


Bahasa
Halaman
Hukum


Higher Education Management Series
Number 3
Budgeting
in Higher Education
Ann Gibson, PhD, CPA
Hasso Endowed Chair of Business Ethics
and Professor of Accounting
School of Business, Andrews University
Berrien Springs, Michigan

2
The Higher Education Management Series is produced and edited by the Education Department
of the General Conference of Seventh-day Adventists, Silver Spring, MD 20904
Copyright © General Conference Department of Education, 2009
Advisory Team
Lisa Beardsley, Associate Director, Education Department, General Conference
John Fowler, Associate Director, Education Department, General Conference
Dennis C. Keith, Sr., Associate Treasurer (retired), General Conference

3
Preface
This booklet is the third in a series produced by the Education Department of the General
Conference of Seventh-day Adventists. The series intends to provide an orientation to major
issues in higher education and is written primarily for administrators working in the tertiary
education sector.
One of the functions of the Education Department of the General Conference is to
arrange for and assist in the accreditation of all education institutions operated by the Seventh-
day Adventist Church. The Accrediting Association of Seventh-day Adventist Schools,
Colleges, and Universities (AAA) fulfills this responsibility and identifies in its handbook its
expectations for institutional operation. The booklets in this series are designed to help
administrators improve institutional quality in line with AAA expectations and international
best practice.
Each booklet is written by one major author, with a team of readers providing advice
and feedback. Booklets are available only by contacting the Department of Education, General
Conference, or through the website: http://education.gc.adventist.org (see publications)
C. Garland Dulan, PhD
Director of Education
General Conference of Seventh-day Adventists

4
Table of Contents
Introduction 3
Part I Budgeting: The Context 4
a. Definition and Principles 4
b. The Issues and the Environment: 5
i. The Ideal Versus Reality 5
ii The Relationship Between the Budget and 5
Organizational Strategic Plans
iii. The Politics of Budgeting 6
c. The Personnel Involved in the Budgeting Process 8
d. Criticisms of the Budgeting Process 10
Part II Budgeting: The Process 13
a. Developing the Budget 13
i. Centralized or Participatory Budgeting 13
ii. Building the Operating Budget 15
iii. Revenue 15
iv. Expenditures 16
v. Reducing the Budget 20
vi. The Cash Budget 21
vii. The Capital Budget 24
b. Implementing the Budget 25
i. Communicating the Budget 25
ii. The Oral Presentation 25
iii. The Written Presentation 26
c. Controlling the Budget 26
i. The Variance Report 26
ii. Additional Analytical Techniques 28
Conclusion 31
Appendices
A. Budget Models 33
B. Eight Golden Rules for Effective Budgets 37
C. Beyond Budgeting–the Hope and Fraser Model 38
D. Ratio and Financial Analysis Glossary 42
E. References and Further Resources 44

5
Introduction
Early in the 20th century, American business leaders realized that the old-style business with a
single product line in a single industry was insufficient to meet growing consumer demand.
Their response was to develop the vertically integrated manufacturing organization–of which
DuPont Company and General Motors were among the first. The field of management was
officially launched by the creation of this type of organization. The management process was
described by the first managers as one of planning, organizing, leading, and controlling.
The managers of these early diversified companies soon realized that the management processes
of planning and controlling were much more difficult once the operating activities were scattered
throughout different divisions. Their answer was: THE BUDGET! Early budgets were designed
as tools for managing costs and cash flow across divisions. Ultimately companies developed
operating budgets, which forecast revenues and expenses for the next operating period, and
capital budgets, which outline the spending plan for plant and equipment and other assets that
will have multi-year lifetimes.
Today, all organizations, whether for-profit or not-for-profit, use the budget techniques
developed by DuPont and General Motors to assist with organizational planning and control.
All organizations, including colleges and universities, wrestle with projecting revenues and
expenses as an organizational exercise in planning the future path of the business. They all
experience what the early 20th century DuPont accountants realized—that the more complex the
organization, the more difficult it is to perform the essential management functions of planning
and controlling.
Budgeting in Higher Education examines the budget process as faced by colleges and
universities in what is an increasingly complex educational environment. The monograph is
divided into two parts. The first part discusses the context of budgeting, including its definition,
the environment, the personnel involved, and criticisms of the process. Also included in this
section is a discussion of the relationship between the budget and strategic planning, and the
pitfalls an organization will encounter as the budget process interacts with the people who must
ultimately make the budget work.
The second part discusses the budget process itself, including the development, implementation,
and control of the budget. This section is not written for the controller or the chief accountant; it
is written for the non-accountant who wishes to understand the “big picture” view of the process.
The conclusion summarizes the key points of both the budget context and the process. The
appendices provide a summary of a number of possible budget models, guidelines for effective
budgets, a brief discussion of a recent book which urges organizations to move beyond
budgeting—or at least beyond its major pitfalls, and additional information on ratio and financial
analysis.

6
PART I: BUDGETING: THE CONTEXT
DEFINITION AND PRINCIPLES:
A budget is a statement of an organization’s plans, priorities, goals, and objectives, expressed in
financial terms, for a specific period of time. The most common period of time that an operating
budget covers is one year. Capital budgets are generally for a longer period of time. Budgets are
a tool and a means to an end—they are not an end in themselves. The primary purpose of the
budget is to assist in planning and control for the organization, department, or program, although
a budget, properly done, also enhances communication and motivation within the organization.
The control function of the budget kicks in after the activity has occurred. Its purpose is to
determine if what was anticipated is what actually happened. Evaluation of managerial
performance is often a part of the control process.
To begin preparation of a budget for an organization, a department, or a program, one must first
know the purpose of the entity and know what it is trying to accomplish with its activities. Thus
the first question to ask when beginning to budget is: “What do we want to accomplish?”
Once the mission is known, goals must be established. In putting this step into action, one asks:
“How will we accomplish this plan?” Goals are established by a comparison of the mission and
prevailing circumstances, in order to determine what direction one needs to move toward if the
mission is to be accomplished.
One should not overlook the importance of clearly defining the mission and goals of the
organization as part of the budgeting process. The financial manager must know what the
institution wants to accomplish and must seek the necessary resources to advance the mission of
the institution as part of the budgeting process. The financial manager’s role is to assist the
organization in funding its priorities and purposes, not to “hoard” funds for his/her own agenda.
The care and keeping of the institution and the furtherance of its goals are the primary purposes
of budgeting, even in times of limited funds.
Once the goals have been established, alternative ways to reach them must be evaluated and a
particular path must be selected as the strategy to follow. The strategy specifies the activity,
what is needed, when it is needed, and what resources will be required to accomplish the goals.
The question to keep in mind at this stage is: “How much will the activity cost?” The answer to
that question becomes the budget. The goal and its strategy become the justification for the
budget.
If properly done, the budget process co-ordinates the actions of the different managers and
departments/programs of the organization, while securing commitment to achieving the desired
results. Finally, the voted budget provides revenue targets for departments/programs of an
organization and gives authority to departmental managers to incur expenditures within their

7
areas of responsibility.
THE ISSUES AND THE ENVIRONMENT:
The Ideal versus Reality:
The Sylvester Jones Leadership Center describes the ideal budget-making process as
accomplishing the following:
1. Defines/Refines goals that realistically reflect the resources available in the
organization.
2. Compels members of the organization to use funds efficiently.
3. Provides accurate information for evaluating programs and activities.
4. Aids in decision making.
5. Provides a historical reference to be used for future planning.
Unfortunately, budget-making reality often turns into an attempt by someone in an executive
office to match anticipated revenue with expenditure requests. Generally the expenditure
requests from the various cost centers are higher than the anticipated revenue, so subsequent
negotiations are needed to bring down the level of expenditure requests so they are in line with
anticipated revenue. The final budget then becomes a statement of how the revenue is allocated
to the budget cost centers, which may or may not match the original requests. At the end of the
process, where ideally there should have been a strong relationship between organizational goals
and the actual use of organizational resources, there is, instead, little relationship between
organizational goals and the budget.
The Relationship Between Budgeting and Organizational Strategic Plans:
As noted above, the budget process ideally brings the organization’s managers together in
support of the organization’s mission and goals. This can only be done if there is extensive
communication (both by talking and listening) between upper management and all cost center
managers before, during, and after the budget process. Top management must communicate the
organization’s strategic objectives to all levels of the organization. The financial manager must
assist the organization in funding these strategic objectives. This communicated vision will
inform the cost center managers of where top management expects the organization to be in the
next three to five years and what they hope the organization will achieve. In return, cost center
managers must communicate their particular needs, assumptions, expectations, and goals back to
top management. Through this ongoing communication process, the strategic plan of the
organization will be transformed into the tactical annual operation plan—i.e., the budget.

8
The final product generated by this on-going communication throughout the budget process is
the compilation of all the individual budgets from the organization’s individual cost centers or
departments into a master budget. In a manufacturing environment, the individual budgets might
include a materials budget, a labor budget, and factory overhead budget (the three budgets which
support the manufacturing operations), and other departmental budgets, such as a
sales/marketing budget and administrative budget. In a not-for-profit organization, the cost
centers mirror the organization’s activities. For example, in a college/university, each academic
department or school within the college/university will prepare a budget. There will also be a
budget for the library, food service, dormitories, plant service area, computing center, and
administrative offices. Irrespective of the names of the cost centers, the master budget brings all
the pieces together so that it ultimately incorporates the operating budget (which deals with
income and expense items) and the financial budget (which deals with the capital budget and the
cash budget) into one comprehensive picture of the organization’s plan for the year. But this
annual plan must be tied to the strategic plan because the annual budget is merely the short-term
action plan which will carry the organization toward reaching its long-term goals.
As one might expect, budget preparation involves a great deal of number crunching. But more
than number crunching, budget preparation involves people. Ideally, everyone involved in the
budget process is moving toward the same goal—i.e., to achieve the organization’s strategic
objectives. But because each individual brings their own needs and assumptions to the
budgeting process, there are bound to be genuine disagreements over the projected numbers, the
importance of particular expenditures, the division of resources among the cost centers, and even
the strategic goals. It is this human element that can make the budget process fun. The same
human element can also lead to frustration and game-playing, especially when anticipated
revenues fall short of proposed expenditures.
The Politics of Budgeting:
Cost center managers often perceive that their departments and projects are at risk during the
negotiation process that inevitably occurs when proposed expenditures exceed the anticipated
revenue. To protect themselves and their cost centers from these anticipated losses, managers
engage in a number of budget games. These games go by various names, including “padding the
budget,” “creating a cushion,” “slush fund,” “hedge,” “kitty,” or “war chest.”
For example, if one is uncertain of the level of risk in a new product, service, or a new
department, a manager may be tempted to add a percentage to the budget to ensure the successful
completion of the plan. Generally the manipulation consists of an overstatement of expense or
understatement of projected income so that a differential is created which will be to the
manager’s or the department’s benefit. Christopher Bart has a wonderful discussion on budget
games in his article: “Budgeting Gamesmanship.”
Research cited in Bart’s article specifically relates to a manufacturing environment, but the
findings illustrate situations which encourage budget games. From an institutional viewpoint,
budget games are not desirable. If the department playing the “game” is successful, institutional
resources will be placed in the pockets of those who play games rather than where the institution

9
chooses or desires to place its resources (which should be in accordance with the strategic plan).
Programs/Departments which need institutional resources will be short-changed, and successful
game-players’ programs/departments may receive the funds instead. Additionally, if managers
are personally benefitted either by bonuses or promotion for “staying on budget,” budget games
may mis-allocate the bonuses or promotions away from those who truly stayed on target and
reward those who focused primarily on games.
Bart’s research identified the following situations which encourage budget games:
1. When there are large funds allocated to “soft numbers,” such as advertising, consumer
promotions, trade-related expenses, and market research. These numbers are estimates at
best, and very difficult to disprove. All organizations have programs which are difficult
to accurately determine planned costs. Any such program is a likely candidate for a
budget game.
2. When there are big promotional budgets for new products, projects, or any area
where there is no prior experience to rely upon in judging the numbers.
3. When there is an opportunity to present the product or project as a “growth” project
(and therefore in need of additional funding), as opposed to a “harvest” project or
product for which a large body of historical costs has been established.
4. When there are time constraints for budget preparation and thus no time to carefully
check the numbers.
5. When the managers are unknowledgeable and thus unlikely to catch the game-
playing.
Bart defined some of the reasons for budget game-playing. They include:
1. When the junior manager believes that the submitted budget will invariably be
changed by senior management (e.g., by arbitrary cutting) and thus uses “hedges”
to protect against the anticipated cuts.
2. When market uncertainty exists, and with it comes the fear that without a hedge, it is
unlikely that profit targets will be met.
3. When the drive to achieve the profit target is very strong and linked with some
personal reward for meeting the targets, such as a bonus or a favorable personnel
evaluation.
Budget game-playing ultimately hurts everyone in the organization, as explained above. It is
much better for a department or project manager to negotiate for the money one really needs and
determine not to play the budget game. At the maximum, the department or project manager
may place an amount on a “contingency line” in the budget to cover unexpected developments.
Such a contingency plan is particularly wise when the budget is for a product or project which is

10
new and does not have a historical basis for estimating costs. It is important to keep in mind that
the purpose of the budget isn’t to stay within the budget, but to estimate as accurately as possible
what the costs are going to be.
Top management, however, also has a major role constraining budget games. Steps that may be
taken to constrain the games include:
1. Get the best from people by developing budgets that include participation and
consultation with those who must work with the budget. This method generally works
better than a budget that is imposed by senior management.
2. Explain what the budget is all about and exactly what each manager is expected to
achieve and how he/she is to perform. This process should include outlining what the
manager’s total profit target should be, thus focusing on total profit from the
department/division (rather than on constraining expenses). This focus will relieve the
pressure to play games with the expense lines.
3. Avoid setting budget targets too high or too low. People can become demoralized
when actual results are compared with unattainable budgets.
4. Carefully review budget proposals in view of historical spending patterns and examine
figures which are significantly out of line. Avoid the time crunch situation where
insufficient time is available to review submitted material.
THE PERSONNEL INVOLVED IN THE BUDGETING PROCESS:
In an educational institution, the primary personnel involved in the budgeting process include the
cost center managers, the vice president for academic administration, the vice president for
financial administration, and the controller. These people may be brought together in a large
budget committee, or the budget committee may be composed of the two vice presidents and the
controller, with representatives from the cost center groups. The latter method is used if the
institution is of sufficient size that having all the cost center managers meet with the vice
presidents would make the committee too large to function effectively.
The role of the budget committee is to review the submitted figures and assess their viability in
preparation for finalizing the master budget. The two vice presidents are present to represent the
major parts of the educational institution. At times the president of the institution may choose to
join the budget committee, particularly if questions are raised about how budget requests relate
to the overall strategic goals of the organization. But ultimately the budget committee will
present the budget to the president, who will present it to the board. Thus the president’s role is
advisory on the committee.
It is essential that the members of the budget committee carefully consider budget requests in
light of the big picture—i.e., the strategic plan of the institution as a whole. In this role, three

11
important questions should be considered (Source: Harvard Business Series, page 228):
1. Do the tactical plans being considered support the larger and longer-term strategic
goals of the university?
2. Does the university have, or have access to, the required resources to fund the
activities throughout the immediate budget period?
3. Will the university create enough value to attract adequate future resources by
following the presented tactical plan to achieve its longer-term goals?
This “big picture view” is essential as the budget committee members advise the cost center
managers and coordinate the final agreements. The role of the controller in the committee is to
assist in the budget preparation, not to determine the actual content of the cost center budgets.
Throughout the budget process, college/university officials need to be kept informed about the
programs within the college/university and their needs. All administrative personnel and cost
center managers need to hear the details about the university’s fiscal situation. If certain
department requests are not funded, there must be an explanation given so that parties involved
understand why the decision was made (Birdsall).
When a cost center manager is presenting his/her budget to the budget committee, it is essential
that the manager be perceived as fiscally responsible in order to build trust and confidence in
his/her ability to manage the proposed budget properly. Specifically, the cost center manager
should (Birdsall):
1. Come to the budget committee completely prepared, with figures that are consistent
with prior year’s requests. If some portion of the prior year’s requests were unspent,
explanations should be given, particularly if operating increases are being requested.
2. Avoid budgetary surprises. Inform the vice president in charge of your area of
any new projects for which funds are being requested.
3. Use honest and accurate data to support requests and make your requests in a rational
and analytical manner.
4. Demonstrate the ability to make budget hard choices within the department prior
to bringing the budget to top administration.
Some institutions may have cost center managers who are not interested in, or qualified, to deal
with financial matters. For example, in some academic institutions, a department chair may be
selected because of his or her academic expertise—not because of any expressed financial
interest or acumen. In such cases, asking the cost center manager to present his/her budget to the
budget committee may be problematic, if not impossible. Under these circumstances, it may be
necessary for the controller to work closely with the department chair to assure that the budget is
prepared in a timely manner and that the financial needs of the department are met. The
controller would then bring the department’s budget to the budget committee for inclusion in the
master budget.

12
CRITICISMS OF THE BUDGETING PROCESS:
In Part II we will discuss the budgeting process. Conceptually, creating a budget is a very easy
assignment. First estimate future income. Second, estimate future expenditures. Finally,
calculate expected net income for the next operating period.
But as described above, the budget process is fraught with difficulty because it is done by people
whose behavior is often driven by the desire to “meet the budget” and receive the subsequent
positive performance evaluations and/or bonuses or avoid scolding for budget overruns. As a
result, cost center managers may play games when creating budgets, may set easy targets which
favor their meeting the goals even if the targets do not meet the organization’s strategic plan, and
may pad their budget requests in anticipation of across-the-board cuts from top administration.
Because of the potential pitfalls of the budget process, and the fact that the process is universally
disliked because it takes too long and adds little value to the organization, there are many critics
of the budgeting process. Some of these critics call for a new set of management processes
which would essentially do away with budgeting (e.g., Hope and Fraser; for more on their ideas,
see Appendix C). Other critics urge that managers recognize the issues and take steps to resolve
the problems in less drastic ways. Certainly, without recognizing the points raised by the budget
critics, a manager may easily fall into serious budgeting traps which will ultimately derail the
process and may even derail the organization.
It must be recognized that for all their value, budgets do not measure everything that makes an
organization efficient or great. Budgets deal with items which can be quantified in numbers, and
thus are excellent for tracking where the money goes. They are not, however, a good measure or
evaluator of managerial decision-making, nor does the budget indicate whether or not the
organization’s resources have been used in a manner that will best meet the organization’s
mission and goals. Budgets are particularly ineffective when they are used to gauge managerial
performance. If a cost center manager focuses on “meeting the budget numbers” at the end of
the year, he/she will be tempted to take any actions that are required to meet the budgeted
revenue or expense amounts, irrespective of whether these actions are actually wise or good.
Examples of some dysfunctional decisions include:
(1) spending whatever is in the budget (a “use it or lose it mentality”), irrespective of
whether the expenditure is needed or wanted;
(2) creating “stories” to explain away unfavorable variances rather than dealing with the
problems;
(3) blaming other departments for cost overruns, rather than focusing on customer
concerns and customer service;
(4) doing less than expected at year-end with respect to revenue generation because of

13
fear that if you beat the budgeted revenue numbers, you will be expected to do more next
year—and you cannot guarantee a second year of revenue success;
(5) increasing internal charging in order to transfer one’s own departmental cost overruns
to another department so that the department “looks good” for the year-end budget
check.
Finally, a focus on budget numbers may lead a manager to refuse to take risks, even risks that
should be taken in order to improve customer service, a product, or take the organization to a
new level. If a manager is focused on the budget number, he/she may be afraid that moving into
a new area to build the business might fail, which would result in an unfavorable performance
evaluation or a public scolding. The result is that only negative behavior is controlled—i.e.,
overspending. Positive behavior, like creating new business or a new product through risk-
taking goes unrewarded, and thus, undone.
Thomas Stewart, in the article “Why Budgets Are Bad for Business,” summarizes his argument
with the following comment: “The worst failure of budgets is what they don’t measure. Budgets
show what you spend on customer service, but not what value customers put on it. They count
noses, but not brains. ... In many companies budgets actually discourage spending to protect
market share or improve products.” Stewart goes on to recommend the following actions to
avoid falling into the budget performance trap:
1. Rather than only control expenditures (and ignore how much a cost center may earn),
use cost center profit as the key measure. If the cost center has only expenses (such as
the Registrar’s Office or Human Resources in an educational institution), create relevant
measures of achievement such as reduction in the number of complaints during
registration or decreasing employee turnover, as success measures. This will shift the
focus away from spending money toward providing service.
2. For capital investments, make long-range budgets and do not expect an immediate
pay-back. This method is superior to doing a “quick fix” that will save operating funds
for the current year. Cost reduction is important in the future as well as in the present,
and often real savings for the organization will come through investment in new
processes or equipment, even if the current year sees an expenditure cost overrun.
3. While budget numbers are tied to the financial statement numbers, these accounting
numbers may not be the best numbers to use for management decision-making. For
example, the library budget may call for a certain amount of budgeted revenue from
overdue book fines. But from a managerial perspective, if all books were returned on
time, that would be a better use of the library resources. If the staff can notify patrons of
overdue books electronically, thus reducing the amount of fines, the library may not meet
its expected revenue budget but it will have achieved a major managerial objective of
having the library’s books used and returned to facilitate future borrowing.
4. Charging other departments in the organization for its services is a favorite way for a
cost center to “make budget.” For example, the custodial department may charge an

14
academic department for set-up of chairs for a departmental function. Because these
charges create revenue for the custodial department but create costs for the academic
department, the academic department may decide to purchase its own chairs in order to
save the set-up charges. As a result, the organization as a whole will own chairs within
each department—and perhaps may have purchased more chairs than it actually needs.
Conversely, if the set-up charges by custodial become too large, the academic department
may go to an outside supplier when chairs are needed—thus leaving the custodial
department with both the chairs and with the costs of maintaining the chairs.
5. If there is a cost overrun in a department, ask why before criticizing the overrun. For
example, if an academic department has more students than expected, it may incur cost
overruns in its supplies and teaching staff budgets. Before demanding that the
department stay on budget (and in the future, fail to attract additional students), find out
what happened. Perhaps the costs were incurred this year, but revenues will be increased
in future years. A wise manager takes the long-range view when asking for explanations
for expenditures that run above the budget plan.
PART II: BUDGETING: THE PROCESS
DEVELOPING THE BUDGET:
To develop a budget, one must gather information about the internal and external influences on
the organization, estimate amounts for income and expenditures, and bring all this information
together in one overall document, the master budget.
The assessment of external influences (e.g., economic factors, government legislation, business
relationships with customers and competitors, etc.) is very important to the financial success of
the organization. Equally important is the assessment of internal factors, such as the types of
products and services provided, the directors and employees of the organization, and the
available resources, including capital, land, buildings, and equipment. Finally, in developing the
budget, one must consider the limiting factor—the dominating influence that has a constraining
effect on the organization. If you fail to recognize the limiting factor, you may set budget targets
that are not achievable. For example, the limiting factor for some colleges/universities may be
capacity constraints in dormitories, or location in a war-torn area of the country or world, which
makes it impossible for students to attend school at expected times. Another limiting factor for
schools may be constraints on the development of new programs due to lack of library support or
qualified faculty for certain desirable academic degrees.
Centralized or Participatory Budgeting:
The question can be raised as to whether budgeting should be a centralized process (top-down

15
budgeting) or a shared process which includes participation from a large number of budget
managers (bottom-up budgeting).
In centralized (top-down) budget planning, senior managers estimate budgets from their
experience, set budget goals (e.g., revenue, expense, profit), and then impose these goals and
allocate the funds accordingly to lower-level managers for execution. Centralized budget
planning works if managers carefully allocate costs and possess significant experience at
managing the needs of lower-level areas of the organization. Centralized budget planning is
faster than participatory planning. Its advantages are that it:
1. Considers the entire needs of the organization and reflects management’s larger
strategic objectives.
2. Consolidates and standardizes information across the organization.
3. Centralizes controls and procedures.
4. Discourages budget games by individual unit managers.
Centralized budget planning will fail if upper management is out of touch with the realities of the
individual cost center manager’s needs and thus sets inappropriate or unattainable goals. But
more often it fails because individual cost center managers do not accept the goals “handed
down” because they do not feel involved in the budget process.
Research supports participative budgeting (Birnberg et al, 1990) as the best way to achieve
commitment to the budget by cost center managers. Participatory budgeting ideally encourages
teamwork. In the participatory model, staff members get together and attempt to hammer out a
budget from the task-level detail. These staff members are often the people who have the best
information to make the budget decisions. As a group, they share openly in order to consider
and include all tasks and evaluate all possible solutions. With this commitment comes a higher
level of motivation to attain the budget goals and keep within the budget. In today’s work
environment, acceptance is crucial if one wants long-term commitment. Participatory budgeting
ideally encourages teamwork, but only if it is truly participative. It cannot be pseudo-
participatory, where top management pays lip service to the ideas of lower-level management,
but in the end, discounts all input and essentially moves forward under the centralized model.
Peter Brinckerhoff recommends the participatory approach precisely because the people involved
are the ones who know the needs of the department. He provides the following steps for
“bottom’s up” budgeting:
1. Provide training and orientation for those who will be involved in the budgeting
process. Walk people through the process; don’t leave them in the dark!
2. Delegate both responsibility and authority to the staff.
3. Reward success. It is, however, very important that in the process of establishing the
16
rewards, one considers the possibility of dysfunctional behaviors, as one will get
the behavior that is rewarded.
4. Provide regular feedback and reporting. Provide easy-to-read monthly reports. Large
discrepancies should be questioned by the administrator who oversees the area.
5. If one hasn’t done participatory budgeting before, start slowly with people who really
want to participate. Making a budget is not easy—even though writing down the
numbers is!
Participatory budgeting isn’t perfect, however, It takes time. If performance evaluations are tied
to budget achievement, the participatory method may lead to budget game playing by cost center
managers. Finally, the people closest to the project, or the department, may not be able to see
how their budget fits into the organization’s overall strategic plan. This disadvantage may be
overcome by submitting the budget and its final approval to the budget committee (discussed on
pages 8-10) for review by those taking the “big picture” view of the organization.
Building the Operating Budget:
The process of building an operating budget should be an orderly one. It is important to use
one’s best estimate for each component of the budget. While it is impossible to know the future
and thus there is always the risk of underestimating or overestimating revenues and expenses, it
is still important that one create a budget that is as close to expected reality as possible.
The Managers Toolkit from the Harvard Business Essentials series (page 229) recommends the
following tips for setting budget assumptions:
1. Use historical data as a starting point. Even when times are changing quickly,
information about past performance can establish a base from which to begin.
2. Trust your own experience. Make educated guesses where necessary about what is
likely to happen in the future.
3. Listen to your intuition. Even though you can’t verify those gut feelings, you can take
them into account.
4. Conduct due diligence. Seek out the information you need. This may involve doing
research, reading trade journals, collecting industry statistics, and so on. Finally, don’t
forget that the Internet is a growing information resource.
5. Talk with and listen to knowledgeable people. Discuss your ideas with team
members, colleagues, and mentors. Seek out industry participants, suppliers, concerned
community leaders, and experts in the field. Engage in discussions with competitors.
6. Learn when to be a risk taker and when to be conservative. In a volatile market,

17
conservative assumptions may be the safest.
7. Test your assumptions. If possible, try out your assumptions in small experiments
before you accept them.
Revenue:
The first step in budgeting is to estimate revenue. This number is established based on
measurable expectations, although typically the beginning point on revenue will be what
happened the previous year, adjusted for expected changes due to the identified external and
internal influences. For example, in a school, the estimated revenue is based on the number of
students expected multiplied by the tuition rate. If more students are expected in the future than
are present at the school now, anticipated revenue will go up. Alternatively, if there is reason to
believe that fewer students will attend in the subsequent year, downward adjustments in expected
revenue should be made when the budget is prepared. Enrollment projections based on
applications and acceptances may be made by the admissions team in a college or university to
assist the financial manager in making realistic projections. In an organization which sells a
product, such as a publishing house, the expected revenue would be based on the anticipated
sales of books times the average price of each book. If there are sales people involved, their
estimates of expected sales are an important factor in establishing the amount of revenue.
If the revenue is coming from a donor or a grant, the budget process swings immediately toward
the expense side, as revenue will match the expenses if the donor believes the listed expenses are
justified.
The estimation of revenue is a point at which internal tension can occur and internal tension may
lead to budget game playing. For example, if cost center managers are evaluated and rewarded
on their achievement of budgeted revenue targets, they may be tempted to develop conservative
revenue targets that will be easy to reach, making it more likely that they will receive a positive
evaluation and its subsequent rewards.
Expenditures:
It is essential to understand cost behavior and cost drivers in order to measure the cause and
effect of various decisions. Costs can be viewed from two perspectives. Costs may be fixed or
variable. They may also be direct or indirect.
Fixed or variable costs can be understood in terms of the cost linkage to the organization’s
volume of activity—which is generally measured by its revenue. Costs that stay the same when
activity volume increases (or decreases) are fixed costs. Costs that increase (decrease) in
proportion to activity volume increases (or decreases) are variable costs. Many costs are neither
fixed nor variable, but a combination of the two. In not-for-profit organizations like schools,
most costs are fixed, at least until capacity is reached, when another jump in fixed cost is added.
For example, dormitory costs for heat and light and depreciation do not immediately go up or

18
down, depending on the number of students in the building. Eventually, however, if the
institution grows, another dormitory must be added. At that point the fixed costs related to the
dormitories take a major bump upward.
Direct costs are incurred for the benefit of just one product or service. Indirect costs are incurred
for the benefit of many products or services. Indirect costs are often called overhead, and are
shared across departments or projects. Top administrative costs are indirect costs and are shared
across all departments in an organization, whereas a faculty salary for teaching only accounting
courses would be a direct cost to the accounting department.
All costs are tied to activities. The more complex the activity becomes, the greater the expense.
The importance of tying the cost to the activity was recognized in the manufacturing field in the
late 1980s and resulted in the development of activity-based-costing systems. The basic
philosophy behind activity based costing is that since activities consume resources, the first step
is to identify the activities involved in the process and assign the costs to these activities. The
key question is: What is driving the costs of the organization? Once the cost driver is
established, one then selects the appropriate measure for each activity and determines the cost
driver rate.
While most not-for-profit organizations have not adopted activity-based-costing, the concept of
activities-driving-costs is an important one for all organizations to consider. Many times
expenses rise in an organization and no one can understand why. Unless one recognizes the way
costs behave and what activities are driving the costs, it is impossible to control the expenses of
the organization.
For example, consider a college. An identification of some basic activities which create costs
(expenses) might include:
Academic administration
Teaching contracts
Cafeteria
Academic records
Billing and collection services
Using academic records as an example, one might expect that with an increase in students, the
costs in academic records are likely to rise. In this case, the increase in the cost driver (number
of students) creates more costs in the academic records department because of the need for more
staff and/or more hours of staff time to keep the records for an increasing number of students.
Other activity and cost driver relationship examples are listed below.
Activity Cost Driver
Academic administration Number of departments or number of faculty, depending
on the organization of the college
Teaching contracts Number of classes
Cafeteria Number of meals served
19
Academic records Number of students
Billing and collection Number of students
To establish the cost driver rate, divide the total cost by the expected cost driver measure to
develop a cost per unit. For example, assume that the total cost of academic records is $25,000
and the total number of students is 2,500. The cost driver rate would be $10 per student
($25,000 divided by 2,500). This rate would then be used to budget academic records costs as
the number of students increased or decreased. If the college expected an increase in total
students to 3,000 in the next fiscal year, the budget for medical records should increase to
$30,000 (3,000 x $10 per student). The activity in academic records is driven by the number of
students. As they increase, the academic records budget must also increase in recognition that
the related activity (number of students) will increase the cost of the department. Provision for
this increase must be made in the budget.
While this is only an example, it illustrates the point that activity-based-costing assists managers
in remembering that activity drives costs. Often, however, the first question asked is: How does
one define the activities of an organization? Here are some suggestions of where to look:
Ask your staff. They may be able to provide estimates of the time required to complete a task or
project, as well as assist in estimating the quantities of needed supplies and equipment. It is
important that these estimates be as specific as possible. Keep in mind that costs are tied to time
requirements. If there is a requirement for a rush job so that the project may be completed faster
than planned, costs will generally rise. Overtime and rush charges (especially when an outside
vendor tacks on extra charges to complete a job on short notice or outside regular working hours)
will quickly increase the costs and cause a budget overrun.
Ask outside vendors, suppliers or service providers. These individuals are particularly
invaluable if you are planning a project (as opposed to running an on-going department). If you
plan to order supplies and equipment for a specific project’s requirements, ask the providers for
an estimate. If you must have hard numbers from the outside providers or consultants, get a
written estimate of the expected costs.
Ask other managers or experts. People who have managed similar projects or departments can
provide excellent advice and cost estimates.
For most organizations, the largest expenses are those related to personnel—the costs of the
people working in the organization, department, or on the project. Personnel costs not only
include the actual salary or wages paid, but also employee benefits, which are generally charged
as a percentage of payroll. The amounts needed for employee costs are relatively easy to
compute: the number of employees multiplied by the salary or hourly wage, plus a percentage for
benefits.
Other common expenses for schools might include: supplies; equipment, travel, legal fees,
training costs, marketing and advertising, library, computing center, records office expenses, etc.
Generally the additional indirect costs are charged to the department. Often these are charged on
a percentage basis from the organization’s head office.
20
College and university expenses are primarily composed of educational and general costs (more
commonly known as E&G expenditures). The following costs make up E&G expenditures:
instructional, research, public service, academic support, student support, and institutional
support. Costs outside of the E&G category are called auxiliary costs, and include, among
others, dormitory and cafeteria costs. The difference between E&G costs and auxiliary costs is
that auxiliary costs include both revenue and expense items, while E&G costs must depend on
tuition revenue as the income-generator to cover the E&G expenses. These categories for
college/university expenses are set by the accounting profession as guidelines for all
colleges/universities to classify information for their financial statements.
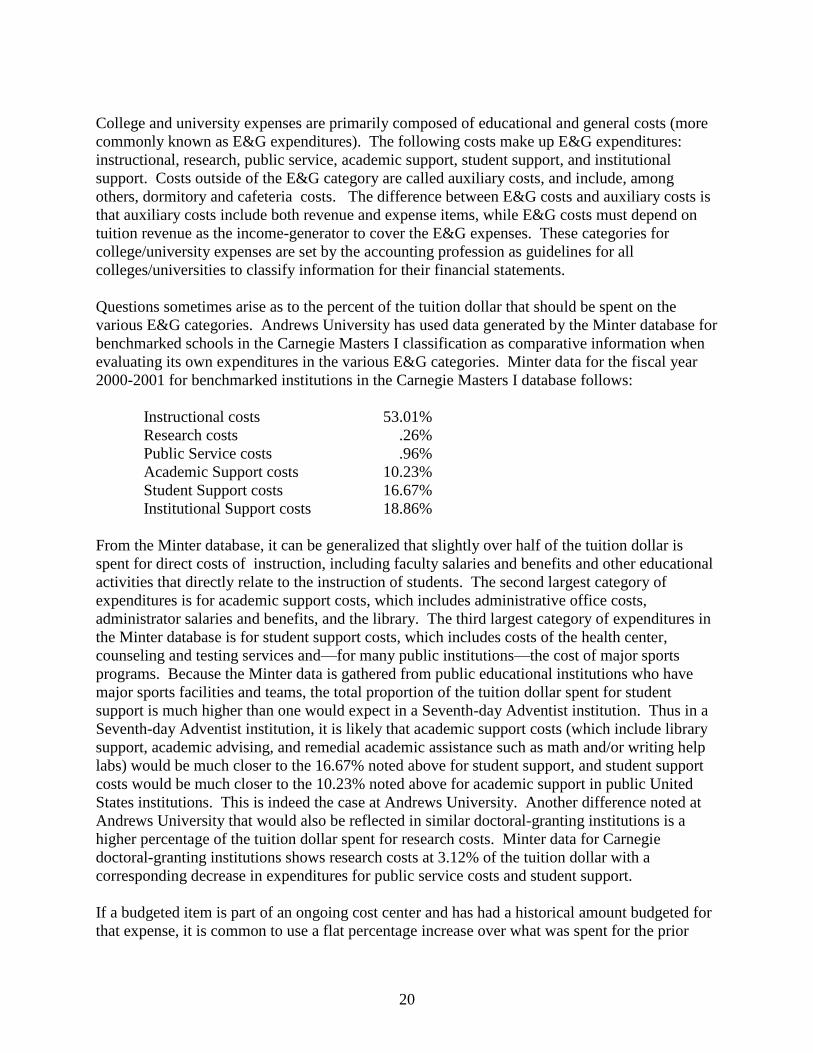
Questions sometimes arise as to the percent of the tuition dollar that should be spent on the
various E&G categories. Andrews University has used data generated by the Minter database for
benchmarked schools in the Carnegie Masters I classification as comparative information when
evaluating its own expenditures in the various E&G categories. Minter data for the fiscal year
2000-2001 for benchmarked institutions in the Carnegie Masters I database follows:
Instructional costs 53.01%
Research costs .26%
Public Service costs .96%
Academic Support costs 10.23%
Student Support costs 16.67%
Institutional Support costs 18.86%
From the Minter database, it can be generalized that slightly over half of the tuition dollar is
spent for direct costs of instruction, including faculty salaries and benefits and other educational
activities that directly relate to the instruction of students. The second largest category of
expenditures is for academic support costs, which includes administrative office costs,
administrator salaries and benefits, and the library. The third largest category of expenditures in
the Minter database is for student support costs, which includes costs of the health center,
counseling and testing services and—for many public institutions—the cost of major sports
programs. Because the Minter data is gathered from public educational institutions who have
major sports facilities and teams, the total proportion of the tuition dollar spent for student
support is much higher than one would expect in a Seventh-day Adventist institution. Thus in a
Seventh-day Adventist institution, it is likely that academic support costs (which include library
support, academic advising, and remedial academic assistance such as math and/or writing help
labs) would be much closer to the 16.67% noted above for student support, and student support
costs would be much closer to the 10.23% noted above for academic support in public United
States institutions. This is indeed the case at Andrews University. Another difference noted at
Andrews University that would also be reflected in similar doctoral-granting institutions is a
higher percentage of the tuition dollar spent for research costs. Minter data for Carnegie
doctoral-granting institutions shows research costs at 3.12% of the tuition dollar with a
corresponding decrease in expenditures for public service costs and student support.
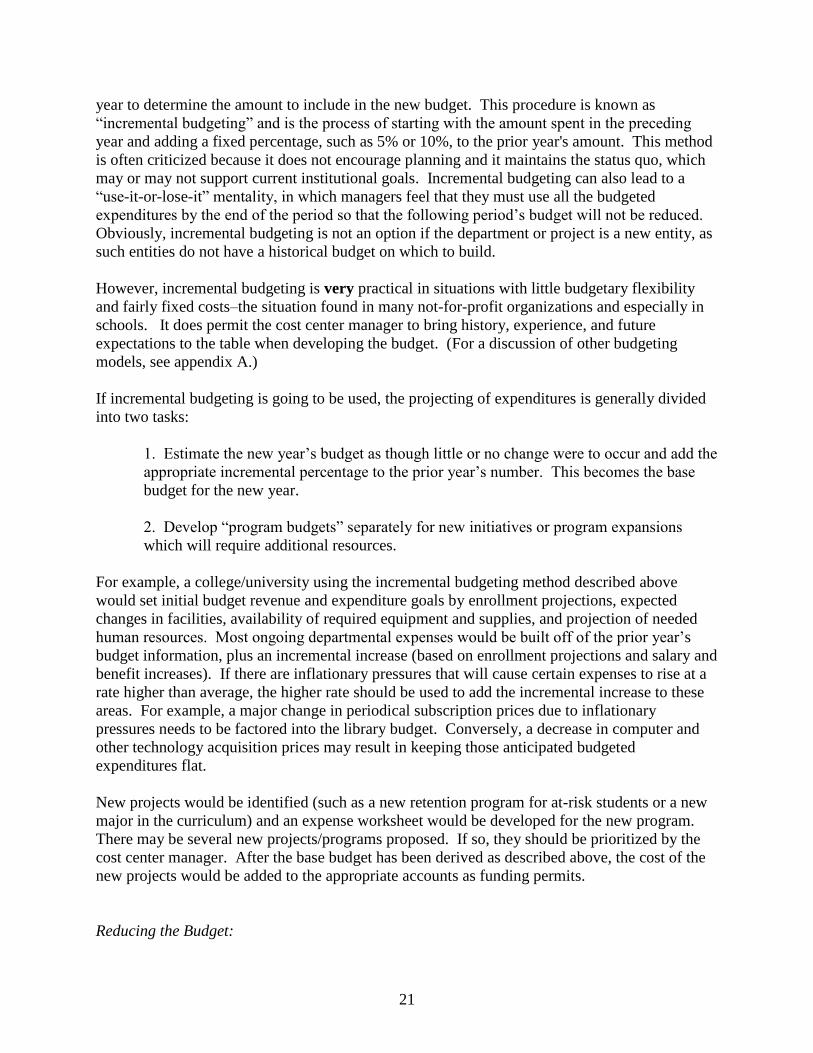
If a budgeted item is part of an ongoing cost center and has had a historical amount budgeted for
that expense, it is common to use a flat percentage increase over what was spent for the prior
21
year to determine the amount to include in the new budget. This procedure is known as
“incremental budgeting” and is the process of starting with the amount spent in the preceding
year and adding a fixed percentage, such as 5% or 10%, to the prior year's amount. This method
is often criticized because it does not encourage planning and it maintains the status quo, which
may or may not support current institutional goals. Incremental budgeting can also lead to a
“use-it-or-lose-it” mentality, in which managers feel that they must use all the budgeted
expenditures by the end of the period so that the following period’s budget will not be reduced.
Obviously, incremental budgeting is not an option if the department or project is a new entity, as
such entities do not have a historical budget on which to build.
However, incremental budgeting is very practical in situations with little budgetary flexibility
and fairly fixed costs–the situation found in many not-for-profit organizations and especially in
schools. It does permit the cost center manager to bring history, experience, and future
expectations to the table when developing the budget. (For a discussion of other budgeting
models, see appendix A.)
If incremental budgeting is going to be used, the projecting of expenditures is generally divided
into two tasks:
1. Estimate the new year’s budget as though little or no change were to occur and add the
appropriate incremental percentage to the prior year’s number. This becomes the base
budget for the new year.
2. Develop “program budgets” separately for new initiatives or program expansions
which will require additional resources.
For example, a college/university using the incremental budgeting method described above
would set initial budget revenue and expenditure goals by enrollment projections, expected
changes in facilities, availability of required equipment and supplies, and projection of needed
human resources. Most ongoing departmental expenses would be built off of the prior year’s
budget information, plus an incremental increase (based on enrollment projections and salary and
benefit increases). If there are inflationary pressures that will cause certain expenses to rise at a
rate higher than average, the higher rate should be used to add the incremental increase to these
areas. For example, a major change in periodical subscription prices due to inflationary
pressures needs to be factored into the library budget. Conversely, a decrease in computer and
other technology acquisition prices may result in keeping those anticipated budgeted
expenditures flat.
New projects would be identified (such as a new retention program for at-risk students or a new
major in the curriculum) and an expense worksheet would be developed for the new program.
There may be several new projects/programs proposed. If so, they should be prioritized by the
cost center manager. After the base budget has been derived as described above, the cost of the
new projects would be added to the appropriate accounts as funding permits.
Reducing the Budget:

22
It would be highly unusual if all expenditure requests were funded. Given this fact, the impact of
not receiving requested funds on a department or project’s ability to accomplish the goals of the
organization must be communicated to the decision-makers.
Possible cost center director responses to the request to reduce the proposed budget in a school
could include: establishing new mechanisms to reduce controllable expenses; reducing faculty
expense by eliminating planned sections of classes; reducing the number of courses offered;
increasing student-faculty ratio; increasing class size; increasing teaching loads; having full-time
faculty take unpaid leaves of absence; having full-time faculty accept a shorter contract year;
reducing support of students by elimination of lab personnel or reducing student labor hours
(Birdsall).
Given that the budget process is an attempt to look into the future, proposed reductions should be
accompanied by the development of alternative scenarios. The questions this “what if” process
could answer include: How will a change in one area affect the expected outcome? For
example, eliminating planned sections of classes as a way to reduce expenditures may result in
fewer students coming to the college/university because they cannot take the class at the
expected time in order to complete their degree. Increasing teaching loads may have negative
impact on college/university accreditation results, as accrediting bodies expect faculty to not
only teach, but also be involved in research and service.
The Cash Budget:
Cash is king in the not-for-profit realm, as it is for all other types of organizations. Those who
have cash can do almost anything. Those who do not, stagger under a load of worry as to
whether or not the bills and/or salaries can be paid. Adequate cash allows the organization to
pay its bills. More than adequate cash gives the organization a source of additional revenue
(through investment income), an operating cushion, and liberation from some of the daily grind
of worrying about continued financial existence.
Not-for-profit organizations with adequate cash can do two critical things: Survive crises and
take advantage of opportunities. The best way to “plan” for cash is to prepare a cash flow
budget, which is actually a cash flow projection. The cash flow projection displays the cash
expected to come in, the cash expected to go out, and the difference between the two numbers. It
also demands an explanation from management of how any negative differences will be
financed.
A simple cash flow projection for three months is provided below. The example assumes that
the organization begins the year with a $10,000 cash balance in the bank account. The three-
month illustration demonstrates that in months when the cash outflow exceeds the cash inflow,
some plan for borrowing sufficient funds to meet payroll and creditor demands must be made. In
the example, the organization has access to a line of credit at the bank, which they can draw on
as needed. However, provision for repayment of that line of credit must be made in the
following months. Even if the organization does not feel compelled to repay the line of credit

23
quickly, the bank will want to know how the funds will be repaid, and how quickly the
organization will turn itself around so it will not again be drawing on the line of credit.
A cash projection report allows one to predict a cash disaster in advance—in time to do
something about it. While a financial manager may carry this kind of projection around in
his/her head, non-financial managers need to see it on paper. A projection signals the
importance of cash to everyone and allows for action on a planned basis.
The steps to follow to build a cash projection are:
1. Add receipts. Determine the expected receipts of cash that will be achieved for the month.
For a school, this number is related to the speed associated with the collection of student
accounts receivable. The shorter the collection period, the faster the cash will come into the
school’s bank accounts.
2. Deduct disbursements. Calculate how much cash will be required to cover disbursements
for the month. Note that in the illustration on the next page, the organization plans to increase its
fund-raising and have success by March. Contracted services in February and consultants fees in
March will be the expenses associated with this fund-raising drive.
The illustrated organization has a fiscal year-end of December 31. (Many colleges/universities
have a June 30 year-end.) Audit fees for the illustrated organization are due in January and
February of $1,000 per month. Legal fees of $1,000 per month continue throughout the year.
Equipment lease payments are anticipated to increase in March due to the lease of a new
photocopier and a new fax machine. The first six months of property insurance premiums are
due in March.
3. Calculate the cash surplus or deficiency. To calculate the cash surplus or deficiency for the
month, subtract the disbursements from the sum of the receipts expected during that period.
4. Add the beginning cash balance. The beginning cash balance is the ending balance from
the previous month. By adding it to the cash surplus (deficiency) for the month, one calculates
the new ending balance.
5. Determine financing needed. The ending balance will be either positive or negative. A
positive balance indicates that you have more than enough cash to cover operations during that
period. A negative balance requires the development of a plan for financing the shortfall from
other sources, such as a bank loan. Repayment of the bank loan must be reflected among the
cash outflows of subsequent periods.

24
January February March
Cash In:
Tuition Revenue $300,000 $300,000 $300,000
Fund-raising Donations 30,000 30,000 50,000
Miscellaneous 15,000 15,000 15,000
Total In 345,000 345,000 365,000
Cash Out:
Salaries $227,160 $227,160 $227,160
Payroll Taxes 22,000 22,000 22,000
Employee Benefits 22,240 22,240 22,240
Consultants 0 0 2,500
Legal/Audit 2,000 2,000 1,000
Contracted Services 3,000 5,000 3,000
Program Supplies 47,000 47,000 47,000
Vehicle Expense 1,500 1,500 1,500
Equipment Leases 1,600 1,600 4,000
Rent 24,000 24,000 24,000
Utilities 4,000 4,000 4,000
Property Insurance 0 0 6,000
Total Out 354,500 356,500 364,400
Net Monthly Surplus (Deficiency) ( 9,500) (11,500) 600
Beginning Cash Balance 10,000 500 4,000
Ending Cash Balance 500 (11,000) 4,600
Borrow/(Repay) on line of credit 0 15,000 (1,500)
The Capital Budget:
Capital projects undertaken by an organization require investment in capital assets. Such

25
investments may take the form of purchasing, building, leasing, or renovating buildings or
equipment; or other long-range major items of property. Because such activities involve large
sums of money and bring about a large increase in fixed costs, they affect the organization’s
finances for the current year and many future years. Planning poorly for capital expenditures
may harm the organization’s ability to achieve financial stability because monies are tied up in
non-liquid investments or in servicing debt, when at the same time, these monies are needed by
the organization to maintain positive operating cash flow.
On the other hand, every organization must invest in capital assets if it is going to survive.
Given that no organization has unlimited funds available for investment, one must choose
wisely, both in deciding when to make a capital investment and which capital investment to
choose. Once an organization makes a capital investment decision, alternative investment
opportunities are normally lost. For all of these reasons, organizations must be very careful in
their analysis of capital projects. They must therefore prepare a capital budget.
As noted above, operating budgets are prepared for a 12-month period. The cash budget is
prepared for a shorter period of time—generally three or six months. The capital budget takes a
long-range perspective and is often prepared for a three- to five-year period. Capital asset annual
needs are listed in the budget, with the expectation that annual expenditures will total at or above
annual depreciation expense. Because this budget takes a long-term perspective, planned
expenditures of major amounts can be identified early on and appropriate funding requests made
well in advance of the actual purchase. Like operating budgets, capital budgets must be
approved by the board of directors of the organization.
In a for-profit company, making capital-budget decisions involves analyzing cash inflows and
outflows, because the company assumes that the initial investment will be “paid back” in terms
of increased sales and/or increased profits over an expected period of time. A not-for-profit
organization often does not have a direct link between the purchase of a capital item and
increased revenue. For example, a college/university may decide to purchase new computers for
the computer lab, but there is no expectation that the new computers will necessarily generate
more tuition revenue. However, the new computers must be purchased in order to maintain the
expected level of learning of the current students and to attract future students. Thus the
investment must still be made—even if one cannot determine a direct link to immediate
increased revenue. Thus the not-for-profit organization has unique challenges in funding capital
expenditures.
The usual method of funding large items, such as buildings, is for the college/university to seek
donors from alumni or friends, or to ask for an appropriation from the parent organization (such
as the local union or division) or both. In addition, permission to borrow money for the project
may be granted by the Board.
Equipment purchases, however, usually require the use of operating funds. The concept of
“funding depreciation” is often used to describe the process of assuring that sufficient funds are
generated through operating to purchase equipment. Because depreciation expense is an
operating expense that does not require a cash outlay, it is often used as a measure of whether an
organization is using its cash to replace capital assets (such as equipment) in sufficient amounts
26
to maintain its asset base. The goal is to assure that the organization does not get itself into a
situation where massive sums of money are required to solve what has become a “deferred
maintenance” problem. The deferred maintenance problem occurs most often as an organization
begins to experience financial difficulty. Because capital items are costly and because such
investments may (incorrectly) appear to be able to be postponed, there is often a temptation to
delay capital expenditures when cash is in short supply. Yielding to such temptation always
results in an overwhelming need to restore the organization’s capital base at some point in the
future. Generally by the time the problem is recognized, the deferred maintenance issue has
become almost financially unmanageable.
Irrespective of whether the capital budget is dealing with large items, such as buildings, or
smaller items, such as equipment expenditures, the organization’s financial administration must
tie the capital budget to the organization’s strategic plan. Capital budgeting must reflect the
direction in which the institution plans to grow and must be integrated into the campus master
plan and academic programming plans of the institution. For example, if the college is seeking
university status as part of its strategic plan, the capital budget must reflect increased
expenditures in the library because, as a university, the library holdings must support university
research by both students and faculty members. Likewise, if the college/university is seeking to
double its size over the next 10 years, the capital budget must provide for increased dormitory
and classroom space. The cost of failing to adequately manage and fund the organization’s
capital budget and reflect in that budget the organization’s strategic goals may actually end up
being the loss of the school’s future growth and reputation.
IMPLEMENTING THE BUDGET:
Communicating the Budget:
The budget presentation to the Board or the Budget Committee is the administration’s summary
of what it already knows about the organization’s plans and its fiscal situation. However, it is
essential that the presentation be done in a style that assures the Board or the Budget Committee
of the competency and responsibility of the presenter.
There are four “S’s” for budget presentation: Keep it simple, salient, scrupulous, and with no
surprises.
The Oral Presentation:
The oral presentation should be honest, clear, and concise, but with enough detail to convey what
will be accomplished with the requested funds. The speaker should address the board with
conviction, avoid the jargon of one’s discipline (e.g., accounting), avoid trivial comments and
being too casual. Act like you believe you will be given the requested funds. In periods of
reductions in funding, the impact of the reduced funding levels should be communicated clearly,
but in a non-threatening manner.
Birdsall offers three additional strategies on budget presentations for college personnel:

27
1. Convey the impression that the dean or support unit administrator understands that the
department or unit is only one part of the university, and that there are important
needs to be met throughout both the academic and non-academic sides of the
campus. Statements should not be made about the need to direct funds from one
area of the university to another.
2. Convey the importance of the department or support unit to the mission of the
university. Specific links should be made between the institution's strategic plan
and the contributions of the department or unit.
3. Department and support units that have high levels of external funding can show how
well those funds were leveraged and how efficiently they were managed. Units with
fewer opportunities for external funding may point to national statistics that support
their position and then emphasize their traditional reliance on money
appropriated by the university’s administration.
The Written Presentation:
The written presentation of the budget to the board or the budget committee should be highly
focused and concise. If possible, it should be a one-page document. One method to achieve this
level of conciseness is to place funding priorities into categories—for example, those that
support general education requirements; and another for graduate assistants. Use a different
category for one-time requests and another section for new funding that changes the base
appropriation for the department or unit. A third category can be used for items that arise
because of workload increases (e.g., computing centers).
CONTROLLING THE BUDGET:
As the costs are incurred, they will be compared against the budget. The budget is the traditional
device used by senior management to measure managerial and business performance.
The Variance Report
Differences between the budget and the actual expenditures are called variances. Variances can
be favorable (i.e., underspending) or unfavorable (i.e., overspending). Generally unfavorable
variances for expenditures are shown in parentheses. All variances require a full explanation in
order to identify potential problems. The variance report should not only show how and why the
variance occurred, but also must identify whether or not the variance can be absorbed in the
future. Of particular interest to management is what category of variances are encountered (e.g.,
revenue variances or expense variances), and what are the causes, the effects, and the remedies.
An example of a simplified variance report follows:

28
Actual Budget Variance
Favorable (or
Unfavorable)
compared to
Budget
Revenue:
Tuition Revenue $ 100,000 $ 90,000 $ 10,000
Expenditures:
Personnel Costs $ (75,000) $ (70,000) $ (5,000)
Supplies $ (12,000) $ (10,000) $ (2,000)
Equipment Depreciation $ ( 5,000) $ ( 5,000) $ ----
Net Income $ 8,000 $ 5,000 $ 3,000
In the above example, the school budgeted $90,000 for tuition revenue, but more students came
to campus, giving the school a favorable tuition variance of $10,000. However, having more
students on campus required more faculty (probably contract faculty to teach the additional
sections of classes) and more supplies. The equipment depreciation did not change because of
additional students because depreciation is a fixed cost and does not change with increases in the
enrollment of the school in the short-run. From the variance report financial management can
determine that while revenue was up by $10,000, net income is only up by $3,000 because of the
additional expenses incurred with higher enrollment.
Financial managers can create a variance report as illustrated above, or any other type of report
that fits their decision-making needs. Other examples of possible reports include exception
reports, payroll reports, and program reports. Exception reports show those budget areas that
significantly deviate from budget expectations. Payroll reports are necessary to show that there
have been no deviations from authorized staffing levels. Payroll reports can also pinpoint
exceptions to budget expectations caused by salary adjustments and excessive overtime. Finally,
program reports can be used for program budgeting or program-oriented planning to track
expenditures by major function in the institution.
The following are some examples of budgeting problems and corrective actions that can be
taken:
Example 1. Assume that labor expenses are exceeding the budget because some parties
have done advance work on future phases of the project. This variance is a timing
problem, and will take care of itself in the future.
Example 2. Assume that supply expenditures are exceeding budget because of higher
prices of the supplies than anticipated due to inflation. In this case, the budget will need
to be revised to recognize the inflationary effect on anticipated supply expenses.
29
Example 3. Assume that supply expenditures are exceeding budget because the
purchaser bought more than needed, or because he/she purchased higher quality than the
project demanded. In this case, controls need to be put in place to control purchases.
Examples of such controls might be pre-approval of requisitions or check requests.
When investigating variances, it is important not to blame staff members for a variance that is
effectively unavoidable. Often a variance could not have been foreseen at the time the budget
was prepared, even though it is easily explained with hindsight. Staff members will be
demoralized if the “easy explanation” given after the fact includes blame to them as if they
should have been able to see into the future.
If the cost is a controllable one, then the budget manager should make every effort to bring the
expenditures into line with the budget.
Additional Analytical Techniques:
Additional analytical techniques that may be used for controlling the budget include:
1. Review of monthly financial statement numbers in the format presented.
2. Calculation of financial ratios.
The review of monthly financial statement numbers in the format presented is used when the
manager seeks to quickly identify items where recent changes have occurred. The manager
should particularly note balance sheet changes in the current asset accounts (e.g., accounts
receivable, inventories, investments, and cash). Changes in current liabilities (e.g., accounts
payable) and long-term debt and mortgages are also worthy of note because they signal
additional borrowing by the organization. On the income statement, the manager should note
any large changes in revenue or expense accounts for the fiscal period.
The financial manager should be able to mentally account for the changes identified, and if
he/she cannot, further investigation should take place. For example, an increase in total student
accounts receivable would be expected at the beginning of the school term because tuition
charges have just been placed on the student accounts. A decrease in total student accounts
receivable would be anticipated at the end of the term because of the expectation that student
accounts are being collected. If the expected decrease in student accounts receivable does not
occur, the financial manager may wish to speak with his/her accounts receivable collection clerk
to find out what is happening to student accounts receivable, and why collections are not
materializing as expected.
The calculation of financial ratios is done to help the financial manager put large numbers into an
understandable perspective and to assist when comparing two organizations or two periods of
time when the numbers may be quite different in size. Financial ratios are commonly divided
into three categories to assist the financial manager in obtaining the desired analytical
information. These three categories are: liquidity ratios, profitability ratios, and solvency ratios.

30
Liquidity Ratios. These ratios measure the short-term ability of the enterprise to pay its
maturing obligations to outside creditors and to meet unexpected needs for cash. The calculation
of these ratios on a regular basis will help the financial manager determine whether the
organization can pay its bills on a timely basis.
There are two primary liquidity ratios: Acid Test (or Quick Assets) Ratio and the Current Ratio.
The Acid Test (or Quick Assets) Ratio is a measure of the organization’s immediate short-term
liquidity. It is computed as follows:
Cash + Marketable Securities + Receivables
Current Liabilities
Conventional wisdom says this ratio should be 1:1, which means there is one dollar of “quick
assets” (assets quickly turned into cash) available to meet the current obligations to outside
creditors.
The Current Ratio is a measure used to evaluate an organization’s liquidity and short-term debt-
paying ability over a slightly longer period (i.e., over a year). It is computed as follows:
Current Assets
Current Liabilities
Conventional wisdom says that this ratio should be 2:1, which means there are at least two
dollars of current assets available to pay for every one dollar of current liabilities which will
come due in the next 12 months. It is important to remember that current assets include the asset
“inventory.” It will take some time to turn inventory into cash because the inventory must be
sold, and if it is sold on account, it will take some time to also collect the receivable. If an
organization does not have much inventory (which is common for many colleges and
universities), the current ratio and the acid test ratio may be almost identical.
Profitability Ratios. The profitability ratios measure the operating success of the organization
for a given period of time. One of the most common profitability ratios is the profit margin
calculation.
The Profit Margin measures the percentage of each dollar of revenue (tuition, etc.) that results in
net income (or change in net assets). The ratio is computed as follows:
Net Income (or Change in Net Assets)
Tuition Revenue or Total Revenue
The higher the profit margin, the better—to a point. Profit is very important because it generates
cash for stability, innovation, and growth. However, a not-for-profit organization’s board may
choose to set a limit to the amount of profit it wishes the organization to generate (e.g., 10%) and
require that after that limit is reached, then additional services need to be provided.
31
Solvency Ratios. Solvency ratios measure the ability of the enterprise to survive over a long
period of time. Since the most common reason for the demise of an organization is its inability
to meet the demands of its creditors, the solvency ratios focus on the amount of debt an
organization holds. We will consider one solvency ratio: Debt to Total Assets.
The Debt to Total Assets ratio measures the percentage of total assets provided by the creditors
(as opposed to the owners/donors). The number is expressed as a percentage. A high percentage
indicates high debt load; a low percentage indicates low debt load. The higher the percentage of
debt, the less flexibility the organization has to meet its mission and more of its revenue must go
to service the debt through the payment of interest and re-payment of principal. The ratio is
computed as follows:
Total Liabilities
Total Assets
The ratios presented will assist the financial manager and user in understanding whether or not
the organization can pay its bills; whether or not it is profitable so that the mission of the
organization can be continued and enhanced; and whether or not the organization will continue
into the future or whether it is in danger of going bankrupt.
The ratio and financial analysis glossary (see Appendix D) provides a number of other ratios
which can be computed if the manager is interested in using additional ratio analysis techniques.
Additional discussion of the importance of ratio and financial analysis for the manager and best
practices for financial statement analysis are provided in the Higher Education Management
Series monograph entitled: Financial Statement Analysis.
CONCLUSION
A budget is a statement of an organization’s plans, priorities, goals, and objectives, expressed in
financial terms, for a specific period of time. Ideally, the budget ties to and supports the
organization’s strategic plan, which in turn is connected to the mission and goals of the
organization. But people prepare the budget. How these people work together affects the budget
process and ultimately, the effectiveness of the budget itself. If an individual believes that
his/her department or project is at risk through the budget process, he/she may react by engaging
in budget games. To guard against such dysfunctional behavior, management must be in
constant communication with all cost centers managers and there must be a high level of trust
among these people, irrespective of where they are within the organization. It is not sufficient to
have high levels of communication and trust only among top management. These attributes must
be exhibited at all organizational levels.
The budget process can be easily described, but it is difficult to accomplish. The process
requires the budget makers to estimate the organization’s revenue and expenditures for the
coming 12-month period. Unfortunately, few organizations have sufficient revenue to cover

32
desired expenditures, and reductions in expenditures (or expectations of additional revenue) are
generally required to balance the budget. Using the participatory budget process, where all
budget-makers work as a team, is ideal for budget-making, including the process of dealing with
budget reductions, if required. However, the temptation to make a “top-down” decision at this
final point in order to “get the budget done” is strong. “Top-down” decisions, especially after
budget players have participated in the budget process, never builds trust nor achieves buy-in to
the final budget. Since budgets are only effective when everyone works together, the temptation
to short-cut the process as it enters its final stage just prior to communication to the board should
be avoided.
When communicating the budget to the board, the presenter must be honest, clear, and concise.
The board must be informed of the needs of the organization with sufficient detail so they
understand what will be accomplished with the requested funds. If, in order to balance the
budget, certain departments or programs have had their funding reduced, the impact of this
reduction in funding should be communicated clearly to the board members. Budget
communication should follow the four “S’s”: Keep the presentation simple, salient, scrupulous,
and with no surprises.
Budget-making is only the first step in the process. After the budget is voted, it is used as a tool
during the coming year to control actual costs. Differences between the budget and the actual
expenditures, called variances, must be monitored as the year progresses in order to assure
achievement of the expected profit or loss for the year. This monitoring process is a monthly
event and requires action as soon as the variance is determined to be material. The
organization’s controller is generally given the responsibility to monitor the budget and
communicate any problems to the appropriate cost center managers.
It is highly unlikely that anyone involved in budget-making would describe the process as “fun.”
However, having a financial plan that guides the college/university toward financial profitability
is essential. Without financial profit, a college/university cannot enjoy the stability necessary to
focus on how to build and grow the institution. Instead, the organization may be required to
focus on how to cut back and forego, and may be subject to nasty financial surprises, such as
borrowing for payroll or finding itself unable to meet other organizational commitments.
All Seventh-day Adventist colleges and universities see themselves as part of the overall mission
of the church to serve mankind while spreading the message of the soon return of Christ to all the
world. But to fulfill this mission, the organization must stay in business, and while in business, it
must utilize its resources in the wisest manner, again in support of achieving the organization’s
mission. Careful budgeting provides for growth in the financial dimension of the organization.
Such financial growth is a necessary precondition to growth in mission.

33
APPENDIX A
Budget Models
1. Executive Budget Model:
In the executive budget model, the budgeting process is centralized in a specific office—
commonly a vice president's office. This vice president is the one who submits the budget to the
board. The advantages seen for this model include (1) consideration of the entire needs of the
organization; (2) consolidating and standardizing information; and (3) centralizing controls and
procedures. The disadvantage is that it is not a participatory model, and thus is unlikely to have
buy-in from the cost center managers who will have to make the budget work effectively. Given
that most middle-level managers today want input into decision-making, the executive budget
model very seldom achieves success.
2. Performance Budget Model:
The performance budget model focuses on activities and their outcomes (as opposed to
objectives)—specifically the historical performance of the team. Examples of indicators that
might be used to measure past performance in an academic setting are the number of credits
taught, the number of sections taught, the number of students in the program, the number of
graduates, the number of graduates employed, etc.
This method is rational, objective, and rewards performance characteristics the institution wants
to encourage. It is primarily used as a top-down method of budgeting in hierarchical
organizations.
Problems with this model include: (1) the fact that quality indicators are difficult to identify; (2)
agreement on appropriate measurements for evaluation is difficult to accomplish; and (3) the
cause/effect relationship is usually complex and often difficult to measure. Thus quality
indicators are often used as supplements to financial measures when evaluating the effectiveness
of a cost center or department.
3. Planning, Programming, Budgeting Systems (PPBS):
PPBS attempts to merge the strategic planning process with the allocation of funds. It is
generally implemented by a top-down approach.

34
The steps of this method are:
1. Establish objectives and goals.
2. Develop alternative programs that will accomplish goals.
3. Establish resource requirements for each alternative.
4. Estimate benefits to be gained from each program alternative.
5. Develop an operating plan by selecting from among alternatives.
6. Test the long-range fiscal implication of the plan.
7. Compile the annual budget.
8. Evaluate the success with which program benefits are achieved.
9. Revise planning standards.
10. Repeat the cycle to accommodate changes in objectives, goals, available resources, and the
institution's environment.
Obviously, this method is VERY time consuming and therefore very difficult (even impossible)
to implement unless you have a large staff and lots of time. However, some useful principles can
be gleaned which can be used in other contexts:
First, budgeting should be focused on the benefit an activity will provide rather than on what
resources are available to expend. Suppose you have just been asked to cut your budget in a
particular area. If you have tied the budget to the benefit, you can respond by informing the
decision-maker what benefit the organization must forego. If you have not tied the budget to the
benefit, you have no response but to cut the budget.
Second, number 6 above highlights the importance of testing the long-range fiscal implications
of the plan. In this step, one identifies the future costs of an action. Long-range fiscal planning
is important in retaining future flexibility and responsiveness.
4. Formula Budgeting:
Formula budgeting creates a budget formula by estimating future budget requirements through
the manipulation of data about future programs and by utilizing the relationship between the
program and the cost. This method assumes that the past accurately predicts the future, that the
chosen formula is a mathematical expression of the best decisions of the past, and that the basis
of the formula is a cost analysis of past performance. Unfortunately, this is not always true. At
their own peril, the users of this method may forget that the results of the calculations are only as
good as the data and formula. If the data is inconsistent or the formula is an inaccurate summary
of past history, then the estimate will not be reliable. Formula budgeting also stifles innovation
and change. It assumes and encourages the status quo. Finally, because formula budgeting is so
simple, it often is applied to circumstances where it is inappropriate.
This method can, however, be quite useful for some budget accounts where the expenditures are
small and numerous, such as instructional supplies, or where the mathematical relationship is
very consistent. Two such instances are described below.
35
Example l: Salary expenditures are projected by determining the number and type of
positions required, then applying to that estimate a salary schedule or average
salary per position.
Example 2: Budgets for classroom supplies are created by multiplying the historical cost
of the materials per student times the number of sections and average enrollment
for the course.
5. Zero-Based Budgeting:
Zero-based budgeting starts with a blank sheet of paper, usually in regard to discretionary
expenditures, with the intent to get a handle on rising costs. Beginning at zero is seen as the best
exercise to review discretionary overhead (instead of incrementing the new on the old). While
conceptually attractive, it requires a great deal of managerial time to prepare and implement.
The concept grew out of concern for increasing costs in the 1970s in United States businesses.
However, because of the bureaucratic and time-consuming nature of the process, few companies
tried it more than once.
This process is unfit for programs which are of a continuing nature—as are many programs in
educational institutions. For example, a college/university will need to “teach out” students,
even if a particular major is dropped. Thus using zero-based budgeting for faculty salaries is not
a wise use of the staff's time.
Sometimes the term "zero-based budgeting" is used loosely—i.e., to mean "starting from
scratch" in estimating needed resources, rather than the more formal process of deciding whether
you need the activity. In such cases, the call is generally for rethinking the nature of the
program, or whether a particular course of study is still relevant to the students. It is important
that the manager remember the loose definition of the term when hearing a call for “zero-based
budgeting.” Few organizations have the time or resources to redo their entire organizational
financial plan on an annual basis.
6. Incremental Budgeting:
This is the most common type of budgeting and the one discussed in Part II. This method
assumes that the starting point for each discretionary expenditure item is the amount spent on it
in previous years. Frequently, the amount of the budget increases by some fixed percentage—
such as 5% or 10% of the prior year's amount.
While this method is often criticized, it does have advantages. It is easy to understand, easy to
use to prepare a new budget, ruffles very few feathers, and is accepted by most governing
boards. It is especially practical in situations of little budgetary flexibility and fairly fixed
costs—which is often the very situation faced in many colleges and universities.
The weakness with this approach is that it maintains the status quo and does not encourage

36
planning. It also does not require any connection between allocation of resources and
institutional goals. Thus when using this approach, comparing the budget with the
organization’s mission and strategic plan is essential.

37
APPENDIX B
Eight Golden Rules for Effective Budgets
Budget Continuously. Budgeting and planning are not just one-time events. Consider budgeting
as more than an annual activity. Remember that the future is uncertain, so revise budgets
regularly to reflect changes in the business environment.
Take Your Time. Budgets are the key part of planning and require careful thinking. Do not
underestimate the time needed to gather relevant information, formulate plans, and make a
budget a realistic planning proposal.
Involve Everyone. Include all those that should be involved in the budgeting process. Make
your budgeting more than just a high-level activity. Involve relevant people with appropriate
knowledge and skills and encourage them to commit to the process.
Be Realistic. Focus on what your department actually needs in a particular budget. Be aware
that if resources are scarce there will be competing demands for items within the organization,
which can often lead to deliberate overestimation.
Look Ahead. Look to the future, not to the past when deciding budgeting amounts. Keep
focused on future targets. Do not rely on historic figures to guide next year’s budget, which,
although approximately right, might be completely wrong.
Be Aware of Politics. Understand that the size of a budget should not be confused with its
importance in the organization. Avoid all traditional budgetary game-playing around this normal
misunderstanding.
Monitor Events. Priorities and amounts may need to be changed in line with events. Be
prepared to amend your budget while still challenging all expenditures and trying to resolve
unforeseen problems in other areas.
Allow Flexibility. Budgets do not have to be slavishly followed. Avoid the temptation to spend
all that you were authorized to, and do not guard the underspent portion of your budget when
others could well use the resource.
Source: Brookson, p. 29

38
APPENDIX C
Beyond Budgeting–the Hope and Fraser Model
As noted in Part 1, budgets are severely criticized by many because the process is too time-
consuming and therefore too expensive for the value it brings to the business, and because the
process often results in budget game-playing by those involved. These general criticisms can
also be levied at the budget process within Seventh-day Adventist colleges and universities,
where attempts to create a participatory budget process often result in hours and hours of
meetings which include both administration and middle-management cost center managers, but
do not result in corresponding buy-in to the budget or reduction in budget game playing.
Hope and Fraser, in their book entitled Beyond Budgeting: How Managers Can Break Free
From the Annual Performance Trap, discuss the two criticisms noted above and already
addressed in this document, and add a third. Their book discusses the use of the budget as a
“fixed performance contract,” through which top administration commits the cost center
manager to “achieving an agreed-upon outcome and then enables a superior to control the results
against that outcome” (p. 10). Often managerial rewards, including promotion, are tied to
achieving these budget contracts. This use of the budget relates to the “command and control”
style of management that does not fit in today’s competitive and fast-changing climate. If an
organization uses the budget as a fixed performance contract, the organization can become
“budget-focused” rather than “strategy-focused”—often to its competitive detriment.
Hope and Fraser define the “budget contract” as one that includes the following features (p. 10):
1. A fixed target.
2. An incentive or reward, usually fixed to the agreed target.
3. An agreed-upon plan.
4. A statement of resources which are allocated to functions and departments.
5. A commitment to cross-company actions so that actions in one area commit other
departments to common goal and plans.
6. A reporting schedule identifying the type and frequency of reporting.
As can be seen from the above list, Hope and Fraser are describing a tightly-controlled budget
process where the pressure to “meet the budget” is enormous and where failure to achieve the
stated goals result in personal loss, either financially or through loss of recognition or promotion.
In such an environment, the pressure to improve performance with respect to the budget runs
directly counter to the recognition that with business conditions constantly changing (and
sometimes deteriorating), one does not have the required flexibility to act in market-smart ways.
Most colleges/universities do not grant bonuses or promotions based on budget performance, nor
do they closely tie the organization’s various departments/cost centers together, as would be true
in a manufacturing environment. Thus it may appear that Hope and Fraser’s caution against
fixed performance contracts does not fit an educational organization. However, when top
administration uses the budget or the budget process to control middle management’s actions,
such control inevitably results in the inability of the organization, as a whole, to act strategically.

39
As Hope and Fraser put it, “management by the numbers” is a “dismal way of managing a
business” (p. 15).
Hope and Fraser’s remedy for the dysfunctional budget process is to do away with budgets in
order to encourage the organization to relinquish top-down control and focus on multilevel
control. They urge management to work to build trust among team members and grant more
responsibility to these people rather than attempt to control team members actions through the
budget process.
Hope and Fraser take an extreme approach to address the problem of too much control from the
top during budget creation and evaluation. The author of this monograph would argue that rather
than doing away with budgets, good managers should seek participation and consultation with
those who must work with the budget in order to create support and budget buy-in. All
organizations must have a financial plan in order to be successful. The Seventh-day Adventist
Church recognizes this reality by including the preparation of the budget as part of required
church financial policy for its organizations. Doing away with budgets is not an appropriate
answer to budget problems. Doing budgeting wisely and carefully, with participation and buy-in
from cost center managers, is the best answer to a dysfunctional budget situation.
However, in all organizations, even Seventh-day Adventist colleges and universities, too much
time may be spent in budgeting, and cost center managers may engage in gaming activities.
Often frustrated administrators respond to these realities by increasing financial control over cost
centers and in some cases, preparing autocratic budgets which are handed down from the top
without input from the budget managers. Hope and Fraser warn us that increasing managerial
control increases dysfunctional behavior. At times this dysfunctional behavior takes the form of
budget games, such as those discussed in Part 1. At other times the effect of too much control is
to squeeze the life and spirit out of the organization and its people. In either case, the
organization and its mission are not well-served.

40
APPENDIX D
Ratio and Financial Analysis Glossary
Acid-test ratio A measure of a company’s immediate short-term liquidity,
computed by dividing the sum of cash, marketable securities, and
(net) receivables by current liabilities.
Current ratio A measure used to evaluate a company’s liquidity and short-term
debt-paying ability, computed by dividing current assets by current
liabilities.
Debt to total assets ratio Measures the percentage of total assets provided by creditors,
computed by dividing total debt by total assets.
Horizontal analysis A technique for evaluating a series of financial statement data over
a period of time to determine the increase (decrease) that has taken
place, expressed as either an amount or a percentage.
Inventory turnover ratio A measure of liquidity of inventory, computed by dividing cost of
goods sold by average inventory.
Liquidity ratios Measures the short-term ability of the enterprise to pay its
maturing obligations and to meet unexpected needs for cash.
Profitability ratios Measures the income or operating success of an enterprise for a
given period of time.
Profit margin ratio Measures the percentage of each dollar of sales that results in net
income, computed by dividing net income by net sales.
Receivables turnover ratio A measure of the liquidity of receivables, computed by dividing
net credit sales by average net receivables.
Return on assets ratio An overall measure of profitability, computed by dividing net
income by average assets.
Solvency ratios Measures the ability of the enterprise to survive over a long period
of time.
Vertical analysis A technique for evaluating financial statement data that expresses

41
each item within a financial statement in terms of a percent of a
base amount.
% of Self-Support Earned Operating Income (Excl. Donations/Appropriations)
divided by Total Operating Income. This percentage is an
important indicator of self-sufficiency. Operating within the
organization’s own income, exclusive of appropriations for
operating purposes, is the goal. The higher the percentage, the
better the position.
% of Required Working
Capital Working Capital divided by Required Working Capital. Required
Working Capital for all organizations has been established by
policy. The expected percentage to be maintained is 100%. Effort
should be exerted to bring the actual working capital up to this
point. An unreasonable accumulation of working capital beyond
the 100% point should be guarded against as it may be an
indication of hoarding to the detriment of the field program.
% of Fixed Asset
Investment Net Invested in Plant divided by Total Fund Balances. This
percentage measures the extent to which the total fund balances of
the organization are tied up in land and buildings. Fixed asset
requirements are relative; certain types of organizations require
more than others. The cost of maintenance, repairs and
depreciation increases even if the assets are donated. Alert
management will adopt as its objective the investment of the
minimum in fixed assets consistent with the operational
requirements of the particular organization.
% of Debt-Financed Fixed
Assets Invested in Plant Payables divided by Total Fixed Assets. This
shows the percentage of fixed assets financed with borrowed
funds. Appropriate percentage should be determined based on a
number of factors: relative needs for capital for carrying on the
operating program of the entity: availability of funds from lenders,
and cost of borrowing (interest): estimated future cash flows and
ability to repay borrowing when due: and proper authorization for
borrowing voted by the senior organization(s) as required by
policy.

42
% of Receivables to
Operating Accounts Receivable (net) + Notes and Loans Receivable divided
by Unallocated and Allocated Operating Fund Balances. This is a
key percentage to control receivables as it relates to the operating
fund balances. Generally, the lower the percentage, the better the
position. How much of the operating fund balances should be tied
up in receivables? What are the basic operating needs of the
organization in this respect? No norm has been established.
% of Return on Equity Net Increase (Decrease) from Operations divided by Total Fund
Balances indicates the percent of excess of all income over all
expenditures as related to total investment of denominational
funds. It is usually more meaningful in such organizations as
institutions (publishing, healthcare, etc.), and commercially
oriented operations, but it is an informative guide in conference-
type organizations as well.

43
APPENDIX E
References and Further Resources
Bart, C. K. “Budgeting Gamesmanship.” Academy of Management Executive, 1988, pp. 285-
294.
Birnberg, J., M. Shields, and S. Young. “The Case for Multiple Methods in Empirical
Management Accounting Research (with an Illustration from Budget Setting).” Journal of
Management Accounting Research, 1990, pp. 33-66.
Birdsall, Douglas G. “The MicroPolitics of Budgeting in Universities: Lessons for Library
Administrators.” Journal of Academic Librarianship, November 1995, Vol. 21, Issue 6, pp. 427-
438.
Brinckerhoff, Peter. “How to Save Money Through Bottoms-Up Budgeting.” Nonpofit World,
Vol. 14 (1), Jan./Feb., 1996, pp. 22-25.
Brookson, Stephen. Managing Budgets. London: Dorling Kindersley Press, 2000.
Chabotar, K. J. “Managing Participative Budgeting in Higher Education.” Change,
Sept./Oct.1995, Vol. 27 (5), pp. 21-31.
Godin, Seth and Paul Lim. If You’re Clueless About Accounting and Finance and Want to Know
More. Chicago, Ill: Dearborn Trade Publishing, 1998.
Harvard Business Essentials Manager’s Toolkit. Your Mentor and Guide to Doing Business
Effectively. Boston, Mass.: Harvard Business School Press, 2004.
Hope, Jeremy and Robin Fraser. Beyond Budgeting: How Managers Can Break Free From the
Annual Performance Trap. Boston, Mass.: Harvard Business School Press, 2003.
McLaughlin, Thomas A. Streetsmart Financial Basics for Nonprofit Managers. John Wiley &
Sons, 1995.
Sylvester Jones Resource (Note: according to the website, it's called “Resource” Center), not
Sylvester Jones University. Center. University of Alabama. http://leadership.ua.edu.
Stewart, T. A. and Shawn Tully. “Why Budgets Are Bad For Business.” Fortune, June 4, 1990,
pp. 179-190.
Tracy, John A. How to Read a Financial Report. John Wiley & Sons, 1999, 5th edition.
Top Related
Copyright © 2022 FDOKUMEN

