


Bahasa
Halaman
Hukum

BODIL: a molecular modeling environment for structure-function analysisand drug design
Jukka V. Lehtonena, Dan-Johan Stilla, Ville-V. Rantanena;b, Jan Ekholma, Dag Bjork-lunda, Zuhair Iftikhara, Mikko Huhtalaa, Susanna Repoa, Antti Jussilab, Jussi Jaakkolab,Olli Pentikainena, Tommi Nyronenc, Tiina Salminena, Mats Gyllenbergb;d and Mark S.Johnsona;�aDepartment of Biochemistry and Pharmacy, Abo Akademi University, Tykistokatu 6A, FIN-20520 Turku,Finland; bDepartment of Mathematics, University of Turku, Matematiikan laitos, FIN-20014 Turun yliopisto,Finland; cCSC, the Finnish IT Center for Science, P.O. Box 405, FIN-02101 Espoo, Finland; dCurrentaddress: Rolf Nevanlinna Institute, Department of Mathematics and Statistics, FIN-00014 University ofHelsinki, Finland
Received 20 April 2004; accepted in revised form 10 September 2004
Key words: density docking, molecular visualization, sequence comparisons, structure comparison, struc-ture modeling
Summary
BODIL is a molecular modeling environment geared to help the user to quickly identify key features ofproteins critical to molecular recognition, especially (1) in drug discovery applications, and (2) to under-stand the structural basis for function. The program incorporates state-of-the-art graphics, sequence andstructural alignment methods, among other capabilities needed in modern structure–function–drug targetresearch. BODIL has a flexible design that allows on-the-fly incorporation of new modules, has intelligentmemory management, and fast multi-view graphics. A beta version of BODIL and an accompanyingtutorial are available at http://www.abo.fi/fak/mnf/bkf/research/johnson/bodil.html
Introduction
As the biological sciences enter what has beenreferred to as the ‘post-genomic’ era, where the fo-cus has shifted to the comparison of genomes anddetailed investigation of the encoded proteins, thecomparison and analysis of sequences and three-dimensional structures have become routine aspectsin molecular biology. Very often, direct visualiza-tion of molecular structures and their relationshipto the linear sequence and to ligands they bind isnecessary to interpret and understand the detailedbiological functions of proteins, often revealed onlyindirectly by wet-lab experimentation.
Five years ago we began to develop a graphicalinterface for our own programs and to use thisgraphical interface to ease the development anduse of novel software. The result today is the BodilMolecular Modeling Environment, which providesflexible and convenient integration of proteincomparison and modeling tools coupled with high-quality molecular graphics. In Bodil we sought todo basic tasks (e.g., alignments, display, high-similarity structure modeling) well, while fullyrealizing that it was impossible to accomplish all ofthe tasks that are available in commercial pro-grams. We aimed to make a straightforward userinterface for some of the tasks that are difficult toachieve in commercial and other academic pack-ages – most often tasks related to data manipula-tion or access to frequently used procedures.
�To whom correspondence should be addressed. Fax: +358-2-
215-3280; E-mail: [email protected]
Journal of Computer-Aided Molecular Design 18: 401–419, 2004.� 2004 Kluwer Academic Publishers. Printed in the Netherlands.
401
Furthermore, we wanted Bodil to be written insuch a way that it would be easy to introduce newmodules and to modify and enhance the programas needs change. Our ultimate goal was to producea quality set of tools useful for protein structure–function analysis and applicable to ligand design,and whose features could evolve with futuredesires.
Bodil consists of a core program and a set ofmodules that perform different tasks. These tasksinclude reading/writing sequence and structurefiles, making multiple sequence alignments, align-ments of three-dimensional structures, graphicaldisplay of structures, estimating the coordinates ofa protein structure, ‘protein modeling’, and so on.The core of Bodil provides for common datastorage and management of plug-in programs.The plug-ins present data in different ways,e.g., alignments, structure, surface features, rela-tionships, etc. The change of the common datain one plug-in notifies the other plug-ins via thecore program. Thus, one can highlight sequenceidentities, differences, amino acid properties (e.g.,hydrophobicity, polarity, size, etc.), motifs inthe sequence alignment, and their location onthe three-dimensional structure is immediatelyshown. Likewise, interesting structural featuresare linked back to the residues in the sequencealignment.
The graphical structure view editor makes iteasy to mock-up a complicated view of proteinsand any bound ligand molecules, where, forexample, different parts of the structures can bedisplayed simultaneously as opaque and trans-parent surfaces, the secondary structure asribbons, and any portion of the structure as ball-and-sticks, CPK or as wire frameworks. Bodil canread in density grids specifying the ideal locationfor binding chemical groups [1], chemical probegrid maps from AutoDock [2], GRID [3] andelectron density from X-ray crystallography orcryo-electron microscopy (cryo-EM). We haveused a plug-in devised by us within Bodil to dockX-ray coordinates into low-resolution electrondensity obtained from cryo-EM. Grid density datacan be displayed as contours, ranges or as iso-en-ergy values, colored appropriately.
The current generation of mid-priced graphicscards for desktop machines can display and rotatesurfaces without the annoying delay seen previouslyeven on older, high-priced graphics workstations.
At the present time, a fast personal computer run-ning under Linux is an ideal solution, but the pro-gram is nearly fully functional under the MicrosoftWindows operating system, too. Bodil can usehardware stereomode, forwhich graphics cards andX-windows support is available for the Linuxoperating system.
Methods
Bodil – design strategy
The initial design goal of the program Bodil was tocreate a software package that would visualizemolecules with high quality graphics even on Intel-based PC computers, which would present the userwith a simple and intuitive, yet powerful, graphicaluser interface, and that should be easy to expandby adding new functionality. The main design taskwas to choose an appropriate data structure forthe biochemical data and to develop an efficientmethod for incorporating useful algorithms intothe program. The result is a modular design, wherethe main executable contains only the commondata and the algorithms are encapsulated inmodules that are physically separate, dynamicallyloaded libraries. This produces independent mod-ules, which only require access to the commondata. New functionality can be added to the pro-gram simply by adding modules; the existing pro-gram does not need to be changed. Similarly,changing a module requires only the recompilationof that single library. There is also a run-timeperformance benefit from this modular design:modules are loaded into memory only if theyare used and unloaded after use to release thememory.
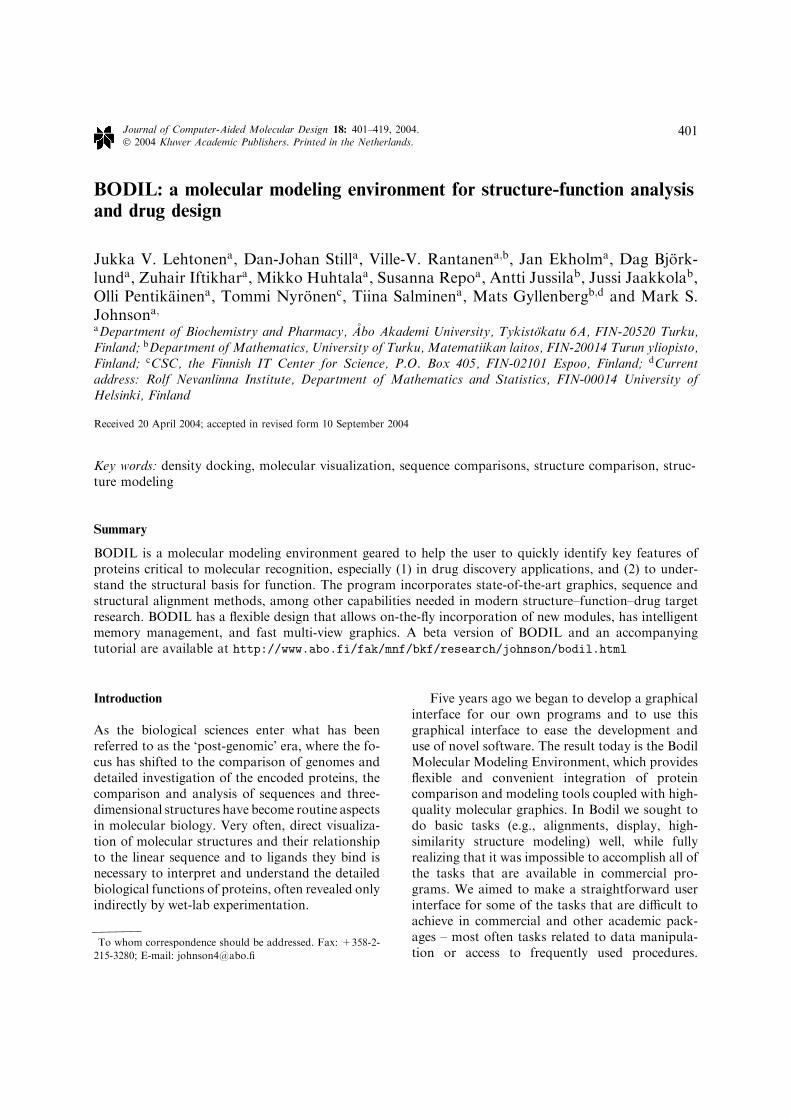
In Figure 1 we show the program componentsand the modules currently implemented. Themodules have been grouped by their purpose:visualization tools, computational algorithms,parsers, and utilitarian procedures. The visualiza-tion modules employ different techniques to showthe data graphically and allow interactive modifi-cation of the data. The parser modules convertdata between the program’s internal representa-tion and external file formats. The set of algo-rithms includes computational procedures both toassist visualization and to analyze proteins andmolecular interactions. The utility modules
402
provide helper functions, such as the selection ofthe files for data import.
The data structure
Biochemical data contain both clearly definedphysical entities and the relationships betweenthose entities. Some entities, like molecules, areclearly composed of smaller parts – the atoms.These higher-level abstractions of molecules areusable alone; a protein sequence describes the one-dimensional properties of a protein and onlyimplies the existence of an atomic structure. Thus,
it is a sufficient representation of the protein forsequence comparison purposes. A chemical bondis an example of a stronger dependency, since itmust explicitly refer to defined atoms. It is ratherstraightforward to use an object oriented datastructure to represent such data in the form of anobject tree. A composite design pattern [4]describes a way to construct an object tree, andeach molecular entity can be modeled by either ofthe two basic types – leaf and composite – definedby the pattern. The leaves are always terminalnodes in the tree and the composites can beinternal nodes. An internal node represents a
Figure 1. Program components. The program is divided into the core binary, which holds the data and module libraries that containthe computational algorithms and the user interface. The modules are grouped by their task. Some of the algorithms are implementedwithin the visualization modules, and some computational modules do have their own user interface for selecting operating param-eters. The density grids are three-dimensional arrays of discrete spatial data, which can be, for example, electron densities, electrostaticpotentials, or a force field. Besides molecules and density grids, the program also handles alignments and arbitrary geometric objects.
403
larger structure that is composed from smallerobjects (leaves). Thus, an operation performed ona composite node does not change that nodedirectly. Instead, the operation is automaticallyperformed on every node directly under the com-posite node in the tree (the child nodes). Since achild node can be a composite node, the resultingrecursion asserts that the operation is performedfor each leaf node within the subtree, rooted at thecomposite node on which the operation was initi-ated. Thus, the state of the composite node ischanged indirectly, as the state is a composition ofthe states of the leaf nodes. In addition, compositebiochemical entities, such as a protein chain, canhave some state variables (color, name, etc.)independent of the state of the child nodes.Therefore, the composite objects in our imple-mentation are more complex than the compositedesign pattern [4] requires.
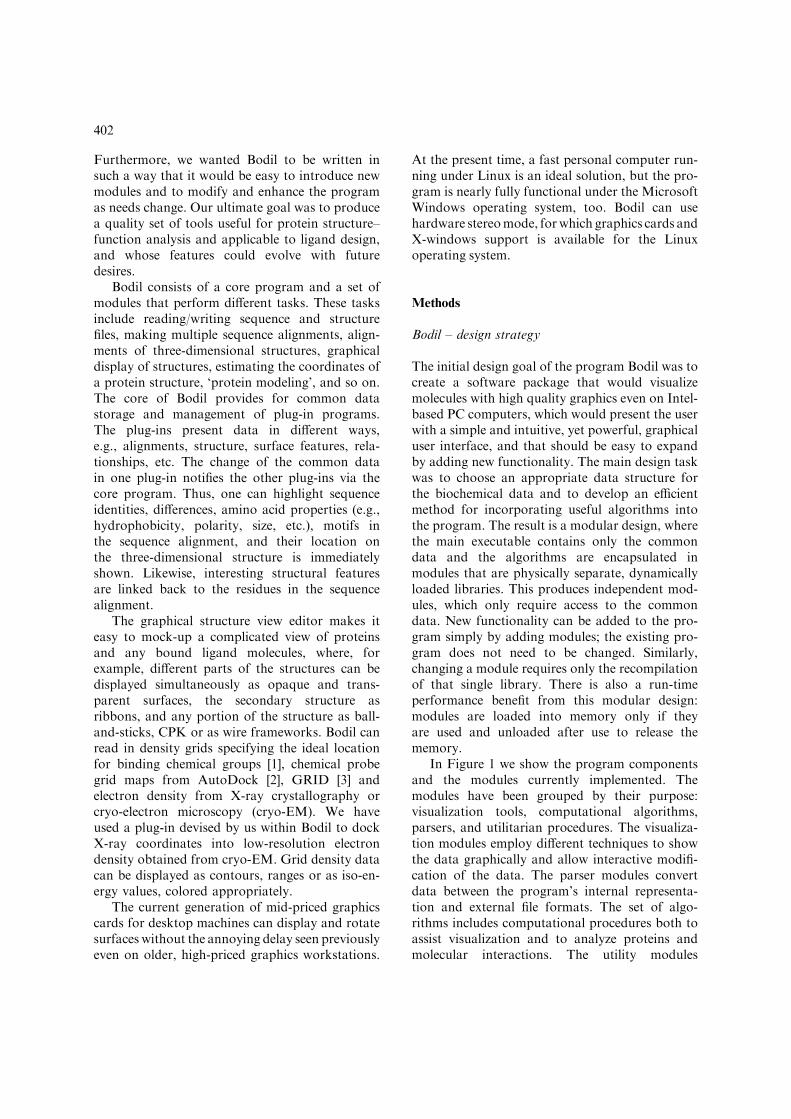
In our implementation we represent biochemi-cal entities as objects and store all objects in ahierarchical tree structure (Figure 2). The levels ofhierarchy are a convention that is not required bythe data structure nor by the algorithms, but itsimplifies both the implementation and the use ofthe tree. While Figure 2 shows only an example ofthe main hierarchy, the tree also contains rela-tionships between physical entities, for examplebonds and alignments, as well as other objectssuch as grid maps, surfaces, and arbitrary geo-metrical shapes. A grid is an array that containsdiscrete values sampled from a three-dimensionalvolume. Electron densities, force fields and spatialprobabilities are types of data typically stored as adiscrete grid. The density within a three-dimen-sional volume is visualized by an iso-surface,similarly to the way a contour curve indicates a
specific height in a two-dimensional map. Thecoordinates of iso-surface points are computedfrom grid points by interpolation of density values.The surface points can be used to draw triangles,which approximate the iso-surface. We store theset of triangles as a separate surface object, whichis a child of the grid object.
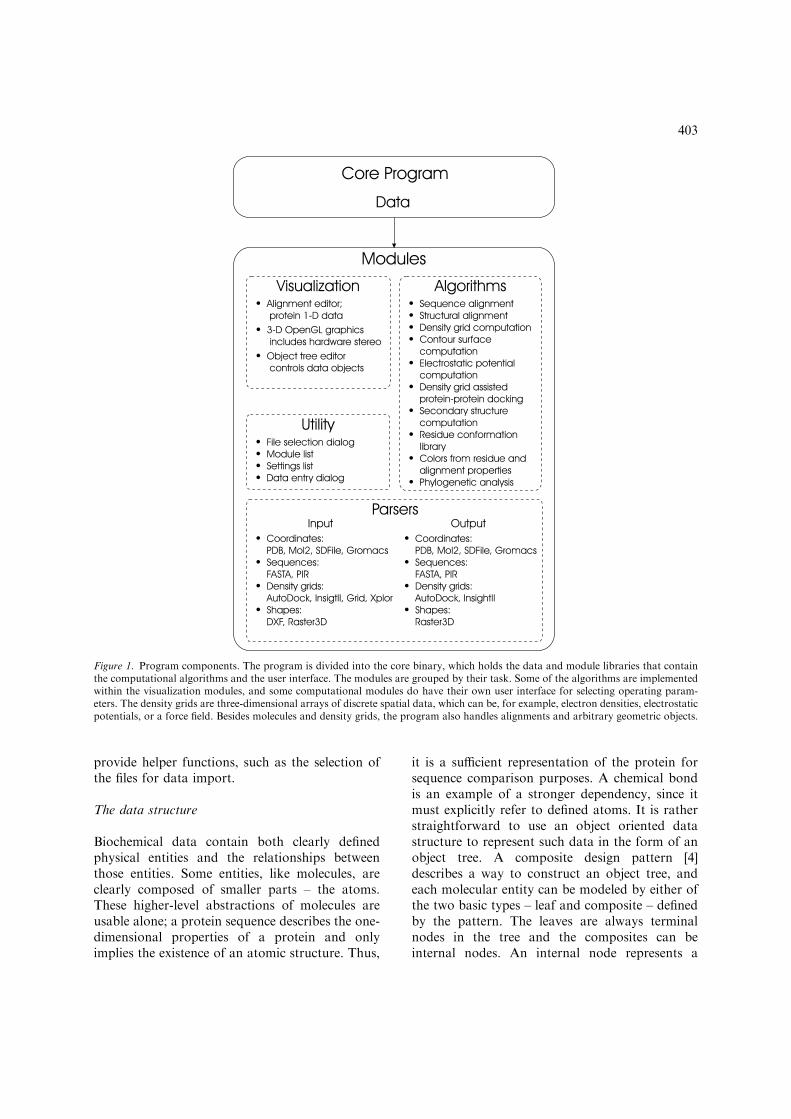
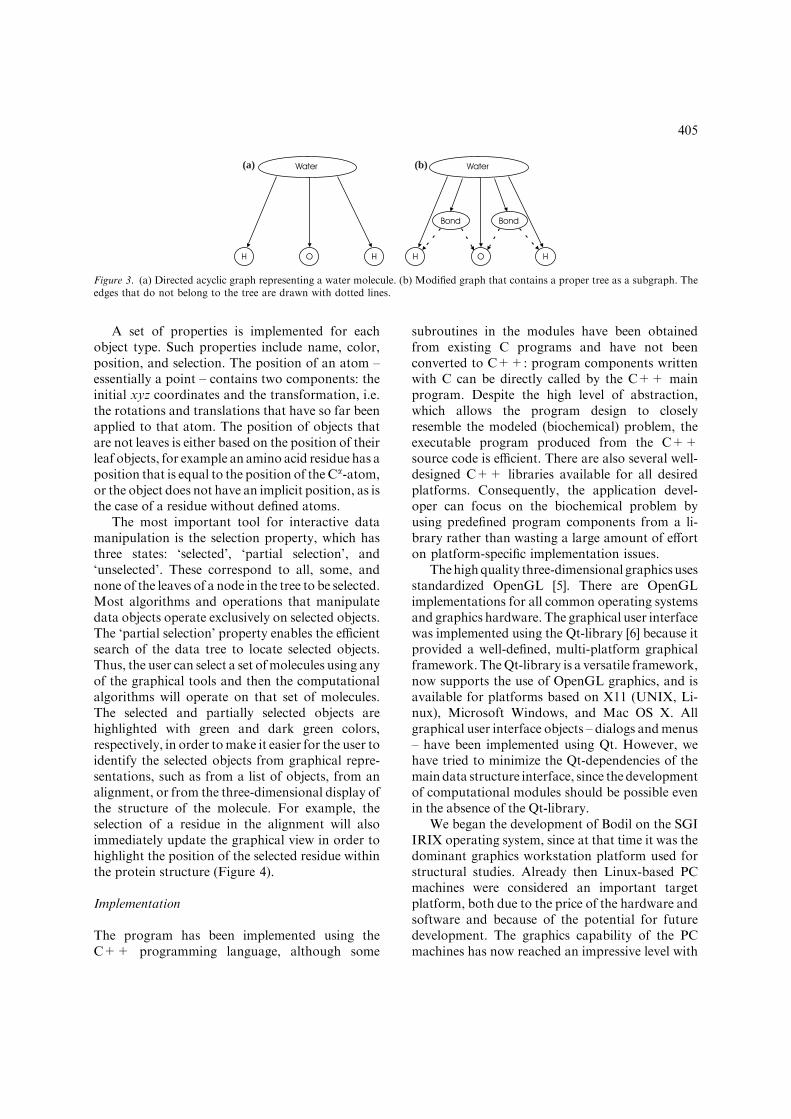
A bond between two atoms or an alignmentbetween two or more protein chains is an object,although it represents a less tangible relationshipbetween the entities. A normal object, for examplean amino acid, is a branch node in a tree: a childof a chain and the parent of the atoms. A bond,however, does not fit into the tree as easily: thebond must connect two atoms without beingeither the parent or the child, since the presence ofmore than one bond per atom would violate thetree structure where each child can only have asingle parent. Therefore, it is clear that a treestructure (Figure 3a) cannot be used to representsuch relationships. Instead, we have used adirected acyclic graph (DAG) to describe both themolecular entities and their relationships (Fig-ure 3b). This graph includes a tree, which is onlya special form or subset of a DAG where eachnode has only one incoming edge; a tree doeshave the advantage of allowing more simplifiedrecursive operations than a generic DAG. Con-sequently, we identify the tree within the DAG,marking the edges in the data structure to be ofeither a ‘tree’ or a ‘relationship’ type (Figure 3b).The edges belonging to the tree are stored sepa-rately from the relationship edges. Thus, we canaccess the data objects efficiently with tree algo-rithms, but the graph can still be traversedexplicitly using the relationship edges whenneeded.
Figure 2. Hierarchy of molecular data. On the left we list major levels of the hierarchy; on the right is an example tree organizedaccording to the hierarchy.
404
A set of properties is implemented for eachobject type. Such properties include name, color,position, and selection. The position of an atom –essentially a point – contains two components: theinitial xyz coordinates and the transformation, i.e.the rotations and translations that have so far beenapplied to that atom. The position of objects thatare not leaves is either based on the position of theirleaf objects, for example an amino acid residue has aposition that is equal to the position of the Ca-atom,or the object does not have an implicit position, as isthe case of a residue without defined atoms.
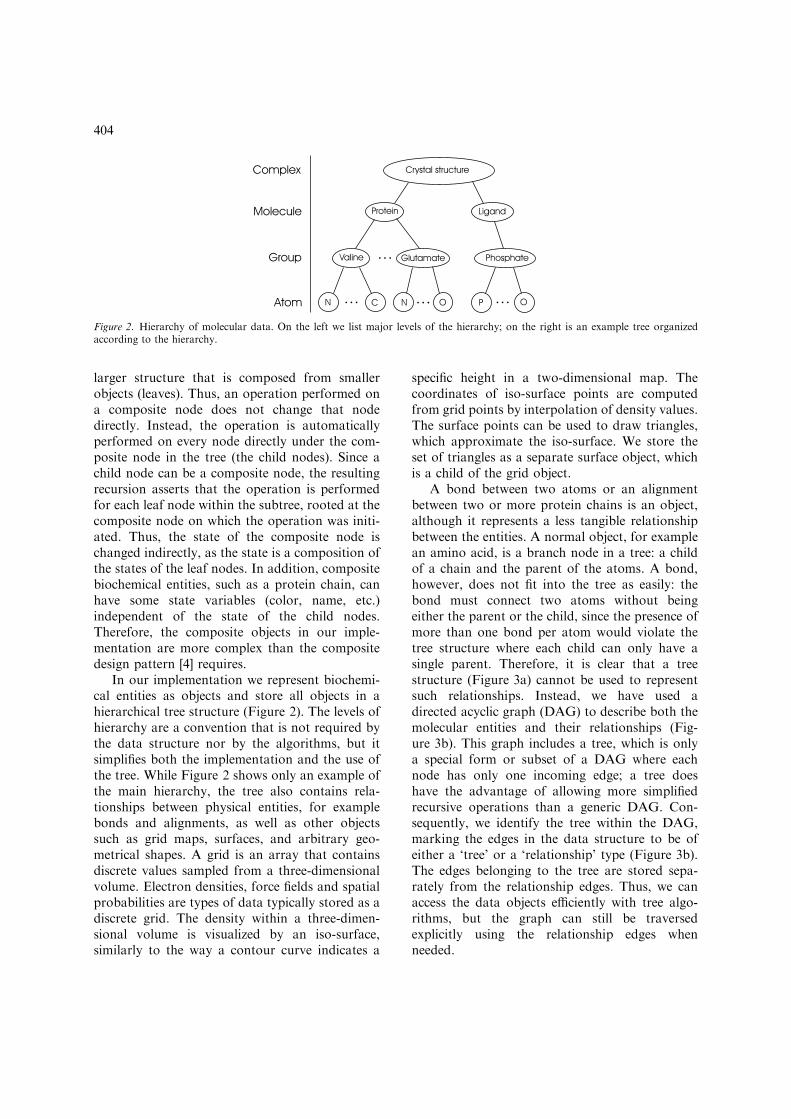
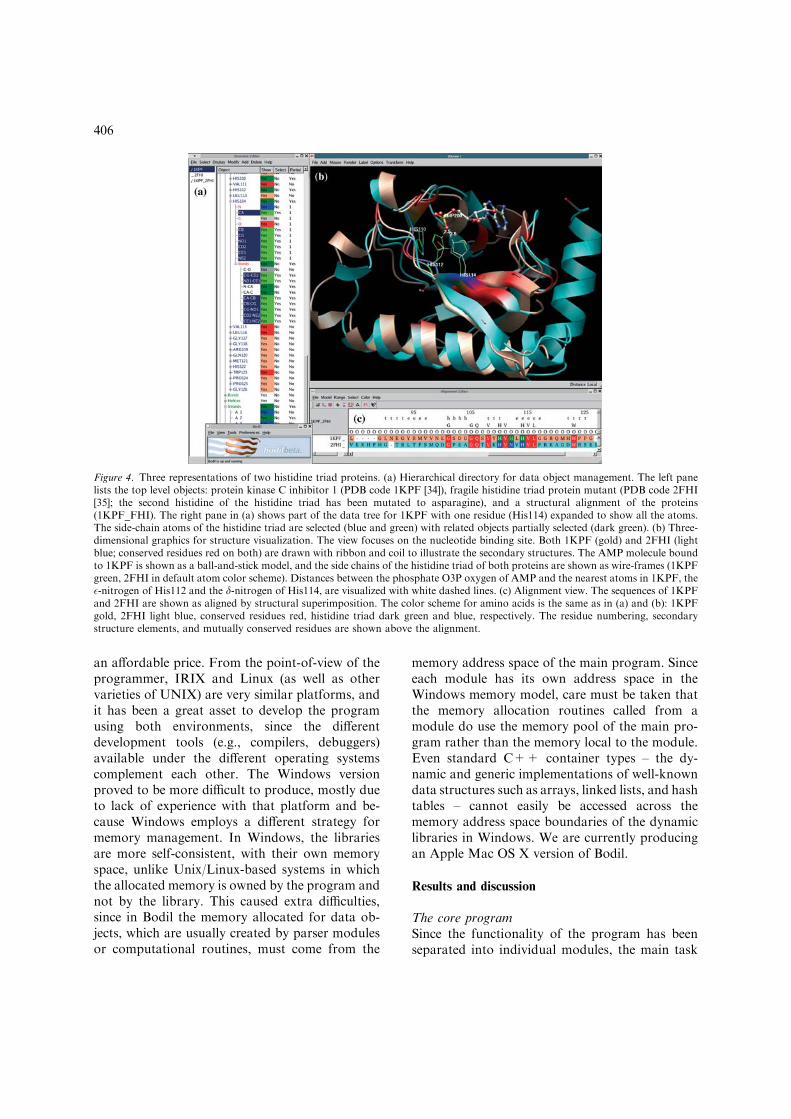
The most important tool for interactive datamanipulation is the selection property, which hasthree states: ‘selected’, ‘partial selection’, and‘unselected’. These correspond to all, some, andnone of the leaves of a node in the tree to be selected.Most algorithms and operations that manipulatedata objects operate exclusively on selected objects.The ‘partial selection’ property enables the efficientsearch of the data tree to locate selected objects.Thus, the user can select a set ofmolecules using anyof the graphical tools and then the computationalalgorithms will operate on that set of molecules.The selected and partially selected objects arehighlighted with green and dark green colors,respectively, in order tomake it easier for the user toidentify the selected objects from graphical repre-sentations, such as from a list of objects, from analignment, or from the three-dimensional display ofthe structure of the molecule. For example, theselection of a residue in the alignment will alsoimmediately update the graphical view in order tohighlight the position of the selected residue withinthe protein structure (Figure 4).
Implementation
The program has been implemented using theC++ programming language, although some
subroutines in the modules have been obtainedfrom existing C programs and have not beenconverted to C++: program components writtenwith C can be directly called by the C++ mainprogram. Despite the high level of abstraction,which allows the program design to closelyresemble the modeled (biochemical) problem, theexecutable program produced from the C++source code is efficient. There are also several well-designed C++ libraries available for all desiredplatforms. Consequently, the application devel-oper can focus on the biochemical problem byusing predefined program components from a li-brary rather than wasting a large amount of efforton platform-specific implementation issues.
Thehighquality three-dimensional graphicsusesstandardized OpenGL [5]. There are OpenGLimplementations for all common operating systemsand graphics hardware. The graphical user interfacewas implemented using the Qt-library [6] because itprovided a well-defined, multi-platform graphicalframework. TheQt-library is a versatile framework,now supports the use of OpenGL graphics, and isavailable for platforms based on X11 (UNIX, Li-nux), Microsoft Windows, and Mac OS X. Allgraphical user interface objects – dialogs andmenus– have been implemented using Qt. However, wehave tried to minimize the Qt-dependencies of themaindata structure interface, since the developmentof computational modules should be possible evenin the absence of the Qt-library.
We began the development of Bodil on the SGIIRIX operating system, since at that time it was thedominant graphics workstation platform used forstructural studies. Already then Linux-based PCmachines were considered an important targetplatform, both due to the price of the hardware andsoftware and because of the potential for futuredevelopment. The graphics capability of the PCmachines has now reached an impressive level with
(a) (b)
Figure 3. (a) Directed acyclic graph representing a water molecule. (b) Modified graph that contains a proper tree as a subgraph. Theedges that do not belong to the tree are drawn with dotted lines.
405
an affordable price. From the point-of-view of theprogrammer, IRIX and Linux (as well as othervarieties of UNIX) are very similar platforms, andit has been a great asset to develop the programusing both environments, since the differentdevelopment tools (e.g., compilers, debuggers)available under the different operating systemscomplement each other. The Windows versionproved to be more difficult to produce, mostly dueto lack of experience with that platform and be-cause Windows employs a different strategy formemory management. In Windows, the librariesare more self-consistent, with their own memoryspace, unlike Unix/Linux-based systems in whichthe allocated memory is owned by the program andnot by the library. This caused extra difficulties,since in Bodil the memory allocated for data ob-jects, which are usually created by parser modulesor computational routines, must come from the
memory address space of the main program. Sinceeach module has its own address space in theWindows memory model, care must be taken thatthe memory allocation routines called from amodule do use the memory pool of the main pro-gram rather than the memory local to the module.Even standard C++ container types – the dy-namic and generic implementations of well-knowndata structures such as arrays, linked lists, and hashtables – cannot easily be accessed across thememory address space boundaries of the dynamiclibraries in Windows. We are currently producingan Apple Mac OS X version of Bodil.
Results and discussion
The core programSince the functionality of the program has beenseparated into individual modules, the main task
Figure 4. Three representations of two histidine triad proteins. (a) Hierarchical directory for data object management. The left panelists the top level objects: protein kinase C inhibitor 1 (PDB code 1KPF [34]), fragile histidine triad protein mutant (PDB code 2FHI[35]; the second histidine of the histidine triad has been mutated to asparagine), and a structural alignment of the proteins(1KPF_FHI). The right pane in (a) shows part of the data tree for 1KPF with one residue (His114) expanded to show all the atoms.The side-chain atoms of the histidine triad are selected (blue and green) with related objects partially selected (dark green). (b) Three-dimensional graphics for structure visualization. The view focuses on the nucleotide binding site. Both 1KPF (gold) and 2FHI (lightblue; conserved residues red on both) are drawn with ribbon and coil to illustrate the secondary structures. The AMP molecule boundto 1KPF is shown as a ball-and-stick model, and the side chains of the histidine triad of both proteins are shown as wire-frames (1KPFgreen, 2FHI in default atom color scheme). Distances between the phosphate O3P oxygen of AMP and the nearest atoms in 1KPF, the�-nitrogen of His112 and the d-nitrogen of His114, are visualized with white dashed lines. (c) Alignment view. The sequences of 1KPFand 2FHI are shown as aligned by structural superimposition. The color scheme for amino acids is the same as in (a) and (b): 1KPFgold, 2FHI light blue, conserved residues red, histidine triad dark green and blue, respectively. The residue numbering, secondarystructure elements, and mutually conserved residues are shown above the alignment.
406

of the program is to hold data. Besides biochemi-cal data, the core program also handles programsettings. The main program reads all configurationfiles, including module-specific files, on startup.These data are used to generate the list of availablemodules without loading the binary library filesfor each module, which are loaded on demand.The module configuration may require a menuentry, which will be added at this point into themenu of the main program window. Access tomenu items from the main window will load thecorresponding modules. The module loading andexecution interface is all that the core programknows about the modules, and therefore it is easyto add more functionality to the program package.The main program provides an application pro-gramming interface (API) for the modules to ac-cess the data tree and the configuration settings.The API includes an event notification systembased on observer design pattern [4]. The observerpattern defines a one-to-many dependency, wherethe change of the state of the observed object(called ‘Subject’ or ‘Publisher’) is automaticallysignaled to each observing object (known as ‘Ob-server’ or ‘Subscriber’). In practice, the subject hasa list of observer objects and after each change ofthe subject state the list will be iterated through,and an ‘update’ procedure is executed for each listmember. The observer object provides the ‘update’procedure which changes the internal state of thatobserver to match the changes of the ‘Subject’state. The main program has a single ‘Subject’object that informs the observers about changes ofthe data tree. Any module may contain one ormore ‘Observer’ objects that should implementappropriate actions for notification events. Thus,the modules can update their local data to corre-spond to the current state of the main data tree.For example, selecting a residue in the alignmentview will be immediately visible also in the 3-Dgraphics and vice versa.
Description of available modulesThe different modules can be divided into threefunctionally different categories: computational,graphical, and utilitarian modules. The utilitarianmodules are used for viewing and changing thestate of the program. For example, the configu-ration settings can be listed and edited in a sepa-rate window, which also allows the re-reading ofthe settings from files. Some modules do, however,
cache the setting values and do not check if thevalues change. Most of those modules weredeveloped relatively early in the project, when thecore application was not yet available. Now thatthe main program design and implementation hasreached a stable state, we are – besides addingfunctionality – revising older modules in order toreplace redundant or more restricted initialimplementations with calls to more refined imple-mentations.
Computational modules
The computational modules contain algorithmsfor processing and producing molecular data.Many of the algorithms have been adapted fromexisting programs that were freely available,resulting in faster implementation and the intro-duction of fewer errors. Some of the algorithmswere adapted from previously unpublished in-house software and are described here. When themain program and the primary modules reached astable and usable state, we began to develop newalgorithms and modules in order to expand thefunctionality of the program to better match theneeds of molecular modeling as well as to testthe robustness of the core design. As a result, thedata structure design has been refined and aug-mented from its original model to the one pre-sented here in order to better fulfill the needs of thecomputational algorithms as well as to improveoverall performance.
Sequence alignmentsThe sequence alignment module was derived fromthe multiple sequence alignment program MA-LIGN [7]. The original command line program wasimplemented in C and used static memory man-agement. The integrated version added a graphicaldialog for selecting parameters, i.e., a scoring ma-trix and gap penalty, and the memory is nowmanaged dynamically. While the use of dynamicmemory handling is unavoidably slower than theuse of static memory, it conveys two benefits: thememory used is only that which is really required,possibly compensating for any loss in performance,and the artificial problem size limit is removed. Themodule receives an alignment data object from themain program and recomputes the alignment ofthe sequences held by that object. Furthermore, theuser may specify that some of the sequences belong
407
to a pre-aligned set, and the rest of the sequencesare then aligned against that set and each other. Adirect application of this latter feature is to align asequence against a structural alignment made bycomparing the three-dimensional structures ofrelated proteins. Here, the structural alignmentshould have fewer ambiguities, but the sequencealignment algorithm is unlikely to reproduce it. Bypreventing changes to the structural alignment, wein effect introduce spatial variation into the gappenalties and bring structural information into thealignment process, leading to more accuratealignments.
Distances reflecting the degree of sequencesimilarity among proteins can be computed fromthe alignment and the relationships amongsequences can be visualized with a tree diagram.For example, the Phylip program package [8]provides several methods for the distance compu-tation and for phylogenetic tree construction. Wehave implemented as a separate module a graphi-cal dialog where the user can select options, andthe dialog will then produce and execute a script,which calls appropriate programs from the Phylippackage in order to construct a tree from analignment (currently available only in the Linuxand IRIX versions).
Structural alignmentsProteins whose three-dimensional structures areknown can be superimposed in order to comparetheir structures and to provide more accuratesequence alignments. We have added a separatemodule, Superimposer, which contains algorithmsfor superimposing protein structures. The pairwisesuperimposition of structures involves three steps:(1) the definition of equivalent positions in the twostructures, (2) the calculation of the transforma-tion that minimizes the distances between theequivalent positions, and (3) application of thetransformation to the xyz-coordinates of one ofthe proteins so that it is superposed on the other.The transformation is computed with the leastsquares minimization method of Kearsley [9] andthe transform is applied by adding it to the internaltransformation stored within the atom objects.
The key step in the superimposition procedureis the definition of equivalences: the equivalencesrepresent the common elements of the two com-pared structures. Thus, an incorrect set of equi-valences usually produces a superimposition that
will not correctly highlight the similarities anddifferences of the structures. At least three pairs ofequivalent points are required in order to computethe transformation, and already three well chosenpairs can produce a useful superimposition. Weprovide three strategies for the definition of theequivalences: (1) manual method, (2) iterativesuperimposition-based procedure, and (3) fullyautomatic structure alignment.
In the manual method pairs of equivalences aredefined by the user. The set of equivalent pairsshould contain at least three pairs of atoms that areknown or highly likely to reflect ‘equivalent’ enti-ties in the structures located at the same or similarrelative positions. They are often obtained from asequence alignment or other data, for examplemutation studies. The procedure obtains the equi-valences from the specified alignment object, andminimizes the root of the mean squared deviations(RMSD) of the pairs of equivalent points, which bydefault are the Ca-atoms.
An approximate superimposition, obtained forexample by interactively moving the molecules orby the use of the manual method, can be refinedwith the iterative method, which uses a dynamicprogramming algorithm (DPA) [10] for identifyingthe equivalences from superimposed structures.The similarity of the Ca-atom positions needed inthe DPA is computed with the Rossmann andArgos [11] equation, similarly to the programSTAMP [12]. The subset of identified equivalencesthat are already superimposed within a user de-fined cut-off are used to recompute the superim-position and the process is repeated until the set ofequivalences does not change any more, or amaximum number of iterations is reached, indi-cating that the procedure cannot converge, butinstead fluctuates between solutions.
The automatic algorithm implements ourtopology based structure alignment programVERTAA [13]. The algorithm was specificallydesigned to align structures that have similarshapes both quickly and automatically. VERTAAdefines the initial set of equivalences by correlatingthe patterns of Ca-atom density values – thenumber of Ca-atoms within 14 A of each residue –along the sequence of each structure. Therefore,no initial alignment or superimposition is needed.For convenience, multiple structures can besuperimposed (pairwise) onto one reference struc-ture with a single procedure call.
408
Molecular modeling of protein structure – HomodgeThe prediction of a protein structure is a complextask, but it canbe simplified if the complete answer isnot needed or if enough biological information isavailable. For example, the specificity of a receptorcan be studied quite extensively already when amodel of the binding site, not the whole protein, isconstructed. Homology modeling generates themodel of a protein structure from known structuresof homologous proteins (templates). Thus, both theselection of the template and the alignment of se-quences have a significant effect on the model. If themodel can be generated and displayed within sec-onds, the user can quickly assess the quality of themodel based on his knowledge about the studiedproblem and decide to refine the current model, orfeed information back to the alignment process andgenerate a new model.
The computer program Homodge has beendeveloped for such use. The philosophy behind theprogram has been to rely on information fromthe related structure as much as possible, makingthe minimum number of changes. Such anapproximation is sufficient when highly similarproteins are modeled and the speed of the methodallows interactive use. While Homodge is partic-ularly suitable for highly similar proteins, it alsoperforms reasonably well with low similarity, un-less the alignment contains long insertions ordeletions (indels), since indels require construction,or at least major modification of the main chain.
Homodge generates the putative main chain ofthe model by copying the coordinates of all resi-dues, including those that will be deleted, from thetemplate structure. For each insertion the main-chain positions are computed by adjusting – with asimulated annealing algorithm – the main-chaintorsion angles of the residues in the inserted frag-ment as well as for a couple of residues precedingand following the insertion. The goal of the torsionangle adjustment is to produce a continuous mainchain with the torsion angles within allowed re-gions of the Ramachandran plot. Deletions areremoved from the model after the insertions havebeen added, and torsion angles are adjusted inorder to reconnect the remaining residues. Thisapproach is fast for short insertions and deletions.The construction of the main chain is completedby adding atomic coordinates for the amino- andcarboxy-terminal overhangs; both are given apseudo-helical conformation. The residues are
added in order to let the user manipulate the wholestructure with other methods.
The resulting model is thus a partial copy of thetemplate. There is no minimization step, so theside chains and even the main chain may collide.More accurate results would require minimizationof the model structure, which is computationallyexpensive, and can itself produce structural arti-facts. In places where the template differs only bypoint mutations (no indels) the main chain will beidentical in the model regardless of the level ofsequence identity.
When the main-chain coordinates have beendetermined, the side chains are reconstructedbased on torsion angles, along with bond lengthsand angles. The template provides torsion anglesfor the conserved residues, while the most fre-quently occurring torsion angles of each aminoacid type – as found in known structures [14] – areused for inserted and mutated residues. The rot-amer library (see below) can be used to quicklychange the side-chain orientations.
The program Homodge is distributed as aseparate binary usable either from the commandline or from the alignment editor in Bodil. Thus,the user can also substitute an alternative model-ing program for Homodge. For example, a shellscript could execute Modeller [15] with predefinedoptions and then return the produced modelstructure for Bodil.
Rotamer libraryThe conformation of side chains along the proteinchain is important both for the structure of theprotein and for the interactions with other mole-cules. We have added a rotamer library in order tofacilitate the exploration of probable side-chainconformations. The rotamer library [14, 16] con-sists of a list of conformations corresponding tolocal energy minima that have been observed inknown protein structures. The rotamer modulewithin Bodil looks up the conformations for anamino acid from a list of identified rotamers [14]and creates an alternate set of coordinates for theatoms in the amino acid for each conformation.The user can cycle through the conformations foratoms, groups, or even whole proteins (NMR-structure files often report tens of alternativeconformations for the whole structure, which canbe cycled through with the same method as forrotamers of a single amino acid), and see on the
409
graphics how different conformations fit into thestructure. The coordinates of any and all confor-mations can be saved to a structure file. Thesupplied rotamer library is a flat file in pseudoPDB-format [17] and can be edited or replaced bythe user.
Surface computationsThe space filling representation of atoms is aneasily implemented way of showing the spaceoccupied by a molecule, but the molecular surfaceis aesthetically and functionally a more effectivemethod. The computation of the molecular surfaceis a three-stage process. First, a function is evalu-ated at discrete points. The function defines theshape of the surface. The evaluation of the functionat any given point requires computing the distancesfrom all atoms. Therefore, it is more effective topre-compute values of grid points rather than tostart from any point on the surface and dynami-cally explore the surface and use recursion toachieve an increased level of detail where the cur-vature of the surface is higher. A straightforwardgrid-based approach uses an even distribution ofpoints resulting in evenly sized triangles, i.e. largeplanar surfaces will be divided into many trianglesand tight curves flatten out due to too few triangles.A finer grid with more points does produce a moreaccurate surface composed of smaller triangles, butthe memory requirements and amount of compu-tations increase exponentially. The user can specifythe spacing of the points in the grid in order toallow computation of both rough and smoothsurfaces. A more complex, grid-based procedurewould start with a sparse grid and recursivelysubdivide the volume locally into finer grids onlywhere the surface is not planar. The recursive ap-proach is not used in Bodil, since the grid dataobject type was designed for evenly spaced datapoints. A separate grid implementation for sparsedata can be added later.
In addition to the molecular surface algorithmof Connolly [18], we have functions that will pro-duce van der Waals and solvent accessible sur-faces. The solvent is represented by a sphericalprobe with radius usually equal to 1.4 A. Thesolvent accessible surface represents the closestpoints outside the molecule, where the probe canbe positioned, i.e. positions where the distancebetween the center of the probe and the closestatom is equal to the sum of the probe radius and
the van der Waals radius of the atom. When theprobe ‘rolls’ over the molecule, its center moves onthe solvent accessible surface and the probetouches the Connolly molecular surface. Thus, theConnolly molecular surface contains the volumewithin van der Waals radii of atoms and thegrooves between two or more atoms that areunreachable by the probe.
The second stage is to create triangles such thatthey approximate a surface that represents a user-specified threshold value of the function. Theposition of each triangle is linearly interpolatedfrom the grid points, since the value of the func-tion is only evaluated for the grid points. We usethe triangulation algorithm of Bloomenthal [19] togenerate the triangles. The triangulation algorithmmay be used to create a contour surface to anygrid. For example, the user can read into theprogram an electron density map created fromcryo-electron microscopy (cryo-EM) image pro-cessing and visualize the density volumes due tomacromolecules.
The third stage in the surface computationinvolves locating the nearest atom for each pointon the surface. The mapping of atoms to the sur-face allows the quick mapping of atom or residueproperties such as color to the surface.
The initial implementation of the surfacecomputation module performed its task as a singlestep and produced only the final surface object.We quickly found that the division of the processinto separate sub-routines and the storage of theintermediate results gave much more flexibility andalso helped us to verify the correctness of each sub-routine. Separating the computation of a grid fromthe generation of the iso-surface permits the gen-eration of surfaces for precomputed grids. Thecreation of grid as a separate object allows thegeneration of several different iso-surfaces fromone grid without re-computation of that grid.Different functions can be implemented for com-puting values to an existing grid. Thus, the usercan choose from several options to perform dif-ferent, but related tasks with a small number ofprogram components. The default options pro-duce basically the same surface as the initial single-step implementation did.
Electrostatic potentialsMolecular interactions are due to inter-atomicforces. The electrostatic potential is one important
410
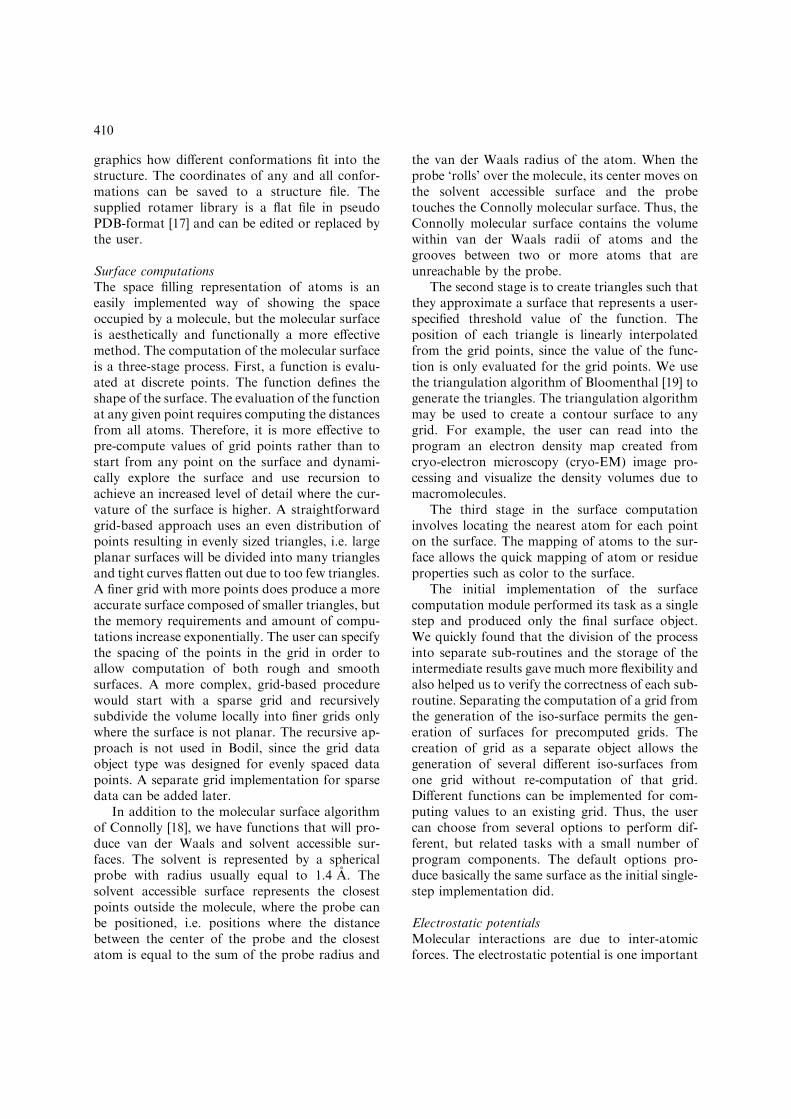
type of force contributing to specificity in molec-ular interactions. The contribution of a chargedatom to the potential energy falls off exponentiallyas the distance from the atom increases. However,the net potential energy at any specific point is asum of contributions of all atoms, including sol-vent atoms. Visualization of electrostatic poten-tials for a protein is typically used to help locatethe patches on the protein surface that are com-plementary to the surface of a molecule thatinteracts with the protein. For example, a surfacein the binding pocket of a ligand molecule canhave both hydrophobic (neutral) areas that pro-vide non-specific interactions as well as charged/polar areas that interact specifically with charged/polar groups of the ligand. The computation of theelectrostatic potential involves two steps: thepotential is computed at discrete points (a grid)enclosing the protein, and then the grid values arevisualized. Our implementation uses successiveover-relaxation [20] to solve the Poisson–Boltz-mann equation at the grid points. The visualiza-tion is handled by interpolating the values fromthe grid to points on the molecular surface com-puted for the protein. The surface is then coloredbased on these values, the value range is convertedinto a color range; the default color range is from
red (negative charge) via semi-transparent white(neutral) to blue (positive charge) (Figure 5).
Fitting of atom-resolution protein models tolow-resolution density mapsLarge biomolecular complexes are increasinglystudied by methods such as cryo-electron micros-copy (cryo-EM) that provide three-dimensional,low-resolution density maps. Such a map can beused to construct a model of the complex atpseudo-atomic resolution, if the high-resolution X-ray or NMR structures of individual componentsare known or can be modeled from related struc-tures. Thus, the task is to assemble the complex ofmolecules with the low-resolution density map as aguide.
We have implemented in the module ‘EMfit’ asimple algorithm to fit a protein structure into adensity grid. The program performs an exhaustivesearch of the local rotational and translationalspace. Each sampled transformation is (i) scoredaccording to the fit to the low-resolution densitymap and (ii) optionally examined for overlap withother protein structures contributing to the com-plex, which have been pre-determined by the useras being correctly positioned in the low-densitymap. The score is the sum of density values in the
Figure 5. Molecular surface of protein kinase C inhibitor 1 (PDB code 1KPF [34]). The ligand molecule (AMP) is drawn as a CPKmodel. The secondary structure of 1KPF is shown. Residues with at least one atom within 4.0 A from any atom in the ligand areshown as ball-and-stick representation. Oxygen atoms from water molecules within 5.0 A of the ligand atoms are shown as small cyanspheres. The molecular surface for 1KPF has been computed, and the electrostatic potential has been interpolated onto the surface.The surface has been colored according to the potential values, from negative (solid red) through neutral (transparent white) to positive(solid blue).
411
low-resolution map at each Ca-position of theprotein being fitted. Since side-chain atoms are notconsidered, possible inaccuracies in the proteinmodel due to side-chain conformational changesupon complex formation have no effect on thefitting. Notably, the method uses neither pre-determined density contour cut-offs to limit fittingnor convolution of the high-resolution model tothe low resolution of the map. Density maps ofentire complexes as well as difference maps, wherethe density of the components not being fitted hasbeen deducted, can be used.
Transformations with overlap of proteinstructures can be discarded without further com-putations, since the non-overlapping solutions areguaranteed to be found by the exhaustive search.The overlap can be determined in linear time bythe use of a simplified density grid, generated fromthe static structure. The transformed moleculeoverlaps if any of its atoms is within the density ofthe static molecule, i.e. a grid point near the atomhas been flagged as being near a static atom (inpractice, Ca-atoms closer than 4.0 A from eachother). Moreover, preferred positions for selectedCa-atoms can be pre-defined. The distances ofthese Ca-atoms from their preferred coordinatesare then recorded in the list of transformations andthey can be used for filtering the results. Thisallows external information about the location ofthe protein, such as mutagenesis or cross-linkingdata, to be included in the search. The user inter-face of the module allows the user to interactivelyspecify the input parameters. After fitting, the usercan pick transformations from the resultant listand immediately visualize the correspondingcomplexes.
The module has been successfully used to fit areceptor domain, the I-domain of a2b1-integrin,onto the structure of the non-enveloped picorna-virus echovirus 1 [21] (Figure 6) and to resolve thebiological dimerization mode of bovine lysosomala-mannosidase [22]. In the virus-receptor case, adensity map of the complex at 25 A resolutionfrom cryo-EM and crystal structures of bothechovirus 1 [23] and the a2I-domain were avail-able. Published results from mutagenesis were notused to constrain the fitting, but the resultingmodel was nonetheless in good agreement withthose data [21]. Crystallographic data on a-man-nosidase, an enzyme known to form a dimer insolution, was compatible with two alternative
dimeric structures. The dimer was observed di-rectly in solution by cryo-EM, and fitting of bothof the dimers derived from crystal symmetry to thelow-resolution cryo-EM density map clearly re-solved the higher-scoring dimer as the biologicallyrelevant one [22].
ParsersMolecular data are usually stored in formattedfiles and there are several file formats, eachdesigned for a different purpose. Most formats usetext files that can be directly edited by hand. Suchmanual changes are convenient, but may introduceerrors. Binary files are a more efficient form ofstorage, but are usually only accessible by a limitedset of programs. Because we decided it would beimportant to be able to use and also produce filesthat are directly exchangeable and usable withother programs, Bodil does not use any Bodil-specific format: parser modules were developedwhere each module encapsulates knowledge aboutone existing, widely used format. Thus, eachmodule is able to convert data from one formatinto data objects within Bodil and also to produceformatted data from data objects. The conversionfrom any particular file format has to take intoaccount the conventions and peculiarities of thatformat. For example, the Protein Data Bank(PDB) [17] format assumes implicitly that theamino acids have bonds, while the SYBYL Mol2[24] format lists each bond explicitly. Thus, someformats require more preprocessing and knowl-edge about represented molecules than others. Inaddition, the text files may be incomplete ormodified by the user. In such a case the parsermust be able to handle the inconsistent datagracefully. Since each format, including the datarepresentation within Bodil, typically only repre-sents some subset of the molecular data, the con-version has to use some default values for datathat does not exist in the source format and todiscard data that cannot be represented by thedestination format. For example, the PDB format– designed for macromolecules – will not store thebond types for small molecules. Thus, the bondtypes for a small molecule should be computed, asthey cannot be read from the PDB file. The currentset of parser modules reads and writes the typicalmolecular formats PDB, Mol2, Gromacs [25], andMDL SDfile [26], and the sequence formatsFASTA [27] and PIR. The modified PIR sequence
412

format is used also by the program Modeller [15],and we use it to represent sequence alignments too.
Another group of parsers is focused onimporting three-dimensional value grids. Thesegrids can represent, for example, electron densitiesor energy distributions. Thus, precomputed spatialdata can be read in from ASCII grid formatsproduced by the programs Grid [3], AutoDock [2],CNSsolve [28], and Surfnet [29], and from binaryformats of Grid and AVS [30]. Grids computed inBodil can be written out for visualization by otherprograms. We are developing a molecular inter-action-predicting algorithm using statistical meth-ods [1, 31, 32]. The gathered data can be plotted toa grid and visualized just like any other spatialdata. In Bodil, a grid can be easily visualized bycomputing a contour surface. The triangles of asurface, as well as spheres and cylinders repre-senting atoms and bonds, can be saved as a Ras-ter3D [33] input file for higher quality renderedimages, but the 3D-graphics module can also printthe rendered view directly into bitmap image.Likewise, the alignment viewer module can printthe displayed alignment.
The C++ programming language encouragesresource abstraction with the concept of the‘stream’. Both text and files can be referred to asstreams of characters, thus separating the access toa stream from the true type of the stream. Forparsing formatted data this creates an interestingpossibility, since several file formats are text basedand as such can be handled as streams. Thus, wehave already implemented some of the parsers asprocedures, which take data from, or put to, astream, and then added a helper method thatcreates a stream from a file and calls the parsingprocedure. The direct benefit from this separationis the possibility to call the parser module with atext stream object rather than a real file. To usethis feature, we have a separate graphical module,which contains a box with editable text. Instead ofsaving data from Bodil into a text file and openingthat file in a text editor, the user can display thesame formatted text directly within the box.Likewise, the contents of the text box can be readinto Bodil just like a regular data file, although theformat of the contents must be specified by theuser since there is no associated filename that
Figure 6. Rigid-body fitting of integrin a2I domain into a low-resolution density map of the complex of echovirus 1 and a2I domainusing the EMFitter module [21]. The density map (isodensity contour surface shown in semitransparent gray) was obtained by cryo-electron microscopy of single particles and three-dimensional image reconstruction. Ca-traces of the 10 highest-scoring transformationsof the a2I domain are shown in red. The atom-resolution crystal structure of echovirus 1 [23] was used to constrain the fitting of thereceptor. Two protomers of echovirus are drawn in yellow and blue. The EMFitter start dialog and the interactive density mapcropping dialog are shown on the left.
413
could indicate the correct format. Since the con-tents of the box can be edited, for example bypasting a sequence into the box, or by changingdata retrieved from the Bodil data structure, theuser can easily input data from several sources oreven create several copies of a single molecule.
Graphical modules
The main purpose of Bodil is to visualize molec-ular data and provide the user with ways to modifythat data interactively. The computational mod-ules described above usually perform these modi-fications of data.
Structure editorWhile the main program stores the data as a treeof objects (Figure 4a), the structure editor allowsthe user to explore the data object tree in a similarway to browsing directories and files. A file icon ina directory window shows some properties of thefile and allows operations like rename and delete.Analogously, the structure editor lets the user seeand change the properties of molecular objects.Naturally, the tree view allows selection andmodification of individual objects as well as wholebranches and groups of objects. Structure depen-dent selection methods have also been imple-mented. For example, all atoms near any alreadyselected atom or within the same residue as theselected atoms can be easily selected. Thus, theuser can quickly select a ligand molecule fromthe tree, request atoms within hydrogen bondingdistance, and fully select each identified group. Asa result, each protein residue within hydrogenbonding distance from the ligand is selected andthus easy to find both in the graphical view and inthe sequence alignment. A separate query windowis used to select atoms through a combination ofthree regular expressions that match chain, resi-due, and atom names, respectively. The query canselect or deselect atoms matching the expression,or remove the selection if an atom does not matchthe expression. These operations correspond tounion, difference, and intersection operators usedin set theory. The structure editor also providesaccess to some computational algorithms: the callsto the surface computation module and the rot-amer module require extra parameters (type ofsurface and target amino acid, respectively) thatare supplied by the structure editor. The compu-
tational modules could – and should – have theirown graphical dialogs for selecting such parame-ters, but it is more convenient for the user to accessthe modules via the structure editor and it reducesthe number of windows displayed.
Three-dimensional graphicsThe graphics viewer module (Figure 4b) can dis-play one or more simultaneous 3D-graphical views,rendering each object in a different mode and froma different viewpoint. Multiple windows can belinked to receive the same camera rotation andtranslation changes. Most, but not all, objects dohave a graphical representation. Atoms and bondscan be drawn with a combination of wire frame,stick, ball-and-stick, and CPK model representa-tions. Atoms can also show their name, identifier(usually atom number from the structure coordi-nate file), charge, or type as a label. Similarly,groups can be labeled. A bond is drawn by defaultas two parts (lines or sticks) with each part usingthe color of the nearest atom, but it can also beconstructed as a single piece with a unique color.The wire frame representation of an aromatic bondhas one solid and one dashed line, while double andtriple bonds have two and three solid lines,respectively. Texture bitmaps are used to drawaromatic bonds as ‘stippled’ sticks. The chain canbe drawn as a wire frame Ca-trace or the secondarystructure elements (SSE) can be drawn separatelywith helices as ribbons, strands as arrows of definedthickness, turns as filled arcs to highlight theirlocations, and random coils as tubes. The color ofthese chain fragments is either a single color of theparticular SSE or the color assigned to the residues.The other shapes may have dot, line, opaquepolygon, or transparent polygon representations.Surfaces have all four possibilities, while grids canonly be drawn as dots. Only grid points with valueswithin a user-specified range are drawn. Thus,‘dense’ volumes can be located by specifying arange that covers the large values, but a contoursurface computed for the grid, which encloses suchvolumes, is usually a more effective visual repre-sentation of the same property. Alignments ofstructures can be drawn as lines connecting thecorresponding matched Ca-atoms, helping tohighlight poorly superimposed, yet aligned resi-dues. Furthermore, aligned residues can be coloredaccording to the separation (distance) of their Ca-atoms in order to further highlight the differences
414
of the aligned structures. The view drawn on thescreen exists within the memory of the graphicscard. It can be saved as a bitmap image file, pro-ducing a snapshot of the view. However, that imageis limited to the resolution of the visible graphicswindow. The OpenGL standard also describes off-screen rendering of the image directly into a bitmapformat. This would allow the creation of higher-resolution images, limited only by the amount ofavailable memory. However, the OpenGL imple-mentations do not uniformly support the off-screenrendering to very large bitmaps. Therefore, onlyscreen-resolution bitmap creation is available inthe graphics module.
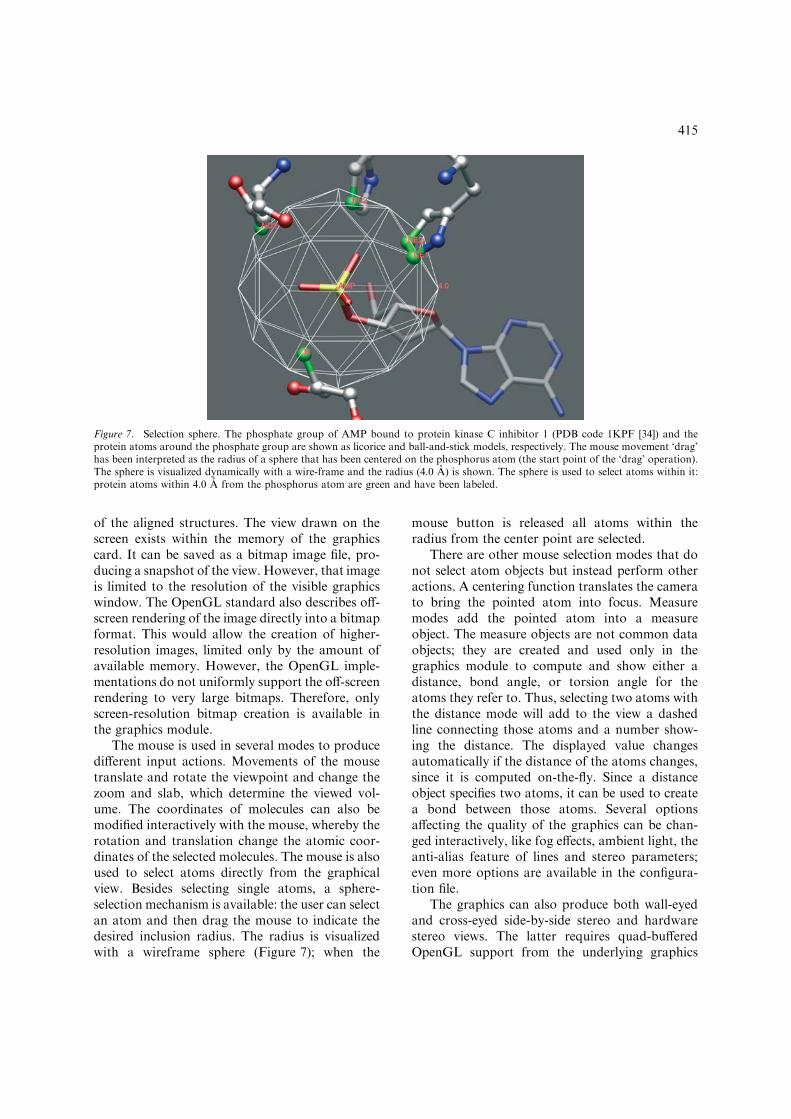
The mouse is used in several modes to producedifferent input actions. Movements of the mousetranslate and rotate the viewpoint and change thezoom and slab, which determine the viewed vol-ume. The coordinates of molecules can also bemodified interactively with the mouse, whereby therotation and translation change the atomic coor-dinates of the selected molecules. The mouse is alsoused to select atoms directly from the graphicalview. Besides selecting single atoms, a sphere-selection mechanism is available: the user can selectan atom and then drag the mouse to indicate thedesired inclusion radius. The radius is visualizedwith a wireframe sphere (Figure 7); when the
mouse button is released all atoms within theradius from the center point are selected.
There are other mouse selection modes that donot select atom objects but instead perform otheractions. A centering function translates the camerato bring the pointed atom into focus. Measuremodes add the pointed atom into a measureobject. The measure objects are not common dataobjects; they are created and used only in thegraphics module to compute and show either adistance, bond angle, or torsion angle for theatoms they refer to. Thus, selecting two atoms withthe distance mode will add to the view a dashedline connecting those atoms and a number show-ing the distance. The displayed value changesautomatically if the distance of the atoms changes,since it is computed on-the-fly. Since a distanceobject specifies two atoms, it can be used to createa bond between those atoms. Several optionsaffecting the quality of the graphics can be chan-ged interactively, like fog effects, ambient light, theanti-alias feature of lines and stereo parameters;even more options are available in the configura-tion file.
The graphics can also produce both wall-eyedand cross-eyed side-by-side stereo and hardwarestereo views. The latter requires quad-bufferedOpenGL support from the underlying graphics
Figure 7. Selection sphere. The phosphate group of AMP bound to protein kinase C inhibitor 1 (PDB code 1KPF [34]) and theprotein atoms around the phosphate group are shown as licorice and ball-and-stick models, respectively. The mouse movement ‘drag’has been interpreted as the radius of a sphere that has been centered on the phosphorus atom (the start point of the ‘drag’ operation).The sphere is visualized dynamically with a wire-frame and the radius (4.0 A) is shown. The sphere is used to select atoms within it:protein atoms within 4.0 A from the phosphorus atom are green and have been labeled.
415
system. Proper anti-aliased lines and transparentsurfaces would require drawing the objects inback-to-front order, but the sorting of objectsneeded after each change of viewpoint is a time-consuming operation. In order to keep thegraphics fast enough for interactive use, we havechosen not to sort the objects. Instead, we apply a‘peeling’ method, which requires rendering of theview in several passes: (1) determine the closestobjects, (2) render other than closest objects, and(3) render the closest objects. This ensures that atleast the closest objects have proper anti-aliasingand transparency.
Alignment editorThe purpose of the alignment editor (Figure 4c) isto display protein sequences and to ease the editingof alignments. Since each character in the dis-played sequence represents either a gap or a resi-due, and the linkage between a residue characterand the corresponding residue object is main-tained, the residue objects can be manipulated –for example, selected – via the alignment display.The primary visualization aid available throughthe alignment editor is the coloring of residues.Besides changing the color of selected residues, theuser can color residues based on their properties.The properties for residues (e.g. hydrophobicity,hydrophilicity, polarity, etc.) are listed in a datafile and a color map is associated with eachproperty. Thus, the property values are convertedinto colors and applied to the residues. Since theproperties are defined statically for individualamino acid types, the values and colors do notdepend on the sequence. However, residues dohave properties that are sequence or structuredependent – for example, the solvent accessiblearea of a residue, or the accuracy of the superim-position of the structurally aligned residues –which must be computed rather than looked upfrom a table. Thus, the generation of a propertyvalue, be it from a table lookup or computation,should be clearly separated from the visualizationof the value, for example with color schemes orseparate plots.
The main function of displaying an alignmentis to identify and highlight similarities and differ-ences among the sequences. Therefore, two color-ing methods operate on the properties of thealignment, rather than properties of individualamino acids, as above. One identifies each column
in the alignment where a user-specified minimumnumber of residues are identical and then colorsthose residues, highlighting conserved aminoacids. The other alignment-based coloring methodcomputes the distance between Ca-atom positionsof aligned residues and converts the distance valueinto a color using a color map. However, the dis-tance computation assumes that the structureshave already been superimposed according to thealignment. The superimposed residues in thealignment will have different color (blue) fromthose residues (red) that, although aligned, havedistance larger than a cut-off value (6.0 A). Boththe color map and the cut-off are adjustable con-figuration options.
The object shown in the alignment editor is analignment object. It contains a list of chains and anarray of columns, each representing one positionin the alignment. A column in the alignment pointsto an aligned residue in each chain or shows a gapmarker for those chains that do not have a residuecorresponding to that position. The alignmentobjects are generated on three occasions: (1) from(unaligned) sequences in the alignment editor, (2)as a result of the structure alignment algorithm, or(3) from a file with pre-aligned sequences. It isimportant to note that the alignment object maycontain any set of sequences, with gaps inserted atarbitrary positions. Only if the sequences do havecorresponding parts – residues – and those resi-dues are aligned properly, then the alignment ob-ject does represent an alignment of the proteinsequences (or structures), else the alignment objectmerely lists the residues. Deletion of a residueobject does not destroy the alignment; the deletedresidues are converted into gap markers in thealignment.
The alignment objects are modified by passingthem to the Malign module, which performs thesequence alignment, or by adding and removingcolumns or rows and by moving gaps in a rowinteractively. The structure alignment modulecreates new alignment objects in order to describethe alignment of structures instead of modifyingexisting alignments. The user may also specify asubrange of the sequences for re-alignment byMalign, for example to realign a loop region whilekeeping the rest of the alignment unchanged. It ispossible to have more than one alignment editorwindow open at the same time in order to viewseveral alignments or different locations along a
416
single alignment that are difficult to visualizewithin a single window because of the length of thealignment.
Performance and system requirements
The size of the program is moderate, less than100,000 lines of code, and the size of the binarydistribution is about 20 MB, including the Qt-li-brary binary file which is required by the program.The memory use of the program depends on theamount of objects (molecules, grids, surfaces) thatare loaded or computed during runtime. Thedevelopment of the program began on the IRIXplatform using MIPS R5000-based SGI O2 work-stations. The main asset of those machines wastheir support for hardware stereo graphics. Inter-estingly, the graphics system in the O2 workstationused the main memory rather than dedicatedgraphics memory, and performed part of the ren-dering in the main processor. When the PCgraphics hardware evolved into a stereo-capableplatform, Linux became the main developmentplatform. While OpenGL provides a standardinterface for graphics, the optimization of thegraphical performance must take into account thehardware used. There is a clear trade-off betweenspeed and quality. One way to increase speed
without sacrificing quality is to minimize thecomputations made on the graphics hardware byprecomputing values in the main processor. This,however, requires more memory for storing thevalues and the transfer of values from the mainmemory into the graphics memory may well be thereal bottleneck of the system. In the old O2 systemsthe memory was limited, and the computationswere in every case performed by the main proces-sor. On the latest PCs as well as on high-end SGIworkstations the graphics hardware is veryadvanced and most likely contains more compu-tational power than the main processor.
Planned additions
The program, although usable, is by no meanscomplete yet. The basic modeling procedure wouldbenefit from addition of more functionality. Fur-thermore, the feedback from users has not onlyhelped to remove bugs, but has elongated the listof ‘obvious’ features needed, too. For example,full-featured command-line access and scripting,and saving of the program state would allowcontinuation of work at a later time. Direct accessto data on network servers and databases may bemore convenient than via intermediate files. Thechemical properties of molecules obtained from a
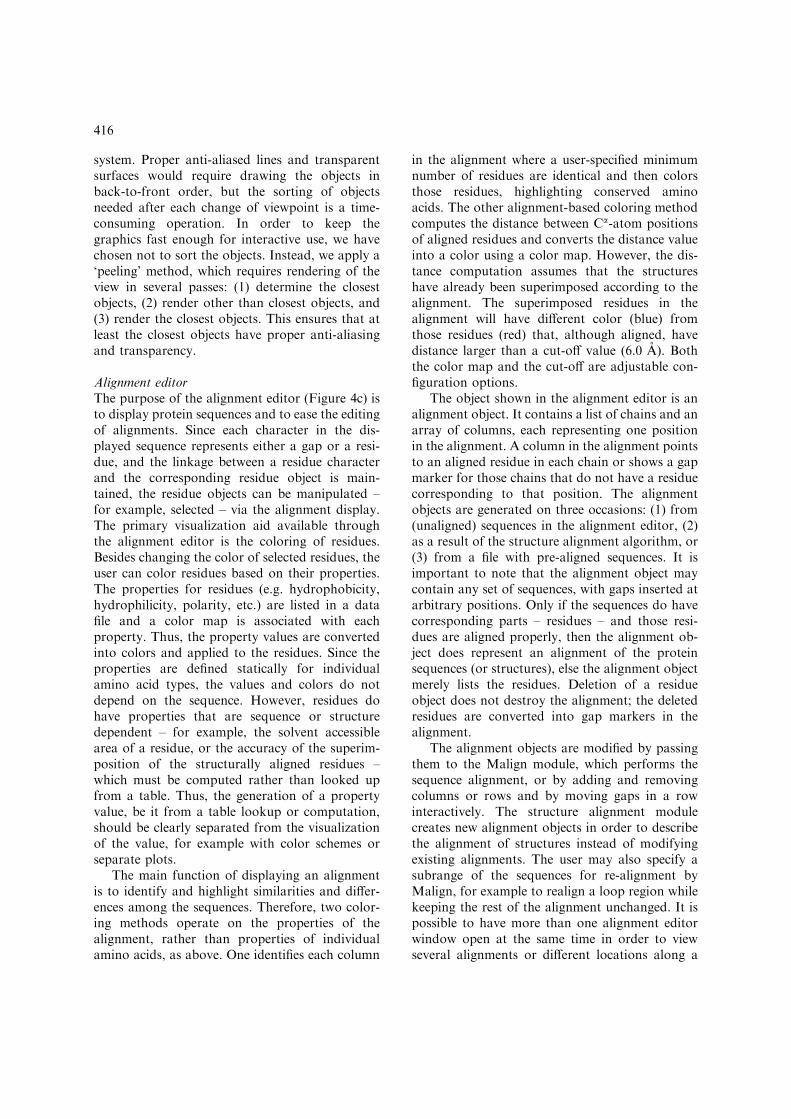
Figure 8. Visualization of precomputed spatial data. A molecular interaction library [32] has been used to predict volumes in contactwith the protein kinase C inhibitor 1 structure (PDB code 1KPF [34]) where ligand atoms can be placed: hydrogen bond donors (blue),hydrogen bond acceptors (red), and aliphatic carbons (cyan wire-frame). The predicted volumes coincide closely with the ligandmolecule (AMP, ball-and-sticks, six atoms labeled) present in the crystal structure. Amino acid side chains around the ligand have beendrawn as licorice models and the Ca-trace (orange) is also shown.
417
database for a large set of molecules or fromcomputations can be intractable without a tabularview that supports sorting and filtering of data.Similarly, both quantitative structure–activityrelationships (QSAR) and small molecule dockingare essential computational tools for drug design.Rantanen et al. [1, 31, 32] have studied molecularinteractions detected in the experimentally deter-mined structures of protein–ligand and protein–protein complexes. The resulting interactionlibrary could, for example, be used to score howwell a small molecule has been docked into thebinding site of a protein (Figure 8). Additionalinteractive visualization methods, such as contactmaps, Ramachandran plots, and trees, couldhighlight potential errors within structural models.Building of molecules, adjustment of torsion an-gles, and automatic addition of hydrogens andhydrogen bonds would contribute to the modelingprocess. The increase of configurability and addi-tion of graphical options would allow productionof even better quality images.
Conclusions
We have developed a modular program package,Bodil, for visualization of molecular structures andinteractions in order to simplify the study of pro-teins and their function. The use of availableprogram development tools and technologies suchas the OpenGL standard and the Qt library hasfacilitated simultaneous development on differentplatforms, such as Linux and MS Windows. Oneof our goals was to produce a high quality pro-gram operating on PC and portable computers,eliminating the need for high-priced graphicsworkstations. The modular design of the programallows addition of functionality in the form of newmodules without changing the existing program. Itwas important to implement the functionality assmall specific algorithms that could be mixed andmatched – reused – to offer a wide spectrum ofpossibilities to the user. We already provide theessential modules used in structural studies andprotein homology modeling, and currently it israther straightforward to introduce new ideas andfunctionality quickly.
The visualization of biochemical data offersseveral benefits. While an algorithm may yield anoptimal result for a ligand docking with respect to
the used scoring function, often only the humaneye can deduce from a three-dimensional imagewhether the result is also biochemically sound. Theability to see data in several formats simulta-neously allows the user to recognize such relationsthat cannot be seen in any single view alone. Forexample, seeing both a conserved residue in thesequence alignment and the position of that resi-due in the protein structure may help to explainwhy that residue is conserved. The interactivegraphics allows the user to focus on the key fea-tures of the studied molecular interactions. Fur-thermore, the user can interactively select and limitimportant substructures as input for the compu-tational algorithms and the result of the compu-tation will automatically be visualized.
The beta version of the program is available foruse without a fee. Compiled versions of the pro-gram for SGI IRIX, Linux, and MS Windowsoperating systems, as well as a tutorial, can bedownloaded from: http://www.abo.fi/fak/mnf/bkf/research/johnson/bodil.html.
Acknowledgements
We are grateful for constructive feedback andencouragement from members of the StructuralBioinformatics Laboratory in the Department ofBiochemistry and Pharmacy, Abo Akademi Uni-versity. This study has financially been supportedby TEKES – the National Technology Agency ofFinland, the Academy of Finland, the Ministry ofEducation, the Foundation of Abo AkademiUniversity, the Erna and Victor HasselbladFoundation (Sweden), the Sigfrid Juselius Foun-dation, the Tor, Joe och Pentti Borgs minnesfund,Fatman Bioinformational Designs Ltd, theNational Graduate School in Informational andStructural Biochemistry, Finland, and the Grad-uate School in Computational Biology, Bioinfor-matics and Biometry, Finland.
References
1. Rantanen, V.V., Denessiouk, K.A., Gyllenberg, M.,Koski, T. and Johnson, M.S., J. Mol. Biol., 313 (2001)197.
2. Morris, G., Goodsell, D., Halliday, R., Huey, R., Hart,W., Belew, R. and Olson, A., J. Comput. Chem., 19 (1998)1639.
418
3. Goodford, P.J., J. Med. Chem., 28 (1985) 849.4. Gamma, E., Helm, R., Johnson, R. and Vlissides, J. (Eds),
Design Patterns. Elements of Reusable Object-orientedSoftware. Addison-Wesley, New York, USA, 1994.
5. Woo, M., Neider, J., Davis, T. and Shreiner, D., OpenGLProgramming Guide, 3rd edition. Addison-Wesley, NewYork, USA, 1999.
6. Qt, Version 3.3. Trolltech AS, Oslo, Norway, 2004.7. Johnson, M.S. and Overington, J.P., J. Mol. Biol., 233
(1993) 716.8. PHYLIP (Phylogeny Inference Package), Version 3.5c.
Joe Felsenstein, Department of Genetics, University ofWashington, Seattle, 1993.
9. Kearsley, S., Acta Crystallogr., A, Found. Crystallogr., 45(1989) 208.
10. Fredman, M., Bull. Math. Biol., 46 (1984) 553.11. Rossmann, M. and Argos, P., J. Mol. Biol., 105 (1976) 75.12. Russell, R.B. and Barton, G.J., Proteins, 14 (1992) 309.13. Johnson, M.S. and Lehtonen, J.V., In Higgins, D. and
Taylor, W. (Eds), Bioinformatics: Sequence, Structure andDatabanks. Practical Approach Series, Oxford UniversityPress, Oxford, UK, pp. 15–50.
14. Lovell, S.C., Word, J.M., Richardson, J.S. and Richard-son, D.C., Proteins, 40 (2000) 389.
15. Sali, A. and Blundell, T.L., J. Mol. Biol., 234 (1993) 779.16. Dunbrack, R.L. Jr. and Karplus, M., Nat. Struct. Biol., 1
(1994) 334.17. Berman, H.M., Westbrook, J., Feng, Z., Gilliland, G.,
Bhat, T.N., Weissig, H., Shindyalov, I.N. and Bourne,P.E., Nucleic Acids Res., 28 (2000) 235.
18. Connolly, M.L., Science, 221 (1983) 709.19. Bloomenthal, J., In Heckbert, P.S. (Ed.), Graphics Gems
IV. Academic Press Professional, Inc., San Diego, CA,USA, pp. 324–349.
20. Nicholls, A. and Honig, B., J. Comput. Chem., 12 (1991)435.
21. Xing, L., Huhtala, M., Pietiainen, V., Kapyla, J., Vuori-nen, K., Marjomaki, V., Heino, J., Johnson, M.S.,
Hyypia, T. and Cheng, R.H., J. Biol. Chem., 279 (2004)11632.
22. Heikinheimo, P., Helland, R., Leiros, H.K.S., Leiros, I.,Karlsen, S., Evjen, G., Ravelli, R., Schoehn, G., Ruigrok,R., Tollersrud, O.K., McSweeney, S. and Hough, E.,J. Mol. Biol., 327 (2003) 631.
23. Filman, D.J., Wien, M.W., Cunningham, J.A., Bergelson,J.M. and Hogle, J.M., Acta Crystallogr. D, Biol. Crystal-logr., 54 (1998) 1261.
24. SYBYL�, Version 6.7.1, Tripos Inc., St. Louis, Missouri,USA.
25. Lindahl, E., Hess, B. and van der Spoel, D., J. Mol.Model., 7 (2001) 306.
26. MDL ISI/Base, Version 2.5, MDL Information SystemsInc., San Leandro, CA, 2002.
27. Pearson, W.R. and Lipman, D.J., Proc. Natl. Acad. Sci.USA, 85 (1988) 2444.
28. Brunger, A.T., Adams, P.D., Clore, G.M., DeLano, W.L.,Gros, P., Grosse-Kunstleve, R.W., Jiang, J.S., Kuszewski,J., Nilges, M., Pannu, N.S., Read, R.J., Rice, L.M.,Simonson, T. and Warren, G.L., Acta Crystallogr. D,Biol. Crystallogr., 54 (1998) 905.
29. Laskowski, R.A., J. Mol. Graph., 13 (1995) 323.30. Advanced Visual Systems Inc., Waltham, MA, Develop-
er’s Guide and Applications Guide.31. Rantanen, V.V., Gyllenberg, M., Koski, T. and Johnson,
M.S., Bioinformatics, 18 (2002) 1257.32. Rantanen, V.V., Gyllenberg, M., Koski, T. and Johnson,
M.S., J. Comput.-Aided Mol. Des., 17 (2003) 435.33. Merritt, E.A. and Bacon, D.J., Meth. Enzymol., 277
(1997) 505.34. Lima, C.D., Klein, M.G. and Hendrickson, W.A., Sci-
ence, 278 (1997) 286.35. Pace, H.C., Garrison, P.N., Robinson, A.K., Barnes,
L.D., Draganescu, A., Rosler, A., Blackburn, G.M.,Siprashvili, Z., Croce, C.M., Huebner, K. and Brenner,C., Proc. Natl. Acad. Sci. USA, 95 (1998) 5484.
419
Top Related
Copyright © 2022 FDOKUMEN

