


Bahasa
Halaman
Hukum

Biomagnification of cadmium selenide quantumdots in a simple experimental microbial food chainR. Werlin1,2, J. H. Priester2,3,4, R. E. Mielke2,3,4,5, S. Kramer6, S. Jackson2,7, P. K. Stoimenov8,
G. D. Stucky2,6,8, G. N. Cherr2,7, E. Orias1 and P. A. Holden2,3,4*
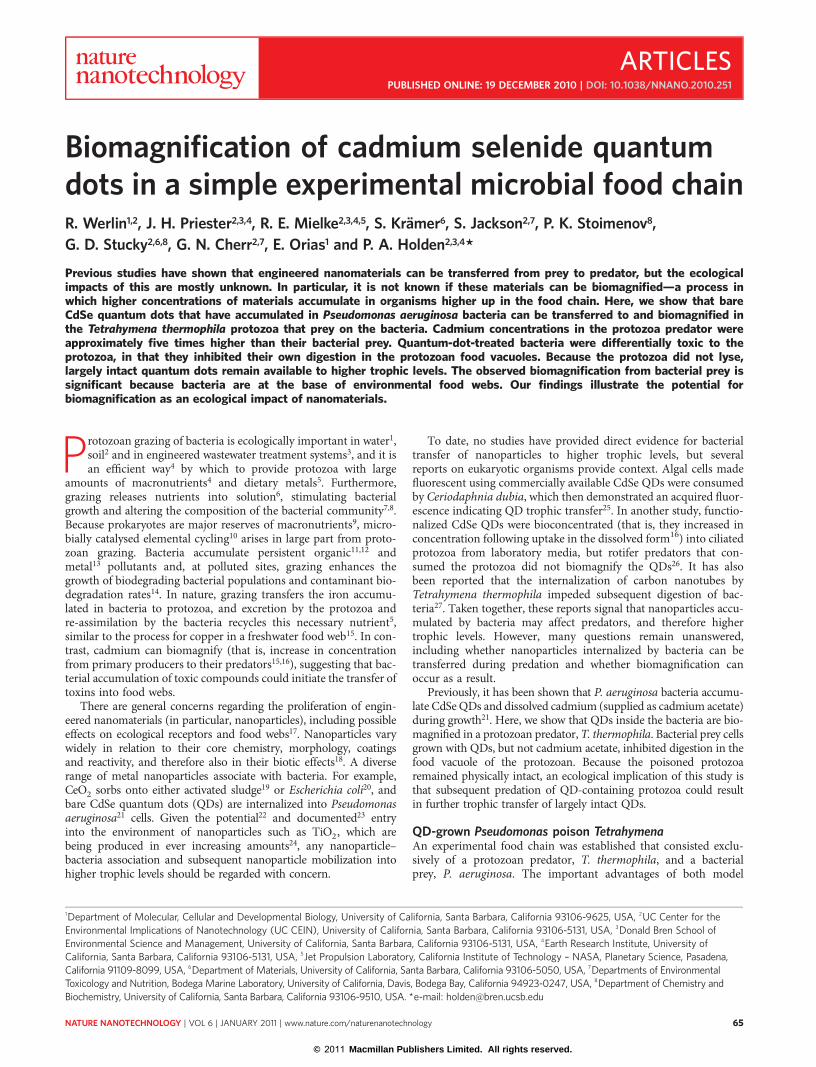
Previous studies have shown that engineered nanomaterials can be transferred from prey to predator, but the ecologicalimpacts of this are mostly unknown. In particular, it is not known if these materials can be biomagnified—a process inwhich higher concentrations of materials accumulate in organisms higher up in the food chain. Here, we show that bareCdSe quantum dots that have accumulated in Pseudomonas aeruginosa bacteria can be transferred to and biomagnified inthe Tetrahymena thermophila protozoa that prey on the bacteria. Cadmium concentrations in the protozoa predator wereapproximately five times higher than their bacterial prey. Quantum-dot-treated bacteria were differentially toxic to theprotozoa, in that they inhibited their own digestion in the protozoan food vacuoles. Because the protozoa did not lyse,largely intact quantum dots remain available to higher trophic levels. The observed biomagnification from bacterial prey issignificant because bacteria are at the base of environmental food webs. Our findings illustrate the potential forbiomagnification as an ecological impact of nanomaterials.
Protozoan grazing of bacteria is ecologically important in water1,soil2 and in engineered wastewater treatment systems3, and it isan efficient way4 by which to provide protozoa with large
amounts of macronutrients4 and dietary metals5. Furthermore,grazing releases nutrients into solution6, stimulating bacterialgrowth and altering the composition of the bacterial community7,8.Because prokaryotes are major reserves of macronutrients9, micro-bially catalysed elemental cycling10 arises in large part from proto-zoan grazing. Bacteria accumulate persistent organic11,12 andmetal13 pollutants and, at polluted sites, grazing enhances thegrowth of biodegrading bacterial populations and contaminant bio-degradation rates14. In nature, grazing transfers the iron accumu-lated in bacteria to protozoa, and excretion by the protozoa andre-assimilation by the bacteria recycles this necessary nutrient5,similar to the process for copper in a freshwater food web15. In con-trast, cadmium can biomagnify (that is, increase in concentrationfrom primary producers to their predators15,16), suggesting that bac-terial accumulation of toxic compounds could initiate the transfer oftoxins into food webs.
There are general concerns regarding the proliferation of engin-eered nanomaterials (in particular, nanoparticles), including possibleeffects on ecological receptors and food webs17. Nanoparticles varywidely in relation to their core chemistry, morphology, coatingsand reactivity, and therefore also in their biotic effects18. A diverserange of metal nanoparticles associate with bacteria. For example,CeO2 sorbs onto either activated sludge19 or Escherichia coli20, andbare CdSe quantum dots (QDs) are internalized into Pseudomonasaeruginosa21 cells. Given the potential22 and documented23 entryinto the environment of nanoparticles such as TiO2, which arebeing produced in ever increasing amounts24, any nanoparticle–bacteria association and subsequent nanoparticle mobilization intohigher trophic levels should be regarded with concern.
To date, no studies have provided direct evidence for bacterialtransfer of nanoparticles to higher trophic levels, but severalreports on eukaryotic organisms provide context. Algal cells madefluorescent using commercially available CdSe QDs were consumedby Ceriodaphnia dubia, which then demonstrated an acquired fluor-escence indicating QD trophic transfer25. In another study, functio-nalized CdSe QDs were bioconcentrated (that is, they increased inconcentration following uptake in the dissolved form16) into ciliatedprotozoa from laboratory media, but rotifer predators that con-sumed the protozoa did not biomagnify the QDs26. It has alsobeen reported that the internalization of carbon nanotubes byTetrahymena thermophila impeded subsequent digestion of bac-teria27. Taken together, these reports signal that nanoparticles accu-mulated by bacteria may affect predators, and therefore highertrophic levels. However, many questions remain unanswered,including whether nanoparticles internalized by bacteria can betransferred during predation and whether biomagnification canoccur as a result.
Previously, it has been shown that P. aeruginosa bacteria accumu-late CdSe QDs and dissolved cadmium (supplied as cadmium acetate)during growth21. Here, we show that QDs inside the bacteria are bio-magnified in a protozoan predator, T. thermophila. Bacterial prey cellsgrown with QDs, but not cadmium acetate, inhibited digestion in thefood vacuole of the protozoan. Because the poisoned protozoaremained physically intact, an ecological implication of this study isthat subsequent predation of QD-containing protozoa could resultin further trophic transfer of largely intact QDs.
QD-grown Pseudomonas poison TetrahymenaAn experimental food chain was established that consisted exclu-sively of a protozoan predator, T. thermophila, and a bacterialprey, P. aeruginosa. The important advantages of both model
1Department of Molecular, Cellular and Developmental Biology, University of California, Santa Barbara, California 93106-9625, USA, 2UC Center for theEnvironmental Implications of Nanotechnology (UC CEIN), University of California, Santa Barbara, California 93106-5131, USA, 3Donald Bren School ofEnvironmental Science and Management, University of California, Santa Barbara, California 93106-5131, USA, 4Earth Research Institute, University ofCalifornia, Santa Barbara, California 93106-5131, USA, 5Jet Propulsion Laboratory, California Institute of Technology – NASA, Planetary Science, Pasadena,California 91109-8099, USA, 6Department of Materials, University of California, Santa Barbara, California 93106-5050, USA, 7Departments of EnvironmentalToxicology and Nutrition, Bodega Marine Laboratory, University of California, Davis, Bodega Bay, California 94923-0247, USA, 8Department of Chemistry andBiochemistry, University of California, Santa Barbara, California 93106-9510, USA. *e-mail: [email protected]
ARTICLESPUBLISHED ONLINE: 19 DECEMBER 2010 | DOI: 10.1038/NNANO.2010.251
NATURE NANOTECHNOLOGY | VOL 6 | JANUARY 2011 | www.nature.com/naturenanotechnology 65
© 2011 Macmillan Publishers Limited. All rights reserved.
organisms for this type of study are summarized in the Methods.Starved protozoa were exclusively fed washed, mid-exponential-phase bacteria. The bacteria were cultivated in Luria Bertani (LB)broth without cadmium (control) and with 75 mg l21 totalcadmium added as either dissolved cadmium acetate or dialysedCdSe QDs. Inductively coupled plasma atomic emission spec-troscopy did not detect any cadmium in either control bacteria orcontrol protozoa.
Bacteria cultivated with cadmium acetate accumulated �15% ofthe added cadmium mass, leading to a total cellular cadmium con-centration significantly higher than the media, and a volumetricconcentration factor (VCF)5 of 33 (Supplementary Tables S1 andS2). Bacteria cultivated with CdSe QDs accumulated �25% of thetotal administered cadmium, resulting in a VCF of 70(Supplementary Tables S1 and S2). The bacteria were thenthoroughly washed to remove external cadmium. Previous work21
and the observations reported here have shown that Pseudomonasbacteria grown with CdSe QDs contain largely intact QDs.Selenium controls were not included, as the protozoa showed noadverse effects to various forms of Se (Na2SeO4 and Na2SeO3)even at the highest concentration tested (75 mg l21; R.A. Werlin,
unpublished observations), which on a mass basis represents ahigher Se concentration than in the CdSe QDs.
The protozoa that fed upon control bacteria increased theirpopulation with a constant 4 h doubling time (td) throughout thefirst 16 h of the experiment (Fig. 1a; Supplementary Table S3),resulting in a yield28 of (1.97+0.3) × 1025 protozoa per bacteriaconsumed. Observations of the control protozoa culture under dis-secting microscopy showed typical, vigorously swimming cells.When feeding upon cadmium acetate-grown bacteria, the initialprotozoan doubling time (td¼ 5 h) was comparable to that of thecontrol (Supplementary Table S3), but growth stopped abruptlyafter the population had doubled once (Fig. 1b). During the first4–6 h, the swimming and physical appearance of the protozoaundergoing the cadmium acetate treatment were indistinguishablefrom controls. However, by 8 h none of the treated protozoa wereswimming, and only �1% moving. Abrupt growth cessation withthe cadmium acetate treatment was also evident in the significantlylower protozoan yield relative to the control ((3.55+0.9) × 1026;P¼ 0.008 by single-factor ANOVA). Complete poisoning of theseprotozoa was confirmed by their inability to resume growth whentransferred to rich growth media without added cadmium.
Tetra
hym
ena
(cel
ls p
er m
l)
1614121086420
Time (h)
ba
Tetra
hym
ena
(cel
ls p
er m
l)
Pseudomonas (cells per m
l)
2.4 104
2.0 104
1.6 104
1.2 104
8.0 103
4.0 103
0.0 100
1.6 1010
1.4 1010
1.2 1010
1.0 1010
8.0 109
6.0 109
4.0 109
2.0 109
0.0 100
1.6 105
1.4 105
1.2 105
1.0 105
8.0 104
6.0 104
4.0 104
2.0 104
0.0 100
1614121086420
Time (h)
Figure 1 | Extent and rate of growth of Tetrahymena varies with Pseudomonas prey treatment. a, Tetrahymena population growth (filled symbols) and
Pseudomonas population decline (open symbols) for control (triangles), CdSe QD (squares) and cadmium acetate (circles) treatments. Error bars represent
standard error of the mean. For the Tetrahymena data, error bars are masked by the symbols. b, Tetrahymena population increase for three individual cultures
in the QD (squares) and cadmium acetate (circles) treatments. Tetrahymena cells that fed upon cadmium-acetate-grown bacteria stopped growing by 6 h,
whereas those that fed on QD-grown bacteria continued to grow slowly for up to 14 h.
25 m 25 m 25 m
a b c
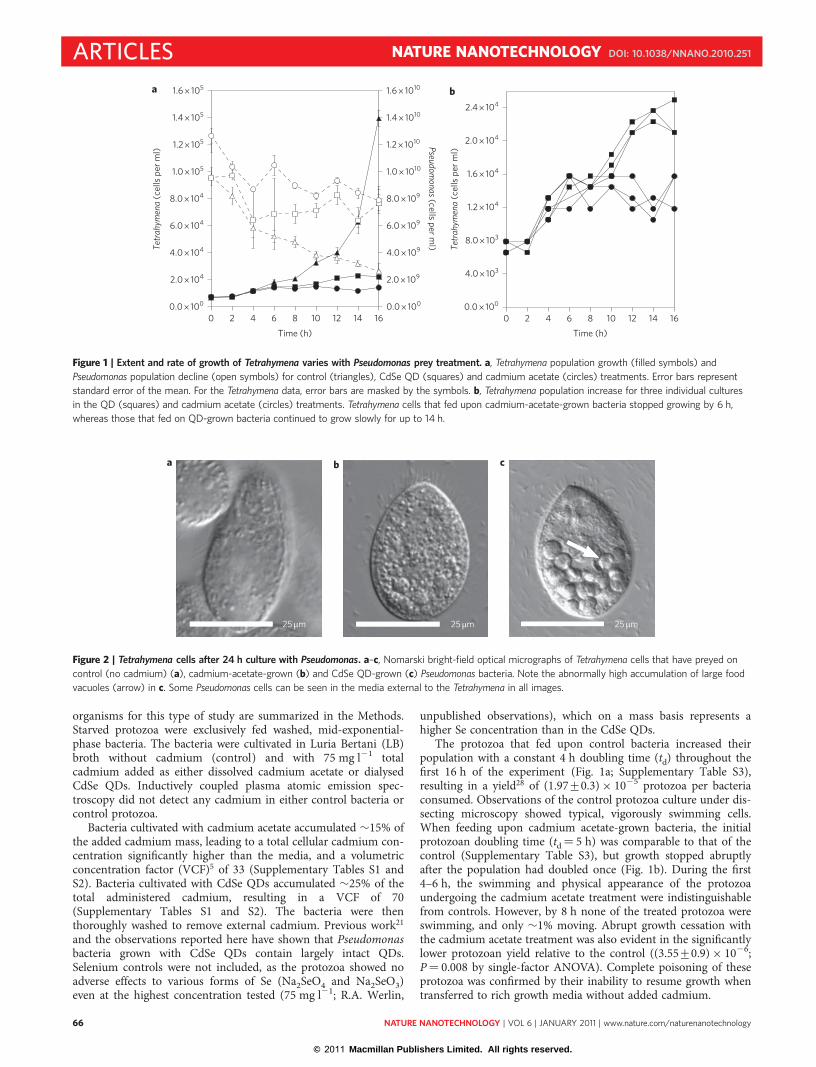
Figure 2 | Tetrahymena cells after 24 h culture with Pseudomonas. a–c, Nomarski bright-field optical micrographs of Tetrahymena cells that have preyed on
control (no cadmium) (a), cadmium-acetate-grown (b) and CdSe QD-grown (c) Pseudomonas bacteria. Note the abnormally high accumulation of large food
vacuoles (arrow) in c. Some Pseudomonas cells can be seen in the media external to the Tetrahymena in all images.
ARTICLES NATURE NANOTECHNOLOGY DOI: 10.1038/NNANO.2010.251
NATURE NANOTECHNOLOGY | VOL 6 | JANUARY 2011 | www.nature.com/naturenanotechnology66
© 2011 Macmillan Publishers Limited. All rights reserved.
Protozoa that fed on QD-grown bacteria grew for 14 h (Fig. 1b).This growth period was shorter than the control treatment, but.200% longer than that for the cadmium acetate treatment.Growth rates were significantly lower than in the control treatments(Supplementary Table S3) and, although growth appeared to bebiphasic, growth rates of individual replicate cultures were similarthroughout the 14 h period (Fig. 1b). The protozoan yield for theQD treatment was intermediate ((6.20+2.5) × 1026) to thecontrol and cadmium acetate treatments. At 16 h, only 0.3% of pro-tozoa that had been fed QD-grown bacteria recovered after transferto rich growth medium without added cadmium. Protozoan swim-ming was similar to that in the cadmium acetate treatment, with fewprotozoa moving after �10 h.
The rapid onset of growth (Fig. 1) suggests that the phagocyticingestion of bacteria was independent of the initial bacterial treat-ments; in other words, the protozoa fed indiscriminately.However, the lower yields for the cadmium acetate and CdSe QDtreatments compared to the controls show that the protozoa areextracting less nutrition from the ingested bacteria, perhapsbecause of the energy cost of the cadmium stress response.Furthermore, although the end results were similar (death of vir-tually all exposed cells), under QD treatment the protozoa werekilled more slowly than under the cadmium acetate treatment.
Protein carbonylation levels were measured to assay for oxidativedamage. For the QD and cadmium acetate treatments, the protozoashowed elevated protein carbonylation levels (SupplementaryFig. S1). This oxidative damage could be a direct heavy-metaleffect29 or a secondary effect due to damage to the mitochondrialmembrane with consequent release of reactive oxygen species tothe cytoplasm30.
QD-grown Pseudomonas inhibit Tetrahymena digestionNomarski bright-field optical microscopy revealed protozoan mor-phological differences between treatments. Control protozoa weremorphologically normal (Fig. 2a), with ciliary rows clearly visiblethroughout the course of the experiment. At 16 h, protozoa incadmium acetate treatments had a pebbly appearance on theirsurface, which obscured their ciliary rows (Fig. 2b). When focusedthrough the entire protozoan cell, no other aberrations were appar-ent. In contrast, protozoa in QD treatments showed abnormallyhigh numbers of food vacuoles (Fig. 2c), averaging �5 mm in diam-eter and distributed throughout the cell. No other gross morpho-logical aberrations were apparent at this magnification. Also, weobserved no evidence of protozoan cells undergoing lysis, or rem-nants of lysed cells.
The prolonged and slower growth of protozoa that were fedQD-grown bacteria and the high number of food vacuoles observedunder optical microscopy could result if the protozoa digested thebacteria at a reduced rate, perhaps because of hitherto unknownspecial effects of ingested QDs. Protozoan digestion rates varywith their prey species31, prey morphology32 and bacterial pro-duction of a toxic metabolite33. Tetrahymena food vacuole lifespanscan differ depending on whether bacterial cells or similarly sizedinert particles are ingested34, suggesting that food quality can signifi-cantly affect the digestion and egestion processes. Carbon nanotubesin Tetrahymena have been reported to interfere with subsequentdigestion of phagocytosed bacteria27, and Daphnia have beendescribed as showing signs of digestion interference from CdSeQDs in their food vacuoles35. To evaluate if a similar process wasat work here, we examined the ultrastructure of the protozoa ineach treatment over the time course of the experiment.
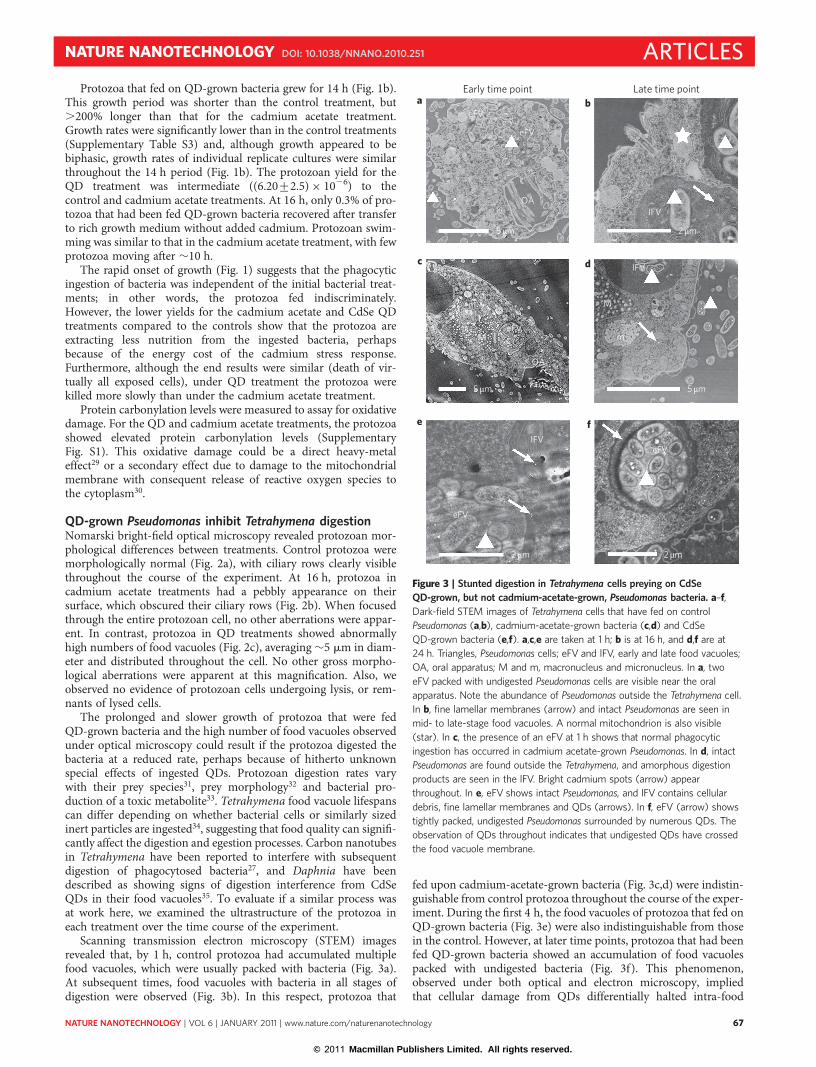
Scanning transmission electron microscopy (STEM) imagesrevealed that, by 1 h, control protozoa had accumulated multiplefood vacuoles, which were usually packed with bacteria (Fig. 3a).At subsequent times, food vacuoles with bacteria in all stages ofdigestion were observed (Fig. 3b). In this respect, protozoa that
fed upon cadmium-acetate-grown bacteria (Fig. 3c,d) were indistin-guishable from control protozoa throughout the course of the exper-iment. During the first 4 h, the food vacuoles of protozoa that fed onQD-grown bacteria (Fig. 3e) were also indistinguishable from thosein the control. However, at later time points, protozoa that had beenfed QD-grown bacteria showed an accumulation of food vacuolespacked with undigested bacteria (Fig. 3f). This phenomenon,observed under both optical and electron microscopy, impliedthat cellular damage from QDs differentially halted intra-food
eFV
eFV
OA
IFV
eFV
eFV
IFV
IFV
M
m
OA
eFVM
m
5 m
2 m 2 m
2 m
5 m5 m
aEarly time point Late time point
b
c d
e f
Figure 3 | Stunted digestion in Tetrahymena cells preying on CdSe
QD-grown, but not cadmium-acetate-grown, Pseudomonas bacteria. a–f,
Dark-field STEM images of Tetrahymena cells that have fed on control
Pseudomonas (a,b), cadmium-acetate-grown bacteria (c,d) and CdSe
QD-grown bacteria (e,f). a,c,e are taken at 1 h; b is at 16 h, and d,f are at
24 h. Triangles, Pseudomonas cells; eFV and lFV, early and late food vacuoles;
OA, oral apparatus; M and m, macronucleus and micronucleus. In a, two
eFV packed with undigested Pseudomonas cells are visible near the oral
apparatus. Note the abundance of Pseudomonas outside the Tetrahymena cell.
In b, fine lamellar membranes (arrow) and intact Pseudomonas are seen in
mid- to late-stage food vacuoles. A normal mitochondrion is also visible
(star). In c, the presence of an eFV at 1 h shows that normal phagocytic
ingestion has occurred in cadmium acetate-grown Pseudomonas. In d, intact
Pseudomonas are found outside the Tetrahymena, and amorphous digestion
products are seen in the lFV. Bright cadmium spots (arrow) appear
throughout. In e, eFV shows intact Pseudomonas, and lFV contains cellular
debris, fine lamellar membranes and QDs (arrows). In f, eFV (arrow) shows
tightly packed, undigested Pseudomonas surrounded by numerous QDs. The
observation of QDs throughout indicates that undigested QDs have crossed
the food vacuole membrane.
NATURE NANOTECHNOLOGY DOI: 10.1038/NNANO.2010.251 ARTICLES
NATURE NANOTECHNOLOGY | VOL 6 | JANUARY 2011 | www.nature.com/naturenanotechnology 67
© 2011 Macmillan Publishers Limited. All rights reserved.
vacuole digestion and egestion. That some digestion of bacteria hadoccurred was indicated by the QD-sized bright spots distributedthrough the cytoplasm, including around food vacuoles and nearmitochondria (Fig. 3f). In combination with the prolonged andslower growth of the protozoa in the QD treatments (Fig. 1), thedifferential effect on digestion (Figs 2c and 3f) relative to thecadmium acetate treatments is suggestive evidence for a QD ‘nano-particle-specific effect’ in the way that the protozoa are intoxicated,although we have not ruled out the unlikely possibility of a veryspecific interaction of some ionic selenium and cadmium generatedby partial dissolution of QDs.
Interestingly, at early times only, STEM images of QD-treatedprotozoa also revealed the presence of QDs in small (cross-sections,�10–250 nm), apparently extracellular vesicles in the oral cavity(Supplementary Section 5 and Fig. S2). To our knowledge, suchvesicle-like structures have not been reported, and we cannotexplain how the QDs enter the membrane-enclosed space.
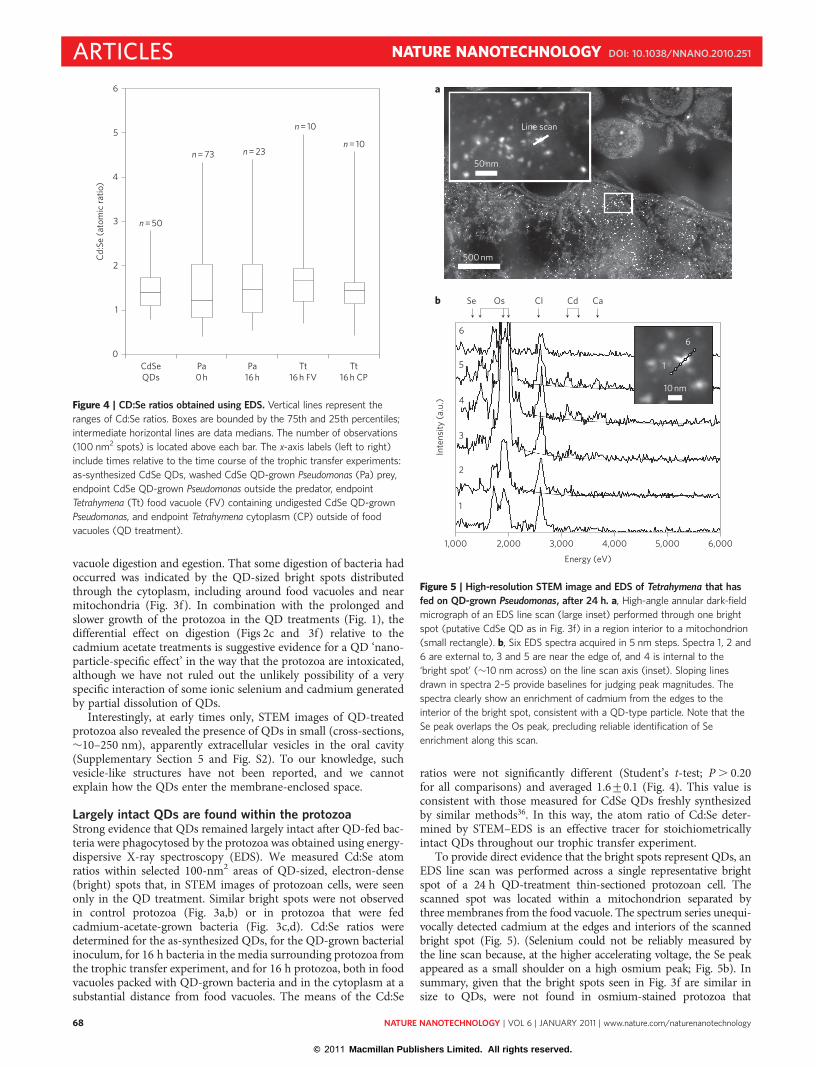
Largely intact QDs are found within the protozoaStrong evidence that QDs remained largely intact after QD-fed bac-teria were phagocytosed by the protozoa was obtained using energy-dispersive X-ray spectroscopy (EDS). We measured Cd:Se atomratios within selected 100-nm2 areas of QD-sized, electron-dense(bright) spots that, in STEM images of protozoan cells, were seenonly in the QD treatment. Similar bright spots were not observedin control protozoa (Fig. 3a,b) or in protozoa that were fedcadmium-acetate-grown bacteria (Fig. 3c,d). Cd:Se ratios weredetermined for the as-synthesized QDs, for the QD-grown bacterialinoculum, for 16 h bacteria in the media surrounding protozoa fromthe trophic transfer experiment, and for 16 h protozoa, both in foodvacuoles packed with QD-grown bacteria and in the cytoplasm at asubstantial distance from food vacuoles. The means of the Cd:Se
ratios were not significantly different (Student’s t-test; P . 0.20for all comparisons) and averaged 1.6+0.1 (Fig. 4). This value isconsistent with those measured for CdSe QDs freshly synthesizedby similar methods36. In this way, the atom ratio of Cd:Se deter-mined by STEM–EDS is an effective tracer for stoichiometricallyintact QDs throughout our trophic transfer experiment.
To provide direct evidence that the bright spots represent QDs, anEDS line scan was performed across a single representative brightspot of a 24 h QD-treatment thin-sectioned protozoan cell. Thescanned spot was located within a mitochondrion separated bythree membranes from the food vacuole. The spectrum series unequi-vocally detected cadmium at the edges and interiors of the scannedbright spot (Fig. 5). (Selenium could not be reliably measured bythe line scan because, at the higher accelerating voltage, the Se peakappeared as a small shoulder on a high osmium peak; Fig. 5b). Insummary, given that the bright spots seen in Fig. 3f are similar insize to QDs, were not found in osmium-stained protozoa that
5
4
3
2
1
0CdSeQDs
n = 50
Cd:S
e (a
tom
ic ra
tio)
n = 73 n = 23
n = 10
n = 10
Pa0 h
Pa16 h
Tt16 h FV
Tt16 h CP
6
Figure 4 | CD:Se ratios obtained using EDS. Vertical lines represent the
ranges of Cd:Se ratios. Boxes are bounded by the 75th and 25th percentiles;
intermediate horizontal lines are data medians. The number of observations
(100 nm2 spots) is located above each bar. The x-axis labels (left to right)
include times relative to the time course of the trophic transfer experiments:
as-synthesized CdSe QDs, washed CdSe QD-grown Pseudomonas (Pa) prey,
endpoint CdSe QD-grown Pseudomonas outside the predator, endpoint
Tetrahymena (Tt) food vacuole (FV) containing undigested CdSe QD-grown
Pseudomonas, and endpoint Tetrahymena cytoplasm (CP) outside of food
vacuoles (QD treatment).
Line scan
50 nm
500 nm
a
10 nm
1,000 2,000 3,000 4,000 5,000 6,000
Energy (eV)
Inte
nsity
(a.u
.)
1
6
Seb
6
5
4
3
2
1
Os Cl Cd Ca
Figure 5 | High-resolution STEM image and EDS of Tetrahymena that has
fed on QD-grown Pseudomonas, after 24 h. a, High-angle annular dark-field
micrograph of an EDS line scan (large inset) performed through one bright
spot (putative CdSe QD as in Fig. 3f) in a region interior to a mitochondrion
(small rectangle). b, Six EDS spectra acquired in 5 nm steps. Spectra 1, 2 and
6 are external to, 3 and 5 are near the edge of, and 4 is internal to the
‘bright spot’ (�10 nm across) on the line scan axis (inset). Sloping lines
drawn in spectra 2–5 provide baselines for judging peak magnitudes. The
spectra clearly show an enrichment of cadmium from the edges to the
interior of the bright spot, consistent with a QD-type particle. Note that the
Se peak overlaps the Os peak, precluding reliable identification of Se
enrichment along this scan.
ARTICLES NATURE NANOTECHNOLOGY DOI: 10.1038/NNANO.2010.251
NATURE NANOTECHNOLOGY | VOL 6 | JANUARY 2011 | www.nature.com/naturenanotechnology68
© 2011 Macmillan Publishers Limited. All rights reserved.
preyed upon cadmium-acetate-grown bacteria (Fig. 3c,d), haveretained the Cd:Se stoichiometry of intact QDs (Fig. 4), and representdiscrete peaks of cadmium enrichment (Fig. 5), it is reasonable toconclude that QDs, either intact or only partially decomposed, com-prise such bright spots. The combined data therefore provide strongevidence for trophic transfer of largely intact QD material from QD-grown bacteria to protozoa.
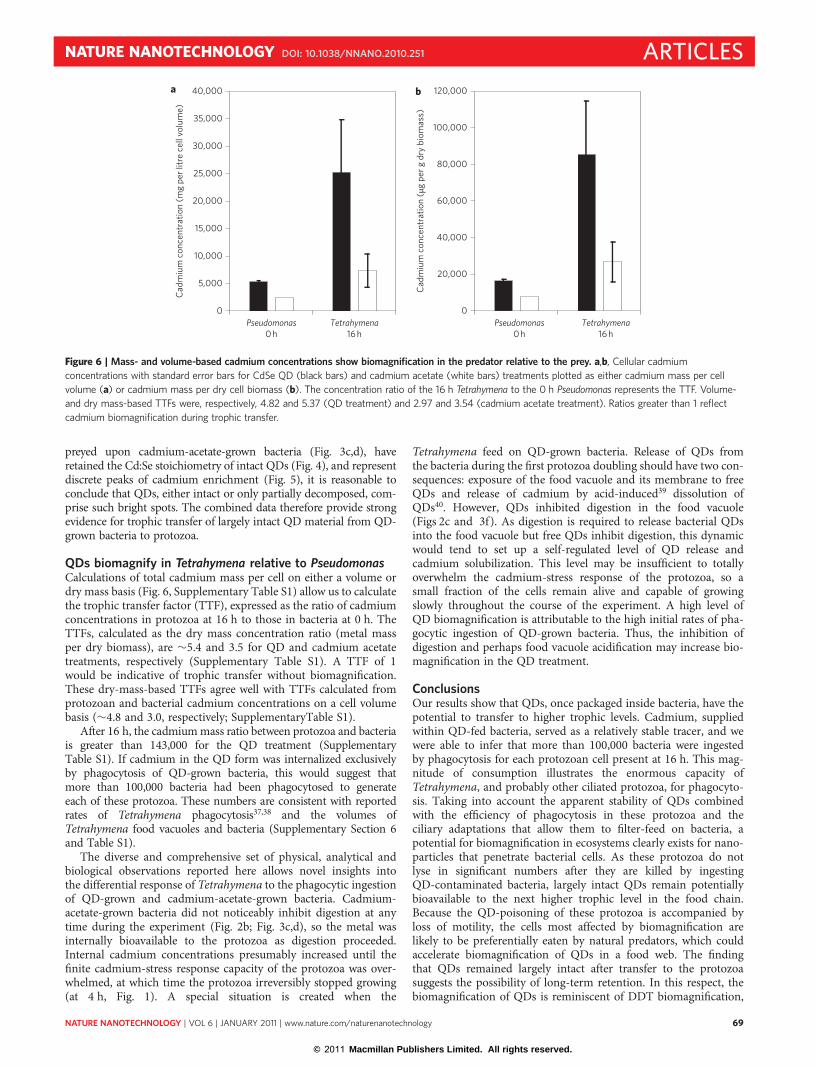
QDs biomagnify in Tetrahymena relative to PseudomonasCalculations of total cadmium mass per cell on either a volume ordry mass basis (Fig. 6, Supplementary Table S1) allow us to calculatethe trophic transfer factor (TTF), expressed as the ratio of cadmiumconcentrations in protozoa at 16 h to those in bacteria at 0 h. TheTTFs, calculated as the dry mass concentration ratio (metal massper dry biomass), are �5.4 and 3.5 for QD and cadmium acetatetreatments, respectively (Supplementary Table S1). A TTF of 1would be indicative of trophic transfer without biomagnification.These dry-mass-based TTFs agree well with TTFs calculated fromprotozoan and bacterial cadmium concentrations on a cell volumebasis (�4.8 and 3.0, respectively; SupplementaryTable S1).
After 16 h, the cadmium mass ratio between protozoa and bacteriais greater than 143,000 for the QD treatment (SupplementaryTable S1). If cadmium in the QD form was internalized exclusivelyby phagocytosis of QD-grown bacteria, this would suggest thatmore than 100,000 bacteria had been phagocytosed to generateeach of these protozoa. These numbers are consistent with reportedrates of Tetrahymena phagocytosis37,38 and the volumes ofTetrahymena food vacuoles and bacteria (Supplementary Section 6and Table S1).
The diverse and comprehensive set of physical, analytical andbiological observations reported here allows novel insights intothe differential response of Tetrahymena to the phagocytic ingestionof QD-grown and cadmium-acetate-grown bacteria. Cadmium-acetate-grown bacteria did not noticeably inhibit digestion at anytime during the experiment (Fig. 2b; Fig. 3c,d), so the metal wasinternally bioavailable to the protozoa as digestion proceeded.Internal cadmium concentrations presumably increased until thefinite cadmium-stress response capacity of the protozoa was over-whelmed, at which time the protozoa irreversibly stopped growing(at 4 h, Fig. 1). A special situation is created when the
Tetrahymena feed on QD-grown bacteria. Release of QDs fromthe bacteria during the first protozoa doubling should have two con-sequences: exposure of the food vacuole and its membrane to freeQDs and release of cadmium by acid-induced39 dissolution ofQDs40. However, QDs inhibited digestion in the food vacuole(Figs 2c and 3f). As digestion is required to release bacterial QDsinto the food vacuole but free QDs inhibit digestion, this dynamicwould tend to set up a self-regulated level of QD release andcadmium solubilization. This level may be insufficient to totallyoverwhelm the cadmium-stress response of the protozoa, so asmall fraction of the cells remain alive and capable of growingslowly throughout the course of the experiment. A high level ofQD biomagnification is attributable to the high initial rates of pha-gocytic ingestion of QD-grown bacteria. Thus, the inhibition ofdigestion and perhaps food vacuole acidification may increase bio-magnification in the QD treatment.
ConclusionsOur results show that QDs, once packaged inside bacteria, have thepotential to transfer to higher trophic levels. Cadmium, suppliedwithin QD-fed bacteria, served as a relatively stable tracer, and wewere able to infer that more than 100,000 bacteria were ingestedby phagocytosis for each protozoan cell present at 16 h. This mag-nitude of consumption illustrates the enormous capacity ofTetrahymena, and probably other ciliated protozoa, for phagocyto-sis. Taking into account the apparent stability of QDs combinedwith the efficiency of phagocytosis in these protozoa and theciliary adaptations that allow them to filter-feed on bacteria, apotential for biomagnification in ecosystems clearly exists for nano-particles that penetrate bacterial cells. As these protozoa do notlyse in significant numbers after they are killed by ingestingQD-contaminated bacteria, largely intact QDs remain potentiallybioavailable to the next higher trophic level in the food chain.Because the QD-poisoning of these protozoa is accompanied byloss of motility, the cells most affected by biomagnification arelikely to be preferentially eaten by natural predators, which couldaccelerate biomagnification of QDs in a food web. The findingthat QDs remained largely intact after transfer to the protozoasuggests the possibility of long-term retention. In this respect, thebiomagnification of QDs is reminiscent of DDT biomagnification,
40,000
35,000
25,000
30,000
20,000
15,000
Cad
miu
m c
once
ntra
tion
(mg
per l
itre
cell
volu
me)
10,000
5,000
0
a
Pseudomonas0 h
Tetrahymena16 h
Cad
miu
m c
once
ntra
tion
(g
per g
dry
bio
mas
s)
0
20,000
40,000
60,000
80,000
100,000
120,000b
Pseudomonas0 h
Tetrahymena16 h
Figure 6 | Mass- and volume-based cadmium concentrations show biomagnification in the predator relative to the prey. a,b, Cellular cadmium
concentrations with standard error bars for CdSe QD (black bars) and cadmium acetate (white bars) treatments plotted as either cadmium mass per cell
volume (a) or cadmium mass per dry cell biomass (b). The concentration ratio of the 16 h Tetrahymena to the 0 h Pseudomonas represents the TTF. Volume-
and dry mass-based TTFs were, respectively, 4.82 and 5.37 (QD treatment) and 2.97 and 3.54 (cadmium acetate treatment). Ratios greater than 1 reflect
cadmium biomagnification during trophic transfer.
NATURE NANOTECHNOLOGY DOI: 10.1038/NNANO.2010.251 ARTICLES
NATURE NANOTECHNOLOGY | VOL 6 | JANUARY 2011 | www.nature.com/naturenanotechnology 69
© 2011 Macmillan Publishers Limited. All rights reserved.
a compound that likewise accumulates in bacteria12 and is amplifiedintact in successively higher levels of food webs.
The need to obtain reliable quantitative measurements drove ourexperimental design to use high cadmium concentrations and batchconditions (rather than steady-state, for example, chemostat con-ditions). Our findings therefore illustrate what could happen. Theeffects of a low-concentration, steady-state influx of toxic nanopar-ticles capable of being internalized by bacteria in a complex naturalenvironment are not directly predictable from our experiments.Nonetheless, the findings do caution that such steady influx maynot be risk-free for biomagnification.
MethodsBiological materials. Strain SB210E of T. thermophila was used as an apex predatorto test the potential for QD biomagnification. Strain SB210E is a fresh thaw of strainSB210, the strain for which the macronuclear genome has been sequenced41,which is available from the Tetrahymena Stock Centre (http://tetrahymena.vet.cornell.edu/). T. thermophila, a consummate bacterivore, is a freshwater member ofthe ciliated protozoa, a major eukaryotic evolutionary group comprising commoninhabitants of all aquatic environments41,42. Tetrahymena cells are among the fastestgrowing eukaryotes, actively phagocytise bacteria and represent the ciliatedprotozoa, which together with other heterotrophic protozoa are vital links in thefood web of every aquatic ecosystem.
Strain PG201, a previously studied environmental strain of P. aeruginosa21,43, wasused as the prey. This is a heavy-metal-tolerant environmental strain that can begrown with cadmium concentrations high enough to allow reliable measurements ofintracellular concentrations. The work presented here builds upon our recentlypublished comparison of the fate and toxicity of QDs and dissolved cadmium inPG201 cells, and the demonstration that 5 nm bare QDs can be ‘packaged’ byPseudomonas cells through uptake into their cytoplasm21.
Trophic transfer experiment. Chemicals, media and cell preparation methods forthe trophic transfer experiments are described in the Supplementary Information.Protozoa were fed bacteria grown in LB broth supplemented in three different ways:unsupplemented (control), supplemented with cadmium acetate and supplementedwith bare CdSe QDs. Three independent replicates of each experimentaltreatment were established and studied for cell growth by time-course cell counting,endpoint cellular cadmium concentrations, and protozoa viability, morphology,ultrastructure and protein carbonyl content (see Supplementary Information).
Specific growth rate and yield measurements. The exponential phase specificgrowth rates for the protozoa were calculated as described in the SupplementaryInformation. The protozoan yields were calculated for the exponential growthperiods as absolute values of the ratios of the differences between the initial and finalcell concentrations: (CT,1–CT,2)/(CP,–CP,2), where CT and CP are the concentrationsof protozoa and bacteria, respectively, and 1 and 2 are the initial and final times ofthe exponential growth period, respectively. Both types of calculations have beenreported previously for predator–prey studies involving protozoan bacterivores28.
Cadmium quantification and biomagnification calculations. Separated protozoanand bacterial cells were used to measure total cadmium in each cell fraction. Totalcadmium was quantified by inductively coupled plasma atomic emissionspectroscopy with a TJA High Resolution IRIS instrument (Thermo ElectronCorporation). The instrument was calibrated against commercial cadmiumstandards (Sigma Chemical). Samples were prepared by dissolving in aqua regia.
Volume-based cellular cadmium concentrations were calculated for bacteria andprotozoa using an approach from a previous study21. For each cell type andtreatment, cadmium mass, quantified by inductively coupled plasma spectroscopy,was divided by the cell count to give cadmium mass per cell. To calculate cellularvolume-based cadmium concentration, this number was divided by the cellvolume, measured under our experimental conditions (Supplementary Section 6).To convert to cellular dry-mass-based cadmium concentrations, literature valueswere used for dry-mass-based cell densities. The dry mass values were corrected byassuming that the total cell mass was the sum of the cadmium-unexposed celldry mass (assumed) and the cellular cadmium mass (measured by inductivelycoupled plasma spectroscopy). Data and intermediate steps in these calculations areexplained in full detail in the text preceding Supplementary Table S1.
Biomagnification extents were calculated as volume- and dry-cell-mass-basedTTFs (as by others44), that is, as the ratio of 16 h protozoan cadmium concentration(volume- or dry-cell-mass-based) to the corresponding 0 h bacterial cadmiumconcentration (Supplementary Table S1). Calculated volume- and dry-mass-basedTTFs fell within 16% of one another.
Optical and electron microscopy, and energy dispersive spectroscopy. Swimmingbehaviour and overall appearance of protozoan cells were observed every 30 min for2 h, thereafter every hour for 5 h, and at 2 h intervals for 17 h thereafter under adissecting scope (×30). The methods for preparing cells for Nomarski imaging andelectron microscopy are provided in the Supplementary Information. STEM images
were acquired using an FEI XL30 ESEM FEG microscope operating at 30 kVaccelerating voltage with a STEM detector at a working distance of 6.7 mm.EDS analysis was performed in a manner similar to previous reports45 on selectedrectangular areas of 100 nm2 for 15 s at 25.6 mS using an X-ray detector with asapphire super Ultra-Thin Window (UTW; EDAX) on an FEI Nano600 FEGmicroscope. Genesis software (EDAX) was used in ZAF mode to analyse the spectra.TEM images and EDS line scans were acquired in high-angle annular dark-fieldmode using an ultrahigh-resolution FEI Titan 80-300 (TEM/STEM) operated at300 kV accelerating voltage, with a spatial resolution in the order of 1 nm2.
Received 18 August 2010; accepted 17 November 2010;published online 19 December 2010
References1. Barbeau, K., Moffett, J. W., Caron, D. A., Croot, P. L. & Erdner, D. L. Role of
protozoan grazing in relieving iron limitation of phytoplankton. Nature 380,61–64 (1996).
2. Clarholm, M. Interactions of bacteria, protozoa and plants leading tomineralization of soil-nitrogen. Soil Biol. Biochem. 17, 181–187 (1985).
3. Gude, H. Grazing by protozoa as selection factor for activated sludge bacteria.Microb. Ecol. 5, 225–237 (1979).
4. Ducklow, H. W. Production and fate of bacteria in the oceans. Bioscience 33,494–501 (1983).
5. Vogel, C. & Fisher, N. S. Trophic transfer of Fe, Zn and Am from marine bacteriato a planktonic ciliate. Mar. Ecol. Prog. Ser. 384, 61–68 (2009).
6. Berninger, U. G., Finlay, B. J. & Kuuppoleinikki, P. Protozoan control of bacterialabundances in freshwater. Limnol. Oceanogr. 36, 139–147 (1991).
7. Sherr, E. B. & Sherr, B. F. Significance of predation by protists in aquaticmicrobial food webs. Anton. Leeuw. Int. J. G. 81, 293–308 (2002).
8. Pernthaler, J. Predation on prokaryotes in the water column and its ecologicalimplications. Nat. Rev. Microbiol. 3, 537–546 (2005).
9. Whitman, W. B., Coleman, D. C. & Wiebe, W. J. Prokaryotes: the unseenmajority. Proc. Natl Acad. Sci. USA 95, 6578–6583 (1998).
10. Schlesinger, W. H. Biogeochemistry: An Analysis of Global Change (AcademicPress, 1997).
11. Hudson, M. J., Swackhamer, D. L. & Cotner, J. B. Effect of microbes oncontaminant transfer in the Lake Superior food web. Environ. Sci. Technol. 39,9500–9508 (2005).
12. Johnson, B. T. & Kennedy, J. O. Biomagnification of p,p’-DDT andmethoxychlor by bacteria. Appl. Microbiol. 26, 66–71 (1973).
13. Mullen, M. D. et al. Bacterial sorption of heavy metals. Appl. Environ. Microbiol.55, 3143–3149 (1989).
14. Madsen, E. L., Sinclair, J. L. & Ghiorse, W. C. In situ biodegradation:microbiological patterns in a contaminated aquifer. Science 252, 830–833 (1991).
15. Croteau, M. N., Luoma, S. N. & Stewart, A. R. Trophic transfer of metals alongfreshwater food webs: evidence of cadmium biomagnification in nature. Limnol.Oceanogr. 50, 1511–1519 (2005).
16. Luoma, S. N. & Rainbow, P. S. Metal Contamination in Aquatic Environments:Science and Lateral Management (Cambridge Univ. Press, 2008).
17. Klaine, S. J. et al. Nanomaterials in the environment: behavior, fate,bioavailability, and effects. Environ. Toxicol. Chem. 27, 1825–1851 (2008).
18. Stern, S. T. & McNeil, S. E. Nanotechnology safety concerns revisited. Toxicol.Sci. 101, 4–21 (2008).
19. Limbach, L. K. et al. Removal of oxide nanoparticles in a model wastewatertreatment plant: influence of agglomeration and surfactants on clearingefficiency. Environ. Sci. Technol. 42, 5828–5833 (2008).
20. Thill, A. et al. Cytotoxicity of CeO2 nanoparticles for Escherichia coli. Physico-chemical insight of the cytotoxicity mechanism. Environ. Sci. Technol. 40,6151–6156 (2006).
21. Priester, J. H. et al. Effects of soluble cadmium salts versus CdSe quantum dotson the growth of planktonic Pseudomonas aeruginosa. Environ. Sci. Technol. 43,2589–2594 (2009).
22. Kaegi, R. et al. Synthetic TiO2 nanoparticle emission from exterior facades intothe aquatic environment. Environ. Pollut. 156, 233–239 (2008).
23. Kiser, M. A. et al. Titanium nanomaterial removal and release from wastewatertreatment plants. Environ. Sci. Technol. 43, 6757–6763 (2009).
24. Robichaud, C. O., Uyar, A. E., Darby, M. R., Zucker, L. G. & Wiesner, M. R.Estimates of upper bounds and trends in nano-TiO2 production as a basis forexposure assessment. Environ. Sci. Technol. 43, 4227–4233 (2009).
25. Bouldin, J. L. et al. Aqueous toxicity and food chain transfer of quantum dots infreshwater algae and Ceriodaphnia dubia. Environ. Toxicol. Chem. 27,1958–1963 (2008).
26. Holbrook, R. D., Murphy, K. E., Morrow, J. B. & Cole, K. D. Trophic transfer ofnanoparticles in a simplified invertebrate food web. Nature Nanotech. 3,352–355 (2008).
27. Ghafari, P. et al. Impact of carbon nanotubes on the ingestion and digestion ofbacteria by ciliated protozoa. Nature Nanotech. 3, 347–351 (2008).
ARTICLES NATURE NANOTECHNOLOGY DOI: 10.1038/NNANO.2010.251
NATURE NANOTECHNOLOGY | VOL 6 | JANUARY 2011 | www.nature.com/naturenanotechnology70
© 2011 Macmillan Publishers Limited. All rights reserved.
28. Eccleston-Parry, J. D. & Leadbeater, B. S. C. A comparison of the growth kineticsof six marine heterotrophic nanoflagellates fed with one bacterial species. Mar.Ecol. Prog. Ser. 105, 167–177 (1994).
29. Stohs, S. J. & Bagchi, D. Oxidative mechanisms in the toxicity of metal ions. FreeRadic. Biol. Med. 18, 321–336 (1995).
30. Rikans, L. E. & Yamano, T. Mechanisms of cadmium-mediated acutehepatotoxicity. J. Biochem. Mol. Toxicol. 14, 110–117 (2000).
31. Boenigk, J., Matz, C., Jurgens, K. & Arndt, H. The influence of precultureconditions and food quality on the ingestion and digestion process of threespecies of heterotrophic nanoflagellates. Microb. Ecol. 42, 168–176 (2001).
32. Corno, G. & Jurgens, K. Direct and indirect effects of protist predation onpopulation size structure of a bacterial strain with high phenotypic plasticity.Appl. Environ. Microbiol. 72, 78–86 (2006).
33. Matz, C. et al. Impact of violacein-producing bacteria on survival and feeding ofbacterivorous nanoflagellates. Appl. Environ. Microbiol. 70, 1593–1599 (2004).
34. Boenigk, J., Matz, C., Jurgens, K. & Arndt, H. Confusing selective feeding withdifferential digestion in bacterivorous nanoflagellates. J. Eukaryot. Microbiol. 48,425–432 (2001).
35. Lewinski, N. A. et al. Quantification of water solubilized CdSe/ZnS quantumdots in Daphnia magna. Environ. Sci. Technol. 44, 1841–1846 (2010).
36. Lin, Y. W., Hsieh, M. M., Liu, C. P. & Chang, H. T. Photoassisted synthesis ofCdSe and core–shell CdSe/CdS quantum dots. Langmuir 21, 728–734 (2005).
37. Nilsson, J. R. & Williams, N. E. in Biochemistiry and Physiology of Protozoa Vol.2 (Academic Press, 1979).
38. Orias, E. & Pollock, N. A. Heat-sensitive development of phagocytotic organellein a Tetrahymena mutant. Exp. Cell Res. 90, 345–356 (1975).
39. Fok, A. K., Lee, Y. & Allen, R. D. The correlation of digestive vacuole pH and sizewith the digestive cycle in Paramecium caudatum. J. Protozool. 29,409–414 (1982).
40. Mahendra, S., Zhu, H. G., Colvin, V. L. & Alvarez, P. J. Quantum dot weatheringresults in microbial toxicity. Environ. Sci. Technol. 42, 9424–9430 (2008).
41. Eisen, J. A. et al. Macronuclear genome sequence of the ciliate Tetrahymenathermophila, a model eukaryote. PLoS Biol. 4, 1620–1642 (2006).
42. Nanney, D. L. & Simon, E. M. Tetrahmena thermophila (Academic Press, 1979).43. Steinberger, R. E., Allen, A. R., Hansma, H. G. & Holden, P. A. Elongation
correlates with nutrient deprivation in unsaturated Pseudomonas aeruginosabiofilms. Microb. Ecol. 43, 416–423 (2002).
44. Xie, L. T., Funk, D. H. & Buchwalter, D. B. Trophic transfer of Cd from naturalperiphyton to the grazing mayfly Centroptilum triangulifer in a life cycle test.Environ. Pollut. 158, 272–277 (2010).
45. Clarke, S., Mielke, R. E., Neal, A., Holden, P. & Nadeau, J. L. Bacterial andmineral elements in an Arctic biofilm: a correlative study using fluorescence andelectron microscopy. Microsc. Microanal. 16, 153–165 (2010).
AcknowledgementsThis research was primarily funded by US Environmental Protection Agency Science ToAchieve Results (STAR) award no. R833323 (to P.A.H. and G.D.S.), and by the NationalScience Foundation and the Environmental Protection Agency under cooperativeagreement no. DBI-0830117 (to P.A.H., G.N.C. and G.D.S.). Any opinions, findings andconclusions or recommendations expressed in this material are those of the author(s) anddo not necessarily reflect the views of either the National Science Foundation or theEnvironmental Protection Agency. This work has not been subjected to EnvironmentalProtection Agency review and no official endorsement should be inferred. Environmentalscanning and scanning transmission electron microscopy were partly performed in theMicro-Environmental Imaging and Analysis Facility at University of California SantaBarbara (www.bren.ucsb.edu/facilities/MEIAF/) under National Science Foundationawards nos BES-9977772 and DBI-0216480. Transmission electron microscopy was partlyperformed in the University of California Santa Barbara Materials Research LaboratoryCentral Facilities supported by the Materials Research Science and Engineering CentersProgram of the National Science Foundation under award no. DMR05-20415. The T.thermophila portion of the work was partially supported by grant no. R01-RR009231 fromthe National Center for Research Resources of the National Institutes of Health (to E.O.).The authors gratefully acknowledge critical comments on the manuscript by T. Klanjscek.Thanks also go to anonymous reviewers for valuable suggestions that led to significantimprovement of the manuscript.
Author contributionsP.A.H., J.H.P., R.W., E.O. and G.D.S. designed the experiment. P.K.S. and G.D.S.synthesized and provided the quantum dots. R.W. and J.H.P. executed the trophic transferexperiments. R.E.M. and S.K. performed the electron microscopy and EDS analyses.G.N.C. and S.J. determined protein carbonyl content. All authors contributed to the writingof the manuscript.
Additional informationThe authors declare no competing financial interests. Supplementary informationaccompanies this paper at www.nature.com/naturenanotechnology. Reprints andpermission information is available online at http://npg.nature.com/reprintsandpermissions/.Correspondence and requests for materials should be addressed to P.A.H.
NATURE NANOTECHNOLOGY DOI: 10.1038/NNANO.2010.251 ARTICLES
NATURE NANOTECHNOLOGY | VOL 6 | JANUARY 2011 | www.nature.com/naturenanotechnology 71
© 2011 Macmillan Publishers Limited. All rights reserved.
Top Related
Copyright © 2022 FDOKUMEN

