


Bahasa
Halaman
Hukum


Assessing Student Knowledge, Background and Perceptions in the International Civic and Citizenship Study
Wolfram Schulz Australian Council for Educational Research
Melbourne/Australia [email protected]
Falk Brese IEA Data Processing and Research Center
Hamburg/Germany [email protected]
Paper prepared for the Annual Meetings of the American Educational Research Association in New York, 24-28 March 2008.

2
Introduction It is over the ten years since IEA last investigated civic education, and in that time new challenges have emerged in educating young people for their roles as citizens in the 21st century. These challenges have stimulated renewed reflection on the meanings of citizenship and the roles of and approaches to civic and citizenship education. In many countries there is a growing interest in using evidence to improve policy and practice in civic and citizenship education.
ICCS is the third international IEA study in this area and it is explicitly linked through common questions to the IEA Civic Education Study (CIVED) which was undertaken in 1999 and 2000 (Torney-Purta, Lehmann, Oswald and Schulz, 2001; Amadeo et. al., 2004; Schulz and Sibberns, 2004). The study will survey 13-to-14-year old students in 38 countries in the years 2008 and 2009 and report on student achievement and perceptions related to civic and citizenship education. Outcome data will be obtained from representative samples of students in their eighth year of schooling and context data from the students, their schools and teachers as well as through national centres. The study builds on the previous IEA study of civic education (CIVED) undertaken in 1999. Information about ICCS can be found at http://iccs.acer.edu.au/.1
It is recognised that there is substantial diversity in the field of civic and citizenship education within and across countries. Consequently, maximising the involvement of researchers from participating countries in this international comparative study is deemed to be of particular importance for the success of this study. Input from national research centres is sought throughout the study and the consortium has developed strategies that have maximised country contributions to the instrument development for the field trial and will continue to involve countries in the selection process of item material for main survey.
The students surveyed for ICCS are students enrolled in the grade that represents eight years of schooling, counting from the first year of ISCED Level 1, provided the mean age at the time of testing is at least 13.5 years. According to this definition, for most countries the target grade would be the eighth grade, or its national equivalent. The aim of the survey is to gather data on (a) student knowledge, conceptual understanding and competencies in civic and citizenship education, (b) student background characteristics and participation in active citizenship, and (c) student perceptions of aspects of civics and citizenship.
The student-level data in ICCS are obtained from three student survey instruments:
1. The cognitive test of 60 minutes which consists of new items and a number of trend items selected from the IEA CIVED study administered as a rotated booklet design with between 80 and 100 cognitive items (mainly multiple-choice but also some open-ended response items).
2. A background questionnaire of 15 minutes length to provide information about student characteristics, home background and civic-related activities in and out of school. One important aspect of this assessment is the measurement of
1 The study is managed by a consortium of three partner institutions (the Australian Council for Educational Research, the National Foundation for Educational Research in the United Kingdom and the Laboratorio di Pedagogia sperimentale at the Rome Tre University) who work in close cooperation with the IEA Secretariat, the IEA Data Processing and Research Center and the national research coordinators in the participating countries.

3
students’ socio-economic status based on data about parental education and occupation as well as the existence of household items.
3. A student perceptions questionnaire to gather information about student perceptions of and attitudes towards issues related to civic and citizenship education and will take 30 minutes to complete.
This paper provides an overview of the areas assessed with the three student instruments and gives information about the conceptual underpinning for item development. It will outline the general principles for scaling and analysis that underlie the procedures used in ICCS and it discusses possible ways of assessing measurement invariance across participating countries. First results from the international field trial carried out in late 2007 are used to illustrate the ICCS student assessment and the potential of measurement and analysis of these data.
The Measurement of Cognitive Aspects The data derived from the test items constructed to represent the processes in the cognitive domains will be used to construct a global scale of civic and citizenship knowledge and understandings of four content domains:
• Content Domain 1: Civic society and systems
• Content Domain 2: Civic principles
• Content Domain 3: Civic participation
• Content Domain 4: Civic identities.
In addition, two cognitive domains are distinguished. The first cognitive domain, knowing, outlines the types of civic and citizenship information that students are required to demonstrate knowledge of. The second domain, reasoning and analysing, details the cognitive processes that students require to reach conclusions that are broader than the contents of any single piece of knowledge, including the processes involved in understanding complex sets of factors influencing civic actions and planning for and evaluating strategic solutions and outcomes.
The Measurement of Affective-behavioural Aspects The items measuring the affective-behavioural domains will not require correct or incorrect responses but typically will be measured through use of a Likert-type item format in the student perceptions and student background questionnaires.
Affective-behavioural Domain 1: Value Beliefs Value beliefs relevant in the context of civics and citizenship include beliefs about fundamental concepts or ideas (freedom, equity, social cohesion). There are three types of value beliefs that will be measured in ICCS.
Students’ beliefs in democratic values This construct refers to student beliefs about democracy and relates mainly to Content Domain 2 (civic principles). In the IEA CIVED study students were asked to rate a number of characteristics of society as either “good or bad for democracy”. Contrary to the expectations the results did not show similar patterns of conceptual dimensions

4
along which students rate these items, However, a number of items represented a factor related to rule of law model of democracy that was consistent across countries (see Torney-Purta et. al., 2001). Instead of asking about positive or negative consequences for democracy, ICCS includes a set of items that ask about the agreement of students with what a society should be like. The items were adapted from a subset of those included in CIVED and will reflect students’ endorsement of basic democratic values.
Students’ beliefs in citizenship values This construct refers to student beliefs regarding “good citizenship” and relates mainly to Content Domain 1 (civic society and systems). Items asking about the importance of certain behaviours for “good citizenship” were already included in the first IEA study on civic education in 1971 (Torney, Oppenheim and Farnen, 1975). In CIVED, a set of 15 items were used asking students to rate the importance of certain behaviours for being a good citizen (see Torney-Purta et. al, 2001, p. 77f). Two sub-scales on conventional and social-movement-related citizenship were reported (see Schulz, 2004). Kennedy (2006) distinguish active (conventional and social-movement-related) from passive citizenship elements (national identity, patriotism and loyalty). ICCS includes 13 items on good citizenship behaviour, most of them are modified versions of those used in CIVED.
Students’ acceptance of socially undesirable behaviour This construct refers to student beliefs about the acceptability of certain types of socially undesirable actions and relates mainly to Content Domain 1 (civic society and systems). Students are asked about actions in and out of school that are generally viewed as socially undesirable.
Affective-behavioural Domain 2: Attitudes The different types of attitudes relevant with respect to civics and citizenship include: (a) students’ self-cognitions related to civics and citizenship; (b) students’ attitudes towards rights and responsibilities; and (c) students’ attitudes towards institutions.
Students' self-cognitions related to Civics and Citizenship
The following constructs relate to student self-cognitions and are relevant with regard to civics and citizenship.
Interest in political events and social issues This construct reflects students’ motivation with regard to politics and relates to Content Domain 4 (civic identities). The first IEA Civic Education Study in 1971 included measures of interest in public affairs television which turned out to be a positive predictor for civic knowledge and participation (Torney, Oppenheim and Farnen, 1975). In the IEA CIVED study an item on political interest was used (Torney-Purta et. al., 2001). Similar to earlier findings, CIVED results also showed interest in politics as a positive predictor of civic knowledge and likelihood to vote (Amadeo et. al., 2002). ICCS uses a list of items covering students’ interest in a broader range of eight different political and social issues.
Self-concept regarding political participation (political internal efficacy) This construct refers to students’ self-concept regarding political involvement and relates to Content Domain 3 (civic participation). The broader concept of political

5
efficacy has played a prominent role in studies on political behaviour and political socialisation. Political efficacy is the “feeling that political and social change is possible and that the individual citizen can play a part in bringing about this change” (Campbell, Gurin and Miller, 1954, p. 187). Analyses of items typically used to measure political efficacy soon revealed a two-dimensional structure of political efficacy, where Internal efficacy can be defined as the confidence of the individual in his or her own abilities to understand politics and to act politically, whereas external efficacy constitutes the individual’s belief in the responsiveness of the political system (see Converse, 1972; Balch, 1974).
The IEA CIVED study used three items measuring internal political efficacy, which was positively associated with indicators of civic engagement (see Schulz, 2005). In ICCS, the three CIVED items has been complemented with four additional items.
Citizenship self-efficacy This construct reflects students’ self-confidence in active citizenship behaviour and relates primarily to Content Domain 3 (civic participation). Individuals' “judgements of their capabilities to organise and execute courses of action required to attain designated types of performances” (Bandura, 1986, p. 391) are deemed to have a strong influence on individual choices, efforts, perseverance and emotions related to the tasks. The concept of self-efficacy constitutes an important element of Bandura's social cognitive theory (1993) about the learning process, in which the learner directs his or her own learning.
The distinction between self-concept regarding political participation (political internal efficacy) and citizenship self-efficacy is as follows: Whereas internal political efficacy asks about global statements regarding students’ general capacity to act politically, citizenship self-efficacy asks about the students’ self-confidence to undertake specific tasks in the area of civic participation. ICCS includes eights different items reflecting different activities.
Perceptions of distinctiveness compared to others in the country This construct is based on students’ self-perception regarding their characteristics as members of society and relates mainly to Content Domain 4 (civic identities). Distinctiveness refers to whether individuals stand out in terms of their language, nationality, religion or ethnicity. In ICCS, apart from objective factors of distinctiveness (like reported foreign language use at home, foreign country of birth, ethnicity) are taken as measure of distinctiveness, also self-beliefs about distinctiveness are measured (including life-style characteristics).
Sense of belonging to communities This construct reflects the students’ sense of belonging to different community levels and relates to Content Domain 4 (civic identities). Over the past few decades, data from the World Values Survey have provided some evidence for a global pattern of increasing identification with supra-national levels in particular among young people has been observed (Jung, 2008). In addition, claims have been made that globalisation has also had the effect of strengthening identifications with local and regional levels . ICCS includes a question asking students to rate how much they feel part of communities at different levels (local, regional, national, supranational).

6
Students' attitudes towards rights and responsibilities The following constructs reflect students’ attitudes towards rights and responsibilities and are relevant with regard to civics and citizenship.
Attitudes towards gender rights This construct reflects student beliefs about rights for different gender groups in society. It relates to Content Domain 2 (civic principles). The first IEA civic education study in 1971 included four items measuring support for women’s political rights. The IEA CIVED study used a set of six items to capture students’ attitudes regarding women’s political rights (Torney-Purta et. al., 2001). ICCS includes eight items on gender rights, some of them are identical or similar to those used in CIVED.
Attitudes towards the rights of ethnic/racial groups This construct reflects students’ beliefs about rights for different ethnic/racial groups in society. It relates primarily to Content Domain 2 (civic principles). The four items used in ICCS had already been used in the IEA CIVED study but not included in the international report (Schulz, 2004).
Attitudes towards the rights of immigrants This construct reflects students’ beliefs about rights for immigrants and it relates to Content Domain 2 (civic principles). The IEA CIVED study measured this construct with eight items, five of them were included in a scale reflecting attitudes toward immigrants (Torney-Purta et. al., 2001; Schulz, 2004). ICCS includes a slightly modified version of the same five items used for scaling together with three additional items.
Attitudes towards policies to avert threats to democracy This construct reflects students’ beliefs about what should be done against groups that pose a threat to democratic society. In the IEA CIVED study, four items were included asking about tolerance towards anti-democratic groups, The items formed a scale but were not reported in the international report (Torney-Purta et. al, 2001; Schulz, 2004).
ICCS includes six items measuring students’ endorsement of measures taken against groups or individuals that pose a threat to democracy or society. The construct relates primarily to Content Domain 2 (civic principles).
Students' attitudes towards institutions The following constructs reflect students’ attitudes towards institutions and are deemed important for civic and citizenship education.
Trust in institutions This construct reflects students’ feelings of trust in a variety of state and civic institutions in society The first IEA Civic Education Study included one item on trust in government (Torney, Oppenheim and Farnen, 1975). CIVED used a set of 12 items covering political/civic institutions, media, United Nations, schools and people in general. ICCS uses a similar range of 10 core items in modified format together with three optional items on supra-national and state/provincial institutions. The construct relates mainly to Content Domain 1 (civic society and systems).

7
Responsiveness of the political system (political external efficacy) This construct reflects students’ beliefs about the responsiveness of the political system and the ability of citizens to influence it. There is some evidence that (among adults) political external efficacy is more likely to be influenced by experiences with political participation than internal efficacy (Finkel, 1985) and that it is positively correlated with trust in government (Niemi, Craig and Mattei, 1991).
The IEA CIVED study included six items measuring this construct (Schulz and Sibberns, 2004). ICCS uses four of these items together with two additional items. The construct relates to Content Domain 1 (civic society and systems). However, some items also contain aspects of Content Domain 3 (civic participation).
Confidence in student participation at school This construct reflects students’ beliefs regarding the usefulness of becoming actively involved at school. Adolescent are generally not able to vote or run for office in "adult politics" but they experiment as students to what extent they have the power to influence the ways schools are run (Bandura, 1997, p. 491). The IEA CIVED study included seven items asking about students’ perceptions of influence at school, four of them were about general confidence in school participation (Torney-Purta et. al., 2001).
ICCS uses a set of four (partly modified) CIVED items and three additional items reflecting student attitudes toward student participation at school. The construct relates to Content Domain 3 (civic participation).
Attitudes towards one’s nation This construct reflects students’ attitudes towards abstract concepts of nation. One can distinguish different forms of national attachment (symbolic, constructive, uncritical patriotism or nationalism), which are different from feelings of national identity (Huddy and Khatib, 2007).
The IEA CIVED survey included 12 items reflecting attitudes toward the students’ country. Four of these items were used to measure Positive Attitudes toward One’s Nation (Torney-Purta et. al., 2001). ICCS uses a set of eight items (four of them from CIVED) measuring students’ attitudes toward the country they live covering both symbolic and uncritical patriotism. The construct relates mainly to Content Domain 4 (civic identities).
Satisfaction with country’s achievements This construct reflects students’ attitudes towards certain aspects of their country’s society. It is related to the measurement of national pride (Huddy and Khatib, 2007) but avoids the use of the term “pride” and focuses rather on satisfaction with different aspects of students’ country. In ICCS the construct is measured with 10 item and it relates primarily to Content Domain 4 (civic identities).
Affective-behavioural Domain 3: Behavioural Intentions One important aspect in the measurement of behavioural intentions in the area of civics and citizenship is certainly political participation. It can be defined as an "activity that has the intent or effect of influencing government action – either directly by affecting the making of implementation of public policy or indirectly by

8
influencing the selection of people who make those policies" (Verba, Schlozman, & Brady, 1995, p. 38).
During the Seventies and Eighties, protest behaviour as a form of participation has become more prominent in Western democracies (Barnes, Kaase et. al., 1979). Scholars have distinguished "conventional" (voting, running for office) from "unconventional (social movement)" activities (grass-root campaigns, protest activities) and among the latter legal from illegal forms of behaviour (Kaase, 1990).
Verba, Schlozman and Brady (1995) identify the following three factors as predictors of political participation: (i) Resources enabling individuals to participate (time, knowledge), (ii) psychological engagement (interest, efficacy) and (iii) "recruitment networks" which help to bring individuals into politics (like social movements, church groups or parties).
The IEA CIVED study included 12 items measuring expected participation (voting, active conventional, unconventional and protest). ICCS developed a broader set of items covering a wider range of behavioural intentions, that are related to the following constructs or sets of constructs.
Preparedness to participate in forms of civic protest This set of constructs reflects students’ beliefs about future involvement in protest activities (for example, signing petitions, participating in protest marches, blocking traffic). It relates to Content Domain 3 (civic participation). The items relate to two different dimensions of protest behaviour, legal and illegal protest forms.
Behavioural intentions regarding future political participation as adults This set of constructs (voting-related participation, political activities) was measured in CIVED and reflects students’ beliefs about future political participation as an adult (for example, voting in elections, active campaigning, joining a party, becoming a candidate). It relates mainly to Content Domain 3 (civic participation).
Behavioural intentions regarding future participation This construct, measured in CIVED, reflects students’ beliefs about their future participation in citizenship activities (for example, volunteer work, opinion leadership, writing letters to newspapers). It relates mainly to Content Domain 3 (civic participation).
Affective-behavioural Domain 4: Behaviours Civic-related behaviour is limited for 14-year-old students, and many activities for citizens are not available at this age. However, several civic-related behaviours can occur among 14-year-olds, and the aim is to capture these through the student background questionnaire.
The IEA CIVED study used a wide range of participation forms both inside and outside of school. Reported student participation in a school council or student parliament turned out to be a positive predictor of civic knowledge and engagement (see Torney-Purta et. al., 2001; Amadeo et. al., 2003). Participation in political youth organization had a positive effect on feelings of political efficacy (Schulz 2005). Using NAEP data, Niemi and Junn (1998) found that participation in role-playing elections or mock trials was positively related to civic knowledge.

9
The ICCS student questionnaire collects data both on the involvement in civic-related participation in the community and in civic-related activities at school.
Involvement in civic-related participation in the community Student are asked about current or past participation in organizations like human-rights groups, religious associations or youth clubs. The underlying construct relates mainly to Content Domain 3 (civic participation) but is also a relevant contextual variable described in the contextual framework.
Involvement in civic-related activities at school The ICCS student questionnaire includes questions about a wide range of civic-related participation at school (for example, in school council/parliament, school newspaper groups, student debates), The underlying construct relates primarily to Content Domain 3 (civic participation) and is also relevant as a contextual variable described in the contextual framework.
Measuring Student Background Variables
Measuring the Context of Schools and Classrooms The field trial student background questionnaire includes questions regarding the following context of schools and classroom with regard to classroom climate for civic and citizenship education at school, students’ sense of belonging to school and perceptions about students’ influence on decision-making at school.
Classroom climate for civic and citizenship education at school The IEA CIVED study included a set of items measuring students’ perceptions of what happened in their civic education classes. Six items were used to measure an index of open climate for classroom discussion (see Schulz, 2004) that was a positive predictor of civic knowledge and students’ expectations to vote as an adult (Torney-Purta et. al, 2001). The ICCS student questionnaire includes a similar instrument that measures students’ perceptions of what happens in the classroom when discussing political and social issues.
Perceptions about students’ influence on decision-making at school Some scholars argue that more democratic forms of school governance are able to contribute to higher levels of student engagement in school (see for example Mosher, Kenny and Garrod, 1994, p. 83). However, student perceptions of direct influence on school or classroom matters have to be negatively associated with civic knowledge in a recent Swedish study (Almgren, 2006). ICCS includes a set of items asking about the extent to which students think they have direct influence on different types of school matters.
Student perceptions of school climate School climate is widely regarded as an important factor in explaining student learning outcomes. Scheerens and Bosker (1997, pp. 112ff) view school climate as a synonym of school culture that involves a range of variables such as student engagement, absenteeism, student conduct and behaviour, staff motivation, and the relationship between students, teachers and school. Homana, Barber and Torney-Purta

10
(2005) emphasise the importance of a positive school climate for engaging students in civic-related learning experiences.
The ICCS student questionnaire includes two sets of items measuring students’ sense of belonging to school and students’ perceptions of student-teacher relations at school. International research has shown that student’s sense of belonging to school is considerably lower among students from immigrant background and families with low socio-economic status (Willms, 2003).
The Context of the Home Environment The home and family contexts and characteristics that may influence the development of young people’s knowledge, competencies, and beliefs in the context of civics and citizenship are considerable. They include peer-group interactions, educational resources in the home, culture, religion, values, language use, the relationship status the young person has within the family, parental education, incomes and employment levels, access to different kinds of media, the quality of the school–home connections, and the wide range of civic-related opportunities out of school the young person can exercise. With all of these, family background can influence certain behaviours, attitudes, and beliefs.
Research has often emphasised the role of family background for developing positive attitudes towards engagement and participation of young people (see for example Renshon, 1975). However, the school as a competing agent of home background has sometimes been seen as even more influential (see Hess and Torney, 1968). But there that family background is generally regarded as an influential variable in the political development of adolescents. The role of socio-economic background can be seen as influential in (i) providing a more stimulating environment as well as in (ii) enhancing the educational attainment and future prospects of adolescents, which in turn enhance political involvement as an individual resource.
Recent studies of political socialization and participation have emphasized the importance of the access of families and individuals to different forms of capital. Bourdieu (1986) sees economic capital as the sources of other forms of capital and distinguishes between human, cultural and social capital. Whereas human capital refers to skills, knowledge and qualifications of an individual, Cultural capital is seen as those ‘widely shared, high-status cultural signals (attitudes, preferences, formal knowledge, behaviours) used for social and cultural exclusion’ (Lamont and Lareau, 1988, p. 156). Social capital is conceptualized as a societal resource that links citizens to each other to achieve goals more effectively (see Stolle with Lewis, 2002).
In his study of institutional performance in Italy, Putnam (1993, p. 185) sees social capital as the “key to making democracy work”. His conceptual view builds on Coleman’s (1988) concept of social capital that is generated by the relational structure of interactions inside and outside the family and which facilitates the success of an individual’s actions and also their learning outcomes.2 According to Putnam (1993) three components of social capital (social trust, social norms and social networks) form a “virtuous cycle” that provides a context for successful cooperation and participation in a society. 2 Putnam’s view of social capital, however, is narrower and more specific than Coleman’s concept. Putnam sees social capital as a collective resource and states that horizontal interactions tend to foster trust and participation whereas vertical relationships lead to distrust and disengagement (Stolle with Lewis, 2002).

11
Social capital research has used a varying range of different factors including socio-economic status, personal networks, memberships in organizations, interpersonal trust and personal communication (media, discussions). Consequently, the concept of social capital has often been criticized for its lack of clarity and problems with finding suitable indicators (Woolcock, 2001).
In the context of ICCS the concept of social capital is viewed as helpful to describe mechanisms to explain why some students’ have higher levels of civic knowledge and engagement than others. Measures of different aspects of social capital (trust, norms and social interaction) include attitudinal and background variables. Some variables reflecting social capital are related to the home environment, in particular interactions with parents, peers and media. Other variables relevant in this context are measures of interpersonal trust and voluntary participation in civic-related organizations (see Civics and Citizenship Framework).
Variables related to the home environment that are antecedents of student learning and development and are measured through the student background questionnaire include (1) parental socio-economic status, (2) cultural and ethnic background and (3) family composition. The student background questionnaire will also collect data on process-related variables that reflect social interactions outside of school (for example through discussions of political and social issues with parents and peers as well as media information).
Parental socio-economic status Socio-economic status (SES) is widely regarded as an important explanatory factor that influences learning outcomes in many different and complex ways (Saha, 1997). There is a relative consensus that socio-economic status is represented by income, education and occupation (Gottfried, 1985; Hauser, 1994) and that using all three variables is better than using only one (White, 1982). However, there is no agreement among researchers which measures should be used in the analysis (Entwisle and Astone, 1994; Hauser, 1994). In international studies additional caveats are imposed on the validity of background measures and the cross-national comparability of family background measures is an ongoing challenge for researchers in this area (see Buchmann, 2002).
In ICCS, three different types of measures are collected through the student background questionnaire:
• Data on Parental occupation are collected through open-ended student reports on mother’s and father’s jobs and coded accroding the ISCO-88 classification (ILO, 1990) which in turn are scored using the International Socio-economic Index of occupational status (SEI) to obtain socio-economic measures (Ganzeboom, de Graaf and Treiman, 1992).
• Data on parental education are collected through closed questions where educational levels are defined by the ISCED - 97 classification (UNESCO, 1997) and then adapted to the national context.
• Data on household possessions are collected through two questions regarding (1) the existence of a number of international core and country-specific household items and (2) the number of books at home.

12
Cultural/ethnic background International studies have confirmed differences in reading literacy for language and immigrant status (see Elley, 1992; Stanat and Christensen, 2006) but also for mathematics literacy (Mullis et. al. 2000). Students from immigrant families, especially among those who have arrived recently, tend to lack proficiency in the language of instruction and are also often unfamiliar with cultural norms of the dominant culture. Furthermore, ethnic minorities often have a lower socio-economic status, which in turn is highly correlated with learning and engagement but there is also evidence that immigrant status and language do have a unique impact on student literacy (Lehmann, 1996).
In ICCS, the cultural and ethnic family background is measured using the following variables:
• Country of birth (mother, father and student): This information can be used to distinguish “native”, “first-generation” (parents born abroad but student born in country) and “immigrant” (student and parents born abroad) students.
• Language of use at home (language of test versus other languages).
• Student self-reports on ethnicity (this question is optional for countries).
Family composition Family structure represents an important factor of socialisation, which may affect learning outcomes. Research in the United States, for example, has shown that students from single-parent families perform less well than those from two-parent households. This typically has been associated with economic stress and lack of human or social capital in the household (see McLanahan and Sandefur, 1994; Seltzer, 1994). However, the effects of single-parent upbringing on learning outcomes have been generally considered as relatively small (see a review in Marjoribanks, 1997).
In ICCS, family structure is measured by a question regarding the composition of the students’ household (parents, guardians, siblings, relatives or other persons).
Indicators of social interaction Analysis of IEA CIVED data have shown frequencies of political discussions as a positive predictor of both feelings of efficacy and expected participation (see for example Richardson, 2003). Similar results were found in a comparative study of lower and upper secondary students in 15 countries participating in the IEA CIVED study (Schulz, 2005).
One popular explanation for the waning of civil society in the United States is the negative effect of television viewing (Putnam, 2000), which leads to decreasing interest, sense of efficacy, trust and participation (see also Gerbner, 1980; Robinson, 1976). However, research has also shown that media use (in particular for information) is usually positively related to political participation and Norris (2000) concludes from an extensive literature review and own findings from a large-scale study that there is no conclusive evidence for a negative relationship between media use and political participation. The IEA CIVED study showed media information through television news was a positive predictor for civic knowledge and expected participation in elections (Torney-Purta et. al., 2001).

13
It has been suggested that religious affiliation may help to foster political and social engagement (see for example Verba, Schlozman, & Brady, 1995) because religious organizations provide networks for political recruitment and motivation. However, there is also evidence of negative effects of religious affiliation on democratic citizenship that is reflected in lower levels of knowledge and feelings of efficacy among strongly religious people (Scheufele, Nisbet and Brossard, 2003). In the case of young people religious affiliation and participation can be seen as part of the home environment that may influence process of civic-related learning.
The following variables reflect interactions of students in the context of the home environment or peer-group:
• Participation in discussions about political social issues with parents or peers.
• Media information from television, radio, newspapers or the Internet.
• Participation in religious services (optional).
The Context of the Individual Student Individual students’ development of understandings, competencies, and dispositions can be influenced by a number of characteristics, some of which link to family background. Antecedents at this level will be collected through the student background questionnaire and include the student characteristics age, gender and expected educational qualifications. In addition, the student questionnaire collects data one process-related individual activities like participation in civic-related organizations in the community.
Age Research has found that during adolescence civic knowledge and (at least some forms of) engagement increase with age (Hess and Torney, 1967; Amadeo et. al., 2002). However, there is also evidence that feelings of trust in the responsiveness of institutions and willingness to engage in conventional forms of active political participation decrease toward the end of secondary school (Schulz, 2005).
In cross-sectional research based on grade sample data age tends to be negatively correlated with student performance in general, in particular in countries with higher rates of grade repetition because the students in the class who are older are typically those who have repeated a grade because of low achievement.
Gender (male, female) The first IEA Civic Education Study in 1971 found considerable gender differences regarding cognitive achievement where males tended to have higher civic knowledge scores (Torney, Oppenheim and Farnen, 1975). The IEA CIVED study, however, showed a different picture: Whereas in some countries males showed (slightly and not significantly) higher average scores, in other countries females were performing better (although only in one country a significant difference was reported). Interestingly, there were somewhat higher gender differences in favour of males in the follow-up study of upper secondary students (Amadeo et. al., 2002).
The IEA CIVED study also showed that gender differences were usually larger with regard to indicators of civic engagement: In most countries males tended to have higher levels of political interest and expected participation. Gender differences were also important with regard to attitudes toward immigrant’s and women’s rights

14
(Torney-Purta et. al, 2001; Amadeo et. al., 2002). Analyses of ICCS will include gender differences for a range of variables related to civic knowledge and engagement.
Expected educational level In the first two IEA studies on civic education expected years of future education were important predictors of civic knowledge (Torney, Oppenheim and Farnen, 1975; Torney-Purta et. al., 2001; Amadeo et. al., 2002). This variable reflects individual aspirations. Furthermore responses may also be influenced by parent or peer expectations or, in some educational systems, by limitations when students are studying in study programs that do not give access to university studies.
A shortcoming of asking about years of further education is the uncertainty students may have about how long it will take to reach certain qualifications (in particular at the tertiary level). Therefore, ICCS includes a modified question that asks about the expected educational qualification. The educational qualifications follow the ISCED qualification (UNESCO, 1997) and are adapted to each country’s educational system.
Out-of-school activities The IEA CIVED study included a few indicators of student activities outside of school. Higher frequencies of students spending time with peers outside their homes turned out to be a negative predictor for civic knowledge (Torney-Purta et. al., 2001). The ICCS student questionnaire includes a set of items regarding student behaviour outside of school like television watching, spending time with peers or reading for enjoyment.
Civic participation The ICCS student questionnaire collects data both on the involvement in civic-related participation in the community and in civic-related activities at school. These variables are described in details as behavioural constructs in the Civics and Citizenship framework (ICCS, 2007).
The ICCS Approach to Field Trial Data Analysis
Analysing cognitive test items
Review of category percentages In the analysis of the cognitive test items, reviewing the percentages of item categories focuses on the following aspects:
• General difficulty of item3 (percentage with correct response for multiple choice items, distribution of percentages across categories for scored response items).
• Appropriateness of categories (roughly equal distribution across distractors in multiple-choice items, frequency of use of all existing scores for scored response items).
• Occurrence of missing data in test items. 3 This ‘general difficulty’ has to be understood with reference to the sample or population that completed each item.

15
There are three possible types of missing responses: (a) omitted items (coded as 9), (b) not administered items (coded as 8) and invalid responses (coded as 7). A separate missing category called “not reached” (coded as 6) was created for analysis purposes: Here, an item is coded as not reached if there was no response to any of the items following it and if the response to the preceding item had been omitted. Review of its occurrence gives information about the appropriateness of test length as well as the appropriateness of test difficulty.
Classical item statistics The review of classical item statistics is a helpful first step in the analysis of test items and usually also included in most IRT software programs. The following statistics provide information on scaling properties:
• Point biserial correlations: The correlation (Pearson’s coefficient) of the correct response category or the overall score with the total raw score provides an indication of how well the item measures the underlying ability. For multiple-choice items, distractors (incorrect responses), invalid or omitted responses are expected to be negatively correlated with overall score. This information will be included by the item statistics that are provided by the IEA DPC.
• Test reliability: Coefficients measuring the internal consistency of a test will provide information about how well the underlying latent trait is measured. Cronbach’s alpha will be reported as the best known measure of test reliability.
IRT Scaling Analysis Scaling test items with the IRT one-parameter model (Rasch 1960) provides the following criteria for assessing the scaling properties of each item:
• Item fit statistics: The weighted mean square statistic indicates to what extent the observed data fit the scaling model. Items with very high or very low fit statistics will be flagged for revision or non-inclusion.
• Item Characteristic Curves: Plots of expected and observed will provide further evidence on the fit of each item to the scaling model.
• Average ability scores per category: For multiple-choice items it should be expected that ability scores are higher for students who selected the correct response and lower for those who selected incorrect responses or omitted the item. For scored items the average ability within each category should always be higher than in the adjacent lower category.
The ACER ConQuest program (Wu, Adams, Wilson and Haldane, 2007) is used for IRT scaling analysis. This software uses the One-parameter IRT model and provides different types of ability estimates including plausible values.
Figure 1 shows the example of an item statistics for a multiple-choice item used in the ICCS field trial, which combines classical and IRT item statistics. In this example, the item has a good discrimination (0.40 correlation of the correct response with the overall score) and a good item fit of 0.98 (indices close to 1.0 indicate satisfactory item fit to the IRT scaling model). The incorrect responses are negatively correlated

16
with the overall score and the average student abilities (PV1Avg) are low for the incorrect and high for the correct response.
Figure 1 Example item statistic for cognitive test item (multiple-choice format) Item 2
------
item:2 (CI104M1)
Cases for this item 8855 Discrimination 0.40
Item Threshold(s): -0.17 Weighted MNSQ 0.98
Item Delta(s): -0.17
------------------------------------------------------------------------------
Label Score Count % of tot Pt Bis t (p) PV1Avg:1 PV1 SD:1
------------------------------------------------------------------------------
1 0.00 1033 11.67 -0.26 -25.36(.000) -0.41 0.63
2 0.00 1951 22.03 -0.16 -15.32(.000) -0.11 0.70
3 0.00 898 10.14 -0.13 -12.62(.000) -0.17 0.76
4 1.00 4873 55.03 0.40 41.52(.000) 0.40 0.76
7 0.00 37 0.42 -0.09 -8.37(.000) -0.96 1.22
9 0.00 63 0.71 -0.06 -5.45(.000) -0.38 0.70
=============================================================
In addition, item category characteristic curves can be reviewed, which indicate to what extent the correct responses and incorrect responses adjust to the scaling model. Figure 12 shows the category characteristic curves for the same test item. All three incorrect responses as well as omitted responses become less likely with higher ability estimates, whereas the average correct responses follow the line predicted by the IRT scaling model.
Figure 2 Example of Category Characteristic Curve for cognitive item 2
Cognitive items are reviewed for Differential Item Functioning (DIF), that is the extent to which items behave differently in different sub-groups (like gender). For the
17
selection of material of test items for the main survey, occurrence of gender DIF is one criterion for item selection by giving preference to those items with less DIF.
An additional source of information about the occurrence of gender DIF is obtained through Item Characteristic Curves (ICC) where observed percentages of correct responses within ability groups are plotted separately for each gender group.
It is important that the IRT measurement model is comparable across countries. Items which show item-by-country interaction, which means that they are relatively much harder in some countries but much easier in others, are generally not suitable for the scaling of cognitive items in international surveys. Figure 3 shows an example of how the extent of item-by-country interaction can be reviewed.
Figure 3 Example of Plot with Item-by-country Interaction
TWN
SWE
SVN
SVK
PRY
POL
NZL
NOR
NLD
MLT
MEX
LVA
LUX
LTU
ITA
IRL
GTM
GRC
FIN
EST
ESP
ENG
DOM
DNK
COL
CHL
CHE
BGR
BFL
COUNTRY
3.000
2.000
1.000
0.000
-1.000
-2.000
-3.000
The bars show the item parameters for an item as estimated for each country with their respective standard errors. The horizontal line shows the international item parameter which is used for scaling. Bars which are above or below the line indicate the occurrence of item-by-country interaction in a country. Reviews of item-by-country interaction with field trial data inform item selection and preference will be given to those items that have less item-by-country interaction. However, it needs to be recognised that for most items there will always be a certain amount of item-by-country interaction and that total parameter invariance cannot be expected given the difference in cultures and languages that are included in this international study.
Review of Trend Items The CIVED items included in the test will be reviewed regarding their relative item difficulty in the field trial compared to the one obtained in the 1999 CIVED survey. Item parameters from separate calibrations are compared for each item to inform the process of selection of link items.

18
Only those link items with similar relative item difficulty in CIVED and ICCS should be included in the main study and be used for the equating of test scores.
Analysis of Coder Reliability About 10 percent of the ICCS test consists of open-ended response items that require judgements about students’ performances to be made by trained coders. The use of open-ended response items and their subsequent coding includes the possibility of variation between different coders in the scoring of identical student responses.
Establishing and maintaining the credibility of this study will depend crucially upon our ability to monitor, accommodate and minimise variation between coders both within and between countries.
In the Field Trial we will be collecting data to inform us about the inter-coder variation. These data will be used to:
• inform the development of scoring rubrics;
• inform the translation verification of scoring rubrics; and
• examine the extent of between-country differences in coders.
Field Trial Analysis of Questionnaire Data
Review of category percentages To address the question whether questionnaire length is appropriate and whether there are items with larger proportions of omitted responses, missing patterns will be checked systematically internationally and within countries.
Review of percentages across categories will be computed by the IEA DPC and will provide information about the possible skew of items. For example, certain Likert-type items may attract an overwhelming majority of agreeing responses and hardly any disagreement. This may be due to social desirability or to a “common sense nature” of an item with which it is hard to disagree. In principle, preference should be given to items that have sufficient percentages in each category.
For some items, it is envisaged to include different item formats in different questionnaire booklets which are randomly allocated to students. Item frequencies and relationships with other variables will be checked systematically to compare the effects of item format on item responses.
Analysis of item dimensionality To check the feasibility of reporting scales for the questionnaire data, and to check whether these constructs are distinct from one another, the following analyses using Structural Equation Modelling (see Appendix B) are envisaged :
• Exploratory Factor Analyses (EFA) is used to determine the number of factors underlying relevant subsets of student and school questionnaire items. The number of factors is specified a priori based on theoretical expectations. In view of the categorical nature of item responses, weighed least squares estimation will be used, which accounts for the categorical nature of the item responses by estimating the polychoric correlation matrix as well as the asymptotic covariance matrix of the polychoric correlation matrix.

19
• Confirmatory Factor Analyses (CFA) will be utilized to test rigorous hypotheses regarding the simple factor structure underlying the student and school questionnaires. CFA will provide specific tests of hypotheses regarding overall model fit, significance of factor loading parameters, and correlations between latent factors. A variety of fit indices will be explored, but the main measure of model fit will be on the root mean square error of approximation (RMSEA; see Browne and Cudeck, 1993; Steiger, 1990; Steiger and Lind, 1980). If the results of the CFA suggest the need to modify the model to obtain a more reasonable fit to the data, the expected cross-validation index can be used as a means of gauging whether the modifications are substantively important or simply capitalize on chance features of the data.
• Multiple-group analysis: To test parameter invariance, it is possible to use multiple-group modelling, which is an extension of standard structural equation modelling (SEM). Multiple-group modelling can be undertaken by placing different equality constraints on parameters in multiple-group models and comparing model fit indices across different multiple-group models with increasing constraints starting with a totally unconstrained model (see Schulz 2006; Little 1997).
Fit indices measure the extent to which a model based on the a-priori structure as postulated by the researcher “fits the data”. In the ICCS field trial analysis, model fit is assessed using the Root-Mean Square Error of Approximation (RMSEA), the Root Mean Square Residual (RMR), the Comparative Fit Index (CFI) and the Non-normed Fit Index (NNFI) (see Bollen and Long, 1993). RMSEA values over 0.10 are usually interpreted as a sign of unacceptable model fit whereas values below 0.05 indicate a close model fit. RMR values should be less than 0.05. Both CFI and NNFI are bound between 0 and 1 and values between 0.90 and 0.95 indicate an acceptable model fit, with values greater than 0.95 indicating a close model fit.
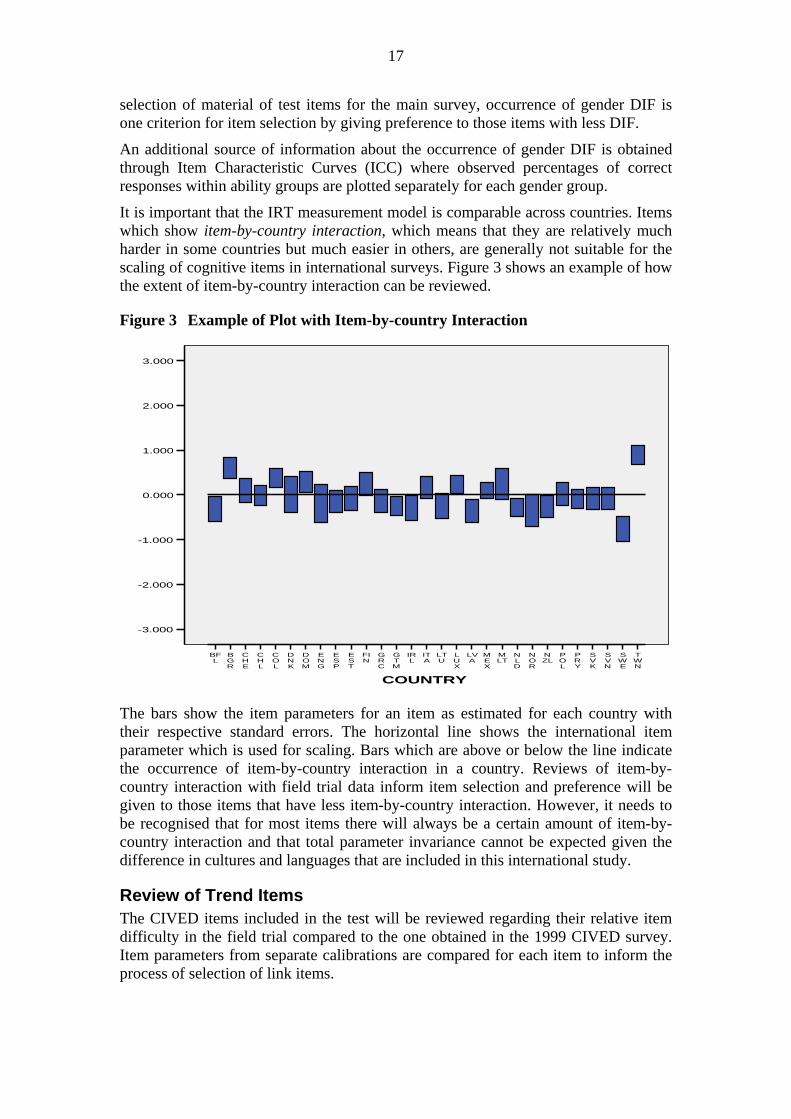
Figure 4 shows a path diagram for a confirmatory factor analysis of items measuring expected political participation in the future. The first three items reflect expectations to participate in activities related to elections (voting in local and national elections, getting information about candidates before voting), the next four items reflect expected active participation (in a campaign, a political party, a trade union or as a candidate) and the last five items reflect informal participation (talking to other about political and social issues, trying to get friends to agree with political opinions, writing to a newspaper, contributing to on-line discussion forums, joining an organisation for a cause).
A three-factor model is assumed with Expected Electoral Participation (VOTEPART), Expected Political Participation (POLPART) and Expected Informal Participation (INFPART) as dimensions. These (preliminary) results support the expected dimensional structure: The model fit indices (RMSEA = 0.071, RMR = 0.045, CFI = 0.95, NNFI = 0.94) indicate a satisfactory model fit. Whereas the latent correlations of VOTEPART with the other two dimensions are only moderate, there is a fairly high correlation between POLPART and VOTEPART. Table 1 shows the model fit for the three-factor model across countries participating in the ICCS field trial. In most countries the model fit is satisfactory.
20
Figure 4 Example of path diagram for confirmatory factor analysis of items measuring expected participation in the future
VOTEPART1.00
POLPART1.00
INFPART1.00
I03A 0.26
I03B 0.25
I03C 0.59
I03D 0.59
I03E 0.33
I03F 0.46
I03G 0.46
I04C 0.54
I04D 0.55
I04E 0.40
I04F 0.45
I04G 0.46
Chi-Square=2661.86, df=51, P-value=0.00000, RMSEA=0.071
0.86
0.87
0.64
0.64
0.82
0.73
0.74
0.68
0.67
0.77
0.74
0.73
0.43
0.39
0.69

21
Table 1 Example of CFA model fits results across countries
Fit indices Correlations between latent variables
COUNTRY RMSEA RMR CFI NNFI VOTEPART/
POLPART VOTEPART/
INFPART POLPART/ INFPART
CNT1 0.118 0.079 0.88 0.88 0.33 0.28 0.63 CNT2 0.077 0.060 0.94 0.94 0.41 0.41 0.65 CNT3 0.099 0.053 0.90 0.90 0.45 0.44 0.59 CNT4 0.079 0.059 0.95 0.95 0.48 0.39 0.68 CNT5 0.065 0.039 0.96 0.96 0.45 0.23 0.69 CNT6 0.081 0.048 0.93 0.93 0.45 0.43 0.74 CNT7 0.070 0.071 0.95 0.95 0.61 0.49 0.81 CNT8 0.114 0.064 0.90 0.90 0.50 0.53 0.64 CNT9 0.077 0.057 0.95 0.95 0.47 0.42 0.78 CNT10 0.085 0.040 0.91 0.92 0.37 0.21 0.49 CNT11 0.076 0.031 0.94 0.94 0.41 0.32 0.53 CNT12 0.067 0.059 0.93 0.93 0.30 0.28 0.55 CNT13 0.098 0.067 0.92 0.92 0.33 0.50 0.73 CNT14 0.083 0.053 0.92 0.92 0.37 0.39 0.70 CNT15 0.084 0.057 0.93 0.93 0.30 0.25 0.64 CNT16 0.070 0.040 0.96 0.96 0.71 0.50 0.74 CNT17 0.063 0.036 0.95 0.95 0.40 0.32 0.69 CNT18 0.055 0.043 0.97 0.97 0.29 0.32 0.72 CNT19 0.092 0.073 0.90 0.90 0.27 0.21 0.64 CNT20 0.104 0.064 0.90 0.90 0.41 0.41 0.62 CNT21 0.112 0.067 0.92 0.93 0.25 0.32 0.80 CNT22 0.107 0.053 0.91 0.91 0.41 0.48 0.55 CNT23 0.094 0.068 0.91 0.91 0.42 0.25 0.57 CNT24 0.060 0.046 0.96 0.96 0.54 0.26 0.72 CNT25 0.070 0.044 0.94 0.94 0.33 0.37 0.63 CNT26 0.090 0.055 0.92 0.92 0.31 0.38 0.57 CNT27 0.087 0.043 0.94 0.94 0.48 0.41 0.68 CNT28 0.082 0.039 0.94 0.94 0.40 0.40 0.63
Classical Item Statistics The following classical item statistics are computed for the pooled dataset and separately for each country:
• Item-total correlations: Pearson’s correlations between each item and the (corrected) overall raw score are particularly useful to review translation errors. For example, a negative correlation with the overall score may indicate that a negatively phrased item (“Students of my age are too young to have a say in school matters “) was translated as a positive one (“Students of my age have a say in school matters “).
• Scale reliabilities (Cronbach’s alpha). This coefficient gives an estimate of the internal consistency of each scale. Values over 0.7 indicate a satisfactory reliability, values over 0.8 an excellent reliability. However, it should be noted that the coefficient is influenced by the number of items included in the scale.
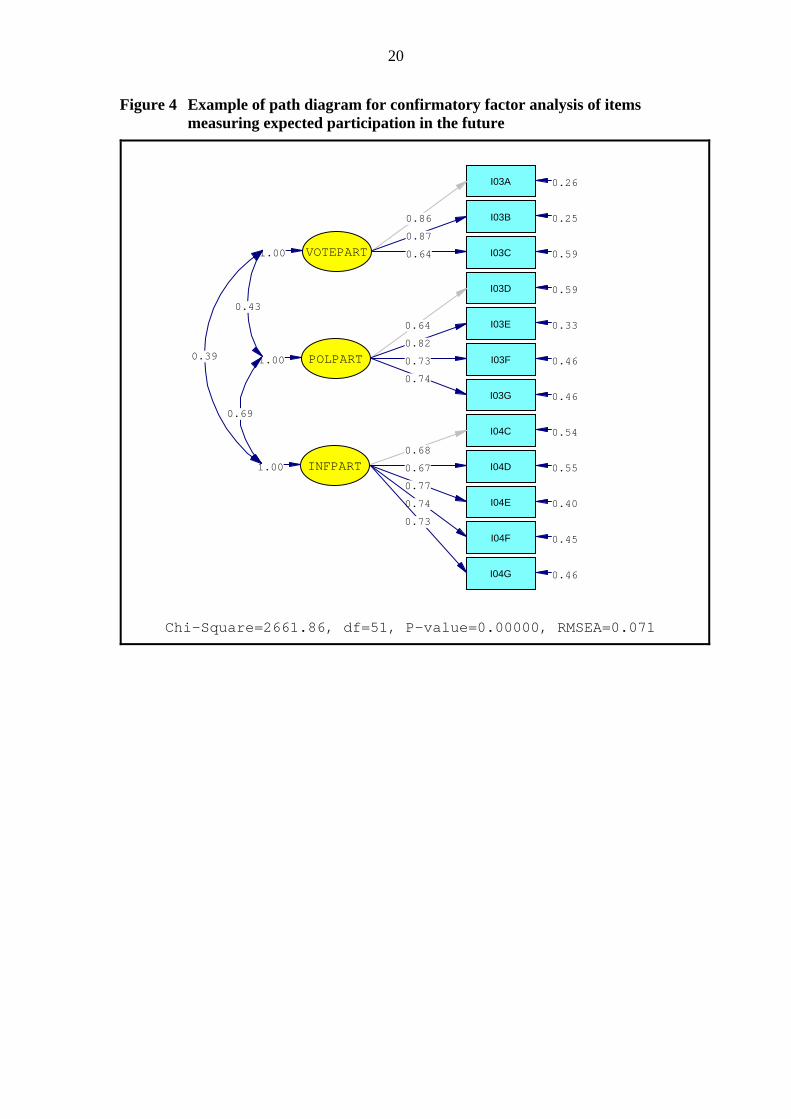
Table 2 shows an example of classical item statistics for three items measuring students' expected participation in activities related to elections. For each participating
22
country, the scale reliability (Cronbach's alpha), the number of items, the corrected item-score correlations, the number of cases, the percentage of missing responses, the mean of the raw scale (taking the average of all items) and the correlation of the raw score with the student performance in the test of civic knowledge is printed.
For the items measuring expected electoral participation (VOTEPART) the scale reliabilities is highly satisfactory and item-total correlations indicate a high degree of consistency across countries. There are less than 2 percent of missing values for all three items in most of the countries, only in one country there appear to be a considerable proportion of students with no responses. In most countries there is a positive correlation between expected electoral participation in civic knowledge as measured by the international cognitive test.
Table 2 Classical item statistics for items measuring expected participation in activities related to elections (ICCS field trial 2007)
Country Alpha Items ISRI03A ISRI03B ISRI03C Valid
N %
miss SCALE
mean COR_TEST CNT1 .727 3 .671 .654 .352 351.0 .85 1.82 .319CNT2 .790 3 .687 .688 .529 418.0 1.65 2.10 .241CNT3 .849 3 .736 .784 .639 339.0 2.87 2.17 .323CNT4 .893 3 .800 .850 .724 482.0 1.43 2.00 .096CNT5 .763 3 .611 .651 .524 516.0 3.37 2.40 .183CNT6 .853 3 .776 .768 .641 158.0 2.47 2.18 .459CNT7 .704 3 .576 .594 .409 301.0 22.62 2.14 -.015CNT8 .861 3 .779 .798 .638 121.0 .82 1.91 .229CNT9 .862 3 .776 .824 .625 406.0 1.69 2.11 .208CNT10 .764 3 .652 .685 .466 335.0 .30 2.04 .281CNT11 .804 3 .658 .726 .573 415.0 .48 2.16 .237CNT12 .771 3 .685 .674 .479 402.0 .50 2.29 .390CNT13 .779 3 .673 .689 .505 361.0 1.63 2.18 .410CNT14 .792 3 .672 .679 .567 395.0 .75 2.38 .479CNT15 .774 3 .719 .673 .461 351.0 .85 2.20 .119CNT16 .817 3 .697 .712 .601 542.0 4.58 1.78 .279CNT17 .827 3 .708 .719 .629 369.0 1.34 2.13 .291CNT18 .755 3 .632 .648 .482 574.0 5.12 2.36 .262CNT19 .725 3 .597 .676 .399 190.0 2.06 1.89 .318CNT20 .870 3 .773 .796 .687 589.0 2.97 1.89 .357CNT21 .879 3 .814 .866 .633 182.0 3.19 2.31 .340CNT22 .858 3 .776 .798 .633 448.0 2.40 1.97 .397CNT23 .788 3 .690 .730 .486 369.0 .27 2.15 .272CNT24 .809 3 .695 .695 .590 352.0 5.88 2.37 .192CNT25 .788 3 .677 .693 .526 417.0 .48 1.89 .370CNT26 .842 3 .745 .780 .602 403.0 1.47 2.16 .337CNT27 .874 3 .776 .829 .676 405.0 1.46 2.08 .486CNT28 .873 3 .832 .793 .654 553.0 .90 2.05 .344
IRT Scaling of Questionnaire Items For each scale IRT models are estimated to check scaling characteristics and to review the appropriateness of using this scaling technique. Likert-type items are scaled using the IRT Partial Credit Model (see Masters and Wright, 1997).

23
Item statistics address the issue of item fit: Item statistics including frequencies, point biserial correlations, item discrimination and the distribution of latent estimates across categories. Item statistics are computed using the ACER ConQuest software. Figure 5 shows the item statistics for item IS2I03A measuring expected electoral participation (VOTEPART). The item has a good discrimination of 0.88 and an satisfactory fit statistic (Weighted MNSQ = 0.93); indices close to 1.0 indicate a good item fit to the Partial Credit Model.
Figure 5 Example of item statistics for item IS2I03A Item 1
------
item:1 (IS2I03A)
Cases for this item 10861 Discrimination 0.88
Item Threshold(s): -1.80 -0.54 1.84 Weighted MNSQ 0.93
Item Delta(s): -1.49 -0.77 1.76
------------------------------------------------------------------------------
Label Score Count % of tot Pt Bis t (p) PV1Avg:1 PV1 SD:1
------------------------------------------------------------------------------
0 0.00 810 7.46 -0.62 -81.90(.000) -2.10 1.55
1 1.00 1238 11.40 -0.40 -45.40(.000) -0.33 1.02
2 2.00 3928 36.17 -0.12 -12.44(.000) 1.04 1.09
3 3.00 4885 44.98 0.70 101.00(.000) 3.05 1.59
==============================================================================
In addition, Category Characteristic Curves (ICC) can be used for examining item fit. Figure 6 shows observed and expected category characteristic curves for an ICCS item. If the model fits the data, the observed curves should follow closely those predicted by the Partial Credit Model.
Figure 6 Example of Category Characteristic Curves for item IS2I03A

24
For the main study, Weighted Likelihood Estimates (Warm 1989) will be used as individual scale scores for questionnaire constructs. Using IRT scaling enables researchers to review the scaling properties of categorical items and also provides an elegant way of dealing with missing responses.
Analysis of Relationships between Variables To inform the selection of questionnaire items and scales, it will be useful to analyse the relationship between variables and the predictive validity of constructs. The assessment framework will provide guidance for this part of the analyses.
In principle, three analytic tools will be used for the analysis of relationships between variables (including both test and questionnaire scales and variables):
• Review of correlations between variables. Pearson’s correlation coefficient with the test score will be routinely reported for each scale (by country).
• Multiple regression models both at the international and national level (for example with the cognitive scale as the criterion and questionnaire scales and single items as predictors).
One example of this kind of analysis is the review of socio-economic background variables collected through the student background questionnaire. The following variables are included in the field trial data:
• Highest parental occupational status (HISEI): Open-ended responses of students about each parent's occupation were coded according to the ISCO-88 classification and then converted into occupational status scores (SEI). The maximum of both parents’ SEI scores provides the HISEI score.
• Highest parental education (HISCED): Educational level of students' mother and father were collected by mapping national educational levels to the international ISCED classification. The highest of both parents' ISCED levels provides the HISCED score.
• Index of family wealth (WEALTH): Students were asked about the existence of household possessions at home, five of these were country-specific items designed to take the different socio-economic contexts into account. A summary index of these items provides the WEALTH score.
• Books at home (BOOKS): Students were asked about the number of books at home (in categories).
Table 3 shows the correlation between the socio-economic indicators used in ICCS. Generally, correlations between these indicators are consistently positive across countries. The highest correlations are found between HISEI and HISCED. However, in a number countries the WEALTH scores has only low correlations with HISEI and HISCED. These countries are mostly Northern European countries where household possessions may be accessible for most people and it is difficult to measure family wealth with household items.

25
Table 3 Correlations between socio-economic background variables across participating countries
HISEI with HISCED with WEALTH
with HISCED WEALTH BOOKS WEALTH BOOKS BOOKS CNT1 0.46 0.24 0.25 0.28 0.29 0.23 CNT2 0.62 0.40 0.50 0.41 0.49 0.36 CNT3 0.59 0.28 0.41 0.26 0.40 0.30 CNT4 0.59 0.48 0.32 0.52 0.37 0.37 CNT5 0.55 0.42 0.31 0.43 0.35 0.43 CNT6 0.41 0.08 0.24 0.13 0.20 0.02 CNT7 0.47 0.27 0.19 0.26 0.27 0.20 CNT8 0.32 0.26 0.31 0.13 0.17 0.15 CNT9 0.59 0.17 0.42 0.13 0.42 0.09 CNT10 0.46 0.25 0.25 0.25 0.27 0.07 CNT11 0.46 0.16 0.28 0.13 0.23 0.08 CNT12 0.59 0.33 0.38 0.36 0.34 0.22 CNT13 0.60 0.43 0.30 0.44 0.34 0.33 CNT14 0.41 0.30 0.42 0.29 0.36 0.25 CNT15 0.55 0.29 0.41 0.26 0.42 0.24 CNT16 0.55 0.26 0.34 0.32 0.36 0.28 CNT17 0.52 0.21 0.41 0.24 0.41 0.27 CNT18 0.58 0.35 0.16 0.34 0.19 0.12 CNT19 0.56 0.41 0.32 0.43 0.38 0.30 CNT20 0.50 0.32 0.34 0.19 0.31 0.31 CNT21 0.33 0.23 0.27 0.24 0.30 0.33 CNT22 0.25 0.07 0.31 0.04 0.25 0.21 CNT23 0.38 0.31 0.26 0.28 0.34 0.26 CNT24 0.62 0.36 0.33 0.43 0.36 0.37 CNT25 0.51 0.35 0.41 0.30 0.45 0.32 CNT26 0.54 0.38 0.33 0.36 0.31 0.26 CNT27 0.53 0.30 0.29 0.34 0.35 0.28 CNT28 0.37 0.19 0.28 0.17 0.26 0.34 CNT29 0.53 0.32 0.32 0.26 0.34 0.36 Median 0.53 0.30 0.32 0.28 0.34 0.27
The measurement of socio-economic family background still needs to be explored further, in particular with regard to the computation of composite indices for SES. Different composite indices will be compared with regard to their relationship with other variables.
Another example of more content-related analyses is to estimate tentative regression models to explain civic knowledge and engagement among students. Test performance on the civic knowledge test and expected electoral participation are the criterion variables in these models. Both variables were z-standardised within countries to avoid that between-country variation influences the results of this analysis. The following are predictor variables in the models:
• Gender (female)
• SES: To create a composite, the average of country-specific z-scores for HISEI, HISCED, WEALTH and BOOKS were computed. This index has a mean of 0 and standard deviation of 1 within each country.

26
• Expected education: Students were asked which level of education they expect, the categories were mapped to ISCED classification.
• Parental interest: Students were asked about the level of mother's and father's interest in political and social issues, the variable reflects the average score of both variables.
• Watching TV News: Students reported the frequency of this activity.
• Reading for enjoyment: Students reported the frequency of this activity.
• Hanging out with friends: Students reported the frequency of this activity.
• Participation in school parliament (student self-report).
Civic knowledge test scores were used as an additional predictor for the model explaining expected electoral participation.
Table 4 Regression models for Civic Knowledge and Expected Electoral Participation (preliminary results for pooled field trial sample)
Civic knowledge Expected electoral participation
Unstandardised
coefficients Standardised coefficients
Unstandardised coefficients
Standardised coefficients
Constant -0.77 -0.96 Gender (female) 0.17 0.09 0.01 0.00 SES 0.32 0.24 0.06 0.04 Expected education 0.20 0.21 0.07 0.07 Parental interest 0.05 0.03 0.28 0.20 Watching TV news 0.05 0.06 0.09 0.10 Reading for enjoyment 0.08 0.09 0.04 0.05 Hanging out with friends -0.07 -0.10 -0.01 -0.02 Participated in school parliament 0.13 0.07 0.11 0.05 Civic knowledge (test scores) * * 0.21 0.18 R Squared 0.20 0.15
* Dependent variables were z-standardised within countries.
Table 4 shows the results of this analysis. The models explain 20 percent of the (within-country) variation of test performance and 15 percent of variance in expected electoral participation. Whereas SES and expected education are the most important predictors for test performance, it is interesting that for expected electoral participation (together with civic knowledge) parental interest is the dominant predictor. These preliminary results indicates that parental interest in political and social issues may be an important factor influencing student engagement.
Generally, the findings are similar to those from the CIVED study. However, it can be seen that additional variables (like additional socio-economic background indicators, parental interest and reading for enjoyment) may complement and enrich the potential for analyses. Further analyses like this will also include more detailed reviews of results within countries and also for other important indicators of student engagement.

27
General outcomes and outlook First preliminary results have shown encouraging results for most of the measures included in the international field trial student instruments of ICCS. However, further extensive analyses will be undertaken to provide an empirical basis for the selection of item material for the main survey in 2008/2009.
Regarding the international student test most of the cognitive items have shown satisfactory scaling properties. The IRT reliability estimate for the international test of 0.79 is highly satisfactory. Figure 7 shows that (internationally) there is a good match between item difficulties and student ability distribution.
Figure 7 Match between student abilities and ICCS cognitive test items
------------------------------------------------------------ | | | | | | 2 | | X|57 | XX| | XX| | XX|48 67 | XX|23 | XXX| | XXXX|78 | XXXX|31 45 | 1 XXXX|76 | XXXXXX|17 42 80 97 | XXXXX|12 41 72 | XXXXXX|59 68 73 77 83 | XXXXXXX|61 75 91 98 | XXXXXXXX|8 79 | XXXXXXXX|11 37 60 85 89 90 94 | XXXXXXXXX|14 29 47 | XXXXXXXX|6 53 65 70 84 92 | XXXXXX|22 27 63 81 | 0 XXXXXXX|44 64 88 | XXXXXXX|2 4 7 9 13 32 50 71 93 | XXXXXXXX|15 55 62 96 | XXXXXXXXXX|5 20 25 58 | XXXXXXXX|16 24 26 30 | XXXXXXX|18 43 46 49 51 52 54 82 86 | XXXX|1 21 28 | XXXXX|3 19 34 35 56 66 | XXXXX|40 74 | -1 XXX| | XXX|10 69 | XX|33 36 95 | XX| | X| | X| | X|38 87 | X|39 | | | | | -2 | | | | ============================================================ Each 'X' represents 123.5 cases ============================================================

28
Table 5 Scale reliabilities for ICCS field trial student questionnaire items
Reliabilities across countries
Scale name Scale content N
items Median Minimum Maximum WEALTH Family wealth (home possessions) 12 0.61 0.44 0.78 POLDISC Frequency of political discussions 4 0.70 0.59 0.81 MEDINF Frequency of media information 3 0.51 0.38 0.70 SOCACT Frequency of social activities 4 0.37 -0.04 0.61 PARTCOM Civic participation in the community 8 0.75 0.62 0.85 PARTSCHL Civic participation at school 9 0.62 0.49 0.76 CCLIM Open Classroom Climate 7 0.79 0.65 0.85 STUDPART Student participation in school decisions 6 0.89 0.78 0.92 BELONG Sense of belonging to school 6 0.72 0.55 0.86 STUREL Student-teacher relations 5 0.78 0.68 0.86 CONFS Confidence in school participation 7 0.67 0.50 0.79 DEMVAL Democratic values 9 0.68 0.52 0.79 CTCON Conventional citizenship 13 0.78 0.68 0.86 GTRUST General trust 6 0.65 0.48 0.74 ACCEPT Acceptance of undesirable behaviour 7 0.77 0.70 0.84 INTPOLS Interest in political and social issues 8 0.87 0.77 0.93 SCPOL Self-concept for political participation 7 0.77 0.57 0.86 GENRGHT Attitudes towards gender rights 8 0.79 0.32 0.86 GRPRGHT Attitudes towards ethnic/racial groups 5 0.82 0.64 0.93 IMMRGHT Attitudes towards immigrants 8 0.73 0.40 0.85 AVTHREAT Attitudes towards aversion of threats 6 0.54 0.31 0.68 INTRUST Trust in political institutions 6 0.84 0.76 0.90 ATTCNT Attitudes towards own country 8 0.79 0.63 0.87 RESPPOL Responsiveness of political system 6 0.57 0.00 0.73 ACHCNT Satisfaction with country's achievements 10 0.85 0.76 0.91 CITEFF Citizenship self-efficacy 8 0.82 0.74 0.90 CONVPROT Expected participation: conventional protest 8 0.84 0.78 0.89 ILLPROT Expected participation: illegal protest 3 0.83 0.67 0.91 VOTEPART Expected electoral participation 3 0.81 0.70 0.89 POLPART Expected active political participation 4 0.81 0.68 0.85 INFPART Expected informal political participation 7 0.83 0.75 0.89
Coefficients Cronbach's alpha reliabilities. Coefficients > 0.7 in bold.
First analyses of the questionnaire item material used in the field trial also show promising results. Table 5 contains the reliabilities of student questionnaire scales across participating countries showing the median, minimum and maximum alpha reliability coefficients. Most of the scales have satisfactory internal consistencies, however, some of the constructs (in particular SOCACT, AVTHREAT and RESPOL) are not reliably measured and may not be retained for the main survey.
One of the remaining important steps in the field trial analysis will be a thorough review of measurement equivalence across countries using item response modelling and multiple-group analysis based variance and covariances. The results of the analyses will be discussed with national research centres in order to facilitate the selection process of item material for the main survey.

29
References
Almgren, E. (2006). Att fostra demokrater: Om skolan i demokratin och demokratin i skolan [To educate democracy: Of democracy in school or school in democracy]. University of Uppsala: Dissertation.
Amadeo, J., Torney-Purta, J., Lehmann, R., Husfeldt, V., & Nikolova, R. (2002). Civic knowledge and engagement: An IEA study of upper secondary students in sixteen countries. Amsterdam: International Association for the Evaluation of Educational Achievement (IEA).
Balch, G. I. (1974). Multiple indicators in survey research: The concept “sense of political efficacy.” Political Methodology, 1(2), 1-43.
Bandura, A. (1986). Social foundations of thought and action: A social cognitive theory. Englewood Cliffs, N. J.: Prentice-Hall.
Bandura, A. (1993). Perceived self-efficacy in cognitive development and functioning. Educational Psychologist, 28 (2), 117-148.
Bandura, A. (1997). Self-efficacy: The exercise of control. New York: W.H. Freeman and Company.
Barnes, S. H., Kaase, M. et al. (Eds.), Political action: Mass participation in five Western democracies. Beverly Hills: Sage Publications, pp. 487–521
Bollen, K.A. & Long, S. J. (1993) (Eds.). Testing Structural Equation Models, Newbury Park/London.
Bourdieu, Pierre (1986). The Forms of Capital. In: Richardson, John G. (ed.): Handbook of theory and research for the sociology and education. New York, Greenwood Press, pp. 241-258.
Browne, M.W., & Cudeck, R. (1993). Alternative Ways of Assessing Model Fit. In: K.A. Bollen and S.J. Long (Eds.). Testing Structural Equation Models, Newbury Park/London, 136-162.
Buchmann, C. (2002). Measuring Family Background in International Studies of Education: Conceptual Issues and Methodological Challenges. In: Porter, A. C. & Gamoran, A. (eds.). Methodological Advances in Cross-National Surveys of Educational Achievement (pp. 150-97). Washington, DC: National Academy Press.
Campbell, A., Gurin, G., & Miller, W. E. (1954). The Voter Decides. Evanston, IL: Row, Peterson and Company.

30
Coleman, James S. (1988): Social Capital in the Creation of Human Capital. In: American Journal of Sociology, 94 (supplement), 95-120.
Converse, P. E. (1972). Change in the American Electorate. In A. Campbell & P. E. Converse (Eds.), The Human Meaning of Social Change. New York: Russell Sage Foundation, pp. 263-337
Elley, W. B. (1992). How in the world do students read? The Hague: IEA.
Entwistle, D. R. & Astone, N. M. (1994). Some Practical Guidelines for Measuring Youth’s Race/Ethnicity and Socioeconomic Status. Child Development, 65, 1521-1540.
Finkel, S. E. (1985). Reciprocal effects of participation and political efficacy: A panel analysis. American Journal of Political Science, 29(4), 891-913.
Ganzeboom, H.B.G., de Graaf, P.M., & Treiman, D.J. (1992). A standard international socio-economic index of occupational status. Social Science Research, 21, 1-56.
Gerbner, George (1980). The Mainstreaming of America. Journal of Communication 30, 10-29.
Gottfried, A. W. (1985). Measures of Socioeconomic Status in Child Development Research: Data and Recommendations. Merrill-Palmer Quarterly, 31:1, 85-92.
Hauser, R. M. (1994). Measuring Socioeconomic Status in Studies of Child Development. Child Development, 65, 1541-1545.
Hess, R. D. & Torney, J. (1967). The Development of Political Attitudes in Children. Garden City: Anchor.
Homana, G., Barber, C. and Torney-Purta, J. (2006). Assessing School Citizenship Education Climate: Implications for the Social Studies. Circle Working Paper 48.
Huddy, L. & Khatib, N. (2007). American Patriotism, National Identity and Political Involvement. In: American Political Science Review, 51:1, 63-77.
International Labour Organisation (1990). International Standard Classification of Occupations: ISCO-88. Geneva: International Labour Office.
Jung, J. K. (2008). Growing supranational identities in a globalizing world? A multilevel analysis of the World Values Surveys. European Journal of Political Research (forthcoming).

31
Kaase, M. (1990) Mass participation. In M. K. Jennings, J. W. van Deth et al. (Eds.), Continuities in political action. Berlin, New York: Walter de Gruyter, pp.23–67
Kennedy, K. (2006). Towards a Conceptual Framework for Understanding Active and Passive Citizenship. Unpublished report.
Lamont, M. & Lareau, A. (1988). Cultural capital: allusions, gaps and glissandos in recent theoretical developments. Sociological Theory 6: 153-68.
Lehmann, R. (1996). Reading Literacy Among Immigrant Students in the United States and Former West Germany. In: Binkley, M, Rust, K. & Williams, T. (Eds.). Reading Literacy in an International Perspective. Washington D.C.: NCES.
Little, T. D. (1997). Mean and Covariances Structures (MACS) Analyses of Cross-Cultural Data: Practical and Theoretical Issues. In: Multivariate Behavioural Research, 32 (1), 53-76.
Marjoribanks, K. (1997). Children of Single-parent Families. In: Saha, L. J. (Ed.). International Encyclopedia of the Sociology of Education. Oxford/New York/Tokyo: Elsevier, pp. 589-95
Masters, G. N. & Wright, B. D. (1997). The Partial Credit Model. In: van der Linden, W. J. and Hambleton, R. K. (Eds.). Handbook of Modern Item Response Theory (pp. 101-122). New York/Berlin/Heidelberg: Springer.
McLanahan, S.S. & Sandefur, G. D. (1994). Growing Up with a Single Parent: What Hurts, What Helps. Cambridge, MA: Harvard University Press.
Mosher, R./Kenny, R.A./Garrod, A. (1994). Preparing for Citizenship. Teaching Youth Live Democratically. Westport/London: Praeger.
Mullis, I.V.S., Martin, M.O., Gonzalez, E J., Gregory, K D., Garden, R A., O'Connor, K M., Chrostowski, S J., & Smith, T A. (2000). TIMSS 1999 international mathematics report : findings from IEA's repeat of the Third International mathematics and Science Study at the eighth grade. Chestnut Hill MA : Boston College. International Study Center, 2000.
Niemi, R. & Junn, J. (1998). Civic education: What makes students learn? New Haven: Yale University Press.
Niemi, R. G., Craig, S. C., & Mattei, F. (1991). Measuring internal political efficacy in the 1988 national election study. American Political Science Review, 85(4), 1407-1413.

32
Norris, Pippa (2000). A Virtuous Circle: Political Communication in Postindustrial Societies. Cambridge: Cambridge University Press.
Putnam, R. D. (1993). Making Democracy Work. Princeton: Princeton University Press
Putnam, R. D. (2000). Bowling alone: The collapse and revival of American community. New York: Simon and Schuster.
Rasch, G. (1960). Probabilistic models for some intelligence and attainment tests. Copenhagen: Nielsen & Lydiche.
Renshon, S. A. (1975). The Role of Personality Development in Political Socialization. In: D. C. Schwartz & S. Schwartz (eds.). New Directions in Socialization. New York: Free Press, pp. 29-68.
Richardson, W. (2003). Connecting Political Discussion to Civic Engagement: The Role of Civic Knowledge, Efficacy and Context for Adolescents. Doctoral Dissertation (PhD). College Park: University of Maryland.
Robinson, Michael J. (1976) Public Affairs Television and the Growth of Political Malaise: The Case of ‘the Selling of the Pentagon’. In: American Political Science Review, 70, 409-432.
Saha, L. J. (1997). Introduction: The Centrality of the Family in Educational Processes. In: Saha, L. J. (Ed.). International Encyclopedia of the Sociology of Education (pp. 587-88). Oxford/New York/Tokyo: Elsevier.
Scheerens, J. & Bosker, R. J. (1997) The foundations of educational effectiveness. Oxford, New York and Tokyo, Pergamon Press.
Scheufele, D. A., Nisbet, M. C. & Brossard, D. (2003). Pathways to Political Participation? Religion, Communication Contexts, and Mass Media. International Journal of Public Opinion Research, 15:3, 300-324.
Schulz W. (2005). Political Efficacy and Expected Political Participation among Lower and Upper Secondary Students. Paper prepared for the ECPR General Conference in Budapest, 8 - 10 September
Schulz, W. & Sibberns, H. (2004) IEA Civic Education Study. Technical Report. Amsterdam: IEA.
Schulz, W. (2004). Scaling Procedures for Likert-type Items on Students’ Concepts, Attitudes and Actions. In: W. Schulz & H. Sibberns (eds.) IEA Civic Education Study. Technical Report. Amsterdam: IEA, pp. 93-126.

33
Schulz, W. (2006). Testing Parameter Invariance for Questionnaire Indices using Confirmatory Factor Analysis and Item Response Theory. Paper presented at the Annual Meetings of the American Educational Research Association (AERA) in San Francisco, 7-11 April.
Seltzer, J. (1994). Consequences of marital dissolution for children. Annual Review of Sociology, 20, 235-66.
Stanat, P. & Christensen, G. (2006). Where immigrant students succeed – A comparative review of performance and engagement in PISA 2003. Paris: OECD Publications.
Stolle, D. with Lewis, J. (2002). Social Capital: An Emerging Concept. In: B. Hobson, J. Lewis & B. Siim (eds.) Contested Concepts in Gender and European Social Politics, Edward Elgar Press, Cheltenham: pp. 195-229.
Torney, J. V., Oppenheim, A. N., & Farnen, R. F. (1975). Civic education in ten countries: An empirical study. New York: John Wiley and Sons.
Torney-Purta, J., Lehmann, R., Oswald, H., & Schulz, W. (2001). Citizenship and education in twenty-eight countries. Amsterdam: International Association for the Evaluation of Educational Achievement (IEA).
UNESCO (2006). ISCED 1997. International Standard Classification of Education (re-edition). Paris: UNESCO-UIS.
Verba, Sidney, Kay L. Schlozman, & Henry E. Brady. (1995). Voice and Equality. Cambridge: Harvard University Press.
Warm, T. A. (1989). Weighted Likelihood Estimation of Ability in Item Response Theory. Psychometrika, 54(3), 427-450.
White, K. R. (1982).The relation between socioeconomic status and educational achievement. Psychological Bulletin, 91(3), 461-81.
Willms, J. D. (2003). Student Engagement at School. A Sense of Belonging and Participation. Paris: OECD Publications.
Woolcock, M.. (2001) The place of social capital in Understanding Social and Economic Outcomes. ISUMA Canadian Journal of Policy Research 2 (1) 11-17.
Wu, M.L., Adams, R.J., Wilson, M.R. and Haldane, S. (2007). ACER ConQuest 2.0: General item response modelling software [computer program manual]. Camberwell, Vic.: ACER Press.
Copyright © 2022 FDOKUMEN

