


Bahasa
Halaman
Hukum

- � -
Hong Kong Exchanges and Clearing Limited and The Stock Exchange of Hong Kong Limited take no responsibility for the contents of this announcement, make no representation as to its accuracy or completeness and expressly disclaim any liability whatsoever for any loss howsoever arising from or in reliance upon the whole or any part of the contents of this announcement.
(Incorporated in the Cayman Islands with limited liability)(Stock code: �75)
ANNOUNCEMENT OF INTERIM RESULTSFOR THE SIX MONTHS ENDED 30 JUNE 2011
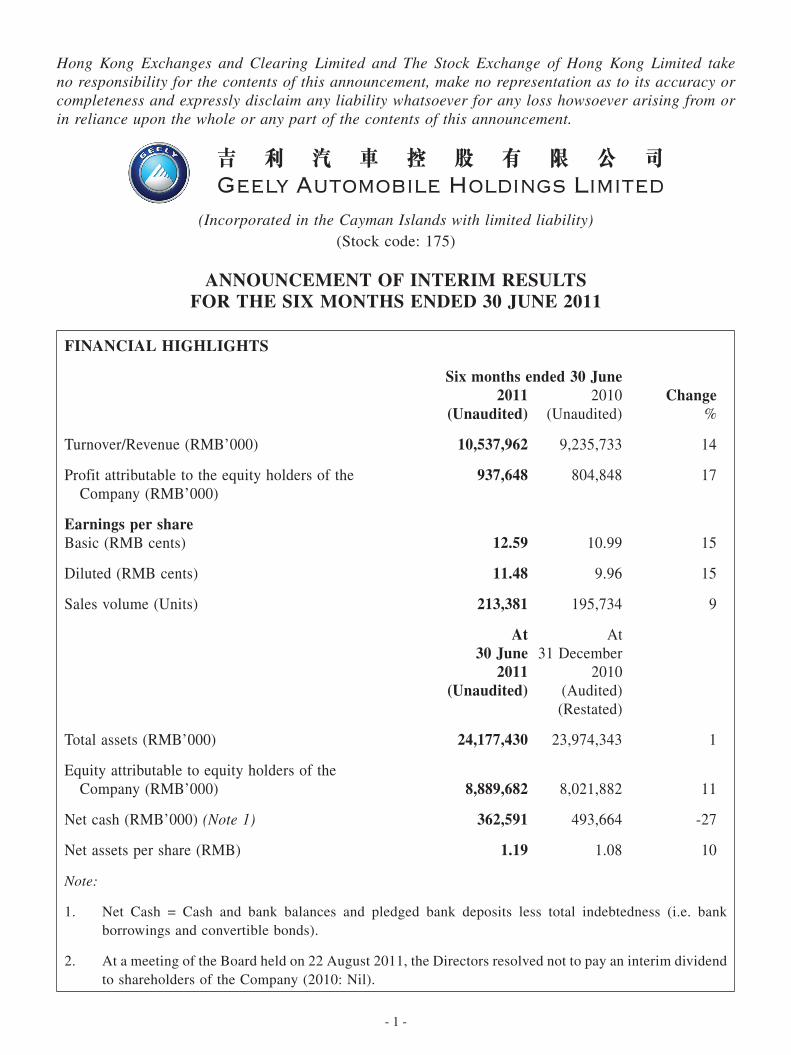
FINANCIAL HIgHLIgHTS
Six months ended 30 June 2011 20�0 Change (Unaudited) (Unaudited) %
Turnover/Revenue (RMB’000) 10,537,962 9,235,733 �4
Profit attributable to the equity holders of the 937,648 804,848 �7 Company (RMB’000)
Earnings per shareBasic (RMB cents) 12.59 �0.99 �5
Diluted (RMB cents) 11.48 9.96 �5
Sales volume (Units) 213,381 �95,734 9
At At 30 June 3� December 2011 20�0 (Unaudited) (Audited) (Restated)
Total assets (RMB’000) 24,177,430 23,974,343 �
Equity attributable to equity holders of the Company (RMB’000) 8,889,682 8,02�,882 ��
Net cash (RMB’000) (Note 1) 362,591 493,664 -27
Net assets per share (RMB) 1.19 �.08 �0
Note:
�. Net Cash = Cash and bank balances and pledged bank deposits less total indebtedness (i.e. bank borrowings and convertible bonds).
2. At a meeting of the Board held on 22 August 20��, the Directors resolved not to pay an interim dividend to shareholders of the Company (20�0: Nil).
- 2 -
INTERIM RESULTS
The Board of Directors (the “Board”) of Geely Automobile Holdings Limited (the “Company”) is pleased to announce the unaudited interim results of the Company and its subsidiaries (the “Group”) for the six months ended 30 June 20��. These interim results have been reviewed by the Company’s Audit Committee, comprising solely the independent non-executive directors, one of whom chairs the committee, and the Company’s auditors, Grant Thornton Jingdu Tianhua.
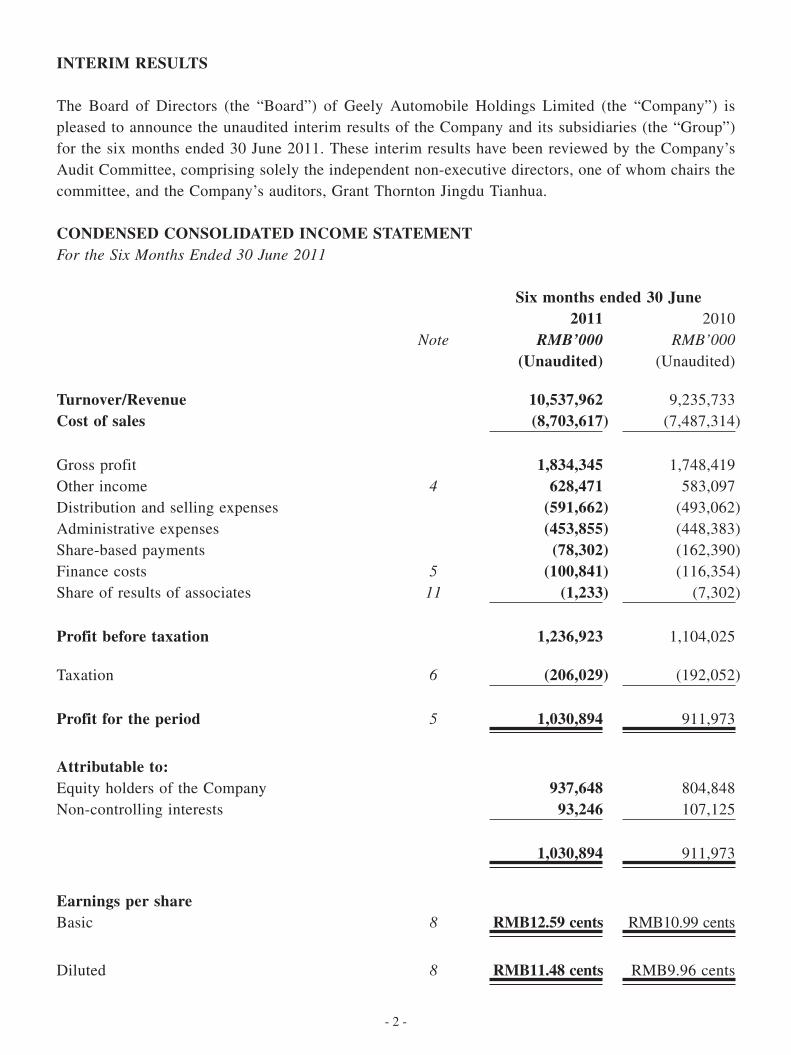
CONDENSED CONSOLIDATED INCOME STATEMENTFor the Six Months Ended 30 June 2011
Six months ended 30 June 2011 20�0 Note RMB’000 RMB’000 (Unaudited) (Unaudited)
Turnover/Revenue 10,537,962 9,235,733Cost of sales (8,703,617 ) (7,487,3�4 )
Gross profit 1,834,345 �,748,4�9Other income 4 628,471 583,097Distribution and selling expenses (591,662 ) (493,062 )Administrative expenses (453,855 ) (448,383 )Share-based payments (78,302 ) (�62,390 )Finance costs 5 (100,841 ) (��6,354 )Share of results of associates 11 (1,233 ) (7,302 )
Profit before taxation 1,236,923 �,�04,025
Taxation 6 (206,029 ) (�92,052 )
Profit for the period 5 1,030,894 9��,973
Attributable to:Equity holders of the Company 937,648 804,848Non-controlling interests 93,246 �07,�25
1,030,894 9��,973
Earnings per shareBasic 8 RMB12.59 cents RMB�0.99 cents
Diluted 8 RMB11.48 cents RMB9.96 cents

- 3 -
CONDENSED CONSOLIDATED STATEMENT OF COMPREHENSIVE INCOMEFor the Six Months Ended 30 June 2011
Six months ended 30 June 2011 20�0 RMB’000 RMB’000 (Unaudited) (Unaudited)
Profit for the period 1,030,894 9��,973
Other comprehensive income:Exchange differences on translation of foreign operations recognised 11,909 (26,964 )
Total comprehensive income for the period 1,042,803 885,009
Attributable to:Equity holders of the Company 949,557 777,884Non-controlling interests 93,246 �07,�25
1,042,803 885,009
- 4 -
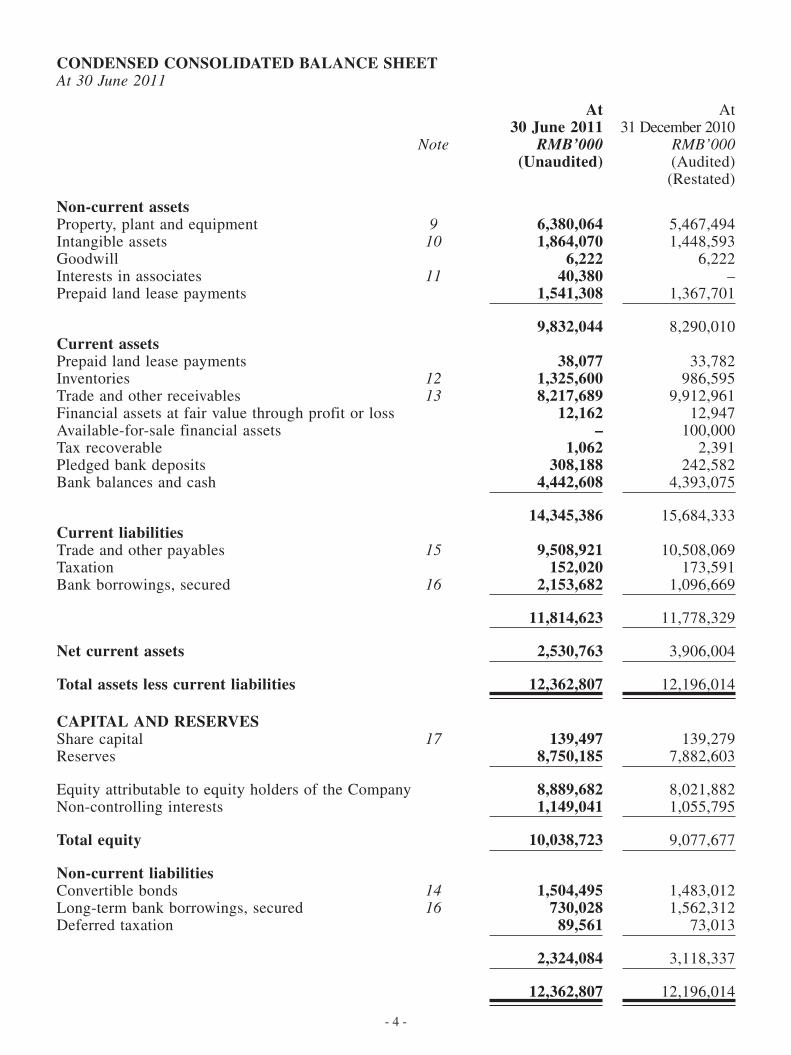
CONDENSED CONSOLIDATED BALANCE SHEETAt 30 June 2011
At At 30 June 2011 3� December 20�0 Note RMB’000 RMB’000 (Unaudited) (Audited) (Restated)
Non-current assetsProperty, plant and equipment 9 6,380,064 5,467,494Intangible assets 10 1,864,070 �,448,593Goodwill 6,222 6,222Interests in associates 11 40,380 –Prepaid land lease payments 1,541,308 �,367,70�
9,832,044 8,290,0�0Current assetsPrepaid land lease payments 38,077 33,782Inventories 12 1,325,600 986,595Trade and other receivables 13 8,217,689 9,9�2,96�Financial assets at fair value through profit or loss 12,162 �2,947Available-for-sale financial assets – �00,000Tax recoverable 1,062 2,39�Pledged bank deposits 308,188 242,582Bank balances and cash 4,442,608 4,393,075
14,345,386 �5,684,333Current liabilitiesTrade and other payables 15 9,508,921 �0,508,069Taxation 152,020 �73,59�Bank borrowings, secured 16 2,153,682 �,096,669
11,814,623 ��,778,329
Net current assets 2,530,763 3,906,004
Total assets less current liabilities 12,362,807 �2,�96,0�4
CAPITAL AND RESERVESShare capital 17 139,497 �39,279Reserves 8,750,185 7,882,603
Equity attributable to equity holders of the Company 8,889,682 8,02�,882Non-controlling interests 1,149,041 �,055,795
Total equity 10,038,723 9,077,677
Non-current liabilitiesConvertible bonds 14 1,504,495 �,483,0�2Long-term bank borrowings, secured 16 730,028 �,562,3�2Deferred taxation 89,561 73,0�3
2,324,084 3,��8,337
12,362,807 �2,�96,0�4
- 5 -
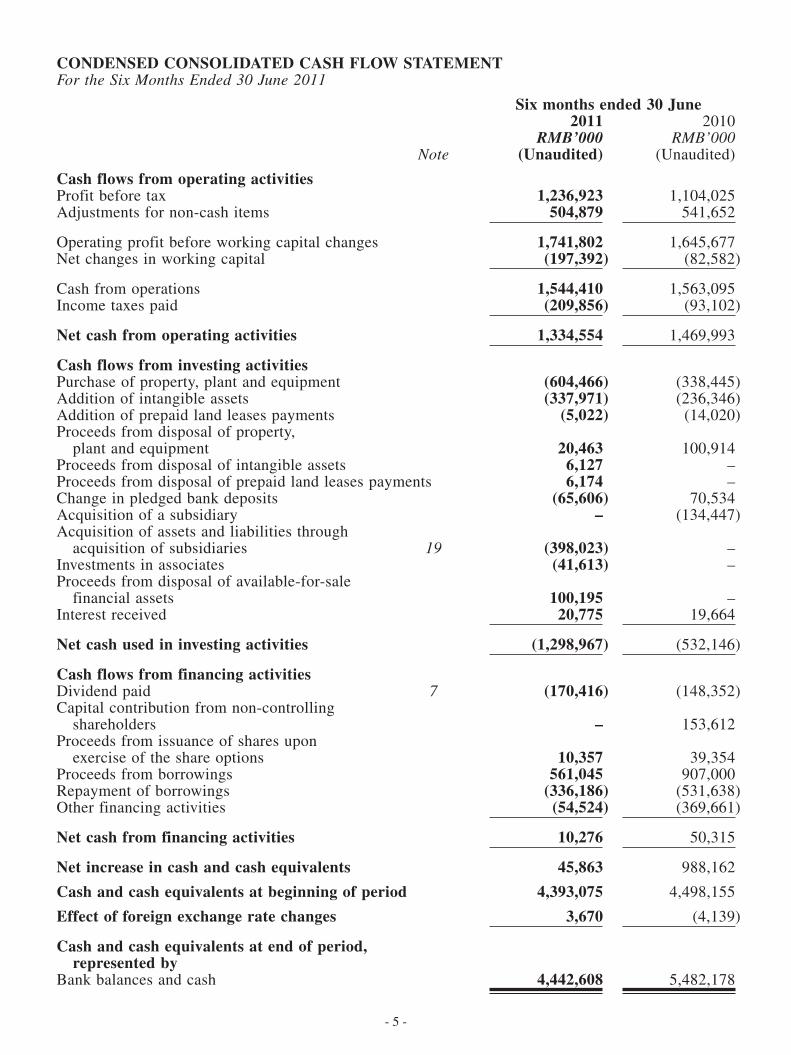
CONDENSED CONSOLIDATED CASH FLOW STATEMENTFor the Six Months Ended 30 June 2011
Six months ended 30 June 2011 20�0 RMB’000 RMB’000 Note (Unaudited) (Unaudited)
Cash flows from operating activitiesProfit before tax 1,236,923 �,�04,025Adjustments for non-cash items 504,879 54�,652
Operating profit before working capital changes 1,741,802 �,645,677Net changes in working capital (197,392 ) (82,582 )
Cash from operations 1,544,410 �,563,095Income taxes paid (209,856 ) (93,�02 )
Net cash from operating activities 1,334,554 �,469,993
Cash flows from investing activitiesPurchase of property, plant and equipment (604,466 ) (338,445 )Addition of intangible assets (337,971 ) (236,346 )Addition of prepaid land leases payments (5,022 ) (�4,020 )Proceeds from disposal of property, plant and equipment 20,463 �00,9�4Proceeds from disposal of intangible assets 6,127 –Proceeds from disposal of prepaid land leases payments 6,174 –Change in pledged bank deposits (65,606 ) 70,534Acquisition of a subsidiary – (�34,447 )Acquisition of assets and liabilities through acquisition of subsidiaries 19 (398,023 ) –Investments in associates (41,613 ) –Proceeds from disposal of available-for-sale financial assets 100,195 –Interest received 20,775 �9,664
Net cash used in investing activities (1,298,967 ) (532,�46 )
Cash flows from financing activitiesDividend paid 7 (170,416 ) (�48,352 )Capital contribution from non-controlling shareholders – �53,6�2Proceeds from issuance of shares upon exercise of the share options 10,357 39,354Proceeds from borrowings 561,045 907,000Repayment of borrowings (336,186 ) (53�,638 )Other financing activities (54,524 ) (369,66� )
Net cash from financing activities 10,276 50,3�5
Net increase in cash and cash equivalents 45,863 988,�62
Cash and cash equivalents at beginning of period 4,393,075 4,498,�55
Effect of foreign exchange rate changes 3,670 (4,�39 )
Cash and cash equivalents at end of period, represented byBank balances and cash 4,442,608 5,482,�78

- 6 -
NOTES TO THE CONDENSED CONSOLIDATED FINANCIAL STATEMENTSFor the Six Months Ended 30 June 2011
1. BASIS OF PREPARATION
These condensed consolidated financial statements have been prepared in accordance with the applicable disclosure provisions of the Rules Governing the Listing of Securities on the Stock Exchange of Hong Kong Limited, including compliance with Hong Kong Accounting Standard (“HKAS”) 34, Interim Financial Reporting, issued by the Hong Kong Institute of Certified Public Accountants (“HKICPA”).
The condensed interim financial statements are presented in thousands of Renminbi (“RMB’000”), unless otherwise stated.
The condensed consolidated interim financial statements have not been audited.
These condensed consolidated financial statements have been prepared in accordance with the same accounting policies adopted in the 20�0 annual financial statements, except for the accounting policy changes that are expected to be reflected in the 20�� annual financial statements. Details of these changes in accounting policies are set out in note 2.
2. CHANgES IN ACCOUNTINg POLICIES
(a) Adoption of new/revised HKFRSs
The HKICPA has issued a number of new and revised Hong Kong Financial Reporting Standards (“HKFRSs” which term collectively includes individual HKFRSs, HKASs and Interpretations) that are effective for accounting periods beginning on or after � January 20��. The Group has applied for the first time the following new and revised HKFRSs which are relevant to and effective for Group’s financial statements for the annual financial period beginning on � January 20��:
HKFRSs (Amendments) Improvements to HKFRSs 20�0HKAS 24 (Revised) Related Party DisclosuresHKAS 32 (Amendments) Classification of Rights IssuesHK(IFRIC) – Int �9 Extinguishing Financial Liabilities with Equity Instruments
Other than stated below, the adoption of the new HKFRSs had no material impact on how the results and financial position for the current and prior periods have been prepared and presented.
AmendmentstoHKAS34InterimFinancialReporting
The amendment clarified certain disclosures relating to events and transactions that are significant to an understanding of changes in the Group’s circumstances since the 20�0 annual financial statements. The Group’s interim financial statements for the six months ended 30 June 20�� reflect these amended disclosure requirements, where applicable.
(b) Change in accounting policy
During the period, the Group changes its accounting policy for the government grants. Government grants related to assets are now deducted from the carrying amount of the asset and consequently are recognised in profit or loss over the useful life of the asset by reducing the depreciation expense.

- 7 -
Before the change in accounting policy, the government grants related to assets are included in non-current liabilities as deferred government grants and are recognised as subsidy income (included in other income) over the useful life of the assets in the consolidated income statement.
Management believes that the new classification of deferred government grants gives a more relevant presentation of the results and financial position of the Group for the periods.
The change in accounting policy has been accounted for retrospectively and the condensed consolidated financial statements have been restated. The effect on the condensed consolidated financial statements is as follows:
At At 30 June 2011 3� December 20�0 RMB’000 RMB’000 (Unaudited) (Audited)
Decrease in property, plant and equipment 311,776 329,256Decrease in trade and other payables 34,959 34,959Decrease in deferred government grants 276,817 294,297
Six months ended 30 June 2011 20�0 RMB’000 RMB’000 (Unaudited) (Unaudited)
Decrease in other income 17,480 –Decrease in depreciation expenses 17,480 –
(c) Effects of application of HKFRSs not yet effective
The Group has not early applied the following new/revised standards, amendments or interpretations relevant to the Group’s operations that have been issued but are not yet effective.
HKAS � (Amendments) Presentation of Items of Other Comprehensive Income2
HKAS 27 (Amendments) Separate Financial Statements (20��)3
HKAS 28 (Amendments) Investments in Associates and Joint Ventures (20��)3
HKFRS 7 (Amendments) Disclosures – Transfer of Financial Assets�
HKFRS 9 Financial Instruments3
HKFRS �0 Consolidated Financial Statements3
HKFRS �� Joint Arrangements3
HKFRS �2 Disclosure of Interests in Other Entities3
HKFRS �3 Fair Value Measurement3
� Effective for annual periods beginning on or after � July 20��2 Effective for annual periods beginning on or after � July 20�23 Effective for annual periods beginning on or after � January 20�3
HKAS27(Amendments)–SeparateFinancialStatements(2011)
The requirements relating to separate financial statements are unchanged and are included in the amended HKAS 27. The other portions of HKAS 27 are replaced by HKFRS �0.
- 8 -
HKAS28(Amendments)–InvestmentsinAssociatesandJointVentures(2011)
HKAS 28 is amended for conforming changes based on the issuance of HKFRS �0, HKFRS �� and HKFRS �2.
HKFRS9FinancialInstruments
Under HKFRS 9, all recognised financial assets that are within the scope of the HKAS 39 Financial Instruments: Recognition and Measurement are subsequently measured at either amortised cost or fair value. Specifically, debt investments that are held within a business model whose objective is to collect the contractual cash flows, and that have contractual cash flows that are solely payments of principal and interest on the principal outstanding are generally measured at amortised cost at the end of subsequent accounting periods. All other debt investments and equity investments are measured at their fair values at the end of subsequent accounting periods.
In relation to financial liabilities, the significant change relates to financial liabilities that are designated as at fair value through profit or loss. Specifically under HKFRS 9, for all financial liabilities that are designated as at fair value through profit or loss, the amount of change in the fair value of the financial liability that is attributable to changes in the credit risk of that liability is presented in other comprehensive income, unless the presentation of the effects of changes in the liability’s credit risk in other comprehensive income would create or enlarge an accounting mismatch in profit or loss. Changes in fair value attributable to a financial liability’s credit risk are not subsequently reclassified to profit or loss. Previously, under HKAS 39, the entire amount of the change in the fair value of the financial liability designated as at fair value through profit or loss is presented in profit or loss.
HKFRS10ConsolidatedFinancialStatements
HKFRS �0 replaces the consolidation guidance in HKAS 27 Consolidated and Separate Financial Statements and HK(SIC) – Int�2 Consolidation – Special Purpose Entities by introducing a single consolidation model for all entities based on control, irrespective of the nature of the investee (i.e., whether an entity is controlled through voting rights of investors or through other contractual arrangements as is common in special purpose entities). Under HKFRS �0, control is based on whether an investor has �) power over the investee; 2) exposure, or rights, to variable returns from its involvement with the investee; and 3) the ability to use its power over the investee to affect the amount of the returns.
HKFRS13FairValueMeasurement
HKFRS �3 applies when another HKFRS requires or permits fair value measurements or disclosures about fair value measurements (and measurements, such as fair value less costs to sell, based on fair value or disclosures about those measurements), except for certain exemptions. HKFRS �3 requires the disclosures of fair values through a ‘fair value hierarchy’. The hierarchy categorises the inputs used in valuation techniques into three levels. The hierarchy gives the highest priority to (unadjusted) quoted prices in active markets for identical assets or liabilities and the lowest priority to unobservable inputs. If the inputs used to measure fair value are categorised into different levels of the fair value hierarchy, the fair value measurement is categorised in its entirety in the level of the lowest level input that is significant to the entire measurement.
The directors of the Company anticipate that the application of other new and revised standards, amendments and interpretations in issue but not yet effective will have no material impact on the results and the financial position of the Group.

- 9 -
3. SEgMENT INFORMATION
The Group has presented the following two reportable segments. No operating segments have been aggregated to form the following reportable segments.
Automobiles and related parts and components: Manufacture and sale of automobiles, automobile parts and related automobile components (excluding gearboxes).
Gearboxes: Manufacture and sale of gearboxes.
The accounting policies of the reportable segment are the same as the Group’s accounting policies described in the Company’s annual financial statements for the year ended 3� December 20�0 and note 2 above. Segment profit represents the profit earned by each segment without allocation of corporate expenses, directors’ emoluments, share of results of associates, interest income, interest expenses and income tax expenses. Segment assets include all tangible, intangible assets and current assets with the exception of interests in associates, deferred tax assets and other corporate assets. This is the measure reported to the Group’s chief operating decision maker for the purposes of resource allocation and assessment of segment performance. Inter-segment sales are priced with reference to prices charged to external parties for similar orders. Information regarding the Group’s reportable segments is set out below.
For the six months ended 30 June 2011 (unaudited)
Automobiles and related parts and components gearboxes Unallocated Eliminations Total RMB’000 RMB’000 RMB’000 RMB’000 RMB’000
Sales to external customers 10,122,494 415,468 – – 10,537,962Inter-segment 6,874 178,116 – (184,990 ) –
Total segment revenue 10,129,368 593,584 – (184,990 ) 10,537,962
Segment results 1,421,759 (14,327 ) – – 1,407,432Interest income 18,925 1,670 180 – 20,775Finance costs (54,302 ) – (46,539 ) – (100,841 )Corporate and other unallocated expenses – – (89,210 ) – (89,210 )Share of results of associates (1,233 ) – – – (1,233 )
Profit before tax 1,236,923Income tax expense (206,029 )
Profit for the period 1,030,894
- �0 -
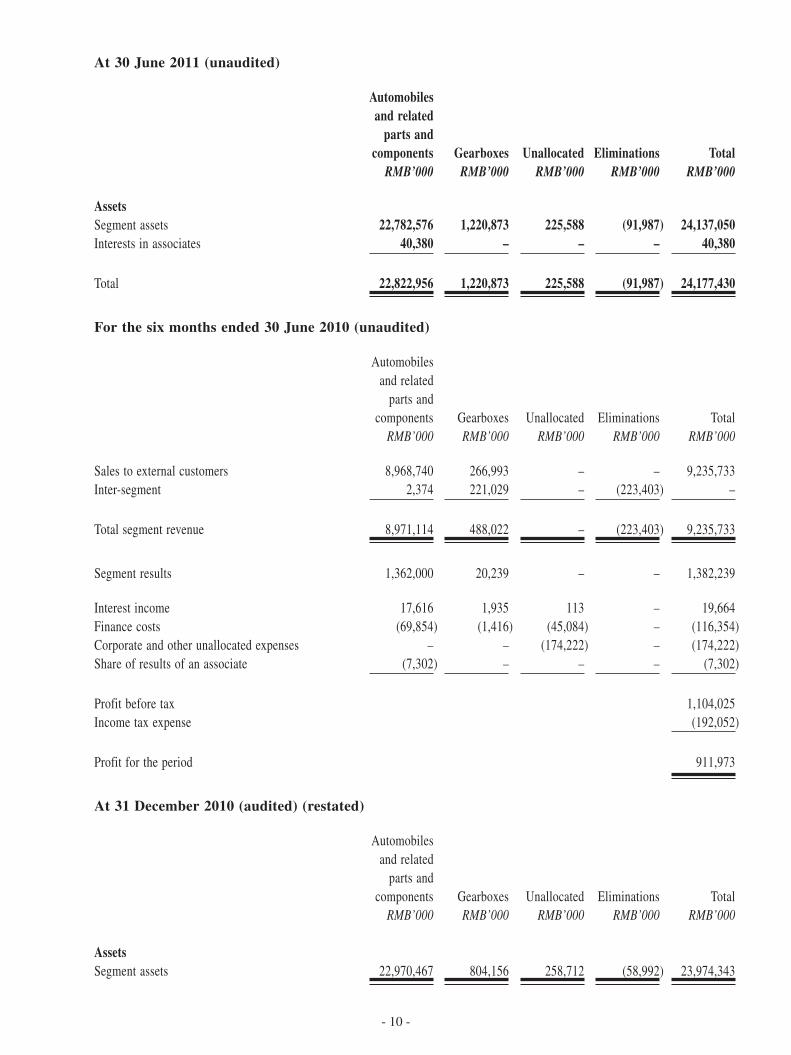
At 30 June 2011 (unaudited)
Automobiles and related parts and components gearboxes Unallocated Eliminations Total RMB’000 RMB’000 RMB’000 RMB’000 RMB’000
AssetsSegment assets 22,782,576 1,220,873 225,588 (91,987 ) 24,137,050Interests in associates 40,380 – – – 40,380
Total 22,822,956 1,220,873 225,588 (91,987 ) 24,177,430
For the six months ended 30 June 2010 (unaudited)
Automobiles and related parts and components Gearboxes Unallocated Eliminations Total RMB’000 RMB’000 RMB’000 RMB’000 RMB’000
Sales to external customers 8,968,740 266,993 – – 9,235,733Inter-segment 2,374 22�,029 – (223,403 ) –
Total segment revenue 8,97�,��4 488,022 – (223,403 ) 9,235,733
Segment results �,362,000 20,239 – – �,382,239
Interest income �7,6�6 �,935 ��3 – �9,664Finance costs (69,854 ) (�,4�6 ) (45,084 ) – (��6,354 )Corporate and other unallocated expenses – – (�74,222 ) – (�74,222 )Share of results of an associate (7,302 ) – – – (7,302 )
Profit before tax �,�04,025Income tax expense (�92,052 )
Profit for the period 9��,973
At 31 December 2010 (audited) (restated)
Automobiles and related parts and components Gearboxes Unallocated Eliminations Total RMB’000 RMB’000 RMB’000 RMB’000 RMB’000
AssetsSegment assets 22,970,467 804,�56 258,7�2 (58,992 ) 23,974,343

- �� -
4. OTHER INCOME
Six months ended 30 June 2011 20�0 RMB’000 RMB’000 (Unaudited) (Unaudited)
Bank interest income 20,775 �9,664Gain on disposal of available-for-sale financial assets 195 –Gain on disposal of intangible assets 222 –Gain on disposal of property, plant and equipment 1,842 –Gain on disposal of prepaid land leases 2,100 –Gain on disposal of scrap materials 32,686 28,�96Net claims income on defective materials purchased 17,018 �4,389Rental income 6,019 3,853Subsidy income from government (note) 534,748 5�0,639Sundry income 12,866 6,356
628,471 583,097
Note: Subsidy income mainly relates to cash subsidies in respect of research and development activities from government which are either unconditional grants or grants with conditions having been satisfied.
5. PROFIT FOR THE PERIOD
Six months ended 30 June 2011 20�0 RMB’000 RMB’000 (Unaudited) (Unaudited)
Profit for the period has been arrived at after charging:
Finance costsEffective interest expense on convertible bonds 46,317 44,898Interest on bank borrowings wholly repayable within five years 54,303 7�,377Interest expenses paid to a non-controlling shareholder of a subsidiary of the Group 221 79
Total finance costs 100,841 ��6,354
Staff costs (including directors’ emoluments)Salaries, wages and other benefits 407,691 343,408Retirement benefit scheme contributions 36,274 26,787Recognition of share-based payments 78,302 �62,390
Total staff costs 522,267 532,585
Other itemsCost of inventories recognised as expense (note) 8,703,617 7,487,3�4Depreciation 282,032 2��,942Amortisation of prepaid land lease payments 17,049 �6,804Amortisation of intangible assets 51,530 43,829Research and development costs 30,577 47,794Unrealised loss on financial assets at fair value through profit or loss that are classified as held for trading (listed investments held for trading) 785 26

- �2 -
Note: Cost of inventories recognised as expense included staff costs, depreciation and amortisation expenses, operating lease charges and research and development costs, which the amount is also included in the respective total amounts disclosed separately for each type of expenses.
6. TAXATION
Six months ended 30 June 2011 20�0 RMB’000 RMB’000 (Unaudited) (Unaudited)
Current tax:– PRC enterprise income tax 158,061 �75,0�6– Other overseas tax 1,416 �,�64Under/(Over)provision in prior years 30,137 (5,�54 )
189,614 �7�,026Deferred taxation 16,415 2�,026
206,029 �92,052
Hong Kong Profits Tax has not been provided for the period as the companies within the Group had no estimated assessable profits in Hong Kong.
Pursuant to the relevant laws and regulations in the PRC, the Group’s PRC subsidiary is entitled to an exemption from PRC enterprise income tax for the two years starting from its first profit-making year, followed by a 50% reduction for the next three years. The income tax provision is calculated at the applicable tax rates on the estimated assessable profits for the year based on existing legislation, interpretations and practises in respect thereof.
Taxation arising in other jurisdictions is calculated at the rates prevailing in the relevant jurisdictions.
7. DIVIDEND PAID
During the current period, a final dividend for the year ended 3� December 20�0 of HK$0.026 per share (20�0: HK$0.023 per share), amounting to approximately RMB�70,4�6,000 (20�0: RMB�48,352,000), were paid to the shareholders of the Company.
- �3 -
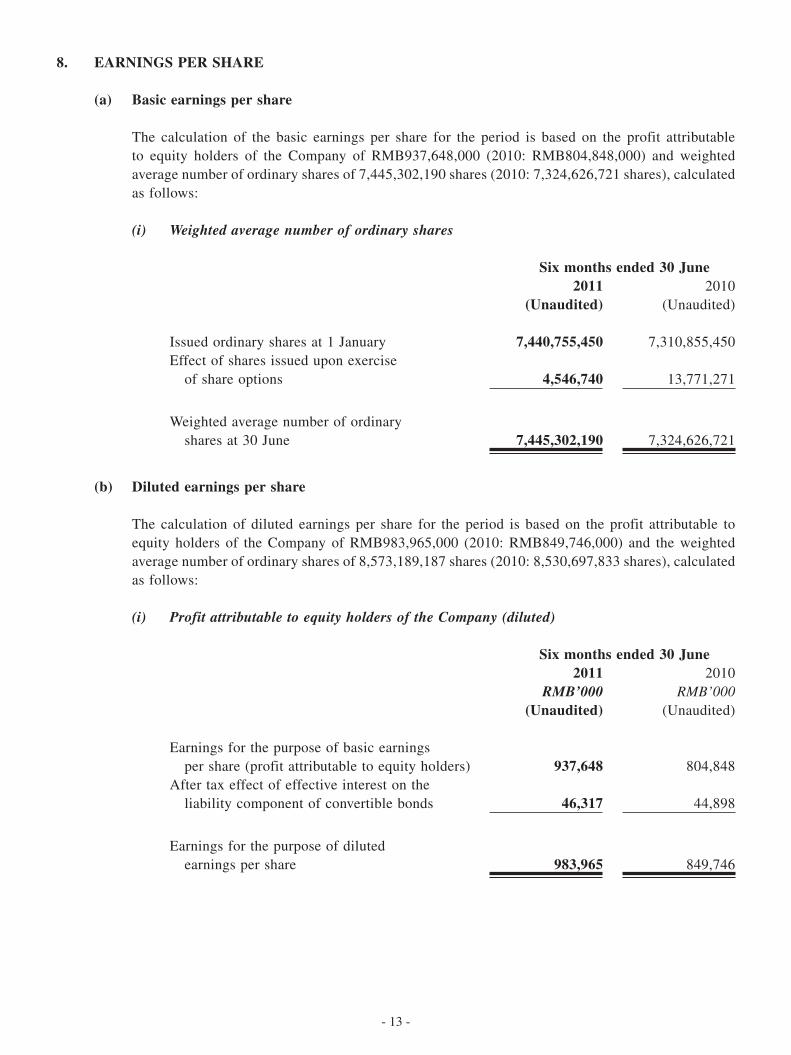
8. EARNINgS PER SHARE
(a) Basic earnings per share
The calculation of the basic earnings per share for the period is based on the profit attributable to equity holders of the Company of RMB937,648,000 (20�0: RMB804,848,000) and weighted average number of ordinary shares of 7,445,302,�90 shares (20�0: 7,324,626,72� shares), calculated as follows:
(i) Weightedaveragenumberofordinaryshares
Six months ended 30 June 2011 20�0 (Unaudited) (Unaudited)
Issued ordinary shares at � January 7,440,755,450 7,3�0,855,450Effect of shares issued upon exercise of share options 4,546,740 �3,77�,27�
Weighted average number of ordinary shares at 30 June 7,445,302,190 7,324,626,72�
(b) Diluted earnings per share
The calculation of diluted earnings per share for the period is based on the profit attributable to equity holders of the Company of RMB983,965,000 (20�0: RMB849,746,000) and the weighted average number of ordinary shares of 8,573,�89,�87 shares (20�0: 8,530,697,833 shares), calculated as follows:
(i) ProfitattributabletoequityholdersoftheCompany(diluted)
Six months ended 30 June 2011 20�0 RMB’000 RMB’000 (Unaudited) (Unaudited)
Earnings for the purpose of basic earnings per share (profit attributable to equity holders) 937,648 804,848After tax effect of effective interest on the liability component of convertible bonds 46,317 44,898
Earnings for the purpose of diluted earnings per share 983,965 849,746

- �4 -
(ii) Weightedaveragenumberofordinaryshares(diluted)
Six months ended 30 June 2011 20�0 (Unaudited) (Unaudited)
Weighted average number of ordinary shares for the purpose of basic earnings per share 7,445,302,190 7,324,626,72�Effect of deemed conversion of convertible bonds 1,004,069,387 998,484,894Effect of deemed exercise of warrants 88,025,505 �0�,�45,065Effect of deemed issue of shares under the Company’s share option scheme 35,792,105 �06,44�,�53
Weighted average number of ordinary shares for the purpose of diluted earnings per share 8,573,189,187 8,530,697,833
9. PROPERTY, PLANT AND EQUIPMENT
During the period, the Group acquired property, plant and equipment of approximately RMB680,285,000 (20�0: RMB765,268,000), excluding the amounts through acquisition of subsidiaries as set out in note �9.
10. INTANgIBLE ASSETS
During the period, additions to intangible assets by acquisition and capitalisation in respect of development costs amounted to approximately RMB3�6,683,000 (20�0: RMB2�6,�44,000), excluding the amounts through acquisition of subsidiaries as set out in note �9.
11. INTERESTS IN ASSOCIATES
At At 30 June 2011 3� December 20�0 RMB’000 RMB’000 (Unaudited) (Audited)
Share of net assets 122,198 8�,8�8Goodwill 18,182 �8,�82Impairment loss recognised (100,000 ) (�00,000 )
40,380 –
Represented by:Cost of investments in associates Unlisted 41,613 – Listed overseas 197,788 �97,788
239,401 �97,788Share of post-acquisition losses and reserves (99,021 ) (97,788 )Impairment loss recognised (100,000 ) (�00,000 )
40,380 –
Fair value of listed investments 30,142 36,7�4

- �5 -
The Group’s interest in Manganese Bronze Holding plc (“MBH”) is �9.97% and the Group retains significant influence over MBH through the power to nominate representations on the board. Having considered the significant drop in the market value of the shares in MBH and the projected future profitability and cash flows of MBH, the impairment made in previous year is not reversed.
During the period, the Group invested 35% and �8% equity interest in Mando (Ningbo) Automotive Parts Company Limited (“Mando”) and Ningbo DIPO Traffic Facilities Company Limited (“Ningbo DIPO”) amounted to RMB39,027,000 and RMB2,586,000 respectively. Both Mando and Ningbo DIPO are engaged in research, production, marketing and sales of automobile parts and related components. The Group has significant influence over Ningbo DIPO through the power to nominate representations on the board.
The summarised financial information in respect of the Group’s associates are set out below:
At At 30 June 2011 3� December 20�0 RMB’000 RMB’000 (Unaudited) (Audited)
Total assets 906,701 75�,�28Total liabilities (457,356 ) (405,850 )
Net assets 449,345 345,278
Group’s share of net assets of associates 122,198 8�,8�8
Six months ended 30 June 2011 20�0 RMB’000 RMB’000 (Unaudited) (Unaudited)
Revenue 400,568 339,604
Loss for the period attributable to equity holders of associates (12,889 ) (42,�94 )
Group’s share of results of associates for the period (1,233 ) (7,302 )
During the year ended 3� December 20�0, the Group’s interest in MBH has been reduced to zero. Hence, the subsequent loss incurred by MBH has not been recognised by the Group during the period ended 30 June 20��.
- �6 -
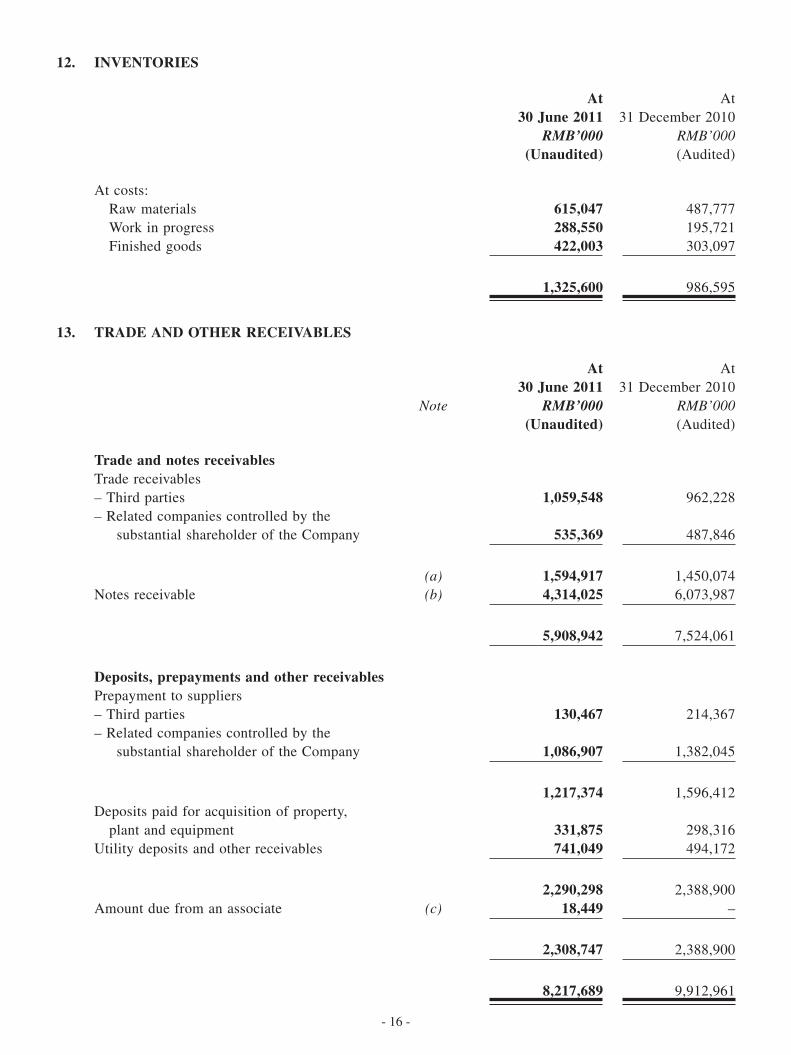
12. INVENTORIES
At At 30 June 2011 3� December 20�0 RMB’000 RMB’000 (Unaudited) (Audited)
At costs: Raw materials 615,047 487,777 Work in progress 288,550 �95,72� Finished goods 422,003 303,097
1,325,600 986,595
13. TRADE AND OTHER RECEIVABLES
At At 30 June 2011 3� December 20�0 Note RMB’000 RMB’000 (Unaudited) (Audited)
Trade and notes receivablesTrade receivables– Third parties 1,059,548 962,228– Related companies controlled by the substantial shareholder of the Company 535,369 487,846
(a) 1,594,917 �,450,074Notes receivable (b) 4,314,025 6,073,987
5,908,942 7,524,06�
Deposits, prepayments and other receivablesPrepayment to suppliers– Third parties 130,467 2�4,367– Related companies controlled by the substantial shareholder of the Company 1,086,907 �,382,045
1,217,374 �,596,4�2Deposits paid for acquisition of property, plant and equipment 331,875 298,3�6Utility deposits and other receivables 741,049 494,�72
2,290,298 2,388,900Amount due from an associate (c) 18,449 –
2,308,747 2,388,900
8,217,689 9,9�2,96�

- �7 -
(a) Trade receivables
The Group allows an average credit period of 30 days to 90 days to its local PRC trade customers. The following is an aged analysis of the trade receivables of local PRC trade customers based on invoice dates at the balance sheet dates:
At At 30 June 2011 3� December 20�0 RMB’000 RMB’000 (Unaudited) (Audited)
0 – 60 days 705,907 588,0806� – 90 days 42,840 55,�70Over 90 days 214,482 �44,354
963,229 787,604
For overseas trade customers, the Group may allow a credit period of over � year. The following is an aged analysis of the trade receivables of overseas trade customers based on invoice dates at the balance sheet dates:
At At 30 June 2011 3� December 20�0 RMB’000 RMB’000 (Unaudited) (Audited)
0 – 60 days 179,183 277,49�6� – 90 days 118,914 47,0709� – 365 days 262,469 244,848Over � year 71,122 93,06�
631,688 662,470
(b) Notes receivable
All notes receivable are denominated in Renminbi and are primarily notes received from third parties for settlement of trade receivable balances. At 30 June 20�� and 3� December 20�0, all notes receivable were guaranteed by established banks in the PRC and have maturities of six months or less from the balance sheet date.
(c) Amount due from an associate
The amount due from an associate represents the receivable from sale of property, plant and equipment. The amount due is unsecured, interest-free and has no fixed repayment terms.

- �8 -
14. CONVERTIBLE BONDS
The convertible bonds (“CB20�4”) contain a liability component and a conversion option which is included in the equity of the Company. Details of the terms of the CB20�4 are set out in the Company’s annual report for the year ended 3� December 20�0. Upon the payment of final dividends for the year ended 3� December 20�0, the conversion price of the CB20�4 was changed from RMB�.66 (equivalent to HK$�.8894) to RMB�.65�(equivalent to HK$�.8742) from 30 June 20�� in accordance with the provisions of CB20�4.
The movements of the convertible bonds for the period/year are set out below:
At At 30 June 2011 3� December 20�0 RMB’000 RMB’000 (Unaudited) (Audited)
Liability componentCarrying amount brought forward 1,488,725 �,449,�50Accrued effective interest charges 46,317 90,94�Interest paid during the period/year – (5�,366 )
1,535,042 �,488,725
Liability component is represented by:Convertible bonds 1,504,495 �,483,0�2Accrued interests included in trade and other payables 30,547 5,7�3
1,535,042 �,488,725
The principal amount outstanding at 30 June 20�� is RMB�,67� million (At 3� December 20�0: RMB�,67� million).
CB20�4 contains two components, liability and equity elements. The equity element is presented in equity as convertible bonds reserve. The effective interest rate of the liability component on initial recognition is 6.582% per annum. The redemption option of CB20�4 is included as a liability component and not separately recognised. The liability component is measured at amortised cost.

- �9 -
15. TRADE AND OTHER PAYABLES
At At 30 June 2011 3� December 20�0 Note RMB’000 RMB’000 (Unaudited) (Audited) (Restated)
Trade and notes payablesTrade payables– Third parties 4,895,678 4,6�9,345– Related parties controlled by the substantial shareholder of the Company 510,454 728,792
(a) 5,406,132 5,348,�37
Notes payable– Third parties 708,662 �0,000– Related parties controlled by the substantial shareholder of the Company – 325,�64
(b) 708,662 335,�64
6,114,794 5,683,30�
Other payablesReceipts in advance from customers– Third parties 1,280,297 2,739,679– Related parties controlled by the substantial shareholder of the Company 544,037 �5,680
1,824,334 2,755,359Deferred income related to government grants which conditions have not yet been satisfied 99,947 434,��0Payables for acquisition of property, plant and equipment 718,718 609,340Accrued staff salaries and benefits 134,700 �98,787Business and other taxes 176,077 205,6�2Accrued charges and other creditors 282,467 6�2,347
3,236,243 4,8�5,555Loan from a non-controlling shareholder of a subsidiary of the Group (c) 7,884 9,2�3Amount due to ultimate holding company (d) 150,000 –
3,394,127 4,824,768
9,508,921 �0,508,069

- 20 -
(a) Trade payables
The following is an aged analysis of trade payables based on invoice dates at the balance sheet dates:
At At 30 June 2011 3� December 20�0 RMB’000 RMB’000 (Unaudited) (Audited)
0 – 60 days 4,215,399 4,464,0626� – 90 days 669,327 625,890Over 90 days 521,406 258,�85
5,406,132 5,348,�37
The trade payables do not carry interest. The average credit period on purchase of goods is 60 days.
(b) Notes payable
At 30 June 20�� and 3� December 20�0, all notes payable have maturities of less than � year.
(c) Loan from a non-controlling shareholder of a subsidiary of the group
Loan from a non-controlling shareholder of a subsidiary of the Group is unsecured, interest bearing at 2.78% - 3.�6% (3� December 20�0: 2.86% - 5.56%) per annum and repayable within one year.
(d) Amount due to ultimate holding company
The amount due to ultimate holding company is unsecured, interest-free and has no fixed repayment terms.
16. BANK BORROWINgS
At At 30 June 2011 3� December 20�0 RMB’000 RMB’000 (Unaudited) (Audited)
Bank loans secured by the Group’s assets 1,340,910 �,560,38�Bank loans guaranteed by the ultimate holding company 1,397,000 93�,000Other bank loans 145,800 �67,600
2,883,710 2,658,98�

- 2� -
At the balance sheet date, the Group’s bank loans were repayable as follows:
At At 30 June 2011 3� December 20�0 RMB’000 RMB’000 (Unaudited) (Audited)
On demand or within one year 2,153,682 �,096,669In the second year 415,028 845,4�7In the third to fifth year 315,000 7�6,895
2,883,710 2,658,98�Less: amounts due within one year shown under current liabilities (2,153,682 ) (�,096,669 )
730,028 �,562,3�2
17. SHARE CAPITAL
Number of shares Nominal value RMB’000
Authorised: Ordinary shares of HK$0.02 each At 3� December 20�0 and 30 June 2011 (Unaudited) �2,000,000,000 246,720
Issued and fully paid: Ordinary shares of HK$0.02 each At � January 20�0 7,3�0,855,450 �36,993 Shares issued under share option scheme 48,800,000 859
Balance at 30 June 20�0 7,359,655,450 �37,852 Shares issued under share option scheme 8�,�00,000 �,427
Balance at 3� December 20�0 and � January 20�� 7,440,755,450 �39,279 Shares issued under share option scheme �2,390,000 2�8
Balance at 30 June 2011 (Unaudited) 7,453,145,450 139,497
During the period, options were exercised to subscribe for �2,390,000 ordinary shares in the Company at a consideration of approximately RMB�0,357,000 of which approximately RMB2�8,000 was credited to share capital and the balance of RMB�0,�39,000 was credited to the share premium account. Upon exercise of share options, RMB�,955,000 has been transferred from the share option reserve to the share premium account in accordance with the accounting policy set out in the Company’s 20�0 annual report.

- 22 -
18. WARRANTS
For the year ended 3� December 2009, the Company issued 299,526,900 warrants to certain investors with a subscription price of HK$� for all the warrants. The warrants are convertible into fully paid ordinary shares of HK$0.02 each of the Company at an initial exercise price of RMB2.0262 (equivalent to HK$2.3) per share, subject to adjustment in certain events. Upon the payment of final dividends for the year ended 3� December 20�0, the exercise price of the warrants were adjusted from RMB2.0�48 (equivalent to HK$2.287�) to RMB�.9986 (equivalent to HK$2.2687) per share from 30 June 20�� in accordance with the provisions of the warrants. The warrants are exercisable in part or in whole at any time from the issue date of the warrants on �� November 2009 to the fifth anniversary of the issuance of the warrants and are freely transferable, but in minimum tranches of 250,000 warrants. The warrants have been classified as equity instruments of the Company.
During the period, none of the warrants issued has been exercised.
19. ACQUISITION OF ASSETS AND LIABILITIES THROUgH ACQUISITION OF SUBSIDIARIES
For the six months ended 30 June 2011
On 2� January 20��, the Company entered into an agreement with Zhejiang Geely Holding Group Company Limited and its subsidiary to acquire �00% interests in Ningbo Vision Automobile Parts and Components Company Limited (“Ningbo Vision”) and Shandong Geely Gearbox Company Limited (“Shandong Geely”) for cash considerations of RMB437.3 million and RMB20 million respectively. There is a further capital injection of RMB80 million for Shandong Geely immediately after the completion of its acquisition. The acquisition of Ningbo Vision and Shandong Geely was completed during the period. Details of the acquisition have been set out in the Company’s announcement dated 2� January 20��.
Ningbo Vision and Shandong Geely have not engaged in any operating activities, and did not have sufficient workforce and all necessary plant and equipment ready for production at the acquisition date and the acquisition were accounted for as purchases of assets and liabilities of which no goodwill was recognised.
The assets and liabilities acquired in the acquisition of Ningbo Vision and Shandong Geely at the acquisition dates are as follows:
Carrying amount RMB’000
The assets and liabilities acquired:Property, plant and equipment 54�,776Intangible assets �55,839Prepaid land lease payments �94,003Trade and other receivables 4�,038Inventories 7,732Cash and cash equivalents 59,3�9Trade and other payables (542,365 )
457,342
Total consideration satisfied by:Cash 457,342
Net cash outflow arising on acquisition:Cash consideration paid 457,342Bank balances and cash acquired (59,3�9 )
398,023
20. COMPARATIVE FIgURES
The comparative figures related to balances with related parties have been reclassified to conform with the current period’s presentation.

- 23 -
MANAgEMENT DISCUSSION AND ANALYSIS
The Group’s performance in the first half of 20�� was broadly in line with previous expectations despite uncertain macro-economic conditions in China during the period and the expiry of tax incentives for small-size vehicles at the end of 20�0. The Group sold a total of 2�3,38� units of vehicles in the first six months of 20��, up 9% from the same period in the previous year, achieving 44% of the Group’s full year sales volume target of 480,000 units. Total revenues increased by �4% to RMB�0,538 million, reflecting a steady growth in sales volume and the continued improvement in product mix during the period. The profit attributable to shareholders for the first half of 20�� was up by �7% to RMB938 million, thanks to revenue growth, lower share-based payments to employees and well-controlled administrative expenses, which more than offset lower profit margins and higher distribution and selling expenses during the period. Fully diluted earnings per share (EPS) was up �5.3% to RMB��.48 cents. Excluding non-cash expenses related to the recognition of share-based payments to employees, the adjusted profit attributable to shareholders increased by 5% to RMB�,0�6 million.
Performance at the Group’s �00%-owned subsidiary DSI Holdings Pty Limited (“DSIH”) continued to improve steadily in the first half of 20��. Total net profit from DSIH was up 92% to A$0.9 million on 26% growth in revenue to A$62 million. DSIH manufactured and sold a total of 35,0�� units of automatic gearboxes to independent Original Equipment Manufacturer (OEM) customers during the period, which was in line with its budget.
The Group’s 5�%-owned Shanghai LTI Automobile Components Company Limited (“Shanghai LTI”), a joint venture with Manganese Bronze Holdings PLC (“MBH”), recorded a net loss of RMB�7 million for the first half of 20��, as its sales volume remained below break-even level. Shanghai LTI manufactured and sold 490 units of TX4 London taxi vehicles in the first half of 20��, up from �76 units for the same period last year.
Financial Resources
The Group’s financial position remained strong at the end of the first half of 20�� due to the continued good operational net cash inflow from its manufacturing operation. Total value of cash and bank balances (including pledged bank deposits) of the Group increased by 2% to RMB4.8 billion at the end of June 20��. Total bank borrowings also increased slightly from RMB2.7 billion at the end of 20�0 to RMB2.9 billion at the end of June 20��, mainly due to the increase of short-term bank loans. Despite this, the Group’s net cash level (bank balances and cash + pledged bank deposits – bank borrowings – convertible bonds) was still maintained at a healthy level at RMB363 million at the end of June 20��.
Vehicle Manufacturing (91% interests)
The Group sold a total of 2�3,38� units of vehicles in the first half of 20��, up 9% from the same period last year, helped by a strong demand for the “Emgrand EC7” model in the China market and a rapid increase in export sales, which more than offset the drop in the sales of older models like “Free Cruiser” and “Vision” during the period.

- 24 -
The Group’s domestic sales volume in the first half of 20�� was up 6% to �99,996 units, which was roughly in line with the 8% increase in the sales volume of China’s overall sedan market during the period. The Group’s market share in China’s sedan market was maintained at over 4%. Exports sales volume recovered strongly and was up 93% to �3,385 units in the first half of 20��, thanks to the strong recovery of the Group’s major export markets in developing countries. Exports sales accounted for 6.3% of the Group’s total sales volume in the period.
The demand for the “Emgrand EC7” model continued to be very strong, making the model the Group’s best-selling model in the first half of 20��, accounting for 2�% of the Group’s total sales volume during the period. This was despite the major demand constraints caused by the lack of automatic transmissions (AT) versions of “Emgrand EC7” during the period. Sales volume of “Free Cruiser” and “Vision”, however, declined by �6% and 8% respectively from the same period of the previous year, ahead of the planned launches of their upgraded models in the second half of 20��. The sales of “Geely Kingkong”, “GLEagle Panda” and “Englon SC7” models were steady during the period with their sales volumes growing in line with the overall China sedan market. The demand for the two new models launched at the end of last year: “Emgrand EC8” and “Englon SC5-RV” was in line with the Company’s expectations. Despite the model represents the Group’s first entry into the larger size sedan market, “Emgrand EC8” continued to receive good market response, achieving total sales volume of 7,067 units in the first half of 20��. As a result of the continued positive shift in product mix during the period, driven by the strong sales volume growth of “Emgrand EC7”, the Group’s ex-factory average sales price improved further to RMB45,020 per unit in the first half of 20��, up �.2% from the same period of last year and up 0.5% from the full year 20�0. Higher-priced models like “Vision”, “EC7”, “EC7-RV”, “SC7”, “EC8” and “TX4” accounted for 49% of the Group’s total sales volume in the first half of 20��, compared with 46% in 20�0.
The Group conducts its business under three independent product lines and brands: “GLEagle”, “Emgrand” and “Englon”, all of which have their own management teams, production facilities and distribution networks. By the end of June 20��, the Group’s three independent sales networks in China comprised a total of 94� shops, including 589 exclusive franchisee stores and 352 4S stores.
New Products
In the second half of 20��, the Group plans to launch the following new products:
• “GLEagle GC7” mid-size sedan• “GLEagle GX7” SUV• “Englon SC3” basic sedan• “Englon SC7” 6AT mid-size sedan• “Emgrand EX7” SUV
In addition, the Group has recently launched the new and upgraded models for “Free Cruiser” and plans to launch the upgraded models for “Vision” in the remaining period of the year. Both models will be marketed under the “GLEagle” brand.

- 25 -
Exports
The Group exported a total of �3,385 units of vehicles in the first six months of 20��, up 93% from the same period last year, and accounted for 6.3% of the Group’s total sales volume during the period. The Group’s share of China’s total exports of sedans decreased from 9.6% in the first half of 20�0 to 8.9% in the first half of 20��. Unlike the domestic market, the Group continues to market its products in the export markets under the “Geely” brand. “Geely MK” (Kingkong), “Geely LC” (Panda) and “Geely CK” (Free Cruiser) were the most popular export models in terms of sales volume in the first half of 20��, accounting for 33%, 25% and 22%, respectively, of the Group’s total export sales volume during the period. Developing countries in the Middle East, Eastern Europe and Central and South America remained the most important markets for the Group’s exports.
DSIH (100% interests)
DSIH is principally engaged in the design, development and manufacture of automatic transmissions in Australia, supplying major international automobile original equipment manufacturers like Ssangyong Motor Company (SYMC), Mahindra & Mahindra and Ford Motor Australia (Ford). DSIH’s net profit after tax was A$0.9 million on revenue of A$62 million in the first half of 20��. DSIH manufactured and sold 35,0�� sets of automatic gearboxes in the first six months of 20��, on track to achieve its full year sales volume target of 73,000 units in 20��, despite some delay in the launch program by one of its major customers during the period.
To expand DSIH’s sales in China and to improve the cost competitiveness of its products, DSIH has set up several 50:50 joint venture companies with other members of the Group. Its first joint venture in China, namely Hunan Jisheng International Drivetrain Systems Co., Ltd. (“Hunan Jisheng”) which was formed with Hunan Geely Automobile Components Company Limited (“Hunan Geely”), one of the Group’s 9�%-owned operating subsidiaries, started official production in August 20��. The total annual production capacity of Hunan Jisheng is �00,000 units per shift. Estimated production and sales volumes for Hunan Jisheng would be approximately 6,000 sets of automatic gearboxes in 20�� and �00,000 sets of automatic gearboxes in 20�2. Hunan Jisheng is currently working with a number of China-based suppliers to localize the supplies of its parts and components. In addition to the supply of automatic transmissions for the Group’s own use, Hunan Jisheng is also discussing with a number of third party car manufacturers in China for the supply of automatic transmissions to these manufacturers in a bid to speed up its scale production in China.
Shanghai LTI (51% interests)
5�%-owned Shanghai LTI is a production joint venture between the Group and MBH. Shanghai LTI was established in June 2007 to achieve volume production of the iconic London taxi (TX4) at a significantly lower cost and for the production of other high-end saloon cars for sales to the domestic and the world market. In addition, Shanghai LTI started to supply body kits and components to MBH for the assembly of a revised TX4 model range for sales in the UK market in November 20�0.

- 26 -
Demand for TX4, however, has been below the original expectations due to the lack of petroleum automatic transmissions version, which is important for generating demand in markets outside Europe, and the continued difficult UK trading condition. Shanghai LTI only achieved sales of 490 units in the first half of 20��, of which 9�% were exported to overseas countries. As a result, Shanghai LTI continued to operate below the break-even level and recorded a net loss of RMB�7 million on revenue of RMB73 million in the first half of 20��.
The new arrangement by MBH to import body kits and parts from Shanghai LTI for assembly of TX4 London taxi in its Coventry facility started in November last year should be able to improve the utilization of the production facilities of Shanghai LTI in the future. MBH, which sources most of the vehicles sold to the international market from Shanghai LTI, had reported strong international sales order book of over �,300 vehicles for 20�� in its 20�� interim report. MBH’s existing international sales order, if materialized, should generate significantly higher sales volume and thus improved profitability for Shanghai LTI in the remaining period of the year.
Outlook
With the positive results of its “Strategic Transformation” in the areas of brand image, product quality, technology and innovation, the Group’s overall competitiveness has strengthened significantly over the past few years, thus putting the Group in a much stronger position to meet new market challenges. With the effort spent in the past few years to further strengthen its export business, through continued improvement in distribution capabilities and revamping of its manufacturing arrangements in major export markets, the Group’s export performance has showed sign of improvement so far in 20��. This should provide the Group with a cushion to buffer any possible cyclical downturn in the China sedan market in the future, thus enabling the Group to sustain longer term growth.
Although there had been better than expected recovery at our major export markets in 20��, the slackening market condition in the China’s sedan market, the higher overall cost base as a result of the addition of two new plants in Jinan and Chengdu, and the higher overheads and expenses caused by the development of three new brands and their associated sales networks, have resulted in less than exciting earnings performance by the Group in the first half of 20��. Motor vehicle sales in most parts of the world market have been weakening since the beginning of the year and look set to deteriorate further in the remainder of the year given the high level of uncertainties in most of the major economies, higher inflation and tightening monetary policies in China. All of these factors could pose significant threat to the Group’s performance in the second half of 20��. As a result, the Group decided to take a more conservative stance, implementing more stringent cost control and lifting cash reserves, aiming at strengthening the Group’s position to compete in a difficult market condition. Over longer-term, the Group will continue to restructure its management system, shifting its focus from product line management to brand management, from technology competence to total quality focus, and from fast growth to sustainable growth, aiming at transforming the Group into a real global automobile manufacturer which is able to compete internationally.

- 27 -
Although competition in both the domestic and export markets is expected to intensify further in the remainder of the year, the Group’s management team decided to keep our 20�� sales volume target of �5% growth to 480,000 units unchanged, believing that the Group’s sales performance should improve in the remaining period of the year, helped by the continued improvement in the Group’s brand image, product and service quality, and more new product launches in the coming few months.
CAPITAL STRUCTURE AND TREASURY POLICIES
The Group funds its short-term working capital requirement mainly through its own operational cash flow, short-term bank loans from commercial banks in China and the credit from its suppliers. For its longer-term capital expenditures including product and technology development costs, investment in the construction, expansion and upgrading of production facilities, the Group’s strategy is to fund these longer-term capital commitments by a combination of its operational cash flow, shareholders’ loan from its parent company, Geely Holding Group and fund raising exercises in the capital market. As at 30 June 20��, the Group’s shareholders’ fund amounted to approximately RMB8.9 billion (As at 3� December 20�0: approximately RMB8.0 billion). Upon exercise of share options, �2.39 million new shares were issued by the Group during the first six months ended 30 June 20��.
EXPOSURE TO FOREIgN EXCHANgE RISK
The Group considers that fluctuations in exchange rate do not impose a significant risk to the Group since the Group’s operations are principally in the Mainland China and Hong Kong and the Group’s assets and liabilities are mainly denominated either in Renminbi or Hong Kong dollars.
LIQUIDITY AND FINANCIAL RESOURCES
As at 30 June 20��, the Group’s current ratio (current assets/current liabilities) was �.2� (As at 3� December 20�0: �.33) and the gearing ratio of the Group was 49% (As at 3� December 20�0: 52%) which was calculated on the Group’s total borrowings to total shareholders’ equity. Total borrowings (excluding the trade and other payables) as at 30 June 20�� amounted to approximately RMB4.4 billion (As at 3� December 20�0: approximately RMB4.� billion) were mainly the Company’s convertible bonds and bank borrowings. For the Company’s convertible bonds, they were unsecured, interest-bearing and can be repaid on early redemption or maturity. For the bank borrowings, they were secured, interest-bearing and to be repaid on maturity. Should other opportunities arise requiring additional funding, the board of directors believe the Group is in a good position to obtain such financing.
EMPLOYEES’ REMUNERATION POLICY
As at 30 June 20��, the total number of employees of the Group was about �7,783 (As at 3� December 20�0: approximately �7,�02). Employees’ remuneration packages are based on their experience and work performance. The packages are reviewed annually by the management who takes into account the overall performance of the working staff and market conditions. The Group also participates in the Mandatory Provident Fund Scheme in Hong Kong and state-managed retirement benefit scheme in the PRC. In addition, employees are eligible for share options under the share option scheme adopted by the Company.

- 28 -
INTERIM DIVIDEND
At a meeting of the Board held on 22 August 20�� the Directors resolved not to pay an interim dividend to shareholders of the Company (20�0: Nil).
PURCHASE, SALE OR REDEMPTION OF THE COMPANY’S LISTED SECURITIES
Neither the Company nor any of its subsidiaries purchased, sold or redeemed any of the Company’s listed securities during the period ended 30 June 20��.
CORPORATE gOVERNANCE
The Company has met with the code provisions of the Code on Corporate Governance Practices (the “CG Code”), as set out in Appendix �4 of the Listing Rules, throughout the six months ended 30 June 20��, except for the deviation from CG Code E.�.2 as explained below:
The CG Code E.�.2 provides that the Chairman of the Board shall attend the annual general meeting of the Company. Due to other commitment in the PRC, Mr. Li Shu Fu (“Mr. Li”), the Chairman of the Board, was unable to attend physically at the annual general meeting of the Company held on �8 May 20�� in Hong Kong. Despite this, the Company had provided another communication channel via conference call for shareholders to directly discuss with Mr. Li during the annual general meeting held on �8 May 20��.
The Company has adopted the Model Code for Securities Transactions by Directors of Listed Issuers (the “Model Code”) as set out in Appendix �0 of the Listing Rules as its own Code for Securities Transactions by Officer (the “Code”). All directors of the Company have confirmed their compliance during the review period with the required standards set out in the Model Code and the Code.
AUDIT COMMITTEE
The Company has an audit committee which was established in accordance with the requirements of the CG Code for the purpose of reviewing and providing supervision over the Group’s financial reporting processes and internal controls. As at 30 June 20�� the audit committee comprises Messrs. Lee Cheuk Yin, Dannis, Song Lin and Yeung Sau Hung, Alex, who are the independent non-executive directors of the Company.
The Audit Committee has reviewed the unaudited interim results of the Group for the six months ended 30 June 20��.

- 29 -
PUBLICATION OF INTERIM REPORT ON THE WEB SITES OF THE COMPANY AND THE STOCK EXCHANgE OF HONg KONg LIMITED
Pursuant to the requirements of the Listing Rules regarding the reporting period, the 20�� interim report will set out all information disclosed in the interim results announcement for the first half of 20�� and will be disclosed on the websites of the Company (http://www.geelyauto.com.hk) and the Stock Exchange of Hong Kong Limited (http://www.hkexnews.hk) in due course.
By Order of the Board ofgeely Automobile Holdings Limited
Li Shu FuChairman
Hong Kong, 22 August 20��
As at the date of this announcement, the executive directors of the Company are Mr. Li Shu Fu (Chairman), Mr. Yang Jian (Vice Chairman), Mr. Gui Sheng Yue (CEO), Mr. Ang Siu Lun, Lawrence, Mr. Yin Da Qing, Richard, Mr. Liu Jin Liang, Dr. Zhao Fuquan, Ms. Wei Mei and Mr. Li Dong Hui, Daniel, the non-executive director of the Company is Mr. Wang Yang and the independent non-executive directors of the Company are Mr. Lee Cheuk Yin, Dannis, Mr. Song Lin and Mr. Yeung Sau Hung, Alex.
Copyright © 2022 FDOKUMEN

