


Bahasa
Halaman
Hukum

Tectonophysics, 121 (1985) 45-62
Elsevier Science Publishers B.V., Amsterdam - Printed in The Netherlands
45
AN INVESTIGATION OF THE RELATIONSHIP BETWEEN THE GEOLOGY OF INDONESIAN SEDIMENTARY BASINS AND HEAT FLOW DENSITY
MOCHAMAD THAMRIN
Department of Geological Evaluation and Development Pertamrna, Jakarta (Indonesia)
(Received February 6. 1985; revised April 23. 1985)
ABSTRACT
Thamrin, M., 1985. An investigation of the relationship between the geology of Indonesian sedimentary
basins and heat flow density. In: A.E. Beck (Editor), Terrestrial Heat Flow and Thermal Regimes.
Tectonophysics, 121: 45-62. ’
Geothermal data. collected from 929 wells drilled by oil companies in 20 Tertiary basins of Indonesia,
have been related to the geology and tectonics of the area. It is found that the thermal conductivity
increases with the depth of burial and degree of compaction in both transgressive and regressive
sediments but decreases with increases in impurities and heterogeneous grain sizes. The temperature
gradient is controlled mainly by the depth and temperature of a heat source beneath a basin. Very high
heat-flow densities ( > 125 mW mA2) found in central Sumatra, South Sumatra, Salawati Basin and
Bintuni Basin may be caused by relatively shallow magmatic diapirism.
INTRODUCTION
As part of a study of the role of temperature and depth of burial of hydrocarbon
source rocks in the process of oil generation, Pertamina instituted a program of
determining temperature gradients and thermal properties in numerous holes drilled
in oil fields of the sedimentary basins of Indonesia. These data have been related to
the local and regional geology and it is the purpose of this paper to report our
observations and conclusions.
In section I the regional and local geology is discussed, in section II we describe
the methods used for determining thermal conductivity and temperature gradients,
in section III we derive terrestrial heat flow density values, and draw conclusions
relating heat flow densities to the geology of the area of interest in section IV.
I. REGIONAL GEOLOGY
Indonesia is an area where three major lithospheric plates, the Eurasian, Pacific,
and Indian-Australian, as well as many smaller plates, interact in a complex
0040-1951/85,‘$03.30 0 1985 Elsevier Science Publishers B.V.
46
manner. The presently active subduction zones and strike-slip faults have been
identified by Carvalho et al. (1980), Eubank and Maki (1981) and Katili (1975); in
the regional geological setting eastern Indonesia is more complex than western
Indonesia.
Sedimentary basins
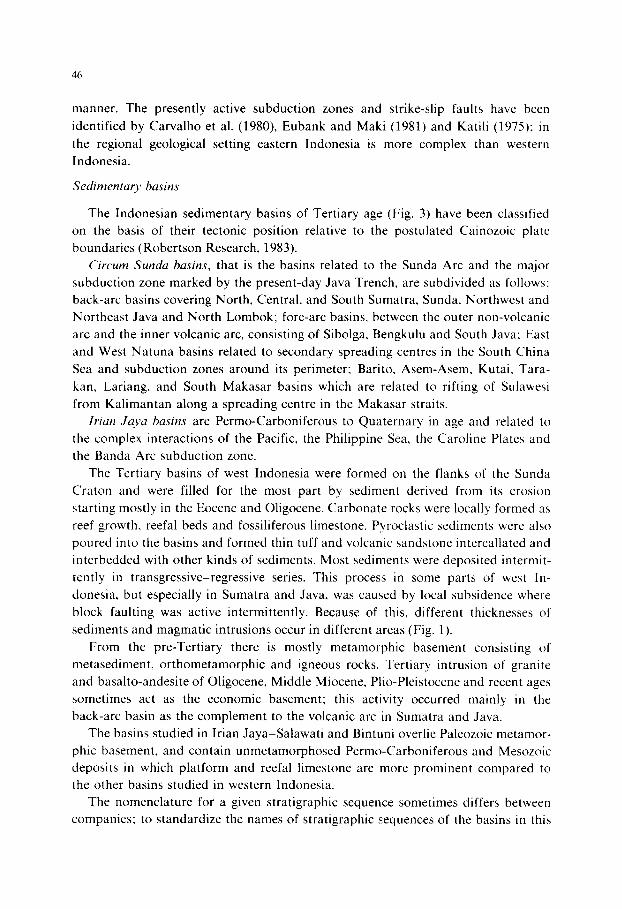
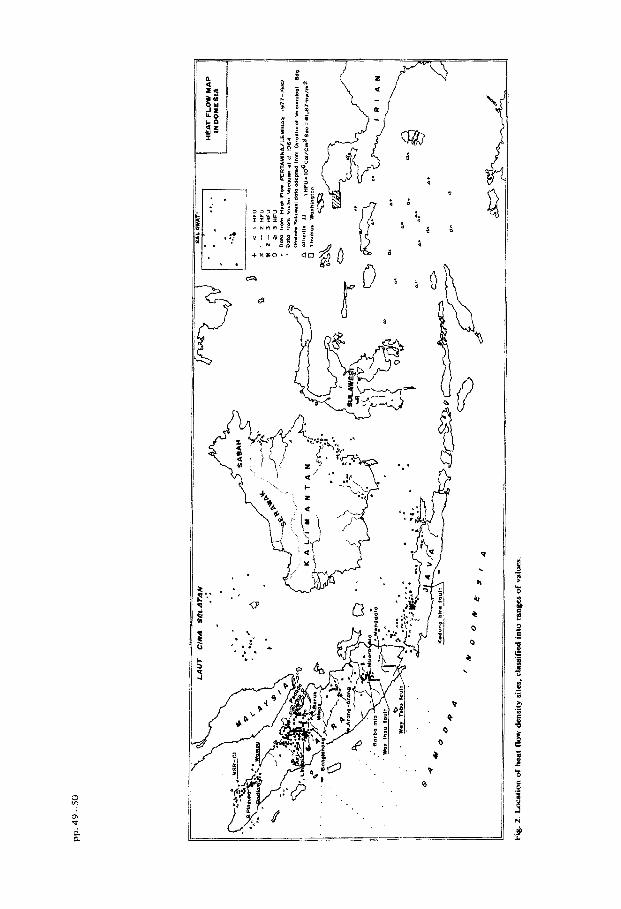
The Indonesian sedimentary basins of Tertiary age (Fig. 3) have been classified
on the basis of their tectonic position relative to the postulated Cainozoic plate
boundaries (Robertson Research, 1983).
Circum Sunda basins, that is the basins related to the Sunda Arc and the major
subduction zone marked by the present-day Java Trench, are subdivided as follows:
back-arc basins covering North. Central, and South Sumatra, Sunda, Northwest and
Northeast Java and North Lombok; fore-arc basins, between the outer non-volcanic
arc and the inner volcanic arc, consisting of Sibolga, Bengkulu and South Java; East
and West Natuna basins related to secondary spreading centres in the South China
Sea and subduction zones around its perimeter; Barito, Asem-Asem. Kutai, Tara-
kan, Lariang, and South Makasar basins which are related to rifting of Sulawesi
from Kalimantan along a spreading centre in the Makasar straits.
Zrian Jqva basins are Permo-Carboniferous to Quaternary in age and related to
the complex interactions of the Pacific, the Philippine Sea, the Caroline Plates and
the Banda Arc subduction zone.
The Tertiary basins of west Indonesia were formed on the flanks of the Sunda
Craton and were filled for the most part by sediment derived from its erosion
starting mostly in the Eocene and Oligocene. Carbonate rocks were locally formed as
reef growth. reefal beds and fossiliferous limestone. Pyroclastic sediments were also
poured into the basins and formed thin tuff and volcanic sandstone intercallated and
interbedded with other kinds of sediments. Most sediments were deposited intermit-
tently in transgressive-regressive series. This process in some parts of west In-
donesia, but especially in Sumatra and Java, was caused by local subsidence where
block faulting was active intermittently. Because of this, different thicknesses of
sediments and magmatic intrusions occur in different areas (Fig. 1).
From the pre-Tertiary there is mostly metamorphic basement consisting of
metasediment, orthometamorphic and igneous rocks. Tertiary intrusion of granite
and basalto-andesite of Oligocene, Middle Miocene. Plio-Pleistocene and recent ages
sometimes act as the economic basement; this activity occurred mainly in the
back-arc basin as the complement to the volcanic arc in Sumatra and Java.
The basins studied in Irian Jaya-Salawati and Bintuni overlie Paleozoic metamor-
phic basement, and contain unmetamorphosed Permo-Carboniferous and Mesozoic
deposits in which platform and reefal limestone are more prominent compared to
the other basins studied in western Indonesia.
The nomenclature for a given stratigraphic sequence sometimes differs between
companies: to standardize the names of stratigraphic sequences of the basins in this
3N3303W
d
3N3303
3N330E
lllO
pp.
49-m
-.-
-___
----
-==
Fig.
2.
lmxt
ion
of h
eat
flow
den
sity
sit
u,
clas
sifi
ed in
to r
ange
s of
val
ues
. . . . . . . . . . . . . . *:. . . . . . . . . .:. OEI . . . . . . . . .:. . . . . . . . -:. . . . . . *:.
study, the epochs of the Tertiary will be used, at least when discussing thermal
conductivity.
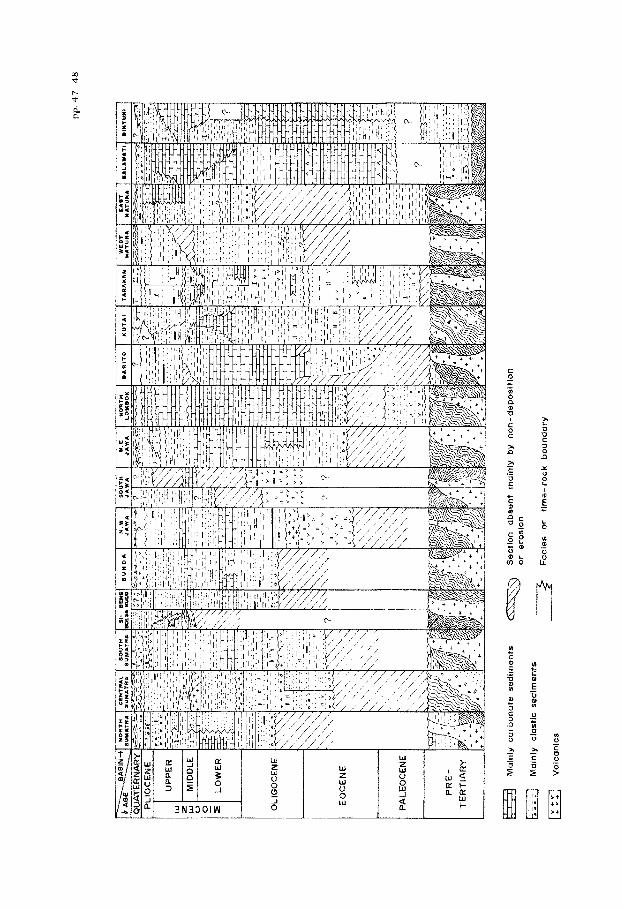
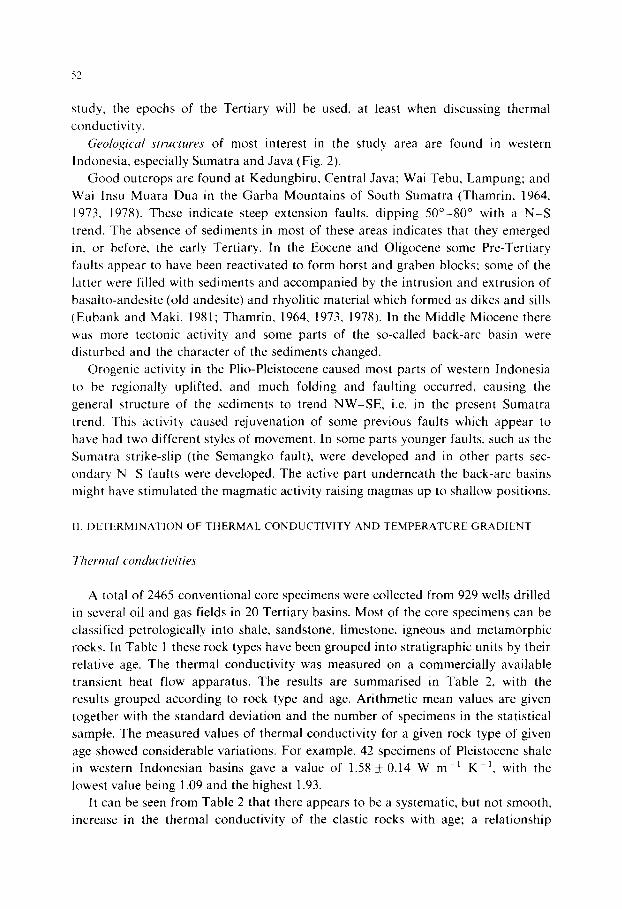
Geological structures of most interest in the study area are found in western
Indonesia. especially Sumatra and Java (Fig. 2).
Good outcrops are found at Kedungbiru, Central Java; Wai Tebu, Lampung; and
Wai Insu Muara Dua in the Garba Mountains of South Sumatra (Thamrin. 1964,
1973. 1978). These indicate steep extension faults, dipping 50”-80” with a N-S
trend. The absence of sediments in most of these areas indicates that they emerged
in, or before. the early Tertiary. In the Eocene and Oligocene some Pre-Tertiary
faults appear to have been reactivated to form horst and graben blocks: some of the
latter were filled with sediments and accompanied by the intrusion and extrusion of
basalto-andesite (old andesite) and rhyolitic material which formed as dikes and sills
(Eubank and Maki, 1981; Thamrin, 1964, 1973, 1978). In the Middle Miocene there
was more tectonic activity and some parts of the so-called back-arc basin were
disturbed and the character of the sediments changed.
Orogenic activity in the Plio-Pleistocene caused most parts of western Indonesia
to be regionally uplifted, and much folding and faulting occurred, causing the
general structure of the sediments to trend NW-SE, i.e. in the present Sumatra
trend. This activity caused rejuvenation of some previous faults which appear to
have had two different styles of movement. In some parts younger faults, such as the
Sumatra strike-slip (the Semangko fault), were developed and in other parts sec-
ondary N-S faults were developed. The active part underneath the back-arc basins
might have stimulated the magmatic activity raising magmas up to shallow positions.
Il. DETERMINATION OF THERMAL CONDUCTIVITY AND TEMPERATURE GRADIENT
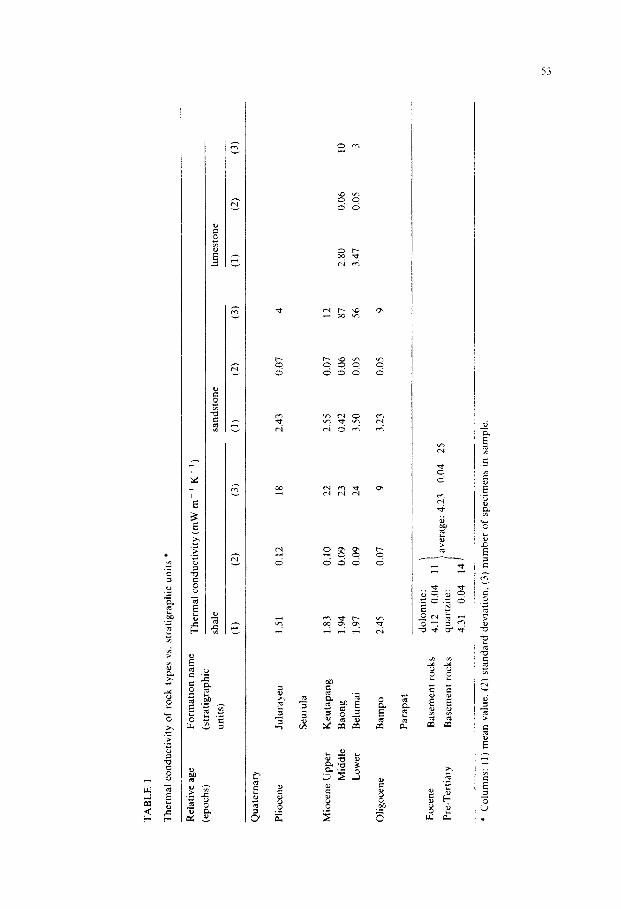
Thertnul conductiuities
A total of 2465 conventional core specimens were collected from 929 wells drilled
in several oil and gas fields in 20 Tertiary basins. Most of the core specimens can be
classified petrologically into shale, sandstone, limestone. igneous and metamorphic
rocks. In Table 1 these rock types have been grouped into stratigraphic units by their
relative age. The thermal conductivity was measured on a commercially available
transient heat flow apparatus. The results are summarised in Table 2, with the
results grouped according to rock type and age. Arithmetic mean values are given
together with the standard deviation and the number of specimens in the statistical
sample. The measured values of thermal conductivity for a given rock type of given
age showed considerable variations. For example, 42 specimens of Pleistocene shale
in western Indonesian basins gave a value of 1.58 + 0.14 W m-’ Km’. with the
lowest value being 1.09 and the highest 1.93.
It can be seen from Table 2 that there appears to be a systematic, but not smooth,
increase in the thermal conductivity of the elastic rocks with age; a relationship
TA
BL
E
I
The
rmal
co
nduc
tivity
of
ro
ck
type
s vs
. st
ratig
raph
ic
units
*
Rel
ativ
e ag
e
(epo
chs)
Form
atio
n na
me
The
rmal
co
nduc
tivity
(m
W
mm
’ K
.. ‘)
(s
trat
igra
phic
units
) sh
ale
sand
ston
e lim
esto
ne
____
_I
(1)
(2)
(3)
(1)
(2)
(3)
(1)
(2)
(3)
Plio
cene
Ju
lura
yeu
1.51
0.
12
18
2.43
0.
07
4
Seur
ula
Mio
cene
U
pper
K
euta
pang
1.
83
0.10
22
2.
55
0.07
12
Mid
dle
Bao
ng
1.94
0.
09
23
0.42
0.
06
87
2.80
0.
06
10
Low
er
Bel
umai
1.
97
0.09
24
3.
50
0.05
56
3.
41
0.05
3
Olig
ocen
e B
ampo
2.
45
0.07
9
3.23
0.
05
9
Para
pat
-
Eoc
ene
Pre-
Ter
tiary
dolo
mite
: B
asem
ent
rock
s 4.
12
0.04
11
B
asem
ent
rock
s qu
artz
ite:
aver
age:
4.
23
0.04
25
* C
olum
ns:
(1) m
ean
valu
e.
(2)
stan
dard
de
viat
ion.
(3
) nu
mbe
r of
sp
ecim
ens
in
sam
ple.
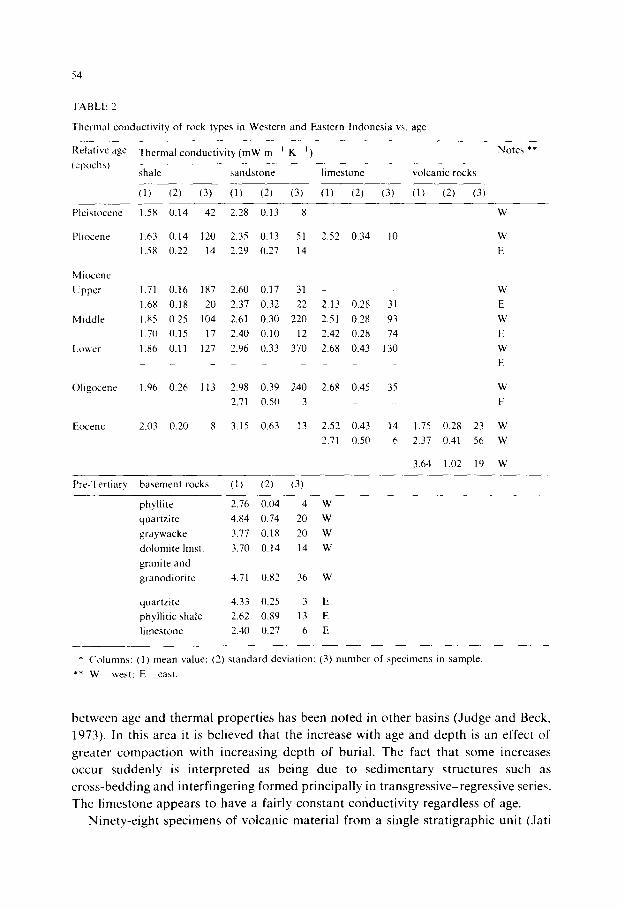
TABLE 2
Thermal conductivity of rock types in Western and Eastern Indonesia vs. age
Relative age
(cpoch~)
Pleistocene
Plmcene
Miocene
Upper
MIddIe
Lower
tocene
Thermal conductivity (mW m ’ Km’) Notes **
shale sandstone limestone volcanic rocks
(1) (2) (3) (1) (2) (3) (1) (2) (3) (1) (2) (3)
7.58 0.14 42 2.28 0.13 X W
1.63 0.14 120 2.35 0.13 51 2.52 0.34 10 W
1.5x 0.22 14 2.29 0.27 14 E
1.71 0.16 1X7 2.60 0.17 31 - _
1.68 0.18 20 2.37 0.32 22 2.13 0.28 31
1.85 0.25 104 2.61 0.30 220 2.51 0.28 93
1.70 0.15 17 2.40 0.10 I2 2.42 0.28 74
1.X6 0.11 127 2.96 0.33 370 2.68 0.43 130 _ _
1.96 0.26 113 2.98 0.39 240 2.68 0.45 35 2.71 0.50 3 - _
2.03 0.20 8 3.15 0.63 13 2.52 0.43 14 1.75
2.71 0.50 6 2.37
3.64
W
E
0.28 23 W
0.41 56 W
1.02 I9 w
Pre-Tertiary basement rocks (1) (2) (3)
phyllite
quartzite
graywacke
dolomite Imst.
granite and
granodlorite
quartzite 4.33 0.25 3 E
phyllitic shale 2.62 0.89 13 E
limestone 2.40 0.27 6 E
2.76 0.04 4 W
4.84 0.74 20 w
3.77 0.18 20 w
3.70 0.14 14 w
4.71 0.82 36 W
* Columns: (1) mean value; (2) standard deviation; (3) number of specimens in sample
** W-west: E-east.
between age and thermal properties has been noted in other basins (Judge and Beck,
1973). In this area it is believed that the increase with age and depth is an effect of
greater compaction with increasing depth of burial. The fact that some increases
occur suddenly is interpreted as being due to sedimentary structures such as
cross-bedding and interfingering formed principally in transgressive-regressive series.
The limestone appears to have a fairly constant conductivity regardless of age.
Ninety-eight specimens of volcanic material from a single stratigraphic unit (Jati
Barang volcanics) and consisting of tuff, volcanic sand and volcanic breccia, gave
mean values of 1.75 & 0.28, 2.37 _t 0.41, and 3.64 + 1.02 W rn-’ K-i respectively.
The pre-Tertiary rocks cannot be grouped by epoch; the values given in Table 2
are for the specimens grouped without regard to age.
Temperature gradients
Because of the absence of any other data, the temperature gradient for each drill
hole was calculated from an ambient mean annual surface temperature of 26.7”C as
used by the Indonesian Petroleum Association (Aadland and Phoa, 1981) and the
bottom-hole temperature obtained after correction according to a Schlumberger
Nomograph, which is equivalent to the method used by Dowdle and Cobb (1975)
and Ferth and Whichman (1977).
III. CALCULATION OF HEAT FLOW DENSITIES
Since the temperature gradient is essentially being averaged over a considerable
depth of borehole, the heat flow density value must be calculated using a weighted
harmonic mean conductivity (A,,,,,, ) for the whole stratigraphic column of N
formations, where each of the formations with a mean conductivity X,,, as given in
Table 3, is weighted according to its thickness (d,) in the column. This is equivalent
to the calculation of the series type conductivity (Beck and Beck, 1965; Beck, 1976)
given by eqn. (1).
Iv
The values of heat flow density are classified according to the system of Anderson
et al. (1978), namely, the heat flow density is low if H < 40 mW me2, normal if
40 < H-c 85 mW mp2, high if 85 < H < 125 mW me2 and very high if H > 125 mW
m 2. If the thermal conductivity of the stratigraphic column through which the well
bore passes is similar for all heat flow density sites, then a similar classification can
be used for temperature gradients.
The results for heat flow density values are given in Table 4 and Fig. 4.
From Table 4 it can be seen that most of the basins have normal to high heat flow
densities with three of the back arc basins having high to very high values and two of
the fore arc basins having very low values.
Figures 3 and 4 demonstrate that in spite of the rather crude method of
estimating temperature gradients from a single mean annual surface temperature
and a single temperature at considerable depth, when several holes are available in a
given region the heat flow density values obtained are reasonably reliable. Because
of the much larger statistical errors associated with single sites, no attempt is made
to discuss differences in heat flow densities between individual wells.
TA
BL
E
3
Dat
a of
fo
rmat
ions
fo
r he
at
flow
ca
lcul
atio
n (e
xam
ple:
N
orth
Su
mat
ra
basi
n)
Wel
l da
ta
Dat
a of
for
mat
tons
*
Hea
t fl
ow
para
met
ers
**
Seur
ula
Fm.
Keu
tapa
ng
Fm.
Bao
ng
Fm.
Bel
umai
Fm
. B
ampo
Fm
. T
. D.
A,,,
, G
H
d,
1,
I:
d,
A,
8 d,
A
, R
d,
A
,, R
d,
, A
,, R
Tg.
M
uraw
a-1
205
1.86
53
.8
1155
1.
96
51.2
74
2 2.
07
48.4
11
7 2.
91
34.4
40
5 2.
46
40.8
26
82
2.09
46
.0
96.1
Dis
ki-l
42
5 1.
92
58.0
71
2 2.
35
47.2
12
03
2.17
51
.2
- -
- _
2340
2.
17
51.2
11
1.2
Dis
ki-
402
1.95
58
.2
922
2.06
55
.2
861
2.13
53
.4
75
2.38
41
.7
- -
- 24
27
2.07
52
.9
109.
5
Wam
pu-3
45
0 1.
87
61.9
96
2 2.
18
53.3
10
09
2.12
54
.7
325
2.79
41
.6
- -
2798
2.
16
53.5
11
4.9
Wam
pu-5
44
5 1.
91
68.5
95
3 2.
17
60.3
10
30
2.09
62
.5
236
2.57
51
.0
- -
- 27
34
2.12
61
.0
129.
2
P. P
akam
-1
203
1.87
61
.5
930
2.17
53
.2
1313
2.
24
51.4
41
4 2.
98
30.7
-
- 28
69
2.27
50
.3
114.
1
P. P
akam
-2
298
1.96
53
.0
1252
2.
07
50.3
82
7 2.
11
49.7
29
7 2.
43
39.6
-
- -
2875
2.
12
44.3
94
Bat
uman
di-2
A
441
1.99
43
.4
901
2.21
39
.1
1102
2.
09
41.2
12
6 2.
55
33.9
-
- 26
00
1.91
40
.3
86.1
Bat
uman
di-3
44
5 1.
93
38.5
76
5 2.
10
35.4
12
64
2.16
34
.4
45
2.23
21
.3
- -
2561
2.
11
34.6
73
.6
Bas
ilanA
l 43
3 1.
83
61.2
a2
7 1.
94
57.8
10
72
2.09
53
.6
183
2.54
44
.2
115
2.80
40
.1
3074
2.
04
51.0
10
4.1
Tan
jung
pura
-1
180
1.93
53
.7
848
2.08
49
.8
899
2.05
50
.1
18
3.49
29
.7
- -
- 19
45
2.06
50
.3
103.
7
Dar
at
Uta
ra-1
-
- -
95
2.18
67
.0
2416
2.
23
65.5
63
4 2.
19
52.8
-
- -
3145
2.
32
63.0
14
6.3
Tei
aga
A-l
--
-
- _
_ 24
63
2.14
59
.3
93
2.98
42
.4
563
2.57
49
.2
3119
2.
22
57.0
12
6.7
Tel
aga
B-l
49
5 2.
16
42.1
21
14
2.14
42
.1
- -
- -
- -
2609
2.
14
42.3
90
.7
P. B
rand
an-l
36
5 1.
89
43.5
10
50
1.96
41
.9
785
2.14
39
.2
- -
- _
2200
2.
01
40.9
81
.9
Geb
ang-
9 37
1 1.
84
58.0
96
6 2.
05
52.2
98
4 2.
07
51.7
-
- -
- -
2321
1.
68
52.8
10
6.6
Palu
h T
abua
n-21
31
3 1.
73
54.9
98
7 1.
98
45.4
90
0 2.
06
43.7
--
-
- 22
00
1.97
45
.4
89.5
Sem
bila
n-A
l0
310
2.0
52.0
10
66
1.98
52
.9
1416
2.
12
49.0
89
7 2.
21
30.2
-
- 37
20
2.27
45
.9
104.
5
Susu
-Al
--
- 9.
50
1.98
48
.4
1027
2.
10
45.1
-
- -
_ 19
77
2.04
46
.9
95.7
Susu
T
imur
-1
295
1.75
47
.0
1070
1.
99
41.4
69
1 2.
09
39.5
--
-
- _
2066
1.
98
41.5
82
.3
Susu
Se
lata
n-1
158
0.68
50
.1
1004
2.
13
45.6
19
14
2.18
44
.4
- -
- 30
76
2.57
45
.2
97.0
* d,
=
form
atio
n th
ickn
ess
(m),
h,
, =
ther
mal
co
nduc
tivity
(m
W
m
’ K
’ 1
, g =
tem
pera
ture
gr
adie
nt
(mK
m
m ’
)_ *
* T
. D
. =
tota
l de
pth
(m).
h,
,, =
ther
mal
cond
uctiv
ity
of
the
stra
tigra
phic
co
lum
n (m
W
m-r
K
-’
)% G
= a
vera
ge
tem
pera
ture
gr
adie
nt
in c
olum
n (m
K
m
‘).
Ib =
hea
t fl
ow
dens
ity
(mW
m
-:)
.
i 50
40
30
2
20
IO
0 1 7
I 3 I 80
i 50
N = 113
40
30
20
13
1
IO
0 160 240 320mWm’~
N. SUMATRA C. SUMATRA S. SUMATRA
i 50
40
N = 16 30
20
SIBOLGA 8 BENGKULU
N
t
4
50 .B
i x
N-176
4c
3c
2c 16
L IC
5 4
c , 240 320 mWme2
i 58 50
40
30 1 2:
20
IO
0
80 1w 240 320 mwm-’ 30 160 240 320mwm~
SUNDA 8 NW. JAWA
1 40
N=56 30
20
13
IO
0 30 Id0 240 3ZOmWm~f
I
I
N=357
15
l- 160 240 32OmWm*~
i 50
40
N=69 I N-47
i SC
4c
N=26 30
m 20
10 IO
0 a0 160 P40 320 mwm.’
80 160 240 320mWm’t
E 8 NE. JAWA SEA
N-45
24
13
IL
6
2
*0 160 t40 3ZOmWm~’
BARITO, KUTAI 8 TARAKAN E 8 W NATUNA SEA SALAWATI 8 BINTUNI
Fig. 4. Heat flow density histograms for several of the basins studied.
TA
BL
E
4
Hea
t fl
ow
dens
ities
da
ta
sum
mar
y of
tw
enty
ba
sins
in
In
done
sia
*
No.
N
ame
of
Bas
ins
Num
ber
of w
ells
T
empe
ratu
re
grad
ient
(m
K
m
‘)
.- L
N
H
vH
L
N
H
V
H
(1)
(2)
(1)
(2)
(1)
(2)
(1)
(2)2
h8
1.
N.
Sum
atra
23
71
13
39
3.
5 48
5.
6 56
7.
1
2.
C.
Sum
atra
81
95
55
5.
4 78
4.
7
3.
S. S
umat
ra
12
230
15
52
3.8
64
2.0
4.
Sibo
lga
5 7
1 16
1.
8 22
3.
0 39
5.
Ben
gkul
u 2
22
0.6
6.
Sund
a 15
5
2 44
4.
7 50
4.
0 84
12
.8
7.
NW
Ja
wa
38
20
3 39
4.
6 48
4.
9 70
3.
7
8.
Biii
ton
& P
ati
5 2
I 29
6.
0 50
0.
9 61
9.
S. J
awa
Sea
2 24
1.
5
10.
NE
Ja
wa
2 18
34
2.
3 40
7.
6
11.
NE
Ja
wa
Sea
13
10
15
35
6.3
44
3.7
12.
Mak
asar
1
3 2
32
2.3
40
0.3
13.
Ase
m-A
sem
4
3 32
5.
8 48
1.
3
14.
Bar
ito
7 6
33
3.7
40
6.3
15.
Kut
ei
28
6 37
4.
9 40
5.
3
16.
Tar
akan
10
1
35
4.2
40
17.
E.
Nat
una
10
1 31
5.
8 36
18.
W.
Nat
una
8 9
33
3.1
41
4.6
19.
Sala
wat
i 10
12
4
36
9.3
46
6.3
70
10.5
20.
Bin
tuni
2
14
1 2
24
3.0
30
3.7
53
0.0
81
5.1
NO
. N
ame
of
The
rmal
co
nduc
tivity
(m
W
m-’
K
-‘)
Hea
t fl
ow
(mW
m
’ )
B
asin
s L
N
H
V
H
L
N
H
VH
-I
_~
(1)
12)
(1)
(2)
Uf
(2)
(1)
(2)
(1)
(2)
(1)
(2)
(1)
(2)
(1)
(2)
1.
N.
Sum
atra
2.
C.
Sum
atra
3.
S. S
umat
ra
4.
Sibo
lga
5.
Ben
gkul
u
6.
Sund
a
7.
NW
Ja
wa
8.
Bili
ton
& P
ati
9.
S. J
awa
Sea
10.
NE
Jaw
a
11.
NE
Ja
wa
Sea
12.
Mak
asar
13.
Ase
m-A
sem
14.
Bar
ito
15.
Kut
ei
16.
Tar
akan
17.
E.
Nat
una
18.
W.
Nat
una
19.
Sala
wat
i
20.
Bin
tuni
2.24
1.88
2.09
1.50
2.05
0.5
2.40
1.85
1.80
2.18
2.03
1.97
1.99
2.24
2.16
2.16
2.24
2.13
2.05
2.19
2.12
0.1
1.78
2.17
2.01
2.05
2.10
1.95
1.96
2.21
2.14
2.20
2.29
2.38
2.38
2.47
2.41
2.19
2.28
2.21
1.88
2.41
0.
2 80
2.04
0.
1
2.03
0.
1
36
4 53
40
1
1.83
0.
1 74
2.08
0.
1 71
2.29
61
49
68
70
32
71
69
14
66
71
61
73
2.09
0.
2 69
2.03
0.
1 36
5
52
2 10
2
110
106
8 10
7
7 97
9 94
10
109
4 5 94
13
91
6 92
7 11
3
11
98
11
95
7 89
10
102
I 93
10
100
6 99
11
138
13
9 16
0 31
8 13
0 2
0 8 15
3 15
10
141
7
6 13
9
9 6 1 14
13
10 8 9
145
19
166
5
* L
= l
ower
, N
= n
orm
al,
H =
hi
gh,
vH
= ve
ry
high
; (1
) m
ean
valu
e,
(2)
stan
dard
de
viat
ion.
60
61
IV. DISCUSSION
In this section we try to relate the statistical picture given by Fig. 4 to lithology,
geology and tectonics.
First we note from Table 2 that the thermal conductivity of some rock types
depends on age. and therefore depth. We attribute the changes to compaction; in
particular we note that shale increases by 28% and sandstone by 38%. Grouping rock
types by their ages or stratigraphic units may therefore be very important in detailed
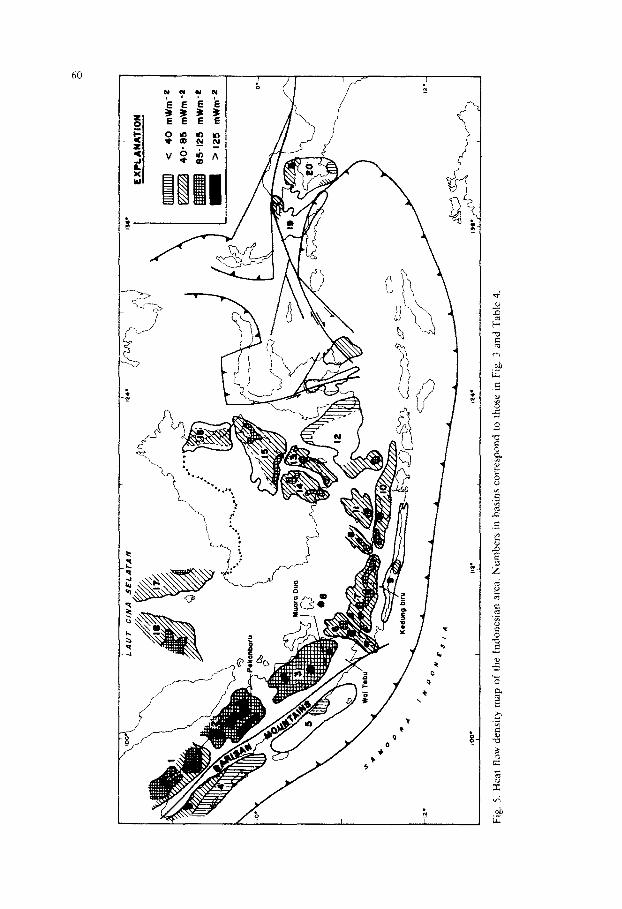
petroleum engineering studies. From Table 4 and Fig. 5 we note that heat flow
densities appear to decrease regularly from high (to very high) values in the back-arc
basins to low in the fore-arc basins. The highest values of heat flow densities and
temperature gradients are found in the central Sumatra and the south Sumatra
basins. Since the north Sumatra basin was developed in the same tectonic framework
as central and south Sumatra, presumably its significantly different heat flow density
value is related to its submergence later than the central and southern parts (Fig. 2).
The central and south Sumatra basins suffered high intensity tectonic movement
which formed deep steep faults: there were at least three tectonic episodes in the
Oligocene, Middle Miocene and Plio-Pleistocene. All of them produced folding and
faulting, and were accompanied by magmatic intrusion and extrusion, which could
indicate magmatic diapirism. The shallow depths of magmatic diapirs, such as those
in central Sumatra (Carvalho et al., 1980; Eubank and Mnki, 1981) would obviously
have a significant effect on the heat flow density of the basin. Carvalho et al. (1980)
indicate how to estimate the depth of magmatic diapirism in central Sumatra.
In the south Sumatra basin, diapirism occurred westward of Lematang Basin
between the Garba Mountains and the Barisam Mountains. Therefore, the very high
heat flow densities and thermal gradients of some locations in the area may be
explained as being due to magmatic diapirism; this view is supported by the
existence of solfatars on the west rim of the basin. about 20 km from Muaradua.
SUMMARY AND CONCLUSION
The results of this study in 20 sedimentary basins of Indonesia indicate that the
thermal conductivity of sedimentary rocks is affected by textural composition and
compaction due to burial. Therefore. grouping the rock types by age may reveal very
high heat flow densities and temperature gradients which might indicate the ex-
istence of shallow magmatic diapirism.
As can be seen from Fig. 5, the Tertiary basins of Indonesia fall into the category
of normal to hot basins except those that are near the active subduction zone.
ACKNOWLEDGEMENTS
The author gratefully acknowledges the management of Pertamina for permission
to present this paper at a Heat Flow symposium of the IASPEI Regional Assembly
62
in Hyderabad, India. I thank Ir. AK. Soejoso and Drs. Luki Witoelar, Division
Head of Litbang EP, for approving a heat flow study in the working program, and
Professors A.E. Beck and S. Uyeda who provided constructive criticism and com-
ment.
REFERENCES
Aadland, A.J. and Phoa, R.S.K., 1981. Geothermal Gradient Map of Indonesia. Indonesian Petroleum
Association. Jakarta.
Beck. A.E., 19’76. An improved method of computing the thermal conducti~,ity of ~uid-filled sedimentary
rocks. Geophysics. 41: 133-144.
Beck, J.M. and Beck, A.E., 1965. Computing thermal conductivities of rocks from chips and conventinal
specimens. J. Geophys. Res.. 70: 5227-5259.
Carvalho, H. da S., Purwoko, Siswoyo, Thamrin, M. and Vacquier, V., 1980. Terrestrial Heat Row in the
Tertiary basin of central Sumatra. Tectonophysics. 69: 163-188.
Dowdle. W.L. and Cobb, W.M.. 1975. Static formation temperature from well logs-an empirical
method. J. Pet. Technol, 27: 1326-1330.
Eubank, L.R.T. and Maki. C.. 1981. Structural geology of the central Sumatra back-arc basin. IPA Proc.
1981.
Ferth, W.H. and Whichman, P.A., 1977. How to determine static BHT from well log data. World Oil.
Jan.: 105-106.
Judge, AS. and Beck, A.E., 1973. Analysis of heat flow data in several boreholes in a sedimentary basin.
Can. J. Earth Sci.. 10: 1494-1507.
Katili. J.A.. 1975. Volcanism and plate tectonics m the Indonesian Island arc. Tectonophysics, 26:
165-188.
Robertson Research, 1983. Petroleum Geochemistry of Indonesian Basins. Robertson Research lnterna-
tionai Ltd., Llandudno, U.K., Vol. 1, pp. 6-8.
Thamrin, M., 1964. Preliminary report on the geology of the north central part of South Serayu Mts.
Major thesis for Sarjana degree ITB Bandung (unpublished).
Thamrin, M.. 1973. Preliminary report on the geology of Tanjung Kemala, Lampong. Exploration report
for Pertamina.
Thamrin, M.. 1978. Preliminary report on the geology of Garba Mountains. Muara Dua, South Sumatra.
R&D report, Pertamina (unpublished).
Thamrin, M.. Siswoyo, Sandjojo, S.. Prayitno, and Siregar, I.. 1980. Heat flow in the Tertiary basin of
South Sumatra, Indonesia. Proc. 16th Session CCOP, Bandung, pp. 250-269.
Thamrin, M.. Siswoyo and Pray&no, 1981a. Heat flow in the Tertiary basin of North Sumatra. Indonesia.
Proc. 17th Session CCOP, Bangkok, pp. 394-408.
Thamrin. M., Siswoyo and Prayitno, 1981b. Heat flow in the Tertiary basin of Northwest Java, Indonesia.
Proc. 18th Session CCOP, Seoul.
Copyright © 2022 FDOKUMEN

