


Bahasa
Halaman
Hukum

An Entrepreneurship Perspective on the
Formation and Growth of Business Groups
in the Small Business Sector
by
Donato Iacobucci
A thesis submitted to the
University of Stirling
For the degree of
Doctor of Philosophy
Department of Business and Organisation
University of Stirling
June 2009
brought to you by COREView metadata, citation and similar papers at core.ac.uk
provided by Stirling Online Research Repository
ii
Abstract
This thesis is a contribution to our understanding of business groups in the small busi-
ness sector. Specifically, its aim is to verify to what extent the consideration of entrepre-
neurial processes can advance our understanding of this phenomenon. A ‘business group’
is a set of companies which are legally distinct but belong to the same person or people.
Despite the significant presence of business groups in the small business sector, most of
the literature on business groups addresses large groups. This study demonstrates that the
available theories of business groups – the financial and the diversification theories – are
not able to explain the presence and characteristics of business groups in the small business
sector. Given the little work done on the issue, the research strategy involves the use of
both, quantitative and qualitative methods. Quantitative methods are used to test proposi-
tions deduced from available models of business groups; qualitative methods, based on
case studies and direct interviews, are used to get new insights about the phenomenon and
develop theoretical propositions. Quantitative analyses refer to the population of Italian
business groups; case studies and interviews refer to a sample of business groups in the
Marche region (Italy).
The business group is an organizational form used by portfolio entrepreneurs to grow
and diversify the businesses under their control. By using cross sectional and longitudinal
analyses this study shows that in the small business sector diversification is a substitute
strategy for growth in the original business. Moreover, this study demonstrates that the di-
versification theory is not able to explain the setting up of a business group as in most
cases the degree of diversification observed in small groups is very low.
iii
The thesis demonstrates that entrepreneurial processes associated with the exploitation
of new business opportunities by portfolio entrepreneurs play a crucial role in explaining
the formation and characteristics of business groups. The start-up phase is critical for the
success of a new business as it requires complete dedication of time and attention by the
entrepreneur to continuously adjust the planned actions to the unforeseen events and un-
predictable contingencies that are typical of this phase. The legal autonomy granted to the
new venture helps focus resources and monitor results. In addition to this and more than
anything else, legal autonomy allows entrepreneurs to modify the ownership structure of
the new business and give minority shares to people involved in the start-up. The financial
explanation of business groups stresses the importance of legal autonomy as a way for ma-
nipulating the ownership structure of new businesses, to raise outside equity. The thesis
demonstrates that the causal relationship is the opposite of that hypothesised by the finan-
cial explanation: it is not so much the aim of raising outside equity that determines the in-
volvement of external shareholders as the need to involve and motivate people in the start
up of the new business that induces entrepreneurs to sell minority shares in it, thus enlarg-
ing the entrepreneurial team. By involving other people in the start-up of new ventures,
portfolio entrepreneurs enhance their ability to enter new businesses while retaining own-
ership and control of the ones already established. The empirical analysis revealed the exis-
tence of three different patterns: joint venture with established entrepreneurs, employee in-
volvement and intrapreneurship. The first is when new ventures are set up with other estab-
lished entrepreneurs. The second is when the entrepreneur gives a share of the new com-
pany to an employee to secure his/her involvement in the start-up of a new venture (em-
ployee involvement). The third is when the new business is established as a result of the
inspiration of an ‘intrapreneurial’ employee who takes major responsibility for the devel-
iv
opment of the business. As well as the discovery and analysis of these three forms, the the-
sis provides a theoretical explanation of entrepreneurial team development in business
groups, based on the problems faced by portfolio entrepreneurs in allocating time and at-
tention between the running of established businesses and the exploitation of new business
opportunities. By integrating the latter explanation with other models of business groups
the thesis provides a more general framework for understanding the formation and dynam-
ics of business groups in the small business sector. The thesis also provides contributions
to explain the formation and dynamics of entrepreneurial teams in a multi business context
and in situations where there is a ‘dominant’ or ‘lead’ entrepreneur and one or more ‘asso-
ciate’ or ‘sub’ entrepreneurs.
Studying the formation and evolution of business groups poses several methodological
problems, as groups are complex systems, characterised by the presence of several compa-
nies, different architectural structures and a multi-business context. The thesis provides
methodological contributions on the ways to represent the current structure of business
groups and on how to analyse their evolution over time.

v
Preface and acknowledgements
The first idea for this research came to me in the year 2000 when reading the 1998
paper by Peter Rosa on business clusters in entrepreneurial firms. For some years I had
been involved in the study of the growth processes of small and medium-sized firms in It-
aly and I came across the phenomenon of business groups. Indeed, most of the companies I
was analysing ended up forming a business group. At that time, the phenomenon of busi-
ness groups was studied almost exclusively with reference to large firms. In the case of
small firms, the prevailing idea (at least in Italy) was that business groups were formed for
the purpose of concealing the true scale of the activities under the control of the entrepre-
neur in order to take advantage of the incentives and benefits which are available to small
firms. I was unconvinced about this interpretation and looking for alternative explanations.
When reading the paper by Peter Rosa, I got the feeling that he was going down a route
which I wanted to explore. I contacted Peter and we started planning a research project
with the aim of contributing to explanations of the phenomenon of business groups in the
small business sector. My sincere thanks to Peter are therefore not only for his help in en-
couraging me during these years and supervising my work, but also for inspiring this re-
search from the very beginning.
I also express my sincere thanks to my main supervisor, Jovo Ateljevic. Although
he joined this project at a later stage, he was always very supportive with my work. I espe-
cially thank him for his thorough reading of the preliminary versions of the thesis. The fi-
nal result has greatly benefited from his comments and suggestions.
I am indebted to many colleagues and friends with whom I have shared ideas and
research activity during this work. The list is too long to record here and so with the risk of
omissions. I would like to mention two people to whom I owe special gratitude: Giulio
Cainelli, with whom I have shared an interest in the study of business groups over the last
decade and with whom I have published several works on the subject. I also wish to give
particular thanks to Professor Valeriano Balloni (now retired from the Università Politec-
nica delle Marche) with whom I began the study of business groups in the Marche region
in 1996 and who was the first person to stimulate my interest in this subject.
vi
I received valuable comments and suggestions from participants to conferences and
workshops where preliminary results of this research were presented and from anonymous
referees of papers submitted for publications.
Some of the empirical research used for this thesis received financial support from
the Italian Ministry of University and Scientific Research under the PRIN 2003 programme
‘Dynamic capabilities between firm’s organisation and local systems of production’. I also
acknowledge financial support from the Aristide Merloni Foundation and from the De-
partment of Information Engineering, Management and Automation of the Università
Politecnica delle Marche.
vii
Preliminary results of this research were presented at the following international con-
ferences and workshops
"The process of business group formation by habitual entrepreneurs: entrepreneurial dy-
namics and organizational setting" (with Peter Rosa); paper presented at BKERC 2003
(Babson Kauffman Entrepreneurship Research Conference), Babson College, MA, June
2003.
“Dynamic capabilities and entrepreneurial team development in SMEs” paper presented at
the Workshop on “Dynamic Capabilities between firm organization and local systems
of production” Lecce (Italy), 25-26 June 2004
“Business groups as evolutionary entrepreneurial systems” (with Peter Rosa) presented at
BKERC 2004 (Babson Kauffman Entrepreneurship Research Conference), Strathclyde
University, Glasgow, 3-5 June 2004.
“Habitual entrepreneurs, entrepreneurial team development and business group forma-
tion” (with Peter Rosa), presented at RENT XVIII, Research in Entrepreneurship and
Small Business, Copenhagen, 24-26 November 2004.
“Habitual entrepreneurs and business group formation”, presented at the Expert Work-
shop on Networks, Entrepreneurship and Methodological Issues, ESC, Toulouse Busi-
ness School, Toulouse, 13-14 May 2005
“The role of agglomeration and technology in shaping firm’s strategy and organization”
(with Giulio Cainelli”, presented at ‘EUNIP 2006 Conference’ Department of Econom-
ics, Kemmy Business School, University of Limerick, Ireland, 20-22 June 2006
“Vertical integration, organizational governance and firm performance. An empirical
study of Italian business groups” (with Giulio Cainelli), presented at the International
Workshop on “Internal organisation, cooperative relationships among firms and com-
petitiveness”, Lucca (Italy) – 19-20 January 2007.
viii
Preliminary results of this research were used for the following publications
Iacobucci, D., and P. Rosa (2005), Growth, diversification and business group formation in
entrepreneurial firms, Small Business Economics, 25 (1), 65-82.
Potena, D., C. Diamantini, D. Iacobucci, and M. Panti (2005), 'Business groups analysis by
hierarchical clustering'. In S. Zani and A. Cerioli (Eds), Classification and Data
Analysis 2005. Book of Short Papers. Meeting of the Classification and Data Analy-
sis Group of the Italian Statistical Society, Parma, Monte Università Parma Editore,
Cainelli, G., D. Iacobucci, and E. Morganti (2006), Spatial agglomeration and business
groups. New evidence from Italian industrial districts, Regional Studies, 40 (5), 1–
12.
Iacobucci, D. (2007), 'Dynamic capabilities, entrepreneurial team development and busi-
ness group formation'. In R. Leoncini and A. Montresor (Eds), Dynamic Capabilities
between Firm Organization and Local Systems of Production, London, Routledge,
Cainelli, G., and D. Iacobucci. (2007), Agglomeration, Technology and Business Groups,
Cheltenham, Edward Elgar.
Cainelli, G., and D. Iacobucci (forthcoming), Do Agglomeration and Technology Affect
Vertical Integration? Evidence From Italian Business Groups, International Journal
of the Economics of Business
ix
Table of contents
Abstract ii
Preface and acknowledgments v
List of figures xii
List of tables xiv
Acronyms and definitions used in the text xvii
Chapter 1 - Introduction 1
1.1 Subject of the thesis 1
1.2 Background and justification for the research 2
1.3 Business groups in entrepreneurship research 5
1.4 Aims and objectives 7
1.5 Research design and methodology 8
1.6 Scope and context of the study 10
1.7 Structure of the thesis 13
Chapter 2 - Business groups: Facts and interpretations 17
2.1 Concepts and definitions 18
2.1.1 Ownership and control 18
2.1.2 Groups, networks and clusters 21
2.2 The presence and relevance of business groups in industrialized countries 26
2.3 Economic and management theories about business groups 32
2.3.1 The group as an efficient organizational form 34
x
2.3.2 The group as a result of specific socio-economic and political contexts 41
2.3.3 The group as a mechanism of corporate governance 45
2.4 The entrepreneurship perspective on business groups 58
2.4.1 Comparison between habitual and novice entrepreneurs 60
2.4.2 Portfolio entrepreneurs and entrepreneurial processes 65
2.5 A synthesis of the theoretical approaches to business groups 70
2.6 Empirical and theoretical gaps 73
Chapter 3 - Research design and methodology 79
3.1 Research methods and techniques 80
3.2 The unit of analysis 86
3.3 Data collection and analysis 91
3.3.1 The ISTAT data set 94
3.3.2 The Capitalia data set 105
3.3.3 The Marche region data set 108
3.3.4 Direct interviews 111
Chapter 4 - Ownership structure and agency problems in business groups 116
4.1 The financial explanation of family-owned groups 117
4.2 Group structure: pyramidal versus horizontal structures 120
4.3 Ownership concentration in business groups 128
4.4 Agency problems in family-owned groups 136
Chapter 5 - Diversification strategies and business groups formation 148
5.1 Nature and measures of diversification 150
5.2 Degree of diversification of business groups 156
5.3 Patterns of diversification in business groups 168
xi
5.3.1 Direction of growth 175
5.3.2 Horizontal and vertical differentiation 179
5.4 Diversification strategies and business group formation 185
Chapter 6 - Entrepreneurial processes and business groups dynamics 188
6.1 New venture creation and team formation 189
6.2 Patterns of entrepreneurial team development in business groups 194
6.2.1 Joint venture with established entrepreneurs 196
6.2.2 Employee involvement 197
6.2.3 Intrapreneurship 200
6.3 Entrepreneurial teams and business groups dynamics 202
6.4 Propositions emerging from the qualitative analysis 209
Chapter 7 - A model of business group development in the small business sector 212
7.1 New venture creation in SMEs and mode of organising 213
7.2 The time constraints of portfolio entrepreneurs 219
7.3 Entrepreneurial activity and ownership 222
7.4 A conceptual model of business group formation in SMEs 233
Chapter 8 - Conclusions 240
8.1 Key findings 240
8.2 Research limitations 255
8.3 Management and policy implications 258
8.4 Further development 261
Bibliographic references 263
xii
List of Figures
Figure 2.1 – Types of business groups ................................................................................ 24
Figure 2.2 – The mechanism of ‘equity leverage’ ............................................................... 50
Figure 2.3 – The control of Telecom Italia in 2006. ............................................................ 52
Figure 2.4 – Theoretical perspectives on business groups ................................................... 72
Figure 3.1 – Data, information and methods used in the empirical analyses ...................... 93
Figure 3.2 – Example of a pyramidal structure ................................................................... 96
Figure 3.3 – Example of an “informal” group ..................................................................... 96
Figure 3.4 – Structure of “pseudo groups” .......................................................................... 99
Figure 3.5 – Groups by the degree of concentration of employees (employees on the largest
company / total employees) - 24,202 small groups ........................................ 105
Figure 3.6 – Process of data analysis of qualitative interviews ......................................... 115
Figure 4.1 – Structure of groups composed of two companies ......................................... 121
Figure 4.2 – Structure of groups composed of three companies ....................................... 122
Figure 4.3 – Evolution of the Loccioni group (in parenthesis the ownership percentage of
the family) ....................................................................................................... 126
Figure 4.4 – Agency costs of outside equity, debt and total .............................................. 140
Figure 4.5 – Agency costs of outside equity in privately owned companies ..................... 144
Figure 4.6 – Share of outside shareholders of controlled companies in small groups
(relative frequencies) ...................................................................................... 145
Figure 5.1 – Diversification strategies according to Rumelta ............................................ 151
Figure 5.2 – Growth directions from original activity ....................................................... 175
Figure 5.3 - Ownership structure of the Lube group in 2006 ............................................ 181
xiii
Figure 5.4 - Organization of activities in the Lube group ................................................. 182
Figure 6.1 – Tree nodes about the new companies ............................................................ 190
Figure 6.2 – Tree nodes about the people involved in the entrepreneurial team ............... 191
Figure 6.3 - Tree nodes about the type of involvement in the new business ..................... 192
Figure 7.1 – Mode of organizing new ventures by portfolio entrepreneurs ...................... 216
Figure 7.2 – New venture creation and entrepreneurial team development ...................... 218
Figure 7.3 – Entrepreneurial processes and entrepreneurial activity. ................................ 225
Figure 7.4 – Novice and habitual entrepreneurs ................................................................ 234
Figure 7.5 – Factors affecting new venture creation by established entrepreneurs ........... 235
Figure 7.6 – Factors affecting the way of organising new ventures by established
entrepreneurs ................................................................................................... 237
xiv
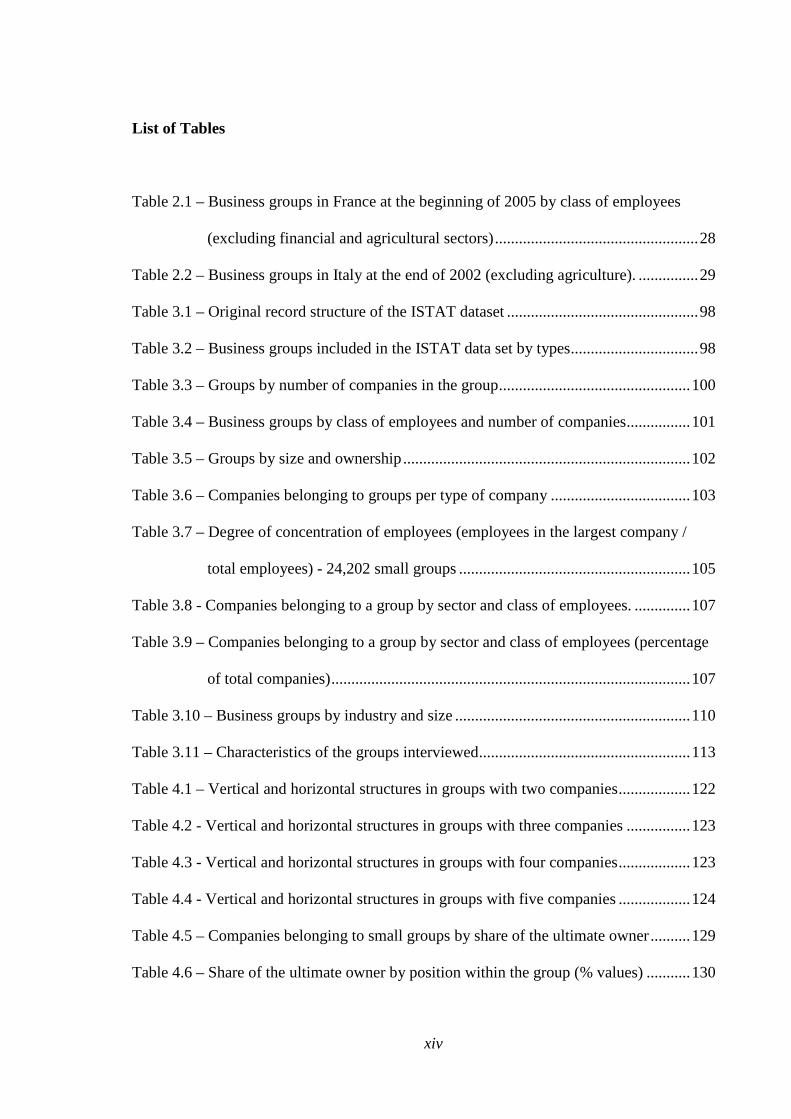
List of Tables
Table 2.1 – Business groups in France at the beginning of 2005 by class of employees
(excluding financial and agricultural sectors) ................................................... 28
Table 2.2 – Business groups in Italy at the end of 2002 (excluding agriculture). ............... 29
Table 3.1 – Original record structure of the ISTAT dataset ................................................ 98
Table 3.2 – Business groups included in the ISTAT data set by types ................................ 98
Table 3.3 – Groups by number of companies in the group ................................................ 100
Table 3.4 – Business groups by class of employees and number of companies ................ 101
Table 3.5 – Groups by size and ownership ........................................................................ 102
Table 3.6 – Companies belonging to groups per type of company ................................... 103
Table 3.7 – Degree of concentration of employees (employees in the largest company /
total employees) - 24,202 small groups .......................................................... 105
Table 3.8 - Companies belonging to a group by sector and class of employees. .............. 107
Table 3.9 – Companies belonging to a group by sector and class of employees (percentage
of total companies) .......................................................................................... 107
Table 3.10 – Business groups by industry and size ........................................................... 110
Table 3.11 – Characteristics of the groups interviewed ..................................................... 113
Table 4.1 – Vertical and horizontal structures in groups with two companies .................. 122
Table 4.2 - Vertical and horizontal structures in groups with three companies ................ 123
Table 4.3 - Vertical and horizontal structures in groups with four companies .................. 123
Table 4.4 - Vertical and horizontal structures in groups with five companies .................. 124
Table 4.5 – Companies belonging to small groups by share of the ultimate owner .......... 129
Table 4.6 – Share of the ultimate owner by position within the group (% values) ........... 130
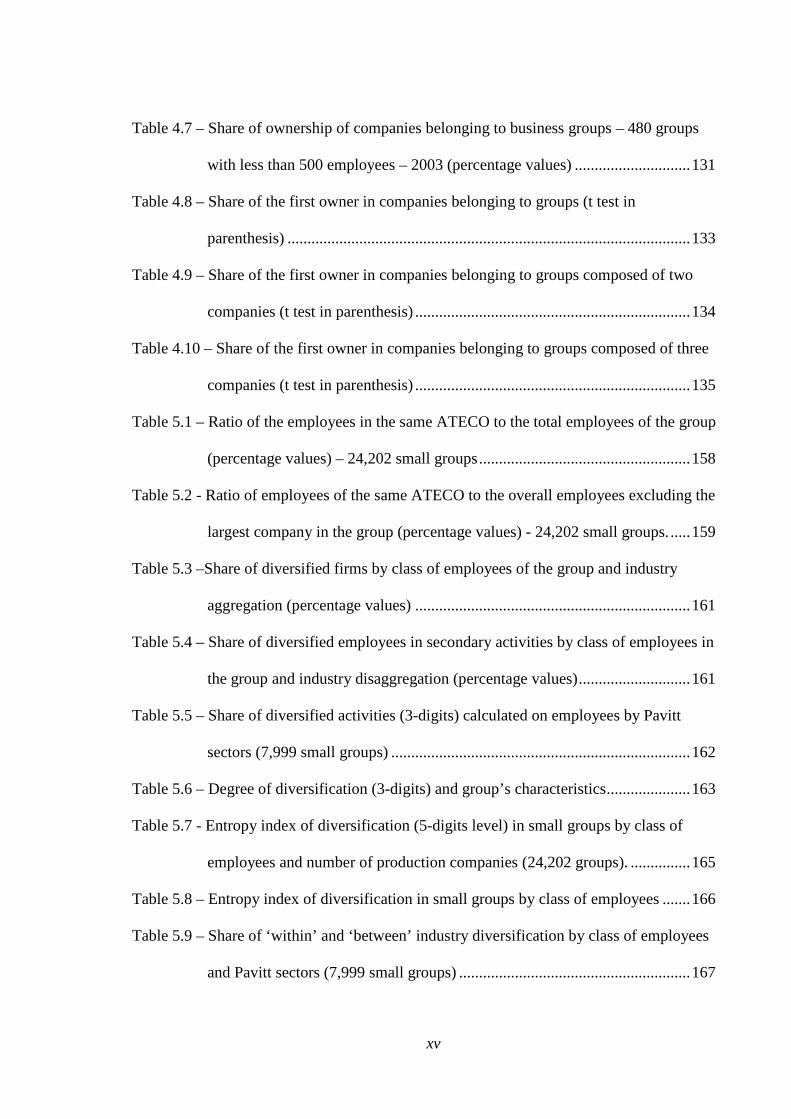
xv
Table 4.7 – Share of ownership of companies belonging to business groups – 480 groups
with less than 500 employees – 2003 (percentage values) ............................. 131
Table 4.8 – Share of the first owner in companies belonging to groups (t test in
parenthesis) ..................................................................................................... 133
Table 4.9 – Share of the first owner in companies belonging to groups composed of two
companies (t test in parenthesis) ..................................................................... 134
Table 4.10 – Share of the first owner in companies belonging to groups composed of three
companies (t test in parenthesis) ..................................................................... 135
Table 5.1 – Ratio of the employees in the same ATECO to the total employees of the group
(percentage values) – 24,202 small groups ..................................................... 158
Table 5.2 - Ratio of employees of the same ATECO to the overall employees excluding the
largest company in the group (percentage values) - 24,202 small groups. ..... 159
Table 5.3 –Share of diversified firms by class of employees of the group and industry
aggregation (percentage values) ..................................................................... 161
Table 5.4 – Share of diversified employees in secondary activities by class of employees in
the group and industry disaggregation (percentage values) ............................ 161
Table 5.5 – Share of diversified activities (3-digits) calculated on employees by Pavitt
sectors (7,999 small groups) ........................................................................... 162
Table 5.6 – Degree of diversification (3-digits) and group’s characteristics ..................... 163
Table 5.7 - Entropy index of diversification (5-digits level) in small groups by class of
employees and number of production companies (24,202 groups). ............... 165
Table 5.8 – Entropy index of diversification in small groups by class of employees ....... 166
Table 5.9 – Share of ‘within’ and ‘between’ industry diversification by class of employees
and Pavitt sectors (7,999 small groups) .......................................................... 167
xvi
Table 5.10 – Associations of primary and secondary activities in small groups (% on total
groups) ............................................................................................................ 170
Table 5.11 - Companies belonging to manufacturing groups in the Marche region by type
and location (2001) ......................................................................................... 176
Table 6.1 – Companies set up by portfolio entrepreneurs by type of entrepreneurial team
......................................................................................................................... 195
xvii
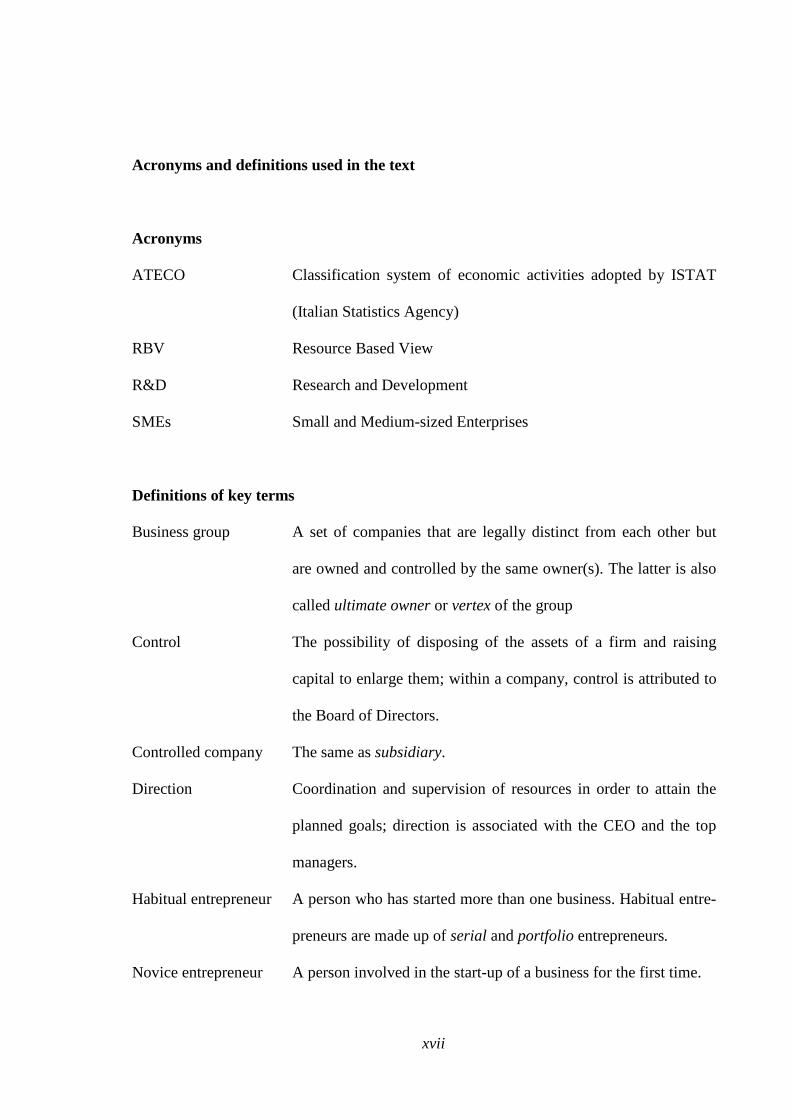
Acronyms and definitions used in the text
Acronyms
ATECO Classification system of economic activities adopted by ISTAT
(Italian Statistics Agency)
RBV Resource Based View
R&D Research and Development
SMEs Small and Medium-sized Enterprises
Definitions of key terms
Business group A set of companies that are legally distinct from each other but
are owned and controlled by the same owner(s). The latter is also
called ultimate owner or vertex of the group
Control The possibility of disposing of the assets of a firm and raising
capital to enlarge them; within a company, control is attributed to
the Board of Directors.
Controlled company The same as subsidiary.
Direction Coordination and supervision of resources in order to attain the
planned goals; direction is associated with the CEO and the top
managers.
Habitual entrepreneur A person who has started more than one business. Habitual entre-
preneurs are made up of serial and portfolio entrepreneurs.
Novice entrepreneur A person involved in the start-up of a business for the first time.
xviii
Outside equity Equity capital provided by people or institutions that are not di-
rectly involved in the management of a company; in this study,
outside equity refers to equity capital provided by investors other
than the entrepreneur (or family members) who own the group.
Pyramid When a company is controlled by another company. The mini-
mum number of companies for a pyramid is two, when there is
one company controlling another company. It is synonymous with
pyramidal group.
Pyramidal group The same as pyramid.
Portfolio entrepreneur A person who started more than one business and has retained the
ownership and control of at least one of the previously established
businesses.
Serial entrepreneur A person who has started more than one business but has sold or
closed the established business before starting a new one.
Subsidiary A company that is controlled by another company owning 50% or
more of its shares.
Ultimate owner The subject, or coalition of subjects, that controls the company at
the top of a pyramidal group. It is synonymous with vertex. In
small groups the ultimate owner is often an entrepreneur and
his/her family members.
Vertex The same as ultimate owner.
Introduction 1
Chapter 1 - Introduction
1.1 Subject of the thesis
This thesis is a contribution to our understanding of business groups in the small
business sector. Specifically, its aim is to verify whether or not and to what extent the
consideration of entrepreneurial processes can advance our understanding of this phe-
nomenon. A ‘business group’ is a set of companies which are legally distinct but belong
to the same person or people. Business groups are present both in industrialized and in
emerging economies, where they account for a large proportion, if not the majority, of
employees and capital invested. The economic and management literature on business
groups has generally focussed its attention on large firms. However, as demonstrated in
this thesis, business groups are not confined to the large firm sector and also have a sig-
nificant presence among small and medium-sized firms (SMEs). Indeed, the business
group can be considered the organizational form normally adopted by entrepreneurs
when expanding the business activities under their control. For this reason, the study of
business groups should be regarded not as a curiosity, but as a central topic for under-
standing the growth process and the performance of firms and entrepreneurs.
Despite this, little work has been done either to investigate the characteristics of
business groups among SMEs or to justify their presence and characteristics. One of the
aims of this thesis is to develop a theoretical framework to explain the presence and
characteristics of business groups in the small business sector. Small groups, like small
Introduction 2
firms, are characterized by the relevant presence of entrepreneurs, i.e. people who retain
key positions in the ownership, control and management of firms. For this reason, spe-
cific attention will be paid to the role of entrepreneurial processes in explaining the
formation and dynamics of business groups. Entrepreneurial processes are those proc-
esses associated with the discovery and exploitation of new business opportunities.
Among the many issues included in this topic, this study concentrates on the follow-
ing theoretical and empirical questions: i) why do entrepreneurs prefer to set up new
companies when expanding the activities under their control? i.e. why are business
groups formed?; ii) how are business groups organized and developed through time? iii)
what is the role of entrepreneurial processes as opposed to other possible explanations
for the phenomenon of business groups?
1.2 Background and justification for the research
Business groups have been studied by researchers belonging to different disciplines
including economics, management, sociology and economic development. Recently this
issue has also attracted the attention of entrepreneurship researchers. Each of these dis-
ciplines addressed the subject looking at specific aspects and using their own methodo-
logical approaches.
Economic and managerial literature on business groups has generally focussed on
large groups, sometimes the largest ones in each country where studies have been con-
ducted. The choice of this object has strongly influenced the theoretical perspectives
used by researchers. The theoretical approaches to explaining the presence of business
groups can be divided in two broad categories: the first considers the group as an organ-
izational form to manage diversified or vertically integrated activities (Williamson,
Introduction 3
1975; Chandler, 1982; Goto, 1982; Kester, 1992; Shimotani, 1997); the second consid-
ers the group as a financial device to manipulate the ownership structure of companies
to the advantage of controlling owners (Hilferding and Bottomore, 1981; Barca and
Becht, 2001; Morck and Yeung, 2003). The first approach emphasizes the ‘horizontal’
nature of business groups as collections of units devoted to specific businesses; the sec-
ond emphasizes the ‘vertical’ nature of business groups associated with ownership rela-
tions between successive layers of companies (what is called a ‘pyramid’). In the case
of the financial explanation, specific attention is paid to the relationship between the
presence of business groups and the functioning of capital markets; in fact, the objects
of analysis are large, publicly traded companies.
There is another important strand of literature that examines the nature of business
groups in developing and emerging economies (Ghemawat and Khanna, 1998; Khanna,
2000; Khanna and Yafeh, 2005; Yiu et al., 2005; Chang, 2006). This literature explains
the presence of business groups as the result of the specific social, economic and politi-
cal conditions of these countries: market asymmetries, underdevelopment of capital
markets, weak legal protection of investors and a wide scope for political lobbying. This
strand of literature also focuses on large firms, often the largest in the country.
Empirical evidence shows that business groups are largely present in developed
countries and among SMEs (Rosa and Scott, 1997, 1999b; Loiseau, 2001; Chabanas,
2002; Iacobucci, 2002). This reduces the possibility of explaining the phenomenon by
referring to specific socio-economic conditions, either attributed to individual countries
or to a set of countries. Moreover, when we consider small and medium-sized groups,
the explanation based on financial arguments is less important and often irrelevant.
Given the differences between large and small firms, it is likely that the theoretical ap-
Introduction 4
proaches previously mentioned contribute little to explaining the presence and charac-
teristics of business groups in the small business sector.
A recent model proposed by Almeida and Wolfenzon (2006) has extended the finan-
cial explanation to small, family-owned business groups. In this model, groups are seen
as a device used by entrepreneurs to manipulate the ownership structure of new busi-
nesses to maximize their financial wealth. The Almeida and Wolfenzon (2006) paper is
a theoretical contribution and the authors do not provide evidence on the predictions of
their model. This thesis demonstrates that some of the latter predictions are not con-
firmed by available evidence of business groups in the small business sector. This is be-
cause the model relies only on financial arguments and overlooks organizational and en-
trepreneurial motives that are specifically relevant in the case of small groups.
At present there is no convincing theory explaining the presence and characteristics
of small groups. There is also no study that compares and links the theoretical ap-
proaches previously mentioned and assesses their role and limits in explaining the phe-
nomenon of business groups in the small business sector.
Another reason for the limited attention that researchers have dedicated to small
groups is also the lack of empirical evidence on the phenomenon. Business statistics in
most countries are not organised around entrepreneurs or business groups. With only
slight variations from country to country, statistics on business activity are generally
based on establishments and firms (Eurostat - OECD, 2007). An establishment is a sin-
gle physical location of economic activity (a plant, a shop, etc.). A firm is a more diffi-
cult object to define but is generally associated with a legal unit: a single proprietorship,
a partnership, a company, etc. For most countries the firm (i.e. the legal unit) is the
highest level of aggregation of statistics on economic organizations. Some statistics
Introduction 5
agencies rely on more complex definitions of the firm and also consider the business
group. Eurostat, for example, defines the group as “an association of enterprises bound
together by legal and/or financial links ... It constitutes an economic entity which is em-
powered to make choices, particularly concerning the unit it comprises” (Eurostat,
2003, p. 196). Notwithstanding the requests provided by Eurostat for the collection of
data about business groups, only a few European statistics agencies provide statistics on
this phenomenon, and the legal unit remains the main unit for data and information
about the business sector.
1.3 Business groups in entrepreneurship research
The phenomenon of business groups in SMEs has recently received attention from
entrepreneurship researchers. It is not a direct interest but the result of research on the
related phenomenon of habitual entrepreneurs, i.e. entrepreneurs who have started more
than one business during their lifetime. Following a few seminal articles (MacMillan,
1986; Starr and Bygrave, 1991; Birley and Westhead, 1993; Scott and Rosa, 1996) lit-
erature on this phenomenon grew rapidly since the second half of the 1990s.
Habitual entrepreneurs comprise two types (Westhead and Wright, 1998b): ‘serial
entrepreneurs’, i.e. entrepreneurs who started more than one business but sell the previ-
ously established business before the last start-up; ‘portfolio entrepreneurs’, i.e. entre-
preneurs who retain at least one of the previously started business(es) when starting
other businesses. The latter are the ones who end up forming a business group. The two
concepts - portfolio entrepreneur and business group - refer to the same phenomenon al-
though from different perspectives: business group refers to the set of companies owned
Introduction 6
by the same entrepreneur; portfolio entrepreneur refers to the person owning the set of
companies.
The increasing interest of entrepreneurship researchers in habitual entrepreneurs pro-
duced the emergence of two main themes. The first is concerned with exploring the dif-
ferences between novice and habitual entrepreneurs and how these differences affect the
characteristics and performance of new ventures (Westhead and Wright, 1998b, 1999;
Ucbasaran et al., 2003c). The common hypothesis of these studies is that habitual entre-
preneurs should have an advantage over novice entrepreneurs in starting new businesses
because of the accumulation of experience and human capital in the start up of busi-
nesses (Birley and Westhead, 1993; Westhead et al., 2003; Ucbasaran et al., 2008).
Given the latter aim, this literature focused on the start-up events rather than on the
overall businesses owned by habitual entrepreneurs.
The second theme developed around accounting for diversification and portfolio
formation as an entrepreneurial strategy; it focused on the characteristics of the entire
group of businesses brought about by the activity of habitual entrepreneurs (Rosa and
Scott, 1999a, 1999b). This led to detailed consideration of the reasons why entrepre-
neurs wanted to diversify by setting up new businesses rather than by expanding within
the core business. The question of why business groups are formed in the small business
sector became an important focus of interest. Previous research has already established
that entrepreneurial processes are associated with growth through business group forma-
tion by small firm entrepreneurs (Rosa, 1998; Iacobucci, 2002). However, the nature
and complexities of these processes have not been systematically explored or researched
as issues in their own right. We also do not know how entrepreneurial motivations relate
to the other explanations of business groups based on financial arguments and on the
Introduction 7
diversification hypothesis. The latter research questions represent the main motivation
for this thesis.
1.4 Aims and objectives
The main aims and objectives of this research can be synthesized as follows.
In the small business sector, business groups are the result of entering into new busi-
ness by portfolio entrepreneurs. The fundamental research question is understanding
why and when entrepreneurs decide to set up a new company rather than developing the
new venture within the established firm. The nature of these processes has not been sys-
tematically explored and we do not know how far business groups can be considered the
result of entrepreneurial processes (those associated with the start up of new ventures)
rather than as a device to efficiently manage a portfolio of businesses.
One of the main theoretical approaches to business groups – the financial explanation
- hypothesises that business groups are a device used by entrepreneurs and managers to
manipulate the ownership structure of new businesses (Almeida and Wolfenzon, 2006).
Until now, this theory has not been empirically tested. We do not know whether the in-
volvement of other people in the ownership of new ventures is merely for financial mo-
tives – as is the case for large groups - or whether there are other motivations and
mechanisms at work. The involvement of other people by the entrepreneur in the
growth of business groups and the dynamics of the interactions between the entrepre-
neur and those people are still to be investigated.
Business groups are not stable over time and there is empirical evidence from pre-
vious research that phases of growth and contraction occur, which may have complex
Introduction 8
causes (Rosa, 1998). However, the dynamics of business groups over time, in all its
forms and determinants, requires systematic investigation.
1.5 Research design and methodology
Given the aims of this thesis, the research design is based on a mixed methods strat-
egy that includes the use of quantitative and qualitative methods. Quantitative methods,
based on statistical analysis of large sets of data, are needed to test some of the theories
proposed by the literature; namely, the financial and the diversification theories. I derive
the main empirical propositions emerging from the latter theories and assess to what ex-
tent they are confirmed by available data. For the quantitative analysis I use both cross-
sectional data and longitudinal data. Cross sectional data are taken from two large data
sets. The first is a data set of the population of business groups in the Italian economy
elaborated by ISTAT, referring to 2001. This is the first attempt made by ISTAT to
build a data set about the population of business groups. The statistics are published pe-
riodically at an aggregate level (ISTAT, 2005). Thanks to a research agreement between
ISTAT and Università Politecnica delle Marche, I have been able to access and elabo-
rate the micro-data about business groups that are not publicly available. Given the
complexity of representing and elaborating data about business groups, the analysis of
this data set has required considerable effort to organize the data (at group and at firm
level), identify the main variables and elaborate on them according to the aims of this
study.
As mentioned above, the main aim of this thesis is to assess whether and to what ex-
tent the consideration of entrepreneurial processes adds to our understanding of business
groups and whether it is able to fill the gaps left by other theoretical approaches. To
Introduction 9
achieve these aims, it is necessary to use qualitative methods; specifically, I used case
study analysis and direct interviews with entrepreneurs. The choice of qualitative meth-
ods is justified by two main reasons. Until now, little work has been done on this topic
and we do not have a consolidated theory from which to derive propositions that can be
tested with available data. For this reason, I carried out an exploratory study aimed at
developing a coherent set of theoretical propositions about business group formation in
the small business sector. To this aim, it is necessary to look at the complexities of the
processes involved and leave the entrepreneurs free to give their own meaning and ex-
planations, rather than imposing some pre-defined hypotheses. The other reason for us-
ing qualitative methods is that it is difficult to express entrepreneurial processes using
quantifiable variables and they are better described and analysed through narrative
statements and visual models.
The process of theory building is made by integrating the results of qualitative and
quantitative analyses. In the qualitative analysis I used some of the techniques of
grounded theory. I started interpreting the interviews on the basis of some pre-defined
issues. I then added coded the interviews by adding new issues and concepts as they
emerged from the views and motives expressed by entrepreneurs; finally, these issues
and concepts were gradually refined to derive some general propositions. These propo-
sitions has been compared with the results obtained from the case studies and quantita-
tive analyses of secondary sources. The combination and comparisons of results ob-
tained from interviews, case studies and quantitative analyses have been beneficial to
the overall process of model building.
Introduction 10
The thesis proposes a new conceptual framework based on entrepreneurship theory
to explain why and when entrepreneurs are likely to develop a business group rather
than expanding the activity within the same legal unit.
1.6 Scope and context of the study
This study aims at explaining the presence and characteristics of business groups in
the small business sector. To delimit the field of analysis, it is necessary to define the
two constructs and specify the criteria for their empirical identification. Business groups
are defined as the set of legal units (companies) belonging, directly or indirectly, to the
same owner. Indirectly refers to the fact that a company can be owned by means of an-
other company (referred to in the literature as a pyramid). The ‘owner’ is not necessarily
a single person. In the small business sector it is common to observe firms that are
owned by members of the same family or by a coalition of owners. In both cases, the
number of owners is limited to a few people; moreover, it is normally possible to iden-
tify a ‘dominant’ entrepreneur, i.e. a person who played the major role in the start up
and development of the group and who retains key positions in the ownership and con-
trol of companies. Majority rule is used for the empirical identification of business
groups; i.e. legal units are considered as belonging to a group when the same owner (or
coalition of owners) owns at least 50% of it.
The theoretical definition and empirical identification of the small business sector
poses more problems; though the size of firms is the obvious criteria in discriminating
between small and large firms, the empirical application of this criteria is not straight-
forward because of the difficulties in identifying a quantifiable dimension and a cut-off
value for delimitating the two aggregates (Storey, 1994). Depending on the sectors ex-
Introduction 11
amined, the national context and the specific aims of researchers, several discriminating
values have been proposed based on input dimensions (such as number of employees)
or output (such as sales) dimensions. To empirically delimit the small business sector I
have used the number of employees, as this is the dimension most commonly used in
the empirical literature. Because most of the empirical analysis refers to the manufactur-
ing sector, I use the cut-off values proposed by the EU for delimiting SMEs in this sec-
tor: i.e. 50 employees for small firms and 250 employees for medium sized firms. As
observed for small firms also in the case of groups their size distribution is highly
skewed towards the smaller size. When appropriate, I provide evidence that the empiri-
cal results are robust to the use of different size classes.
Some authors also propose using qualitative dimensions for identifying the small
firm sector. The most important feature attributed to small firms is the concentration of
ownership and the association between ownership and management. This is the reason
why the entrepreneur is so often associated, in the empirical and theoretical literature,
with the owner-manager of a small firm. The latter association is questioned by re-
searchers who consider entrepreneurship as a process rather than a state (Gartner, 1988;
Ucbasaran et al., 2001); entrepreneurial processes can be observed in large as well as in
small firms. Nevertheless, the processes of opportunity identification and new venture
creation in large firms are significantly different to those observed in small firms. For
this reason the scope of the analysis is limited to privately-held and family-managed
small firms.
The term family is used here, as in much of the literature on family firms, as a ‘col-
lective’ label meaning a single person (the entrepreneur), a few members of the entre-
preneur’s family or a coalition of people belonging to different families (Pramodita,

Introduction 12
2004; Chrisman et al., 2005). What these situations have in common is that the owner-
ship of the firm is concentrated in the hands of a few people who retain key positions in
the control and management of it.
Most of quantitative and qualitative analyses contained in this thesis refer to the
manufacturing sector. This is because of the relevance of this sector for innovation and
competitiveness in industrialized countries. It is possible that agriculture and service
sectors present similar problems with regard to the issues of this thesis, but also specific
features (Carter, 1998; Westhead and Wright, 1999); their inclusion would have re-
quired a different, comparative approach. By limiting the analysis to the manufacturing
sector, it is possible to rely on a more homogeneous basis for the analysis.
The geographical context of the study is that of business groups located in Italy. The
choice of this context is based on the availability of relevant statistics which fulfil the
aims of the research. The Italian statistics agency (ISTAT) is among the few in devel-
oped countries to produce systematic statistics on the population of business groups.
Thanks to the concern about the presence of business groups raised by some Italian re-
searchers at the beginning of the nineties (Brioschi et al., 1990; Barca et al., 1994), in-
formation on business groups has also been incorporated in the main surveys on busi-
ness activities.
Though the Italian context presents specific economic and social features - above all
the prevalence of small firms organized in industrial clusters - the widespread presence
of business groups is not a peculiar Italian phenomenon. Nor are there reasons to sup-
pose that the characteristics of business groups and the general motives for their forma-
tion differ between the Italian context and those observed in other countries. When
more information on the causes and characteristics of this phenomenon become avail-
Introduction 13
able, the design of comparative studies to assess how different national contexts influ-
ence them will be worthwhile.
The data sets examined in the empirical section exclude from the analysis sole pro-
prietorships and partnerships. This is because the information on ownership structure,
that is essential for the identification of business groups, is more easily accessible for
limited companies than for sole proprietorship and partnership. The exclusion of the lat-
ter legal forms does not represent a significant limitation for the aims of the study. This
is for two reasons. Sole proprietorship and partnership are more common in the service
sector, especially the retail sector and the personal service sector; because I focus on
manufacturing, the exclusion of sole proprietorships and partnerships cut a lower per-
centage of firms. Besides this, there is a more important reason that is linked to the spe-
cific object of the study. Business groups emerge as a strategy of growth by entrepre-
neurs who expand their original business by creating new ventures. The empirical evi-
dence shows that this is more likely when the original firm survives and goes beyond a
minimum threshold; in fact, the presence of business groups is negligible in firms with
less than 10 employees, but increases steadily afterwards. For this reason, the study of
the phenomenon is better carried out considering small and medium sized firms (com-
monly organised as joint stock companies) rather than micro firms (commonly organ-
ised as sole proprietorships or partnerships).
1.7 Structure of the thesis
The thesis is organized in seven chapters.
Chapter 2 reviews the available empirical and theoretical literature about business
groups. After discussing the definitions adopted to delimit the field of investigation, the
Introduction 14
chapter deals with two main issues: a) the analysis of available statistics on the phe-
nomenon of business groups in developed and emerging economies; b) the review of the
several strands of literature that have addressed this phenomenon. The final section
identifies the main research gaps and elaborates the scope and aims of the thesis.
Chapter 3 is dedicated to illustrate the research methods used in the thesis. After a
brief discussion of some methodological issues in the field of the social sciences (and in
entrepreneurships research specifically), the chapter outlines the empirical and theoreti-
cal methods used to attain the research aims. The chapter describes the major sources of
data that are used through the thesis: a) a large data set on Italian business groups, refer-
ring to the population of Italian firms in the year 2001; b) the result of a survey about
Italian manufacturing firms; c) a longitudinal data set of the population of business
groups in the Marche region; d) information collected through a qualitative survey on a
sample of business groups in the Marche region. These sources of data differ in terms of
geographical and population coverage as well as for the span of information about the
groups and their evolution over time. For this reason they will be used to address differ-
ent research questions or to analyse the same issue with different perspectives.
On the basis of the data set of business groups for the population of Italian firms (de-
veloped by ISTAT, the Italian statistics agency) the chapter also offers an analysis of
the main characteristics of business groups in the Italian economy. This analysis is an
important first step for understanding the broad characteristics of the phenomenon I am
going to investigate.
The two following chapters (4 and 5) address the two main theoretical explanations
put forward by the literature to explain the presence of business groups: the separation
of ownership and control and the diversification of activities. Chapter 4 addresses what
Introduction 15
I refer to as the ‘financial explanation’ of business groups, i.e. the one that considers the
group form as a financial device for separating cash flow rights from control rights. The
main aim of the chapter is to analyse the ownership and control structure of business
groups and discuss to what extent the financial explanation is appropriate in the case of
small and medium-sized groups.
Chapter 5 discusses how diversification strategies can explain the formation of busi-
ness groups. After discussing the problems arising from defining and measuring diversi-
fication the chapter examines the current pattern of diversification observed in business
groups. It also examines a specific aspect of diversification, i.e. the integration of activi-
ties within the same production chain (vertical integration); in fact, this is one of the
reasons for the presence of autonomous legal units under the same ownership. As in the
case of the previous chapter, the main aim of chapter 5 is to examine to what extent the
diversification hypothesis is able to explain the phenomenon of business groups in the
small business sector and explore which questions remain unanswered.
Chapter 6 deals with the role of entrepreneurial processes in explaining business
group formation. The chapter is based on the results of a direct survey based on inter-
views with habitual entrepreneurs and a qualitative analysis of the context and reasons
that justified the setting up of new legal units when starting new business activities.
Specifically, the chapter addresses two issues that justify the role of entrepreneurial
processes in business group formation: a) the entrepreneurial functions involved in the
start up phase; b) the development of an entrepreneurial team.
Chapter 7 integrates the results of the previous chapters to develop a model that aids
an understanding of the decisions of entrepreneurs to set up new firms and enlarge the
entrepreneurial team when starting new businesses.

Introduction 16
Chapter 8 synthesizes the main results of the thesis, discusses its limitations and
points the way to further research on this topic.
Business groups: facts and interpretations 17
Chapter 2 - Business groups: Facts and interpretations
This chapter is devoted to an analysis of what we know about the phenomenon of
business groups, both at an empirical and theoretical level. Before starting the analysis
of available statistics, section 2.1 discusses the terms and concepts used by researchers
to identify and analyse the phenomenon. Definitions are not neutral with respect to in-
terpretative models of reality; for this reason, it is necessary to discuss them and justify
why I have chosen one definition over others.
At an empirical level, the chapter analyses available statistics in order to shed light
on two main aspects: a) the relevance of the phenomenon in industrialized countries and
the presence of business groups by size of firms and sector of activity; b) the main char-
acteristics of business groups, such as the number of firms, their activities, etc. This is
the object of section 2.2.
On a theoretical level, the chapter reviews the existing theories on business groups to
assess to what extent they are able to explain the available evidence and whether there
are still research gaps to be addressed. Specific attention is given to groups of SMEs
and to the literature that addresses them. This analysis is carried out in section 2.3.
Finally, section 2.4 presents the main results and points out the research gaps that ex-
ist both at a theoretical and empirical level.
Business groups: facts and interpretations 18
2.1 Concepts and definitions
2.1.1 Ownership and control
The private ownership of businesses is recognised as one of the most important fea-
tures of a free market economy. Owning businesses is somewhat different from owning
assets such as land, buildings or equipment. It implies the possibility of organising and
directing people’s work in order to attain economic goals; it is the ownership of a going
concern1. The most important feature of ownership is the possibility of freely disposing
of assets within the limits set by the law. In the case of a business I use the term ‘con-
trol’ to indicate the possibility of disposing of the particular ‘going concern’ represented
by the set of physical assets, people, brand names, commercial relationships, etc. that
we call a firm. The way in which the owners of a firm exercise this control is regulated
by the law, customs and cultural institutions; for this reason it differs according to the
legal status of the firm and the country in which it is based2
Acquiring and allocating resources is not enough for the successful running of a
business; it is also necessary to provide the direction and co-ordination of such re-
. In modern corporations
ownership and control are formally separated and owners are not allowed to directly
control firms. They may only appoint the people who will be responsible for that (mem-
bers of the board) and periodically verify the result of their activity. The modern corpo-
ration has been specifically created for separating ownership and control and for regu-
lating the relationship between them.
1 Recognising the specific features of business ownership, each country has a dedicated set of norms on this issue, separate from general rules concerning the ownership of assets. 2 For a theoretical analysis of how the ownership of firms is assigned and exercised see Demsetz (1988) and Hansmann (1996).
Business groups: facts and interpretations 19
sources in order to attain the planned goals. As already noted by Kaldor (1934), the run-
ning of a business implies the exercise of three main functions a) risk of the capital in-
vested in the business (ownership); b) allocation of resources (control); c) co-ordination
and supervision of resources (direction)3
In SMEs these three functions are generally performed by the same person(s); in fact,
the owner(s) of the business is normally responsible for resource allocation and the
daily coordination of people employed in the firm. In modern corporations the three
functions are attributed to different organisms and persons. With the rise of giant firms
and stock markets, the separation between these functions and especially between own-
ership and control, has continuously progressed (Berle and Means, 1932): ownership is
increasingly widespread among a large number of individuals and institutions who are
not interested in control; the allocation of resources is attributed to the board of direc-
tors, co-ordination and supervision to executives. In the case of large public companies,
both directors and executives are selected from the lower ranks of the organizational
pyramid on the basis of experience and capabilities, rather than emanating from the
ownership ranks. There are several arguments to support the superiority of this model
(the public company) and the specialization of functions needed to run a business. The
separation of ownership from control is seen as beneficial both to owners (portfolio di-
versification) and to top management (assigned to competent people rather than capital-
ists). Notwithstanding, the current situation of company ownership and control is rather
different from what is expected from the portfolio diversification hypothesis and the re-
sulting public company model. Concentration of ownership and the association between
.
3 The control function is called co-ordination by Kaldor (1934); it “… is concerned with the allocation of resources along the various lines of investment, with the adjustment of the productive concern to the con-tinuous changes of economic data” (Kaldor, 1934, p. 68).
Business groups: facts and interpretations 20
ownership and control remain important in most industrialized countries and are pre-
dominant in developing countries (La Porta et al., 1999). This is true not only in the
case of SMEs but also for large firms. Even in the USA the relevance of direct owner-
ship has been somewhat underestimated and recent tendencies are towards an increase
in direct involvement of owners in the control of firms (Jensen, 1989; Holderness,
2009). The debate on these issues both at theoretical and empirical level has gained con-
siderable relevance in the last decade (Shleifer and Vishny, 1997; Tricker, 2000; Becht
et al., 2002).
Together with the debate on the separation of ownership and control, recent literature
on corporate governance has also underlined the importance of ‘multiple business own-
ership’; i.e. the fact that the same owner(s) can control more than one firm. This phe-
nomenon cannot simply be explained in terms of portfolio diversification; a strategy of
portfolio diversification would be efficiently attained through the spread of capital in a
large number of firms. On the contrary, in the case of multiple business ownership the
owner retains a significant stake in each company in order to maintain control of them.
Researchers belonging to different disciplines have investigated the advantages of own-
ing and controlling more than one business. As is common in the social sciences, each
discipline has concentrated on some aspects of the phenomenon and developed its own
terminology. As a result, the same object is sometimes referred to by different names
and the same term is used to refer to different objects. This is one of the reasons why,
until now I have used the neutral expression of multiple business ownership. The terms
used to refer to this phenomenon are those of ‘business group’ (or simply group), ‘busi-
ness cluster’, ‘holding company’ and numerous variants to indicate specific forms (py-
ramidal group, horizontal group, etc.). From now on, I will use the term ‘business
Business groups: facts and interpretations 21
group’. The reasons for this choice and a clearer definition of the concept and of the ob-
jects it refers to will be discussed in the following section.
2.1.2 Groups, networks and clusters
The terms ‘group’ and ‘cluster’ are general ones. They mean a number of similar en-
tities considered together because of their relation to each other. In our case, these simi-
lar entities are represented by legally autonomous businesses (mostly companies)
among which there is a form of stable connection. There are many definitions of a busi-
ness group. While all of them agree on the units constituting the group (i.e. legal units
organizing business activities), there are differences in the kind of relationships between
them. Taking into account that we are concerned with stable connections (as opposed to
spot market transactions), the most important distinction is between ownership and non-
ownership links. In the former case the belonging to a group is determined by the fact
that most shares – or a stake large enough to secure control – belong to the same owner.
In the latter case literature has defined several forms of connections that allow the iden-
tification of a group of firms. Goto (1982) for example, states that “business groups are
essentially coalitions of firms pursuing their common interests through a system which
coordinates decisions made by member firms” (Goto, 1982, p. 61). Common ownership
is not necessary in this definition, as long as the managers controlling the firms are
committed in some way to a long term collaboration policy. Granovetter (1994) also
uses a broad definition: "A business group is a collection of firms bound together in
some formal and/or informal ways" (Granovetter, 1994, p. 454). In general, economic
and managerial literature has stressed ownership ties, while sociological literature has
emphasized the analysis of non ownership ties (Barringer and Harrison, 2000; Smangs,
Business groups: facts and interpretations 22
2006). In the latter literature specific attention has been dedicated to links based on the
presence of the same people on the boards of companies: the phenomenon referred to as
‘interlocking directorates’ (Stokman et al., 1985; Silva et al., 2006).
Although I do not deny that forms of collaboration or interlocking directorates can
influence the behaviour of firms, throughout this study I will identify a group (or a
business group) on the basis of ownership relationships. This is mainly because of the
importance I put on ownership and control in the definition of entrepreneurship (as dis-
cussed in the previous section). The reference to ownership also has the advantage of
relying on an objective and quantifiable character. It also has a few drawbacks: firstly, it
rules out those situations in which several companies, although not belonging to the
same owner, are bound together by a form of dependence similar to that implied by
ownership; secondly, the presence of ownership links can be associated with a large va-
riety of relationships between firms belonging to the same group, in terms of depend-
ence and economic synergies.
Notwithstanding these limitations, ownership ties are specifically important for this
study. The control secured by ownership is different from any other form of contractual
dependence: the latter is normally limited to specific objectives and periods of time
while the former, as discussed above, is characterized by the generality attributed by the
law to ownership4
There are two ways in which ownership relationships can be organized in a business
group. In the first case, one or more persons retain the majority of ownership of several
.
4 We prefer to use the term ‘network’ (rather than group) to refer to firms that are bound together by dif-ferent forms of non-ownership ties but implying the presence of long term collaboration. Among the most important and widespread forms of business networks are those composed by firms engaged in vertical relationships (customer-supply relationships) within a production chain.
Business groups: facts and interpretations 23
companies, directly or through several layers of companies with a holding company at
the top. In the second case, we observe minority shareholding between firms. The latter
type is identified as a joint group and its presence is quite exclusively limited to large
Japanese firms under the name of Keiretsu (Goto, 1982). In the first case, we have a
unitary control of the companies by means of majority shares while in the second case
minority stakes are used to support long term coordination of business policy by the
member firms.
In the case of Western countries and other Asian countries, the former type of group
is the prevailing one5
There are two main types of business groups (
. This is the form to which literature normally refers when consid-
ering the phenomenon. It is also the object I will investigate in this study, throughout
which I will adopt the following definition: a business group is a set of companies (or
other legal units) controlled by the same owner(s). In the case of SMEs, the owner is
represented by a single person or a coalition of people (often members of the same fam-
ily). In general, we also have the case of groups in which the owner is represented by
the state or by a public company (Cuervo-Cazurra, 2006). These cases are generally
confined to the large firm sector and are ruled out from this study.
Figure 2.1): the first is when the com-
panies are controlled by means of other companies; the second is when one or more
people directly own more than one company. The former type is referred to as a py-
ramidal group (or simply a pyramid); the latter as an ‘informal’ or ‘horizontal’ group6
5 Even in the case of Japan Gerlach (1997) demonstrates that the pyramidal group is the prevailing form and that the Keiretsu form is limited to the largest firms in the country.
.
Although in business groups we can have a complex ownership structure with several
6 There is not general agreement on such terminology. The term ‘horizontal group’ is also used in the lit-erature to refer to the ‘Keiretsu’ type of business groups, where there are minority holdings between com-panies (Goto, 1982).
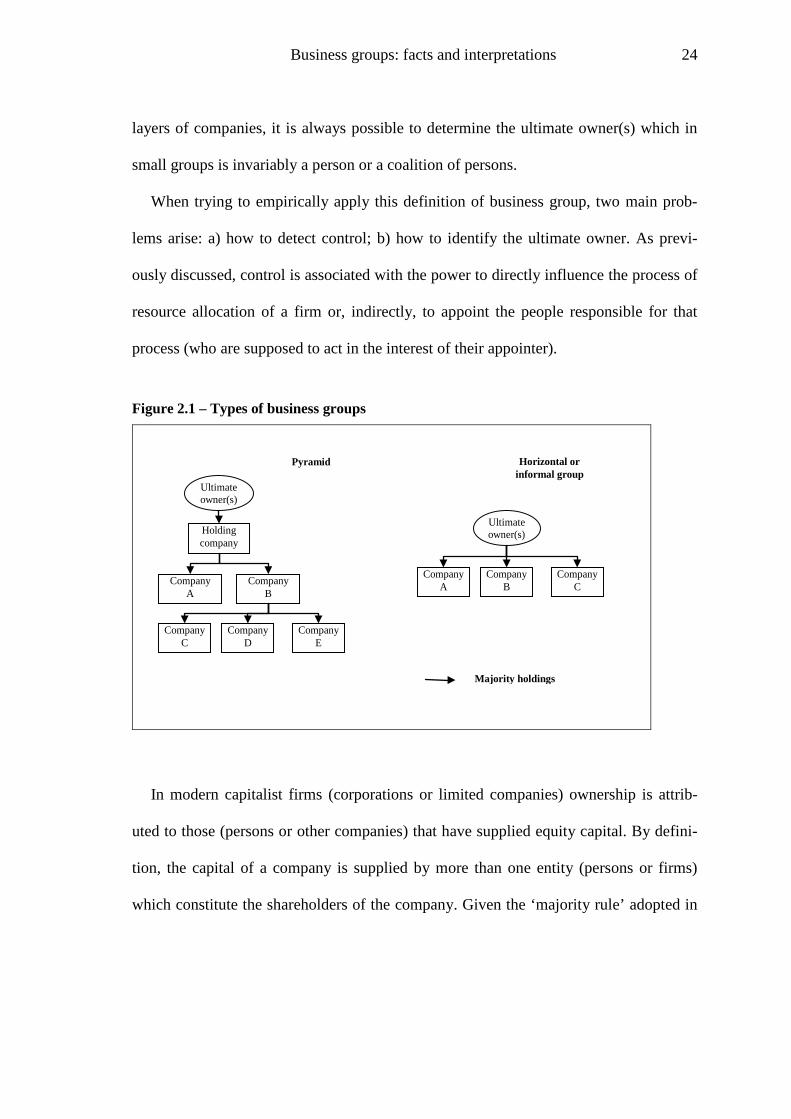
Business groups: facts and interpretations 24
layers of companies, it is always possible to determine the ultimate owner(s) which in
small groups is invariably a person or a coalition of persons.
When trying to empirically apply this definition of business group, two main prob-
lems arise: a) how to detect control; b) how to identify the ultimate owner. As previ-
ously discussed, control is associated with the power to directly influence the process of
resource allocation of a firm or, indirectly, to appoint the people responsible for that
process (who are supposed to act in the interest of their appointer).
Figure 2.1 – Types of business groups
Ultimate owner(s)
Ultimate owner(s) Holding
company
Company A
Pyramid
Company B
Company C
Company D
Company E
Company A
Company B
Company C
Majority holdings
Horizontal or informal group
In modern capitalist firms (corporations or limited companies) ownership is attrib-
uted to those (persons or other companies) that have supplied equity capital. By defini-
tion, the capital of a company is supplied by more than one entity (persons or firms)
which constitute the shareholders of the company. Given the ‘majority rule’ adopted in

Business groups: facts and interpretations 25
the shareholders’ meeting, an entity owning more than fifty percent of the capital can be
unambiguously identified as the controlling owner7
Problems arise when there is no single entity owning more than fifty percent of the
shares. Three main situations can be identified. The first is when there is an owner with
a significant stake while the other shares are spread among smaller shareholders. This
situation is often observed in listed companies. Although the largest owner does not
have more than fifty percent of the shares, he/she is able to control the company given
that the small shareholders have no possibility or incentive to do this
.
8. How large a
stake should be in order to secure control in this situation is difficult to assess; it de-
pends on how widely the remaining shares are spread and on the rules governing share-
holders’ meeting. The second situation is when there are few shareholders and none of
them holds the majority of shares9. In this case it is rather difficult to identify the con-
trolling shareholders because control is exercised through a coalition. In Italy, as well as
in other countries, shareholders of private companies are often members of the same
family; in this case the family, rather than a single person, can be considered the ulti-
mate owner10
7 Minority shareholders can certainly have an influence in controlling the firm depending on their relative share and on their role in the effective management of the firm (position on the board, links with suppliers and customers, etc.). However, an entity owning more than fifty percent of shares can impose his/her will on the other shareholders.
. The third case is a company in which ownership is sufficiently spread so
that neither a single owner nor a coalition is expected to exercise a significant influence
on the company. This is the situation of a pure public company. In this case, control is
in the hands of the top managers sitting on the board and influencing its formation.
8 The “free rider” problem prevents the single small shareholder from being interested in challenging the present management. Large coalitions of small shareholders are difficult to form and manage. 9 A typical case is a fifty-fifty joint venture. 10 This case is so widespread that in a recent theoretical work on business groups family is used as a synonym of ultimate owner (Almeida and Wolfenzon, 2006).
Business groups: facts and interpretations 26
The ownership structure within groups can be very complex, with several layers of
controlled companies. To identify the presence of a common ownership (and the ulti-
mate owner) one must take into account not only the ownership structure of individual
companies but all the direct and indirect relationships between them. Given the informa-
tion on the ownership structure of legal entities, the identification of business groups
can be made by applying the following algorithm: a) setting up of rules which specify
how a ‘controlling’ owner is identified (for example a majority share of equity); b) iden-
tification of all the companies that are controlled, directly or indirectly, by the same
owner. These are the rules adopted in this thesis for the empirical identification of busi-
ness groups.
2.2 The presence and relevance of business groups in industrialized countries
In spite of the widely recognized importance of business groups in industrialized and
developing countries, we lack systematic and comparable data on this phenomenon. Na-
tional statistics agencies normally consider the legal unit and its sub-units (plants or es-
tablishments) as the statistical unit for collecting data about firms. For this reason they
normally fail to recognize the group as an economic entity.
This is explained by theoretical and practical reasons. From a theoretical point of
view, it reflects economists’ view of the economic system as populated by firms that re-
late to each other through market relationships (both through exchange or competitive
relationships). In this view, it is taken for granted that the legal boundaries coincide
with the economic boundaries and that ownership links between firms are only of a fi-
nancial nature, with no consequences for the firm as an economic entity.
Business groups: facts and interpretations 27
The practical reason is associated with the difficulty in collecting data on ownership
relationships between firms and the fact that these relationships are subject to continu-
ous changes over time. Moreover, while a legal unit or a plant both present clear-cut
characteristics, such as location, type of activity, etc., the group appears as a complex
system that is more difficult to characterize in terms of statistics traditionally used for
firms.
EU regulations on statistical units define the enterprise as “the smallest combination
of legal units producing goods and services and constituting an autonomous economic
entity”11. Nevertheless, European national statistics agencies normally associate the en-
terprise (or firm) with a legal entity (a sole proprietorship or a company). Indeed a re-
cent survey by the European Commission stated: “… the fact of observing an enterprise
gives no information about whether it forms part of a group of enterprises. … Regretta-
bly, groups of enterprises do not currently figure in the business statistics of many
Member States” (European Commission, 2001, p. 191)12
Of the major EU countries, France is among the few that systematically collect data
on business groups. Since 1980 INSEE (France’s official statistics bureau) has carried
out an annual survey on business groups (‘enquête liaisons financières entre sociétés’)
that takes into account medium-sized and large companies. At the same time, since
1984, INSEE has also carried out a survey on state controlled companies
.
13
11 Regulation (EEC) No 696/93, 15 March 1993, p. 1.
. In the IN-
SEE surveys, the ultimate owner (‘tête de groupe’) is represented by a company when it
12 Although the European Commission report gives a definition of the enterprise group as “an association of enterprises bound together by legal and/or financial links” (European Commission, 2001, p. 193), no data are provided about enterprises groups within the EU or within its member states. 13 For the methodology and results of these two surveys see Chabanas (2002).
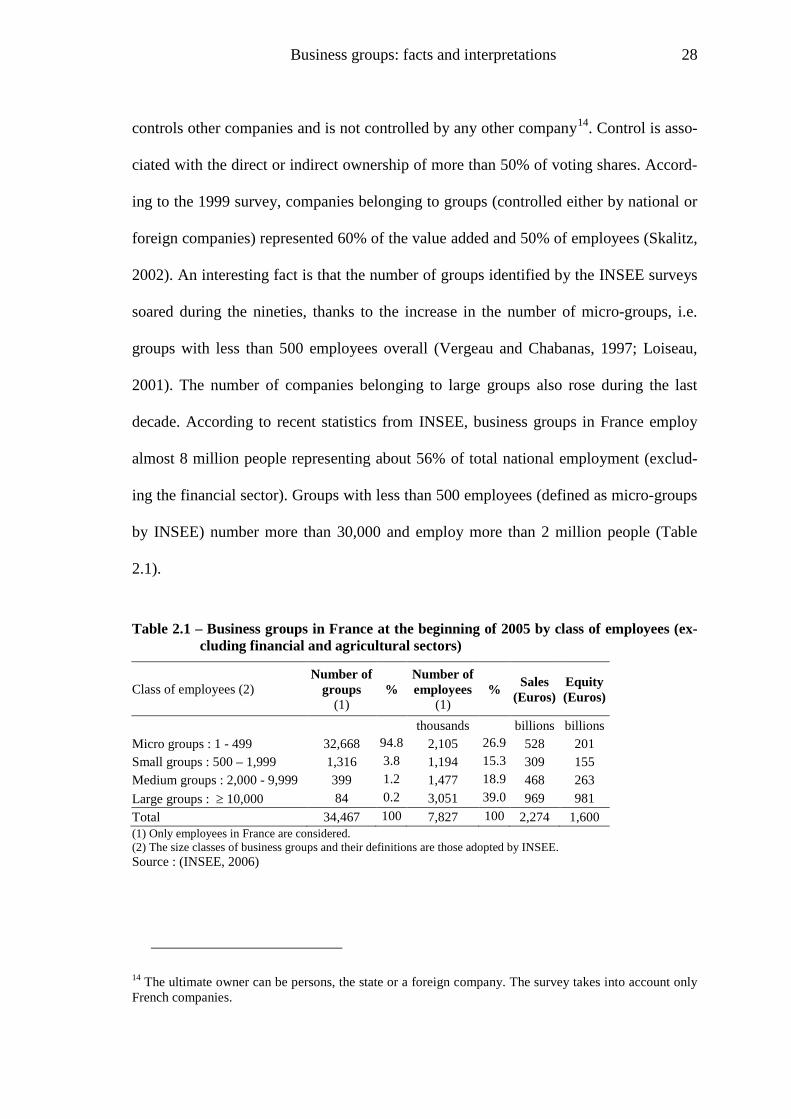
Business groups: facts and interpretations 28
controls other companies and is not controlled by any other company14
Table
2.1
. Control is asso-
ciated with the direct or indirect ownership of more than 50% of voting shares. Accord-
ing to the 1999 survey, companies belonging to groups (controlled either by national or
foreign companies) represented 60% of the value added and 50% of employees (Skalitz,
2002). An interesting fact is that the number of groups identified by the INSEE surveys
soared during the nineties, thanks to the increase in the number of micro-groups, i.e.
groups with less than 500 employees overall (Vergeau and Chabanas, 1997; Loiseau,
2001). The number of companies belonging to large groups also rose during the last
decade. According to recent statistics from INSEE, business groups in France employ
almost 8 million people representing about 56% of total national employment (exclud-
ing the financial sector). Groups with less than 500 employees (defined as micro-groups
by INSEE) number more than 30,000 and employ more than 2 million people (
).
Table 2.1 – Business groups in France at the beginning of 2005 by class of employees (ex-cluding financial and agricultural sectors)
Class of employees (2) Number of
groups (1)
% Number of employees
(1) % Sales
(Euros) Equity (Euros)
thousands billions billions Micro groups : 1 - 499 32,668 94.8 2,105 26.9 528 201 Small groups : 500 – 1,999 1,316 3.8 1,194 15.3 309 155 Medium groups : 2,000 - 9,999 399 1.2 1,477 18.9 468 263 Large groups : ≥ 10,000 84 0.2 3,051 39.0 969 981 Total 34,467 100 7,827 100 2,274 1,600 (1) Only employees in France are considered. (2) The size classes of business groups and their definitions are those adopted by INSEE. Source : (INSEE, 2006)
14 The ultimate owner can be persons, the state or a foreign company. The survey takes into account only French companies.
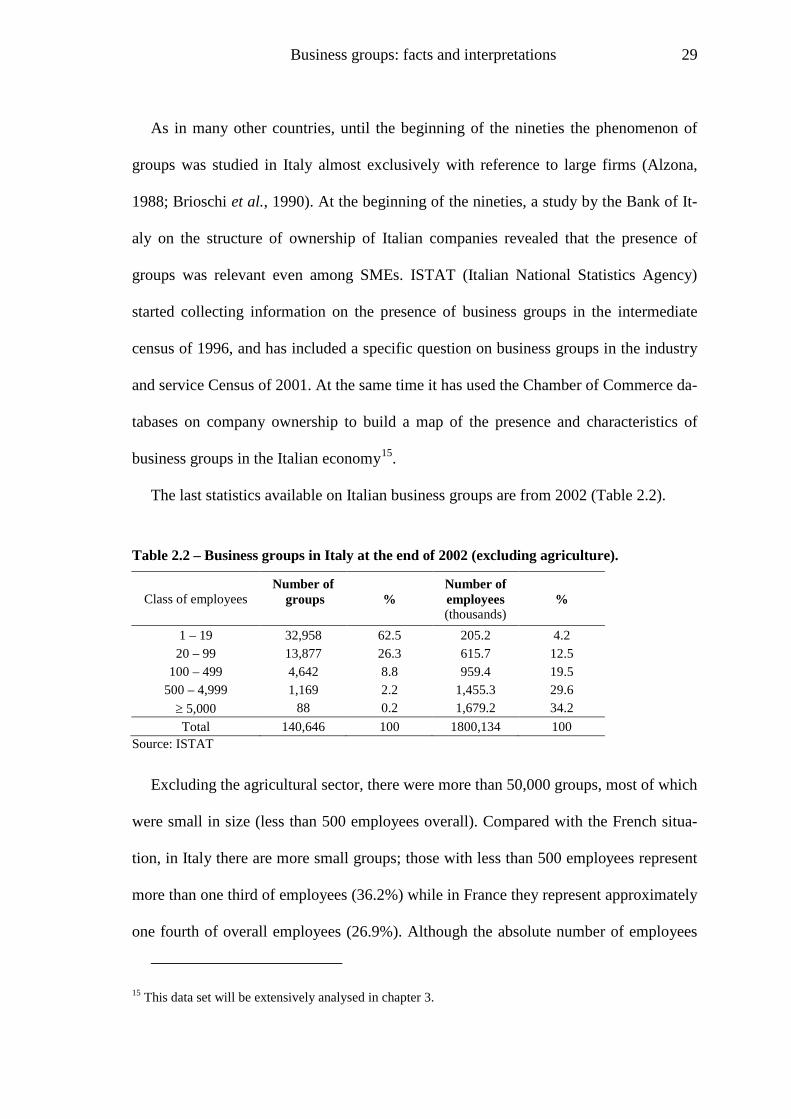
Business groups: facts and interpretations 29
As in many other countries, until the beginning of the nineties the phenomenon of
groups was studied in Italy almost exclusively with reference to large firms (Alzona,
1988; Brioschi et al., 1990). At the beginning of the nineties, a study by the Bank of It-
aly on the structure of ownership of Italian companies revealed that the presence of
groups was relevant even among SMEs. ISTAT (Italian National Statistics Agency)
started collecting information on the presence of business groups in the intermediate
census of 1996, and has included a specific question on business groups in the industry
and service Census of 2001. At the same time it has used the Chamber of Commerce da-
tabases on company ownership to build a map of the presence and characteristics of
business groups in the Italian economy15
The last statistics available on Italian business groups are from 2002 (
.
Table 2.2).
Table 2.2 – Business groups in Italy at the end of 2002 (excluding agriculture).
Class of employees Number of
groups
% Number of employees (thousands)
%
1 – 19 32,958 62.5 205.2 4.2 20 – 99 13,877 26.3 615.7 12.5
100 – 499 4,642 8.8 959.4 19.5 500 – 4,999 1,169 2.2 1,455.3 29.6 ≥ 5,000 88 0.2 1,679.2 34.2 Total 140,646 100 1800,134 100
Source: ISTAT
Excluding the agricultural sector, there were more than 50,000 groups, most of which
were small in size (less than 500 employees overall). Compared with the French situa-
tion, in Italy there are more small groups; those with less than 500 employees represent
more than one third of employees (36.2%) while in France they represent approximately
one fourth of overall employees (26.9%). Although the absolute number of employees
15 This data set will be extensively analysed in chapter 3.
Business groups: facts and interpretations 30
is much bigger in French groups than in Italian ones, their weight on the overall em-
ployees is remarkably similar (although the two data are not exactly comparable given
slight differences in the composition of the numerator and the denominator): the em-
ployees in Italian business groups represents 56.5% of all employees in joint stock
companies (ISTAT, 2005, p. 11).
In other EU countries there are several surveys on the phenomenon of business
groups, but none of them have reliable official statistics covering the population of
firms (such as those for Italy and France). This is not because the phenomenon is less
important, but simply because it has not yet attracted the attention of scholars and offi-
cial statistics agencies.
For the US Census Bureau, the statistical unit for collecting company data is the es-
tablishment, defined as a single physical location where a manufacturing or other activ-
ity is performed. Data on establishments are then aggregated to form a firm, defined as a
business organization consisting of one or more domestic establishments in the same
state and industry that were specified under common ownership and control (the term
company is also used as synonymous of firm). All the reported statistics are at the level
of the single company and it is unclear whether controlled companies are included
within the same unit16. In the USA there is also less attention than in Europe to the phe-
nomenon of multiple business ownership (Starr and Bygrave, 1991). One of the reasons
for this is that business groups are supposed to be of marginal importance in the USA,
where divisional structures are used to control diversified business activities17
16 The Census Bureau also defines the enterprise as “a business organization consisting of one or more domestic establishments that were specified under common ownership and control… Each multi-established company forms one enterprise” (U.S. Census Bureau, Statistics of U.S. Businesses – Explana-tion of Terms). The definition of enterprise coincides with that of company.
.
17 Morck (2003) maintains that the scanty presence of business groups in the USA is due to fiscal reasons.
Business groups: facts and interpretations 31
Statistics Canada is the most explicit in distinguishing between legal units and
groups of companies under common control. This is the result of a 1962 Act (the Cor-
porations and Labour Unions Returns Act, CALURA) that requires all corporations
over a certain size to declare their ownership and the companies controlled18
18 “The Act, as amended in July 1981, applies to every corporation that carries on business in Canada or that is incorporated under a low of Canada or a province, whose gross revenue for the reporting period exceeded $15 million, or whose assets exceeded $10 million” (Statistics Canada, ICO, 1998).
. The data
collected by Statistics Canada are organized in the ICO (Inter Corporate Ownership) da-
tabase and published quarterly. Within the ICO database, the following definition of en-
terprise is given: “An enterprise is a group of corporations under common control…
Controlled corporations are called subsidiaries. A multi-corporation enterprise contains
one or more subsidiaries. A corporation which is not controlled by another corporation
and that does not control another corporation is called a single-corporation enterprise”
(Statistics Canada, ICO, 1998). The ICO database also specifies how control is defined
and how the controlled corporations are aggregated under a single enterprise. The data-
base has two important limits when used to access the importance of multiple business
ownership in Canada: the first is that it excludes small firms; the second is that the ulti-
mate owners are represented by a corporation and not by people (as in the French case).
For the latter reason, the database underestimates the phenomenon as it does not take
into account the cases in which one or a few persons directly control more than one
company (without a holding company). Of the more than 90,000 corporations consid-
ered in the 1998 database, about 80% were multi-unit corporations (i.e. groups) while
the rest were single unit corporations. Unfortunately, the database does not provide in-
formation on the size of the corporations; for this reason it is impossible to assess how
the relevance of the phenomenon varies according to the size of the companies.
Business groups: facts and interpretations 32
Comparing firms’ statistics across countries is a difficult task given the different le-
gal systems that regulate economic activities and the different definitions and method-
ologies adopted by statistical agencies (Traù, 2004). In the case of business groups this
is even more so, given the fact that further qualifications are needed to identify and
classify the phenomenon. Notwithstanding these difficulties and the lack of statistics in
several countries, from the available works and statistics it is possible to reach the fol-
lowing conclusions:
a) The business group is the normal form through which business activities are
controlled in capitalist economies. Almost all major companies are organized
as a group, resulting in the fact that the bulk of activities in all countries are
controlled through this organizational form.
b) As in the case of single legal units, the large majority of business groups are of
small size. Moreover, the presence of groups is also a relevant phenomenon in
the small business sector.
c) The weight of business groups increases steadily with the size of firms. This
suggests that the setting up of a business group is the main way through which
successful entrepreneurs expand the activities under their control.
2.3 Economic and management theories about business groups
Given the relevance of business groups in all countries and the fact that almost all the
main firms are organized as a group, it is not surprising that there is a large body of lit-
erature on this phenomenon. However, for the most part this literature concerns large
groups. The economics and management literature on business groups can be classified
in three broad perspectives.
Business groups: facts and interpretations 33
The first perspective considers the group as an efficient form of organizing business
activities. The reference points for this approach are Chandler’s work on the evolution
of large firms in industrialized countries (Chandler, 1962, 1977, 1990) and William-
son’s work on the governance of multidivisional structures (Williamson, 1975).
The second approach comprises those authors who, studying specific countries, con-
sider the group as a result of institutional conditions in those countries. Specifically,
they see the group as the result of the lack of efficient market institutions (such us the
financial market) or as a result of particular historical events. Within this approach, I
consider scholars coming from different fields: economic history, industrial economics
and sociology. Given the perspective of these studies, they tend to focus on specific
countries rather than trying to formulate more general explanations for the phenomenon
(Ghemawat and Khanna, 1998).
The third approach sees the group – specifically the pyramidal group - as a financial
device that allows investors to maximise the activities they control given a fixed amount
of financial resources (Brioschi et al., 1990; Barca et al., 1994). This is possible in those
countries (many in continental Europe) where the listing of both controlled and holding
companies is permitted. In some ways this approach can be considered as a subset of the
second one because it considers the group as a result of specific conditions regarding
corporate law and capital market regulation. Nevertheless, I decided to separate it from
the institutional approach, given the importance that it has received in explaining the
presence of groups in continental Europe (while the former approach mainly concerns
emerging economies).
Between these perspectives there are also links and overlaps. Nevertheless, the clas-
sification proposed here is useful for the scope of this study and allows me to unambi-
Business groups: facts and interpretations 34
guously classify the literature. Within the first approach, I consider all the authors who
focus on the internal organization of business activities; in the second approach I con-
sider all the studies that focus on the relationships between institutional conditions and
organizational choices of firms; and in the third, I consider the authors who study the
problems of corporate governance and their relationships with the financial market.
A common characteristic of these three approaches is that they refer to large firms,
sometimes the largest in the country that has been analysed.
2.3.1 The group as an efficient organizational form
The starting point for this approach are Chandler’s studies on the organizational
changes in the largest American firms during the first decades of the 20th century
(Chandler, 1962, 1977). In these studies, Chandler gives an explanation of the develop-
ment of vertically integrated firms as a result of the need to coordinate mass production.
In the same studies he explains the emergence of the multidivisional form (M-form in
the terminology later introduced by Williamson) as a result of the need to efficiently
control diversified activities. Although in these works Chandler does not consider the
group in an explicit way, his contribution is fundamental because of the similarities be-
tween the group and the M-form: both can be interpreted as decentralized organizational
forms for controlling diversified activities. In a subsequent work Chandler explicitly
considers the differences between the group and the M-form (Chandler, 1982b). He ar-
gues that the two forms arise from the same needs; nevertheless, the M-form is typical
of North-American firms while the group is typical of European countries. The differ-
ence between the two forms, according to Chandler, is that the group is based on con-
tractual relationships (“contractual cooperation”) among formally independent legal en-
Business groups: facts and interpretations 35
tities, while the M-form is based on administrative relationships (“administrative coor-
dination”). Chandler believes that the “administrative coordination”, peculiar to the M-
form is more efficient for controlling diversified activities, both for the allocation of fi-
nancial resources and for the exploitation of economic synergies. He maintains that the
persistence of business groups in Europe and the delay in adopting the superior manage-
rial hierarchies of the M-form can be explained by the relative underdevelopment of
capital markets (such as in France or Germany) or by the persistence of family control
of large firms (as in the case of the UK)19
Although Chandler must be considered the initiator of the organisational approach,
his method is mainly descriptive. It is Williamson who has given this approach its main
theoretical background through the elaboration of the transaction costs theory. The con-
tributions of Williamson can be divided in two chronologically distinct parts.
.
In one of his first studies Williamson, following the work of Chandler on the evolu-
tion of large firms in the USA, gives a more general explanation of the emergence of the
M-form and gives a clearer characterization of this organizational form using the ana-
lytical categories of the transaction costs theory. According to Williamson the funda-
mental features of the M-form are the following (Williamson, 1970, pp. 120-121):
"1. The responsibility for operating decisions is assigned to (essentially self-
contained) operating divisions or quasifirms.
19 “… in industries where British firms failed to create such managerial hierarchies as was the case in many technologically advanced chemical and machinery products, American and sometimes German firms, which had grown through administrative efficiency, completely dominated the British market” (Chandler, 1982b, p. 19).
Business groups: facts and interpretations 36
2. The elite staff attached to the general office performs both advisory and auditing
functions. Both have the effect of securing greater control over operating division
behavior.
3. The general office is principally concerned with strategic decisions, involving
planning, appraisal, and control, including the allocation of resources among the
(competing) operating divisions."
The separation between operative and strategic responsibility enables the firm to
manage them in a more efficient way: "..the whole is greater (more effective, more effi-
cient) than the sum of the parts" (Williamson, 1970, p. 121). The superiority of the M-
form in the efficiency and effectiveness of decisional processes are compared by Wil-
liamson with the problems of the functional form (U-form): the slack in pursuing goals,
the distortion and concealing of information20
"In relation to the U-form organization of the same activities, the M-form organiza-
tion of the large, complex enterprise served both to economize on bounded ration-
ality and attenuate opportunism" (Williamson, 1975, p. 137).
.
With regard to the group, Williamson adheres to Chandlers’ idea that it should be
considered as an M-form that is not completely developed. He indicates the group as the
H-form (holding company) of which he gives the following definition (Williamson,
1975, p. 152):
20 These problems are attributed to some aspects of human behaviour that are at the basis of the transac-tion costs theory: i.e. bounded rationality and opportunism.
Business groups: facts and interpretations 37
"This is the divisionalized enterprise for which the requisite internal control appara-
tus has not been provided. The divisions are often affiliated with the parent com-
pany through a subsidiary relationship".
According to Williamson the H-form can enhance the allocation of financial re-
sources to the divisions (internal capital market) but lacks some of the characteristic fea-
tures of the M-form (Williamson, 1975, p. 143):
"... a holding company form of organization is a loosely divisionalized structure in
which the controls between the head-quarters and the separate operating parts are
limited and often unsystematic. The divisions thus enjoy a high degree of auton-
omy under a weak executive structure".
As a consequence, the H-form can show inefficiencies in the strategic and operative
processes and in the functioning of the internal capital market (the allocation of finan-
cial resources). For these reasons it is unclear, according to Williamson, why the group
form should be preferred to the M-form. His conclusion about the two forms is un-
equivocal: "Holding companies certainly cannot be expected reliably to yield results
that compare favorably with those which I impute to the M-form structure"
(Williamson, 1975, p. 144).
The contribution of Williamson extends well over the comparison between the M-
form and the H-form. It is an indirect contribution associated with the works that have
used the transaction costs economics (from now on TCE) (Williamson, 1985) to explain
the nature and diffusion of business groups. The authors that have used this theory can
be divided in two groups: on the one hand, those who have focused on the internal as-
pects of the organization, paying attention to the relationships between the companies
Business groups: facts and interpretations 38
forming the group; and on the other hand, those researchers who focused on the envi-
ronmental factors that, raising transaction costs, determine the convenience of the adop-
tion of specific organizational forms of enterprise.
According to TCE the group is characterized as an intermediate form of transactions
government between the hierarchy (the administrative coordination of Chandler) and
the market. Such intermediate form is not identifiable with a specific contractual rela-
tionship, but comprises a continuum of possibilities between the two extremes. For this
reason, the authors using TCE tend to give a general definition of the business group as
a set of enterprises tied by long term relationships not necessarily based on ownership.
What is important for TCE is the examination of the relationships between independent
enterprises, among which ownership ties are one of the many possibilities. In the au-
thors that use this approach, there is sometimes ambiguity (from the point of view of
this study) between the group (i.e. companies tied by ownership relationships) and the
network (i.e. companies tied by long term contractual relationships)21
The most convinced supporter of transaction cost theory in the explanation of the
groups is Kester (1992). In his work he refers to the main groups of Japan, Germany
and Sweden. His aim is to show that such organizations of enterprise can be considered
as efficient forms of organization of the economic transactions rather than as a phe-
nomenon to be regarded with suspicion. The analysis conducted by Kester concerns
. A further limit of
transaction cost theory, when applied to the analysis of business groups, is that TCE is
especially appropriate for explaining the nature of vertical relationships between firms
(i.e. the exchange of goods and services along a production chain) rather than the man-
agement of a diversified portfolio of business.
21 The differences between the two are discussed in section 2.1.2.
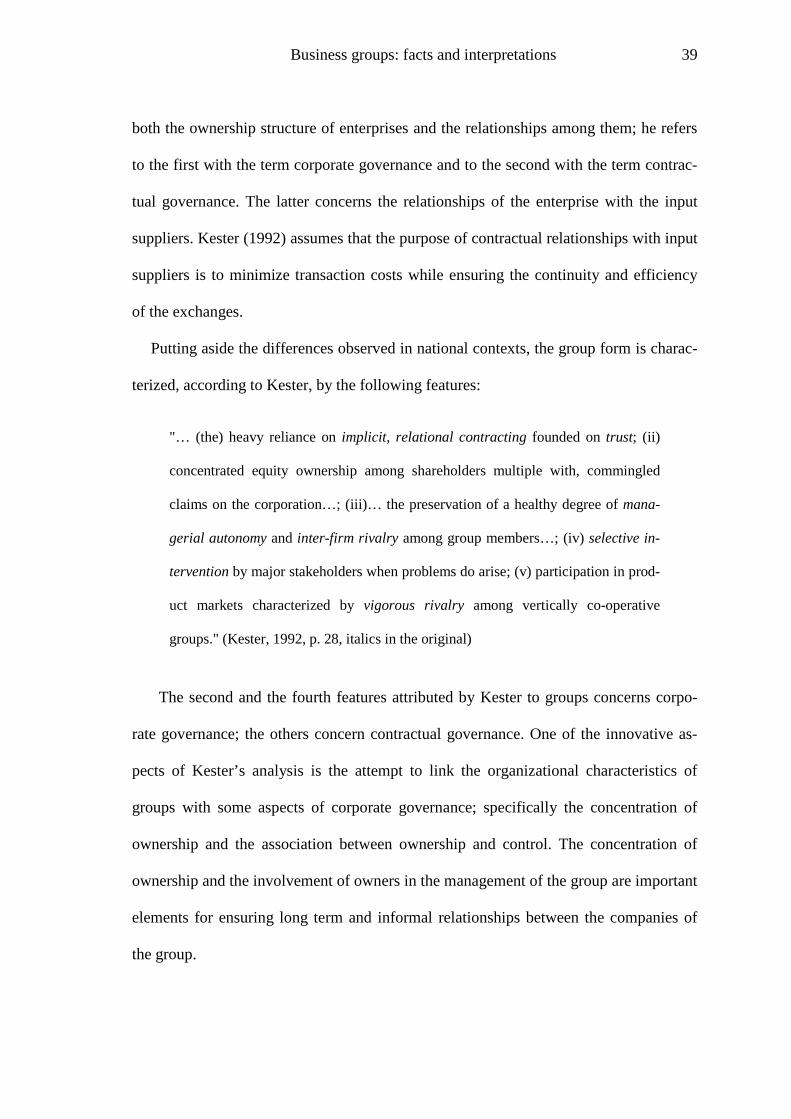
Business groups: facts and interpretations 39
both the ownership structure of enterprises and the relationships among them; he refers
to the first with the term corporate governance and to the second with the term contrac-
tual governance. The latter concerns the relationships of the enterprise with the input
suppliers. Kester (1992) assumes that the purpose of contractual relationships with input
suppliers is to minimize transaction costs while ensuring the continuity and efficiency
of the exchanges.
Putting aside the differences observed in national contexts, the group form is charac-
terized, according to Kester, by the following features:
"… (the) heavy reliance on implicit, relational contracting founded on trust; (ii)
concentrated equity ownership among shareholders multiple with, commingled
claims on the corporation…; (iii)… the preservation of a healthy degree of mana-
gerial autonomy and inter-firm rivalry among group members…; (iv) selective in-
tervention by major stakeholders when problems do arise; (v) participation in prod-
uct markets characterized by vigorous rivalry among vertically co-operative
groups." (Kester, 1992, p. 28, italics in the original)
The second and the fourth features attributed by Kester to groups concerns corpo-
rate governance; the others concern contractual governance. One of the innovative as-
pects of Kester’s analysis is the attempt to link the organizational characteristics of
groups with some aspects of corporate governance; specifically the concentration of
ownership and the association between ownership and control. The concentration of
ownership and the involvement of owners in the management of the group are important
elements for ensuring long term and informal relationships between the companies of
the group.
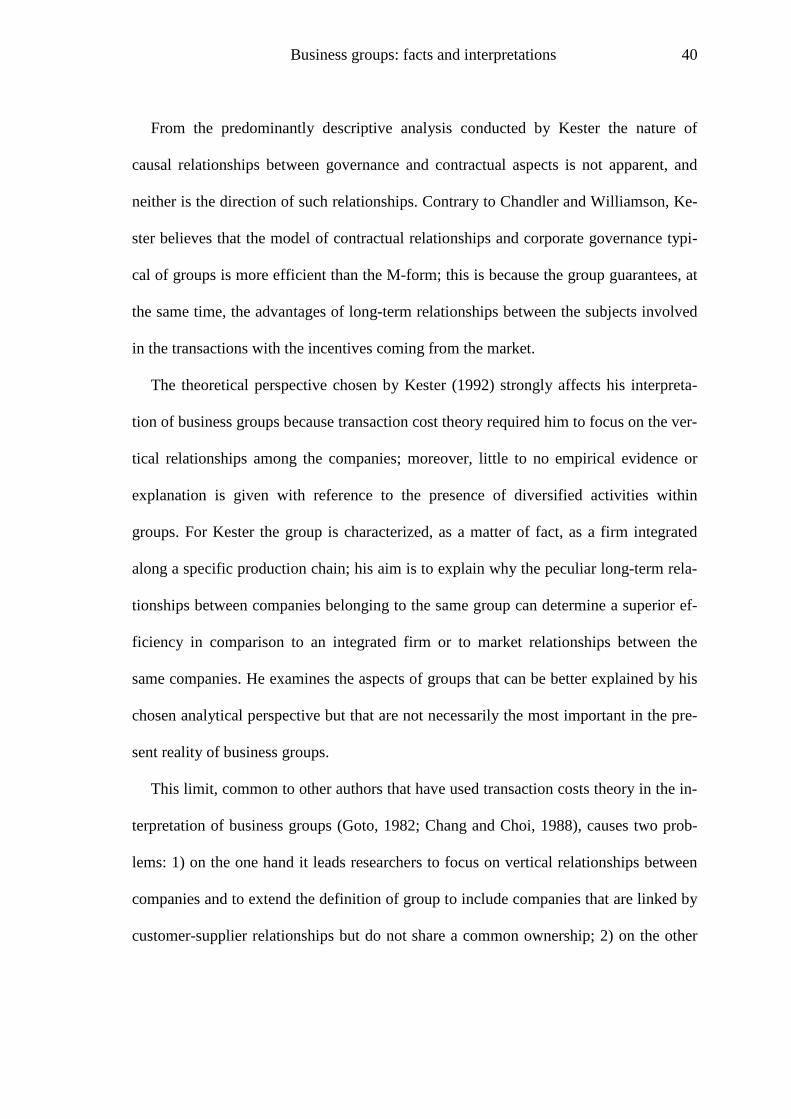
Business groups: facts and interpretations 40
From the predominantly descriptive analysis conducted by Kester the nature of
causal relationships between governance and contractual aspects is not apparent, and
neither is the direction of such relationships. Contrary to Chandler and Williamson, Ke-
ster believes that the model of contractual relationships and corporate governance typi-
cal of groups is more efficient than the M-form; this is because the group guarantees, at
the same time, the advantages of long-term relationships between the subjects involved
in the transactions with the incentives coming from the market.
The theoretical perspective chosen by Kester (1992) strongly affects his interpreta-
tion of business groups because transaction cost theory required him to focus on the ver-
tical relationships among the companies; moreover, little to no empirical evidence or
explanation is given with reference to the presence of diversified activities within
groups. For Kester the group is characterized, as a matter of fact, as a firm integrated
along a specific production chain; his aim is to explain why the peculiar long-term rela-
tionships between companies belonging to the same group can determine a superior ef-
ficiency in comparison to an integrated firm or to market relationships between the
same companies. He examines the aspects of groups that can be better explained by his
chosen analytical perspective but that are not necessarily the most important in the pre-
sent reality of business groups.
This limit, common to other authors that have used transaction costs theory in the in-
terpretation of business groups (Goto, 1982; Chang and Choi, 1988), causes two prob-
lems: 1) on the one hand it leads researchers to focus on vertical relationships between
companies and to extend the definition of group to include companies that are linked by
customer-supplier relationships but do not share a common ownership; 2) on the other
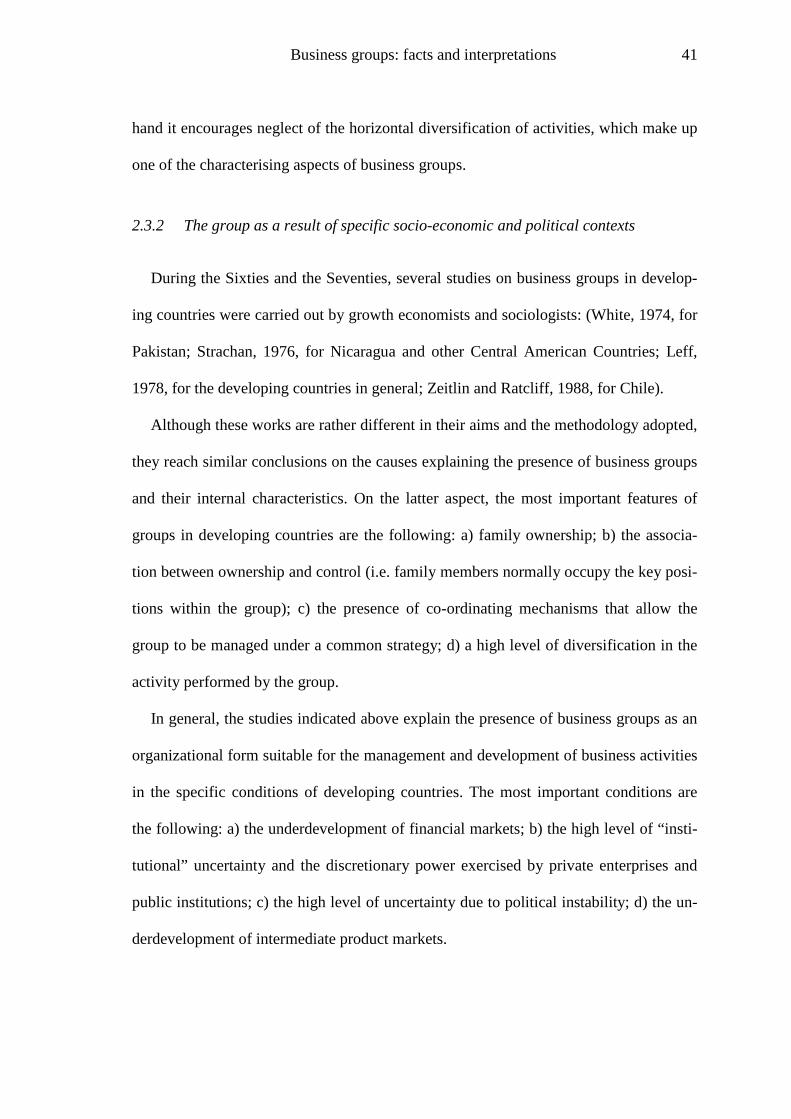
Business groups: facts and interpretations 41
hand it encourages neglect of the horizontal diversification of activities, which make up
one of the characterising aspects of business groups.
2.3.2 The group as a result of specific socio-economic and political contexts
During the Sixties and the Seventies, several studies on business groups in develop-
ing countries were carried out by growth economists and sociologists: (White, 1974, for
Pakistan; Strachan, 1976, for Nicaragua and other Central American Countries; Leff,
1978, for the developing countries in general; Zeitlin and Ratcliff, 1988, for Chile).
Although these works are rather different in their aims and the methodology adopted,
they reach similar conclusions on the causes explaining the presence of business groups
and their internal characteristics. On the latter aspect, the most important features of
groups in developing countries are the following: a) family ownership; b) the associa-
tion between ownership and control (i.e. family members normally occupy the key posi-
tions within the group); c) the presence of co-ordinating mechanisms that allow the
group to be managed under a common strategy; d) a high level of diversification in the
activity performed by the group.
In general, the studies indicated above explain the presence of business groups as an
organizational form suitable for the management and development of business activities
in the specific conditions of developing countries. The most important conditions are
the following: a) the underdevelopment of financial markets; b) the high level of “insti-
tutional” uncertainty and the discretionary power exercised by private enterprises and
public institutions; c) the high level of uncertainty due to political instability; d) the un-
derdevelopment of intermediate product markets.
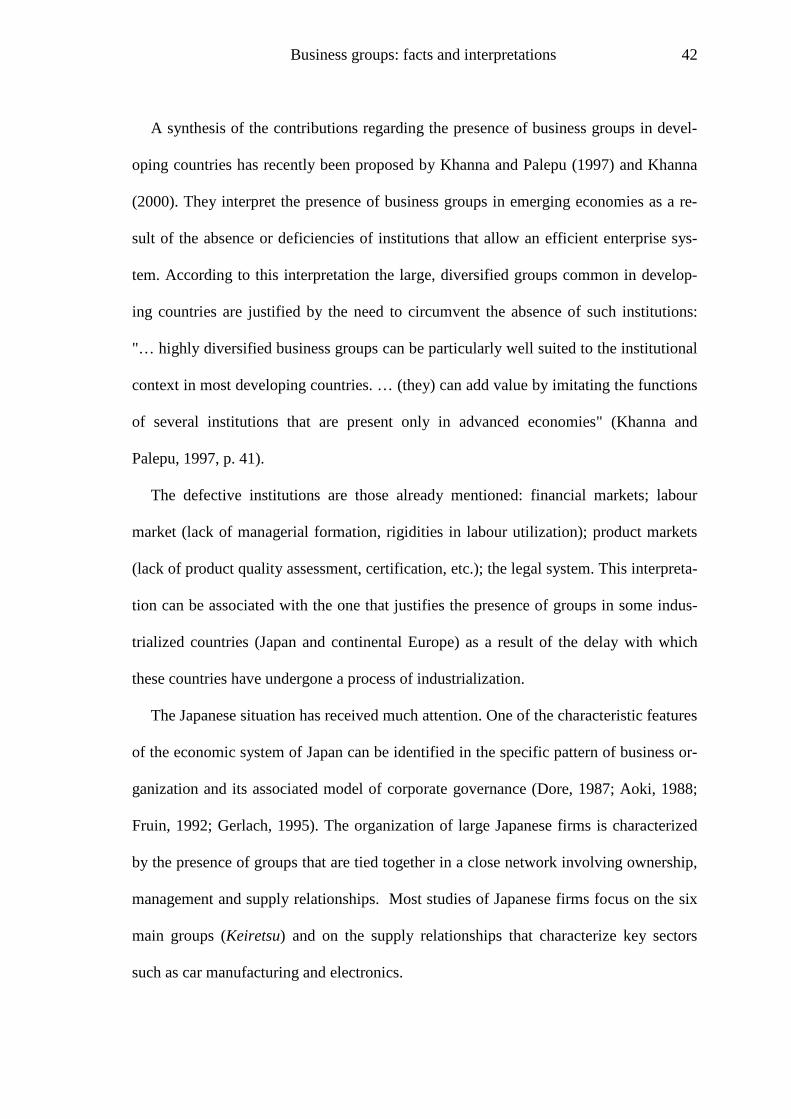
Business groups: facts and interpretations 42
A synthesis of the contributions regarding the presence of business groups in devel-
oping countries has recently been proposed by Khanna and Palepu (1997) and Khanna
(2000). They interpret the presence of business groups in emerging economies as a re-
sult of the absence or deficiencies of institutions that allow an efficient enterprise sys-
tem. According to this interpretation the large, diversified groups common in develop-
ing countries are justified by the need to circumvent the absence of such institutions:
"… highly diversified business groups can be particularly well suited to the institutional
context in most developing countries. … (they) can add value by imitating the functions
of several institutions that are present only in advanced economies" (Khanna and
Palepu, 1997, p. 41).
The defective institutions are those already mentioned: financial markets; labour
market (lack of managerial formation, rigidities in labour utilization); product markets
(lack of product quality assessment, certification, etc.); the legal system. This interpreta-
tion can be associated with the one that justifies the presence of groups in some indus-
trialized countries (Japan and continental Europe) as a result of the delay with which
these countries have undergone a process of industrialization.
The Japanese situation has received much attention. One of the characteristic features
of the economic system of Japan can be identified in the specific pattern of business or-
ganization and its associated model of corporate governance (Dore, 1987; Aoki, 1988;
Fruin, 1992; Gerlach, 1995). The organization of large Japanese firms is characterized
by the presence of groups that are tied together in a close network involving ownership,
management and supply relationships. Most studies of Japanese firms focus on the six
main groups (Keiretsu) and on the supply relationships that characterize key sectors
such as car manufacturing and electronics.

Business groups: facts and interpretations 43
In the case of Keiretsu, these are large business groups linked by cross minority
shareholdings and interlocking directorate mechanisms (that is, the same board mem-
bers for the main companies in the group). The structure of these groups, therefore, is
horizontal rather than pyramidal (Goto, 1982). In the case of the car manufacturing and
electronics groups the term group is used with reference to the network of suppliers to a
large company. The horizontal groups that characterize the largest companies in Japan
are not the only form of group that exists there. Shimotani (1997, p. 24) identifies three
types of groups: i) corporate complexes (such as the Keiretsu referred to above); ii)
corporate groups; iii) subcontractors (networks of suppliers). While the literature on
Japanese firms has mainly focused on the first and third of these three forms, corporate
groups (that is, pyramidal groups) are in fact the most widespread in Japan.22
The term ‘corporate group’ will be used to identify the organic whole consisting of
a parent company at the apex of a supporting cast of group companies, each linked
to the parent by capital and operational ties. Virtually all major Japanese companies
are organized in this corporate group form. (Shimotani, 1997, p. 9)
Corporate
groups correspond to the definition of the business group used in this study:
According to Shimotani these groups are established through new company spin-offs
rather than by the acquisition of established businesses. The setting up of new compa-
nies is the result of a diversification process or the need to control the production chain.
The phenomenon of business groups in emerging markets continues to attract the at-
tention of management researchers. A special issue on conglomerates and business
22. ‘Of the three types, the one that occupies the most central position is the corporate group, composed of a large number of subsidiaries and forming a fundamental unit of business enterprise’ (Shimotani, 1997, p. 9).
Business groups: facts and interpretations 44
groups in the Asia Pacific was published in December 2006 by Asia Pacific Journal of
Management. While adding new empirical evidence on the structure, performance and
evolution of business groups in emerging markets (especially East Asian countries)
these new contributions do not change the basic explanation for the importance of busi-
ness groups in emerging economies.
As stated by Peng and Delios in the presentation of the special issue of the Asia Pa-
cific Journal of Management mentioned above: “In general, business groups and con-
glomerates are creatures of institutional imperfections”. (Peng and Delios, 2006, p.
399). This view is shared by Chang (2006b) with specific regard to East Asian coun-
tries:
“Business groups are creatures of market imperfections, government intervention,
and socio-cultural environments. I expect that as long as markets, especially capital
markets, are imperfect and the East Asian governments influence resource alloca-
tion, business groups will continue to exist and even prosper in this region. As
markets become more efficient and government intervention subsides, business
groups may lose their reason for existence and see their influence decline”. (Chang,
2006b, p. 413)
Business groups occur most frequently and most profitably in countries where mar-
ket inefficiencies are prominent, usually developing countries with significant market
information asymmetry (Yiu et al., 2005). In particular, it is the delay in the develop-
ment of capital markets that justifies the specific type of development and firm govern-
ance represented by the group. If this hypothesis were correct, we should see a progres-
sive reduction in the presence of groups as the process of industrialisation and the de-
velopment of those institutions typical of a market economy progresses. At present, we
Business groups: facts and interpretations 45
lack longitudinal statistics on the phenomenon of business groups that might allow us to
confirm or reject the hypothesis of a diminishing role of business groups in emerging
economies.
2.3.3 The group as a mechanism of corporate governance
European studies on business groups have paid the most attention to the separation of
ownership and control and to the way in which this separation is carried out through the
group form. What differentiates the countries of continental Europe from the UK and
USA is the particular way in which the first stages of industrial accumulation occurred.
Lack of private capital and insufficient development of stock markets have made public
sector and bank intervention more important in the financing of industrial activities
(Landes, 1969). The differences between Continental European and English-speaking
countries in the accumulation process have had considerable influence on the ways
firms are financed and controlled. Countries in continental Europe are characterized by
a higher concentration of ownership, a closer association between ownership and con-
trol, by a reduced importance of the stock market and by the greater importance of
banks in financing businesses. In the UK and the USA, the development of stock mar-
kets has favoured the establishment of public companies under managerial control. In
continental Europe the group structure has allowed concentrated control based on
banks, families or the state to persist (La Porta et al., 1999). In a public company the
fundamental instrument for controlling manager discretion is the stock market, through
the contestability of control. In the case of business groups, the control of the firms is
granted by forms of negotiated relationships between the main stakeholders who ensure
greater stability of control (Trento, 1993, p. 34). According to this interpretation, groups
Business groups: facts and interpretations 46
are used to carry out two main functions: a) the stability of control; b) the separation be-
tween ownership and control.
Daems’s (1978) study of the largest Belgian groups is one of the first to interpret the
group as a way to reach efficiency and stability in the control of business activities.
Daems pays great attention to the main financial holdings defined as "…financial insti-
tutions which manage a portfolio of stocks in order to control the companies in which
they hold a share of the equity capital" (Daems, 1978, p. 2). The crucial point in this
definition is the notion of control since it is this activity which justifies the existence of
the group. By control Daems means the possibility of monitoring, and therefore influ-
encing, the allocation of capital by the controlled companies. Through this function the
holding company replaces the “visible hand” of managerial control with the invisible
one of the capital market. Nevertheless, this requires a developed capital market to raise
the capital necessary for acquiring control of the subsidiaries23
23 "By acting as a financial intermediary in the capital market, the holding company becomes similar to a closed mutual fund. The basic difference is that holding companies strive for control over corporate deci-sion-making" (Daems, 1978, p. 3).
. The presence of groups
is justified by the fact that the mechanism of resource allocation guaranteed by the hold-
ing company is more efficient than the capital market. From a theoretical point of view,
in a perfect capital market there would be no need for intermediation. The existence of
the holding company can therefore be justified on the basis of two elements: 1) the exis-
tence of imperfections in the capital market (information, transaction and monitoring
costs) which make both portfolio diversification and the active management of shares
carried out by the holding company convenient; 2) the existence of advantages stem-
ming from the direct control of businesses, that result from the possibility of directly in-
fluencing strategic decisions and resource allocation. According to Daems it is the sec-
Business groups: facts and interpretations 47
ond factor which is especially important in explaining the presence of groups24. On the
basis of empirical evidence on the main Belgian groups Daems (1978) shows that the
shares held by the holding companies and the mechanisms of interlocking directorates
guarantee the possibility of exercising an effective control over the strategic decisions
of companies. The main reason for the persistence of the holding company is to be
found, in Daems’ opinion, in the presence of conflicts of interest between investors and
in the inability of the capital market to offer an efficient solution for these conflicts25
There are some studies by Italian authors who interpret the group as the mechanisms
for the control of resources invested in the controlled firms (Buzzacchi and Comombo,
1994; Buzzacchi and Pagnini, 1994; Guelpa, 1994; Buzzacchi and Colombo, 1996).
Buzzacchi and Colombo (1994) show that belonging to a group influences the concen-
tration of ownership. Other things being equal, a firm belonging to a group shows a
higher spread of ownership if the other companies in the group require a high amount of
capital and vice versa. This is the result of internal mechanisms of financial resource al-
location that characterise pyramidal groups where the ‘invisible hand’ of the stock mar-
. In
this situation investors are prepared to pay a prize in order to exercise control over the
businesses to allow for coordination of their company policies. The holding company is
the instrument which allows this control to be exercised: "The financial institution of the
holding company, as an invention of financial capitalism meant to structure the corpo-
rate control market, permits the large investors to implement their policy preferences
and diversify their wealth at the same time" (Daems, 1978, p. 122).
24 "The economic rationale for the existence of the large holding companies and industrial combines, if any exists, must consequently be sought in the struggle for control over corporate wealth and corporate strategic decision-making" (Daems, 1978, p. 65). 25 “Conflicts of interest arise among them [investors] because of uncertainty, differences in beliefs about the likely occurrence of some events and because of incomplete markets” (Daems, 1978, p. 122).
Business groups: facts and interpretations 48
ket is replaced by the ‘visible hand’ of the vertex of the group. According to Buzzacchi
and Colombo (1996) the empirical evidence available does not permit an assessment of
whether or not the distortion in the ownership structure induced by the presence of py-
ramidal groups responds to allocation efficiency criteria. From a theoretical point of
view, there are arguments in favour of this – as the greater incentives for the monitoring
of managers or the investment in information and human capital - as well as against it –
as the greater difficulty in the reallocation of control.
Buzzacchi and Pagnini (1994, 1995) try to measure the importance of financial re-
sources managed within the group (internal capital market) and allocation efficiency of
this internal market. In their first study on a sample of 510 large industrial enterprises,
they show that the amount of capital intermediated within the group is comparable to
the financial resources raised by the group from external sources. This confirms the role
of the group as an instrument for the allocation of financial resources in the same way
as in a multi-divisional enterprise. Unlike the latter, in a group the centres for raising ex-
ternal capital are multiplied, since capital (debt and equity) can be raised both by the
holding company and by the individual companies. It is this feature, according to Buz-
zacchi and Pagnini, which could potentially generate inefficiencies in the allocation
process. In fact, the allocation process can be orientated to maximising the utility for the
vertex controlling the group to the detriment of minority shareholders of individual
companies. This possibility is ruled out in the case of a multi-divisional enterprise since
the shareholders have the same share in all the activities (divisions) of the firm
(Buzzacchi and Pagnini, 1995).
The inefficiency associated with the ownership structure of the group and potential
conflicts of interest between majority and minority shareholders in individual busi-
Business groups: facts and interpretations 49
nesses have particularly interested those authors who interpret the group as being a
mechanism for separating ownership and control. The interpretation of groups as a way
to maximise control over a number of activities had already been proposed by Einaudi
in the Twenties, referring to the Italian situation, and even before that by Hilferding
with reference to the most important capitalist countries (Hilferding and Bottomore,
1981).
The first systematic study which adopted this perspective with reference to the Italian
situation is by Brioschi et al. (1990) who examine the ownership and control structure
of the pyramidal groups listed on the Milan stock exchange. The interpretation of the
group given by these authors is clearly illustrated in the introduction to their book:
“even if the importance of the group as an organisational form of enterprise mid-
way between the market and hierarchy cannot be denied, it is necessary to recog-
nise explicitly that the group phenomenon, in its hierarchical version, is essentially
linked, for causes and effects, to the issue of separation between ownership and
control … following Hilferding hypothesis, the group form is seen as an answer to
the problem of controlling the widest range of activities with a limited amount of
capital.” (Brioschi et al., 1990, p. 21-22).
In this interpretation, a fundamental role is played by the relationship between groups
and the stock market since the maximization of controlled capital is achieved through
the presence of minority shareholders in the companies controlled by the vertex of the
group. The same conclusion is reached by a study of the bank of Italy at the beginning
of the Nineties. In this study the pyramidal group is also seen as a mechanism for sepa-
rating ownership and control:
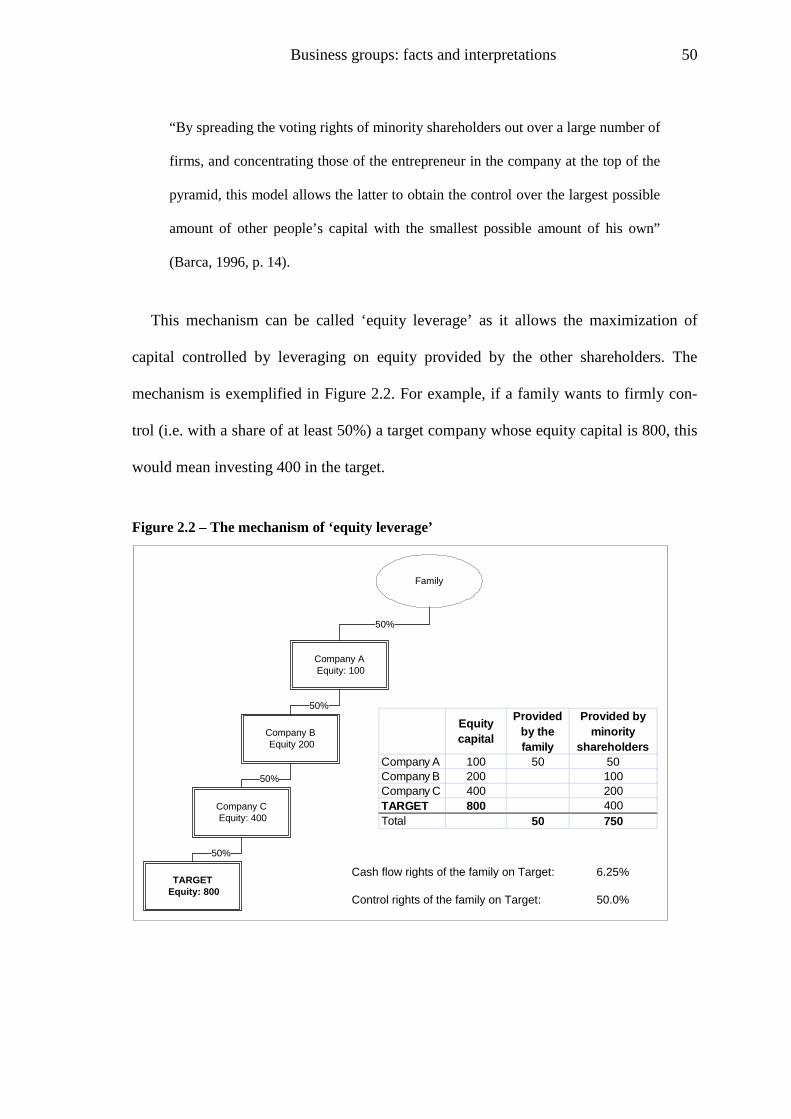
Business groups: facts and interpretations 50
“By spreading the voting rights of minority shareholders out over a large number of
firms, and concentrating those of the entrepreneur in the company at the top of the
pyramid, this model allows the latter to obtain the control over the largest possible
amount of other people’s capital with the smallest possible amount of his own”
(Barca, 1996, p. 14).
This mechanism can be called ‘equity leverage’ as it allows the maximization of
capital controlled by leveraging on equity provided by the other shareholders. The
mechanism is exemplified in Figure 2.2. For example, if a family wants to firmly con-
trol (i.e. with a share of at least 50%) a target company whose equity capital is 800, this
would mean investing 400 in the target.
Figure 2.2 – The mechanism of ‘equity leverage’
Company A Equity: 100
Company B Equity 200
50%
Company C Equity: 400
50%
Family
50%
TARGET Equity: 800
50%
Equitycapital
Provided by the family
Provided by minority
shareholdersCompany A 100 50 50Company B 200 100Company C 400 200TARGET 800 400Total 50 750
Cash flow rights of the family on Target: 6.25%
Control rights of the family on Target: 50.0%
Business groups: facts and interpretations 51
Alternatively, the family could create a pyramid of holding companies between the
family and the target. In the company at the top of the pyramid (Company A), the fam-
ily might own 50% of shares, the remaining capital provided by other shareholders. Be-
ing in control of Company A, the family can decide on the allocation of its capital that
is used to firmly control (50%) another company (Company B) that issued 200 of equity
capital; the remaining capital is again provided by other shareholders (the market in the
case of a listed company). This can be repeated several times. In each passage the cash
flow rights of the family (i.e. the rights to dividends) are reduced according to the share
in the company; in this example, they are cut by a half each time. This is not the case for
the control rights which remain at 50% for all the companies. With a pyramid of 4 com-
panies, a family can firmly control a capital of 800 by investing only 50 (the 6.25%);
while firmly controlling it with a direct share of 50%.
As an actual example of this phenomenon Figure 2.3 shows the pyramidal structure
used by the Tronchetti Provera family to control Pirelli & Co. and Telecom Italia, both
among the largest companies listed on the Milan stock exchange. The control of Tele-
com was in the hands of the company Olimpia that retained 18% of voting shares; this
share was enough to secure Telecom’s control, given that the remaining shares were
dispersed among a large number of minority shareholders. The cash flow rights of Tele-
com held by the Tronchetti Provera family (through the family holding GPI) were about
0.8 of the Telecom capital. This last figure corresponds to the capital actually invested
by GPI to secure the 18% control of Telecom Italia26
.
26 Morck and Yeung (2003) report a similar case of the Bronfman group in Canada. Other cases of large family groups with listed companies are reported in Morck (2000) and Barca and Becht (2001).
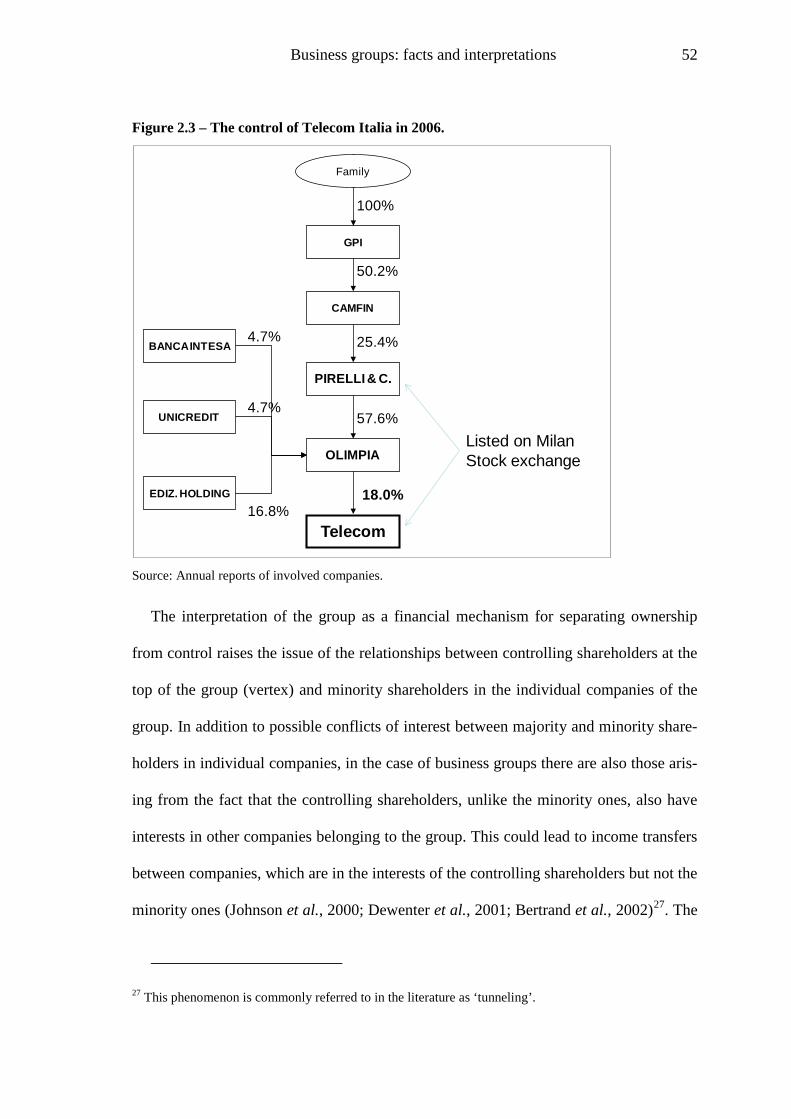
Business groups: facts and interpretations 52
Figure 2.3 – The control of Telecom Italia in 2006.
Source: Annual reports of involved companies.
The interpretation of the group as a financial mechanism for separating ownership
from control raises the issue of the relationships between controlling shareholders at the
top of the group (vertex) and minority shareholders in the individual companies of the
group. In addition to possible conflicts of interest between majority and minority share-
holders in individual companies, in the case of business groups there are also those aris-
ing from the fact that the controlling shareholders, unlike the minority ones, also have
interests in other companies belonging to the group. This could lead to income transfers
between companies, which are in the interests of the controlling shareholders but not the
minority ones (Johnson et al., 2000; Dewenter et al., 2001; Bertrand et al., 2002)27
27 This phenomenon is commonly referred to in the literature as ‘tunneling’.
. The
Family
GPI
CAMFIN
PIRELLI & C.
OLIMPIA
Telecom
EDIZ. HOLDING
UNICREDIT
BANCA INTESA
100%
16.8%18.0%
57.6%
4.7%
4.7%
25.4%
50.2%
Listed on Milan Stock exchange

Business groups: facts and interpretations 53
interpretation of the group as a financial device to separate ownership and control is ap-
propriate for groups that include listed companies and where there is a significant diver-
gence between control rights and cash flow rights; it concerns a tiny minority of large
groups, though in some small countries they can represent an important fraction of the
economy (Morck et al., 2005).
In a recent paper Almeida and Wolfenzon (2006) have extended the financial expla-
nation to small, family owned business groups. The starting point of Almeida and Wolf-
enzon (AW from now on) is the dissatisfaction with the equity leverage explanation,
given the empirical evidence on the widespread presence of business groups in the small
business sector. As stated by the authors:
“Despite the ubiquity of pyramidal business groups, no formal theory explains their
existence. A traditional informal explanation argues that pyramids are formed to al-
low a family to achieve control of a firm using only a small cash flow stake”
(Almeida and Wolfenzon, 2006, p. 2638, italics added).
From the above statement it seems that the dissatisfaction is motivated not only by
the discrepancies between theory and facts, but also by the way in which the traditional
theory is formulated (informal versus formal). For this reason, the aim of AW is two-
fold: the first, explicitly stated, is that of providing a more general model for the pres-
ence of business groups that does not rely on the separation of cash flow rights from
control rights; the second, implicit, is to develop a formal model to account for the new
evidence. In social sciences a formal model is a mathematical model. The choice of
mathematical formulation is associated with two main consequences (Bianchi and
Henrekson, 2005): the assumption of a (rationally) maximizing behaviour on the part of
Business groups: facts and interpretations 54
the decision makers (in this case the family)28
The AW model justifies why business groups exist and why they are organized as
pyramids instead of an ownership structure in which companies are owned directly by
the family; the latter form is what I have called ‘informal groups’ but is referred to as
horizontal groups by AW (see
and the choice of a quantifiable target for
maximization so that it is possible to analytically specify the relationship between aims
and means to achieve them. In the case of the AW model, the family maximizes the
monetary payoff of capital investment. The authors recognize that there are other rea-
sons why a controlling shareholder (an entrepreneur or a family) might wish to set up an
independent company to develop a new business: to separate risks from the established
company; to offer better incentives and more control to middle managers; and to in-
crease the transparency of results (Morck et al., 2005). Nevertheless, they argue that
these considerations do not alter the basic results of their model.
Figure 2.1, p. 24). The AW model also aims to explain
why firms controlled through pyramids sometimes have substantial deviations between
ownership and control while in other cases the separation is minor, as is the case in most
small and medium-sized groups. For these reasons, the AW model can be considered a
more general explanation of business groups than that based on the separation of cash
flow rights from control rights. An interesting novelty of the AW model is that business
28 Almeida and Wolfenzon (2006) consider the ‘family’ as the ultimate owner of a business group and the decision maker. In this study we refer to the ‘entrepreneur’ as the ultimate owner and the decision maker. There is some truth in both choices. When considering the ownership of a group we often observe that it is shared by members of the entrepreneur’s family; when considering the decision process it appears that the entrepreneur has a key role.
Business groups: facts and interpretations 55
groups are considered the result of companies being added over time by the family as
new business opportunities arise29
“When this opportunity arises, the family must decide on the ownership structure
of the business group. Under a pyramidal structure, the new firm is owned by all
the shareholders of the original firm. As a result, although the family shares the se-
curity benefits of the new firm with nonfamily shareholders of the original firm, it
has access to all of the retained earnings (cash) of the original firm. The alternative
ownership structure we consider is one in which the family controls the new firm
by directly holding its shares.” (Almeida and Wolfenzon, 2006, p. 2639)
.
A key ingredient of the model is the assumption of poor investor protection in finan-
cial markets. Poor investor protection allows the family to divert (i.e. appropriate at the
expense of minority shareholders) some of the cash flow of the controlled company; at
the same time, the presence of minority shareholders reduces the security benefits (i.e.
the share of dividends from the controlled company) for the family. In the presence of
poor investor protection, the pyramidal structure is more attractive than the horizontal
structure.
Because in a pyramidal structure the family shares the security benefits with non-
family shareholders, while in the horizontal structure it keeps all the security bene-
fits, high diversion gives a greater payoff to the family under the pyramidal struc-
ture than under the horizontal structure (payoff advantage). Second, because exter-
nal investors anticipate diversion and discount the terms at which they are willing
29 AW use the term ‘family’ to refer to what we have called the ‘ultimate owner’ of a business group. The use of the term family recognizes that the authors are dealing with privately owned companies, controlled by one or more entrepreneurs and their family members.
Business groups: facts and interpretations 56
to provide financing, it is optimal for the controlling shareholders to use internal
funds from existing firms to set up new firms before raising any external financing.
This makes the family’s ability to use all the retained earnings of existing group
firms in a pyramid structure more valuable (financing advantage). (Almeida and
Wolfenzon, 2006 pp. 2639-2640, italics in the original)
This citation clarifies that in the AW model the explanation for the presence of py-
ramidal groups rests on financial arguments while organizational or other management
issues receive no consideration. Because the AW model is based on the hypothesis of
wealth maximization and rules out organizational issues I consider it as belonging to the
‘financial explanations’ of business groups. The AW model makes several predictions
about the factors affecting the presence of business groups, their characteristics and the
ownership structure of controlled companies. The paper of Almeida and Wolfenzon
(2006) is a theoretical one; the authors discuss some anecdotical evidence but do not
provide an empirical test of their conclusions.
Compared to the previous financial explanations, the AW model is specifically rele-
vant for this thesis as it refers to family owned (small) business groups rather than large
groups. For this reason it is important to examine how far the AW model is able to ex-
plain the present characteristics of business groups in the small business sector and what
questions it leaves unanswered.
On a theoretical level, the main weakness of the AW model is that it does not give
enough consideration to the agency costs of outside equity (i.e. equity provided by sub-
jects that are external to the controlling family) in family firms. This is a crucial issue,
because the justification for the creation of business groups and pyramids in particular
Business groups: facts and interpretations 57
rests on the possibility for the entrepreneur to raise equity capital from external (to the
entrepreneur’s family) shareholders when financing new business ventures.
Agency costs are normally referred to the relations between owners and managers in
firms where there is a separation between ownership and control. The basic idea of
agency theory is that managers, as agents of shareholders (principals), can engage in de-
cision making and behaviours that may be inconsistent with maximizing shareholder
wealth (Jensen and Meckling, 1976; Fama and Jensen, 1983).
Agency costs are normally considered relevant in the case of publicly traded firms.
In the context of family firms the conventional viewpoint has been that agency issues
are of little to no significance owing to the association of ownership and control and the
resulting concordance of the interests of owners and managers in such firms (Jensen and
Meckling, 1976; Daily et al., 2003). However, recent research suggests that agency is-
sues in family firms are more complex than previously believed (Chrisman et al., 2004;
Steier et al., 2004). In fact, entrenched ownership and asymmetric altruism could create
unique agency problems in family controlled firms (Gomez-Mejia et al., 2001; Schulze
et al., 2001; Schulze et al., 2003). Up to now the literature has given attention to the fact
that the overlapping between family and business objectives can hamper firm’s per-
formance. Little attention has been paid to the agency costs arising from the presence of
minority shareholders (Chrisman et al., 2005, p. 560). The available studies refer to
specific situations like when financial resources are raised involving family members
(Steier, 2003) as in the case of venture capital operations (Chrisman et al., 2005, p.
560).
In the case of small firms, because of the coincidence between the (main) owners and
managers, the latter will pursue a value maximization policy which is in the interests of

Business groups: facts and interpretations 58
all the shareholders. This is clearly a simplified assumption for several reasons: a) it is
recognized that family owned firms can pursue objectives that are in the interests of the
controlling family (such as giving management positions to its members) but not of the
minority shareholders; b) when managers enjoy perks that reduce profits; this has no
consequences on the overall welfare of the controlling family but can seriously hurt the
interests of minority shareholders. In the case of business groups these problems are ex-
acerbated further given the possibility that the controlling owner may choose to divert
resources from companies where he/she has higher shares to the detriment of companies
where he/she has lower shares.
Despite the relevance of these issues for the family firms in general and business
groups in particular, it is an under researched area. For this reason I will dedicate chap-
ter 4 to discussing the ownership structure of business groups and assessing to what ex-
tent the financial explanation can be extended to small (family-owned) business groups.
2.4 The entrepreneurship perspective on business groups
The phenomenon of business groups in SMEs has only recently received attention,
mainly from entrepreneurship researchers. Even then it has not been a direct interest;
rather, it is the result of studies of a connected phenomenon: that of habitual entrepre-
neurs, i.e. entrepreneurs who have started more than one business during their lifetime.
Following a few seminal articles (MacMillan, 1986; Starr and Bygrave, 1991), literature
on this phenomenon grew rapidly during the nineties (see issue No. 4, Vol. 22 1998 of
Entrepreneurship Theory and Practice dedicated to ‘habitual’ entrepreneurs). Although
we lack a clear picture on the extent of this phenomenon in different countries, it can be
said that the impact of ‘multiple business ownership’ in small firms seems relevant in
Business groups: facts and interpretations 59
all the industrialised countries (Donckels et al., 1987; Birley and Westhead, 1993; Scott
and Rosa, 1996; Rosa and Scott, 1999c).
Within the habitual entrepreneurs category it is possible to distinguish two types
(Westhead and Wright, 1998b): ‘serial entrepreneurs’, i.e. entrepreneurs who sell their
original business but at a later date inherit, establish, and/or purchase another business;
and ‘portfolio entrepreneurs’, i.e. entrepreneurs who retain their original business and
establish and/or purchase or inherit other businesses. Both categories are referred to as
‘habitual entrepreneurs’. In contrast ‘novice’ entrepreneurs are entrepreneurs on their
first business start-up (Birley and Westhead, 1993; Wright et al., 1997). The terms
‘multiple venture entrepreneurs’ has also been used (Starr and Bygrave, 1991). In this
study I am specifically interested in ‘portfolio entrepreneurs’, i.e. entrepreneurs who
start or acquire new businesses while retaining those previously established, thus setting
up a business group. The two concepts (portfolio entrepreneur and business group) refer
to the same phenomenon although from different perspectives: business group refers to
the set of companies owned by the same entrepreneur; portfolio entrepreneur refers to
the person owning the set of companies30
We now have a sufficient number of studies on the phenomenon of habitual entre-
preneurs to be able to divide them in two broad categories: the first is mainly concerned
with exploring the differences between novice and habitual entrepreneurs with reference
to personal characteristics, the gestation process, the features of the new ventures, and
.
30 Companies are by definition owned by more than one person. Sometimes they all play important roles in them so we need to think of them as an entrepreneurial team. Owners of companies in the small busi-ness sector are often members of the same family; for this reason the economic and management litera-ture about groups often uses the term ‘family’ as a label to indicate the set or persons owning a company.
Business groups: facts and interpretations 60
so on; the second category of studies focus on the characteristics of the entire group of
businesses brought about by the activity of habitual entrepreneurs.
2.4.1 Comparison between habitual and novice entrepreneurs
The first strand of literature on habitual entrepreneurs is the largest. Its main aim is
detecting the differences between novice and habitual entrepreneurs and examining how
these differences affect the characteristics and performance of the new ventures (Birley
and Westhead, 1993; Kolvereid and Bullvåg, 1993; Wright et al., 1997b, 1997a; Alsos
and Kolvereid, 1998; Westhead and Wright, 1998b, 1998a; Ucbasaran et al., 2003c;
Westhead et al., 2003; Westhead et al., 2005; Ucbasaran et al., 2006). The common hy-
pothesis of these studies is that habitual entrepreneurs should be advantaged over novice
entrepreneurs in starting new businesses. These advantages refer both to the identifica-
tion of new business opportunities and to the exploitation of these opportunities through
the start-up of new organizations.
Ucbasaran et al. (2003b) find that there are differences in the process of opportunity
identification between novice and habitual entrepreneurs: specifically, they find that
with the same amount of information, habitual entrepreneurs are more likely to identify
business opportunities than novice entrepreneurs. Moreover, habitual entrepreneurs are
more likely to emphasize the importance of spontaneity and alertness in the identifica-
tion of new business opportunities and are more opportunistic and alert to recognizing
new business opportunities than novice entrepreneurs. Not only does the process of op-
portunity recognition seem different between novice and habitual entrepreneurs, but
also the outcomes: habitual entrepreneurs reported significantly higher levels of innova-
tiveness in their new opportunities than novice entrepreneurs. To explain these differ-
Business groups: facts and interpretations 61
ences, the literature on habitual entrepreneurs has focused on the entrepreneur’s learn-
ing process. The theoretical approach most often used in this literature is that of human
capital. Human capital is a somewhat loose concept that encompasses the practical
knowledge, acquired skills and learned abilities of an individual that make him/her po-
tentially productive in some activities. In the case of habitual entrepreneurs, the knowl-
edge, skills and abilities are those required for the start-up of new firms: i.e. the recogni-
tion and exploitation of new business opportunities. Strictly speaking the human capital
concept is somewhat inappropriate in this context; human capital is normally thought of
as the result of an explicit ‘investment’ in education and training. In the case of habitual
entrepreneurs, such accumulation is the involuntary result of an activity (the start-up of
a business) that has been carried out for reasons other than the accumulation of knowl-
edge and skills.
The improvement of entrepreneurs’ human capital is the result of two distinct
mechanisms: learning and experience. There is an important difference between the two
mechanisms: while the learning process of how to start a business can be considered as
a ‘general purpose device’, and for this reason it can be useful for any subsequent start-
up, experience appears to be more ‘localized’ in terms of sectors and geographical ar-
eas. Ucbasaran et al. (2008, pp. 61-71) also make a distinction between general and spe-
cific human capital. General human capital refers to education and managerial experi-
ence, while specific human capital refers to aspects that are more closely related to en-
trepreneurial processes: entrepreneurial team experience, motivations for establishing
new ventures, perceived entrepreneurial skills, and so on.
The human capital – i.e. skills, experience, network relations, etc. - accumulated by
habitual entrepreneurs in their previous start-up(s) is expected to differentiate their be-
Business groups: facts and interpretations 62
haviour in subsequent start-ups from novice entrepreneurs; for this reason, other things
being equal, businesses started by habitual entrepreneurs are expected to perform better
than businesses started by novice entrepreneurs. Though some studies found empirical
evidence to support the former hypothesis - i.e. the presence of differences in the start-
up process between novice and habitual entrepreneurs - (Westhead and Wright, 1998b;
Westhead et al., 2003), empirical studies have not found support for the latter hypothe-
sis – i.e. that business started by habitual entrepreneurs should perform better than busi-
nesses started by novice entrepreneurs (Kolvereid and Bullvåg, 1993; Westhead and
Wright, 1998b). As stated by Carter and Ram (Carter and Ram, 2003):
“The “popular truth” not upheld by the evidence, however, is that the experience of
previous venture ownership endows habitual entrepreneurs with a greater propen-
sity for business success. Within the research literature, there is almost no evidence
to support such a view” (Carter and Ram, 2003, p. 372).
There are several explanations for this apparent contradiction between this reason-
able hypothesis and the empirical evidence. As already noted by Starr and Bygrave
(1991) previous start-up experience can result in both assets and liabilities when consid-
ering the subsequent start-up of a business. Liabilities may refer to biases and blindspots
as a result of previous entrepreneurial experience:
“... through experience, an entrepreneur may develop the inertia of conventional
wisdom which may be challenged by others who bring a fresher perspective. The
negative impact of expertise might be considered the liabilities of staleness.” (Starr
and Bygrave, 1991 , p. 222, text underlined in the original)
Business groups: facts and interpretations 63
Also in the case of network relationships developed through past start-up experience,
Starr and Bygrave (1991) suggest that they can bring problems as well as advantages in
subsequent start-ups. In fact, experienced entrepreneurs might favour familiar circles
and customary relationships over the unknown, thus hindering their ability to innovate
(what they call the liability of sameness). Starr and Bygrave (1991) also point out other
potential negative effects of previous successes. For example, successful entrepreneurs
tend to spend more capital on subsequent ventures, not paying the same attention to re-
ducing fixed costs, increasing flexibility and reducing risks which they applied success-
fully in their resource-constrained first venture (what the authors call the liability of
costliness).
Besides the question of whether past start-up experience can be considered an asset
or a liability for subsequent start-ups, there is also an important methodological problem
when comparing the performances of novice and habitual entrepreneurs. When search-
ing for a positive relationship between previous start-up experience and subsequent
start-up success, the following assumptions are implicitly made:
1. It is possible to identify and measure a set of personal skills and attitudes that
influence the ability to recognize and exploit business opportunities;
2. It is possible to directly connect the level of those skills and attitudes to the
probability of success in new venture creation;
3. The ‘quality’ of entrepreneurs (i.e. the ‘stock’ of entrepreneurial skills and at-
titudes) were at an equal level before their first start-up or the differences are
much lower compared to what entrepreneurs can gain through the start-up ex-
perience.
Business groups: facts and interpretations 64
If assumption 1 is not satisfied, there would be a problem in the identification of the
variables that are enhanced during the start-up process and that are expected to be dif-
ferent depending on whether the entrepreneur is a novice or a habitual entrepreneur. In
the case of assumption 2, the problem is that of controlling for all the other variables in-
fluencing the probability of the success of a new venture, so that it is possible to isolate
the relationship between entrepreneurial attitude and skills and new venture success.
These two aspects are discussed at length in the literature on habitual entrepreneurship;
in fact, they are at the core of this literature.
Less importance has been given to the third question. The assumption of an almost
‘equal’ distribution of entrepreneurial attitudes and skills prior to the first start-up is
quite strong both from a theoretical and an empirical point of view. From a theoretical
point of view there are several models of entrepreneurial behaviour that start from the
opposite hypothesis: i.e. of an unequal distribution of entrepreneurial attitudes in the
population (Kihlstrom and Laffont, 1979; Holmes and Schmitz, 1990). If this is the
case, it is the initial stock of entrepreneurial capabilities that matter the most, compared
with the gains achieved through the start-up experience. From an empirical point of
view, there are several studies acknowledging differences in entrepreneurial attitudes
within the population (Chen et al., 1998; Freytag and Thurik, 2007; Ardagna and Lu-
sardi, 2008). Moreover, there can be other employment conditions - such as functional
responsibility within a firm - that can allow people to enhance their entrepreneurial
skills (for example in people management). If we do not retain the hypothesis of an
equal distribution of entrepreneurial attitudes and skills in the population before the first
start-up attempt, it could be that the stock of ‘entrepreneurial attitudes and skills’ of a
Business groups: facts and interpretations 65
novice entrepreneur is higher than that of an habitual entrepreneur, even though the lat-
ter had the opportunity to improve them during previous start-ups.
When considering portfolio entrepreneurs (i.e. those entrepreneurs that start new
businesses while retaining ownership and control of those previously established), there
is an additional problem; the relationship between the new business and the businesses
already established businesses needs to be taken into account. In fact, much of the lit-
erature on habitual entrepreneurs does not consider the entire growth process of busi-
ness cluster formation by habitual entrepreneurs and focuses on the last start-up, thus
not giving enough importance to the relationships between the new ventures and the
ones already set up by the entrepreneur. If the new business is in some way related to
the previous one (as it is in the majority of cases) it could be that the poor performance
of the new business is partially compensated by the synergies (and enhanced perform-
ance) of the established businesses. In making their decisions, portfolio entrepreneurs
take into account the overall performance of the businesses they control over time rather
than considering them independently.
2.4.2 Portfolio entrepreneurs and entrepreneurial processes
The second strand of studies on habitual entrepreneurs focuses on the characteristics
of the entire group of businesses brought about by the activity of habitual entrepreneurs.
The main aim of these studies is to explain the nature and processes of new business
development by habitual entrepreneurs and the characteristics of the resulting groups (or
clusters) of companies. These issues were analysed initially by Rosa (1998) and Rosa
and Scott (1999a). Their approach involved mapping out each group and interviewing
the entrepreneurs to investigate how and why each company was added to the group.
Business groups: facts and interpretations 66
These authors were interested in understanding the overall growth of activities under the
control of an entrepreneur rather than paying attention to the performance of specific
businesses. The results were complex, showing that the reasons and strategies for add-
ing each new company were often different and varied considerably according to cir-
cumstances. Diversification, normally related to the current businesses, tended to pre-
dominate as a reason for setting up new firms; nevertheless, serendipity also played a
role as few entrepreneurs predicted in advance where the next additional business would
come from. These studies revealed that entrepreneurial processes are associated with the
growth of medium-sized groups, but they were exploratory in nature and do not at-
tempted to develop general hypotheses for the formation and growth of business groups
in the small business sector.
Rosa (1998) points to a number of interesting questions and further developments
that could arise from the study of habitual entrepreneurs. For example, it is not clear
how far aggregate value in the cluster of firms created by habitual entrepreneurs outper-
forms that of the single firm entrepreneur; i.e. whether the creation of a business group
in the small firm sector should be seen as a defensive strategy because of a lack of
growth in the original business or as way of attaining growth when market structures
become more segmented and competitive (Rosa, 1998 , p. 59). Rosa (1998) also intro-
duced the concept of ‘entrepreneurial performance’ to distinguish performance through
creating a cluster of ventures rather than through growing a single one.
“Comparing the latest firm started by a habitual entrepreneur with that started by a
novice entrepreneur ... can be potentially misleading without taking a more holistic
view of how growth in capital assets and employment is achieved over all business
activities.” (Rosa, 1998 , p. 58)
Business groups: facts and interpretations 67
A theoretical study that follows this line of reasoning is that of Sarasvathy and
Menon (2004). They suggest separating the performance of firms from the performance
of entrepreneurs:
“For the one time entrepreneur, the firm is an end in itself; whereas for the multiple
entrepreneur, each firm, whether successful or failed, is an instrument of learning
that enables him or her to achieve better performance over time.” (Sarasvathy and
Menon, 2004, p. 9).
Sarasvathy and Menon (2004) are interested in modelling serial entrepreneurship as a
temporal portfolio; moreover, serial entrepreneurship provides a viable strategy for the
entrepreneur to improve his or her own expectations of success for firms they start sub-
sequently. It is not the performance of any single business that matters but that of the
entire set of businesses started by the entrepreneur over time. Though the authors are in-
terested in modelling the behaviour of serial entrepreneurs, they do not make specific
assumptions about whether or not entrepreneurs retain their successful businesses (thus
becoming portfolio entrepreneurs) or sell them before starting a new one (as is assumed
for serial entrepreneurs). This aspect is irrelevant in their model as its aim is to try and
separate the probability of success and failure of entrepreneurs and firms. Nevertheless,
it is central to my reasoning because I am specifically interested in portfolio entrepre-
neurs and the problems arising from managing and developing a set of different busi-
nesses simultaneously.
There are several studies that use a ‘career’ approach to study not only the decision
to become an entrepreneur (i.e. to start-up a business), but also that of persisting in that
Business groups: facts and interpretations 68
career. These studies support the consideration of the entire career path of an individual
rather than analyzing his/her status at a certain point in time during a single event.
In their investigation of what determines ‘entrepreneurial persistence’, i.e. maintain-
ing an entrepreneurial career after the first start-up, Burke et al. (2008) acknowledge
that entrepreneurial persistence is not synonymous with firm survival as successful en-
trepreneurs may be associated with rapid change of ventures. One of the aims of this
study is to distinguish between characteristics that encourage individuals to become en-
trepreneurs (attempting their first start-up) and those that encourage persistence in these
entrepreneurial careers. The authors do find differences between the factors that influ-
ence people to become entrepreneurs and those explaining persistence in an entrepre-
neurial role. Given the data set used by Burke et al. (2008) these factors refer to prior
personal and family characteristics while there is no information available on the char-
acteristics of the businesses controlled by entrepreneurs.
Dyer (1994) gives some suggestions to develop a theory of the ‘entrepreneurial ca-
reer’, which he defines as the career of those who found organizations. His starting
point is the fact that while “… entrepreneurship researchers have put so much emphasis
on understanding the factors that influence someone to start a new business, little work
has been done to understand how these individuals progress through various roles
throughout their careers” (Dyer, 1994 , p. 7). He analyses several aspects of the entre-
preneurial career and discusses how career roles and dilemmas vary across different
stages of the career. He recognizes that roles and dilemmas in mid-career – after the
start up phase - are different from those in the early phases: “ To manage growth, entre-
preneurs often must change from a ‘doing role’ to a ‘delegating role’ since they must
rely on others to get work accomplished” (Dyer, 1994 , p. 14). The problem of delega-
Business groups: facts and interpretations 69
tion is more complex in the case of portfolio entrepreneurs as delegation can refer not
only to the management of established businesses but also to the start-up of new busi-
nesses. Until now, the latter question has not been taken into consideration by the litera-
ture.
In a recent article Wiklund and Shepherd (2008) point out another methodological
question related to the comparison between novice and habitual entrepreneurs. The lit-
erature equates a business start-up to the establishment of a new company; this is by
definition true in the case of a novice entrepreneur, but not necessarily so in the case of
habitual entrepreneurs. In fact, the latter also have the choice of developing the new
venture within one of the already established companies. According to Wiklund and
Shepherd (2008) when comparing business start-ups by novice and portfolio entrepre-
neurs, the literature only considers a subset of the latter as some of them can choose to
develop the new venture within the company they already own. Their methodological
point is to “…conceptually and empirically separate the act of entrepreneurship from its
organization” (Wiklund and Shepherd, 2008, p. 702). Within their approach the ‘portfo-
lio’ is defined in terms of opportunities and they are interested in analyzing the way ha-
bitual entrepreneurs organize the exploitation of these opportunities. In doing this, they
distinguish between the ‘internal’ mode of organizing, where the new venture is devel-
oped within the established company, and the ‘external’ mode of organizing, where the
new venture is developed by setting up a new company.
“We contrast exploiting the opportunity within the organizational context where
the opportunity is discovered (an existing firm) with the creation of a new firm ….
We refer to these as internal vs. independent organizational modes” (Wiklund and
Shepherd, 2008, p. 704).
Business groups: facts and interpretations 70
The main aim of Wiklund and Shepherd (2008) is to compare novice and habitual
entrepreneurs; for this reason the choice between internal and external modes of orga-
nizing is not central to their investigation. The only hypothesis they put forward in this
regard is that “… experts would be more prone than novices to choose the new organi-
zation mode because it offers greater control over the new entry”. As a result: “Habitual
founders are more likely than novice founders to use an independent firm as the orga-
nizing mode for portfolio entrepreneurship.” (Wiklund and Shepherd, 2008, p. 706).
The latter hypothesis seems somewhat strange because it is unclear how the organizing
modes of habitual and novice entrepreneurs might be compared given the fact that the
latter have no other choice than to start a new company. The choice between the ‘inter-
nal’ and ‘external’ mode of organizing a new venture is meaningful only in the case of
portfolio entrepreneurs who already have a company under their control. Moreover,
Wiklund and Shepherd (2008) do not consider one of the main features of the ‘external’
mode of organizing: i.e. the possibility it gives to alter the ownership structure of the
new business and to isolate the risk.
2.5 A synthesis of the theoretical approaches to business groups
Figure 2.4 presents a synthesis of the theoretical approaches developed so far to ad-
dress the phenomenon of business groups and the type of groups to which they refer. I
distinguish business groups as belonging to 4 types according to their size – large or
small - and the prevailing aspect considered by researchers: vertical ownership relations
(pyramids) or horizontal management of diversified activities. Figure 2.4 indicates the
papers that initiated the theoretical approach and the main contributors. The distinction
between large and small groups is admittedly blurred, as any attempt at finding a unique
Business groups: facts and interpretations 71
cut-off to distinguish between large and small firms will be. In the case of large groups,
authors usually refer to the largest companies in a country; the main companies of these
groups are generally listed on stock markets and their shares are publicly traded. In fact,
the relationship between business groups and financial markets is one of the key issues
of the literature on large groups.
In general, explanations that emphasize financial aspects refer to the pyramidal (ver-
tical) structures, based on several layers of controlled companies within the same group.
On the contrary, explanations emphasizing the organizational nature of business groups
refer to the horizontal nature of these structures: i.e. the collection of different activities
within a common ownership. In the case of contributors referring to emerging econo-
mies both aspects are considered.
Figure 2.4 highlights the fact that only a few theoretical papers refer to small groups
while most of the empirical and theoretical literature refers to large groups.
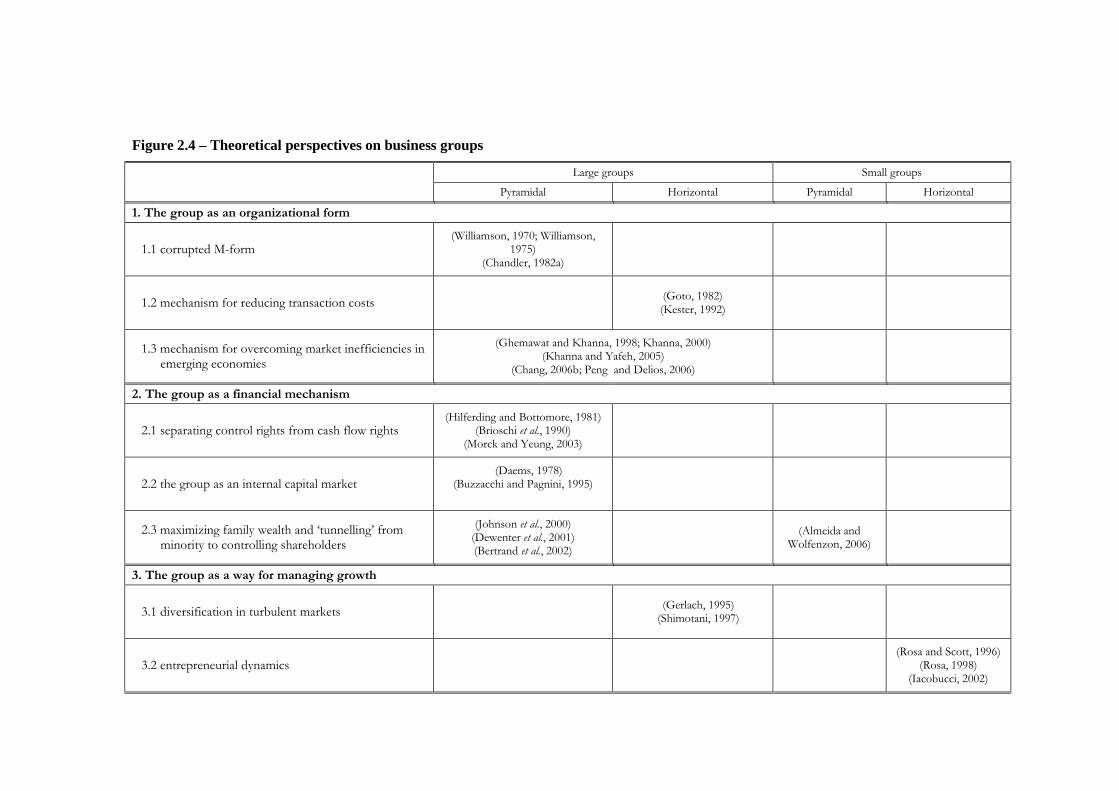
Figure 2.4 – Theoretical perspectives on business groups
Large groups Small groups
Pyramidal Horizontal Pyramidal Horizontal
1. The group as an organizational form
1.1 corrupted M-form (Williamson, 1970; Williamson,
1975) (Chandler, 1982a)
1.2 mechanism for reducing transaction costs (Goto, 1982) (Kester, 1992)
1.3 mechanism for overcoming market inefficiencies in emerging economies
(Ghemawat and Khanna, 1998; Khanna, 2000) (Khanna and Yafeh, 2005)
(Chang, 2006b; Peng and Delios, 2006)
2. The group as a financial mechanism
2.1 separating control rights from cash flow rights (Hilferding and Bottomore, 1981)
(Brioschi et al., 1990) (Morck and Yeung, 2003)
2.2 the group as an internal capital market (Daems, 1978)
(Buzzacchi and Pagnini, 1995)
2.3 maximizing family wealth and ‘tunnelling’ from minority to controlling shareholders
(Johnson et al., 2000) (Dewenter et al., 2001) (Bertrand et al., 2002)
(Almeida and Wolfenzon, 2006)
3. The group as a way for managing growth
3.1 diversification in turbulent markets (Gerlach, 1995) (Shimotani, 1997)
3.2 entrepreneurial dynamics (Rosa and Scott, 1996)
(Rosa, 1998) (Iacobucci, 2002)
Research design and methodology 73
2.6 Empirical and theoretical gaps
As discussed in the previous sections, business groups have been widely investigated
by several strands of literature. Nevertheless, the literature refers mainly to large groups
and up to now has focussed on financial issues. On one hand, this does not acknowledge
the relevance of business groups in the small business sector; and on the other hand, the
financial explanations cannot easily be extended to small groups that are characterized
by the concentration of ownership and the association between ownership and control.
In the case of small firms, it is more appropriate to considered a business group as an
organizational device used by entrepreneurs to enlarge the activities under their control.
Nevertheless, the entrepreneurial processes at work and their relations with other as-
pects, such as the diversification strategies, are still under-investigated.
The limits of current theories in explaining the ‘ubiquitous’ phenomenon of business
groups is expressed by several authors.
In their review of the empirical and theoretical literature on ‘habitual entrepreneurs’,
Wright, et al. (1998) indicated 29 directions for future research. As examined in Section
2.4., the entrepreneurship literature has focussed on the comparison between habitual
and novice entrepreneurs when considering opportunity discovery and exploitation or
the performance of new ventures. Less attention has been given to other directions indi-
cated by Wright et al. (1998), that are more closely connected to the study of business
groups. For example, as a first point they indicate that “Studies should examine the full
scope of the activities of entrepreneurial individuals, rather than focusing solely upon
individual businesses” (Wright et al., 1998, p. 16). They also point out to empirical gaps
Research design and methodology 74
in the field. As a third point they call attention to the fact that “National-level studies
need to be conducted which measure the scale and nature of habitual entrepreneur-
ship...” (Wright et al., 1998, p. 16). These two gaps, among others, will be specifically
addressed in this study.
The dissatisfaction for available theories is also expressed by researchers studying
the phenomenon of business groups. Referring to a large number of emerging econo-
mies, Khanna and Yafeh (2005) examine several hypotheses that could explain the
presence and characteristics of business groups: facilitating mutual insurance among
member firms, enabling them to share risks, smoothing income flows and reallocate
money from one to another. However, they fail to substantiate their hypotheses with
empirical evidence and conclude that “other reasons are more likely to explain the ubiq-
uity of business groups around the world” (Khanna and Yafeh, 2005, p. 301). I suggest
that the economic and managerial literature on business groups has given too much em-
phasis on financial aspects, thus undervaluing the role of business groups as an organ-
izational device used by entrepreneurs to growth and manage their portfolio of busi-
nesses. This is one of the gaps addressed in the present study.
Also in the literature that considers the role of institutional factors in explaining
business groups there is increasing dissatisfaction for the theoretical approaches used by
researchers. After reviewing the post-crisis restructuring of business groups in Asian
countries, Chang (2006b) suggests researchers should not “… approach business groups
as a special entity specific to each East Asian country. Research on business groups can
be better appreciated by a larger academic community if business groups are treated as a
general form of diversified corporations that are commonly found in every part of the
world” (Chang, 2006b, p. 414). Among the several issues that still need to be better in-

Research design and methodology 75
vestigated, Chang acknowledges the fact that the analysis of business groups can pro-
vide an interesting setting for exploring entrepreneurship:
“Founders of business groups are often private entrepreneurs. A historical analysis
of the growth of business groups can highlight how each entrepreneur started up
his/her own business and expanded it to create a group while overcoming many dif-
ficulties”. (Chang, 2006b, p. 415)
However, up to now little has been done along this direction.
The last citation by Chang (2006b) could well represent the broad scope of the pre-
sent thesis as it takes into consideration business groups founded by private entrepre-
neurs. Its main purpose it to assess to what extent the entrepreneurial processes contrib-
ute to understanding their formation and growth. By entrepreneurial processes I mean
all the “... functions, activities and actions associated with perceiving of opportunities
and the creation of organizations to pursue them” (Bygrave and Hofer, 1991, p. 14).
Given the fact that the formation of a business group is the common way through
which entrepreneurs expand the activities under their control, we still lack a model ex-
plaining why and when the formation of business groups is more likely and how we can
predict their characteristics. Despite the importance of new business creation for estab-
lished companies’ growth and profitability Zahra et al. (2006) note that:
“...little attention has been given to the process by which new businesses are cre-
ated within established companies. ... The scarcity of research on the topic stems
from the complexity of the processes involved and the long gestation period of
many of these initiatives.” (Zahra et al., 2006)
Research design and methodology 76
This is even more so in the case of small firms. Entrepreneurship literature has fo-
cused on comparisons between novice and habitual entrepreneurs in relation to the
characteristics of the businesses they develop, but leaves several unanswered questions
concerning the causes and the processes of the business groups’ formation and dynam-
ics.
As a result of the literature review and of the gaps previously highlighted, the main
research questions addressed in this thesis are summarized below by specifying the cen-
tral questions and related sub questions.
1. The main research question of this thesis is that of understanding the role of
entrepreneurial processes in the formation of business groups. Specifically, the
study addresses the following issues:
1.1 why and when entrepreneurs decide to exploit new ventures by setting up
a new company rather than developing the new venture within the estab-
lished firm;
1.2 whether there are other people involved in the growth of business groups
and their role in the start-up of new ventures;
1.3 what are the nature of these teams and how they evolve over time.
Given the exploratory nature of these questions they will be addressed with
qualitative methods, based on retrospective interviews with portfolio entrepre-
neurs. A detailed account of the research design is provided in the next chapter.
The results are analysed in Chapter 6.
2. According to a theory recently proposed by Almeida and Wolfenzon (2006)
the business group is a device used by the entrepreneur to manipulate the
Research design and methodology 77
ownership structure of new businesses in order to maximize the financial
wealth of his/her family (I labelled it as the ‘financial explanation’). The pre-
dictions of this theory have yet to be empirically tested. Specifically, this
study addresses the following questions:
2.1 assessing whether and to what extent the empirical predictions of the fi-
nancial explanation about group structure (vertical versus horizontal
structures) and the ownership structures of new companies are verified
by the available evidence about business groups in the small business
sector;
2.2 discussing how the financial explanation relates to the results of the
qualitative analysis about the role of entrepreneurial processes in busi-
ness group formation.
The empirical verification of the financial explanation is based on quantitative meth-
ods referring to the population of Italian small groups. The results are discussed in
Chapter 4.
3. The literature on habitual entrepreneurs has not resolved the question of
whether the advantages of habitual over novice entrepreneurs in setting up
new businesses are related to some form of specialization in the entrepreneu-
rial activity per se or whether they originate from the accumulation of idiosyn-
cratic knowledge and resources in the original activity. The latter question re-
fers to the relationships between the new activities and the one already estab-
lished by entrepreneurs (diversification strategies). Specifically, the study ad-
dresses the following questions:
Research design and methodology 78
3.1 Assessing to what extent the setting up of new firms by habitual entre-
preneurs is the result of diversification in new sectors rather than the ex-
pansion of the original business;
3.2 Analyse the degree of diversification in business groups and how the set-
ting up of new companies relate with the overall structure and dynamics
of groups.
These questions are addressed by using quantitative methods referring to large
samples of business groups and examining a few case studies. The results are re-
ported in Chapter 5.
Finally, given the different theories proposed to explain the presence and characteris-
tics of business groups and the entrepreneurial perspective introduced by this research it
is a specific aim of the thesis that of proposing an integrated framework to related the
different theoretical explanations and assess their relative importance in explaining the
empirical evidence on business groups. This is done in Chapter 7.
Research design and methodology 79
Chapter 3 - Research design and methodology
This chapter provides a discussion and a justification of the methodology and ana-
lytical methods used to address the research questions discussed in the previous chapter.
It also provides a description of the sources of data used in this study. Collecting, orga-
nizing and analysing data is a time consuming and resource absorbing activity. For this
reason there is a trade-off between the ideal set of information needed to address the re-
search questions and those that can be efficiently obtained given the available time and
resources. As described in detail in section 3.3, I use several data sets, some already
available from statistical agencies or other sources (indirect or secondary sources) and
others specifically collected for this study (direct or primary sources).
The methodology used to analyse data is as important as the data itself. Some authors
would even question the idea that data can exist independently of the theories and
methods to interpret them. This is especially true in the social sciences where data about
a phenomenon cannot be collected without some prior concepts which allow us to de-
fine entities and to give meaning to information about them (Bryman, 2001). This
means that the ways data are collected and elaborated are not neutral with respect to
theoretical models and approaches used to interpret the reality. In our case, the collec-
tion of data about business groups is necessarily dependent on an ‘a priori’ definition of
what a business group is. Moreover, not all available data are appropriate to the chosen
definition. For example, official statistics on business groups are collected on the basis
of a specific definition of what constitutes a group. This definition fits the aims of statis-
Research design and methodology 80
tical agencies but not necessarily those of researchers. Data and information collected
directly can overcome this limit but their collection is much more costly than those
which are publicly available.
Another problem with empirical data is that the breath of coverage of the population
is normally inversely related to the amount of information per unit of analysis. For this
reason I will use several sources of information that differ in terms of population cover-
age and amount of information: from statistical information referring to the population
of business groups, yet containing only a little information about them, to direct inter-
views with entrepreneurs which allow me to gain a much richer picture of the phe-
nomenon while referring to a small number of cases.
The chapter is organized as follows. The next section discusses some methodological
issues about theoretical and empirical research in the fields of management and entre-
preneurship. Section 3.1 presents the research strategy adopted to address the questions
raised in the previous chapter. Section 3.3 illustrates the characteristics of indirect and
direct sources of data that will be used in the remaining chapters. In describing these
data sets, the section also provides a general overview of the phenomenon of business
group in Italy and in the Marche region.
3.1 Research methods and techniques
Entrepreneurship is an interdisciplinary field (Herron et al., 1991; Ripsas, 1998;
Zahra and Dess, 2001; Busenitz et al., 2003). This is reflected not only by the variety of
topics included under this heading, but also by the different methodologies used by en-
trepreneurship scholars. Indeed, in the entrepreneurship field we can observe a wide va-
riety of methodological approaches both in theory building and in applied work: from
Research design and methodology 81
the positivist approach and quantitative methods which are typical of economics and
psychology, to the inductive approaches and qualitative methods that are more common
among sociologists and anthropologists. This reflects not only the fact that entrepre-
neurship has attracted the interest of several disciplines, but also the variety and com-
plexity of issues that entrepreneurship scholars try to address (Chandler and Lyon,
2001; Davidsson and Wiklund, 2001; Ucbasaran et al., 2001; Grant and Perren, 2002).
Given the close connection existing in the social sciences between the issues addressed
and the methodology used, it is no surprise that entrepreneurship researchers have cho-
sen the methods that are best suited to address their specific research questions.
There has been a thorough debate in the last decades about the possibility of defining
a distinctive domain for the field of entrepreneurship (Shane and Venkataraman, 2000).
Over the years, there has been a shift from approaches that focus on the characteristics
of people who become entrepreneurs, to the processes that characterize entrepreneurial
activity: i.e. discovery, evaluation and exploitation of new business opportunities
(Gartner, 1988; Casson, 1990; Davidsson, 2008). Nevertheless, several contrasting is-
sues remain. Some authors (Gartner, 1985; Vesper, 1990; Brush et al., 2003) associate
entrepreneurship with the creation of new organizations (new venture creation).
“Entrepreneurship is the creation of new organizations. … If we are to understand
the phenomenon of entrepreneurship in order to encourage its growth, then we need
to focus on the process by which new organizations are created.” (Gartner, 1988,
p. 26, italics in the original).
Other authors do not view the creation of new organizations as the characteristic fea-
ture of entrepreneurial activity and define entrepreneurship as “… the discovery, evalua-
Research design and methodology 82
tion and exploitation of future goods and service” (Eckhardt and Shane, 2003, p. 336).
In this definition it is the characteristics of opportunities that matter; ‘entrepreneurial
opportunities’ are defined as “… situations in which new goods, services, raw materi-
als, markets and organizing methods can be introduced through the formation of new
means, ends, or means-ends relationships” (Eckhardt and Shane, 2003, p. 336). As a re-
sult, entrepreneurial decisions are ‘creative’ decisions and cannot be reduced to optimiz-
ing or satisficing decisions in which ends and means are taken as given31
Apart from the different importance placed on opportunities rather than organiza-
tions, a common characteristic of recent contributions to the definition of entrepreneur-
ship is the importance given to ‘entrepreneurial processes’. The study of entrepreneurial
processes means the analysis of the people, activities and circumstances that are in-
volved in the discovery of new business opportunities, their evaluation and structuring
and their exploitation through the set-up and development of new ventures.
.
Despite the growing consensus on the defining of the domain of entrepreneurship,
(Cornelius et al., 2006) there remains a lively debate on methodological issues (Low
and MacMillan, 1988; Chandler and Lyon, 2001)32
31 This aspect of ‘creation’ as the distinguishing feature of entrepreneurial activity is stressed by the work of Sarasvathy (Sarasvathy, 2001, 2003; Dew et al., 2004).
. Apart from specific questions, one
of the main concerns is the absence of a ‘dominant paradigm’ in the field (Gartner et al.,
2006). As a result, in 2001 Low argued that entrepreneurship research was still in its
‘adolescence’ with a modest level of academic legitimacy (Low, 2001, p. 17). More re-
cently, Gartner et al. (2006) noted that “most entrepreneurship scholars appear to bring
with them the community of some other ‘home’ disciplines, be it psychology, sociol-
32 Methodological controversies are common in all the social science fields. In the case of entrepreneur-ship this is accentuated by the interdisciplinary nature of the field.
Research design and methodology 83
ogy, economics, finance, or strategic management” and that “…many of the issues that
entrepreneurship scholars address are primarily oriented to core issues embedded in
other disciplines” (Gartner et al., 2006, p. 324).
An issue that has raised specific attention among entrepreneurship researchers is that
of theory building (Amit et al., 1993; Phan, 2004; Zahra, 2007). The question can be
split into two aspects: the first is whether there is a need (and possibility) to develop a
‘theory of entrepreneurship’ distinct from theories used in the fields of economics, psy-
chology, finance, etc.; the second refers to the methodology used by entrepreneurship
scholars to develop theory in the field.
In the case of the first question, the most commonly shared opinion is that by its na-
ture entrepreneurship is an integrative area of inquiry and that for this reason it will con-
tinue to borrow theories and concepts from other, more established, areas of the social
sciences (Low, 2001; Busenitz et al., 2003; Gartner et al., 2006).
In the case of the second question, concern has been raised about the need for more
‘theory-driven’ research and for improved quality in theory building (Zahra and Dess,
2001). It is often recognized that qualitative methods are important specifically because
they can help to build grounded theory in a field where there is not a well developed
paradigm (Brush et al., 2003, p. 320). In contrast, other authors emphasize the use of
mathematical modelling (as opposed to the wide use of ‘conceptual framework’) as a
way of adding structure and rigour to theory building (Lévesque, 2004). The latter claim
contrasts with a large number of scholars who have cast doubt on the possibility of de-
veloping formalized theories of entrepreneurship in the way that is typical of economics
(Baumol, 1968; Barreto, 1989; Casson, 1990; Baumol, 1993a; Baumol, 1993b). This is
because (mainstream) economics is mainly defined by its method rather than by its is-
Research design and methodology 84
sues: “It [economics] is about building models that are tested, or that can at least be
tested in principle. Hence, is it no surprise that idea that cannot be modelled formally
tend to be ignored in economics” (Bianchi and Henrekson, 2005, p. 356). It is difficult
to model entrepreneurial processes formally in the way mainstream economics does,
since they elude analytical tractability. Formal models can be useful in two ways: for
considering specific aspects of entrepreneurial behaviour, as suggested by Lévesque
(2004); or to capture the dynamics of the whole population of entrepreneurial firms
(Bianchi and Henrekson, 2005).
For these reasons, I have chosen to use a research strategy that involves the use of
both quantitative and qualitative methods. In general, the latter distinction is associated
with deductive and inductive methods in theory building and with post-positivist rather
than constructivist approaches to knowledge. Quantitative methods are generally used to
test propositions deduced by formal models developed on the basis of a few assump-
tions; qualitative methods use case studies as their strategy of enquiry and grounded
theory for model building; they emphasize the context and settings of participants and
their meaning and interpretation of phenomena.
Quantitative methods, based on statistical analysis of large sets of data, are used to
test the theories proposed by the literature; namely, the financial and the diversification
theories. I derive the main empirical propositions emerging from the latter theories and
assess to what extent they are confirmed by available data.
Besides the empirical test of available theories, the main aim of this thesis is to as-
sess whether and to what extent the consideration of entrepreneurial processes add to
our understanding of business groups and whether it is able to fill the gaps left by other
theoretical approaches. To achieve these aims, it is necessary to use qualitative meth-
Research design and methodology 85
ods; specifically, I have used case study analysis and direct interviews with entrepre-
neurs. There are two main reasons for this choice of qualitative methods. So far few
studies have been done on this topic and we do not have a consolidated theory from
which to derive propositions that could be tested with available data. For this reason, I
carried out an exploratory study aimed at developing a coherent set of theoretical propo-
sitions on business group formation in the small business sector. With this aim, it is
necessary to look at the complexities of the processes involved and allow the entrepre-
neurs the freedom to make their own interpretations and give their own explanations,
rather than trying to get them to verify pre-imposed hypotheses. Another reason for us-
ing qualitative methods is that the expression of entrepreneurial processes in the form of
quantifiable variables is difficult and they are better described and analysed through
narrative statements and visual models.
Initially I planned to use a sequential mixed strategy: firstly, using quantitative meth-
ods to test available theories, followed by qualitative methods aimed at exploration and
model building. I have ended up using a strategy of concurrent methods in which the
two approaches have been mixed to raise the efficacy in the use of quantitative and
qualitative techniques (Creswell, 2003).
The process of theory building is made by integrating the results of qualitative and
quantitative analyses. In the qualitative analysis I used some of the techniques of
grounded theory. I started interpreting the interviews on the basis of some pre-defined
issues. New issues and concepts has been added as they emerged from the views and
motives expressed by interviewed entrepreneurs; I then refined these issues and con-
cepts to derive some general propositions. These propositions has been compared with
the results obtained from the case studies and quantitative analyses of secondary sources
Research design and methodology 86
(Stake, 1995). The combination and comparisons of results obtained from interviews,
case studies and quantitative analysis have been beneficial to the overall process of
model building. For this reason there is a discussion of several theoretical papers in the
final chapter. This discussion is functional to theory building; the chapter integrates the
result of direct interviews with some proposed theoretical approaches for interpreting
the observed patterns of entrepreneurial processes.
I use different research strategies to address the research questions (Bryman, 2001,
Chap. 2; Chandler and Lyon, 2001): specifically, cross-sectional data are used to ex-
plore the main characteristics of the phenomenon of business groups; longitudinal data
are used for analysing the dynamic patterns of business groups; and retrospective case
study analysis based on direct interviews is used to explore the reasons and motives of
entrepreneurs to set up a business group. These research strategies are used to address
different research questions but also to address the same questions in different ways.
Several analytical techniques are used, both quantitative and qualitative, according to
the specific research questions. In the case of quantitative methods I make use of de-
scriptive statistics for characterizing the phenomenon of business groups; I use correla-
tion analysis and multiple regression for exploring relations between variables. Data
management and quantitative elaborations have been made using STATA 9.0. Qualita-
tive elaborations have been made by using the software QRS NVivo 7.0. This helped in
the transcription of the interviews and in coding the text.
3.2 The unit of analysis
An important methodological question in empirical studies is the definition of the
unit of analysis. Researchers addressing the study of business groups have used differ-
Research design and methodology 87
ent units of analysis: a) the group as a whole, as is the case of the organizational
(Williamson, 1975; Chandler, 1982a) and the institutional approaches (Ghemawat and
Khanna, 1998); b) the companies belonging to groups, as is the case of the literature on
internal capital markets (Daems, 1978; Buzzacchi and Colombo, 1996) and tunnelling
(Bertrand et al., 2002); c) the controlling owner(s), as in the case of the ‘equity lever-
age’ hypothesis (Brioschi et al., 1990) and of recent financial explanations for privately
owned groups (Almeida and Wolfenzon, 2006).
The owner perspective is also adopted by the literature on habitual entrepreneurs. As
discussed in Section 2.4 we can identify two different approaches within the entrepre-
neurship literature. The first is concerned with assessing the differences between novice
and habitual entrepreneurs when starting new businesses (Ucbasaran et al., 2008); for
this reason, the main unit of analysis is represented by the entrepreneur (owner-manager
of the businesses) while a secondary unit is represented by subsequent start-ups. The
second approach is concerned with analysing the role of entrepreneurial processes in de-
termining the presence of portfolio entrepreneurship (Rosa, 1998); for this reason the
main unit of analysis is represented by the entrepreneur and the secondary unit is repre-
sented by the whole set of companies under his/her control.
This thesis follows the latter approach. For this reason, the empirical analysis refers
to both units of analysis: the group and the entrepreneur who controls it.
Because a business group is, by definition, a set of companies, it is obvious that to
examine the features of a group it is necessary to study the characteristics of the compa-
nies that make up that group. Nevertheless, these individual companies are not consid-
ered as a unit per se, but as instrumental for understanding the characteristics of the
group and the behaviour of entrepreneurs. It must also be taken into consideration that
Research design and methodology 88
most of the statistics available refer to the single company rather than the group as a
whole (see the discussion in Section 2.2); in order to obtain information about the
group, it is necessary to collect and aggregate data referring to the single companies that
form the group.
Given the aims of this study (see Section 2.6), I consider only those groups where it
is possible to identify the presence of one or a few people who own and control the
group and who are directly involved in the management of its companies (i.e. the
owner-manager). This is the situation normally observed in the small business sector,
though it is not unusual to observe large firms that are also characterized by concentra-
tion of ownership and the association between ownership and control. I focus on small
and medium sized groups is because this is the area that has the most theoretical and
empirical gaps (see Section 2.6).
Firms with concentrated ownership and association between ownership and control
are also referred to as ‘family firms’. Also in the literature on business groups, family
ownership is often used as a criteria for characterizing them (Almeida and Wolfenzon,
2006). There is no agreement in the literature about the definition of ‘family firm’
(Westhead and Cowling, 1998; Steier et al., 2004). Several criteria can be used, either in
isolation or in combination: the percentage of shares owned by the members of the same
family; the involvement of family members in the management of the company; and the
transfer of ownership and control from one generation to another (Chua et al., 1999;
Steier et al., 2004; Chrisman et al., 2005, p. 556).
Some researchers us a very broad concept of family firms, as those companies in
which a single family owns more than a specific percentage of shares. Oswald et al.
(2009) delimit family firms as those in which a single family holds at least 15% of the
Research design and methodology 89
shares. Morck and Yeung (2004) use the following criteria of family control to distin-
guish family firms: (1) the largest group of shareholders in a firm is a specific family,
and (2) the stake of that family is greater than either a 10% or 20% control of the voting
shares. These definitions of family firms are suited for studies on listed companies and
in countries like the USA where there is a prevalence of large, publicly held firms. In all
other countries, publicly held firms are the exception rather than the rule and ownership
of firms is much more concentrated (La Porta et al., 1999). This is even more so in the
small business sector; in fact, the majority of SMEs are closely held firms and their
shares are not publicly traded. For the definition of business groups I have used the 50%
of shares as a cut off for identifying the control of a firm: legal units are considered as
belonging to a group when the same owner (or coalition of owners) owns at least 50%
of it. This means that all the groups examined in this study are family owned groups.
They are also family controlled, as members of the family retain key positions in the
control (board of directors) and management of the companies. Moreover, in the groups
examined it is possible to identify a ‘dominant’ entrepreneur, i.e. a person who played
the major role in the start up and development of the group and who retains key posi-
tions in the ownership and control of companies. Descriptive statistics about the owner-
ship structure of business groups are discussed in Section 3.3 when analysing the data
sets used in the empirical section.
There is also a high level of ownership concentration and direct involvement of own-
ers in the control and management of companies because in the empirical analysis I
consider groups belonging to the small business sector: i.e. small and medium sized
groups. The theoretical definition and empirical identification of the small business sec-
tor is problematic. Though the size of firms is the obvious criteria in discriminating be-
Research design and methodology 90
tween small and large firms, the empirical application of this criteria is not straightfor-
ward because of the difficulties in identifying a quantifiable dimension and a cut-off
value for delimitating the two aggregates (Storey, 1994). Depending on the sectors ex-
amined, the national context and the specific aims of researchers, several discriminating
values have been proposed. Some of them are based on inputs, such as the number of
employees or the amount of capital; others are based on output, such as the value of
sales or the level of production.
In order to empirically delimit the small business sector I have used the number of
employees as this is the dimension most commonly used in the empirical literature and
the one available in all the data sets used in the empirical analysis. Because most of the
empirical analyses refer to the manufacturing sector I decided to use the cut off values
proposed by the EU for delimiting SMEs in this sector: i.e. 50 employees for small
firms and 250 employees for medium sized firms. As observed the small business sector
in general, also in the case of business groups their size distribution is highly skewed
towards the smaller size (statistics on the size distribution of business groups are dis-
cussed in Section 3.3 . When appropriate, I provide evidence that the empirical results
are robust to the use of different size classes.
Most of the quantitative and qualitative analyses carried out in this thesis refer to the
manufacturing sector. This is because of the availability of data on this sector and be-
cause of its relevance for innovation and competitiveness in industrialized countries. It
is possible that agriculture and service sectors present similar problems with regard to
the issues examined in this thesis, but also have their own specific features (Carter,
1998; Westhead and Wright, 1999); their inclusion would have required a different,

Research design and methodology 91
comparative approach. By limiting the analysis to the manufacturing sector I can rely on
a more homogeneous basis for the analysis.
3.3 Data collection and analysis
The application of quantitative and qualitative methods has been based on data and
information collected from several sources, including publicly available data (secondary
sources) and direct interviews (primary sources). Through the study I use four data sets,
each one having a different geographical coverage, number of observations and amount
of information per observation (see Figure 3.1).
The first two data sets (ISTAT and Capitalia) are secondary sources, produced by
large institutions. The other two data sets are primary sources, with data collected spe-
cifically to address the research questions of the present study.
The first two sources have the advantage of covering the population of Italian busi-
ness groups: specifically, the population of joint stock companies in the case of the
ISTAT data set and the manufacturing companies with more than 10 employees in the
case of the Capitalia data set. In both cases, data refer to a specific year; for this reason
they do not allow us to consider dynamic aspects. The other data sets are much smaller
in terms of cases considered and population represented, but the information gathered
allows me to analyse the evolution of business groups over time. The latter data sets
contain much more information on the characteristics of business groups than the for-
mer.
The different sources are used to study different aspects of the phenomenon; the
comparison of results obtained using different data sets is important for validating them.
All the data sets examined in the empirical section exclude sole proprietorships and

Research design and methodology 92
partnerships from the analysis. This is because information on ownership structure that
is essential for the identification of business groups is more easily accessible for limited
companies than for sole proprietorships and partnerships.
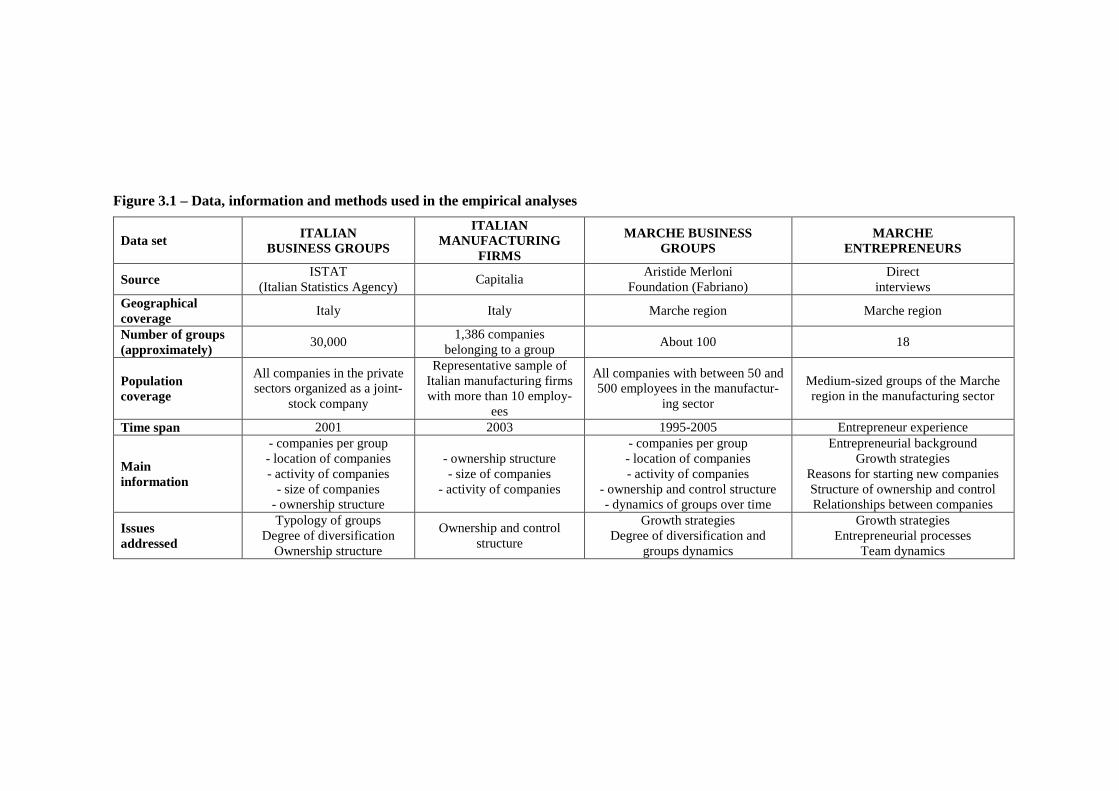
Figure 3.1 – Data, information and methods used in the empirical analyses
Data set ITALIAN BUSINESS GROUPS
ITALIAN MANUFACTURING
FIRMS
MARCHE BUSINESS GROUPS
MARCHE ENTREPRENEURS
Source ISTAT (Italian Statistics Agency) Capitalia Aristide Merloni
Foundation (Fabriano) Direct
interviews Geographical coverage Italy Italy Marche region Marche region
Number of groups (approximately) 30,000 1,386 companies
belonging to a group About 100 18
Population coverage
All companies in the private sectors organized as a joint-
stock company
Representative sample of Italian manufacturing firms with more than 10 employ-
ees
All companies with between 50 and 500 employees in the manufactur-
ing sector
Medium-sized groups of the Marche region in the manufacturing sector
Time span 2001 2003 1995-2005 Entrepreneur experience
Main information
- companies per group - location of companies - activity of companies
- size of companies - ownership structure
- ownership structure - size of companies
- activity of companies
- companies per group - location of companies - activity of companies
- ownership and control structure - dynamics of groups over time
Entrepreneurial background Growth strategies
Reasons for starting new companies Structure of ownership and control Relationships between companies
Issues addressed
Typology of groups Degree of diversification
Ownership structure
Ownership and control structure
Growth strategies Degree of diversification and
groups dynamics
Growth strategies Entrepreneurial processes
Team dynamics
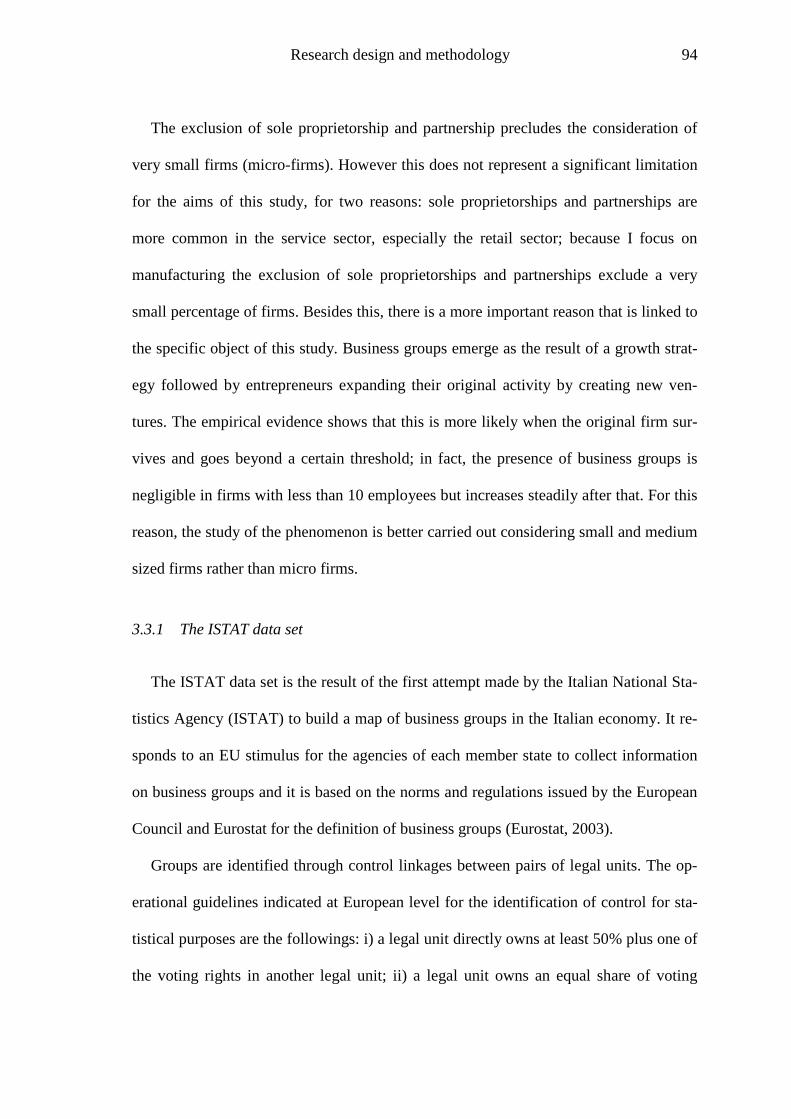
Research design and methodology 94
The exclusion of sole proprietorship and partnership precludes the consideration of
very small firms (micro-firms). However this does not represent a significant limitation
for the aims of this study, for two reasons: sole proprietorships and partnerships are
more common in the service sector, especially the retail sector; because I focus on
manufacturing the exclusion of sole proprietorships and partnerships exclude a very
small percentage of firms. Besides this, there is a more important reason that is linked to
the specific object of this study. Business groups emerge as the result of a growth strat-
egy followed by entrepreneurs expanding their original activity by creating new ven-
tures. The empirical evidence shows that this is more likely when the original firm sur-
vives and goes beyond a certain threshold; in fact, the presence of business groups is
negligible in firms with less than 10 employees but increases steadily after that. For this
reason, the study of the phenomenon is better carried out considering small and medium
sized firms rather than micro firms.
3.3.1 The ISTAT data set
The ISTAT data set is the result of the first attempt made by the Italian National Sta-
tistics Agency (ISTAT) to build a map of business groups in the Italian economy. It re-
sponds to an EU stimulus for the agencies of each member state to collect information
on business groups and it is based on the norms and regulations issued by the European
Council and Eurostat for the definition of business groups (Eurostat, 2003).
Groups are identified through control linkages between pairs of legal units. The op-
erational guidelines indicated at European level for the identification of control for sta-
tistical purposes are the followings: i) a legal unit directly owns at least 50% plus one of
the voting rights in another legal unit; ii) a legal unit owns an equal share of voting
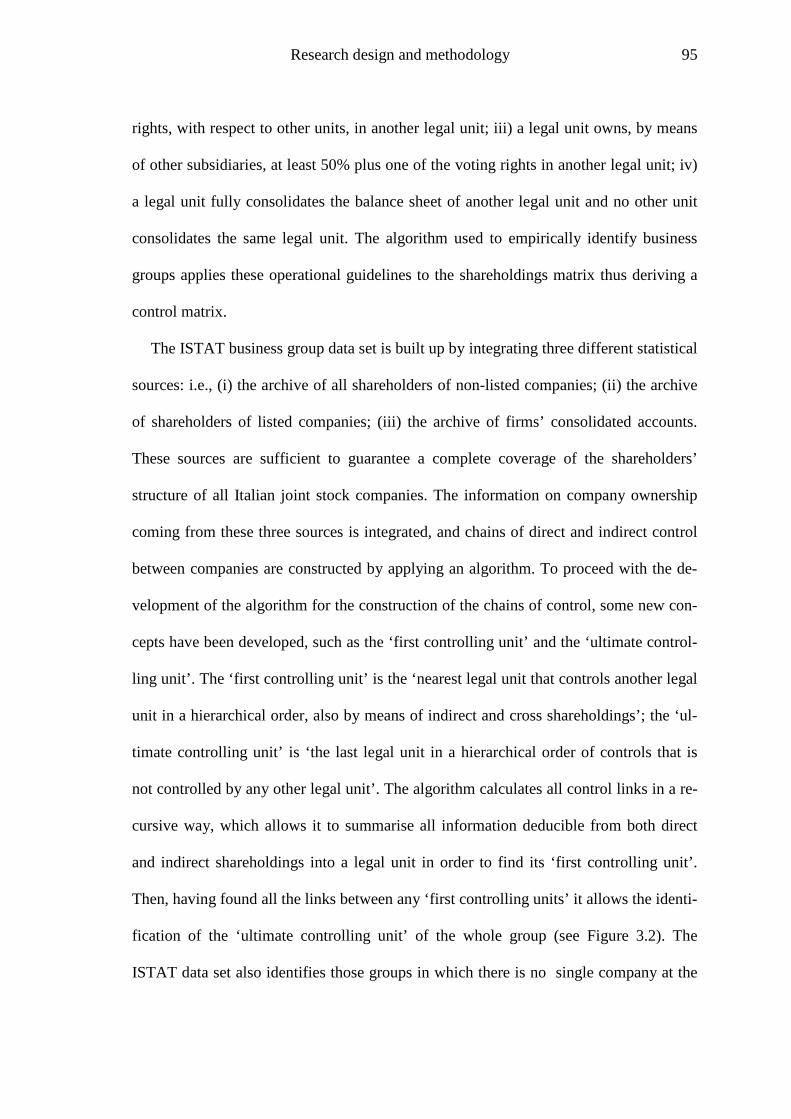
Research design and methodology 95
rights, with respect to other units, in another legal unit; iii) a legal unit owns, by means
of other subsidiaries, at least 50% plus one of the voting rights in another legal unit; iv)
a legal unit fully consolidates the balance sheet of another legal unit and no other unit
consolidates the same legal unit. The algorithm used to empirically identify business
groups applies these operational guidelines to the shareholdings matrix thus deriving a
control matrix.
The ISTAT business group data set is built up by integrating three different statistical
sources: i.e., (i) the archive of all shareholders of non-listed companies; (ii) the archive
of shareholders of listed companies; (iii) the archive of firms’ consolidated accounts.
These sources are sufficient to guarantee a complete coverage of the shareholders’
structure of all Italian joint stock companies. The information on company ownership
coming from these three sources is integrated, and chains of direct and indirect control
between companies are constructed by applying an algorithm. To proceed with the de-
velopment of the algorithm for the construction of the chains of control, some new con-
cepts have been developed, such as the ‘first controlling unit’ and the ‘ultimate control-
ling unit’. The ‘first controlling unit’ is the ‘nearest legal unit that controls another legal
unit in a hierarchical order, also by means of indirect and cross shareholdings’; the ‘ul-
timate controlling unit’ is ‘the last legal unit in a hierarchical order of controls that is
not controlled by any other legal unit’. The algorithm calculates all control links in a re-
cursive way, which allows it to summarise all information deducible from both direct
and indirect shareholdings into a legal unit in order to find its ‘first controlling unit’.
Then, having found all the links between any ‘first controlling units’ it allows the identi-
fication of the ‘ultimate controlling unit’ of the whole group (see Figure 3.2). The
ISTAT data set also identifies those groups in which there is no single company at the
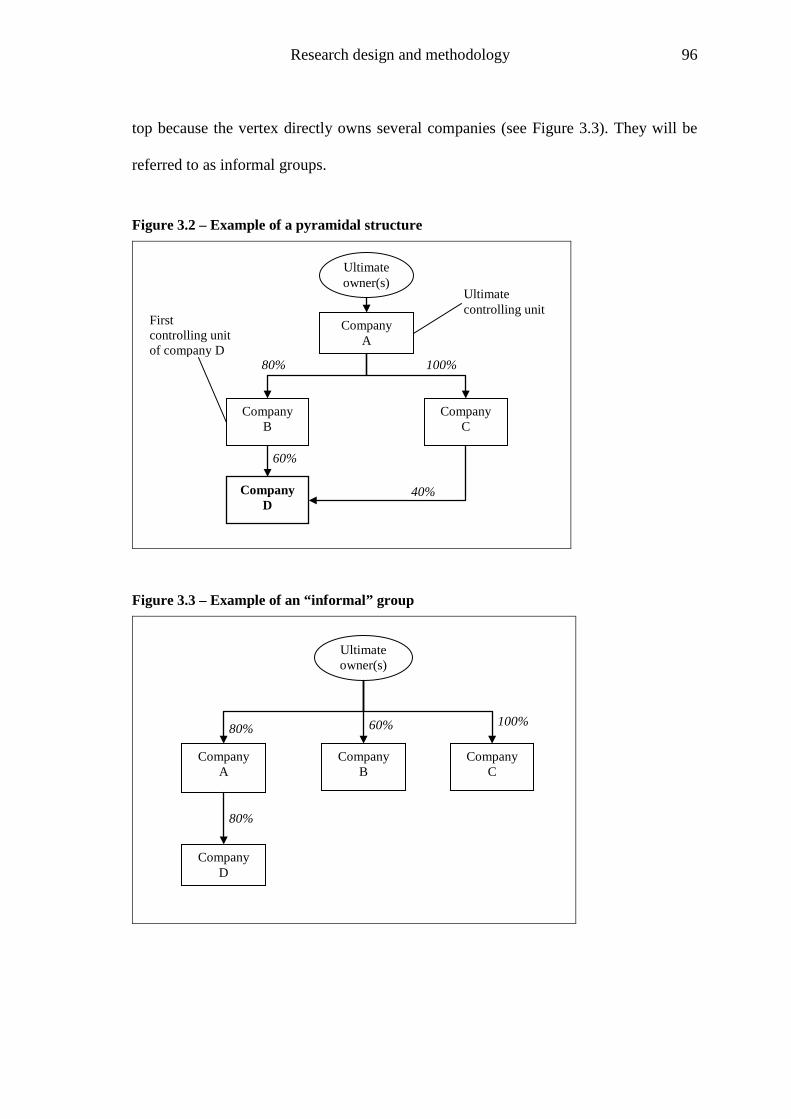
Research design and methodology 96
top because the vertex directly owns several companies (see Figure 3.3). They will be
referred to as informal groups.
Figure 3.2 – Example of a pyramidal structure
Ultimate owner(s)
Company B
Company D
Company A
Company C
Ultimate controlling unit
First controlling unit of company D
100% 80%
40%
60%
Figure 3.3 – Example of an “informal” group
Ultimate owner(s)
Company A
Company B
Company C
100% 80%
80%
60%
Company D
Research design and methodology 97
When all the companies belonging to the same group (that is, controlled by the same
ultimate owner) have been identified they are given a unique code that specifies the
group which they belong. The data set also identifies the position of companies within
the group pyramid; the ultimate controlling unit is allocated position 1, then 2 and so on.
Another limitation of the ISTAT data set is that it considers foreign companies con-
trolled by business groups but does not supply information about them (location, activ-
ity, size, etc.). For this reason, the analyses based on the ISTAT data set refer only to
domestic units. This is not an important limitation for the purposes of this research.
When expanding their production or commercial activities in foreign countries compa-
nies are obliged to set up new legal units. It is only in the case of domestic activities that
entrepreneurs face the choice between internal growth and the setting up of a new legal
unit. For this reason, the analysis of the determinants of business groups will be based
on the consideration of domestic units.
Groups are complex structures, being composed of several units. Statistics on busi-
ness groups – such as the number of companies and employees, the degree of diversifi-
cations, etc. – are the result of aggregation and elaboration of data and information
about the individual companies composing the group. In fact, the original record pro-
duced by ISTAT refers to individual companies, this being the basic statistical unit
(Table 3.1).
The ISTAT data set contains 115,455 legal units forming 36,383 groups. All the data
and statistics are based on elaborations of these original records. In the empirical analy-
sis I make use of data and information about the group as a whole (such as the number
of companies, the degree of diversification, etc.) and about the individual companies
(such as the share of capital owned by the vertex, its activity, etc.). For this reason, from
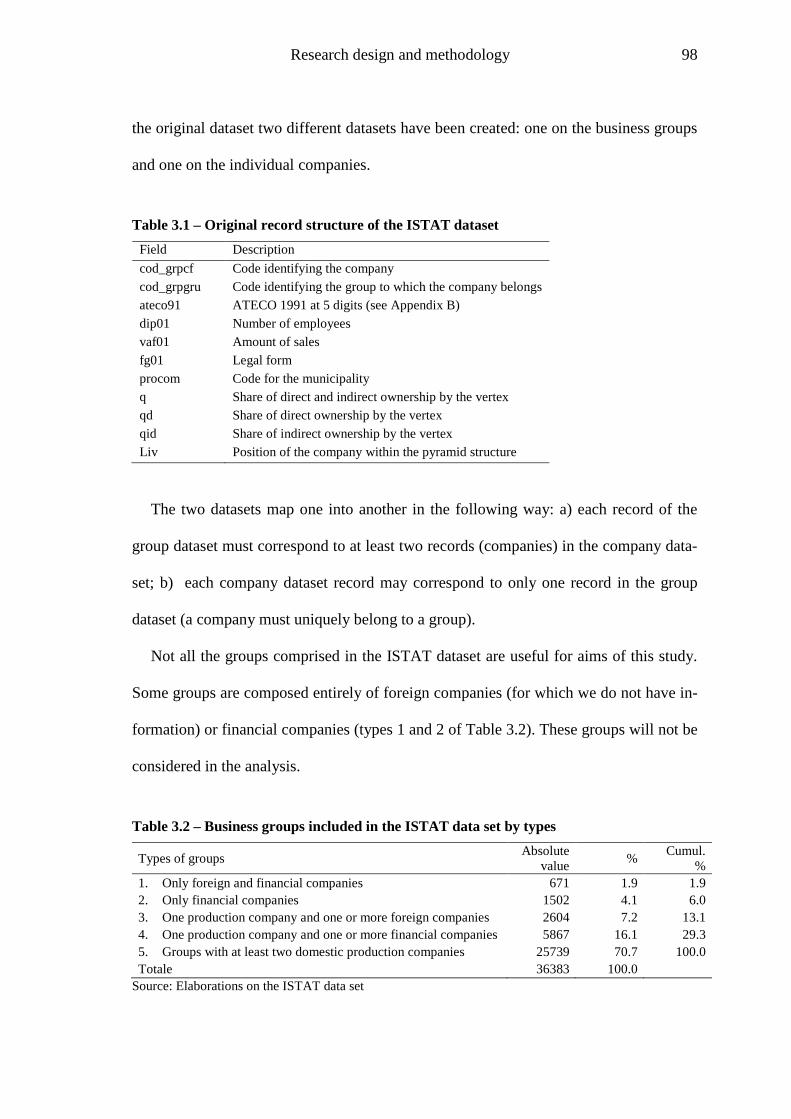
Research design and methodology 98
the original dataset two different datasets have been created: one on the business groups
and one on the individual companies.
Table 3.1 – Original record structure of the ISTAT dataset Field Description cod_grpcf Code identifying the company cod_grpgru Code identifying the group to which the company belongs ateco91 ATECO 1991 at 5 digits (see Appendix B) dip01 Number of employees vaf01 Amount of sales fg01 Legal form procom Code for the municipality q Share of direct and indirect ownership by the vertex qd Share of direct ownership by the vertex qid Share of indirect ownership by the vertex Liv Position of the company within the pyramid structure
The two datasets map one into another in the following way: a) each record of the
group dataset must correspond to at least two records (companies) in the company data-
set; b) each company dataset record may correspond to only one record in the group
dataset (a company must uniquely belong to a group).
Not all the groups comprised in the ISTAT dataset are useful for aims of this study.
Some groups are composed entirely of foreign companies (for which we do not have in-
formation) or financial companies (types 1 and 2 of Table 3.2). These groups will not be
considered in the analysis.
Table 3.2 – Business groups included in the ISTAT data set by types
Types of groups Absolute value % Cumul.
% 1. Only foreign and financial companies 671 1.9 1.9 2. Only financial companies 1502 4.1 6.0 3. One production company and one or more foreign companies 2604 7.2 13.1 4. One production company and one or more financial companies 5867 16.1 29.3 5. Groups with at least two domestic production companies 25739 70.7 100.0 Totale 36383 100.0
Source: Elaborations on the ISTAT data set
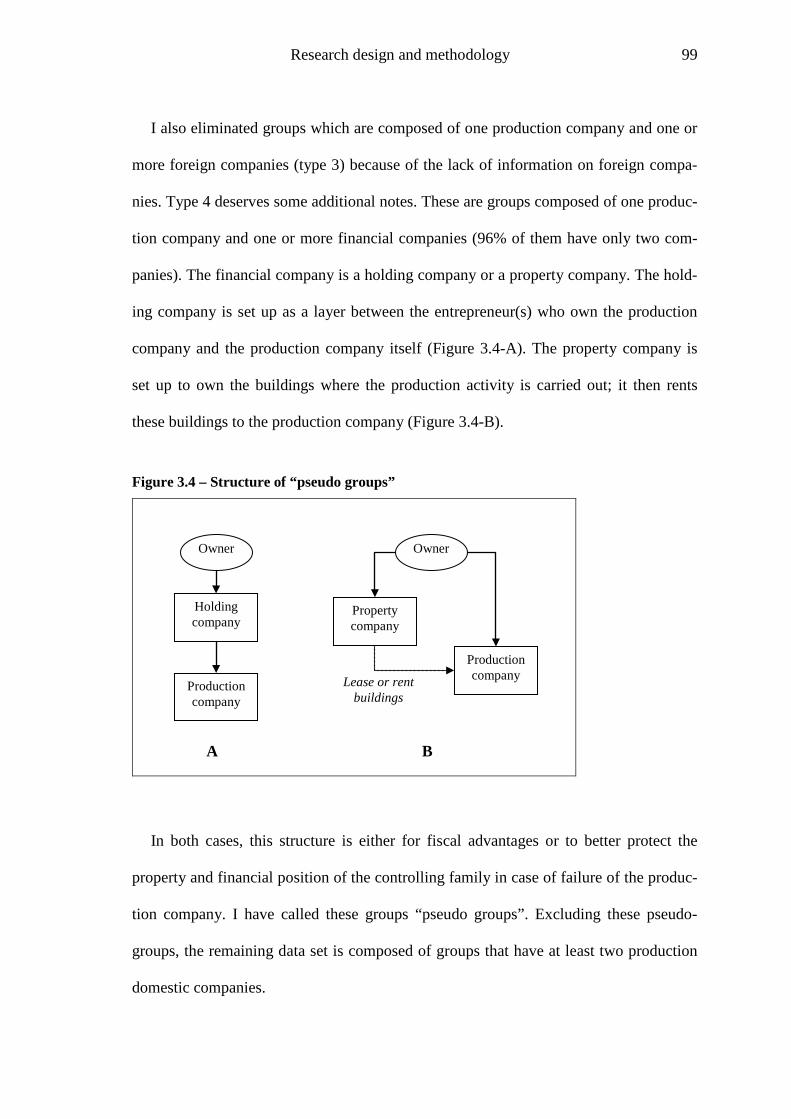
Research design and methodology 99
I also eliminated groups which are composed of one production company and one or
more foreign companies (type 3) because of the lack of information on foreign compa-
nies. Type 4 deserves some additional notes. These are groups composed of one produc-
tion company and one or more financial companies (96% of them have only two com-
panies). The financial company is a holding company or a property company. The hold-
ing company is set up as a layer between the entrepreneur(s) who own the production
company and the production company itself (Figure 3.4-A). The property company is
set up to own the buildings where the production activity is carried out; it then rents
these buildings to the production company (Figure 3.4-B).
Figure 3.4 – Structure of “pseudo groups”
Owner Owner
Holding company
Production company
Property company
Production company Lease or rent
buildings
A B
In both cases, this structure is either for fiscal advantages or to better protect the
property and financial position of the controlling family in case of failure of the produc-
tion company. I have called these groups “pseudo groups”. Excluding these pseudo-
groups, the remaining data set is composed of groups that have at least two production
domestic companies.
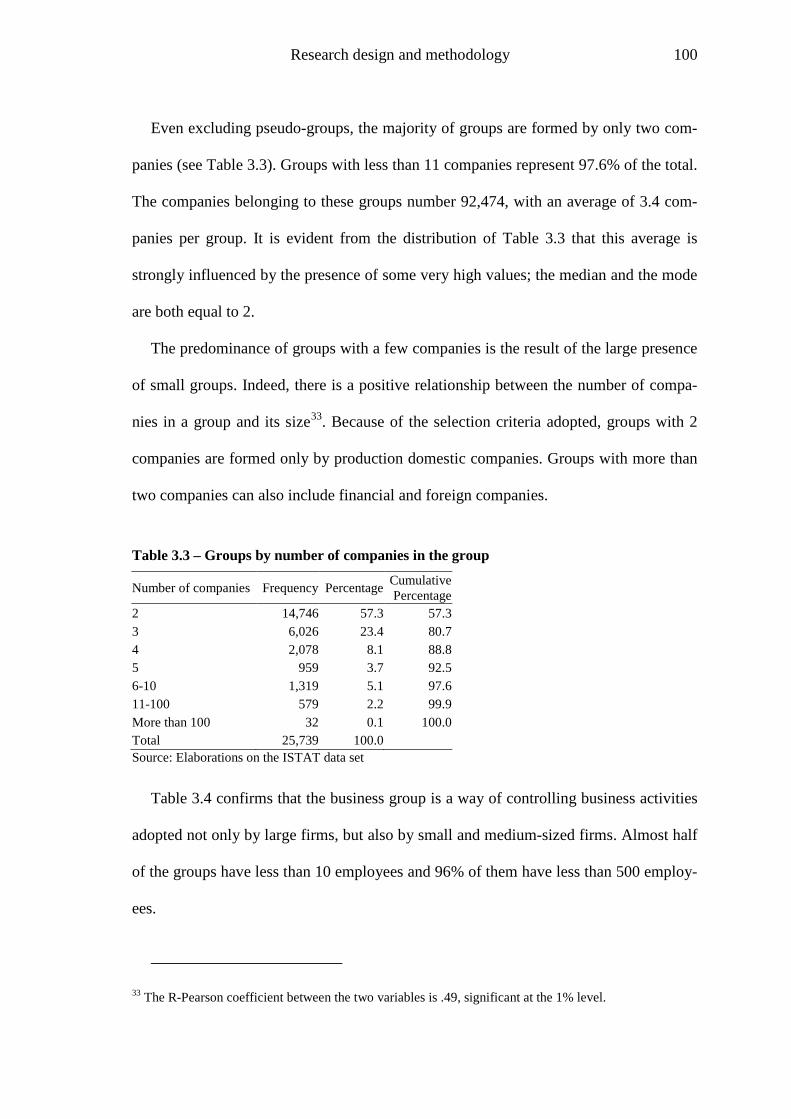
Research design and methodology 100
Even excluding pseudo-groups, the majority of groups are formed by only two com-
panies (see Table 3.3). Groups with less than 11 companies represent 97.6% of the total.
The companies belonging to these groups number 92,474, with an average of 3.4 com-
panies per group. It is evident from the distribution of Table 3.3 that this average is
strongly influenced by the presence of some very high values; the median and the mode
are both equal to 2.
The predominance of groups with a few companies is the result of the large presence
of small groups. Indeed, there is a positive relationship between the number of compa-
nies in a group and its size33
Table 3.3 – Groups by number of companies in the group
. Because of the selection criteria adopted, groups with 2
companies are formed only by production domestic companies. Groups with more than
two companies can also include financial and foreign companies.
Number of companies Frequency Percentage Cumulative Percentage
2 14,746 57.3 57.3 3 6,026 23.4 80.7 4 2,078 8.1 88.8 5 959 3.7 92.5 6-10 1,319 5.1 97.6 11-100 579 2.2 99.9 More than 100 32 0.1 100.0 Total 25,739 100.0 Source: Elaborations on the ISTAT data set
Table 3.4 confirms that the business group is a way of controlling business activities
adopted not only by large firms, but also by small and medium-sized firms. Almost half
of the groups have less than 10 employees and 96% of them have less than 500 employ-
ees.
33 The R-Pearson coefficient between the two variables is .49, significant at the 1% level.
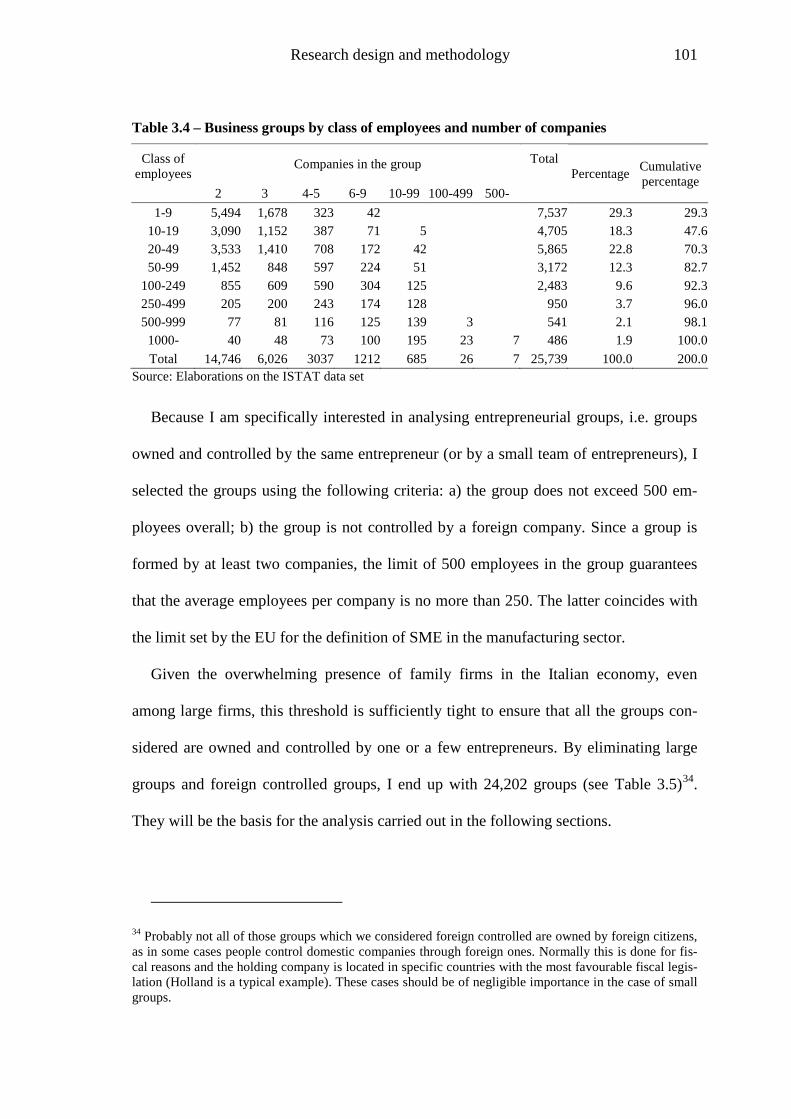
Research design and methodology 101
Table 3.4 – Business groups by class of employees and number of companies
Class of employees
Companies in the group Total
Percentage Cumulative percentage
2 3 4-5 6-9 10-99 100-499 500- 1-9 5,494 1,678 323 42 7,537 29.3 29.3
10-19 3,090 1,152 387 71 5 4,705 18.3 47.6 20-49 3,533 1,410 708 172 42 5,865 22.8 70.3 50-99 1,452 848 597 224 51 3,172 12.3 82.7
100-249 855 609 590 304 125 2,483 9.6 92.3 250-499 205 200 243 174 128 950 3.7 96.0 500-999 77 81 116 125 139 3 541 2.1 98.1
1000- 40 48 73 100 195 23 7 486 1.9 100.0 Total 14,746 6,026 3037 1212 685 26 7 25,739 100.0 200.0
Source: Elaborations on the ISTAT data set
Because I am specifically interested in analysing entrepreneurial groups, i.e. groups
owned and controlled by the same entrepreneur (or by a small team of entrepreneurs), I
selected the groups using the following criteria: a) the group does not exceed 500 em-
ployees overall; b) the group is not controlled by a foreign company. Since a group is
formed by at least two companies, the limit of 500 employees in the group guarantees
that the average employees per company is no more than 250. The latter coincides with
the limit set by the EU for the definition of SME in the manufacturing sector.
Given the overwhelming presence of family firms in the Italian economy, even
among large firms, this threshold is sufficiently tight to ensure that all the groups con-
sidered are owned and controlled by one or a few entrepreneurs. By eliminating large
groups and foreign controlled groups, I end up with 24,202 groups (see Table 3.5)34
34 Probably not all of those groups which we considered foreign controlled are owned by foreign citizens, as in some cases people control domestic companies through foreign ones. Normally this is done for fis-cal reasons and the holding company is located in specific countries with the most favourable fiscal legis-lation (Holland is a typical example). These cases should be of negligible importance in the case of small groups.
.
They will be the basis for the analysis carried out in the following sections.
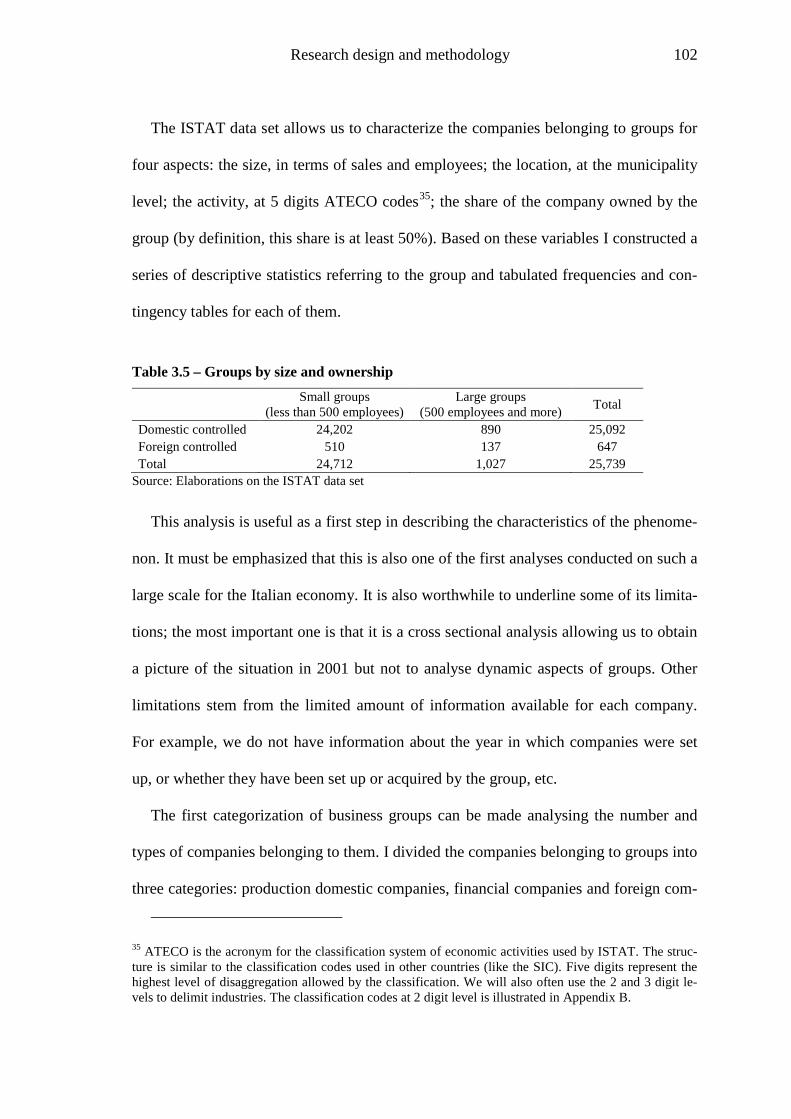
Research design and methodology 102
The ISTAT data set allows us to characterize the companies belonging to groups for
four aspects: the size, in terms of sales and employees; the location, at the municipality
level; the activity, at 5 digits ATECO codes35
Table 3.5 – Groups by size and ownership
; the share of the company owned by the
group (by definition, this share is at least 50%). Based on these variables I constructed a
series of descriptive statistics referring to the group and tabulated frequencies and con-
tingency tables for each of them.
Small groups (less than 500 employees)
Large groups (500 employees and more) Total
Domestic controlled 24,202 890 25,092 Foreign controlled 510 137 647 Total 24,712 1,027 25,739
Source: Elaborations on the ISTAT data set
This analysis is useful as a first step in describing the characteristics of the phenome-
non. It must be emphasized that this is also one of the first analyses conducted on such a
large scale for the Italian economy. It is also worthwhile to underline some of its limita-
tions; the most important one is that it is a cross sectional analysis allowing us to obtain
a picture of the situation in 2001 but not to analyse dynamic aspects of groups. Other
limitations stem from the limited amount of information available for each company.
For example, we do not have information about the year in which companies were set
up, or whether they have been set up or acquired by the group, etc.
The first categorization of business groups can be made analysing the number and
types of companies belonging to them. I divided the companies belonging to groups into
three categories: production domestic companies, financial companies and foreign com-
35 ATECO is the acronym for the classification system of economic activities used by ISTAT. The struc-ture is similar to the classification codes used in other countries (like the SIC). Five digits represent the highest level of disaggregation allowed by the classification. We will also often use the 2 and 3 digit le-vels to delimit industries. The classification codes at 2 digit level is illustrated in Appendix B.
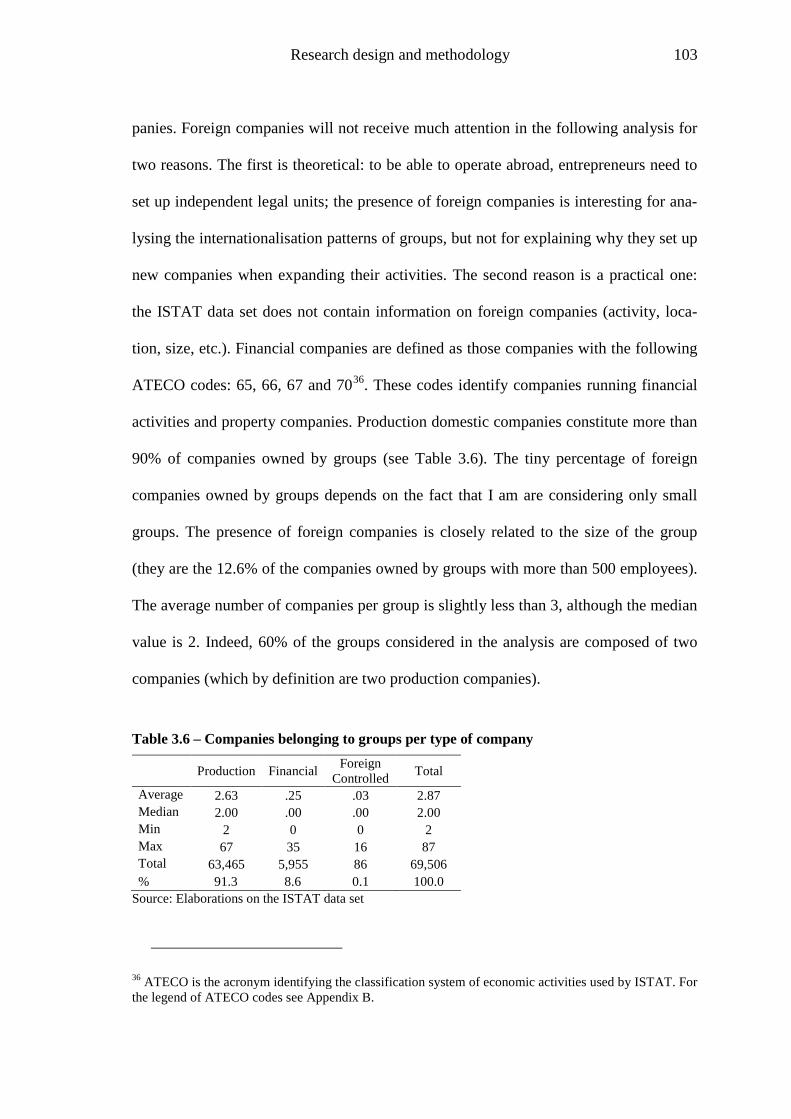
Research design and methodology 103
panies. Foreign companies will not receive much attention in the following analysis for
two reasons. The first is theoretical: to be able to operate abroad, entrepreneurs need to
set up independent legal units; the presence of foreign companies is interesting for ana-
lysing the internationalisation patterns of groups, but not for explaining why they set up
new companies when expanding their activities. The second reason is a practical one:
the ISTAT data set does not contain information on foreign companies (activity, loca-
tion, size, etc.). Financial companies are defined as those companies with the following
ATECO codes: 65, 66, 67 and 7036
Table 3.6
. These codes identify companies running financial
activities and property companies. Production domestic companies constitute more than
90% of companies owned by groups (see ). The tiny percentage of foreign
companies owned by groups depends on the fact that I am are considering only small
groups. The presence of foreign companies is closely related to the size of the group
(they are the 12.6% of the companies owned by groups with more than 500 employees).
The average number of companies per group is slightly less than 3, although the median
value is 2. Indeed, 60% of the groups considered in the analysis are composed of two
companies (which by definition are two production companies).
Table 3.6 – Companies belonging to groups per type of company
Production Financial Foreign Controlled Total
Average 2.63 .25 .03 2.87 Median 2.00 .00 .00 2.00 Min 2 0 0 2 Max 67 35 16 87 Total 63,465 5,955 86 69,506 % 91.3 8.6 0.1 100.0
Source: Elaborations on the ISTAT data set
36 ATECO is the acronym identifying the classification system of economic activities used by ISTAT. For the legend of ATECO codes see Appendix B.
Research design and methodology 104
One of the most important features of groups is the degree of concentration of activi-
ties in the companies of the group. According to this value of concentration, we can
separate ‘satellite system’ groups from ‘peer’ groups. The first type is characterized by
the fact that most of the activity is concentrated in one company of the group; the sec-
ond type is characterized by the fact that there is no lead company and all the companies
are of similar size. In calculating indices of concentration, I will refer only to production
companies. The reason for this is that most of the financial companies (particularly
those in small groups) do not perform any kind of activity and are set up only for fiscal
reasons (as discussed before).
As a first step towards analysing the degree of concentration of activities in the com-
panies of the group, I used a simple index, based on the ratio of the employees of the
largest company in the groups to the overall employees. I used the employees rather
than sales volume because employees are more reliable in capturing the actual distribu-
tion of activities between the companies of the group. The use of sales can have two dis-
torting effects: on the one hand, the level of sales is strongly influenced by the degree of
vertical integration (a commercial company can have a large volume of sales even
though it has little production activity); on the other hand, there could be duplication of
sales figures where a company of the group sells its output to another company within
the same group. Descriptive statistics of the employee concentration index are presented
in Table 3.7, while the distribution is presented in Figure 3.5. The level of concentration
is rather high, as might be expected in the case of small groups. The frequency distribu-
tion shows the presence of several modal values around 50% and 65%; i.e. around one
half and two thirds of total employees.
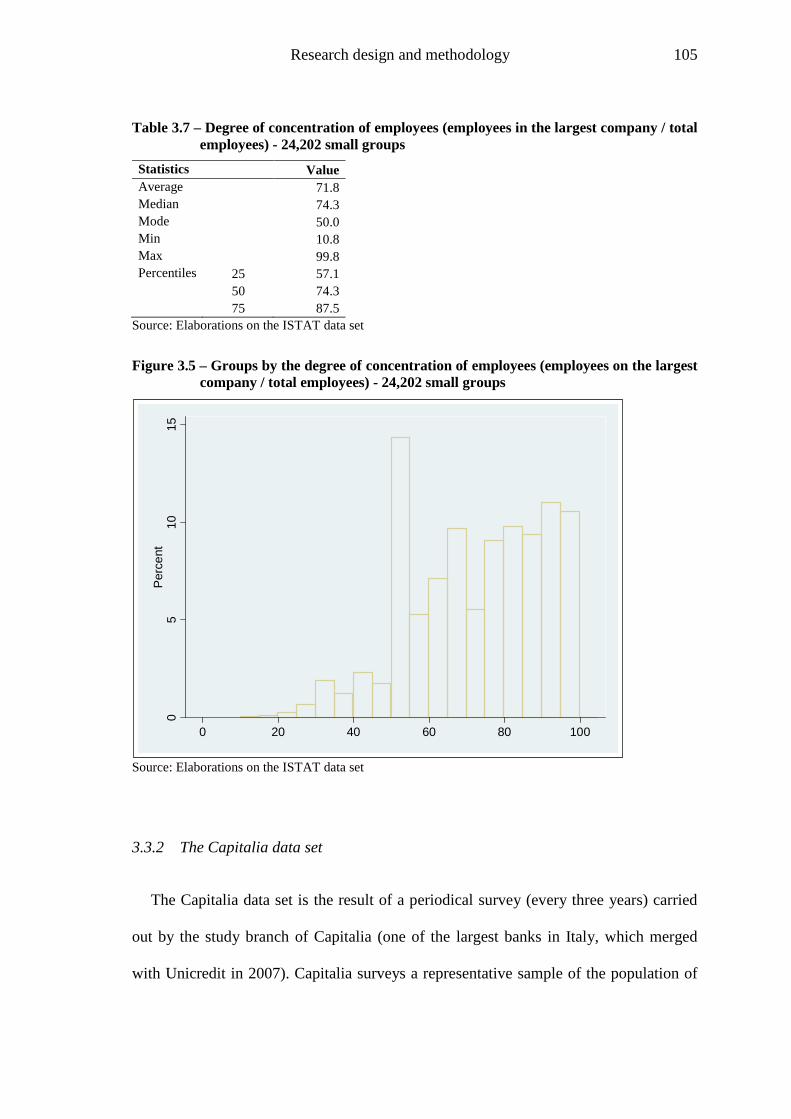
Research design and methodology 105
Table 3.7 – Degree of concentration of employees (employees in the largest company / total employees) - 24,202 small groups
Statistics Value Average 71.8 Median 74.3 Mode 50.0 Min 10.8 Max 99.8 Percentiles 25 57.1 50 74.3 75 87.5
Source: Elaborations on the ISTAT data set
Figure 3.5 – Groups by the degree of concentration of employees (employees on the largest company / total employees) - 24,202 small groups
Source: Elaborations on the ISTAT data set
3.3.2 The Capitalia data set
The Capitalia data set is the result of a periodical survey (every three years) carried
out by the study branch of Capitalia (one of the largest banks in Italy, which merged
with Unicredit in 2007). Capitalia surveys a representative sample of the population of
05
1015
Per
cent
0 20 40 60 80 100
Research design and methodology 106
Italian manufacturing firms with more than 10 employees. Over time the Capitalia sur-
vey has gained a reputation as one of the most reliable sources of information on Italian
manufacturing firms; for this reason the data set is widely used by the scientific com-
munity. The data set I use is the latest available; the survey was conducted in 2004 and
data refers to the period 2001-2003. Besides general information on the size and activity
of firms, the survey has several sections referring to the characteristics of employees,
investment and innovation, internationalisation processes, etc. The sections of most in-
terest for the purposes of this research are those referring to the ownership and control
structure of companies and whether or not they belong to a business group.
In the case of the ownership structure of firms, the survey asks for information on the
type and share of the first three owners. The survey also tells us whether these owners
directly exercise control of the firm. The unit of analysis of the Capitalia data set is the
company and not the group. For this reason, information about the group is collected in
an indirect way, when the company declares it belongs to a group during the survey in-
terview. The questions included in the ‘group section’ are the following: 1. whether the
company belongs to a group or not (of crucial importance for the following questions);
2. the position of the company within the group pyramid (i.e. head of the group, in an
intermediate position or just controlled); 3. the overall companies belonging to the
group; 4. the year of set-up of the group; 5. whether the companies in the group belong
to the same sector; 6. whether other companies in the group (besides those interviewed)
carry out industrial activities; 7. whether there are operative relationships between the
companies belonging to the group; 8. the overall number of employees in the group.
The Capitalia data set is particularly interesting for studying the ownership structure
of companies belonging to a group. It also allows a comparison between those compa-
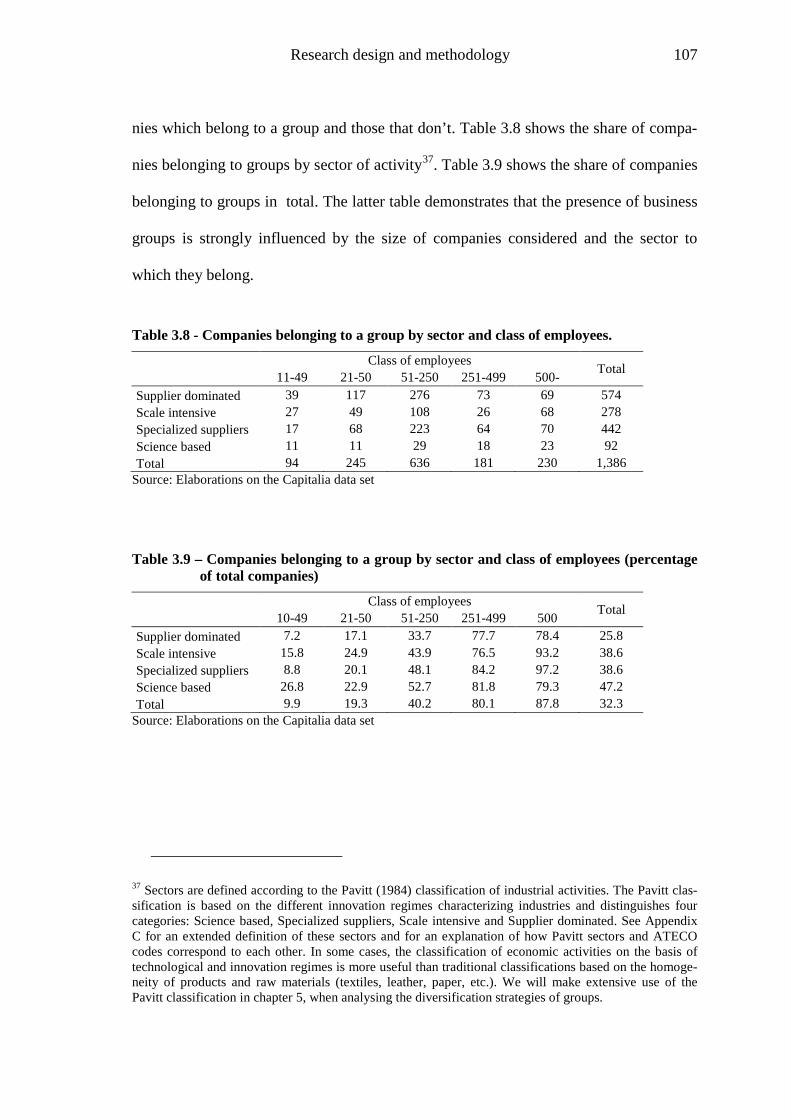
Research design and methodology 107
nies which belong to a group and those that don’t. Table 3.8 shows the share of compa-
nies belonging to groups by sector of activity37 Table 3.9. shows the share of companies
belonging to groups in total. The latter table demonstrates that the presence of business
groups is strongly influenced by the size of companies considered and the sector to
which they belong.
Table 3.8 - Companies belonging to a group by sector and class of employees.
Class of employees Total 11-49 21-50 51-250 251-499 500-
Supplier dominated 39 117 276 73 69 574 Scale intensive 27 49 108 26 68 278 Specialized suppliers 17 68 223 64 70 442 Science based 11 11 29 18 23 92 Total 94 245 636 181 230 1,386
Source: Elaborations on the Capitalia data set
Table 3.9 – Companies belonging to a group by sector and class of employees (percentage of total companies)
Class of employees Total 10-49 21-50 51-250 251-499 500
Supplier dominated 7.2 17.1 33.7 77.7 78.4 25.8 Scale intensive 15.8 24.9 43.9 76.5 93.2 38.6 Specialized suppliers 8.8 20.1 48.1 84.2 97.2 38.6 Science based 26.8 22.9 52.7 81.8 79.3 47.2 Total 9.9 19.3 40.2 80.1 87.8 32.3
Source: Elaborations on the Capitalia data set
37 Sectors are defined according to the Pavitt (1984) classification of industrial activities. The Pavitt clas-sification is based on the different innovation regimes characterizing industries and distinguishes four categories: Science based, Specialized suppliers, Scale intensive and Supplier dominated. See Appendix C for an extended definition of these sectors and for an explanation of how Pavitt sectors and ATECO codes correspond to each other. In some cases, the classification of economic activities on the basis of technological and innovation regimes is more useful than traditional classifications based on the homoge-neity of products and raw materials (textiles, leather, paper, etc.). We will make extensive use of the Pavitt classification in chapter 5, when analysing the diversification strategies of groups.
Research design and methodology 108
3.3.3 The Marche region data set
The data set on the Marche region is a longitudinal data set of the manufacturing
groups in the Marche region (Italy). It has been built by collecting data on business
groups for the period 1995-2005. Compared with the ISTAT and the Capitalia data sets,
the Marche data set allows the analysis of the dynamics of business groups. The avail-
ability of data on business groups in the Marche region is the result of the interest of the
Aristide Merloni Foundation in promoting the analysis of the growth process and per-
formance of the main manufacturing firms operating in the region38
The Marche is a small, highly industrialised region in central Italy. It belongs to the
set of the north-east-central (NEC) regions of Italy (Friuli, Veneto, Emilia Romagna,
Tuscany, Umbria) which, following World War II, experienced an intensive process of
industrialisation, mostly based on small firms concentrated in industrial districts. In-
deed, according to the last industry census conducted in 2001, over 50% of the employ-
ees were working in units with less than fifty employees. Like the other NEC regions,
the Marche is specialized in ‘traditional’ industries (such as clothing, footwear and fur-
niture) and medium tech industries (such as electrical domestic appliances, metal work
and industrial machinery). During the last decades, the latter industries have become in-
creasingly important, while traditional sectors have declined in terms of employees and
output.
.
Given the recent industrialization process, most of the companies and groups covered
by the data set were set up in the seventies and the eighties, and the founding entrepre-
38 The Aristide Merloni Foundation is a non profit organization named after the founder of the Merloni manufacturing industries in Fabriano. The aim of the foundation is to contribute to the economic devel-opment of the Marche region.
Research design and methodology 109
neur is still running the company. The data set contains information on about 250 manu-
facturing companies and about 100 groups. For each group, the data set contains data on
the following aspects:
a) the companies controlled by the group and their activities;
b) the structure of ownership and control;
c) the economic and financial performance of the group (where there a consolidated
balance-sheet is available) and of their main companies.
Data contained in the Merloni Foundation data set are collected from company an-
nual reports. This information is supplemented by data on ownership and control (from
the Chamber of Commerce) and with data and information on company products and
activities (from company websites and other sources). This data set will be used to study
the growth patterns of groups and to test the different theoretical perspectives explain-
ing group formation.
For the reasons explained in the previous section, I excluded those groups with more
than 500 employees overall. I also excluded from the analysis groups owned by foreign
multinationals. The longitudinal analysis is based on a panel involving all the firms with
between 50 and 500 employees. I followed these firms for a ten year period with spe-
cific regard to group dynamics: that is, the formation, acquisition, selling, liquidation or
consolidation of companies belonging to the group. There are several problems in build-
ing a longitudinal data set on business groups: some of them are common to any longi-
tudinal study and some are specific to the nature of business groups. A common prob-
lem with a panel study is the sample attrition caused by failures. In our case, the per-
centage of failed firms is very small as we are not dealing with new firms.
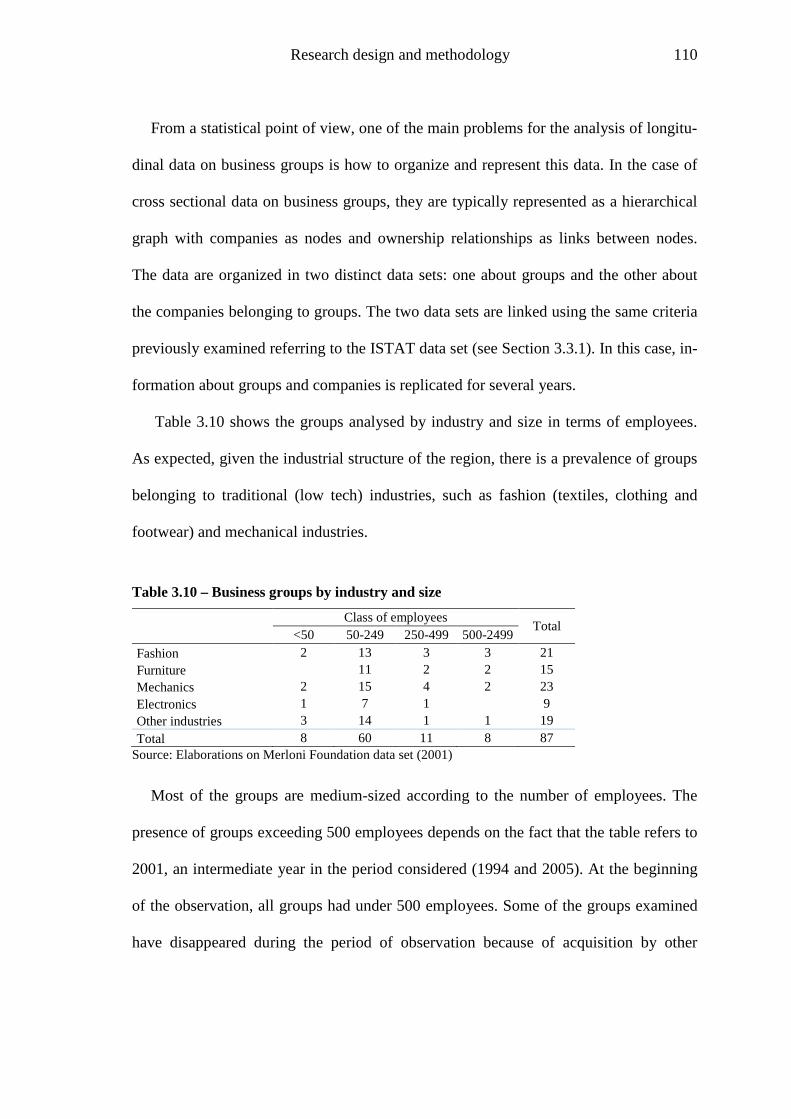
Research design and methodology 110
From a statistical point of view, one of the main problems for the analysis of longitu-
dinal data on business groups is how to organize and represent this data. In the case of
cross sectional data on business groups, they are typically represented as a hierarchical
graph with companies as nodes and ownership relationships as links between nodes.
The data are organized in two distinct data sets: one about groups and the other about
the companies belonging to groups. The two data sets are linked using the same criteria
previously examined referring to the ISTAT data set (see Section 3.3.1). In this case, in-
formation about groups and companies is replicated for several years.
Table 3.10 shows the groups analysed by industry and size in terms of employees.
As expected, given the industrial structure of the region, there is a prevalence of groups
belonging to traditional (low tech) industries, such as fashion (textiles, clothing and
footwear) and mechanical industries.
Table 3.10 – Business groups by industry and size
Class of employees Total
<50 50-249 250-499 500-2499 Fashion 2 13 3 3 21 Furniture 11 2 2 15 Mechanics 2 15 4 2 23 Electronics 1 7 1 9 Other industries 3 14 1 1 19 Total 8 60 11 8 87
Source: Elaborations on Merloni Foundation data set (2001)
Most of the groups are medium-sized according to the number of employees. The
presence of groups exceeding 500 employees depends on the fact that the table refers to
2001, an intermediate year in the period considered (1994 and 2005). At the beginning
of the observation, all groups had under 500 employees. Some of the groups examined
have disappeared during the period of observation because of acquisition by other
Research design and methodology 111
groups or because of failure. In 2001 there were 407 companies belonging to these 87
groups with an average of 4.7 companies per group.
To organize the data in a longitudinal structure, the data set of the companies belong-
ing to groups are replicated for several years; this poses considerable problems for the
representation and analysis of data.
3.3.4 Direct interviews
The Marche region data set offers a rich array of data and information on business
groups and their evolution over time. However, it is based on publicly available data
and does not allow us to understand some aspects of the processes behind the formation
and evolution of business groups. Specifically, we lack information on the circum-
stances and motivations that have induced entrepreneurs to start up new firms rather
than expanding the one(s) already established. For this reason why I carried out a quali-
tative survey based on direct interviews with a sample of entrepreneurs. The choice of
qualitative methods was determined by the exploratory nature of this part of the study.
Indeed, its aim is to develop a framework for understanding the role of entrepreneurial
processes in business group formation. For this reason, interviews focus on the analysis
of the context of new venture creation by established entrepreneurs and on the reasons
expressed by entrepreneurs themselves for the setting up (or acquisition) of new com-
panies. As is common in qualitative analysis, purposive sampling rather than statistical
sampling was used (Silverman, 2000, p. 104; Bryman, 2001, p. 324). The entrepreneurs
interviewed were chosen from the population of small groups (those not exceeding 500
employees) located in the Marche region included in the Merloni Foundation database
(described in the previous section). From these groups, I selected the cases that were
Research design and methodology 112
specifically relevant to the aims of the study. The selection criteria were: a) the group
was founded and is still controlled by the interviewed entrepreneur; b) the group con-
tains more than two manufacturing companies, providing a sufficiently rich context for
analysing the development process. These selection criteria isolated about 30 groups.
The results reported here refer to 18 groups whose entrepreneurs agreed to be inter-
viewed. The main characteristics of the groups interviewed are presented in Table 3.11.
The small number of case studies analysed does not limit the aim of the research; in
fact, as the interviews progressed, I became convinced that I had covered all the main
issues and that the informative value of further interviews was rapidly decreasing.
In-depth interviews have been carried out with the entrepreneurs that founded and
developed these groups. In those cases where an entrepreneurial team existed (often
members of the same family) I interviewed the person who played the most important
role in the group formation and development. The aim of the interviews was to collect
data and information not publicly available. In particular, information about the origin
of the group, the circumstances of the growth process and the reasons for starting up
new companies.
The interviews were based on a semi-structured questionnaire divided in to five main
topics: the beginning of the entrepreneurial activity; the growth strategy followed after
the formation of the original activity; the reasons for setting up new companies; the dy-
namics of the group; and the present structure of the group. For each topic, a set of spe-
cific questions was identified. The interview guide is illustrated in Appendix A.
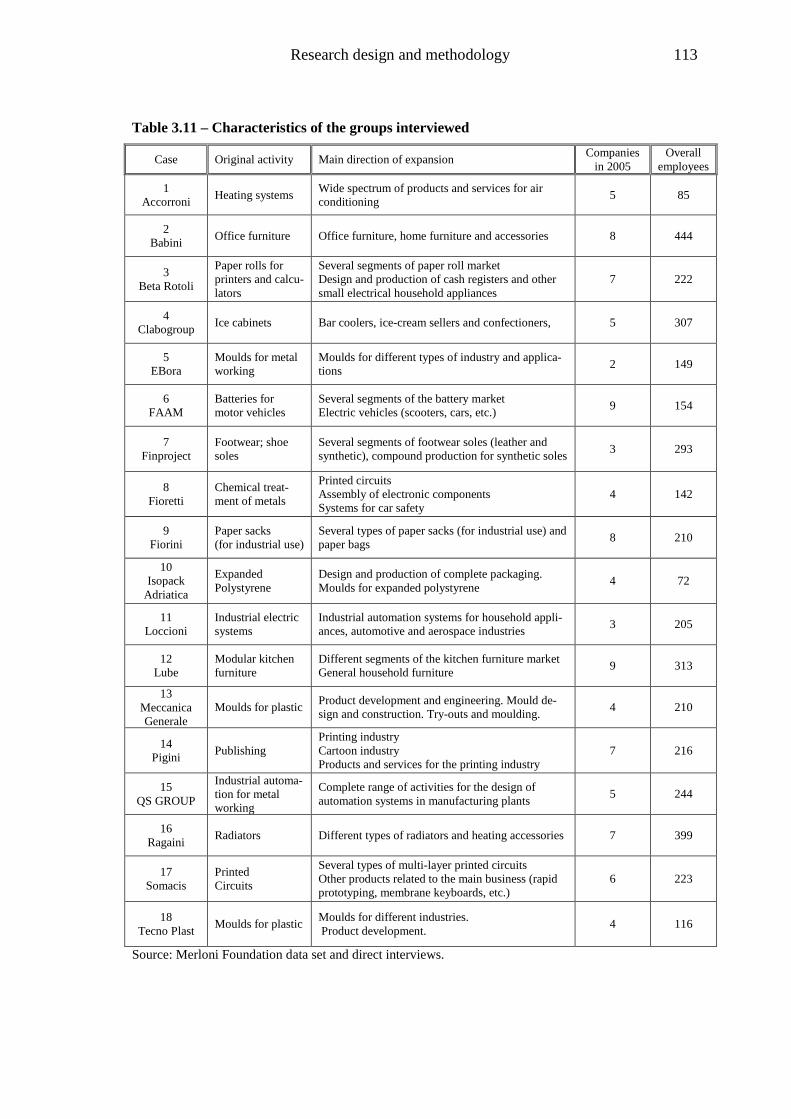
Research design and methodology 113
Table 3.11 – Characteristics of the groups interviewed
Case Original activity Main direction of expansion Companies in 2005
Overall employees
1 Accorroni Heating systems Wide spectrum of products and services for air
conditioning 5 85
2 Babini Office furniture Office furniture, home furniture and accessories 8 444
3 Beta Rotoli
Paper rolls for printers and calcu-lators
Several segments of paper roll market Design and production of cash registers and other small electrical household appliances
7 222
4 Clabogroup Ice cabinets Bar coolers, ice-cream sellers and confectioners, 5 307
5 EBora
Moulds for metal working
Moulds for different types of industry and applica-tions 2 149
6 FAAM
Batteries for motor vehicles
Several segments of the battery market Electric vehicles (scooters, cars, etc.) 9 154
7 Finproject
Footwear; shoe soles
Several segments of footwear soles (leather and synthetic), compound production for synthetic soles 3 293
8 Fioretti
Chemical treat-ment of metals
Printed circuits Assembly of electronic components Systems for car safety
4 142
9 Fiorini
Paper sacks (for industrial use)
Several types of paper sacks (for industrial use) and paper bags 8 210
10 Isopack
Adriatica
Expanded Polystyrene
Design and production of complete packaging. Moulds for expanded polystyrene 4 72
11 Loccioni
Industrial electric systems
Industrial automation systems for household appli-ances, automotive and aerospace industries 3 205
12 Lube
Modular kitchen furniture
Different segments of the kitchen furniture market General household furniture 9 313
13 Meccanica Generale
Moulds for plastic Product development and engineering. Mould de-sign and construction. Try-outs and moulding. 4 210
14 Pigini Publishing
Printing industry Cartoon industry Products and services for the printing industry
7 216
15 QS GROUP
Industrial automa-tion for metal working
Complete range of activities for the design of automation systems in manufacturing plants 5 244
16 Ragaini Radiators Different types of radiators and heating accessories 7 399
17 Somacis
Printed Circuits
Several types of multi-layer printed circuits Other products related to the main business (rapid prototyping, membrane keyboards, etc.)
6 223
18 Tecno Plast Moulds for plastic Moulds for different industries.
Product development. 4 116
Source: Merloni Foundation data set and direct interviews.
Research design and methodology 114
I chose the semi-structured interview because of its flexibility and because I did not
want to impose a predefined pattern of analysis on the interview results. Flexibility is
important because of the differences in the structure and in the patterns of development
of groups. I also wanted the entrepreneur to give her/his account of the group formation,
rather than encouraging them to choose from suggested explanations. Although there
are several hypotheses for explaining group formation, in the interviews I asked the en-
trepreneurs about their reasons for setting up new firms, leaving them free to give their
reasons. All the interviews took place in the offices of one of the entrepreneur’s compa-
nies. The interviews were carried out between 2003 and 2005. In a few cases, a follow
up after the first interview was done in order to clarify some aspects of the interview or
to collect additional data. The overall process of data collection and analysis is illus-
trated in Figure 3.6.
All the interviews were recorded (in digital format) and transcribed by a word proc-
essor for analysis. In preparing the transcriptions for the analysis, I have not adopted the
strict conventions of conversation analysis (CA). In some cases, the words used by the
entrepreneurs interviewed have been changed to maintain consistency in the analysis.
For example, one entrepreneur referred to his group as a network. I retained the original
word in the raw transcript as it indicates the specific way in which the entrepreneur sees
the relationships between his controlled companies; in editing the text however, the
word network was changed into group since within this research project the term ‘net-
work’ is used with a different meaning. The edited transcripts were transferred to QRS
NVivo to facilitate the process of coding. I started by codifying the text according to
pre-defined topics which I considered relevant to business groups. Other topics were
progressively added as they emerged from the interviews. Finally, all the topics were ra-
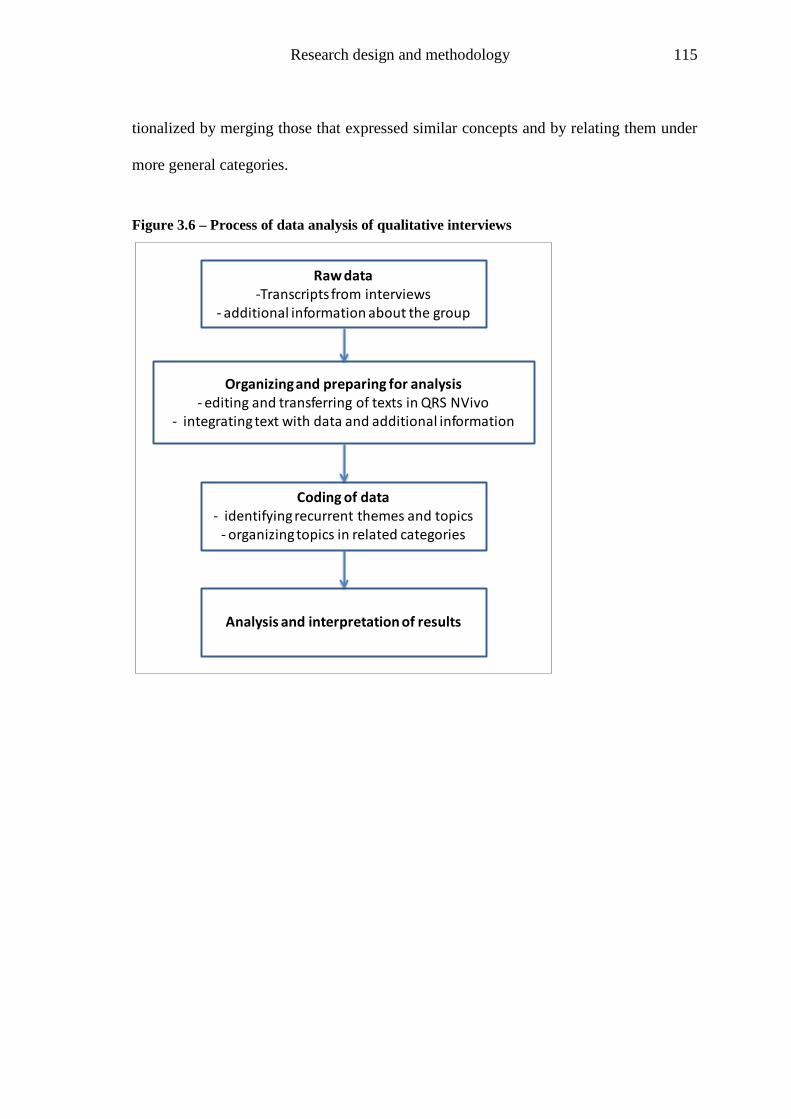
Research design and methodology 115
tionalized by merging those that expressed similar concepts and by relating them under
more general categories.
Figure 3.6 – Process of data analysis of qualitative interviews
Raw data-Transcripts from interviews
- additional information about the group
Organizing and preparing for analysis- editing and transferring of texts in QRS NVivo
- integrating text with data and additional information
Coding of data- identifying recurrent themes and topics
- organizing topics in related categories
Analysis and interpretation of results
Ownership and control 116
Chapter 4 - Ownership structure and agency problems in business
groups
The prevailing justification for the presence of business groups in developed coun-
tries is that they are a device for manipulating the ownership and control of business ac-
tivities. This argument is particularly relevant in the case of pyramidal groups (see the
definition in Section 2.1). In chapter 2 I refer to it as the ‘financial explanation’ of busi-
ness groups. The justification for the presence of pyramids is the separation of control
rights, that remain in the hands of the ultimate owner, from cash flow rights, which are
shared with the non-controlling owners; a situation I refer to as equity leverage (see
Section 2.3.3). This separation is better achieved when companies are listed on stock
markets and there are a large number of minority shareholders. There are two facts that
do not support the equity leverage hypothesis: on the one hand, business groups are
widespread among privately owned non-listed companies where the phenomenon of eq-
uity leverage is barely relevant (see Section 2.2); on the other hand, a significant differ-
ence between control rights and cash-flow rights is seen only in a tiny minority of large
groups (Franks and Mayer, 2001; Faccio and Lang, 2002).
Until recently, the financial explanations for business groups were considered rele-
vant only in the case of large groups. As discussed in Section 2.3.3, Almeida and Wolf-
enzon (2006) put forward a model that extends the financial explanation to privately
owned small groups as well, which they refer to as ‘family groups’. It is out of the scope
of this chapter to review in detail the assumptions and development of the AW model. It
Ownership and control 117
is interesting to focus on the empirical predictions of the model and test some of them
using the data available on Italian business groups. This is important for verifying to
what extent the financial explanation can help understanding of the presence of business
groups in the small business sector.
The aims of this chapter are the following: 1) review the implications of the financial
explanation of business groups in the case of privately owned groups; 2) give the first
empirical verification of the Almeida and Wolfenzon (2006) model using the data avail-
able on Italian business groups; 3) assess to what extent the financial explanation justi-
fies the presence of business groups in the small business sector and examine the as-
pects this theory leaves unexplained.
4.1 The financial explanation of family-owned groups
The basic idea of the AW model is that business groups are used by entrepreneurs to
manipulate the ownership structure of new businesses in order to maximize the financial
wealth of his/her family (see Section 2.3.3). This is achieved by two basic mechanisms:
by privately appropriating the cash flow of controlled companies to the detriment of mi-
nority shareholders (cash flow advantage); and by using the cash flow of the controlled
company to finance new businesses (financing advantage). In section 3 of their article,
Almeida and Wolfenzon (2006) discuss the following 10 predictions that can be derived
from their model:
1. It is possible to observe pyramids in which the controlling family has high
cash flow stakes in member firms, in which case the separation between
ownership and control is not large…

Ownership and control 118
2. The family might strictly prefer to create a pyramid, even when restrictions
on the issuance of dual-class shares are not binding…
3. Pyramids tend to be created over time, following good performance of ex-
isting family firms…
4. Separate companies in pyramids are more likely to correspond to separate
industry ventures by the controlling family, and are less likely to be in the
same industry…
5. Diversion is higher for firms placed in a pyramid than for firms controlled
directly by the family …
6. Firm value and firm performance are lower in pyramid-owned firms than
in unaffiliated firms or horizontal structures …
7. Family business groups should be more prevalent in countries with poor
investor protection…
8. Family business groups are more likely to be organized as pyramids, espe-
cially in countries with poor investor protection…
9. Firms in pyramids are larger, or they are more likely to belong to capital
intensive industries…
10. When a new firm is added to a pyramidal structure, the existing non family
shareholders of the pyramid realize a negative return (Almeida and
Wolfenzon, 2006, pp. 2662-2668).
Not all of these predictions are relevant for this study. I am interested in explaining
why business groups emerge and their characteristics; for this reason, I will examine
those predictions of the AW model that directly address these issues: i.e. predictions 1,
2, 3, 4, 7, 8, 9.
Ownership and control 119
Prediction 7 is widely claimed; in fact, most of the literature about business groups
refers to emerging economies. We do not have enough statistical evidence to compare
the weight of business groups in different countries; data available seem to question this
proposition, as business groups are also a relevant and growing phenomenon in devel-
oped countries (see chapter 2). This means that the presence of ‘poor investor protec-
tion’ is not a necessary condition for the existence of such structures.
Prediction 9 is partially verified by Italian data. Because the presence of business
groups increases with the size of firms, companies belonging to business groups are lar-
ger than the average in the same industry (Cainelli and Iacobucci, 2007). It is also true
that the presence of business groups in scale intensive sectors is higher than average
(see Table 3.9, p. 107). Moreover, the industries where business groups are more wide-
spread belong to Science-based sectors (see Table 3.9 p. 107); in these industries it is
not only the need for capital that justifies the presence of business groups, but also the
greater possibility of diversification in related activities as a result of the exploitation of
the wide knowledge base typical of these sectors (see the discussion of this aspect in
Chap. 5). By concentrating on financial aspects, the AW model considers the business
group only as a device for raising capital rather than as an organizational form suited for
developing new business opportunities.
Predictions 3 and 4 on the dynamics of group formation and the degree of diversifi-
cation of member companies will be specifically addressed in chapter 6 and 5 respec-
tively.
In the next two sections I focus on the predictions of the AW model that are more
closely associated to the financial explanation of business groups. Specifically, I address
the following two issues:
Ownership and control 120
- the prevalence of pyramidal versus horizontal structures (predictions 2 and 8);
- the degree of ownership concentration in controlled companies and their deter-
minants (prediction 1 of the AW model).
4.2 Group structure: pyramidal versus horizontal structures
The AW model specifically addresses the question of when we should observe a
horizontal rather than a pyramidal structure. The level of diversion plays a key role: i.e.
the amount of cash flow that the controlling family can privately appropriate to the det-
riment of minority shareholders. When the non-diverted cash flow of the new firm is
positive, the family will choose the horizontal structure; if the family chooses the py-
ramidal structure, it must share the non-diverted revenue with outside shareholders of
the established firm. When the non-diverted revenue is negative, the family would pre-
fer to set up the new company in a pyramid structure for two reasons: a) external inves-
tors are less willing to contribute to the financing of the new company (thus the impor-
tance of using the cash accumulated in the established company); b) the pyramid allows
the family to share the negative (non diverted) cash flow with the minority shareholders
of the established company. As a result, a new firm is less likely to be owned through a
pyramid in the following conditions (Almeida and Wolfenzon, 2006, p. 2647): i) the
new firm generates higher revenues; ii) the new firm requires a smaller investment; iii)
investor protection increases.
It is not easy to verify any of these hypotheses given the difficulties in assessing the
degree of diversion in firms or the ex-ante revenue forecasts. In any case, the AW
model predicts that pyramids are generally preferred to horizontal structures (prediction
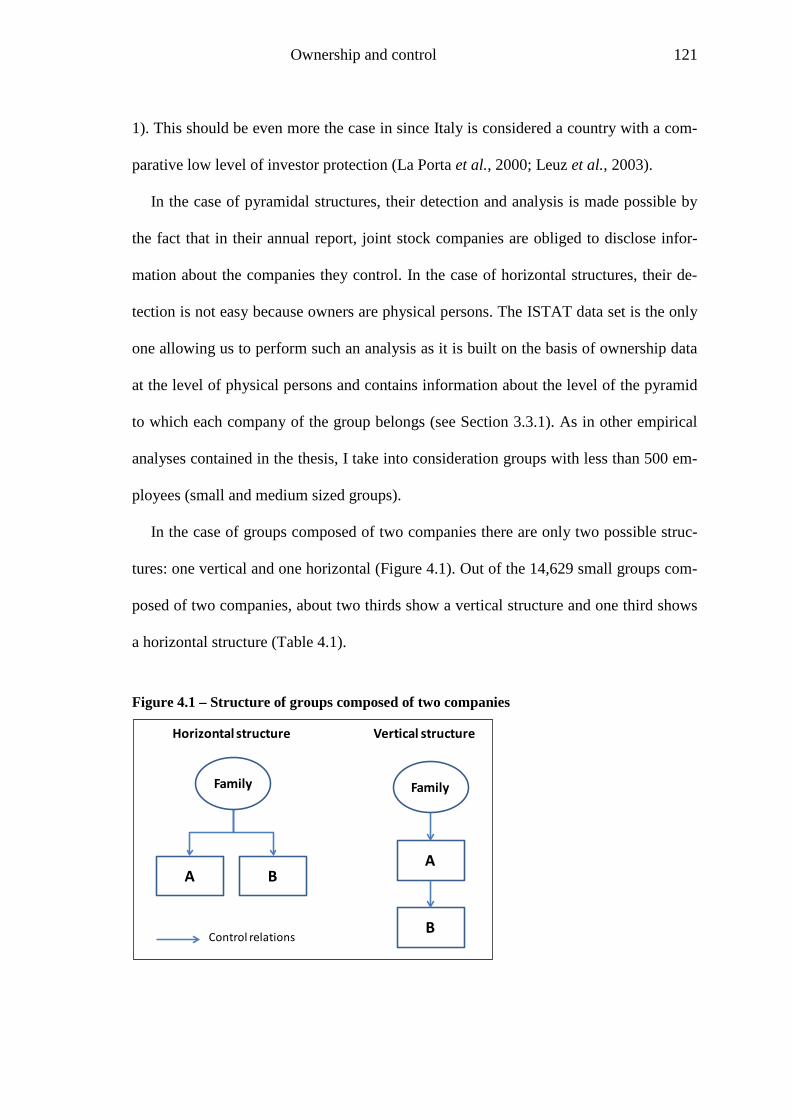
Ownership and control 121
1). This should be even more the case in since Italy is considered a country with a com-
parative low level of investor protection (La Porta et al., 2000; Leuz et al., 2003).
In the case of pyramidal structures, their detection and analysis is made possible by
the fact that in their annual report, joint stock companies are obliged to disclose infor-
mation about the companies they control. In the case of horizontal structures, their de-
tection is not easy because owners are physical persons. The ISTAT data set is the only
one allowing us to perform such an analysis as it is built on the basis of ownership data
at the level of physical persons and contains information about the level of the pyramid
to which each company of the group belongs (see Section 3.3.1). As in other empirical
analyses contained in the thesis, I take into consideration groups with less than 500 em-
ployees (small and medium sized groups).
In the case of groups composed of two companies there are only two possible struc-
tures: one vertical and one horizontal (Figure 4.1). Out of the 14,629 small groups com-
posed of two companies, about two thirds show a vertical structure and one third shows
a horizontal structure (Table 4.1).
Figure 4.1 – Structure of groups composed of two companies
A BA
B
Horizontal structure Vertical structure
Control relations
Family Family
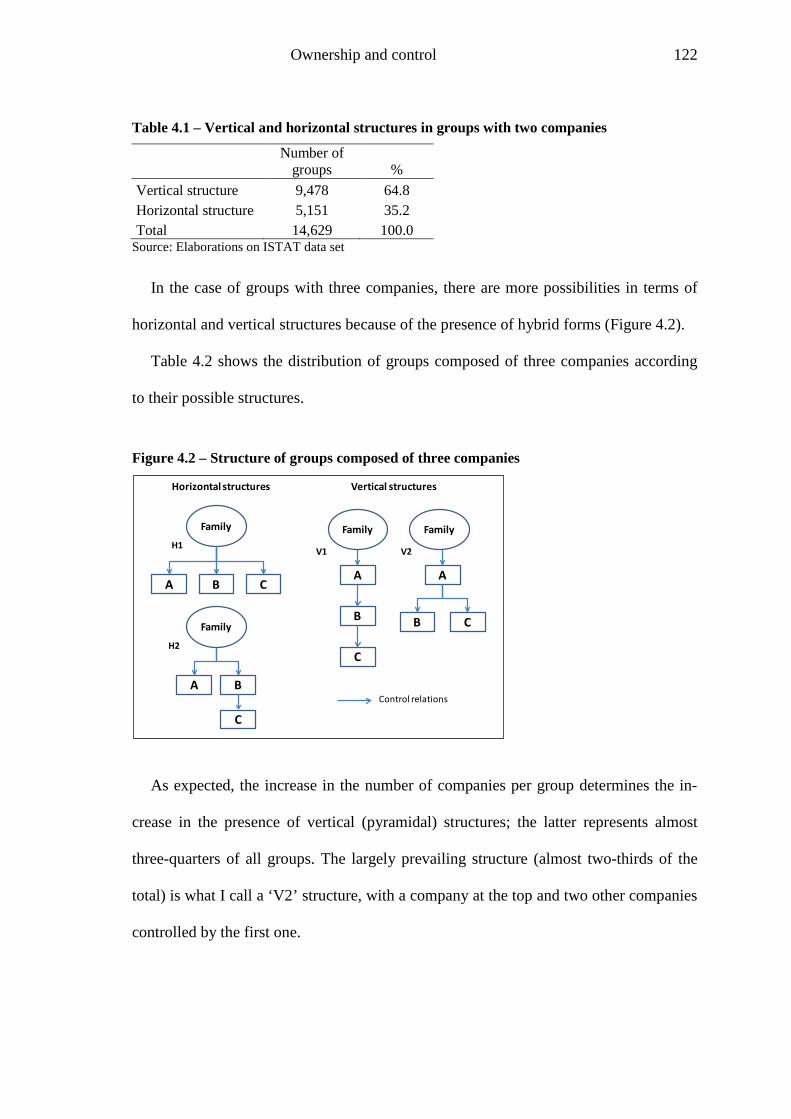
Ownership and control 122
Table 4.1 – Vertical and horizontal structures in groups with two companies
Number of groups %
Vertical structure 9,478 64.8 Horizontal structure 5,151 35.2 Total 14,629 100.0
Source: Elaborations on ISTAT data set
In the case of groups with three companies, there are more possibilities in terms of
horizontal and vertical structures because of the presence of hybrid forms (Figure 4.2).
Table 4.2 shows the distribution of groups composed of three companies according
to their possible structures.
Figure 4.2 – Structure of groups composed of three companies
As expected, the increase in the number of companies per group determines the in-
crease in the presence of vertical (pyramidal) structures; the latter represents almost
three-quarters of all groups. The largely prevailing structure (almost two-thirds of the
total) is what I call a ‘V2’ structure, with a company at the top and two other companies
controlled by the first one.
A BA
B
Horizontal structures Vertical structures
Control relations
C
C
A
B C
A B
C
H1
H2
V1 V2
Family Family Family
Family

Ownership and control 123
Table 4.2 - Vertical and horizontal structures in groups with three companies
Number of groups % Pure vertical (V1) 668 11.8 V2 3,500 62.1 Pure Horizontal (H1) 937 16.6 H2 533 9.5 Total 5,638 100.0
Source: Elaborations on ISTAT data set
The latter structure, i.e. one company at the top controlling all the other companies
(two-level structure), is also the prevailing structure in groups with four companies,
where it represents 41.7% of the total (Table 4.3) and in groups with 5 companies where
they represent one third of the total (Table 4.4).
Table 4.3 - Vertical and horizontal structures in groups with four companies
Number of groups % Pure Vertical 31 1.6 V (1-3) 785 41.7 V (1-2-1) 340 18.1 V (1-1-2) 184 9.8 Pure Horizontal 231 12.3 H (3-1) 129 6.9 H (2-2) 152 8.1 H (2-1-1) 30 1.6 Total 1,882 100.0 Total vertical 1,340 71.2 Total horizontal 542 28.8
Source: Elaborations on ISTAT data set
The prevalence of vertical structures is in accordance with the AW model prediction.
Also in small groups, companies tend to be controlled through another company (nor-
mally the one at the top) rather than directly by entrepreneurs (and their family mem-
bers). Because of the difficulties in measuring the degree of diversion by controlling en-
trepreneurs, it is impossible to assess whether the prevalence of pyramidal (vertical)
structures is determined by the ‘payoff advantage’, i.e. the appropriation of diverted
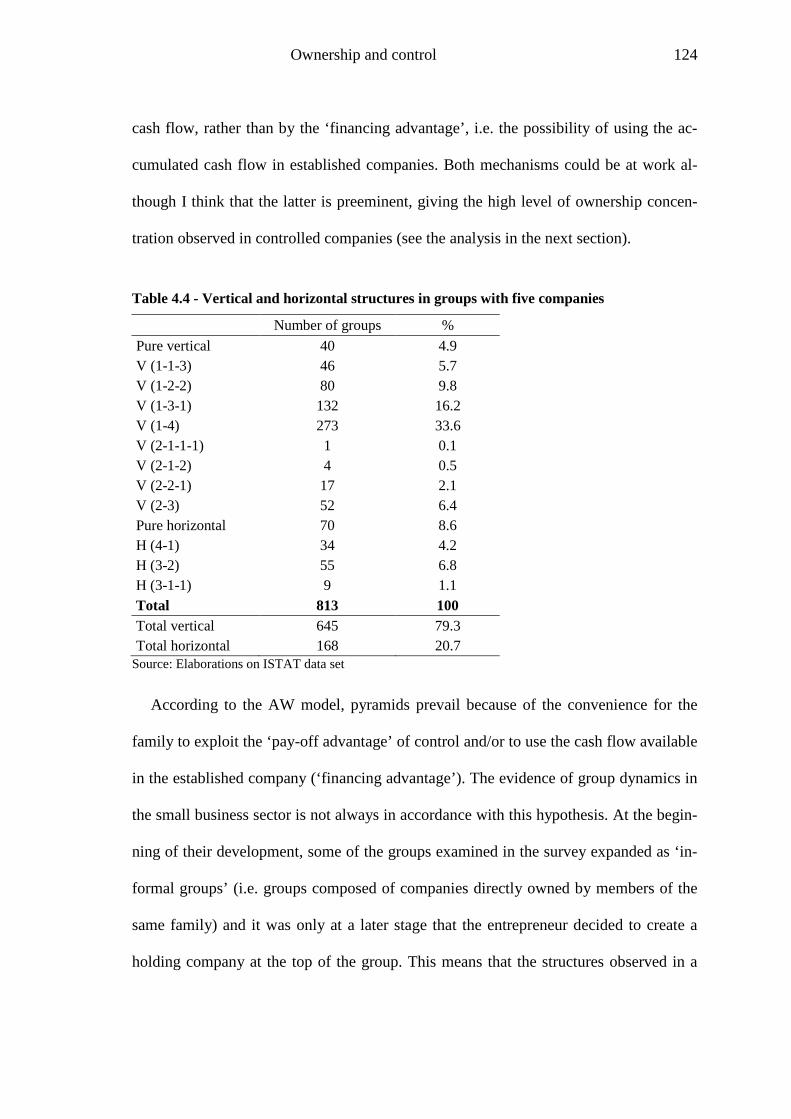
Ownership and control 124
cash flow, rather than by the ‘financing advantage’, i.e. the possibility of using the ac-
cumulated cash flow in established companies. Both mechanisms could be at work al-
though I think that the latter is preeminent, giving the high level of ownership concen-
tration observed in controlled companies (see the analysis in the next section).
Table 4.4 - Vertical and horizontal structures in groups with five companies
Number of groups % Pure vertical 40 4.9 V (1-1-3) 46 5.7 V (1-2-2) 80 9.8 V (1-3-1) 132 16.2 V (1-4) 273 33.6 V (2-1-1-1) 1 0.1 V (2-1-2) 4 0.5 V (2-2-1) 17 2.1 V (2-3) 52 6.4 Pure horizontal 70 8.6 H (4-1) 34 4.2 H (3-2) 55 6.8 H (3-1-1) 9 1.1 Total 813 100 Total vertical 645 79.3 Total horizontal 168 20.7
Source: Elaborations on ISTAT data set
According to the AW model, pyramids prevail because of the convenience for the
family to exploit the ‘pay-off advantage’ of control and/or to use the cash flow available
in the established company (‘financing advantage’). The evidence of group dynamics in
the small business sector is not always in accordance with this hypothesis. At the begin-
ning of their development, some of the groups examined in the survey expanded as ‘in-
formal groups’ (i.e. groups composed of companies directly owned by members of the
same family) and it was only at a later stage that the entrepreneur decided to create a
holding company at the top of the group. This means that the structures observed in a
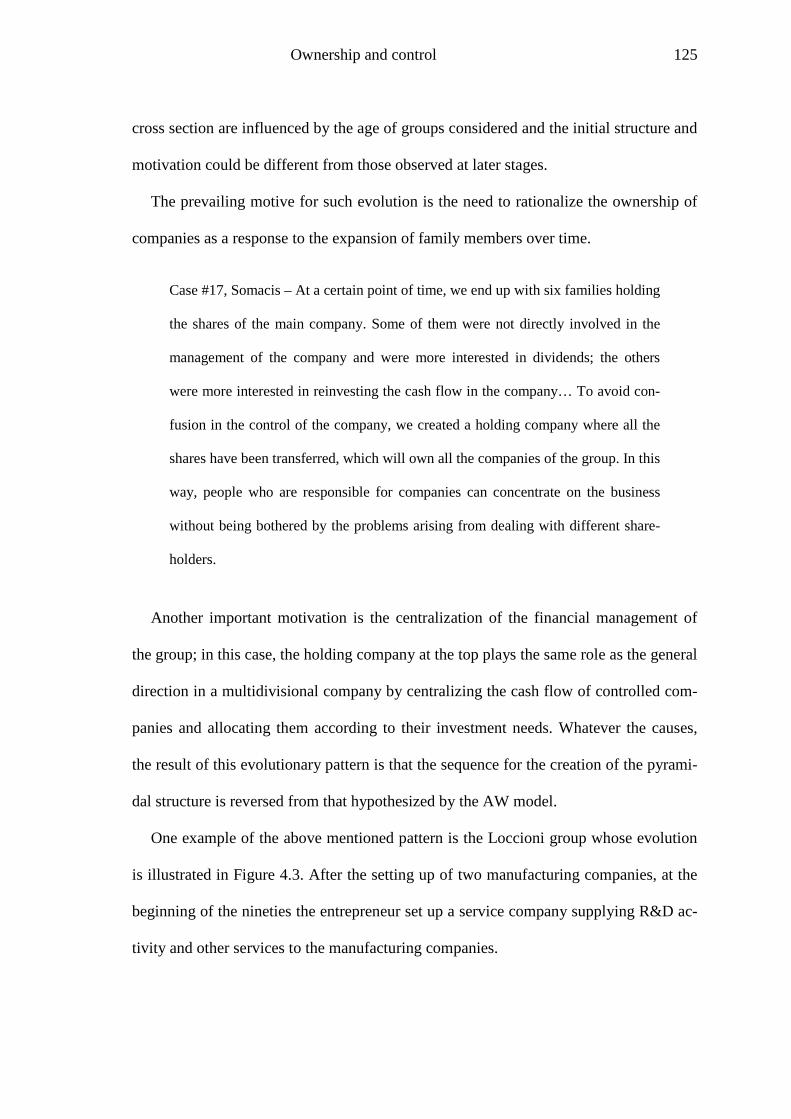
Ownership and control 125
cross section are influenced by the age of groups considered and the initial structure and
motivation could be different from those observed at later stages.
The prevailing motive for such evolution is the need to rationalize the ownership of
companies as a response to the expansion of family members over time.
Case #17, Somacis – At a certain point of time, we end up with six families holding
the shares of the main company. Some of them were not directly involved in the
management of the company and were more interested in dividends; the others
were more interested in reinvesting the cash flow in the company… To avoid con-
fusion in the control of the company, we created a holding company where all the
shares have been transferred, which will own all the companies of the group. In this
way, people who are responsible for companies can concentrate on the business
without being bothered by the problems arising from dealing with different share-
holders.
Another important motivation is the centralization of the financial management of
the group; in this case, the holding company at the top plays the same role as the general
direction in a multidivisional company by centralizing the cash flow of controlled com-
panies and allocating them according to their investment needs. Whatever the causes,
the result of this evolutionary pattern is that the sequence for the creation of the pyrami-
dal structure is reversed from that hypothesized by the AW model.
One example of the above mentioned pattern is the Loccioni group whose evolution
is illustrated in Figure 4.3. After the setting up of two manufacturing companies, at the
beginning of the nineties the entrepreneur set up a service company supplying R&D ac-
tivity and other services to the manufacturing companies.
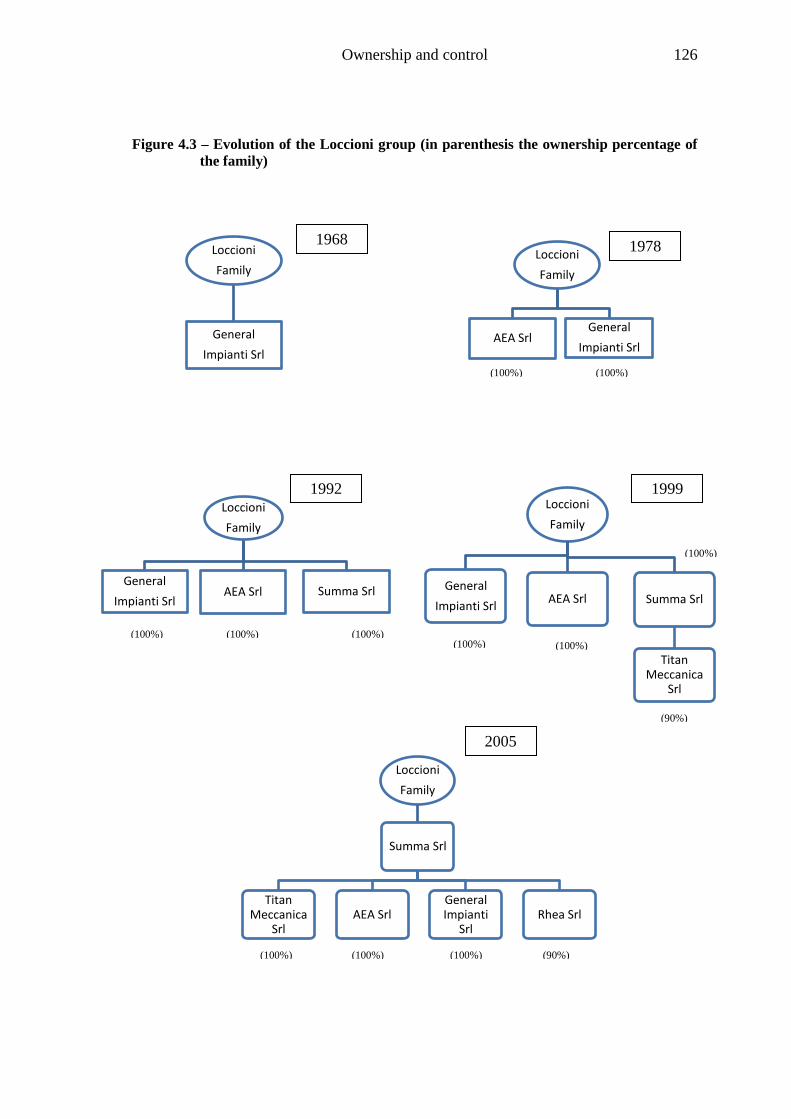
Ownership and control 126
Loccioni Family
General Impianti Srl
AEA Srl Summa Srl
Loccioni Family
General Impianti Srl AEA Srl Summa Srl
TitanMeccanica
Srl
Figure 4.3 – Evolution of the Loccioni group (in parenthesis the ownership percentage of the family)
1968 1978
1992
Loccioni Family
General Impianti Srl
Loccioni Family
General Impianti Srl
AEA Srl
1999
Loccioni Family
Summa Srl
TitanMeccanica
SrlAEA Srl
General Impianti
SrlRhea Srl
2005
(100%) (100%)
(100%) (100%)
(100%) (100%) (100%)
(90%)
(100%)
(100%)
(100%) (100%) (52.2%)
(100%)
(100%)
(100%) (100%) (100%) (90%)
Ownership and control 127
In 2006 the service company became the holding company for the group. In this case
the two main companies of the group (General Impianti and AEA) were 100% owned
by the entrepreneur and his wife. For this reason the evolution of the group was not in-
fluenced by the need to raise capital from external (to the family) shareholders. The
payoff advantage and the financing advantage were both ‘sterilized’ by the absence of
external owners. On the contrary, the last two companies (Titan Meccanica and Rhea)
were set up by one of the companies of the group (Summa) recently transformed into a
holding company.
This case illustrates a typical pattern of development of family based groups from an
informal to a pyramidal group. It also highlights another feature typical of family
groups: i.e. the high concentration of ownership in the hands of the family members.
The three main companies (General Impianti, AEA and Summa) are 100% owned by
the entrepreneur and his wife. Only the last two companies (Titan Meccanica and Rhea)
were not 100% owned when they were founded because they were set up by involving
former employees for the development of specific businesses. In the case of Titan Mec-
canica, the group later acquired the full ownership of the company.
The high level of ownership concentration helps to explain why, in the case of small
groups, the advantages of the pyramidal structure are not as relevant as supposed by the
AW model. The main explanation for the high level of ownership concentration ob-
served in small groups is the agency costs of outside equity (i.e. equity provided by
people external to the entrepreneur’s family). I examine the empirical evidence on own-
ership concentration in the next section and discuss the problems arising from the pres-
ence of agency costs of outside equity in the last section.
Ownership and control 128
4.3 Ownership concentration in business groups
Because the AW model does not rely on the traditional argument of separating cash-
flow rights from control rights, it accounts for situations characterized by a high con-
centration of ownership of controlled firms.
Although pyramidal firms are associated with lower ultimate ownership compared
to firms controlled directly by the family, our model does not necessarily require
(as the traditional argument does) that the ultimate ownership concentration in a
pyramidal firm be small in an absolute sense. (Almeida and Wolfenzon, 2006 p.
2641)
As is clear from the latter statement, the AW model makes two predictions; a) own-
ership concentration is not necessarily low in pyramidal firms (as is supposed by the
equity leverage hypothesis); b) families are expected to hold smaller ownership stakes
in firms which they control through pyramids, relative to firms they own directly. These
predictions about ownership concentration can be tested in the Italian case using the
ISTAT and the Capitalia data sets; in fact, these data sets contain information on the
percentage of company equity owned by the ultimate owner. According to the ISTAT
data set, the average share of the ultimate owner in controlled companies is 81.3%; in
20% of cases companies are 100% controlled by the vertex and in more than one third
of cases the vertex owns at least 95% of shares. Besides the modal value of 100%, the
distribution of shares shows the presence of other noticeable values: 80%, 70%, 60%,
51% and 55% (see Table 4.5).
The share of ownership of controlled companies is rather high, and generally much
larger that what is needed to secure the control of companies; this is in accordance with
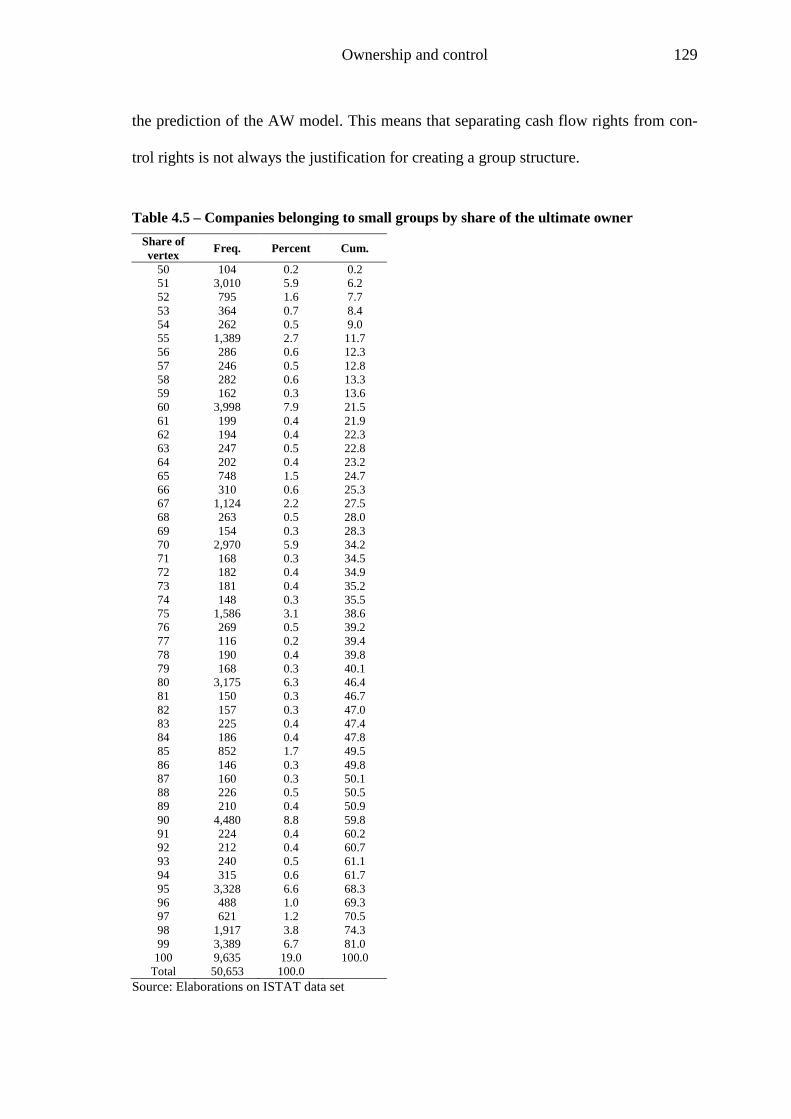
Ownership and control 129
the prediction of the AW model. This means that separating cash flow rights from con-
trol rights is not always the justification for creating a group structure.
Table 4.5 – Companies belonging to small groups by share of the ultimate owner Share of vertex Freq. Percent Cum.
50 104 0.2 0.2 51 3,010 5.9 6.2 52 795 1.6 7.7 53 364 0.7 8.4 54 262 0.5 9.0 55 1,389 2.7 11.7 56 286 0.6 12.3 57 246 0.5 12.8 58 282 0.6 13.3 59 162 0.3 13.6 60 3,998 7.9 21.5 61 199 0.4 21.9 62 194 0.4 22.3 63 247 0.5 22.8 64 202 0.4 23.2 65 748 1.5 24.7 66 310 0.6 25.3 67 1,124 2.2 27.5 68 263 0.5 28.0 69 154 0.3 28.3 70 2,970 5.9 34.2 71 168 0.3 34.5 72 182 0.4 34.9 73 181 0.4 35.2 74 148 0.3 35.5 75 1,586 3.1 38.6 76 269 0.5 39.2 77 116 0.2 39.4 78 190 0.4 39.8 79 168 0.3 40.1 80 3,175 6.3 46.4 81 150 0.3 46.7 82 157 0.3 47.0 83 225 0.4 47.4 84 186 0.4 47.8 85 852 1.7 49.5 86 146 0.3 49.8 87 160 0.3 50.1 88 226 0.5 50.5 89 210 0.4 50.9 90 4,480 8.8 59.8 91 224 0.4 60.2 92 212 0.4 60.7 93 240 0.5 61.1 94 315 0.6 61.7 95 3,328 6.6 68.3 96 488 1.0 69.3 97 621 1.2 70.5 98 1,917 3.8 74.3 99 3,389 6.7 81.0
100 9,635 19.0 100.0 Total 50,653 100.0
Source: Elaborations on ISTAT data set
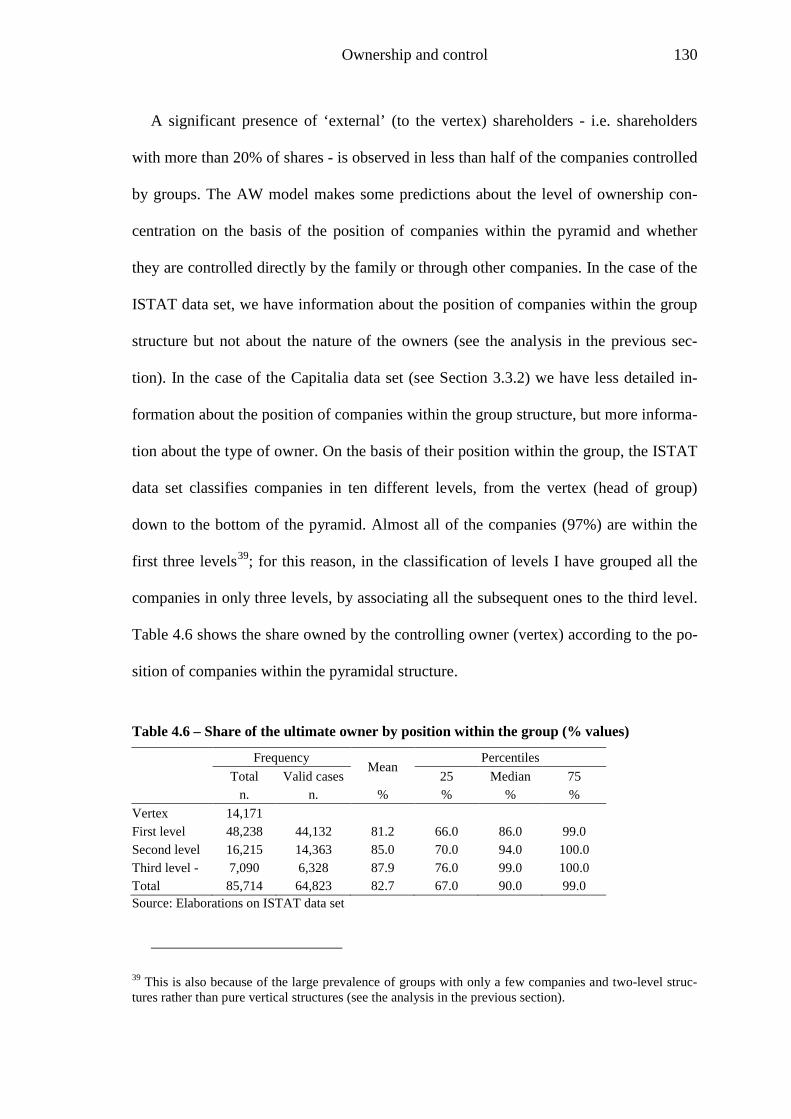
Ownership and control 130
A significant presence of ‘external’ (to the vertex) shareholders - i.e. shareholders
with more than 20% of shares - is observed in less than half of the companies controlled
by groups. The AW model makes some predictions about the level of ownership con-
centration on the basis of the position of companies within the pyramid and whether
they are controlled directly by the family or through other companies. In the case of the
ISTAT data set, we have information about the position of companies within the group
structure but not about the nature of the owners (see the analysis in the previous sec-
tion). In the case of the Capitalia data set (see Section 3.3.2) we have less detailed in-
formation about the position of companies within the group structure, but more informa-
tion about the type of owner. On the basis of their position within the group, the ISTAT
data set classifies companies in ten different levels, from the vertex (head of group)
down to the bottom of the pyramid. Almost all of the companies (97%) are within the
first three levels39
Table 4.6
; for this reason, in the classification of levels I have grouped all the
companies in only three levels, by associating all the subsequent ones to the third level.
shows the share owned by the controlling owner (vertex) according to the po-
sition of companies within the pyramidal structure.
Table 4.6 – Share of the ultimate owner by position within the group (% values)
Frequency Mean
Percentiles Total Valid cases 25 Median 75
n. n. % % % % Vertex 14,171 First level 48,238 44,132 81.2 66.0 86.0 99.0 Second level 16,215 14,363 85.0 70.0 94.0 100.0 Third level - 7,090 6,328 87.9 76.0 99.0 100.0 Total 85,714 64,823 82.7 67.0 90.0 99.0 Source: Elaborations on ISTAT data set
39 This is also because of the large prevalence of groups with only a few companies and two-level struc-tures rather than pure vertical structures (see the analysis in the previous section).
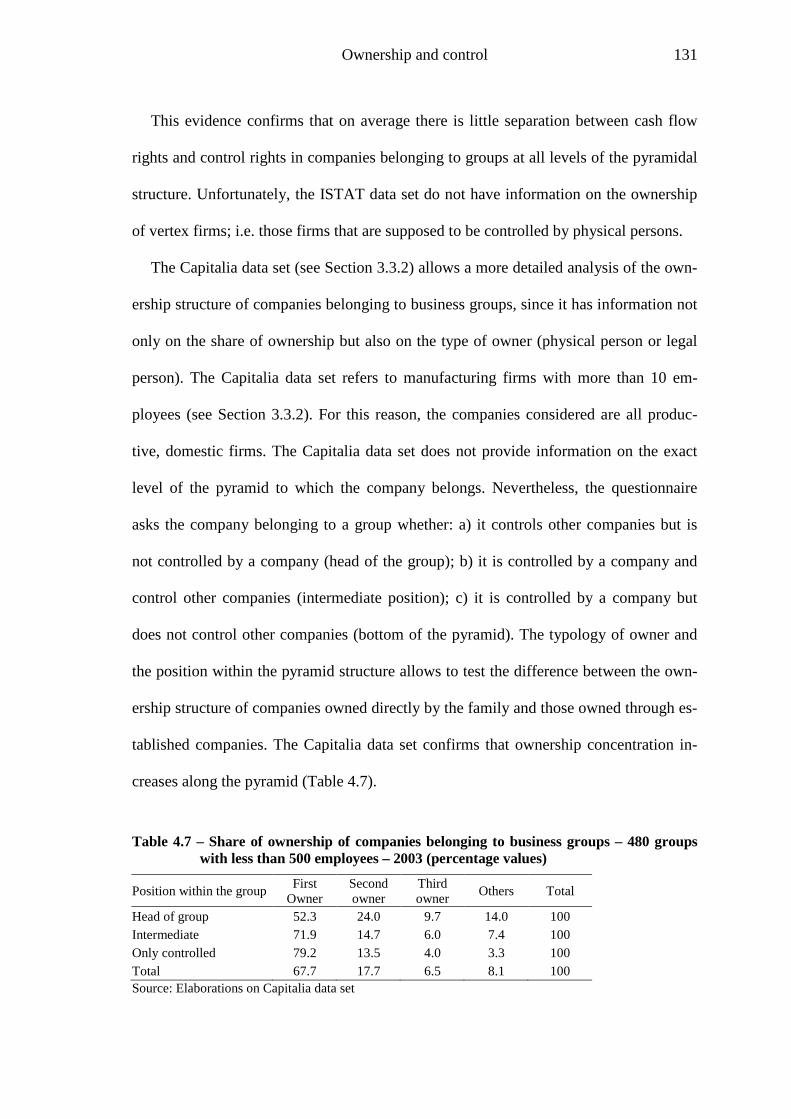
Ownership and control 131
This evidence confirms that on average there is little separation between cash flow
rights and control rights in companies belonging to groups at all levels of the pyramidal
structure. Unfortunately, the ISTAT data set do not have information on the ownership
of vertex firms; i.e. those firms that are supposed to be controlled by physical persons.
The Capitalia data set (see Section 3.3.2) allows a more detailed analysis of the own-
ership structure of companies belonging to business groups, since it has information not
only on the share of ownership but also on the type of owner (physical person or legal
person). The Capitalia data set refers to manufacturing firms with more than 10 em-
ployees (see Section 3.3.2). For this reason, the companies considered are all produc-
tive, domestic firms. The Capitalia data set does not provide information on the exact
level of the pyramid to which the company belongs. Nevertheless, the questionnaire
asks the company belonging to a group whether: a) it controls other companies but is
not controlled by a company (head of the group); b) it is controlled by a company and
control other companies (intermediate position); c) it is controlled by a company but
does not control other companies (bottom of the pyramid). The typology of owner and
the position within the pyramid structure allows to test the difference between the own-
ership structure of companies owned directly by the family and those owned through es-
tablished companies. The Capitalia data set confirms that ownership concentration in-
creases along the pyramid (Table 4.7).
Table 4.7 – Share of ownership of companies belonging to business groups – 480 groups with less than 500 employees – 2003 (percentage values)
Position within the group First Owner
Second owner
Third owner Others Total
Head of group 52.3 24.0 9.7 14.0 100 Intermediate 71.9 14.7 6.0 7.4 100 Only controlled 79.2 13.5 4.0 3.3 100 Total 67.7 17.7 6.5 8.1 100 Source: Elaborations on Capitalia data set
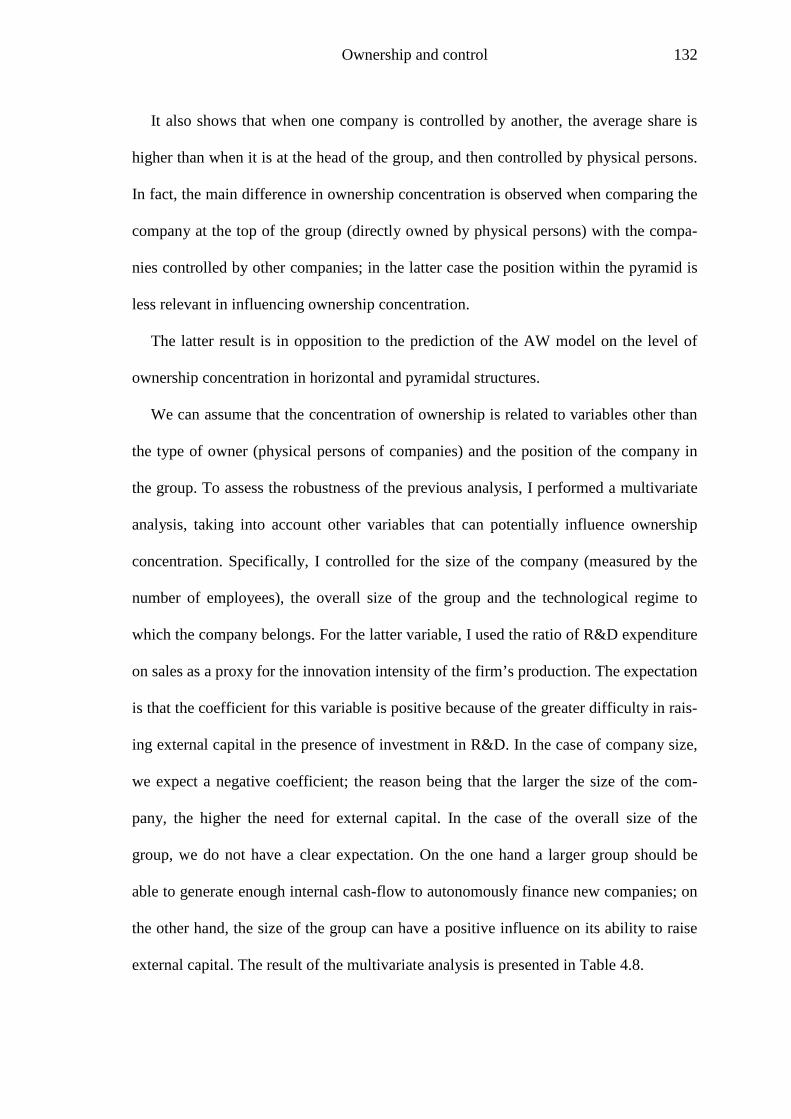
Ownership and control 132
It also shows that when one company is controlled by another, the average share is
higher than when it is at the head of the group, and then controlled by physical persons.
In fact, the main difference in ownership concentration is observed when comparing the
company at the top of the group (directly owned by physical persons) with the compa-
nies controlled by other companies; in the latter case the position within the pyramid is
less relevant in influencing ownership concentration.
The latter result is in opposition to the prediction of the AW model on the level of
ownership concentration in horizontal and pyramidal structures.
We can assume that the concentration of ownership is related to variables other than
the type of owner (physical persons of companies) and the position of the company in
the group. To assess the robustness of the previous analysis, I performed a multivariate
analysis, taking into account other variables that can potentially influence ownership
concentration. Specifically, I controlled for the size of the company (measured by the
number of employees), the overall size of the group and the technological regime to
which the company belongs. For the latter variable, I used the ratio of R&D expenditure
on sales as a proxy for the innovation intensity of the firm’s production. The expectation
is that the coefficient for this variable is positive because of the greater difficulty in rais-
ing external capital in the presence of investment in R&D. In the case of company size,
we expect a negative coefficient; the reason being that the larger the size of the com-
pany, the higher the need for external capital. In the case of the overall size of the
group, we do not have a clear expectation. On the one hand a larger group should be
able to generate enough internal cash-flow to autonomously finance new companies; on
the other hand, the size of the group can have a positive influence on its ability to raise
external capital. The result of the multivariate analysis is presented in Table 4.8.

Ownership and control 133
Table 4.8 – Share of the first owner in companies belonging to groups (t test in parenthe-sis)
OLS Coefficientsa
1 2 3 4 5
The first owner is a person -28.74** (-12.07)
-22.06** (-7.20)
-21.08** (-6.80)
-21.30** (-6.88)
-21.67** (-7.01)
The company is controlled by another company
13.20** (4.21)
14.87** (4.62)
15.56** (4.70)
15.79** (4.78)
Size of the company (ln of company employees)
2.18* (2.18)
4.54* (2.49)
4.58* (2.52)
Size of the group (ln of group employees)
-2.70 (-1.33)
-2.89 (-1.42)
Technology intensity of production (R&D on sales) 61.14
(1.65)
Number of observations 462 462 462 462 462 F 145.6 96.4 67.5 52.6 44.1 R2 0.24 0.28 0.29 0.29 0.30
a. Robust coefficients; the regression also includes a constant term. Legend: ** significant at 1%; * significant at 5%. Elaborations on Capitalia data set.
The multivariate estimates confirm the robustness of previous results even when con-
trolling for the influence of other variables: the share of the first (controlling) owner is
higher when a company is controlled by another company than when it is controlled by
physical persons40
40 As the estimates are based on cross section data, it must be assumed that the intention was to capture associations between variables rather than causal relations.
. The ‘financing advantage’, i.e. the use of cash flow from established
firms appears to be a more important reason for creating a pyramid than the need to
change the ownership structure and raise external (to the controlling family) capital. The
technological intensity of production shows the expected sign but is not statistically sig-
nificant; this is probably due to measurement problems. Contrary to expectations, the
coefficient of the size of the company shows a positive sign, but is significant only at
5%. The coefficient of the size of the group has a negative sign but it is not statistically
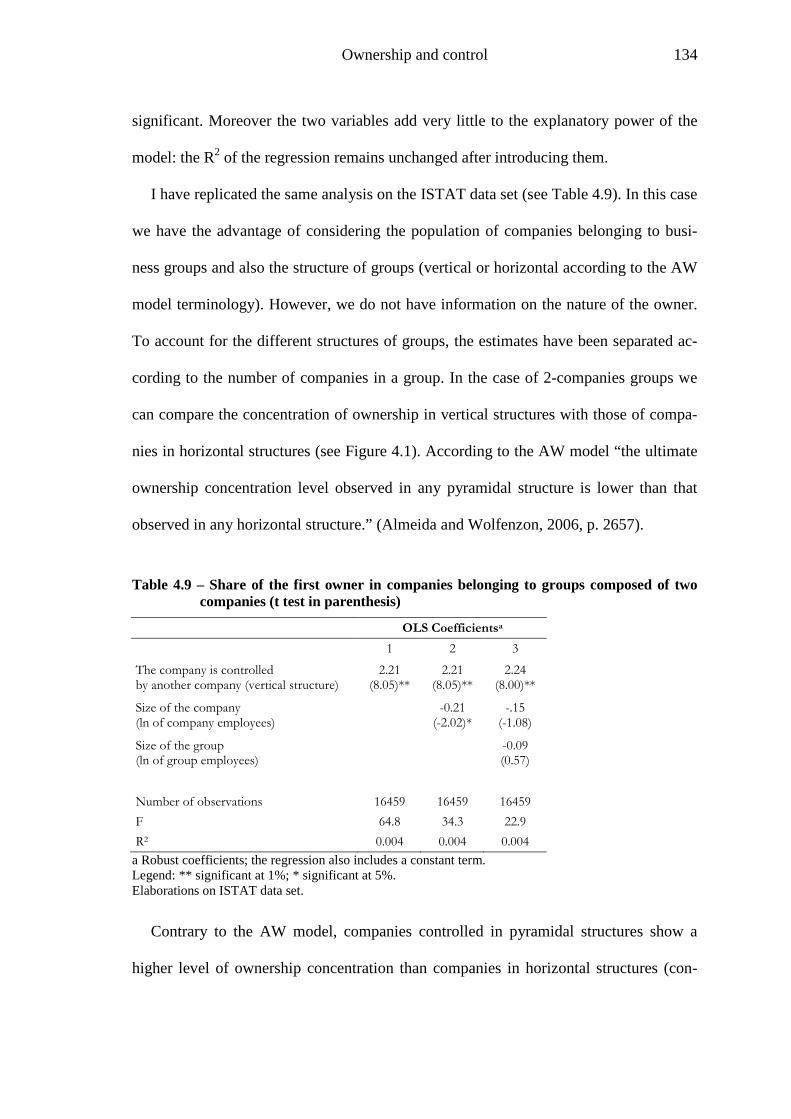
Ownership and control 134
significant. Moreover the two variables add very little to the explanatory power of the
model: the R2 of the regression remains unchanged after introducing them.
I have replicated the same analysis on the ISTAT data set (see Table 4.9). In this case
we have the advantage of considering the population of companies belonging to busi-
ness groups and also the structure of groups (vertical or horizontal according to the AW
model terminology). However, we do not have information on the nature of the owner.
To account for the different structures of groups, the estimates have been separated ac-
cording to the number of companies in a group. In the case of 2-companies groups we
can compare the concentration of ownership in vertical structures with those of compa-
nies in horizontal structures (see Figure 4.1). According to the AW model “the ultimate
ownership concentration level observed in any pyramidal structure is lower than that
observed in any horizontal structure.” (Almeida and Wolfenzon, 2006, p. 2657).
Table 4.9 – Share of the first owner in companies belonging to groups composed of two companies (t test in parenthesis)
OLS Coefficientsa
1 2 3
The company is controlled by another company (vertical structure)
2.21 (8.05)**
2.21 (8.05)**
2.24 (8.00)**
Size of the company (ln of company employees)
-0.21 (-2.02)*
-.15 (-1.08)
Size of the group (ln of group employees)
-0.09 (0.57)
Number of observations 16459 16459 16459 F 64.8 34.3 22.9 R2 0.004 0.004 0.004
a Robust coefficients; the regression also includes a constant term. Legend: ** significant at 1%; * significant at 5%. Elaborations on ISTAT data set.
Contrary to the AW model, companies controlled in pyramidal structures show a
higher level of ownership concentration than companies in horizontal structures (con-
Ownership and control 135
trolled directly by the vertex). The coefficient of the variable is robust to different speci-
fications. In the case of the size of the company the coefficient has the expected sign
(negative); However its statistical significance is at 5% and the sign is not robust to dif-
ferent specifications. The introduction of the size of the group makes the coefficient un-
stable, also because of multicollinearity problems41
Table 4.10
. These results are confirmed also in
the case of groups composed of three companies ( ).
Companies controlled through vertical structures (Figure 4.2) show a higher level of
ownership concentration (share of the vertex) than companies in horizontal structures.
The size of the company shows the expected (negative) size, although it does not seems
robust to different specifications of the model.
Table 4.10 – Share of the first owner in companies belonging to groups composed of three companies (t test in parenthesis)
OLS Coefficientsa
1 2 3
The company is controlled by another company (vertical structure)
2.14 (5.51)**
2.13 (5.50)**
2.06 (8.00)**
Size of the company (ln of company employees)
0.07 (0.57)
-0.46 (-2.92)**
Size of the group (ln of group employees)
1.01 (5.58)**
Number of observations 9570 9570 9570 F 30.4 15.39 20.78 R2 0.003 0.003 0.006
a Robust coefficients; the regression also includes a constant term. Legend: ** significant at 1%; * significant at 5%. Elaborations on ISTAT data set.
The size of the group shows a positive association with ownership concentration.
This is contrary to the hypothesis that the size of the group could facilitate the raising of
41 Because we are dealing with groups with only two companies, there is a strong relationship between the size of a company and the size of the group to which the company belongs.
Ownership and control 136
external capital by its member companies. It gives support to concept of the role of the
group as an internal capital market with the head of the group pooling financial re-
sources which are then invested in the controlled companies.
4.4 Agency problems in family-owned groups
The empirical results obtained in the previous sections on the prevailing structures of
groups and the ownership concentration of member companies allow us to critically
discuss some of the conclusions of the AW model and propose a different explanation
for the observed patterns of ownership structure in family-owned groups. As predicted
by the AW model, vertical structures (pyramids) prevail over horizontal structures; this
is true in general and also in the case of small groups. This evidence confirms that when
entering a new business portfolio entrepreneurs tend to use the cash flow generated by
the business(es) already established; in the AW model this is called ‘financing advan-
tage’.
If the established business is 100% owned by the entrepreneur (or members of
his/her family) whether the new business is owned directly by the family or through a
company already established is irrelevant; the entrepreneur can use the cash flow from
the established business to pay the dividends and invest them in the new business; or
s/he can use the cash flow of the established company directly to acquire shares in the
new business42
42 Though the two situations are indifferent in terms of cash flow, they can be different in terms of tax, depending on the fiscal position of the owners.
. However, things are different if there are other owners in the estab-
lished company; in this case, these two possibilities are relevant for the entrepreneur be-
cause he/she receives as dividends only part of the cash flow generated by the estab-
Ownership and control 137
lished company. As owner-manager he/she could use the entire cash flow accumulated
in the established company to set up the new businesses. This is one of the main agency
problems between minority and controlling shareholders in family owned companies;
the owner-manager can decide to pay less dividends and use the accumulated cash flow
to finance new businesses (or use it for perks). The minority shareholders might be
more interested in receiving dividends than leaving the cash flow in the company.
Whatever the ownership structure of the established company, the ‘financing advan-
tage’ hypothesis is not a sufficient condition for justifying the setting-up of an inde-
pendent legal unit. In fact, the same strategy (i.e. using the accumulated cash flow) can
also be implemented by developing the new business within the legal boundary of the
established company. If a new company is set-up, this is done for other reasons which
must be one (or both) of the following: i) to separate the risks between the established
business and the new one, and ii) to modify the ownership structure of the new business
and raise outside equity, i.e. equity capital provided by subjects other than the entrepre-
neur and his/her family members.
The financial explanation stresses the importance of the latter reason - i.e. the raising
of outside equity – to justify the creation of a pyramid; in fact, the AW model predicts
that the share of the controlling family is higher in horizontal structures (those in which
companies are directly owned by the family) than in vertical (pyramidal) ones (those in
which companies are owned by established companies). This prediction is not con-
firmed by the empirical evidence; ownership concentration is higher in companies
owned through pyramidal structures than in companies directly owned by physical per-
sons. This is due to the fact that the AW model relies only on financial motives while no
importance is given to the identity of outside shareholders and to the motivations for
Ownership and control 138
acquiring shares in the new business; in fact, it is hypothesized that these motivations
are purely financial (i.e. the expected return on invested capital).
In extending the financial explanation from large groups and listed companies to pri-
vately owned companies, the AW model underestimates the agency costs of outside eq-
uity in privately-owned companies. As clearly stated by Myers (2000, p. 1005) “Ap-
plied corporate finance accepts outside equity as a fact of life but does not really explain
how managers’ and stockholders’ interests becomes sufficiently aligned”. In our case
the interests to be aligned are those of the controlling entrepreneur and the minority in-
vestors in controlled companies. In business groups the agency costs are due to two dif-
ferent causes: a) on the one hand, there is a conflict of interest between minority owners
and the owner-manager (Schulze et al., 2001); b) on the other hand, the controlling
owners can divert resources from the companies of the group in which they have a lar-
ger share to the detriment of companies in which they have a lower share (Morck and
Yeung, 2003).
The first authors that have given adequate importance to agency costs in explaining
the ownership structure of firms are Jensen and Meckling (1976). Agency costs are the
result of costs incurred by a firm in terms of lower performance because of its unwill-
ingness or inability to deal with agency problems, and because of costs incurred through
for incentives and monitoring activity to deal with information asymmetries and to align
the interests of an agent with the interests of a principal43
2.3.3
. Compared with the abundant
literature about agency costs in publicly held firms – as a result of the separation be-
tween ownership and control – there is very little work on the agency costs in privately
held firms both at a theoretical and at an empirical level (see Section ).
43 For an in-depth discussion about the nature and origin of these costs, see also Milgrom and Roberts (1992, pp. 491-505 ).
Ownership and control 139
In their seminal work, Jensen and Meckling (1976) model the choice faced by the
‘owner-manager’ of a closely held company (the entrepreneur in our case) when he/she
need to raise additional capital to finance a new business. They identify three possibili-
ties: a) inside equity (equity capital provided by the entrepreneur); b) outside equity
(equity capital provided by external investors); c) debt. Apart from ‘inside equity’ (i.e.
the cash flow accumulated in the established business) the other two forms present
agency costs. Given agency costs, entrepreneurs will consider the raising of external
capital only in cases where investment in the new business opportunity exceeds the fi-
nances available to the entrepreneur or the cash flow available from the established
business.
Given the amount of external resources which the entrepreneur needs to raise, Jensen
and Meckling (1976) model the choice between equity and debt in the following way.
Given:
B = debt;
C0 = outside equity;
E = B + C0 = total amount of external capital;
q = C0 / (B + C0)= share of equity capital on total ( 0 1≤ ≤q );
A qB ( ) = agency costs of debt;
A qc ( ) = agency costs of outside equity;
A q A q A qT C B( ) ( ) ( )= + = total agency costs;
Agency costs are represented as a function of q. Given the amount of external fi-
nance needed by the entrepreneur, he/she will choose the combination of debt and eq-
uity that minimizes the agency costs of external financing (see Figure 4.4). According to
this representation of agency costs, A qB ( ) is decreasing in q, while A qC ( ) is increasing
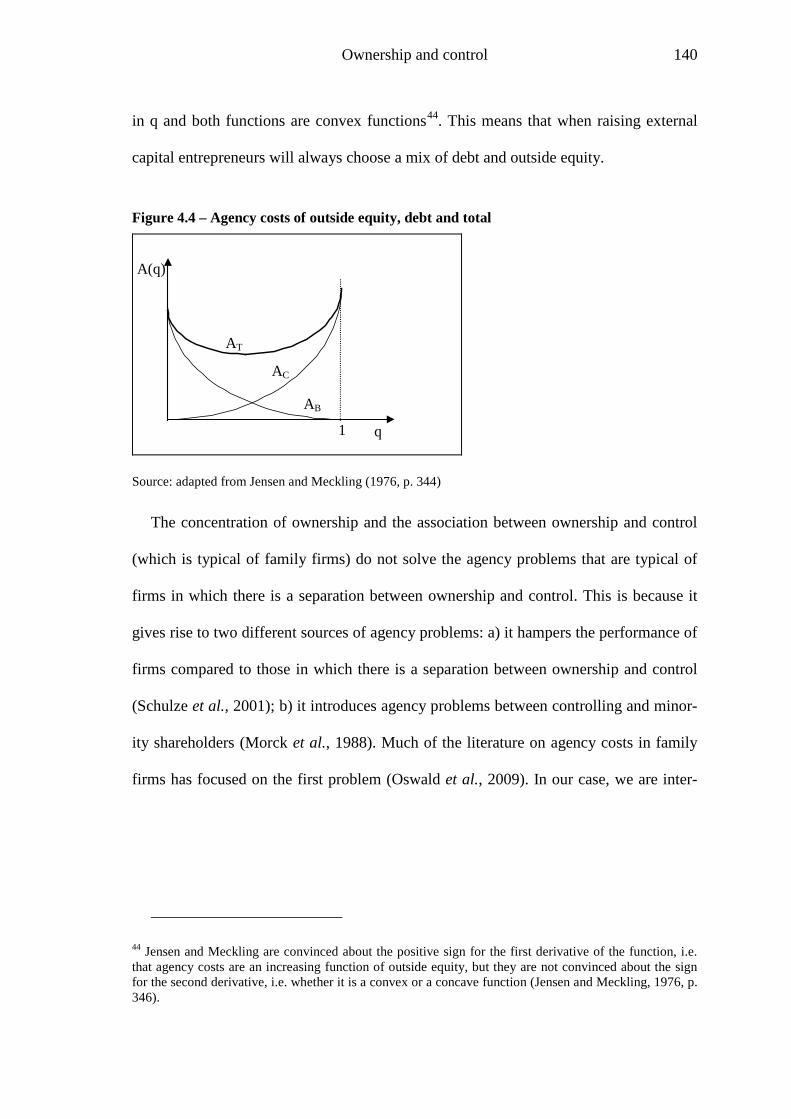
Ownership and control 140
in q and both functions are convex functions44
Figure 4.4 – Agency costs of outside equity, debt and total
. This means that when raising external
capital entrepreneurs will always choose a mix of debt and outside equity.
AB
AC
q
A(q)
1
AT
Source: adapted from Jensen and Meckling (1976, p. 344)
The concentration of ownership and the association between ownership and control
(which is typical of family firms) do not solve the agency problems that are typical of
firms in which there is a separation between ownership and control. This is because it
gives rise to two different sources of agency problems: a) it hampers the performance of
firms compared to those in which there is a separation between ownership and control
(Schulze et al., 2001); b) it introduces agency problems between controlling and minor-
ity shareholders (Morck et al., 1988). Much of the literature on agency costs in family
firms has focused on the first problem (Oswald et al., 2009). In our case, we are inter-
44 Jensen and Meckling are convinced about the positive sign for the first derivative of the function, i.e. that agency costs are an increasing function of outside equity, but they are not convinced about the sign for the second derivative, i.e. whether it is a convex or a concave function (Jensen and Meckling, 1976, p. 346).
Ownership and control 141
ested in the second type of problem; i.e. the possible conflicts and agency costs between
controlling shareholders and minority shareholders45
Agency costs of outside equity depend primarily on the possibility for the owner-
manager, thanks to his/her control position, to appropriate pecuniary and non-pecuniary
benefits to the detriment of the value maximization of the company. The likelihood of
this private appropriation is supposed to increase with the share of outside shareholders;
in fact, the owner-manager gets all the benefits while sustaining its cost only as a pro-
portion of his/her share. This is anticipated by outside equity providers who, after pro-
viding the capital, then spend resources on monitoring the owner-manager: participating
in board meetings, demanding financial and business reporting, evaluating business de-
cisions, etc. Such monitoring activity may well be considered an impediment to the
freedom and speed of decision-making on the part of the entrepreneur; not only may
this reduce the possibility for him/her to privately appropriate resources, it can also limit
the chances of success for the new business.
.
When comparing the agency costs between publicly traded and closely held compa-
nies, it must taken into account that in the latter case the main problem for minority
shareholders is the reduced possibility of liquidating the investment in the case of con-
flicts with controlling shareholders (even if they simply want to change their investment
position). There is no a market valuation of the shares and difficulty in finding a buyer
can significantly open the gap between the perceived value of the shares and the price at
45 The latter problems are linked to the former. If a family-controlled company hampers its performance by providing excessively for the welfare of the family (for example assuring above market salaries to its members) this will not reduce the overall welfare of the family but will have an impact on minority shareholders.
Ownership and control 142
which they can be sold. Buying a minority share in a closely held company can result in
being ‘trapped’ in case of divergent interests with the controlling owner46
It must also be considered that closely held firms are not subject to the controls and
regulations of publicly held firms, thus raising the costs of monitoring activity. Given
the costs for collecting and analyzing information on the performance and the prospects
of a company, in the case of publicly traded firms, these costs can be shared by a large
number of actual and potential investors. In the case of closely held firms, the same
costs are to be sustained only by one or more investors
.
47
Agency costs of minority shares in privately held (or family owned) companies are
much higher than those of publicly traded firms; so much so that it is very difficult for
entrepreneurs to raise outside equity to finance new businesses
.
48
Apart from the level of agency costs of minority shares in family owned groups, the
behaviour of these costs as a function of the amount of capital raised differs from that
hypothesized by Jensen and Meckling (1976), as depicted in
. This is even more the
case for a new business started by an established entrepreneur. The possible reputation
that he/she has acquired in the previous start up is counterbalanced by the additional
agency costs observed in business groups, due to possible diverting of resources be-
tween the companies of the group.
Figure 4.4. To demonstrate
why this is so, we must analyze in detail the sources of agency costs and how they are
related to the amount of outside equity.
46 For this reason private equity operations and venture capital operations require detailed contracts which specify the circumstances in which investors will liquidate their shares. 47 This greatly reduces the incentive to collect and provide information for closely held companies. 48 The difficulties in raising equity capital due to asymmetry of information and agency costs has been discussed and empirically verified by the abundant literature on the ‘finance gap’. For a review of the main arguments and conclusions see (Storey, 1994).
Ownership and control 143
The major sources of agency costs are determined by the need to reduce the asymme-
try of information and the moral hazards between controlling owners and minority
shareholders. They are the result of the ex-ante evaluation of the business in order to de-
termine its prospects and risks and also the ex-post monitoring activity. The latter activ-
ity can consist of direct participation on the board of directors, external auditing or the
implementation of formal control systems.
The amount of outside equity and the corresponding share in the business increases
the incentive of minority shareholders to spend resources for evaluation and monitoring
activities. This does not necessarily raise its costs; in fact, for the most part they are
fixed with respect to the amount of equity and the share of ownership49. Also in the case
of the bonding costs sustained by the owner-manager – such as the limitations in the
speed and flexibility of the decision process - they are for the most part fixed with re-
spect to the share of minority shareholders50
Therefore, if agency costs of outside equity are for the most part fixed and only
slightly dependent on its amount, the function
.
)( oC CA is a convex rather than a concave
function and presents a point of discontinuity in q=0, being 0)0( =CA and
CoCCACA
o
=→
)(lim0 where 𝐴𝐴𝐶𝐶���� represents the fixed part of the agency costs. As a result, the
behaviour of )( oC CA is better described by the line in Figure 4.5. This means that the
49 The misalignment of incentives between the owner-manager and outside investors (and consequently the need for monitoring activity) can be minimized through the use of ex-ante shareholder agreements (Chemla et al., 2007). These agreements are common in situations where only some shareholders are in-volved in managing the company, such as joint ventures, venture capital baked companies, etc. Also in this case, the costs of collecting information and drawing up these agreements are fixed and do not de-pend on the share of outside equity. 50 Myers (2000) assumes that the incentive for managers to privately appropriate perks does not depend on the share of outside equity but only on its presence. If this is the case, the incentive for external inves-tors to invest in monitoring activity also would not depend on their share of equity.
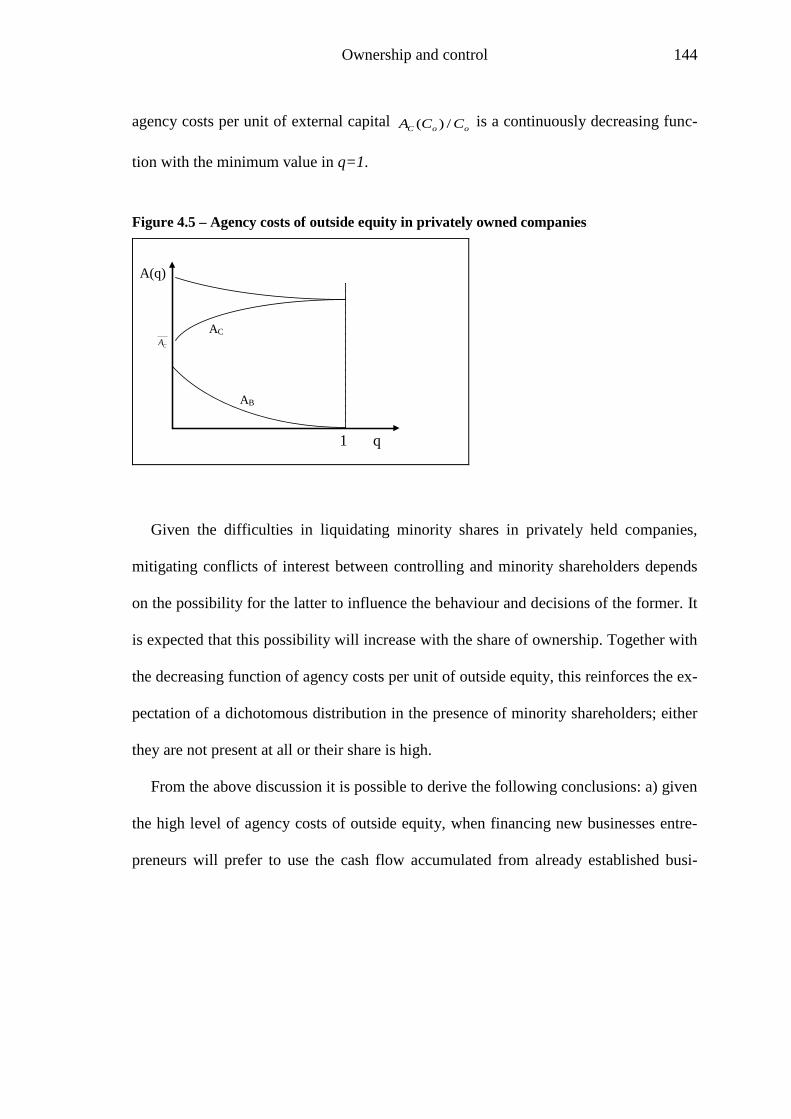
Ownership and control 144
agency costs per unit of external capital ooC CCA /)( is a continuously decreasing func-
tion with the minimum value in q=1.
Figure 4.5 – Agency costs of outside equity in privately owned companies
q
A(q)
CA
1
AC
AB
Given the difficulties in liquidating minority shares in privately held companies,
mitigating conflicts of interest between controlling and minority shareholders depends
on the possibility for the latter to influence the behaviour and decisions of the former. It
is expected that this possibility will increase with the share of ownership. Together with
the decreasing function of agency costs per unit of outside equity, this reinforces the ex-
pectation of a dichotomous distribution in the presence of minority shareholders; either
they are not present at all or their share is high.
From the above discussion it is possible to derive the following conclusions: a) given
the high level of agency costs of outside equity, when financing new businesses entre-
preneurs will prefer to use the cash flow accumulated from already established busi-
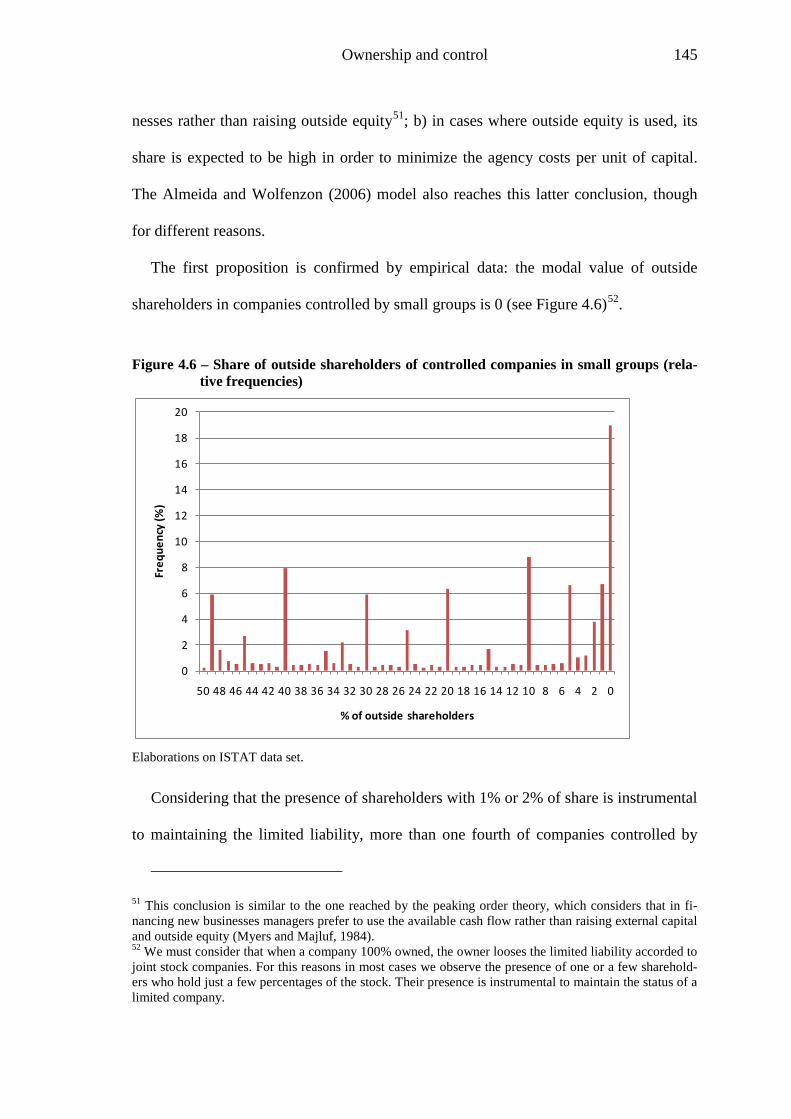
Ownership and control 145
nesses rather than raising outside equity51
The first proposition is confirmed by empirical data: the modal value of outside
shareholders in companies controlled by small groups is 0 (see
; b) in cases where outside equity is used, its
share is expected to be high in order to minimize the agency costs per unit of capital.
The Almeida and Wolfenzon (2006) model also reaches this latter conclusion, though
for different reasons.
Figure 4.6)52
Figure 4.6 – Share of outside shareholders of controlled companies in small groups (rela-tive frequencies)
.
Elaborations on ISTAT data set.
Considering that the presence of shareholders with 1% or 2% of share is instrumental
to maintaining the limited liability, more than one fourth of companies controlled by
51 This conclusion is similar to the one reached by the peaking order theory, which considers that in fi-nancing new businesses managers prefer to use the available cash flow rather than raising external capital and outside equity (Myers and Majluf, 1984). 52 We must consider that when a company 100% owned, the owner looses the limited liability accorded to joint stock companies. For this reasons in most cases we observe the presence of one or a few sharehold-ers who hold just a few percentages of the stock. Their presence is instrumental to maintain the status of a limited company.
0
2
4
6
8
10
12
14
16
18
20
50 48 46 44 42 40 38 36 34 32 30 28 26 24 22 20 18 16 14 12 10 8 6 4 2 0
Freq
uenc
y (%
)
% of outside shareholders
Ownership and control 146
small groups do not have outside shareholders. What is not confirmed by the data is the
expected dichotomous distribution in the presence of outside shareholders; in fact, mo-
dal values are evenly distributed between 49% and 10%. This means that there are other
mechanisms at work that allow for the presence of low shares of outside equity even if
the agency costs per unit of capital raised is expected to be very high.
The empirical evidence on the share of minority shareholders in companies con-
trolled by groups hardly reconciles with agency theory, unless we are able to identify
the presence of mechanisms able to mitigate the conflict of interest between minority
and controlling shareholders, thus reducing the agency costs of outside equity. The in-
terviews with entrepreneurs help to solve this apparent contradiction and identify the
mechanisms at work. In fact, by examining the people involved in the ownership of
companies subsequently started by portfolio entrepreneurs, it emerged that the presence
of minority shareholders was never justified for purely financial reasons (i.e. return on
capital) because the people that supplied equity capital were directly involved in the
management of the company.
Though this would not completely eliminate potential conflicts of interest with the
controlling shareholders, direct involvement in the management of the company elimi-
nates the asymmetry of information between the two categories of shareholders and sig-
nificantly raises the contractual power of minority shareholders. In some ways they be-
come ‘insiders’.
The involvement of minority shareholders in the management of the company cannot
be explained by attempts to reduce agency costs. In fact, in these cases the causal rela-
tionship hypothesized by agency theory is reversed. It is not because of the need to raise
external capital that other people are involved in the ownership and control of new
Ownership and control 147
companies; on the contrary, minority shares are given as an incentive to external sub-
jects in order to secure their involvement in the start-up of the new business. This ex-
plains why in so many cases the minority shares in controlled companies are quite low
(10 to 20%).
If the main reason for setting up a new company and altering its ownership structure
is not that of raising additional capital, but to involve other people in the management of
the new business, several questions remain:
a) why do entrepreneurs need to involve other people when starting a new business
and what are their specific roles;
b) why are people given minority shares in the new business to perform such role
rather than using alternative contractual arrangements.
These questions will be analysed in depth in chapter 6.
Diversification 148
Chapter 5 - Diversification strategies and business groups formation
The organizational perspective on business groups emphasises the role of such struc-
tures in developing and managing diversified activities (Chandler, 1982a). This hy-
pothesis has been advanced and verified using data on large groups with only limited
attention paid to SMEs (Rosa and Scott, 1999a). Nevertheless, it remains one of the
most widespread hypotheses on the nature of business groups.
“Although their [of business groups] exact features differ from country to country
because of distinct economic, social, and cultural environments, they also have im-
portant similarities. Most notably, business groups pursue unrelated product diver-
sification under centralized control” (Chang, 2006b, p. 407, italics added)
Throughout this chapter I will refer to this hypothesis as the ‘diversification hypothe-
sis’. The aim of this chapter is to explore to what extent this perspective is able to ex-
plain the phenomenon of business groups in the small business sector.
The idea of the business group as an organizational structure mimicking the M-form
(multidivisional structure) in order to manage a diversified portfolio of businesses is
broadly confirmed by the evidence discussed in the previous chapter: indeed, the pre-
vailing structure of groups is that of one company at the top which controls several oth-
ers (see Section 4.2). Following the classification proposed by Almeida and Wolfenzon
(2006) I considered these as ‘vertical structures’ because companies are not controlled
Diversification 149
directly by the family. However, it is the ‘horizontal’ form that is prevalent in such
groups, with companies playing the same role as the divisions in a multidivisional com-
pany.
Although the ‘diversification hypothesis’ seems at first glance more congruent with
the empirical evidence than the ‘financial hypothesis’ (particularly the ‘equity leverage’
hypothesis) several questions remain unanswered. The use of business groups in pursu-
ing unrelated diversification seems a common strategy for large groups in emerging
economies (Peng and Delios, 2006). It is not clear to what extent this hypothesis may
be valid in developed countries, where well functioning financial markets should, theo-
retically, reduce the advantage of unrelated diversification, and in the small business
sector, where firms are supposed to be single business or related diversifier. So far, the
analysis of diversification patterns of business groups has been carried out only through
case studies. In this chapter I will use the data sets on Italian business groups to examine
the overall patterns of diversification in small groups (those with less than 500 employ-
ees) as well as the Marche data set to examine the growth strategies of groups over time.
The quantitative information available from the above mentioned data sets will be sup-
plemented with the qualitative information collected through direct interviews. The
chapter is organized as follows: section 1 discusses the problems in the definition and
measurement of diversification; section 2 analyses the degree of diversification ob-
served in the population of Italian business groups; section 3 examines the pattern of di-
versification as a result of the growth process observed in business groups; section 4
lays out the main conclusions and discusses the limits of the ‘diversification hypothesis’
in explaining business group formation.
Diversification 150
5.1 Nature and measures of diversification
In examining the diversification strategies of firms, one of the main issues regards
the way in which diversification is defined and measured. Traditionally, diversification
has been defined as the entry of a firm into a new sector. The boundaries between the
sectors - also referred to as industries (Jacquemin and Berry, 1979), segments (Denis et
al., 1997), or lines of business (Montgomery, 1994) - are generally deduced from the
classification system of activities adopted by statistical agencies. Apart from the prob-
lem of identifying the appropriate level of aggregation (2, 3, 4 or 5 digits), the use of
classification codes has several drawbacks, already noted by Penrose (1959). The main
problem of using classification codes for measuring diversification is their “failure to
tap the dimension of relatedness” (Hall and St. John, 1994, p. 154). A method that
partly overcomes this problem has been suggested by Jacquemin and Berry (1979): they
use the entropy index of concentration, which makes it possible to separate the diversi-
fication ‘within’ an industry group (defined as a 2-digit SIC code) from the diversifica-
tion ‘across’ industry groups. Although this is a richer way of measuring diversification,
it also has some drawbacks: the first is that it still relies on classification codes in order
to define the industry boundaries; the second is that it fails to relate the ‘amount’ of di-
versification to the growth strategy followed by firms.
To overcome these limits, some authors have proposed qualitative measures of diver-
sification, based on a direct (but subjective) valuation of the degree of relatedness be-
tween activities controlled by a firm. The first to use this method was Rumelt (1974)
who defined four types of diversification strategies, based on the following indices: a)
the specialisation ratio (SR) defined as the share of sales coming from the main activity;
b) the correlation ratio (RR), defined as the share of sales coming from related activi-
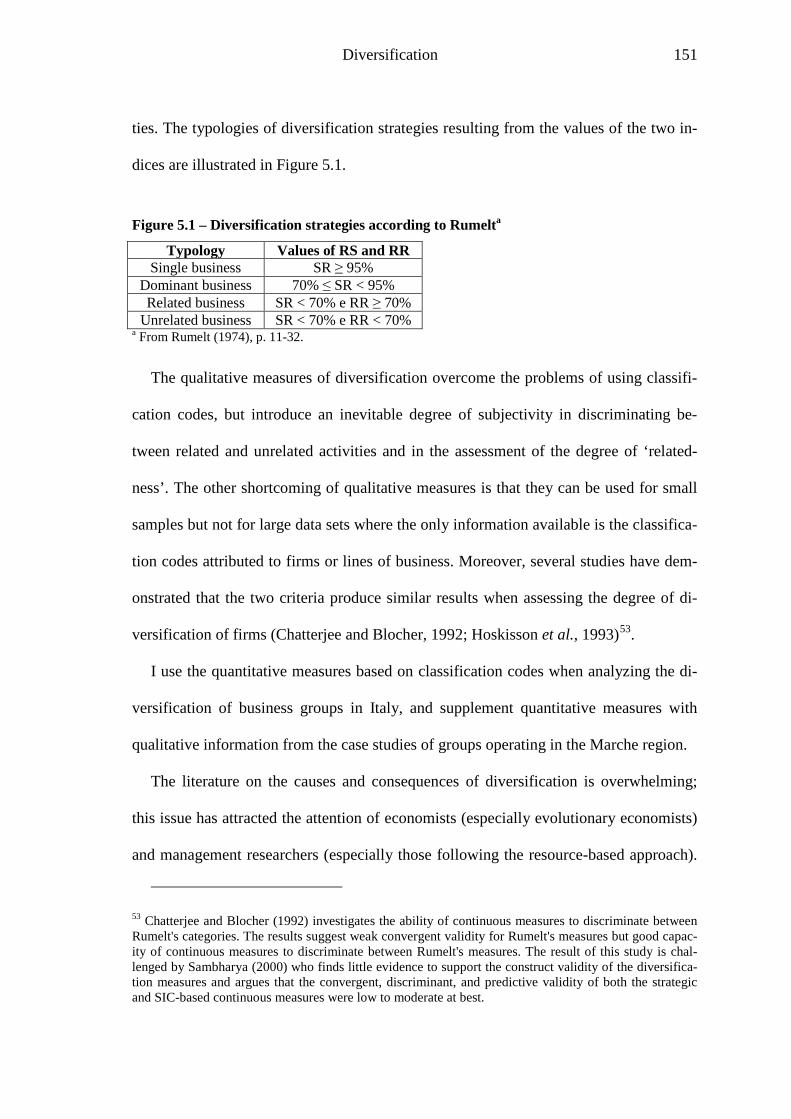
Diversification 151
ties. The typologies of diversification strategies resulting from the values of the two in-
dices are illustrated in Figure 5.1.
Figure 5.1 – Diversification strategies according to Rumelta
Typology Values of RS and RR Single business SR ≥ 95%
Dominant business 70% ≤ SR < 95% Related business SR < 70% e RR ≥ 70%
Unrelated business SR < 70% e RR < 70% a From Rumelt (1974), p. 11-32.
The qualitative measures of diversification overcome the problems of using classifi-
cation codes, but introduce an inevitable degree of subjectivity in discriminating be-
tween related and unrelated activities and in the assessment of the degree of ‘related-
ness’. The other shortcoming of qualitative measures is that they can be used for small
samples but not for large data sets where the only information available is the classifica-
tion codes attributed to firms or lines of business. Moreover, several studies have dem-
onstrated that the two criteria produce similar results when assessing the degree of di-
versification of firms (Chatterjee and Blocher, 1992; Hoskisson et al., 1993)53
I use the quantitative measures based on classification codes when analyzing the di-
versification of business groups in Italy, and supplement quantitative measures with
qualitative information from the case studies of groups operating in the Marche region.
.
The literature on the causes and consequences of diversification is overwhelming;
this issue has attracted the attention of economists (especially evolutionary economists)
and management researchers (especially those following the resource-based approach).
53 Chatterjee and Blocher (1992) investigates the ability of continuous measures to discriminate between Rumelt's categories. The results suggest weak convergent validity for Rumelt's measures but good capac-ity of continuous measures to discriminate between Rumelt's measures. The result of this study is chal-lenged by Sambharya (2000) who finds little evidence to support the construct validity of the diversifica-tion measures and argues that the convergent, discriminant, and predictive validity of both the strategic and SIC-based continuous measures were low to moderate at best.
Diversification 152
The two most important issues in the literature on corporate diversification are: a) the
reasons for diversification; b) the relationship between diversification and performance.
Closely associated to these issues is the direction of diversification. The resource-based
view (RBV) of the firm, originating from the work of Penrose (1959), stresses the im-
portance of related diversification. According to the RBV, the growth of firms is based
on the accumulation of idiosyncratic resources; for this reason, it is expected to follow a
coherent pattern of development around the initial activities (Teece et al., 1994). This is
not only a positive prediction (that is, for explaining the actual behaviour of firms) but
also a normative prescription: firms ought to diversify in related businesses in order to
exploit the idiosyncratic resources that are the basis of their competitive advantage. Ac-
cording to this perspective, we should observe a positive relationship between related
diversification and performance and a negative relationship between unrelated diversifi-
cation and performance. Finance researchers make less stringent hypotheses on the di-
rection of diversification, and generally favour the hypothesis of a negative relationship
between (unrelated) diversification and firm performance. The ‘agency’ perspective
used by financial researchers considers diversification as the result of managers pursu-
ing their expansion objectives at the expense of shareholders (Amihud and Lev, 1981).
Other theoretical perspectives, such as the ‘market power view’, has also gained the at-
tention of industrial economists (Carlton and Perloff, 2005).
A review of this abundant literature is beyond the scope of this research for two main
reasons54
54 Several surveys have been already proposed (Ramanujan and Varadarajan, 1989; Montgomery, 1994; Martin and Sayrak, 2003).
: i) most of the literature on diversification refers to large firms while I am in-
terested in analysing the nature and role of diversification in SMEs; ii) most of the lit-
Diversification 153
erature concentrates on the diversification-performance relationship while my main in-
terest is the impact of diversification on the organization of firms. Therefore, I will take
for granted the theoretical approaches proposed by the literature and concentrate on the
empirical analysis of diversification in business groups, with the aim of verifying to
what extent the ‘diversification hypothesis’ is able to explain the observed phenomena.
At an empirical level, the study of diversification can be grouped into two strands of
literature: cross-sectional studies of the relationship between corporate diversification
and firm value (the so called ‘diversification discount’) and longitudinal studies analyz-
ing the patterns of corporate diversification over time. The first problem, i.e. the per-
formance-diversification relationship, is the one that has received most attention:
“Cross-sectional evidence on corporate diversification is abundant, but systematic evi-
dence on how firms evolve over time is scarce. … longitudinal information might be
useful in understanding diversification” (Matsusaka, 2001, p. 425). In the following
analysis I will first explore the degree of diversification in business groups using cross
sectional data (ISTAT data set); I will then concentrate the attention on the pattern of
diversification as a result of firms’ growth over time.
Because this study deals with groups in the small business sector, before starting the
empirical analysis, it is worthwhile examining the studies that addressed the issue of di-
versification in SMEs. While the literature on diversification by large firms is prolific,
only a few studies have addressed the issue of diversification in SMEs (Lynn and
Reinsch, 1990; Sandvig and Coakley, 1998; Dass, 2000; Sandvig, 2000). In these stud-
ies it has been hypothesised that diversification in SMEs occurs: a) as a survivalist strat-
egy (Robson et al., 1993); b) as a result of entrepreneurial ‘dynamics’ (Donckels et al.,
1987); c) as the result of family capital accumulation (Scott and Rosa, 1996).
Diversification 154
The study of Robson et al. (1993) is particularly interesting for this research. They
find that in the case of smaller firms (those with less than 30 employees) employment
growth is higher for non-diversified than for diversified firms. For the other size classes
(up to 200 employees) there is no significant difference in the rate of growth between
diversified and non-diversified firms. From these results, the authors draw two main
conclusions: the first is that in very small firms, entrepreneurs lack the resources and
skills to manage activities in diversified businesses, hence the negative relationship be-
tween diversification and growth; the second conclusion is that in small firms diversifi-
cation can be considered a survivalist strategy adopted to counterbalance a decline in
the original business, rather than the result of a growth strategy (Robson et al., 1993, p.
47).
One of the limitations of the Robson et al. (1993) work is that the authors associate
the firm with the legal entity. We know that when the size of the firm increases, growth
is achieved not only through the expansion of the existing company, but also through
the setting-up or the acquisition of new companies. Growth appears to be mainly the re-
sult of an entrepreneurial process “… in which the entrepreneur is constantly identifying
and evaluating new opportunities … Over time a significant ‘portfolio’ of surviving
ventures (acquired or founded) can be built up” (Rosa, 1998, p. 44). Empirical research
by Rosa (1998) and Rosa and Scott (1999b) demonstrates that related diversification is
commonly associated with growth strategies where entrepreneurs seize opportunities
arising from existing activities. Unrelated diversification, where there is an entry into a
new business area, is relatively uncommon in the smaller business environment, and is
less growth oriented. Rosa (1998) shows that both related and unrelated forms of diver-
sification can lead to new companies being added to the group. The consideration of
Diversification 155
business groups, rather than the single legal units, is more appropriate when studying
the relationship between growth and diversification, also in the case of SMEs.
Moreover, the growth process in SMEs shows a lower degree of planning than one
might expect in a managerial firm and the decision to pursue a diversified activity is of-
ten the product of serendipity and opportunism. Serendipity and opportunism can lead
to rapid decision-making to diversify into a new company. This could result in a higher
probability of seizing opportunities with no relationship to the ones already established.
Rosa (1998) shows, however, that the planning of new ventures is less intense when the
entrepreneur is doing well. Only when problems became urgent did entrepreneurs pur-
sue a strategy of survivalist diversification. This was usually a carefully planned proc-
ess, and often involved unrelated diversification. This research thus points to complex
diversification strategies followed by entrepreneurs in response to favourable and unfa-
vourable economic climates.
A few papers compare diversification strategies in large and medium-sized firms. In
general these works adopt the agency costs view and focus their attention on the rela-
tionship between ownership concentration and diversification. Amihud and Lev (1999)
found that ownership concentration is negatively associated with diversification, thus
confirming the agency costs hypothesis. Anderson et al. (2000) reached the same con-
clusion; however they suggested that firms can use alternative governance mechanisms
as substitutes for CEO ownership and conclude that agency costs do not provide a com-
plete explanation for the magnitude and persistence of the valuation discount associated
to conglomerate diversification. Aw and Batra (1998) studied the relationship between
size and diversification (product and geographical) for firms located in Taiwan and con-
cluded that diversification is not just a large firm phenomenon, although the most com-
Diversification 156
mon form of diversification for Taiwanese firms is geographic rather than product di-
versification. They found that the positive relationship between firm size and product
diversification, typically found in developed countries, is valid only for the largest ex-
porting firms. Bethel and Liebeskind (1998) demonstrated that the legal organization of
firms does influence the degree of diversification. Specifically, firms organized as a
group of subsidiary companies show a higher degree of diversification than firms organ-
ized as a single legal unit (multidivisional firms). I put forward the hypothesis that the
causal relationship runs in the opposite direction and that the group is the organizational
form adopted by entrepreneurs and managers to pursue a diversification strategy.
5.2 Degree of diversification of business groups
Companies belonging to business groups can be broadly divided into three categories
(Iacobucci and Rosa, 2005): foreign companies; financial companies (like holding com-
panies, property companies, etc.); and production domestic companies. Foreign-based
companies are not relevant for the study of the relationship between diversification and
business group formation as by definition they must be managed as independent legal
units. Financial companies are normally set up because of fiscal advantages or as an in-
strument for controlling production companies55
55 The typical case is a holding company owning the production companies of the group.
. For these reasons, we concentrate the
attention on production domestic companies. As well as representing the main compa-
nies in terms of employees and sales, in small groups they are particularly relevant for
understanding the reasons why entrepreneurs set up new legal units rather than develop-
ing new ventures within established companies. For that reason I consider only groups
Diversification 157
with at least two production companies located in Italy (see also the discussion in sec-
tion 3.3.1).
There are several ways of measuring the degree of diversification: some of them are
based on qualitative scales defining the type of relationship between two activities; oth-
ers are based on quantitative measures based on classification codes. In the case of the
ISTAT data set, we have no choice between the two methods because the only informa-
tion on the activities of companies is their classification code. To assess the relative im-
portance of different activities within the same group, I use the number of employees in
each activity. An alternative measure would have been that of sales. I prefer the number
of employees because it gives a better measure of the importance of the different activi-
ties; in the case of sales, there could be potential distortions arising from duplication of
sales in case where there is a buying-supplying relationship between companies in the
same group.
If ijx represents the employees of the group in industry i, i=1,…,n, and j is an index
of the companies in the group j=1…m, then ijij
xq
X= , with ij
jX x= ∑ , is the share of
employees of company j on total. I define the primary activity of the group as the activ-
ity of the largest company: . As a result can be consid-
ered as a specialization index. I determined those ratios for the companies of the groups
examined at 2, 3, 4 and 5 digit-level industry classification codes56
56 In a previous study (Iacobucci and Rosa, 2005) we have shown that this index produces the same result as other more sophisticated indices (such as the Herfindahl and the Entropy indices) based on considera-tion of the relative importance of employees in all the companies.
. The degree of spe-
cialization of groups is very high (which means that the degree of diversification is,
nixx im ,...,1 ,max == mm q
Xx
=
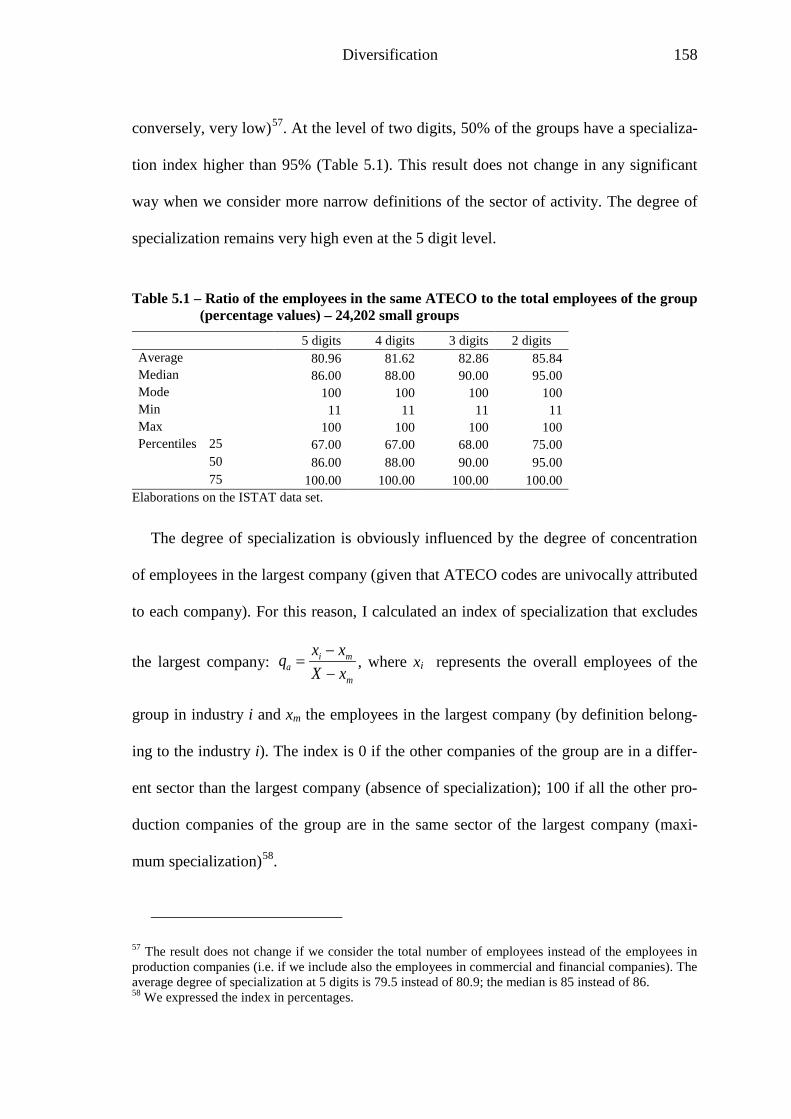
Diversification 158
conversely, very low)57
Table 5.1
. At the level of two digits, 50% of the groups have a specializa-
tion index higher than 95% ( ). This result does not change in any significant
way when we consider more narrow definitions of the sector of activity. The degree of
specialization remains very high even at the 5 digit level.
Table 5.1 – Ratio of the employees in the same ATECO to the total employees of the group (percentage values) – 24,202 small groups
5 digits 4 digits 3 digits 2 digits Average 80.96 81.62 82.86 85.84 Median 86.00 88.00 90.00 95.00 Mode 100 100 100 100 Min 11 11 11 11 Max 100 100 100 100 Percentiles 25 67.00 67.00 68.00 75.00
50 86.00 88.00 90.00 95.00 75 100.00 100.00 100.00 100.00
Elaborations on the ISTAT data set.
The degree of specialization is obviously influenced by the degree of concentration
of employees in the largest company (given that ATECO codes are univocally attributed
to each company). For this reason, I calculated an index of specialization that excludes
the largest company: i ma
m
x xqX x−
=−
, where xi represents the overall employees of the
group in industry i and xm the employees in the largest company (by definition belong-
ing to the industry i). The index is 0 if the other companies of the group are in a differ-
ent sector than the largest company (absence of specialization); 100 if all the other pro-
duction companies of the group are in the same sector of the largest company (maxi-
mum specialization)58
57 The result does not change if we consider the total number of employees instead of the employees in production companies (i.e. if we include also the employees in commercial and financial companies). The average degree of specialization at 5 digits is 79.5 instead of 80.9; the median is 85 instead of 86.
.
58 We expressed the index in percentages.
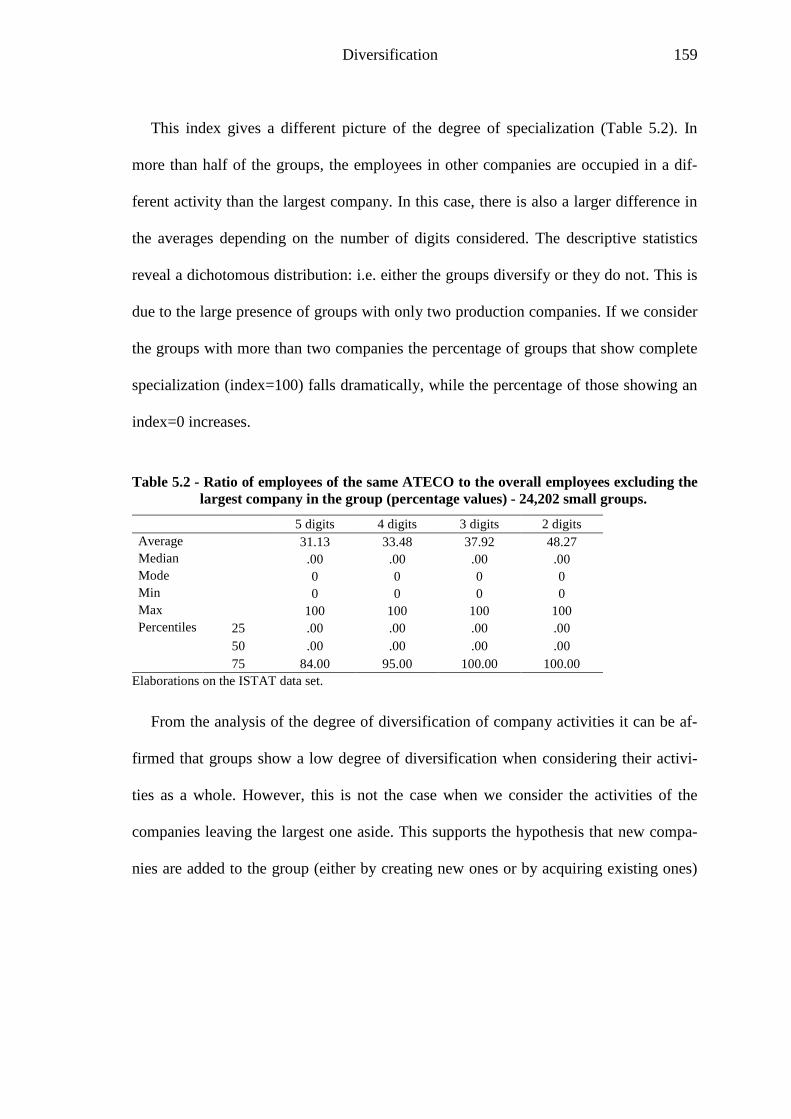
Diversification 159
This index gives a different picture of the degree of specialization (Table 5.2). In
more than half of the groups, the employees in other companies are occupied in a dif-
ferent activity than the largest company. In this case, there is also a larger difference in
the averages depending on the number of digits considered. The descriptive statistics
reveal a dichotomous distribution: i.e. either the groups diversify or they do not. This is
due to the large presence of groups with only two production companies. If we consider
the groups with more than two companies the percentage of groups that show complete
specialization (index=100) falls dramatically, while the percentage of those showing an
index=0 increases.
Table 5.2 - Ratio of employees of the same ATECO to the overall employees excluding the largest company in the group (percentage values) - 24,202 small groups.
5 digits 4 digits 3 digits 2 digits Average 31.13 33.48 37.92 48.27 Median .00 .00 .00 .00 Mode 0 0 0 0 Min 0 0 0 0 Max 100 100 100 100 Percentiles 25 .00 .00 .00 .00
50 .00 .00 .00 .00 75 84.00 95.00 100.00 100.00
Elaborations on the ISTAT data set.
From the analysis of the degree of diversification of company activities it can be af-
firmed that groups show a low degree of diversification when considering their activi-
ties as a whole. However, this is not the case when we consider the activities of the
companies leaving the largest one aside. This supports the hypothesis that new compa-
nies are added to the group (either by creating new ones or by acquiring existing ones)
Diversification 160
in order to diversify from the primary activity. Even at the two digits level (which is a
rather broad definition of industry) this is true for more than 50% of groups59
This empirical evidence on the degree of diversification in small groups raises two
questions: i) given the large share of groups in which all the activities belong to the
same industry, understanding why entrepreneurs have chosen to manage them as a sepa-
rate legal entity may be important; ii) when we observe diversification from the primary
activity it would be important to analyse the direction of such diversification, i.e. the re-
lationship between primary and diversified activities. I will concentrate firstly on the
latter question and will subsequently discuss the former issue.
.
Several studies have demonstrated that firms tend to diversify in activities that show
a high degree of relatedness or coherence (synergies) with existing activities (Teece et
al., 1994; Piscitello, 2000; Breschi et al., 2003; Piscitello, 2005). This seems true also in
the case of small groups: the degree of unrelated diversification is rather low as entre-
preneurs expand their control in activities that are closely connected to the original one
(Iacobucci, 2002).
I define a first index of diversification as the share of firms with a different activity
to the largest one (Table 5.3). The same index is calculated using employees rather than
firms (Table 5.4). While the percentage of firms performing diversified activities is
positively linked to the size of the group, the same is not true when the percentage of
diversified activities is measured in terms of employees. This means that smaller groups
59 We must consider that the way we measure diversification, by attributing a unique code to each com-pany, while appropriate in characterising group diversification underestimates the effective level of diver-sification in the cases where different activities are performed by the same company. This could happen particularly in the case of the largest company.
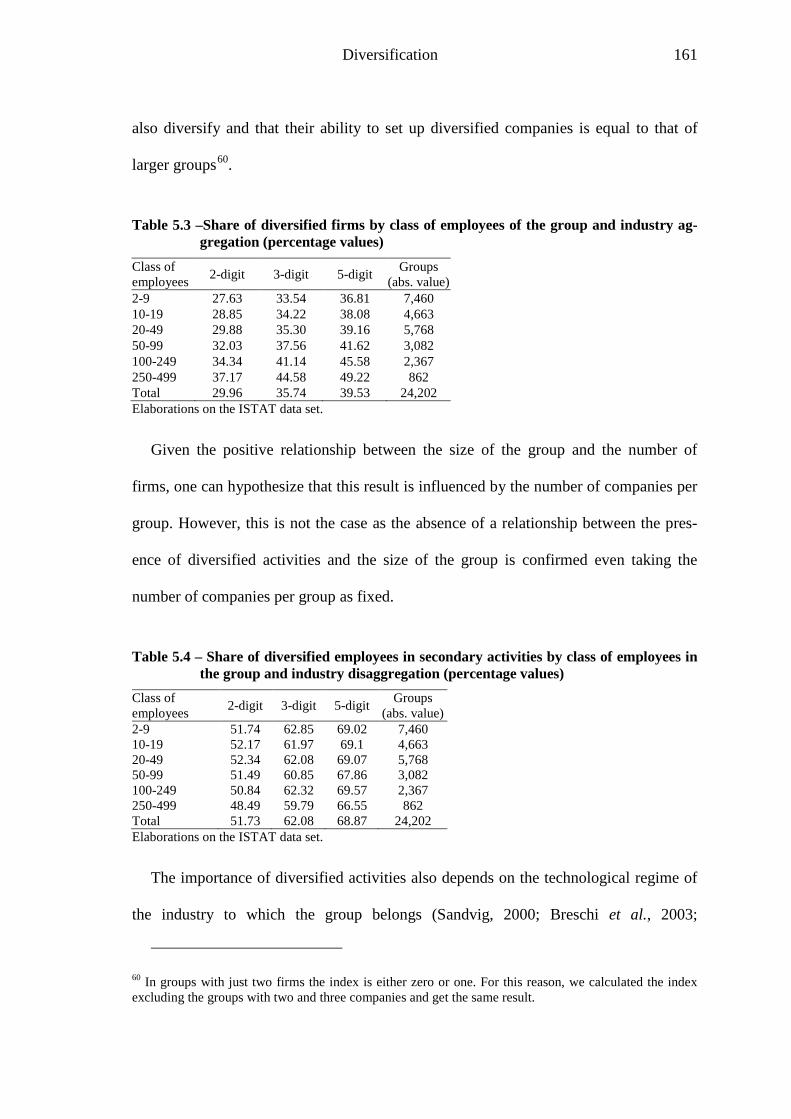
Diversification 161
also diversify and that their ability to set up diversified companies is equal to that of
larger groups60
Table 5.3 –Share of diversified firms by class of employees of the group and industry ag-gregation (percentage values)
.
Class of employees 2-digit 3-digit 5-digit Groups
(abs. value) 2-9 27.63 33.54 36.81 7,460 10-19 28.85 34.22 38.08 4,663 20-49 29.88 35.30 39.16 5,768 50-99 32.03 37.56 41.62 3,082 100-249 34.34 41.14 45.58 2,367 250-499 37.17 44.58 49.22 862 Total 29.96 35.74 39.53 24,202 Elaborations on the ISTAT data set.
Given the positive relationship between the size of the group and the number of
firms, one can hypothesize that this result is influenced by the number of companies per
group. However, this is not the case as the absence of a relationship between the pres-
ence of diversified activities and the size of the group is confirmed even taking the
number of companies per group as fixed.
Table 5.4 – Share of diversified employees in secondary activities by class of employees in the group and industry disaggregation (percentage values)
Class of employees 2-digit 3-digit 5-digit Groups
(abs. value) 2-9 51.74 62.85 69.02 7,460 10-19 52.17 61.97 69.1 4,663 20-49 52.34 62.08 69.07 5,768 50-99 51.49 60.85 67.86 3,082 100-249 50.84 62.32 69.57 2,367 250-499 48.49 59.79 66.55 862 Total 51.73 62.08 68.87 24,202 Elaborations on the ISTAT data set.
The importance of diversified activities also depends on the technological regime of
the industry to which the group belongs (Sandvig, 2000; Breschi et al., 2003;
60 In groups with just two firms the index is either zero or one. For this reason, we calculated the index excluding the groups with two and three companies and get the same result.
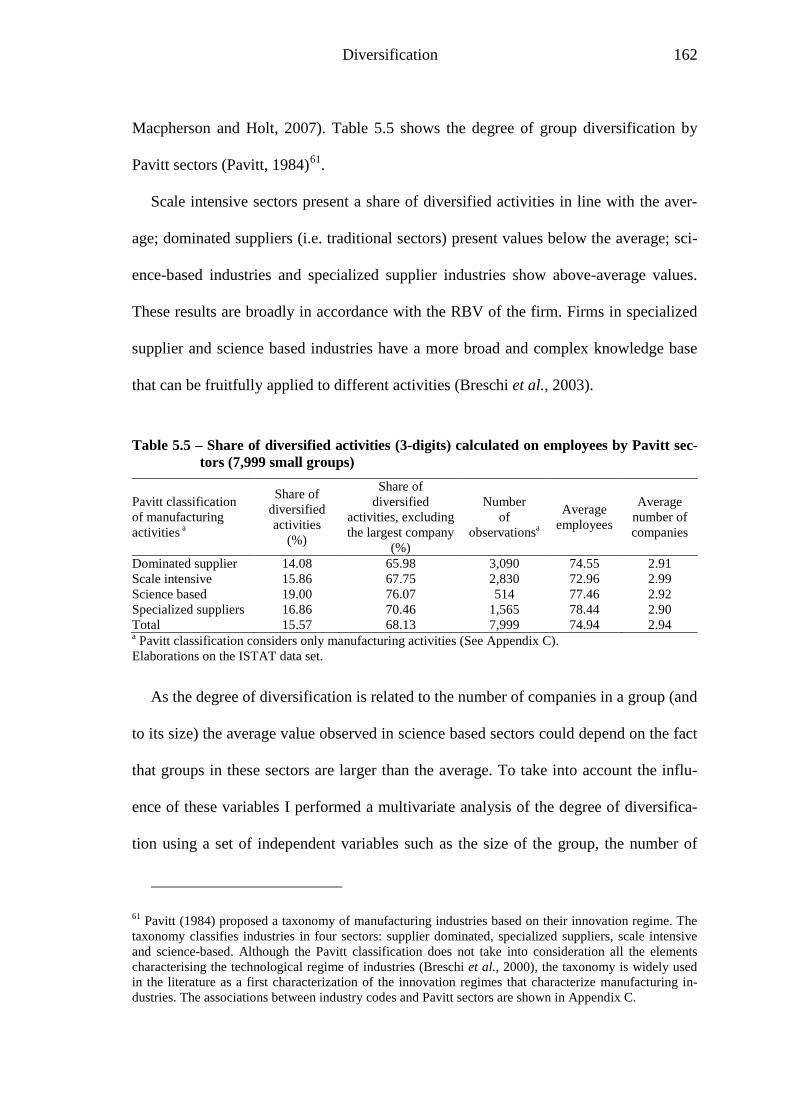
Diversification 162
Macpherson and Holt, 2007). Table 5.5 shows the degree of group diversification by
Pavitt sectors (Pavitt, 1984)61
Scale intensive sectors present a share of diversified activities in line with the aver-
age; dominated suppliers (i.e. traditional sectors) present values below the average; sci-
ence-based industries and specialized supplier industries show above-average values.
These results are broadly in accordance with the RBV of the firm. Firms in specialized
supplier and science based industries have a more broad and complex knowledge base
that can be fruitfully applied to different activities (Breschi et al., 2003).
.
Table 5.5 – Share of diversified activities (3-digits) calculated on employees by Pavitt sec-tors (7,999 small groups)
Pavitt classification of manufacturing activities a
Share of diversified activities
(%)
Share of diversified
activities, excluding the largest company
(%)
Number of
observationsa
Average employees
Average number of companies
Dominated supplier 14.08 65.98 3,090 74.55 2.91 Scale intensive 15.86 67.75 2,830 72.96 2.99 Science based 19.00 76.07 514 77.46 2.92 Specialized suppliers 16.86 70.46 1,565 78.44 2.90 Total 15.57 68.13 7,999 74.94 2.94 a Pavitt classification considers only manufacturing activities (See Appendix C). Elaborations on the ISTAT data set.
As the degree of diversification is related to the number of companies in a group (and
to its size) the average value observed in science based sectors could depend on the fact
that groups in these sectors are larger than the average. To take into account the influ-
ence of these variables I performed a multivariate analysis of the degree of diversifica-
tion using a set of independent variables such as the size of the group, the number of
61 Pavitt (1984) proposed a taxonomy of manufacturing industries based on their innovation regime. The taxonomy classifies industries in four sectors: supplier dominated, specialized suppliers, scale intensive and science-based. Although the Pavitt classification does not take into consideration all the elements characterising the technological regime of industries (Breschi et al., 2000), the taxonomy is widely used in the literature as a first characterization of the innovation regimes that characterize manufacturing in-dustries. The associations between industry codes and Pavitt sectors are shown in Appendix C.
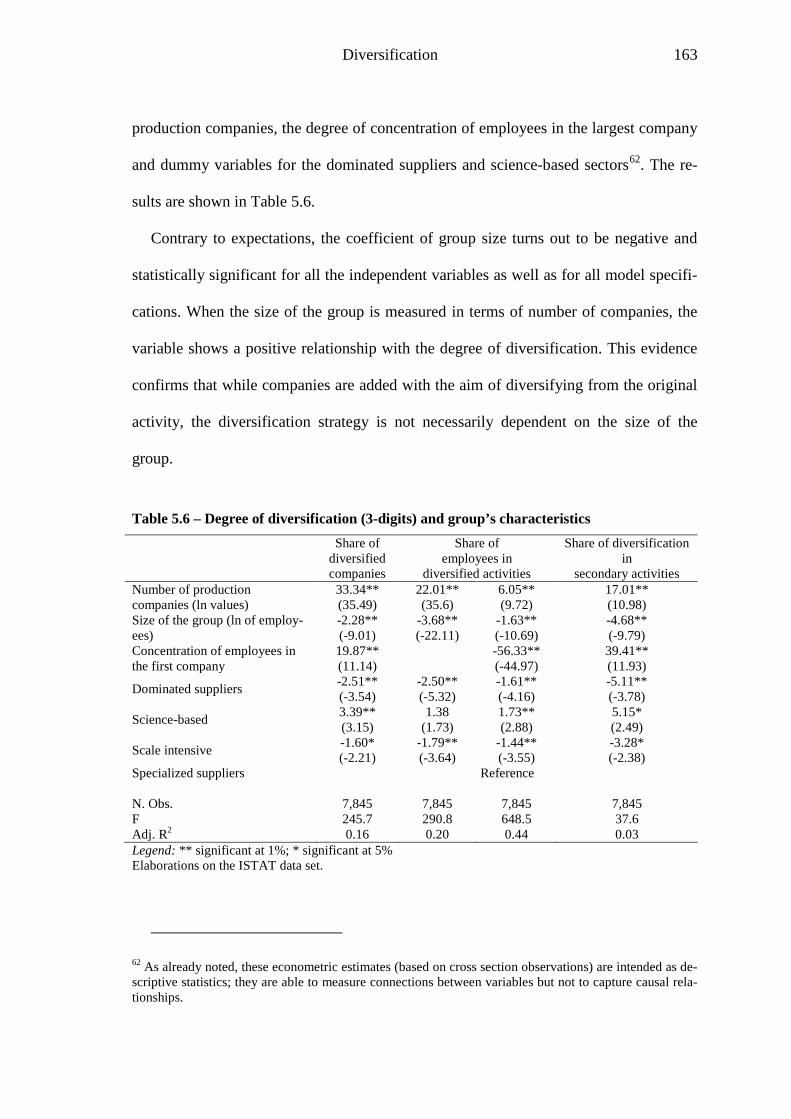
Diversification 163
production companies, the degree of concentration of employees in the largest company
and dummy variables for the dominated suppliers and science-based sectors62
Table 5.6
. The re-
sults are shown in .
Contrary to expectations, the coefficient of group size turns out to be negative and
statistically significant for all the independent variables as well as for all model specifi-
cations. When the size of the group is measured in terms of number of companies, the
variable shows a positive relationship with the degree of diversification. This evidence
confirms that while companies are added with the aim of diversifying from the original
activity, the diversification strategy is not necessarily dependent on the size of the
group.
Table 5.6 – Degree of diversification (3-digits) and group’s characteristics
Share of
diversified companies
Share of employees in
diversified activities
Share of diversification in
secondary activities Number of production companies (ln values)
33.34** (35.49)
22.01** (35.6)
6.05** (9.72)
17.01** (10.98)
Size of the group (ln of employ-ees)
-2.28** (-9.01)
-3.68** (-22.11)
-1.63** (-10.69)
-4.68** (-9.79)
Concentration of employees in the first company
19.87** (11.14)
-56.33** (-44.97)
39.41** (11.93)
Dominated suppliers -2.51** (-3.54)
-2.50** (-5.32)
-1.61** (-4.16)
-5.11** (-3.78)
Science-based 3.39** (3.15)
1.38 (1.73)
1.73** (2.88)
5.15* (2.49)
Scale intensive -1.60* (-2.21)
-1.79** (-3.64)
-1.44** (-3.55)
-3.28* (-2.38)
Specialized suppliers Reference N. Obs. 7,845 7,845 7,845 7,845 F 245.7 290.8 648.5 37.6 Adj. R2 0.16 0.20 0.44 0.03 Legend: ** significant at 1%; * significant at 5% Elaborations on the ISTAT data set.
62 As already noted, these econometric estimates (based on cross section observations) are intended as de-scriptive statistics; they are able to measure connections between variables but not to capture causal rela-tionships.
Diversification 164
Although not intended to explain the phenomenon, this evidence is compatible with a
pattern of growth in which diversification is a ‘substitute’ strategy for growth in the
same industry. It gives support (or at least is compatible with) the ‘survival hypothesis’
(Robson et al., 1993) according to which small firms diversify when there is no possi-
bility of growth within the original sector. The coefficient of the concentration variable
deserves some comment; the positive sign of the coefficient is obvious in the case of the
share of employees in diversified activities. More interesting are the positive (and statis-
tically significant) coefficients in the other two measures of group diversification (the
share of diversified employees on total and the share of diversified employees on sec-
ondary activities). It means that - all things being equal - the concentration of activity in
one industry motivates entrepreneurs to find ways to diversify63
In the case of the technological regimes to which groups belong, the findings con-
firms our expectations; taking the specialized suppliers as the reference sector, groups
belonging to dominated supplier and scale intensive industries show a lower degree of
diversification while the contrary is true for groups with primary activity in science-
based industries.
. This evidence is also
compatible with the hypothesis that one of the main reasons for diversification in small
firms is to reduce the financial risk of owners (Rosa, 1998). The concentration of own-
ership in the activities controlled determines a sub-optimal portfolio diversification of
entrepreneur’s wealth; this could induce him/her to diversify in unrelated business to
reduce specific risk.
63 It is worthwhile to note that the signs and statistical significance of coefficients are robust even when we exclude groups with two companies.
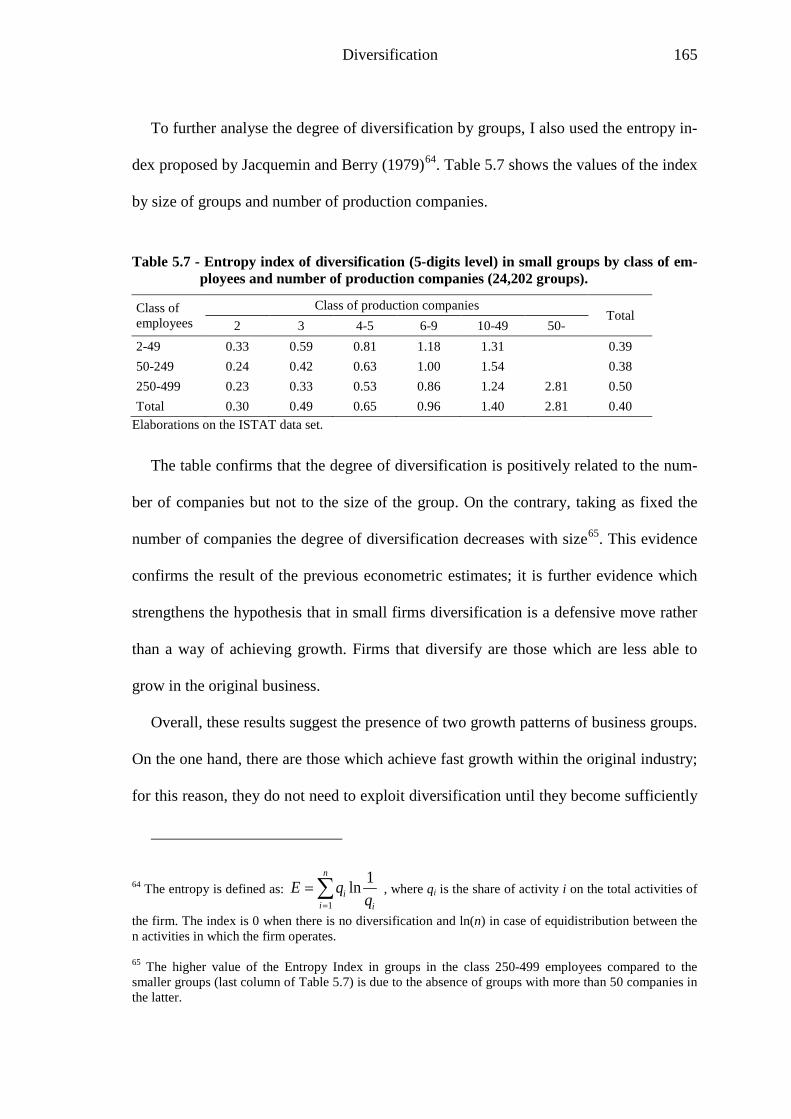
Diversification 165
To further analyse the degree of diversification by groups, I also used the entropy in-
dex proposed by Jacquemin and Berry (1979)64 Table 5.7. shows the values of the index
by size of groups and number of production companies.
Table 5.7 - Entropy index of diversification (5-digits level) in small groups by class of em-ployees and number of production companies (24,202 groups).
Class of employees
Class of production companies Total
2 3 4-5 6-9 10-49 50- 2-49 0.33 0.59 0.81 1.18 1.31 0.39 50-249 0.24 0.42 0.63 1.00 1.54 0.38 250-499 0.23 0.33 0.53 0.86 1.24 2.81 0.50 Total 0.30 0.49 0.65 0.96 1.40 2.81 0.40
Elaborations on the ISTAT data set.
The table confirms that the degree of diversification is positively related to the num-
ber of companies but not to the size of the group. On the contrary, taking as fixed the
number of companies the degree of diversification decreases with size65
Overall, these results suggest the presence of two growth patterns of business groups.
On the one hand, there are those which achieve fast growth within the original industry;
for this reason, they do not need to exploit diversification until they become sufficiently
. This evidence
confirms the result of the previous econometric estimates; it is further evidence which
strengthens the hypothesis that in small firms diversification is a defensive move rather
than a way of achieving growth. Firms that diversify are those which are less able to
grow in the original business.
64 The entropy is defined as: ∑=
=n
i ii q
qE1
1ln , where qi is the share of activity i on the total activities of
the firm. The index is 0 when there is no diversification and ln(n) in case of equidistribution between the n activities in which the firm operates. 65 The higher value of the Entropy Index in groups in the class 250-499 employees compared to the smaller groups (last column of Table 5.7) is due to the absence of groups with more than 50 companies in the latter.

Diversification 166
large. On the other hand, there are firms which start diversifying when they are very
small, probably because they are not able to grow within the original industry; in the lat-
ter case diversification appears to be a defensive strategy because of poor performance
(in terms of growth and profitability) in the original industry (Robson et al., 1993; Rosa,
1998).
Given the value of the entropy index at 5-digits, we can divide it into two compo-
nents: the first capturing diversification between sectors (i.e. the presence of activities in
different 2-digit codes); the second component captures diversification within the same
sector (i.e. between 5-digit codes belonging to the same 2-digit industry)66
Table 5.8
. The share of
the two components by size of groups is shown in .
Table 5.8 – Entropy index of diversification in small groups by class of employees Class of Employees
Entropy index at 5 digits
Within (2 digit) sector component
Between (2 digit) sector component
Number of groups
2-49 0.39 0.07 0.32 17,891 50-249 0.38 0.11 0.27 5,449 250-499 0.50 0.16 0.34 862 Total 0.40 0.09 0.30 24,202
Elaborations on the ISTAT data set.
Contrary to expectations the ‘between sector’ component does not show a significant
correlation with size. On the contrary, the ‘within sector’ component show a positive re-
lationship with size. This confirms that it is easier for small firms to enter new sectors of
66 Although the entropy index has not a fixed range of variation, it has the advantage of being decom-posed to measure different levels of diversification. Given two levels of diversification (i.e. 5-digit and 2-digit levels) the index can be decomposed in the following way: ∑∑∑ +==
== SAWj
S
j
n
i ii EEq
qqE )(1ln
11
Where qj is the share of employees of groups in the same 2-digits industry, with j = 1,…,s and s≤n;
∑=
s
jWjEq
1
= component of diversification ‘within’ the same 2-digit industry; EA= component of diversifica-
tion ‘between’ 2-digits industries. See also Baldwin et al. (2000) for a discussion of the use of the entropy index for the measure of diversification.
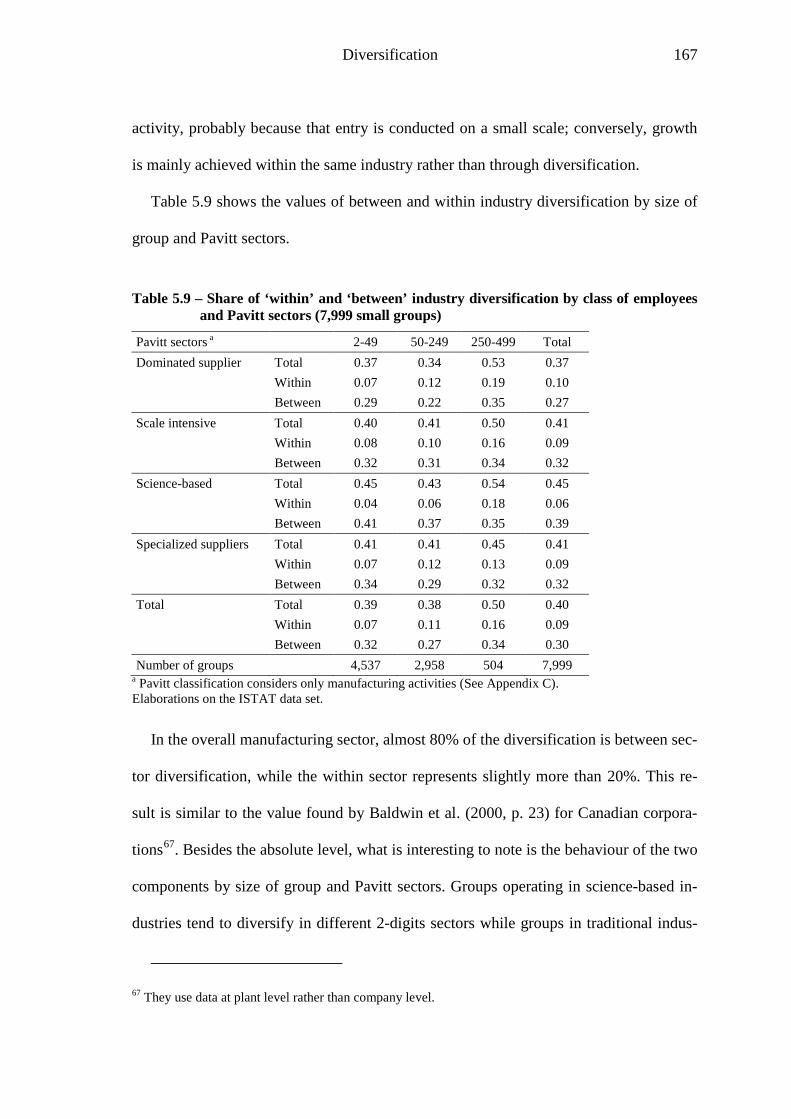
Diversification 167
activity, probably because that entry is conducted on a small scale; conversely, growth
is mainly achieved within the same industry rather than through diversification.
Table 5.9 shows the values of between and within industry diversification by size of
group and Pavitt sectors.
Table 5.9 – Share of ‘within’ and ‘between’ industry diversification by class of employees and Pavitt sectors (7,999 small groups)
Pavitt sectors a 2-49 50-249 250-499 Total Dominated supplier Total 0.37 0.34 0.53 0.37
Within 0.07 0.12 0.19 0.10
Between 0.29 0.22 0.35 0.27 Scale intensive Total 0.40 0.41 0.50 0.41
Within 0.08 0.10 0.16 0.09
Between 0.32 0.31 0.34 0.32 Science-based Total 0.45 0.43 0.54 0.45
Within 0.04 0.06 0.18 0.06
Between 0.41 0.37 0.35 0.39 Specialized suppliers Total 0.41 0.41 0.45 0.41
Within 0.07 0.12 0.13 0.09
Between 0.34 0.29 0.32 0.32 Total Total 0.39 0.38 0.50 0.40
Within 0.07 0.11 0.16 0.09
Between 0.32 0.27 0.34 0.30 Number of groups 4,537 2,958 504 7,999
a Pavitt classification considers only manufacturing activities (See Appendix C). Elaborations on the ISTAT data set.
In the overall manufacturing sector, almost 80% of the diversification is between sec-
tor diversification, while the within sector represents slightly more than 20%. This re-
sult is similar to the value found by Baldwin et al. (2000, p. 23) for Canadian corpora-
tions67
67 They use data at plant level rather than company level.
. Besides the absolute level, what is interesting to note is the behaviour of the two
components by size of group and Pavitt sectors. Groups operating in science-based in-
dustries tend to diversify in different 2-digits sectors while groups in traditional indus-

Diversification 168
tries rely more on differentiation within the same industry. This is congruent with evo-
lutionary models of diversification as science-based industries are characterized by a
broader knowledge base that enables firms to exploit their resources and capabilities in
wide variety of products and services (Teece et al., 1994; Breschi et al., 2000; Cantwell
et al., 2004).
5.3 Patterns of diversification in business groups
As previously mentioned, literature on diversification has focused its attention not
only on the degree of diversification but also on its direction. To analyse the direction of
diversification researchers have used two approaches. The first requires the definition of
a measure of relatedness between industries and the analysis of whether the actual di-
versification of firms matches this map. The second approach identifies the patterns of
diversification of firms to see whether there are regularities in them. The presence of the
same pattern in firms belonging to the same industry is considered as an indirect meas-
ure of relatedness between the activities that are most commonly associated. Whenever
this approach is followed, the first step is that of analysing the associations between the
activities of the companies belonging to the same group.
We can assess the associations of ATECO codes in business groups using a dummy
variable which indicates if an association between two codes is present or not within a
group. Given an industry j=1,2,…,J defined as the primary industry of the group and all
the possible complementary industries k=1,2,…,K, I define the association variable ajk
as: {0 if group operating in industry j does not have a company in industry k
1 if group operating in industry j has at least one company in industry kjka =
Diversification 169
The index reveals the presence of associations between primary and secondary indus-
tries without measuring the relative importance of the two. It considers only the associa-
tions between the primary and secondary activity and not associations between secon-
dary activities. Out of 24,202 small groups, 8,589 have all the companies in the same
two-digits code (no diversification) and those remaining have at least one company in a
different 2-digit code. By observing the frequency of associations between primary and
secondary activities it is possible to analyse what the typical patterns are (if any) of di-
versification. Table 5.10 shows the associations between primary and secondary activity
in groups on the basis of the ajk index. Two aspects are immediately evident: a) the im-
portance of the forward integration in the wholesale sector (code 51) in order to better
control the distribution of products; b) the widespread control of business services (code
74) which in most cases are an input of the manufacturing process. Less generalized is
the control over information services (code 72), with the exception of the office equip-
ment and computer manufacturers, given the synergies between the two activities. An-
other largely present association is with the real estate sector (code 45). Except for the
case of non-metal products (code 26), for which the real estate sector is the primary sec-
tor for sales, in the other industries the control of real estate firms by manufacturing
groups is the result of speculative investment or tax reduction strategies (see the discus-
sion on this point in Section 3.3.1).

Table 5.10 – Associations of primary and secondary activities in small groups (% on total groups)
11 13 14 15 16 17 18 19 20 21 22 23 24 25 26 27 28 29 30 31 32 33 34 35 36 37 40 41 45
11
33.3 13
66.7
14
43.0
29.5 15
9.6
16 17
17.7
5.7
5.7 18
25.7
9.5
19
14.1
6.3
6.3 20
5.4
7.1
25.0
12.5
21
17.9
10.4
9.0 22
23
6.9
13.8
6.9
27.6 24
5.1
11.2
7.0
5.1
25
8.1
12.2 18.7 26
11.6
5.8
32.8
27
26.5 18.4 28
8.5
26.5
8.5
29
7.6
19.9
5.1
7.9 30
6.6
31
10.1 19.6
6.2 5.8
11.6 32
6.5 7.5
15.9
5.6
33
6.3 13.1
10.0 7.5
9.4 34
26.2 14.8
6.6
35
13.7
17.8 36
7.3
5.8
11.5 6.3
5.8
37
8.3
5.6
11.1 40
29.0
41
38.1 45
5.4
50
5.2
7.1
7.1 51
6.8
6.2 7.2
5.6
52
7.1
5.1 55
5.4
16.1
60 61
6.7 62
6.3 6.3
12.5 6.3
6.3
6.3
25.0
63
6.3 64
9.3
7.4
13.0
71
5.9
15.5 72
5.8
73
7.1
6.3
5.4 74
5.5
12.0
80 85
5.6
12.1 90
5.7
20.3
92
6.2
11.0 93
11.3
Total
5.9
8.3
Continued
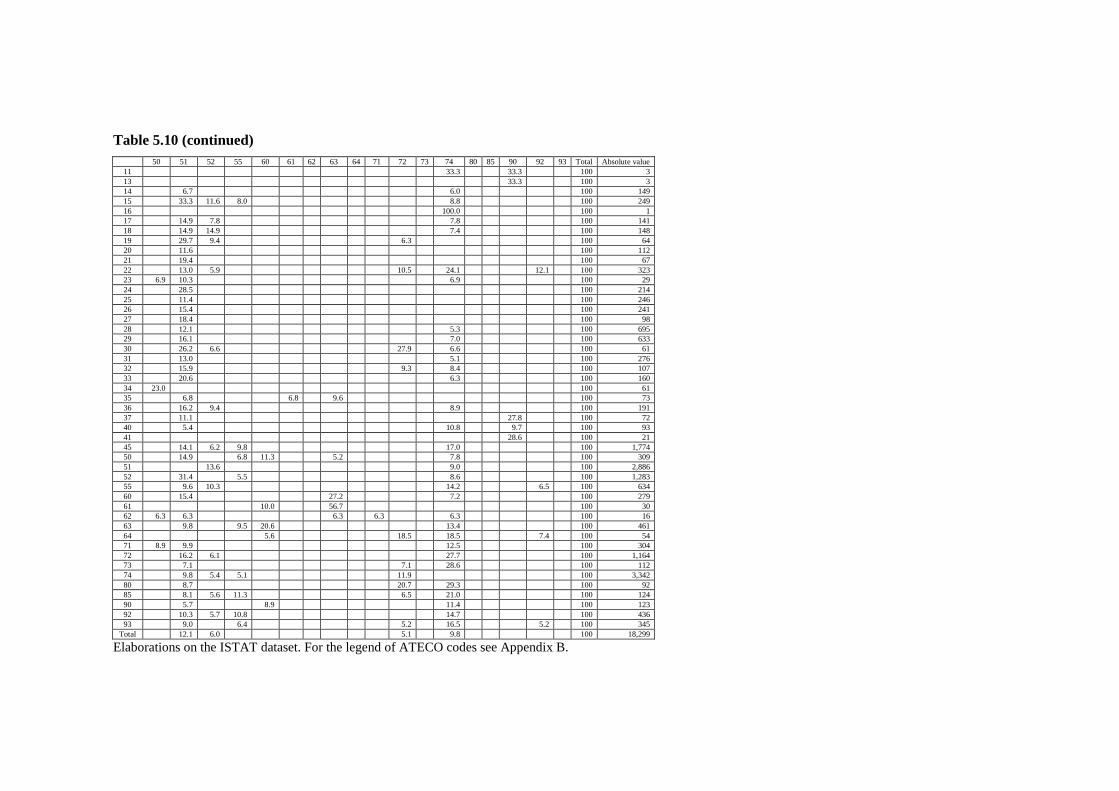
Table 5.10 (continued)
50 51 52 55 60 61 62 63 64 71 72 73 74 80 85 90 92 93 Total Absolute value
11
33.3
33.3
100 3 13
33.3
100 3
14
6.7
6.0
100 149 15
33.3 11.6 8.0
8.8
100 249
16
100.0
100 1 17
14.9 7.8
7.8
100 141
18
14.9 14.9
7.4
100 148 19
29.7 9.4
6.3
100 64
20
11.6
100 112 21
19.4
100 67
22
13.0 5.9
10.5
24.1
12.1
100 323 23 6.9 10.3
6.9
100 29
24
28.5
100 214 25
11.4
100 246
26
15.4
100 241 27
18.4
100 98
28
12.1
5.3
100 695 29
16.1
7.0
100 633
30
26.2 6.6
27.9
6.6
100 61 31
13.0
5.1
100 276
32
15.9
9.3
8.4
100 107 33
20.6
6.3
100 160
34 23.0
100 61 35
6.8
6.8
9.6
100 73
36
16.2 9.4
8.9
100 191 37
11.1
27.8
100 72
40
5.4
10.8
9.7
100 93 41
28.6
100 21
45
14.1 6.2 9.8
17.0
100 1,774 50
14.9
6.8 11.3
5.2
7.8
100 309
51
13.6
9.0
100 2,886 52
31.4
5.5
8.6
100 1,283
55
9.6 10.3
14.2
6.5
100 634 60
15.4
27.2
7.2
100 279
61
10.0
56.7
100 30 62 6.3 6.3
6.3
6.3
6.3
100 16
63
9.8
9.5 20.6
13.4
100 461 64
5.6
18.5
18.5
7.4
100 54
71 8.9 9.9
12.5
100 304 72
16.2 6.1
27.7
100 1,164
73
7.1
7.1
28.6
100 112 74
9.8 5.4 5.1
11.9
100 3,342
80
8.7
20.7
29.3
100 92 85
8.1 5.6 11.3
6.5
21.0
100 124
90
5.7
8.9
11.4
100 123 92
10.3 5.7 10.8
14.7
100 436
93
9.0
6.4
5.2
16.5
5.2
100 345 Total
12.1 6.0
5.1
9.8
100 18,299
Elaborations on the ISTAT dataset. For the legend of ATECO codes see Appendix B.
Diversification 172
Within the manufacturing sector the industry that shows the most diffuse association
with others is the construction of machinery (code 29). This is especially true for me-
chanics and transportation industries, while other industries (such as textiles, clothing,
leather, wood, etc.) do not show the same propensity for controlling this type of activity.
In the case of the transportation industry (codes 34 and 35), control regards not only the
production of machinery, but also metal products (code 28). This is probably explained
by the importance of these products as input in the production of transportation equip-
ment. The control of basic metal production (code 27) is not relevant for any industry.
This is because the output of early metal production does not present a high degree of
specificity so that users of these products (such as metal work or machinery construc-
tion firms) do not need to integrate this activity. At the same time, groups whose pri-
mary activity is in basic metal production (code 27) are significantly integrated into
metal working and machinery production68
Although chemical products enter almost all production processes, the chemical in-
dustry (code 24) does not show diffuse associations with other manufacturing activities
. Outside the mechanical productions, the
only activity that shows a diffuse association with other activities is the paper industry
and plastics industry (code 25). There are different reasons for this; in the case of the as-
sociation between paper products and plastic products it could be for the complementar-
ity of output. In the case of the chemical industry it is because of forward integration
(the same is observed in the opposite direction, with rubber and plastic producers inte-
grating backwards in chemical productions).
68 For the relevance of backward and forward relations along the production chain see the input-output coefficients contained in Appendix E.
Diversification 173
(except with the plastics industry just mentioned). The fact that chemical production is
not diffusely present as a secondary activity is probably for two reasons; on the one
hand it could be for the same reason as basic metal production previously mentioned:
i.e. most chemical products show a low degree of specificity so firms do not need to
control them. On the other hand, chemical production requires a knowledge base that is
not easily transferable from other industries69
Business groups operating in the so-called ‘traditional’ industries (such as textiles
and clothing, leather and footwear, wood products, etc.) are the ones that show lower
degrees of associations with other manufacturing activities. In the case of wood prod-
ucts (code 20) the only significant associations are with the metal work industry (code
28) because of the complementarity in some productions (for example doors and win-
dows made of both wood and metal) or forward integration with the furniture industry
(code 36). In the case of the textile industry, the only relevant association is with the
clothing industry (code 18) which is clearly motivated by forward integration. The
clothing industry shows a significant association with the textile industry (backward in-
tegration) but also with the leather industry (code 19). In the latter case it is the com-
plementarity of output that motivates the association. The food and beverage industry is
the only one that does not show any significant association with other manufacturing ac-
tivities; indeed its most important association is with wholesale and the retail activity.
This is understandable given that most food products are perishable goods and so con-
trol of the distribution chain is fundamental to ensure the speed and the conditions by
which such products reach final consumers.
.
69 Most chemical productions are also subject to economies of scale and therefore entry in this industry is not easy.
Diversification 174
From the analysis of the associations between industry codes within business groups,
it emerges that the majority of them are motivated by control of the production chain
rather than unrelated diversification. The importance of vertical relationships between
companies belonging to the same group does not come as a surprise; in fact, as exam-
ined in chapter 2, there are authors who have stressed such relationships in the interpre-
tation of business groups (Kester, 1992). Moreover, from an empirical point of view, it
is not easy to distinguish between related diversification and vertical integration unless
one has direct information on the exchange flows between units belonging to the same
group70
At the same time, we must take into account that in about one third of the group all
the companies belong to the same industry; this raises the additional question of why
entrepreneurs decided to set up legally independent units when the degree of diversifi-
cation appears to be either very low or nil (according to classification codes).
. Given the different causes that motivate the two strategies, it is interesting to
try and separate vertical integration (which refers to the control of activities within the
same production chain) from diversification (which includes the remaining cases) what-
ever the motivations for entering a new field of activity.
To answer these questions, we need qualitative information about the activities and
growth patterns of groups that allows us to go beyond the information provided by clas-
sification codes.
70 Some researchers use the term diversification to refer to both, distinguishing between ‘horizontal’ and ‘vertical’ diversification (Baldwin et al., 2000).
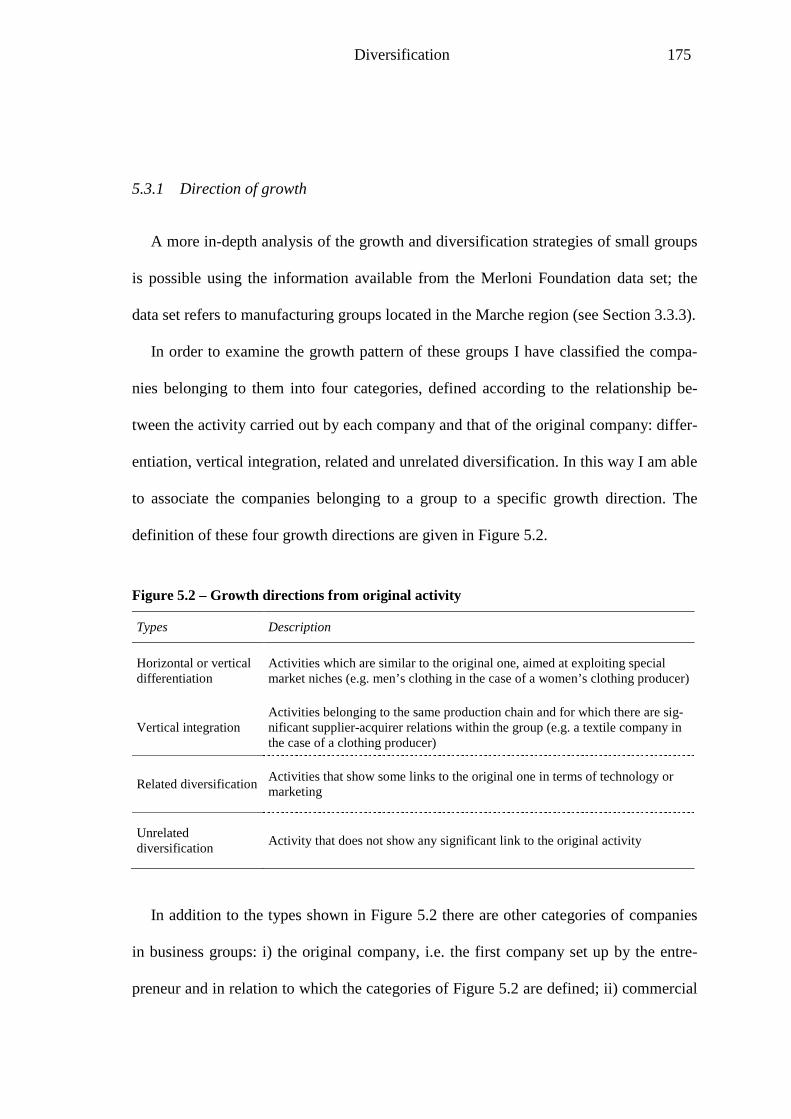
Diversification 175
5.3.1 Direction of growth
A more in-depth analysis of the growth and diversification strategies of small groups
is possible using the information available from the Merloni Foundation data set; the
data set refers to manufacturing groups located in the Marche region (see Section 3.3.3).
In order to examine the growth pattern of these groups I have classified the compa-
nies belonging to them into four categories, defined according to the relationship be-
tween the activity carried out by each company and that of the original company: differ-
entiation, vertical integration, related and unrelated diversification. In this way I am able
to associate the companies belonging to a group to a specific growth direction. The
definition of these four growth directions are given in Figure 5.2.
Figure 5.2 – Growth directions from original activity
Types Description
Horizontal or vertical differentiation
Activities which are similar to the original one, aimed at exploiting special market niches (e.g. men’s clothing in the case of a women’s clothing producer)
Vertical integration Activities belonging to the same production chain and for which there are sig-nificant supplier-acquirer relations within the group (e.g. a textile company in the case of a clothing producer)
Related diversification Activities that show some links to the original one in terms of technology or marketing
Unrelated diversification Activity that does not show any significant link to the original activity
In addition to the types shown in Figure 5.2 there are other categories of companies
in business groups: i) the original company, i.e. the first company set up by the entre-
preneur and in relation to which the categories of Figure 5.2 are defined; ii) commercial
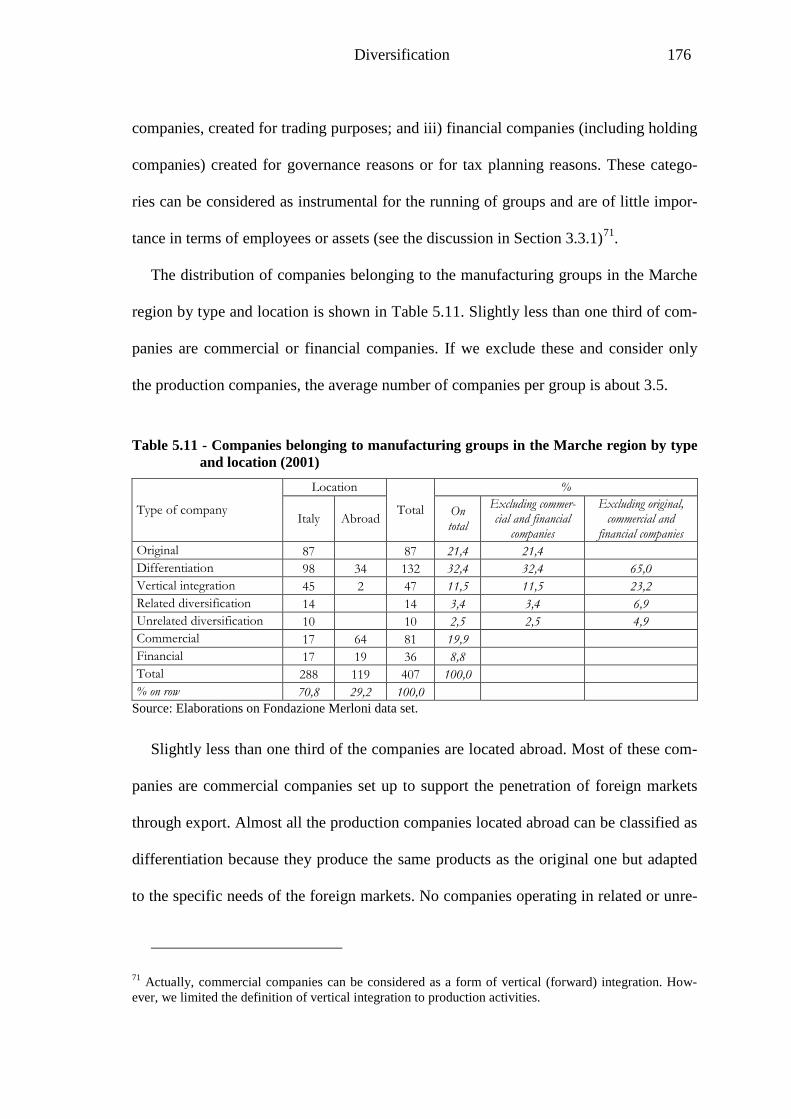
Diversification 176
companies, created for trading purposes; and iii) financial companies (including holding
companies) created for governance reasons or for tax planning reasons. These catego-
ries can be considered as instrumental for the running of groups and are of little impor-
tance in terms of employees or assets (see the discussion in Section 3.3.1)71
The distribution of companies belonging to the manufacturing groups in the Marche
region by type and location is shown in
.
Table 5.11. Slightly less than one third of com-
panies are commercial or financial companies. If we exclude these and consider only
the production companies, the average number of companies per group is about 3.5.
Table 5.11 - Companies belonging to manufacturing groups in the Marche region by type and location (2001)
Type of company
Location
Total
%
Italy Abroad On total
Excluding commer-cial and financial
companies
Excluding original, commercial and
financial companies Original 87 87 21,4 21,4 Differentiation 98 34 132 32,4 32,4 65,0 Vertical integration 45 2 47 11,5 11,5 23,2 Related diversification 14 14 3,4 3,4 6,9 Unrelated diversification 10 10 2,5 2,5 4,9 Commercial 17 64 81 19,9 Financial 17 19 36 8,8 Total 288 119 407 100,0 % on row 70,8 29,2 100,0
Source: Elaborations on Fondazione Merloni data set.
Slightly less than one third of the companies are located abroad. Most of these com-
panies are commercial companies set up to support the penetration of foreign markets
through export. Almost all the production companies located abroad can be classified as
differentiation because they produce the same products as the original one but adapted
to the specific needs of the foreign markets. No companies operating in related or unre-
71 Actually, commercial companies can be considered as a form of vertical (forward) integration. How-ever, we limited the definition of vertical integration to production activities.
Diversification 177
lated businesses are located abroad. This supports the hypothesis that internationaliza-
tion is a substitute strategy for product diversification and it is therefore unlikely that
both strategies will be observed at the same time (Davies et al., 2001).
Related diversification justifies the setting up of less than 10% of companies, and an
even smaller percentage of employees and sales. It also concerns less than 10% of
groups (8 out of 87). Unrelated diversification concerns a very low percentage of new
companies and groups (6% and 5% respectively). The results from the interviews also
shows that unrelated diversification can often be interpreted as an incidental move by
entrepreneurs - the serendipity mentioned by Rosa (1998) - rather than the result of a
planned strategy.
The Merloni Foundation data set includes medium sized groups that not only have
survived through the years, but have also shown significant growth. This is further evi-
dence of the ‘survival’ or ‘defensive’ hypothesis (Robson et al., 1993; Rosa, 1998): di-
versification (especially unrelated diversification) is more likely in smaller firms that
are not able to grow in their original business. When significant growth is observed in
SMEs (as it is the case of the groups examined), it is more likely that it is achieved
through expansion of the original business or in activities that are closely connected to
it. This is the case with vertical integration and differentiation.
Vertical integration concerns about a quarter of the companies belonging to groups.
As noted in other studies about vertical integration in manufacturing (Caves and
Bradburd, 1988; Joskow, 2005) it mainly concerns backward integration rather than
forward integration. The cases analyzed indicated that the main aim for setting up or ac-
quiring those companies is to secure control of some phases of the production chain.
Diversification 178
The reasons expressed by interviewed entrepreneurs help understanding the logic
underlying the setting-up or acquiring companies that control specific phases along the
production chain.
“We had problems with our supplier [of compound for footwear soles] over the
quality and compliance of supply agreements. For this reason, we decided to set up
a company for the production of compound and started producing plastic granules.
We rented premises and bought the necessary equipment. One of the shareholders
of the new company was formerly a technician for our supplier.” (Case #7 – Fin-
project)
“At the beginning of the nineties we perceived the need on the part of our custom-
ers for finished product: i.e. the printed circuit with all the components already in
place. Among our customers there was a company that performed a service of this
kind. Our group entered this company with a share of 41.5%. The company contin-
ued to perform its previous activity. When one of our customers had this need [for
the finished product] we worked together to satisfy it.” (Case #17 – Somacis)
The group form seems particularly appropriate for the control of vertically integrated
activities, especially in the case of backward integration. In fact, the legal autonomy of
companies reduces the risks associated with vertical integration by facilitating the abil-
ity of controlled firms to acquire and sell in the market (Kester, 1992).
Excluding commercial and financial companies, 60% of the companies subsequently
set-up or acquired by entrepreneurs can be classified as differentiation from the original
business. This is further evidence that group structures are used by entrepreneurs also
when the degree of diversification is very low; in fact, differentiated activity is mostly
Diversification 179
classified within the same code (even when taken at 5 digits). The expansion in different
segments of the same market justifies the large number of groups whose companies be-
long to the same classification code (see Section 5.2). Given the importance of product
differentiation as a reason for setting up a group, I will deepen the analysis of this aspect
in the next section, also taking advantage of the information gathered through direct in-
terviews.
5.3.2 Horizontal and vertical differentiation
Given the empirical importance of differentiation in the growth strategies of groups,
it is worthwhile examining this aspect in more detail. It is connected to the increasing
vertical and horizontal segmentation of markets. Vertical segmentation refers to the dif-
ferent quality levels characterising products within the same market; horizontal segmen-
tation refers to products with different characteristics within the same quality level72
72 The distinction between vertical and horizontal differentiation was introduced by Lancaster (1979) and is commonly used in models of product differentiation (Caves and Williamson, 1985; Shaked and Sutton, 1987; Sutton, 1991).
.
Despite its increasing importance, differentiation is ignored by classification codes: in
fact, products belonging to different segments of the same market are classified within
the same code (even when we consider the maximum level of disaggregation). Although
associated to the same classification code, products belonging to different segments can
have dramatic differences in terms of production technology and marketing processes,
especially where vertical differentiation is concerned. Taking the example of a clothing
firm, there is quite a difference between operating in the production and distribution of
casual clothing and the prêt-a-porter or haut-couture segments. The differences in the
organization of production and marketing activities between these two segments are so
Diversification 180
high that it is difficult to find firms operating at the same time in both. Nevertheless, all
the above-mentioned segments of the clothing market are included within the same 5-
digit ATECO code (or the same 4-digit SIC code).
The failure of taking into account product differentiation is a major problem in our
case for two reasons: a) because of new technological and demand conditions, markets
are becoming more and more segmented and expansion in these segments represents
one of the most important ways through which firms grow; b) in most cases, to enter a
new market segment implies modifications in firms’ activities and in the external rela-
tionships with customers and suppliers no less than those arising from conventional di-
versification. These differences also justify the need for organizational differentiation
when entering into new segments of the same market.
Cases of product differentiation are very common in the manufacturing groups as
demonstrated by the large number of groups with companies all belonging to the same
industry. Examples of these groups can also be found in the Marche region. For exam-
ple, in groups belonging to the furniture sector it is common to observe companies pro-
ducing the same type of furniture, but of different quality; the motivation for the legal
autonomy of companies is because they use different brands, different distribution
channels, and they organize the manufacturing process differently.
To better understand the logic behind the expansion in related segments of the same
industry it is worthwhile examining in details the structure of one of the groups exam-
ined, case #12, Lube (see Table 3.11).
The Lube Group is an interesting case of a kitchen producer organized in a group of
companies that mimic a multidivisional organization, with companies dedicated to spe-
cific segments of the market and companies performing centralized activities. The
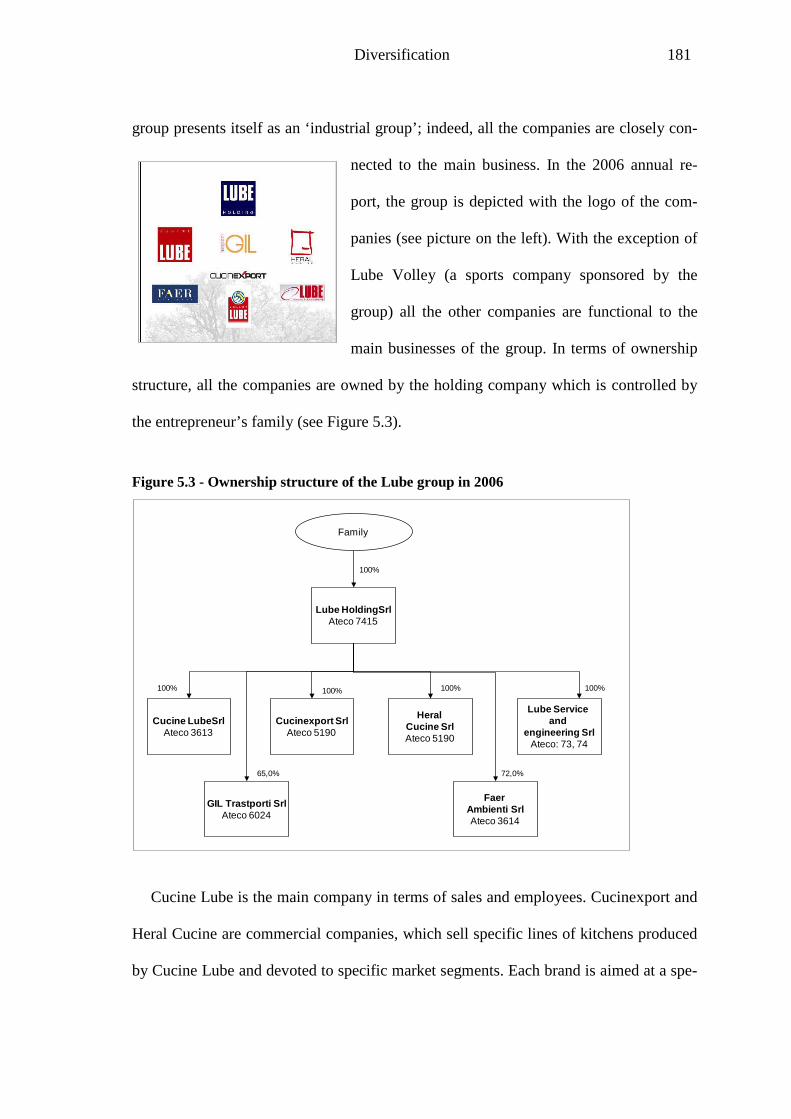
Diversification 181
group presents itself as an ‘industrial group’; indeed, all the companies are closely con-
nected to the main business. In the 2006 annual re-
port, the group is depicted with the logo of the com-
panies (see picture on the left). With the exception of
Lube Volley (a sports company sponsored by the
group) all the other companies are functional to the
main businesses of the group. In terms of ownership
structure, all the companies are owned by the holding company which is controlled by
the entrepreneur’s family (see Figure 5.3).
Figure 5.3 - Ownership structure of the Lube group in 2006
Cucine Lube is the main company in terms of sales and employees. Cucinexport and
Heral Cucine are commercial companies, which sell specific lines of kitchens produced
by Cucine Lube and devoted to specific market segments. Each brand is aimed at a spe-
Family
Lube HoldingSrlAteco 7415
FaerAmbienti SrlAteco 3614
HeralCucine SrlAteco 5190
Cucine LubeSrlAteco 3613
Cucinexport SrlAteco 5190
100%
100% 100%100% 100%
65,0%
Lube Service and
engineering SrlAteco: 73, 74
GIL Trastporti SrlAteco 6024
72,0%
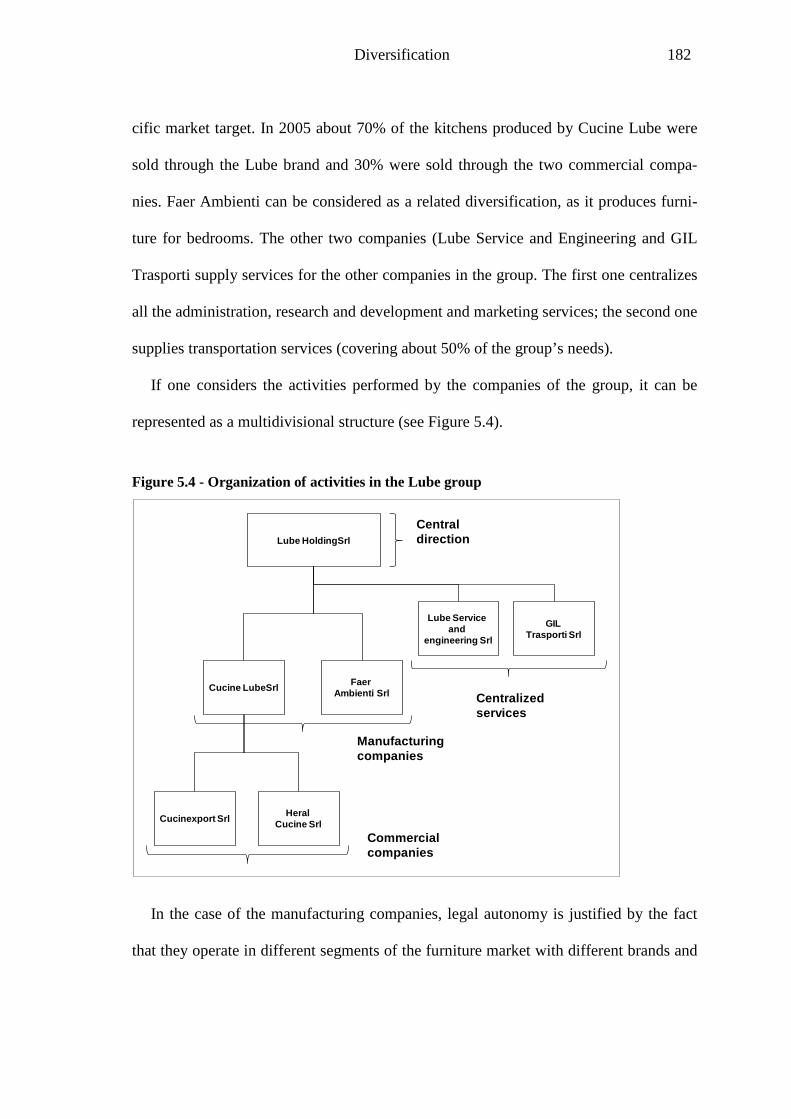
Diversification 182
cific market target. In 2005 about 70% of the kitchens produced by Cucine Lube were
sold through the Lube brand and 30% were sold through the two commercial compa-
nies. Faer Ambienti can be considered as a related diversification, as it produces furni-
ture for bedrooms. The other two companies (Lube Service and Engineering and GIL
Trasporti supply services for the other companies in the group. The first one centralizes
all the administration, research and development and marketing services; the second one
supplies transportation services (covering about 50% of the group’s needs).
If one considers the activities performed by the companies of the group, it can be
represented as a multidivisional structure (see Figure 5.4).
Figure 5.4 - Organization of activities in the Lube group
In the case of the manufacturing companies, legal autonomy is justified by the fact
that they operate in different segments of the furniture market with different brands and
Lube HoldingSrl
FaerAmbienti Srl
HeralCucine Srl
Cucine LubeSrl
Cucinexport Srl
Lube Service and
engineering Srl
GILTrasporti Srl
Central direction
Centralizedservices
Manufacturingcompanies
Commercialcompanies
Diversification 183
production organization. This is also the case for the two commercial companies, as
they sell the same product (kitchen furniture) but to different market segments.
This same phenomenon is observed in groups belonging to the fashion industry and
in other industries as well. Although most of the groups expanded their activities within
the original sector, the entrepreneur decided to set up new companies in order to man-
age the expansion in different segments of the same market. I have deliberately chosen
groups belonging to supplier dominated industries (Pavitt, 1984) because these sectors
are the ones in which the technological regime does not favour related diversification
(Teece et al., 1994; Breschi et al., 2000); nevertheless, groups are also present in these
industries as a result of horizontal or vertical differentiation in different market seg-
ments.
The importance of market segmentation for justifying the legal autonomy of compa-
nies emerged clearly from the interviews. The entrepreneurs indicated the need to focus
resources as one of the main reasons for setting up a new company, even when it is
dedicated to a production that seems very close to the existing ones. The following case
refers to a group operating in the production of paper bags. Originally it produced paper
sacks for the cement industry but during its development the group enlarged its product
range while remaining within the same industry (according to the industry classifica-
tion): i.e. the production of paper sacks and bags. For each new product, the entrepre-
neur created separate companies to address different customers and production needs.
“In 1984 we began producing paper shopping bags. At first we were the only com-
pany in Italy able to produce paper bags with handles and we began supplying the
main distribution chains. … [The respondent then described the formation of two
new companies, one producing 1Kg paper sacks in 1988 and another producing
Diversification 184
sacks for the cement industry] …The setting up of a new company was justified by
the fact that the production was completely different [from the original one]. Com-
pared with other paper bags the technology is completely different, the machinery
is different.”… “Apart from differences in technology, there is a completely differ-
ent way of operating. In one case [the original company] there are large lots for
which you need maximum efficiency. In the other sectors quality is important and
you need to focus on other issues as well as efficiency. As each company works
with a different production philosophy, it is better to keep them apart
The following case refers to an entrepreneur producing car batteries, initially differenti-
ating in different segments (from starting batteries to traction batteries) and later diver-
sifying in activities further along the production chain (like electric vehicles).
.” (Case #9
Fiorini)
“The idea of setting up a group of independent companies came from these diversi-
fications in traction batteries and electrical vehicles. The logic behind these new
companies is as follows: FAAM [the original company] experiments with new ac-
tivities and products. As soon as it sees that the latter are promising businesses a
new company is set up with the aim of developing the new activity. This is because
it is possible to create a healthy competition between the different activities (moti-
vating people responsible for them to produce more and better quality). At the
same time, the relative performance of the different activities is more easily meas-
urable and comparable. For a new business you need a new, focused, organization”
(Case #6 FAAM).
Diversification 185
5.4 Diversification strategies and business group formation
The analysis carried out in the previous sections demonstrates the importance of di-
versification strategies as a motivation for the formation of a business group. The main
results emerging from the empirical analysis are as follows.
The first is the relevance of diversification strategies in the small business sector.
The degree of diversification is not directly related to the size of groups as diversifica-
tion is also seen in smaller companies; this means that a diversification strategy can oc-
cur soon after the beginning of the life of the enterprise, when the growth of the original
business is below expectations. Diversification can also occur because the entrepreneur
wants to reduce the financial risks associated with the concentration of investment in the
original activity. In both cases, diversification in smaller groups appears as a result of a
‘defensive’ or ‘survival’ strategy rather than as a way for fostering growth.
Overall, the previous analysis confirms that the business group is the organizational
form used by entrepreneurs to pursue a diversification strategy. In fact, the degree of di-
versification is positively related to the number of companies owned rather than to the
size of the group. However, there are several cases in which the degree of diversifica-
tion would not justify the high level of organizational autonomy associated with the le-
gal autonomy of companies. In fact, in most cases diversification takes the form of dif-
ferentiation: i.e. the entering into new segments of the same industry. Traditionally this
has not been considered as proper diversification, particularly since differentiation is ig-
nored by classification codes of economic activity. Moreover, as emerged from case
studies, the new market conditions stress the importance of strategic and operative
autonomy also in the case of firms operating in apparently similar activities but devoted
to different segments of the same market. Moving to a different segment sometimes re-
Diversification 186
quires the same changes in resources and capabilities as applying the technological or
market know-how of the firm in other industries.
The empirical evidence also highlights the relevance of business groups as an organ-
izational form to control activities along the same production chain; i.e. vertical integra-
tion. Although some authors have stressed the importance of business groups for the
control of activities along the production chain (Kester, 1992), this perspective has been
rather neglected in recent times. Kester (1992) referred his analysis to large groups;
elaborations on the ISTAT dataset demonstrate that there are no big differences between
small and large firms when pursuing vertical integration strategies or in the use of the
group to carry out this strategy.
Although the idea of business groups as a way of ‘managing diversified activities
under centralized control’ finds empirical support, this proposition is not completely
convincing as an explanation of the phenomenon. Diversified activities (especially those
within the same sector) can also be managed through organizational forms other than a
business group. The need to give operative and strategic autonomy to diversified activi-
ties does not necessarily imply the need to give legal autonomy to the new organiza-
tional unit. In fact, we have also seen cases of firms with a high degree of diversifica-
tion that are organized in a multi-divisional structure rather than through a business
group. To explain when and why a diversification strategy results in the formation of a
business group, we need to examine the specific advantages of giving legal autonomy to
the organizational units devoted to managing diversified activities. The answer to this
question is that legal autonomy allows entrepreneurs to differentiate the ownership
structure of new activities. Specifically, it allows entrepreneurs to raise equity capital
from external shareholders. This aspect is stressed by the financial interpretation of
Diversification 187
business groups. However, we have seen in chapter 4 that the financial explanation is
not able to explain ‘per se’ the observed phenomena and leaves some questions unan-
swered.
An aspect that up to now has received little attention from both the financial or the
diversification explanations refers to the dynamics associated with the start-up of new
businesses. Current theories do not distinguish between the problems arising from the
start-up of new activities (new venture creation) and those posed by the management of
these activities at later stages. The interviewed entrepreneurs stressed the importance of
setting up a new company for the initial development of a new business; when the busi-
ness is consolidated there are other organizational forms that can be used to manage the
bundle of resulting activities efficiently. This suggests that business groups are dynamic
devices which are expanded or contracted (in terms of number of companies) by entre-
preneurs depending on the development stage of new ventures. These aspects will be
analysed in detail in the next chapter.
Entrepreneurial processes 188
Chapter 6 - Entrepreneurial processes and business groups dynamics
The ‘financial’ and the ‘diversification’ explanations both contribute to understand-
ing important aspects of the phenomenon of business groups; however, they still leave
some questions unanswered, especially in the case of small groups.
As demonstrated in the previous chapter, in most cases the degree of diversification
observed in these groups is very low and does not explain the legal autonomy accorded
to new business units. In fact, there are other organizational arrangements (like the divi-
sional organization) that could efficiently achieve the same aim.
Legal autonomy allows the entrepreneur to modify the ownership structure of new
businesses. The financial explanation stresses this aspect by considering the group as a
mechanism for raising equity capital from external shareholders (outside equity) in or-
der to maximise the return on capital invested by the controlling family (Almeida and
Wolfenzon, 2006). However, the financial explanation is not completely convincing in
explaining the presence and characteristics of business groups. The degree of ownership
concentration of controlled firms is higher than we expected. The financial explanation
also does not provide a convincing explanation on how to solve the problem of agency
costs of minority shareholders in privately held companies. This questions the hypothe-
sis that the main motivation for legal autonomy is the raising of outside equity. More-
over, in small firms ownership is normally associated with control and management. As
a result, the modification of ownership structure for a new activity is inevitably associ-
ated with the modification of its control structure: it is not the capital per se that matters
Entrepreneurial processes 189
but the people who provide it, since they are going to be directly involved in the man-
agement of the new business.
These observations are the result of direct interviews with entrepreneurs who chose
to build a business group. The methodology of the survey and the characteristics of
groups interviewed are illustrated in Section 3.3.4. The data and information collected
through the interviews allowed the analysis of the processes involved in the decisions to
enlarge the companies in a group as well as to shrink it. The elaboration and comparison
of case studies provides a better understanding of the mechanisms behind new venture
creation by portfolio entrepreneurs and the entrepreneurial processes involved in the
formation and development of business groups.
The chapter is organized as follows. Section 1 reports the results of direct interviews
with portfolio entrepreneurs and examines the different mechanisms of entrepreneurial
team development. Section 2 highlights the main propositions about the entrepreneurial
processes involved in the formation of business groups.
6.1 New venture creation and team formation
After listening to the interviews and transcribing them for computer treatment, I
started the analysis by coding the events that resulted in the formation and development
of the group: i.e. the setting up or acquisition of new businesses. At the beginning the
analysis was mainly concentrated on examining the direction of growth and the eco-
nomic relationships between the new company and the original company. This resulted
in the tree nodes illustrated in Figure 6.1. For each new company added to the group I
attached two attributes: one specifying whether the company was set up or acquired by
the entrepreneur, the other specifying the relation with the original company (according
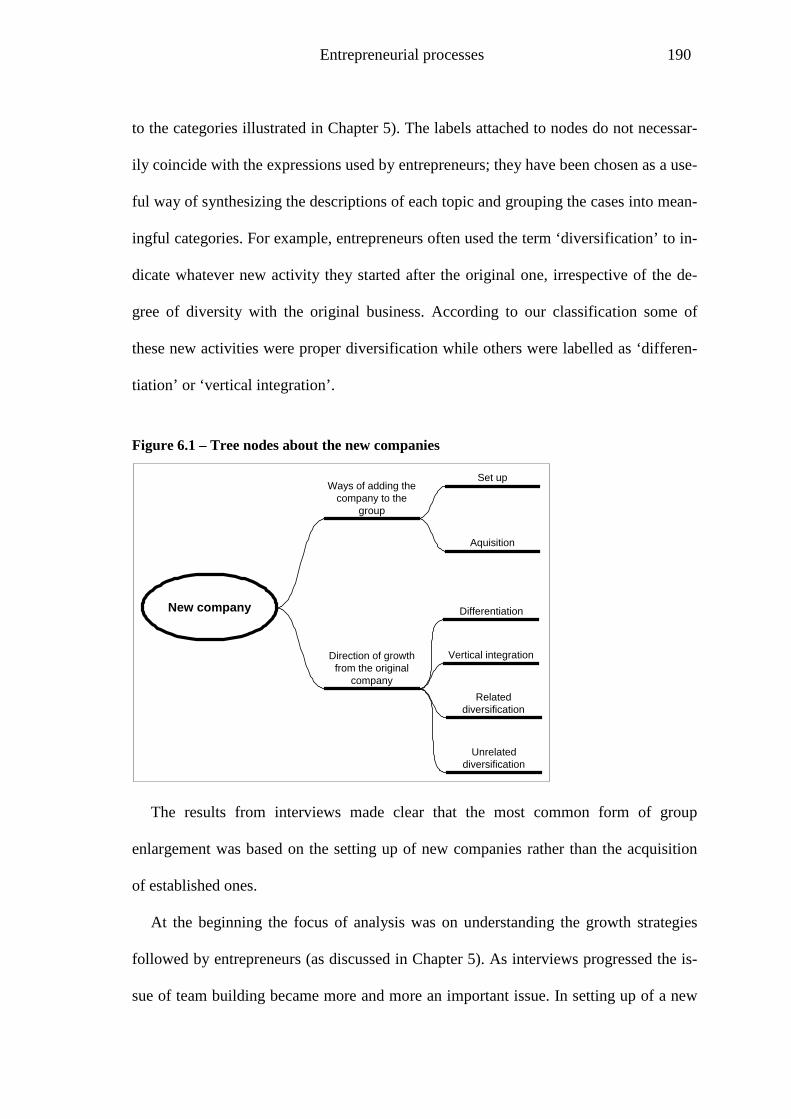
Entrepreneurial processes 190
to the categories illustrated in Chapter 5). The labels attached to nodes do not necessar-
ily coincide with the expressions used by entrepreneurs; they have been chosen as a use-
ful way of synthesizing the descriptions of each topic and grouping the cases into mean-
ingful categories. For example, entrepreneurs often used the term ‘diversification’ to in-
dicate whatever new activity they started after the original one, irrespective of the de-
gree of diversity with the original business. According to our classification some of
these new activities were proper diversification while others were labelled as ‘differen-
tiation’ or ‘vertical integration’.
Figure 6.1 – Tree nodes about the new companies
The results from interviews made clear that the most common form of group
enlargement was based on the setting up of new companies rather than the acquisition
of established ones.
At the beginning the focus of analysis was on understanding the growth strategies
followed by entrepreneurs (as discussed in Chapter 5). As interviews progressed the is-
sue of team building became more and more an important issue. In setting up of a new
New company
Ways of adding the company to the
group
Direction of growth from the original
company
Set up
Aquisition
Differentiation
Vertical integration
Related diversification
Unrelated diversification
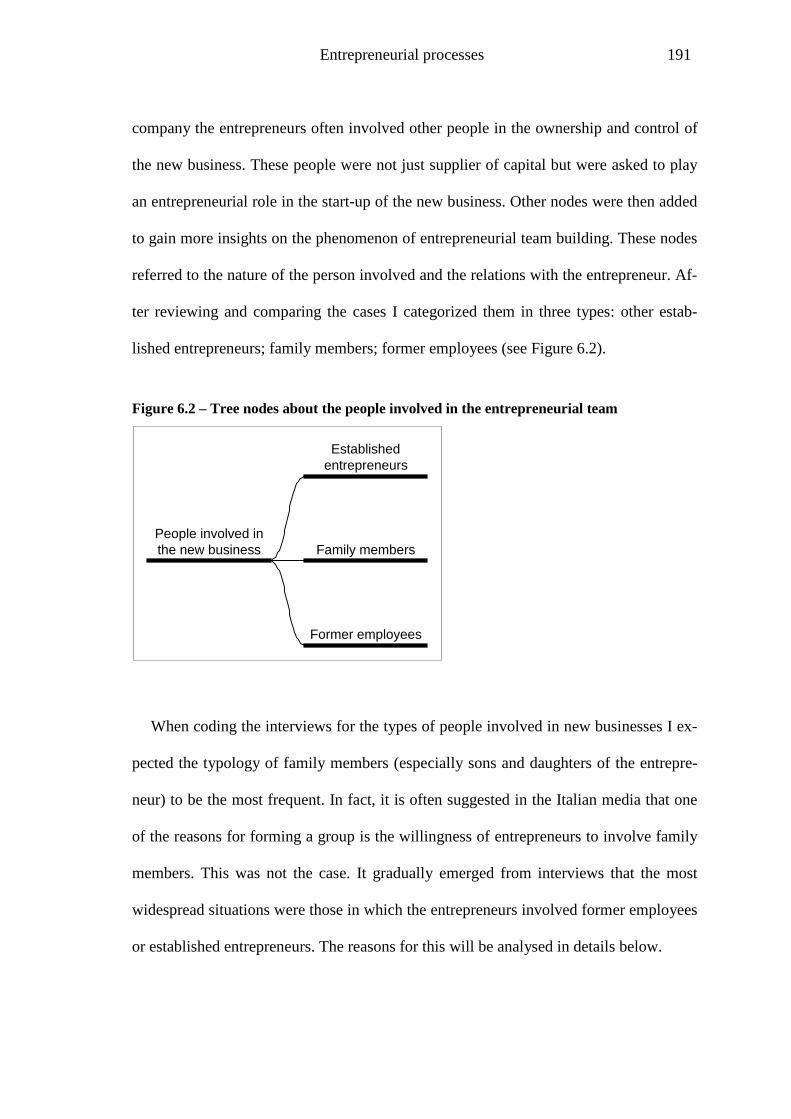
Entrepreneurial processes 191
company the entrepreneurs often involved other people in the ownership and control of
the new business. These people were not just supplier of capital but were asked to play
an entrepreneurial role in the start-up of the new business. Other nodes were then added
to gain more insights on the phenomenon of entrepreneurial team building. These nodes
referred to the nature of the person involved and the relations with the entrepreneur. Af-
ter reviewing and comparing the cases I categorized them in three types: other estab-
lished entrepreneurs; family members; former employees (see Figure 6.2).
Figure 6.2 – Tree nodes about the people involved in the entrepreneurial team
When coding the interviews for the types of people involved in new businesses I ex-
pected the typology of family members (especially sons and daughters of the entrepre-
neur) to be the most frequent. In fact, it is often suggested in the Italian media that one
of the reasons for forming a group is the willingness of entrepreneurs to involve family
members. This was not the case. It gradually emerged from interviews that the most
widespread situations were those in which the entrepreneurs involved former employees
or established entrepreneurs. The reasons for this will be analysed in details below.
People involved in the new business
Established entrepreneurs
Family members
Former employees
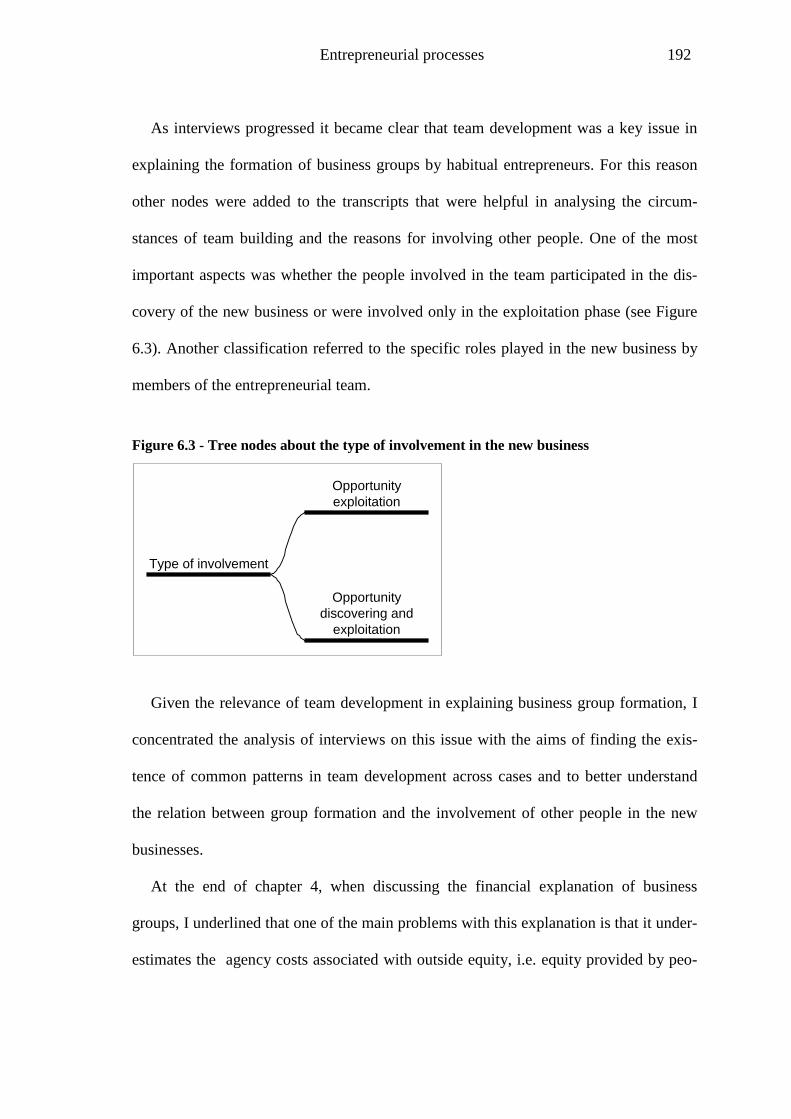
Entrepreneurial processes 192
As interviews progressed it became clear that team development was a key issue in
explaining the formation of business groups by habitual entrepreneurs. For this reason
other nodes were added to the transcripts that were helpful in analysing the circum-
stances of team building and the reasons for involving other people. One of the most
important aspects was whether the people involved in the team participated in the dis-
covery of the new business or were involved only in the exploitation phase (see Figure
6.3). Another classification referred to the specific roles played in the new business by
members of the entrepreneurial team.
Figure 6.3 - Tree nodes about the type of involvement in the new business
Given the relevance of team development in explaining business group formation, I
concentrated the analysis of interviews on this issue with the aims of finding the exis-
tence of common patterns in team development across cases and to better understand
the relation between group formation and the involvement of other people in the new
businesses.
At the end of chapter 4, when discussing the financial explanation of business
groups, I underlined that one of the main problems with this explanation is that it under-
estimates the agency costs associated with outside equity, i.e. equity provided by peo-
Type of involvement
Opportunity discovering and
exploitation
Opportunity exploitation
Entrepreneurial processes 193
ple external to current owner(s) and not involved in the management of the company.
This is especially true in the case of small firms. The presence of agency costs makes it
very difficult to observe the acquisition of minority shares in privately held companies
for financial reasons (i.e. return on invested capital)73
The latter conclusion is strongly supported by the results of the interviews with port-
folio entrepreneurs. When minority shares of a new company have been given to people
outside the entrepreneur’s family, these people became directly involved in the man-
agement of the new company. This means that as the group expands, other people be-
sides the founding entrepreneur assume an entrepreneurial role within the group by ac-
tively participating in the ownership and control of new businesses; i.e. there is an
enlargement of the entrepreneurial team
. This means that either the new
company will be 100% owned by the vertex of the group or that the presence of minor-
ity shareholders is explained by reasons other than the raising of outside equity alone.
74
73 In the case of minority shares acquired by private equity investors (such as venture capitalists), the op-eration requires detailed selection procedures and complex contractual arrangements, both aimed at re-ducing the agency costs associated with it. However, these operations concern a tiny, though qualitatively important, minority of smalls and medium sized businesses, operating in high tech industries. The conse-quences of the high level of agency costs of outside equity, with regard to the Italian private equity indus-try, is underlined by Colombo et al. (2007).
. The survey revealed the presence of different
motivations for such enlargement. Three different patterns emerged: the first is when
joint ventures are set up with established entrepreneurs; the second is when the entre-
preneur gives a stake in the new company to an employee to secure his/her involvement
in the development of the new business (I called this process ‘employee involvement’);
the third pattern is when the new business is established as a result of the inspiration of
74 Ensley et al. (2000) define a team of entrepreneurs as “ ... a group of individuals, each of whom has a significant ownership interest in a small, individually owned and operated business, and each of whom plays a significant role in the management of that business” (Ensley et al., 2000, p. 64). According to Watson at al. (1995a) a venture team is two or more individuals who jointly establish and actively partici-pate in a business in which they have an equity (financial) interest.
Entrepreneurial processes 194
an ‘intrapreneurial’ employee who has played a major role in the discovery and devel-
opment of the business and is given a minority share in the new company.
6.2 Patterns of entrepreneurial team development in business groups
In this section I will examine these three patterns in detail, reporting the quotations of
entrepreneurs about some of the most interesting cases. The quantitative relevance of
the three patterns in the groups interviewed is shown in Table 6.1. For reasons ex-
plained in chapter 3 I consider only domestic production companies (i.e. I exclude for-
eign and financial companies).
About half of the companies owned by the entrepreneurs interviewed involved one of
the three mechanisms mentioned above. In the other cases, the companies are 100%
owned by the entrepreneur or his/her family members.
Of the three patterns involving an enlargement of the entrepreneurial team joint ven-
tures and ‘employee involvement’ are more common than intrapreneurship. One of the
explanations for this is that in the groups interviewed (with only one exception) I did
not observe any ‘codified’ process to accommodate intrapreneurs wanting to develop
their own business. It is possible that the majority of such former employees have sim-
ply left the company to start their own business. For this reason, the majority of cases of
‘intrapreneurship’ that I observed were not part of a ‘codified’ process within the group
and were accommodated by the entrepreneur as and when they emerged. It is also
worthwhile noting that, by definition, I am considering cases in which the entrepreneur
retains the majority share of the new company (i.e. the new company is still part of the
group).
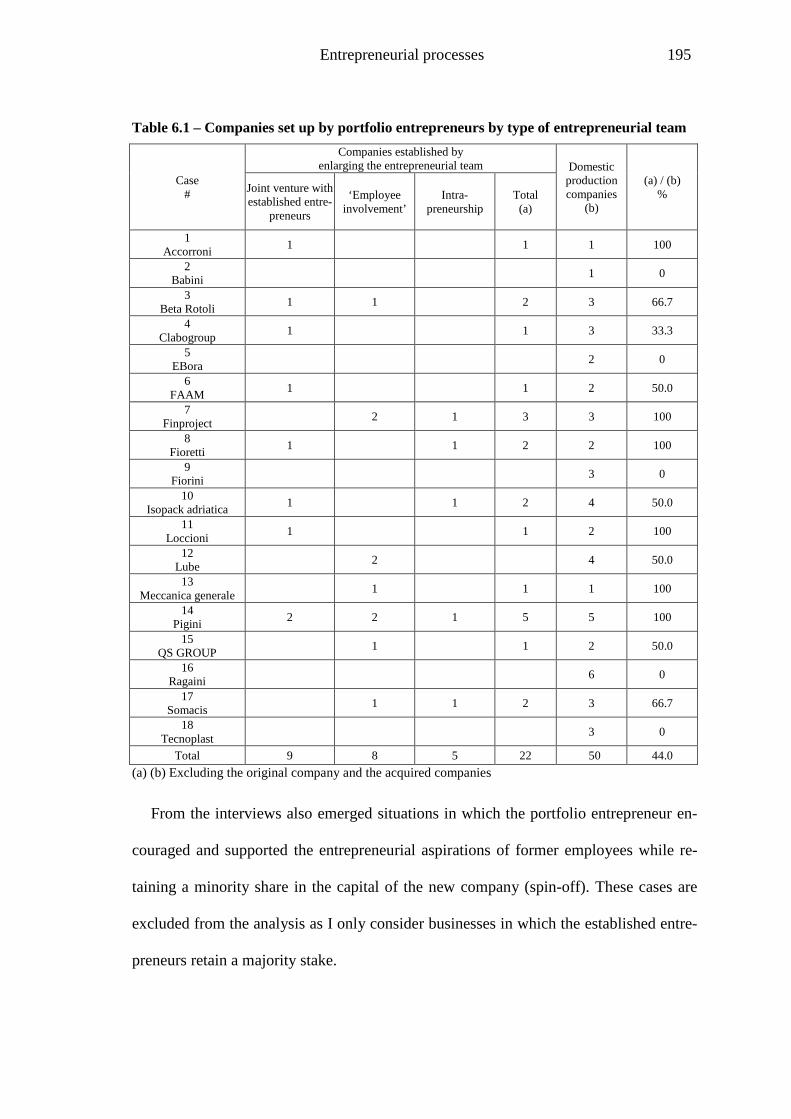
Entrepreneurial processes 195
Table 6.1 – Companies set up by portfolio entrepreneurs by type of entrepreneurial team
Case #
Companies established by enlarging the entrepreneurial team
Domestic
production companies
(b)
(a) / (b) % Joint venture with
established entre-preneurs
‘Employee involvement’
Intra- preneurship
Total (a)
1 Accorroni 1 1 1 100
2 Babini 1 0
3 Beta Rotoli 1 1 2 3 66.7
4 Clabogroup 1 1 3 33.3
5 EBora 2 0
6 FAAM 1 1 2 50.0
7 Finproject 2 1 3 3 100
8 Fioretti 1 1 2 2 100
9 Fiorini 3 0
10 Isopack adriatica 1 1 2 4 50.0
11 Loccioni 1 1 2 100
12 Lube 2 4 50.0
13 Meccanica generale 1 1 1 100
14 Pigini 2 2 1 5 5 100
15 QS GROUP 1 1 2 50.0
16 Ragaini 6 0
17 Somacis 1 1 2 3 66.7
18 Tecnoplast 3 0
Total 9 8 5 22 50 44.0 (a) (b) Excluding the original company and the acquired companies
From the interviews also emerged situations in which the portfolio entrepreneur en-
couraged and supported the entrepreneurial aspirations of former employees while re-
taining a minority share in the capital of the new company (spin-off). These cases are
excluded from the analysis as I only consider businesses in which the established entre-
preneurs retain a majority stake.
Entrepreneurial processes 196
6.2.1 Joint venture with established entrepreneurs
The first pattern is when a new company emerges as a joint venture with established
entrepreneurs. This case is rather widespread across the groups.
“…we had [at the beginning of the seventies] an important customer in Rome to
whom we sold paper rolls for telex. Demand was growing and we decided to buy a
new automatic machine. I talked about the idea to the [above mentioned] customer.
We went to Germany together to see the machine and we then decided to set up a
joint venture for this new production” (Case #3, Beta Rotoli)
I always had the idea that the future of printing was in the rotary press. Then there
was an opportunity with an Italian newspaper that wanted to print in the Marche
region. We set up a new company in which the newspaper company took one third
and we took the remaining two thirds (Case #14, Pigini)
In these and other cases, the involvement of other entrepreneurs is for two reasons: to
raise capital for the initial investment, thus spreading the risk, and to secure the demand
for the new product.
The formation of a joint venture is a common motivation for the setting-up of a new
company. The phenomenon has been studied at length by the managerial literature
which explored the motivations for such alliances, the optimal ownership structure and
the possible causes of success and failure. Most of this literature refers to large firms.
However, some attention has been given to entrepreneurial alliances as a way of enter-
ing new businesses (Hoskisson and Busenitz, 2002; Ripollés-Meliá and Sánchez-
Peinado, 2006). Hoskisson and Busenitz (2002) develop a framework for understanding
when various organizational entry mode choices – corporate venturing, acquisitions and
Entrepreneurial processes 197
joint ventures - are most likely to be appropriate. They identify two key factors explain-
ing corporate choices: market uncertainty (i.e. the lack of knowledge about the future
direction of a market) and learning distance (i.e. the extent to which a firm’s current ca-
pabilities are similar to the capabilities needed for the new business). The authors sug-
gest that joint venture is the most appropriate mode of entry when both market uncer-
tainty and learning distance are high.
Ripollés-Meliá and Sánchez-Peinado (2006) also consider joint ventures by small
firms as an effective way of overcoming entry barriers in new markets. In their study
they find that “…firms prefer methods, such as joint ventures or contractual agreements,
in order to overcome the entry barriers existing in R&D and marketing-intensive sec-
tors. Therefore, empirical evidence confirms the importance of relying on the support of
an incumbent firm in order to access technological assets and market know-how”
(Ripollés-Meliá and Sánchez-Peinado, 2006 , pp. 381-382). Contrary to the Hoskisson
and Busenitz (2002) hypothesis, they find that the degree of diversification between the
established and the new business does not influence the choice of entry mode.
This conclusion is in accordance with the results of case studies, as most of the joint
ventures refer to businesses that are close to the ones already established by the entre-
preneur. From the interviews it emerged that the need for raising additional capital
(spreading of risk) and the reduction of market uncertainty (by involving customers) is
more important than overcoming learning difficulties.
6.2.2 Employee involvement
The second pattern is when a former employee is given a minority stake in a venture
discovered and initiated by the owner-entrepreneur. This is the most interesting pattern

Entrepreneurial processes 198
in terms of its quantitative importance and its significance for this study. The former
employee does not participate in the opportunity discovery phase, but only in new ven-
ture development. The following examples belong to this pattern.
“The new company was set up as a rib of the original company. Initially, the origi-
nal company made both moulds and production lines. The two activities could not
coexist for technical reasons. However, the new company could also work for other
customers. The new company was set up in 1990 with an employee I trusted and
who is now the production supervisor of the new company. I gave autonomy and
trust to this employee.” (Case #15, QsGroup)
“As well as printed circuits, we began to produce membrane keyboards. It was low
technology by our standards. The product was initially developed within the origi-
nal company at the end of the eighties but never reached large volumes. It was a
languishing department because no one was really interested in it. I found a person
who took a 10% share in the new company and who was interested in developing
it… It was an activity that already existed in the original company, but if it had re-
mained there it would have died.” (Case # 17, Somacis)
“In 1975 we decided to split the company in two: the original company remained
focussed on leather soles while the new one (UNITAL) would specialize in the
production of plastic soles... Some of the technicians employed in the original
company became minority shareholders of the new one. They were directly in-
volved in the management of the new company as heads of production depart-
ments. During the following years the group continuously enlarged its product
range to be ready to cover all the needs of both current and potential customers. In
1975 the VBP Leather Sud was created... Also in this company minority shares
Entrepreneurial processes 199
were given to a few technicians who were directly involved in the management of
the company. We needed someone we could trust to manage the specialized facto-
ries. We thought that involving these people in the ownership of the companies was
the best way to get them involved in the management of the companies....” (Case
#7, Finproject)
“In the [now closed] business of professional training there was a group of 5 people
employed in printing. When the business was closed there were two possibilities;
selling the printing activity or starting a company to work for external customers.
The employees started looking for new customers… We then decided to start a new
company. I gave 40 per cent of the ownership to 2 former employees (20% each)
who are responsible for the management of the company. At present it is one of the
largest printing company in central Italy” (Case #14, Pigini)
This pattern is widespread both among and within cases. The association of former
employees in new businesses responds to several, sometimes overlapping, needs. First
the raise of additional capital and the spread of risk. Second to involve people with spe-
cific expertise and competences. Besides the above mentioned needs, from the inter-
views also emerged that an important reason for involving other people in new venture
is to overcome the entrepreneur’s limitations in the availability of time and attention to
dedicate to the start-up of the new business while retaining ownership and control of the
existing ones. When questioned about this the entrepreneurs interviewed responded that
just installing a manager to be in charge was not good enough. A new venture requires
particularly high levels of motivation, interest and dedication. This was combined with
Entrepreneurial processes 200
a shrewd appreciation of the need to prevent employees establishing the same business
in competition and stealing customers75
“This is a design company that we set up at the beginning of the Nineties…. At that
time there was a high request of designers by the mechanical companies of our dis-
trict. We had trained employees that were particularly valuable for the other small
firms… we set up a design company. Employees who wanted to resign were of-
fered a share of the new company. The new company worked for us but also for
other customers … It was a great idea. We retained the three or four people that
wanted to leave and start on their own. It was also a chance for involving other em-
ployees, such as the head of technicians… In this way we were able to stop the
bleeding” (Case #13, Meccanica Generale)
.
6.2.3 Intrapreneurship
The third pattern is when the new venture arises from the activities of an ‘intrapre-
neurial’ employee. In this pattern, the former employee actively participates in the new
business from the opportunity discovery phase. In this case, the portfolio entrepreneur
plays a supporting role (in terms of financial resources, market credibility, network rela-
tionships, etc.) in the development of the new business.
“In the same period [the end of the Seventies] a young man who was employed in
one of our companies and was also a friend suggested we start a commercial activ-
ity that he would supervise. At the beginning my brother and I took a 60% stake
and the former employee 40%. For some years, this company developed the com-
mercial activity but then this employee champed at the bit and started a production
75 We will examine these aspects in more detail in the last section of this chapter.
Entrepreneurial processes 201
activity for one of our companies … This new company grew rapidly, driven by
this former employee and helped financially and commercially by the group.”
(Case #8, Fioretti)
“There was a designer who was employed for some time in a company of the
group. He had a difficult character. After some time he resigned and went to France
to work for a cartoon firm. I had always wanted to enter the cartoon industry. After
a few years he resigned from the French firm and came back to Italy and proposed
some ideas to me. I proposed setting up a company together. I gave him 30% of the
new company although he did not pay anything in cash.” (Case # 14, Pigini)
“... a former employee of our main supplier of plastic material (compound) sug-
gested we start a company for producing this plastic material. As we were not satis-
fied of with suppliers of raw materials (both in terms of quality and price) we set
up a new company producing plastic granules for soles. We gave a minority share
(25%) to the technician who suggested this new activity (he was a chemist) and
who took the main responsibility for running the company.” (Case #7, Finproject)
In all the cases the original entrepreneur retained control of the new company, al-
though giving a significant stake to the former employee. The latter played the key role
both in structuring the new business and in developing it; moreover, the new business
received full support from the established entrepreneur and remained part of the group.
Overall, the interviews show that whatever the nature of the associated entrepreneur -
established entrepreneurs or former employees - the development of an entrepreneurial
Entrepreneurial processes 202
team to structure and exploit new business opportunities is an important aspect associ-
ated with the setting up of new companies by established entrepreneurs76
When the enlargement of the entrepreneurial team involves a former employee, es-
tablished entrepreneurs are using two different skills. In the first pattern (employee in-
volvement) the entrepreneur is recognising and utilising the entrepreneurial attitudes of
employees to manage the new venture creation phase. In the second pattern (intrapre-
neurship) the established entrepreneur is accommodating the intrapreneur’s project
within the group to his/her benefit. It is not by chance that people involved in the
enlargement of the entrepreneurial team were former employees. In fact, the employee
relationship allowed the entrepreneur to evaluate the entrepreneurial attitude of his/her
employees and develop the necessary trust in order to get them on board and part of the
entrepreneurial team.
.
The work of the resulting team is rather different according to the history and the
present structure of groups. Normally, the associated entrepreneurs are only involved in
the management of one company with, little or no involvement in the other companies
of the group. It is only the founding entrepreneur and members of his/her family who
play a pivotal role for the group as a whole.
6.3 Entrepreneurial teams and business groups dynamics
From the interviews it emerged that the development of a group of companies and
the associated enlargement of the entrepreneurial team, is particularly important for
76 The involvement of former employees is far more common than the involvement of an entrepreneur’s family members. This challenges a thesis put forward by some Italian researchers according to which one of the main reasons for the presence of business groups is the willingness of entrepreneurs to give entre-preneurial roles to family members, sons in particular (Depperu and Capello, 1990).
Entrepreneurial processes 203
supporting new venture creation. The setting up of a legal independent company is es-
pecially important in the new venture creation phase. This was expressed very clearly
by one entrepreneur:
“The logic behind these new companies is as such: [the original company] experi-
ments on new activities and new products. As soon as it sees that the latter are
promising business a new company is set up with the aim of developing the new
activity. This is done because it is possible to create a healthy competition between
the different activities, motivating people responsible for them to produce more and
better. At the same time the relative performance of the different activities are more
easily measurable and comparable. For a new business you need a new, focused,
organization”. (Case #6, FAAM)
Once the ventures have been developed, rationalization in managing established ac-
tivities prevails. In some cases this has resulted in the merger of part or all the compa-
nies of the group.
In two of the cases examined (case #7 and case #15) after having set up a group of
several companies, the entrepreneurs then decided to merge most of the production
companies and set up a multidivisional company. This was now motivated by manage-
rial efficiency.
“In 1989 we decided to rationalize the group … and decided to merge the different
companies. Despite the merger, from an operational point of view the factories re-
mained autonomous. Specialization was retained at the level of production units.”
(Case #7, Finproject)
Entrepreneurial processes 204
“In 2003 we decided to merge all these companies [those production units operat-
ing in the same sector: i.e. industrial automation]. Within the new company we
created four divisions that reproduced the specialization of the merged companies.”
(Case #15, QS GROUP)
The collapse into a divisionalised organization is less likely when the group has been
developed through the enlargement of the entrepreneurial team, given the reduced
autonomy and motivation of the associated entrepreneur who is now managing a divi-
sion rather than an independent company. Another problems arising from the merging
of companies in a group is how to determine the value of a minority share in an individ-
ual company and transform it into a minority share of the group as a whole.
The case study cited above (#7, Finproject) is particularly relevant in this regard77
77 For the whole story of the group see Appendix D.
.
The group was formed by entering into different segments of the same market (footwear
soles) but also integrating activities along the production chain (production of plastic
compound). In each of these companies, there were different minority shareholders who
helped the entrepreneur in the start-up of the new companies. According to the entre-
preneur, the existence of buying and supplying relationships between the companies
within the group was a potential source of conflict of interest between shareholders and
the companies of the group. For this reason, he decided to merge most of the companies
forming the group. The minority shares in the single companies were transformed into
minority shares in the merged company; for example, the 25% shareholder that helped
with the setting up and running of the company producing plastic compound for the
companies producing soles was given an 8% share in the new company. Besides the
Entrepreneurial processes 205
problems in determining the values of shares in the individual companies, the new or-
ganization inevitably reduced the autonomy of the different business units and reduced
the role of their former CEO to a head of a division. It is also for this reason that the
former shareholder of the compound company later exited from the group ownership,
due to disagreements with the entrepreneur about the strategy of the group.
“We merged the different companies to avoid a possible conflict of interests be-
tween shareholders, as there were complex buying-supplying relations between
companies. We made the valuations of the different companies and determined the
exchange rates between shares. All the shareholders of the different companies be-
came shareholders of the merged company... The shareholder who had 25 per cent
of one company [producing plastic compound] became a 8 per cent owner of the
merged company. He did not agree with the merger as the activities of the com-
pound business were growing faster than the other businesses of the group. Eventu-
ally he sold his share in the group” (Case #7, Finproject)
The latter case points out to the more general question of the dynamics of entrepre-
neurial teams. In all the cases examined, the presence of a ‘dominant’ entrepreneur is a
clear feature; this is the entrepreneur who started the original company and who retains
the majority of ownership in all the companies of the group.
Harper (2008) defines the situation where there is a lead entrepreneur and at least one
sub-entrepreneur as a ‘nested entrepreneurial team’.
“The nested entrepreneurial team applies hierarchical principles of direction and
subordination. ... The lead entrepreneur creates and propagates an overarching
business conception or vision for the team. He communicates and imposes a new
overarching ends-means framework that serves to fix the parameters within which
Entrepreneurial processes 206
the subentrepreneur discovers and exploits localized opportunities.” (Harper, 2008,
p. 622)
These hierarchical principles partially apply in the case of ‘employee involvement”.
In the case of ‘intrapreneurship’, the role of the associated entrepreneur is more proac-
tive than is hypothesized in the ‘nested’ schema. However, the employees who have
been given an entrepreneurial role in new ventures play a more pro-active role in its
structuring and development than is hypothesized by Harper (2008) in the interaction
between a lead entrepreneur and a sub-entrepreneur. This is why I prefer the term
‘dominant entrepreneur’ and ‘associate entrepreneur’ (rather than “lead” and “sub”)
when referring to the different roles played by members of the entrepreneurial teams in
business groups. The person who is associated to the entrepreneurial team in a specific
business is the primary responsible in the start-up and management of that business.
Previous empirical studies have demonstrated that even when it is possible to iden-
tify a lead entrepreneur (i.e. someone who is in a position to control the entrepreneurial
team) there is no evidence to support the hypothesis that lead entrepreneurs possess
greater skills than other entrepreneurial team members (Ensley et al., 2000, p. 70). In
fact, in some of the case studies (the Rainbow company within the Pigini group and the
RICO company within the Fioretti Group) the venture managed by the associated entre-
preneur experienced great success and over the years ended up as one of the biggest
companies in the group. In both cases, this also resulted in an increase of the share of
the associated entrepreneur in the two companies.
Case #8, Fioretti – “The new company was growing rapidly. I told the minority
partner [who was responsible for managing the company] that I would give him
Entrepreneurial processes 207
50% of the company if it reached the same turnover as the main company of the
group. This happened at the end of the nineties. I had never thought of owning a
company as a joint venture but I made this promise and I had to keep it.”
Kamm et al. (1990) recognize that the distribution of ownership in an entrepreneurial
team may be equal or unequal. However there is little theoretical work or empirical evi-
dence about what causes this distribution and how it evolves over time. In business
groups the ownership distribution at start-up has the main function of distinguishing the
roles between the dominant and the associated entrepreneur. Minority shares are in-
strumental in the involvement of other people in the start-up and management of new
ventures; the majority share is what allows the portfolio entrepreneur to maintain a
‘dominant’ position. Even if the new venture is the responsibility of the associated en-
trepreneur, through the majority share the portfolio entrepreneur retains the right to in-
tervene in the control of the new business at any time.
The empirical survey demonstrates that the formation of a business group allows en-
trepreneurs to form a wide range of team patterns according to the characteristics of the
new venture, the circumstances that led to its start-up and the people involved. It also
demonstrates that the roles within the team change over time according to the perform-
ance of new ventures.
While, the ‘dominant entrepreneur’ can play different roles in the individual compa-
nies of the group, it is difficult to have more than one dominant entrepreneur within the
same group. There was more than one dominant entrepreneur in those cases where the
original business was founded by more than one entrepreneur with no clear prevalence
of one over another: in the Clabo Group and the Fiorini groups they were two brothers;
Entrepreneurial processes 208
in the Babini group they were two close friends. In all three cases, the group eventually
broke up and the two entrepreneurs retained a part of the group each.
“My brother is a good person and is very clever at doing things by himself. For this
reason he does not like delegating. At the end of the nineties we had about one
hundred employees and had good prospects of entering foreign markets. We made
a commercial agreement with a large company in northern Italy but we were unable
to serve it adequately because we retained an artisan rather than industrial philoso-
phy … [At that time] the main business was customized furnishings [for bars]; the
other business [standardized ice cabinets] was considered as subordinate to the
main one. My vision was the opposite, to keep the artisan production as a support
for the industrial products … The reason for separating was a different business
philosophy. Besides this there were also disagreements on the ways family mem-
bers should be involved in managerial positions… Eventually we came to the point
where we decided to separate and each of us took one of the companies” (Case #4,
Clabogroup).
The problems that can arise if there are two dominant entrepreneurs in the same
group demonstrate that a business group in the small business sector should be consid-
ered as a whole, subject to a unique vision and strategy, rather than a portfolio of differ-
ent businesses. This is also further evidence that entrepreneurial teams can have both
advantages and disadvantages, especially when considered over a long period of time
rather than just at the start up phase (Cooney, 2005). Entrepreneurial teams are more
likely to survive when there is heterogeneity in team composition and in the distribution
of power within the team members rather than when there is a team of peers. This is
true for the individual companies and for the group as a whole.
Entrepreneurial processes 209
6.4 Propositions emerging from the qualitative analysis
The results that emerge from the analysis of the interviews with portfolio entrepre-
neurs can be synthesized in the following propositions about business group formation
and dynamics:
Proposition 1: Business groups are the result of the development of new businesses by
established entrepreneurs, mainly inspired by related diversification
opportunities.
Proposition 2: The setting up of a new company is especially advantageous in the
start-up phase, as it helps to focus resources on the development of the
new product, process or service. When the activities reach their mature
stage, companies are more likely to be merged as a result of a rationali-
zation process.
Propositions 3: The setting up of a new company is more likely when portfolio entre-
preneurs need to enlarge the entrepreneurial team, both to exploit op-
portunities he/she already discovered or to accommodate and support
business opportunities discovered by novice entrepreneurs.
Proposition 4: The accommodation of outsiders can be crucial in maximising the
growth potential of the new venture, through providing energy, knowl-
edge and commitment to the success of the new venture, which the
portfolio entrepreneur cannot do him/herself owing to other commit-
ments.
Proposition 5: The entrepreneurial teams developed by habitual entrepreneurs are pre-
dominantly formed by former employees. This is because the employee
Entrepreneurial processes 210
relation allows the entrepreneur to evaluate the entrepreneurial attitude
of the employee and develop the trust relationship needed to make him
or her part of the entrepreneurial team.
Proposition 6: Groups developed by enlarging the entrepreneurial team are less likely
to collapse into a divisionalised structure when the development phase
of the new businesses is complete.
The fundamental process explaining business group formation in the small business
sector is new venture creation by established entrepreneurs. Until now, the reasons for
giving legal autonomy to new ventures were associated with the degree of diversifica-
tion of the new venture from established ones and/or to the need to raise external capi-
tal. The results of the empirical survey suggest that there is another important reason for
explaining business group formation by habitual entrepreneurs: the development of an
entrepreneurial team through the involvement of other people in the ownership and con-
trol of new ventures. The empirical analysis showed that this is done for three main rea-
sons: the formation of joint ventures with established entrepreneurs; the deployment of
employees’ entrepreneurial attitudes to enhance the success and growth possibilities of
the new ventures; and the accommodation of entrepreneurial projects proposed by intra-
preneurs. As reported by entrepreneurs interviewed, the employer-employee relation-
ship gives the entrepreneur the advantage of familiarity with the attitudes of the em-
ployee and a stronger basis for developing the trust needed to bring him/her onto the en-
trepreneurial team.
Several questions on the mechanisms involved in the enlargement of the entrepreneu-
rial team need to be theoretically explained and better understood. Established entrepre-
Entrepreneurial processes 211
neurs are supposed to be more experienced than their employees in new venture crea-
tion; therefore, why is there a need to involve other people for developing the new busi-
ness? What are the limits that established entrepreneurs are trying to overcome? If, as
emerged from case studies, the raising of external capital is not the main motivation for
involving other people in the development of new ventures, why do they receive minor-
ity shareholdings? Why not use other organizational arrangements that would achieve
the same aim without modifying the ownership structure of new ventures?
To answer these questions it is necessary to analyse the resources and capabilities
needed by established entrepreneurs when creating new ventures and how they can be
provided or enhanced by enlarging the entrepreneurial team. I will also discuss why
ownership is a critical attribute for people who play an entrepreneurial role in new busi-
ness development.
Model of business group development 212
Chapter 7 - A model of business group development in the small busi-
ness sector
This chapter develops a conceptual model to explain the reasons for the formation of
business groups in the small business sector. Specifically, the model highlights the role
of entrepreneurial processes (i.e. those associated with the exploitation of new business
opportunities) as determinants for business group formation. In doing so, this chapter
integrates the results of the empirical analysis carried out in the previous chapter. It also
discusses some theoretical models that help explain the results synthesized in the propo-
sitions advanced at the end of chapter 6.
The results that emerge from the analysis of case studies are in accordance with
models of entrepreneurship that focus on the distinction between managerial and entre-
preneurial tasks (Holmes and Schmitz, 1990) and that stress the importance of time al-
location between established businesses and new ones (Gifford, 1998). The latter aspect
has been somewhat overlooked by the empirical literature on habitual entrepreneurs and
yet it is fundamental for a better comprehension of observed phenomena.
The chapter is organized as follows. Section 1 highlights the importance of new ven-
ture creation in SMEs and analyses the mode of organizing these new ventures by port-
folio entrepreneurs. Section 2 discusses the problem of time allocation between estab-
lished and new businesses faced by portfolio entrepreneurs. Section 3 reviews the entre-
preneurial processes involved in new venture creation and discusses why ownership is a

Model of business group development 213
key requisite. Section 4 synthesises the main results of the thesis and develops a concep-
tual model to explain business groups formation in SMEs.
7.1 New venture creation in SMEs and mode of organising
Literature on corporate entrepreneurship has emphasised the importance of new
business creation for established company growth and profitability (Burgelman and
Sayles, 1986; Zahra et al., 1999b). Entering into new businesses can be important for
fostering growth in the case of small firms as well78
When SMEs enter new businesses, the role of the entrepreneur remains fundamental.
Indeed, in SMEs the entrepreneur retains key positions in the ownership, control and di-
rection of the firm. If the ability to recognise and exploit new business opportunities af-
ter the first start-up is fundamental for the success of entrepreneurs and the growth of
SMEs, it would be interesting to analyse the factors that influence this ability.
. This is for several reasons: a) as a
result of a strategy of product differentiation, given the increasing segmentation of mar-
kets; b) as a way of securing the supply of key services or components (vertical integra-
tion); c) as a result of the difficulties in expanding the established business which en-
courages a related diversification strategy; d) as a way of reducing financial risk when
the entrepreneur’s wealth is concentrated in one business.
The literature on habitual entrepreneurs has focussed on the entrepreneur’s learning
process and human capital accumulation (see Section 2.4).
78 The relevance of new venture creation as determinants of growth in SMEs has been somewhat over-looked by researchers. Indeed, it is usual to think of SMEs as organizations devoted to a specific prod-uct/market combination. According to this view, the growth of SMEs is normally associated with the ex-pansion of activities within the same business. Thus, the main obstacles to SME growth have usually been associated with the attraction of resources (see the abundant literature on the finance gap) or to do with the coordination of those resources as the size increases and firms pass through different stages of growth (Steinmetz, 1969; Greiner, 1974; Churchill and Lewis, 1983).
Model of business group development 214
Ucbasaran et al. (2003a) suggest that entrepreneurs attract other people to join the
ownership and control of new ventures to compensate for his/her personal human capi-
tal deficiencies. Building an entrepreneurial team seems particularly important for main-
taining control of multiple businesses (Slevin and Covin, 1992); empirical studies found
that portfolio entrepreneurs are more likely than novice entrepreneurs to start new busi-
nesses with teams rather than as sole owners (Westhead and Wright, 1998a; Alsos et al.,
2006).
Within the human capital accumulation hypothesis, this evidence is rather puzzling:
an habitual entrepreneur should have more knowledge, skills, network capability and fi-
nancial wealth than a novice entrepreneur, allowing them to start new businesses by
him/herself rather than by building an entrepreneurial team. The most cited explanation
for this evidence is that of ‘human capital integration’. When habitual entrepreneurs ex-
pand the scope of their business activity by setting up or acquiring new businesses, they
need partners to gain access to a greater depth of expertise as well as access to wider
networks (Ucbasaran et al., 2008, p. 64). This explanation seems appropriate when the
entrepreneur involves other entrepreneurs with demonstrated experience and capabili-
ties in specific activities (the joint venture type discussed in the previous section); it
seems less appropriate when ‘novice’ entrepreneurs, such as former employees, are in-
volved.
The interviews with entrepreneurs revealed another issue that is particularly relevant
in the case of portfolio entrepreneurs; the development of a new business generates a
conflict in allocating time and attention between the running of established businesses
and the development of new ones. This issue has not been given much importance by
Model of business group development 215
the literature on habitual entrepreneurship, although it is sometimes referred to in gen-
eral discussions of the phenomenon (Rosa, 1998).
The allocation of time and attention by entrepreneurs is critical for the start-up of
new ventures as it involves a high degree of pro-activity and cannot easily be delegated.
It must be done by the entrepreneur him/herself or by people playing an entrepreneurial
role. In the case of portfolio entrepreneurs, this generates a trade-off between the time
and attention he/she can dedicate to established businesses rather than exploiting new
business opportunities. This trade-off can be mitigated by involving other people in the
start-up of the new business. This problem is highlighted by Rosa (1998) referring to the
diversification strategy of a portfolio entrepreneur operating in the advertising sector:
“His diversifications start with a strategic wish to start operating in a new market
area, but the start-up of the new business does not take place until the right market
opportunity and the right managing director is found to delegate to and run it. ...
Under this model of diversified growth, there is no theoretical limit to expansion,
as long as capable managing directors can be found and motivated to run the new
businesses.” (Rosa, 1998, p. 53)
Because habitual entrepreneurs are supposed to be among the ‘capable’ people to
start up and run the new business, it is clear that the main reason for involving other
people arises from the time constraints of the portfolio entrepreneur, given his/her in-
volvement in managing the previously established businesses. In the previous citation,
Rosa refers to the people involved in the new businesses as ‘managing directors’; this
seems to indicate that they are salaried managers, rather than owners of the new busi-
ness.
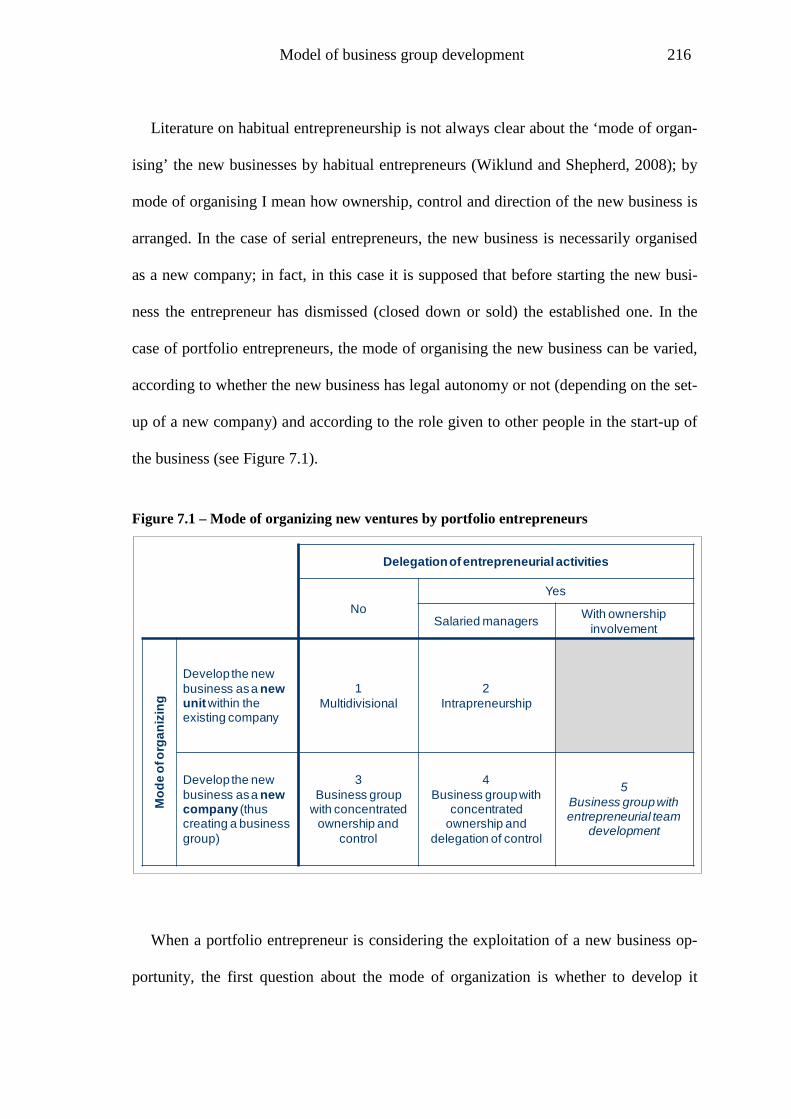
Model of business group development 216
Literature on habitual entrepreneurship is not always clear about the ‘mode of organ-
ising’ the new businesses by habitual entrepreneurs (Wiklund and Shepherd, 2008); by
mode of organising I mean how ownership, control and direction of the new business is
arranged. In the case of serial entrepreneurs, the new business is necessarily organised
as a new company; in fact, in this case it is supposed that before starting the new busi-
ness the entrepreneur has dismissed (closed down or sold) the established one. In the
case of portfolio entrepreneurs, the mode of organising the new business can be varied,
according to whether the new business has legal autonomy or not (depending on the set-
up of a new company) and according to the role given to other people in the start-up of
the business (see Figure 7.1).
Figure 7.1 – Mode of organizing new ventures by portfolio entrepreneurs
When a portfolio entrepreneur is considering the exploitation of a new business op-
portunity, the first question about the mode of organization is whether to develop it
Delegation of entrepreneurial activities
NoYes
Salaried managers With ownershipinvolvement
Mod
eof
org
aniz
ing
Develop the new business as a new unit within the existing company
1Multidivisional
2Intrapreneurship
Develop the new business as a new company (thus creating a business group)
3Business group
with concentrated ownership and
control
4Business group with
concentrated ownership and
delegation of control
5Business group with entrepreneurial team
development
Model of business group development 217
within the boundaries of the established company (as a new business unit) or as a new
company. Together with this choice, it must also be decided whether and to what extent
to involve other people playing an entrepreneurial role. In the case of a business unit
developed within the established company, the involvement of other people is based on
employee-employer relationships; incentive contracts based on performance measures
can be arranged with people involved in the development of the new business; however,
the ownership structure of the new business remains the same as the established com-
pany.
When the new business is developed as a new company, more options are open to the
entrepreneur in terms of the ways of organising the ownership, control and management
of the new business. All the three possibilities comprised in the bottom part of Figure
7.1 have been observed in the case studies: new companies owned and controlled by the
established entrepreneur with no involvement of other people in the entrepreneurial ac-
tivity; new companies fully owned by the entrepreneur but with salaried managing di-
rectors; new companies in which other people are given a minority stake in order to
strengthen their involvement in entrepreneurial activity.
Involving other people in the start-up of a new company is crucial for the ability of
portfolio entrepreneurs to exploit new business opportunities; this is done not just for
financial motives (raising outside equity) or capability constraints, but to overcome the
limits of portfolio entrepreneurs in allocating time and attention between established
and new businesses. There are two conditions for the success of such involvement: i)
the first is that the person involved in the start-up of the new venture must be trusted by
the entrepreneur both in terms of expected behaviour and entrepreneurial attitudes; ii) to
assume an entrepreneurial role the person involved in the start-up of the new venture
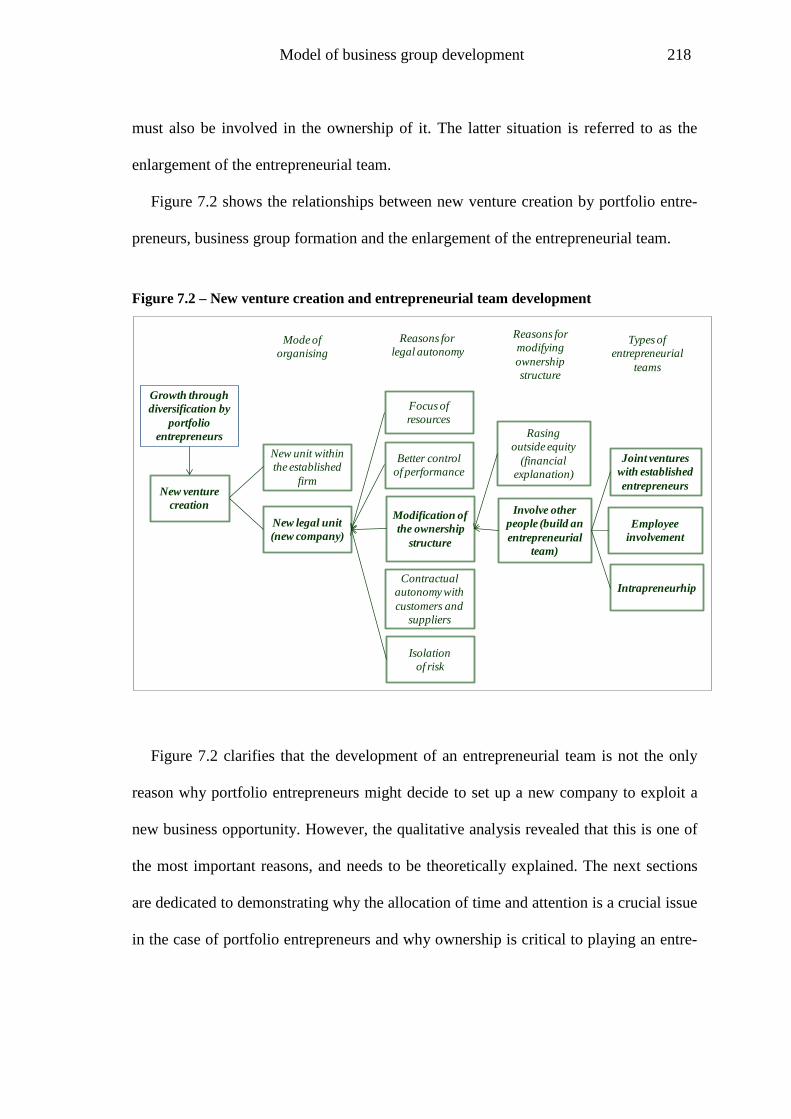
Model of business group development 218
must also be involved in the ownership of it. The latter situation is referred to as the
enlargement of the entrepreneurial team.
Figure 7.2 shows the relationships between new venture creation by portfolio entre-
preneurs, business group formation and the enlargement of the entrepreneurial team.
Figure 7.2 – New venture creation and entrepreneurial team development
Figure 7.2 clarifies that the development of an entrepreneurial team is not the only
reason why portfolio entrepreneurs might decide to set up a new company to exploit a
new business opportunity. However, the qualitative analysis revealed that this is one of
the most important reasons, and needs to be theoretically explained. The next sections
are dedicated to demonstrating why the allocation of time and attention is a crucial issue
in the case of portfolio entrepreneurs and why ownership is critical to playing an entre-
Growth through diversification by
portfolio entrepreneurs
Mode of organising
Reasons for legal autonomy
Types of entrepreneurial
teams
New venture creation
New legal unit (new company)
New unit within the established
firm
Modification ofthe ownership
structure
Isolation of risk
Better control of performance
Focus of resources
Reasons for modifying ownership structure
Involve other people (build an entrepreneurial
team)
Rasing outside equity
(financial explanation)
Employee involvement
Intrapreneurhip
Joint ventures with established entrepreneurs
Contractual autonomy with customers and
suppliers
Model of business group development 219
preneurial role; both questions are important for understanding why portfolio entrepre-
neurs choose to set up a new company when exploiting a new business opportunity.
7.2 The time constraints of portfolio entrepreneurs
The issue of time allocation has not received much attention in the literature on ha-
bitual entrepreneurs, although it is accounted for in some theoretical models of serial
and portfolio entrepreneurship. Two models are particularly interesting for the purposes
of this research: the Holmes and Schmitz (1990) model and the models proposed by
Gifford (1992b, 1992a). All these models rely on the distinction between ‘entrepreneu-
rial’ and ‘managerial’ activities. The entrepreneurial activity is defined by Gifford as:
“...the perception of an opportunity for profit and the necessary decision making
for, and acceptance of responsibility for the outcome of, its exploitation.” (Gifford,
1998, p. 5).
In the case of the Holmes and Schmitz (1990) model, the distinction between entre-
preneurial and managerial activity is even simpler: “There are two tasks in the econ-
omy, developing products and producing products previously developed” (Holmes and
Schmitz, 1990, p. 267). The first task is performed by entrepreneurs, the second by
managers. Both the Gifford (1998) and the Holmes and Schmitz (Holmes and Schmitz,
1990) models assume the presence of different individual specialization; i.e. they as-
sume the presence of differences in the ability of individuals to perform entrepreneurial
rather than managerial activities. These differences can be the result of different factors:
attitudes toward risk, ‘innate’ quality, learning and experience, investment to enhance
entrepreneurial capabilities, etc. Whatever the origin of these differences, there are al-
Model of business group development 220
ways people who are more willing to act as entrepreneurs and people who prefer to
work as salaried employees. This assumption is also commonly found in the literature
on habitual entrepreneurs (Alsos and Kolvereid, 1998), although its consequences in
explaining the behaviour of portfolio entrepreneurs are not developed79
The Holmes and Schmitz (1990) model explains the presence of serial entrepreneurs
based on differences in individual abilities to develop business opportunities (start-ups).
When entrepreneurial abilities are not evenly distributed among the population, it pays
for some individuals to specialise in developing new businesses while others specialise
in managing already established businesses. People specialising in entrepreneurial activ-
ity (entrepreneurs) will be involved in successive start-ups. The model assumes that
each individual is endowed with an indivisible time unit in each period so that s/he has
to choose whether to spend this time managing a previously established business or
starting a new one. If the latter course of action is decided on, the entrepreneur must
discontinue (close) or sell the previous business (i.e. the model allows for serial but not
portfolio entrepreneurs). The Holmes and Schmitz (1990) model is somewhat extreme
in its assumptions of an indivisible time unit in each period although it explicitly recog-
nises one of the most important resources of entrepreneurs - their time.
.
The problem of allocating time between alternative tasks is particularly relevant in
the case of portfolio entrepreneurs; those entrepreneurs that start new businesses while
retaining ownership and control of the previous ones. The literature on habitual entre-
79 There are other models of entrepreneurship based on individual specialization. Kihlstrom and Laffont (1979) propose a model in which individuals differ in their attitude toward risk; more risk-averse indi-viduals become workers (fixed-wage employees) while less risk-averse individuals become entrepreneurs (receive risky profits from running firms). The model assumes that all individuals are equal in their ability to perform entrepreneurial as well as “normal” labour functions and they differ only in their willingness to bear risks. A weakness of this model (from the point of view of this thesis) is that it does not distin-guish between starting up a firm and managing it; both tasks are assumed to be entrepreneurial (i.e. risk bearing) activities.
Model of business group development 221
preneurs generally does not consider this problem, assuming that the time available to
entrepreneurs is unlimited, or that there are no agency costs in delegating the running of
established businesses to hired managers. This is an extreme hypothesis as the indivisi-
ble time unit of the Holmes and Schmitz (1990) model. The reality is something in be-
tween: when a new business opportunity arises, portfolio entrepreneurs have to decide
how to share their time between the management of established businesses and the start-
up of new ones.
This problem is at the core of the entrepreneurial models developed by Gifford
(Gifford, 1992a, 1998). Her models focus on the consequences stemming from the allo-
cation of limited entrepreneurial attention between current activities (the management
of established businesses) and the search for new opportunities and their exploitation.
This means recognising that entrepreneurial activity has an opportunity cost and that in
the case of portfolio entrepreneurs this opportunity cost refers not only to the alternative
of a salaried job (as in the case of a novice entrepreneur) but also to the attention paid to
the management of established businesses.
The key aspect of the Gifford model is that “… the entrepreneurial role of being alert
to profit opportunities and deciding how to reorganize productive resources to capture
those profits requires the entrepreneur’s attention, which, like anyone else’s, is limited.”
(Gifford, 1998, p. 6). The use of the term ‘attention’ rather than time is not by chance:
giving attention to specific tasks means not only dedicating time to them but also em-
ploying the physical and mental resources so that the allocation of time is productive.
Attention is synonymous with dedication, commitment, obligations to other people,
diligence, enthusiasm and will. Though some of these attributes are also relevant in the
case of managerial work, they are especially relevant in the case of entrepreneurial ac-
Model of business group development 222
tivities as they imply the fulfilment of ‘non-routine’ tasks within an uncertain environ-
ment.
“The type of decisions I have in mind as requiring entrepreneurial attention are the
ones that cannot be routinized, that require individual consideration of the unique
circumstances of each decision” (Gifford, 1992b, p. 293).
Possessing entrepreneurial capabilities is not enough for starting a new venture; peo-
ple also need the motivation to spend their time and give their attention to this task
rather than other possible tasks.
7.3 Entrepreneurial activity and ownership
Business entry (start- up) is a fundamentally different activity than managing a busi-
ness (Gartner and Vesper, 1994). The main entrepreneurial activities (and decisions) in-
volved in the start-up of a new business are the following:
a) setting the objectives and the plan of activities;
b) contracting with suppliers to attract necessary resources and communicating with
customers about the new product or service;
c) hiring, monitoring and compensating the employees involved in the new venture.
It is questionable why these activities are classified as ‘entrepreneurial’ rather than
‘managerial’; managers responsible for a business do the same things. What distin-
guishes ‘entrepreneurial activity’ from ‘managerial activity’ is, above all, the context in
which these activities are performed. Entrepreneurial activities are those performed be-
fore and after the start-up. Decisions taken around the start-up (and the resulting activi-
ties) are subject to what is defined as ‘structural uncertainty’ (Knight, 1921; Kirzner,
Model of business group development 223
1979). Structural uncertainty is a situation for which there is no past experience to rely
upon and where the decision maker is partially ignorant about possible alternatives and
their consequences (Langlois and Robertson, 1995; Sautet, 2000). This situation re-
quires interpretation and judgment about technology and market information and a high
level of pro-activity in decision making; it requires imagination and critical judgment in
identifying problems and in generating and evaluating trial solutions (Harper, 1996).
Moreover, decisions must be continuously adjusted to results and this requires a high
degree of attention and commitment by people responsible for them. For these reasons
there is also less scope for delegating the decision making process and resulting activi-
ties.
Recent studies have stressed that the entrepreneur’s role involves not just the ability
to ‘recognise’ existing opportunities, as if they were objectively present in the environ-
ment waiting only for someone to grasp them. Their recognition implies a creative way
of organising the abundant and disparate information from the environment in order to
build new business opportunities (Baron, 2004; Ward, 2004). Thus, what is critical in
new venture creation is not opportunity recognition but rather the exploitation of the
perceived opportunity. This view is effectively synthesised by Ardichvili et al. (2003, p.
113) according to whom: “While elements of opportunities may be ‘recognized’, oppor-
tunities are made, not found”. It is this ‘making’ of business opportunities that requires
a high degree of dedication and attention on the part of the entrepreneur during the start
up phase, thus generating the conflict in time allocation between the running of estab-
lished activities and the development of new ones.
According to Harper (2008)“... entrepreneurship is best conceived as a dynamic
problem-solving process in which entrepreneurs learn in the light of experience and
Model of business group development 224
feedback from the market” (Harper, 2008, p. 613). Opportunity identification has little
value until the entrepreneurial idea is put into practice and its validity is tested; this is
not a ‘one shot’ game but a process that requires dedication and attention in order to ad-
just the entrepreneurial idea to market conditions and maximise its possibility of suc-
cess. The importance of the exploitation phase is also more and more recognised by re-
searchers who follow the Austrian view, whose initiators stressed the importance of en-
trepreneurial alertness and opportunity identification. “The only way the entrepreneur-
promoter can exploit his/her discovered opportunity is by the implementation of a firm”
(Sautet, 2000, p. 75). This is because of the need to hire the necessary resources and
persuade them to make the specific investment needed to exploit the business opportu-
nity. “The entrepreneur-promoter can exploit his/her discovery having only seen
through some parts of the fog of uncertainty and relying on resource owners to see
through other parts of the fog. The emergence of the firm can be seen as the simultane-
ous exploitation of profits by different entrepreneurs” (Sautet, 2000, p. 76). The in-
volvement of employees in the ownership of new ventures is the way through which
portfolio entrepreneurs secure the availability of key human resources for the exploita-
tion of a new business opportunity.
Decisions are made at a specific point in time; however, the resulting actions are not
‘instantaneous’ and require time to be accomplished. In the case of new venture crea-
tion, the period of time needed for its discovery and exploitation span around a pivotal
point: the start-up. This could be the set-up date of a new company or the date in which
a board has decided to invest in a new business unit. Besides the possibility of identify-
ing a specific point in time, it is important to note that start-up represents a solution of
continuity within the opportunity discovery and exploitation processes. This is espe-
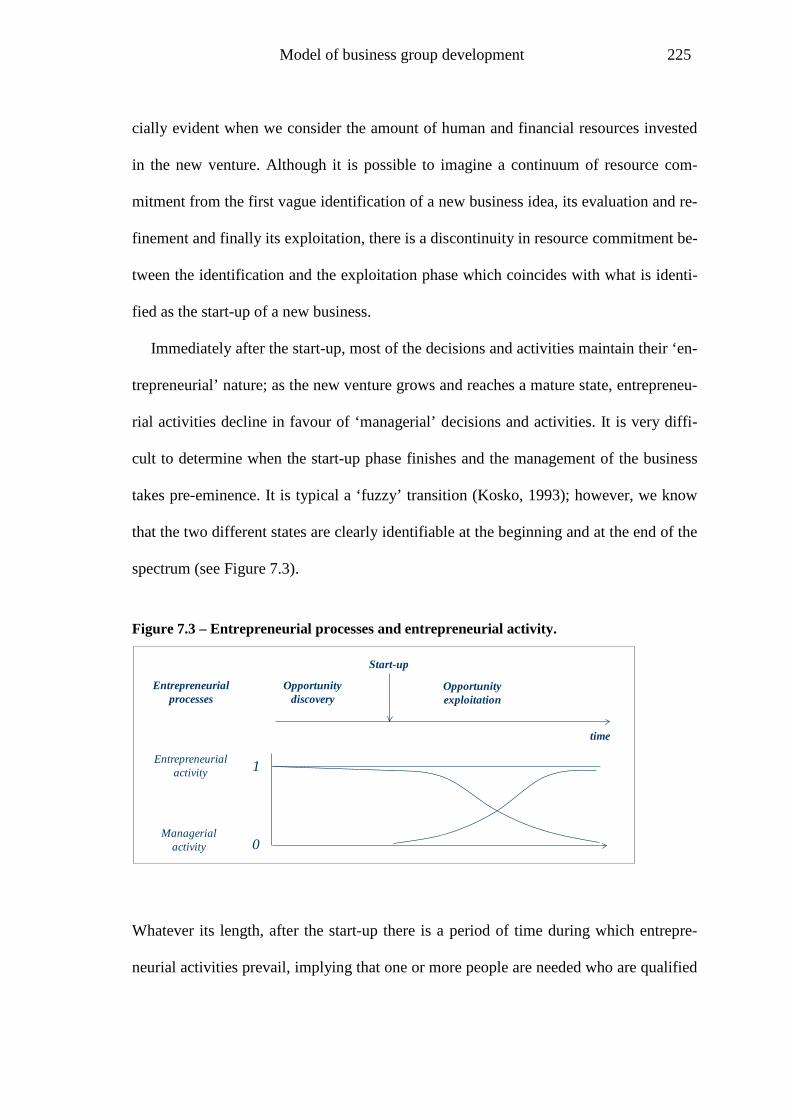
Model of business group development 225
cially evident when we consider the amount of human and financial resources invested
in the new venture. Although it is possible to imagine a continuum of resource com-
mitment from the first vague identification of a new business idea, its evaluation and re-
finement and finally its exploitation, there is a discontinuity in resource commitment be-
tween the identification and the exploitation phase which coincides with what is identi-
fied as the start-up of a new business.
Immediately after the start-up, most of the decisions and activities maintain their ‘en-
trepreneurial’ nature; as the new venture grows and reaches a mature state, entrepreneu-
rial activities decline in favour of ‘managerial’ decisions and activities. It is very diffi-
cult to determine when the start-up phase finishes and the management of the business
takes pre-eminence. It is typical a ‘fuzzy’ transition (Kosko, 1993); however, we know
that the two different states are clearly identifiable at the beginning and at the end of the
spectrum (see Figure 7.3).
Figure 7.3 – Entrepreneurial processes and entrepreneurial activity.
Whatever its length, after the start-up there is a period of time during which entrepre-
neurial activities prevail, implying that one or more people are needed who are qualified
Opportunity discovery
Opportunity exploitation
Start-up
Entrepreneurial activity
time
Managerial activity 0
1
Entrepreneurial processes
Model of business group development 226
to carry them out. ‘Qualified’ means not only having the capabilities to perform entre-
preneurial activities, but also being in the position to take decisions and execute them.
In a partnership, the power to take and execute entrepreneurial decisions is in the hands
of the owners who jointly run the company. In limited companies or closely held corpo-
rations, this power is in the hands of the board of directors and the staff delegated by the
board: the CEO, when present, is the person who concentrates these responsibilities.
The nature of entrepreneurial decisions and activities (as briefly synthesised above)
makes it very difficult to delegate them to salaried managers, even if they are involved
in the board and appointed as CEO. The future contingencies and outcomes associated
with the start-up of a new business are many and unpredictable; for this reason, it would
be very expensive, if not impossible, to write incentive contracts for salaried manag-
ers80
Entrepreneurial activity requires a high level of human-specific investment and ties
the individual to the new business in a way that is much greater than that observed in
the case of a salaried manager.
. This situation also raises the cost of monitoring salaried managers once they have
been appointed to the position. Entrepreneurial activities must be the responsibility of a
person who has a direct involvement in the ownership, control and management of
the new business; this gives him/her the necessary incentives and authority to perform
them efficaciously and efficiently.
It [new business creation] vests the individuals, who, to a large extent, defines him-
self or herself in relation to it. It occupies a large part of the individual’s life (ac-
80 Alvarez and Barney (2004) suggest another argument to explain this. If it was possible to write incen-tive contracts for managers, this means that knowledge about the new business opportunities and its po-tential results is ‘common’ knowledge. In this case, the salaried manager, hired to take advantage of this opportunity, will appropriate most of the economic rents associated with it.
Model of business group development 227
tivities, goals, means, social status, etc.), and enables or constrains the individual to
learn and change his or her relations network. (Bruyat and Julien, 2001, p. 169)
To induce people to make this kind of investment and commitment, it is necessary to
involve them in the ownership of the new business and give them primary responsibility
in its management.
This is why portfolio entrepreneurs need to give ownership shares in new business in
order to enlarge the entrepreneurial team; in doing so, the portfolio entrepreneur raises
the amount of entrepreneurial resources available to exploit new business opportunities
and partially solves the problem of time allocation between established and new busi-
nesses. What distinguishes the creation of an entrepreneurial team from the hiring of
salaried managers is that the former requires direct involvement in the ownership of the
new business. In fact, an entrepreneurial team is a group of people who share the own-
ership, control and management of a venture (Kamm and Nurick, 1993; Watson et al.,
1995b).
An alternative to forming an entrepreneurial team is to appoint salaried managers to
manage established or new businesses. This is the method reported by Rosa (1998, p.
53) when considering the Duir case (see the citation at p. 215). Rosa (1998) suggests
that the involvement of other people in the ownership of companies is more likely in the
case of established businesses rather than new ones.
The clusters identified in the case studies were complex and often involved part-
nerships between different owners (either family members, or with corporate part-
ners). ... The partnerships were often necessary to manage each business while the
driving entrepreneur turned his or her mind to a new project (Rosa, 1998 , p. 58).
Model of business group development 228
Though not explicitly mentioned, the reason for associating partners in established
businesses is to allow the entrepreneur to allocate more time and attention to new pro-
jects. The evidence from case studies shows that it is more common to observe the in-
volvement of other people in the ownership and control of new businesses rather than
the hiring of salaried managers to manage established ones. Involving people in the
ownership and management of companies not only integrates specific resources (as in
the case of joint ventures with established entrepreneurs), it also saves the entrepre-
neur’s time so he/she can focus his/her attention on new business start-ups that would
otherwise be diverted to the management of the established businesses. To involve other
people in the entrepreneurial activity, it is necessary to give them a share in the owner-
ship of the new business; thus the need for setting up a new legal entity.
The role of ownership in the definition of entrepreneurship has been debated at
length. It is still an unresolved question whether ownership of a business is a necessary
condition for entrepreneurship. It is generally recognised that an entrepreneur is some-
one who owns, controls and manages a business. This is the main reason why entrepre-
neurship is so often associated with the small business sector where it is common to ob-
serve the association between ownership and control (Gartner and Shane, 1995). Ac-
cording to this view the ownership of a (small) business and the start up of a new one
are the most common ways to conceptualise entrepreneurship. Some authors have ques-
tioned this definition of entrepreneurship by stressing the fact that entrepreneurship is
about creating new ventures or organisations rather than just owning and running a
business (Gartner, 1988; Timmons, 1999). It is a shift of emphasis from what an entre-
preneur is to what an entrepreneur does. Of course it cannot be the case that there are
people who are forever entrepreneurs versus people who are non-entrepreneurs, but that
Model of business group development 229
some people at certain times in their lives perform entrepreneurial activities. When de-
fined in this way, ownership does not seem a necessary condition for the presence of en-
trepreneurship: indeed, in the literature on corporate entrepreneurship, the intrapreneur
is not necessarily required to own the business he/she has contributed towards identify-
ing and starting up (Zahra et al., 1999a).
Being involved in the start up of a new business as a salaried manager, without any
ownership of it (as observed in some intrapreneurial activity), hampers the ability of
people to perform an entrepreneurial role. The empirical evidence on business groups
shows that one of the ways used by portfolio entrepreneurs to ‘delegate’ the entrepre-
neurial function is that of giving minority shares in the new business. This has several
consequences: i) making the people partially responsible for the outcome of the busi-
ness; ii) enhancing their authority in resource allocation and coordination; iii) offering
incentives to people to get human capital investment (expertise, contacts, etc.) that are
business-specific; iv) preventing them from easily ‘resigning’ from managing the busi-
ness, in cases where profits do not match expectations81
New business opportunities are often the result of ‘tacit’ or personal knowledge that
reflects unique experience on the part of the individual. This means that articulating
business opportunities and getting others to understand them is difficult to achieve at
low cost (Alvarez and Barney, 2004). Being involved in the ownership of the new busi-
ness is a signal of shared belief in the profit opportunity associated with the new busi-
ness.
.
81 This is done not only to prevent the potential loss of specific human capital but also to reduce the risk of a salaried manager starting a business of his/her own to exploit the new business opportunity once he/she has gained enough knowledge about it.

Model of business group development 230
To better understand the relevance of ownership in entrepreneurship it is worthwhile
analysing in more detail how the roles played by entrepreneurs are related to the owner-
ship of the business. Kaldor (1934) was among the first to analyse the roles played by
entrepreneurs and their consequences for the size and performance of the firm. Accord-
ing to Kaldor (1934, p. 67) the entrepreneurial function consists of three functions: 1)
risk, or rather uncertainty bearing (on capital) ; 2) supervision; 3) co-ordination. Kaldor
is especially interested in analysing which of the three factors is fixed in the short term,
thus representing a burden to the growth of the firm (the exploitation of new business
opportunities in our case). He dismisses the first factor (risk bearing) as in joint stock
companies it can be easily spread among many individuals. He also dismisses the su-
pervisory role (i.e. checking that people do what they have been asked to do and that the
results of their work is as expected): “An army of supervisors may be just as efficient
(provided it consists of men of equal ability) as one supervisor alone”. (Kaldor, 1934, p.
68). According to Kaldor the coordinating function characterises the role of the entre-
preneur. The coordinating role is the fixed factor in the short term because of the diffi-
culties in ‘splitting’ and delegating it: it must be the decision-making process of a single
person. Kaldor recognises that in modern organisations the co-ordinating role is not
necessarily attributed to a single individual but to a board. However, it is essential to
recognise that while in the case of supervision the division of labour works smoothly, in
the case of the co-ordination activity it remains a single-minded activity: “...all the
members of that Board will, in all important decisions, have to keep all the alternatives
in their minds-in regard to this most essential mental process there will be no division of
labour between them - and that it will not be possible, at any rate beyond a certain point,
to increase the supply of co-ordinating ability available to that enterprise merely by
Model of business group development 231
enlarging the Board of Directors.” (Kaldor, 1934, p. 69). Not only can co-ordinating ac-
tivity not be ‘divided’ and delegated, it is also efficiently performed by a few (or just
one) persons. Because each member of that board will have to go through the same
mental processes, the advantages of a collective decision consist solely in the checking
and counter-checking of each other's judgments. If the Board consists of people of equal
ability, this will not improve the quality of their decisions; if the abilities of the different
members are markedly unequal, the co-ordinating ability could be improved by dismiss-
ing the board and leaving the single most efficient individual in control (Kaldor, 1934,
p. 69). According to Kaldor the co-ordinating activity is the “...function which deter-
mines what sort of contracts should be entered into: which carries out the adjustments to
the given constellation of "data."” (Kaldor, 1934, p. 68). The key aspects of the co-
ordinating role are: i) making contracts to secure adequate resources for the new busi-
ness; ii) adjusting those contracts to the continuously changing conditions of the envi-
ronment. Both functions are critical in the early stages of a new business and require
particular dedication and commitment on the part of the entrepreneur; they also require
that the person in charge has enough authority and credibility regarding external sub-
jects.
In the case studies, control of the new businesses is shared by the established entre-
preneur (who retains the majority of shares) and another person (who is given a minor-
ity stake); the established entrepreneur supports the new business with capital and ex-
perience while dedicating only a fraction of his/her time to it. The ‘associated’ entrepre-
neur, on the contrary, is fully dedicated to the new business and performs the co-
ordinating role. This ‘division of labour’ between a dominant entrepreneur, who sup-
plies the financial resources for the new business and gives credibility to it thanks to
Model of business group development 232
his/her past record, and the associated entrepreneur, who dedicates his/her attention on a
full time basis at the start-up, is beneficial for the successful performance of the new
business.
Hellmann (2007) specifically examines the problems of attracting resources for the
development of a new venture: “...the venture needs to have credibility to get a partner’s
commitment, but also needs to have commitments from partners to have credibility”
(Hellmann, 2007, p. 82). This problem had already been noted by Birley and Norburn
(1985). In examining the differences between large and small firms in strategy forma-
tion and implementation, they observe that the main problem for new businesses is that
of assembling (i.e. attracting) the resources needed to put a viable plan into action. In
this process, credibility is a key factor: “Credibility is fundamental, and many would-be
owners fail at the outset because they cannot step off the credibility merry-go-round. ...
the bank will not lend without an order, the customer will not place an order without
evidence that the product can be supplied, the supplier will not give credit, the landlord
requires a deposit and guarantees, and the skilled worker is reluctant to leave guaranteed
employment” (Birley and Norburn, 1985, p. 83-84). Attracting the key resources needed
to launch a new business is much more of a challenge for an individual entrepreneur
than for an established company; there are several ways an entrepreneur can mitigate
this problem but all are expensive or can only partially resolve it (Bhidé and Stevenson,
1999). In the case of a new business started within a group, the credibility problem is
partially resolved by the fact that the established entrepreneur can transfer the credibil-
ity he/she already developed through his/her success in established businesses.
Model of business group development 233
7.4 A conceptual model of business group formation in SMEs
This section synthesises the results of the empirical analysis and of the theoretical
discussion by drawing a conceptual model to describe the role of entrepreneurial proc-
esses in business group formation and growth in the small business sector. The concep-
tual model makes explicit statements about the hypothesised functional relationships be-
tween the different variables included in the model.
Conceptual models are more appropriate when the aim is the consideration all the en-
tities and variables involved in the analysis, the relationships between them, the motiva-
tions explaining the observed behaviour and the contextual factors that influence these
relationships and motives; these aspects are often referred to as the what, how, why and
when (Whetten, 1989). The development of a mathematical model could help to clarify
the causal relationships between variables (i.e. the how and why) but at the expense of
drastically reducing the variables under consideration and the contextual factors (i.e. the
what and when). Mathematical models are more appropriate when dealing with quanti-
tative (or measurable) variables rather than qualitative variables (Lévesque, 2004).
First of all it is worthwhile clarifying the objects involved in the analysis, i.e. the
what and who. The object of this study is new venture creation by established entre-
preneurs (quadrant B of Figure 7.4); its aim is to understand the circumstances and mo-
tives explaining why this can give rise to a business group, i.e. a portfolio of independ-
ent companies owned by the same entrepreneur (box B.1 of Figure 7.4). Basically, this
question regards the ‘mode of organising’ the exploitation of new ventures by estab-
lished entrepreneurs. This depends on the characteristics of the venture and the circum-
stances under which the new venture is developed.
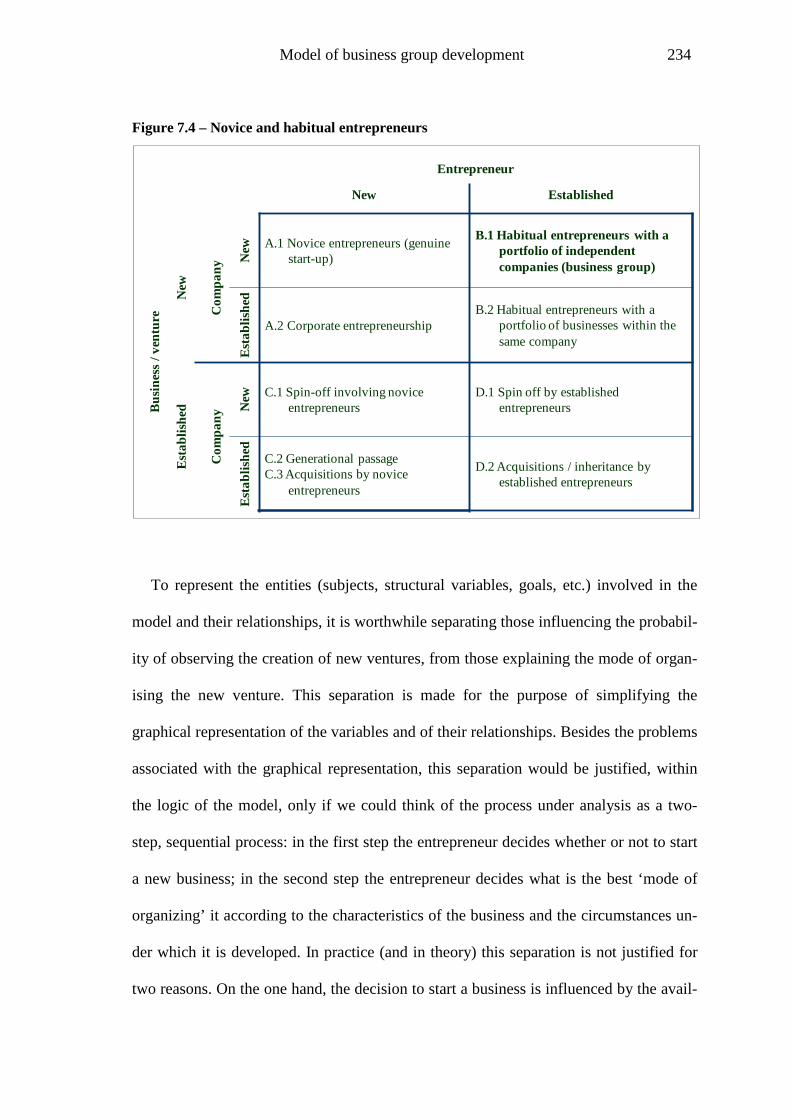
Model of business group development 234
Figure 7.4 – Novice and habitual entrepreneurs
To represent the entities (subjects, structural variables, goals, etc.) involved in the
model and their relationships, it is worthwhile separating those influencing the probabil-
ity of observing the creation of new ventures, from those explaining the mode of organ-
ising the new venture. This separation is made for the purpose of simplifying the
graphical representation of the variables and of their relationships. Besides the problems
associated with the graphical representation, this separation would be justified, within
the logic of the model, only if we could think of the process under analysis as a two-
step, sequential process: in the first step the entrepreneur decides whether or not to start
a new business; in the second step the entrepreneur decides what is the best ‘mode of
organizing’ it according to the characteristics of the business and the circumstances un-
der which it is developed. In practice (and in theory) this separation is not justified for
two reasons. On the one hand, the decision to start a business is influenced by the avail-
Entrepreneur
New Established
Bus
ines
s / v
entu
re
New
Com
pany
New A.1 Novice entrepreneurs (genuine
start-up)
B.1 Habitual entrepreneurs with a portfolio of independent companies (business group)
Est
ablis
hed
A.2 Corporate entrepreneurshipB.2 Habitual entrepreneurs with a
portfolio of businesses within the same company
Est
ablis
hed
Com
pany
New C.1 Spin-off involving novice
entrepreneursD.1 Spin off by established
entrepreneurs
Est
ablis
hed
C.2 Generational passageC.3 Acquisitions by novice
entrepreneurs
D.2 Acquisitions / inheritance by established entrepreneurs
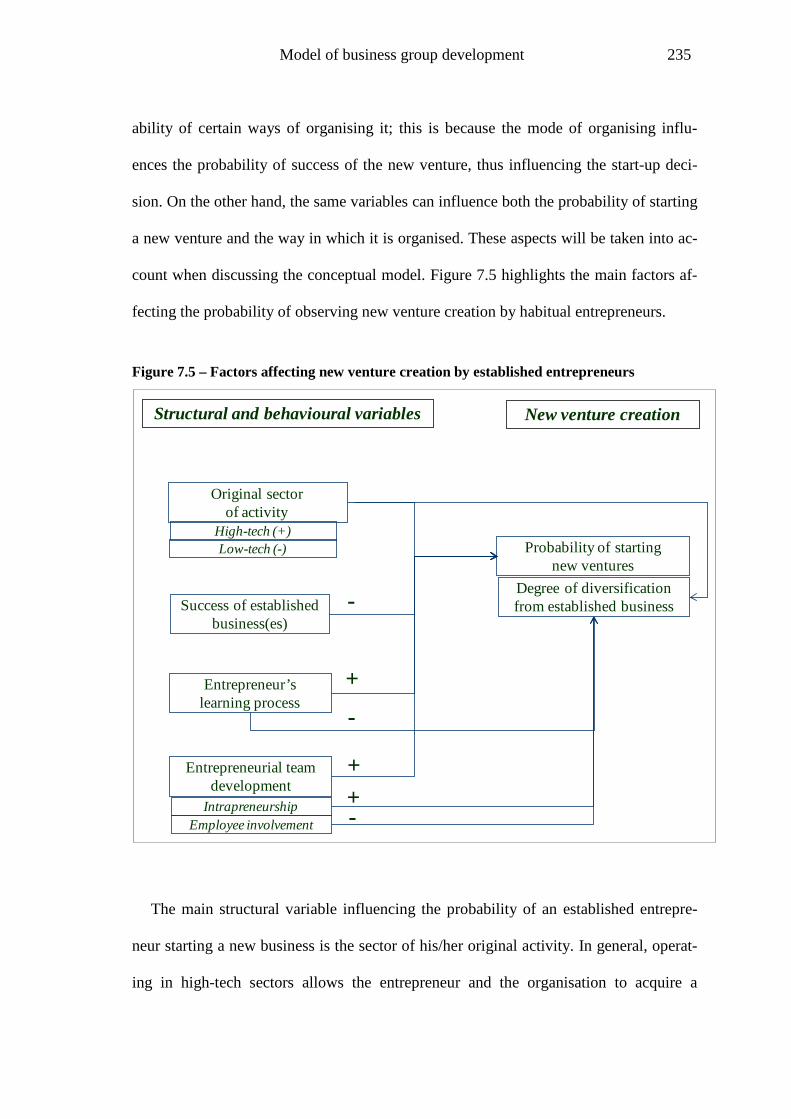
Model of business group development 235
ability of certain ways of organising it; this is because the mode of organising influ-
ences the probability of success of the new venture, thus influencing the start-up deci-
sion. On the other hand, the same variables can influence both the probability of starting
a new venture and the way in which it is organised. These aspects will be taken into ac-
count when discussing the conceptual model. Figure 7.5 highlights the main factors af-
fecting the probability of observing new venture creation by habitual entrepreneurs.
Figure 7.5 – Factors affecting new venture creation by established entrepreneurs
The main structural variable influencing the probability of an established entrepre-
neur starting a new business is the sector of his/her original activity. In general, operat-
ing in high-tech sectors allows the entrepreneur and the organisation to acquire a
Original sector of activity
Structural and behavioural variables New venture creation
Degree of diversificationfrom established business
Entrepreneurial team development
Intrapreneurship
Success of established business(es)
Probability of starting new ventures
Low-tech (-)High-tech (+)
Entrepreneur’s learning process
-
-
-
Employee involvement
+
++
Model of business group development 236
broader knowledge base than when operating in low-tech sectors, thus enhancing the
possibility to diversify into other business activities. This factor also has a big influence
in the degree of diversification of the ventures subsequently started; entrepreneurs oper-
ating in traditional (low-tech) sectors are more likely to follow a differentiation strategy
by entering in different segments of the same market rather than diversifying in new
sectors.
The success of the original business, measured in terms of growth, has a negative in-
fluence on the probability of starting new ventures. At first this seems counterintuitive
because a successful entrepreneur is supposed to have more experience and wealth than
an unsuccessful one, but this conclusion is not supported by the empirical evidence. En-
trepreneurs who are successful in developing their original business are more likely to
concentrate on it rather than diversifying into new businesses. On the contrary, entre-
preneurs who encounter difficulties in expanding their original business are more likely
to turn their mind to other ventures82
The main difference between an established and a novice entrepreneur should be in
the enhanced capability of the former to start-up new businesses thanks to the learning
process during the previous start-ups. The empirical evidence of business groups dem-
onstrates that this learning process is ‘sector-specific’; i.e. it does not raise the probabil-
ity of success in starting whatever new business but ventures that are closely connected
with the original one. This means that once an entrepreneur has initially entered an in-
.
82 It is possible that when successful businesses reach a mature stage (i.e. slow or no growth) the entre-preneur decides to invest in other businesses. In this case the diversification strategy appears to follow the same motives as those normally discussed when referring to large, managerially oriented companies. It is also worthwhile mentioning that when the original business reaches a mature stage it is easier for the en-trepreneur to delegate its direction to salaried managers and concentrate his/her time and energy to other businesses.
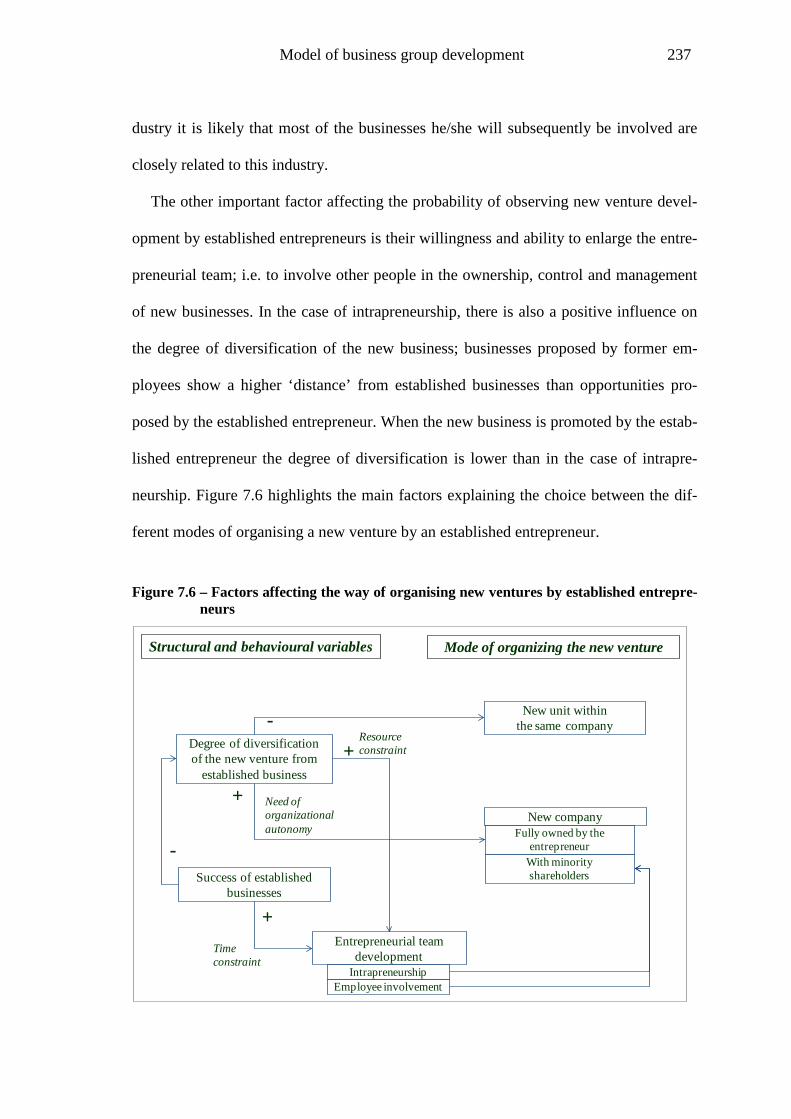
Model of business group development 237
dustry it is likely that most of the businesses he/she will subsequently be involved are
closely related to this industry.
The other important factor affecting the probability of observing new venture devel-
opment by established entrepreneurs is their willingness and ability to enlarge the entre-
preneurial team; i.e. to involve other people in the ownership, control and management
of new businesses. In the case of intrapreneurship, there is also a positive influence on
the degree of diversification of the new business; businesses proposed by former em-
ployees show a higher ‘distance’ from established businesses than opportunities pro-
posed by the established entrepreneur. When the new business is promoted by the estab-
lished entrepreneur the degree of diversification is lower than in the case of intrapre-
neurship. Figure 7.6 highlights the main factors explaining the choice between the dif-
ferent modes of organising a new venture by an established entrepreneur.
Figure 7.6 – Factors affecting the way of organising new ventures by established entrepre-neurs
Degree of diversification of the new venture from
established business
Structural and behavioural variables Mode of organizing the new venture
With minority shareholders
New unit within the same company
Success of established businesses
+
+
-
New company
Entrepreneurial team development
IntrapreneurshipEmployee involvement
+
Fully owned by the entrepreneur-
Resource constraint
Timeconstraint
Need of organizational autonomy
Model of business group development 238
Figure 7.5 does not list all the possible modes of organising, but considers only the
three main options: i) a new organisational unit within the established company; ii) a
new company fully owned by the habitual entrepreneur; iii) a new company in which
the entrepreneur involves minority shareholders.
One of the most important factors explaining the choice of starting a new company to
develop a new business is the degree of diversification from an established (often the
original) business; the main reason for this choice is because of the need to give organ-
izational autonomy to the new business. The legal autonomy helps to focus resources,
which is especially beneficial in the start-up phase. It also enables the contractual
autonomy of the new business, so that each company is able to adapt its contractual re-
lationships with customers and suppliers (for example the terms of payment) to its spe-
cific needs. This aspect is particularly important for businesses that rely on an extended
network of external suppliers. Contractual autonomy is also relevant in the case of new
businesses along the same production chain, as it facilitates the selling of output to the
market thus reducing the risks associated with vertical integration. Finally, the legal
autonomy also allows the entrepreneur to isolate the risk of the new business from es-
tablished businesses.
The degree of diversification has a positive influence on the probability of involving
other people in the ownership and control of the new business; in this case the main rea-
son is to overcome resource constraints by the established entrepreneur, which could be
a financial constraint or a capability constraint. Starting a new company is a necessary
condition for giving minority shares to people involved in the ownership and control of
the new business, thus involving them in the entrepreneurial team.
Model of business group development 239
In the cases examined, the constraints were not limited to financial resources or in-
dustry-specific capabilities, they were also made up of entrepreneurial capabilities: i.e.
the specific capabilities needed to start up and develop new ventures. At first this seems
to contradict the fact that habitual entrepreneurs should be more capable of carrying out
entrepreneurial functions than the other people involved, who in most cases were novice
entrepreneurs.
This contradiction disappears when we take into consideration the fact that the time
and attention available to entrepreneurs is limited and that portfolio entrepreneurs have
to share their time and attention between the running of established business(es) and the
development of new ones. In such circumstances, the involvement of other people in the
ownership, control and management of the new business aims to motivate and empower
those people to perform an entrepreneurial role in the new business. This is critical for
enhancing the probability of success of the new venture.
Conclusions 240
Chapter 8 - Conclusions
This chapter summarises the main findings of this research and relates them to the
current debate in entrepreneurship literature.
This thesis provides theoretical and empirical contributions to three diverse but inter-
related issues: business groups, with specific regard to those in the small business sec-
tor; habitual entrepreneurs, with specific regard to portfolio entrepreneurs; and entre-
preneurial teams.
On the one hand, exploring entrepreneurial processes helps understanding the forma-
tion and characteristics of business groups in the small business sector; on the other
hand, the analysis of business group formation and dynamics sheds light on theories of
habitual entrepreneurs and entrepreneurial teams.
The chapter also discusses the limitations of this study and how it could be devel-
oped further.
8.1 Key findings
The main aim of this thesis was to establish whether, and to what extent the consid-
eration of entrepreneurial processes improves our understanding of the formation and
growth of business groups. It aimed at explaining why it is common to observe business
groups in the small business sector and the reasons entrepreneurs choose this organisa-
tional form.
Conclusions 241
The thesis demonstrates that available theories on business groups - the financial and
the diversification theories - are not able, per se, to explain the empirical evidence on
business groups in the small business sector. The main reason for this is that these theo-
ries do not take into consideration the problems faced by portfolio entrepreneurs when
exploiting new business opportunities.
The ‘diversification hypothesis’ considers the business group as an organisational
form suited to efficiently manage diversified activities (Chandler, 1982a; Goto, 1982;
Chang, 2006a). This interpretation finds empirical support in the case of large groups
where the companies forming the group normally operate in different industries under a
strategy of conglomerate diversification (Ghemawat and Khanna, 1998; Peng and
Delios, 2006). The legal autonomy accorded to these diversified activities is justified by
the need to give them strategic and operative autonomy, as well as to spread risk
(Gerlach, 1997; Khanna and Yafeh, 2005). Small and medium sized groups present two
aspects that contradict this interpretation. In most cases the degree of diversification ob-
served in business groups is very low and would not justify the setting up of a new
company. As demonstrated in chapter 5 of this thesis, companies belonging to groups of
SMEs are the result of a differentiation policy (entrance into different segments of the
same market) or of a vertical integration strategy (i.e. the control of activities along the
production chain). In both cases, the new activities show a low degree of diversification
and close synergies with the original activity. There are alternative organisational struc-
tures – namely the divisional organisation – that could be used by entrepreneurs to man-
age these forms of diversification. The second aspect of dissatisfaction with the diversi-
fication theory is that it does not differentiate between the start-up of a new business as
opposed to the management of it. In so doing, it implies that there are no differences in
Conclusions 242
the organisational problems associated with the start up of a business compared with
those arising at later stages.
The financial explanation of business groups stresses the importance of legal auton-
omy as a way of manipulating the ownership structure of new businesses. This gives en-
trepreneurs the opportunity to raise outside equity: i.e. equity capital provided by inves-
tors from outside the controlling shareholders (Myers, 2000). In the case of large groups
with companies listed on the stock exchange, this is done with the aim of separating
ownership from control; according to the financial interpretation, pyramidal groups are
created to allow the ultimate owner (typically a family) to minimise the capital invested
to control large, publicly owned companies (Morck and Yeung, 2004).
This interpretation is not relevant in the case of groups in the small business sector
where the companies are privately held and the degree of ownership concentration is
very high. A recent theoretical paper (Almeida and Wolfenzon, 2006) has extended the
financial interpretation of business groups to privately held (family owned) small
groups. The basic idea of this model is that when entering new businesses, entrepre-
neurs make them legally autonomous in order to raise equity capital from external (to
the controlling family) shareholders. By doing this, the controlling family maximises its
financial wealth through two mechanisms: by using the cash flow accumulated in estab-
lished businesses (financial advantage) and by diverting to their advantage part of the
cash flow generated by the new businesses (payoff advantage). In the Almeida and
Wolfenzon (2006) model it is taken for granted that the entrepreneur retains the control
and management of the new business while the minority shareholders are purely inves-
tors. This thesis demonstrates that the latter hypothesis is a major limitation of the
Almeida and Wolfenzon (2006) model. In the case of small groups (and small firms in
Conclusions 243
general), the presence of minority shareholders can hardly be of a purely financial na-
ture because of the high level of agency costs of outside equity in privately held compa-
nies. This means that the raising of outside equity cannot be the main reason for the
creation of an autonomous company. This conclusion is supported by the results of the
survey conducted using a sample of portfolio entrepreneurs (discussed in chapter 6).
From the interviews with entrepreneurs it emerged that the presence of minority share-
holders in a new business is instrumental to associating other people in the start up of
the new venture. The causal relationship is the opposite of that hypothesised by the fi-
nancial explanation: it is not much so the aim of raising outside equity that determines
the involvement of external shareholders as the need to involve and motivate people in
the start up of the new business that induces portfolio entrepreneurs to sell minority
shares in it.
The results emerging from case studies and their integration with theoretical models
of entrepreneurship made it possible to develop a new explanation of business group
formation and growth (discussed in chapter 7). According to this explanation, entrepre-
neurial processes associated to the start-up of new businesses by portfolio entrepreneurs
play a crucial role. When considering entering into a new business portfolio entrepre-
neurs face two problems: a) how to take advantage of the synergies with established
businesses while guaranteeing the necessary focus on, and autonomy of the new busi-
ness; b) how to share time and attention between the management of established busi-
nesses and the start-up of the new venture. The start-up phase is critical for the success
of the new business (Ardichvili et al., 2003). It requires complete dedication of time and
attention by the entrepreneur to continuously adjust the planned actions to the unfore-
seen events and unpredictable contingencies that are typical of the start-up phase.
Conclusions 244
One of the ways in which portfolio entrepreneurs mitigate or overcome these prob-
lems is through the setting up of a new company, thus creating or enlarging a business
group. The legal autonomy granted to the new venture helps focus resources and moni-
tor results. It also enables the contractual autonomy of the new business, so that each
company is able to adapt its contractual relationships with customers and suppliers (for
example the terms of payment) to its specific needs. Contractual autonomy is also rele-
vant in the case of new businesses along the same production chain because it facilitates
the selling of output to the market, thus reducing the risks associated with vertical inte-
gration.
In addition to these reasons and more than anything else, legal autonomy allows en-
trepreneurs to modify the ownership structure of the new business and give minority
shares to people involved in the start-up of the new venture. The formation and
enlargement of the business group coincides with the enlargement of the entrepreneurial
team; i.e. of people who play entrepreneurial roles within the group. This thesis (chapter
7) demonstrates why involvement in the ownership is a necessary condition for per-
forming an entrepreneurial role in the start-up of a new venture. The start-up entails the
following activities: a) setting the objectives and the plan for the business; b) contract-
ing suppliers to attract necessary resources and launching the new product or service to
customers; c) hiring, monitoring and compensating the employees involved in the new
venture. Future contingencies associated with the start-up are too many and unpredict-
able; for this reason it would be very expensive, if not impossible, to appoint salaried
managers for these activities and draw up incentive contracts for them. They must be
the responsibility of an entrepreneur: a person who has a direct involvement in the own-
ership, control and management of the business; this gives him/her the necessary incen-
Conclusions 245
tives and authority to perform an entrepreneurial role. By involving other people in the
start-up of new ventures, portfolio entrepreneurs overcome the problem of time alloca-
tion between established and new activities, thus enhancing their ability to enter new
businesses while retaining ownership and control of the ones already established.
The empirical analysis revealed the existence of three different types of entrepreneu-
rial teams (which can coexist within the same group): joint venture with established en-
trepreneurs, employee involvement and intrapreneurship. The first is when new ven-
tures are set up with other established entrepreneurs. The second is when the entrepre-
neur gives a share of the new company to an employee to secure his/her involvement in
the start-up of a new venture (employee involvement). The third is when the new busi-
ness is established as a result of the inspiration of an ‘intrapreneurial’ employee who
then takes major responsibility for the development of the business. Besides joint ven-
tures with established entrepreneurs, it is the phenomena of ‘employee involvement’
and ‘intrapreneurship’ that is the most widespread and the most interesting. In the case
of ‘employee involvement’ the established entrepreneur draws on employee skills to
enhance the capabilities of exploiting new business opportunities. Entrepreneurial atti-
tudes are encouraged in employees for the exploitation of new business opportunities,
while opportunity recognition remains a prerogative of the established entrepreneur. In
the second type (intrapreneurship) the entrepreneur facilitates and financially sustains
employees who want to develop their own businesses. In the latter case the established
entrepreneur must reconcile the new project within the group activities and accommo-
date the emerging entrepreneur within a coherent team.
As well as the discovery and analysis of these three forms, the thesis provides a more
general contribution to understanding the dynamics of entrepreneurial teams in situa-
Conclusions 246
tions where there is a ‘dominant’ or ‘lead’ entrepreneur and one or more ‘associate’ or
‘sub’ entrepreneurs. The few theoretical and empirical works available on these situa-
tions refer to individual business and do not consider the functioning of teams in a
multi-business situation (as it is the case of a business group). Moreover, the literature
has concentrated on the structure of the entrepreneurial team at the start-up and does not
consider the evolution of the team over time (Ensley et al., 2000; Harper, 2008). Busi-
ness groups are flexible organisational structures which accommodate a wide range of
team types: from the hierarchical model between a lead and a sub-entrepreneur (Harper,
2008) that is observed in ‘employee involvement’, to the ‘tutoring’ model that is ob-
served in the case of ‘intrapreneurship’. The different types depend on the characteris-
tics of the new venture, the circumstances that led to its start-up and the people in-
volved.
The portfolio entrepreneur remains the ‘dominant’ figure for the group as a whole;
he/she retains a leading position in the original company of the group and majority
ownership in all the companies. However, the portfolio entrepreneur does not necessar-
ily play a ‘leading’ role in all the new ventures; when an associate entrepreneur is pre-
sent, it is he/she who plays the major entrepreneurial role in the new business. The
dominant entrepreneur provides the majority of equity capital, facilitates the access to
external resources (thanks to the reputation gained by the group), and supports the asso-
ciate entrepreneur in the main strategic decisions. The group form allows the entrepre-
neurial tasks needed for the start up of a new business to be shared, which is beneficial
for the success of the new business. This division of the entrepreneurial work is shared
between the dominant entrepreneur and the associate entrepreneurs. This makes it pos-
sible to differentiate team interactions within the same group according to the circum-
Conclusions 247
stances that led to the start-up of each new business and the role that the dominant and
the associate entrepreneur plays in each of them. The empirical survey also showed that
the roles within the team can change over time according to the performance of the new
venture. When the new business is particularly successful, the associated entrepreneur
increases his/her role in the business; this was clear because of the increased number of
shares owned by the associated entrepreneur in the company.
The analysis of entrepreneurial teams in business groups helps resolve one of the
main problems with the theory on entrepreneurial teams. The theoretical literature on
entrepreneurship stresses the ‘individual’ nature of the cognitive and behavioural proc-
esses that result in entrepreneurial activity (Kirzner, 1979; Casson, 1982). This is not
easily reconcilable with the idea that entrepreneurial processes (opportunity recognition
and exploitation) can be the result of a team activity (Harper, 2008). The formation and
dynamics of entrepreneurial teams in business groups demonstrates that in each phase
of the entrepreneurial process it is possible to identify a ‘lead’ entrepreneur who is the
person responsible for the discovery or the exploitation of the new venture. The ‘divi-
sion of labour’ between entrepreneurs is made in such a way that it allows ‘one’ entre-
preneur to play a leading role in each phase. It is also interesting to note that the pres-
ence of entrepreneurial teams is more easily observed in the exploitation phase (start-
up) rather than in the opportunity discovery phase. This is because during opportunity
discovery, cognitive processes are preeminent which are highly subjective by nature
(Harper, 2003). In the exploitation phase there is more scope for organisational proc-
esses that facilitate the division of labour between people. Moreover, the setting up of a
new company allows differentiation in the roles of team members in the ownership,
control and direction of the new business.
Conclusions 248
The importance of having one ‘lead’ entrepreneur emerges also at the level of the
business group as a whole. Case studies highlighted the difficulties in the coexistence of
more than one ‘dominant’ entrepreneur within the same group; this situation happened
when the original business was set up as a partnership between family members or
friends. When this happened, the group eventually broke up because of divergent vi-
sions and strategies developed by the original partners as time passed and the group
enlarged. With reference to entrepreneurial team theory, this confirms that entrepreneu-
rial teams can have both advantages and disadvantages, especially when team dynamics
are considered over a long period of time rather than just at the start up phase. More-
over, it demonstrates that in the long run, teams in which there is a single leader are
more likely to survive and grow than teams made up of peers. The difficulties in the co-
existence of two dominant entrepreneurs is further proof that business groups in the
small business sector must be considered as an entrepreneurial construct, subject to a
unitary vision and strategy.
The literature about family owned firms has considered the advantages and disadvan-
tages of involving members of the family in the ownership and management of firms
(Miller and Le Breton-Miller, 2006). This thesis demonstrates that when considering the
involvement of other people, portfolio entrepreneurs enlarge the set of people who can
potentially be involved in the entrepreneurial team by considering the employees in es-
tablished companies a possible team members. The reason for this is that the employer-
employee relationship allows the entrepreneur to know and evaluate the attitudes of
employees and to develop the relationship of trust needed to associate him/her in the en-
trepreneurial team (Zahra et al., 2006).
Conclusions 249
Overall, this thesis demonstrates that in the small business sector the business group
is an organisational suited not so much to ‘manage’ a portfolio of diversified businesses
as to enhance the probability of success in the start-up of new ventures. Further confir-
mation of this conclusion is that the setting up of a new company is especially beneficial
in the start-up phase. Once the new business has consolidated, the need for maintaining
legal autonomy diminishes and the group tends to reduce to a divisionalised organisa-
tion. The analysis of several case studies suggests the existence of an evolutionary pat-
tern of business groups with phases of expansion of the number of companies when
new businesses are added and contraction (merging) when the businesses are consoli-
dated. In some cases the number of companies is not reduced but the structure of the
group is rationalised through the creation of holding companies and better defined cen-
tralised and autonomous activities. This confirms that in the case of small firms, the
group is a device for managing growth through the exploitation of new businesses rather
than achieving efficiency in their management.
Theories of habitual entrepreneurs have emphasised the accumulation of human capi-
tal to explain the (supposed) superior capabilities of habitual entrepreneurs in discover-
ing and exploiting new business opportunities. By studying the diversification patterns
of business groups this thesis demonstrates that the accumulation of capital and experi-
ence is mostly specific to the business originally established. The new businesses started
by portfolio entrepreneurs are closely related to the original one; in most cases they are
set up to exploit different market segments within the same industry.
The enlargement of the entrepreneurial team by portfolio entrepreneurs when ex-
ploiting new businesses is not easily reconciled within the human capital accumulation
hypothesis. According to the latter hypothesis, established entrepreneurs are supposed
Conclusions 250
to have an advantage over novice entrepreneurs when starting up new businesses. In the
cases analysed, established entrepreneurs have given entrepreneurial responsibilities to
‘novice’ entrepreneurs (mostly, former employees). The enlargement of the entrepre-
neurial team is aimed not so much at integrating specific knowledge and resources as to
overcome the problem of dedicating time and attention to the new business during the
start-up phase. Entrepreneurs who decide to exploit new business opportunities - while
retaining the ownership and control of the established ones - face the problem of allo-
cating time and attention between the established and the new activities. This thesis
demonstrates why this is not a trivial problem. The start-up phase requires a high degree
of ‘proactivity’ by the people in charge and dedication to ensure the timely and effective
solutions to the problems continuously arising, since these problems are not easily fore-
seeable and cannot be dealt with by routine procedures. One of the ways portfolio en-
trepreneurs solve this problem is by involving other people in the ownership and man-
agement of the new ventures. Giving ownership stakes in the new business to other
people and making them responsible for the start-up phase (i.e. enlarging the entrepre-
neurial team) increases the probability of success of the new venture.
Zahra (2005) highlighted the challenge for family firms to remain ‘entrepreneurial’
after the initial start-up and also the importance of involving other family members to
this aim. This study demonstrates that through the development of a business group, en-
trepreneurs are able to enlarge the entrepreneurial team by drawing on entrepreneurial
attitudes and capabilities of a wider base of people than just family members. People in-
volved in the new ventures were predominantly former employees of the portfolio en-
trepreneurs. This is because the employee relationship allows entrepreneurs to evaluate
the entrepreneurial attitudes of his/her employees and develop the necessary trust in or-
Conclusions 251
der to get them to become a part of the entrepreneurial team. In this process of ‘em-
ployee involvement’, the capabilities shown by portfolio entrepreneurs are not only
those traditionally associated with the recognition and exploitation of new businesses,
but also those associated with entrepreneurial team building; this is an aspect which has
received little attention in the literature on habitual entrepreneurs.
The presence of business groups increases with firm size; this confirms that the pro-
portion of entrepreneurs that diversify their activity is positively connected to the size of
their established business. Moreover, by comparing the degree of diversification of
groups (i.e. entrepreneurs who have decided to diversify their activity) it emerges that
there are no significant differences in the degree of diversification between small and
large groups. This means that once an entrepreneur has decided to diversify, his/her
ability to carry out this strategy does not depend on size. This result can be justified
considering that the entrance of small firms in new industries is likely to be done on a
small scale, while in the case of larger firms they tend to enter new markets on a larger
scale (Dunne et al., 1988; Dunne and Hughes, 1994).
Another finding of the present study regards the motivations for entrepreneurs to di-
versify. Cross sectional analysis on the population of Italian groups reveals that there is
a negative relationship between the concentration of activities (employees or sales) in
the main company and the degree of diversification. This suggests that diversification is
a substitute strategy for growth in the original business. Cross sectional evidence cannot
be considered an appropriate empirical test for this hypothesis; however, this finding is
compatible with the theory that diversification in smaller firms is the result of a defen-
sive (or survivalist) strategy, pursued when entrepreneurs encounter difficulties in their
original activity (Robson et al., 1993; Rosa, 1998).
Conclusions 252
In most cases diversification takes the form of differentiation: i.e. the entering into
different segments of the same industry. Traditionally, this has not been considered as
true diversification, particularly since differentiation is ignored by classification codes
of economic activity. However, the new market conditions stress the importance of stra-
tegic and operative autonomy in the case of firms operating in apparently similar activi-
ties but devoted to different segments of that same market. Moving to a new segment
sometimes requires the same changes in resources and capabilities as applying the tech-
nological or market know-how of the firm in completely differnt industries.
The empirical evidence also highlights the relevance of business groups as an organ-
isational form to control activities along the same production chain; i.e. vertical integra-
tion. The presence of vertical integration within business groups was detected using a
new methodological approach (Fan and Lang, 2000; Acemoglu et al., 2004) based on
information drawn from the input-output table; this can be used to determine when ac-
tivities belong to the same production chain. For every pair of industries, from the in-
put-output table it is possible to calculate the percentage of input of one industry ac-
quired from all the other industries and the percentage of output of one industry sold to
all the other industries. For example, in a group belonging to the clothing industry (code
18) backward integration is present if the group owns a company in the textile industry
(code 17) given that the input-output table shows a positive inter-industry coefficient
between the two industries. Quantitative analyses based on the ISTAT dataset demon-
strate that there are no significant differences between small and large firms when pur-
suing vertical integration strategies or in the use of the group to carry out this strategy.
The group is an organisational form particularly suited to carrying out vertical integra-
tion strategies; in fact, the legal autonomy of firms belonging to the same group reduces
Conclusions 253
the risks associated with vertical integration by facilitating the ability of controlled
firms to sell in the market. This result is confirmed by the analyses conducted on the
Marche dataset and by the interviews with entrepreneurs.
This is the first study on diversification patterns of small groups conducted on such a
large scale (the population of groups in the Italian economy). Moreover, the possibility
to compare this quantitative analysis with the results obtained from the longitudinal
analysis and the qualitative survey helped to strengthen empirical results and to build
the theoretical models.
Studying the formation and evolution of business groups poses several methodologi-
cal problems because business groups are complex systems, characterised by the pres-
ence of several companies, different architectural structures and a multi-business con-
text. Most of the statistical information and data on firms are collected and organised on
the basis of single legal units rather than groups. In order to analyse the characteristics
of business groups and their evolution over time, it was necessary to develop specific
data sets to organise and elaborate data on both the group as a whole and the individual
companies composing it. To this end, the cross sectional information on groups was or-
ganised in two different datasets: one on the business groups and one on the individual
companies. The two datasets map into each other in the following way: a) each record
of the group dataset must correspond to at least two records (companies) in the com-
pany dataset; b) each record of the company dataset can correspond only to one record
in the group dataset (a company uniquely belongs to a group).
It is not easy to analyse the evolution of business groups over time since they modify
not only the quantity of input and output but also the number of firms and their owner-
ship relationships. In the case of input and output variables (such as employees or sales)
Conclusions 254
it is possible to obtain synthetic measures at group level by summing up the values ob-
served in the individual companies. However, not all the variables produce reliable re-
sults; for example, in the case of sales there could be duplication of sales figures where
a company of the group sells its output to another company within the same group.
Ownership relationships are more difficult to analyse and synthesise yet these rela-
tionships are rather important as they define the ‘architecture’ of business groups in
terms of vertical (pyramids) or horizontal structures. This aspect is receiving increasing
attention in the literature as the choice of different structures responds to specific entre-
preneur aims. For this reason, the analysis of business structures has been used in this
study not just for describing the current reality of business organisations, but also for
discriminating between different theoretical hypotheses about business groups.
Throughout the study the graph representation of business groups has been used where
the nodes represent the companies of the group and the arches represent the ownership
relationships between companies.
The empirical evidence demonstrates there is also a prevalence of pyramidal struc-
tures in the case of small groups; this means that portfolio entrepreneurs prefer to use
the accumulated cash flow from established businesses when starting new ventures. Be-
sides the analogies in the formal structures of small and large groups, this study demon-
strates that the reasons for the presence of business groups in the small business sector
are different from those put forward to explain the presence of large groups. Specifi-
cally, this study demonstrates that the consideration of entrepreneurial processes can
greatly contribute to explaining the presence and characteristics of business groups in
the small business sector.
Conclusions 255
8.2 Research limitations
All research work has its limitations for several reasons: besides the abilities and mo-
tivation of the researchers involved, there are invariably resource constraints and the as-
sociated lack of appropriate data and information. Awareness of these limitations and of
their potential impact on the theoretical and empirical results is vital.
This thesis focuses on the problems and circumstances that induce entrepreneurs to
set up a new legal unit rather than pursuing new business opportunities within the estab-
lished organisation. According to Bygrave and Hofer (1991)
“An Entrepreneurial Event involves the creation of a new organization to pursue
an opportunity… The Entrepreneurial Process involves all the functions, activities,
and actions associated with the perceiving of opportunities and the creation of or-
ganizations to pursue them” (Bygrave and Hofer, 1991, p. 14).
In this study the entrepreneurial event is associated with the setting up of a new com-
pany by habitual entrepreneurs. Not all the sources of data used in this thesis offer the
same degree of validity in identifying and measuring this construct (Chandler and Lyon,
2001).
In the case of indirect sources (the ISTAT and Capitalia data set) there is no informa-
tion on whether or not the companies belonging to groups have been set up to exploit
business opportunities. Because of this gap in knowledge, commercial, financial and
property companies were excluded from the analysis, since they are often set up for
other reasons than the pursuing of a new business opportunity; the analysis was re-
stricted to ‘production’ companies (either manufacturing or service). Direct information
about business groups in the Marche region and those collected through direct inter-
Conclusions 256
views confirm that in the case of small groups, production companies are almost always
the result of the entrepreneur exploiting new business opportunities. Other processes
that could have resulted in the adding of new companies – such as the breaking up of
existing activities or acquisitions of already established businesses - are common in
large groups but a marginal phenomenon in small groups.
Companies (or the entire group) can be inherited by the controlling entrepreneur. I
can’t control for this when using indirect sources (like the ISTAT and the Capitalia
datasets); nevertheless, these are the sources which have been used to analyse the gen-
eral characteristics of business groups. In the case studies of business groups in the
Marche region, I have interviewed all the entrepreneurs that directly founded the
group83
There is a big debate in economic and management sciences about the repeatability
and consistency of results that are obtained by using interviews and case studies and the
possibility of deriving (inferring) general results from their analysis.
.
Economists are the social scientists that give the least importance to interviews be-
cause they argue that people’s intentions and goals can be ‘presumed’ by researchers
under the hypothesis of ‘rationality’ of behaviour (either absolute or bounded). This is
the position taken by Almeida and Wolfenzon (2006) in developing their model on
business groups, which is based on the hypothesis of a wealth maximisation goal on the
part of entrepreneurs. The limit of this position is clearly highlighted by Bewley (2002):
“The danger of this position is that investigators put too much power in their own
hands by assuming they know better than decision makers what their motives are.
83 In a few cases the interviewed entrepreneur inherited a small business but it was he/she who developed the group.
Conclusions 257
Why should an investigator’s prejudices take precedence over those of the people
studied? If you give yourself the right to ignore evidence, such as what decision
makers say, there is little limit to what you can assert” (Bewley, 2002, p. 349-350)
It can also be argued that what people say about their motives can be interesting,
whether or not they are able to explain the ‘real’ motives behind their behaviour; it re-
veals how they interpret the situation and the nature of their worries. Human behaviour
is always interesting, whether it is rational or not, and we should want to understand it
(Bewley, 2002, p. 350). Given the aim of this study, I chose direct interviews to get a
direct account of entrepreneur behaviour and to understand motivations and insights that
were not addressed by the available theories. In fact, the main motivation for this study
was the dissatisfaction with available theories on business groups. Besides the reliability
of the interviews as a tool for inferring the motives of human behaviour, there is also a
debate about whether the use of a single case study is superior to the use of multiple
case studies (Eisenhardt, 1989; Dyer and Wilkins, 1991). I preferred the use of several
case studies because of the variety of situations that characterise the phenomenon of
business groups and because it was an exploratory study aimed at discovering new is-
sues. New cases were added until they no longer advanced comprehension of the phe-
nomenon.
Although the case studies were not selected as a random sample I am confident that
the results are reliable when extended to other samples. The groups that I chose for case
studies, though located in one region (the Marche region) show similar characteristics to
those observed at national level. Given that the institutional context under which entre-
preneurs take their decisions is similar across the country, there is no reason to believe
that those located in the Marche region show anomalous behaviour. The comparison be-
Conclusions 258
tween the groups examined in this study and the cases reported in other countries (Rosa,
1998; Loiseau, 2001) show noticeable similarities in the structure and dynamics of
business groups. This suggests that most of the empirical findings of this research are
not country specific. However, the theoretical framework developed to synthesise the
main results of the study do not include country-specific variables.
8.3 Management and policy implications
The basic approach of this thesis was analytical, i.e. developing a theoretical frame-
work to explain the evidence on business groups in the small business sector. The thesis
does not develop a performance analysis, useful for management strategy, or a welfare
analysis, useful for policy implementation. Nevertheless, the empirical and theoretical
findings of this study suggest some management and policy implications.
In the case of management, the most important result is the recognition of the group
structure as an organisational form specifically suited to facilitate the start up of new
businesses. As such, the group structure cannot simply be reduced to a “corrupted” divi-
sional structure. Though mimicking an M-form in some aspects, the business group pre-
sents specificities of its own. The most important one is the possibility of changing the
ownership structure of a new business and set it in order to maximize the probability of
its success. This is not a trivial matter because in the new economic conditions, organ-
isational and governance issues overlap more and more (Rajan and Zingales, 2000).
Given the increasing demand for quality and innovation, the control of physical capital
has declined as a source of rent and most of all as a condition to appropriate the growth
opportunities associated with business activity; on the contrary, the role of human capi-
tal has become more and more important. At the same time, the need for fostering inno-
Conclusions 259
vation and entrepreneurial behaviour within established firms is becoming fundamental
for their ability to compete and grow (Kanter, 1989; Stopford and Baden-Fuller, 1994;
Zahra et al., 1999c). In these new conditions, the ability to motivate people and to en-
courage them to make the specific investments that are needed for the exploitation of
new business opportunities has become of critical importance. The business group ap-
pears to be a mechanism which can help entrepreneurs exploit new business opportuni-
ties while retaining some of the advantages of centralised control.
Instead of considering the group as a peculiarity of emerging economies or as an
‘anomalous’ structure resulting from capital market imperfections, it should be consid-
ered as organisational form specifically suited for the development of new businesses
and, as such, it should be given adequate space in the management literature84
The available theories stress the importance of ‘market imperfections’ when explain-
ing the presence and characteristics of business groups: the imperfections in capital
markets, in the case of the financial theory and the backwardness of capitalistic institu-
tions, in the case of the literature on emerging economies. This thesis demonstrates that
the main driving forces behind the formation and development of business groups are to
. The
cases analysed in this research show that the business group can be a very flexible struc-
ture; it can mimic an M-form but also enable better ‘fine tuning’ between centralisation
and autonomy. Compared with the M-form, the business group also has the important
advantage of legal autonomy of its business units. This allows entrepreneurs to change
the ownership structure of the new business, thus involving other people who can play
an entrepreneurial role within the group.
84 Despite the relevance of business groups in emerging and developed countries, it is rare to find sections dedicated to this organisational form in management manuals.
Conclusions 260
be found in strategic and organisational aspects rather than market imperfections: spe-
cifically, the exploitation of new business opportunities and the efficient management of
diversified activities.
For these reasons, the legal systems (taxation, corporate and commercial law, etc.)
should incorporate the idea of the group not only as a financial and fiscal device to be
regarded with suspicion (Morck and Yeung, 2004), but as an efficient organisational
form. Of course, business groups are also used by entrepreneurs and managers for the
purposes of tax avoidance as well as to manipulate the ownership structure of compa-
nies in order to maximise returns for the controlling owners. Recognising this fact is
quite different to making an automatic association between business groups and these
practices.
The debate about the relationship between fiscal policy and business groups is par-
ticularly lively in the USA where there was a recent proposal to abolish the inter-
company dividend taxation; some authors (Morck and Poterba, 2005; Morck and
Yeung, 2005) maintain that this taxation was introduced (in the 1930s) with the specific
aim of eliminating business groups and that it should be maintained to prevent the phe-
nomenon of pyramidal groups and equity leverage.
The problem is not the presence of business groups as such. As showed in Section
2.1 groups are present in a range of types and a response to a variety of motives. Policy
makers should try and discourage inefficient (or undesirable) behaviour but should not
reduce the possibilities available to entrepreneurs and managers to organise the control
of business activities in ways than can enhance potential growth and efficiency.
Conclusions 261
8.4 Further development
Several questions emerged during this research. Here I highlight those that appear as
the most promising for further investigation.
When entering into new activities, portfolio entrepreneurs prefer to set up new com-
panies rather than acquire established ones. While the setting up of new firms is a com-
mon phenomenon in each firm size range, the probability of observing acquisitions of
established firms is positively related to the size of the acquiring firm. This could be the
result of the characteristics of the new business but also of the problems faced by small
firms in managing an acquisition process. Small and medium sized firms can lack the
resources and capabilities needed for acquiring firms and integrating them within the es-
tablished businesses. A better understanding of the factors affecting the different capa-
bilities behind the start-up or the acquisition of new ventures can therefore help the
growth possibilities of small firms.
The thesis has underlined the role of the business group as a way of enlarging the en-
trepreneurial team. This is done by giving a minority share in the new venture to people
involved in the start-up phase. It would be interesting to better understand what factors
influence the share given to other people and whether this has any influence on the per-
formance of the new business. In the case studies a reverse causal relationship is ob-
served; the share of the associated entrepreneur was enlarged as a result of the success
of the new venture. There is a large amount of literature on the optimal share to be
given to managers to resolve the agency problems in publicly held firms. In the case of
business groups, a minority share is instrumental for involving people in the start-up of
a new venture. It is possible that in this case the factors involved are different from the
case of large firms.
Conclusions 262
Most of small groups are family owned and managed. This thesis revealed that the
ownership and control structure in business groups is more complex than in individual
firms. Indeed, in some cases the group is formed in order to involve people from outside
the entrepreneur’s family in playing an entrepreneurial role. This means several aspects
of the debate about family firms should be reconsidered. The multi business context of
business groups can offer interesting insights to better understand the internal dynamics
within the controlling family as well as the relationships with ‘outside’ entrepreneurs
involved in the ownership and management of individual companies.
Agency costs play a major role in the possibility of acquiring outside equity in pri-
vately-held firms. In business groups this question is overcome by the fact that minority
shareholders are given a pre-eminent role in the management of the business in which
they have a stake; actually, the minority share is instrumental to this involvement rather
than the raising of equity. Given the importance of outside equity for the ability of firms
to grow and diversify, it will be interesting to further analyse, on a theoretical and em-
pirical level, the factors affecting the possibility of privately held firms to reduce the
agency costs attached to minority shares, thus enhancing the possibility for firms to
raise outside equity when entering into new businesses.
The analysis of entrepreneurial teams within business groups demonstrates that there
is a wider range of possibilities in the typology of teams besides the ‘extreme’ cases of
the ‘nested’ and the ‘peer’ teams (Harper, 2008). Further theoretical and empirical work
is needed on this issue to develop a more comprehensive typology of entrepreneurial
teams and the factors affecting the forms chosen by entrepreneurs.
References 263
Bibliographic references
Acemoglu, D., P. Aghion, R. Griffith, and F. Zilibotti (2004), Vertical integration and technology. Theory and evidence, NBER Working Paper Series (10997), 1-46.
Almeida, H., and D. Wolfenzon (2006), A theory of pyramidal ownership and family business groups, The Journal of Finance, 61 (6), 2637-2680
Alsos, G.-A., L. Kolvereid, and E.-J. Isaksen (2006), 'New Business Early Performance: Differences between Firms Started by Novice, Serial and Portfolio Entrepreneurs'. In P. R. Christensen and P. F. (Eds), Managing Complexity and Change in SMEs. Frontiers in European Research, Cheltenam, UK, Edward Elgar, pp. 35-49.
Alsos, G. A., and L. Kolvereid (1998), The business gestation process of novice, serial and parallel business founders, Entrepreneurship Theory & Practice, 22 (4), 101-114.
Alvarez, S. A., and J. B. Barney (2004), Organizing rent generation and appropriation: toward a theory of the entrepreneurial firm, Journal of Business Venturing, 19 (5), 621-635.
Alzona, G. (1988), 'I gruppi industriali in Italia: determinanti reali e finanziarie'. In Zanetti G. (a cura di), Alle radici della struttura produttiva italiana, Roma, SIPI,
Amihud, Y., and B. Lev (1981), Risk reduction as a managerial motive for conglomerate mergers, Bell Journal of Economics, 12 (2), 605-617.
Amihud, Y., and B. Lev (1999), Does Corporate Ownership Structure Affect its Strategy Towards Diversification?, Strategic Management Journal, 20 (11), 1063-1070.
Amit, R., L. Glosten, and E. Muller (1993), Challenges to theory development in entrepreneurship research, Journal of Management Studies, 30 (5), 815-834.
Anderson, R. C., T. W. Bates, J. M. Bizjak, and M. L. Lemmon (2000), Corporate Governance and Firm Diversification, Financial Management, 29 (Seas Spr), 5-22.
Aoki, M. (1988), Information, Incentives, and Bargaining in the Japanese Economy, Cambridge, Cambridge University Press.
Ardichvili, A., R. Cardozo, and S. Ray (2003), A theory of entrepreneurial opportunity identification and development, Journal of Business Venturing, 18 (1), 105-123.
Aw, B. Y., and G. Batra (1998), Firm size and the pattern of diversification, International Journal of Industrial Organization, 16 (3), 313-332.
Baldwin, J. R., D. Beckstead, G. Gellatly, and A. Peters. (2000). Patterns of corporate diversification in Canada: An empirical analysis (No. 150). Ottawa, Statistics Canada.
Barca, F. (1996), On Corporate Governance in Italy: Issue, Facts and Agenda, Fondazione ENI Enrico Mattei Working Paper Series (Nota di lavoro 10.96).
References 264
Barca, F., and M. Becht. (2001), The Control of Corporate Europe, Oxford, Oxford University Press.
Barca, F., M. Bianco, L. Cannari, R. Cesari, C. Gola, G. Manitta, G. Salvo, and L. F. Signorini. (1994), Assetti proprietari e mercato delle imprese. Vol. I. Proprietà, modelli di controllo e riallocazione delle imprese industriali italiane, Bologna, Il Mulino.
Baron, R. A. (2004), The cognitive perspective: a valuable tool for answering entrepreneurship's basic "why" questions, Journal Of Business Venturing, 19 (2), 221-239.
Barreto, H. (1989), The entrepreneur in micro-economic theory : disappearance and explanation, London, Routledge.
Barringer, B. R., and J. S. Harrison (2000), Walking a tightrope: creating value through interorganizational relationships, Journal of Management, 26 (3), 367-403.
Baumol, W. J. (1968), Entrepreneurship in Economic Theory, American Economic Review, 58 ( 2 May), 64-71.
Baumol, W. J. (1993a), Entrepreneurship, management, and the structure of payoffs, Cambridge, Mass., MIT Press.
Baumol, W. J. (1993b), Formal Entrepreneurship Theory in Economics: Existence and Bounds, Journal of Business Venturing, 8 (3), 197-210.
Becht, M., P. Bolton, and A. Roell (2002), Corporate Governance and Control, Nber Working Paper Series (9371).
Berle, A., and G. Means. (1932), The Modern Corporation and Private Property, NewYork, MacMillan.
Bertrand, M., P. Mehta, and S. Mullainathan (2002), Ferreting out Tunneling: An Application to Indian Business Groups, Quarterly Journal of Economics, 117 (1), 121-148.
Bethel, J. E., and J. P. Liebeskind (1998), Diversification and the Legal Organization of the Firm, Organization Science, 9 (1), 49-67.
Bewley, T. (2002), Interviews as a valid empirical tool in economics, Journal of Socioeconomics, 31 (4), 343-353.
Bhidé, A., and H. H. Stevenson (1999), 'Attracting Stakeholders'. In W. A. Sahlman, H. H. Stevenson, M. J. Roberts and A. Bhidé (Eds), The Entrepreneurial Venture. 2nd edition, Boston, Harvard Business School Press, pp. 211-222.
Bianchi, M., and M. Henrekson. (2005). Is Neoclassical Economics still Entrepreneurless? (Vol. 58, pp. 353-377).
Birley, S., and D. Norburn (1985), Small vs. Large Companies: The Entrepreneurial Conundrum, Journal of Business Strategy, 6 (1), 81-87.
Birley, S., and P. Westhead (1993), A Comparison of New Businesses Established by `Novice' and `Habitual' Founders in Great Britain, International Small Business Journal, 12 (1), 38.
Breschi, S., F. Lissoni, and F. Malerba (2003), Knowledge-relatedness in firm technological diversification, Research Policy, 32 (1), 69-87.
Breschi, S., F. Malerba, and L. Orsenigo (2000), Technological Regimes and Schumpeterian Patterns of Innovation, Economic Journal (463), 388-410.
Brioschi, F., L. Buzzacchi, and M. G. Colombo. (1990), Gruppi di imprese e mercato finanziario. La struttura di potere nell'industria italiana, Roma, La Nuova Italia Scientifica.
References 265
Brush, C. G., I. M. Duhaime, W. B. Gartner, A. Stewart, J. A. Katz, M. A. Hitt, S. A. Alvarez, G. D. Meyer, and S. Venkataraman (2003), Doctoral Education in the Field of Entrepreneurship, Journal of Management, 29 (3), 309-331.
Bruyat, C., and P.-A. Julien (2001), Defining the field of research in entrepreneurship, Journal of Business Venturing, 16 (2), 165-180.
Bryman, A. (2001), Social research methods, Oxford, Oxford University Press. Burgelman, R. A., and L. R. Sayles. (1986), Inside corporate innovation : strategy,
structure, and managerial skills, New York, London, Free Press, Collier-Macmillan.
Burke, A. E., F. R. FitzRoy, and M. A. Nolan (2008), What Makes a Die-Hard Entrepreneur? Beyond the 'Employee or Entrepreneur' Dichotomy, Small Business Economics, 31 (2), 93-115.
Busenitz, L. W., G. P. West, D. Shepherd, T. Nelson, G. N. Chandler, and A. Zacharakis (2003), Entrepreneurship Research in Emergence: Past Trends and Future Directions, Journal of Management, 29 (3), 285-308.
Buzzacchi, L., and M. G. Colombo (1996), Business groups and the determinants of corporate ownership, Cambridge Journal of Economics, 20, 31-52.
Buzzacchi, L., and M. G. Comombo (1994), Gruppi di imprese e proprietà, Politica Economica, X (2), 157-189.
Buzzacchi, L., and M. Pagnini. (1994), I meccanismi di funzionamento dei circuiti interni dei capitali: un'indagine empirica del caso italiano, Roma, Banca d'Italia, Temi di discussione, n. 240.
Buzzacchi, L., and M. Pagnini (1995), Diritti di proprietà e mercati interni dei capitali nel modello d'impresa italiana, L'Industria, XVI (3), 503-525.
Bygrave, W. D., and C. W. Hofer (1991), Theorizing about Entrepreneurship, Entrepreneurship Theory & Practice, 16 (4), 13-22.
Cainelli, G., and D. Iacobucci. (2007), Agglomeration, Technology and Business Groups, Cheltenham, Edward Elgar.
Cantwell, J., A. Gambardella, and O. Granstrand. (2004), The economics and management of technological diversification, London ; New York, Routledge.
Carlton, D. W., and J. M. Perloff. (2005), Modern Industrial Organization (Fourth ed.), Boston, Pearson/Addison Wesley.
Carter, S. (1998), Portfolio entrepreneurship in the farm sector: indigenous growth in rural areas?, Entrepreneurship and Regional Development, 10 (1), 17-32.
Carter, S., and M. Ram (2003), Reassessing Portfolio Entrepreneurship, Small Business Economics, 21 (4), 371-380.
Casson, M. (1982), The entrepreneur : an economic theory, Totowa, N.J., Barnes & Noble Books.
Casson, M. (1990), Entrepreneurship, Aldershot, Hants, England ; Brookfield, Vt., USA, E. Elgar Pub.
Caves, R. E., and R. M. Bradburd (1988), The empirical determinants of vertical integration, Journal of Economic Behavior & Organization, 9 (3), 265-279.
Caves, R. E., and P. J. Williamson (1985), What Is Product Differentiation, Really?, Journal of Industrial Economics, 34 (December).
Chabanas, N. (2002). Les entreprises francaises des groupes vues a travers les enquetes "liaisons financieres" de 1980 a 1999. Paris, INSEE.
Chandler, A. D. (1962), Strategy and structure: chapters in the history of the industrial enterprise, Cambridge,, M.I.T. Press.
References 266
Chandler, A. D. (1977), The Visible Hand: The Managerial Revolution in American Business, Cambridge, Harvard University Press.
Chandler, A. D. (1982a), M-Form: Industrial Groups, American Style, European Economic Review, 19 (1), 3-23.
Chandler, A. D. (1982b), M-Form: Industrial Groups, American Style, European Economic Review, 19, 3-23.
Chandler, A. D. (1990), Scale and Scope: The Dynamics of Industrial Capitalism, Cambridge MA, Harvard University Press.
Chandler, G. N., and D. W. Lyon (2001), Issues of Research Design and Construct Measurement in Entrepreneurship Research: The Past Decade, Entrepreneurship Theory and Practice, 25 (4), 101-113.
Chang, S. J. (2006a), Business groups in East Asia: Financial crisis, restructuring and new growth, Oxford, Oxford University Press.
Chang, S. J. (2006b), Business groups in East Asia: Post-crisis restructuring and new growth, Asia Pacific Journal of Management, 23 (4), 407-417.
Chang, S. J., and U. Choi (1988), Strategy, Structure and Performance of Korean Business Groups: A Transactions Cost Approach, Journal of Industrial Economics, 37(2), 141-158.
Chatterjee, S., and J. D. Blocher (1992), Measurement of Firm Diversification: Is It Robust?, Academy of Management Journal, 35 (4), 874.
Chemla, G., M. A. Habib, and A. Ljungqvist (2007), An Analysis of Shareholder Agreements, Journal of the European Economic Association, 5 (1), 93-121.
Chrisman, J. J., J. H. Chua, and R. A. Litz (2004), Comparing the Agency Costs of Family and Non-Family Firms: Conceptual Issues and Exploratory Evidence, Entrepreneurship: Theory & Practice, 28 (4), 335-354.
Chrisman, J. J., J. H. Chua, and P. Sharma (2005), Trends and Directions in the Development of a Strategic Management Theory of the Family Firm, Entrepreneurship: Theory & Practice, 29 (5), 555-575.
Chua, J. H., J. J. Chrisman, and P. Sharma (1999), Defining the Family Business by Behavior, Entrepreneurship: Theory & Practice, 23 (4), 19-39.
Churchill, N., and V. Lewis (1983), The Five Stages of Small Firm Growth, Harvard Business Review (May-June), 30-50.
Colombo, M. G., L. Grilli, and C. Verga (2007), High-Tech Start-Up Access to Public Funds and Venture Capital: Evidence from Italy, International Review of Applied Economics, 21 (3), 381-402.
Cooney, T. M. (2005), Editorial: What is an Entrepreneurial Team?, International Small Business Journal, 23 (3), 226-235.
Cornelius, B., H. Landström, and O. Persson (2006), Entrepreneurial Studies: The Dynamic Research Front of a Developing Social Science, Entrepreneurship: Theory & Practice, 30 (3), 375-398.
Creswell, J. W. (2003), Research design : qualitative, quantitative, and mixed method approaches (2nd ed.), Thousand Oaks, Calif., Sage Publications.
Cuervo-Cazurra, A. (2006), Business groups and their types Asia Pacific Journal of Management, 23 (4), 419-437.
Daems, H. (1978), The Holding Company and Corporate Control, Leinden, Stenferd Kroese.
References 267
Daily, C. M., D. R. Dalton, and N. Rajagopalan (2003), Governance through ownership: Centuries of practice, decades of research, Academy of Management Journal, 46 (2), 151-158.
Dass, P. (2000), Relationship of Firm Size, Initial Diversification, and Internationalization with Strategic Change, Journal of Business Research, 48 (2), 135-146.
Davidsson, P. (2008), The entrepreneurship research challenge, Cheltenham, UK, Edward Elgar.
Davidsson, P., and J. Wiklund (2001), Levels of Analysis in Entrepreneurship Research: Current Research Practice and Suggestions for the Future, Entrepreneurship Theory and Practice, 25 (4), 81-100.
Davies, S. W., L. Rondi, and A. Sembenelli (2001), Are multinationality and diversification complementary or substitute strategies?, International Journal of Industrial Organization, 19 (8), 1315-1346.
Demsetz, H. (1988), Ownership Control and the Firm, Oxford, Basil Blackwell. Denis, D. J., D. K. Denis, and A. Barin (1997), Agency Problems, Equity Ownership,
and Corporate Diversification, Journal of Finance, 52 (1), 135-160. Depperu, D., and P. Capello. (1990), I gruppi di imprese di dimensioni minori, Milano,
Franco Angeli. Dew, N., S. D. Sarasvathy, and S. Venkataraman (2004), The economic implications of
exaptation, Journal of Evolutionary Economics, 14 (1), 69-84. Dewenter, K., W. Novaes, and R. H. Pettway (2001), Visibility versus Complexity in
Business Groups: Evidence from Japanese Keiretsu, Journal of Business, 74 (1), 79-100.
Donckels, R., B. Dupont, and P. Michel (1987), Multiple business starters. Who? Why? What?, Journal of Small Business and Entrepreneurship, 5 (1), 48-63.
Dore, R. (1987), Taking Japan Seriously, Stanford, Stanford University Press. Dunne, P., and A. Hughes (1994), Age, size, growth and survival: U.K. companies in
the 1980s, Journal of Industrial Economics, 42 (2), 115-140. Dunne, T., M. J. Roberts, and L. Samuelson (1988), Patterns of firm entry and exit in
U.S. manufacturing industries, RAND Journal of Economics, 19 (4, Winter), 495-515.
Dyer, G. W. (1994), Toward a Theory of Entrepreneurial Careers, Entrepreneurship Theory and Practice, 19 (2), 7.
Dyer, G. W., and A. L. Wilkins (1991), Better stories, not better constructs, to generate better theory: A rejoinder to Eisenhardt, Academy of Management Review, 16 (3), 613-619.
Eckhardt, J. T., and S. A. Shane (2003), Opportunities and Entrepreneurship, Journal of Management, 29 (3), 333-349.
Eisenhardt, K. M. (1989), Building theories from case study research, Academy of Management Review, 14 (4), 532-550.
Ensley, M. D., J. W. Carland, and J. C. Carland (2000), Investigating the Existence of the Lead Entrepreneur, Journal of Small Business Management, 38 (4), 59-77.
European Commission. (2001), Enterprises in Europe, Sixth Report, Luxembourg, Office for the Publications of the European Communities.
Eurostat - OECD. (2007). Eurostat − OECD Manual on Business Demography Statistics. Luxembourg, Eurostat.
References 268
Eurostat. (2003). Business register Recommendations manual. Luxembourg, European Commission.
Faccio, M., and L. H. Lang (2002), The ultimate ownership of Western European corporations, Journal of Financial Economics, 65 (3), 365-395.
Fama, E. F., and M. C. Jensen (1983), Separation of ownership and control, Journal of Law and Economics, 26 (2), 301-325.
Fan, J. P. H., and L. H. P. Lang (2000), The Measurement of Relatedness: An Application to Corporate Diversification, Journal of Business, 73 (4), 629-660.
Franks, J., and C. Mayer (2001), Ownership and Control of German Corporations, Review of Financial Studies, 14 (4), 943-978.
Fruin, W. M. (1992), The Japanese Enterprise System, Oxford, Claredon Press. Gartner, W. B. (1985), A framework for describing the phenomenon of new venture
creation, Academy of Management Review, 10 (4), 696-706. Gartner, W. B. (1988), Who is the entrepreneur is the wrong question, American
Journal of Small Business, 12, 11994. Gartner, W. B., P. Davidsson, and S. A. Zahra (2006), Are You Talking to Me? The
Nature of Community in Entrepreneurship Scholarship, Entrepreneurship: Theory & Practice, 30 (3), 321-331.
Gartner, W. B., and S. A. Shane (1995), Measuring Entrepreneurship Over Time, Journal of Business Venturing, 10 (4), 283.
Gartner, W. B., and K. H. Vesper (1994), Experiments in Entrepreneurship Education: Successes and Failures, Journal of Business Venturing, 9 (3), 179.
Gerlach, M. L. (1995), Alliance Capitalism - The Social Organization of Japanese Business, Organization Studies, 16 (1), 157.
Gerlach, M. L. (1997), 'The Organizational Logic of Business Groups: Evidence from the Zaibatsu'. In T. Shiba and M. Shimotani (Eds), Beyond the Firm. Business groups in international and historical perspective, Oxford, Oxford Univesity Press, pp. 245-273.
Ghemawat, P., and T. Khanna (1998), The Nature of Diversified Business Groups: A Research Design and Two Case Studies, Journal of Industrial Economics, 46 (1), 35-.
Gifford, S. (1992a), Allocation of entrepreneurial attention, Journal of Economic Behavior & Organization, 19 (3), 265-284.
Gifford, S. (1992b), Innovation, firm size and growth in a centralized organization, Rand Journal of Economics, 23 (2), 284-298.
Gifford, S. (1998), The allocation of limited entrepreneurial attention, Norwell, Mass., Kluwer Academic Publishers.
Gomez-Mejia, L. R., M. Nunez-Nickel, and I. Gutierrez (2001), The role of family ties in agency contracts, Academy of Management Journal, 44 (1), 81-95.
Goto, A. (1982), Business Groups in a Market Economy, European Economic Review, 19 (1), 53-70.
Granovetter, M. (1994), 'Business Groups'. In N. J. Smelser and R. Swedberg (Eds), The Handbook of Economic Sociology, Princeton NJ, Princeton University Press,
Grant, P., and L. Perren (2002), Small Business and Entrepreneurial Research: Meta-theories, Paradigms and Prejudices, International Small Business Journal, 20 (2), 185-211.
Greiner, L. (1974), Evolution and Revolution as Organizations Grow, Harvard Business Review (July-August), 37-46.
References 269
Guelpa, F. (1994), Gruppi di imprese come forma organizzativa intermedia fra mercato e gerarchia: una verifica empirica, Economia e politica industriale, 82, 107-128.
Hall, E. H., and C. H. St. John (1994), A Methodological Note on Diversity Measurement, Strategic Management Journal, 15 (2), 153.
Hansmann, H. (1996), The ownership of enterprise, Cambridge, Mass., The Belknap Press of Harvard University Press.
Harper, D. A. (1996), Entrepreneurship and the market process : an enquiry into the growth of knowledge, London ; New York, Routledge.
Harper, D. A. (2003), Foundations of entrepreneurship and economic development, London ; New York, Routledge.
Harper, D. A. (2008), Towards a theory of entrepreneurial teams, Journal of Business Venturing, 23 (6), 613-626.
Hellmann, T. (2007), Entrepreneurs and the Process of Obtaining Resources, Journal of Economics and Management Strategy, 16 (1), 81-109.
Hilferding, R., and T. B. Bottomore. (1981), Finance capital : a study of the latest phase of capitalist development, London ; Boston, Routledge & Kegan Paul.
Holderness, C. G. (2009), The Myth of Diffuse Ownership in the United States, Review of Financial Studies, 22 (4), 1377-1408.
Holmes, T. J., and J. A. Schmitz (1990), A Theory of Entrepreneurship and Its Application to the Study of Business Transfer, Journal of Political Economy, 98 (2), 265-294.
Hoskisson, R. E., and W. Busenitz (2002), 'Market uncertainty and learning distance. In corporate entrepreneurship entry mode choice'. In M. A. Hitt, R. D. Ireland, S. M. Camp and D. L. Sexton (Eds), Strategic entrepreneurship. Creating a new mindset, Oxford, Blackwell Publishing, pp. 151–172.
Hoskisson, R. E., M. A. Hitt, R. A. Johnson, and D. D. Moesel (1993), Construct Validity of an Objective (Entropy) Categorical Measure of Diversification Strategy, Strategic Management Journal, 14 (3), 215.
Iacobucci, D. (2002), Explaining business groups started by habitual entrepreneurs in the Italian manufacturing sector, Entrepreneurship and Regional Development, 14 (1), 31-48.
Iacobucci, D., and P. Rosa (2005), Growth, diversification and business group formation in entrepreneurial firms, Small Business Economics, 25 (1), 65-82.
INSEE (2006), Images économiques des entreprises et des groupes au 1er janvier 2005, Insee Résultats, Economie (27), 1-34.
ISTAT. (2005). I gruppi di imprese in Italia. Anno 2002. Roma, ISTAT. Jacquemin, A., and C. H. Berry (1979), Entropy measure of diversification and
corporate growth, Journal of Industrial Economics, 27 (4). Jensen, M. C. (1989), Eclipse of the Public Corporation, Harvard Business Review, 67
(September-October), 61-74. Jensen, M. C., and W. H. Meckling (1976), Theory of the Firm: Managerial Behaviour,
Agency Costs and Ownership Structure, Journal of Financial Economics, 3 (4), 305-360.
Johnson, S., R. La Porta, F. Lopez-de-Silanes, and A. Shleifer (2000), Tunneling, The American Economic Review, 90 (2), 22-27.
Joskow, P. L. (2005), 'Vertical integration'. In C. Menard and M. M. Shirley (Eds), Handbook of New Institutional Economics, Dordrecht, The Netherlands, Springer, pp. 319-348.
References 270
Kaldor, N. (1934), The Equilibrium of the Firm, Economic Journal, 44 (173), 70-91. Kamm, J. B., and A. J. Nurick (1993), The Stages of Team Venture Formation: A
Decision-making Model, Entrepreneurship Theory and Practice, 17 (2), 17. Kamm, J. B., J. C. Shuman, J. A. Seeger, and A. J. Nurick (1990), Entrepreneurial
Teams in New Venture Creation: A Research Agenda, Entrepreneurship: Theory & Practice, 14 (4), 7-17.
Kanter, R. M. (1989), When giants learn to dance : mastering the challenge of strategy, management, and careers in the 1990s, New York, Simon and Schuster.
Kester, W. C. (1992), Industrial Groups as Systems of Contractual Governance, Oxford Review of Economic Policy, 8 (3), 24-44.
Khanna, T. (2000), Business groups and social welfare in emerging markets: Existing evidence and unanswered questions, European Economic Review, 44 (4-6), 748-761.
Khanna, T., and K. Palepu (1997), Why Focused Strategies May Be Wrong for Emerging Markets, Harvard Business Review (July-August).
Khanna, T., and Y. Yafeh (2005), Business Groups and Risk Sharing around the World, Journal of Business, 78 (1), 301-340.
Kihlstrom, R. E., and J.-J. Laffont (1979), A General Equilibrium Entrepreneurial Theory of Firm Formation Based on Risk Aversion, Journal of Political Economy, 87 (4), 719-748.
Kirzner, I. M. (1979), Perception, opportunity, and profit : studies in the theory of entrepreneurship, Chicago, University of Chicago Press.
Knight, F. H. (1921), Risk, uncertainty and profit, Boston, New York,, Houghton Mifflin Company.
Kolvereid, L., and E. Bullvåg (1993), 'Novices versus experienced business founders: An exploratory investigation.'. In S. Birley, I. C. MacMillan and S. Subramony (Eds), Entrepreneurship Research: Global Perspectives, Amsterdam, Elsevier, pp. 275-285.
Kosko, B. (1993), Fuzzy thinking : the new science of fuzzy logic (1st ed.), New York, Hyperion.
La Porta, R., F. Lopez-de-Silanes, A. Shleifer, and R. Vishny (2000), Investor protection and corporate governance, Journal of Financial Economics, 58 (1-2), 3-27.
La Porta, R., F. Lopez-de-Sinales, and A. Shleifer (1999), Corporate Ownership Around the World, Journal of Finance, 54 (2), 471-517.
Lancaster, K. (1979), Variety, equity, and efficiency : product variety in an industrial society, New York, Columbia University Press.
Landes, D. S. (1969), The unbound Prometheus: technological change and industrial development in Western Europe from 1750 to the present, London,, Cambridge U.P.
Langlois, R. N., and P. L. Robertson. (1995), Firms, Markets and Economic Change. A Dynamic Theory of Business Institutions, London, Routledge.
Leff, N. H. (1978), Industrial Organization and Entrepreneurship in the Developing Countries: The Economic Groups, Economic Development and Cultural Change, 27 (July).
Leuz, C., D. Nanda, and P. D. Wysocki (2003), Earnings management and investor protection: an international comparison, Journal of Financial Economics, 69 (3), 505-527.
References 271
Lévesque, M. (2004), Mathematics, theory, and entrepreneurship, Journal of Business Venturing, 19 (5), 743-765.
Loiseau, H. (2001). Des groupes de la taille d'une PME. Un phenomen en plein essor. Paris, INSEE.
Low, M., and I. MacMillan (1988), Entrepreneurship: past research and future challenges, Journal of Management, 35, 139-161.
Low, M. B. (2001), The Adolescence of Entrepreneurship Research: Specification of Purpose, Entrepreneurship Theory and Practice, 25 (4), 17-26.
Lynn, M. L., and N. L. J. Reinsch (1990), Diversification patterns among small businesses, Journal of Small Business Management, 28 (4 October), 60-70.
MacMillan, I. (1986), To really learn about entrepreneurship, lets study habitual entrepreneurs, Journal of Business Venturing, 1, 241-243.
Macpherson, A., and R. Holt (2007), Knowledge, Learning and Small Firm Growth: A Systematic Review of the Evidence, Research Policy, 36 (2), 172-192.
Martin, J. D., and A. Sayrak (2003), Corporate diversification and shareholder value: a survey of recent literature, Journal of Corporate Finance, 9 (1), 37-57.
Matsusaka, J. G. (2001), Corporate Diversification, Value Maximization, and Organizational Capabilities, Journal of Business, 74 (3), 409-432.
Milgrom, P., and J. Roberts. (1992), Economics, Organization and Management, Englewood Cliffs, NJ, Prentice-Hall.
Miller, D., and I. Le Breton-Miller (2006), Family Governance and Firm Performance: Agency, Stewardship, and Capabilities, Family Business Review, 19 (1), 73-87.
Montgomery, C. A. (1994), Corporate Diversification, Journal of Economic Perspectives, 8 (3), 163.
Morck, R. (2000), Concentrated corporate ownership, Chicago, University of Chicago Press.
Morck, R. (2003), Why some double taxation might make sense: The special case of inter-corporate dividends, NBER Working Paper (9651).
Morck, R., and J. M. Poterba (2005), 'How to Eliminate Pyramidal Business Groups: The Double Taxation of Intercorporate Dividends and Other Incisive Uses of Tax Policy'. In Tax Policy and the Economy. Volume 19, Cambridge and London: MIT Press for the National Bureau of Economic Research, pp. 135-179.
Morck, R., A. Schleifer, and R. Vishny (1988), Management Ownership and Market Valuation: An Empirical Analysis, Journal of Financial Economics, 15 (3), 293-315.
Morck, R., D. Wolfenzon, and Y. Bernard (2005), Corporate Governance, Economic Entrenchment, and Growth, Journal of Economic Literature, 43 (3), 655-720.
Morck, R., and B. Yeung (2003), Agency problems in large family business groups, Entrepreneurship Theory & Practice, 27 (4), 367-382.
Morck, R., and B. Yeung (2004), Family Control and the Rent-Seeking Society, Entrepreneurship: Theory & Practice, 28 (4), 391-409.
Morck, R., and B. Yeung (2005), Dividend Taxation and Corporate Governance, The Journal of Economic Perspectives, 19 (3), 163-180.
Myers, S. C. (2000), Outside Equity, The Journal of Finance, 55 (3), 1005-1037. Myers, S. C., and N. S. Majluf (1984), Corporate Financing and Investment Decisions
When Firsm Have Information Investors Do Not Have, Journal of Financial Economics, June, 187-222.
References 272
Oswald, S. L., L. A. Muse, and M. W. Rutherford (2009), The Influence of Large Stake Family Control on Performance: Is It Agency or Entrenchment?, Journal of Small Business Management, 47 (1), 116-135.
Pavitt, K. (1984), Sectoral Patterns of Technical Change: Towards a Taxonomy and a Theory, Research Policy, 13, 343-373.
Peng, M. W., and A. Delios (2006), What determines the scope of the firm over time and around the world? An Asia Pacific perspective Asia Pacific Journal of Management, 23 (4), 385-405.
Peng , M. W., and A. Delios (2006), What determines the scope of the firm over time and around the world? An Asia Pacific perspective Asia Pacific Journal of Management, 23 (4), 385-405.
Penrose, E. (1959), The Theory of the Growth of the Firm, Oxford, Basil Blackwell. Phan, P. H. (2004), Entrepreneurship theory: possibilities and future directions, Journal
of Business Venturing, 19 (5), 617-620. Piscitello, L. (2000), Relatedness and Coherence in Technological and Product
Diversification of the World's Largest Firms, Structural Change and Economic Dynamics, 11 (3), 295-315.
Piscitello, L. (2005), Corporate Diversification, Coherence and Firm Innovative Performance, Revue d'Economie Industrielle, 110 (2ème Trimestre), 127-148.
Pramodita, S. (2004), An Overview of the Field of Family Business Studies: Current Status and Directions for the Future, Family Business Review, 17 (1), 1-36.
Rajan, R. G., and L. Zingales (2000), The governance of the new enterprise, NBER Working Paper 7958.
Ramanujan, V., and P. Varadarajan (1989), Reserach on corporate diversification: A synthesis, Strategic Management Journal, 10 (6), 523-551.
Ripollés-Meliá, M., and L. Sánchez-Peinado (2006), Relatedness and entry mode choice in the context of entrepreneurial business entries, The International Entrepreneurship and Management Journal, 2 (3), 367-389.
Robson, G., C. Gallagher, and M. Daly (1993), Diversification Strategy and Practice in Small Firms, International Small Business Journal, 11 (2), 37.
Rosa, P. (1998), Entrepreneurial Processes of Business Cluster Formation and Growth by 'Habitual' Entrepreneurs, Entrepreneurship Theory and Practice, 22 (4), 43-62.
Rosa, P., and M. Scott. (1996, Nov). Portfolio Entrepreneurs: Some Empirical Evidence on the Multiple Ownership or Control of SMEs, and its Implication for our Understanding of Start-Up and Growth. Paper presented at the Research in entrepreneurship and small business: Entrepreneurship and SME research; on its way to the next millenium, Brussels.
Rosa, P., and M. Scott (1999a), Entrepreneurial diversification, business-cluster formation, and growth, Environment and Planning C, 17 (5), 527-548.
Rosa, P., and M. Scott (1999b), The prevalence of multiple owners and directors in the SME sector: implications for our understanding of start-up and growth, Entrepreneurship and Regional Development, 11 (1), 21-38.
Rosa, P., and M. G. Scott (1999c), The prevalence of multiple owners and directors in the SME sector: implication for our undestanding of start-up and growth, Entrepreneurship & Regional Development, 11, 21-37.
References 273
Rumelt, R. P. (1974), Strategy, structure, and economic performance, Boston, Cambridge, Mass., Division of Research, Graduate School of Business Administration, distributed by Harvard University Press.
Sambharya, R. B. (2000), Assessing the Construct Validity of Strategic and SIC-Based Measures of Corporate Diversification, British Journal of Management, 11 (2), 163-174.
Sandvig, J. C. (2000), The Role of Technology in Small Firm Diversification, Journal of Technology Transfer, 25 (2), 157-168.
Sandvig, J. C., and L. Coakley (1998), Best Practices in Small Firm Diversification, Business Horizons, 41 (3), 33-40.
Sarasvathy, S. D. (2001), Causation and Effectuation: Toward a Theoretical Shift from Economic Inevitability to Entrepreneurial Contingency, Academy of Management Review, 26 (2), 243-263.
Sarasvathy, S. D. (2003), Entrepreneurship as a science of the artificial, Journal of Economic Psychology, 24 (2), 203-220.
Sarasvathy, S. D., and A. Menon (2004), Faling firms and successful entrepreneurs: serial entrepreneurship as a simple machine, Darden Business School Working Paper (04-05).
Sautet, F. E. (2000), An entrepreneurial theory of the firm, London ; New York, Routledge.
Schulze, W. S., M. H. Lubatkin, and R. N. Dino (2003), Toward a theory of agency and altruism in family firms, Journal of Business Venturing, 18 (4), 473.
Schulze, W. S., M. H. Lubatkin, R. N. Dino, and A. K. Buchholtz (2001), Agency Relationships in Family Firms: Theory and Evidence, Organization Science, 12, 99-116.
Scott, M., and P. Rosa (1996), Has Firm Level Analysis Reached its Limits? Time for a Rethink, International Small Business Journal, 14 (4), 81-89.
Shaked, A., and J. Sutton (1987), Product Differentiation and Industry Structure, Journal of Industrial Organization, 36 (3).
Shaker A. Zahra (2005), Entrepreneurial Risk Taking in Family Firms, Family Business Review, 18 (1), 23-40.
Shane, S., and S. Venkataraman (2000), The Promise of Entrepreneurship As a Field of Research, Academy of Management Review, 25 (1), 217-226.
Shimotani, M. (1997), 'The history and structure of business groups in Japan'. In T. Shiba and M. Shimotani (Eds), Beyond the firm : business groups in international and historical perspective, Oxford ; New York, Oxford University Press, pp. 5-27.
Shleifer, A., and R. Vishny (1997), A Survey of Corporate Governance, Journal of Finance, 52, 737-783.
Silva, F., N. Majluf, and R. D. Paredes (2006), Family ties, interlocking directors and performance of business groups in emerging countries: The case of Chile Journal of Business Research, 59 (3), 315-321.
Silverman, D. (2000), Doing Qualitative Research. A Practical Handbook, London, SAGE Publications.
Skalitz, A. (2002). Au-delà des entreprises: les groupes. Paris, INSEE. Slevin, D. P., and J. G. Covin (1992), 'Creating and maintaining high-performance
teams'. In D. L. Sexton and J. D. Kasarda (Eds), The State of the Art of Entrepreneurship, Boston, MA, PWS-Kent Publishing Company, pp. 358-386.
References 274
Smangs, M. (2006), The Nature of the Business Group: A Social Network Perspective, Organization, 13 (6), 889-909.
Stake, R. E. (1995), The art of case study research, Thousand Oaks, Sage Publications. Starr, J., and W. Bygrave (1991), 'The assets and liabilities of prior start-up experience:
An exploratory study of multiple venture entrepreneurs.'. In N. C. Churchill, W. D. Bygrave, J. G. Covin, D. L. Sexton, D. P. Slevin, K. H. Vesper and W. E. Wetzel (Eds), Frontiers of Entrepreneurship Research, Wellesley, MA, Babson College, pp. 213–227.
Steier, L. (2003), Variants of agency contracts in family-financed ventures as a continuum of familial altruistic and market rationalities, Journal of Business Venturing, 18 (5), 597-618.
Steier, L. P., J. J. Chrisman, and J. H. Chua (2004), Entrepreneurial Management and Governance in Family Firms: An Introduction, Entrepreneurship: Theory & Practice, 28 (4), 295-303.
Steinmetz, G. (1969), Critical stages of small business growth: when they occur and how to survive them, Business Horizons, 12 (1), 29-34.
Stokman, F. N., R. Ziegler, and J. Scott. (1985), Networks of Corporate Power: A Comparative Analysis of Ten Coutries, Oxford, Blackwell.
Stopford, J. M., and C. W. F. Baden-Fuller (1994), Creating corporate entrepreneurship, Strategic Management Journal, 15, 521-536.
Storey, D. J. (1994), Understanding the small business sector, London ; New York, Routledge.
Strachan, H. W. (1976), Family and Other Business Groups in Economic Development. The Case of Nicaragua, New York, Praeger Publishers.
Sutton, J. (1991), Sunk Cost and Market Structure, Cambridge (Mass.), MIT Press. Teece, D. J., R. Rumelt, G. Dosi, and S. Winter (1994), Understanding Corporate
Coherence. Theory and Evidence, Journal of Economic Behavior and Organization, 23, 1-30.
Timmons, J. A. (1999), New venture creation : entrepreneurship for the 21st century (5th ed.), Boston ; London, Irwin McGraw-Hill.
Trento, S. (1993), Il gruppo di imprese come modello di controllo nei paesi ritardatari, Roma, Banca d'Italia, Temi di discussione n. 196.
Tricker, R. I. (2000), Corporate governance, Aldershot ; Brookfield, USA, Ashgate. Ucbasaran, D., G.-A. Alsos, P. Westhead, and M. Wright (2008), Habitual
Entrepreneurs, Foundations and Trends in Entrepreneurship, 4 (4), 309-450. Ucbasaran, D., A. Lockett, M. Wright, and P. Westhead (2003a), Entrepreneurial
Founder Teams: Factors Associated with Member Entry and Exit, Entrepreneurship Theory and Practice, 28 (2), 107-128.
Ucbasaran, D., P. Westhead, and M. Wright (2001), The Focus of Entrepreneurial Research: Contextual and Process Issues, Entrepreneurship Theory and Practice, 25 (4), 57-80.
Ucbasaran, D., P. Westhead, M. Wright, and M. Binks (2003b), Does Entrepreneurial Experience Influence Opportunity Identification?, The Journal of Private Equity (Winter), 7-14.
Ucbasaran, D., M. Wright, and P. Westhead (2003c), A longitudinal study of habitual entrepreneurs: starters and acquirers, Entrepreneurship and Regional Development, 15 (3), 207-228.
References 275
Vergeau, E., and N. Chabanas. (1997). Le nombre de groups d'entreprises a explosé en 15 ans (No. n. 553). Paris, INSEE.
Vesper, K. H. (1990), New venture strategies (Rev. ed.), Englewood Cliffs, N.J., Prentice Hall.
Ward, T. B. (2004), Cognition, creativity, and entrepreneurship, Journal Of Business Venturing, 19 (2), 173-188.
Watson, W. E., L. D. Ponthieu, and J. W. Critelli (1995a), Team interpersonal process effectiveness in venture partnerships and its connection to perceived success, Journal of Business Venturing, 10 (5), 393-411.
Watson, W. E., L. D. Ponthieu, and J. W. Critelli (1995b), Team Interpersonal Process Effectiveness in Venture Partnerships and Its Connection to Perceived Success, Journal of Business Venturing, 10 (5), 393.
Westhead, P., and M. Cowling (1998), Family firm research: The need for a metholological rethink, Entrepreneurship Theory & Practice, 22, 31-56.
Westhead, P., D. Ucbasaran, and M. Wright (2003), Differences Between Private Firms Owned by Novice, Serial and Portfolio Entrepreneurs: Implications for Policy Makers and Practitioners, Regional Studies, 37 (2), 187-200.
Westhead, P., and M. Wright (1998a), Novice, Portfolio, and Serial Founders in Rural and Urban Areas, Entrepreneurship Theory and Practice, 22 (4), 63-100.
Westhead, P., and M. Wright (1998b), Novice, Portfolio, and Serial Founders: Are They Different?, Journal of Business Venturing, 13 (3), 173-204.
Westhead, P., and M. Wright (1999), Contributions of Novice, Portfolio and Serial Founders Located in Rural and Urban Areas, Regional Studies, 33 (2), 157-174.
Whetten, D. A. (1989), What Constitutes a Theoretical Contribution?, Academy of Management Review, 14 (4), 490-495.
White, L. J. (1974), Industrial Concentration and Economic Power in Pakistan, Princeton, Princeton University Press.
Wiklund, J., and D. A. Shepherd (2008), Portfolio Entrepreneurship: Habitual and Novice Founders, New Entry, and Mode of Organizing, Entrepreneurship: Theory & Practice, 32 (4), 701-725.
Williamson, O. E. (1970), Corporate Control and Business Behavior, Englewood Cliffs, Prentice Hall.
Williamson, O. E. (1975), Markets and Hierarchies, Analysis and Antitrust Implications: A study in the economics of internal organization, New York, Free Press.
Williamson, O. E. (1985), The Economic Institution of Capitalism: Firms, Markets, Relational Contracting, New York, Free Press.
Wright, M., K. Robbie, and C. Ennew (1997), Venture Capitalists and Serial Entrepreneurs, Journal of Business Venturing, 12 (3), 227-249.
Wright, M., P. Westhead, and J. Sohl (1998), Habitual Entrepreneurs and Angel Investors, Entrepreneurship Theory and Practice, 22 (4), 5-22.
Yiu, D., G. D. Bruton, and Y. Lu (2005), Understanding Business Group Performance in an Emerging Economy: Acquiring Resources and Capabilities in Order to Prosper, Journal of Management Studies, 42 (1), 183–206.
Zahra, S. A. (2007), Contextualizing theory building in entrepreneurship research, Journal of Business Venturing, 22 (3), 443-452.
References 276
Zahra, S. A., and G. G. Dess (2001), Entrepreneurship As a Field of Research: Encouraging Dialogue and Debate, Academy of Management Review, 26 (1), 8-20.
Zahra, S. A., D. F. Jennings, and D. F. Kuratko (1999a), The Antecedents and Consequences of Firm-Level Entrepreneurship: The State of the Field, Entrepreneurship Theory and Practice, 24 (2), 45-66.
Zahra, S. A., D. F. Jennings, and D. F. Kuratko (1999b), Corporate Entrepreneurship in a Global Economy, Entrepreneurship Theory and Practice, 24 (1), 5-8.
Zahra, S. A., D. F. Kuratko, and D. F. Jennings (1999c), Corporate Entrepreneurship and Wealth Creation: Contemporary and Emerging Perspectives, Entrepreneurship Theory and Practice, 24 (2), 5-8.
Zahra, S. A., R. I. Yavuz, and D. Ucbasaran (2006), How Much Do You Trust Me? The Dark Side of Relational Trust in New Business Creation in Established Companies, Entrepreneurship: Theory & Practice, 30 (4), 541-559.
Zeitlin, M., and R. E. Ratcliff. (1988), Landlords & capitalists : the dominant class of Chile, Princeton, N.J., Princeton University Press.
Top Related
Copyright © 2022 FDOKUMEN

