


Bahasa
Halaman
Hukum

Advanced Power Estimation Techniques
MASSOUD PEDRAM
University of Southern California
Department of Electrical Engineering � Systems
Los Angeles� CA �����
massoud�zugros�usc�edu
This chapter describes a methodology and techniques for power estimationand analysis at behavioral� register�transfer and gate levels of design abstrac�tion� The major components of the proposed methodology are survey sam�pling techniques� probabilistic compaction techniques� RTL co�simulationengine� power macro�modeling� and high�level power estimation�
� Statistical Sampling
Existing power estimation techniques at the gate level and the circuit levelcan be classi�ed into two classes� static and dynamic� Static techniques��� � � �� rely on statistical information such as the mean activity ofthe input signals and their correlations� about the input stream to estimatethe internal switching activity of the circuit� While these are very e�cient�their main limitation is that they cannot accurately capture factors such asslew rates� glitch generation and propagation� DC �ghting� etc� Dynamictechniques ��� �� explicitly simulate the circuit under a �typical� input vectorstream� They can be applied at both the circuit and gate levels� Their mainshortcoming is however that they are very slow� Moreover� their results arehighly dependent on the simulated sequence� To alleviate this dependenceand thereby produce a trustworthy power estimate� the required number ofsimulated vectors is usually high� which further exacerbates the run timeproblem�
To address this problem� a Monte Carlo simulation technique was pro�

posed in ��� This technique uses an input model based on a Markov processto generate the input stream for simulation� The simulation is performedin an iterative fashion� In each iteration� a vector sequence of �xed length called sample� is simulated� The simulation results are monitored to calcu�late the mean value and variance of the samples� The iteration terminateswhen some stopping criterion is met� This approach su�ers from four majorshortcomings� First� since the simulation vectors are generated internallybased on statistics of the input stream� a large number of vectors needsto be examined to extract reliable statistics� Second� when the vectors areregenerated for simulation� the spatial correlations among various inputscannot be adequately captured� which may lead to inaccuracy in the powerestimates� Third� the required number of samples� which directly impactsthe simulation run time� is approximately proportional to the ratio betweenthe sample variance and square of sample mean value� For certain input se�quences� this ratio becomes large� thus signi�cantly increasing the simulationrun time� Finally there is a general concern about the normality assump�tion on the sample distribution� Since the stopping criterion is derived basedon the normality assumption� if the sample distribution signi�cantly devi�ate from normal distribution� the simulation may terminate prematurely�Di�cult distributions that cause premature termination include bi�modal�multi�modal� distributions with long or asymmetric tails�
The power estimation problem is addressed from a survey sampling per�spective in ���� The authors assume a sequence of vectors are providedto estimate the power consumption of a given circuit with certain statisti�cal constraints� such as error and con�dence levels� The power estimationproblem is then transformed into a survey sampling problem by dividingthe vector sequence into small units� e� g� consecutive vectors� to constitutethe population for the survey� Power consumption is the characteristic un�der study� The average power consumption is estimated by simulating thecircuit by a number of samples drawn from the population� a procedure re�ferred to as sampling� using an accurate circuit� or gate�level simulator suchas Power�Mill or Verilog�XL� The objective is to design a sampling proce�dure that will signi�cantly reduce the number of simulated vectors whilesatisfying the given error and con�dence levels�
The e�ciency of simple random sampling similar to what is used in ���is not very high� This can be explained in the context of power estima�tion as follows� Consider the case where the distribution of the population
�
Power consumption
Prob.
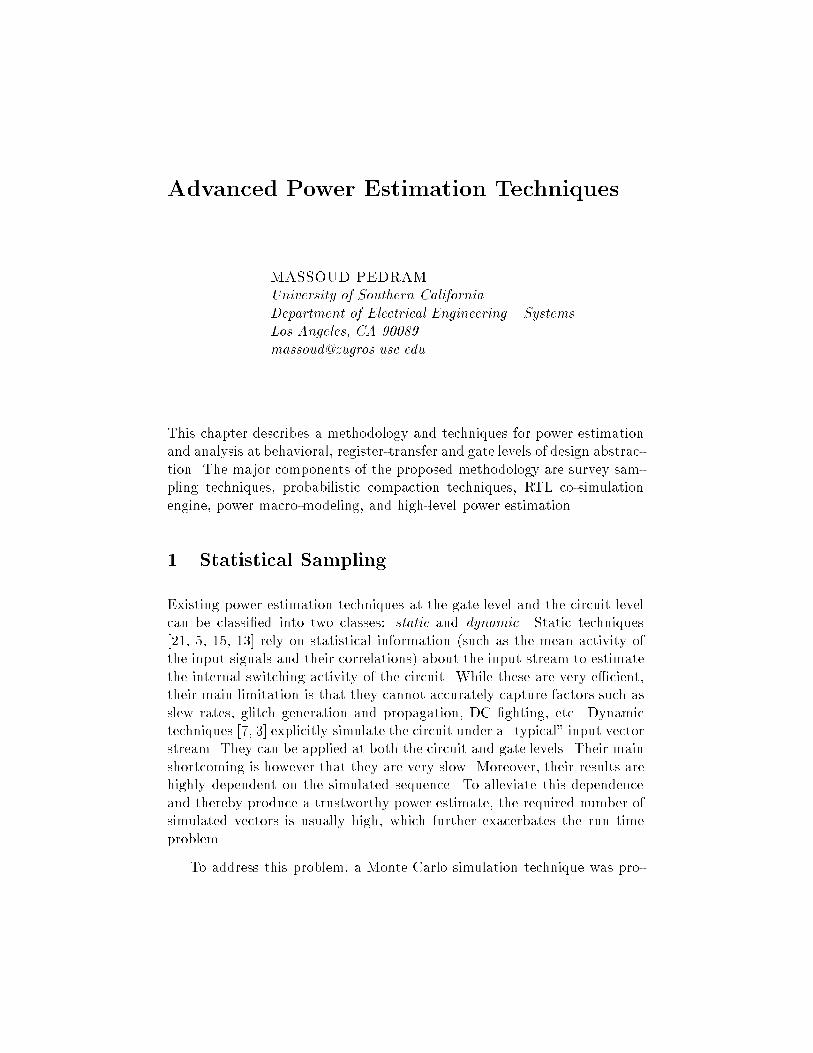
Figure � An example where simple random sampling performs poorly�
characteristic i� e� � power consumption� is as shown in Figure � that is�assuming the characteristic of half of the population is distributed aroundthe right peak� and the characteristic of the other half is distributed aroundthe left peak the population is bi�modal�� Since the selected unit couldeither come from the right peak or the left peak� the sampling variance isvery high�
If� on the other hand� one divides the population into two halves� thoseunits whose characteristic values are around the right peak are put into onesubpopulation while the remaining units are put into the other subpopula�tion� and select the samples in such a way that half of the units in a sampleare selected from each of the subpopulations� then the sampling variancewill be signi�cantly reduced� In order to divide the population into subpop�ulations� a predictor is often used� This predictor need not have a linearrelationship with the characteristic under study� as it is only used to dividethe population into subpopulations and is not directly used to calculatethe power estimates� The authors of ��� propose a more e�cient samplingprocedure based on this scheme called stratied sampling�
Strati�ed sampling techniques have been widely used for surveys becauseof their e�ciency� The purpose of strati�cation is to partition the populationinto disjoint subpopulations so that the power consumption characteristicwithin each subpopulation is more homogeneous compared to the originalpopulation� The partitioning is based on a low�cost predictor that needs tobe e�ciently calculated for each member in the population�
�
0 1 2 3 4 5 6 7 8 9 100
5
10
15
zero−delay power (mW)
pow
erm
ill p
ower
(m
W)
random sequence, C1355
0 1 2 3 4 5 6 7 8 9 100
5
10
15
zero−delay power (mW)
pow
erm
ill p
ower
(m
W)
biased sequence, C1355
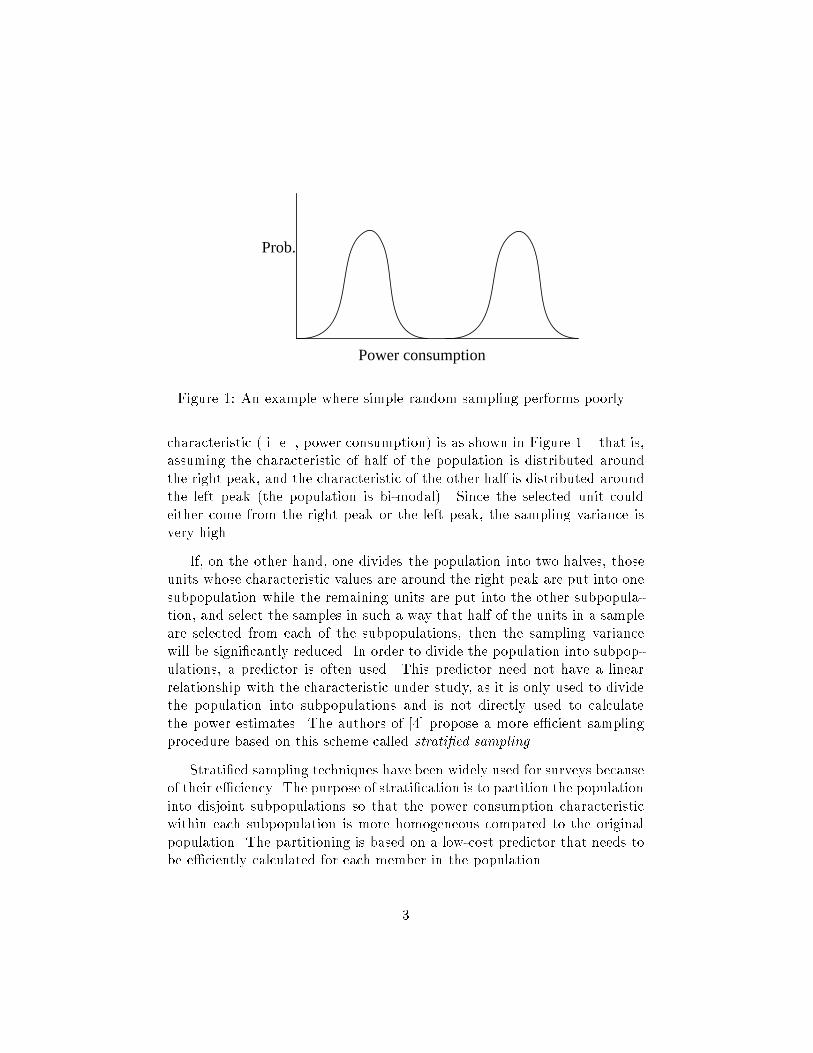
Figure �� Examples of Power�Mill power values vs� zero�delay power esti�mates for both random and biased input streams�
�
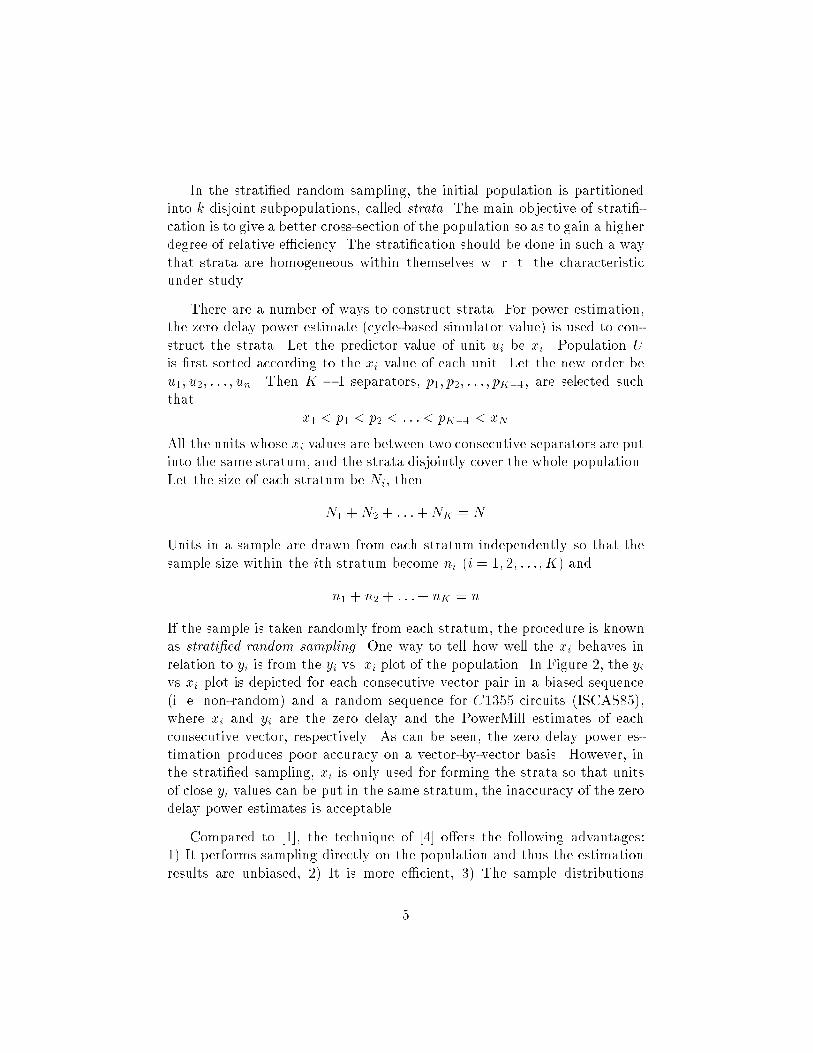
In the strati�ed random sampling� the initial population is partitionedinto k disjoint subpopulations� called strata� The main objective of strati��cation is to give a better cross�section of the population so as to gain a higherdegree of relative e�ciency� The strati�cation should be done in such a waythat strata are homogeneous within themselves w� r� t� the characteristicunder study�
There are a number of ways to construct strata� For power estimation�the zero delay power estimate cycle�based simulator value� is used to con�struct the strata� Let the predictor value of unit ui be xi� Population U
is �rst sorted according to the xi value of each unit� Let the new order beu�� u�� � � � � un� Then K � separators� p�� p�� � � � � pK��� are selected suchthat
x� � p� � p� � � � � � pK�� � xN
All the units whose xi values are between two consecutive separators are putinto the same stratum� and the strata disjointly cover the whole population�Let the size of each stratum be Ni� then
N� � N� � � � ��NK � N
Units in a sample are drawn from each stratum independently so that thesample size within the ith stratum become ni i � � �� � � � � K� and
n� � n� � � � �� nK � n
If the sample is taken randomly from each stratum� the procedure is knownas stratied random sampling� One way to tell how well the xi behaves inrelation to yi is from the yi vs� xi plot of the population� In Figure �� the yivs xi plot is depicted for each consecutive vector pair in a biased sequence i� e� non�random� and a random sequence for C� circuits ISCAS���where xi and yi are the zero delay and the PowerMill estimates of eachconsecutive vector� respectively� As can be seen� the zero delay power es�timation produces poor accuracy on a vector�by�vector basis� However� inthe strati�ed sampling� xi is only used for forming the strata so that unitsof close yi values can be put in the same stratum� the inaccuracy of the zerodelay power estimates is acceptable�
Compared to ��� the technique of ��� o�ers the following advantages�� It performs sampling directly on the population and thus the estimationresults are unbiased� �� It is more e�cient� �� The sample distributions
are more likely to be a normal distribution� and �� Di�cult populationdistributions can be handled more e�ectively� When the population sizeis large� one can use a two�stage strati�ed sampling procedure to reducethe overhead of predictor calculation and strati�cation� The proposed two�stage strati�ed sampling technique can be easily extended to multi�stagesampling� Note however that the predictors used at di�erent stages shouldbe as uncorrelated as possible�
The proposed techniques have been implemented in C and tested on IS�CAS� benchmarks� Two experiments have been performed� In the �rstexperiment� the authors compare the e�ciency of the strati�ed and sim�ple random sampling on a random and a biased sequences� In the secondexperiment� they compare the e�ciency of two�stage strati�ed sampling tothe technique proposed in �� for in�nite�size population i� e� � no initialpopulation was given�� The results can be summarized as follows�
For random and biased input sequences� the strati�cation approach re�sults in an e�ciency improvement factor reduction in simulation time� of��� and �� over the simple random sampling approach for an error levelof � and a con�dence level of ����� The e�ciency improvement of strat�i�ed sampling in the random sequence is much smaller than that in biasedsequence which is explained as follows� Since the transition probability ofeach circuit input was assumed to be ��� from the law of large numbers�the distribution of the number of input bit changes has a high peak arounda value equal to half of the circuit input count� Therefore the power dis�tribution is already very homogeneous� In addition� for a ������ randomsimulations of the biased sequence� no error values greater than ��� was de�tected for the strati�ed random sampling while for about ��� of the cases�the simple random sampling resulted in such high errors� This demonstratesthat strati�ed sampling can handle di�cult population distributions moree�ectively� As expected� there is no high error violation observed in therandom sequence� Power�Mill was used for actual power measurements�
They also compare the e�ciency of the proposed two�stage strati�edsampling technique to that proposed in ��� Since this experiment cannotbe performed in a reasonable time on PowerMill� the authors use an in�house real�delay gate�level power estimator instead� ���� simulation runswith ���� con�dence and � error levels were performed� There was nohigh error violation observed in either technique� The proposed two�stagestrati�ed sampling technique is however more than twice as e�cient as the
�

Markov�based technique�
� Probabilistic Compaction
Another approach for reducing the power simulation time is to compact thegiven long stream of bit vectors using probabilistic automata ��� The ideais to build a stochastic state machine which captures the relevant statisticalproperties of a given bit stream and then excite this machine by a smallnumber of random inputs so that the output sequence of the machine isstatistically equivalent to the initial much larger� sequence� The relevantstatistical properties can for example denote the signal and transition prob�abilities� and �rst�order spatio�temporal correlations among bits and acrossconsecutive time frames� The procedure then consists of decomposing theSSM into a set of deterministic state machines� and realizing it through SSMsynthesis with some auxiliary inputs� The compacted sequence is generatedby random excitement of the auxiliary inputs� As an example� a long se�quence of �bit vectors ������� is compressed to a much shorter sequence� by building a machine with states � and and a transition probabilityof to move out of the present state to the next state� Similarly� a longsequence of �bit vectors ��������� is compressed to a much shortersequence �� by building a machine with states � and and a transitionprobability of �� to stay in the present state and �� to move out of thepresent state�
The number of states in the probabilistic automata is proportional tothe number of distinct patterns in the initial vector sequence� Since thisnumber may be large i�e�� worst�case exponential in the number of bits ineach vector�� one has to manage the complexity by either � partitioningthe n bits into b groups with a maximum size of k bits per group and thenbuilding a probabilistic automata for each group of bits independently� ��partitioning the long vector sequence into consecutive blocks of vectors suchthat the number of distinct vectors in each block does not exceed some userde�ned parameter� say K� The shortcoming of the �rst approach is thatone may generate a bit pattern vector� that was not present in the initialsequence since correlations across di�erent groups of bits are ignored�� Thisis in turn a problem in certain applications with forbidden input patterns codes not used� illegal instructions� bad memory addresses� etc��� Thus� the
�
second approcah is often more desirable�
An improved algorithm for vector compaction is presented in ���� Thefoundation of this approach is also probabilistic in nature� it relies onadaptive dynamic� modeling of binary input streams as �rst�order Markovsources of information and is applicable to both combinational and sequen�tial circuits� The adaptive modeling technique itself best known as Dynamic
Markov Chain modeling� was recently introduced in the literature on datacompression ��� as a candidate to solve various data compression problems�This original formulation is extended in ��� to manage not only correla�tions among adjacent bits that belong to the same input vector� but alsocorrelations between successive input patterns� The model captures thuscompletely spatial correlations and �rst�order temporal correlations� Con�ceptually� it has no inherent limitation to be further extended to capturetemporal dependencies of higher orders�
Results of these approaches show �� orders of magnitude compaction depending on the initial length and charactersistics of the input sequence�with negligible error i�e� � � in most cases� using PowerMill as thesimulator see �� and ��� for details�� As a distinctive feature� note thatnone of the two approaches need the actual circuit to compact the inputsequences�
� Co�simulation for Power Evaluation
The register�transfer level RTL� power estimation problem can be stated asfollows� �Given an RTL circuit description consisting of m modules� and aninput vector sequence of length N � estimate the average power consumptionof the circuit over the N cycles�� The standard simulation based RT�levelpower estimation process consists of two steps�
� Perform behavioral simulation and collect the input statistics for allmodules in RTL descriptions�
�� Evaluate the power macro�model equation for each module and sumover the modules�
Busses� clock trees� random logic� etc� are processed separately� There is awide range of behavioral simulators available today� RTL power evaluation
�
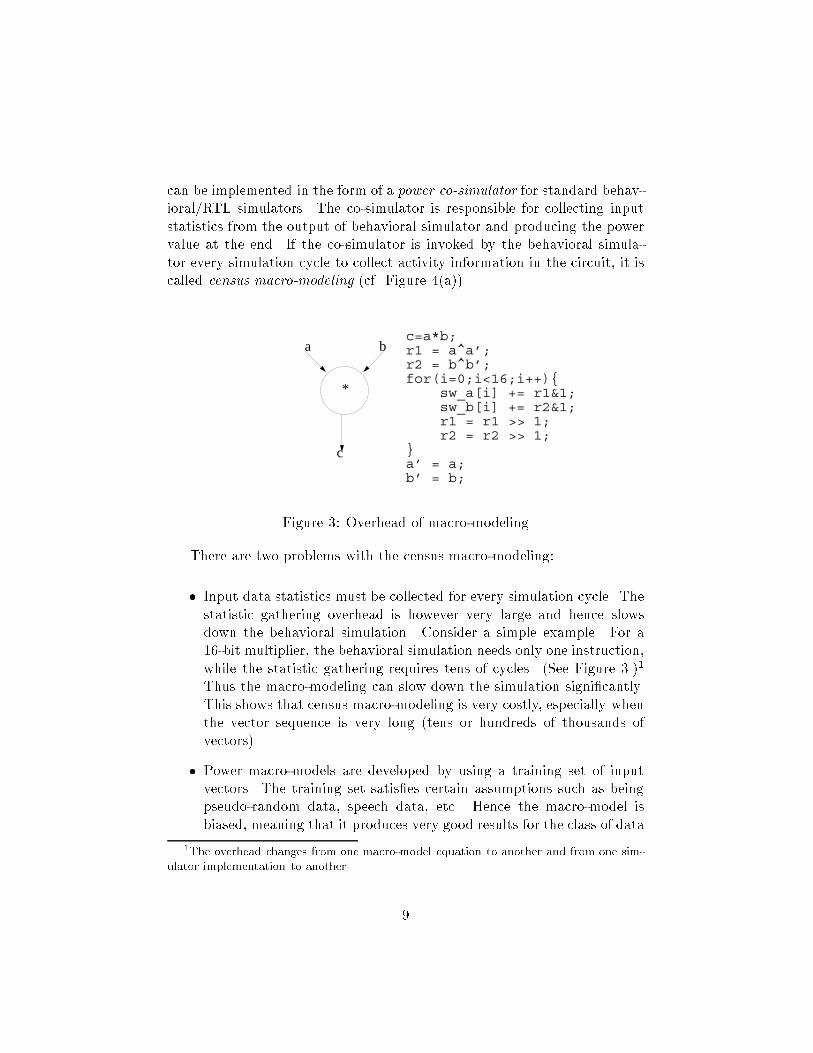
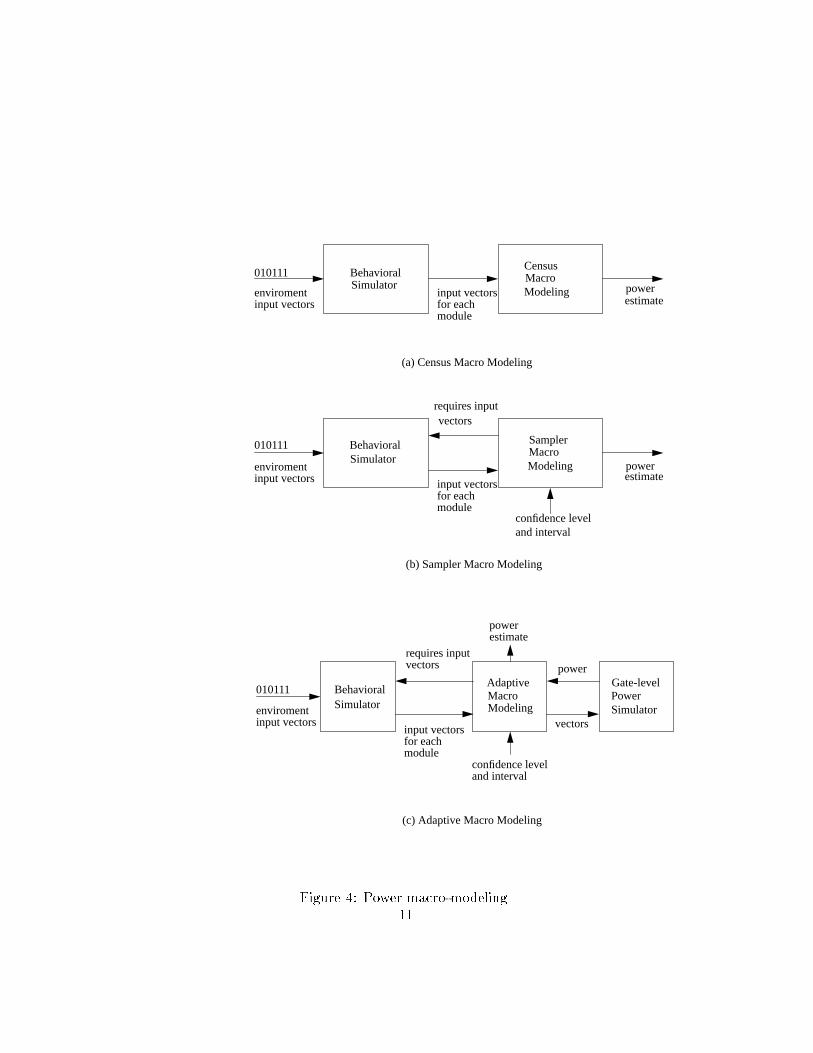
can be implemented in the form of a power cosimulator for standard behav�ioral�RTL simulators� The co�simulator is responsible for collecting inputstatistics from the output of behavioral simulator and producing the powervalue at the end� If the co�simulator is invoked by the behavioral simula�tor every simulation cycle to collect activity information in the circuit� it iscalled census macromodeling cf� Figure � a���
*
a b
c
c=a*b;r1 = a^a’;r2 = b^b’;for(i=0;i<16;i++){ sw_a[i] += r1&1; sw_b[i] += r2&1; r1 = r1 >> 1; r2 = r2 >> 1;}a’ = a;b’ = b;
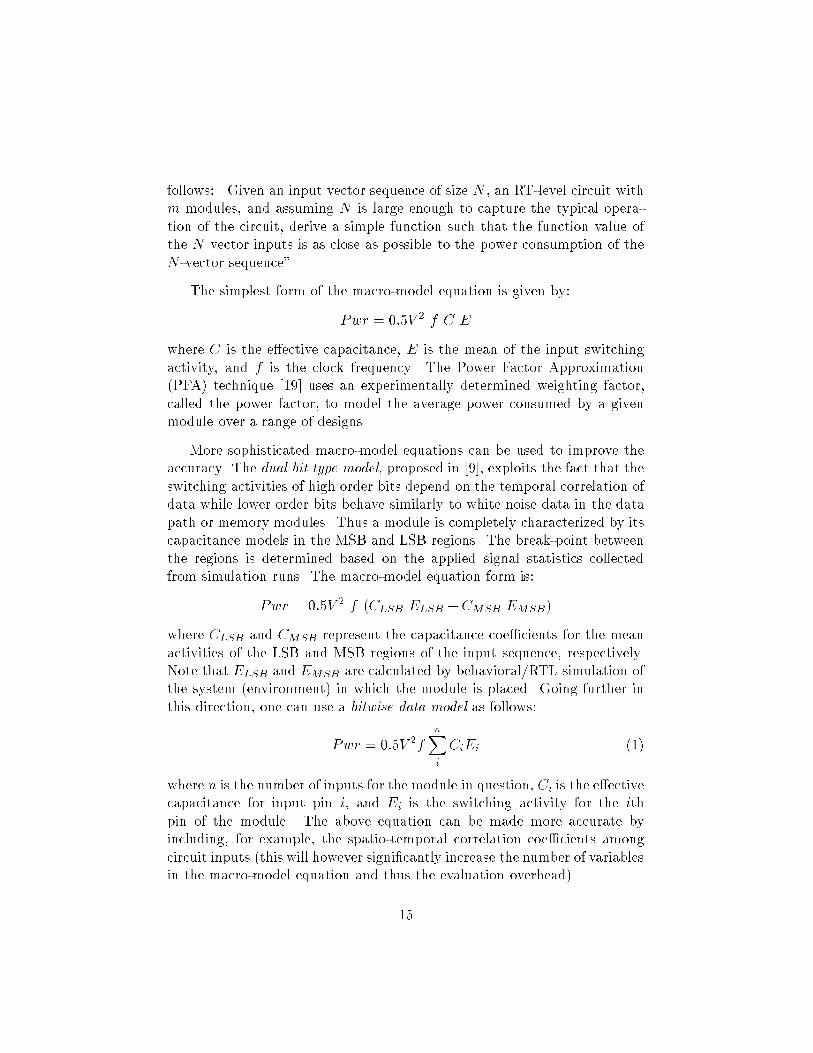
Figure �� Overhead of macro�modeling
There are two problems with the census macro�modeling�
� Input data statistics must be collected for every simulation cycle� Thestatistic gathering overhead is however very large and hence slowsdown the behavioral simulation� Consider a simple example� For a��bit multiplier� the behavioral simulation needs only one instruction�while the statistic gathering requires tens of cycles� See Figure ����
Thus the macro�modeling can slow down the simulation signi�cantly�This shows that census macro�modeling is very costly� especially whenthe vector sequence is very long tens or hundreds of thousands ofvectors��
� Power macro�models are developed by using a training set of inputvectors� The training set satis�es certain assumptions such as beingpseudo�random data� speech data� etc� Hence the macro�model isbiased� meaning that it produces very good results for the class of data
�The overhead changes from one macro�model equation to another and from one sim�
ulator implementation to another�
�

which behaves similarly to the training set� otherwise� it produces poorresults�
Two macro�modeling schemes are proposed in ����
� Sampler macromodeling collects and analyzes the input vectors formodules only for a relative small number of cycles cf� Figure � b���In this manner� the overhead of collecting input statistics at every cyclewhich is required by census macro�modeling is substantially reduced�
�� Adaptive macromodeling not only interacts with behavioral simulator�but also involves a gate�level simulator on a small number of cycles toimprove the estimation accuracy cf� Figure � c��� In this manner� the�bias� of the static macro�models which is due to the choice of thetraining set� is reduced or even eliminated�
To solve the e�ciency problem of census macro�modeling� the authorsof ��� have developed a sampler macro�modeling using statistical randomsampling methods� To improve the accuracy or make the power evaluationmore sensitive to the population variation� they have developed an adaptivepower macro�modeling using a double sampling regression estimator� Bothtechniques use statistical estimation methods� The sampler macro�modelinguses a simple random sampling technique to reduce the number of cyclesduring which data statistics is collected without loss of much accuracy whileadaptive macro�modeling relies on regression analysis combined with gate�level simulation on a minimum number of cycles to �correct� the staticmacro�model estimate and hence can be thought of as a self�adjusting macro�model� The designer can select either of these techniques to make accuracyversus speed trade�o��
Evaluating the macro�model equation at each cycle during the simu�lation is actually a census survey� To reduce the run time overhead� onecan use simple random sampling to select a sample and only calculate themacro�model equation for the vector pairs in the sample� The sample sizeis determined before simulation� The sampler macro�modeling randomly se�lects n cycles and marks those cycles� When the behavioral simulator reachesthe marked cycle� the macro�modeling invokes the behavioral simulator forthe current input vectors and previous input vectors for each module� Theinput statistics is only collected in these marked cycles�
�
BehavioralSimulator
010111CensusMacroModelingenviroment
input vectorsinput vectorsfor eachmodule
powerestimate
(a) Census Macro Modeling
010111
enviromentinput vectors
BehavioralSimulator
requires inputvectors
input vectorsfor eachmodule
SamplerMacroModeling
confidence leveland interval
powerestimate
(b) Sampler Macro Modeling
010111
enviromentinput vectors
BehavioralSimulator
requires inputvectors
input vectorsfor eachmodule
AdaptiveMacroModeling
powerestimate
confidence leveland interval
power
vectors
Gate-levelPowerSimulator
(c) Adaptive Macro Modeling
Figure �� Power macro�modeling�
The con�dence interval of the sample mean can be also derived� However�to calculate the con�dence interval� more than one sample is needed� andthe sample mean should be close to the normal distribution� From theexperiments� the sample mean will approach normal distribution when thesample size is greater than ��� Instead of selecting only one sample of largesize� several samples of size �� or larger� are selected before the simulation�Then the average value of sample means is the estimate of population mean�
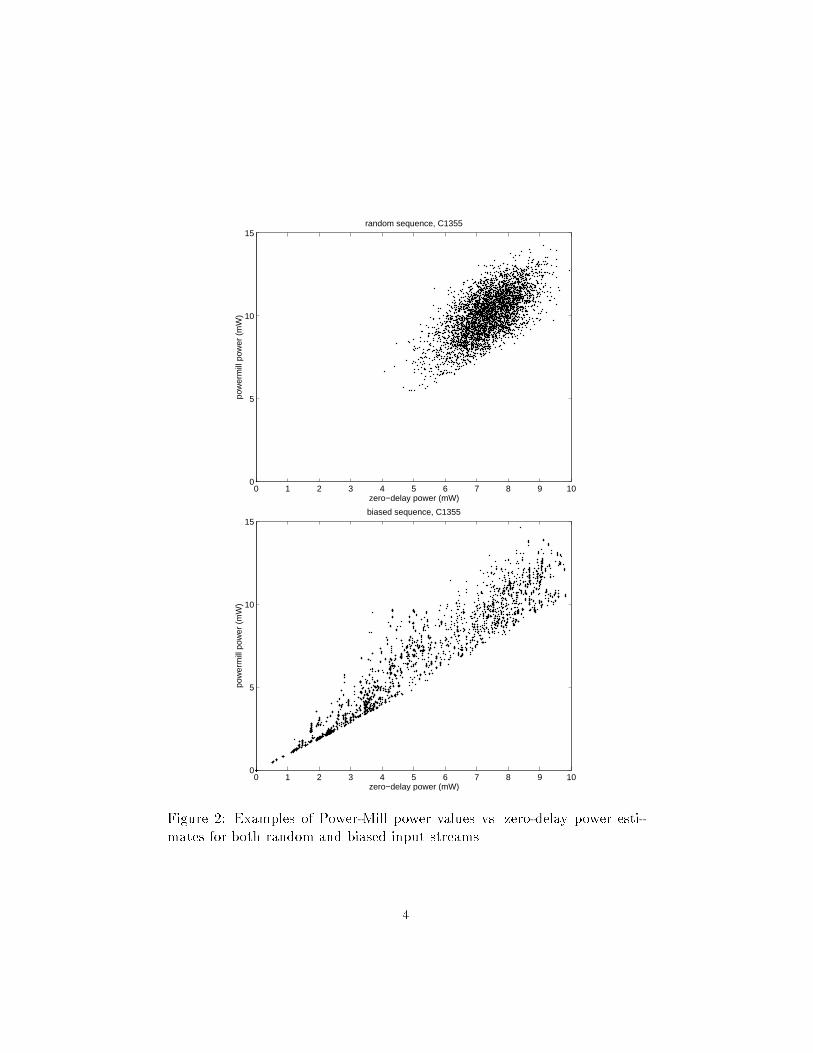
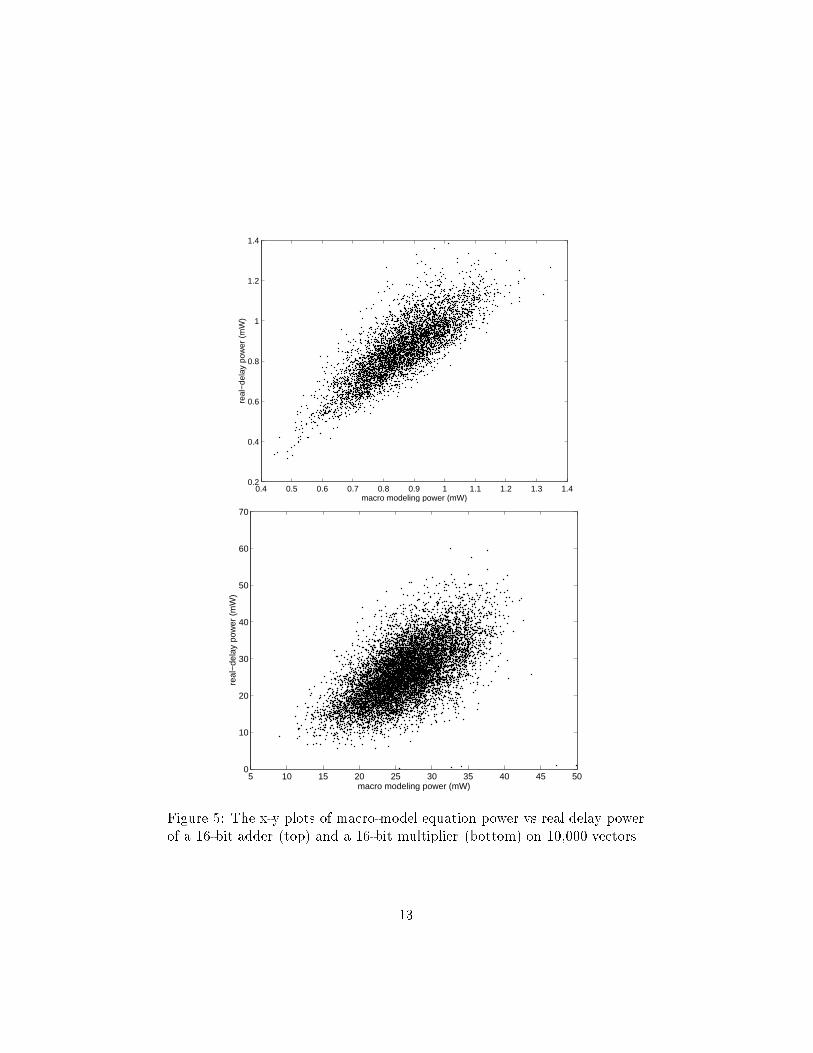
One way to reduce the gap between the power macro�model equationand the gate�level power estimation is to use a regression estimator� Figure shows plots of the the gate level power values that is� the y values� versusthe macro�model equation estimates that is� the x values� for a ��bit adderand a ��bit multiplier for a macro�model equation with �� n parameterswhere n is the number of inputs to the module�� It can be seen that themacro�model equation is a good predictor for gate�level power value usinga linear regression line��
In general� the regression estimator applies to situations where the scatter�plot of y versus x reveals an approximately linear relation of the form�
y � �� �x�
It can be shown that an estimator of the population mean is�
Y lr � y � b X � x�
where X is the population mean of characteristics x� x and y are the subpop�ulation means for characteristics x and y of the sampled data� respectivelywhile b is obtained by using the method of least�square�error on the sam�pled data� It is straight�forward to derive the estimator variance and thusthe con�dence interval and the stopping criterion for sampling� See ��� fordetails��
The regression estimator can achieve very high e�ciency if the correla�tion between the gate�level and the macro�modeling power estimates is high�The lower the correlation between the gate�level and the static macro�modelpower estimates� the slower the convergence rate of the regression sampler�This also points out that the static macro�model needs to be designed andtrained with great caution� In addition� note that a non�linear regressionmodel can provide better results for certain types of circuits for example�multipliers��
�
0.4 0.5 0.6 0.7 0.8 0.9 1 1.1 1.2 1.3 1.40.2
0.4
0.6
0.8
1
1.2
1.4
macro modeling power (mW)
real
−de
lay
pow
er (
mW
)
5 10 15 20 25 30 35 40 45 500
10
20
30
40
50
60
70
macro modeling power (mW)
real
−de
lay
pow
er (
mW
)
Figure � The x�y plots of macro�model equation power vs real delay powerof a ��bit adder top� and a ��bit multiplier bottom� on ����� vectors�
�

In contrast to static macro�models� adaptive macro�models can providethe designers with information i�e� the con�dence level� about the accuracyof predicted value for a given input sequence which is desirable� Adaptivemacro�models also guarantee to eliminate the estimator bias given enoughgate�level simulations� hence� they tend to be more accurate�
A double�sampling regression estimator can be built on top of samplermacro�modeling see ��� for details�� In the double�sampling regression es�timation scheme� n� cycles are selected and marked as �x and n cycles ran�domly selected from the n� cycles and marked as �y � Every time the co�simulator encounters cycles marked �x � the macro�modeling power is evalu�ated� On the other hand� every time the co�simulation enters cycles marked�y then the vector pairs are recorded for later gate�level power simulation�After the behavioral simulation is completed� the gate�level simulation isperformed on the set of recorded vector pairs� Then� the regression estima�tion is performed� Similar to sampler macro�modeling� the con�dence leveland interval can be derived� For the single�stage regression estimator� themacro�modeling power estimates of all N cycles need to be evaluated� whichis not e�cient�
The proposed techniques have been implemented in C and tested onstandard high�level benchmarks consisting of both data�path and control in�tensive circuits e�g�� di�erential equation solver� DSP �lters� discrete cosinetransform� robot arm controller�� Experimental results show that samplermacro�modeling results in an average e�ciency improvement of �X overthe census macro�modeling with and average error of �� Furthermore�whereas the census macro�modeling incurs large error an average of ���for the benchmark circuits� compared to gate level simulation� the adaptivemacro�modeling exhibits an average error of only �����
� Power Macro�model Design
Most RT�level power estimation techniques use capacitance models for cir�cuit modules and activity pro�les for data or control signals ��� �� ��� Suchtechniques� which are commonly known as power macromodeling� consistof generating circuit capacitance models for some assumed data statisticsor properties� The statistics of input data is gathered during behavioralsimulation of the circuit� Power macro�modeling problem is thus de�ned as
�
follows� �Given an input vector sequence of size N � an RT�level circuit withm modules� and assuming N is large enough to capture the typical opera�tion of the circuit� derive a simple function such that the function value ofthe N vector inputs is as close as possible to the power consumption of theN �vector sequence��
The simplest form of the macro�model equation is given by�
Pwr � ��V � f C E
where C is the e�ective capacitance� E is the mean of the input switchingactivity� and f is the clock frequency� The Power Factor Approximation PFA� technique ��� uses an experimentally determined weighting factor�called the power factor� to model the average power consumed by a givenmodule over a range of designs�
More sophisticated macro�model equations can be used to improve theaccuracy� The dual bit type model� proposed in ���� exploits the fact that theswitching activities of high order bits depend on the temporal correlation ofdata while lower order bits behave similarly to white noise data in the datapath or memory modules� Thus a module is completely characterized by itscapacitance models in the MSB and LSB regions� The break�point betweenthe regions is determined based on the applied signal statistics collectedfrom simulation runs� The macro�model equation form is�
Pwr � ��V � f CLSB ELSB � CMSB EMSB�
where CLSB and CMSB represent the capacitance coe�cients for the meanactivities of the LSB and MSB regions of the input sequence� respectively�Note that ELSB and EMSB are calculated by behavioral�RTL simulation ofthe system environment� in which the module is placed� Going further inthis direction� one can use a bitwise data model as follows�
Pwr � ��V �f
nX
i
CiEi �
where n is the number of inputs for the module in question� Ci is the e�ectivecapacitance for input pin i� and Ei is the switching activity for the ithpin of the module� The above equation can be made more accurate byincluding� for example� the spatio�temporal correlation coe�cients amongcircuit inputs this will however signi�cantly increase the number of variablesin the macro�model equation and thus the evaluation overhead��
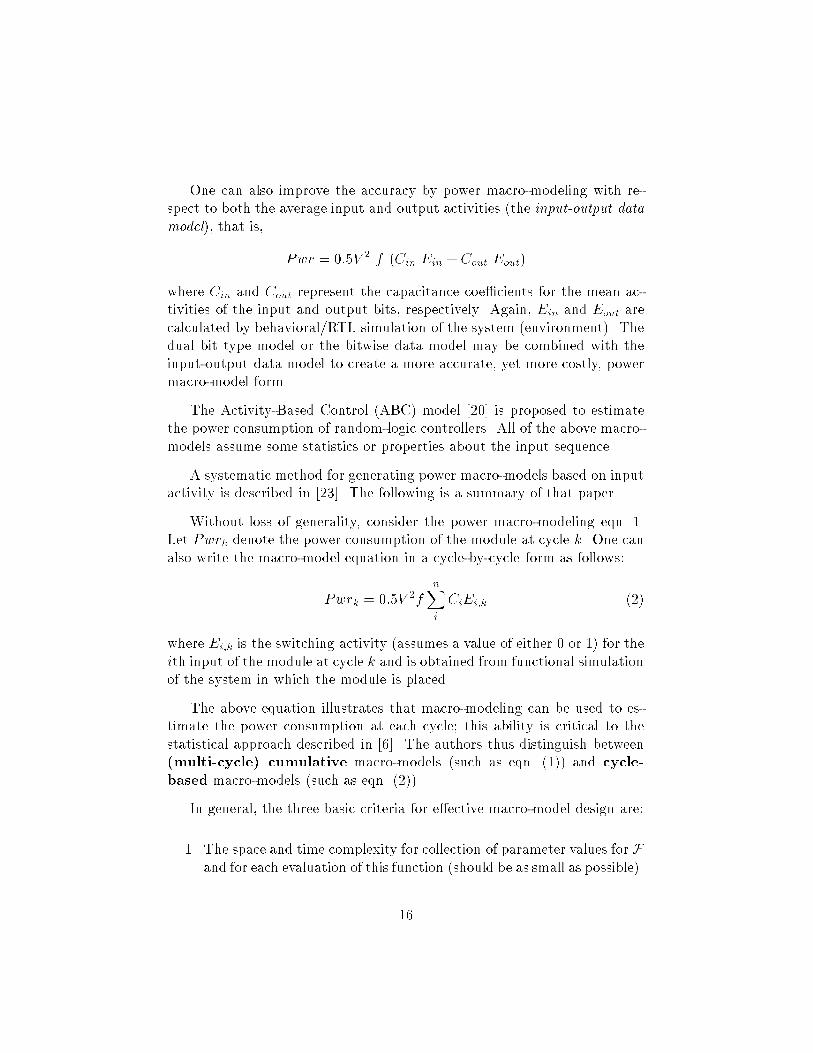
One can also improve the accuracy by power macro�modeling with re�spect to both the average input and output activities the inputoutput datamodel�� that is�
Pwr � ��V � f Cin Ein � Cout Eout�
where Cin and Cout represent the capacitance coe�cients for the mean ac�tivities of the input and output bits� respectively� Again� Ein and Eout arecalculated by behavioral�RTL simulation of the system environment�� Thedual bit type model or the bitwise data model may be combined with theinput�output data model to create a more accurate� yet more costly� powermacro�model form�
The Activity�Based Control ABC� model ���� is proposed to estimatethe power consumption of random�logic controllers� All of the above macro�models assume some statistics or properties about the input sequence�
A systematic method for generating power macro�models based on inputactivity is described in ����� The following is a summary of that paper�
Without loss of generality� consider the power macro�modeling eqn� �Let Pwrk denote the power consumption of the module at cycle k� One canalso write the macro�model equation in a cycle�by�cycle form as follows�
Pwrk � ��V �f
nX
i
CiEi�k ��
where Ei�k is the switching activity assumes a value of either � or � for theith input of the module at cycle k and is obtained from functional simulationof the system in which the module is placed�
The above equation illustrates that macro�modeling can be used to es�timate the power consumption at each cycle� this ability is critical to thestatistical approach described in ���� The authors thus distinguish between�multi�cycle� cumulative macro�models such as eqn� �� and cycle�
based macro�models such as eqn� ����
In general� the three basic criteria for e�ective macro�model design are�
� The space and time complexity for collection of parameter values for Fand for each evaluation of this function should be as small as possible��
�

�� The accuracy of the macro�model should be as high as possible��
�� The error sensitivity of the macro�model to variations in populationbehavior should not be too sensitive��
During the macro�model design phase� some typical input vector se�quence� called the training set� is used� Next� circuit level power simulationof the typical input vector sequence is performed and curve �tting is appliedto derive the coe�cients of the macro�model� The macro�model can be veryaccurate on the original training set� However� the error may become verylarge when the input sequence statistically deviates from the original train�ing set� For example� a macro�model trained by a pseudo�random inputsequence will not produce accurate results for a real application data thatexhibits high correlations on the higher order bits� One can imagine alle�viating this problem by creating application speci�c data�speci�c� macro�models for each module in the RTL library� This leads to a �proliferation�of macro�models associated with a module and the need to automaticallydetermine what macro�model to use�
The authors of ���� present two approaches for macro�model generation�In one approach� detailed information about module core� structure andfunctionality is used to derive a specialized closed form capacitance equa�tion with a relatively small number of variables� This approach leads tomacro�model equations with high accuracy and low evaluation cost� How�ever� it requires detailed knowledge of the module structure and functional�ity and cannot be fully automated� In the second approach� one starts witha general�purpose macro�model equation with a large number of variables for example� all pairwise spatio�temporal correlation coe�cients among themodule inputs� and then use a carefully selected training sequence and astatistical test to eliminate as many variables as possible without incurringlarge errors� This technique leads to less accurate macro�models with higherevaluation costs� but the advantage is that it can be fully automated� Theauthors of ���� describe an automatic procedure for macro�model genera�tion based on statistical sampling for the training set design and regressionanalysis combined with appropriate statistical tests for macro�model vari�able selection and coe�cient calculation� The statistical framework enablesthem to predict both the power value and the con�dence level for the pre�dicted power value�
The authors of ���� report a specialized macro�model for various archi�
�

tectures parallel� Wallace tree� etc�� of a ��bit multiplier which uses �variables� The estimation error of this macro�model equation compared tocircuit level simulation result� is � on a cycle�by�cycle basis and �� onan average power basis over a wide range of input streams not restricted tothe training set itself�� This result should be compared to those obtained forthree automatically generated macro�models of the same multipliers whichuse �� � and �� parameters� respectively� The simplest model results in ����� error on a cycle�by�cycle basis and ���� error on an average powerbasis� The second model results in ����� error on a cycle�by�cycle basisand ��� error on an average power basis� The last macro�model results inthe same error values as the specialized macro�model� Obviously� completefunctional� structural� or layout information about the IP� cores may notbe available and even when they are known� one may not be able to auto�matically come up with a concise and accurate macro�model similar to theone generated for the multiplier�� and therefore� one must use partitioning ofthe core using behavioral hints� or algorithmic partitioning techniques thatidentify the combinational kernel from the other parts of the design� followedby invocation of specialized or general�purpose macro�model equations oneach part�
� High Level Power Estimation
Most of the high level power prediction tools use pro�ling and simulationto capture data activity in the circuit� Important statistics include numberof operations of a given type� number of bus� register and memory accesses�and number of I�O operations executed within a given period� Instructionlevel simulation or behavioral simulators are easily adapted to produce thisinformation� Statistical techniques described previously are used to improvethe e�ciency of these simulators�
In addition to data activity� power dissipation is dependent on the phys�ical capacitances that are being switched from one voltage level to another�Estimating this capacitance at high level of abstraction is di�cult and im�precise because it requires estimation of load values in circuits whose RTLstructure are not determined yet�
Two approaches are possible at this high level of design abstraction�
�
� Develop analytic models for estimating the switched capacitance as afunction of the circuit complexity and technology�library parameters�
�� Synthesize the circuit and then estimate the power dissipation of thecircuit using either RTL or gate�level estimation techniques describedpreviously�
In the �rst approach� the key issue is estimation of the circuit complex�ity� Some circuit parameters that relate to this complexity include� but arenot limited to� number and type of arithmetic and�or Boolean operationsin the behavioral description� number of states and�or state transitions ina controller description� number of cubes literals� in a minimum sum�of�products factored�form� expression of a Boolean function� and amount ofdecrease in entropy from circuit inputs to circuit outputs� Works reportedin ���� and ��� are steps in this direction� More accurate estimates basedon probabilistic and�or information theoretic models are possible� One cansubsequently use regression analysis and�or regression sampling techniquesto correct the analytical model estimates�
The second approach tends to be more accurate� However� it requires thedevelopment of a quick synthesis capability that mimics a full synthesisprogram� yet it is much more e�cient in terms of its runtime� For a behav�iorally described circuit� say in Verilog� the �basic� synthesis tasks includegeneration of a control and data !ow graph CDFG�� operation scheduling�module and register type selection� allocation and binding� and intercon�nect synthesis� Quick versions of the four basic optimization steps can bedeveloped in a straight�forward manner� For example� one can use HDLparsing and compiler�type code optimization to generate the CDFG� a sim�ple list scheduling to create the operation schedule� a greedy clique coveringalgorithm to solve the module�register type selection� allocation and bind�ing problems� and a simple multiplexor or bus�based interconnect scheme toconnect the RTL components� Chances are good that the quick synthesisoption will produces results that are reasonably close to the full synthesisprogram since � in the absence of tight resource� timing� or power constraints� most of the heuristic techniques used during high level synthesis producesimilar results� Unfortunately� this observation does not hold when the user�speci�ed constraints are tight� that is� a fast synthesis option in this casemay produce results that are substantially di�erent from those generated bythe full synthesis program� Thus� the quality of estimates generated basedon the quick synthesis result may become poor� Detailed consideration of
�

these constraints however� can considerably reduce the supposed e�ciency ofthe quick synthesis option� This is a di�cult situation that requires furtherstudy and experimentation�
Other important decisions at the behavioral level are choice of hardwarepartitioning� type of I�O DMA� port�mapped�� and pipeline design none�functional� structural�� synchronization scheme global clock� local hand�shaking�� and possible use of gated�clocks and multiple�supply voltage levelsfor low power designs� These decisions tend to have a very large impact onthe actual power estimates and must therefore be accurately captured by thequick synthesis option� Fortunately� user or environment� often provideshints as to which of these alternatives are selected�
Now assume that the basic architecture of the design is determined andthe mapping to RTL description has been completed� At this time� the fol�lowing classes of components are used� memory elements� data path mod�ules� controllers� and random or glue� logic blocks�
Pre�characterizing i�e�� macro�modeling� the operational modules suchas adders� multipliers� and IP cores� and memory elements memory coreand register �le� is possible� Techniques described previously can be usedhere to model the power dissipation that is� switched capacitance� of thesecomponents�
Obviously� one cannot use macro�modeling for controllers or general logic such as random logic� glue logic� address or data encoder�decoder� circuits�It is however not too di�cult to develop a quick logic synthesis option sincethe overall circuit architecture� clock frequency� supply voltage level� com�binational logic boundaries� etc� are �xed at the logic level� One such ap�proach will start with a general description of a circuit Boolean network forcombinational logic� State Transition Graph for �nite state machines� anda combination of combinational and FSM kernels in the form of interactingFSMs for more general circuits� and perform a fast minimal�length encod�ing followed by fast algebraic extraction and mapping to a gate library� Inparticular� developing a quick synthesis option for structured design stylesappears to be easy and is expected to show higher correlation with the fullsynthesis program�
Interconnect however complicates the problem as it plays an increasinglyimportant role in determining the capacitive loading of gates while its es�timation is a very di�cult task even after technology mapping due to lack
��
of detailed place and route information� Approximate estimates can be ob�tained by using information derived from a companion placement solution��� or by using stochastic�procedural interconnect models ����
� Acknowledgment
This article could have not been written without the help of my students atUSC in particular� C�S� Ding� C�T� Hsieh� D� Marculescu� R� Marculescu�and Q� Wu� whose research works are re!ected here� The research wassupported in part by DARPA under contract no� F������C��� and anNSF NYI award�
References
�� R� Burch� F� N� Najm� P� Yang� and T� Trick� �A Monte Carlo approachfor power estimation�� IEEE Transactions on VLSI Systems� ������� March ����
��� G� V� Cormack and R� N� Horspool� �Data compression using dynamicMarkov modeling�� Computer Journal� �� ������� June ����
��� C� Deng� �Power analysis for CMOS�BiCMOS circuits�� Proceedings of
���� International Workshop on Low Power Design� April ���� pages����
��� C�S� Ding� C�T� Hsieh� Q� Wu and M� Pedram� �Strati�ed randomsampling for power estimation�� Proc� Int l Conf� on Computer Aided
Design� November ���� pages ������
�� A� A� Ghosh� S� Devadas� K� Keutzer� and J� White� �Estimation of av�erage switching activity in combinational and sequential circuits�� Pro
ceedings of the ��th Design Automation Conference� June ���� pages������
��� C�T� Hsieh� C�S� Ding� Q� Wu and M� Pedram� �Statistical sam�pling and regression estimation in power macro�modeling�� Proc� Int l
Conf� on Computer Aided Design� November ���� pages ������
�
��� C� M� Huizer� �Power dissipation analysis of CMOS VLSI circuits bymeans of switch�level simulation�� IEEE European Solid State Circuits
Conf�� ���� pages �����
��� S� Iman and M� Pedram� �POSE� Power optimization and synthesisenvironment�� Proc� ��rd Design Automation Conf�� June ���� pages�����
��� P� Landman and J� Rabaey� �Power estimation for high�level synthe�sis�� Proceedings of IEEE European Design Automation Conference�February ���� pages �������
��� D� Liu and C� Svensoon� �Power consumption estimation in CMOSVLSI chips�� IEEE Journal of Solid State Circuits� �� ����������� June����
�� D� Marculescu� R� Marculescu and M� Pedram� �Stochastic sequen�tial machine synthesis targeting constrained sequence generation��Proc� ��rd Design Automation Conf�� June ���� pages �������
��� D� Marculescu� R� Marculescu and M� Pedram� �Information theoreticmeasures for power analysis�� IEEE Trans� on ComputerAided Design�
��������� June ����
��� R� Marculescu� D� Marculescu and M� Pedram� �E�cient power estima�tion for highly correlated input streams�� Proc� ��nd Design Automa
tion Conf�� June ��� pages ��������
��� R� Marculescu� D� Marculescu and M� Pedram� �Adaptive models forinput data compaction for power simulators�� To appear in Proceedings
of the �nd AsiaPacic Design Automation Conference� January ����
�� F� N� Najm� �Transition density� A new measure of activity in digitalcircuits�� IEEE Transactions on ComputerAided Design of Integrated
Circuits and Systems� � ���������� February ����
��� M� Pedram� �Power minimization in IC design� principles and applica�tions�� ACM Trans� on Design Automation of Electronic Systems� ������ January ����
��� M� Pedram and N� Bhat� �Layout driven technology mapping��Proc� ��th Design Automation Conf�� June ��� pages �����
��

��� M� Pedram� B� T� Preas� �Accurate prediction of physical design char�acteristics of random logic�� Proc� Int l Conf� Computer Design� VLSI
in Computers and Processors� October ���� pages ������
��� S� Powell and P� Chau� �Estimating power dissipation of VLSI signalprocessing chips� The PFA techniques�� Proceedings of IEEE Workshop
on VLSI Signal Processing IV� Vol� IV� ���� pages ������
���� J� Rabaey P� Landman� �Activity�sensitive architectural power analysisfor the control path�� Proceedings of International Symposium on Low
Power Desing� April ��� pages ������
��� C�Y� Tsui� M� Pedram� and A� M� Despain� �E�cient estimation ofdynamic power dissipation under a real delay model�� Proceedings of the
IEEE International Conference on Computer Aided Design� November���� pages ��������
���� Q� Wu and M� Pedram� �Statistical design of macro�models for RT�level power evaluation�� Technical Report CENG ������ University ofSouthern California� October ����
���� Q� Wu� C�S� Ding� C�T� Hsieh� and M� Pedram� �Statistical design ofmacro�models for RT�level power evaluation�� To appear in Proceedings
of the �nd AsiaPacic Design Automation Conference� January ����
��
Top Related
Copyright © 2022 FDOKUMEN

