


Bahasa
Halaman
Hukum


1
Using eco-design tools: an overview of experts’ practices
Flore Vallet1, Benoît Eynard
1, Dominique Millet
2, Stéphanie Glatard Mahut
1,
Benjamin Tyl3, Gwenola Bertoluci
4
1Université de Technologie de Compiègne, France
2Supmeca Toulon, France
3ESTIA Bidart, France
4AgroParisTech Massy, France
*Corresponding author: [email protected]
Université de Technologie de Compiègne
Department of Mechanical Systems Engineering
UMR CNRS 7337 Roberval
BP 60319- F60203 Compiègne France
Tel : +33 3 44 23 52 44, Fax +33 3 44 52 29
Abstract:
The practice of eco-design requires relating traditional design criteria to new environmental criteria.
So far, few studies have investigated the nature and singularities of eco-design. This article provides
some elements of response based upon the redesign of a consumer product (disposable razor). The
study was conducted by three groups of experienced eco-designers using existing eco-design tools
(SIMAPRO, ECOFAIRE, ECODESIGN PILOT). A protocol analysis with a three-level coding of
transactions was carried out for this purpose. Two main findings are reported: (1) environmental
assessment, solution finding and strategy definition are the activities which differentiate eco-design
from design; (2) environmental initial assessment and strategy definition are more heavily influenced
by eco-designers’ expertise than support from tools.
Keywords: ecodesign, protocol analysis, design team, product design.
Understanding the design process has been the subject of multiple works, whose focuses include the
evaluation of ideas produced by designers during creative processes (Cross, 1997; Dorst, 2001;
Goldschmidt & Sever, 2009; Yong, Sang, Jung & Ji, 2009) or the progression of design phases
(Valkenburg & Dorst, 1998; Kruger, 2006; Liikanen, 2009). In order to investigate typical features of
design activities, researchers have turned towards analyzing either individual or group design meetings.
Collective stakes in design are described according to various viewpoints: the influence of cognitive
conflicts on innovation (Badke-Schaub, Golschschmidt & Meijer, 2007), modelling co-evolution with
several actors (Reynen, Dorst & Smulders, 2009), communication in design teams (Mulet, Lopez-
Mesa, Gonzales & Camelo, 2007).
Eco-design as defined in ISO 14062 (ISO/TR 14062, 2002) is a design approach aiming to reduce the
environmental impacts of products and services throughout the whole lifecycle, while assuring similar
or improved services to the end customer. The idea is still to meet the consumer’s requirements, but in
a more sustainable way (Crul & Diehl, 2009). Designers and design teams are some of the prominent
actors playing a central role in the integration of the environment in industry (Akermark, 2003;
Lindhal, 2006, Fuad-Luke, 2004). Several conditions must be united if designers are to succeed in this
integration, given their lack of knowledge of a complex and multifaceted environmental dimension.
Our attention is focused on eco-design methods and tools seen as “vectors of learning” in industry, i.e.
allowing designers to improve their individual and collective expertise in eco-design (Millet, 2003).
Even though a large number of methods and tools have been created in academia and industry in the
past few years, evidence of actual use of existing tools is scarce. There seems to be a real need for
stringent analysis to highlight how design activities are supported by eco-design tools (Baumann,
Boons & Bragd, 2002; Lindhal, 2006).
Fargnoli and Kimura compare eight eco-design tools against usability criteria, but do not actually
observe the eco-design activity (Fargnoli & Kimura, 2006). Creative outcomes of the idea generation
phase are more likely to be examined in eco-innovation. In (Jones et al., 2001) the influence of input
data and choice of method on the quality of outcomes (environmental relevance and originality) is
studied, whereas Collado and Ostad-Ahmad-Ghorabi deal with the influence of the level of detail and
specificity of environmental information on outcomes (Collado & Ostad-Ahmad-Ghorabi, 2010). The
brought to you by COREView metadata, citation and similar papers at core.ac.uk
provided by Archive Ouverte en Sciences de l'Information et de la Communication

2
issue of environmental information with regard to how it is managed by professional experts in eco-
design, redesign or innovation is tackled by (Bakker, 1995). All the above illustrate the necessity to
better understand the articulation of design phases and the support of eco-design tools in teams.
This article thus aims to gain understanding in the eco-design approach practiced in design teams. We
intend to highlight the influence of eco-design tools in resolving problems. How are eco-design tools
handled by designers to match the design context? How are shared eco-design vision and strategies
constructed in design teams? We provide elements of response through the analysis of the team work of
23 experienced eco-designers working on a same redesign brief and supported by three distinct tools.
The following research question is considered: “What is the nature and singularity of eco-design
compared to design?” After defining the activity, methods and tools from a theoretical standpoint (section 1) we pursue our
study by a protocol analysis of three design sessions (sections 2 and 3). In section 4 where results are
presented, a detailed view of two distinctive phases is provided. The different viewpoints on the
problems induced by the tools are examined. Results are discussed in section 5. The conclusions of
this work (section 6) fit into a more general framework, whose aim is to characterize the dynamics of
learning in eco-design according to the initial expertise (or not) of designers.
1 Characteristics of the eco-design activity Firstly, we intend to review the typical steps of an eco-design approach, and secondly to summarize the
contribution of eco-design methods and tools to the design of environmentally-sound products. We
close this chapter by stating hypotheses regarding the specific nature of eco-design activities compared
to design activities.
1.1 Steps of the eco-design activity
Le Pochat et al. (2007) suggest an adaptation of the eco-design process mentioned in (ISO/TR 14062,
2002). Two core activities are emphasized within the conceptual and detailed design phases:
environmental assessment and environmental improvement. Environmental assessment aims to
evaluate the environmental impacts of an existing product or service, whilst environmental
improvement is focused on the search for environmentally friendly solutions. Eco-design tools
supporting those two activities are available, complemented by traditional decision making and
communication tools. Brezet & Van Hemel state that, with the integration of environment in design,
new activities have appeared in the traditional product development process (Brezet & Van Hemel,
1997, p. 49). These new activities deal with: the search for environmental information, initial
environmental assessment and environmental strategy. The last two seem to differentiate eco-design
from traditional design according to Collado & Ostad-Ahmad-Ghorabi (2010). In order to help
companies on a practical level to reduce the environmental impacts of their products, a systematic
approach was created (Brezet & Van Hemel, 1997). Current eco-design tools have certainly been
strongly influenced by this early work of systematization. This step-by-step approach embeds seven
steps in its initial version, and nine in the latest manual, entitled ‘D4S’ (Design for Sustainability) (Crul
& Diehl, 2009). Finally three core activities are put forward, namely environmental assessment,
solution finding and strategy. Those are defined more precisely in next sub-sections.
1.1.1 Environmental assessment
Firstly, environmental assessment is necessary to provide a good initial understanding of the
environmental problems caused by the reference product. Secondly, it is meant to evaluate the
redesigned product compared with the reference product. For Millet (2003), the initial step of
assessment aims to highlight where there are bottlenecks in order to identify relevant focus areas.
Following this logic, and since this task has to be processed quantitatively by an environmental expert,
it also has to be supported by an expert tool like Life Cycle Assessment (or LCA). Cruhl & Diehl
express a different position, arguing that the results of this first assessment can be obtained
qualitatively in experts’ focus groups (Crul & Diehl, 2009). This method appears to be efficient, whilst
being far less time consuming than a traditional LCA approach.
However, the environmental quality of products remains closely linked with the notion of service to the
customer. Therefore, the functional fulfillment of an eco-product should not be neglected on account of
reducing environmental impacts. In order to integrate environmental assessment and functional
requirements engineering, Lagerstedt et al. suggest the creation of an ‘eco-functional’ matrix. This
allows the designer to visualize the interrelations between functional criteria (e.g. lifetime, reliability,
3
security) and environmental criteria (e.g. size, number of product/year, use of energy, scarce materials)
(Lagerstedt, Luttropp & Linfors, 2003).
The assessment of environmental impacts is a key step of the eco-design process which may not be
disassociated from the functional requirements of the product. However, the mechanisms of coupling
environmental assessment and functional requirements engineering do not seem to be investigated in
depth in available literature. Environmental assessment provides two sorts of useful information: (1)
which phases of the life cycle have the greatest impact when assessing an existing product; (2)
awareness that no pollution transfer occurred during the environmental improvement phase.
1.1.2 Solution finding
The aim of this activity is to create concepts which can lead to environmental improvements. As it is
similar to principal solutions generation, it relies on the same kind of creativity techniques:
brainstorming, brainwriting or morphological box (Brezet & Van Hemel, 1997). Creative ideas may be
combined in one design thanks to the morphological box. After idea generation, Fussler & James
suggest to start with "harvesting the outstanding ideas" positioned in an Ideas Matrix by the project
team (Fussler & James, 1996, p. 316). The Ideas matrix assesses business value and environmental
improvement. Then the top level ideas are mapped onto a spider-web diagram called 'eco-compass',
and connections between ideas are created to generate one or several concepts. A redesigned concept of
refrigerator may, for example, associate three ideas: (1) an unique plastic material (formed PUR); (2) a
separation between fridge and freezer to increase eco-efficiency and reduce maintenance; (3) easy-to-
disassemble joints to improve end of life (Fargnoli & Kimura, 2007). Developing environmental
solutions can affect multiple aspects of the product including basic product improvement, but also
redesign of the product, creating new functions or even making innovations to the system (Brezet,
1997) The following environmental strategy statements which derive from the initial assessment are
useful to generate those improvement ideas
1.1.3 Environmental strategy
In the traditional design field, a strategy is defined as a “general plan of action” undertaken by a design
team and is composed of a sequence of particular activities (Cross, 2008).The notion of environmental
strategy includes the various routes which can be followed in eco-design (Brezet & Van Hemel, 1997,
p. 69). It is advisable to choose a relevant combination of eco-design strategies depending on the
product, the project and the company situation. Each strategy is developed into a set of guidelines, with
the recent addition of ethical and social aspects (Crul & Diehl, 2009). The seven traditional eco-design
strategies proposed by Brezet & Van Hemel (1997) cover the product lifecycle as follows:
S1: Low impact material
S2 : Reduction of material use
S3 :Optimization of production techniques
S4 :Optimization of distribution system
S5 :Reduction of impact during use
S6 :Optimization of product lifetime
S7 :Optimization of End of Life systems
Although some strategies are likely to tend in the same way offering a potential synergetic effect,
others may be in conflict (Luttropp & Lagerstedt, 2006). As an illustration of a potential conflict, using
recycled materials (as suggested in S1) might significantly decrease the mechanical strength of a part
and thus affect the product life time (S6).
Recent research has addressed strategies focused on users’ behavior, especially towards energy
consuming products. In fact, aiming at eco-efficiency appears to be insufficient if account is taken of
how consumers really (mis)use their products. Significant energy loss due to consumers was reported
by (Sauer, Wiese & Ruttinger, 2002). That is why others have expressed new sets of strategies based on
user’s feedback, persuasion, attractiveness or automatic control (Wever, Van Kuijk & Boks, 2008;
Lilley, 2009; Schmalz & Boks, 2011).
Using an environmental taxonomy of products, it is possible to choose the most appropriate strategy
among several possibilities. Crul and Diehl propose categorizing products into four types thus leading
to focused strategies: active or passive (i.e. energy consuming), mobile or immobile (i.e. with
transportation during the use phase), requiring consumables, with limited life time (Crul & Diehl,
2009). Moreover, the same authors point out that environmental targets and strategies have no
prescriptive or normative aim, but have simply a pragmatic objective of reducing the problem’s
complexity: “Remember this is not a precise process but an approximate way of narrowing down the
focus for action and reducing the complexity of decision-making” (Crul & Diehl, 2009 p.51). This is in
line with the observations made in a traditional design context by Stempfle & Badke-Schaub.

4
Designers appear to work in a ‘quick and dirty’ way in order to manipulate data of an acceptable level
of complexity and make decisions quite rapidly. This accounts for the alternating phases of widening
the problem space (thus increasing the complexity through idea generation) and reducing this space as
soon as possible (by comparing and assessing ideas) (Stemfle & Badke-Schaub, 2002).
The whole range of environmental strategies, which include fostering sustainable behaviours, are
expected to be mastered by eco-design practitioners, and should appear in their approach to eco-design
problems.
1.2 Contribution of methods and tools to the eco-design activity
Before summarizing features of eco-design methods and tools, it is useful to define what is meant by
these terms. The word ‘eco-design tool’ stands for “any systematic means for dealing with
environmental issues during the product development process” (Baumann, Boons & Bragd, 2002).
According to Ritzen, the main point is that eco-design tools are supposed to assist designers in their
daily tasks, being “artifacts that support product developers with certain considerations or tasks,
typically arranged in software or written guidelines” (Ritzen, 2000, p.10). Eco-design needs to be
practiced in multidisciplinary teams in industry. It is an efficient way to ensure that all departments of a
company contribute to the environmental improvement of products from the early stages of the design
process to the market launch (ISO/TR 14062, 2002, p. 7). Cognitive and social aspects of eco-design
activity impose the addition of new requirements for methods and tools, as described in the next
section.
1.2.1 Supporting individual and collective learning
Ritzen introduces the idea that eco-design tools have to support designers in both individual learning
and collaborative work as well as enhance communication between company departments. Tools are
therefore more helpful in highlighting problems than in solving them (Ritzen, 2000). For Akermark,
using a tool gives an opportunity to define a common language, structure and make goals visible to
different actors (Akermark, 2003). Due to the complexity of the eco-design activity, there is a risk of forgetting significant elements
during the process. Systematic use of a tool is one way to limit this risk (Akermark, 2003), and hence to
increase the confidence designers in their work. Lindhal also underlines the importance of designers’
feelings of confidence and satisfaction in achieving work inspired by tools. (Lindhal, 2006). Methods
and tools also play an important role in the preservation of the collective memory and company
knowledge by creating “know-how back-ups”. On an individual level, designers “consciously or
subconsciously” associate new methods with former ones, which are never entirely forgotten or
abandoned (Lindhal, 2006). Although important for the understanding of the support offered by eco-
design tools, those aspects will not be addressed in this article, but should be considered in future
research. Consideration can now be given to how designers’ judgment on the use of eco-design tools is
influenced by their expertise in eco-design.
1.2.2 Influence of expertise
Not all of the various eco-design tools require the same level of environmental expertise. Although it is
essential for carrying out any rigourous quantitative assessment, Life Cycle Assessment remains an
expert tool. Even though LCA has been progressively introduced into large companies, it is still rarely
implemented in small and medium enterprises (SMEs) due to lack of time and the technical and human
means to disseminate the method (Le Pochat, Bertoluci & Froelich, 2007). More generally,
environmental assessment tools are reserved for experts, who are supposed to guarantee the relevance
of both results and interpretations. By contrast, improvement tools such as guidelines or eco-design
manuals are less demanding in terms of environmental expertise, but they present the disadvantage of
being too general (Le Pochat, Bertoluci & Froelich, 2007).Thus, a successful integration of the
environmental dimension relies on the presence of an expert or an environmental group in active
collaboration with design teams and the company’s top management (Millet, 2003). So far, the issue of
choosing eco-design tools in compliance with the users’ level of expertise has been poorly investigated.
One possible explanation for this is that environmental experts who design tools, are unaware of non-
experts’ difficulties (Le Pochat, Bertoluci & Froelich., 2007). Jones (2003) suggests two ideas based on
his observations of practitioners using eco-innovation tools:
less experienced designers tend to follow the given process carefully,

5
more experienced designers do not follow any systematic approach and reason by intuition as
individuals; within a team, they feel a deeper need to rely on a structured process to achieve
better group performance.
Considering those issues, the objective is to validate the ability of experts to environmentally design
and evaluate new concepts. This leads to formulate two hypotheses.
1.3 Hypotheses: main eco-design activities
The importance of three core eco-design activities has been underlined in the literature survey. In the
next sections these will be referred to as 'eco-activities'. As demonstrated in the case of PSS in Sakao,
Paulsson & Mizuyama (2011), our first assumption deals with the expected nature of the eco-design
process when compared to a traditional design process.
H1: "The eco-design process has a similar structure to a traditional design process "
Eco-activities are supported by existing eco-design tools. The second assumption of this paper is that
the use of eco-design tools by practitioners will ‘reveal’ eco-activities. Significant differences are
expected to be observed between eco-activities, either in time spent or in content. Differences with
traditional design activities are expected to be noticeable.
H2: "All activities are not equally important in time spent. Eco-design can be differentiated from
design when the more important activities are considered". The intention is to empirically
investigate H1 and H2 to clarify the nature and potential singularities of eco-design activities thanks to
the following research set-up.
2 Research method We chose to carry out participant observation in an academic context to match our theory driven
research question. The controlled conditions of a lab experiment allow us to focus on the eco-design
activity without the bias of real life constraints. This kind of enquiry is mostly supposed to neutralize
the real-world influence of other business constraints and trade-offs. In order to obtain fine tuned
insights as well as quantitative elements of comparison, a verbal protocol analysis was conducted on
three design meetings (Gero & Mc Neill, 1998). Coding options are explained in sections 2.3 and 2.4.
This is a typical ‘small scale experiment’ as characterized by Cash et al. (2012). It has to be noted that a
design experiment should, in theory, include one control group (Blessing & Chakrabarti, 2009). This
would be a team that is given the same assignment but no tool. This choice was not made at the time
where the research was set up, and this limitation is reflected on in 4.3.
2.1 Choice of eco-design tools
The experiment was originally implemented with four eco-design tools: the guides ECOFAIRE,
ECODESIGN PILOT, INFORMATION INSPIRATION and the LCA tool SIMAPRO. Due to a poor
audio recording, the INFORMATION INSPIRATION transactions could not be taken into
consideration in this article; however the whole set of solutions created by the four groups can be found
in (Vallet, Millet & Eynard, 2009; 2011).
The four tested tools are classified after Knight & Jenkins (Knight & Jenkins, 2009), see Table 1. They
describe three broad categories depending on the lifecycle approach.
1. Guidelines: broad supports of the whole life cycle;
2. Checklists: “providing in-depth, but narrow application at selected stages of the product
development process or lifecycle”;
3. Analytical tools combining a systematic, detailed vision over the whole lifecycle.
The tested tools (see Box 1) were selected in a focus groups of eco-design experts. SIMAPRO, an
expert tool of quantitative Life Cycle Assessment was introduced amongst three eco-design guides,
which are non-expert tools. Despite its different nature, it is nevertheless a reference tool acknowledged
by practitioners, which accounts for its presence in the protocol. Besides, we are interested in observing
experienced eco-designers’ capacity to use an LCA tool in early design phases, when very little data is
available to them.
Table 1: Characterization of selected eco-design tools
Name of tool
/author/Date
published
Category Language Addressed to Objectives
ECOFAIRE
/SEM
Guideline French Engineering
designers,
Introduction to eco-design
Diagnosis/ First
6
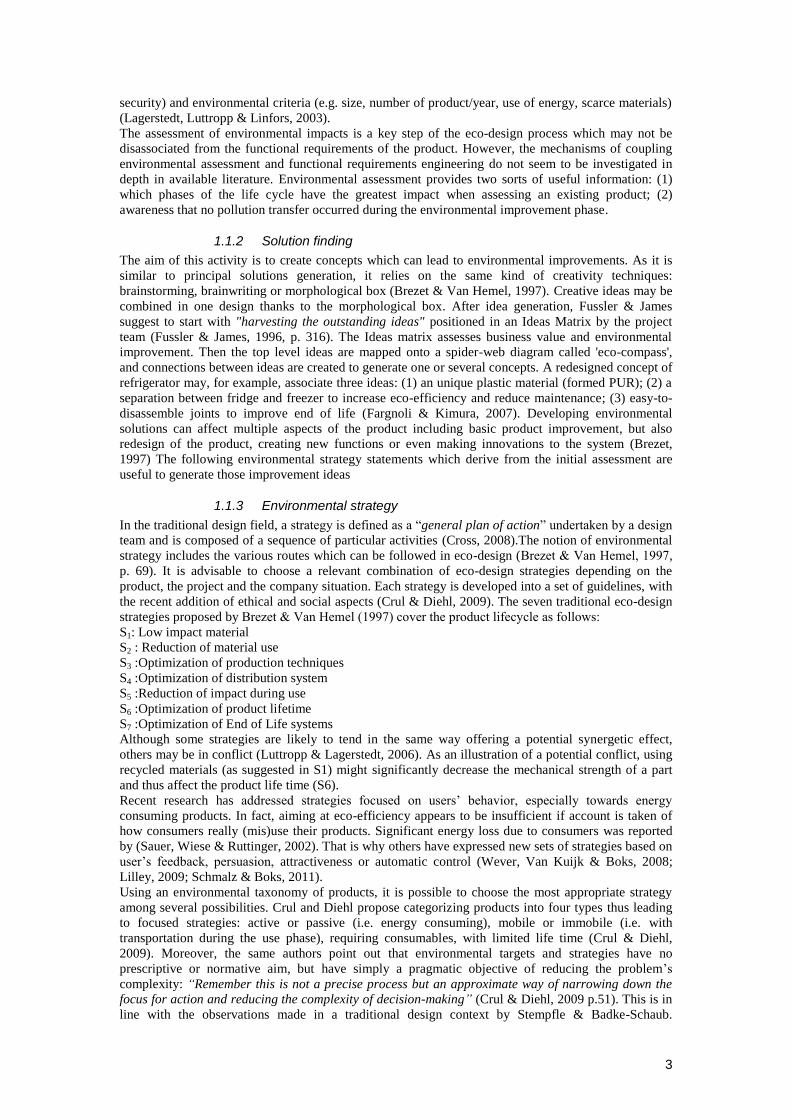
Pays de
Loire/2008
Industrial designers,
Research department,
Marketing …
Teachers, Students.
environmental assessment
Solution finding/Evaluating
solutions
Communication
INFORMATION
INSPIRATION
/Loughborough
University/2005
Guideline English Industrial designers
Introduction to eco-design
Environmental strategies
Examples of eco-products
ECODESIGN
PILOT
/TU Wien/2001
Guideline 10
languages
Designers, Industrial
designers,
Manufacturers,
Environment
managers.
Introduction to eco-design
Environmental strategies
Tracks for environmental
improvement
SimaPro 7.0/
Pré Consultants
Analytic English Environmental
experts
Environmental assessment
2.2 Experimental protocol
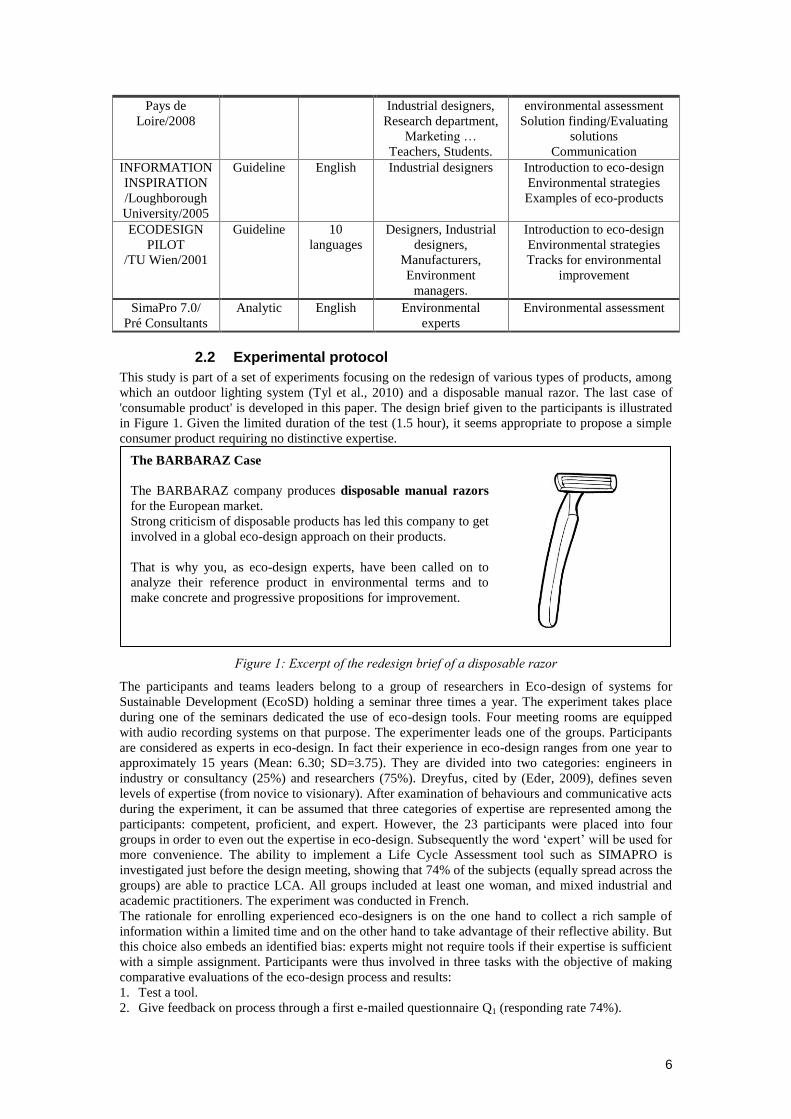
This study is part of a set of experiments focusing on the redesign of various types of products, among
which an outdoor lighting system (Tyl et al., 2010) and a disposable manual razor. The last case of
'consumable product' is developed in this paper. The design brief given to the participants is illustrated
in Figure 1. Given the limited duration of the test (1.5 hour), it seems appropriate to propose a simple
consumer product requiring no distinctive expertise.
Figure 1: Excerpt of the redesign brief of a disposable razor
The participants and teams leaders belong to a group of researchers in Eco-design of systems for
Sustainable Development (EcoSD) holding a seminar three times a year. The experiment takes place
during one of the seminars dedicated the use of eco-design tools. Four meeting rooms are equipped
with audio recording systems on that purpose. The experimenter leads one of the groups. Participants
are considered as experts in eco-design. In fact their experience in eco-design ranges from one year to
approximately 15 years (Mean: 6.30; SD=3.75). They are divided into two categories: engineers in
industry or consultancy (25%) and researchers (75%). Dreyfus, cited by (Eder, 2009), defines seven
levels of expertise (from novice to visionary). After examination of behaviours and communicative acts
during the experiment, it can be assumed that three categories of expertise are represented among the
participants: competent, proficient, and expert. However, the 23 participants were placed into four
groups in order to even out the expertise in eco-design. Subsequently the word ‘expert’ will be used for
more convenience. The ability to implement a Life Cycle Assessment tool such as SIMAPRO is
investigated just before the design meeting, showing that 74% of the subjects (equally spread across the
groups) are able to practice LCA. All groups included at least one woman, and mixed industrial and
academic practitioners. The experiment was conducted in French.
The rationale for enrolling experienced eco-designers is on the one hand to collect a rich sample of
information within a limited time and on the other hand to take advantage of their reflective ability. But
this choice also embeds an identified bias: experts might not require tools if their expertise is sufficient
with a simple assignment. Participants were thus involved in three tasks with the objective of making
comparative evaluations of the eco-design process and results:
1. Test a tool.
2. Give feedback on process through a first e-mailed questionnaire Q1 (responding rate 74%).
The BARBARAZ Case
The BARBARAZ company produces disposable manual razors
for the European market.
Strong criticism of disposable products has led this company to get
involved in a global eco-design approach on their products.
That is why you, as eco-design experts, have been called on to
analyze their reference product in environmental terms and to
make concrete and progressive propositions for improvement.

7
3. Give feedback on their group’s creative outcomes and on other groups’ through a second web
questionnaire Q2 (responding rate 56%).
The experiment is divided into three main steps (Table 2): presentation and carrying out of the design
meeting, followed by feedback questionnaires after a week and 1.5 months, completed by an overall
presentation by the experimenter to the participants three months later. Each participant was contacted
individually to provide reflections on the process and on the generated concepts. In order to
characterize the eco-design process, they were asked to rank tools on a five-point Likert scale regarding
multi-disciplinarity, usability (i.e. easiness to use and learn), compatibility with few input data and time
efficiency, see (Lindhal, 2005). Free comments could be added. Through Q2, subjects had to rank each
generated idea on an identical type of Likert scale against: originality and environmental performance,
see (Jones et al., 2001).
Table 2: Agenda of the experimental protocol
INPUTS DETAIL OF PHASE OUPUTS
Powerpoint presentation of
tools and design brief
Framing
30 min, collective
_
Design Brief (printed format)
Paperboard sheets, felt tip pens,
Personal stationary authorized
Design Meeting (1h30) Completed paperboard sheets,
AND/OR files (ppt, word,
SIMAPRO)
Audio recordings
Collective debriefing (15 min)
Q1 Questionnaire
Sent by e-mail
Feedback of participants on
tools (D+7)
Completed Q1 questionnaire
Q2 Web-questionnaire Feedback of participants on
generated concepts (D+45)
Completed Q2 questionnaire
Powerpoint Presentation
of results (Q1and Q2)
Feedback of researcher on first
observations
(1h) (D+90)
Reactions from participants
Confirmations/Perceptive
offsets
Every session was transcribed according to the simplified notation suggested in (Mc Donnell & Lloyd,
2009, p.7). Each line is associated with an intention of the designer identified by the coder. This
division was refined throughout the coding process. Table 3 below presents a summary of the
observation conditions.
Table 3 : Summary of observation conditions of the three groups
Groups Duration of the observation Number of lines transcribed
SIMAPRO 1h 20 182
ECOFAIRE 1h24 550
ECODESIGN PILOT 1h27 537
Participants Experts : 75% academia / 25% industry
2.3 Coding model
Since the coding model is meant to analyse a collective eco-design session, it should reflect the
collaborative dimension of work as well as the specific features of the activity (namely initial
environmental assessment and strategy). Three models in Table 4 retain our attention. Bakker’s coding
model is partially suitable with regard to eco-design steps; however it has to be completed for it was
used for analyzing individual working sessions (Bakker, 1995). The second model for traditional
design sessions by Stemfle & Badke-Schaub (2002) is inspired by the product development reference
steps of Pahl et al. (2007). Its main interest is that it explains both the ‘Content’ (the process of solving
of the task itself) and the ‘Process’ (the management of the task within the design team).The third
model focuses on the types of interactions between members of a design team (Prudhomme, Pourroy &
Lund, 2007). It is helpful in clarifying the definition of the category ‘Assessment of solutions’. Our
final coding proposition results from a combination of models from (Bakker, 1995) and (Stemfle &
Badke-Schaub, 2002). It is completed with a ‘Tool’ (abbreviated T) category to emphasize moments
where tools are mentioned during group transactions.
8
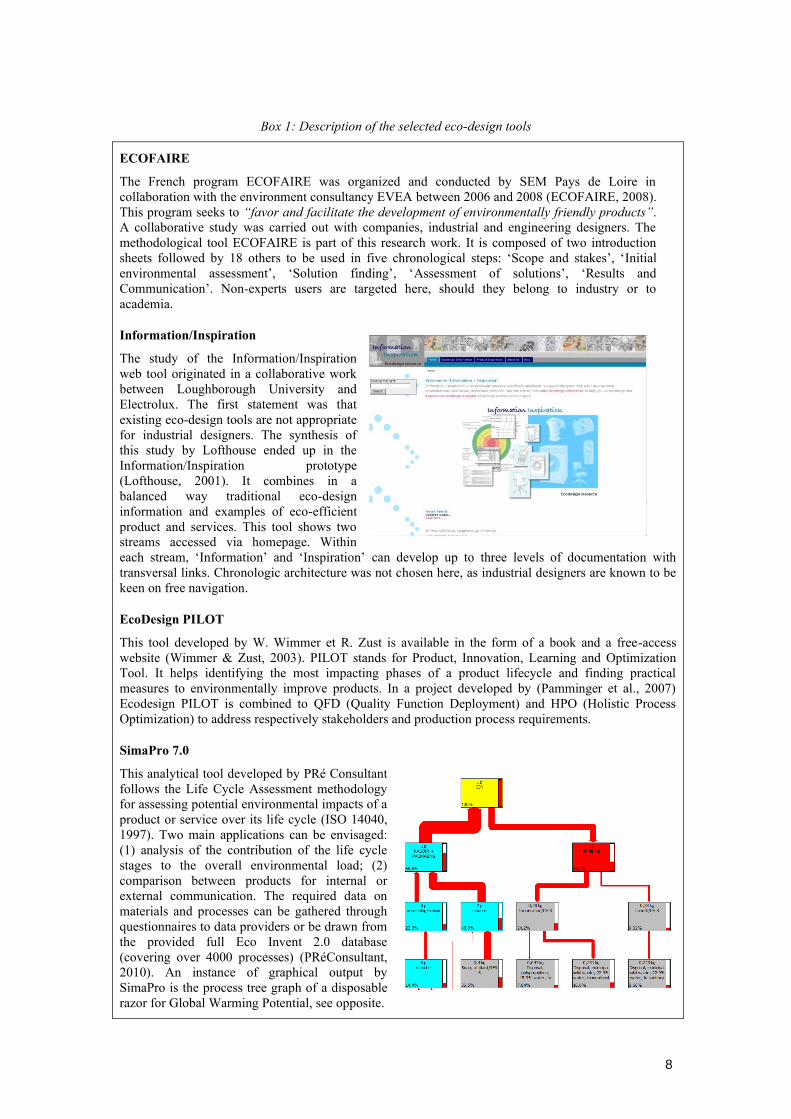
Box 1: Description of the selected eco-design tools
ECOFAIRE
The French program ECOFAIRE was organized and conducted by SEM Pays de Loire in
collaboration with the environment consultancy EVEA between 2006 and 2008 (ECOFAIRE, 2008).
This program seeks to “favor and facilitate the development of environmentally friendly products”.
A collaborative study was carried out with companies, industrial and engineering designers. The
methodological tool ECOFAIRE is part of this research work. It is composed of two introduction
sheets followed by 18 others to be used in five chronological steps: ‘Scope and stakes’, ‘Initial
environmental assessment’, ‘Solution finding’, ‘Assessment of solutions’, ‘Results and
Communication’. Non-experts users are targeted here, should they belong to industry or to
academia.
Information/Inspiration
The study of the Information/Inspiration
web tool originated in a collaborative work
between Loughborough University and
Electrolux. The first statement was that
existing eco-design tools are not appropriate
for industrial designers. The synthesis of
this study by Lofthouse ended up in the
Information/Inspiration prototype
(Lofthouse, 2001). It combines in a
balanced way traditional eco-design
information and examples of eco-efficient
product and services. This tool shows two
streams accessed via homepage. Within
each stream, ‘Information’ and ‘Inspiration’ can develop up to three levels of documentation with
transversal links. Chronologic architecture was not chosen here, as industrial designers are known to be
keen on free navigation.
EcoDesign PILOT
This tool developed by W. Wimmer et R. Zust is available in the form of a book and a free-access
website (Wimmer & Zust, 2003). PILOT stands for Product, Innovation, Learning and Optimization
Tool. It helps identifying the most impacting phases of a product lifecycle and finding practical
measures to environmentally improve products. In a project developed by (Pamminger et al., 2007)
Ecodesign PILOT is combined to QFD (Quality Function Deployment) and HPO (Holistic Process
Optimization) to address respectively stakeholders and production process requirements.
SimaPro 7.0
This analytical tool developed by PRé Consultant
follows the Life Cycle Assessment methodology
for assessing potential environmental impacts of a
product or service over its life cycle (ISO 14040,
1997). Two main applications can be envisaged:
(1) analysis of the contribution of the life cycle
stages to the overall environmental load; (2)
comparison between products for internal or
external communication. The required data on
materials and processes can be gathered through
questionnaires to data providers or be drawn from
the provided full Eco Invent 2.0 database
(covering over 4000 processes) (PRéConsultant,
2010). An instance of graphical output by
SimaPro is the process tree graph of a disposable
razor for Global Warming Potential, see opposite.

9
Table 4: Proposition for a model of collective eco-design activity
BAKKER 1995 STEMPFLE&BADKE
SCHAUB 2002
PRUDHOMME,
POURROY&LUND
2007
Our proposition
Other Content Process Content Process
Analysis Goal
clarification
Planning Outside activity Goal
clarification
Planning
Environmental
Analysis
Solution
Generation
Social relation Initial
Assessment
Analysis
Idea Generation Analysis Analysis Interaction
management
Environmental
strategy
Evaluation Evaluation Evaluation Task management Solution
Generation
Environmental
Evaluation
Decision Decision Opinions Assessment of
Solutions
Evaluation
Modification Control Control Argumentations Decision Decision
Explore and Deepen
arguments
Control Control
Other Other
2.4 Coding scheme
Two researchers were involved in an iterative process of coding. First two common sessions of coding
(50 lines each) were needed to test the robustness of the coding scheme and refine the model. After the
first training phase, a double coding of the three sessions was carried out. The calculated Cohen’s
Kappa coefficients were: SIMAPRO: 0.93; ECOFAIRE 0.80; ECODESIGN PILOT: 0.83. The coding
scheme was judged satisfactory since every coefficient was superior to 0.6. The final version of the
coding scheme is given in Appendices A and B. The detailed analysis of the initial environmental
assessment required an additional level of coding in the Content (C)/ Initial Assessment (EI) category.
Three sub-categories were created to describe the use phase: conditions of shaving (CD), functionality
of shaving (UF) and consumption generated by shaving (CO). These are complemented by three
categories related to the lifecycle (usage excluded): extraction of material (M); production (FA),
distribution and logistics (T), end of life (FV). The double coding at this level leads to the following
satisfactory Kappa coefficients: SIMAPRO: 0.86; ECOFAIRE 0.76; ECODESIGN PILOT: 0.92. An
excerpt of transcription and coding for the ECODESIGN PILOT group is provided below (Table 5).
In the following section, the results of the coding are exposed firstly as a global overview (3.1), then in
detail (3.2).
Table 5 : Excerpt of ECODESIGN PILOT’s coded transcript (Part.: Participant ; TL : Team Leader ; F :
Fanny ; J : Jonathan)
Line Time Tool Part. Code* Dialogue
234 TL P C “In summary, use very important and end of life, it’s the
second thing, isn’t it ?
235 TL C St End of life, extraction. Yes, and end of life.
236 F C EI FA You have to see because foam doesn’t make use of any
brilliant process. It’s just thrown out with the water, and
all the products in it.
237 J C G REACH will come up.
238 F P O Use soap.
239 37’ TL C St So, now extraction and end of life because there is no
reason -
240 F C So So we ought to invent a razor which doesn’t need water
or foam.
241 T TL P Pl I’m taking a look at what they suggest (Reads
rapidly)."Washing machine intensive use".
242 T TL P A It is not really like a washing machine. Here, example
type D, intensive use. Type C, the product »
* G : Goal ; EI : Initial Assessment ; St : Strategy ; So : Solutions ; C : Control; Pl: Planning; A: Analysis; FA: Production

10
3 Results
3.1 Global analysis of eco-design sessions
On a first level we wish to compare the percentage of time dedicated to the generic ‘Content’ and
‘Process’ activities in each group (Figure 2). It can be noted that the proportion of ‘Process’
transactions shows little variation between groups, ranging from 23% of time for SIMAPRO to 33% for
ECODESIGN PILOT. This Process/Content ratio recalls what was observed by Stemfle & Badke-
Schaub (2002), namely a recurrent proportion of 1/3 Process and 2/3 Content in traditional design
studies.
Figure 2: Global time distribution of Content and Process activities
3.1.1 Global analysis of ‘Content' phases
On a second level the distribution of eight ‘Content’ sub-categories can be seen in Figure 3. The
analysis of the ‘Process’ level has been carried out, but will not be presented in this paper, which is
centred on the core eco-design activities. For SIMAPRO, ECOFAIRE and ECODESIGN PILOT, the
percentage of uncategorized transactions (due to incomplete sentences) is respectively 6, 3 and 7%.
As far as the ‘Content’ work is concerned (Figure 3), few decisions seem to be made in all groups (less
than 3%). A greater proportion of informal and social discussions are observed with ECOFAIRE.
Noticeable differences in the management of the five first sub-categories Goal (G), Initial Assessment
(EI), Strategy (St), Solutions (So) and Solution Assessment (ES) are reported. Designers of the
ECODESIGN PILOT team spend 40% of their time performing initial assessment of the product. This
is 37.5% more than SIMAPRO and 30% more than ECOFAIRE. Compared with other teams,
SIMAPRO spend twice much time on seeking solutions. Looking back at transcriptions, this result is
linked to two different types of solutions under the (SO) heading: elementary concepts (for instance
“bamboo handle”) and also relative intermediary concepts (such as “Shorten handle by ½”).
Influenced by the questions in the guide, The ECOFAIRE tool shows longer discussions about the
objectives and framing of the study, even as far as calling into question the social necessity for shaving
(Line 500): “Saying that, is it a fashion effect, a social effect, a social problem”. While remaining
qualitative, the discussions using ECOFAIRE spend more time evaluating solutions than is the case for
the other tools (+10% against SIMAPRO;+5% against ECODESIGN PILOT).
Apart from these differences, a remarkable consistency can be found in the time spent considering
‘problem’ phases [G, EI, St] versus ‘solution’ phases [So, ES, D, C]. The three groups actually spend
on average 40% of their time on [G, EI, St] (SIMAPRO : 37% ; ECOFAIRE : 38% ; ECODESIGN
PILOT : 45%) against an average 34% on [So, ES, D, C] (SIMAPRO : 39% ; ECOFAIRE : 35% ;
ECODESIGN PILOT: 29%). Problem and solution oriented activities appear to be balanced in time

11
Figure 3: Temporal distribution of ‘Content’ activities (G : Goal ; EI : Initial Assessment; St : Strategy ; So :
Solutions ; ES : Assessment of solutions ; D ; Decision ; C : Control ; O : Other)
3.1.2 Effective use of tool during ‘Content’ phase
Before this is analysed further, it is appropriate to take a close look at the effective use of eco-design
tools, as they are the basis of H1. In fact two distinct patterns are visible. ECOFAIRE is used regularly
throughout the whole session. The ECOFAIRE sheets stimulate consideration on various aspects of the
environmental problem of shaving. Conversely ECODESIGN PILOT and SIMAPRO are intensively
referred to in the second phase of the team work, respectively after 43 and 70% of the whole session. In
order to emphasize the tool contribution during the ‘Content’ phase, a comparative table of utterances
(in %) is provided: Figure 3 shows this information for the global session and Table 6 shows this for
where the tools are effectively used by the groups. No distinction is made with ECOFAIRE,
considering it is used though the whole session. When no or slight difference is observed between
overall and ‘with tool’ percentage of utterances, the tool is assumed to have been prevalent in dealing
with the corresponding sub-category. According to this, SIMAPRO is effectively helpful for
environmental assessment of solutions (ES), Decision (D) and (Control) whereas ECODESIGN PILOT
helps with solution finding (So) and assessment of solutions (ES). ECOFAIRE is most efficient in:
Initial Assessment (EI) followed by assessment of solutions (ES) and solution finding (So). Table 6
also pinpoints that some activities are neither supported by SIMAPRO nor by ECODESIGN PILOT.
That is: Goal Clarification (G), Initial Assessment (EI) (85% of which is not supported by
ECODESIGN PILOT); Environmental Strategy (St). This concerns as well Decision (D) and (Control)
for ECODESIGN PILOT. Section 3.2. will focus on the nature of Initial Assessment and
Environmental Strategy transactions.
Table 6: Effective ‘Content’ utterances observed with tools
‘Content’
utterances
(%)
Tool
SIMAPRO ECOFAIRE ECODESIGN PILOT
Overall With tool Overall Overall With tool
G 5.5 0 7.6 2.4 0
EI 24.8 0 28.0 40 6
St 6.8 0 2.8 2.2 0.8
So 22 4 10.0 8.8 8.6
ES 6.8 5.5 20.0 15 15
D 2.7 2.7 1.1 1.6 0.2
C 7.5 5.5 3.5 3.8 0.2
O 2 0 5.2 0
Legend in shaded sub-category for which tool use is predominant

12
3.2 Detailed analysis of eco-design sessions
In this section, we propose a more detailed analysis of the initial environmental assessment phase,
identified as important in 1.1.1. We also examine the stage of formulation of environmental strategy as
a means of reducing the complexity of the problem. The analysis of solutions generated by participants
is summarized below. Further details can be found in (Vallet, Millet & Eynard, 2009; 2011).
3.2.1 Initial environmental assessment
With a third-level of coding, we can understand the path taken by eco-design experts to address the
initial environmental assessment of the product. We note two features:
• Alternation between periods of qualitative and quantitative assessment,
• Environmental and functional viewpoints which overlap and are interrelated, giving an ‘eco-
functional’ character to the initial assessment.
In support of this last remark, repeated sequences are sought in this phase. We try to identify any
preferred associations of reasoning made by experienced eco-designers among the categories Shaving
conditions (CD), Functional Unit (UF), Consumptions (CO), Materials (M), Production (FA),
Distribution (T) and End of Life (FV). A sequence is determined by a succession of at least two
interventions coded under an (EI) heading. Two sequences are separated by an intervention of a
different nature, such as Content-Control and Content-Decision. In Table 7, interactions of the first
sequence (lines 11-14) with ECOFAIRE are reported, where subjects compare razors for men and those
for women. The sequence is composed by: 3 UF and 1 M. The sequences are plotted for each tool,
exemplified for ECOFAIRE in Figure 4 and included in Table 8. The phases of the life cycle appear
under ‘CV’ heading in this table.
The characterization of the phases of the life cycle (alone or combined with CD, CO, or UF) is
predominant with ECOFAIRE, with more than half of the sequences observed in this group (14/22).
With ECODESIGN PILOT, (CO + CD) combinations (alone or in combination with CV) are observed
for one third, followed by CD (20%) and (CO + Life Cycle) (20%). Although it is difficult to
generalize given the small number of SIMAPRO sequences, we note that three of the four categories
represented involve an exchange on the conditions of shaving CD.
Overall, across all sessions, the (CO + CD) sequence alone or in combination appears 11 times, which
is about ¼ of all sequences. This means that to the experts, it is important that both shaving conditions
and consumption of water and foam are defined jointly and iteratively. In second position and in the
same proportions, we find discussions on the characterization of phases of product life (excluding the
use phase) and interdependencies between these phases. These include examining the influence of the
choice of material (e.g. polystyrene) and manufacturing (e.g. injection) at the end of product life (e.g.
landfill).
Table 7: Excerpt of ECOFAIRE’s coded transcript (Part.: Participant; TL:: Team Leader ; B : Bernie; P:
Paul)
Line Time Tool Part. Code* Dialogue
11 T B C EI UF “Targeted product, not much difference in weight or
material
12 T P C EI UF One more blade, a pivoting head, an ergonomic grip
13 T TL C EI M Plus one substance : aloe vera
14 T B C EI UF These finally are very close products
15 T TL P C We are asked for new concepts, so -
16 6' T B C EI UF What are the important impacts?"
Figure 4: Sequences for Initial Assessment (EI) with ECOFAIRE

13
Table 8: Summary of sequences for Initial Assessment (EI); Functional Unit (UF); Consumptions
(CO); Shaving conditions (CD); Life Cycle (CV)
Combinations Number of sequences per tool Total number of
sequences/combination SIMAPRO ECOFAIRE ECODESIGN
PILOT
UF only 1 1 2
CO only 2 2
CD only 1 5 6
CV only 7 2 9
UF+CD 1 5 1 7
UF+CV 3 2 5
CO+CD 1 7 8
CD+CV 2 1 3
CO+CV 2 5 7
CO+CD+CV 2 1 3
UF+CO+CV 1 1
Total number
of sequences
per tool
6 22 25 53
3.2.2 Definition of an eco-design strategy
Elements of environmental strategy are referred to as ‘levers’ in the SIMAPRO group, and ‘axis’ in the
ECOFAIRE group. These strategies are mentioned by the teams in the context of shaving (Table 9).
After extracting each strategy statement from the transcripts, each is repositioned with the strategies of
section 0. The statement of these strategies is a crucial stage of the process and a basis for seeking
creative solutions. Three main strategies for reducing impact are discussed for this product.
• Strategy to reduce water and consumables (foam or soap), predominant in this case is
expressed by the groups and ECODESIGN PILOT, SIMAPRO. Curiously, this does not
appear explicitly in the group ECOFAIRE.
• The most obvious strategy of reducing and managing raw materials appears in all three groups.
However the ECODESIGN PILOT group does not apply this strategy, unlike the other two
groups.
• The strategy of influencing user behavior and seeking sustainability is also addressed in all
three groups. Two central ideas are discussed. The first is indicating water use to alert the user.
The second is working on the removal of hair cut to increase the life span. ECOFAIRE is the
only group to propose the addition of an extra function (tooth brush) to better exploit the
presence of the handle. In parallel, participants actively and reflectively questioned the
acceptability and practicality of this design choice, as well as whether the designer could be
seen as legitimate to have a real impact on user behavior, see (Lilley, 2009).
In conclusion, this stage of simplification and prioritization of the environmental problems caused by
shaving is addressed homogeneously between the three groups.
Table 9: Implementation of environmental strategies in the shaving case
Tool Strategy Statement
Lo
w i
mp
act
ma
t.
Ma
teri
al
use
Pro
du
ctio
n
tech
niq
ues
Dis
trib
uti
on
syst
em
Imp
act
use
Lif
etim
e
En
d o
f L
ife
SIMAPRO Limited amount of material
(razor)
x
Reduce water and foam x x
Evacuate water and cut hair x ECOFAIRE Choose a single material x x
Add Function x x
Remove the handle x ECO
DESIGN
PILOT
Reduce water consumption x
User behavior x x
Minimize: bag, bomb, water x x
Indicate water consumption x

14
3.2.3 Solution finding
Outcomes from solution finding, summarized in this section, call into question the issue of shaving at
various levels. In order to illustrate this point, two researchers recorded and classified the whole set of
solutions into four categories (Table 10). The systemic scale of Brezet (1997) was adapted to the
shaving context as following: (1) Product improvement deals with optimising the existing product
(razor or packaging); (2) Product Redesign deals with a change in product or consumables (soap or
foam). (3) Function Innovation relates to the use of the product and consumables, and may require new
consumer behaviour; (4) System innovation considers not only the product itself, but also a new system
of products. Examples of creative outcomes from the eco-design sessions are provided in Appendix C.
Although no statistical analysis can be made on this reduced sample of solutions, it can nevertheless be
noted that the tested eco-design tools mainly cater for the first two of these concepts, i.e. product
improvement and redesign. Function Innovation can only be found with ECODESIGN PILOT, where a
genuine effort was developed by the team to reduce hot water consumption. The other two concepts
were more intensively tackled by the fourth tool dedicated to industrial designers, INFORMATION
INSPIRATION (Vallet, Millet& Eynard, 2009; 2011). In conclusion, this analysis confirms that
generated ideas call into question a wide range of factors, from a local change of material to a global
sustainable management of consumables (water, foam or soap).
Table 10: Number of solutions on different systemic levels
Tool SIMAPRO ECOFAIRE ECODESIGN
PILOT
Level of
solution
Total number of solutions 9 8 10
Example of solution
Product
Improvement
Bamboo handle
Biodegradable material
Colours from vegetable pigments
4 5 1
Product
Redesign
Blow out hair system
Multi-purpose handle
(toothbrush/razor)
5 3 6
Function
Innovation
Indication of water consumption
through a change of stiffness of the
razor handle
Gauging plug (to indicate water
consumption and temperature)
0 0 3
System
Innovation
Association with organic cosmetic
products
0 0 0
4 Main outcomes and discussion As a reminder, the intent of this paper is to characterize the eco-design activities with regard to
traditional design practice. Subsection 4.1 will examine the first hypothesis H1, which stated that " The
eco-design process has a similar structure to a traditional design process ". In subsection Erreur !
Source du renvoi introuvable., the second hypothesis H2 is discussed, i.e. "All activities are not
equally important in time spent. Eco-design can be differentiated from design when the more
important activities are considered".
A clear distinction is made between what appears to be within this experiment, ‘tool-dependent’ and
‘tool-independent’ eco-activities. Finally the limits of the study are underlined.
4.1 Nature of the eco-design process
In order to investigate the nature of the eco-design process performed by experienced eco-designers in
conceptual design, we have been coding three sessions. The coding model, adapted from a traditional
design model by Stempfle & Badke-Schaub (2002) was successfully implemented. Hence it can be
concluded that the three eco-design processes have a similar nature to a traditional design process.
Moreover the three eco-activities highlighted by the literature survey have been recognized throughout
the coding process. More precisely, most of the time is spent by experts on initial environmental
assessment (30.9% on average) final environmental assessment (13.9% on average) and solution
finding (13.6%). Time spent on strategy definition is a long way behind, with 3.9% on average. After
this first step of validation, it is relevant to discuss the relative importance of eco-activities and their
support by eco-design tools.

15
4.2 Relative importance of on eco-activities and influence of eco-design tools
The investigation of our second hypothesis involved the implementation of three distinct eco-design
tools with different environmental scopes or objectives (cf. 2.1). The influence of tools appears to
depend on the considered eco-activity. It was observed that, apart from ECOFAIRE, experts choose to
freely tackle the eco-design issue in the first stage of work, and implement the assigned tool after 1/3
and 2/3 of total time for ECODESIGN PILOT and SIMAPRO respectively. It is assumed that the initial
‘tuning’ phase of the eco-design process relies on the sharing of the expertise of the participants. This
leads us to define 'tool-independent activities' which are achieved thanks to environmental expertise.
Alternatively some activities are exclusively supported by tools, and the relative importance of the
activities (in time spent) is dependent on the type of tool as follows.
4.2.1 Eco-activities fostered by the tested tools
The hypothesis H2 leads to compare the effective performance of eco-design tools against the
‘Content’ categories with their expected performance from the literature survey.
SIMAPRO is expected to be most efficient in environmental assessment, whether initial or final. The
protocol reveals that it covers most of the assessment of solutions, and unexpectedly about 20% of the
solutions finding. It would also be expected to help with initial assessment, but this was conducted
quite independently from the tool by the participants, relying on their previous expertise.
ECOFAIRE should, in theory, equally foster all eco-design activities thanks to the various dedicated
sheets. In practice it was used for three activities in the main: initial assessment, solution finding and
environmental assessment of solutions. ECODESIGN PILOT is expected to be most appropriate for
environmental strategy definition and solution finding. This is partly verified since the observed
contribution of the tool deals with solution finding and environmental assessment of solutions.
The findings of this section are summarized in Table 11.
Table 11: Eco-design activities covered by tested eco-design tools
Tool Eco-design activity
Environmental
assessment
Solution finding Environmental
Strategy
Initial
assessment
Assessment
of solutions
SIMAPRO
expected x x
observed x X
ECOFAIRE
expected x x X x
observed x x X
ECODESIGN PILOT
expected X x
observed x x
The three tools influence the transactions between experts in distinct ways. With ECOFAIRE, the main
focus is on the creation of value for the company. Several moments of dialogue hint at the consumer’s
perception (“Wait, a green guy would never buy anything disposable”) or leading companies’ strategic
position towards disposable razors. This is in line with the targeted end-users of the tool: eco-design
consultants. The approach of ECODESIGN PILOT is based on a hypothetical quantitative assessment
of water and material consumption. It can be noted that this group did not use the ‘Assistant’ module
on the first phase of environmental analysis. This module was either not identified by subjects, or not
required because of sufficient knowledge on their part. The systematic search for solutions which
followed gave rise to a large number of solutions. Of these the team leader chose to make a detailed
representation of 4 concepts out of 10. Lastly, and probably with the aim of greater efficiency, the use
of SIMAPRO is characterized by a low level of interactions. Nevertheless, the SIMAPRO group tends
to implement a greater number of steps of the eco-design process. The group goes beyond the
proposition of several environmental concepts to achieve a simplified evaluation of the scenarios
created collectively.

16
4.2.2 Tool-independent eco-activities: environmental assessment and environmental strategy definition
Throughout the experiment, the first activity not supported by tools appears to be the initial
environmental assessment. Our assumption that this activity is part of the eco-designers' expertise
seems to be confirmed by a comment from the first questionnaire: " I have the feeling that functional
aspects were tackled by questioning directly the product rather than using the tool". The detailed
analysis provided in 3.2.1. leads to another conclusion, being the approach is based on an ‘eco-
functional’ way of assessing product performances. In our view, the identification of a stage of eco-
functional assessment is consistent with the results of Reymen, Dorst & Smulders (2009) concerning
the co-evolution of problem-solution involving several players at design stages. The notion of usage
appears as a “bridging concept" between the problem space and possible solutions, and the creation of
detailed usage scenarios is an illustration of this. We were also faced with a difficulty of separating
functional from environmental discussions. Indeed, the conditions of use of the razor is a bridge
between these two views. The intersection of environmental, functional but also aesthetic and market
criteria by eco-experienced designers had already been pointed out by Bakker (1995) during the
solution assessment stage, the initial assessment being initially performed quite rapidly. Our hypothesis
is that the presence of several designers forces the construction of a shared vision from the outset. This
however requires a much longer and more thorough initial assessment phase calling into play the
various different viewpoints.
The second activity not supported by tools is the environmental strategy definition. As it is addressed in
the same way between the three groups, it seems to lead to the conclusion that, for this product,
expressing environmental strategies is part of the eco-designer’s knowledge. User’s behavior is taken
into account as expected in 0.
The proposition is to represent the eco-design activities in order to introduce a balance between
environmental assessment, solution finding and strategy (Figure 5). Taking one step further, such a
combination may refer to a FBS structure (Gero & Kannengiesser, 2004) where environmental strategy
stands for Function, whereas environmental assessment and solution finding stand for Behavior and
Solution respectively. This could be a track for refining the proposed coding scheme.
Environmental
Assessment
EnvironmentalSolution finding
Environmental
Strategy
Life-cycle
stages
Figure 5: Balance between environmental assessment, solution finding and strategy
4.3 Limits of the study
Several limits to this study should be noted. The main limitation is due to the absence of a control
group performing the task without the help of any eco-design tool. The control group would have been
a useful contribution to ascertain that “When the tool is not used, the main influence in solving the task
is due to the expertise of designers”. Expected results would have been, in this case, to see subjects
spend about 5% of time on Goal Definition and Environmental strategy, 30% on Initial Assessment.
Moreover, the actual content of environmental strategies and assessment of a control group should have
been consistent with what was emphasized in 3.2.1 and 3.2.2.
Our analysis is based on the hypothesis of the influence of a tool on the activity. Yet in design, there
are three main factors of influence on the activity: the supporting tool, but also the designers’ mindset,
or experimental bias (Blessing & Chakrabarti, 2009). The following limits can also be found in
Dwarakanath & Blessing (1996), who conducted a similar kind of study in a traditional design context.
They emphasized limits attributed to: (1) the experimental environment; (2) the experimental protocol;
(3) the limited number of cases; (4) the design brief; (5) the subjects. Some advantages of a laboratory
environment against an industrial environment have already been pointed out. But it has to be

17
underlined that in a lab setting, the eco-design problem becomes a ‘stand-alone’ task, which might limit
the motivation and involvement of subjects.
The choice of a protocol analysis based on group work raises the issue of dealing with parallel
activities, whereas transcripts have a linear structure. Moreover, silent actions such as calculations
operated in the SIMAPRO team do not appear in the analysis. Evidence of this phenomenon is the
reduced number of SIMAPRO transcription lines compared to other tools.
This is a ‘small scale’ experiment as defined in Cash, et al. (2012), which involves a single test with
only a few groups. One can legitimately wonder whether the subjects are a fair representation from
across experienced eco-designers. One possible response is to characterize as carefully as possible the
participants’ profile, i.e. their general eco-design expertise and the previous knowledge of the tool they
use.
In addition, it is assumed that, due the simplicity of the product, eco-design experts would prefer to use
their previous knowledge than spend time implementing a tool. In further research work, the influence
of the control variable ‘simplicity of the redesigned product’ should be taken into account. Moreover,
we focus on a specific typology of product involving deeper discussions on the use phase than on other
phases of the life cycle. This may encourage the ‘eco-functional’ assessment analysed in 3.2.1. As a
consequence, it should be mentioned that this work shows observed trends as main outcomes, and more
research is necessary to draw general conclusions.
5 Conclusions and future work In this article we first defined the steps of an eco-design approach and showed the main supporting
features of the eco-design activity provided by methods and tools. In order to better understand the
nature and singularity of eco-design compared to design, participant observation was implemented in
three groups of experienced eco-designers, followed by transcription and coding of the verbal
transactions. The originality of this approach lies in the simultaneous consideration of several steps
within a redesign process. Outcomes from literature usually focus on one specific step, but rarely on the
whole eco-design process.
The results of this enquiry validated the hypothesis H1. According to the observation protocol, the eco-
design process is very similar to a traditional design process as far as structure is concerned. This was
expected since many of the experts involved have a design background.
As far as H2 is concerned, findings are twofold. Firstly, participants are assumed to rely on their
previous expertise to perform initial assessment and strategy definition. Moreover, it has been shown
that the initial environmental assessment of the product mixes environmental and functional
considerations in qualitative or quantitative usage scenarios. The three groups produced adequate
environmental strategies homogeneously.
Secondly, the use of eco-design tools mostly benefits goal definition, solution finding and final
assessment. Nevertheless some slight differences between expected and observed performances of eco-
design tools in supporting eco-activities can be reported.
It was intended to shed light on the nature and singularity of eco-design. Does the practice of eco-
design imply more than just learning to use new tools and adding a few environmental criteria to a
classical design process?
If the idea to narrow the scope of design through defining a strategy is not original, the basic culture of
designers does not allow them to know which lever is really efficient for environmental improvement.
Seemingly good ideas (e.g. a change in materials) might not greatly improve the performance, or might
even be detrimental. In the case of shaving, considering water consumption is not obvious although it is
the main environmental impact throughout the entire life cycle of a razor. New support tools to train
designers with strategy definition should be investigated. These could be based on case-studies. As for
solution finding, it is a typical eco-activity should we take into account the wide range of solutions
observed in 3.2.3. We have demonstrated that solutions range from 'micro' improvements in changing
materials to 'macro' changes in water management systems, shaving being only part of the issue. The
importance of the user's behavior should be emphasized in cases like this one, leading designers to
know more about real usage and consumption patterns than they usually do. As a consequence,
solutions derived from insights on usage should be fostered by future eco-design tools.
From this empirical research, it is our opinion that integrating the environmental dimension underpins
several major challenges. Those are demanding in time, involvement and require a new holistic sense
of design. We have emphasized several key issues: the predominant initial environmental assessment
(in time spent) based on one or several relevant functional scenarios; the variety of environmental
strategies depending on the type of product and the multi-level search for environmental improvement
concepts.

18
In a short term perspective, it is envisaged to enrich this work by analyzing eco-design meetings with
novices and beginners. The aim is to characterize key eco-design competences involving the state of
expertise of designers. We thus hope to contribute to the “new design knowledge” advocated by
(Manzini, 2009) by educating a new generation of designers to be aware of the challenges facing a
sustainable society.
Acknowlegments
The authors express their gratitude to the experts who participated in the experiment during the 4th
seminar of the national network of researchers in Eco-design of systems for Sustainable Development
(EcoSD) held in March 2009 in Paris. Sincere thanks go to Nadège Troussier for her support, and to the
reviewers for their meaningful comments.
References
Akermark A.M. (2005). The Crucial Role of the Designer in EcoDesign. PhD Thesis. Stockholm, Sweden: Royal
Institute of technology, KTH.
Badke-Schaub P., Goldschmidt G., Meijer M. (2007). Cognitive conflict in design teams: competing or
collaborating. In Proceedings of International Conference on Engineering Design, ICED’07, 28-31 August. Paris,
France.
Bakker C. (1995). Environmental Information for Industrial Designers. PhD Thesis. Delft: Delft University of
Technology.
Baumann, H., Boons, F., Bragd, A. (2002). Mapping the green product development field: engineering, policy and
business perspectives. Journal of Cleaner Production, 10, 409-425.
Blessing L., Charkrabarti A.(2009). DRM, A Design Research Methodology, London: Springer Verlag Ltd.
Brezet J.C., Van Hemel C. (1997). Eco-design-A promising approach to sustainable production and consumption.
UNEP, United Nations Publications.
Cash P., Elias E., Deconinck E., Culley S. (2012). Methodological insights from a rigorous small scale design
experiment. Design Studies 33(2), 208-235.
Collado D., Ostad-Ahmad-Ghorabi H. (2010). Influence of environmental information on creativity. Design
Studies 31, 479-498.
Cross N. (1997). Descriptive modes of creative design: application to an example. Design Studies 18, 427-440.
Cross N. ed (2008). Engineering Design Methods-Strategies for Product Design. 4th edition. Chichester: Wiley &
Sons.
Cruhl M., Diehl J. (2009). Design for sustainability, a step-by-step approach. UNEP, United Nations Publications.
Dorst K. (2001). Creativity in the design process: co-evolution of problem-solution. Design Studies 22, 425-437.
Dwarakanath S., Blessing L. (1996). Ingredients of the Design Process: a Comparison between group and
individual work. In Cross N., Christiaans H., Dorst K. Eds, Analysing Design Activity,. John Wiley, Chichester,
93-116.
ECOFAIRE (2008). Methological tool ECOFAIRE, from ECOFAIRE program directed by « SEM régionale des
Pays de Loire » and granted by State, Pays de Loire region and ADEME.
Eder, W.E. (2009). Design engineering and needs for methodology. In Proceedings of the International Conference
on Engineering Design, ICED’09, 24-27 August. Palo Alto, CA, USA.
Fargnoli M., Kimura F. (2006). Sustainable Design of Modern Industrial Products. In Proceeding of International
Conference of Life Cycle Engineering, LCE 2006, 189-194. Leuven, Belgium.
Fargnoli M., Kimura F. (2007). An integrated approach for the sustainability measure of industrial products in
design stages. In Proceedings of the International Conference on Engineering Design, ICED’07, 28-31 August.
Cité des Sciences et de l'Industrie, Paris, France.
Fuad-Luke A. (2004). The eco-design handbook-A complete sourcebook for the home an office. Second Edition,
London: Thames & Hudson Ltd.

19
Fussler C., James P. (1996). Driving Eco Innovation-A breakthrough discipline for innovation and sustainability.
London: Pitman Publishing, Pearson Professional Ltd.
Gero, J.S., Mac Neill T. (1998). An approach to analysis of design protocol. Design Studies 19, 21-61.
Gero J.S., Kannengiesser U. (2004). The situated function-behaviour-structure framework. Design Studies 25(4)
373-391.
Goldschmidt G., Sever A.L. (2009). From text to design solution: inspiring design ideas with texts. In Proceedings
of the International Conference on Engineering Design, ICED’09, 24-27 August. Palo Alto, CA, USA.
ISO 14040 (1997). Environmental Management. Life Cycle Analysis. Principles and framework. ISO, Geneva,
September 1997.
ISO/TR 14062 (2002). Environmental Management, Integrating environmental aspects into product design and
development. Technical Report, ISO, Geneva.
ISO 26000: 2010 (2010). Lignes Directrices relatives à la responsabilité sociétale. ISO, Geneva, November 2010.
Jones, E. (2001). Applying structured methods to Eco-innovation. An evaluation of the Product Ideas Tree
Diagram. Design Studies 22, 519-542.
Jones, E. (2003). Eco-innovation: tools to facilitate early-stage workshops. PhD Thesis. Brunel: Brunel University.
Knight P., Jenkins J.O. (2009). Adapting and Applying eco-design techniques: a practitioners perspective. Journal
of Cleaner Production, 17, 549-558.
Kruger C. (2006). Solution driven versus problem driven design: strategies and outcomes. Design Studies 27 (5)
527-548.
Lagerstedt J, Luttropp C., Lindfors L.G. (2003). Functional Priorities in LCA and Design for Environment.
International Journal of Life Cycle Assessment 8(3), 160-166.
Le Pochat S., Bertoluci G., Froelich D. (2007). Integrating ecodesign by conducting changes in SMEs. Journal of
Cleaner Production, 15(7), 671-680.
Liikanen LA. (2009). Exploring problem decomposition in conceptual design among novice designers. Design
Studies 30, 38-59.
Lilley D. (2009). Design for sustainable behaviour: strategies and perceptions. Design Studies Vol 30 (6), 704-720.
Lindhal M. (2005). Engineering designers’ requirements on design for environment methods and tools. PhD
Thesis. Royal Institute of Technology-KTH, Stockholm.
Lindhal M. (2006). Engineering designers’ experience of design for environment methods and tools-Requirement
definitions from an interview study. Journal of Cleaner Production 14, 487-496.
Lofthouse V.A. (2001). Facilitating Ecodesign in an Industrial Design Context: An Exploratory Study. PhD
Thesis. Cranfield University, Cranfield.
Luttrop C., Lagerstedt J. (2006). Ecodesign and the Ten Golden Rules: generic advice for merging environmental
aspects into product development. Journal of Cleaner Production, Volume 14, 1396-1408.
Manzini E. (2009). Viewpoint-New Design Knowledge. Design Studies 30, 4-12.
Mc Donnell J., Llloyd P. (2009). About: Designing-Analysing Design Meetings. Netherlands: CRC Press/Balkema.
Millet D. (Dir.) (2003). Intégration de l’environnement en conception- L’entreprise et le développement durable,
Paris: Hermès Lavoisier.
Mulet, E. Lopez-Mesa, B., Gonzalez, M.C., Camelo, D. (2007). Characterization of designer interactions in the
creative design process. In Proceedings of International Conference on Engineering Design, ICED’07, 28-31
August. Paris, France : Cité des Sciences et de l’Industrie.
Pahl G., Beitz W, Feldhusen J., Grote K.H. (2007). Engineering design-A Systematic Approach, Third Edition.
London: Springer-Verlag.

20
Pamminger R., Huber M., Wimmer W. (2007). Ecodesign toolbox for the development of green product concepts-
Case study digital voice recorder. In Proceeding of the International Conference on Engineering Design, ICED'07,
Paris, August 2007, pp. 437-447.
PRé Consultants (2010). SimaPro 7.0, Introduction to LCA. Available online: http//www.pre-
sustainability.com/content/manuals, November 2010. Accessed 12/01/12.
Prudhomme G., Pourroy F., Lund K. (2007). An empirical study of engineering knowledge dynamics in a design
situation. Journal of Design Research, 6 (3), 333-358.
Reymen I., Dorst K., Smulders F. (2009). Co-evolution in Design Practice. In Mc Donnell J., Llloyd P., About:
Designing-Analysing Design Meetings (pp 67-82). Netherlands: CRC Press/Balkema.
Ritzen S. (2000). Integrating Environmental Aspects into Product Development-Proactive Measures. PhD Thesis.
Stockholm: Royal Institute of Technology-KTH.
Sakao T., Paulsson S. Mizuyama H. (2011). Inside a PSS Design Process: Insights through Protocol Analysis. In
Proceeding of the International Conference on Engineering Design, ICED'11, Copenhagen, August 2011.
Sauer J., Wiese B., Ruttinger B. (2002). Improving ecological performance of electrical consumer products: the
role of design-based measures and user variables. Applied Ergonomics 33, 297-307.
Schmalz J., Boks C (2011). Simutaneous Application of Design for Sustainable Behavior and Linked Benefit
Strategies in Practice. In Proceeedings of 18th CIRP International Conference on Life Cycle Engineering, LCE
2011, May 2nd-4th 2011. Braunschweig, Germany.
Stempfle J., Badke-Schaub P. (2002). Thinking in Design Teams- An Analysis of Team Communication. Design
Studies 23, 473-496.
Tyl B., Legardeur J., Millet D., Vallet F., Stimulate creative ideas for eco-innovation: an experiment to compare
eco-design and creativity tools. IDMME Virtual Concept 2010, 20-22 October. Bordeaux, France.
Valkenburg, R., Dorst, K. (1998). The reflective practice of design teams. Design Studies 19(3), 249-271.
Vallet F., Millet D., Eynard B. (2009). Investigating the use of eco-design guides: presentation of two case studies.
In Proceedings of the International Conference on Engineering Design, ICED’09, 24-27 August. Palo Alto, CA,
USA.
Vallet F., Millet D., Eynard B. (2011). Requirements and Features Clarifying for eco-design tools. In Global
Product Development. Springer, A. Bernard Ed., 127-137. Nantes, France.
Wever R., Van Kuijk J., Boks C. (2008). User-centred design for sustainable behavior. International Journal of
Sustainable Engineering 1(1), 9-20.
Yong, S.K., Sang, W.L., Jung A.P., Ji, Y.J. (2009). Exercises for cognitive elements of design creativity. In
Proceedings of the International Conference on Engineering Design, ICED’09, 24-27 August. Palo Alto, CA,
USA.
Wimmer W., Züst R. (2003). Ecodesign PILOT: product investigation, learning and optimization tool for
sustainable product development. Kluwer Academic Publishers, Dordrecht, Netherlands.

21
Step Code Description Examples
Goal
clarification G
Definition of context
Choice of product
Innovation level
Labels, current legislation
« We choose a man’s razor »
«It is a new product or a minor innovation?”
« REACH will come up ».
Initial
assessment EI
CD
UF
CO
M
FA
T
FV
Environmental assessment of
existing product
Conditions of shaving: number of
passages, shaving surface, frequency,
security, handling…
Functional Unit, function, boundaries
of study
Consumptions
(water, consumable, packaging), waste
Raw materials
Production
Distribution Logistics
End of Life
« That is to say 7 faces account for 2 legs in surface »
« We shave through once, twice»
« What product do we consider? The razor, the associated consumables? »
« About use, setting the boundaries is difficult enough as it is so, if you add logistics-»
« Three sprays of foam a year, sold »
« What is important, tepid water 40°C, it’s a lot of energy. In my opinion the impact is a lot
also. »
“Let’s say 2g of cardboard for you [MEN], 3g of sachet for us [WOMEN]»
« This one maybe it is not polystyrene, maybe a polypropylene»
« In a preliminary phase, there must be lamination »
« Here I am reading ‘Made in USA, conditioned in Europe’. Distances seem enormous, but with
shipping -»
« About metal, is there any reprocessing in closed loop ?»
Strategy St Proposition concerning strategies et
priorities of environmental
improvement
« Increase durability by all means »
« Reduce water consumption »
« On the cycle : transport and packaging are negligible »
Generation
of solutions So Proposition concerning solutions
and ideas
Analogy
« You can imagine a pump, a syringe »
« It is like spreading. Just what is needed to cut»
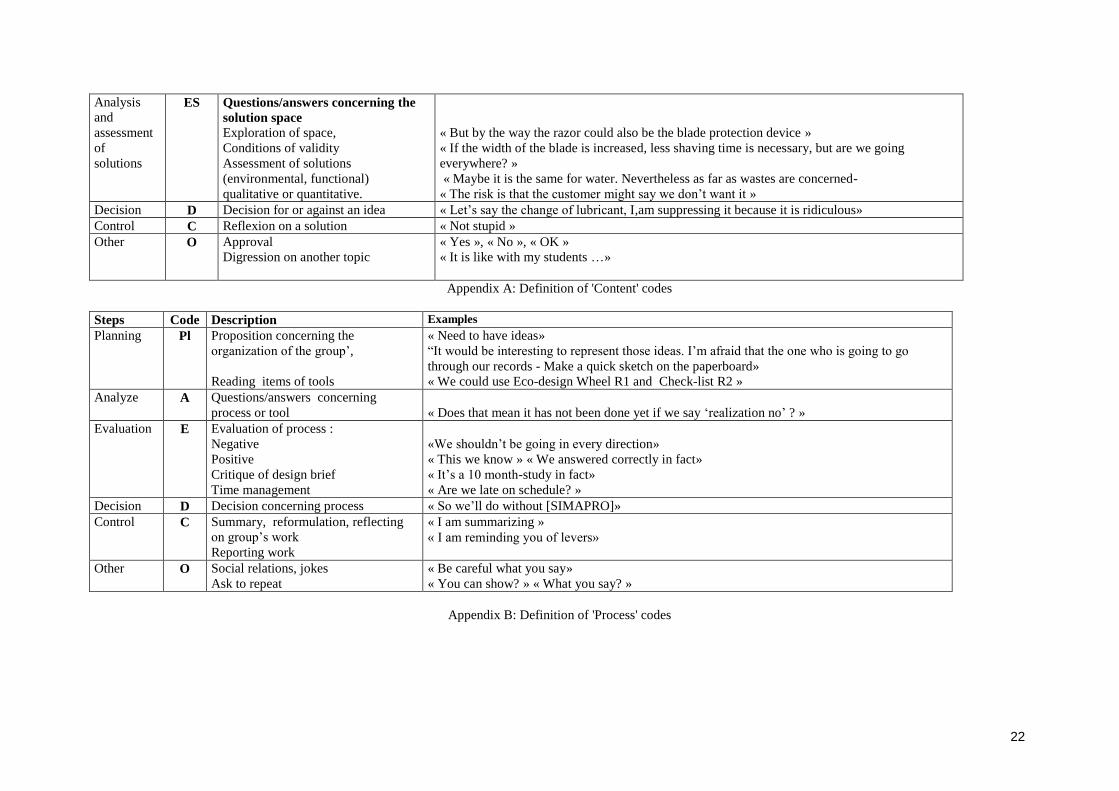
22
Analysis
and
assessment
of
solutions
ES Questions/answers concerning the
solution space
Exploration of space,
Conditions of validity
Assessment of solutions
(environmental, functional)
qualitative or quantitative.
« But by the way the razor could also be the blade protection device »
« If the width of the blade is increased, less shaving time is necessary, but are we going
everywhere? »
« Maybe it is the same for water. Nevertheless as far as wastes are concerned-
« The risk is that the customer might say we don’t want it »
Decision D Decision for or against an idea « Let’s say the change of lubricant, I,am suppressing it because it is ridiculous»
Control C Reflexion on a solution « Not stupid »
Other O Approval
Digression on another topic
« Yes », « No », « OK »
« It is like with my students …»
Appendix A: Definition of 'Content' codes
Steps Code Description Examples
Planning Pl Proposition concerning the
organization of the group’,
Reading items of tools
« Need to have ideas»
“It would be interesting to represent those ideas. I’m afraid that the one who is going to go
through our records - Make a quick sketch on the paperboard»
« We could use Eco-design Wheel R1 and Check-list R2 »
Analyze A Questions/answers concerning
process or tool
« Does that mean it has not been done yet if we say ‘realization no’ ? »
Evaluation E Evaluation of process :
Negative
Positive
Critique of design brief
Time management
«We shouldn’t be going in every direction»
« This we know » « We answered correctly in fact»
« It’s a 10 month-study in fact»
« Are we late on schedule? »
Decision D Decision concerning process « So we’ll do without [SIMAPRO]»
Control C Summary, reformulation, reflecting
on group’s work
Reporting work
« I am summarizing »
« I am reminding you of levers»
Other O Social relations, jokes
Ask to repeat
« Be careful what you say»
« You can show? » « What you say? »
Appendix B: Definition of 'Process' codes

23
Appendix C: Examples of creative outcomes
SIMAPRO
ECOFAIRE ECODESIGN PILOT
Water jet cleaning of razor
Copyright © 2022 FDOKUMEN

