


Bahasa
Halaman
Hukum


U.S. Department of the Interior U.S. Geological Survey
Open-File Report 2016–1104
Abstract Volume for the 2016 Biennial Meeting of the Yellowstone Volcano Observatory

Cover: Photograph of the 2016 deployment of eddy covariance tower (left) and Multi-GAS (right) for time-series monitoring of gas chemistry and discharge. The equipment sits in acid-altered terrain at the north end of the Norris Geyser Basin. It was installed as part of research permit YELL-2016-SCI-5406.

Abstract Volume for the 2016 Biennial Meeting of the Yellowstone Volcano Observatory
Edited by Jacob B. Lowenstern
Open-File Report 2016–1104
U.S. Department of the Interior U.S. Geological Survey

U.S. Department of the Interior SALLY JEWELL, Secretary
U.S. Geological Survey Suzette M. Kimball, Director
U.S. Geological Survey, Reston, Virginia: 2016
For more information on the USGS—the Federal source for science about the Earth, its natural and living resources, natural hazards, and the environment—visit http://www.usgs.gov/ or call 1–888–ASK–USGS (1–888–275–8747).
For an overview of USGS information products, including maps, imagery, and publications, visit http://store.usgs.gov.
Any use of trade, firm, or product names is for descriptive purposes only and does not imply endorsement by the U.S. Government.
Although this information product, for the most part, is in the public domain, it also may contain copyrighted materials as noted in the text. Permission to reproduce copyrighted items must be secured from the copyright owner.
Suggested citation: Lowenstern, J.B., ed., 2016, Abstract volume for the 2016 biennial meeting of the Yellowstone Volcano Observatory: U.S. Geological Survey Open-File Report 2016–1104, 46 p., http://www.dx.doi.org/10.3133/ofr20161104
ISSN: 2331-1258 (online)

iii
Contents Biennial Meeting of the Yellowstone Volcano Observatory ............................................................................ 1
By Jacob B. Lowenstern The 2015 Upper Geyser Basin Seismic Imaging Experiment ........................................................................ 4
By Jamie Farrell, Fan-Chi Lin, Sin-Mei Wu, Bob Smith Multiscale, Multi-property Geophysical Imaging of Hydrothermal Systems, Yellowstone National Park ........ 8
By W. Steven Holbrook, Bradley Carr, Ken Sims, Sylvain Pasquet, Henry Heasler, and Cheryl Jaworowski
The Hydrothermal Dynamics of Yellowstone Lake (HD-YLAKE) Project: Responses to Tectonic, Magmatic, and Climatic Forcing ...................................................................................................................................... 9
By Robert Sohn What We’ve Learned From 12 Years of Sampling Gas and Water at Yellowstone ...................................... 10
By Jacob B. Lowenstern, Deborah Bergfeld, William C. Evans, Shaul Hurwitz, and Andrew G. Hunt
Status and Future Directions of the Chloride Flux Program ......................................................................... 13 By R. Blaine McCleskey and Jacob B. Lowenstern
Continuous Monitoring of Hydrothermal CO2 and Heat Emissions Using the Eddy Covariance Method at Norris Geyser Basin, Yellowstone National Park ......................................................................................... 17
By Jennifer L. Lewicki Satellite and Airborne Measurements of Thermal Emission at Yellowstone ................................................ 19
By R. Greg Vaughan Yellowstone Hydrothermal Systems: Public Safety, Science and Recommendation ................................... 21
By Bob Smith, Jamie Farrell, Keith Koper, and Fred Massin What Do We Know About Earthquakes at Yellowstone: An Overview of Swarms, Magnitudes, Fault Interactions, Earthquake Families, and Why We Can’t Find Long-Period Events........................................ 23
By Jamie Farrell and Bob Smith Recent InSAR Studies at Yellowstone ......................................................................................................... 27
By Chuck Wicks, Daniel Dzurisin, Peter F. Cervelli, Jacob B. Lowenstern, Wendy K. Stovall, and David R. Shelly
Probabilistic Forecasting of Volcanic Eruptions Using Physics-based Models ............................................ 29 By Kyle R. Anderson
What Do We Know About Eruption Precursors at Large Silicic Caldera Systems? ..................................... 32 By Daniel Dzurisin
Tools for Decision Making in Eruption Forecasting ...................................................................................... 36 By Sarah E. Ogburn, John S. Pallister, and Heather M. Wright
Using Global Data for Eruption Forecasting ................................................................................................ 39 By Sarah E. Ogburn, Christopher J. Harpel, Jeremy D. Pesicek, John J. Wellik, John S. Pallister, and Heather M. Wright
An Exercise to Obtain Expert Views on Precursors to Volcanic Eruptions at Yellowstone .......................... 43 By Jacob B. Lowenstern, Sarah E. Ogburn, and Jamie M. Farrell

Conversion Factors U.S. customary units to International System of Units
Multiply By To obtain Area
acre 4,047 square meter (m2) acre 0.4047 hectare (ha) acre 0.4047 square hectometer (hm2) acre 0.004047 square kilometer (km2)
International System of Units to U.S. customary units Multiply By To obtain
Length centimeter (cm) 0.3937 inch (in.) millimeter (mm) 0.03937 inch (in.) meter (m) 3.281 foot (ft) kilometer (km) 0.6214 mile (mi) kilometer (km) 0.5400 mile, nautical (nmi) meter (m) 1.094 yard (yd)
Area square meter (m2) 0.0002471 acre square kilometer (km2) 247.1 acre square centimeter (cm2) 0.001076 square foot (ft2) square meter (m2) 10.76 square foot (ft2) square centimeter (cm2) 0.1550 square inch (ft2) square kilometer (km2) 0.3861 square mile (mi2)
Volume cubic meter (m3) 6.290 barrel (petroleum, 1 barrel = 42 gal) cubic meter (m3) 264.2 gallon (gal) cubic meter (m3) 0.0002642 million gallons (Mgal) cubic centimeter (cm3) 0.06102 cubic inch (in3) cubic decimeter (dm3) 61.02 cubic inch (in3) cubic meter (m3) 35.31 cubic foot (ft3) cubic meter (m3) 1.308 cubic yard (yd3) cubic kilometer (km3) 0.2399 cubic mile (mi3) cubic meter (m3) 0.0008107 acre-foot (acre-ft)
Mass gram (g) 0.03527 ounce, avoirdupois (oz) kilogram (kg) 2.205 pound avoirdupois (lb) metric ton (t) 1.102 ton, short [2,000 lb] metric ton (t) 0.9842 ton, long [2,240 lb]

Biennial Meeting of the Yellowstone Volcano Observatory
By Jacob B. Lowenstern1
Introduction Every two years, scientists, natural resource managers, outreach specialists, and a variety
of other interested parties get together for the biennial meeting of the Yellowstone Volcano Observatory (YVO). Each time, the theme varies. In past years, we have focused the meeting around topics including monitoring plans, emergency response, geodesy, and outreach. This year, we spent the first half-day devoted to recent research results, plans for upcoming studies, and geothermal monitoring. On the second day, our focus switched to eruption precursors, particularly as they apply to large caldera systems.
Very few large explosive eruptions from caldera systems have taken place in recorded history. Therefore, there are few empirical data with which to characterize the nature of volcanic unrest that might precede eruptions with volcano explosivity index (VEI) of six or greater. For this reason, we set up a series of talks that explore what we know and don’t know about large eruptions. We performed an informal expert elicitation (a frequently used method to characterize expert opinion) with a small number of our colleagues, which served as the basis for a productive discussion session.
This short volume of abstracts and extended abstracts provides a summary of the presentations made at the YVO meeting held in Mammoth Hot Springs, Wyoming, on May 10–11, 2016.
Agenda for YVO Meeting May 2016 Meeting overview:
The first afternoon is a combination of research updates, research plans, and tools for improved monitoring. These talks should be of interest to all YVO participants and NPS staff. Hopefully, the presentations will all be targeted toward a general audience.
The second day is “continuing education” for the YVO scientific staff. It is a series of talks, exercises, and discussion related to understanding precursors to large (and smaller) volcanic eruptions. Most talks will extend beyond the interest levels of NPS staff. However, those with an interest in volcanology, or those who want a preview of discussions expected during the next intense earthquake swarm, are encouraged to attend.
1U.S. Geological Survey
2
Schedule [USGS, U.S. Geological Survey; YNP, Yellowstone National Park; WHOI, Woods Hole Oceanographic Institution; PBO, Plate Boundary Observatory; GPS, global positioning system]
Tuesday, May 10, 2016 1:00 p.m.—Jake Lowenstern: Welcome to meeting, Overview of talks, Quick Summary of
last 2 years from YVO perspective.
Recent and upcoming research 1:15 p.m.—Sarah Haas, YNP: News from the research permit office. 1:30 p.m.—Jamie Farrell, University of Utah: Old Faithful seismic experiment. 1:50 p.m.—Steve Holbrook and Brad Carr, University of Wyoming: Near surface
geophysical work and upcoming plans. 2:10 p.m.—Rob Sohn, WHOI: The HD-YLAKE project—plans and opportunities. 2:35 p.m.—Dave Mencin, UNAVCO: UNAVCO, PBO, and the Yellowstone GPS and strain
network. 2:55 p.m.—Break
Methods for study of heat and fluid flow 3:10 p.m.—Jake Lowenstern, USGS: What we’ve learned from 12 years of sampling gas and
waters. 3:30 p.m.—Blaine McCleskey, USGS: Status and future directions for the chloride flux
program. 3:45 p.m.—Jen Lewicki, USGS: Using Eddy Covariance methods to quantify gas and heat
flux at Yellowstone and beyond. 4:00 p.m.—Peter Kelly, USGS: Long-term autonomous volcanic gas monitoring with Multi-
GAS. 4:15 p.m.—Sean Scott and Ken Sims, University of Wyoming: Timescales of fluid
movement in the Yellowstone hydrothermal system. 4:35 p.m.—Greg Vaughan, USGS: Satellite and airborne measurements of thermal emission
at Yellowstone. 4:50 p.m.—Bob Smith, University of Utah: A plan for hydrothermal monitoring at
Yellowstone.
Wednesday, May 11, 2016
Unrest at Yellowstone 8:30 a.m.—Jamie Farrell, University of Utah: What do we know about earthquakes at
Yellowstone. An overview of swarms, magnitudes, fault interactions, earthquake families, and why we can’t find LPs (long-period earthquakes).
9:15 a.m.—Chuck Wicks, USGS: Insights from deformation preceding and subsequent to the March 30, 2014 M4.8 earthquake near Norris.
Tools and knowledge applied to eruption forecasting 9:35 a.m.—Kyle Anderson, USGS: Physics-based models for eruption forecasting. 10:05 a.m.—Break

3
10:20 a.m.—Dan Dzurisin, USGS: Setting the stage for the afternoon. What happens before eruptions at calderas? How much do we know?
10:55 a.m.—Sarah Ogburn, USGS: Tools for decision making in eruption forecasting (Event Trees, Expert Elicitation).
11:40 a.m.—Lunch
Eruption forecasting as applied to Yellowstone 1:00 p.m.—Sarah Ogburn, USGS: Volcano databases to improve probabilistic assessments. 1:45 p.m.—Jake Lowenstern and Sarah Ogburn, USGS: Results of elicitation of monitoring
thresholds. Slicing and dicing the results. 3:00 p.m.—Break 3:15 p.m.—Moderated Discussion (Mike Poland [USGS] and Jamie Farrell):
a) What did we learn from the survey? b) How could we make it better? c) What research or methodologies will help us to make progress? d) What tools need to be better integrated to monitoring streams so we can detect
key precursors?
4
The 2015 Upper Geyser Basin Seismic Imaging Experiment
By Jamie Farrell,1 Fan-Chi Lin,1 Sin-Mei Wu,1 Bob Smith1
The Yellowstone hydrothermal system comprises the largest concentration of geysers, hot springs, fumaroles, and hydrothermal explosion craters on the globe. Old Faithful, located in the Upper Geyser Basin of Yellowstone National Park, is the most famous geyser in the world and has been the focus of several geophysical studies in the past. In a series of in situ experiments from 1983 to 1993, probes with pressure and temperature sensors and a video camera were lowered into the Old Faithful conduit and the geometry of the conduit was modeled do to about 22 m beneath the surface (Hutchinson and others, 1997). Between 1991 and 1994, several temporary seismic array deployments (including a 96 station dense single component geophone array) were conducted near Old Faithful to investigate the origin of the pre-eruption harmonic tremor (Kieffer, 1984; Kedar and others, 1996; 1998). More recently, Vandemeulebrouck and others (2013) reinterpreted the dense geophone data and applied beamforming techniques to determine the source location of the geyser tremor noise. Two groups of source locations are identified with the first group within the conduit directly beneath the Old Faithful vent and the second group being slightly off to the side and is thought to be within a larger hot water and steam recharge cavity. However, the exact dimensions and physical properties of the cavity remain largely unclear.
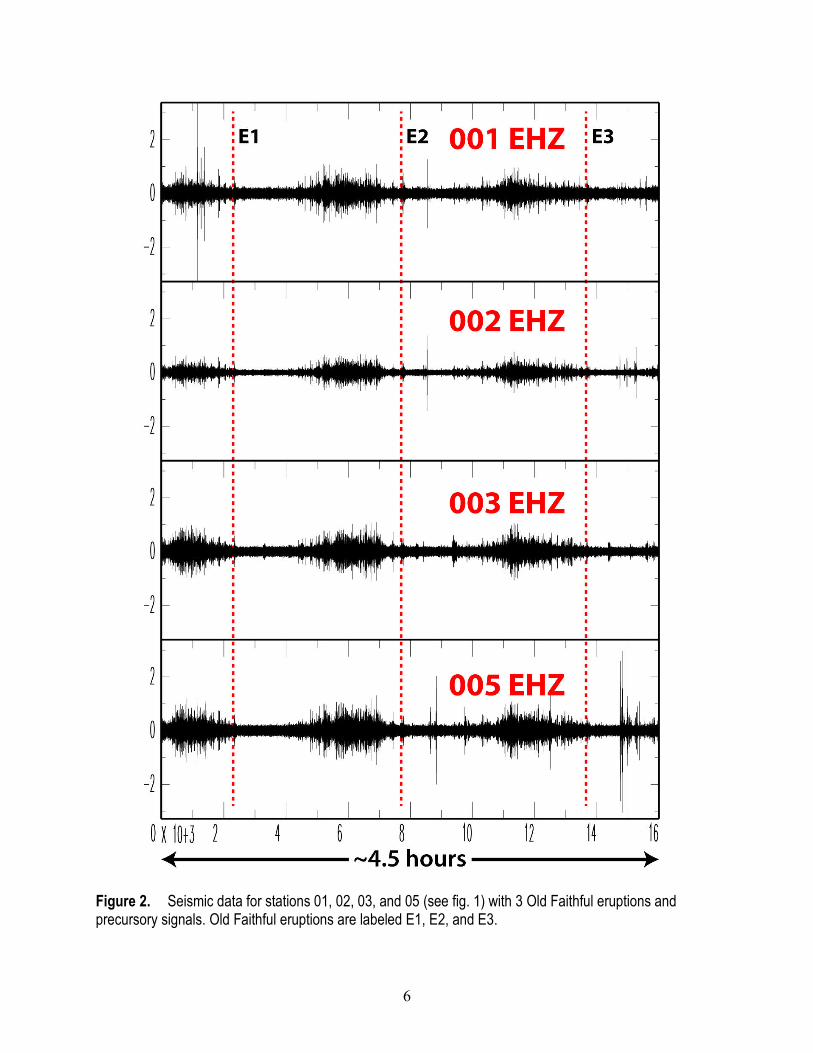
In November 2015, the University of Utah conducted a seismic experiment where 133 new autonomous three-component seismometers were deployed in the Upper Geyser Basin focused on Old Faithful geyser and the surrounding developed areas to evaluate the seismic structure the shallow geotechnical engineering properties (fig. 1). The instruments collected continuous seismic data for two weeks. Preliminary results show unexpected variations in the seismic signature of individual thermal features. The actual Old Faithful geyser eruptions have very little seismic energy, however, about 45 minutes prior to an Old Faithful eruption, hydrothermal tremor begins to develop across the geyser area with amplitudes slowly increasing in time until it reaches a peak about 25 minutes prior to the eruption with slowly decreasing amplitudes until the eruption onset (fig. 2). The seismic signal related to the buildup of Old Faithful reservoir is recorded at stations north, south and to the east of Old Faithful but is missing on stations to the northwest. This suggests a shallow subsurface feature that strongly attenuates the seismic signal immediately NW of the cone of Old Faithful.
Another of the more interesting signals comes from Doublet Pool on Geyser Hill that occurs regularly about every 38 minutes and coincides with visual pulsing of the surface of Doublet Pool. This signal has large seismic wave amplitudes and is recorded throughout the seismic array (fig. 3). The Geyser Hill signal is also affected by the aforementioned subsurface feature NW of the Old Faithful cone.
Interestingly, some of the largest amplitude signals come from cultural noise (cars, etc.) even though the experiment took place after the park was closed to visitors. We will attempt to quantify the cultural energy that is imparted on the hydrothermal system in comparison to natural 1University of Utah

5
signals. With record attendance in and around Yellowstone, and Old Faithful being the most popular stop in the park, it is possible that the seismic noise imparted by visitor activities, as well as visitor services, could have a slight impact on the hydrothermal resource.
Figures
Figure 1. Map of seismic deployment around Old Faithful in the Upper Geyser Basin. Yellow circles show deployed geophones with the numeric name. Red lines are trails and white lines are roads. The red star shows the location of the Old Faithful vent.
6
Figure 2. Seismic data for stations 01, 02, 03, and 05 (see fig. 1) with 3 Old Faithful eruptions and precursory signals. Old Faithful eruptions are labeled E1, E2, and E3.

7
Figure 3. Seismic data for stations 103, 104, 45, 46, 47, 66, and 67 (see fig. 1) for the Geyser Hill signal. Four tremor signals are shown during the ~2.75 hour time period.
References Cited Hutchinson, R.A., Westphal, J.A., and Kieffer, S.W., 1997, In situ observations of Old Faithful
Geyser: Geology, v. 25, p. 875–878. Kedar, S., Sturtevant, B., and Kanamori, H., 1996, The origin of harmonic tremor at Old Faithful
Geyser: Nature, v. 379, p. 708–711. Kedar, S., Kanamori, H., and Sturtevant, B., 1998, Bubble collapse as the source of tremor at Old
Faithful Geyser: Journal of Geophysical Research, v. 103, p. 24283–24299. Kieffer, W.W., 1984, Seismicity at Old Faithful Geyser—An isolated source of geothermal noise
and possible analogue of volcanic seismicity: Journal of Volcanology and Geothermal Research, v. 22, p. 59–95.
Vandemeulebrouck, J., Roux, P., and Cros, E., 2013, The plumbing of Old Faithful Geyser revealed by hydrothermal termor: Geophysical Research Letters, v. 40 no. 10, 1989–1993, doi:10.1002/grl.50422.
8
Multiscale, Multi-property Geophysical Imaging of Hydrothermal Systems, Yellowstone National Park
By W. Steven Holbrook, 1 Bradley Carr,1 Ken Sims,1 Sylvain Pasquet,1 Henry Heasler,2 and Cheryl Jaworowski2
Yellowstone National Park hosts the most active terrestrial hydrothermal system on Earth, with ~10,000 individual features, including the geysers, fumaroles and hot pools that provide the natural beauty that attracts millions of visitors each year. While much is known about the chemistry of the hydrothermal features and about the deep magmatic heat sources that fuel them, a critical knowledge gap exists in the upper ~100 m beneath the surface. We know very little about the details of the plumbing system beneath the park’s iconic geysers and hot springs.
Numerous conceptual models of the Yellowstone hydrothermal system attempt to explain geochemical analyses, but the structural underpinnings of these models are often based on little more than speculation and geologic reasoning. Geophysical methods provide a means to image Yellowstone’s hydrothermal system at depths ranging from 1 m to hundreds of meters, where validation of existing conceptual models is sorely needed.
We examined sites in the Norris Geyser Basin and the Greater Obsidian Pool Thermal Area where neutral chloride and acid sulfate pools exist in close proximity enabling us to investigate the geometry and scale of phase separation. Numerous geophysical methods were acquired at both sites, including: 2D & 3D DC resistivity and self-potential imaging, refraction and surface wave seismic imaging, ground penetrating radar profiling, total field magnetics mapping, shallow multifrequency electromagnetic induction mapping, deep time-domain electromagnetic sounding, and nuclear magnetic resonance sounding. These geophysical methods were integrated to develop the first images of subsurface geophysical properties, groundwater flow pathways, and structural constraints.
1University of Wyoming 2Formerly National Park Service

9
The Hydrothermal Dynamics of Yellowstone Lake (HD-YLAKE) Project: Responses to Tectonic, Magmatic, and Climatic Forcing
By Robert Sohn1
Yellowstone Lake hosts more than 250 sites of hydrothermal discharge on the lake floor, composing one of the major thermal basins within the Park. These vent fields are continually perturbed by a variety of processes spanning a large range of amplitudes and timescales. For example, the stress state of the subsurface matrix hosting hydrothermal flow is perturbed by lake waves with periods of several seconds, intermittent earthquakes and seismic swarms, annual lake level changes, and changing climate stretching back to the last glaciation. The lake also hosts a collection of hydrothermal explosion craters, which are formed when a large volume of hydrothermal fluid percolating through porous rocks flashes to steam in response to a rapid depressurization event, generating an explosion that excavates a large crater. HD-YLAKE, a multi-institutional, National Science Foundation-funded project, seeks to understand the complex cause-and-effect relationships between tectonic, magmatic, and climatic processes with hydrothermal flow beneath the lake by: (1) deploying instrumentation to monitor hydrothermal discharge and forcing mechanisms on the lake floor, (2) acquiring sediment cores that contain a record of forcing and response relationships throughout the post-glacial lake history, and (3) incorporating these results into system-scale models of hydrothermal flow. The project brings together experts in the study and instrumentation of deep-sea vent fields with experts on the Yellowstone hydrothermal system to acquire new types of data from the lake floor and generate new insights into this scientifically important resource that is hidden beneath the lake surface. The project has three field seasons from 2016–2018, and in this talk I will highlight plans for the inaugural 2016 fieldwork.
1Woods Hole Oceanographic Institution

10
What We’ve Learned From 12 Years of Sampling Gas and Water at Yellowstone
By Jacob B. Lowenstern,1 Deborah Bergfeld,1 William C. Evans,1 Shaul Hurwitz,1 and Andrew G. Hunt1
In 2003, we started an extended effort to sample gas discharges at Yellowstone from features such as fumaroles, frying pans (bubbling ground), steaming ground, and hot springs. Surprisingly, very few complete chemical analyses of gas had been published over the 130 years since the area was first explored and preserved as a national park. Our goal was to characterize the geographic variability of gas chemistry, flux, and isotopic compositions. Since 2003, we’ve published a series of peer-reviewed journal articles and data compilations aimed at fulfilling that initial goal (Werner and others, 2008; Evans and others, 2010; Bergfeld and others, 2012, 2014; Lowenstern and others, 2012, 2014, 2015). In this extended abstract, we summarize some of the notable observations made by us and other geoscientists. Much of the discussion is based on the recent review by Lowenstern and others (2015), which provides full references and additional details for those seeking further information.
Early work on geothermal phenomena at Yellowstone focused primarily on the chemistry, geothermometry, and stable isotope systematics of the hot waters found in geyser basins (Fournier, 1989; Nordstrom and others, 2009). The temperatures, mineral-water reactions, and geothermal solute flux were determined by systematic sampling and water chemistry analyses, complementary drilling, and river discharge measurements. A general model emerged of a meteoric-water-dominated groundwater system where long-term water–rock reactions take place between surface-sourced water and rhyolitic rocks present in and around the caldera. The prolific heat flow from the mantle and associated crustal magmatism generate boiling temperatures beneath most thermal areas. Fluid chemistry is controlled by water–rock reactions that create a parent thermal water at elevated temperatures (~340 °C). Boiling and mixing of waters during ascent to the surface could explain most of the variations in water chemistry around the caldera (Fournier, 1989).
More recent studies of gas discharge are somewhat at odds with this simple model, primarily because the very high estimated CO2 flux (45 kilotons per day [kt/d]; Werner and Brantley, 2003) requires that large amounts of deep magmatic and metamorphic gases pass through the hydrothermal system. Thus, gas systematics do not relate simply to boiling, mixing, and other shallow geothermal phenomena (Lowenstern and others, 2015), but rather to open-system throughput of deep gas through a shallow meteoric-dominated system. This process is evident in most acid-sulfate areas where minimal water is discharged at the surface, but diffuse and vent-related gas discharge is considerable (Werner and others, 2008). Though some thermal areas discharge “too much” gas (more than can come from shallow degassing), other areas appear gas-depleted, such as those associated with high-flow springs along the edges of young Central Plateau Member lavas (Morgan and Shanks, 2005; Hurwitz and Lowenstern, 2014).
1U.S. Geological Survey

11
These gas-depleted waters likely experience long flow paths beneath the young lavas, allowing them to lose gas prior to emergence.
Steam is the dominant volatile species in fumaroles, frying pans, and steaming ground, followed by CO2, which typically makes up more than 90 percent of the remainder. Trace gases include H2, CH4, H2S and N2, each of which may dominate at different locales. Other analyzed gases include He, Ar, Ne, NH3 and C2H6. The dry gas to steam ratio (fig. 1) varies over orders of magnitude (~10 percent down to <0.01 percent), yet correlates negatively with the ratio of meteoric (Ar, N2) to deep (He, CO2) gas. We interpret the trend to reflect deep input of CO2-rich gas that is diluted by variable amounts of boiled meteoric geothermal water. Such a process is most likely in high-heat flow areas such as Yellowstone.
Figure 1. Bubble plot of results from gas collected from Yellowstone fumaroles with log (percent Gas) versus log (N2/CO2) and bubble size scaled to log (Ar/He). Steam-rich samples tend to have higher concentrations of atmospheric gases (N2 and Ar) relative to gases with deeper origin, CO2 and He. Fields for magmatic and meteoric fluids are interpretive, and are represented by Mud Volcano and Heart Lake, respectively. The overall trend of Yellowstone fumarole chemistry is inconsistent with generation of gases in different areas by progressive boiling of a parent thermal water (batch and Rayleigh degassing processes shown). From Lowenstern and others (2015).
Stable carbon isotope ratios and CO2/3He of collected gases reflect a mantle source of CO2 with δ13C of –3.4 per mil, somewhat heavier than mid-ocean ridge basalt (MORB) but
12
consistent with other major hotspot volcanoes such as Etna and Nyiragongo (Lowenstern and others, 2015). Helium isotope ratios also reflect a hotspot origin: at Mud Volcano, they reach 16 times the atmospheric ratio (Ra). However, ratios drop precipitously in some locations due to addition of crustal 4He. This radiogenic gas may have resided for hundreds of millions of years within Archaean crust that underlies Yellowstone, to then be degassed over the past 2 million years (Lowenstern and others, 2014).
Future research should focus upon temporal variations in gas discharge and chemical composition. Geophysical models for swarms and uplift/subsidence cycles commonly incorporate pressurization (and release) of gas and aqueous fluid. It seems likely that a comprehensive effort to quantify variations in gas output, chemistry, and isotope systematics will allow us to test various hypotheses and understand cycles of caldera unrest.
References Cited Bergfeld, D., Evans, W.C., Lowenstern, J.B., and Hurwitz, S., 2012, Carbon dioxide and
hydrogen sulfide degassing and cryptic thermal input to Brimstone Basin: Chemical Geology, v. 330-331, p. 233–243.
Bergfeld, D., Lowenstern, J.B., Hunt, A.G., Shanks, Evans, W.C., 2014, Gas and isotope chemistry of thermal features from Yellowstone National Park, Wyoming (ver. 1.1, September 2014): U.S. Geological Survey Scientific Investigations Report 2011–5012, 26 p.
Evans, W.C., Bergfeld, D., McGeehin, J.P., King, J.C., and Heasler, H., 2010, Tree-ring 14C links seismic swarm to CO2 spike at Yellowstone, USA: Geology, v. 38, p. 1075–1078.
Fournier, R.O., 1989, Geochemistry and dynamics of the Yellowstone National Park Hydrothermal System: Annual Reviews of Earth and Planetary Science, v. 17, p. 13–53.
Hurwitz, S., and Lowenstern, J.B., 2014, Dynamics of the Yellowstone hydrothermal system: Reviews of Geophysics, v. 52, no. 3, p. 375–411, doi:10.1002/2014RG000452.
Lowenstern, J.B., Bergfeld, D., Evans, W.C., and Hurwitz, S., 2012. Generation and evolution of hydrothermal fluids at Yellowstone—insights from the Heart Lake Geyser Basin: Geochemistry, Geophysics, Geosystems, v. 13, Q01017, http://dx.doi.org/10.1029/ 2011GC003835.
Lowenstern, J.B., Evans, W.C., Bergfeld, D., and Hunt, A.G., 2014. Prodigious degassing of a billion years of accumulated radiogenic helium at Yellowstone: Nature, v. 506, p. 355–358.
Lowenstern, J.B., Evans, W.C., Bergfeld, D., and Hunt, A.G., 2015, Origin of Geothermal Gases at Yellowstone: Journal of Volcanology and Geothermal Research, v. 302, p. 87–101.
Morgan, L. A., and Shanks, W.C., 2005, Influences of rhyolitic lava flows on hydrothermal processes in Yellowstone Lake and on the Yellowstone Plateau, in Inskeep, W.P. and McDermott, T.R., eds., Geothermal Biology and Geochemistry in Yellowstone National Park: Bozeman, Mont., Montana State University Thermal Biology Institute, p. 31–52.
Nordstrom, D.K., McCleskey, R.B., and Ball, J.W., 2009, Sulfur geochemistry of hydrothermal waters in Yellowstone National Park—IV Acid-sulfate waters: Applied Geochemistry, v. 24, p. 191–207.
Werner, C., and Brantley, S., 2003, CO2 emissions from the Yellowstone volcanic system: Geochemistry, Geophysics, Geosystems, v. 4, no. 7, http://dx.doi.org/10.1029/2002GC000473.
Werner, C., Hurwitz, S., Evans, W.C., Lowenstern, J.B., Bergfeld, D., Heasler, H., Jaworowski, C., and Hunt, A., 2008, Volatile emissions and gas geochemistry of Hot Spring Basin, Yellowstone National Park, USA: Journal of Volcanology and Geothermal Research, v. 178, p. 751–762.

13
Status and Future Directions of the Chloride Flux Program
By R. Blaine McCleskey1 and Jacob B. Lowenstern1
Yellowstone National Park (YNP) was established due to its large number of geysers, hot springs, mud pots, and steam vents. Monitoring Yellowstone’s geothermal system is difficult owing to the presence of over 10,000 geothermal features distributed across 2.2 million acres. However, the chloride flux in the major rivers in YNP has been used as a surrogate for estimating the integrated heat flow in geothermal systems (Ellis and Wilson, 1955; Fournier, 1989) because geothermal waters contain high concentrations of chloride and water discharged from these geothermal features eventually enters major rivers. The U.S. Geological Survey (USGS) and the National Park Service (NPS) have collaborated on monitoring chloride flux in YNP rivers since the 1970s (Fournier and others, 1976; Norton and Friedman, 1985; Hurwitz and others, 2007a; McCleskey and others, 2012).
Monitoring thermal activity is an important tool for managing YNP. The Yellowstone Supervolcano is located in YNP and having a long-term chloride flux baseline and timely monitoring is central to hazard assessment. Monitoring YNP’s geothermal activity potentially yields insights into a variety of research, management, and safety topics including the effects of earthquakes (Norton and Friedman, 1985), climate change, and the effect of inflation/deflation of the magma chamber on geothermal activity. In addition, the amount of water and heat released during geyser eruptions and the effects of storm events can be quantified by continuously monitoring the chloride flux in rivers (McCleskey and others, 2012).
There are several long-term chloride flux monitoring sites (fig. 1) located at or near USGS gages. In the past, chloride concentration has been determined in discrete water samples collected by researchers and volunteers. However, the great distances between sites and accessibility challenges, especially during the winter, limit the number of samples collected annually to about 28 per site. Staffing changes and funding limitations have created large data gaps at some of the monitoring sites (Hurwitz and others, 2007b).
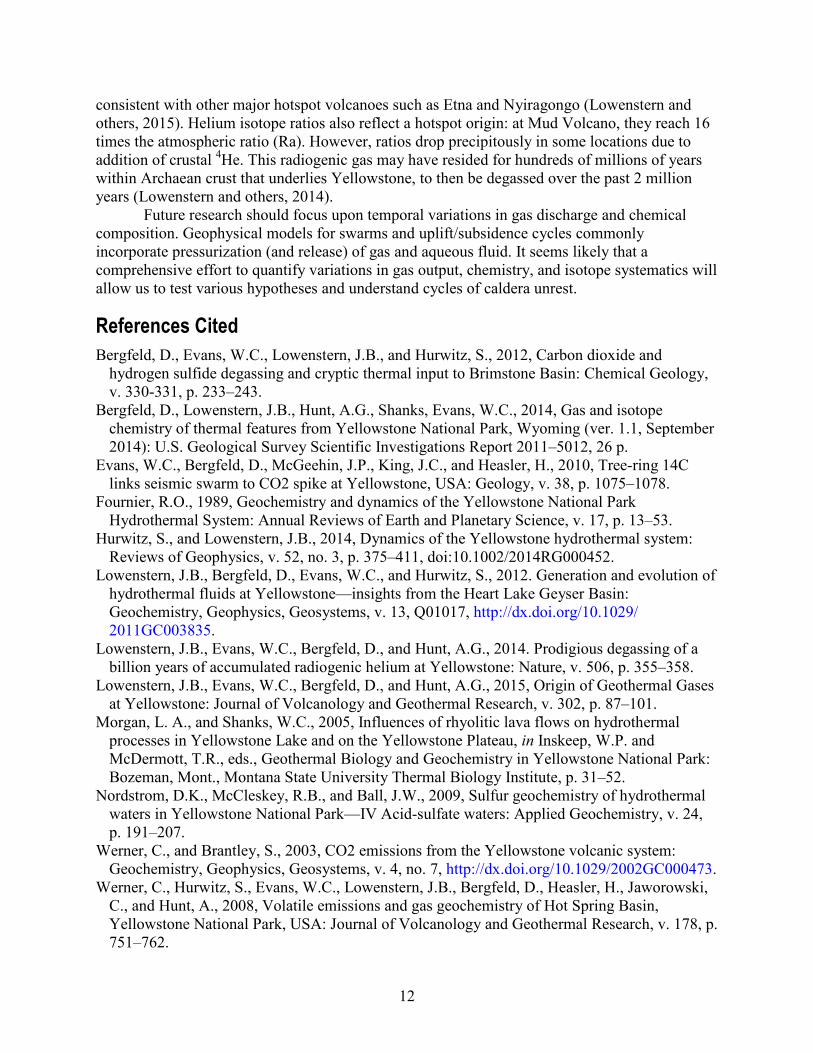
Since 2010, USGS and NPS researchers have been collaborating on a study to quantify the relationship between electrical conductivity and chloride at the Madison, Gibbon, Firehole, Gardner, Yellowstone, and Snake River monitoring sites (fig. 1). The electrical conductivity–chloride correlations (R2>0.97) in the Madison, Firehole, Gibbon, Snake, Gardner, and Yellowstone Rivers are shown figure 2. Electrical conductivity also correlates (R2>0.9) with Na, SO4, F, HCO3, SiO2, K, Li, Ca, B and As in several YNP rivers. In effect, one simple measurement of electrical conductivity gives an excellent estimate of the overall water composition within the correlations demonstrated in this study. Finally, the annual chloride flux can be calculated using electrical conductivity as a surrogate for chloride (fig. 3).
Determining the geothermal flux using electrical conductivity provides a cost- and labor-effective alternative to previous protocols whereby chloride flux was estimated through manual collection of numerous water samples and subsequent chemical analysis. Continuous conductivity measurements are relatively straight forward, reliable, and inexpensive. There are 1U.S. Geological Survey

14
several potential advantages of using electrical conductivity monitoring in YNP: (1) real-time flux estimations can be made (no delay for chemical analyses); (2) high-frequency data (35,000 measurements per year) allows chemical effects of short term events such as geyser eruptions, rain events, and earthquakes on rivers to be quantified; (3) it functions as a surrogate for several geothermal solutes, in addition to chloride, providing a much greater understanding of the thermal discharge and its effects on the Yellowstone ecosystem and downstream communities; and (4) water-quality in two popular swimming holes (Firehole Canyon and Gardiner River at the Boiling River confluence) can readily be determined.
Figure 1. Map of long-term chloride flux monitoring sites. R., River; Cr., Creek.
Future work will focus on the main rivers draining southwest Yellowstone. The Falls River and Henrys Fork are the two remaining sites where the electrical conductivity method needs to be developed. Because southwestern YNP is comparatively inaccessible (fig. 1) and much of the area is remote, electrical conductivity–chloride correlations have not yet been developed and continuous electrical conductivity monitoring has not been initiated. Furthermore, the monitoring sites in southwest YNP have the largest data gaps despite the chloride flux emanating from southwest YNP being a substantial portion (~12 percent) of the total chloride leaving the park (Hurwitz and others, 2007a).
15
0
10
20
30
40
50
60
70
80
90
0
10
20
30
40
50
60
70
80
0 100 200 300 400 500 600 700 800 9000
10
20
30
40
50
60
70
80
0 100 200 300 400 500 600 700 800 900 1000
Chl
orid
e (m
g/L)
Madison RiverR² = 0.998
Chl
orid
e (m
g/L)
Firehole RiverR² = 0.997
Electrical Conductivity (mS/cm)
Chl
orid
e (m
g/L)
Gibbon RiverR² = 0.999
Yellowstone River at Corwin SpringsR² = 0.974
Gardner RiverR² = 0.983
Electrical Conductivity (mS/cm)
Snake RiverR² = 0.987
Figure 2. Plots of chloride-electrical conductivity correlations for six Yellowstone National Park river monitoring sites.

16
1980 1985 1990 1995 2000 2005 2010 20150
5
10
15
20
25
30
Electrical Conductivity Method
Hurwitz and others (2007)
Madison River
Yellowstone River
Friedmand and Norton (2007)
Chl
orid
e Fl
ux (k
t/yr)
Snake River
Figure 3. Plot of annual chloride flux in the Madison, Yellowstone, and Snake Rivers. kt/yr, kilotons per year; R., River.
References Cited Ellis, A.J., and Wilson, S.H., 1955, The heat from the Wairakei–Taupo thermal region calculated
from the chloride output: New Zealand Journal of Science and Technology, v. B36, p. 622–631.
Fournier, R.O., 1989, Geochemistry and dynamics of the Yellowstone National Park hydrothermal system: Annual Reviews of Earth and Planetary Science, v. 17, p. 13–53.
Fournier, R.O., White, D.E., and Truesdell, A.H., 1976, Convective heat flow in Yellowstone National Park, in Proceedings of the second United Nations Symposium on the Development and Use of Geothermal Resources, May 20–29, 1975, San Francisco: Washington, D.C., U.S. Government Printing Office, p. 731–739.
Friedman, I., and Norton, D.R., 2007, Is Yellowstone losing its steam? Chloride flux out of Yellowstone National Park, in Morgan, L.A., ed., Integrated geoscience studies in the Greater Yellowstone Area—Volcanic, Hydrothermal and tectonic Processes in the Yellowstone Geoecosystem: U.S. Geological Survey Professional Paper 1717, p. 275–297.
Hurwitz, S., Eagan, S., Heasler, H., Mahony, D., Huebner, M.A., and Lowenstern, J.B., 2007a, River chemistry and solute flux in Yellowstone National Park. U.S. Geological Survey Data Series 278, Version 3.0.
Hurwitz, S., Lowenstern, J.B., and Heasler, H.P., 2007b, Spatial and temporal geochemical trends in the hydrothermal system of Yellowstone National Park—Inferences from river solute fluxes: Journal of Volcanology and Geothermal Research, v. 162, p. 149–171.
McCleskey, R.B., Clor, L.E., Lowenstern, J.B., Evans, W.C., Nordstrom, D.K., Heasler, H., and Huebner, M.A., 2012, Solute and geothermal flux monitoring using electrical conductivity in the Madison, Firehole, and Gibbon Rivers, Yellowstone National Park: Applied Geochemistry, v. 27, no. 12, p. 2370–2381.
Norton, D.R., and Friedman, I., 1985, Chloride flux out of Yellowstone National Park. Journal of Volcanology and Geothermal Research, v. 26, no. 3–4, p. 231–250.
17
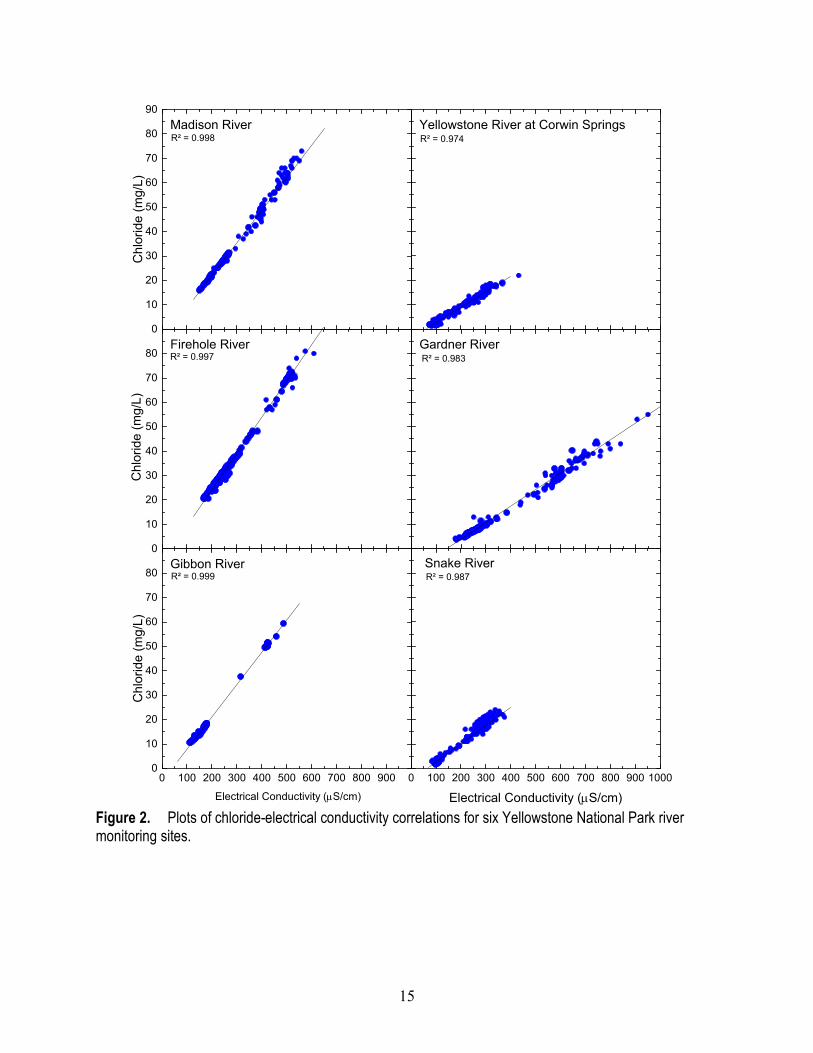
Continuous Monitoring of Hydrothermal CO2 and Heat Emissions Using the Eddy Covariance Method at Norris Geyser Basin, Yellowstone National Park
By Jennifer L. Lewicki1
Eddy covariance (EC) is a micrometeorological technique traditionally used to measure fluxes of gas and heat between a plant canopy and the atmosphere. Studies over the past decade, however, have demonstrated that EC is a viable method to measure magmatic and hydrothermal CO2 emissions from soil (diffuse) and vent (point) sources. Preliminary findings have also suggested that EC may be used to quantify the hydrothermal component of total heat flux, but more work is required to refine the technique. EC determines the net vertical turbulent flux of a scalar (for example, gas, heat) by measuring the temporal covariance of the scalar and vertical wind velocity measured at a fixed height above the ground surface. The method utilizes a fast-response (≥10 Hertz) CO2–H2O analyzer and three-dimensional sonic anemometer to measure fluctuations in atmospheric CO2 and H2O concentrations, temperature, and wind speed in three directions, from which average half-hourly CO2 and heat fluxes are calculated. Using CO2 flux as an example, each value in a time series is a weighted sum of surface CO2 fluxes over an upwind land area. A unique “source weight function” describing the relative contribution of each element of upwind surface CO2 flux to the total measured EC CO2 flux can be modeled based on measured atmospheric parameters. Finally, by carrying out an inversion of the time series of the measured CO2 fluxes and corresponding modeled source weight functions, it is possible to model the “best-fit” distribution of surface CO2 fluxes and calculate a total CO2 emission rate (in tons per day) from the study area. Overall, the EC technique uniquely provides the attributes of automated, continuous, and time- and space-averaged measurements of CO2 and heat fluxes from moderate-size (square meter- to square kilometer-scale) land areas in volcanic and hydrothermal systems.
An EC system was deployed on May 14, 2016 in the northeastern part of the Norris Geyser Basin in Yellowstone National Park as part of a study intended to quantify gas and heat emissions and their temporal variability. The EC system will measure CO2 and sensible and latent heat fluxes, along with a set of ancillary environmental parameters, on a half-hourly basis over a period of approximately 5 months. Based on preliminary analysis of the first 3 weeks of EC data, the mean plus or minus the standard deviation of hydrothermal CO2 was 171.1±72.6 grams per square meter per day and the total (hydrothermal and background solar) sensible and latent heat fluxes were 130.6±58.7 watts per square meter (W/m2) and 249.2±109.4 W/m2, respectively. Diurnal variations in the time series were characterized. The ~5-month-long time series will be used to: (1) characterize diurnal to seasonal variations in gas and heat emissions and their correlation with changes in environmental parameters and potential regional seismic or hydrothermal activity; (2) develop a method to quantify the hydrothermal components of the
1U.S. Geological Survey

18
total measured sensible and latent heat fluxes; (3) integrate the EC CO2 flux time series with atmospheric H2S/CO2 ratios measured by a nearby Multi-GAS system to quantify the temporal variability of H2S fluxes; and (4) calculate the average (~5-month) total hydrothermal CO2 and sensible and latent heat emission rates from the study area.
19
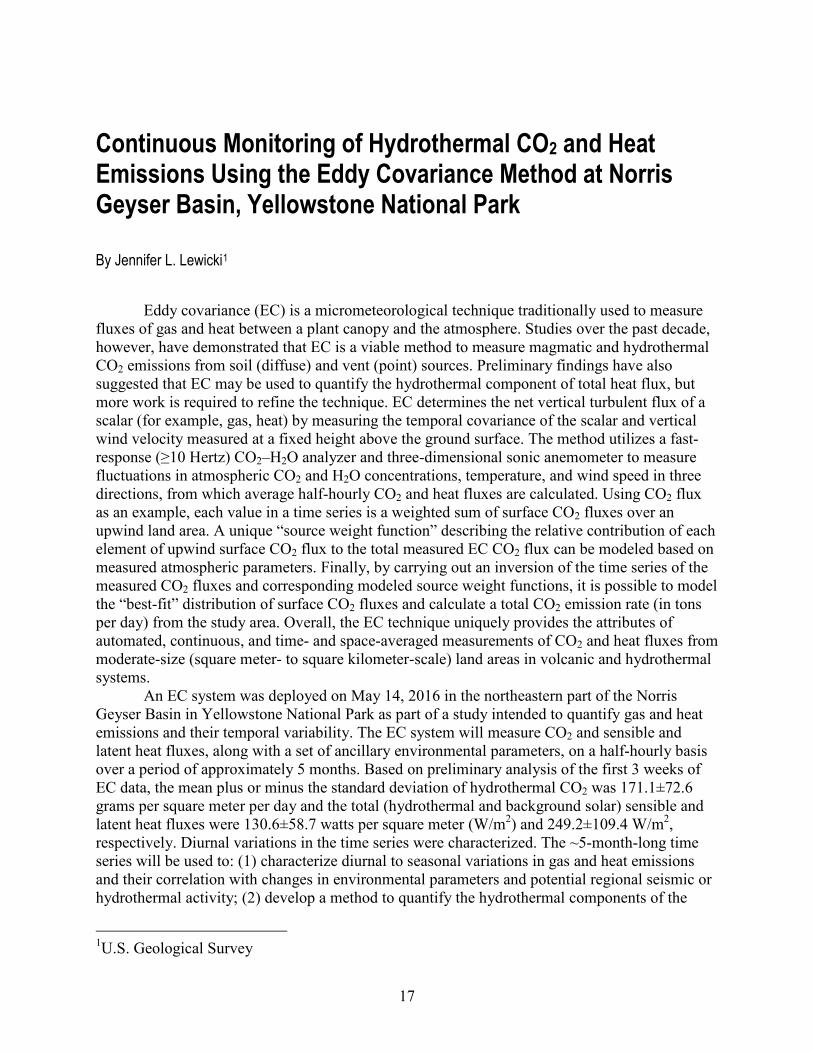
Satellite and Airborne Measurements of Thermal Emission at Yellowstone
By R. Greg Vaughan1
The largest geothermal system in the world, located at Yellowstone National Park, is the surface manifestation of a partly molten magma reservoir that exists beneath the 630,000-year-old Yellowstone Caldera. Magmatic heat and volatiles transferred into the overlying rock and groundwater reservoirs, combined with abundant seismic activity, result in an impressive display of >10,000 thermal features at the surface. The purpose of thermal monitoring in Yellowstone is to document baseline geothermal activity so that significant changes can be recognized should they ever occur—changes that may be related to tectonic or magmatic processes, seasonal hydrologic cycles, or human activities. This information is relevant to (1) monitoring a potentially active volcanic system and (2) supporting decisions for park development, resource protection, and visitor safety. Thermal monitoring is a challenge in Yellowstone because there are so many thermal features that range widely in size and temperature, and they are spread out over a large and mostly inaccessible area.
Satellite-based thermal infrared (TIR) remote sensing data from the Advanced Spaceborne Thermal Emission and Reflection Radiometer (ASTER) and the Landsat 8 Thermal Infrared Sensor have been used to map the location and spatial extent of active thermal areas, to generate thermal anomaly maps, and to quantify thermal monitoring metrics (for example, surface temperature, geothermal radiant emittance, and geothermal radiant heat output), both locally and for the entire geothermal system. In addition, high-spatial-resolution airborne TIR data (1-m pixels) that are occasionally acquired over individual thermal areas provide more spatial details and more accurate thermal metrics than can be achieved with moderate spatial resolution satellite TIR data (90- to 100-m pixels).
Thermal anomaly maps derived from the remote sensing data have been used to assess and update field-based thermal area maps, identify and map gradations in heat flux within thermal areas, and differentiate between thermally emissive and cold degassing thermal areas; they could be used to detect future changes in thermal areas. These data have also been used to estimate the geothermal radiant emittance from each thermal area, which ranges from 7 to 70 watts per square meter (W/m2), and the total geothermal radiant heat output from the entire geothermal system, which is about 2 gigawatts (GW).
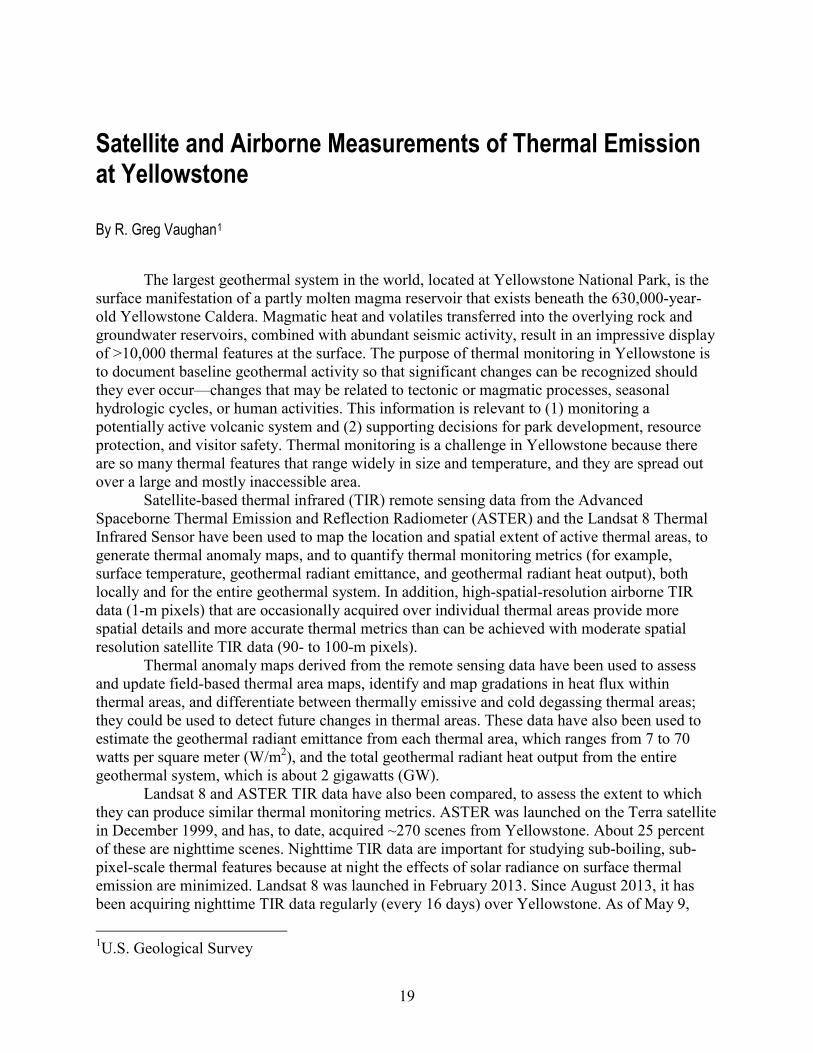
Landsat 8 and ASTER TIR data have also been compared, to assess the extent to which they can produce similar thermal monitoring metrics. ASTER was launched on the Terra satellite in December 1999, and has, to date, acquired ~270 scenes from Yellowstone. About 25 percent of these are nighttime scenes. Nighttime TIR data are important for studying sub-boiling, sub-pixel-scale thermal features because at night the effects of solar radiance on surface thermal emission are minimized. Landsat 8 was launched in February 2013. Since August 2013, it has been acquiring nighttime TIR data regularly (every 16 days) over Yellowstone. As of May 9, 1U.S. Geological Survey
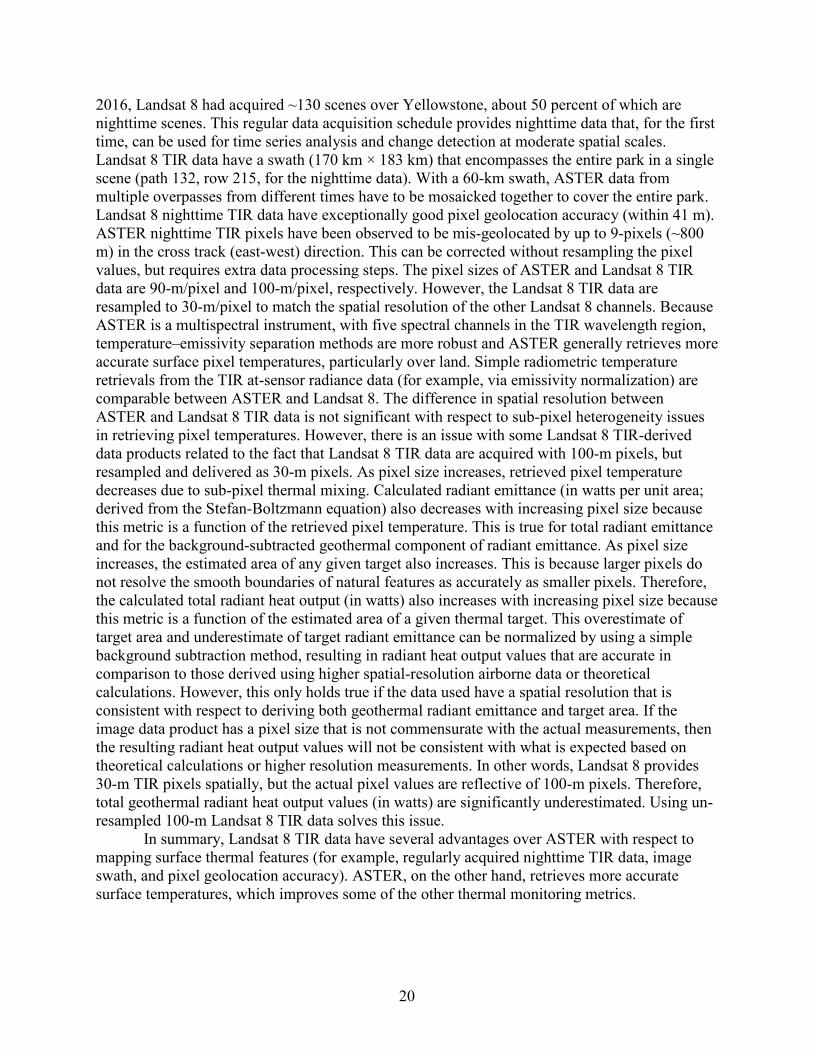
20
2016, Landsat 8 had acquired ~130 scenes over Yellowstone, about 50 percent of which are nighttime scenes. This regular data acquisition schedule provides nighttime data that, for the first time, can be used for time series analysis and change detection at moderate spatial scales. Landsat 8 TIR data have a swath (170 km × 183 km) that encompasses the entire park in a single scene (path 132, row 215, for the nighttime data). With a 60-km swath, ASTER data from multiple overpasses from different times have to be mosaicked together to cover the entire park. Landsat 8 nighttime TIR data have exceptionally good pixel geolocation accuracy (within 41 m). ASTER nighttime TIR pixels have been observed to be mis-geolocated by up to 9-pixels (~800 m) in the cross track (east-west) direction. This can be corrected without resampling the pixel values, but requires extra data processing steps. The pixel sizes of ASTER and Landsat 8 TIR data are 90-m/pixel and 100-m/pixel, respectively. However, the Landsat 8 TIR data are resampled to 30-m/pixel to match the spatial resolution of the other Landsat 8 channels. Because ASTER is a multispectral instrument, with five spectral channels in the TIR wavelength region, temperature–emissivity separation methods are more robust and ASTER generally retrieves more accurate surface pixel temperatures, particularly over land. Simple radiometric temperature retrievals from the TIR at-sensor radiance data (for example, via emissivity normalization) are comparable between ASTER and Landsat 8. The difference in spatial resolution between ASTER and Landsat 8 TIR data is not significant with respect to sub-pixel heterogeneity issues in retrieving pixel temperatures. However, there is an issue with some Landsat 8 TIR-derived data products related to the fact that Landsat 8 TIR data are acquired with 100-m pixels, but resampled and delivered as 30-m pixels. As pixel size increases, retrieved pixel temperature decreases due to sub-pixel thermal mixing. Calculated radiant emittance (in watts per unit area; derived from the Stefan-Boltzmann equation) also decreases with increasing pixel size because this metric is a function of the retrieved pixel temperature. This is true for total radiant emittance and for the background-subtracted geothermal component of radiant emittance. As pixel size increases, the estimated area of any given target also increases. This is because larger pixels do not resolve the smooth boundaries of natural features as accurately as smaller pixels. Therefore, the calculated total radiant heat output (in watts) also increases with increasing pixel size because this metric is a function of the estimated area of a given thermal target. This overestimate of target area and underestimate of target radiant emittance can be normalized by using a simple background subtraction method, resulting in radiant heat output values that are accurate in comparison to those derived using higher spatial-resolution airborne data or theoretical calculations. However, this only holds true if the data used have a spatial resolution that is consistent with respect to deriving both geothermal radiant emittance and target area. If the image data product has a pixel size that is not commensurate with the actual measurements, then the resulting radiant heat output values will not be consistent with what is expected based on theoretical calculations or higher resolution measurements. In other words, Landsat 8 provides 30-m TIR pixels spatially, but the actual pixel values are reflective of 100-m pixels. Therefore, total geothermal radiant heat output values (in watts) are significantly underestimated. Using un-resampled 100-m Landsat 8 TIR data solves this issue.
In summary, Landsat 8 TIR data have several advantages over ASTER with respect to mapping surface thermal features (for example, regularly acquired nighttime TIR data, image swath, and pixel geolocation accuracy). ASTER, on the other hand, retrieves more accurate surface temperatures, which improves some of the other thermal monitoring metrics.

21
Yellowstone Hydrothermal Systems: Public Safety, Science and Recommendation
By Bob Smith,1 Jamie Farrell,1 Keith Koper,1 and Fred Massin2
Thousands of persons visit Yellowstone’s famous geysers, hot springs, mud pots, and fumaroles and are therefore exposed to the boiling water, steam eruptions and explosion hazards. Hydrothermal explosions, dangerously hot ground temperatures on footpaths, and development of new thermal features are commonly observed in Yellowstone in addition to the potential for the release of toxic quantities of carbon dioxide and/or hydrogen sulfide gas. The University of Utah recommends the installation of hydrothermal monitoring systems at front country hydrothermal areas that will be able to detect unusual thermal, seismic, deformation, gas, etc. activity and provide real-time data to the National Park Service to respond appropriately in case of unusual observations and features. The data will locally recorded by MEMS, microelectromechanical sensor nodes, telemetered via real-time on L1 and L2 GPS systems at UNAVCO and telemetered via the UUSS seismic telemetry system (fig. 1). This will allow for the long-term determination of long term background activity associated with geyser eruptions, precipitation, and seasonal water cycles that can be compared with unexpected changes in the above parameters. Moreover the acquired data can be used to model and interpret hydrothermal processes advancing an understanding of the physics and chemistry of hydrothermal features that are necessary to develop working models of Yellowstone hydrothermal systems. An example of a hydrothermal monitoring system for Norris Geyser Basin is shown in figure 2. The seismic-acoustic data can be telemetered using a similar telemetry system as the University of Utah Seismograph Station telemetry network and GPS data can be telemetered through the PBO network to be sent to UNAVCO for processing and archiving. The gas sensor systems can be transmitted to the USGS, Menlo Park for recording and analysis. MEMS logging systems provide low-cost, with minimum environmental footprints, with independent photovoltaic power supplies and easily retrievable data. We therefore recommend that a joint YVO-NPS working group, and other interested parties, be convened to formulate a work plan and seek funding sources for the implementation of a real-time hydrothermal monitoring plan for Yellowstone National Park.
1University of Utah 2Swiss Federal Institute of Technology

22
Figures
Figure 1. Example of a MEMS setup for hydrothermal monitoring.
Figure 2. Example of a typical seismic, acoustic and GPS network layout for hydrothermal monitoring at Norris Geyser Basin with a local MEMS recording system and links to UUSS telemetry at the Norris seismic station.

23
What Do We Know About Earthquakes at Yellowstone: An Overview of Swarms, Magnitudes, Fault Interactions, Earthquake Families, and Why We Can’t Find Long-Period Events
By Jamie Farrell1 and Bob Smith1
The Yellowstone area averages about 1,500 to 2,000 earthquakes per year, making it one of the most seismically active regions in the western U.S. interior. People have been reporting felt earthquakes in Yellowstone since the early explorers started visiting the region in the 1800s, so intense that geologist F.V. Hayden in 1871 named northern Yellowstone Lake, earthquake camp. With today’s modern seismic network, we are able to record and locate earthquakes in real-time and disseminate the information to stakeholders such as Yellowstone National Park (YNP) and the U.S. Geological Survey (USGS) as well as scientists interested in research in addition to the general public.
The seismic network in Yellowstone was originally installed and operated by the USGS in the early 1970s until it was shut down in the early 1980s. The University of Utah took over the network in 1983 and has operated it ever since with continuous upgrades in number, quality, and reliability of stations. Today the Yellowstone Seismic Network (YSN) is one of the most modern volcano centric seismic networks in the world.
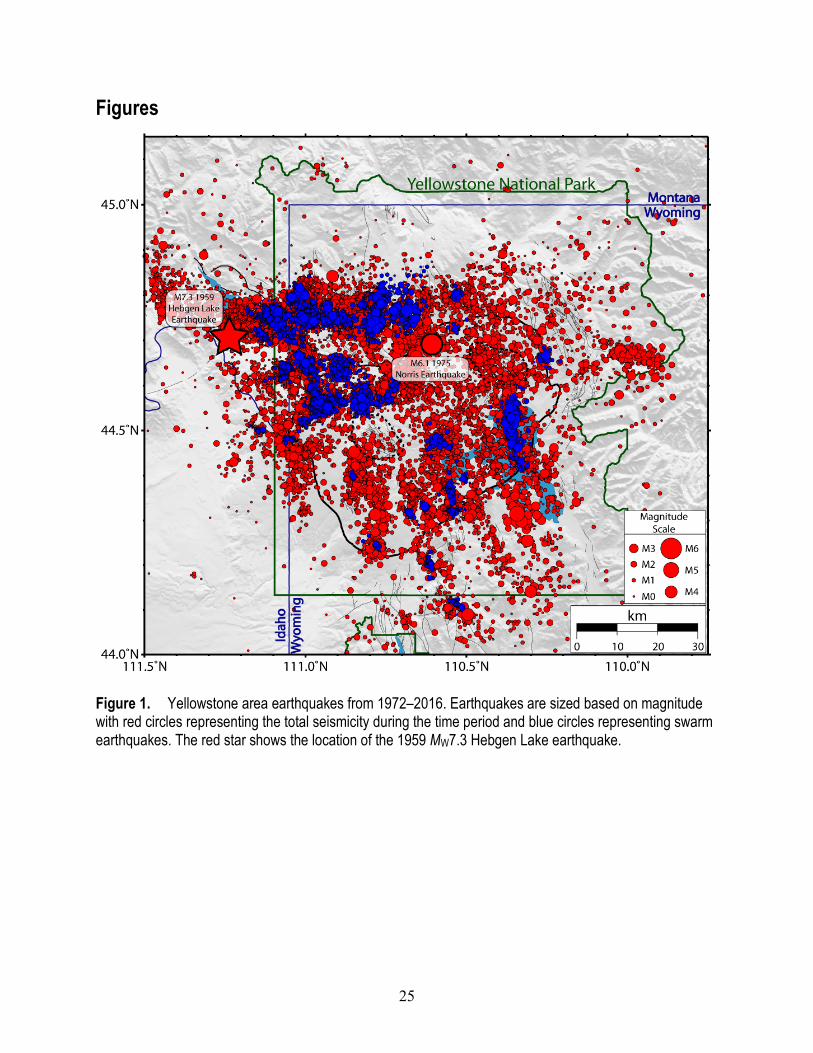
From 1972 to 2016, Yellowstone has experienced over 44,000 earthquakes including one M6 event, two M5 events, 28 M4 events, and 364 M3 events (fig. 1). This includes the 1975 M6.1 Norris event located just SE of Norris Geyser Basin on the 0.64 Ma Yellowstone Caldera boundary, which caused numerous rock-falls and affected the Yellowstone hydrothermal system including the formation of two new geysers. Prior to the installation of the YSN, the region experienced the 1959 M7.3 Hebgen Lake earthquake located just west of YNP near Hebgen Lake, Montana. The Hebgen Lake earthquake, the largest in the Intermountain West, ruptured the Hebgen Lake and the Red Mountain faults and triggered the Madison Canyon landslide, which damned the Madison River and formed Earthquake Lake. In total, 28 people died due to this earthquake with most being buried beneath the above-mentioned landslide. The shaking had profound effects on nearby YNP including changes to the hydrothermal system, major rock-falls along the roadways, and major damage the famous Old Faithful Inn.
About half of Yellowstone earthquakes occur during earthquake swarms, a common mode of seismicity in volcanic areas where there is a burst of earthquakes in a relatively small time-period and geographic area. From 1985 to 2016, we have identified 389 individual swarms comprised of 20,290 swarm events (figs. 1, 2). Some of the largest swarms coincide with a change in caldera deformation such as the 1985 swarm (the largest swarm identified in Yellowstone), the 2008–2009 Yellowstone Lake swarm, the 2010 Madison Plateau swarm, and
1University of Utah

24
the 2013–2014 Norris area swarm sequence (fig. 2). Many of these aforementioned swarms have been attributed to the movement of fluids in the subsurface.
This is demonstrated during the 2013–2014 Norris area swarm sequence where swarm activity began west of Norris Geyser Basin (NGB) in September 2013 and continued around the NGB through June 2014. During this time period, 16 individual swarms were identified with the largest one occurring during March 27–April 1, 2014 north of the NGB. This swarm included the March 30 M4.8 Norris area event, the largest earthquake in Yellowstone for over 30 years. Prior to this event, the Norris area had been inflating at high rates for ~6 months with a drastic change to subsidence coincident with the M4.8 earthquake (fig. 2). In addition, during this time period, the caldera changed from subsidence to renewed inflation showing the relationship between seismicity and deformation in Yellowstone both at local scales (Norris area) and over broader regions (caldera wide).
Moreover, hundreds of earthquakes were triggered in the Yellowstone area due to the passage of the surface waves from the 2002 M7.9 Denali Fault earthquake that occurred in Alaska ~3,000 km away. In addition to triggered earthquakes, the Denali Fault earthquake surface waves also changed the nature of many hydrothermal features in Yellowstone. Eruption intervals at many geysers were altered after the Denali Fault earthquake intervals at Riverside geyser and Daisy geyser decreasing by ~15 minutes and ~32 minutes respectively after the passage of the surface waves. These eruption intervals slowly recovered during the following months.
Even though long period (LP) earthquakes, events that are deficient in energy above 5 Hz, have been recorded in other active volcanic areas, including the Long Valley caldera, there is no evidence of LP earthquakes in Yellowstone.
Overall, earthquakes play a major role in the formation and continued existence of Yellowstone’s world famous hydrothermal systems. Without periodic ground shaking, these systems would clog due to mineral precipitation from saturated hydrothermal waters.
The hazard of large amplitude ground shaking from an earthquake in or nearby Yellowstone remains the dominant geologic hazard for the region. Effects from seismic activity in Yellowstone does not only apply to human activity but also the natural resource itself and the more we can monitor and study seismic activity the better we can understand and mitigate its resulting effects in Yellowstone.
25
Figures
Figure 1. Yellowstone area earthquakes from 1972–2016. Earthquakes are sized based on magnitude with red circles representing the total seismicity during the time period and blue circles representing swarm earthquakes. The red star shows the location of the 1959 MW7.3 Hebgen Lake earthquake.

26
Figure 2. Histogram showing the amount of total earthquakes (red) and swarm earthquakes (blue) from 1972–2016. Black and green lines show vertical deformation through time in the caldera and Norris area, respectively.

27
Recent InSAR Studies at Yellowstone
By Chuck Wicks,1 Daniel Dzurisin,1 Peter F. Cervelli,1 Jacob B. Lowenstern,1 Wendy K. Stovall,1 and David R. Shelly1
We present ongoing InSAR related research covering three topics in the Yellowstone volcanic system: (1) uplift near the north rim of the caldera related to the March 30, 2014 MW 4.8 earthquake: (2) deformation near the north end of Yellowstone Lake related to snow and water loading: and (3) a persistent deformation anomaly near Hebgen Lake.
Uplift of the Norris area that began in the autumn of 2013 (with a possible precursor in midsummer of 2013) switched to subsidence after the March 30, 2014 MW 4.8 earthquake that occurred near the area of peak uplift. We model the deformation measured by global positioning system (GPS) instruments (continuous and semi-continuous) and TerraSAR-X (TSX) interferograms spanning 2012 to June 2014 with a lens-like source near 6-km depth, north of the north caldera rim and beneath Norris Geyser Basin. We interpret this source as an accumulation of fluids derived from a deeper magma body. We speculate that the fluids accumulated near the top of the brittle/ductile transition and the MW 4.8 earthquake caused the fluid reservoir seal to rupture. Only the GPS data measure the peak inflation of the reservoir, whereas the InSAR data measure about 60 percent of the inflation. We interpret anomalous short-spatial-wavelength signals in one of the TSX interferograms to be the result of fluid migration from the reservoir into the crust. In this interferogram, the fluid appears to have migrated mostly to the west of the uplift area, and some InSAR signals indicate fluid intrusion into mapped faults.
An ERS2 interferogram from June 5, 2011, to July 2, 2011, shows a brief excursion to caldera uplift during a long period (2010 through 2013) of caldera subsidence. The uplift, locally more than 2 cm, was concentrated on and near the resurgent domes. During this same time period the land near the north end of Yellowstone Lake appears to have subsided. Continuous GPS (CGPS) station WLWY, on the east side of the Sour Creek dome, shows over 10 mm of uplift in the time spanned by the interferogram, and CGPS station LKWY, about 1 km north of the Yellowstone Lake shoreline, shows about 10 mm of subsidence. By comparing the GPS signals to the water level gage at the outlet of Yellowstone Lake, the anomalous uplift seen in the interferogram and at station WLWY is interpreted to be the result of unloading from snow melt. The subsidence signal around the north end of Yellowstone Lake is interpreted to be the result of loading from the increased volume of water (from snow melt) in the lake. The spring of 2011 saw a heavy accumulation of snow with over 75 cm of water-equivalent snow depth over most of the caldera by late May and the second highest lake level ever recorded (since 1923). The lake-loading signal is prominent on the LKWY vertical and north components every year. We hope to install additional semi-continuous GPS stations between LKWY and Yellowstone Lake and use the lake-loading signal to investigate the shallow crustal structure.
A series of ERS2 and ENVISAT interferograms spanning multiple years indicates that an area just east of Hebgen Lake is inflating at a rate of about 5 mm/yr. The interferograms span from 3 to 6 years between 1997 and 2009. The area of inflation, about 30 km in diameter, is on 1U.S. Geological Survey

28
the west end of the most seismically active area in Yellowstone. This area appears to be inflating at a near-constant rate, independent of the uplift/subsidence episodes of the Yellowstone caldera and the deformation center on the north caldera rim. We hope to install a semi-continuous GPS station near Hebgen Lake to better characterize the deformation.

29
Probabilistic Forecasting of Volcanic Eruptions Using Physics-based Models
By Kyle R. Anderson1
Magma physics are the mathematical “glue” which binds together our diverse observations of volcanic processes. Yet, almost all eruption forecasting is observational, based on recognizing patterns of activity or changes in the rates of key indicator signals (earthquake counts, distance between geodetic instruments, type and quantity of gas emissions, and so on). Despite the success of many such forecasts (for example, Swanson and others, 1983), this approach faces obvious limitations.
Basing eruption forecasts on the physical laws governing volcanic processes and quantitatively constraining such models using time-evolving observations should, in principle, offer some advantages. Physics-based eruption models are (generally) predictive—that is, given a known set of initial conditions, they may be used to predict the state of the volcano at future times. Given a suitable volcano model and some observations, it should be possible to make quantitative, deterministic forecasts of future behavior.
Although physics-based eruption models have indeed been used to make forecasts (for example, Mastin and others, 2009), the approach has not been widely adopted for a number of reasons. Volcanic systems can be extraordinarily complex, even chaotic (with small changes in initial conditions leading to very different outcomes) (Sparks, 2003), and many fundamental principles of magma physics are still poorly understood. Models can only imperfectly represent reality, but the degree to which the model is “wrong” may not be known until too late. This difficulty is compounded for volcanoes that have not erupted in historical times, because it leaves modelers with no observations on which to base model designs, and for volcanoes that erupt with a wide variety of styles (such as Yellowstone). Physics-based eruption models can be very time consuming to design and develop, which presents a challenge given the constraints imposed by a rapidly evolving crisis. Similarly, the models themselves must not be too computationally intensive, and the forecasting framework must allow for the incorporation of new observations as they become available, possibly in close to real time. Finally, the current state of the volcanic system (volume of stored magma, volatile content, and so on), from which forecasts are extrapolated, is imperfectly known, leading to corresponding forecast uncertainty.
Yet, ongoing research suggests cause for optimism. In particular, incorporating physics-based eruption models into probabilistic frameworks can go a long way towards addressing some of the challenges listed above. If an eruption model is capable of predicting a diverse range of observations (Anderson and Segall, 2011), then a Bayesian inverse technique allows those observations, together with any available independent a priori information (derived from the results of previous studies) to be used to constrain model parameters (Anderson and Segall, 2013). This approach can be extended in a straightforward manner to yield a mixed deterministic-probabilistic eruption-forecasting framework (Segall, 2013), suitable for use with 1U.S. Geological Survey

30
data assimilation techniques to incorporate evolving observations (Gregg and Pettijohn, 2016), which yields forecasts whose uncertainties are derived from uncertainties in initial conditions. Applying such a technique to a poorly understood volcano remains a challenge, but some assistance may come from information derived in advance from observations and statistics of many other volcanoes around the world (Ogburn and others, 2012). This Bayesian physics-based modeling and forecasting framework may also be incorporated into a larger Bayesian event tree (for example, Newhall and Hoblitt, 2002), such that volcano physics can be used where appropriate and other approaches (expert elicitation, pattern matching, and thresholding) can be used to inform probabilities in other cases. In the case of a rapidly evolving crisis, it is possible that generic eruption models could be utilized, much as generic event trees might be developed in advance for various classes of eruptive behavior (Newhall and Pallister, 2015). Finally, and encouragingly, we note that our understanding of magma physics is continually improving, our models are gaining in sophistication, computational speed is increasing, and fast sophisticated mathematical emulators are being developed that may be used in place of computationally expensive models (Bayarri, 2009).
We are likely many years from the point where physics-based models may be used to independently and reliably forecast activity at most volcanoes. However, forecasting the evolution (rather than the onset) of some eruption types—such as those whose evolution is controlled largely by deflation of an elastic reservoir rather than highly nonlinear conduit processes—may already be feasible. Thus, while one would not yet want to use a physics-based model to forecast the timing of a Yellowstone caldera-forming eruption, one might feel somewhat more confident using such a model to help forecast the ultimate volume of an active lava flow within the caldera.
References Cited Anderson, K. and Segall, P., 2011, Physics-based models of ground deformation and extrusion
rate at effusively erupting volcanoes: Journal of Geophysical Research—Solid Earth, v. 116, p. B07204, doi:10.1029/2010JB007939.
Anderson, K., and Segall, P., 2013, Bayesian inversion of data from effusive volcanic eruptions using physicsbased models: Application to Mount St. Helens 2004–2008: Journal of Geophysical Research: Solid Earth, v. 118, p. 2017–2037, doi:10.1002/jgrb.50169.
Bayarri, M.J., Berger, J.O., Calder, E.S., Dalbey, K., Lunagomez, S., Patra, A.K., Pitman, E.B., Spiller, E.T., and Wolpert, R.L., 2009, Using statistical and computer models to quantify volcanic hazards: Technometrics, v. 51, p. 402–413, doi:10.1198/TECH.2009.08018.
Gregg, P.M., and Pettijohn, J.C., 2016, A multi-data stream assimilation framework for the assessment of volcanic unrest: Journal of Volcanology and Geothermal Research, v. 309, p. 63–77, 2016, doi:10.1016/j.jvolgeores.2015.11.008.
Mastin, L.G., Lisowski, M., Roeloffs, E., and Beeler, N., 2009, Improved constraints on the estimated size and volatile content of the Mount St. Helens magma system from the 2004–2008 history of dome growth and deformation: Geophysical Research Letters, v. 36, p. L20304, doi:10.1029/2009GL039863.
Newhall, C.G. and Hoblitt, R.P., 2002, Constructing event trees for volcanic crises: Bulletin of Volcanology, v. 64, p. 3–20, doi:10.1007/s004450100173.

31
Newhall, C.G., and Pallister, J.S., 2015, Using multiple data sets to populate probabilistic volcanic event trees, in Papale, P, and Shroder, J., eds., Volcanic Hazards, Risks and Disasters: Elsevier, p. 203–232, doi:10.1016/B978-0-12-396453-3.00008-3.
Ogburn, S.E., Loughlin, S.C., and Calder, E.S., 2012, DomeHaz—Dome-forming eruptions database v2.4: VHub database, available at https://vhub.org/groups/domedatabase.
Segall, P., 2013, Volcano deformation and eruption forecasting: Geological Society, London, Special Publications, v. 380, p. 85–106, doi:10.1144/SP380.4.
Sparks, R.S.J., 2003, Forecasting volcanic eruptions: Earth and Planetary Science Letters, v. 210, p. 1–15, doi:10.1016/S0012-821X(03)00124-9.
Swanson, D.A., Casadevall, T.J., Dzurisin, D., Malone, S.D., Newhall, C.G., and Weaver, C.S., 1983, Predicting eruptions at Mount St. Helens, June 1980 through December 1982: Science, v. 221, p. 1369–76, doi:10.1126/science.221.4618.1369.

32
What Do We Know About Eruption Precursors at Large Silicic Caldera Systems?
By Daniel Dzurisin1
Recent unrest at the Yellowstone (Wyoming) and Long Valley (California) calderas raises the question of what precursors might be expected to occur before an eruption at one of these large silicic magma systems. Neither has erupted during historical time, so to address the question we are left with three types of information: (1) negative occurrences, in other words, events that have already occurred without an ensuing eruption, (2) evidence from other restless silicic calderas, including some with historical eruptions, and (3) evidence from petrologic and modeling studies of potential triggering mechanisms for caldera eruptions.
At Yellowstone, historical unrest that has not culminated in an eruption includes seismicity, ground deformation, hydrothermal activity, and gas emissions. Large tectonic events in the vicinity include the 1959 MS 7.5 Hebgen Lake earthquake and the 1975 ML 6.1 Norris earthquake. Both shook the magmatic system violently and caused substantial changes in the overlying hydrothermal system, but neither triggered an eruption. Swarms of smaller earthquakes are common at Yellowstone and there is direct evidence for fluid migration in at least two cases (October 1985, Waite and Smith, 2002; December 2008, Farrell and others, 2010). The October 1985 swarm was accompanied or soon followed by two small steam explosions, increased ground temperatures, and formation of new fumaroles and a mud volcano at three widely separated sites near the caldera rim (Dzurisin and others, 1994, p. 266). Another notable swarm, the largest since October 1985, began in January 2010 and, like the 1985 swarm, coincided with a reversal from caldera-floor uplift to subsidence—circumstantial evidence for a third case of fluid migration not followed by an eruption.
Ground deformation, another common occurrence at Yellowstone during historical time, likewise has not been indicative of impending eruptive activity. For example, the 1959 MS 7.5 Hebgen Lake earthquake produced a 26-km-long zone of surface faulting with scarps as high as 6 m within 25 km of the northwest caldera rim, and postseismic deformation extended well into the caldera (Savage and others, 1993). New geysers formed and there were dramatic changes in some of Yellowstone’s preexisting hydrothermal features, but no eruption ensued. Less dramatic but more typical are bradyseisms, in other words, episodes of gradual (few centimeters per year) surface uplift or subsidence that typically last a few months to several years. The primary deformation loci are the center of the caldera and north caldera rim near Norris Geyser Basin, with secondary loci at each of the caldera’s two resurgent domes (for example, Wicks and others, 2006; Dzurisin and others, 2012). Net uplift of the caldera floor since the first leveling survey in 1923 has been nearly 1 m at rates as fast as 7–8 cm/yr (2004–2010; Chang and others, 2010), with intervening periods of subsidence lasting at least a decade (1985–1995, Dzurisin and others, 1990, 2012). Near Norris, surface displacement rates as fast as 20 cm/yr have been observed for periods of several months (early 2014). 1U.S. Geological Survey

33
Like seismicity and ground deformation, dynamic hydrothermal activity has been characteristic of the historical period of eruptive quiescence at Yellowstone. New features have formed while others have evolved or gone dormant. Examples include the changes mentioned above that occurred in association with large earthquakes or earthquake swarms. Even small dynamic stresses from regional or more distant earthquakes, such as the 1959 MS 7.5 Hebgen Lake, 1975 ML 6.1 Norris, 1983 MW 6.9 Borah Peak, and 2002 MW 7.9 Denali events have produced changes in the interval between eruptions at Daisy and Old Faithful geysers (Hurwitz and others, 2014).
Volcanic gas emission at sustained, very high rates is another of Yellowstone’s characteristics during eruptive quiescence. With an estimated CO2 flux of 45,000±16,000 tons per day (t/d) (Werner and Brantley, 2003), Yellowstone is responsible for ∼5 percent of the global volcanogenic CO2 budget. It is unequivocal that a substantial fraction of the CO2 flux derives from outgassing of basaltic magma accumulating beneath the silicic system. Otherwise, the reservoir of silicic magma thought to exist beneath the caldera would be purged of CO2 in ∼1,000 years. The same conclusion can be drawn from the relative proportions of CO2, chlorine, fluorine, and sulfur emitted at Yellowstone, which are inconsistent with degassing of silicic magma and, combined with the flux values, require basaltic input at a rate of ∼0.3 km3/yr (Lowenstern and Hurwitz, 2008; Hurwitz and Lowenstern, 2014).
Given that the variety and intensity of unrest at Yellowstone during historical time has not been precursory to an eruption, we can look to calderas elsewhere for an answer to the question posed in the title of this abstract. Newhall and Dzurisin (1988) compiled information about more than 1,000 episodes of historical unrest at more than 100 calderas worldwide. Among their conclusions were (1) few very large earthquakes have occurred near calderas in association with unrest, and none were immediate eruption precursors; (2) eruptions at calderas are relatively common: more than 1,000 eruptions have occurred at calderas (all types) during historical time, about 18 percent of the roughly 6,000 eruptions from all types of volcanoes; (3) most explosive eruptions at calderas are small (75 percent were volcano explosivity index [VEI]) 1 or 2, 14 percent were VEI 3, 3 percent were VEI 4+)—“Large calderas hold greater potential for catastrophic eruptions than do small centers, but most eruptions at calderas are no larger than eruptions at other volcanic centers” (Newhall and Dzurisin, 1988); and (4) good indicators of an impending eruption at silicic calderas are tremor, surface uplift, ground deformation, local seismicity, and thermal/hydrothermal changes. With the exception of tremor (and long-period earthquakes), Yellowstone routinely experiences all of the precursors that typically accompany eruptions at other calderas, but it hasn’t erupted for the past ∼70,000 years.
If historical unrest is indicative of inter-eruption quiescence, what might be required to trigger an eruption at Yellowstone? Recent petrologic and modeling studies suggest several possibilities. Wotzlaw and others (2014), based on petrologic evidence, concluded that the 4.5 Ma, ∼1,800 km3 Kilgore Tuff eruption at the Heise volcanic field in the eastern Snake River Plain, Idaho, followed a relatively short period (103–104 years) of shallow crustal melting and assembly of isolated magma batches into a supervolcanic magma reservoir. They hypothesized that “…connection of magma batches vertically distributed over several kilometers in the upper crust would cause a substantial increase of buoyancy overpressure, providing an eruption trigger mechanism” (internal overpressure scenario). Gregg and others (2015) came to a different conclusion based on a numerical model of subcaldera magma bodies, which indicated that “…the ductile halo created around the hot magma chamber buffers increasing overpressures and prevents pressure relief via magmatic injection from the magma chamber.” Instead, according to

34
the model, eruptions from the largest magma reservoirs are triggered when reservoir overpressure produces uplift and consequent faulting in the overlying roof (external faulting scenario). Barker and others (2016) argued from magma chemistry and mineral diffusion modeling that elevated mafic magma supply to a silicic mush zone beneath Taupo volcano resulted in rapid melt accumulation, and that high differential tectonic stress built up and culminated in the ∼105 km3 232 C.E. eruption (hybrid internal/external triggering scenario).
If an eruption at Yellowstone could be triggered internally by basalt injection or magma reservoir integration, externally by faulting, or a combination of both, and if contemporary unrest at Yellowstone is not indicative of an impending eruption but instead typifies inter-eruption periods, then I suggest that the following unresolved questions need to be addressed in order to better assess the likelihood of an eruption in the foreseeable future.
Does an eruptible body of silicic melt exist beneath the caldera? This is paramount. Potential eruption triggers matter little if the state of the subcaldera silicic magma body is such that neither an injection of basalt nor a through-going fault could intersect a body of eruptible partial melt.
How often do basaltic intrusions penetrate the subcaldera silicic magma body? It’s clear that basalt is underplating the silicic system, perhaps at a depth of ∼20 km, but how often do mafic and silicic magmas intermingle? Even if the answer to the first question is yes, triggering an eruption with a basaltic intrusion is unlikely if such intrusions seldom encounter eruptible magma.
Do the ∼150–70-ka caldera-filling rhyolite flows represent the end-stage of the third Yellowstone Plateau caldera cycle, a completed fourth cycle that did not include caldera formation, or the beginning-stage of a fourth cycle? Eruptions in the foreseeable future are most likely in the third scenario, but it is not known whether a fourth cycle is already over, just getting started, or will never occur.
What do we know about eruption precursors at large silicic caldera systems? Not enough, clearly. But at Yellowstone, focusing on the three questions above might be a productive way forward.
References Cited Barker, S.J., Wilson, C.J.N., Morgan, D.J., Rowland, J.V., 2016, Rapid priming, accumulation,
and recharge of magma driving recent eruptions at a hyperactive caldera volcano: Geology, v. 44, no. 4, p. 323–326, doi:10.1130/G37382.1.
Chang, W-L., Smith, R.B., Farrell, J.M., and Puskas, C.M., 2010, An extraordinary episode of Yellowstone caldera uplift, 2004–2010, from GPS and InSAR observations: Geophysical Research Letters, v. 37, L23302, doi:10.1029/2010GL045451.
Dzurisin, D., Savage, J.C., and Fournier, R.O., 1990, Recent crustal subsidence at Yellowstone Caldera, Wyoming: Bulletin of Volcanology, v. 52, p. 247–270.
Dzurisin, D., Yamashita, K.M., and Kleinman, J.W., 1994, Mechanisms of crustal uplift and subsidence at the Yellowstone caldera, Wyoming: Bulletin of Volcanology, v. 56, p. 261–270.
Dzurisin, D., Wicks, C.W, and Poland, M.P., 2012, History of surface displacements at the Yellowstone Caldera, Wyoming, from leveling surveys and InSAR observations, 1923–2008: U.S. Geological Survey Professional Paper 1788, 68 p. and data files, available at http://pubs.usgs.gov/pp/1788/.
35
Farrell, J., Smith, R.B., Taira, T., Chang, W.L., and Puskas, C.M., 2010, Dynamics and rapid migration of the energetic 2008–2009 Yellowstone Lake earthquake swarm: Geophysical Research Letters, v. 37, L19305, doi:10.1029/2010GL044605.
Gregg, P.M., Grosfils, E.B., and de Silva, S.L., 2015, Catastrophic caldera-forming eruptions II—The subordinate role of magma buoyancy as an eruption trigger: Journal of Volcanology and Geothermal Research, v. 305, p. 100–113, doi:10.1016/j.jvolgeores.2015.09.022.
Hurwitz, S., and Lowenstern, J.B., 2014, Dynamics of the Yellowstone hydrothermal system: Reviews of Geophysics, v. 52, no. 3, p. 375–411, doi:10.1002/2014RG000452.
Hurwitz, S., Sohn, R.A., Luttrell, K., and Manga, M., 2014, Triggering and modulation of geyser eruptions in Yellowstone National Park by earthquakes, Earth tides, and weather: Journal of Geophysical Research, v. 119, p. 1718–1737, doi:10.1002/2013JB010803.
Lowenstern, J.B., and Hurwitz, S., 2008, Monitoring a supervolcano in repose—Heat and volatile flux at the Yellowstone caldera: Elements, Special Issue on Supervolcanoes, v. 4, p. 35–40, doi:10.2113/GSELEMENTS.4.1.35.
Newhall, C.G., and Dzurisin, D., 1988, Historical unrest at large calderas of the world: U.S. Geological Survey Bulletin 1855, 1108 p.
Savage, J.C., Lisowski, M., Prescott, W.H., and Pitt, A.M., 1993, Deformation from 1973 to 1987 in the epicentral area of the 1959 Hebgen Lake, Montana, earthquake (Ms=7.5): Journal of Geophysical Research, v. 98, p. 2145–2153.
Waite, G.P., and Smith, R.B., 2002, Seismic evidence for fluid migration accompanying subsidence of the Yellowstone Caldera: Journal of Geophysical Research, v. 107, no. B9, p. 2177, doi:10.1029/2001JB000586.
Werner, C., and Brantley, S., 2003, CO2 emissions from the Yellowstone volcanic system: Geochemistry Geophysics Geosystems, v. 4, no. 7, p. 1061, doi:10.1029/2002GC000473.
Wicks, C.W., Thatcher, W., Dzurisin, D., and Svarc, J., 2006, Uplift, thermal unrest, and magma intrusion at Yellowstone Caldera, observed with InSAR: Nature, v. 440, no. 7080, p. 72–75, doi:10.1038/nature04507.
Wotzlaw, J.F., Bindeman, I.N., Watts, K.E., Schmitt, A.K., Caricchi, L., and Schaltegger, R., 2014, Linking rapid magma reservoir assembly and eruption trigger mechanisms at evolved Yellowstone-type supervolcanoes: Geology, v. 42, p. 807–810, doi:10.1130/G35979.1.
36
Tools for Decision Making in Eruption Forecasting
By Sarah E. Ogburn,1 John S. Pallister,1 and Heather M. Wright1
This work reviews and compares three popular methods for eruption forecasting: the Classical Model for Expert Judgment Elicitation; Probabilistic Event Trees and the U.S. Geological Survey-USAID Volcano Disaster Assistance Program (VDAP) method of multiple datasets; and the Bayesian Event Tree-Eruption Forecasting (BET-EF) method and software.
Expert Judgment Elicitation using the Classical Model (also known as Structured Expert Judgment or Expert Opinion Elicitation; with procedures for accomplishing the elicitation also known as the Cooke-Aspinall Method, or the Delft Procedure) is a method of weighting and combining expert opinions to arrive at a pooled expert opinion for questions of interest (Cooke, 1991; Aspinall, 2006; Aspinall and Cooke, 2013). Experts first give their median estimate, along with 5th and 95th percentile confidence bounds for a series of “seed” questions with known answers, which are relevant to the questions of interest. The experts are then weighted according to a measure of calibration, which measures the degree to which the data support the hypothesis that the experts’ given probability estimates are accurate for the seed questions (Aspinall, 2006). Experts are also scored based on the information in their distributions, which is related to the width of their distributions and the location of their median choices (Aspinall, 2006). Thus there exists a tradeoff between inaccurate over-confident estimates (narrow confidence bounds that miss the true value; bad calibration but high information) and accurate but imprecise estimates (true value is contained within wide confidence bounds; good calibration but low information). The experts then give bounded median estimates for target questions of interest. In this case, these are the questions regarding eruption forecasting that are unknown and have uncertainty that is difficult to quantify with historical or measured data. Finally, a synthetic “decision maker” is constructed using the expert weights and opinions to arrive at an assessment of variables of interest along with associated uncertainties (Aspinall, 2006; Aspinall and Cooke, 2013). Both the weighting of experts and the construction of the synthetic “decision maker” are accomplished using a software package (Excalibur; Cooke and Solomatine, 1992). This method is often employed in contentious situations where consensus cannot be reached; it is unbiased, inclusive, and confidential; and it formally quantifies uncertainties (Aspinall, 2006; Aspinall and Cooke, 2013). The method, however, requires a trained facilitator and a software package. Weighting experts and creating appropriate seed questions can also be time intensive, although this can be done in advance of a crisis. Also, it can be difficult to see the rationale behind forecasts, as the method is confidential and anonymous.
Probabilistic event trees are frequently used to facilitate discussion, reach consensus, and produce probabilistic forecasts of volcanic activity (Newhall and Hoblitt, 2002; Newhall and Pallister, 2015). Event trees are graphical tree-like representations of successive possible events or outcomes, in this case, events during volcanic unrest. The branches of an event tree lead from general prior events (for example, volcanic unrest) to increasingly specific events (for example, volcano explosivity index [VEI] 3 explosion, lahars) to final outcomes (for example, areas 1U.S. Geological Survey

37
impacted or vulnerability). Each node of the tree is assigned both a nodal and conditional probability (based on prior nodal probabilities along a path). Expert Judgment Elicitation can be employed to assign these probabilities, or other, less formal, methods can be used. VDAP uses a “method of multiple data sets” (Newhall and Pallister, 2015) to combine conceptual and physical models of volcanic processes, current and past monitoring data, local and global patterns of prior occurrence, and expert judgment from multiple disciplines in order to assign probabilities via group discussion and consensus for each node of an event tree (Newhall and Pallister, 2015). Event trees provide a means to elicit communication and debate, a structure to help reach consensus, and a documentation of the rationale behind eruption forecasts (Newhall and Pallister, 2015). This method requires little time to prepare and does not require software or a specially trained facilitator, though it is useful to have a moderator to keep the group on task and to record the rationale behind group decisions. The basis for each probability assignment is easy to trace and well documented. However, because it relies on consensus to assign probabilities, it greatly depends upon the group dynamic. Additionally, VDAP only quantifies event tree uncertainties in an informal way, through assigning high, median, and low probability estimates to each node; though uncertainty could be more fully quantified, depending on time constraints.
The BET-EF software package also relies upon the basic event tree structure, but assesses nodal probabilities and uncertainties in a more formal way (Marzocchi and others, 2004; Marzocchi and others, 2008). First, a prior probability distribution for a particular node is estimated using theoretical knowledge. Then, the probability distributions are updated (to posterior probability distributions) based on historical data. Finally, the new distributions are calculated if monitored parameters exceed thresholds predetermined through an informal expert elicitation (Marzocchi and others, 2004; Marzocchi and others, 2008). Because probabilities at each node are represented by probability distributions, this method has the advantage of fully characterizing uncertainties in an eruption forecast. Additionally, different data sources are combined in a formal manner through a Bayesian framework (Marzocchi and others, 2004; Marzocchi and others, 2008), and thus it is possible to see the rationale for particular forecasts, given some statistical understanding. However, this method requires specialized software and training, and requires effort before a volcanic crisis to decide upon prior distributions, monitoring thresholds, and other software parameters.
These three methods for eruption forecasting differ mainly in their formality (table 1). Expert Judgment Elicitation and BET-EF both formally weight experts, require expert facilitators and software packages, and report formal statistical uncertainties; while the event tree method, as practiced by VDAP, does not (Newhall and Pallister, 2015). The event tree method utilized by VDAP, however, is quicker to implement when faced with sudden volcanic crises, making it well suited to VDAP operations. Finally, it is important to note that all of these methods, regardless of formality, are ultimately based on the judgment of experts.
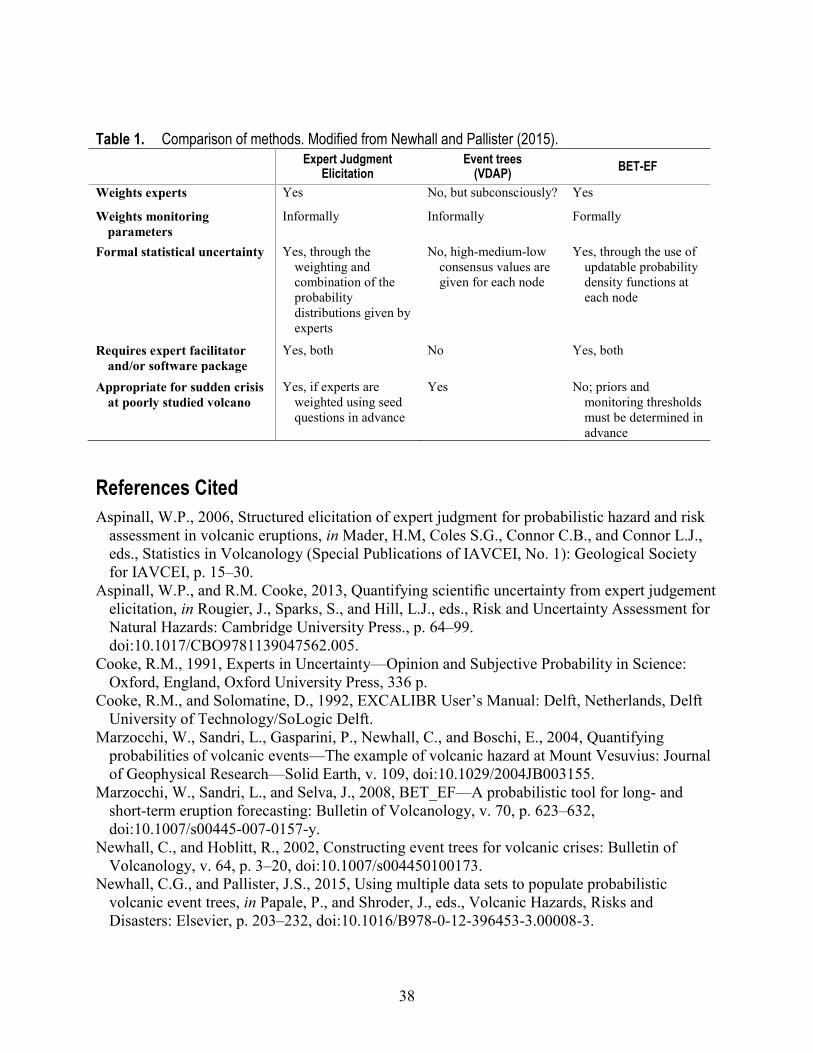
38
Table 1. Comparison of methods. Modified from Newhall and Pallister (2015). Expert Judgment
Elicitation Event trees
(VDAP) BET-EF
Weights experts Yes No, but subconsciously? Yes
Weights monitoring parameters
Informally Informally Formally
Formal statistical uncertainty Yes, through the weighting and combination of the probability distributions given by experts
No, high-medium-low consensus values are given for each node
Yes, through the use of updatable probability density functions at each node
Requires expert facilitator and/or software package
Yes, both No Yes, both
Appropriate for sudden crisis at poorly studied volcano
Yes, if experts are weighted using seed questions in advance
Yes No; priors and monitoring thresholds must be determined in advance
References Cited Aspinall, W.P., 2006, Structured elicitation of expert judgment for probabilistic hazard and risk
assessment in volcanic eruptions, in Mader, H.M, Coles S.G., Connor C.B., and Connor L.J., eds., Statistics in Volcanology (Special Publications of IAVCEI, No. 1): Geological Society for IAVCEI, p. 15–30.
Aspinall, W.P., and R.M. Cooke, 2013, Quantifying scientific uncertainty from expert judgement elicitation, in Rougier, J., Sparks, S., and Hill, L.J., eds., Risk and Uncertainty Assessment for Natural Hazards: Cambridge University Press., p. 64–99. doi:10.1017/CBO9781139047562.005.
Cooke, R.M., 1991, Experts in Uncertainty—Opinion and Subjective Probability in Science: Oxford, England, Oxford University Press, 336 p.
Cooke, R.M., and Solomatine, D., 1992, EXCALIBR User’s Manual: Delft, Netherlands, Delft University of Technology/SoLogic Delft.
Marzocchi, W., Sandri, L., Gasparini, P., Newhall, C., and Boschi, E., 2004, Quantifying probabilities of volcanic events—The example of volcanic hazard at Mount Vesuvius: Journal of Geophysical Research—Solid Earth, v. 109, doi:10.1029/2004JB003155.
Marzocchi, W., Sandri, L., and Selva, J., 2008, BET_EF—A probabilistic tool for long- and short-term eruption forecasting: Bulletin of Volcanology, v. 70, p. 623–632, doi:10.1007/s00445-007-0157-y.
Newhall, C., and Hoblitt, R., 2002, Constructing event trees for volcanic crises: Bulletin of Volcanology, v. 64, p. 3–20, doi:10.1007/s004450100173.
Newhall, C.G., and Pallister, J.S., 2015, Using multiple data sets to populate probabilistic volcanic event trees, in Papale, P., and Shroder, J., eds., Volcanic Hazards, Risks and Disasters: Elsevier, p. 203–232, doi:10.1016/B978-0-12-396453-3.00008-3.

39
Using Global Data for Eruption Forecasting
By Sarah E. Ogburn,1 Christopher J. Harpel,1 Jeremy D. Pesicek,1 John J. Wellik,1 John S. Pallister,1 and Heather M. Wright1
To prevent volcanic crises from becoming disasters, the U.S. Geological Survey-USAID Volcano Disaster Assistance Program (VDAP) helps foreign counterparts to assess volcanic unrest, activity, and hazards before and during crises. Probabilistic event trees are frequently used to facilitate discussion, reach consensus, evaluate uncertainty, and produce probabilistic forecasts of volcanic activity. Event trees (fig. 1) are graphical tree-like representations of successive possible events or outcomes, with the branches leading from general prior events to increasingly specific events to final outcomes (Newhall and Hoblitt, 2002). VDAP uses a “method of multiple data sets” (Newhall and Pallister, 2015) to assign probabilities to each node (nodal probabilities) and to calculate the conditional probabilities (the probability of a node given the occurrence of the previous node) along a path. This method combines conceptual and physical or empirical models of volcanic processes (for example, LAHARZ, energy cone), current and past monitoring data, local and global patterns of prior occurrence, and expert judgment from multiple disciplines to assign probabilities for each node of the event tree. Of particular importance is the global record of volcanic unrest, which can be used to inform our conceptual models, to fill in gaps where local information is sparse, to explore the full range of possible behavior, to compare volcanic activity to that at analogous volcanoes, and to improve uncertainty estimates by leveraging larger datasets.
A variety of data sources are used to populate event trees, including scientific literature, the Smithsonian Institution’s Global Volcanism Program (GVP) Volcanoes of the World (VOTW) database of volcano and eruption information (Global Volcanism Program, 2013), the World Organization of Volcano Observatories (WOVO) WOVOdat database of monitoring data (http://www.wovodat.org), the Geologic Database of Information on Volcanoes in Alaska (GeoDIVA; Cameron and others, 2013), DomeHaz (Ogburn and others, 2012, 2015), and FlowDat (Ogburn, 2012, 2014; Ogburn and others, 2016).
The Eruption Forecasting Information System (EFIS) is a new VDAP initiative with the goal of enhancing VDAP’s ability to forecast the outcome of volcanic unrest. The EFIS project seeks to (1) move away from relying on collective memory and towards probability estimation using databases; (2) create databases useful for pattern recognition and for answering common VDAP questions (for example, how commonly does unrest lead to eruption?); (3) create generic probabilistic event trees using global data for different volcano types; (4) create background, volcano-specific probabilistic event trees for frequently active or particularly hazardous volcanoes in advance of a crisis; (5) quantify and communicate uncertainty in probabilities; and (6) support, complement, and leverage existing databases.
1U.S. Geological Survey
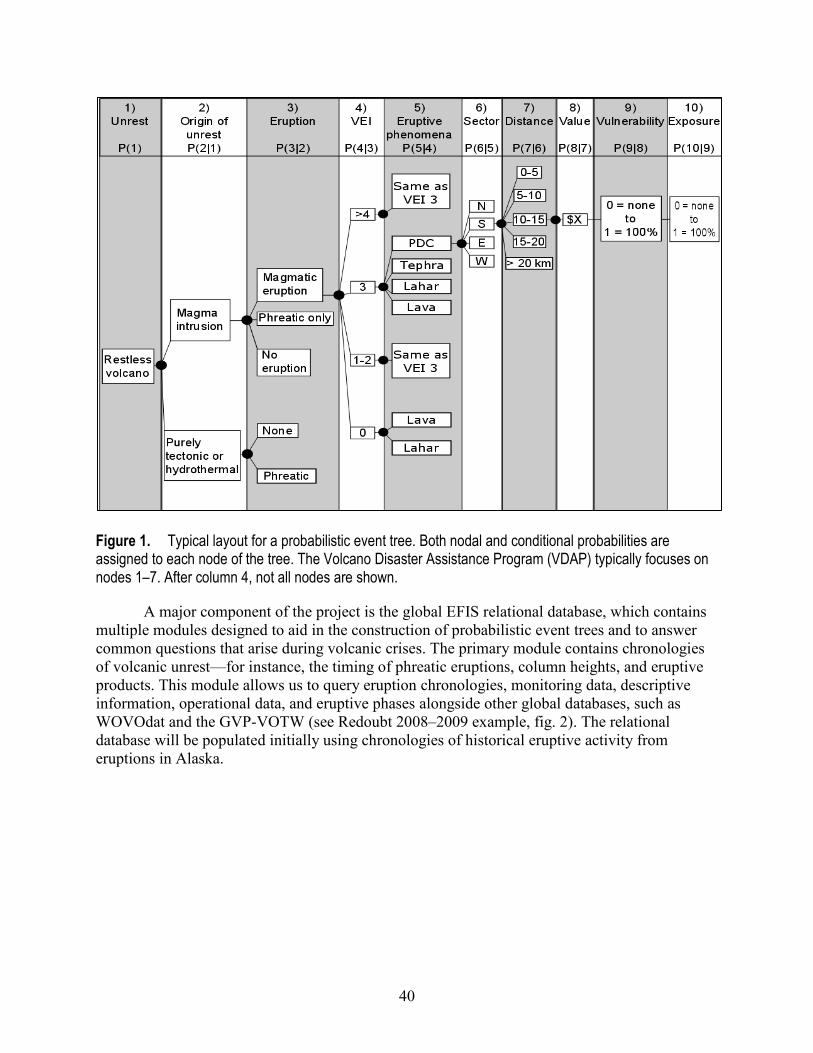
40
Figure 1. Typical layout for a probabilistic event tree. Both nodal and conditional probabilities are assigned to each node of the tree. The Volcano Disaster Assistance Program (VDAP) typically focuses on nodes 1–7. After column 4, not all nodes are shown.
A major component of the project is the global EFIS relational database, which contains multiple modules designed to aid in the construction of probabilistic event trees and to answer common questions that arise during volcanic crises. The primary module contains chronologies of volcanic unrest—for instance, the timing of phreatic eruptions, column heights, and eruptive products. This module allows us to query eruption chronologies, monitoring data, descriptive information, operational data, and eruptive phases alongside other global databases, such as WOVOdat and the GVP-VOTW (see Redoubt 2008–2009 example, fig. 2). The relational database will be populated initially using chronologies of historical eruptive activity from eruptions in Alaska.

41
Figure 2. Plots of the Redoubt Volcano 2008–2009 eruption chronology, including eruptive phases, alert level changes, eruptive products, and continuous monitoring data. Data were drawn from WOVOdat; Alaska Volcano Observatory AQMS Earthquake Catalog; ANSS Earthquake Catalog; Power and others, 2013; Schaefer, 2011; Werner and others, 2013. Special acknowledgment to Kristi Wallace for her helpful eruption chronology data sheets.
Preliminary data are already providing insight into a variety of research areas. For example, VDAP provided a forecast of the likely remaining eruption duration for Sinabung volcano, Indonesia (which has been erupting a lava flow and dome since 2013), using global data taken from similar volcanoes described in the DomeHaz database (Wolpert and others, 2016), in combination with local monitoring streams (current and past eruptive volumes and extrusion rates, and so on). In addition, EFIS seismologists used the beta-statistic test and empirically derived thresholds to identify distal volcano-tectonic earthquake anomalies preceding volcanic eruptions in Alaska during 1990–2015 to retrospectively evaluate Alaska Volcano Observatory (AVO) forecasts.

42
References Cited Cameron, C., and AVO staff, 2013, Geologic Database of Information on Volcanoes in Alaska
(GeoDIVA): Fairbanks, Alaska Volcano Observatory. Global Volcanism Program, 2013, Volcanoes of the World, v. 4.5.0: Venzke, E., ed.,
Smithsonian Institution, available at http://volcano.si.edu . Newhall, C., and Hoblitt, R., 2002, Constructing event trees for volcanic crises: Bulletin of
Volcanology, v. 64, p. 3–20, doi:10.1007/s004450100173. Newhall, C.G., and Pallister, J.S., 2015, Using multiple data sets to populate probabilistic
volcanic event trees, in Papale, P., and Shroder, J., eds., Volcanic Hazards, Risks and Disasters: Elsevier, p. 203–232, doi:10.1016/B978-0-12-396453-3.00008-3.
Ogburn, S.E., 2012, FlowDat—Mass flow database: Vhub database, available at https://vhub.org/groups/massflowdatabase.
Ogburn, S.E., Loughlin, S.C., and Calder, E.S., 2012, DomeHaz—Dome-forming eruptions database v2.4: Vhub database, available at https://vhub.org/groups/domedatabase.
Ogburn, S.E., 2014, Reconciling field observations of pyroclastic density currents with conceptual and computational analogs using a GIS and a newly developed global database: Buffalo, New York, State University of New York, University at Buffalo, Ph.D. dissertation, 318 p.
Ogburn, S.E., Loughlin, S.C., and Calder, E.S., 2015, The association of lava dome growth with major explosive activity (VEI ≥ 4)—DomeHaz, a global dataset: Bulletin of Volcanology, v. 77, p. 1–17, doi:10.1007/s00445-015-0919-x.
Ogburn, S.E., Berger, J., Calder, E.S., Lopes, D., Patra, A., Pitman, A.B., Rutarindwa, R., Spiller, E., and Wolpert, R.L., 2016, Constraining sparse datasets using hierarchical Bayesian analysis, with application to assessment of pyroclastic density current mobility metrics: Statistics in Volcanology, v. 2, p. 1–26, doi:10.5038/2163-338X.2.1.
Power, J.A., Stihler, S.D., Chouet, B.A., Haney, M.M., and Ketner, D.M., 2013, Seismic observations of Redoubt Volcano, Alaska—1989–2010 and a conceptual model of the Redoubt magmatic system: Journal of Volcanology and Geothermal Research, v. 259, p. 31–44, doi:10.1016/j.jvolgeores.2012.09.014.
Schaefer, J.R.,ed., 2011, The 2009 Eruption of Redoubt Volcano, Alaska: Alaska Division of Geological & Geophysical Surveys Report of Investigation 2011-5, 45 p., doi:10.14509/23123.
Werner, C., Kelly, P.J., Doukas, M., Lopez, T., Pfeffer, M., McGimsey, R., and Neal, C., 2013, Degassing of CO2, SO2, and H2S associated with the 2009 eruption of Redoubt Volcano, Alaska: Journal of Volcanology and Geothermal Research, v. 259, p. 270–284, doi:10.1016/j.jvolgeores.2012.04.012.
Wolpert, R.L., Ogburn, S.E., and Calder, E.S., 2016, The longevity of lava dome eruptions: Journal of Geophysical Research, v. 121, p. 676–686, doi:10.1002/2015JB012435.

43
An Exercise to Obtain Expert Views on Precursors to Volcanic Eruptions at Yellowstone
By Jacob B. Lowenstern,1 Sarah E. Ogburn,1 and Jamie M. Farrell2
Introduction The last volcano explosivity index (VEI) 7 eruption on Earth occurred in 1815 at
Tambora, Indonesia. The last VEI 8 occurred 26,500 years ago from the Taupo Caldera in New Zealand. Clearly, neither eruption was recorded with modern scientific instrumentation; descriptions of precursors are minimal for the Tambora eruption and non-existent for Oruanui (Taupo) eruption. Volcanologists have abundant familiarity with the precursors to VEI 3, 4, and 5 eruptions, but how can we know if something larger is in the offing? At large calderas, we have minimal instrumental records of the volcanic behavior prior to VEI 5 and larger eruptions. What would activity be like if Yellowstone Caldera were to erupt again? How could we tell the difference between a small and a large eruption? With minimal empirical data to answer such questions, a useful approach is to canvas experts and identify their prevailing views.
As part of the 2016 biennial meeting of the Yellowstone Volcano Observatory (YVO), we created a survey to obtain views on likely precursors to several eruptive scenarios at Yellowstone and its volcanic system. We did this to gain insight on the following questions: (1) What are the kinds and magnitudes of precursory phenomena that experts predict prior to a Yellowstone eruption? (2) What is the timeframe in which we expect those phenomena? (3) Are there any thresholds (in other words, amount of deformation or number of earthquakes) that experts tend to trust more than others? (4) How varied are scientists’ expectations about eruption precursors at a large caldera like Yellowstone? (5) Given a certain amount of unrest, what fraction of the group is likely to think an eruption is inevitable?
The survey included three scenarios: (1) a large lava flow, (2) a sizeable pyroclastic eruption, and (3) a hydrothermal explosion. In each case, respondents were asked to envision the entire range of precursors that might take place, including earthquakes, ground deformation, phreatic explosions, long-period earthquakes, and so on. Different respondents might envision different timeframes for the unrest, and the questions were worded in a manner to reflect the different timeframes. That is, respondents could predict when precursors would occur as well as which types. Questions were posed about the nature of those precursors: some were multiple choice and others required numerical entries. We worded questions in a way that they would be understandable and intuitive to a diverse range of scientists. One weakness of the survey was that it failed to accommodate the “rates of change” of precursors.
Participants were invited to fill out the survey in March of 2016. This would give sufficient time to organize the data for a presentation at the May YVO meeting. Sixteen YVO scientists responded to the survey, including geologists, geodesists, and seismologists (self-
1U.S. Geological Survey 2University of Utah

44
identified). There were insufficient responses to provide useful quantitative results, but qualitatively, the survey provided important insights that can help the observatory respond to future unrest. In particular, it created context for expectations, predictions, and thresholds envisioned by YVO staff.
The Questions Scenario 1: Lava erupts from a vent near Mary Lake on the Central Plateau. The eruption lasts
for about 5 years and erupts a total of 10 km3 of material, comparable to the size of the Mallard Lake Flow.
Scenario 2: A medium-sized caldera-forming eruption occurs from a vent near Shoshone Lake. Up to 10 cm of ash falls on Cody, Wyoming, between 10 and 50 km3 of magma are erupted, and there is widespread damage in Yellowstone National Park. All explosive eruptive activity is complete within about 1 month.
Scenario 3: A hydrothermal explosion creates a 250-m-wide crater at the Norris Geyser Basin over a several-hour-long series of explosive bursts, some of which are quite strong. Traces of ash reach Gardiner and Cooke City, Montana.
For each of these scenarios, the following questions (or ones slightly reworded) were asked: Number of earthquakes (M>1) within 50 km of the vent during the pre-eruption unrest
Minimum Maximum Best Guess
Maximum earthquake magnitude within 50 km of the vent during the pre-eruption unrest Minimum Maximum Best Guess
Amount of maximum uplift (in centimeters) during the pre-eruption unrest Minimum Maximum Best Guess
Number of phreatic explosions (plume >300 m) during the eruptive unrest Minimum Maximum Best Guess
Please include any comments about these answers in the space below: Below, please answer the timeframe that you think is most likely, with respect to
monitoring parameters. a) Assuming one could detect the beginning of an earthquake swarm that relates to the
eruption, how long before the eruption would the swarm reach 1,000 earthquakes (M>1)? • 1 year prior to eruption • 6 months to 1 year prior to eruption • 3 months to 6 months prior to eruption • 1 month to 3 months prior to eruption
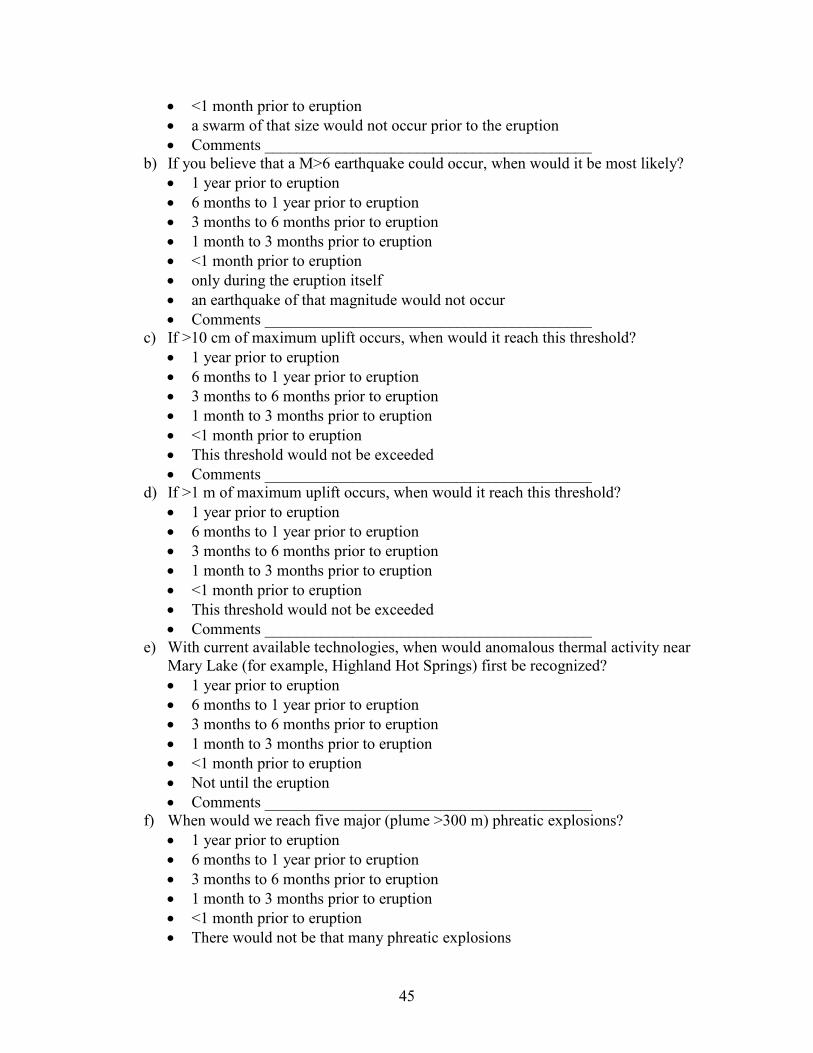
45
• <1 month prior to eruption • a swarm of that size would not occur prior to the eruption • Comments _________________________________________
b) If you believe that a M>6 earthquake could occur, when would it be most likely? • 1 year prior to eruption • 6 months to 1 year prior to eruption • 3 months to 6 months prior to eruption • 1 month to 3 months prior to eruption • <1 month prior to eruption • only during the eruption itself • an earthquake of that magnitude would not occur • Comments _________________________________________
c) If >10 cm of maximum uplift occurs, when would it reach this threshold? • 1 year prior to eruption • 6 months to 1 year prior to eruption • 3 months to 6 months prior to eruption • 1 month to 3 months prior to eruption • <1 month prior to eruption • This threshold would not be exceeded • Comments _________________________________________
d) If >1 m of maximum uplift occurs, when would it reach this threshold? • 1 year prior to eruption • 6 months to 1 year prior to eruption • 3 months to 6 months prior to eruption • 1 month to 3 months prior to eruption • <1 month prior to eruption • This threshold would not be exceeded • Comments _________________________________________
e) With current available technologies, when would anomalous thermal activity near Mary Lake (for example, Highland Hot Springs) first be recognized? • 1 year prior to eruption • 6 months to 1 year prior to eruption • 3 months to 6 months prior to eruption • 1 month to 3 months prior to eruption • <1 month prior to eruption • Not until the eruption • Comments _________________________________________
f) When would we reach five major (plume >300 m) phreatic explosions? • 1 year prior to eruption • 6 months to 1 year prior to eruption • 3 months to 6 months prior to eruption • 1 month to 3 months prior to eruption • <1 month prior to eruption • There would not be that many phreatic explosions
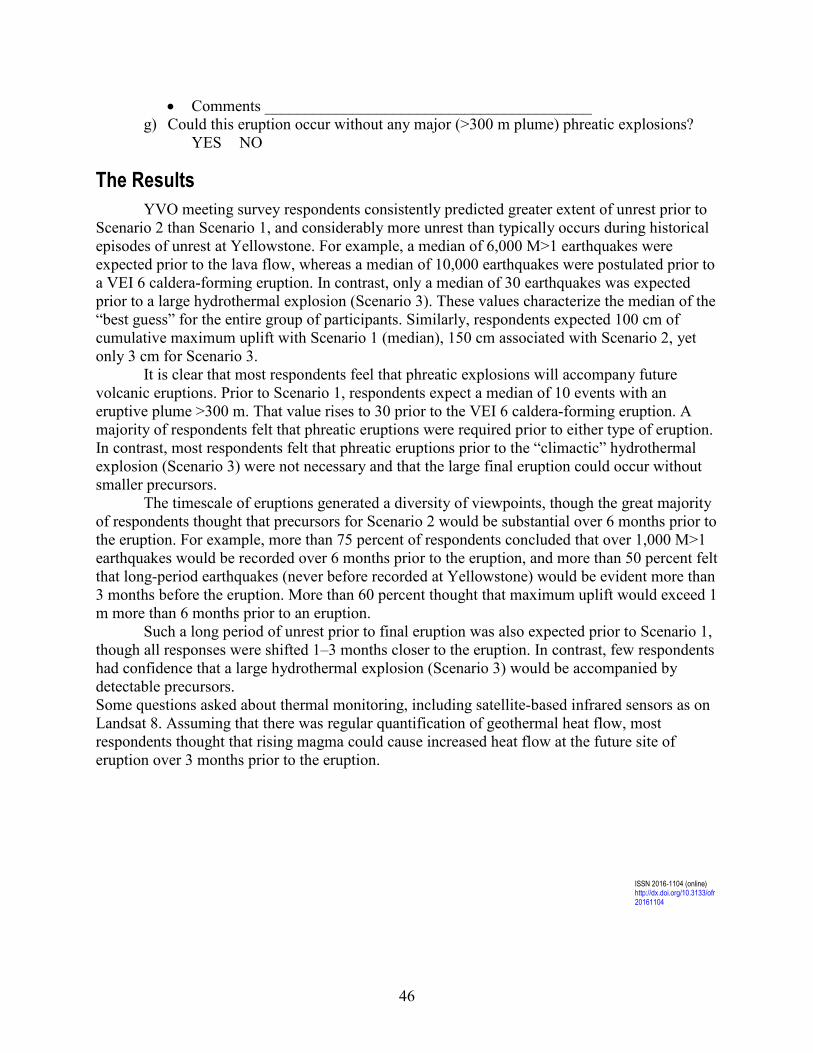
46
• Comments _________________________________________ g) Could this eruption occur without any major (>300 m plume) phreatic explosions?
YES NO
The Results YVO meeting survey respondents consistently predicted greater extent of unrest prior to
Scenario 2 than Scenario 1, and considerably more unrest than typically occurs during historical episodes of unrest at Yellowstone. For example, a median of 6,000 M>1 earthquakes were expected prior to the lava flow, whereas a median of 10,000 earthquakes were postulated prior to a VEI 6 caldera-forming eruption. In contrast, only a median of 30 earthquakes was expected prior to a large hydrothermal explosion (Scenario 3). These values characterize the median of the “best guess” for the entire group of participants. Similarly, respondents expected 100 cm of cumulative maximum uplift with Scenario 1 (median), 150 cm associated with Scenario 2, yet only 3 cm for Scenario 3.
It is clear that most respondents feel that phreatic explosions will accompany future volcanic eruptions. Prior to Scenario 1, respondents expect a median of 10 events with an eruptive plume >300 m. That value rises to 30 prior to the VEI 6 caldera-forming eruption. A majority of respondents felt that phreatic eruptions were required prior to either type of eruption. In contrast, most respondents felt that phreatic eruptions prior to the “climactic” hydrothermal explosion (Scenario 3) were not necessary and that the large final eruption could occur without smaller precursors.
The timescale of eruptions generated a diversity of viewpoints, though the great majority of respondents thought that precursors for Scenario 2 would be substantial over 6 months prior to the eruption. For example, more than 75 percent of respondents concluded that over 1,000 M>1 earthquakes would be recorded over 6 months prior to the eruption, and more than 50 percent felt that long-period earthquakes (never before recorded at Yellowstone) would be evident more than 3 months before the eruption. More than 60 percent thought that maximum uplift would exceed 1 m more than 6 months prior to an eruption.
Such a long period of unrest prior to final eruption was also expected prior to Scenario 1, though all responses were shifted 1–3 months closer to the eruption. In contrast, few respondents had confidence that a large hydrothermal explosion (Scenario 3) would be accompanied by detectable precursors. Some questions asked about thermal monitoring, including satellite-based infrared sensors as on Landsat 8. Assuming that there was regular quantification of geothermal heat flow, most respondents thought that rising magma could cause increased heat flow at the future site of eruption over 3 months prior to the eruption.
ISSN 2016-1104 (online) http://dx.doi.org/10.3133/ofr20161104
Copyright © 2022 FDOKUMEN

