


Bahasa
Halaman
Hukum

ORIGINAL ARTICLE
A new incremental test for VO2max accurate measurementby increasing VO2max plateau duration, allowing the investigationof its limiting factors
Helene Petot • Renaud Meilland • Laurence Le Moyec •
Laurence Mille-Hamard • Veronique L. Billat
Received: 22 August 2011 / Accepted: 28 September 2011 / Published online: 14 October 2011
� Springer-Verlag 2011
Abstract The purpose of this study was to (1) validate a
new exercise protocol for accurate measurement of VO2max
by obtention of a VO2max plateau for all subjects fit and
unfit (2) test the hypothesis that VO2max plateau duration is
not correlated with VO2max and (3) verify that limiting
factors of VO2max plateau duration are different from those
of VO2max amplitude. Therefore, 14 subjects performed two
incremental cycling tests: (1) a classical incremental test
(CIT) to determine VO2max, the power at VO2max (PVO2max)
and at the lactate threshold (PLT) (2) a new incremental
test (NIT) in which the power was decreased just after the
subject reached VO2max. During both protocols, heart rate,
stroke volume, cardiac output, the arterio-venous differ-
ence and the oxygen blood saturation were recorded. The
results showed that, with the NIT, subject could maintain a
long VO2max plateau (6 ± 3 min), even those who could
not reach VO2max plateau at the end of CIT (n = 5). The
VO2max plateau duration was not correlated with VO2max
amplitude which was correlated with the power at SVmax
(r = 0.888, p \ 0.001). The VO2max plateau duration was
correlated with the power decrease (W/s) during the
VO2max plateau (r = -0.72, p = 0.003) but not with car-
diac-related factors nor with PVO2max. In conclusion, these
experiments showed that it was possible to get a long
VO2max plateau at the end of NIT whatever the individual
VO2max amplitude was. The limiting factor of VO2max
duration was the power output.
Keywords Cycle ergometer � Maximal power output �Oxygen uptake � Endurance � Cardiac output
Introduction
The concept of a plateau in oxygen uptake with increasing
intensity of exercise until a maximum was central to Hill
and Lupton’s (1923) description of maximal oxygen uptake
(VO2max), and is considered as the gold standard parameter
of the cardio respiratory system’s ability to maximize
delivery and to utilize oxygen (Hawkins et al. 2007;
Howley 2007).
To determine this VO2max value, many protocols were
tested during the last century. Initially, constantly loaded
exercise protocols (Hill and Lupton 1923; Taylor et al.
1955), typically distributed over several days, were used to
measure the VO2max. Then, the steady state protocols were
replaced by the incremental tests on 1 day, which remains
nowadays the recommended test in the practitioner plans
and allowing the experts to determine the VO2max and the
ventilatory thresholds (American college of sports medi-
cine 2006; Wasserman et al. 1999). However, the matter of
VO2max assessment at the end of the incremental test
remains unclear because the VO2max plateau occurs only
for 50% of the subjects in average (Doherty et al. 2003).
Therefore, the determination of VO2max at the end of
incremental test is not obvious for subjects not able to
maintain a plateau. The absence of VO2max plateau has
been interpreted as an impossibility, for these subjects with
a low VO2max and a low fitness level, to sustain pain and
fatigue at the end of this kind of incremental test (Astorino
et al. 2005; Howley et al. 1995; Shephard 2009). Another
explanation was the incompatibility of maintaining the
Communicated by David C. Poole.
H. Petot (&) � R. Meilland � L. Le Moyec � L. Mille-Hamard �V. L. Billat
UBIAE INSERM U902, University Evry Val d’Essonne,
Batiment Maupertuis, Boulevard F. Mitterrand,
91025 Evry Cedex, France
e-mail: [email protected]
123
Eur J Appl Physiol (2012) 112:2267–2276
DOI 10.1007/s00421-011-2196-5
stroke volume (SV), heart rate (HR) and the arterio-venous
difference (Da-vO2) at their maximal values according to
Fick equation at the end of incremental test (Bergh et al.
2000; Ekblom 2009). Finally, the power output at the end
of incremental test, independently of VO2max values, could
be the major limiting factor to get VO2max plateau.
Stoudemire et al. 1996 systematically reduced treadmill
speed but maintained VO2 at VO2max. In this study, the
independent variable was a rating perceived exertion in
Borg scale which is a subject dependent parameter. In the
present study, we propose a VO2max controlled protocol
after reaching VO2max by modulation of the power. Here,
the independent factor is not subject dependant but esti-
mated by the operator.
For this reason, we propose here to validate a new
incremental test (NIT) which assesses the accurate VO2max
value by maintaining a long VO2max plateau duration in one
incremental protocol. The NIT modifies the CIT test by
decreasing the power output when VO2max is reached
instead of increased power in CIT. Moreover, the NIT
determines the PVO2max, the power associated with the
Lactic threshold (PLT), and all the cardiac variables.
This study showed that it was possible to get a
VO2max plateau at the end of an incremental test irre-
spective of every individual VO2max amplitude, and to
identify the plateau duration limiting factors. For this
purpose, we tested the hypothesis that (1) the decrease of
power just after reaching VO2max, measured in the pre-
vious CIT, allowed to get a VO2max plateau in all sub-
jects (2) the VO2max plateau duration was not correlated
with VO2max (3) the limiting factors of VO2max amplitude
and VO2max duration at the end of incremental tests were
different.
Methods
Subjects
Seventeen healthy, active men and women (5 women and
12 men), voluntarily took part in the study. Before their
participation, all subjects were informed of the risks and
stresses associated with the protocol and gave their written
consent voluntarily. The present study was conformed to
the standards set by the Declaration of Helsinki, and all
the procedures were approved by the Local Research
Ethics Committee. All subjects were free of known car-
diovascular, respiratory, and circulatory dysfunction. None
of them were under any prescribed medication. All tests
were at least 2-h postprandial and subjects were asked to
refrain from caffeine intake prior to testing on the test
days. Subjects performed each exercise test on a separate
day.
Experimental design and exercise protocols
After familiarisation with the laboratory and procedures,
each subject performed two exercise protocols on their
bicycle placed on a Cyclus II ergometer (RBM, Leipzig,
Deutschland). All the tests were performed until exhaustion
and were separated by at least 72 h. The subjects were
verbally encouraged to reach their maximum.
The first test was the classical incremental test (CIT)
during which the power output was increased every 3 min
from 0.5 Watt per kg of body weight, as previously
described (Wasserman et al. 1999). The incremental pro-
tocol with a 3 min stage was chosen for the demonstration
of a steady state in physiological variable (lactate thresh-
old, stroke volume, heart rate…) and this protocol dem-
onstrated a high incidence of VO2max plateau at this end of
the test.
It permitted to determine VO2max, the lowest power
which elicited VO2max (PVO2max), and the lactate threshold
(Tlac) as determined from the relationship between blood
lactate concentration and VO2 and the power associated
with the lactate threshold (PLT). The lactate inflection
point (Tlac) was identified as an abrupt and non linear
increase in blood lactate occured as work intensity (VO2)
increased (Gaesser and Poole 1986). This method identified
the point when the lactate is accumulated above the steady
state value which there is a net contribution of non-aerobic
metabolism to the energetic.
The second test was a NIT. This test was exactly iden-
tical to the CIT before the subject reached VO2max (as
measured with the CIT). At this time, power was decreased
from PVO2max to PLT with different individual patterns
while maintaining a VO2max plateau during the longest time
possible. During the first second of the VO2max plateau, the
first power decreased by 29 W/10 s on average. Then, the
power continuously adjusted by stage of 5 or 10 W so that
the power was at its lowest point possible. In the same way,
in this case VO2 declined lower than 95% VO2max, the
power was increased by the same procedure by stage of 5
or 10 W. The test stopped when the subject did not support
the VO2max, any longer, at its maximum or when the sub-
ject stopped the test by himself.
Data collection procedure
During both tests, electrocardiogram collected with an
electrocardiograph function of the gas analyzer (Quark b2,
Cosmed, Rome, Italy), stroke volume (SV) and heart rate
(HR) were recorded beat-by-beat by a non-invasive cardiac
output measurement using analysis of thoracic electrical
bioimpedance signals (Lab1, Physioflow, Manatec Type
PF05L1, Strasbourg, France). Cardiac output (CO) was
calculated from HR and SV values. The VO2 and CO
2268 Eur J Appl Physiol (2012) 112:2267–2276
123
values were synchronized over 5 s intervals to obtain the
arterio-venous difference (Da-vO2). The oxygen blood
saturation (SaO2) was recorded every 2 min and the end of
VO2max during both tests with a non-invasive pulse oxim-
eter placed at the fingertip (Oxypleth, Novametrix Medical
System, Wallingford, USA). Before each test, the oxygen
analyzer was calibrated according to the manufacturer’s
instructions and using a 3L syringe (Quinton instruments,
USA) for the turbine flow-meter calibration. Oxygen
uptake was measured breath-by-breath throughout each test
using a gas analyzer (Quark b2, Cosmed, Rome, Italy). The
expired gas concentrations were averaged every 5 s.
The lactate blood concentration was measured with
lactate pro� (lactate pro, ARKRAY inc, Kyoto, Japan)
placed at the fingertip for each power stage, every 2 min
during the VO2max plateau, at the end point of the plateau
and at 2 and 4 min during the recovery. The subjects were
given strong verbal encouragement to exercise until voli-
tional fatigue, but were not given progress feedback. The
rating of perceived exertion (RPE) was recorded at the end
of each power stage, every 2 min during VO2max plateau,
and at the end of the test with RPE Borg scale (Borg 1982).
Data analysis
The VO2max attainment was confirmed by at least one of the
following criteria: (1) VO2 variations (DVO2) lower than
50 mL min-1 during at least 1 min (plateau), (2) the fol-
lowing four parameters should be fulfilled—a respiratory
exchange ratio (RER) [1.10, HR [90% of the theoretical
maximal HR (Hill and Lupton 1923), subjective RPE [16,
blood lactate concentration above 8 mmol L-1 (Astrand
and Rodahl 1986). The duration of the VO2max plateau
sustained between VO2max, as it is determined above, is
95% of VO2max. This range took into account the experi-
mental and biological VO2 variability in the repeated
testing of each subject (Katch et al. 1982). The minimal
duration for considering a VO2max plateau was 1 min
(criteria 1). Therefore, three subjects were also tested and
excluded from the present report as they did not present a
VO2 plateau at this end of the CIT and did not reach all the
secondary criteria.
Statistical analysis
When normality and equality of the variances were verified
(Sigma Stat software, Jandel Scientific, Chicago, IL, USA),
a one-way analysis of variance (ANOVA) (Staview 5.5,
Statsoft, Berkeley, CA, USA) test was performed to test for
any protocol effect. A post-hoc test (PLSD of Fischer) was
then applied to test the difference between the exercise
protocols CIT and NIT. Correlations between variables of
Fick equation and respiratory factors: SV, CO, HR, Da-vO2,
VE and the duration at VO2max plateau were determined
using Pearson’s product moment correlation coefficient
(Staview 5.5, Statsoft, Berkeley, CA, USA). Moreover, in
both tests, the duration of VO2max plateau was split in quar-
ters, 25, 50, 75, and 100% of VO2max plateau. Then, an
ANOVA for repeated measures (Staview 5.5, Statsoft,
Berkeley, CA, USA) was applied for analyzing the steady
state of variables of Fick equation, VE, RPE and blood lac-
tate variables during the plateau of VO2max. We also com-
pared the physiological variables during CIT and NIT at the
absolutely same time of VO2max plateau (SAT) corresponded
to the time limit at VO2max in CIT and corresponded to
37 ± 27% of VO2max plateau duration during NIT.
Results
Descriptive characteristics of the subjects
Table 1 indicates the individual physical and physiological
values. The group included three women and 11 men. The
average age, height and weight were respectively
30 ± 7 years, 173 ± 9 cm and 69 ± 10 kg. During the
CIT, the VO2max, the PVO2max and the PLT were measured
and the means were respectively 55 ± 9 mL kg-1 min-1,
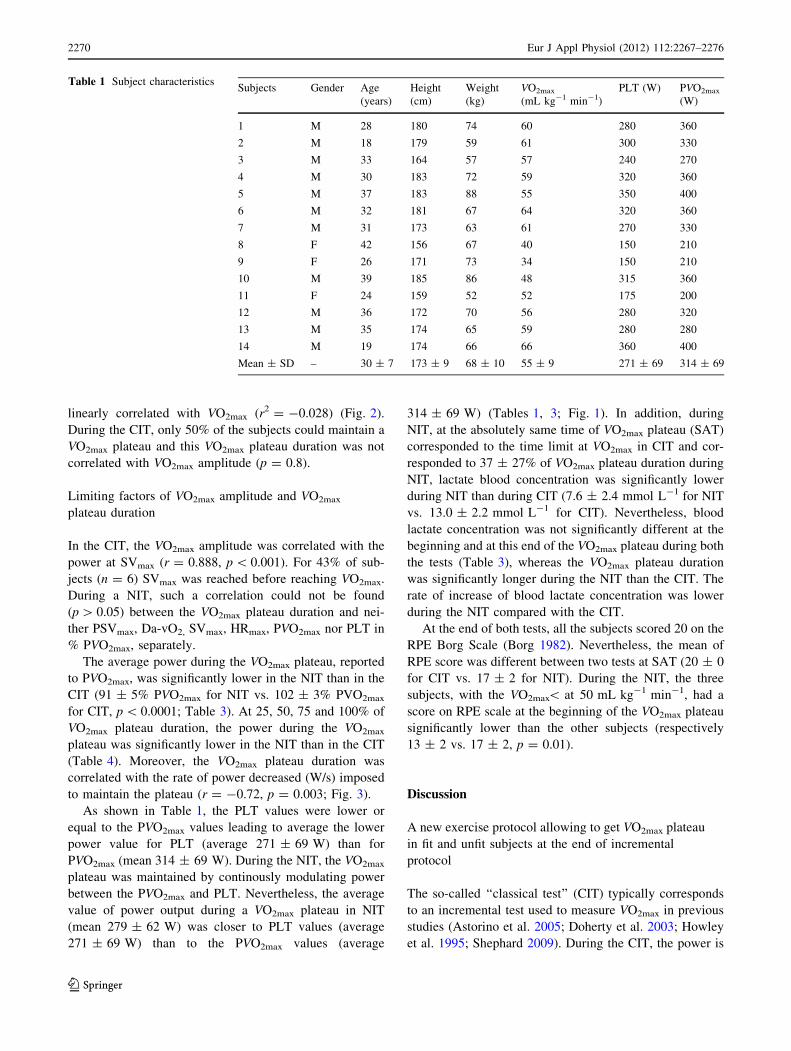
314 ± 69 and 271 ± 69 W.
VO2max plateau measured with the NIT
In the NIT, once the subjects had reached VO2max, as mea-
sured in the previous CIT (Table 1), the VO2max plateau was
maintained by the adjustment of power (Fig. 1). With this
protocol, all the subjects, including those who did not attain a
VO2max plateau in CIT (n = 5), were able to maintain their
VO2max during 6 ± 3 min (Table 2). This average value of
plateau duration was significantly different from the plateau
duration obtained with the CIT (1 min 40 s ± 1 min,
p \ 0.0001). Among the 14 subjects, 13 of them sustained
their VO2max plateau for more than 3 min, eight of them for
more than 5 min, and for one only less than 2 min (Table 2).
In contrast, in CIT, only seven of the subjects (50%) sus-
tained VO2max plateau for more than 1 min, two of them for
more than 3 min and two of them had a VO2max plateau equal
to 1 min (Table 2). Therefore, using the CIT, the average
VO2max measured for subjects exhibits a plateau that was not
significantly different from the average VO2max measured for
subjects not maintaining a plateau.
Independence between VO2max plateau duration
and VO2max amplitude
During the NIT, all subjects exhibited a VO2max plateau.
Moreover, the duration of the VO2max plateau was not
Eur J Appl Physiol (2012) 112:2267–2276 2269
123
linearly correlated with VO2max (r2 = -0.028) (Fig. 2).
During the CIT, only 50% of the subjects could maintain a
VO2max plateau and this VO2max plateau duration was not
correlated with VO2max amplitude (p = 0.8).
Limiting factors of VO2max amplitude and VO2max
plateau duration
In the CIT, the VO2max amplitude was correlated with the
power at SVmax (r = 0.888, p \ 0.001). For 43% of sub-
jects (n = 6) SVmax was reached before reaching VO2max.
During a NIT, such a correlation could not be found
(p [ 0.05) between the VO2max plateau duration and nei-
ther PSVmax, Da-vO2, SVmax, HRmax, PVO2max nor PLT in
% PVO2max, separately.
The average power during the VO2max plateau, reported
to PVO2max, was significantly lower in the NIT than in the
CIT (91 ± 5% PVO2max for NIT vs. 102 ± 3% PVO2max
for CIT, p \ 0.0001; Table 3). At 25, 50, 75 and 100% of
VO2max plateau duration, the power during the VO2max
plateau was significantly lower in the NIT than in the CIT
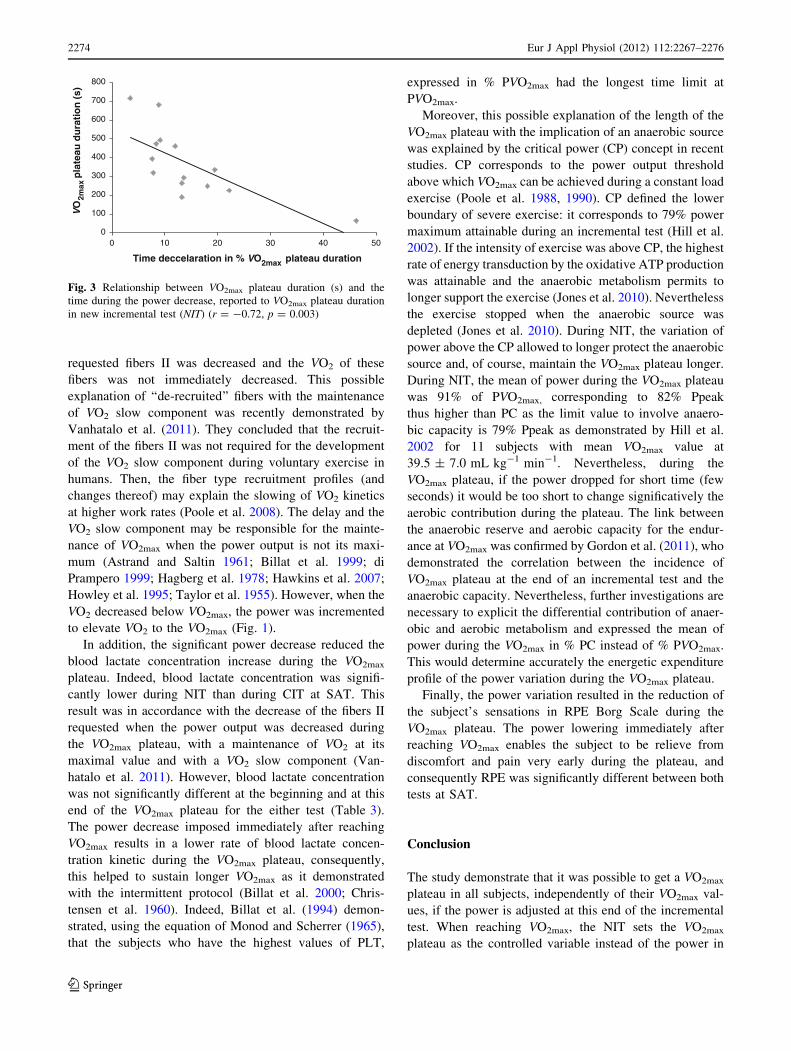
(Table 4). Moreover, the VO2max plateau duration was
correlated with the rate of power decreased (W/s) imposed
to maintain the plateau (r = -0.72, p = 0.003; Fig. 3).
As shown in Table 1, the PLT values were lower or
equal to the PVO2max values leading to average the lower
power value for PLT (average 271 ± 69 W) than for
PVO2max (mean 314 ± 69 W). During the NIT, the VO2max
plateau was maintained by continously modulating power
between the PVO2max and PLT. Nevertheless, the average
value of power output during a VO2max plateau in NIT
(mean 279 ± 62 W) was closer to PLT values (average
271 ± 69 W) than to the PVO2max values (average
314 ± 69 W) (Tables 1, 3; Fig. 1). In addition, during
NIT, at the absolutely same time of VO2max plateau (SAT)
corresponded to the time limit at VO2max in CIT and cor-
responded to 37 ± 27% of VO2max plateau duration during
NIT, lactate blood concentration was significantly lower
during NIT than during CIT (7.6 ± 2.4 mmol L-1 for NIT
vs. 13.0 ± 2.2 mmol L-1 for CIT). Nevertheless, blood
lactate concentration was not significantly different at the
beginning and at this end of the VO2max plateau during both
the tests (Table 3), whereas the VO2max plateau duration
was significantly longer during the NIT than the CIT. The
rate of increase of blood lactate concentration was lower
during the NIT compared with the CIT.
At the end of both tests, all the subjects scored 20 on the
RPE Borg Scale (Borg 1982). Nevertheless, the mean of
RPE score was different between two tests at SAT (20 ± 0
for CIT vs. 17 ± 2 for NIT). During the NIT, the three
subjects, with the VO2max\ at 50 mL kg-1 min-1, had a
score on RPE scale at the beginning of the VO2max plateau
significantly lower than the other subjects (respectively
13 ± 2 vs. 17 ± 2, p = 0.01).
Discussion
A new exercise protocol allowing to get VO2max plateau
in fit and unfit subjects at the end of incremental
protocol
The so-called ‘‘classical test’’ (CIT) typically corresponds
to an incremental test used to measure VO2max in previous
studies (Astorino et al. 2005; Doherty et al. 2003; Howley
et al. 1995; Shephard 2009). During the CIT, the power is
Table 1 Subject characteristicsSubjects Gender Age
(years)
Height
(cm)
Weight
(kg)
VO2max
(mL kg-1 min-1)
PLT (W) PVO2max
(W)
1 M 28 180 74 60 280 360
2 M 18 179 59 61 300 330
3 M 33 164 57 57 240 270
4 M 30 183 72 59 320 360
5 M 37 183 88 55 350 400
6 M 32 181 67 64 320 360
7 M 31 173 63 61 270 330
8 F 42 156 67 40 150 210
9 F 26 171 73 34 150 210
10 M 39 185 86 48 315 360
11 F 24 159 52 52 175 200
12 M 36 172 70 56 280 320
13 M 35 174 65 59 280 280
14 M 19 174 66 66 360 400
Mean ± SD – 30 ± 7 173 ± 9 68 ± 10 55 ± 9 271 ± 69 314 ± 69
2270 Eur J Appl Physiol (2012) 112:2267–2276
123
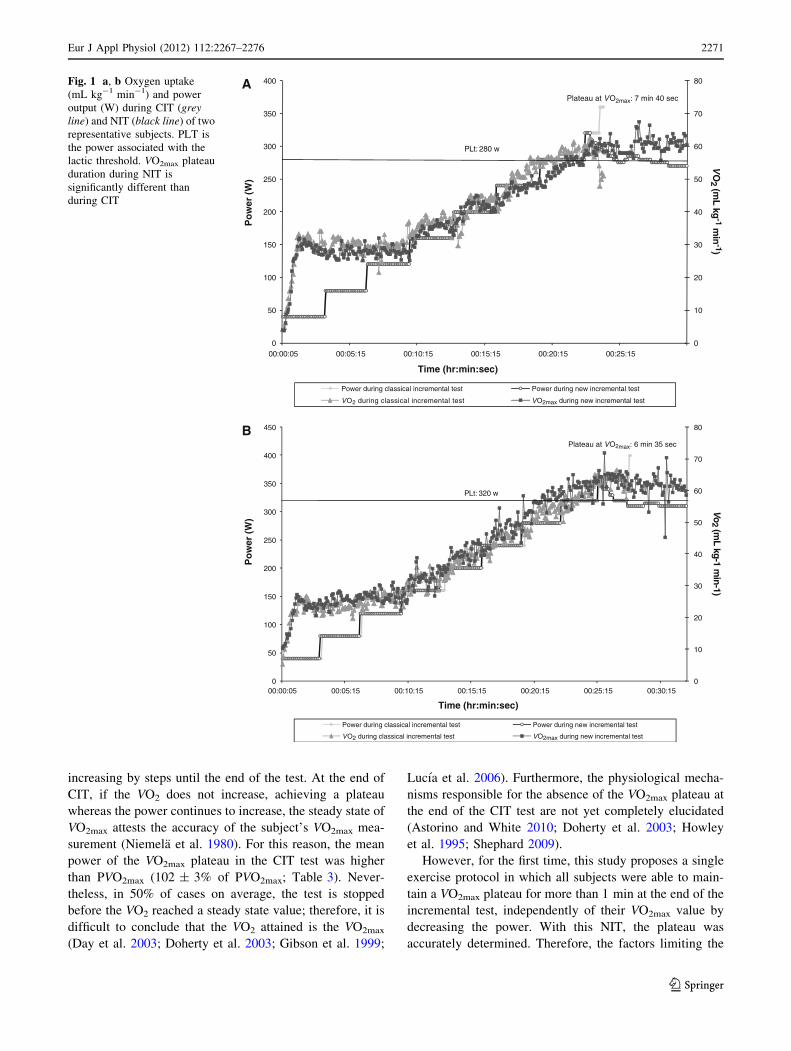
increasing by steps until the end of the test. At the end of
CIT, if the VO2 does not increase, achieving a plateau
whereas the power continues to increase, the steady state of
VO2max attests the accuracy of the subject’s VO2max mea-
surement (Niemela et al. 1980). For this reason, the mean
power of the VO2max plateau in the CIT test was higher
than PVO2max (102 ± 3% of PVO2max; Table 3). Never-
theless, in 50% of cases on average, the test is stopped
before the VO2 reached a steady state value; therefore, it is
difficult to conclude that the VO2 attained is the VO2max
(Day et al. 2003; Doherty et al. 2003; Gibson et al. 1999;
Lucıa et al. 2006). Furthermore, the physiological mecha-
nisms responsible for the absence of the VO2max plateau at
the end of the CIT test are not yet completely elucidated
(Astorino and White 2010; Doherty et al. 2003; Howley
et al. 1995; Shephard 2009).
However, for the first time, this study proposes a single
exercise protocol in which all subjects were able to main-
tain a VO2max plateau for more than 1 min at the end of the
incremental test, independently of their VO2max value by
decreasing the power. With this NIT, the plateau was
accurately determined. Therefore, the factors limiting the
0
10
20
30
40
50
60
70
80
0
50
100
150
200
250
300
350
400
00:00:05 00:05:15 00:10:15 00:15:15 00:20:15 00:25:15
Po
wer
(W
)
Time (hr:min:sec)
Power during classical incremental test Power during new incremental test
VO2 during classical incremental test VO2max during new incremental test
PLt: 280 w
Plateau at VO2max: 7 min 40 sec
0
10
20
30
40
50
60
70
80
0
50
100
150
200
250
300
350
400
450
00:00:05 00:05:15 00:10:15 00:15:15 00:20:15 00:25:15 00:30:15
Po
wer
(W
)
Time (hr:min:sec)
Power during classical incremental test Power during new incremental test
VO2 during classical incremental test VO2max during new incremental test
PLt: 320 w
Plateau at VO2max: 6 min 35 sec
A
B
VO
2 (mL kg
-1 min
-1)V
o2 (m
L kg-1 min-1)
Fig. 1 a, b Oxygen uptake
(mL kg-1 min-1) and power
output (W) during CIT (greyline) and NIT (black line) of two
representative subjects. PLT is
the power associated with the
lactic threshold. VO2max plateau
duration during NIT is
significantly different than
during CIT
Eur J Appl Physiol (2012) 112:2267–2276 2271
123

VO2max plateau could be investigated, as the duration of the
plateau was over 1 min in all subjects. Indeed, during the
NIT, all subjects, including those who did not attain a
VO2max plateau at the end of CIT (n = 5), maintained their
VO2max plateau. For subjects that maintained a plateau in
both tests, the plateau was longer in the NIT test than in the
CIT (Table 2). The proportion of subjects reaching a pla-
teau in a CIT test in this experiment is in agreement with
the previous studies using classical protocols where power
is increased at the end of the test (CIT) (Day et al. 2003;
Doherty et al. 2003; Gibson et al. 1999; Lucıa et al. 2006).
In previous studies, the lack of a VO2max plateau at this
end of the incremental test is often explained by an inad-
equate motivational effort in poorly trained subjects or by
the low VO2 of the subjects (Doherty et al. 2003; Wagner
1999). With the NIT, the decrease of power at the end of
the test to maintain VO2max value seems to overcome these
inconvenient factors, enabling all subjects, with the VO2max
range between 34 and 66 mL kg-1 min-1, to maintain
their efforts at VO2max. Among the 14 subjects, three
subjects (one man and two women) who had the lowest
VO2max (\ at 50 mL kg-1 min-1) during the CIT could
maintain these low levels for more than 7 min 55 s in NIT.
In addition, these three subjects presented an RPE score
significantly lower than the other subjects at the beginning
of the VO2max plateau, but not at the end of the VO2max
plateau. The behavior of these three subjects during the
NIT seems to suggest that the VO2max plateau does not
depend on the subjects physical fitness, as reported by
Astorino et al. (2005) but rather on the adequacy of the test
to the subject fitness during the incremental phase as shown
in previous studies (Day et al. 2003; Midgley et al. 2008;
Yoon et al. 2007). Thus, when adjusting the power at the
end of the incremental test, the VO2max plateau could be
maintained for all subjects.
The VO2max plateau duration was not correlated
with VO2max amplitude
In our study, during the NIT, the VO2max plateau duration
was not correlated with the VO2max value. Our results are
obtained with subjects exhibiting a wide range of VO2max
(34–66 mL kg-1 min-1). It is the first time that the inde-
pendence between the VO2max amplitude and the VO2max
plateau duration were shown. Nevertheless, this result could
be supposed if we analyzed the studies including subjects
with high VO2max values (Lucıa et al. 2006; Lacour et al.
2007). Indeed, all the subjects do not necessary maintain a
VO2max plateau at the end of CIT. Lucıa et al. (2006) showed
that only 47% of the subjects demonstrated a VO2max plateau,
out of a 38 male professional road cyclist group, with a
VO2max amplitude at 74 ± 6 mL kg-1 min-1 on average. In
2007, Lacour et al. showed that only 40% of the subjects
maintained a VO2max in a 94 elite rower group with a VO2max
amplitude of 64 ± 5 mL kg-1 min-1 on average. In these
studies, in spite of high VO2max values, the percentage of
subject who maintained a VO2max plateau corresponded to
the other studies (Day et al. 2003; Doherty et al. 2003;
Gibson et al. 1999; Lucıa et al. 2006) including subjects with
lower VO2max values. Then, the relation between VO2max
amplitude and VO2max plateau could be questioned.
Limiting factors of VO2max amplitude and VO2max
duration are different
As in this NIT, in which the accurate VO2max could be
measured for all subjects, it was possible to determine the
Table 2 Time at VO2max (s) and VO2max during each protocol: clas-
sical incremental test (CIT) and new incremental test (NIT)
Subjects Time at VO2max (s) VO2max (mL kg-1 min-1)
CIT NIT CIT NIT
1 55 295 60 59
2 210 265 61 60
3 195 320 57 57
4 115 250 59 57
5 35 495 55 56
6 85 395 64 62
7 60 190 61 59
8 40 715 40 42
9 60 475 34 35
10 45 680 48 50
11 130 335 52 50
12 55 65 56 56
13 170 460 59 60
14 145 225 66 66
Mean ± SD 100 ± 60 369 ± 182* 55 ± 9 55 ± 8
* p \ 0.0001
0
100
200
300
400
500
600
700
800
30 35 40 45 50 55 60 65 70
VO
2m
ax
pla
teau
du
rati
on
(s)
VO2max (mL kg-1 min-1)
Fig. 2 Relationship between VO2max plateau duration (s) and VO2max
(mL kg-1 min-1) in new incremental test (NIT)
2272 Eur J Appl Physiol (2012) 112:2267–2276
123
main factors limiting the duration of the VO2max plateau
and the amplitude of VO2max. In previous studies, the
factors limiting VO2max amplitude were widely investi-
gated. The Da-vO2 by the arterial oxygen concentration
(CaO2) (Knight et al. 1993), the O2 delivery (DO2)
(Wagner 1999) and the SVmax (di Prampero 1989, 2003;
Levine 2008) were reported as the main parameters
involved in VO2max amplitude. More precisely, the inca-
pacity of the subject to increase the SV until the end of the
incremental test was currently recognized to be a limit of
VO2max amplitude. Indeed, the VO2max was higher if the
PSVmax was corresponding to the PVO2max (Gledhill et al.
1994). In untrained subjects, the SVmax values correspond
to 40% PVO2max values (Zhou et al. 2001) whereas in
endurance trained subjects, SV continues to increase until
the PVO2max value is reached (Gledhill et al. 1994). The
results measured here with our study confirmed this limi-
tation of the VO2max amplitude by the correlation between
the VO2max amplitude and the PSVmax. Nevertheless, in our
study, the duration of the VO2max plateau was not corre-
lated with the PSVmax.
In the NIT, when the VO2max is attained, the power is
monitored to maintain the VO2 at its maximum with the
lowest amount of power as possible. With this method, the
power varied between PVO2max and PLT with different
individual patterns (Fig 2). Consequently, the average
power during the VO2max plateau was significantly lower
than in the CIT and the VO2max plateau duration was cor-
related with the power decrease (%VO2max plateau dura-
tion). Indeed, the faster the power decrease, the longer the
VO2max plateau. The fast decrease between two powers
values, during the VO2max plateau, will allow the subject to
exploit the delay and to adapt this VO2 kinetics. The slower
adaptation of VO2 allows the VO2max to last longer with
lower power output, thus avoiding premature effort stop.
When the power was decreased rapidly, the number of
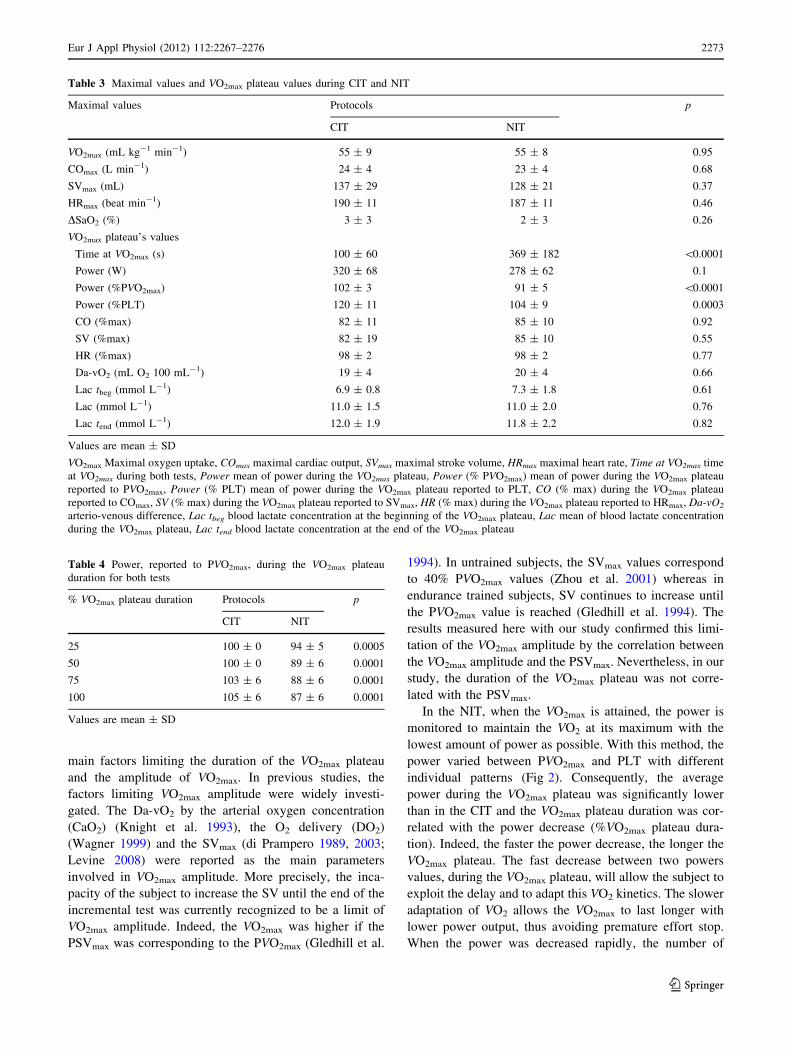
Table 3 Maximal values and VO2max plateau values during CIT and NIT
Maximal values Protocols p
CIT NIT
VO2max (mL kg-1 min-1) 55 ± 9 55 ± 8 0.95
COmax (L min-1) 24 ± 4 23 ± 4 0.68
SVmax (mL) 137 ± 29 128 ± 21 0.37
HRmax (beat min-1) 190 ± 11 187 ± 11 0.46
DSaO2 (%) 3 ± 3 2 ± 3 0.26
VO2max plateau’s values
Time at VO2max (s) 100 ± 60 369 ± 182 \0.0001
Power (W) 320 ± 68 278 ± 62 0.1
Power (%PVO2max) 102 ± 3 91 ± 5 \0.0001
Power (%PLT) 120 ± 11 104 ± 9 0.0003
CO (%max) 82 ± 11 85 ± 10 0.92
SV (%max) 82 ± 19 85 ± 10 0.55
HR (%max) 98 ± 2 98 ± 2 0.77
Da-vO2 (mL O2 100 mL-1) 19 ± 4 20 ± 4 0.66
Lac tbeg (mmol L-1) 6.9 ± 0.8 7.3 ± 1.8 0.61
Lac (mmol L-1) 11.0 ± 1.5 11.0 ± 2.0 0.76
Lac tend (mmol L-1) 12.0 ± 1.9 11.8 ± 2.2 0.82
Values are mean ± SD
VO2max Maximal oxygen uptake, COmax maximal cardiac output, SVmax maximal stroke volume, HRmax maximal heart rate, Time at VO2max time
at VO2max during both tests, Power mean of power during the VO2max plateau, Power (% PVO2max) mean of power during the VO2max plateau
reported to PVO2max, Power (% PLT) mean of power during the VO2max plateau reported to PLT, CO (% max) during the VO2max plateau
reported to COmax, SV (% max) during the VO2max plateau reported to SVmax, HR (% max) during the VO2max plateau reported to HRmax, Da-vO2
arterio-venous difference, Lac tbeg blood lactate concentration at the beginning of the VO2max plateau, Lac mean of blood lactate concentration
during the VO2max plateau, Lac tend blood lactate concentration at the end of the VO2max plateau
Table 4 Power, reported to PVO2max, during the VO2max plateau
duration for both tests
% VO2max plateau duration Protocols p
CIT NIT
25 100 ± 0 94 ± 5 0.0005
50 100 ± 0 89 ± 6 0.0001
75 103 ± 6 88 ± 6 0.0001
100 105 ± 6 87 ± 6 0.0001
Values are mean ± SD
Eur J Appl Physiol (2012) 112:2267–2276 2273
123
requested fibers II was decreased and the VO2 of these
fibers was not immediately decreased. This possible
explanation of ‘‘de-recruited’’ fibers with the maintenance
of VO2 slow component was recently demonstrated by
Vanhatalo et al. (2011). They concluded that the recruit-
ment of the fibers II was not required for the development
of the VO2 slow component during voluntary exercise in
humans. Then, the fiber type recruitment profiles (and
changes thereof) may explain the slowing of VO2 kinetics
at higher work rates (Poole et al. 2008). The delay and the
VO2 slow component may be responsible for the mainte-
nance of VO2max when the power output is not its maxi-
mum (Astrand and Saltin 1961; Billat et al. 1999; di
Prampero 1999; Hagberg et al. 1978; Hawkins et al. 2007;
Howley et al. 1995; Taylor et al. 1955). However, when the
VO2 decreased below VO2max, the power was incremented
to elevate VO2 to the VO2max (Fig. 1).
In addition, the significant power decrease reduced the
blood lactate concentration increase during the VO2max
plateau. Indeed, blood lactate concentration was signifi-
cantly lower during NIT than during CIT at SAT. This
result was in accordance with the decrease of the fibers II
requested when the power output was decreased during
the VO2max plateau, with a maintenance of VO2 at its
maximal value and with a VO2 slow component (Van-
hatalo et al. 2011). However, blood lactate concentration
was not significantly different at the beginning and at this
end of the VO2max plateau for the either test (Table 3).
The power decrease imposed immediately after reaching
VO2max results in a lower rate of blood lactate concen-
tration kinetic during the VO2max plateau, consequently,
this helped to sustain longer VO2max as it demonstrated
with the intermittent protocol (Billat et al. 2000; Chris-
tensen et al. 1960). Indeed, Billat et al. (1994) demon-
strated, using the equation of Monod and Scherrer (1965),
that the subjects who have the highest values of PLT,
expressed in % PVO2max had the longest time limit at
PVO2max.
Moreover, this possible explanation of the length of the
VO2max plateau with the implication of an anaerobic source
was explained by the critical power (CP) concept in recent
studies. CP corresponds to the power output threshold
above which VO2max can be achieved during a constant load
exercise (Poole et al. 1988, 1990). CP defined the lower
boundary of severe exercise: it corresponds to 79% power
maximum attainable during an incremental test (Hill et al.
2002). If the intensity of exercise was above CP, the highest
rate of energy transduction by the oxidative ATP production
was attainable and the anaerobic metabolism permits to
longer support the exercise (Jones et al. 2010). Nevertheless
the exercise stopped when the anaerobic source was
depleted (Jones et al. 2010). During NIT, the variation of
power above the CP allowed to longer protect the anaerobic
source and, of course, maintain the VO2max plateau longer.
During NIT, the mean of power during the VO2max plateau
was 91% of PVO2max, corresponding to 82% Ppeak
thus higher than PC as the limit value to involve anaero-
bic capacity is 79% Ppeak as demonstrated by Hill et al.
2002 for 11 subjects with mean VO2max value at
39.5 ± 7.0 mL kg-1 min-1. Nevertheless, during the
VO2max plateau, if the power dropped for short time (few
seconds) it would be too short to change significatively the
aerobic contribution during the plateau. The link between
the anaerobic reserve and aerobic capacity for the endur-
ance at VO2max was confirmed by Gordon et al. (2011), who
demonstrated the correlation between the incidence of
VO2max plateau at the end of an incremental test and the
anaerobic capacity. Nevertheless, further investigations are
necessary to explicit the differential contribution of anaer-
obic and aerobic metabolism and expressed the mean of
power during the VO2max in % PC instead of % PVO2max.
This would determine accurately the energetic expenditure
profile of the power variation during the VO2max plateau.
Finally, the power variation resulted in the reduction of
the subject’s sensations in RPE Borg Scale during the
VO2max plateau. The power lowering immediately after
reaching VO2max enables the subject to be relieve from
discomfort and pain very early during the plateau, and
consequently RPE was significantly different between both
tests at SAT.
Conclusion
The study demonstrate that it was possible to get a VO2max
plateau in all subjects, independently of their VO2max val-
ues, if the power is adjusted at this end of the incremental
test. When reaching VO2max, the NIT sets the VO2max
plateau as the controlled variable instead of the power in
0
100
200
300
400
500
600
700
800
0 10 20 30 40 50
Time deccelaration in % VO2max plateau duration
VO
2max
pla
teau
du
rati
on
(s)
Fig. 3 Relationship between VO2max plateau duration (s) and the
time during the power decrease, reported to VO2max plateau duration
in new incremental test (NIT) (r = -0.72, p = 0.003)
2274 Eur J Appl Physiol (2012) 112:2267–2276
123
the CIT. For the first time, the VO2max plateau duration
measured corresponded to the endurance time at VO2max
and not to the endurance time at the power output at this
end of the incremental protocol. This NIT allowed sus-
taining the VO2max longer with power variations. In addi-
tion, it provides an overview of physiological parameters of
the subjects. In the future, the NIT protocol may possibly
be used as a unique test. Therefore, the power should be
modulated when the VO2max plateau is reached during
several minute, or when the RPM is obviously decreased or
if the VO2 falls to a level corresponding to the end of the
test in CIT protocol. Then, this NIT may accurately
determines the VO2max values. Then, the matter was to
determine the limiting factors of the VO2max plateau
duration rather than when this plateau was reached. The
VO2max plateau duration was correlated to the decrease of
power during the plateau but not to the VO2max value. In
NIT, the power variation during the VO2max plateau was in
the severe intensity domain above the CP and confirmed
the implication of the anaerobic metabolism. This result
confirmed the relationship, previously demonstrated,
between the aerobic capacity and the anaerobic capacity
during exercise with high workload. Further studies will be
necessary to elucidate more precisely the implication of the
power variation to improve the aerobic and anaerobic
capacities during the VO2max plateau used the PC in ref-
erence but not the PVO2max.
References
American college of sports medicine (2006) ACSM’s resource
manual for guidelines for exercise testing and prescription, 5th
edn. Lippincott Williams and Wilkins, Philadelphia
Astorino TA, White AC (2010) Assement of anaerobic power to
verify VO2max attainement. Clin Physiol Funct Imaging
30:294–300
Astorino TA, Willey J, Kinnahan J, Larsson SM, Welch H, Dalleck
LC (2005) Elucidating determinants of the plateau in oxygen
consumption at VO2max. Br J Sports Med 39:655–660
Astrand PO, Saltin B (1961) Oxygen uptake during the first minutes
of heavy muscular exercise. J Appl Physiol 16:971–976
Astrand PO, Rodahl K (1986) Textbook of work physiology, 3rd edn.
McGraw-Hill, New York, pp 333–365
Bergh U, Ekblom B, Astrand PO (2000) Maximal oxygen uptake
‘‘classical’’ versus ‘‘contemporary’’ viewpoints. Med Sci Sports
Exerc 32:85–88
Billat VL, Renoux JC, Pinoteau J, Petit B, Koralsztein JP (1994) Time
to exhaustion at 100% of velocity at VO2max and modelling of
the time-limit/velocity relationship in elite long distance runners.
Eur J Appl Physiol 69:271–273
Billat VL, Blondel N, Berthoin S (1999) Determination of the
velocity associated with the longest time to exhaustion at
maximal oxygen uptake. Eur J Appl Physiol Occup Physiol
80:159–161
Billat VL, Slawinski J, Bocquet V, Demarle A, Lafitte L, Chassaing
P, Koralsztein JP (2000) Intermittent runs at the velocity
associated with maximal oxygen uptake enables subjects to
remain at maximal oxygen uptake for a longer time than intense
but submaximal runs. Eur J Appl Physiol 81:188–196
Borg GA (1982) Psychophysical bases of perceived exertion. Med Sci
Sports Exerc 14:377–381
Christensen EH, Hedman R, Saltin B (1960) Intermittent and
continuous running (A further contribution to the physiology
of intermittent work). Acta Physiol Scand 50:269–286
Day JR, Rossiter HB, Coats EM, Skasick A, Whipp BJ (2003) The
maximally attainable VO2 during exercise in humans: the peak
versus maximum issue. J Appl Physiol 95:1901–1907
di Prampero PE (1989) Energetics of world records in human
locomotion. In: Wieser W, Gnaiger E (eds) Energy transforma-
tions in cells and organisms. Thieme, Stuttgart, pp 248–253
di Prampero PE (1999) The concept of critical velocity: a brief
analysis. Eur J Appl Physiol Occup Physiol 80:162–164
di Prampero PE (2003) Factors limiting maximal performance in
humans. Eur J Appl Physiol 90:420–429
Doherty M, Nobbs L, Noakes TD (2003) Low frequency of the
‘‘plateau phenomenon’’ during maximal exercise in elite British
athletes. Eur J Appl Physiol 89:619–623
Ekblom B (2009) Counterpoint: maximal oxygen uptake is not
limited by a central nervous system governor. J Appl Physiol
106:339–341
Gaesser GA, Poole DC (1986) Lactate and ventilatory thresholds:
disparity in time course of adaptations to training. J Appl Physiol
61:999–1004
Gibson A, Lambert MI, Hawley JA, Broomhead SA, Noakes TD
(1999) Measurement of maximal oxygen uptake from two
different laboratory protocols in runners and squash players.
Med Sci Sports Exerc 31:1226–1229
Gledhill N, Cox D, Jamnik R (1994) Endurance athletes’ stroke
volume does not plateau: major advantage os diastolic function.
Med Sci Sports Exerc 26:1116–1121
Gordon D, Hopkins S, King C, Keiller D, Barnes RJ (2011) Incidence
of the plateau at VO2max is dependent on the anaerobic capacity.
Int J Sports Med 32:1–6
Hagberg JM, Mullin JP, Nagle FJ (1978) Oxygen consumption during
constant-load exercise. J Appl Physiol 45:381–384
Hawkins MN, Raven PB, Snell PG, Stray-Gundersen J, Levine BD
(2007) Maximal oxygen uptake as a parametric measure of
cardiorespiratory capacity. Med Sci Sports Exerc 39:103–107
Hill AV, Lupton H (1923) Muscular exercise, lactic acid, and the
supply and utilization of oxygen. Q J Med 16:135–171
Hill DW, Poole DC, Smith JC (2002) The relationship between power
and the time to achieve VO2max. Med Sci Sports Exerc
34:709–714
Howley ET (2007) VO2max and the plateau—needed or not? Med Sci
Sports Exerc 39:101–102
Howley ET, Bassett DR Jr, Welch HG (1995) Criteria for maximal
oxygen uptake: review and commentary. Med Sci Sports Exerc
27:1292–1301
Jones AM, Vanhatalo A, Burnley M, Morton RH, Poole DC (2010)
Critical Power: implications for determination of VO2max and
exercise tolerance. Med Sci Sports Exerc 42:1876–1890
Katch VL, Sady SS, Freedson P (1982) Biological variability in
maximum aerobic power. Med Sci Sports Exerc 14:21–25
Knight DR, Schaffartzik W, Poole DC, Hogan MC, Bebout DE,
Wagner PD (1993) Effects of hyperoxia on maximal leg O2
supply and utilization in men. J Appl Physiol 75:2586–2594
Lacour JR, Messonnier L, Bourdin M (2007) The leveling-off of
oxygen uptake is related to blood lactate accumulation. Retro-
spective study of 94 elite rowers. Eur J Appl Physiol
101:241–247
Levine DB (2008) VO2max: What do we know: and what do we still
need to know? J Physiol 586:25–34
Eur J Appl Physiol (2012) 112:2267–2276 2275
123
Lucıa A, Rabadan M, Hoyos J, Hernandez-Capilla M, Perez M, San
Juan AF, Earnest CP, Chicharro JL (2006) Frenquency of the
VO2max plateau phenomenon in world-class cyclists. Int J Sports
Med 27:984–992
Midgley AW, Bentley DJ, Luttikholt H, McNaughton LR, Millet GP
(2008) Challenging a dogma of exercise physiology: does an
incremental exercise test for valid VO2max determination really
need to last between 8 and 12 minutes? Sports Med 38:441–447
Monod H, Scherrer J (1965) The work capacity of synergy muscular
groups. Ergonomics 8:329–338
Niemela K, Palatsi I, Linnaluoto M, Takkunen J (1980) Criteria of
maximum oxygen uptake in progressive bicycle tests. Eur J Appl
Physiol Occup Physiol 44:51–59
Poole DC, Ward SA, Gardner G, Whipp BJ (1988) A metabolic and
respiratory profile for prolonged exercise in man. Ergonomics
31:1265–1279
Poole DC, Ward SA, Whipp BJ (1990) The effects of training on the
metabolic and respiratory profile of high-intensity cycle ergom-
eter exercise. Eur J Appl Physiol 59:421–429
Poole DC, Barstow TJ, McDonough P, Jones AM (2008) Control of
oxygen uptake during exercise. Med Sci Sports Exerc
40:462–474
Shephard RJ (2009) Is the measurement of maximal oxygen intake
passe? Br J Sports Med 43:83–85
Stoudemire NM, Wideman L, Pass KA, McGinnes CL, Gaesser GA,
Weltman A (1996) The validity of regulating blood lactate
concentration during running by ratings of perceived exertion.
Med Sci Sports Exerc 28:490–495
Taylor HL, Buskirk E, Henschel A (1955) Maximal oxygen intake as
an objective measure of cardio-respiratory performance. J Appl
Physiol 8:73–80
Vanhatalo A, Poole DC, DiMenna FJ, Bailey SJ, Jones AM (2011)
Muscle fiber recruitment and the slow component of O2 uptake:
constant work rate versus all-out sprint exercise. Am J Physiol
300:700–707
Wagner PD (1999) New ideas on limitations to VO2max. Exerc Sport
Sci Rev 28:10–14
Wasserman K, Hansen JE, Darryl YS, Casaburi R, Whipp JB (1999)
Principles of exercise testing and interpretation, 3rd edn.
Lippincott Williams and Wilkins, Philadelphia
Yoon BK, Kravitz L, Robergs R (2007) VO2max, protocol duration,
and the VO2 plateau. Med Sci Sports Exerc 39:1186–1192
Zhou B, Conlee RK, Jensen R, Fellingham GW, George JD, Fisher
AG (2001) Stroke volume does not plateau during graded
exercise in elite male distance runners. Med Sci Sports Exerc
33:1849–1854
2276 Eur J Appl Physiol (2012) 112:2267–2276
123
Top Related
Copyright © 2022 FDOKUMEN

