


Bahasa
Halaman
Hukum

ABSTRACT
The Upper Godavari and Kaddam river basins represent two lithologically distinct catchments before their confluence at Adilabad (Andhra Pradesh). Mineral magnetic studies along with petrographic analysis on the sediment samples collected at 28 sites from before-, at-, and after the confluence are inferred here for sediment source mixing. The Deccan source characterized by high ferrimagnetic concentration in the Godavari sands is immediately replaced by the granitic source at its exit from Deccan province at <30 km. The Kaddam River contributes as dilution to ferrimagnetic concentration at its confluence with Godavari; and is attested by the artificial mixing experiments. Further there is significant 'across the channel' variation by high ferrimagnetic concentration over flood plains (related to Deccan source) compared to local mixing in channels. Investigating such independent controls and mixing of modern sedimentation in the Peninsular Rivers is therefore crucial to understand the sediment flux mechanism in the Bay of Bengal sink.
Keywords: Sediment Source Mixing, Godavari Basin, Mineral Magnetism, Adilabad District, Andhra Pradesh.
INTRODUCTION
Characteristics of the continental sediments that are delivered into adjoining ocean basins are mainly governed by catchment lithology and the morphology of the given drainage basin, that are further driven by the variables like climate and tectonics (Holeman, 1968; Milliman and Meade, 1983; Schumm and Rea, 1995; Wasson, 2003). Drainage basins being network of tributaries and trunk streams, the detailed knowledge on their sediment yield, sediment characteristics and intermixing is of particular significance to understand the controls on sediment flux into the sink (Schumm and Rea, 1995).
Godavari represents the largest drainage basin in Peninsular India which also provides characteristic inputs to the Bengal fan as sink. Godavari carries the largest sediment load (170 x 106 t/yr) amongst the Peninsular Rivers (Subramanian, 1987; Vaithiyanathan et al., 1988)
A Mineral Magnetic Approach of Sediment Source Mixing in Godavari and Kaddam Rivers, Adilabad District, Andhra Pradesh
1 1 1 1Sharad Porate , S. J. Sangode *, D. C. Meshram , Yogesh Kulkarni , 2 1S. K. Patil , D. S. Dhongle
1 Department of geology, University of Pune, Pune - 411 007, India2Dr. K.S. Krishnan Geomagnetic Research Laboratory, Chamanganj Bazar, Allahabad - 221 505, India
*E-mail: [email protected]
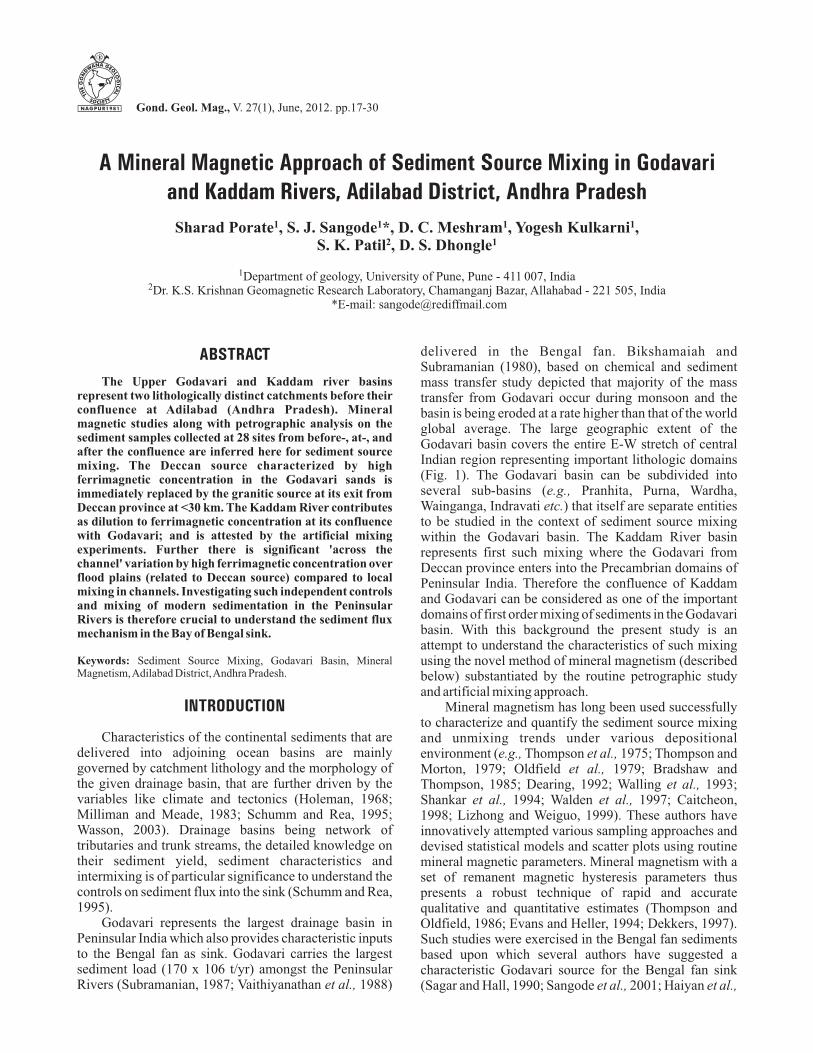
delivered in the Bengal fan. Bikshamaiah and Subramanian (1980), based on chemical and sediment mass transfer study depicted that majority of the mass transfer from Godavari occur during monsoon and the basin is being eroded at a rate higher than that of the world global average. The large geographic extent of the Godavari basin covers the entire E-W stretch of central Indian region representing important lithologic domains (Fig. 1). The Godavari basin can be subdivided into several sub-basins (e.g., Pranhita, Purna, Wardha, Wainganga, Indravati etc.) that itself are separate entities to be studied in the context of sediment source mixing within the Godavari basin. The Kaddam River basin represents first such mixing where the Godavari from Deccan province enters into the Precambrian domains of Peninsular India. Therefore the confluence of Kaddam and Godavari can be considered as one of the important domains of first order mixing of sediments in the Godavari basin. With this background the present study is an attempt to understand the characteristics of such mixing using the novel method of mineral magnetism (described below) substantiated by the routine petrographic study and artificial mixing approach.
Mineral magnetism has long been used successfully to characterize and quantify the sediment source mixing and unmixing trends under various depositional environment (e.g., Thompson et al., 1975; Thompson and Morton, 1979; Oldfield et al., 1979; Bradshaw and Thompson, 1985; Dearing, 1992; Walling et al., 1993; Shankar et al., 1994; Walden et al., 1997; Caitcheon, 1998; Lizhong and Weiguo, 1999). These authors have innovatively attempted various sampling approaches and devised statistical models and scatter plots using routine mineral magnetic parameters. Mineral magnetism with a set of remanent magnetic hysteresis parameters thus presents a robust technique of rapid and accurate qualitative and quantitative estimates (Thompson and Oldfield, 1986; Evans and Heller, 1994; Dekkers, 1997). Such studies were exercised in the Bengal fan sediments based upon which several authors have suggested a characteristic Godavari source for the Bengal fan sink (Sagar and Hall, 1990; Sangode et al., 2001; Haiyan et al.,
Gond. Geol. Mag., V. 27(1), June, 2012. pp.17-30
2006; Sangode et al., 2007). However the characteristic sediment mixing processes within the Godavari Basin is not yet attempted. Therefore, attempt has been made to investigate the scope of mineral magnetism for future detailed characterization of the sediment source mixing patterns within the Godavari basin and its implications to sediment flux in the Bengal fan sink.
STUDY AREAThe study area lies in the central part of the Peninsular
India and represents some the unique geotectonic settings like Kaddam mega lineament (Sangode et al., 2012), Deccan trap margin and the Proterozoic rift basin (Pranhita-Godavari valley) (Vaidyanadhan and Ramakrishnan, 2008). Detail inferences on its tectonic setting with reference to neotectonism are produced in Sangode et al., (2012). The major stratigraphic formation in the confluence area and along the Kaddam River
belongs to the Sullavai Group of Godavari Supergroup overlain on the Albaka Group (Chaudhuri, 2003). Sedimentary rocks in the area comprises conglomerates, felspathic and quartzose sands (red bed). The igneous rock complex comprises granitic gneisses, pegmatites and basic dykes.
The Godavari River flows through two contrasting lithologic domains: A) the Deccan basalt province and B) the Precambrian granite-granulite assemblage. The province of the Godavari basin, therefore, can be divided into these two categories that are also anticipated to provide distinct magnetic mineral characters with the former delivering high concentration ferrimagnetic minerals and their alteration products (magnetite, titanomagnetite and maghemite) and the later delivering relatively low concentration of ferrimagnetic minerals. These two domains also display a differential weathering characteristics because of the lithology and catchment
Fig.1. Generalized geological map (GSI, 2010) and overlaid drainage basin map of the Godavari basin along with sampling locations marked : I) the Godavari River in Deccan Volcanic province, II) Godavari at the exit of DVP, III) before the confluence, IV) at the confluence of Godavari with Kaddam, V) after the confluence, VI) Kaddam river at its proximal catchment, VII) Kaddam River at middle and VIII) Kaddam River at terminal part before confluence.
Sharad Porate and Others18
morphology. The river Godavari behaves as bed rock River in the Deccan Volcanic Province (DVP); whereas in Gondwana, it behave as an alluvial river depositing significant sediment load. Before entering into the Godavari rift zone, the Godavari River traverses through Peninsular Gneissic Complex (younger phase of Archean age).
The Kaddam River prominently flows through the Kaddam fault trending NW-SE (Sangode et al., 2012). Majority of its catchment is made of Precambrian sediments and metasediments represented by the limestone, conglomerates, shale and quartzites of the Penganga Group, sheared quartzites and sericite schists. The stretch of the river after the dam flows through the Archean granite basement. In this stretch the Kaddam river shows mis-matched terrace composition with granitic clasts in the right bank and Precambrian sediment/metasediment clasts in the left banks. The mis-match was previously explained as the neotectonic migration of the channel at confluence of the Godavari with Kaddam (Sangode et al., 2012).
FIELD WORK AND SAMPLING
Total 53 representative channel sand samples were collected from: I) the Godavari River with entirely Deccan Volcanic province, II) Godavari at the exit of the DVP, III) Godavari before the confluence, IV) at the confluence of Godavari with Kaddam, V) after the confluence, VI) Kaddam river at its proximal catchment, VII) Kaddam River at middle and VIII) Kaddam River at terminal/before confluence (Fig. 1). Samples are systematically collected from the cross sectional profile from the flood plains, side channel bars; mid-channel bars etc. At each site, the samples were collected by physically mixing '1m x 1m' and ~30-50 cm deep block of sandy or silty river beds, finally reduced to about 2-3 kg of the sample by coning and quartering at the site.
Laboratory Methods
The mineral magnetic methods allow qualitative and quantitative analysis on bulk natural samples of large quantity (10 to 50 gm) thus representing the natural sample with better population. We prepared three subsamples of 10 gm each from every sample that was previously mixed by coning and quartering method. The low field magnetic susceptibility was measured using Bartington Instrument's (UK) MS2B sensor with a
-5measuring range of 1 x 10 to 9999 x 10 (SI, volume specific). The sensor operates at a frequency of 0.465 and 4.65 KHz and an AF intensity of 80 A/m (= 0.1 mT). The frequency dependence was determined by measuring the samples in both the frequencies (0.465 and 4.65 KHz).
The discriminative characterization of the magnetic minerals was carried out by the detailed analysis through well-defined procedures of the Isothermal Remanent Magnetization (Thompson and Oldfield, 1986; Waldon et al., 1997). This process produces the remanance hysteresis spectra to make qualitative and quantitative
-5
estimates of magnetic mineral phases in the sample (Op. cit). An impulse magnetizer (ASC IM 10-30, USA) and a Rock magnetometer (Minispin, UK) were used to generate the data. Anhysteretic Remanent Magnetization (ARM) was used to detect the Stable Single Domain (SSD) grains. The intensity of ARM is roughly proportional to the content of SD particles in a bulk sample. The meanings of the mineral magnetic parameters used in this are given below.
÷ initial magnetic susceptibility taken as the bulk lf
representation of ferrimagnetic content (and paramagnetic components in case of weak samples). ÷ fd
frequency-dependence of susceptibility estimating the restricted ferrimagnetic grain size of finer/ superparamagnetic (SP) nature. ÷ susceptibility of ARM
anhysteretic remanent magnetization that varies with concentration of stable remanence bearing grain size called Single Domain (SD). SIRM: saturation isothermal remanent magnetization which reflects concentration of remanence carrying minerals (ferrimagnetic and antiferromagnetic). SIRM/÷ a ratio sensitive to lf
mineralogical and grain size variations amongst ferri- and antiferromagnetic oxides. B : remanence coercivity 0(CR)
which represents the demagnetizing fields required to reduce the SIRM to zero and is sensitive to magnetic mineralogy as well as grain size. S-Ratio (= IRM-100mT/SIRM1000mT and S-Ratio 2 = IRM - 300 / SIRM 1000): a discriminative parameter for magnetite or other easily saturated magnetic minerals to distinguish it from hematite and goethite in mixture. The S-ratio can be grain size dependent when it is of unimodal ferrimagnetic composition. The classic version of the S-Ratio (Stober and Thompson 1979; Heslop 2009) was adopted to provide a relative measure of high and low coercivity minerals within its SIRM. The higher negative values of S-ratio indicate presence of multi domain (MD) magnetite of detrital origin. Whereas the lower negative values depict SD magnetites and low positive values depict mixtures of magnetite and hematite, with higher positive values suggesting the presence of hematite.
The data obtained from the laboratory analysis has been mass normalized and grouped into (a) the sites from Deccan Traps Province, (b) the sites at Godavari off the Deccan province, (c) sites from the Kaddam River before the confluence, (d) sites at the confluence of Godavari and Kaddam rivers, and (e) the sites after the confluence. Initially a descriptive statistics is derived to get an overview of the data; followed by the correlation coefficient to see the inter-parametric relations. Standard bi-plots are produced for general qualitative assessment of the magnetic minerals. Finally, the Profile-wise plots are made to see the variation within a site. The petrographic modal analysis of samples was carried out preparing the QFL plots. We also prepared artificial mixing of the two sources in laboratory by preparing the mixing ratios of Godavari and Kadam source (at 70:30, 50:50, 30:70) and mineral magnetic studies were carried out on these mixtures to compare with the natural sample mixing
Mineral Magnetic Approach of Sediment Source Mixing in Godavari and Kaddam Rivers 19
(elaborated in the section: Mineral magnetic variation as bivariate plots below).
RESULT AND DISCUSSION
Statistical Variation amongst Mineral Magnetic Parameters
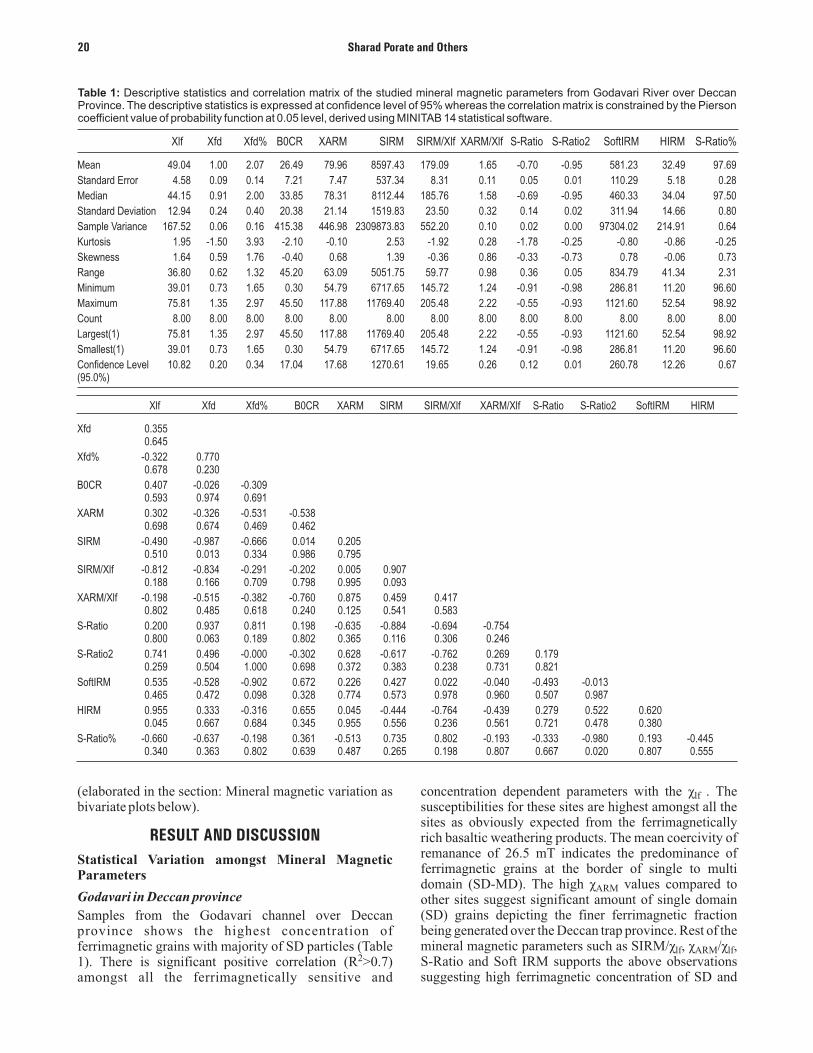
Godavari in Deccan province
Samples from the Godavari channel over Deccan province shows the highest concentration of ferrimagnetic grains with majority of SD particles (Table
21). There is significant positive correlation (R >0.7) amongst all the ferrimagnetically sensitive and
concentration dependent parameters with the . The susceptibilities for these sites are highest amongst all the sites as obviously expected from the ferrimagnetically rich basaltic weathering products. The mean coercivity of remanance of 26.5 mT indicates the predominance of ferrimagnetic grains at the border of single to multi domain (SD-MD). The high ÷ values compared to other sites suggest significant amount of single domain (SD) grains depicting the finer ferrimagnetic fraction being generated over the Deccan trap province. Rest of the mineral magnetic parameters such as SIRM/÷ , ÷ /÷ ,lf lf
S-Ratio and Soft IRM supports the above observations suggesting high ferrimagnetic concentration of SD and
÷lf
ARM
ARM
Xlf Xfd Xfd% B0CR XARM SIRM SIRM/Xlf XARM/Xlf S-Ratio S-Ratio2 SoftIRM HIRM S-Ratio%
Mean 49.04 1.00 2.07 26.49 79.96 8597.43 179.09 1.65 -0.70 -0.95 581.23 32.49 97.69
Standard Error 4.58 0.09 0.14 7.21 7.47 537.34 8.31 0.11 0.05 0.01 110.29 5.18 0.28
Median 44.15 0.91 2.00 33.85 78.31 8112.44 185.76 1.58 -0.69 -0.95 460.33 34.04 97.50
Standard Deviation 12.94 0.24 0.40 20.38 21.14 1519.83 23.50 0.32 0.14 0.02 311.94 14.66 0.80
Sample Variance 167.52 0.06 0.16 415.38 446.98 2309873.83 552.20 0.10 0.02 0.00 97304.02 214.91 0.64
Kurtosis 1.95 -1.50 3.93 -2.10 -0.10 2.53 -1.92 0.28 -1.78 -0.25 -0.80 -0.86 -0.25
Skewness 1.64 0.59 1.76 -0.40 0.68 1.39 -0.36 0.86 -0.33 -0.73 0.78 -0.06 0.73
Range 36.80 0.62 1.32 45.20 63.09 5051.75 59.77 0.98 0.36 0.05 834.79 41.34 2.31
Minimum 39.01 0.73 1.65 0.30 54.79 6717.65 145.72 1.24 -0.91 -0.98 286.81 11.20 96.60
Maximum 75.81 1.35 2.97 45.50 117.88 11769.40 205.48 2.22 -0.55 -0.93 1121.60 52.54 98.92
Count 8.00 8.00 8.00 8.00 8.00 8.00 8.00 8.00 8.00 8.00 8.00 8.00 8.00
Largest(1) 75.81 1.35 2.97 45.50 117.88 11769.40 205.48 2.22 -0.55 -0.93 1121.60 52.54 98.92
Smallest(1) 39.01 0.73 1.65 0.30 54.79 6717.65 145.72 1.24 -0.91 -0.98 286.81 11.20 96.60
Confidence Level 10.82 0.20 0.34 17.04 17.68 1270.61 19.65 0.26 0.12 0.01 260.78 12.26 0.67(95.0%)
Xlf Xfd Xfd% B0CR XARM SIRM SIRM/Xlf XARM/Xlf S-Ratio S-Ratio2 SoftIRM HIRM
Xfd 0.3550.645
Xfd% -0.322 0.7700.678 0.230
B0CR 0.407 -0.026 -0.3090.593 0.974 0.691
XARM 0.302 -0.326 -0.531 -0.5380.698 0.674 0.469 0.462
SIRM -0.490 -0.987 -0.666 0.014 0.2050.510 0.013 0.334 0.986 0.795
SIRM/Xlf -0.812 -0.834 -0.291 -0.202 0.005 0.9070.188 0.166 0.709 0.798 0.995 0.093
XARM/Xlf -0.198 -0.515 -0.382 -0.760 0.875 0.459 0.417 0.802 0.485 0.618 0.240 0.125 0.541 0.583
S-Ratio 0.200 0.937 0.811 0.198 -0.635 -0.884 -0.694 -0.754 0.800 0.063 0.189 0.802 0.365 0.116 0.306 0.246
S-Ratio2 0.741 0.496 -0.000 -0.302 0.628 -0.617 -0.762 0.269 0.1790.259 0.504 1.000 0.698 0.372 0.383 0.238 0.731 0.821
SoftIRM 0.535 -0.528 -0.902 0.672 0.226 0.427 0.022 -0.040 -0.493 -0.0130.465 0.472 0.098 0.328 0.774 0.573 0.978 0.960 0.507 0.987
HIRM 0.955 0.333 -0.316 0.655 0.045 -0.444 -0.764 -0.439 0.279 0.522 0.6200.045 0.667 0.684 0.345 0.955 0.556 0.236 0.561 0.721 0.478 0.380
S-Ratio% -0.660 -0.637 -0.198 0.361 -0.513 0.735 0.802 -0.193 -0.333 -0.980 0.193 -0.4450.340 0.363 0.802 0.639 0.487 0.265 0.198 0.807 0.667 0.020 0.807 0.555
Table 1: Descriptive statistics and correlation matrix of the studied mineral magnetic parameters from Godavari River over Deccan Province. The descriptive statistics is expressed at confidence level of 95% whereas the correlation matrix is constrained by the Pierson coefficient value of probability function at 0.05 level, derived using MINITAB 14 statistical software.
Sharad Porate and Others20
MD over the Deccan province as being transported by the Godavari River.
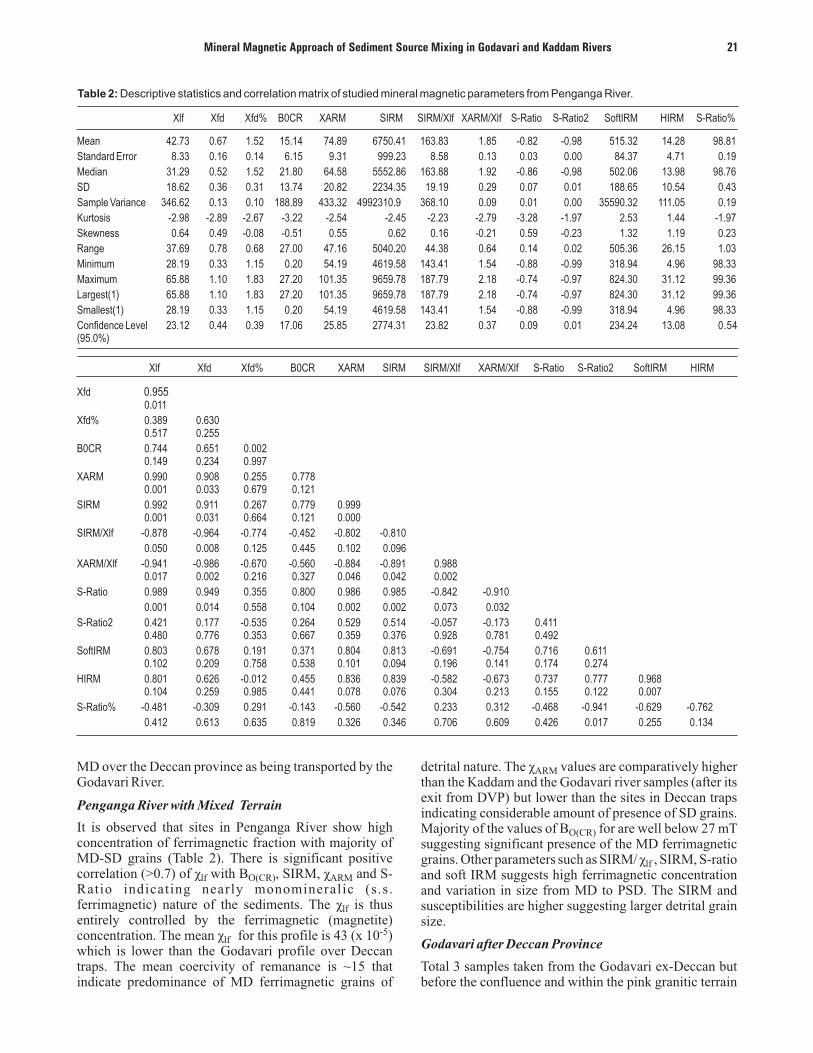
Penganga River with Mixed Terrain
It is observed that sites in Penganga River show high concentration of ferrimagnetic fraction with majority of MD-SD grains (Table 2). There is significant positive correlation (>0.7) of ÷ with B , SIRM, ÷ and S-lf ARM
Ratio indicating nearly monomineralic (s.s. ferrimagnetic) nature of the sediments. The ÷ is thus lf
entirely controlled by the ferrimagnetic (magnetite) -5concentration. The mean ÷ for this profile is 43 (x 10 ) lf
which is lower than the Godavari profile over Deccan traps. The mean coercivity of remanance is ~15 that indicate predominance of MD ferrimagnetic grains of
O(CR)
detrital nature. The values are comparatively higher than the Kaddam and the Godavari river samples (after its exit from DVP) but lower than the sites in Deccan traps indicating considerable amount of presence of SD grains. Majority of the values of B for are well below 27 mT O(CR)
suggesting significant presence of the MD ferrimagnetic grains. Other parameters such as SIRM/ ÷ , SIRM, S-ratio lf
and soft IRM suggests high ferrimagnetic concentration and variation in size from MD to PSD. The SIRM and susceptibilities are higher suggesting larger detrital grain size.
Godavari after Deccan Province
Total 3 samples taken from the Godavari ex-Deccan but before the confluence and within the pink granitic terrain
÷ARM
Xlf Xfd Xfd% B0CR XARM SIRM SIRM/Xlf XARM/Xlf S-Ratio S-Ratio2 SoftIRM HIRM S-Ratio%
Mean 42.73 0.67 1.52 15.14 74.89 6750.41 163.83 1.85 -0.82 -0.98 515.32 14.28 98.81
Standard Error 8.33 0.16 0.14 6.15 9.31 999.23 8.58 0.13 0.03 0.00 84.37 4.71 0.19
Median 31.29 0.52 1.52 21.80 64.58 5552.86 163.88 1.92 -0.86 -0.98 502.06 13.98 98.76
SD 18.62 0.36 0.31 13.74 20.82 2234.35 19.19 0.29 0.07 0.01 188.65 10.54 0.43
Sample Variance 346.62 0.13 0.10 188.89 433.32 4992310.9 368.10 0.09 0.01 0.00 35590.32 111.05 0.19
Kurtosis -2.98 -2.89 -2.67 -3.22 -2.54 -2.45 -2.23 -2.79 -3.28 -1.97 2.53 1.44 -1.97
Skewness 0.64 0.49 -0.08 -0.51 0.55 0.62 0.16 -0.21 0.59 -0.23 1.32 1.19 0.23
Range 37.69 0.78 0.68 27.00 47.16 5040.20 44.38 0.64 0.14 0.02 505.36 26.15 1.03
Minimum 28.19 0.33 1.15 0.20 54.19 4619.58 143.41 1.54 -0.88 -0.99 318.94 4.96 98.33
Maximum 65.88 1.10 1.83 27.20 101.35 9659.78 187.79 2.18 -0.74 -0.97 824.30 31.12 99.36
Largest(1) 65.88 1.10 1.83 27.20 101.35 9659.78 187.79 2.18 -0.74 -0.97 824.30 31.12 99.36
Smallest(1) 28.19 0.33 1.15 0.20 54.19 4619.58 143.41 1.54 -0.88 -0.99 318.94 4.96 98.33
Confidence Level 23.12 0.44 0.39 17.06 25.85 2774.31 23.82 0.37 0.09 0.01 234.24 13.08 0.54(95.0%)
Xlf Xfd Xfd% B0CR XARM SIRM SIRM/Xlf XARM/Xlf S-Ratio S-Ratio2 SoftIRM HIRM
Xfd 0.955 0.011
Xfd% 0.389 0.630 0.517 0.255
B0CR 0.744 0.651 0.002 0.149 0.234 0.997
XARM 0.990 0.908 0.255 0.7780.001 0.033 0.679 0.121
SIRM 0.992 0.911 0.267 0.779 0.999 0.001 0.031 0.664 0.121 0.000
SIRM/Xlf -0.878 -0.964 -0.774 -0.452 -0.802 -0.810
0.050 0.008 0.125 0.445 0.102 0.096
XARM/Xlf -0.941 -0.986 -0.670 -0.560 -0.884 -0.891 0.988 0.017 0.002 0.216 0.327 0.046 0.042 0.002
S-Ratio 0.989 0.949 0.355 0.800 0.986 0.985 -0.842 -0.910
0.001 0.014 0.558 0.104 0.002 0.002 0.073 0.032
S-Ratio2 0.421 0.177 -0.535 0.264 0.529 0.514 -0.057 -0.173 0.4110.480 0.776 0.353 0.667 0.359 0.376 0.928 0.781 0.492
SoftIRM 0.803 0.678 0.191 0.371 0.804 0.813 -0.691 -0.754 0.716 0.6110.102 0.209 0.758 0.538 0.101 0.094 0.196 0.141 0.174 0.274
HIRM 0.801 0.626 -0.012 0.455 0.836 0.839 -0.582 -0.673 0.737 0.777 0.968 0.104 0.259 0.985 0.441 0.078 0.076 0.304 0.213 0.155 0.122 0.007
S-Ratio% -0.481 -0.309 0.291 -0.143 -0.560 -0.542 0.233 0.312 -0.468 -0.941 -0.629 -0.762
0.412 0.613 0.635 0.819 0.326 0.346 0.706 0.609 0.426 0.017 0.255 0.134
Table 2: Descriptive statistics and correlation matrix of studied mineral magnetic parameters from Penganga River.
Mineral Magnetic Approach of Sediment Source Mixing in Godavari and Kaddam Rivers 21
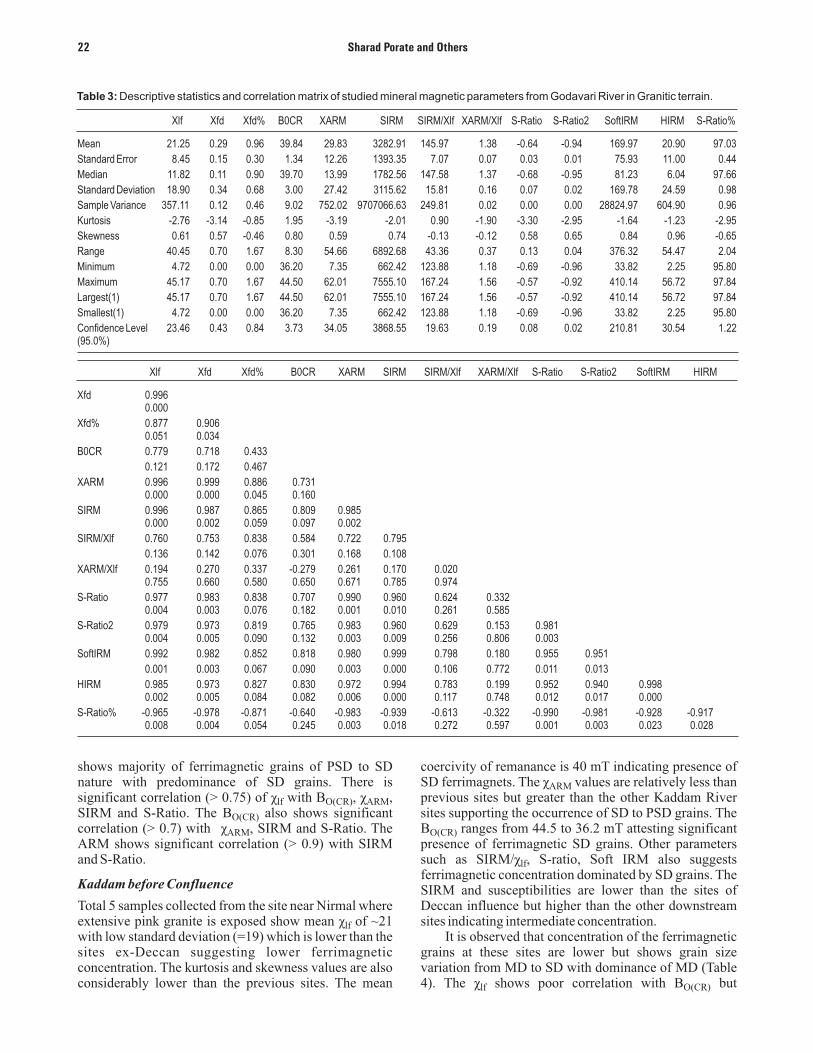
shows majority of ferrimagnetic grains of PSD to SD nature with predominance of SD grains. There is significant correlation (> 0.75) of ÷ with B , ÷ , lf O(CR) ARM
SIRM and S-Ratio. The B also shows significant O(CR)
correlation (> 0.7) with ÷ , SIRM and S-Ratio. The ARM
ARM shows significant correlation (> 0.9) with SIRM and S-Ratio.
Kaddam before Confluence
Total 5 samples collected from the site near Nirmal where extensive pink granite is exposed show mean ÷ of ~21 lf
with low standard deviation (=19) which is lower than the sites ex-Deccan suggesting lower ferrimagnetic concentration. The kurtosis and skewness values are also considerably lower than the previous sites. The mean
coercivity of remanance is 40 mT indicating presence of SD ferrimagnets. The ÷ values are relatively less than ARM
previous sites but greater than the other Kaddam River sites supporting the occurrence of SD to PSD grains. The B ranges from 44.5 to 36.2 mT attesting significant O(CR)
presence of ferrimagnetic SD grains. Other parameters such as SIRM/÷ , S-ratio, Soft IRM also suggests lf
ferrimagnetic concentration dominated by SD grains. The SIRM and susceptibilities are lower than the sites of Deccan influence but higher than the other downstream sites indicating intermediate concentration.
It is observed that concentration of the ferrimagnetic grains at these sites are lower but shows grain size variation from MD to SD with dominance of MD (Table 4). The ÷ shows poor correlation with B but lf O(CR)
Xlf Xfd Xfd% B0CR XARM SIRM SIRM/Xlf XARM/Xlf S-Ratio S-Ratio2 SoftIRM HIRM S-Ratio%
Mean 21.25 0.29 0.96 39.84 29.83 3282.91 145.97 1.38 -0.64 -0.94 169.97 20.90 97.03
Standard Error 8.45 0.15 0.30 1.34 12.26 1393.35 7.07 0.07 0.03 0.01 75.93 11.00 0.44
Median 11.82 0.11 0.90 39.70 13.99 1782.56 147.58 1.37 -0.68 -0.95 81.23 6.04 97.66
Standard Deviation 18.90 0.34 0.68 3.00 27.42 3115.62 15.81 0.16 0.07 0.02 169.78 24.59 0.98
Sample Variance 357.11 0.12 0.46 9.02 752.02 9707066.63 249.81 0.02 0.00 0.00 28824.97 604.90 0.96
Kurtosis -2.76 -3.14 -0.85 1.95 -3.19 -2.01 0.90 -1.90 -3.30 -2.95 -1.64 -1.23 -2.95
Skewness 0.61 0.57 -0.46 0.80 0.59 0.74 -0.13 -0.12 0.58 0.65 0.84 0.96 -0.65
Range 40.45 0.70 1.67 8.30 54.66 6892.68 43.36 0.37 0.13 0.04 376.32 54.47 2.04
Minimum 4.72 0.00 0.00 36.20 7.35 662.42 123.88 1.18 -0.69 -0.96 33.82 2.25 95.80
Maximum 45.17 0.70 1.67 44.50 62.01 7555.10 167.24 1.56 -0.57 -0.92 410.14 56.72 97.84
Largest(1) 45.17 0.70 1.67 44.50 62.01 7555.10 167.24 1.56 -0.57 -0.92 410.14 56.72 97.84
Smallest(1) 4.72 0.00 0.00 36.20 7.35 662.42 123.88 1.18 -0.69 -0.96 33.82 2.25 95.80
Confidence Level 23.46 0.43 0.84 3.73 34.05 3868.55 19.63 0.19 0.08 0.02 210.81 30.54 1.22(95.0%)
Xlf Xfd Xfd% B0CR XARM SIRM SIRM/Xlf XARM/Xlf S-Ratio S-Ratio2 SoftIRM HIRM
Xfd 0.9960.000
Xfd% 0.877 0.906 0.051 0.034
B0CR 0.779 0.718 0.433
0.121 0.172 0.467
XARM 0.996 0.999 0.886 0.7310.000 0.000 0.045 0.160
SIRM 0.996 0.987 0.865 0.809 0.9850.000 0.002 0.059 0.097 0.002
SIRM/Xlf 0.760 0.753 0.838 0.584 0.722 0.795
0.136 0.142 0.076 0.301 0.168 0.108
XARM/Xlf 0.194 0.270 0.337 -0.279 0.261 0.170 0.0200.755 0.660 0.580 0.650 0.671 0.785 0.974
S-Ratio 0.977 0.983 0.838 0.707 0.990 0.960 0.624 0.3320.004 0.003 0.076 0.182 0.001 0.010 0.261 0.585
S-Ratio2 0.979 0.973 0.819 0.765 0.983 0.960 0.629 0.153 0.9810.004 0.005 0.090 0.132 0.003 0.009 0.256 0.806 0.003
SoftIRM 0.992 0.982 0.852 0.818 0.980 0.999 0.798 0.180 0.955 0.951
0.001 0.003 0.067 0.090 0.003 0.000 0.106 0.772 0.011 0.013
HIRM 0.985 0.973 0.827 0.830 0.972 0.994 0.783 0.199 0.952 0.940 0.9980.002 0.005 0.084 0.082 0.006 0.000 0.117 0.748 0.012 0.017 0.000
S-Ratio% -0.965 -0.978 -0.871 -0.640 -0.983 -0.939 -0.613 -0.322 -0.990 -0.981 -0.928 -0.9170.008 0.004 0.054 0.245 0.003 0.018 0.272 0.597 0.001 0.003 0.023 0.028
Table 3: Descriptive statistics and correlation matrix of studied mineral magnetic parameters from Godavari River in Granitic terrain.
Sharad Porate and Others22
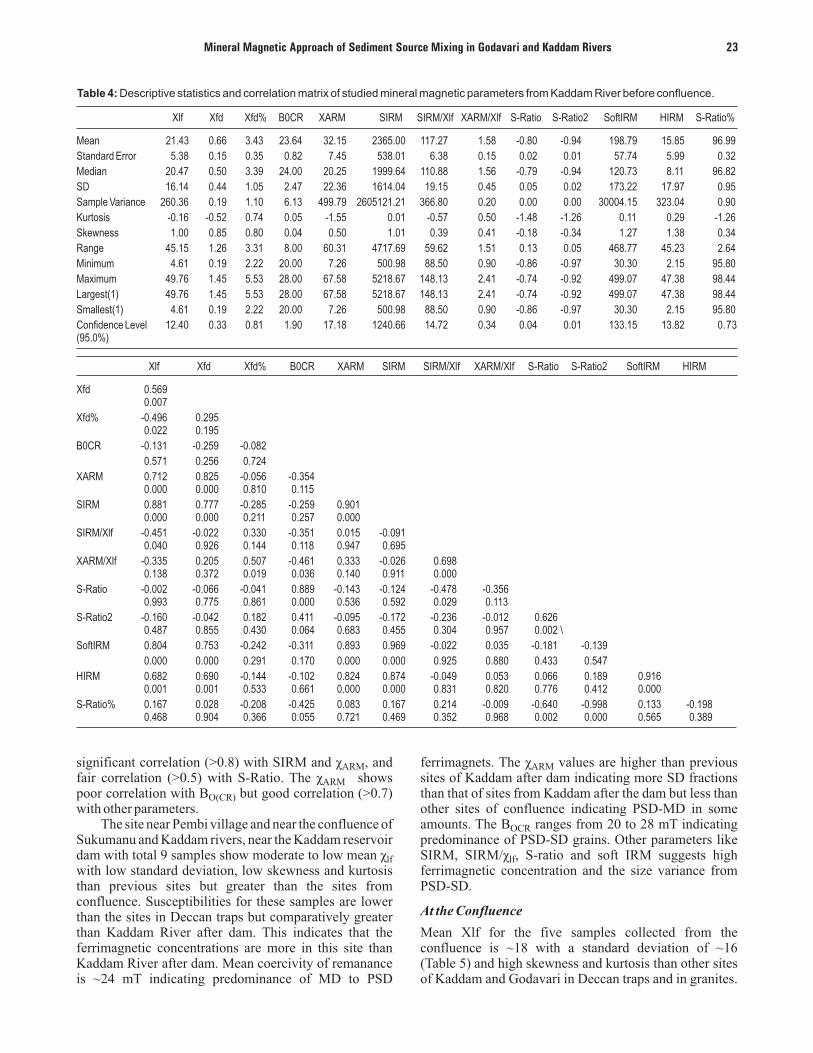
significant correlation (>0.8) with SIRM and , and fair correlation (>0.5) with S-Ratio. The ÷ shows ARM
poor correlation with B but good correlation (>0.7) O(CR)
with other parameters. The site near Pembi village and near the confluence of
Sukumanu and Kaddam rivers, near the Kaddam reservoir dam with total 9 samples show moderate to low mean ÷ lf
with low standard deviation, low skewness and kurtosis than previous sites but greater than the sites from confluence. Susceptibilities for these samples are lower than the sites in Deccan traps but comparatively greater than Kaddam River after dam. This indicates that the ferrimagnetic concentrations are more in this site than Kaddam River after dam. Mean coercivity of remanance is ~24 mT indicating predominance of MD to PSD
÷ARM ferrimagnets. The values are higher than previous sites of Kaddam after dam indicating more SD fractions than that of sites from Kaddam after the dam but less than other sites of confluence indicating PSD-MD in some amounts. The B ranges from 20 to 28 mT indicating OCR
predominance of PSD-SD grains. Other parameters like SIRM, SIRM/÷ , S-ratio and soft IRM suggests high lf
ferrimagnetic concentration and the size variance from PSD-SD.
At the Confluence
Mean Xlf for the five samples collected from the confluence is ~18 with a standard deviation of ~16 (Table 5) and high skewness and kurtosis than other sites of Kaddam and Godavari in Deccan traps and in granites.
÷ARM
Xlf Xfd Xfd% B0CR XARM SIRM SIRM/Xlf XARM/Xlf S-Ratio S-Ratio2 SoftIRM HIRM S-Ratio%
Mean 21.43 0.66 3.43 23.64 32.15 2365.00 117.27 1.58 -0.80 -0.94 198.79 15.85 96.99
Standard Error 5.38 0.15 0.35 0.82 7.45 538.01 6.38 0.15 0.02 0.01 57.74 5.99 0.32
Median 20.47 0.50 3.39 24.00 20.25 1999.64 110.88 1.56 -0.79 -0.94 120.73 8.11 96.82
SD 16.14 0.44 1.05 2.47 22.36 1614.04 19.15 0.45 0.05 0.02 173.22 17.97 0.95
Sample Variance 260.36 0.19 1.10 6.13 499.79 2605121.21 366.80 0.20 0.00 0.00 30004.15 323.04 0.90
Kurtosis -0.16 -0.52 0.74 0.05 -1.55 0.01 -0.57 0.50 -1.48 -1.26 0.11 0.29 -1.26
Skewness 1.00 0.85 0.80 0.04 0.50 1.01 0.39 0.41 -0.18 -0.34 1.27 1.38 0.34
Range 45.15 1.26 3.31 8.00 60.31 4717.69 59.62 1.51 0.13 0.05 468.77 45.23 2.64
Minimum 4.61 0.19 2.22 20.00 7.26 500.98 88.50 0.90 -0.86 -0.97 30.30 2.15 95.80
Maximum 49.76 1.45 5.53 28.00 67.58 5218.67 148.13 2.41 -0.74 -0.92 499.07 47.38 98.44
Largest(1) 49.76 1.45 5.53 28.00 67.58 5218.67 148.13 2.41 -0.74 -0.92 499.07 47.38 98.44
Smallest(1) 4.61 0.19 2.22 20.00 7.26 500.98 88.50 0.90 -0.86 -0.97 30.30 2.15 95.80
Confidence Level 12.40 0.33 0.81 1.90 17.18 1240.66 14.72 0.34 0.04 0.01 133.15 13.82 0.73(95.0%)
Xlf Xfd Xfd% B0CR XARM SIRM SIRM/Xlf XARM/Xlf S-Ratio S-Ratio2 SoftIRM HIRM
Xfd 0.569 0.007
Xfd% -0.496 0.295 0.022 0.195
B0CR -0.131 -0.259 -0.082
0.571 0.256 0.724
XARM 0.712 0.825 -0.056 -0.354 0.000 0.000 0.810 0.115
SIRM 0.881 0.777 -0.285 -0.259 0.9010.000 0.000 0.211 0.257 0.000
SIRM/Xlf -0.451 -0.022 0.330 -0.351 0.015 -0.091 0.040 0.926 0.144 0.118 0.947 0.695
XARM/Xlf -0.335 0.205 0.507 -0.461 0.333 -0.026 0.6980.138 0.372 0.019 0.036 0.140 0.911 0.000
S-Ratio -0.002 -0.066 -0.041 0.889 -0.143 -0.124 -0.478 -0.3560.993 0.775 0.861 0.000 0.536 0.592 0.029 0.113
S-Ratio2 -0.160 -0.042 0.182 0.411 -0.095 -0.172 -0.236 -0.012 0.626 0.487 0.855 0.430 0.064 0.683 0.455 0.304 0.957 0.002 \
SoftIRM 0.804 0.753 -0.242 -0.311 0.893 0.969 -0.022 0.035 -0.181 -0.139
0.000 0.000 0.291 0.170 0.000 0.000 0.925 0.880 0.433 0.547
HIRM 0.682 0.690 -0.144 -0.102 0.824 0.874 -0.049 0.053 0.066 0.189 0.9160.001 0.001 0.533 0.661 0.000 0.000 0.831 0.820 0.776 0.412 0.000
S-Ratio% 0.167 0.028 -0.208 -0.425 0.083 0.167 0.214 -0.009 -0.640 -0.998 0.133 -0.1980.468 0.904 0.366 0.055 0.721 0.469 0.352 0.968 0.002 0.000 0.565 0.389
Table 4: Descriptive statistics and correlation matrix of studied mineral magnetic parameters from Kaddam River before confluence.
Mineral Magnetic Approach of Sediment Source Mixing in Godavari and Kaddam Rivers 23
At this confluence the concentration of ferrimagnetic minerals increases than that of the sites of Kaddam profile. However, it is less than the sites in Deccan traps and that of the intermediate values of pink granites. This is probably because a large population of dia- and paramagnetic minerals from the Kaddam River gets mixed into producing dilution effect. The grain size varies from MD to SD with predominance of SD fraction. The ÷ lf
shows poor correlation (~0.3) with B , but significant O(CR)
correlation (>0.8) with other parameters. B shows (O)CR
poor correlation coefficient (> 0.4) with SIRM and ÷ ARM
and that of > 0.7 with S-Ratio. The S-ratio has significant correlation with SIRM and ÷ (> 0.8) and the SIRM too ARM
has significant correlation (> 0.9) with ÷ . ARM
Mean coercivity of remanance is ~38 mT indicating
predominance of SD ferrimagnetic grains. The values are lower than other sites indicating relatively higher PSD-SD grains than SD grains. The B ranges O(CR)
from 56 to 9 mT indicating large variation in grains from MD-SD. Other factors such as SIRM/÷ and S-ratio lf
suggest that the ferrimagnetic concentration and size mainly varies from MD to PSD.
After the Confluence
This site is near Kalamadugu village where 5 samples were studied. It shows moderate to low ÷ (~18) with a lf
standard deviation of ~20 (Table 6). The skewness and kurtosis of these samples are lower than the previous sites of confluence. Susceptibilities are lower than preceding sites suggesting the presence of ferrimagnetic MD grains.
÷ARM
Xlf Xfd Xfd% B0CR XARM SIRM SIRM/Xlf XARM/Xlf S-Ratio S-Ratio2 SoftIRM HIRM S-Ratio%
Mean 18.23 0.47 3.33 37.56 20.04 2561.17 132.73 1.08 -0.65 -0.93 135.67 17.39 96.52
Standard Error 7.13 0.15 1.20 3.06 9.01 1232.05 15.31 0.11 0.03 0.02 64.62 10.27 0.90
Median 12.32 0.26 2.03 35.80 11.26 1276.39 137.95 1.22 -0.64 -0.94 66.82 4.76 97.04
SD 15.93 0.33 2.68 6.84 20.14 2754.94 34.23 0.25 0.07 0.04 144.48 22.97 2.02
Sample Variance 253.86 0.11 7.20 46.79 405.54 7589676.95 1171.70 0.06 0.01 0.00 20875.75 527.85 4.09
Kurtosis 4.06 -1.61 3.66 -2.20 4.96 4.81 -2.10 -2.08 0.05 0.53 4.76 3.58 0.53
Skewness 1.99 0.90 1.91 0.28 2.23 2.19 -0.37 -0.76 0.67 1.07 2.17 1.90 -1.07
Range 38.43 0.72 6.41 16.20 46.29 6379.81 79.13 0.55 0.18 0.10 332.17 54.02 5.00
Minimum 7.63 0.22 1.56 29.80 9.74 1087.34 88.26 0.74 -0.72 -0.97 60.46 3.08 93.38
Maximum 46.06 0.94 7.97 46.00 56.03 7467.15 167.39 1.29 -0.54 -0.87 392.64 57.10 98.38
Largest(1) 46.06 0.94 7.97 46.00 56.03 7467.15 167.39 1.29 -0.54 -0.87 392.64 57.10 98.38
Smallest(1) 7.63 0.22 1.56 29.80 9.74 1087.34 88.26 0.74 -0.72 -0.97 60.46 3.08 93.38
Confidence Level 19.78 0.40 3.33 8.49 25.00 3420.71 42.50 0.31 0.09 0.05 179.40 28.53 2.51(95.0%)
Xlf Xfd Xfd% B0CR XARM SIRM SIRM/Xlf XARM/Xlf S-Ratio S-Ratio2 SoftIRM HIRM
Xfd 0.7230.168
Xfd% -0.395 0.3490.511 0.565
B0CR 0.317 0.367 0.061 0.603 0.544 0.922
XARM 0.983 0.799 -0.273 0.431 0.003 0.105 0.657 0.469
SIRM 0.986 0.779 -0.302 0.454 0.997 0.002 0.121 0.622 0.442 0.000
SIRM/Xlf 0.325 0.529 0.269 0.969 0.454 0.471 0.594 0.359 0.662 0.007 0.442 0.423
XARM/Xlf 0.094 0.571 0.622 0.743 0.272 0.249 0.8390.880 0.315 0.263 0.151 0.658 0.686 0.075
S-Ratio 0.827 0.553 -0.374 0.712 0.835 0.871 0.676 0.2620.084 0.333 0.535 0.177 0.079 0.055 0.210 0.670
S-Ratio2 0.367 -0.153 -0.678 -0.297 0.199 0.250 -0.369 -0.786 0.3430.543 0.805 0.209 0.627 0.748 0.685 0.542 0.115 0.572
SoftIRM 0.992 0.767 -0.326 0.418 0.997 0.999 0.433 0.213 0.857 0.273 0.001 0.130 0.592 0.483 0.000 0.000 0.467 0.731 0.063 0.657
HIRM 0.993 0.709 -0.399 0.375 0.973 0.985 0.380 0.097 0.880 0.413 0.988 0.001 0.180 0.506 0.534 0.005 0.002 0.528 0.877 0.049 0.489 0.002
S-Ratio% -0.399 0.106 0.658 0.279 -0.234 -0.285 0.341 0.760 -0.372 -0.999 -0.307 -0.4460.505 0.865 0.227 0.650 0.704 0.642 0.574 0.136 0.537 0.000 0.615 0.451
Table 5: Descriptive statistics and correlation matrix of studied mineral magnetic parameters from 'at confluence of Kaddam and Godavari River'.
Sharad Porate and Others24
Mean coercivity of remanance is ~38 mT indicating predominance of ferrimagnetic SD grains. The ÷ ARM
values are lower than that of the confluence, but higher than other sites indicating grain size variation in the range of SD-PSD. The values of B show a range of 53 to O(CR)
7mT indicating larger variation in grain size from SD to MD. Other factors such as SIRM/÷ and S-ratio suggest lf
ferrimagnetic concentrations, and the size varies mainly from MD to SD. This site after confluence shows higher concentration of ferrimagnetic minerals than that at the confluence. The grain size varies from PSD-SD with predominance of SD. The ÷ shows negative/insignificant lf
correlation with B and S-ratio (-0.05, > 0.3) but O(CR)
significant correlation (>0.9) with SIRM and ÷ . The ARM
÷ further shows significant correlation (>0.8) with ARM
SIRM but poor correlation (>0.2) with S-Ratio.
Mineral Magnetic Variation as Bivariate Plots
The mineral magnetic studies have been greatly improved by standardization of data, procedures and presentation methods for global comparisons (Thompson and Oldfield, 1986; Evans and Heller, 1994; Waldon et al., 1997). These standardizations using natural (bulk) samples as well as mineral separates and mixtures are validated through several case studies over the years. Some of these plots need site-specific approach while many are generalized based on natural separates. We used four of the most common standard plots to infer the present data as below;
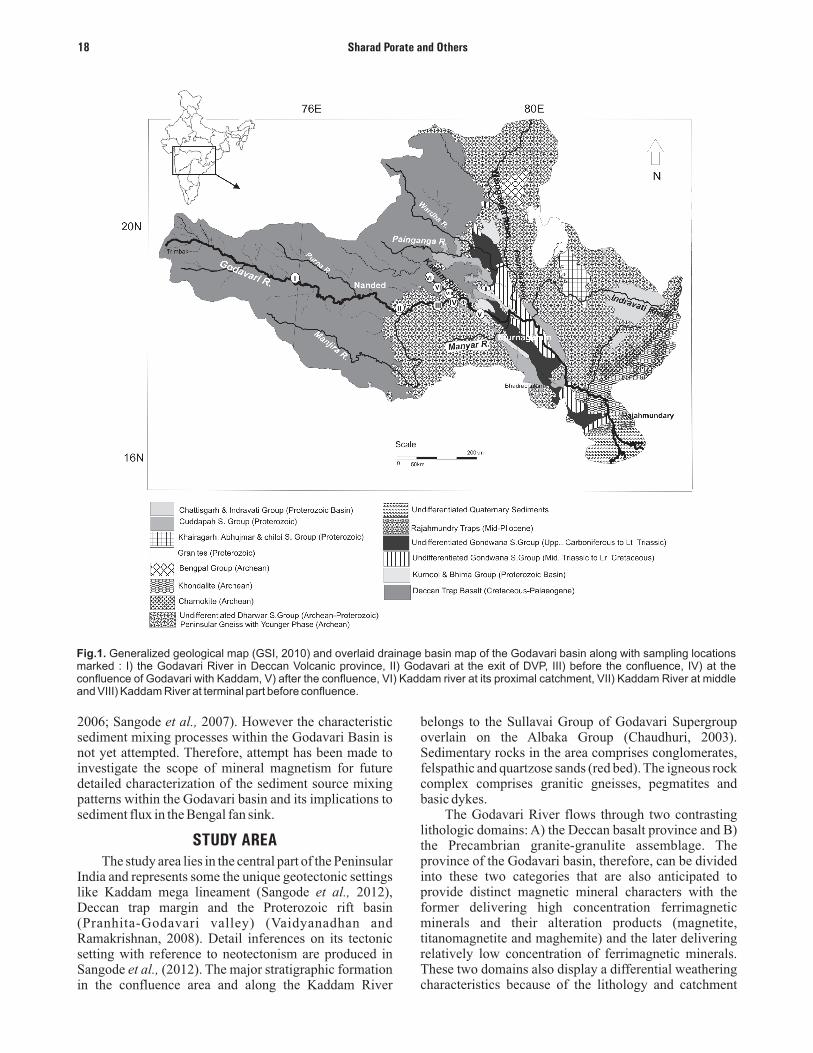
1. B vs. SIRM/ biplot after Thompson and Oldfield OCR
(1986) to depict the mineralogy and grain size domains (Fig. 2).
2. SIRM vs. ÷ biplot to depict the grain size and lf
÷lf
Xlf Xfd Xfd% B0CR XARM SIRM SIRM/Xlf XARM/Xlf S-Ratio S-Ratio2 SoftIRM HIRM S-Ratio%
Mean 17.87 0.43 2.97 37.78 25.92 2615.37 130.82 1.82 -0.62 -0.91 162.60 23.25 95.46
Standard Error 9.07 0.19 0.39 2.23 11.13 1468.72 15.38 0.23 0.03 0.02 90.15 14.39 0.95
Median 5.79 0.15 2.80 39.10 9.16 799.89 138.26 1.84 -0.64 -0.91 37.13 2.87 95.45
SD 20.29 0.42 0.87 4.99 24.89 3284.15 34.39 0.52 0.08 0.04 201.59 32.17 2.12
Sample Variance 411.59 0.17 0.76 24.85 619.43 10785626.34 1182.69 0.27 0.01 0.00 40639.56 1035.03 4.47
Kurtosis -0.45 -2.91 1.23 0.61 -3.33 1.40 2.17 -0.08 -0.96 1.15 -0.45 1.55 1.15
Skewness 1.10 0.67 0.82 -1.12 0.60 1.45 -1.38 -0.25 -0.15 0.75 1.11 1.49 -0.75
Range 45.70 0.86 2.35 12.00 46.44 7702.95 89.01 1.38 0.19 0.11 455.30 73.49 5.69
Minimum 2.91 0.09 1.96 30.00 6.90 245.13 74.50 1.10 -0.72 -0.96 12.86 2.31 92.24
Maximum 48.61 0.95 4.31 42.00 53.34 7948.08 163.51 2.48 -0.53 -0.84 468.16 75.80 97.93
Largest(1) 48.61 0.95 4.31 42.00 53.34 7948.08 163.51 2.48 -0.53 -0.84 468.16 75.80 97.93
Smallest(1) 2.91 0.09 1.96 30.00 6.90 245.13 74.50 1.10 -0.72 -0.96 12.86 2.31 92.24
Confidence Level 25.19 0.52 1.08 6.19 30.90 4077.81 42.70 0.65 0.09 0.05 250.31 39.95 2.63(95.0%)
Xlf Xfd Xfd% B0CR XARM SIRM SIRM/Xlf XARM/Xlf S-Ratio S-Ratio2 SoftIRM HIRM
Xfd 0.972 0.006
Xfd% -0.722 -0.652 0.168 0.233
B0CR -0.052 -0.246 0.225
0.934 0.690 0.716
XARM 0.940 0.992 -0.639 -0.354 0.018 0.001 0.246 0.559
SIRM 0.991 0.933 -0.744 0.058 0.888 0.001 0.021 0.150 0.926 0.044
SIRM/Xlf 0.496 0.397 -0.882 -0.087 0.393 0.544 0.395 0.509 0.048 0.889 0.512 0.344
XARM/Xlf -0.778 -0.696 0.737 -0.055 -0.632 -0.799 -0.386 0.121 0.192 0.155 0.930 0.252 0.105 0.521
S-Ratio 0.320 0.283 0.361 0.605 0.216 0.334 -0.420 -0.090 0.599 0.645 0.551 0.280 0.727 0.583 0.482 0.886
S-Ratio2 0.053 0.077 0.636 0.450 0.035 0.037 -0.720 0.121 0.929
0.933 0.902 0.249 0.447 0.955 0.953 0.170 0.847 0.023
SoftIRM 1.000 0.971 -0.725 -0.052 0.940 0.991 0.512 -0.763 0.317 0.045 0.000 0.006 0.166 0.934 0.018 0.001 0.378 0.133 0.603 0.942
HIRM 0.989 0.930 -0.700 0.094 0.883 0.998 0.507 -0.775 0.394 0.098 0.989
0.001 0.022 0.188 0.880 0.047 0.000 0.383 0.124 0.512 0.875 0.001
S-Ratio% -0.065 -0.096 -0.629 -0.423 -0.055 -0.045 0.726 -0.109 -0.923 -0.999 -0.057 -0.106 0.918 0.879 0.255 0.478 0.930 0.942 0.165 0.861 0.025 0.000 0.928 0.865
Table 6: Descriptive statistics and correlation matrix of studied mineral magnetic parameters from 'after the confluence in Godavari'.
Mineral Magnetic Approach of Sediment Source Mixing in Godavari and Kaddam Rivers 25
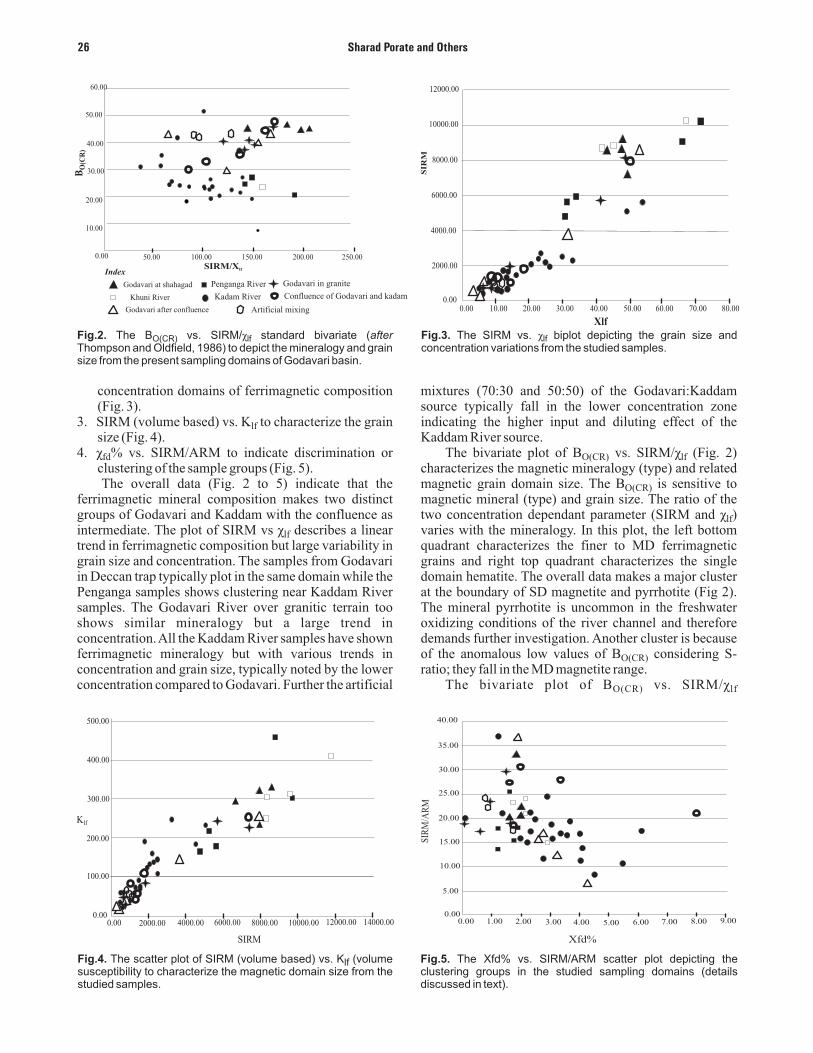
concentration domains of ferrimagnetic composition (Fig. 3).
3. SIRM (volume based) vs. K to characterize the grain lf
size (Fig. 4).4. ÷ % vs. SIRM/ARM to indicate discrimination or
clustering of the sample groups (Fig. 5). The overall data (Fig. 2 to 5) indicate that the
ferrimagnetic mineral composition makes two distinct groups of Godavari and Kaddam with the confluence as intermediate. The plot of SIRM vs ÷ describes a linear lf
trend in ferrimagnetic composition but large variability in grain size and concentration. The samples from Godavari in Deccan trap typically plot in the same domain while the Penganga samples shows clustering near Kaddam River samples. The Godavari River over granitic terrain too shows similar mineralogy but a large trend in concentration. All the Kaddam River samples have shown ferrimagnetic mineralogy but with various trends in concentration and grain size, typically noted by the lower concentration compared to Godavari. Further the artificial
fd
mixtures (70:30 and 50:50) of the Godavari:Kaddam source typically fall in the lower concentration zone indicating the higher input and diluting effect of the Kaddam River source.
The bivariate plot of B vs. SIRM/÷ (Fig. 2) O(CR) lf
characterizes the magnetic mineralogy (type) and related magnetic grain domain size. The B is sensitive to O(CR)
magnetic mineral (type) and grain size. The ratio of the two concentration dependant parameter (SIRM and ÷ ) lf
varies with the mineralogy. In this plot, the left bottom quadrant characterizes the finer to MD ferrimagnetic grains and right top quadrant characterizes the single domain hematite. The overall data makes a major cluster at the boundary of SD magnetite and pyrrhotite (Fig 2). The mineral pyrrhotite is uncommon in the freshwater oxidizing conditions of the river channel and therefore demands further investigation. Another cluster is because of the anomalous low values of B considering S-O(CR)
ratio; they fall in the MD magnetite range.The bivariate plot of B vs. SIRM/÷ O(CR) lf
0.00 50.00 100.00 150.00 200.00 250.00
10.00
20.00
30.00
40.00
50.00
60.00
SIRM/Xlf
Khuni River
Penganga River Godavari in granite
Confluence of Godavari and kadam
Godavari after confluence
Kadam River
Godavari at shahagad
Artificial mixing
Index
BO
(CR
)
Fig.2. The B vs. SIRM/÷ standard bivariate (after O(CR) lfThompson and Oldfield, 1986) to depict the mineralogy and grain size from the present sampling domains of Godavari basin.
RS
IM
0.00 10.00 20.00 30.00 40.00 50.00 60.00 70.00 80.000.00
2000.00
4000.00
6000.00
8000.00
10000.00
12000.00
XlfFig.3. The SIRM vs. ÷ biplot depicting the grain size and lfconcentration variations from the studied samples.
14000.0012000.0010000.008000.006000.004000.002000.000.000.00
100.00
200.00
300.00
400.00
500.00
SIRM
Klf
Fig.4. The scatter plot of SIRM (volume based) vs. K (volume lfsusceptibility to characterize the magnetic domain size from the studied samples.
Xfd%
IR/
SM
AR
M
9.008.007.006.005.004.003.002.001.000.000.00
5.00
10.00
15.00
20.00
25.00
30.00
35.00
40.00
Fig.5. The Xfd% vs. SIRM/ARM scatter plot depicting the clustering groups in the studied sampling domains (details discussed in text).
Sharad Porate and Others26
characterizes the magnetic mineralogy (type) and related magnetic grain sizes. In this plot, Godavari in Deccan trap, the Penganga, and Godavari in granite terrain shows similar clusters that are characteristic of predominantly SD magnetite. However, in Penganga sediments another cluster can be seen depicting finer grain size (SP fraction). The plots for Kaddam River show similar characteristics of B and SIRM/÷ . All these plots are also confined O(CR) lf
to single domain magnetite. At the confluence and after the confluence, the Kaddam and Godavari shows single cluster and indicates SD magnetite that matches with artificial mixing. The SIRM vs Klf bi-plot (Fig. 4) shows a linear trend in magnetic concentration and grain size that may be characteristic of various profiles. This indicates existence of large variation in grain size and concentration of the ferrimagnetic mineralogy. The large diagonal linear trend infers variation in concentration of magnetite within a restricted grain size trend.
Kaddam and Penganga show variation in mineral concentration within restricted grain size. The Kaddam River shows more clustering of grain size than in Deccan sediments. The Kaddam River near the dam and before dam shows variation in mineral concentration with restricted grain size. There is variation in mineral concentration with grain size cluster in confluence area and after the confluence. The artificial mixing on the other hand shows clustering in mineralogy as well as grain size.
Godavari River in the Deccan trap and the Penganga River show restricted mineral concentration as well as linear trend in grain size. This indicates that the concentration and grain size is not much varied between Godavari and Penganga. Godavari in granitic terrain however shows large variation in mineral concentration indicating mixing within restricted grain size range. Kaddam profile shows restricted grain size variation for all the samples.
Major clusters can be seen in ÷ % below 4% and fd
SIRM/ARM in between 100 to 170 (Fig. 5). This indicates that there are SD grains of similar mineralogy. For Kaddam River, all profiles show ÷ < 7% and the fd
SIRM/ARM between 100 and 170. This indicates variation of SD-PSD grains within similar mineralogy. The ÷ % is <5 after the confluence but it vary in the fd
confluence samples from 1 to 8%. The SIRM/ARM varies at the confluence and after the confluence but is restricted in artificial mixing which indicates variation from SD-PSD without mineralogical variation.
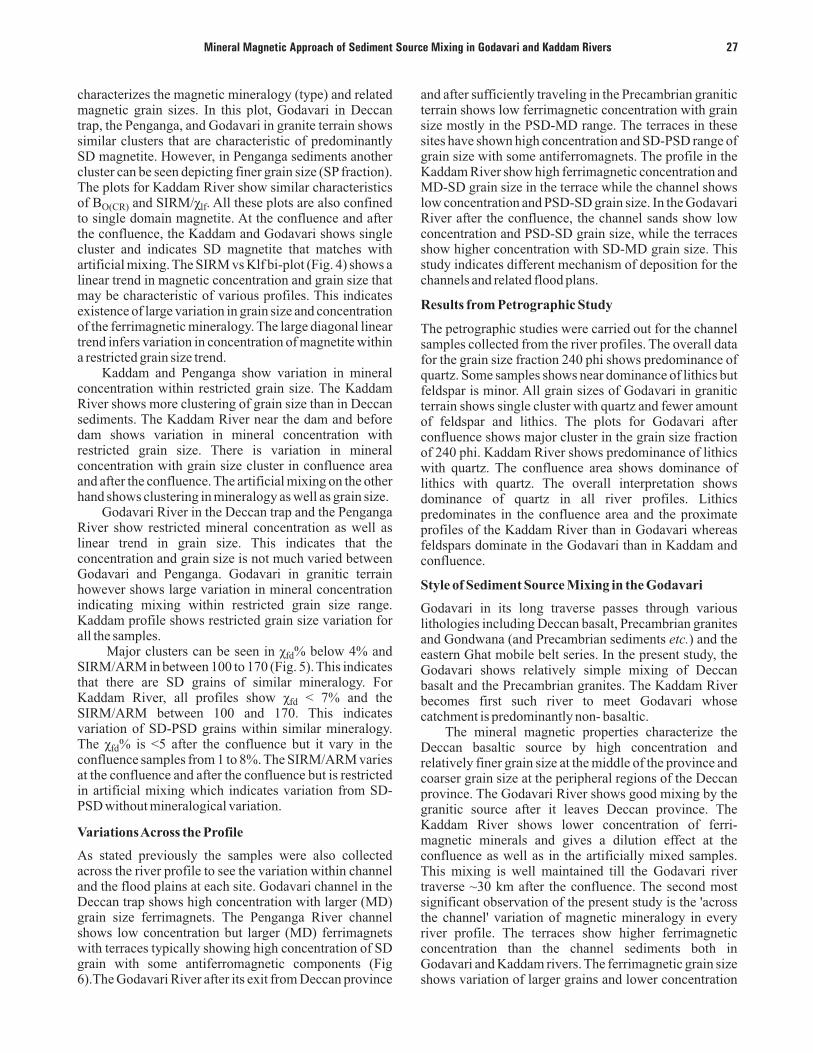
Variations Across the Profile
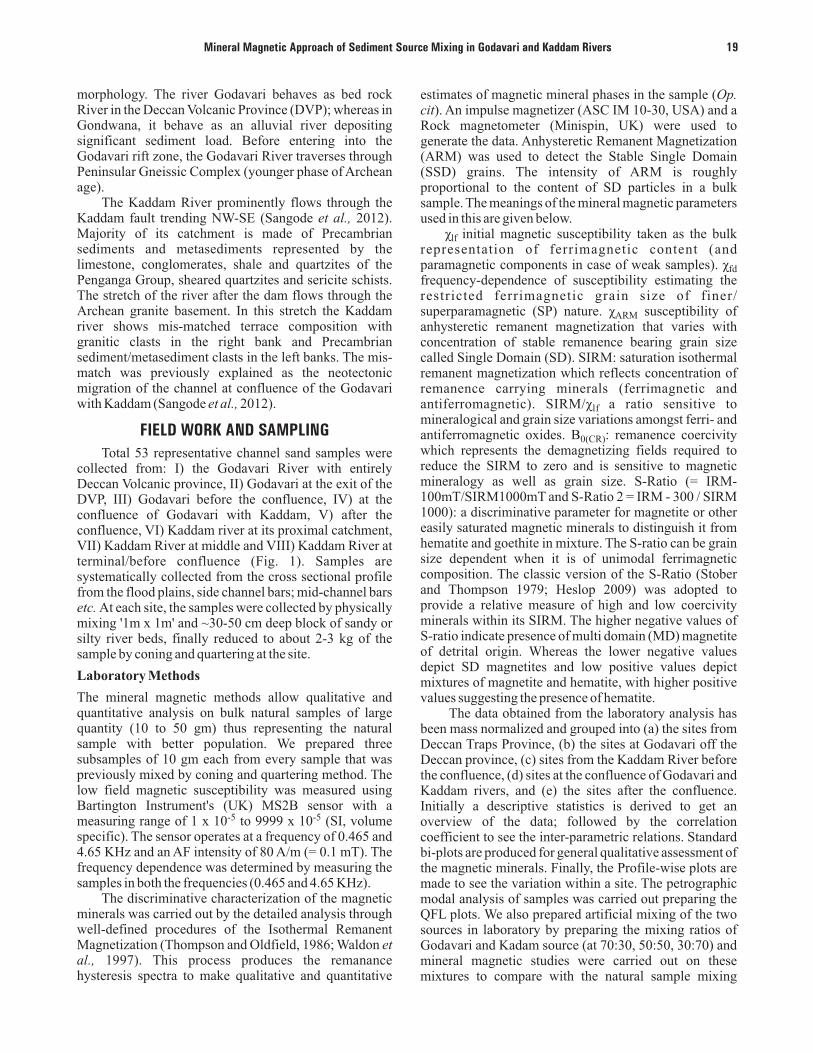
As stated previously the samples were also collected across the river profile to see the variation within channel and the flood plains at each site. Godavari channel in the Deccan trap shows high concentration with larger (MD) grain size ferrimagnets. The Penganga River channel shows low concentration but larger (MD) ferrimagnets with terraces typically showing high concentration of SD grain with some antiferromagnetic components (Fig 6).The Godavari River after its exit from Deccan province
and after sufficiently traveling in the Precambrian granitic terrain shows low ferrimagnetic concentration with grain size mostly in the PSD-MD range. The terraces in these sites have shown high concentration and SD-PSD range of grain size with some antiferromagnets. The profile in the Kaddam River show high ferrimagnetic concentration and MD-SD grain size in the terrace while the channel shows low concentration and PSD-SD grain size. In the Godavari River after the confluence, the channel sands show low concentration and PSD-SD grain size, while the terraces show higher concentration with SD-MD grain size. This study indicates different mechanism of deposition for the channels and related flood plans.
Results from Petrographic Study
The petrographic studies were carried out for the channel samples collected from the river profiles. The overall data for the grain size fraction 240 phi shows predominance of quartz. Some samples shows near dominance of lithics but feldspar is minor. All grain sizes of Godavari in granitic terrain shows single cluster with quartz and fewer amount of feldspar and lithics. The plots for Godavari after confluence shows major cluster in the grain size fraction of 240 phi. Kaddam River shows predominance of lithics with quartz. The confluence area shows dominance of lithics with quartz. The overall interpretation shows dominance of quartz in all river profiles. Lithics predominates in the confluence area and the proximate profiles of the Kaddam River than in Godavari whereas feldspars dominate in the Godavari than in Kaddam and confluence.
Style of Sediment Source Mixing in the Godavari
Godavari in its long traverse passes through various lithologies including Deccan basalt, Precambrian granites and Gondwana (and Precambrian sediments etc.) and the eastern Ghat mobile belt series. In the present study, the Godavari shows relatively simple mixing of Deccan basalt and the Precambrian granites. The Kaddam River becomes first such river to meet Godavari whose catchment is predominantly non- basaltic.
The mineral magnetic properties characterize the Deccan basaltic source by high concentration and relatively finer grain size at the middle of the province and coarser grain size at the peripheral regions of the Deccan province. The Godavari River shows good mixing by the granitic source after it leaves Deccan province. The Kaddam River shows lower concentration of ferri-magnetic minerals and gives a dilution effect at the confluence as well as in the artificially mixed samples. This mixing is well maintained till the Godavari river traverse ~30 km after the confluence. The second most significant observation of the present study is the 'across the channel' variation of magnetic mineralogy in every river profile. The terraces show higher ferrimagnetic concentration than the channel sediments both in Godavari and Kaddam rivers. The ferrimagnetic grain size shows variation of larger grains and lower concentration
Mineral Magnetic Approach of Sediment Source Mixing in Godavari and Kaddam Rivers 27
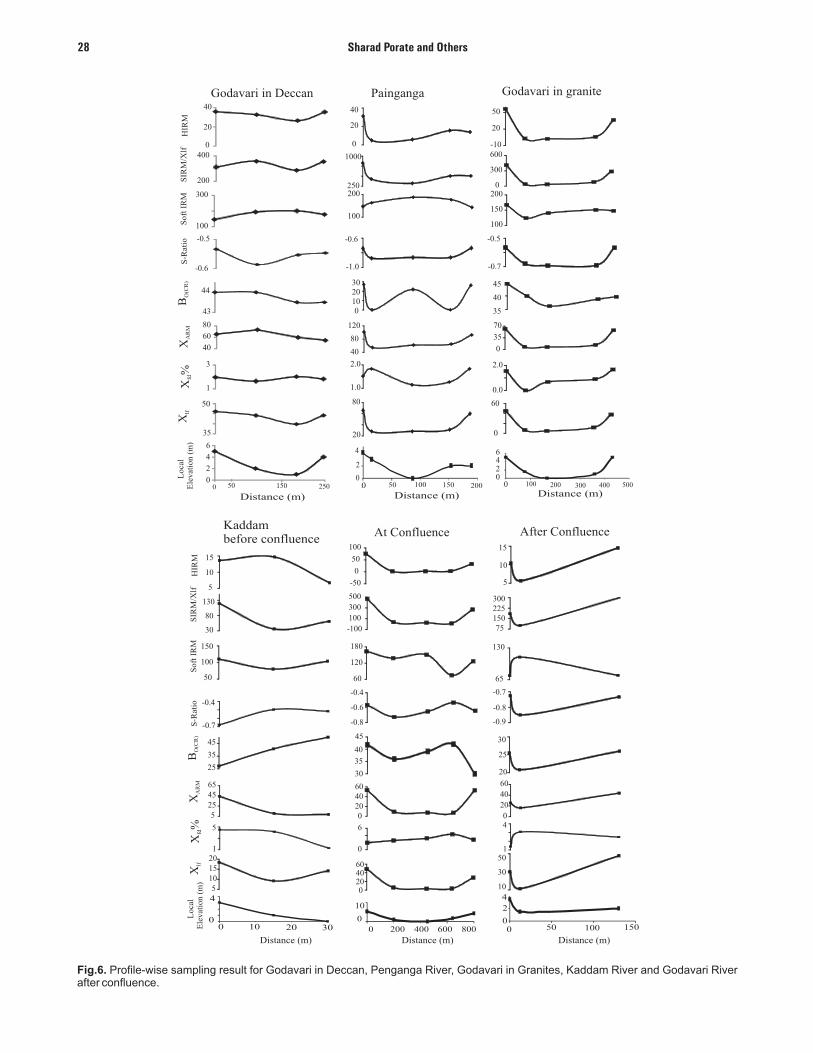
Fig.6. Profile-wise sampling result for Godavari in Deccan, Penganga River, Godavari in Granites, Kaddam River and Godavari River after confluence.
Sharad Porate and Others28
L
oca
li
nE
lev
ato
(m
)X
flX
AM
RB
OC
R)
(R
ioS
-at
oM
Sft
IR
SIR
M/X
lfH
IRM
%X
fd
0246
0 100 200 300 400 500
Godavari in granite
0
60
0.0
2.0
0
35
70
-0.7
-0.5
100
150
2000
300
600-10
20
50
35
40
45
Distance (m)
-0.6
1000
0
2
4
0 50 100 150 200
Painganga
20
80
1.0
2.0
40
80
120
-1.0
100
200250
0
20
40
0102030
-0.6
100
300
0
2
4
6
0 150 250
35
50
1
3
40
60
80
43
44
-0.5
200
400
20
40
Godavari in Deccan
0
50
Distance (m) Distance (m)
501
4
-0.9
-0.8
-0.7
65
130
75150225300
5
10
15
0
20
40
60
20
25
30
After Confluence
30
10
0
2
4
0 50 100 150
Distance (m)
0
6
0204060
-0.8
-0.6
-0.4
60
120
180
-100
100
300
500
-50
0
50
100
30
35
40
45
At Confluence
0204060
0
10
0 200 400 600 800
Distance (m)
Kaddambefore confluence
1
5
5254565
-0.7
-0.4
50
100
150
5
10
15
20
30
80
130
25
35
45
15
510
0
4
0 10 20 30
Distance (m)
c
L
oal
El
in
()
evat
o
mX
lfX
AM
RB
O(C
R)
SR
io-
atS
of
IM
t R
IM
/l
SR
Xf
HIR
MX
%fd
in the channel and smaller grains and higher concentration over terraces. This shows a source differentiation by terraces receiving the distal provinces during monsoon and the channels depositing relatively local source. This also indicates that the major deposition during monsoon occur on terraces while the channel erodes the bedrock.
CONCLUSIONS
The Godavari River in its long course is joined by several tributaries representing varied catchment lithology. The Kaddam River represents first such tributary of the catchment lithology different than the Deccan basalt to join the Godavari from the Deccan volcanic province anticipating the first order mixing. The studies based on mineral magnetism (along with petrographic observations) primarily indicate
varied controls on sediment transport, mixing and deposition for the flood plains and the channel sediments. The floodplains show high transport efficiency (but low mixing) due to its control by monsoon floods. On the contrary the channel sediments show low transport efficiency and highly localized mixing that appears to be controlled by various sedimentologic processes demanding further detailed study.
ACKNOWLEDGEMENTS
The research work was funded by the Department of Science and technology, New Delhi (grant SR/S4/ES-409/2009). Head, Department of Geology, University of Pune is acknowledged for providing necessary facilities. We are thankful to Dr. M. Mohanty (DST) for the generous and prompt funding.
REFERENCES
Bikshamaiah, G. and Subramanian, V. (1980). Chemical and Sediment Mass Transfer in the Godavari River Basin in India. Jour. Hydro., v.46, pp.331-342.
Bradshaw, R. and Thompson, R. (1985). The use of magnetic measurements to investigate the mineralogy of Icelandic lake sediments and to study catchment processes. Boreas, v.14, pp.203-215.
Caitcheon, G.G. (1998). The application of environmental Magnetism to sediment source tracing: A new approach, CSIRO Land and Water technical report no. 21/98.
Chaudhuri, A.K. (2003). Stratigraphy and palaeogeography of the Godavari Supergroup in the south-central Pranhita-Godavari Valley, south India. Jour. Asian Earth Sci., v.21(6), pp.595-611.
Dearing, J.A. (1992). Sediment yields and sources in a Welsh upland lake-catchment during the past 800 years. Earth Sur. Proc. and Landforms, v.17, pp.1-22.
Dekkers, M.J. (1997). Environmental magnetism: an introduction, Geologie en Mijnbouw, v.76(1), pp.163-182.
Evans, M.E. and Heller, F. (1994). Magnetic Enhancement and Palaeoclimate: Study of a Loess/Palaeosol Couplet across the Loess Plateau of China. Geophy. Jour. Int., v.117, pp.257-264.
GSI (2010). Geological Map of India. Geological Survey of India, Map and Cartography Division, Hyderabad.
Haiyan, L., Shihong, Z., Nianqiao, F. and Hongqiang, W. (2006). Magnetic records of Core MD77-181 in the Bay of Bengal and their paleoenvironmental implications. Chinese Sci. Bulletin, v.51(15), pp.1884-1893.
Heslop, D. (2009). On the statistical analysis of the rock magnetic S-ratio. Geophys. Jour. Int., v.178, pp.159-161.
Holeman, J.N. (1968). The sediment yield of major rivers of the world. Water Resources. Res., v.4, pp.737-747.
Lizhong‚ Y. and Weiguo‚ Z. (1999). Quantitative approach to sediment source identification by using magnetic diagnosis model. Chinese Sci. Bull.‚ v.44‚ pp.504-510.
Milliman, J.D. and Meade, R.H. (1983). World-wide delivery of river sediments to the oceans. Jour. Geol., v.91, pp.1-21.
Oldfield, F., Rummery, T.A., Thompson, R. and Walling, D.E. (1979). Identification of suspended sediment sources by means of magnetic measurements: some preliminary results. Water Resources Res., v.15(2), pp.211-218.
Sagar, W.W., Hall, S.A. (1990). Magnetic properties of black mud turbidites form ODP leg 116, distal Bengal fan, Indian Ocean. In: J.R. Cochran and D.A.V.O Stow et al., Proc of the Ocean Drilling Program. Scientific Results, v.116, pp.317-336.
Sangode, S.J., Meshram, D.C., Kulkarni, Y.R., Gudadhe, S.S., Malpe, D.B., Herlekar, M.A. (2012). Neotectonic Response of the Godavari and Kaddam Rivers in Andhra Pradesh, India: Implications to Quaternary Reactivation of old fracture system. Jour. Geol. Soc. India, v.81, pp.459-471.
Sangode, S.J., Sinha, R., Phartiyal, B., Chauhan, O.S., Mazari, R.K., Bagati, T.N., Suresh, N., Mishra, S., Kumar, R., Bhattacharjee, P. (2007). Environmental magnetic studies on some Quaternary sediments of varied depositional settings in the Indian sub-continent. Quaternary Int., v.159, pp.102-118.
Sangode, S.J., Suresh, N. and Bagati, T.N. (2001). Godavari source in the Bengal fan sediments: results from magnetic susceptibility dispersal pattern, Curr. Sci., v.85(5), pp.660-664.
Schumm, S. A. and Rea, D.K. (1995). Sediment yield from disturbed earth systems. Geology, v.23(5), pp.391-394.
Shankar, R., Thompson, R. and Galloway, R.B. (1994). Sediment source modelling: unmixing of artificial magnetisation and natural radioactivity measurements. Earth Planet. Sci. Lett., v.126, pp.411-420.
Stober, J.C., Thompson, R. (1979). An investigation into the source of magnetic minerals in some Finnish lake sediments. Earth planet. Sci. Lett., v.45, pp.464-474.
Subramanian, V. (1987). Environmental geochemistry of Indian river basins - a review. Jour. Geol. Soc. India, v.29, pp.205-220.
Thompson, R. and Morton, D.J. (1979). Magnetic susceptibility and particle-size distribution in recent sediments of the Loch Lomond drainage basin, Scotland. Jour. Sedi. Petrol., v.49, pp.801-812.
Thompson, R. and Oldfield, F. (1986). Environmental Magnetism. Allen & Unwin, London, pp.20-22.
Thompson, R., Batterbee, R.W., O'Sullivan, P.E. and Oldfield, F. (1975). Magnetic susceptibility of lake sediments. Limnol. Oceanog., v.20, pp.687-698.
Vaidyanadhan, R. and Ramakrishnan, M. (2008). Geology
Mineral Magnetic Approach of Sediment Source Mixing in Godavari and Kaddam Rivers 29
of India, v.2, Geological Society of India, Bangalore, 960p.Vaithiyanathan, P., Subramanian, V. and Ramnathan, A.L.
(1988). Erosion, transport and deposition of sediments by the tropical rivers of India, Sediment Budgets. Proceedings of the Porto Alegre Symposium, December.
Walden, J, Slattery, M.C and Burt, T.P (1997). Use of mineral magnetic measurements to fingerprint suspended sediment sources: approaches and techniques for data
analysis. Jour. Hydrol., v.202(1-4), pp.353-372.Walling, D.E., Woodward, C. and Nicholas, A.P. (1993). A
multi-parameter approach to fingerprinting suspended sediment sources. Tracers in Hydrology. Proc. Yokohama Symposium, v.215, pp.329-338.
Wasson, R.J. (2003). A sediment budget for the Ganga-Brahmaputra catchment. Curr. Sci., v.84(8), pp.1041-1047.
(Received : 4 May 2012; Revised form accepted : 10 June 2012)
Sharad Porate and Others30
Top Related
Copyright © 2022 FDOKUMEN

