


Bahasa
Halaman
Hukum

Finnish Environment Institute
REPORTS OF FINNISH ENVIRONMENT INSTITUTE 3 | 2009
Climate change impacts on sub-arctic palsa mires and greenhouse gas feedbacksProceedings of the PALSALARM symposiumAbisko, Sweden 28–30 October 2008
Stefan Fronzek, Margareta Johansson, Torben R. Christensen, Timothy R. Carter, Thomas Friborg and Miska Luoto (eds.)

REPORTS OF FINNISH ENVIRONMENT INSTITUTE 3 | 2009
Climate change impacts on sub-arctic palsa mires and greenhouse gas feedbacks
Proceedings of the PALSALARM symposiumAbisko, Sweden 28–30 October 2008
Stefan Fronzek, Margareta Johansson, Torben R. Christensen, Timothy R. Carter, Thomas Friborg and Miska Luoto (eds.)
Helsinki 2009
FINNISH ENVIRONMENT INSTITUTE
REPORTS OF FINNISH ENVIRONMENT INSTITUTE 3 | 2009 Finnish Environment InstituteResearch Department
Layout: Seija TurunenCover photo: Palsas west of Järämä, 50 km north of Kiruna. 500-600 m.a.s.l., 19 August 2005. B. Sannel
Publication is available on the internet:www.environment.fi/publications
Edita Prima Ltd, Helsinki 2009
ISBN 978-952-11-3361-9 (nid.)ISBN 978-952-11-3362-6 (PDF)ISSN 1238-7312 (pain.)ISSN 1796-1637 (verkkoj.)
3Reports of Finnish Envirornment Institute 3 | 2009
CONTENT
1 Preface ............................................................................................................................5
Stefan Fronzek, Margareta Johansson, Torben R. Christensen, Timothy R. Carter, Thomas Friborg and Miska Luoto
THEME 1: Spatial distributions of palsa mires and permafrost and its current status ...................................................................................................................7
2 Climate change and permafrost in the Arctic ..............................................9
Oleg Anisimov
3 Physical and environmental properties of palsa formations .................12
Matti Seppälä
4 Norwegian monitoring program for palsa peatlands ...............................15
Annika Hofgaard
5 Application of remote sensing in detection and monitoring of palsa mires .........................................................................................17
Hans Tømmervik
6 Modelling the spatial distribution of palsa mires using climate change scenarios ...........................................................................................................................20
Stefan Fronzek, Timothy R. Carter and Miska Luoto
7 Future climate effects on peat plateaus – An experimental manipulation at Abisko ..............................................................................................22
Margareta Johansson, Terry V. Callaghan, Jonas Åkerman, Marcin Jackowicz-Korczynski, Torben R. Christensen
THEME 2: Fluxes and budgets, GHG feedbacks of palsa mires ...............25
8 Fluxes and budgets, GHG feedbacks of palsa mires .................................27
Patrick M. Crill
9 Degrading palsa mires in Northern Europe: potential change in green-house gas fluxes with changing vegetation in an altering climate ..............30
Julia Karlgård
10 CH4 exchange over Stordalen mire by EC technique ............................32
Marcin Jackowicz-Korczyński, Torben R. Christensen, Thomas Friborg, Patrick M. Crill, Lena Ström
11 Palsa mires - CO2 exchange from Stordalen mire ...................................36
Thomas Friborg, Torbjörn Johansson, Marcin Jackowicz-Korczynski, Torben R. Christensen and Patrick M. Crill
4 Reports of Finnish Envirornment Institute 3 | 2009
12 A catchment scale process study ofcarbon and greenhouse gas exchange in a subarctic landscape .........................................................................41
Torben R. Christensen, Torbjörn Johansson, Maria Olsrud, Lena Ström, Anders Lindroth, Mikhail Mastepanov, Nils Malmer, Thomas Friborg, Patrick M. Crill and Terry V. Callaghan
13 Methane emission from Russian frozen wetlands under conditions of climate change ........................................................................................................44
Svetlana Reneva
14 Establishment of a New Carbon Flux Site in Northern Norway ......46
Georg Hansen, Daniel Rasse, Arne Grønlund, Bert Drake, Tom Powell and Tommy Simonsen
15 Dissolved Organic Carbon in the Boreal Black Spruce Forest: Chemical Character and Biodegradability ..........................................................48
Kimberly P. Wickland
THEME 3: Palsa mire ecosystem and paleoecological studies .................51
16 A Holocene perspective on palsa mires in northern Fennoscandia with particular focus on Stordalen ........................................................................53
Dan Hammarlund and Ulla Kokfelt
17 Rise and fall of palsas and peat plateaus in eastern Canada ...............56
Serge Payette
18 Monitoring permafrost and thermokarst dynamics in a subarctic peat plateau complex in northern Sweden .......................................................59
A. Britta K. Sannel and Peter Kuhry
19 Effects of permafrost thawing on lake water organic carbon and primary production......................................................................................................62
Peter Rosén and Jan Karlsson
20 Mire structure, carbon cycling and permafrost have possible implications also for trace elements such as mercury. ................................64
Johan Rydberg and Jonatan Klaminder
Appendix...........................................................................................................................67
Documentation page ...................................................................................................72
Kuvailulehti ......................................................................................................................73
Presentationsblad .........................................................................................................74
5Reports of Finnish Envirornment Institute 3 | 2009
1 Preface
Stefan Fronzek1, Margareta Johansson2, Torben R. Christensen2, Timothy R. Carter1, Thomas Friborg3 and Miska Luoto4
1Finnish Environment Institute, Helsinki, Finland2GeoBiosphere Science Centre, Physical Geography and Ecosystem Analysis, Lund Univer-sity, Lund, Sweden3Department of Geography and Geology, University of Copenhagen, Copenhagen, Denmark4Department of Geography, University of Oulu, Finland
Palsa mires are subarctic mire complexes with permanently frozen peat hummocks. They are a characteristic and unique feature of high latitude environments in parts of Fennoscandia, Russia, Canada and Alaska. In recent decades, palsas have been degrading throughout their distribution range in the northern hemisphere. These marginal permafrost features appear to be highly sensitive to climatic conditions, and the recent decline of palsas in Europe has been linked to regional climatic warming. Consequently, the climate changes projected for future decades may cause a further extensive degradation of permafrost in mires. Aside from being unique geomorphological features of the subarctic landscape, palsa mires also represent biologically heterogeneous environments offering distinct ecosystem services. They are habitats for local harvests of wild berries as well as being breeding grounds for a very rich bird diversity and resting places for migrating birds. In terms of nature conservation, palsas are highly graded in Europe; they are one of the 65 priority natural habitat types listed in Annex I of the “Habitats” Directive of the European Union.
Ecosystems along the 0ºC mean annual isotherm are arguably among the most sensitive to changing climate, and mires in the subarctic regions have significant exchanges of the important greenhouse gases methane and carbon dioxide with the atmosphere. These exchanges are intimately related to temperature and hydrology, and alterations in permafrost coverage, which affect both of those, could have dramatic impacts on the combined climate forcing from these exchanges and emissions. Recent studies have shown that mire ecosystems are subject to dramatic changes in the distribution of permafrost and vegetation. These changes are most likely caused by a warming that has been observed during recent decades. So far, no comprehensive studies have focused on the role of palsa mires in the Nordic countries and the potential effects of a northward migration of the permafrost limit on the exchange of greenhouse gases are largely unknown.
From a biodiversity point of view it is alarming that the gradual disappearance caused by warming of the palsa mire habitat type is unidirectional. There would be no replacement of this type of habitat under future warmer climate, and according to early model results this habitat type will be extinct from mainland Europe within the next 50 years.
Palsa mires clearly represent important “early warning” ecosystems, that are already showing strong physical responses to relatively small changes of climate. Thus, more empirical research is urgently needed for documenting and understanding the potential consequences of the degrading of palsa mires, both from an ecosystems and greenhouse gas emissions perspective.
The problem of thawing permafrost is of especial interest to the Nordic countries because the Nordic region appears likely to witness the complete disappearance of this ecosystem type in the coming decades.
6 Reports of Finnish Envirornment Institute 3 | 2009
The research project “Global change impacts on sub-arctic palsa mires and greenhouse gas feedbacks to the climate system” (PALSALARM) is carried out by the Finnish Environment Institute and the Universities of Copenhagen, Lund and Oulu. The PALSALARM consortium organized a scientific symposium on palsa mires in Abisko, Sweden, from 28 – 30 October 2008. 22 experts from the scientific community in the Nordic countries, north America and Russia met to discuss different aspects of palsa mires. The symposium was structured in three themes:
Theme 1: Spatial distributions of palsa mires and permafrost and its current •statusTheme 2: GHG feedbacks of palsa mires•Theme 3: Palsa mire ecosystem and paleoecological studies•
Each theme was introduced by a keynote speaker followed by a series of presentations. Altogether, 20 oral and four poster presentations were given at the symposium. This report presents the proceedings of the symposium with extended abstracts of the presentations.
Financial support from the Nordic Council of Ministers and the Swedish Research Council FORMAS is gratefully acknowledged.

7Reports of Finnish Envirornment Institute 3 | 2009
Theme 1: Spatial distributions of palsa mires and permafrost and its current status

8 Reports of Finnish Envirornment Institute 3 | 2009
9Reports of Finnish Envirornment Institute 3 | 2009
2 Climate change and permafrost in the Arctic
Oleg Anisimov State Hydrological Institute, St.Petersburg, Russia E-mail of corresponding author: [email protected]
Arctic has shown the most rapid rate of warming in recent decades and continues to be climate change hotspot. Observational evidence indicates that many of the potential environmental and socioeconomic impacts of warming are associated with changes in permafrost, which underlies about 22.8x10⁶ km2 or 24% of the land area in the Northern Hemisphere.
Transgressions and regressions of permafrost in the historical and geological time intervals indicate that climate variations and change in the past have had noticeable impact on the frozen ground. A progressive increase in the depth of seasonal thawing could be a relatively short-term reaction to climatic warming at decadal time scales. In the longer term, climatic warming may lead to a reduction of the near-surface permafrost area and a shift of the boundaries between continuous, discontinuous, and sporadic zones. At regional and local levels changes in permafrost could produce substantial effects on vegetation, soil hydrology and runoff. They may also govern the existence and behavior of specific periglacial landforms like palsa mires or ground subsidence due to thermokarst. While the impacts are most visible at local and regional scales, they often have global drivers, and may thus be predicted using large-scale permafrost modeling under climatic projections.
Though differ in complexity, conventional permafrost models employ similar conceptual approaches and are based on the numeric solution of the heat transfer equation suggesting that soil temperature in the near-surface layer and the depth of seasonal thawing (also called active-layer thickness, ALT) are increasing gradually with climatic warming. Several studies indicated that accurate results may be obtained with relatively simple equilibrium permafrost model that has low data requirements and uses two climatic parameters, mean monthly air temperature and precipitation, however together with few other parameters accounting for the effects and properties of snow cover, vegetation, and soil (Anisimov et al., 2007; Sazonova, Romanovsky, 2003).
In one of our preceding studies the model was run at the nodes of 0.5 º lat/long grid spanning Russian permafrost regions (Anisimov, 2007). Set of five scenarios of climate change for the 11-year long time periods centred on 2030, 2050, and 2080 has been constructed by superimposing predicted by CGCM2, CSM_1.4, ECHAM4/OPYC3, GFDL-R30_c and HadCM3 GCMs changes of climatic parameters on baseline data. All climate projections were based on B2 emission scenario. The climatic scenarios are fully documented and are available on the web sites of the data distribution center of the Intergovernmental Panel on Climate Change (IPCC; http://ipcc-ddc.cru.uea.ac.uk/ and http://igloo.atmos.uiuc.edu/IPCC/).
Results from permafrost model indicate that the projections of the soil temperature and depth of seasonal thawing differ in regional details depending on climatic scenarios. For any given scenario changes are uniform neither in space nor in time. Scenarios are in general agreement predicting 10%-15% increase in the depth of seasonal thawing over most of the permafrost area by 2030, 15%-25% increase by
10 Reports of Finnish Envirornment Institute 3 | 2009
the middle of the century, and 30% and more by 2080. This is consistent with the conclusions of the other studies (Sazonova et al., 2004; Walsh et al., 2005).
Meanwhile, permafrost response to climate is often non-linear, depends on changing non-climatic factors (such as vegetation), and involves threshold mechanisms that are yet to be fully understood. Permafrost properties exhibit strong variability even over relatively small areas due to stochastic nature of the factors governing the thermal regime and depth of seasonal thawing of the frozen ground.
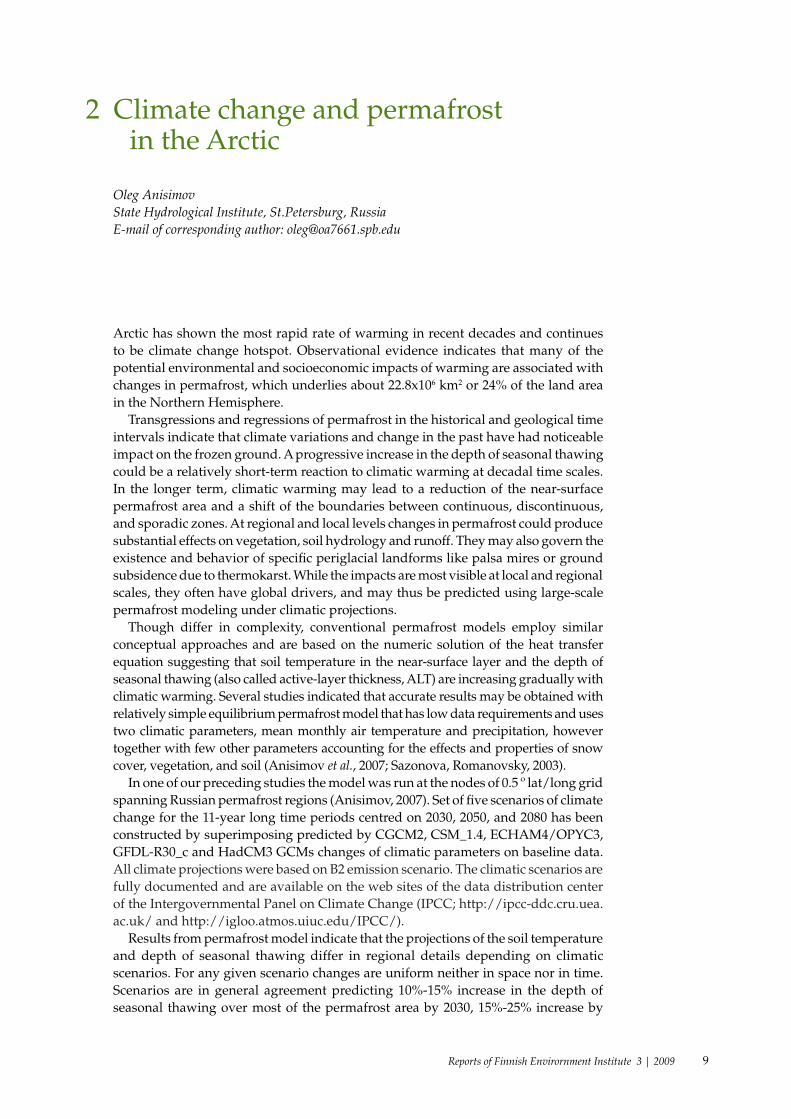
New type of probabilistic model considers the statistical properties of active-layer thickness and other environmental parameters within representative, easily identifiable landscape units, while accounting for differences between units deterministically. Out-put is in the form of maps showing the probability of active-layer thickness within presc-ribed intervals (Anisimov et al., 2002). Probabilistic maps deliver important information supplementing traditional maps, which depict only “average” or “typical” values, as described above. The probabilistic approach thus always assumes the construction of several probability maps for a region, each for a given threshold. Map in figure 1 gives an example of such probabilistic calculation. This map was constructed using the 2050 climatic projection from GFDL-R30_c model under B1 emission scenario. To simulate the effects of small-scale variability in snow, vegetation, and soil moisture the permaf-rost model was run repeatedly with slightly disturbed parameters.
Probability scale
ZT < 0.8 M
0.8 < ZT < 1.5 M
1.5 < ZT < 1.8 M
ZT > 1.8 M
1.00.80.60.40.20
Figure 2-1. Probabilistic map of the active-layer thickness (ZT) for 2050 based on GFDL-R30_c climatic projection under B1 emission scenario.

11Reports of Finnish Envirornment Institute 3 | 2009
ReferencesAnisimov, O., 2007. Potential feedback of thawing permafrost to the global climate system through
methane emission. Environmental Research Letters (2): doi:10.1088/1748-9326/2/4/045016.Anisimov, O.A., Lobanov, V.A., Reneva, S.A., Shiklomanov, N.I., Zhang, T., 2007. Uncertainties in
gridded air temperature fields and their effect on predictive active layer modeling. Journal of Geophysical Research, 112 (F02S14): doi:10.1029/2006JF000593.
Anisimov, O.A., Shiklomanov, N.I., Nelson, F.E., 2002. Variability of seasonal thaw depth in permafrost regions: a stochastic modeling approach. Ecological Modelling, 153 (3): 217-227.
Sazonova, T.S., Romanovsky, V.E., 2003. A model for regional-scale estimation of temporal and spatial variability of active-layer thickness and mean annual ground temperatures. Permafrost and Periglacial Processes, 14 (2): 125- 140.
Sazonova, T.S., Romanovsky, V.E., Walsh, J.E., Sergueev, D.O., 2004. Permafrost dynamics in the 20th and 21st centuries along the East Siberian transect. Journal of Geophysical Research-Atmospheres, 109 (D1).
Walsh, J.E., Anisimov, O., Hagen, J.O.M., Jakobsson, T., Oerlemans, J., Prowse, T.D., Romanovsky, V., Savelieva, N., Serreze, M., Shiklomanov, I., Solomon, S., 2005. Chapter 6: Cryosphere and Hydrology, Arctic Climate Impacts Assessment, ACIA. Cambridge University Press, Cambridge, UK.
12 Reports of Finnish Envirornment Institute 3 | 2009
3 Physical and environmental properties of palsa formations
Matti Seppälä Department of Geography, University of Helsinki [email protected]
A palsa is a peat mound with permanently frozen core. It can be up to 12 m in height. Its diameter can be several hundreds of metres. Palsas are characteristic features for the zone of discontinuous permafrost. The surrounding mire of palsa has no permafrost. Palsas contain frozen peat, small ice crystals filling the pore spaces and ice lenses. Mineral core palsas contain frozen silt or silty till and they are covered by thin layer of insolating peat. Palsas in different stages of development can be found on the same mire: young low palsas, mature high palsas, old collapsing palsas, wind abraded palsas with barren peat surfaces and thermokarst ponds as remains of former palsas.
The thickness of the active layer on palsas in Finnish Lapland has stayed the same from 1974, varying more from place to place than annually. Palsas which are higher than 2 metres have an active layer from 60 to 70 cm on their horizontal surface. On low (1 m in height) palsas the active layer ranges from 40 to 50 cm and on new low palsas (30 cm in height) active layer is 25-30 cm. The thickness of the insolating peat layer is the crucial factor for palsa formation. Minimum thickness of the peat layer on palsas in Finnish Lapland is about 40 cm but often palsas are well developed on mires with some 2 m of wet peat.
Thermal conductivity of peat depends on its water content and temperature. Wet and frozen peat conducts heat and coldness at least three times better than dry and unfrozen peat. Dry peat is an insulator. This has been shown in laboratory tests. Palsa formation is based on the physical properties of peat. Palsas are formed on mires with thin snow cover. In winter palsa surfaces are uncovered by snow. The steep edges of palsas collect thick layers of snow and that prevents palsas of enlarging their area when they have risen well above the mire surface. Wind blows snow off from the mire surface and then frost penetrates deep in peat. This has been experimentally demonstrated in the field in Lapland by shovelling snow off from the mire surface several times in winter. When a palsa rises above the mire surface the ecological conditions of vegetation change. Peat dries and new plants cover the rising hummock. New vegetation forms a different kind of xerophilic peat on palsa mound and this gives a tool to date the palsa formation. The contact of mire peat and palsa peat is dated. Large palsas in Finland are about 1000 years old or younger.
The frost susceptibility of palsa peat was measured with a frost heave test in the laboratory. No frost heave was observed. This means that peat forming palsas have no potential to form segregated ice lenses. However, palsas contain ice lenses. The volumetric growth of a palsa is based on the buoyancy effect of the frozen core. It rises causing some water accumulation under the frozen core. It freezes during the following winter and forms thin ice layers. This explains the ice layers in the palsa core. Later when the frozen core touches the silt layer below peat then ice segregation can start.
13Reports of Finnish Envirornment Institute 3 | 2009
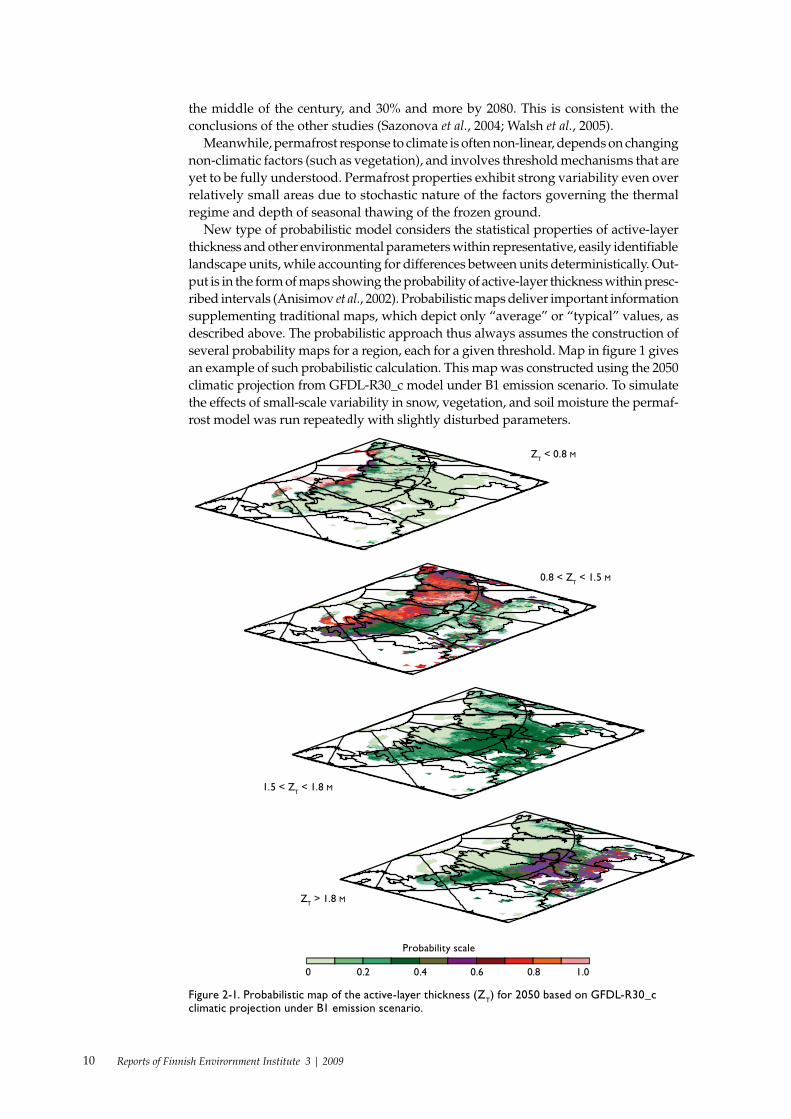
Figure 3-1. New palsas on Vaisjeäggi palsa mire, Utsjoki, Finland, in 2003. Photo: O. Ruth.
Palsas are cyclic features. They grow and in mature stage they start to collapse from edges by block erosion along the cracks on their surfaces. When the insolating peat layer is lost then the frozen core thaws and the palsa will disappear and leave just a small pond or wet surface on the mire. Climate change is not needed for the cyclic development. Climate change may cause thicker snow cover on palsas and this has been experimentally studied by constructing a snow fence around a small palsa and covering it this way by unnatural thick layer of snow. This snow covered palsa is now thawing rather fast and will probably disappear in next years. In winter 2002 some new small palsas started to form in Utsjoki, Finland. They stayed frozen until August 2008. Strong winter storms drifting snow off might have caused the palsa formation. Their thawing is based on wet summers which kept the peat moist through the sum-mer. Heavy summer rains increase the thermal conductivity of the surface peat and this may be the critical factor for the occurrence of palsas. Unusually high summer temperatures during the 2000s have not increased the thickness of active layers but wet summer conditions are fatal for palsas.
The ideal condition for palsas are long, cold winters. Mean annual air temperature should be below -2°C. Snow cover should be thin. Dry snow can be drifted by wind easily. Low annual precipitation ~400 mm is favourable for palsa formation. Climate should be humid enough for peat formation to grow the insolating peat layer thick enough. Strong winds in winter support the ground frost formation by thinning the snow cover on mires but they also abrade old palsas and they disappear. Freezing water should be available on the mire and therefore most palsa mires are crossed by small creeks. It seems to me that on the marginal regions of the palsa zone, palsas are at the moment thawing but in the core area they are still doing well.
14 Reports of Finnish Envirornment Institute 3 | 2009
ReferencesKujala, K., Seppälä, M. & Holappa,T., 2008. Physical properties of peat and palsa formation. Cold
Regions Science and Technology 52, 408-414Luoto, M. & Seppälä, M., 2002. Modelling the distribution of palsas in Finnish Lapland with logistic
regression and GIS. Permafrost and Periglacial Processes 13, 17-28.Luoto, M. & Seppälä, M. 2003. Thermokarst ponds as indicator of the former distribution of palsas in
Finnish Lapland. Permafrost and Periglacial Processes 14, 19-27.Seppälä, M., 1976. Seasonal thawing of a palsa at Enontekiö, Finnish Lapland, in 1974. Biuletyn
Peryglacjalny 26, 17-24.Seppälä, M., 1982. An experimental study of the formation of palsas. Proceedings Fourth Canadian
Permafrost Conference, Calgary. National Research Council of Canada, Ottawa, 36-42.Seppälä, M., 1983. Seasonal thawing of palsas in Finnish Lapland. Permafrost Fourth International
Conference Proceedings. National Academy Press, Washington, D.C. 1127-1132.Seppälä, M., 1986. The origin of palsas. Geografiska Annaler, A68, 141-147.Seppälä, M., 1988a. Palsas and related forms. In: Clark, M.J. (ed) Advances in periglacial
geomorphology. John Wiley, Chichester, 247-278.Seppälä, M., 1990. Depth of snow and frost on a palsa mire, Finnish Lapland. Geografiska Annaler, A72,
191-201.Seppälä, M., 1994. Snow depth controls palsa growth. Permafrost and Periglacial Processes, 5, 283-288.Seppälä, M., 2003. Surface abrasion of palsas by wind action in Finnish Lapland. Geomorphology, 52,
141-148.Seppälä, M., 2004. Wind as a geomorphic agent in cold climates. Cambridge University Press,
Cambridge. 358 pp.Seppälä, M. & Kujala, K., (2008). The role of buoyancy in palsa formation. In Knight, J. and Harrison, S.
(eds.): Periglacial and paraglacial processes and environments. Geological Society Special Publication (in press).
15Reports of Finnish Envirornment Institute 3 | 2009
4 Norwegian monitoring program for palsa peatlands
Annika Hofgaard Norwegian Institute for Nature Research, Trondheim, Norway [email protected]
Anticipated global warming trend especially at high latitudes has increased the need for, and importance of, monitoring programs designed to track the response of fragile ecosystems and edaphic and biotic structures they depend on. Palsa peatlands belong to permafrost landforms that incorporate both fragile edaphic structures and fragile biotic communities. It has been hypothesized that a further warming and/or precipitation increase will result in melting of most palsas within a few decades at the most marginal sites. These sites will also be highly sensitive to any human activities affecting the vegetation structure, peat cover or hydrological properties of the peatlands. Under increased climatic marginalization, even benign human impact may destabilize entire edaphic and biotic structures and consequently jeopardize the long-term survival of depending species locally and regionally. This deserves increased consideration in management or conservation plans for palsa peatlands.
The spatial and temporal distribution of palsas depends on local and regional climatic factors and on how the climate is changing at scales of decades and centuries. In Norway palsas are common features in peatlands mainly in two regions, one in the south restricted to the Dovre region, and one broader northern in Troms and Finnmark. These palsa peatlands are characterized by a mosaic of palsas, peat areas without permafrost, wet sedge areas, and thremokarst ponds, and are highly dynamic through time due to growth and decay of palsas.
The development of palsa peatlands during the later half of the 20th century has been dominated by decline. The documentation has however been slightly biased towards development of dominating “late successional” palsa features and a holistic picture is somewhat obscured. A monitoring program need to capture the constant flux of changes caused by permafrost alternations, including different palsa structures, development of ponds and colonization of ponds along with analyses of vegetation structure and land use changes to be able to draw profound conclusions.
The monitoring program for Norwegian palsa peatlands which was started in 2004 is funded by the Norwegian Directorate for Nature Management and builds on a broad national scientific consensus. Five palsa areas are selected to represent different climatic regions confined by variation in major environmental gradients from northern to southern Norway (Table 1). Selected sites are Ferdesmyra and Goahteluoppal in eastern and western Finnmark county, respectively, Ostojeaggi in Troms county, and Haugtjørnin/Haukskardmyrin and Leirpullan (mineral cored palsas) in the Dovre region. One area is analyzed per year (Table 1) with subsequent reanalyzes every fifth year after the initial year. First reanalyzes will take place in 2009. Changes in peatland and palsa structures are analyzed by air photos (when available) and line analyses including the following categories: distribution of land cover types (10 variables), bottom layer (6 variables), field layer (6 variables), shrub layer (3 variables), thaw depth, frequency of peat cracks, and height above the mire. Details are given in annual reports.
16 Reports of Finnish Envirornment Institute 3 | 2009
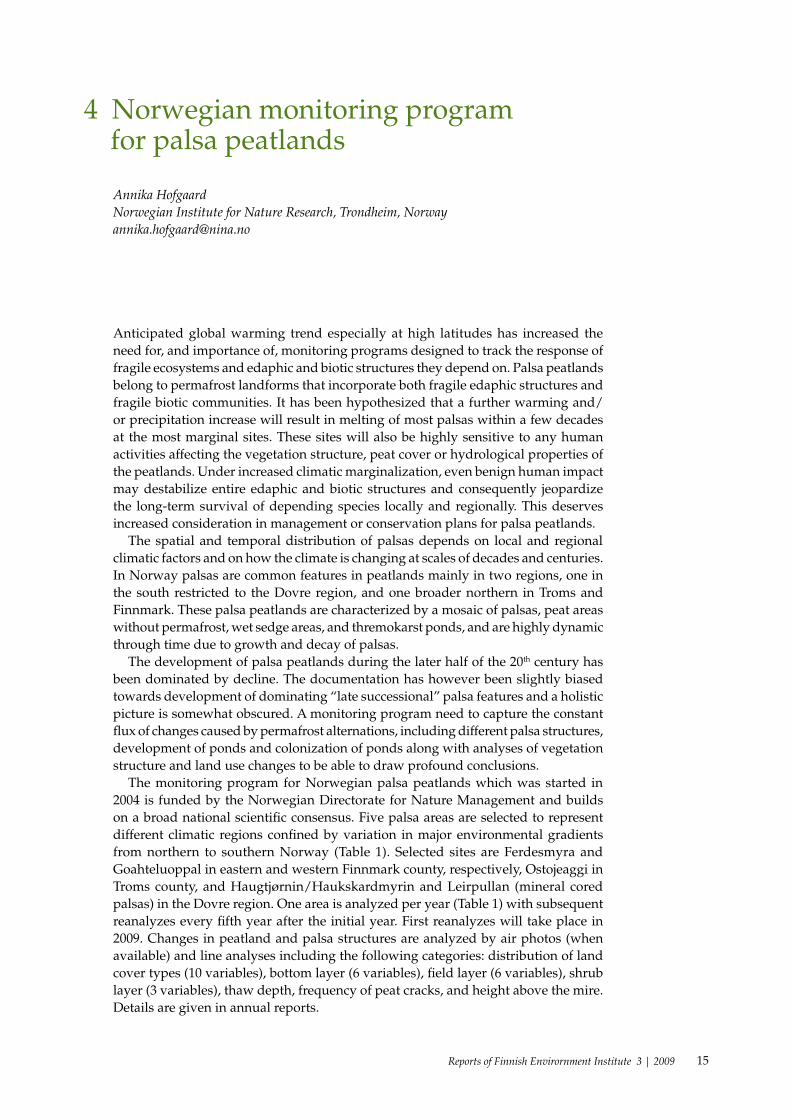
All studied peatlands have experienced a reduction in palsa frequency and distribution during last decades, but formation of new palsas occurs. Air photos for Ostojeaggi from 1956 and 1986 indicate relatively large changes with development of new large palsas within parts of the mire during the period up to 1986. These palsas had disappeared in 2004, were substantially smaller, or were replaced with new possibly ephemeral palsas. Air photos from 1963 in combination with photo documentation show relatively large changes up until 2005 within the Haugtjørnin area (Figure 1), but fairly small changes within Haukskardmyrin. For Goahteluoppal air photos are available from 1958 and 2003. Over this 45 year period, a considerable decreasing trend is shown in palsa covered areas and increasing in sedge covered areas, particular in the wettest parts of the peatlands. Dryer parts show only minor changes. The main climatic background for these changes is a pronounced change in the precipitation regime (close to a doubling since the beginning of the 20th century). Comparison with scientific documentation from 1995 of the palsa area at Leirpullan (Matthews et al. 1997) showed generally modest changes over the 12 year period up to 2007. Palsa size had increased in some minor areas and decreased in others, with a few disappeared small palsas. Thaw depth was deeper in 2007 compared to 1995, possibly caused by differences in individual summer temperature. Ferdesmyra consists of few scattered palsas mainly in a late stage of decay with fast changes over the last few years.
ReferencesReports in Norwegian with English abstracts are available at www.nina.no.Hofgaard, A. 2006. Overvåking av palsmyr. Førstegangsundersøkelse i Dovre 2005: Haukskardmyrin og
Haugtjørnin. NINA Rapport 154. Matthews, J.A., Dahl, S.-O., Berrisfjord, M.S. and Nesje, A. 1997. Cyclic development and theromkarstic
degradation of palsas in the mid-alpine zone at Leirpullan, Dovrefjell, southern Norway. Permafrost and Periglacial Processes 8: 107-122.
Table 4-1. Characteristics of monitoring sites.
Site First ana-lyzes Latitude m a.s.l. Substrate Palsa
type*Height,
maxPalsa
recruitment Decrease
Ferdesmyra 2008 69°44’N 70 peat d (p) 2,5 no fast
Goatheluoppal 2006 68°55’N 435 peat d/p 2,5 - 3 (no) yes
Ostojeaggi 2004 68°29’N 495 peat d/p 3,5 yes ?
Haugtjørnin 2005 62°21’N 1120 peat (d) (p) 0,5 ? fast?
Haukskardmyrin 2005 62°04’N 1050 peat d (p) 1,5 no yes
Leirpullan 2007 62°21’N 1437 mineral d/p 1,5 - 2 ? slow
* dome (d), plateau (p)
Figure 4-1. Decreasing palsa plateau at Haugtjørnin, Dovre, documented during the 31 year period from 1974 (top), 1996 (centre) to 2005 (bottom). Source: Hofgaard 2006.
17Reports of Finnish Envirornment Institute 3 | 2009
5 Application of remote sensing in detection and monitoring of palsa mires
Hans Tømmervik Norwegian Institute for Nature Research, Tromsø, Norway [email protected]
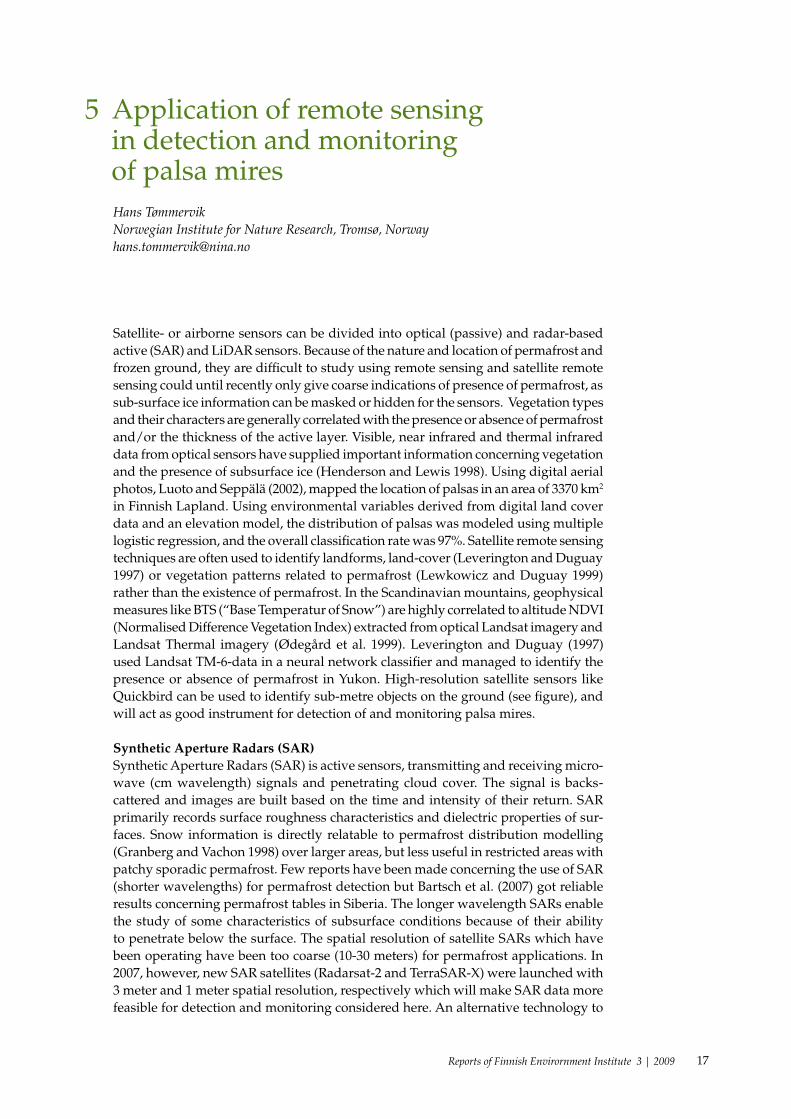
Satellite- or airborne sensors can be divided into optical (passive) and radar-based active (SAR) and LiDAR sensors. Because of the nature and location of permafrost and frozen ground, they are difficult to study using remote sensing and satellite remote sensing could until recently only give coarse indications of presence of permafrost, as sub-surface ice information can be masked or hidden for the sensors. Vegetation types and their characters are generally correlated with the presence or absence of permafrost and/or the thickness of the active layer. Visible, near infrared and thermal infrared data from optical sensors have supplied important information concerning vegetation and the presence of subsurface ice (Henderson and Lewis 1998). Using digital aerial photos, Luoto and Seppälä (2002), mapped the location of palsas in an area of 3370 km2 in Finnish Lapland. Using environmental variables derived from digital land cover data and an elevation model, the distribution of palsas was modeled using multiple logistic regression, and the overall classification rate was 97%. Satellite remote sensing techniques are often used to identify landforms, land-cover (Leverington and Duguay 1997) or vegetation patterns related to permafrost (Lewkowicz and Duguay 1999) rather than the existence of permafrost. In the Scandinavian mountains, geophysical measures like BTS (“Base Temperatur of Snow”) are highly correlated to altitude NDVI (Normalised Difference Vegetation Index) extracted from optical Landsat imagery and Landsat Thermal imagery (Ødegård et al. 1999). Leverington and Duguay (1997) used Landsat TM-6-data in a neural network classifier and managed to identify the presence or absence of permafrost in Yukon. High-resolution satellite sensors like Quickbird can be used to identify sub-metre objects on the ground (see figure), and will act as good instrument for detection of and monitoring palsa mires.
Synthetic Aperture Radars (SAR)Synthetic Aperture Radars (SAR) is active sensors, transmitting and receiving micro-wave (cm wavelength) signals and penetrating cloud cover. The signal is backs-cattered and images are built based on the time and intensity of their return. SAR primarily records surface roughness characteristics and dielectric properties of sur-faces. Snow information is directly relatable to permafrost distribution modelling (Granberg and Vachon 1998) over larger areas, but less useful in restricted areas with patchy sporadic permafrost. Few reports have been made concerning the use of SAR (shorter wavelengths) for permafrost detection but Bartsch et al. (2007) got reliable results concerning permafrost tables in Siberia. The longer wavelength SARs enable the study of some characteristics of subsurface conditions because of their ability to penetrate below the surface. The spatial resolution of satellite SARs which have been operating have been too coarse (10-30 meters) for permafrost applications. In 2007, however, new SAR satellites (Radarsat-2 and TerraSAR-X) were launched with 3 meter and 1 meter spatial resolution, respectively which will make SAR data more feasible for detection and monitoring considered here. An alternative technology to
18 Reports of Finnish Envirornment Institute 3 | 2009
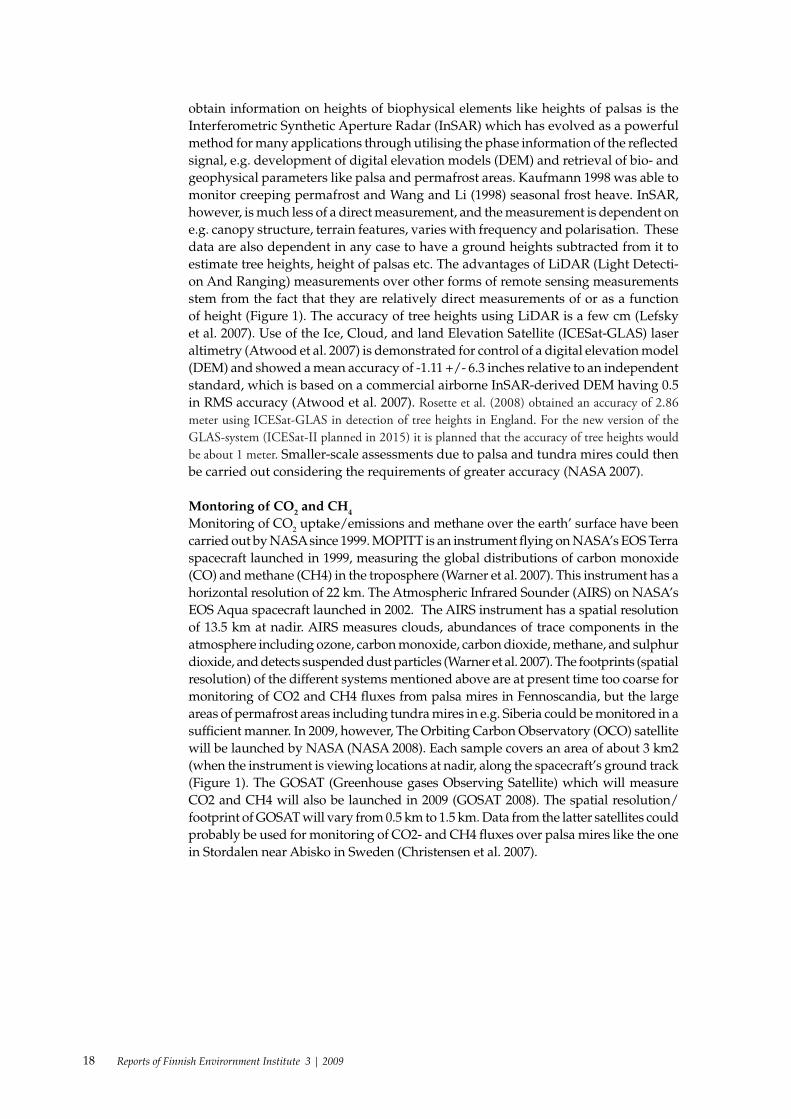
obtain information on heights of biophysical elements like heights of palsas is the Interferometric Synthetic Aperture Radar (InSAR) which has evolved as a powerful method for many applications through utilising the phase information of the reflected signal, e.g. development of digital elevation models (DEM) and retrieval of bio- and geophysical parameters like palsa and permafrost areas. Kaufmann 1998 was able to monitor creeping permafrost and Wang and Li (1998) seasonal frost heave. InSAR, however, is much less of a direct measurement, and the measurement is dependent on e.g. canopy structure, terrain features, varies with frequency and polarisation. These data are also dependent in any case to have a ground heights subtracted from it to estimate tree heights, height of palsas etc. The advantages of LiDAR (Light Detecti-on And Ranging) measurements over other forms of remote sensing measurements stem from the fact that they are relatively direct measurements of or as a function of height (Figure 1). The accuracy of tree heights using LiDAR is a few cm (Lefsky et al. 2007). Use of the Ice, Cloud, and land Elevation Satellite (ICESat-GLAS) laser altimetry (Atwood et al. 2007) is demonstrated for control of a digital elevation model (DEM) and showed a mean accuracy of -1.11 +/- 6.3 inches relative to an independent standard, which is based on a commercial airborne InSAR-derived DEM having 0.5 in RMS accuracy (Atwood et al. 2007). Rosette et al. (2008) obtained an accuracy of 2.86 meter using ICESat-GLAS in detection of tree heights in England. For the new version of the GLAS-system (ICESat-II planned in 2015) it is planned that the accuracy of tree heights would be about 1 meter. Smaller-scale assessments due to palsa and tundra mires could then be carried out considering the requirements of greater accuracy (NASA 2007).
Montoring of CO2 and CH4
Monitoring of CO2 uptake/emissions and methane over the earth’ surface have been carried out by NASA since 1999. MOPITT is an instrument flying on NASA’s EOS Terra spacecraft launched in 1999, measuring the global distributions of carbon monoxide (CO) and methane (CH4) in the troposphere (Warner et al. 2007). This instrument has a horizontal resolution of 22 km. The Atmospheric Infrared Sounder (AIRS) on NASA’s EOS Aqua spacecraft launched in 2002. The AIRS instrument has a spatial resolution of 13.5 km at nadir. AIRS measures clouds, abundances of trace components in the atmosphere including ozone, carbon monoxide, carbon dioxide, methane, and sulphur dioxide, and detects suspended dust particles (Warner et al. 2007). The footprints (spatial resolution) of the different systems mentioned above are at present time too coarse for monitoring of CO2 and CH4 fluxes from palsa mires in Fennoscandia, but the large areas of permafrost areas including tundra mires in e.g. Siberia could be monitored in a sufficient manner. In 2009, however, The Orbiting Carbon Observatory (OCO) satellite will be launched by NASA (NASA 2008). Each sample covers an area of about 3 km2 (when the instrument is viewing locations at nadir, along the spacecraft’s ground track (Figure 1). The GOSAT (Greenhouse gases Observing Satellite) which will measure CO2 and CH4 will also be launched in 2009 (GOSAT 2008). The spatial resolution/footprint of GOSAT will vary from 0.5 km to 1.5 km. Data from the latter satellites could probably be used for monitoring of CO2- and CH4 fluxes over palsa mires like the one in Stordalen near Abisko in Sweden (Christensen et al. 2007).
19Reports of Finnish Envirornment Institute 3 | 2009
ReferencesAtwood, D.K., Guritz, R.M., Muskett R.R., Lingle, C.S., Sauber, J.M. and Freymueller, J.T. 2007DEM control in arctic Alaska with ICESat laser altimetry. IEEE Transaction on Geoscience and Remote
Sensing 45: 3710-3720. Bartch, A. Kidd, R., Pathe, C., Scipal, K. and Wagner, W. 2007. Satellite radar imagery for monitoring
inland wetlands in boreal and sub-arctic enviroments. Aquatic Conservation: Marine and Freshwa-ter Ecosystems 17: 305–317.
GOSAT 2008. http://www.gosat.nies.go.jp/index_e.html. Granberg, H.B. and Vachon, P.W. 1998. Delineation of discontinuous permafrost at Schefferville using
RADARSAT in interferometric mode. Lewkowicz, A.G. & M. Allard (eds.) Permafrost; seventh international conference, proceedings.Centre d’Etudes Nordiques, Universite Laval, pp. 341-345.
Henderson F. M. and A. J. Lewis (eds.) 1998. Principles & applications of Imaging Radar. Manual of Remote Sensing, Third Edition, Vol. 2, John Wiley & Sons, Inc.
Kaufmann, V. 1998. Deformation analysis of the Doesen rock glacier (Austria). Lewkowicz, A.G. & M. Allard (eds.) Seventh International Conference on Permafrost, Proceedings.Centre d’Etudes Nordiques, Universite Laval, pp. 551-556.
Lefsky, M.A., Harding, D.J. Keller, M., Cohen, W.B., Carabajal, C.C., Del Bom Espirito-Santo, F., Hunter, M.O. and de Oliveira, Jr., R. 2005. Estimates of forest canopy height and aboveground biomass using ICESat. Geophys. Res. Lett., 32, L22S02, doi:10.1029/2005GL023971.
Leverington, D.W. and Duguay, C.R. 1997. A neural network method to determine the presence or absence of permafrost near Mayo, Yukon Territory, Canada. Permafrost and Periglacial Processes 8: 207-217.
Lewkowicz, A.G. and Duguay, C.R. 1999. Detection of permafrost features using SPOT panchromatic imagery, Fosheim Peninsula, Ellesmere Island, N.W.T. Canadian Journal of Remote Sensing 25: 34-44.
Luoto, M. and Seppälä, M. 2002. Modelling the distribution of palsas in Finnish lapland with logistic regression and GIS. Permafrost and Periglacial Processes 13: 17-28.
NASA 2007. Report from the ICESat-II Workshop, June 27-29, Linthicim, Maryland. http://icesat.gsfc.nasa.gov/icesat2/ICESat-II_Workshop_Report-1.pdf
NASA 2008. The Orbiting Carbon Observatory (OCO). NASA Goddard Space Flight Centre. The Earth Observer 20 (5): 8-11.
Rosette, J.A.B, North, P.R.J., and Suarez J.C. 2008. Vegetation height estimates for a mixed temperate forest using satellite laser altimetry. International Journal of Remote Sensing 29: 1475-1493.
Wang, Z. and Li, S. 1998. A study of the upheaval and subsidence of permafrost through INSAR techniques. Akasofu, S.I. (ed.) International cooperation in Arctic research; detecting global change and its impacts in the western Arctic.American Association for the Advancement of Science, Arctic Division, pp. 72-73.
Warner, J. X., McCourt Comer, M., Barnet C., McMillan W. W., Wolf W., Maddy E. and Sachse, G. 2007. A comparison of satellite tropospheric carbon monoxide measurements from AIRS and MOPITT during INTEX-NA. Journal of Geophysical Research-Atmospheres 112 (D12), doi:10.1029/2006JD007925.
Ødegård, R.S., Isaksen, K., Mastervik, M., Billdal, L., Engler, M. & Sollid, J.L. 1999. Comparison of BTS and Landsat TM data from Jotunheimen, southern Norway. Norsk Geografisk Tidsskrift 53: 226-233.
Figure 5-1. Satellite image over a mire-fen complex (Stormyra) in Troms county (Norway) taken from the Quickbird satellite with a spatial resolution of 0.72 m(left). Airborne laser scanning (LiDAR) measurements (centre). Right: The diagram illustrates how the planned Orbiting Carbon Observatory (OCO) obtains CO2 mole fractions measurements (XCO2) within its 3 km2 footprint (Source: NASA: The Earth Observer 20 (5): p10).
20 Reports of Finnish Envirornment Institute 3 | 2009
6 Modelling the spatial distribution of palsa mires using climate change scenarios
Stefan Fronzek1, Timothy R. Carter1 and Miska Luoto2 1Finnish Environment Institute, Helsinki, Finland 2Department of Geography, University of Oulu, Finland Email of corresponding author: [email protected]
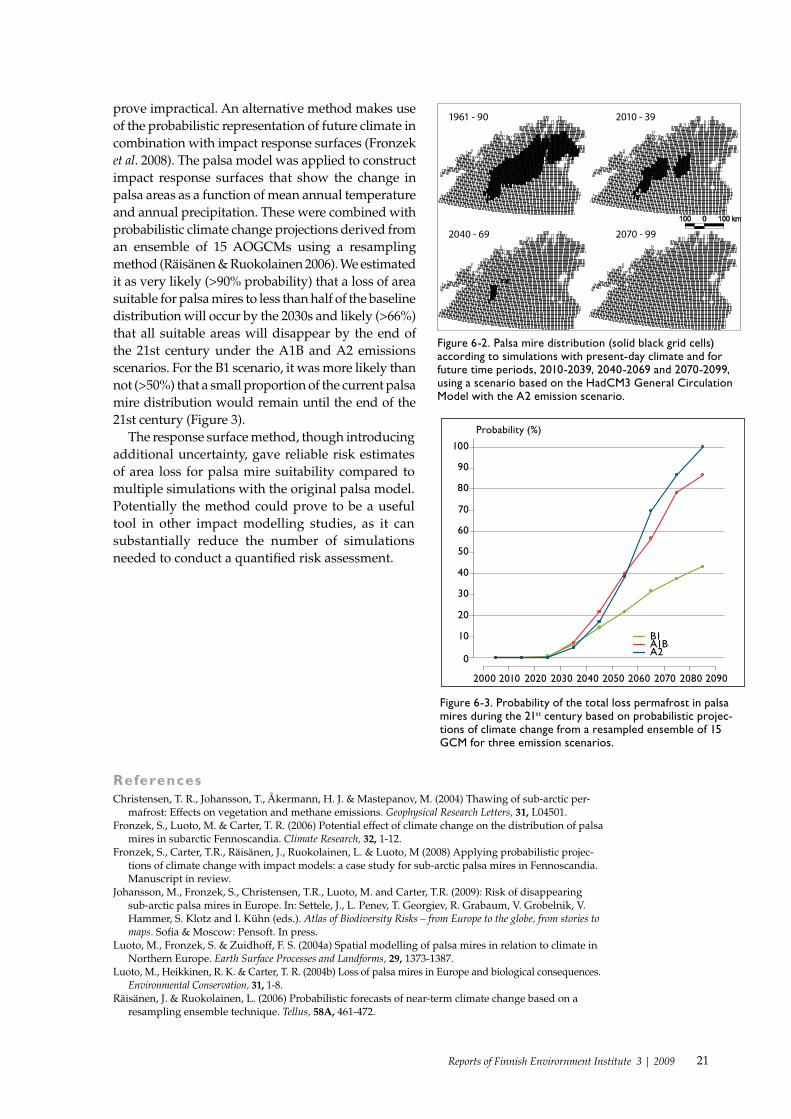
Palsa mires are northern mire complexes with permanently frozen peat hummocks, located at the outer limit of the permafrost zone. Palsa mires have high conservation status, being characterized by a rich diversity of bird species and unique geomorphological processes (Luoto et al. 2004b). They are currently degrading throughout their distributional range, probably because of regional climatic warming (Johansson et al. 2009). Degrading palsa mires can be expected to have significant implications for ecology and carbon balance of the region (Christensen et al. 2004; Karlgård this issue; Reneva this issue).
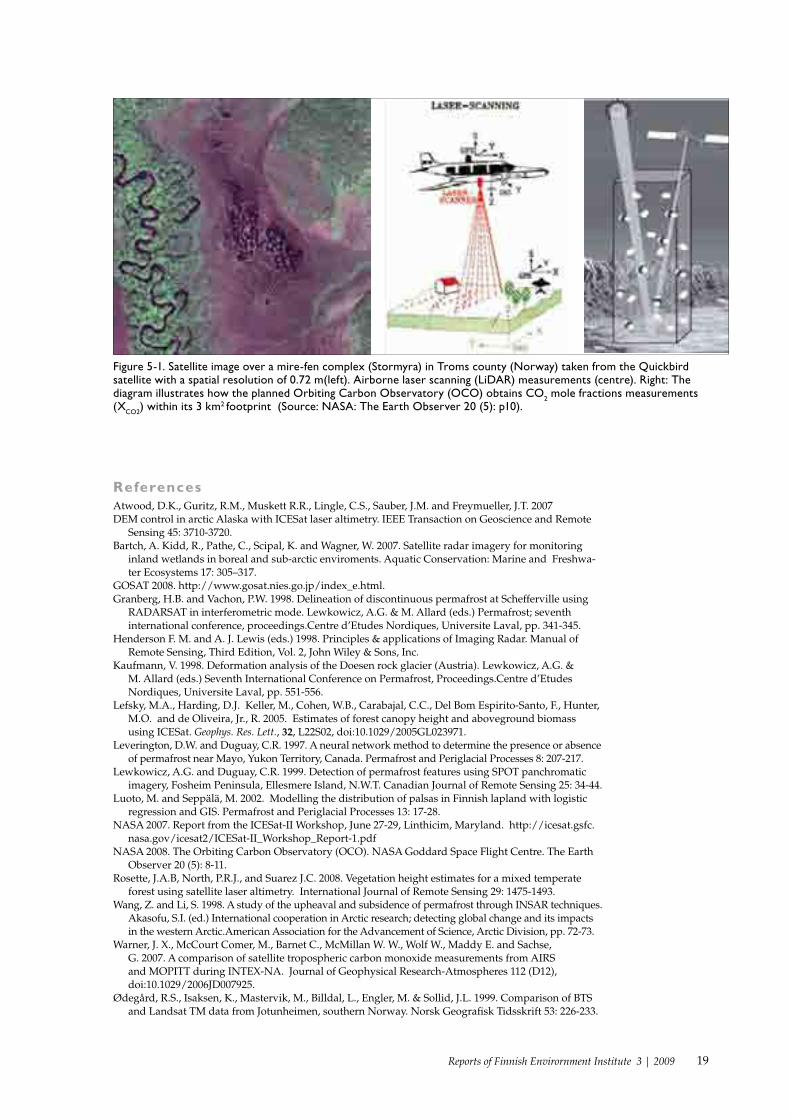
Luoto et al. (2004a) mapped the spatial distribution of palsas in northern Fennoscandia north of the Arctic Circle on a regular 10’ x 10’ grid system (Figure 1). The distribution was then modelled using climate envelope techniques that determine a statistical relationship between climate variables and the spatial distribution of palsa mires. Five climate envelope modelling techniques were used: generalized linear modelling, generalized additive modelling, classification tree analysis, artificial neural networks and multiple adaptive regression splines. The models were studied with respect to their sensitivity to altered climate and climate change scenarios were applied to assess possible impacts on the palsa distribution during the 21st century (Fronzek et al. 2006; 2008).
The models achieved a good to very good agreement with the observed palsa distribution and thus suggest a strong dependency on climate. Even small increases
of temperature (1°C) and precipitation (10%) resulted in considerable losses of areas suitable for palsa development. The models predicted the total disappearance of suitable regions for palsa development with an increased mean annual temperature of 4°C. Under climate change scenarios based on seven Atmosphere-Ocean General Circulation Models (AOGCMs) the models indicated that the degradation of palsas might proceed very quickly (Figures 2). All but one climate scenario resulted in the total disappearance of suitable regions for palsa development by the end of the 21st century (Fronzek et al. 2006).
Recent progress in estimating probabilities of future climate change from ensembles of model projections offers an opportunity to go beyond “what if” types of scenario analysis to a quantified assessment of risks to natural or human systems. However, the application of a potentially high number of ensemble climate projections as inputs to impact models may
Figure 6-1. Current spatial distribution of palsa mires in northern Europe.
21Reports of Finnish Envirornment Institute 3 | 2009
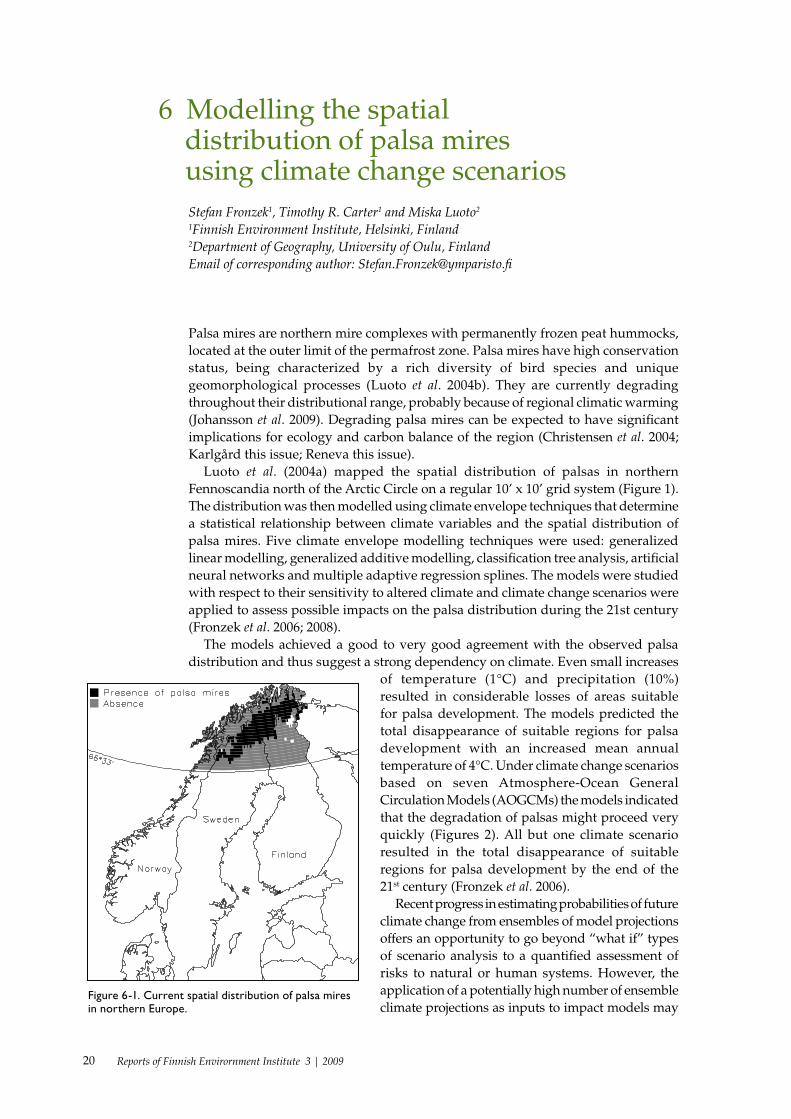
prove impractical. An alternative method makes use of the probabilistic representation of future climate in combination with impact response surfaces (Fronzek et al. 2008). The palsa model was applied to construct impact response surfaces that show the change in palsa areas as a function of mean annual temperature and annual precipitation. These were combined with probabilistic climate change projections derived from an ensemble of 15 AOGCMs using a resampling method (Räisänen & Ruokolainen 2006). We estimated it as very likely (>90% probability) that a loss of area suitable for palsa mires to less than half of the baseline distribution will occur by the 2030s and likely (>66%) that all suitable areas will disappear by the end of the 21st century under the A1B and A2 emissions scenarios. For the B1 scenario, it was more likely than not (>50%) that a small proportion of the current palsa mire distribution would remain until the end of the 21st century (Figure 3).
The response surface method, though introducing additional uncertainty, gave reliable risk estimates of area loss for palsa mire suitability compared to multiple simulations with the original palsa model. Potentially the method could prove to be a useful tool in other impact modelling studies, as it can substantially reduce the number of simulations needed to conduct a quantified risk assessment.
ReferencesChristensen, T. R., Johansson, T., Åkermann, H. J. & Mastepanov, M. (2004) Thawing of sub-arctic per-
mafrost: Effects on vegetation and methane emissions. Geophysical Research Letters, 31, L04501.Fronzek, S., Luoto, M. & Carter, T. R. (2006) Potential effect of climate change on the distribution of palsa
mires in subarctic Fennoscandia. Climate Research, 32, 1-12.Fronzek, S., Carter, T.R., Räisänen, J., Ruokolainen, L. & Luoto, M (2008) Applying probabilistic projec-
tions of climate change with impact models: a case study for sub-arctic palsa mires in Fennoscandia. Manuscript in review.
Johansson, M., Fronzek, S., Christensen, T.R., Luoto, M. and Carter, T.R. (2009): Risk of disappearing sub-arctic palsa mires in Europe. In: Settele, J., L. Penev, T. Georgiev, R. Grabaum, V. Grobelnik, V. Hammer, S. Klotz and I. Kühn (eds.). Atlas of Biodiversity Risks – from Europe to the globe, from stories to maps. Sofia & Moscow: Pensoft. In press.
Luoto, M., Fronzek, S. & Zuidhoff, F. S. (2004a) Spatial modelling of palsa mires in relation to climate in Northern Europe. Earth Surface Processes and Landforms, 29, 1373-1387.
Luoto, M., Heikkinen, R. K. & Carter, T. R. (2004b) Loss of palsa mires in Europe and biological consequences. Environmental Conservation, 31, 1-8.
Räisänen, J. & Ruokolainen, L. (2006) Probabilistic forecasts of near-term climate change based on a resampling ensemble technique. Tellus, 58A, 461-472.
Probability (%)
2000 2010 2020 2030 2040 2050 2060 2070 2080 2090
0
10
20
30
40
50
60
70
80
90
100
B1A1BA2
Figure 6-3. Probability of the total loss permafrost in palsa mires during the 21st century based on probabilistic projec-tions of climate change from a resampled ensemble of 15 GCM for three emission scenarios.
1961 - 90 2010 - 39
2040 - 69 2070 - 99
Figure 6-2. Palsa mire distribution (solid black grid cells) according to simulations with present-day climate and for future time periods, 2010-2039, 2040-2069 and 2070-2099, using a scenario based on the HadCM3 General Circulation Model with the A2 emission scenario.
22 Reports of Finnish Envirornment Institute 3 | 2009
7 Future climate effects on peat plateaus – An experimental manipulation at Abisko
Margareta Johansson1,2, Terry V. Callaghan2,3, Jonas Åkerman1, Marcin Jackowicz-Korc-Marcin Jackowicz-Korc-zynski1, Torben R. Christensen1,2 1) Dept. of Physical Geography and Ecosystem Analyses, Lund University, Sweden 2) Abisko Scientific Research Station, 981 07 Abisko, Sweden 3) Dept. of Animal and Plant Sciences, Sheffield University, UK Email of corresponding author: [email protected]
Snow covers vast land areas for long time periods and plays an important role in the Arctic cryosphere. Snow is one of the single most important mesoscale variable that controls biological systems in Arctic ecosystems and is also the largest single factor accounting for local variations in ground surface temperatures during the winter months. Snow is hence a critical factor for permafrost existence. Snow acts as an in-sulator and prevents cold winter air temperatures from penetrating into the ground and reduces temperature variability (e.g. Walker at al, 1999). Such insulation protects vegetation but leads to permafrost degradation. In addition, when melted, snow can add water and alter the thermal conductivity of the soil that is of importance for permafrost and provides water and nutrients for vegetation.
In the Abisko area, northernmost Sweden, increases in snow depth have been recorded during the last Century (Kohler et al., 2006) and is projected to continue until the end of the 21st Century (Saelthun & Barkved, 2003). The observed change in snow cover has affected peat mires in the area as thawing of permafrost, increases in active layer thickness and associated vegetation changes have been reported during the last decade (Åkerman & Johansson, 2008; Christensen et al., 2004, Malmer et al., 2005; Ström & Christensen, 2007, Johansson et al., 2006). To be able to predict future changes due to climate change, it is necessary to look at both vegetation and permafrost changes and an experimental manipulation was set up in autumn 2005 to simulate future snow cover projected by the end of the Century on a peat plateau.
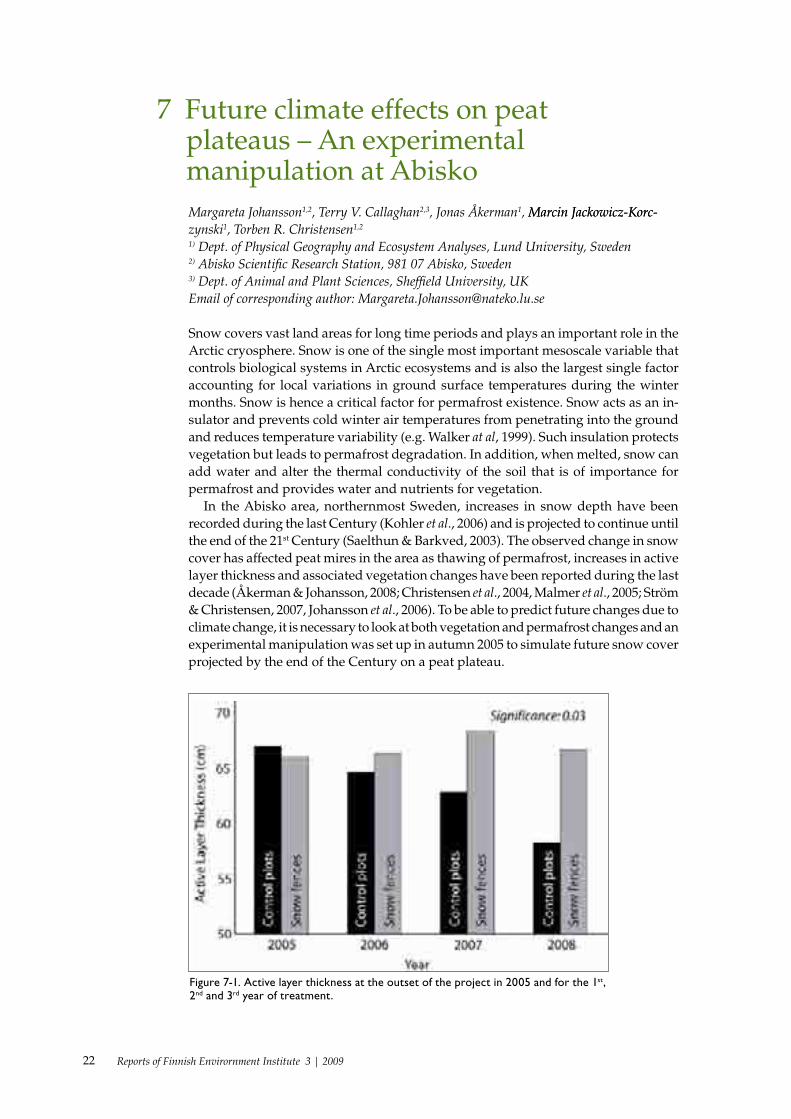
Figure 7-1. Active layer thickness at the outset of the project in 2005 and for the 1st, 2nd and 3rd year of treatment.
23Reports of Finnish Envirornment Institute 3 | 2009
12 plots were set up (6 control and 6 with snow fences) and active layer thickness, species composition, soil (at 15 and 50 cm) and air temperatures (2 m), soil moisture and snow depth were recorded. After three years of treatment, statistically significant differences, between plots with snow fences and control plots, in ground temperatures could be detected for mean winter (October – May) temperatures (0.5 to 1°C higher at the plots with snow fences) as well as for minimum winter temperatures (3 to 5°C higher at the plots with snow fences). No statistically significant difference could be detected in the mean summer soil temperature and the maximum soil temperatures. A difference could also be detected between active layer thickness in the control plots (that decreased from 67 to 58 cm in three years in accordance with other measurements from the area) and the plots with snow fences (remained around 66 cm) (Figure 1). No statistically significant difference could be detected in the abundance of species between the different treatments, but at the sites with snow fences the vegetation stayed greener longer in the autumn compare to the control plots. Higher soil moisture content could be detected at the plots with snow fences compare to the control plots in the end of the summer, when the greening effect appeared. However, an increase in soil moisture in the beginning of the season expected in the plots with snow fences, due to additional snow could not be detected for any of the three years of treatment (Johansson et al., In prep.).
ReferencesAkerman HJ, Johansson M, 2008. Thawing permafrost and thicker active layers in Sub-arctic Sweden.
Permafrost and Periglacial Processes 19(3): 279-292.Christensen, T. R., Johansson, T., Åkerman, H. J., Mastepanov, M., Malmer, N., Friborg, T., Crill, P. and
Svensson, B. H. 2004. Thawing sub-arctic permafrost: Effects on vegetation and methane emissions. Geophysical Research Letters 31, L04501.
Johansson, M., T. V. Callaghan, J. Åkerman, M. Jackowicz-Korczynski, T. R. Christensen, In prep. Rapid response of active layer thickness and vegetation in sub-arctic Sweden to experimentally increased snow cover. To be submitted to Global Changes Biology.
Johansson T, Malmer N, Crill PM, Friborg T, Akerman JH, Mastepanov M, Christensen TR. 2006. Decadal vegetation changes in a northern peatland, greenhouse gas fluxes and net radiative forcing. Global Change Biology 12: 2352-2369.
Kohler, J., O. Brandt, M. Johansson and T. V. Callaghan, 2006. A long-term Arctic snow depth record from Abisko, northern Sweden, 1913-2004. Polar Research, 25: 91-113.
Malmer N, Johansson T, Olsrud M, Christensen TR, 2005. Vegetation, climatic changes and net carbon sequestration in a North-Scandinavian subarctic mire over 30 years. Global Change Biology 11 (11) 1895-1909.
Sælthun, N. R. and Barkved, L. 2003. Climate change scenarios for the SCANNET region. NIVA Report SNO 4663-2003. 74 pp.
Ström L, Christensen TR. 2007. Below ground carbon turnover and greenhouse gas exchanges in a sub-arctic wetland. Soil Biology &Biochemistry 39: 1689-1698.
Walker M.D., Walker, D.A., Welker, J.M., Arft, A.M., Bardsley, T., Brooks, P.D., Fahnestock, J.T., Jones, M.H., Losleben, M., Parsons, A.N., Seastedt, T.R., Turner, P.L., 1999. Long-term experimental mani-pulation of winter snow regime and summer temperature in arctic and alpine tundra. Hydrological Processes 13: 2315-2330.

24 Reports of Finnish Envirornment Institute 3 | 2009

25Reports of Finnish Envirornment Institute 3 | 2009
Theme 2: Fluxes and budgets, GHG feedbacks of palsa mires

26 Reports of Finnish Envirornment Institute 3 | 2009
27Reports of Finnish Envirornment Institute 3 | 2009
8 Fluxes and budgets, GHG feedbacks of palsa mires
Patrick M. Crill Department of Geology and Geochemistry Stockholm University Email: [email protected]
Fine spatial scale variability in the magnitude and the chemical form of carbon (C) sequestration and exchange in palsa mire peatlands is determined by variability in surface hydrology which, in turn, is determined by variations in topography caused by the presence or absence of frozen ground. Permafrost has been transitory during the Holocene in the subarctic. Temperatures in the Arctic regions currently are rising and melting permafrost. There are a number of consequences to these alterations some of which serve as direct feedbacks on the climate system mediated by changing trace gas biogeochemical dynamics. There are shifts in physical mechanisms of C sequestration by the presence or lack of ice and water saturation, shifts in productivity and plant community structures by changes in moisture and nutrient status and shifts in the redox status of the peats, all of which affect trace gas exchange. One possible effect is the exposure of soil organic carbon (OC) previously stabilized for 100’s or 1000’s of years because of having been frozen to conditions that will allow its decomposition. This can result in northern latitude soils which have accumulated large amounts of OC potentially shift from atmospheric C sinks to C sources with positive feedback on climate warming.
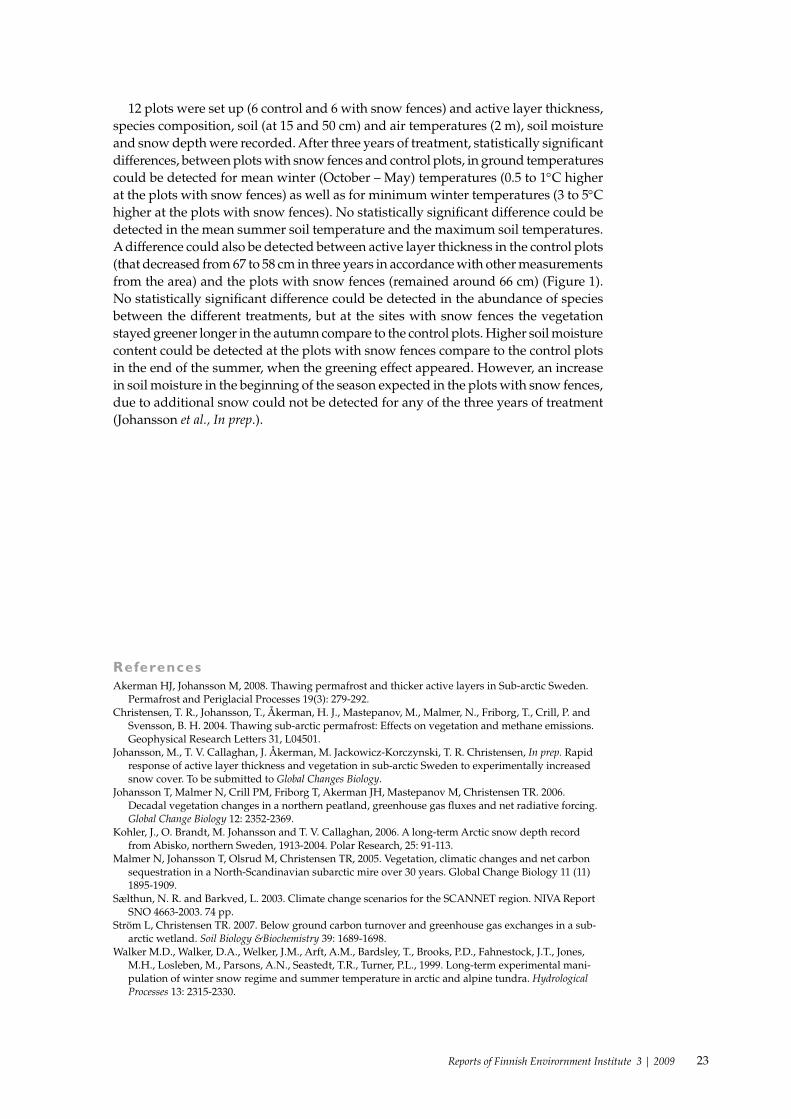
Palsa mires complexes contain a broad range of plant communities that reflect the nutrient status and the surface hydrology (e.g. Malmer et al., 2005) of these systems. In many cases, the range of C fluxes from mire subhabitats can be captured with as few as three general community types that reflect the trophic, and thus the productivity, gradient found in a discontinuous mire complex. In this talk, data gathered with automated chamber measurements of CO2 and total hydrocarbon (THC; CH4 and NMVOCs) exchange to estimate the annual net C gas balance (NCB) of the subarctic Stordalen mire were used as examples of the distinct flux patterns (Figs 1 and 2, Bäckstrand et al. 2008). In this case, three dominant vegetation communities with different moisture and permafrost characteristics were used to characterize the range of fluxes found in this mire; a drained Palsa underlain by permafrost, an ombrotrophic
Figure 8-1. Three day running mean of CO2 and THC pre-sented as lines, and NCB (sum of CO2 and THC) estimates are presented as individual data points. Because the THC component measured in grams C is very small compared to CO2, the seasonal distribution of the NCB measure-ment points can be considered to also show the large scale seasonal variation for CO2. Positive numbers represent addition to the atmosphere and negative numbers repre-sent loss from the atmosphere. The time period between vertical lines at DOY (day of year) 119 and DOY 289 indicate the limit of the green season. All fluxes in mgC m-2d-1. Figure from Bäckstrand et al. 2008.
28 Reports of Finnish Envirornment Institute 3 | 2009
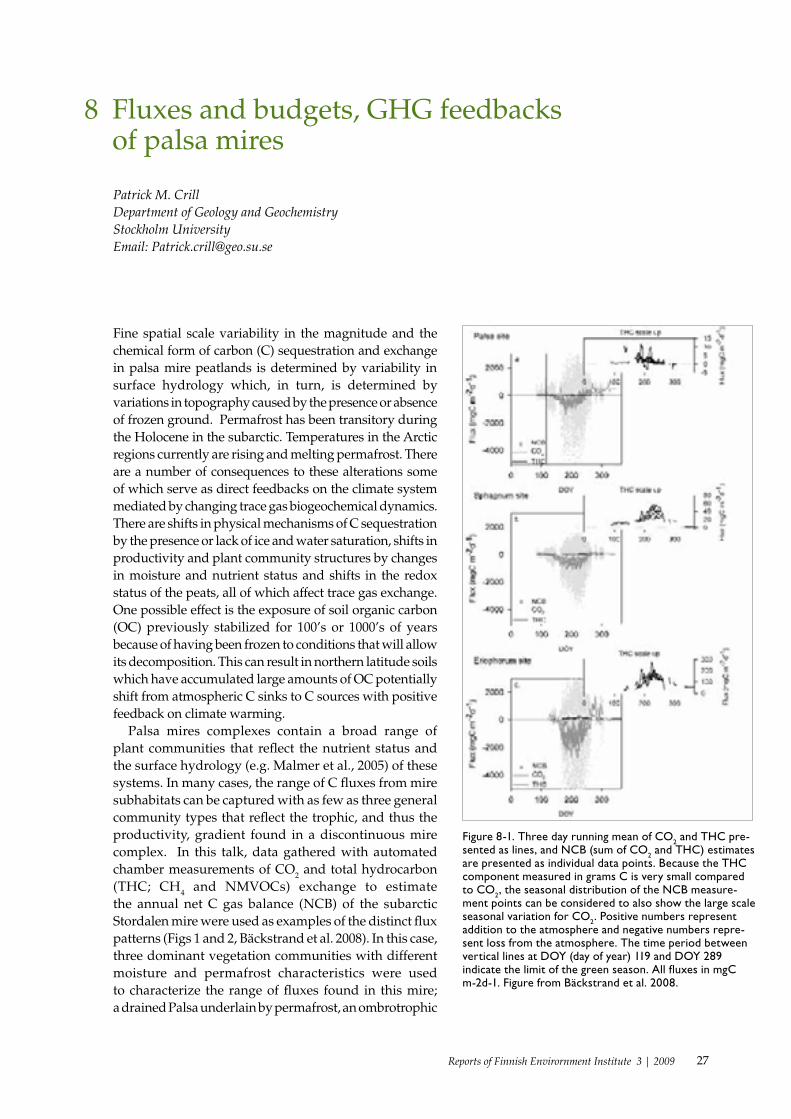
Figure 8-2. Accumulated fluxes of CO2, THC and NCB. Each site is presented separately. Positive numbers represent addition to the atmosphere and negative numbers represent loss from the atmosphere. All fluxes are in mgC m-2. Note that the accumulated flux curves are based on data points when both THC and CO2 flux measurements were available, that is in the range of the THC data points. Figure from Bäckstrand et al. 2008.
transitional melt site dominated by Sphagnum spp. and a minerotrophic wet site with Eriophorum spp. where the soil thaws completely. Whole year accumulated fluxes of CO2 were estimated to 30, -35 and -35 gC m-2 respectively for the Palsa, Sphagnum and Eriophorum sites (positive flux indicates an addition of C to the atmosphere). The corresponding annual THC emissions were 0.5, 6 and 32 gC m-2 for the same sites. The NCB for each of the sites were 30, -29 and -3 gC m-2 respectively for the Palsa, Sphagnum and Eriophorum site.
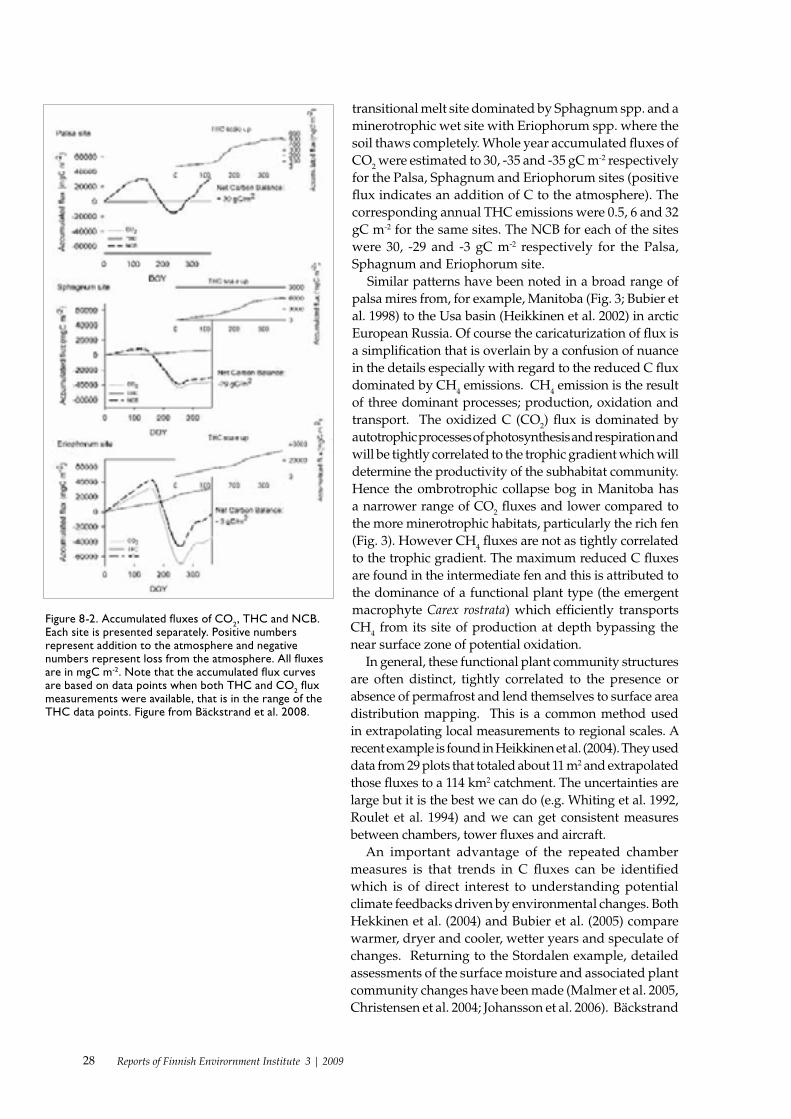
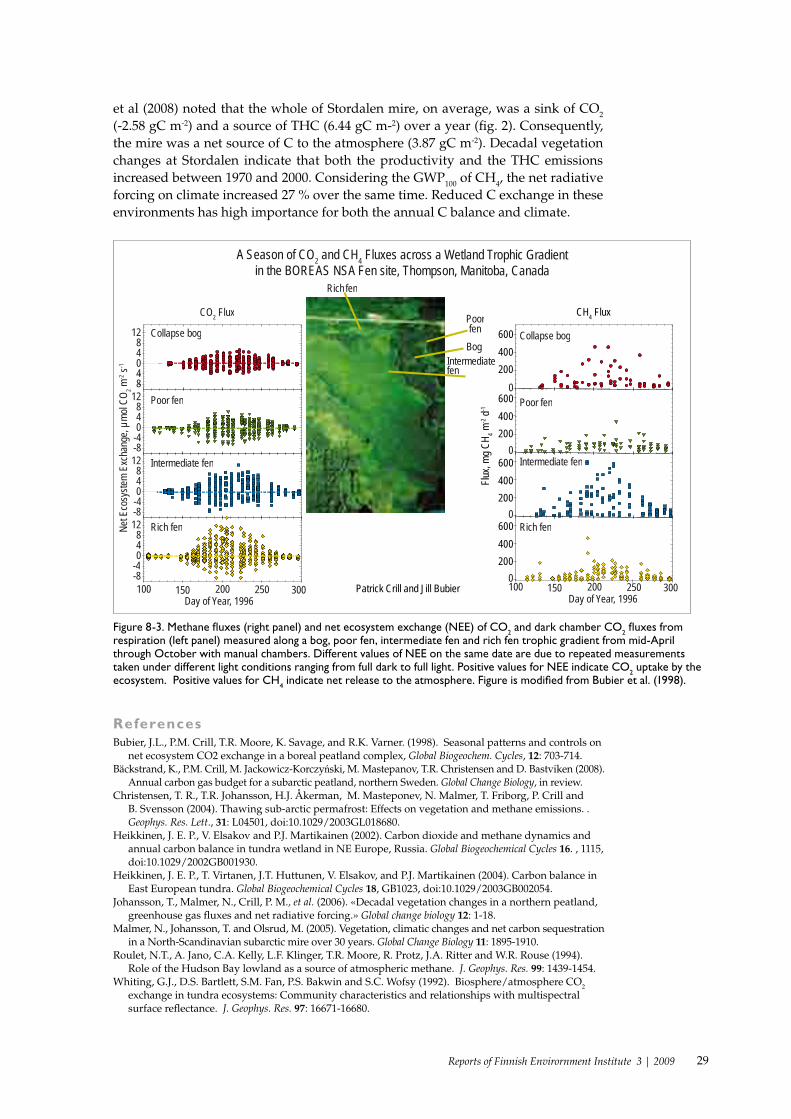
Similar patterns have been noted in a broad range of palsa mires from, for example, Manitoba (Fig. 3; Bubier et al. 1998) to the Usa basin (Heikkinen et al. 2002) in arctic European Russia. Of course the caricaturization of flux is a simplification that is overlain by a confusion of nuance in the details especially with regard to the reduced C flux dominated by CH4 emissions. CH4 emission is the result of three dominant processes; production, oxidation and transport. The oxidized C (CO2) flux is dominated by autotrophic processes of photosynthesis and respiration and will be tightly correlated to the trophic gradient which will determine the productivity of the subhabitat community. Hence the ombrotrophic collapse bog in Manitoba has a narrower range of CO2 fluxes and lower compared to the more minerotrophic habitats, particularly the rich fen (Fig. 3). However CH4 fluxes are not as tightly correlated to the trophic gradient. The maximum reduced C fluxes are found in the intermediate fen and this is attributed to the dominance of a functional plant type (the emergent macrophyte Carex rostrata) which efficiently transports CH4 from its site of production at depth bypassing the near surface zone of potential oxidation.
In general, these functional plant community structures are often distinct, tightly correlated to the presence or absence of permafrost and lend themselves to surface area distribution mapping. This is a common method used in extrapolating local measurements to regional scales. A recent example is found in Heikkinen et al. (2004). They used data from 29 plots that totaled about 11 m2 and extrapolated those fluxes to a 114 km2 catchment. The uncertainties are large but it is the best we can do (e.g. Whiting et al. 1992, Roulet et al. 1994) and we can get consistent measures between chambers, tower fluxes and aircraft.
An important advantage of the repeated chamber measures is that trends in C fluxes can be identified which is of direct interest to understanding potential climate feedbacks driven by environmental changes. Both Hekkinen et al. (2004) and Bubier et al. (2005) compare warmer, dryer and cooler, wetter years and speculate of changes. Returning to the Stordalen example, detailed assessments of the surface moisture and associated plant community changes have been made (Malmer et al. 2005, Christensen et al. 2004; Johansson et al. 2006). Bäckstrand
29Reports of Finnish Envirornment Institute 3 | 2009
et al (2008) noted that the whole of Stordalen mire, on average, was a sink of CO2 (-2.58 gC m-2) and a source of THC (6.44 gC m-2) over a year (fig. 2). Consequently, the mire was a net source of C to the atmosphere (3.87 gC m-2). Decadal vegetation changes at Stordalen indicate that both the productivity and the THC emissions increased between 1970 and 2000. Considering the GWP100 of CH4, the net radiative forcing on climate increased 27 % over the same time. Reduced C exchange in these environments has high importance for both the annual C balance and climate.
-8-4048
12
-8-4048
12
-8-4048
12
Day of Year, 1996 100 150 200 250 300
-8-4048
12
Collapse bog
Poor fen
Intermediate fen
Rich fen
0
0
0
0
A Season of CO2 and CH4 Fluxes across a Wetland Trophic Gradient in the BOREAS NSA Fen site, Thompson, Manitoba, Canada
PoorfenBog
Rich fen
CO2 Flux
Net E
cosy
stem
Exch
ange
, µmo
l CO 2 m
-2 s-1
CH4 Flux
Collapse bog
Poor fen
Intermediate fen
Rich fen
Intermediate fen
600400200
600400200
600400200
600400200
100 150 200 250 300Day of Year, 1996
Flux
, mg C
H 4 m-2 d
-1
Patrick Crill and Jill Bubier
ReferencesBubier, J.L., P.M. Crill, T.R. Moore, K. Savage, and R.K. Varner. (1998). Seasonal patterns and controls on
net ecosystem CO2 exchange in a boreal peatland complex, Global Biogeochem. Cycles, 12: 703-714.Bäckstrand, K., P.M. Crill, M. Jackowicz-Korczyński, M. Mastepanov, T.R. Christensen and D. Bastviken (2008).
Annual carbon gas budget for a subarctic peatland, northern Sweden. Global Change Biology, in review.Christensen, T. R., T.R. Johansson, H.J. Åkerman, M. Masteponev, N. Malmer, T. Friborg, P. Crill and
B. Svensson (2004). Thawing sub-arctic permafrost: Effects on vegetation and methane emissions. . Geophys. Res. Lett., 31: L04501, doi:10.1029/2003GL018680.
Heikkinen, J. E. P., V. Elsakov and P.J. Martikainen (2002). Carbon dioxide and methane dynamics and annual carbon balance in tundra wetland in NE Europe, Russia. Global Biogeochemical Cycles 16. , 1115, doi:10.1029/2002GB001930.
Heikkinen, J. E. P., T. Virtanen, J.T. Huttunen, V. Elsakov, and P.J. Martikainen (2004). Carbon balance in East European tundra. Global Biogeochemical Cycles 18, GB1023, doi:10.1029/2003GB002054.
Johansson, T., Malmer, N., Crill, P. M., et al. (2006). «Decadal vegetation changes in a northern peatland, greenhouse gas fluxes and net radiative forcing.» Global change biology 12: 1-18.
Malmer, N., Johansson, T. and Olsrud, M. (2005). Vegetation, climatic changes and net carbon sequestration in a North-Scandinavian subarctic mire over 30 years. Global Change Biology 11: 1895-1910.
Roulet, N.T., A. Jano, C.A. Kelly, L.F. Klinger, T.R. Moore, R. Protz, J.A. Ritter and W.R. Rouse (1994). Role of the Hudson Bay lowland as a source of atmospheric methane. J. Geophys. Res. 99: 1439-1454.
Whiting, G.J., D.S. Bartlett, S.M. Fan, P.S. Bakwin and S.C. Wofsy (1992). Biosphere/atmosphere CO2 exchange in tundra ecosystems: Community characteristics and relationships with multispectral surface reflectance. J. Geophys. Res. 97: 16671-16680.
Figure 8-3. Methane fluxes (right panel) and net ecosystem exchange (NEE) of CO2 and dark chamber CO2 fluxes from respiration (left panel) measured along a bog, poor fen, intermediate fen and rich fen trophic gradient from mid-April through October with manual chambers. Different values of NEE on the same date are due to repeated measurements taken under different light conditions ranging from full dark to full light. Positive values for NEE indicate CO2 uptake by the ecosystem. Positive values for CH4 indicate net release to the atmosphere. Figure is modified from Bubier et al. (1998).
30 Reports of Finnish Envirornment Institute 3 | 2009
9 Degrading palsa mires in Northern Europe: potential change in greenhouse gas fluxes with changing vegetation in an altering climate
Julia Karlgård Department of Physical Geography and Ecosystem Analysis, Lund University Email: [email protected]
Studies from the palsa mire in Stordalen, northern Sweden, have investigated vegetational changes observed between 1970 and 2000, and the associated change in greenhouse gas (GHG) fluxes (Malmer et al., 2005; Johansson et al., 2006; Christensen et al., 2004). These studies show an increase in the area dominated by wet type vegetation such as tall graminoids and carpets of Sphagnum mosses on the expense of dryer palsa vegetation (Malmer et al., 2005; Johansson et al., 2006). Together with studies showing an increased active layer thickness in the area (Johansson et al., 2006; Åkerman and Johansson, 2008) these results indicate that the observed vegetational changes are correlated with thawing permafrost. In the present study changes in the vegetational patterns associated with degradation of palsas, and its potential impacts on methane and carbon dioxide fluxes is investigated on a regional scale. The study is based on observations from 15 field sites located in northern Sweden, Finland and Norway within an area stretching from 19°00’ to 23°15’ E and from 68°07’ to 69°07’ N. Vegetational patterns and surface structures was documented, together with measurements of active layer thickness and soil moisture content. The same vegetation classification scheme used by Malmer et al. (2005) and Johansson et al. (2006) was adopted, where four major vegetation types was defined: dry hummock vegetation, moist hummock (or semiwet) vegetation, carpet vegeatation and tall graminoid vegetation.
In order to make projections of potential vegetational changes with a future climate, the vegetational patterns were correlated to climate parameters. This was done by comparing the dominating vegetation type with mean annual air temperature (MAAT) and mean annual accumulated precipitation (MAAP) at each of the visited sites. Based on the modeled probability of palsa occurrence by Luoto et al. (2004) fuzzy membership functions of MAAT and MAAP were computed to describe the “climate suitability” for palsa occurrence at a specific site or area. In order to establish threshold values of climate suitability for the four vegetation types the total climate suitability was computed as a function of both MAAT and MAAP, and plotted in relation to the dominating vegetation type for all of the 15 sites. The relationship between climate suitability and dominating vegetation type was then used to estimate potential vegetational changes in palsa mires with a modeled climate change. Projections of precipitation and air temperature changes (Sælthum and Barkved, 2003) were used to model the climate induced vegetational changes on three time horizons: 30, 60 and 90 years, using 1990 as baseline scenario. The area modeled covered the northernmost parts of Sweden, Norway and Finland, approximately 270 000 km2.
The field observations showed that the vegetational changes related to palsa degradation at the Stordalen mire may be considered a general phenomenon within the study area, however measurements of active layer thickness indicate that palsa mires in the westernmost sites are more subjected to thawing than those located further east. Assuming the vegetational patterns of Stordalen mire are representative for the region,
31Reports of Finnish Envirornment Institute 3 | 2009
the GHG flux measurements from Stordalen mire (Bäckstrand, 2008) were up-scaled and used to estimate the potential change in GHG fluxes associated with the modeled change in palsa distribution within the study region.
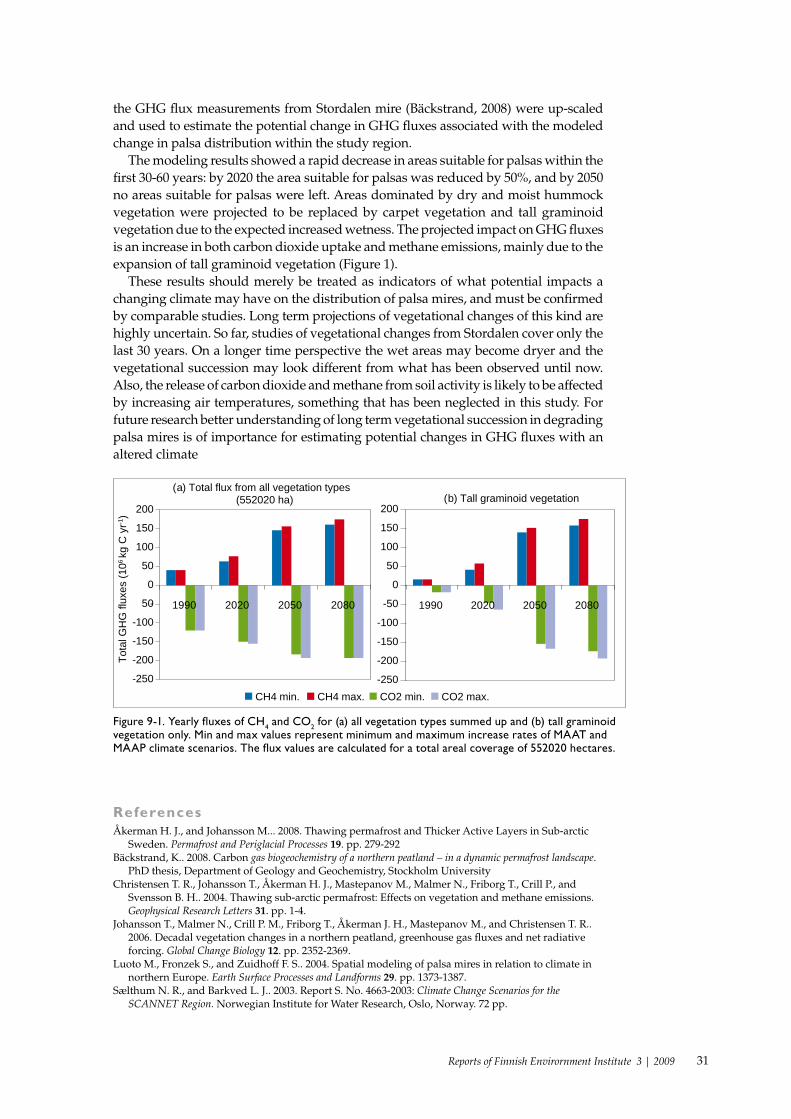
The modeling results showed a rapid decrease in areas suitable for palsas within the first 30-60 years: by 2020 the area suitable for palsas was reduced by 50%, and by 2050 no areas suitable for palsas were left. Areas dominated by dry and moist hummock vegetation were projected to be replaced by carpet vegetation and tall graminoid vegetation due to the expected increased wetness. The projected impact on GHG fluxes is an increase in both carbon dioxide uptake and methane emissions, mainly due to the expansion of tall graminoid vegetation (Figure 1).
These results should merely be treated as indicators of what potential impacts a changing climate may have on the distribution of palsa mires, and must be confirmed by comparable studies. Long term projections of vegetational changes of this kind are highly uncertain. So far, studies of vegetational changes from Stordalen cover only the last 30 years. On a longer time perspective the wet areas may become dryer and the vegetational succession may look different from what has been observed until now. Also, the release of carbon dioxide and methane from soil activity is likely to be affected by increasing air temperatures, something that has been neglected in this study. For future research better understanding of long term vegetational succession in degrading palsa mires is of importance for estimating potential changes in GHG fluxes with an altered climate
-250
-200
-150
-100
-50
0
50
100
150
200
1990 2020 2050 2080
Tota
l GH
G fl
uxes
(106
kg C
yr-1
)
(a) Total flux from all vegetation types (552020 ha)
-250
-200
-150
-100
-50
0
50
100
150
200
1990 2020 2050 2080
(b) Tall graminoid vegetation
CH4 min. CH4 max. CO2 min. CO2 max.
Figure 9-1. Yearly fluxes of CH4 and CO2 for (a) all vegetation types summed up and (b) tall graminoid vegetation only. Min and max values represent minimum and maximum increase rates of MAAT and MAAP climate scenarios. The flux values are calculated for a total areal coverage of 552020 hectares.
ReferencesÅkerman H. J., and Johansson M... 2008. Thawing permafrost and Thicker Active Layers in Sub-arctic
Sweden. Permafrost and Periglacial Processes 19. pp. 279-292 Bäckstrand, K.. 2008. Carbon gas biogeochemistry of a northern peatland – in a dynamic permafrost landscape.
PhD thesis, Department of Geology and Geochemistry, Stockholm University Christensen T. R., Johansson T., Åkerman H. J., Mastepanov M., Malmer N., Friborg T., Crill P., and
Svensson B. H.. 2004. Thawing sub-arctic permafrost: Effects on vegetation and methane emissions. Geophysical Research Letters 31. pp. 1-4.
Johansson T., Malmer N., Crill P. M., Friborg T., Åkerman J. H., Mastepanov M., and Christensen T. R.. 2006. Decadal vegetation changes in a northern peatland, greenhouse gas fluxes and net radiative forcing. Global Change Biology 12. pp. 2352-2369.
Luoto M., Fronzek S., and Zuidhoff F. S.. 2004. Spatial modeling of palsa mires in relation to climate in northern Europe. Earth Surface Processes and Landforms 29. pp. 1373-1387.
Sælthum N. R., and Barkved L. J.. 2003. Report S. No. 4663-2003: Climate Change Scenarios for the SCANNET Region. Norwegian Institute for Water Research, Oslo, Norway. 72 pp.
32 Reports of Finnish Envirornment Institute 3 | 2009
10 CH4 exchange over Stordalen mire by EC technique
Marcin Jackowicz-Korczyński1, Torben R. Christensen1, Thomas Friborg2, Patrick M. Crill3, Lena Ström1 1 GeoBiosphere Science Centre, Physical Geography and Ecosystems Analysis, Lund University, Lund, Sweden, 2 Department of Geography and Geology, University of Copenhagen, Copenhagen, Denmark, 3 Department of Geology and Geochemistry, Stockholm University, Stockholm, Sweden; Email of corresponding author: Marcin Jackowicz-Korczyń[email protected]
Subarctic peatlands are one of the most sensitive ecosystems which react in a direct way to climate warming. Already now we can observe how formations underlain by permafrost are rapidly disintegrating and changing into a wetter hydrological state [Malmer et al., 2005]. These changes have triggered visible and substantial changes in the vegetation distribution and may represent an important feedback mechanism in changing climate through changes in the land-atmosphere exchanges of trace gases such as carbon dioxide (CO2) and methane (CH4) [Johansson et al., 2006].
Within our study, intensive and detailed flux measurements of CH4 were conducted during 2006 and 2007 over Stordalen mire, northernmost part of sub-Arctic Sweden (68o 20’ N, 19o 03’ E, alt. 351 m). For measurements, non-intrusive and high time resolution micrometeorological method - eddy covariance (EC) - coupled with a tunable diode laser detector (TDL) (Aerodyne Res., Inc., Billerica, MA, USA) [Zachnisher et al., 1995] has been used. Despite the EC technique has been applied widely during the last decades and presently CO2 and H2O fluxes are determined on a routine basic all over the word [Baldocchi et al., 2001; Lindroth et al., 2007] there are still a limited number of well documented year round micrometeorological CH4 flux measurements available which are crucial for proper quantitative estimation of the carbon and greenhouse gas balance in wetland environments [Rinne et al., 2007].
Our measurements cover all seasons for both investigated years, however with the highest density obtained during summer and autumn (see table 1). Landscape scale fluxes documented by the eddy correlation system are rather high, averaging ~10 mg m-2 hr-1 during the peak season and these fluxes corresponded well with automatic chamber measurements in the wet minerotrophic parts of the peatland (latter vegetation type that is expanding as the permafrost is melting).
Table 10-1. Percentage of the seasonal data coverage obtained during the 2006 and 2007 measurement campaign.
Year Winter Spring Summer Autumn Total
2006 14.2 31.7 32.5 35.6 23.3
2007 11.7 11.7 50.0 55.8 27.8
In our study we have investigated also the major environmental controls such as the water table level and the soil temperature and it’s influence on the CH4 emission. As a main tool, multiple linear regression models have been applied with ln-transformed CH4 emission as dependent variable and above mentioned environmental controls as independent variables. No significant relations were found between the water table and CH4 during any season and the strongest relationship were found between the soil temperature and CH4 during the summer season. The lack of any clear relationship between the CH4 fluxes and the variation of the WT depth could be explained by the fact that the ecosystem monitored by the EC tower is very wet and permanently
33Reports of Finnish Envirornment Institute 3 | 2009
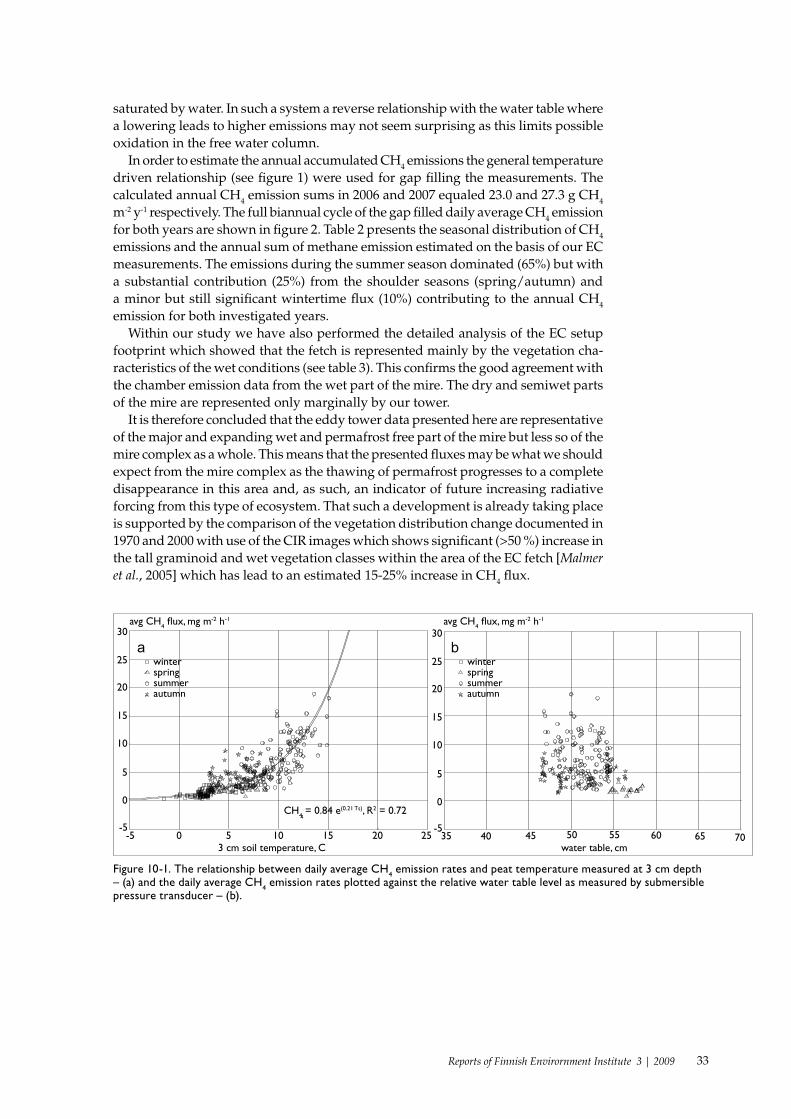
saturated by water. In such a system a reverse relationship with the water table where a lowering leads to higher emissions may not seem surprising as this limits possible oxidation in the free water column.
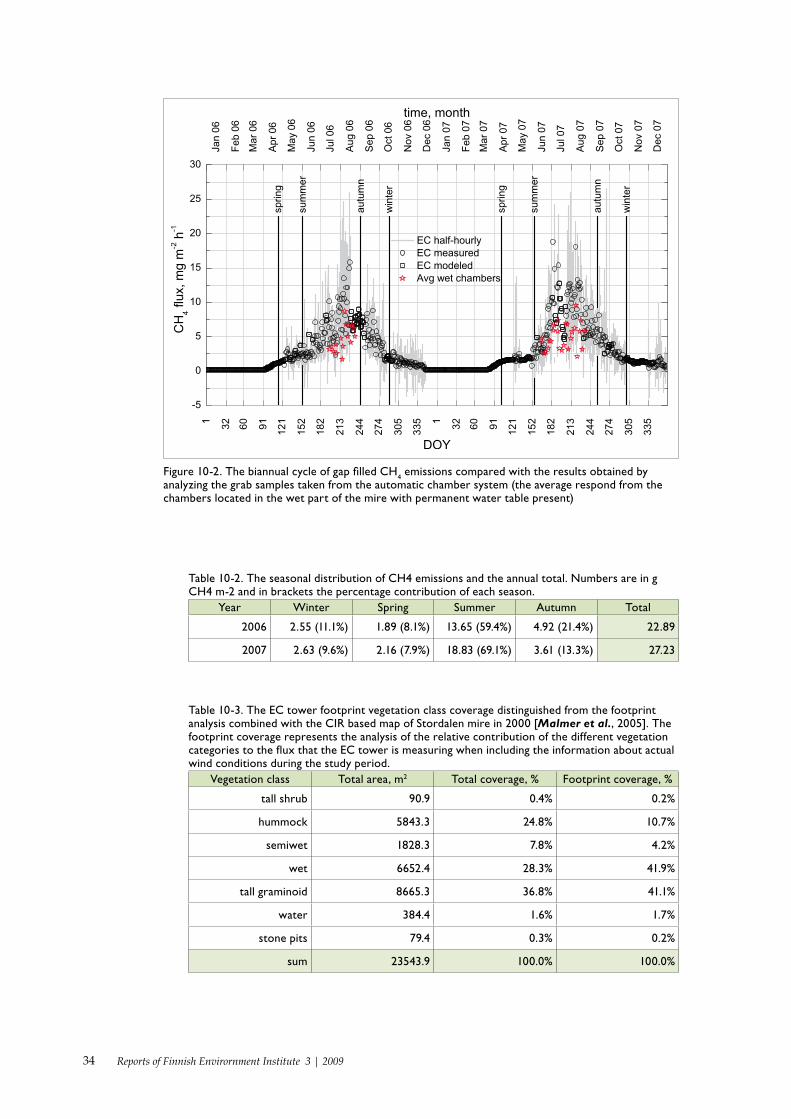
In order to estimate the annual accumulated CH4 emissions the general temperature driven relationship (see figure 1) were used for gap filling the measurements. The calculated annual CH4 emission sums in 2006 and 2007 equaled 23.0 and 27.3 g CH4 m-2 y-1 respectively. The full biannual cycle of the gap filled daily average CH4 emission for both years are shown in figure 2. Table 2 presents the seasonal distribution of CH4 emissions and the annual sum of methane emission estimated on the basis of our EC measurements. The emissions during the summer season dominated (65%) but with a substantial contribution (25%) from the shoulder seasons (spring/autumn) and a minor but still significant wintertime flux (10%) contributing to the annual CH4 emission for both investigated years.
Within our study we have also performed the detailed analysis of the EC setup footprint which showed that the fetch is represented mainly by the vegetation cha-racteristics of the wet conditions (see table 3). This confirms the good agreement with the chamber emission data from the wet part of the mire. The dry and semiwet parts of the mire are represented only marginally by our tower.
It is therefore concluded that the eddy tower data presented here are representative of the major and expanding wet and permafrost free part of the mire but less so of the mire complex as a whole. This means that the presented fluxes may be what we should expect from the mire complex as the thawing of permafrost progresses to a complete disappearance in this area and, as such, an indicator of future increasing radiative forcing from this type of ecosystem. That such a development is already taking place is supported by the comparison of the vegetation distribution change documented in 1970 and 2000 with use of the CIR images which shows significant (>50 %) increase in the tall graminoid and wet vegetation classes within the area of the EC fetch [Malmer et al., 2005] which has lead to an estimated 15-25% increase in CH4 flux.
avg CH4 �ux, mg m-2 h-1
30
25
20
15
10
5
0
30
25
20
15
10
5
0
-5 0 5 10 15 20 25-5 -5
35 40 45 50 55 60 65 70water table, cm3 cm soil temperature, C
winterspring summer autumn
winterspring summer autumn
avg CH4 �ux, mg m-2 h-1
CH4 = 0.84 e(0.21 Ts), R2 = 0.72
Figure 10-1. The relationship between daily average CH4 emission rates and peat temperature measured at 3 cm depth – (a) and the daily average CH4 emission rates plotted against the relative water table level as measured by submersible pressure transducer – (b).
34 Reports of Finnish Envirornment Institute 3 | 2009
Figure 10-2. The biannual cycle of gap filled CH4 emissions compared with the results obtained by analyzing the grab samples taken from the automatic chamber system (the average respond from the chambers located in the wet part of the mire with permanent water table present)
Table 10-2. The seasonal distribution of CH4 emissions and the annual total. Numbers are in g CH4 m-2 and in brackets the percentage contribution of each season.
Year Winter Spring Summer Autumn Total
2006 2.55 (11.1%) 1.89 (8.1%) 13.65 (59.4%) 4.92 (21.4%) 22.89
2007 2.63 (9.6%) 2.16 (7.9%) 18.83 (69.1%) 3.61 (13.3%) 27.23
Table 10-3. The EC tower footprint vegetation class coverage distinguished from the footprint analysis combined with the CIR based map of Stordalen mire in 2000 [Malmer et al., 2005]. The footprint coverage represents the analysis of the relative contribution of the different vegetation categories to the flux that the EC tower is measuring when including the information about actual wind conditions during the study period.
Vegetation class Total area, m2 Total coverage, % Footprint coverage, %
tall shrub 90.9 0.4% 0.2%
hummock 5843.3 24.8% 10.7%
semiwet 1828.3 7.8% 4.2%
wet 6652.4 28.3% 41.9%
tall graminoid 8665.3 36.8% 41.1%
water 384.4 1.6% 1.7%
stone pits 79.4 0.3% 0.2%
sum 23543.9 100.0% 100.0%

35Reports of Finnish Envirornment Institute 3 | 2009
ReferencesBaldocchi, D., et al. (2001), FLUXNET: A New Tool to Study the Temporal and Spatial Variability of
Ecosystem–Scale Carbon Dioxide, Water Vapor, and Energy Flux Densities, Bull. Amer. Meteor. Soc., 82(11), 2415-2434, doi: 10.1175/1520-0477(2001)082<2415:FANTTS>2.3.CO;2.
Johansson, T., N. Malmer, P. M. Crill, T. Friborg, J. H. Akerman, M. Mastepanov and T. R. Christensen (2006), Decadal vegetation changes in a northern peatland, greenhouse gas fluxes and net radiative forcing, Global Change Biol., 12(12), 2352-2369, doi: 10.1111/j.1365-2486.2006.01267.x.
Lindroth, A. et al. (2007), Environmental controls on the CO2 exchange in north European mires, Tellus B, 59(5), 812–825, doi:10.1111/j.1600-0889.2007.00310.x.
Malmer, N., T. Johansson, M. Olsrud and T. R. Christensen (2005), Vegetation, climatic changes and net carbon sequestration in a North-Scandinavian subarctic mire over 30 years, Glob. Change Biol., 11(11), 1895–1909, doi:10.1111/j.1365-2486.2005.01042.x.
Rinne, J., T. Riutta, M. Pihlatie, M. Aurela, S. Haapanala, J. P. Tuovinen, E. S. Tuittila and T. Vesala (2007), Annual cycle of methane emission from a boreal fen measured by the eddy covariance technique, Tellus B, 59(3), 449–457, doi:10.1111/j.1600-0889.2007.00261.x.
Zahniser, M. S., D. D. Nelson, J. Barry, J. McManus, P. L. Kebabian and D. Lloyd (1995), Measurement of Trace Gas Fluxes Using Tunable Diode Laser Spectroscopy, Phil. Trans. R. Soc. Lond. A, 351(1696), 371-381.
36 Reports of Finnish Envirornment Institute 3 | 2009
11 Palsa mires - CO2 exchange from Stordalen mire
Thomas Friborg1, Torbjörn Johansson1, Marcin Jackowicz-Korczynski2, Torben R. Christensen2 and Patrick M. Crill3. 1 University of Copenhagen, Department of Geography and Geology, DK-1350 Copenhagen K, Denmark 2 Lund University, GeoBiosphere Science Centre, Physical Geography and Ecosystems Analysis, S-22362 Lund, Sweden 3 Stockholm University, Department of Geology and Geochemistry, S-10691 Stockholm, Sweden Email of corresponding author: [email protected]
Natural ecosystems at high latitudes rarely show high exchange rates of CO2, water or energy, but especially wetland and associated palsamires often contains large pools of carbon, and in combination with the predicted climatic change particularly at these latitudes the carbon dynamics of these very sensitive ecosystems in the circum polar region is of interest (Laurila et al. 2001).
Here we show data from Stordalen mire (68° 21’N, 19° 02E) in Northernmost Sweden, where measurements of CO2 which in parallel with methane (CH4) flux measurements (Jackowicz-Korczynski, this issue) have been carried out since summer 2000. In relation to a changing climate the area is very interesting by being in the zone of discontinuous permafrost with an annual mean temperature of around 0°C, which makes the palsas a widespread landscape feature of the mires in the ecosystems of the area very sensitive to changes in the temperature. The Stordalen mire is subject to a rapid retreat of the permafrost (also found in several other wetlands of northern Sweden)(Akerman et al. 2008), which has caused a dramatic change in the distribution between wet and drier ecosystem types of the mire, towards the wetter parts becoming progressively more dominating over the past 30 years (Christensen et al. 2004). Such changes are likely to have high impact on the exchange of both CO2 and CH4, as wetter types tend to have higher CO2 uptake rates, but also correspondingly higher CH4 emission rates (Johansson et al. 2006).
The results presented here represent mainly the wetter ecosystem types of the mire, and cover three years of eddy correlation measurements carried out during the period 2001 to 2003. A comparison between these measurements and those obtained by the automated chamber placed in the wet parts of the mire show fairly good agreement in the CO2 flux for the summer season of 2003. Seasonal fluxes from the chambers of CO2 show that the wet parts has a season uptake of 4-500 g CO2 m
-2, whereas dry and intermediate ecosystem types have seasonal uptake rates of 100 and 140g CO2 m
-2 respectively. Despite that the difference in uptake between the different parts of the mire is less pronounced on an annual basis, it is likely that a change towards wetter conditions in the mire, would increase the annual CO2 uptake.
From three years of eddy correlation measurements from the mire we are able to evaluate the inter-annual variation in CO2 exchange (see Figure 1). The annual flux range from an emission of 138 g CO2 m
-2 y-1 in 2001 to a small uptake of 3 g CO2 m-2 y-1
in 2003 and may be related to generally lower temperatures in 2001 and to differences in the distribution of precipitation during summer (data not shown).
To obtain a more detailed understanding on the functioning with respect to photosynthesis of the palsa mire ecosystem in Stordalen and identify potential
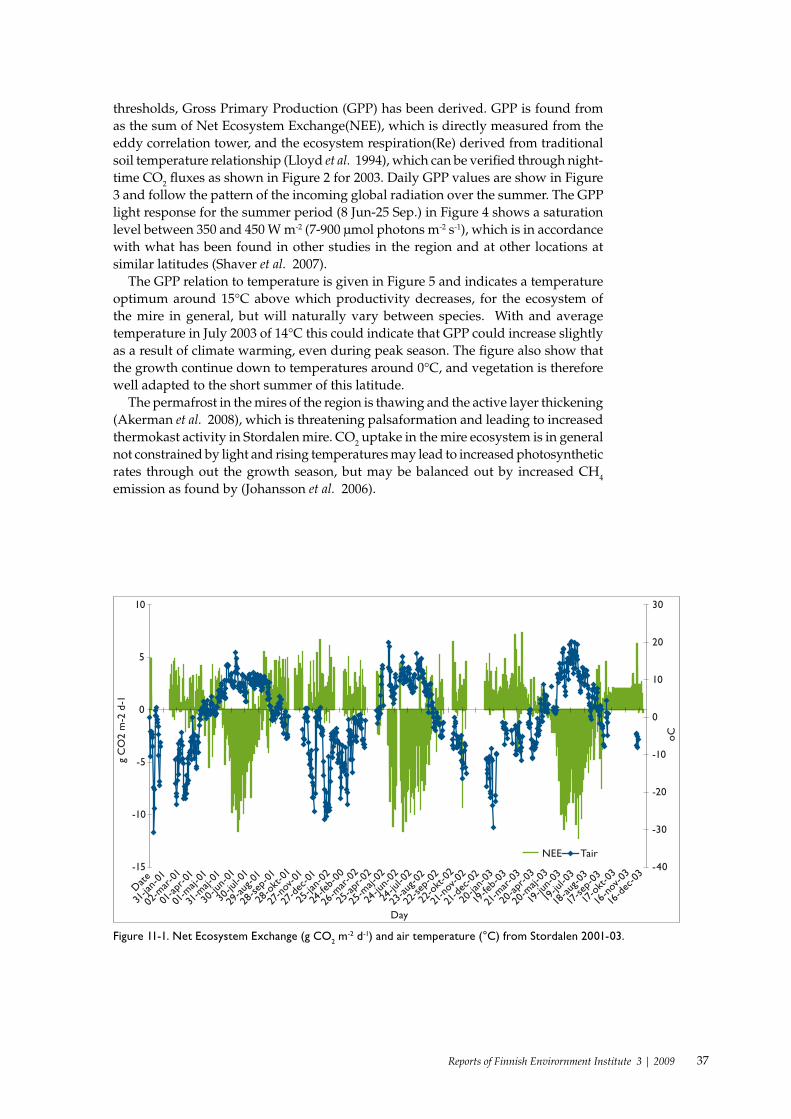
37Reports of Finnish Envirornment Institute 3 | 2009
thresholds, Gross Primary Production (GPP) has been derived. GPP is found from as the sum of Net Ecosystem Exchange(NEE), which is directly measured from the eddy correlation tower, and the ecosystem respiration(Re) derived from traditional soil temperature relationship (Lloyd et al. 1994), which can be verified through night-time CO2 fluxes as shown in Figure 2 for 2003. Daily GPP values are show in Figure 3 and follow the pattern of the incoming global radiation over the summer. The GPP light response for the summer period (8 Jun-25 Sep.) in Figure 4 shows a saturation level between 350 and 450 W m-2 (7-900 μmol photons m-2 s-1), which is in accordance with what has been found in other studies in the region and at other locations at similar latitudes (Shaver et al. 2007).
The GPP relation to temperature is given in Figure 5 and indicates a temperature optimum around 15°C above which productivity decreases, for the ecosystem of the mire in general, but will naturally vary between species. With and average temperature in July 2003 of 14°C this could indicate that GPP could increase slightly as a result of climate warming, even during peak season. The figure also show that the growth continue down to temperatures around 0°C, and vegetation is therefore well adapted to the short summer of this latitude.
The permafrost in the mires of the region is thawing and the active layer thickening (Akerman et al. 2008), which is threatening palsaformation and leading to increased thermokast activity in Stordalen mire. CO2 uptake in the mire ecosystem is in general not constrained by light and rising temperatures may lead to increased photosynthetic rates through out the growth season, but may be balanced out by increased CH4 emission as found by (Johansson et al. 2006).
-15
-10
-5
0
5
10
Date
31-ja
n-01
02-m
ar-0
1
01-ap
r-01
01-m
aj-01
31-m
aj-01
30-ju
n-01
30-ju
l-01
29-au
g-01
28-se
p-01
28-o
kt-0
1
27-n
ov-0
1
27-d
ec-0
1
25-ja
n-02
24-fe
b-00
26-m
ar-0
2
25-ap
r-02
25-m
aj-02
24-ju
n-02
24-ju
l-02
23-au
g-02
22-se
p-02
22-o
kt-0
2
21-n
ov-0
2
21-d
ec-0
2
20-ja
n-03
19-fe
b-03
21-m
ar-0
3
20-ap
r-03
20-m
aj-03
19-ju
n-03
19-ju
l-03
18-au
g-03
17-se
p-03
17-o
kt-0
3
16-n
ov-0
3
16-d
ec-0
3
Day
g C
O2
m-2
d-1
-40
-30
-20
-10
0
10
20
30
oC
NEE Tair
Figure 11-1. Net Ecosystem Exchange (g CO2 m-2 d-1) and air temperature (°C) from Stordalen 2001-03.
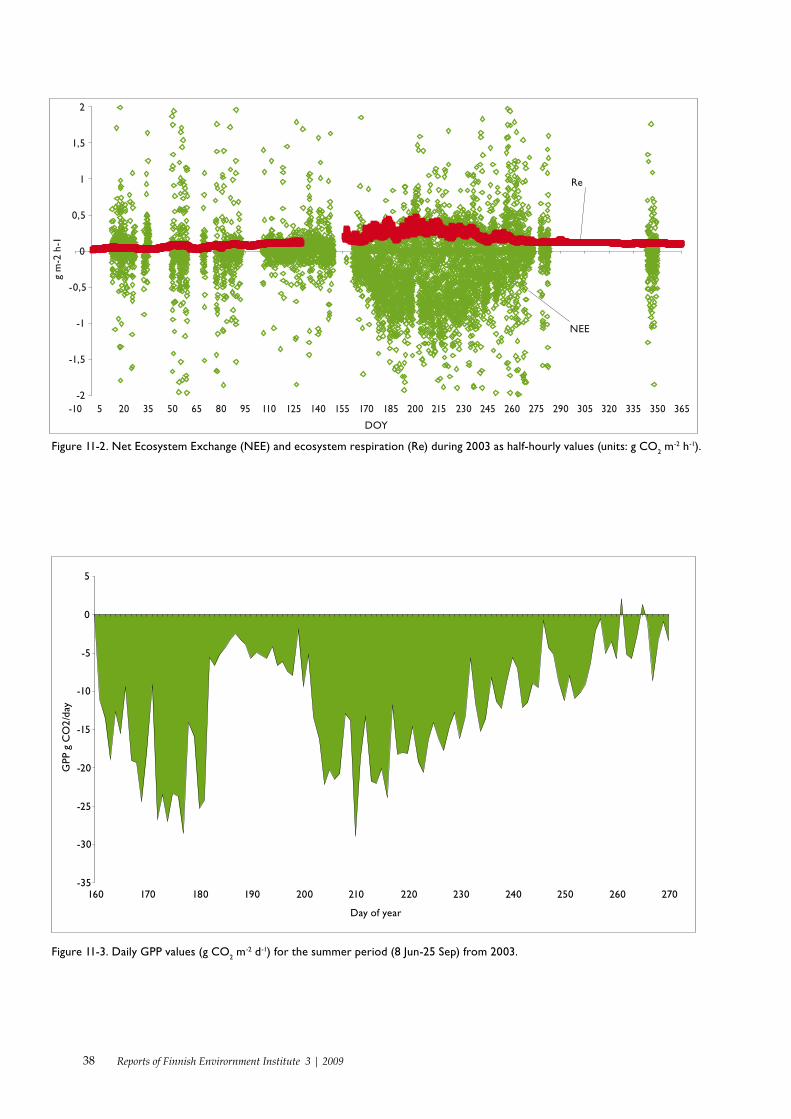
38 Reports of Finnish Envirornment Institute 3 | 2009
-2
-1,5
-1
-0,5
0
0,5
1
1,5
2
-10 5 20 35 50 65 80 95 110 125 140 155 170 185 200 215 230 245 260 275 290 305 320 335 350 365
DOY
g m
-2 h
-1
Re
NEE
Figure 11-2. Net Ecosystem Exchange (NEE) and ecosystem respiration (Re) during 2003 as half-hourly values (units: g CO2 m-2 h-1).
-35
-30
-25
-20
-15
-10
-5
0
5
160 170 180 190 200 210 220 230 240 250 260 270
Day of year
GPP
g C
O2/
day
Figure 11-3. Daily GPP values (g CO2 m-2 d-1) for the summer period (8 Jun-25 Sep) from 2003.
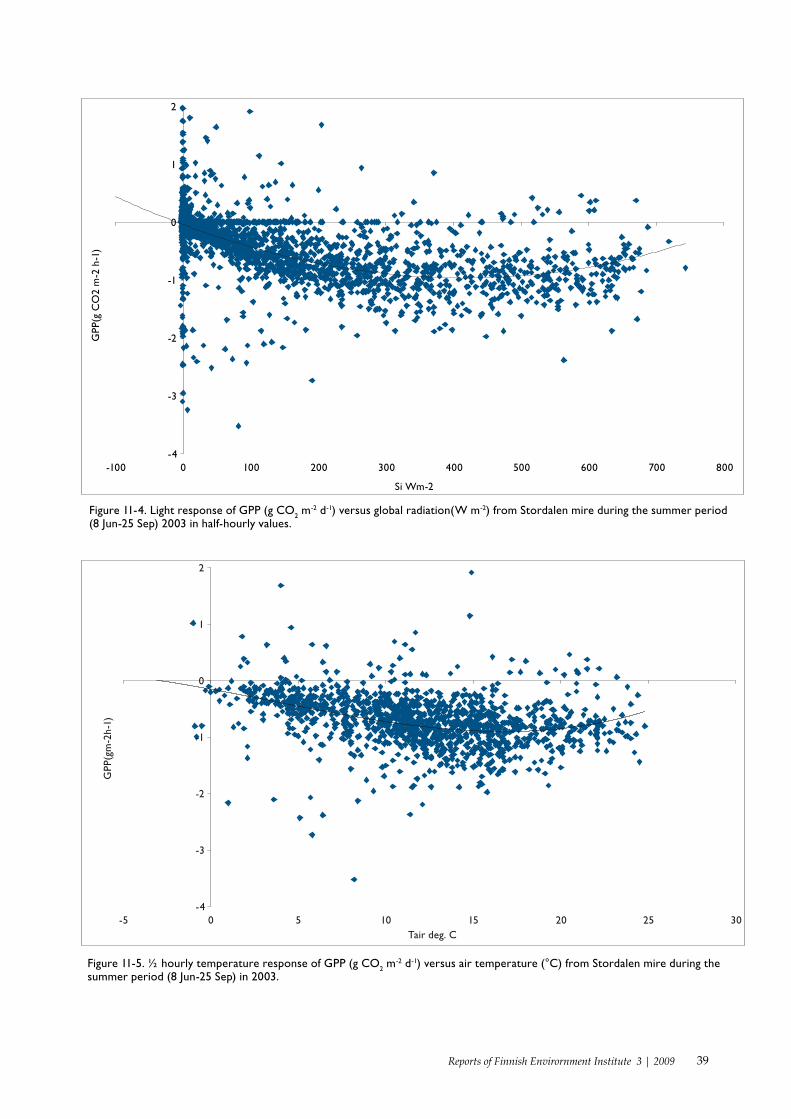
39Reports of Finnish Envirornment Institute 3 | 2009
-4
-3
-2
-1
0
1
2
-100 0 100 200 300 400 500 600 700 800
Si Wm-2
GPP
(g C
O2
m-2
h-1
)
Figure 11-4. Light response of GPP (g CO2 m-2 d-1) versus global radiation(W m-2) from Stordalen mire during the summer period
(8 Jun-25 Sep) 2003 in half-hourly values.
-4
-3
-2
-1
0
1
2
-5 0 5 10 15 20 25 30Tair deg. C
GPP
(gm
-2h-
1)
Figure 11-5. ½ hourly temperature response of GPP (g CO2 m-2 d-1) versus air temperature (°C) from Stordalen mire during the
summer period (8 Jun-25 Sep) in 2003.

40 Reports of Finnish Envirornment Institute 3 | 2009
ReferencesAkerman HJ, Johansson M(2008) Thawing permafrost and thicker active layers in sub-arctic Sweden.
Permafrost and Periglacial Processes 19 279-292.Christensen TR, Johansson TR, Akerman HJ, Mastepanov M, Malmer N, Friborg T, Crill P, Svensson
BH(2004) Thawing sub-arctic permafrost: Effects on vegetation and methane emissions. Geophysical Research Letters 31 .
Johansson T, Malmer N, Crill PM, Friborg T, Akerman JH, Mastepanov M, Christensen TR(2006) De-cadal vegetation changes in a northern peatland, greenhouse gas fluxes and net radiative forcing. Global Change Biology 12 2352-2369.
Laurila T, Soegaard H, Lloyd CR, Aurela M, Tuovinen JP, Nordstroem C(2001) Seasonal variations of net CO2 exchange in European Arctic ecosystems. Theoretical and Applied Climatology 70 183-201.
Lloyd J, Taylor JA(1994) On the Temperature-Dependence of Soil Respiration. Functional Ecology 8 315-323.
Shaver GR, Street LE, Rastetter EB, Van Wijk MT, Williams M(2007) Functional convergence in regulati-on of net CO2 flux in heterogeneous tundra landscapes in Alaska and Sweden. Journal of Ecology 95 802-817.
41Reports of Finnish Envirornment Institute 3 | 2009
12 A catchment scale process study of carbon and greenhouse gas exchange in a subarctic landscape
Torben R. Christensen1,5, Torbjörn Johansson1, Maria Olsrud1,6, Lena Ström1, Anders Lindroth1, Mikhail Mastepanov1, Nils Malmer2, Thomas Friborg3, Patrick M. Crill4 and Terry V. Callaghan5,7 1 GeoBiosphere Science Centre, Physical Geography and Ecosystems Analysis, Lund Uni-versity, Sweden. 2 Department of Ecology, Plant Ecology and Systematics, Lund University, Sweden. 3 Institute of Geography, Copenhagen University, Denmark 4 Department of Geology and Geochemistry, Stockholm University, Sweden 5 Abisko Scientific Research Station, Royal Swedish Academy of Sciences, Sweden. 6 Institute of Biology, Department of Terrestrial Ecology, Copenhagen University, Denmark 7 Department of Animal and Plant Sciences, The University of Sheffield, United Kingdom
Palsa mires have distinct features and dynamics in relation to emissions of the green-house gas methane. We have conducted field experiments at the plot scale where the permafrost is currently disintegrating with significant vegetation changes as a result (Johansson et al. 2006). During one growing season we investigated the fluxes of CO2 and CH4 and how they were affected by ecosystem properties, i.e., composition of species that are currently expanding in the area (Carex rotundata, Eriophorum vaginatum and Eriophorum angustifolium), dissolved CH4 in the pore water, substrate availability for methane producing bacteria, water table depth, active layer, temperature etc. The complex processes making up the net balance of CO2 and CH4 exchange are summari-sed in Figure 1. To be able to evaluate the combined radiative forcing of the different gas emissions we converted the total greenhouse gas emissions from the different plant species to CO2 equivalents, using a Global Warming Potentials Potential (GWP) over a 20 to 500-year time horizon. We found that all expanding species had a positive greenhouse gas budget and lead to an increased radiative forcing. Further the species that over the past two decades has increased the most (Malmer et al. 2005), i.e., E. angustifolium plots had a 1.7 to 2.1 times higher GWP20 than plots of the other two species. We concluded that our plot based study results point toward an important linkage between plant species composition and the functioning of wetland ecosystems with significant implications for feedback mechanisms in a changing climate as result (Ström and Christensen, 2007).
We went on to make an attempt at budgeting average current annual carbon (C) and associated greenhouse gas (GHG) exchanges and transfers in the whole of a subarctic landscape, the Lake Torneträsk catchment (Christensen et al., 2007). It is a heterogeneous area consisting of almost 4000 km2 of mixed heath, birch and pine forest, mires, lakes and alpine ecosystems. The magnitudes of atmospheric exchange of carbon in the form of the GHGs CO2 and CH4 in these various ecosystems differ significantly, ranging from little or no flux in barren ecosystems over a small CO2 sink function and low rates of CH4 exchange in the heaths to significant CO2 uptake in the forests and also large emissions of CH4 from the palsa mires and small lakes (Figure 2). The overall catchment budget, given the size distribution of the individual ecosystem types and a first approximation of run-off as dissolved organic carbon, reveals a landscape with currently a significant sink capacity for atmospheric CO2. This sink capacity is, however, extremely sensitive to environmental changes particularly those that affect the birch forest ecosystem. Climatic drying or wetting and episodic events
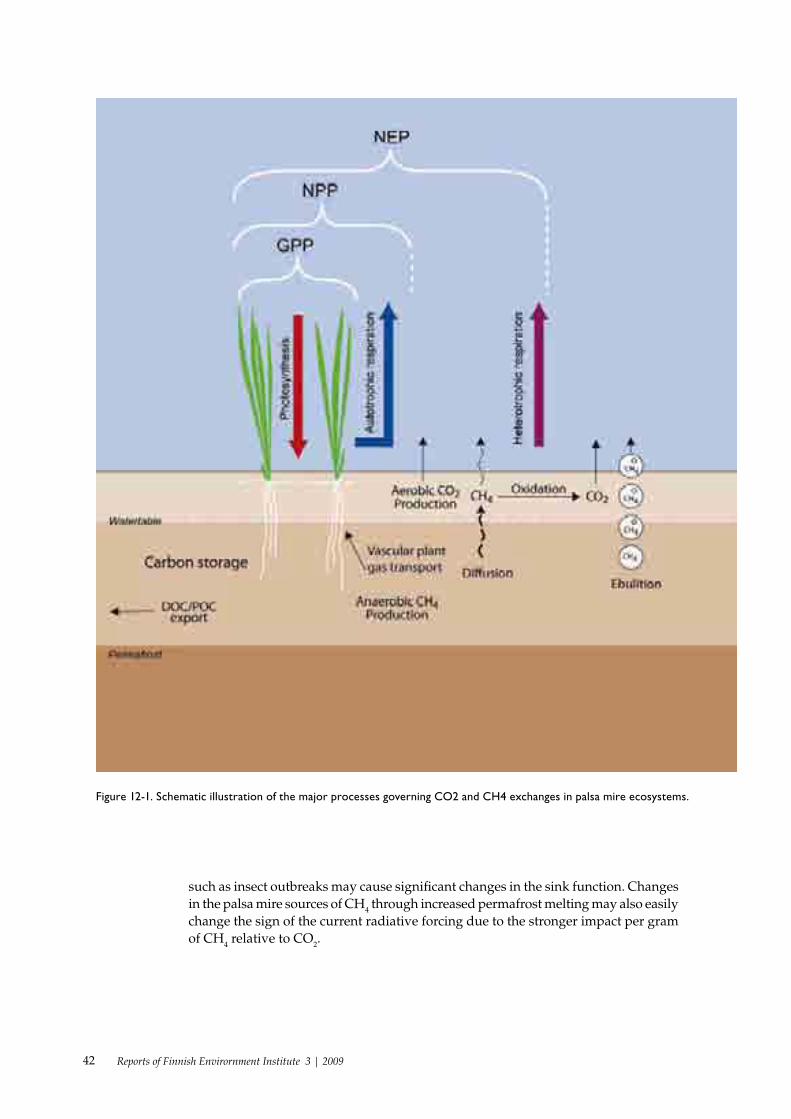
42 Reports of Finnish Envirornment Institute 3 | 2009
such as insect outbreaks may cause significant changes in the sink function. Changes in the palsa mire sources of CH4 through increased permafrost melting may also easily change the sign of the current radiative forcing due to the stronger impact per gram of CH4 relative to CO2.
Figure 12-1. Schematic illustration of the major processes governing CO2 and CH4 exchanges in palsa mire ecosystems.
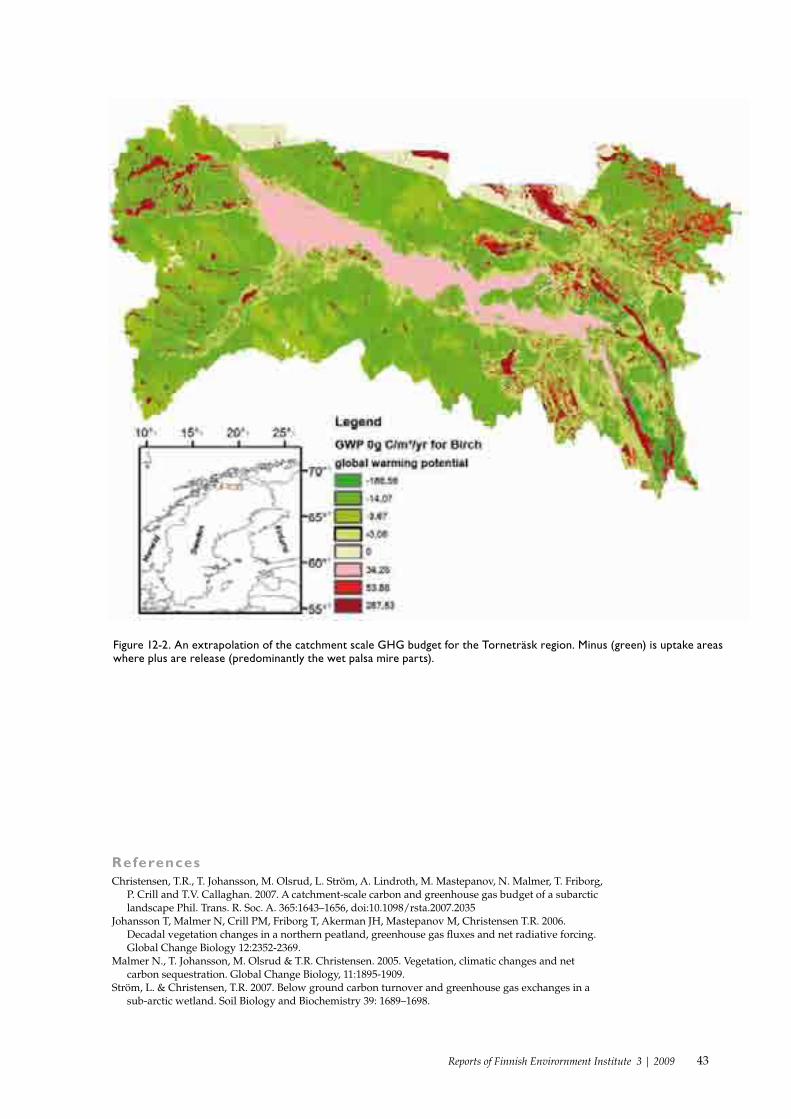
43Reports of Finnish Envirornment Institute 3 | 2009
Figure 12-2. An extrapolation of the catchment scale GHG budget for the Torneträsk region. Minus (green) is uptake areas where plus are release (predominantly the wet palsa mire parts).
ReferencesChristensen, T.R., T. Johansson, M. Olsrud, L. Ström, A. Lindroth, M. Mastepanov, N. Malmer, T. Friborg,
P. Crill and T.V. Callaghan. 2007. A catchment-scale carbon and greenhouse gas budget of a subarctic landscape Phil. Trans. R. Soc. A. 365:1643–1656, doi:10.1098/rsta.2007.2035
Johansson T, Malmer N, Crill PM, Friborg T, Akerman JH, Mastepanov M, Christensen T.R. 2006. Decadal vegetation changes in a northern peatland, greenhouse gas fluxes and net radiative forcing. Global Change Biology 12:2352-2369.
Malmer N., T. Johansson, M. Olsrud & T.R. Christensen. 2005. Vegetation, climatic changes and net carbon sequestration. Global Change Biology, 11:1895-1909.
Ström, L. & Christensen, T.R. 2007. Below ground carbon turnover and greenhouse gas exchanges in a sub-arctic wetland. Soil Biology and Biochemistry 39: 1689–1698.
44 Reports of Finnish Envirornment Institute 3 | 2009
13 Methane emission from Russian frozen wetlands under conditions of climate change
Svetlana Reneva State Hydrological Institute, St.Petersburg, Russia Email: [email protected]
There is growing evidence that the climate change will have significant impact on permafrost, leading to warming, thawing, and disappearance of the frozen ground. Arctic soils contain 14%-30% of all the carbon stored in soils worldwide, many of which is accumulated in the Arctic wetlands (Anisimov & Reneva 2006). Wetlands occupy almost 2 million km2 in the circumpolar region, contain about 50 Gt C, and because of the high groundwater levels favour the production of methane in the anaerobic carbon-rich soil layer (Anisimov et al 2005). Methane has 21-times stronger greenhouse effect than the equal amount of CO2, and there are growing concerns that enhanced CH4 emission may have significant effect on the global radiative forcing. The goal of our study was to estimate the potential increase in the methane emission from Russian frozen wetlands under the projected for the mid-21st century climatic conditions and to evaluate the effect it may have on global radiative forcing.
We used digital geographically referenced contours of Russian wetlands from 1:1,000,000-scale topographic maps to calculate the total area (350 000 km2) and the fraction of land they occupy in the nodes of 0.5 by 0.5 degree lat/long regular grid spanning permafrost regions. These data were overlaid with the results from predic-tive permafrost model (Anisimov & Belolutskaia 2003, Anisimov et al 1999) forced by CCC, HadCM3, GFDL, NCAR climatic projections for 2050 under B1 emission scenario (ref. http://ipcc-ddc.cru.uea.ac.uk/ and(ref. http://ipcc-ddc.cru.uea.ac.uk/ and http://igloo.atmos.uiuc.edu/IPCC/). Ultimately, we calculated the increase in the amount of organic material that may potentially become available for decom-position due to deeper seasonal thawing of wetlands in the Russian part of Arctic. Following (Christensen et al 2003a, Christensen et al 2003b) we hypothesised that the temperature and substrate availability combined explain almost entirely the variations in mean annual methane emissions. We used the results of numerous calculations with the full-scale carbon model simulating a large variety of soil and temperature conditions to derive a simple parameterization that links the relative changes of methane flux with soil temperature and active layer thickness:
J2/J1= exp 0.1(T2 – T1) , 12/ dd HH
where J – methane flux, T – ground temperature, Hd – thaw depth, subscripts 1 and 2 designate the baseline and future climatic conditions current and the future time slices.
Our results for the mid-21st century indicate that the annual emission of methane from Russian permafrost region may increase by 20% – 40% over most of the area, and by 50% – 80% in the northernmost locations, which corresponds to 6–8 Mt y-1. Given that the average residence time of methane in the atmosphere is 12 years, and assuming that other sinks and sources remain unchanged, by the mid-21st century the additional annual 6–8 Mt source due to thawing of permafrost may increase the
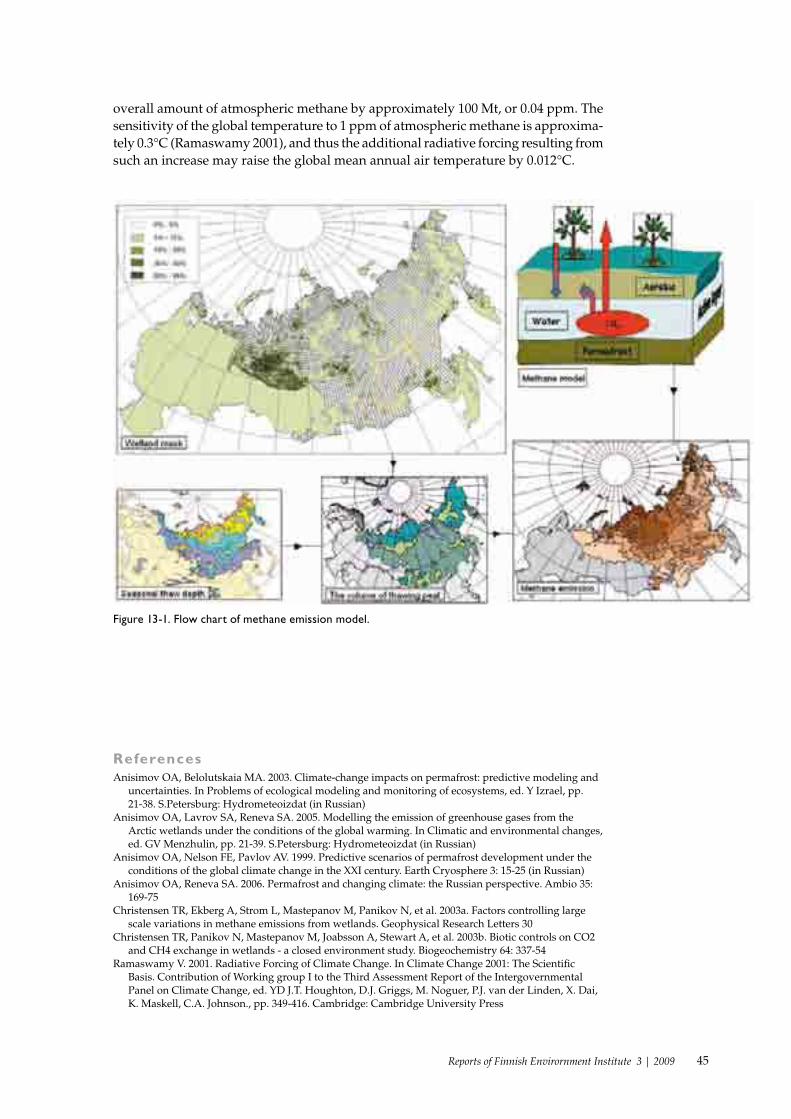
45Reports of Finnish Envirornment Institute 3 | 2009
overall amount of atmospheric methane by approximately 100 Mt, or 0.04 ppm. The sensitivity of the global temperature to 1 ppm of atmospheric methane is approxima-tely 0.3°C (Ramaswamy 2001), and thus the additional radiative forcing resulting from such an increase may raise the global mean annual air temperature by 0.012°C.
Figure 13-1. Flow chart of methane emission model.
ReferencesAnisimov OA, Belolutskaia MA. 2003. Climate-change impacts on permafrost: predictive modeling and
uncertainties. In Problems of ecological modeling and monitoring of ecosystems, ed. Y Izrael, pp. 21-38. S.Petersburg: Hydrometeoizdat (in Russian)
Anisimov OA, Lavrov SA, Reneva SA. 2005. Modelling the emission of greenhouse gases from the Arctic wetlands under the conditions of the global warming. In Climatic and environmental changes, ed. GV Menzhulin, pp. 21-39. S.Petersburg: Hydrometeoizdat (in Russian)
Anisimov OA, Nelson FE, Pavlov AV. 1999. Predictive scenarios of permafrost development under the conditions of the global climate change in the XXI century. Earth Cryosphere 3: 15-25 (in Russian)
Anisimov OA, Reneva SA. 2006. Permafrost and changing climate: the Russian perspective. Ambio 35: 169-75
Christensen TR, Ekberg A, Strom L, Mastepanov M, Panikov N, et al. 2003a. Factors controlling large scale variations in methane emissions from wetlands. Geophysical Research Letters 30
Christensen TR, Panikov N, Mastepanov M, Joabsson A, Stewart A, et al. 2003b. Biotic controls on CO2 and CH4 exchange in wetlands - a closed environment study. Biogeochemistry 64: 337-54
Ramaswamy V. 2001. Radiative Forcing of Climate Change. In Climate Change 2001: The Scientific Basis. Contribution of Working group I to the Third Assessment Report of the Intergovernmental Panel on Climate Change, ed. YD J.T. Houghton, D.J. Griggs, M. Noguer, P.J. van der Linden, X. Dai, K. Maskell, C.A. Johnson., pp. 349-416. Cambridge: Cambridge University Press
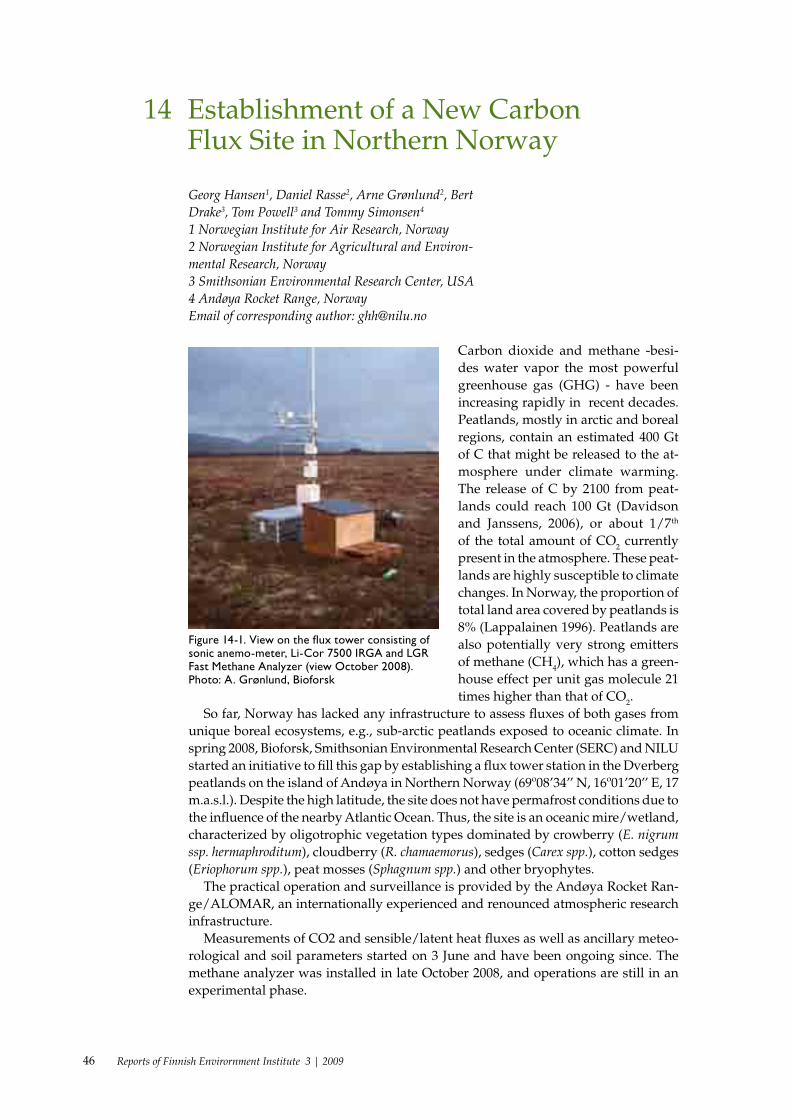
46 Reports of Finnish Envirornment Institute 3 | 2009
14 Establishment of a New Carbon Flux Site in Northern Norway
Georg Hansen1, Daniel Rasse2, Arne Grønlund2, Bert Drake3, Tom Powell3 and Tommy Simonsen4 1 Norwegian Institute for Air Research, Norway 2 Norwegian Institute for Agricultural and Environ-mental Research, Norway 3 Smithsonian Environmental Research Center, USA 4 Andøya Rocket Range, Norway Email of corresponding author: [email protected]
Carbon dioxide and methane -besi-des water vapor the most powerful greenhouse gas (GHG) - have been increasing rapidly in recent decades. Peatlands, mostly in arctic and boreal regions, contain an estimated 400 Gt of C that might be released to the at-mosphere under climate warming. The release of C by 2100 from peat-lands could reach 100 Gt (Davidson and Janssens, 2006), or about 1/7th of the total amount of CO2 currently present in the atmosphere. These peat-lands are highly susceptible to climate changes. In Norway, the proportion of total land area covered by peatlands is 8% (Lappalainen 1996). Peatlands are also potentially very strong emitters of methane (CH4), which has a green-house effect per unit gas molecule 21 times higher than that of CO2.
So far, Norway has lacked any infrastructure to assess fluxes of both gases from unique boreal ecosystems, e.g., sub-arctic peatlands exposed to oceanic climate. In spring 2008, Bioforsk, Smithsonian Environmental Research Center (SERC) and NILU started an initiative to fill this gap by establishing a flux tower station in the Dverberg peatlands on the island of Andøya in Northern Norway (69º08’34’’ N, 16º01’20’’ E, 17 m.a.s.l.). Despite the high latitude, the site does not have permafrost conditions due to the influence of the nearby Atlantic Ocean. Thus, the site is an oceanic mire/wetland, characterized by oligotrophic vegetation types dominated by crowberry (E. nigrum ssp. hermaphroditum), cloudberry (R. chamaemorus), sedges (Carex spp.), cotton sedges (Eriophorum spp.), peat mosses (Sphagnum spp.) and other bryophytes.
The practical operation and surveillance is provided by the Andøya Rocket Ran-ge/ALOMAR, an internationally experienced and renounced atmospheric research infrastructure.
Measurements of CO2 and sensible/latent heat fluxes as well as ancillary meteo-rological and soil parameters started on 3 June and have been ongoing since. The methane analyzer was installed in late October 2008, and operations are still in an experimental phase.
Figure 14-1. View on the flux tower consisting of sonic anemo-meter, Li-Cor 7500 IRGA and LGR Fast Methane Analyzer (view October 2008). Photo: A. Grønlund, Bioforsk
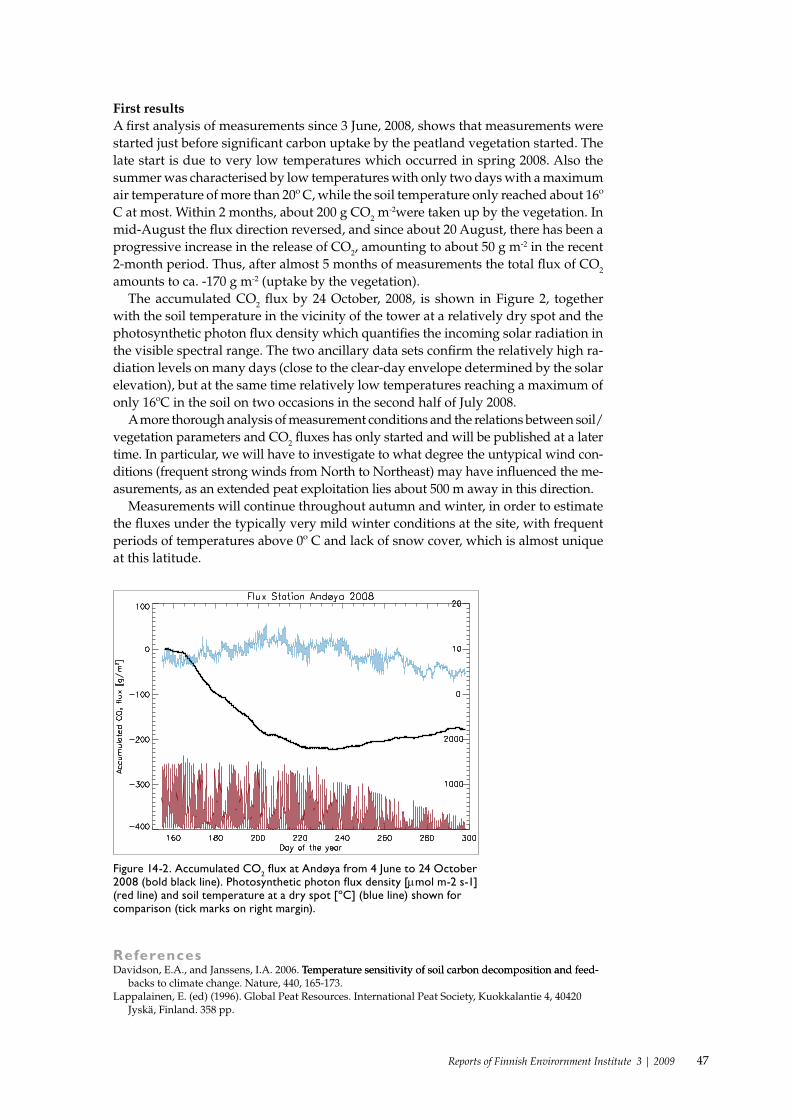
47Reports of Finnish Envirornment Institute 3 | 2009
First resultsA first analysis of measurements since 3 June, 2008, shows that measurements were started just before significant carbon uptake by the peatland vegetation started. The late start is due to very low temperatures which occurred in spring 2008. Also the summer was characterised by low temperatures with only two days with a maximum air temperature of more than 20º C, while the soil temperature only reached about 16º C at most. Within 2 months, about 200 g CO2 m
-2were taken up by the vegetation. In mid-August the flux direction reversed, and since about 20 August, there has been a progressive increase in the release of CO2, amounting to about 50 g m-2 in the recent 2-month period. Thus, after almost 5 months of measurements the total flux of CO2 amounts to ca. -170 g m-2 (uptake by the vegetation).
The accumulated CO2 flux by 24 October, 2008, is shown in Figure 2, together with the soil temperature in the vicinity of the tower at a relatively dry spot and the photosynthetic photon flux density which quantifies the incoming solar radiation in the visible spectral range. The two ancillary data sets confirm the relatively high ra-diation levels on many days (close to the clear-day envelope determined by the solar elevation), but at the same time relatively low temperatures reaching a maximum of only 16ºC in the soil on two occasions in the second half of July 2008.
A more thorough analysis of measurement conditions and the relations between soil/vegetation parameters and CO2 fluxes has only started and will be published at a later time. In particular, we will have to investigate to what degree the untypical wind con-ditions (frequent strong winds from North to Northeast) may have influenced the me-asurements, as an extended peat exploitation lies about 500 m away in this direction.
Measurements will continue throughout autumn and winter, in order to estimate the fluxes under the typically very mild winter conditions at the site, with frequent periods of temperatures above 0º C and lack of snow cover, which is almost unique at this latitude.
ReferencesDavidson, E.A., and Janssens, I.A. 2006. Temperature sensitivity of soil carbon decomposition and feed-Temperature sensitivity of soil carbon decomposition and feed-
backs to climate change. Nature, 440, 165-173.Lappalainen, E. (ed) (1996). Global Peat Resources. International Peat Society, Kuokkalantie 4, 40420
Jyskä, Finland. 358 pp.
Figure 14-2. Accumulated CO2 flux at Andøya from 4 June to 24 October 2008 (bold black line). Photosynthetic photon flux density [µmol m-2 s-1] (red line) and soil temperature at a dry spot [ºC] (blue line) shown for comparison (tick marks on right margin).
48 Reports of Finnish Envirornment Institute 3 | 2009
15 Dissolved Organic Carbon in the Boreal Black Spruce Forest: Chemical Character and Biodegradability
Kimberly P. Wickland United States Geological Survey , USA Email: [email protected]
Dissolved organic carbon (DOC) cycling in arctic and subarctic ecosystems, especially in permafrost-impacted areas, is of particular interest in light of changing climate at northern latitudes. The large amounts of organic C in biomass and soils are a poten-tially significant DOC source, and permafrost prevents deep percolation so DOC can be efficiently transported to surface waters. The fate of terrestrially-derived DOC is important to carbon cycling in both terrestrial and aquatic environments, and recent evidence suggests that climate warming is influencing DOC dynamics in arctic and subarctic ecosystems (Frey and Smith, 2005; Striegl et al., 2005). Terrestrially-derived DOC can be metabolized by microbes in soils and emitted as carbon dioxide (CO2) or methane (CH4) (Chasar et al. 2000), sorbed to mineral soils, or transported to ground and surface waters. To predict the fate of terrestrial DOC in arctic and subarctic ecosys-tems, it is essential to quantify the chemical nature and potential biodegradability of this DOC, and to understand how these qualities vary with source. We examined the chemistry and potential biodegradability of DOC from vegetation leachates and from soil pore waters of black spruce forest, a dominant ecosystem type in the boreal regions of North America. Our results, which are described in detail in Wickland et al. (2007), demonstrate the importance of vegetation common to many northern ecosystems as sources of labile and recalcitrant DOC, and we quantify the potential biodegradability of DOC from sites varying in permafrost extent and hydrologic regime.
We examined DOC chemical characteristics and biodegradability from soil pore waters and dominant vegetation species collected from four boreal black spruce forest sites in Alaska spanning a range of hydrologic regimes and permafrost extents (Well Drained, Moderately Well Drained, Poorly Drained, and Thermokarst Wetlands). Mean permafrost depths at each site were 43 cm at the Moderately Well Drained and 41 cm at the Poorly Drained site, while the Well Drained and Thermokarst Wetlands sites had no detectable permafrost in the upper 2 m. Organic layer thickness increased from a minimum of 10 cm at the Well Drained site to 90 cm at the Poorly Drained and Thermokarst Wetlands sites. Black spruce tree densities were highest at the Well Drained site and lowest (0 trees ha-1) at the Thermokarst Wetlands site. Groundcover vegetation varied with drainage, such that lichens and feathermosses dominated the better drained sites and Sphagnum mosses and sedges were more important at the Poorly Drained and Thermokarst Wetlands sites. Soil pore waters were collected on several dates over the span of four years, and varied with site depending on water availability (Well Drained: April-July; Moderately Well Drained: May-October; Poorly Drained: May-September; Thermokarst Wetlands: March-September). Vegetation samples for leaching were collected from the sites on one occasion, and included Picea mariana (black spruce) needles, P. Mariana bark and twigs, a mix of Hylocomium splendens and Plerozium schreberii (feathermoss mix), Sphagnum angustifolium, Betula nana (dwarf birch) leaves, Betula papyrifera (paper birch) leaves, and Eriphorum an-gustifolium (cotton grass).
Soil pore waters were filtered in the field (0.45 µm) and refrigerated until analysis. Vegetation samples were air-dried, then leached for soluble organic C in the labo-
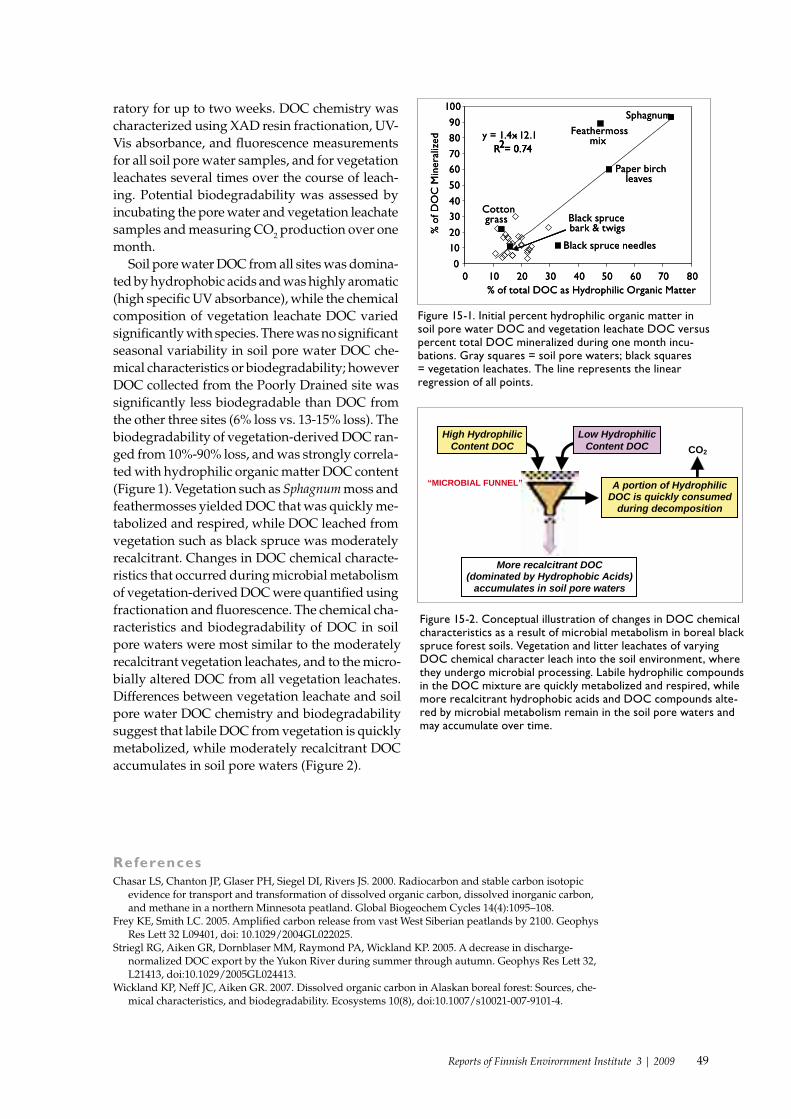
49Reports of Finnish Envirornment Institute 3 | 2009
ratory for up to two weeks. DOC chemistry was characterized using XAD resin fractionation, UV-Vis absorbance, and fluorescence measurements for all soil pore water samples, and for vegetation leachates several times over the course of leach-ing. Potential biodegradability was assessed by incubating the pore water and vegetation leachate samples and measuring CO2 production over one month.
Soil pore water DOC from all sites was domina-ted by hydrophobic acids and was highly aromatic (high specific UV absorbance), while the chemical composition of vegetation leachate DOC varied significantly with species. There was no significant seasonal variability in soil pore water DOC che-mical characteristics or biodegradability; however DOC collected from the Poorly Drained site was significantly less biodegradable than DOC from the other three sites (6% loss vs. 13-15% loss). The biodegradability of vegetation-derived DOC ran-ged from 10%-90% loss, and was strongly correla-ted with hydrophilic organic matter DOC content (Figure 1). Vegetation such as Sphagnum moss and feathermosses yielded DOC that was quickly me-tabolized and respired, while DOC leached from vegetation such as black spruce was moderately recalcitrant. Changes in DOC chemical characte-ristics that occurred during microbial metabolism of vegetation-derived DOC were quantified using fractionation and fluorescence. The chemical cha-racteristics and biodegradability of DOC in soil pore waters were most similar to the moderately recalcitrant vegetation leachates, and to the micro-bially altered DOC from all vegetation leachates. Differences between vegetation leachate and soil pore water DOC chemistry and biodegradability suggest that labile DOC from vegetation is quickly metabolized, while moderately recalcitrant DOC accumulates in soil pore waters (Figure 2).
Figure 15-1. Initial percent hydrophilic organic matter in soil pore water DOC and vegetation leachate DOC versus percent total DOC mineralized during one month incu-bations. Gray squares = soil pore waters; black squares = vegetation leachates. The line represents the linear regression of all points.
Figure 15-2. Conceptual illustration of changes in DOC chemical characteristics as a result of microbial metabolism in boreal black spruce forest soils. Vegetation and litter leachates of varying DOC chemical character leach into the soil environment, where they undergo microbial processing. Labile hydrophilic compounds in the DOC mixture are quickly metabolized and respired, while more recalcitrant hydrophobic acids and DOC compounds alte-red by microbial metabolism remain in the soil pore waters and may accumulate over time.
y = 1.4x - 12.1R2= 0.74
0
1020
30
40
50
6070
80
90
100
0 10 20 30 40 50 60 70 80% of total DOC as Hydrophilic Organic Matter
% o
f DO
C M
iner
aliz
ed
Sphagnum
Feathermossmix
Paper birch leaves
Black spruce needles
Black sprucebark & twigs
Cotton grass
y = 1.4x - 12.1R2= 0.74R2= 0.74
0
1020
30
40
50
6070
80
90
100
0 10 20 30 40 50 60 70 80% of total DOC as Hydrophilic Organic Matter
% o
f DO
C M
iner
aliz
ed
Sphagnum
Feathermossmix
Paper birch leaves
Black spruce needles
Black sprucebark & twigs
Cotton grass
CO2 ex. Moss leachate DOC
ex. Spruce leachate DOC
High Hydrophilic Content DOC
Low Hydrophilic Content DOC
A portion of Hydrophilic DOC is quickly consumed
during decomposition
More recalcitrant DOC (dominated by Hydrophobic Acids)
accumulates in soil pore waters
“MICROBIAL FUNNEL”
ReferencesChasar LS, Chanton JP, Glaser PH, Siegel DI, Rivers JS. 2000. Radiocarbon and stable carbon isotopic
evidence for transport and transformation of dissolved organic carbon, dissolved inorganic carbon, and methane in a northern Minnesota peatland. Global Biogeochem Cycles 14(4):1095–108.
Frey KE, Smith LC. 2005. Amplified carbon release from vast West Siberian peatlands by 2100. Geophys Res Lett 32 L09401, doi: 10.1029/2004GL022025.
Striegl RG, Aiken GR, Dornblaser MM, Raymond PA, Wickland KP. 2005. A decrease in discharge-normalized DOC export by the Yukon River during summer through autumn. Geophys Res Lett 32, L21413, doi:10.1029/2005GL024413.
Wickland KP, Neff JC, Aiken GR. 2007. Dissolved organic carbon in Alaskan boreal forest: Sources, che-mical characteristics, and biodegradability. Ecosystems 10(8), doi:10.1007/s10021-007-9101-4.

50 Reports of Finnish Envirornment Institute 3 | 2009

51Reports of Finnish Envirornment Institute 3 | 2009
Theme 3: Palsa mire ecosystem and paleoecological studies

52 Reports of Finnish Envirornment Institute 3 | 2009
53Reports of Finnish Envirornment Institute 3 | 2009
16 A Holocene perspective on palsa mires in northern Fennoscandia with particular focus on Stordalen
Dan Hammarlund and Ulla Kokfelt GeoBiosphere Science Centre, Quaternary Sciences, Lund University, Lund, Sweden Email of corresponding author: [email protected]
As demonstrated by Fronzek et al. (2006), the modern spatial distribution of palsa mires in northern Fennoscandia, broadly representing the extent of discontinuous and sporadic permafrost at low elevations, is strongly dependent on specific climatic parameters. Especially along its western margin, running largely along the Scandes mountain chain, the distribution of palsa mires is determined by steep gradients in mean annual temperature and precipitation. These climatic gradients, as well as the general decisive pattern of mean annual temperature in the interior of northern Fennoscandia, have experienced substantial centennial- to millennial-scale changes during the present interglacial. Thus, corresponding temporal dynamics of the areal extent of permafrost can be assumed to have taken place, although lag responses have to be taken into account (Halsey et al., 1995).
Northern Fennoscandia is among the most well-studied regions world-wide in terms of Holocene palaeoecological and palaeoclimatic records, and numerous climate reconstructions based on biological transfer functions have been obtained from sediment sequences of small lakes around Lake Torneträsk in northernmost Sweden and in adjacent parts of Norway and Finland. A prominent feature common to these climate reconstructions is a period of inferred summer temperatures exceeding present-day levels by 1-2°C, the Holocene Thermal Maximum (HTM), at c. 8000-4500 cal. BP (Bjune et al., 2004; Snowball et al., 2004). As shown by Bigler et al. (2002), winter temperatures were probably also slightly higher during the HTM, persistently maintaining mean annual temperatures above present-day values. The climatic development during the earliest part of the Holocene, i.e. the 2-3 millennia subsequent to the deglaciation (c. 10,000 cal. BP in the Lake Torneträsk area), is generally poorly constrained due to non-analogous biological assemblages in the proxy records. However, based on several lines of evidence a generally oceanic and relatively cold climate prevailed in northern Fennoscandia prior to the HTM, characterized by enhanced cyclonic circulation and snow-rich winters. Relatively high winter precipitation during the early Holocene is inferred from clearly expressed spring snow-melt events in North Swedish lake sediments (Snowball et al., 1999), higher lake levels in northern Finland (Korhola et al., 2005) and expansion of mountain glaciers in northern Norway (Bakke et al., 2005). These data are consistent with oxygen-isotope records obtained on carbonates in lake sediments and cave deposits indicating a greater penetration of westerlies and associated moisture across the Scandes Mountains during the early Holocene (Hammarlund et al., 2002; Hammarlund and Edwards, 2008). Based on these inferences, it appears likely that permafrost was restricted to higher elevations in the Scandes Mountains until the end of the HTM. A generally thicker snow cover prevented permafrost aggradation during the early Holocene and mean annual temperature was too high during the HTM (see figure). Furthermore, the development of palsa mires was prevented by the general lack of sufficiently thick peat deposits until a colder and more humid climate evolved during the last 3-4 millennia.
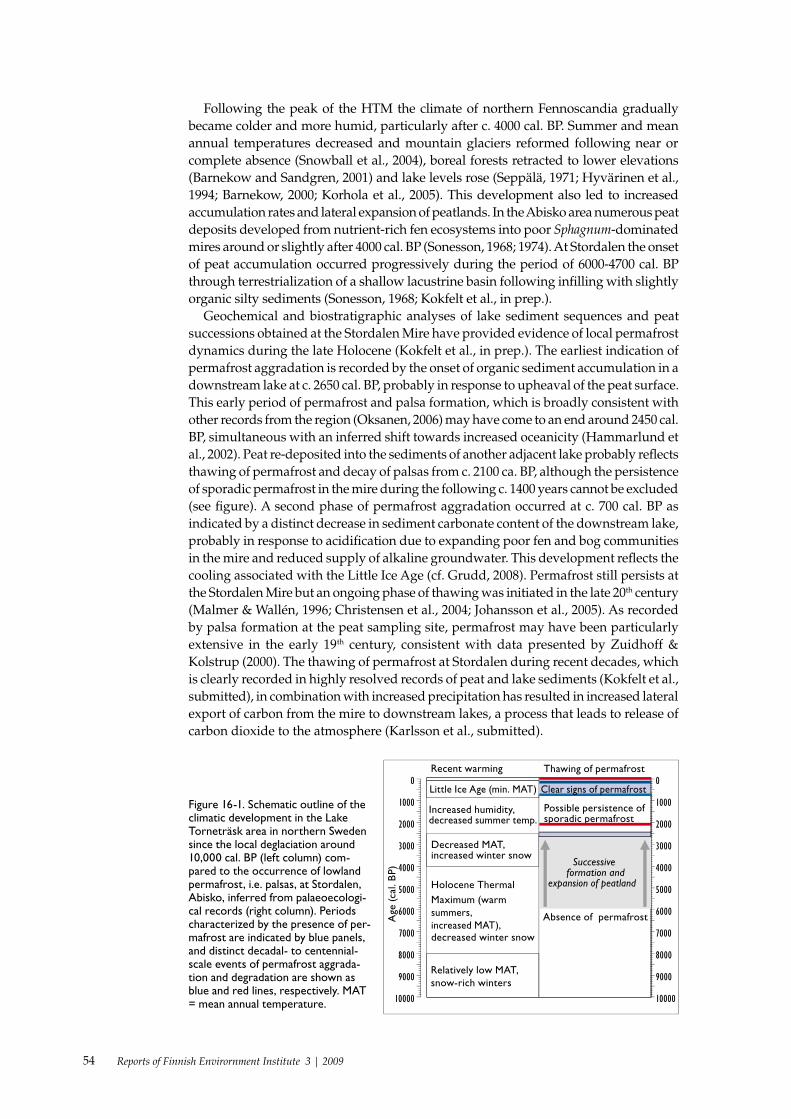
54 Reports of Finnish Envirornment Institute 3 | 2009
Following the peak of the HTM the climate of northern Fennoscandia gradually became colder and more humid, particularly after c. 4000 cal. BP. Summer and mean annual temperatures decreased and mountain glaciers reformed following near or complete absence (Snowball et al., 2004), boreal forests retracted to lower elevations (Barnekow and Sandgren, 2001) and lake levels rose (Seppälä, 1971; Hyvärinen et al., 1994; Barnekow, 2000; Korhola et al., 2005). This development also led to increased accumulation rates and lateral expansion of peatlands. In the Abisko area numerous peat deposits developed from nutrient-rich fen ecosystems into poor Sphagnum-dominated mires around or slightly after 4000 cal. BP (Sonesson, 1968; 1974). At Stordalen the onset of peat accumulation occurred progressively during the period of 6000-4700 cal. BP through terrestrialization of a shallow lacustrine basin following in�lling with slightly organic silty sediments (Sonesson, 1968; Kokfelt et al., in prep.).
Geochemical and biostratigraphic analyses of lake sediment sequences and peat successions obtained at the Stordalen Mire have provided evidence of local permafrost dynamics during the late Holocene (Kokfelt et al., in prep.). The earliest indication of permafrost aggradation is recorded by the onset of organic sediment accumulation in a downstream lake at c. 2650 cal. BP, probably in response to upheaval of the peat surface. This early period of permafrost and palsa formation, which is broadly consistent with other records from the region (Oksanen, 2006) may have come to an end around 2450 cal. BP, simultaneous with an inferred shift towards increased oceanicity (Hammarlund et al., 2002). Peat re-deposited into the sediments of another adjacent lake probably re�ects thawing of permafrost and decay of palsas from c. 2100 ca. BP, although the persistence of sporadic permafrost in the mire during the following c. 1400 years cannot be excluded (see �gure). A second phase of permafrost aggradation occurred at c. 700 cal. BP as indicated by a distinct decrease in sediment carbonate content of the downstream lake, probably in response to acidi�cation due to expanding poor fen and bog communities in the mire and reduced supply of alkaline groundwater. This development re�ects the cooling associated with the Little Ice Age (cf. Grudd, 2008). Permafrost still persists at the Stordalen Mire but an ongoing phase of thawing was initiated in the late 20th century (Malmer & Wallén, 1996; Christensen et al., 2004; Johansson et al., 2005). As recorded by palsa formation at the peat sampling site, permafrost may have been particularly extensive in the early 19th century, consistent with data presented by Zuidhoff & Kolstrup (2000). The thawing of permafrost at Stordalen during recent decades, which is clearly recorded in highly resolved records of peat and lake sediments (Kokfelt et al., submitted), in combination with increased precipitation has resulted in increased lateral export of carbon from the mire to downstream lakes, a process that leads to release of carbon dioxide to the atmosphere (Karlsson et al., submitted).
Little Ice Age (min. MAT)
Relatively low MAT, snow-rich winters
Holocene ThermalMaximum (warm summers, increased MAT),decreased winter snow
Decreased MAT,increased winter snow
Increased humidity,decreased summer temp.
Absence of permafrost
0
1000
2000
3000
4000
5000
6000
7000
8000
9000
10000
Age
(cal
. BP)
0
1000
2000
3000
4000
5000
6000
7000
8000
9000
10000
Possible persistence ofsporadic permafrost
Recent warming Thawing of permafrost
Clear signs of permafrost
Successiveformation and
expansion of peatland
Figure 16-1. Schematic outline of the climatic development in the Lake Torneträsk area in northern Sweden since the local deglaciation around 10,000 cal. BP (left column) com-pared to the occurrence of lowland permafrost, i.e. palsas, at Stordalen, Abisko, inferred from palaeoecologi-cal records (right column). Periods characterized by the presence of per-mafrost are indicated by blue panels, and distinct decadal- to centennial-scale events of permafrost aggrada-tion and degradation are shown as blue and red lines, respectively. MAT = mean annual temperature.
55Reports of Finnish Envirornment Institute 3 | 2009
ReferencesBakke, J., Dahl, S. O., Paasche, Ø., Løvlie, R. & Nesje, A. 2005: Glacier fluctuations, equilibrium-line
altitudes and palaeoclimate in Lyngen, northern Norway, during the Lateglacial and Holocene. The Holocene, 15, 518-540.
Barnekow, L. 2000: Holocene regional and local vegetation history and lake-level changes in the Torneträsk area, northern Sweden. Journal of Paleolimnology, 23, 399-420.
Barnekow, L. & Sandgren, P. 2001: Palaeoclimate and tree-line changes during the Holocene based on pollen and plant macrofossil records from six lakes at different altitudes in northern Sweden. Review of Palaeobotany and Palynology, 117, 109-118.
Bigler, C., Larocque, I., Peglar, S. M., Birks, H. J. B. & Hall, R. I. 2002: Quantitative multiproxy assessment of long-term patterns of Holocene environmental change from a small lake near Abisko, northern Sweden. The Holocene, 12, 481-496.
Bjune, A., Birks, H. J. B. & Seppä, H. 2004: Holocene vegetation and climate history on a continental-oceanic transect in northern Fennoscandia based on pollen and plant macrofossils. Boreas, 33, 211-223.
Christensen, T. R., Johanson, T., Åkerman, J. & Mastepanov, M. 2004: Thawing sub-arctic permafrost: Effects on vegetation and methane emissions. Geophysical Research Letters, 31, L04501.
Fronzek, S., Luoto, M. & Carter, T. R. 2006: Potential effect of climate change on the distribution of palsa mires in subarctic Fennoscandia. Climate Research, 32, 1-12.
Grudd, H. 2008: Torneträsk tree-ring width and density ad 500–2004: a test of climatic sensitivity and a new 1500-year reconstruction of north Fennoscandian summers. Climate Dynamics, 31, 843-857.
Halsey, L. A., Vitt, D. H. & Zoltai, S. C. 1995: Disequilibrium response of permafrost in boreal continental western Canada to climate change. Climatic Change, 30, 57-73.
Hammarlund, D., Barnekow, L., Birks, H. J. B., Buchardt, B. & Edwards, T. W. D. 2002: Holocene changes in atmospheric circulation recorded in the oxygen-isotope stratigraphy of lacustrine carbonates from northern Sweden. The Holocene, 12, 339-351.
Hammarlund, D. & Edwards, T. W. D. 2008: Stable isotope variations in stalagmites from northwestern Sweden document changes in temperature and vegetation during the early Holocene: a comment on Sundqvist et al. 2007a. Holocene, 18, 1007-1008.
Hyvärinen, H. & Alhonen, P. 1994: Holocene lake-level changes in the Fennoscandian tree-line region, western Finnish Lapland: diatom and cladoceran evidence. The Holocene, 4, 251-258.
Johansson, M., Christensen, T. R., Åkerman, H. J. & Callaghan, T. V. 2005: What determines the current presence or absence of permafrost in the Torneträsk region, a sub-arctic landscape in Northern Sweden. Ambio, 35, 190-197.
Karlsson, J., Christensen, T. R., Friborg, T., Förster, J., Hammarlund, D., Jackowicz-Korczynski, M., Kokfelt, U., Roehm, C. & Rosén, P.: Carbon emission from a subarctic lake: quantitative importance and response to permafrost thawing (submitted to Ecosystems).
Kokfelt, U., Rosén, P., Schoning, K., Christensen, T. R., Förster, J., Karlsson, J., Reuss, N., Rundgren, M.,
Callaghan, T. V., Jonasson, C. & Hammarlund, D.: Ecosystem responses to increased precipitation and permafrost decay in subarctic Sweden inferred from peat and lake sediments. (submitted to Global Change Biology).
Kokfelt, U., Struyf, E., Reuss, N., Sonesson, M., Rundgren, M., Skog, G. & Hammarlund, D.: Wetland development, permafrost history and nutrient cycling inferred from peat and lake sediment records in subarctic Sweden. (in prep. for Global Biogeochemical Cycles).
Korhola, A., Tikkanen, M. & Weckström, J. 2005: Quantification of Holocene lake-level changes in Finnish Lapland using a cladocera - lake depth transfer model. Journal of Paleolimnology, 34, 175-190.
Malmer, N. & Wallén, B. 1996: Peat formation and mass balance in subarctic ombrotrophic peatlands around Abisko, northern Scandinavia. Ecological Bulletins, 45, 79-92.
Oksanen, P. O. 2006: Holocene development of the Vaisjeaggi palsa mire, Finnish Lapland. Boreas, 35, 81-95.
Seppälä, M. 1971: Evolution of eolian relief of the Kaamasjoki-Kiellajoki river basin in Finnish Lapland. Fennia, 104, 1-88.
Snowball I., Korhola A., Briffa K. R., & Koc N. 2004: Holocene climate dynamics in Fennoscandia and the North Atlantic. Battarbee, R. W., Gasse, F. & Stickley, C. E. (editors): Past Climate Variability through Europe and Africa. Springer, Dordrecht, The Netherlands, 465-494.
Snowball, I., Sandgren, P. & Petterson, G. 1999: The mineral magnetic properties of an annually laminated Holocene lake-sediment sequence in northern Sweden. Holocene, 9, 353-362.
Sonesson, M. 1968: Pollen zones at Abisko, Torne Lappmark, Sweden. Botaniska Notiser, 121, 491-500.Sonesson, M. 1974: Late Quaternary forest development of the Tornetrask area, North Sweden .2. Pollen
analytical evidence. Oikos, 25, 288-&.Zuidhoff, F. S. & Kolstrup, E. 2000: Changes in palsa distribution in relation to climate change in
Laivadalen, northern Sweden, especially 1960-1997. Permafrost and Periglacial Processes, 11, 55-69.
56 Reports of Finnish Envirornment Institute 3 | 2009
17 Rise and fall of palsas and peat plateaus in eastern Canada
Serge Payette Centre d’études nordiques, Université Laval, Québec City, Canada Email: [email protected]
IntroductionPalsas and peat plateaus are peat-covered permafrost mounds (Seppälä, 1986) distributed across the circumboreal zone, particularly in areas north of the 0 °C mean annual temperature line. Most palsas and peat plateaus develop primarily in boreal and sub-Arctic peatlands south of the Arctic treeline (Zoltai, 1972; Oksanen et al., 2001; Payette 2001, Arlen-Pouliot and Bhiry, 2005). These periglacial features are more common in continental areas than in maritime environments because of thinner snowpack and contrasted temperatures. In North America, palsas and peat plateaus are mostly confined to the boreal environment, from the lichen-woodland zone to the forest-tundra zone (Zoltai and Tarnocai, 1972; Payette, 2001). Given the geographical expanse of the boreal environment in Canada, palsas and peat plateaus are developing across a large array of climatic conditions, i.e., ranging from 0 to -8 °C in annual mean temperature and from 200 to 800 mm of annual precipitation.
Morphology and compositionPalsas are generally less than 100 m long whereas peat plateaus may be more than 400 to 500 m long in wind-exposed peatlands. Palsas are forming convex structures compared to flat-topped peat plateaus. Height of palsas and peat plateaus varies according to climatic conditions and type of mineral deposits. Low-elevated landforms (often < 1 m high) are generally associated with coarse, sandy and gravelly deposits beneath the peat cover, whereas high-elevated landforms (1 to 10 m high) are developing in peatlands underlain by silty and clayey sediments. Segregation ice is the prevailing type of ice material in these landforms with a neat concentration of ice lenses in mineral deposits, whereas frozen peat contains only small, dispersed ice crystals.
Two types of palsas and peat plateaus are occurring in Canada based on vegetation cover, i.e., lichen-shrub palsas and peat plateaus and wooded palsas and peat plateaus (Zoltai and Tarnocai, 1971; Payette, 2001). Wooded palsas and peat plateaus are developing in sites with a rather thin snow cover (< 30-40 cm) as it is the case west of Hudson Bay and in cold sites (< -2 to -8°C) where the snow cover may be thicker.
Aggrading palsas are individual, convex permafrost mounds formed in situ, whereas residual palsas are flat permafrost mounds created by the thermal collapse of peat plateaus. The spatial distribution of residual palsas in large collapsing peat plateaus displays a polygonal, transversal, longitudinal or concentric pattern according to peatland drainage and ice-wedge network.
Origin of palsas and peat plateausThe inception of palsas and peat plateaus in eastern Canada dates back to the late Holocene. 14C dating and tree-ring dating are the two main techniques used for the determination of the age of palsas and peat plateaus. Up-lifting of the peat surface due
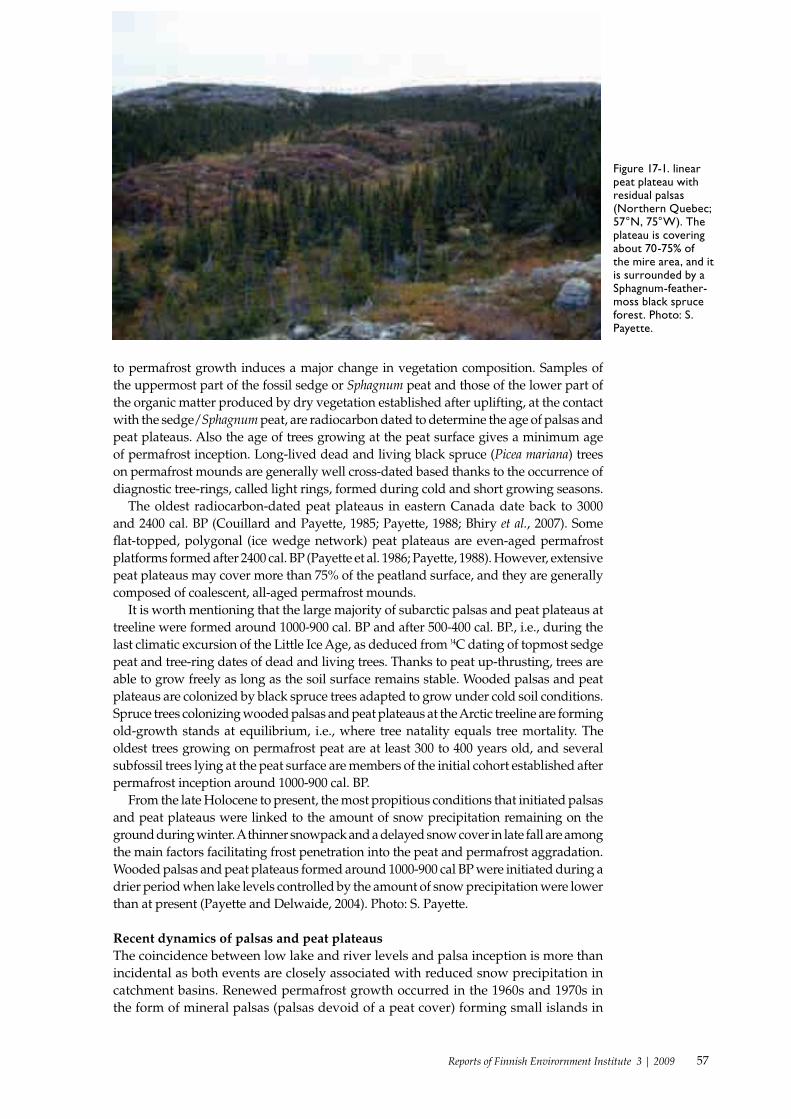
57Reports of Finnish Envirornment Institute 3 | 2009
to permafrost growth induces a major change in vegetation composition. Samples of the uppermost part of the fossil sedge or Sphagnum peat and those of the lower part of the organic matter produced by dry vegetation established after uplifting, at the contact with the sedge/Sphagnum peat, are radiocarbon dated to determine the age of palsas and peat plateaus. Also the age of trees growing at the peat surface gives a minimum age of permafrost inception. Long-lived dead and living black spruce (Picea mariana) trees on permafrost mounds are generally well cross-dated based thanks to the occurrence of diagnostic tree-rings, called light rings, formed during cold and short growing seasons.
The oldest radiocarbon-dated peat plateaus in eastern Canada date back to 3000 and 2400 cal. BP (Couillard and Payette, 1985; Payette, 1988; Bhiry et al., 2007). Some �at-topped, polygonal (ice wedge network) peat plateaus are even-aged permafrost platforms formed after 2400 cal. BP (Payette et al. 1986; Payette, 1988). However, extensive peat plateaus may cover more than 75% of the peatland surface, and they are generally composed of coalescent, all-aged permafrost mounds.
It is worth mentioning that the large majority of subarctic palsas and peat plateaus at treeline were formed around 1000-900 cal. BP and after 500-400 cal. BP., i.e., during the last climatic excursion of the Little Ice Age, as deduced from !4C dating of topmost sedge peat and tree-ring dates of dead and living trees. Thanks to peat up-thrusting, trees are able to grow freely as long as the soil surface remains stable. Wooded palsas and peat plateaus are colonized by black spruce trees adapted to grow under cold soil conditions. Spruce trees colonizing wooded palsas and peat plateaus at the Arctic treeline are forming old-growth stands at equilibrium, i.e., where tree natality equals tree mortality. The oldest trees growing on permafrost peat are at least 300 to 400 years old, and several subfossil trees lying at the peat surface are members of the initial cohort established after permafrost inception around 1000-900 cal. BP.
From the late Holocene to present, the most propitious conditions that initiated palsas and peat plateaus were linked to the amount of snow precipitation remaining on the ground during winter. A thinner snowpack and a delayed snow cover in late fall are among the main factors facilitating frost penetration into the peat and permafrost aggradation. Wooded palsas and peat plateaus formed around 1000-900 cal BP were initiated during a drier period when lake levels controlled by the amount of snow precipitation were lower than at present (Payette and Delwaide, 2004). Photo: S. Payette.
Recent dynamics of palsas and peat plateausThe coincidence between low lake and river levels and palsa inception is more than incidental as both events are closely associated with reduced snow precipitation in catchment basins. Renewed permafrost growth occurred in the 1960s and 1970s in the form of mineral palsas (palsas devoid of a peat cover) forming small islands in
Figure 17-1. linear peat plateau with residual palsas (Northern Quebec; 57°N, 75°W). The plateau is covering about 70-75% of the mire area, and it is surrounded by a Sphagnum-feather-moss black spruce forest. Photo: S. Payette.
58 Reports of Finnish Envirornment Institute 3 | 2009
lakes and peatlands in eastern Canada. The regrowth of permafrost during the 20th century, although a period of milder conditions, is clear evidence for the causal link between permafrost aggradation and reduced snow cover causing lake lowering and deeper frost penetration into the exposed lake bottom.
Renewed lake permafrost in the mid-20th was but a secondary event in terms of the overall permafrost activity during this century, given the tremendous collapse of permafrost landforms across the circumboreal zone (Camill and Clark, 1998; Sollid and Sorbell, 1998; Turetsky et al., 2000; Zuidhoff and Kolstrup, 2000; Lloyd et al., 2003; Luoto and Seppälä, 2003; Payette et al., 2004; Arlen-Pouliot and Bhiry, 2005; Vallée and Payette, 2007). Disintegration of palsas and peat plateaus due to permafrost thaw is now occurring all over their geographical range. The collapse is more rapid in the southern part of the range where current annual temperatures rose of at least 2°C during the past 15 years. In the northernmost part of the range where annual temperatures are well below -5 °C, wind-exposed palsas and peat plateaus are still relatively stable with only minor signs of thermal decay. Given the current trend of more rapid than expected rising temperatures and precipitations, the northernmost, solid and robust palsas and peat plateaus will be likely at risk in the near future.
ReferencesArlen-Pouliot, Y. and N. Bhiry. 2005. Paleoecology of a palsa and a filled thermokarst pond in a
permafrost peatland, subarctic Québec, Canada. The Holocene 15: 408-419.Bhiry, N., S. Payette and É. Robert. 2007. Peatland development at the arctic tree line (Québec, Canada)
influenced by flooding and permafrost. Quaternary Research 67: 426-437.Camill, P. and J. S. Clark. 1998. Climate change disequilibrium of boreal permafrost peatlands caused by
local processes. American Naturalist 151: 209-222.Couillard, L. and S. Payette. 1985. Évolution holocène d’une tourbière à pergélisol (Québec nordique).
Canadian Journal of Botany 63 : 1104-1121.Lloyd, A. H., K. Yoshikawa, C. L. Fastie, L. Hinzman and M. Fraver. 2003. Effects of permafrost
degradation on woody vegetation at arctic treeline on the Seward Peninsula, Alaska. Permafrost and Periglacial Processes 14: 93-101.
Luoto, M. and M. Seppälä. 2003. Thermokarst ponds as indicators of the former distribution of palsas in Finnish Lapland. Permafrost and Periglacial Processes 14: 19-27.
Oksanen, P. O., P. Khury and R. N. Alekseeva. 2001. Holocene development of the Rogovaya River peat plateau, European Russian Arctic. The Holocene 11: 25-40.
Payette, S. 1988. Late-Holocene development of subarctic ombrotrophic peatlands: allogenic and autogenic succession. Ecology 69: 516-531.
Payette, S. 2001. Formes périglaciaires. In Écologie des tourbières du Québec-Labrador. Payette, S. and L. Rochefort, ed. Presses de l’Université Laval, Québec, Canada.
Payette, S. and A. Delwaide. 2004. Dynamics of subarctic wetland forests over the past 1500 years. Ecological Monographs 74 : 373-391.
Payette, S., A. Delwaide, M. Caccianiga and M. Beauchemin. 2004. Accelerated thawing of subarctic peatland permafrost over the last 50 years. Geophysical Research Letters 31: L18208.
Payette, S., L. Gauthier and I. Grenier. 1986. Dating ice-wedge growth in subarctic peatlands following deforestation. Nature 322: 724-727.
Seppälä, M. 1986. The origin of palsas. Geografiska Annaler 68A: 141-147.Sollid, J. L. and L. Sørbel. 1998. Palsa bogs as a climatic indicator: examples from Dovrefjell, southern
Norway. Ambio 27: 287-291.Turetsky, M. R., R. K. Wider, C. J. Williams and D. H. Vitt, 2000. Organic matter accumulation, peat
chemistry and permafrost melting in peatlands of boreal Alberta. Écoscience 7: 379-392.Vallée, S. and S. Payette. 2007. Collapse of permafrost mounds along a subarctic river over the last 100
years (northern Québec). Geomorphology 90: 162-170.Zoltai, S. C. 1972. Palsas and peat plateaus in central Manitoba and Saskatchewan. Canadian Journal of
Forest Research 2: 291-302.Zoltai, S. C and C. Tarnocai. 1971. Properties of a wooded palsa in northern Manitoba. Arctic and Alpine
Research 3: 115-129.Zoltai, S. C and C. Tarnocai 1972. Palsas and peat plateaus in central Manitoba and Saskatchewan.
Canadian Journal of Forest Research 2: 291-302.Zuidhoff, F. S. and E. Kolstrup 2000. Changes in palsa distribution in relation to climate change in
Laivadalen, northern Sweden, especially 1960-97. Permafrost and Periglacial Processes 11: 55-69.
59Reports of Finnish Envirornment Institute 3 | 2009
18 Monitoring permafrost and thermokarst dynamics in a subarctic peat plateau complex in northern Sweden
A. Britta K. Sannel and Peter KuhryDepartment of Physical Geography and Quaternary Geology, Stockholm UniversityEmail of corresponding author: [email protected]
IntroductionPerennially frozen peatlands in subarctic regions are sensitive to a warming climate since permafrost temperatures are close to the 0 °C mean annual isotherm. Few monitoring studies have been performed of permafrost dynamics in subarctic peatlands because of their often remote location, the expensive logistics and the harsh field conditions. Rapid and extensive permafrost thawing in bogs and mixed mires underlain by permafrost in northern Sweden has been recorded by Christensen et al. (2004). Zuidhoff (2002) concluded that in palsas block erosion, thermokarst and wind erosion are the most important degradational processes involved in the decay. Sollid & Sørbel (1974) found that where frozen palsa plateaus are in direct contact with water the permafrost core is undermined causing cracks in the peat. The peat then slips sideways creating a steep erosion edge. This edge gradually works its way in towards the central part of the palsa. In a modelling study from Russia, Mazhitova et al. (2004) suggest a 20-30 cm deepening of the active layer in peat plateaus until 2080 as a result of future global warming. It is not only the air temperature that affects the thaw depth; precipitation, snow depth, the ice content in the ground and other hydrogeological conditions are also important factors for the active layer distribution (Oberman & Mazhitova 2001). Long term ecosystem monitoring is important for predicting the behaviour of subarctic peatlands under the expected future warmer and wetter climate conditions.
Aim, methods and study areaThe main objective of this project is to study local climate and ground dynamics in a subarctic peat plateau/thermokarst lake complex in order to get a better understanding of how these permafrost peatlands will respond to climate change. Which factors and mechanisms cause the collapse of peat plateaus into thermokarst lakes? Why does the erosion occur only in certain parts of the peat plateau and along certain parts of the thermokarst lake shoreline? How sensitive are these ecosystems to global warming? At the peat plateau/thermokarst lake complex in Tavvavuoma (68°28’ N, 20°54’ E), northern Sweden, permafrost temperature and landscape dynamics are studied through monitoring of ground temperatures, meteorological data and snow depth (since 2005), and a time series analysis of aerial photographs and satellite images (from 1963 to 2003). On the peat plateau, snow depth and ground temperatures down to 2 m depth are recorded at nine different micro-sites; on the peat plateau, at the eroding edge of the peat plateau, in the thermokarst lake and in a nearby non-permafrost fen (Figure 1).
Ground temperature monitoring in a 6 m deep bore-hole was initiated in September 2008. Air temperature, precipitation and wind data are recorded on top of the plateau. Snow depth is monitored by using a stationary digital camera that records one image per day.
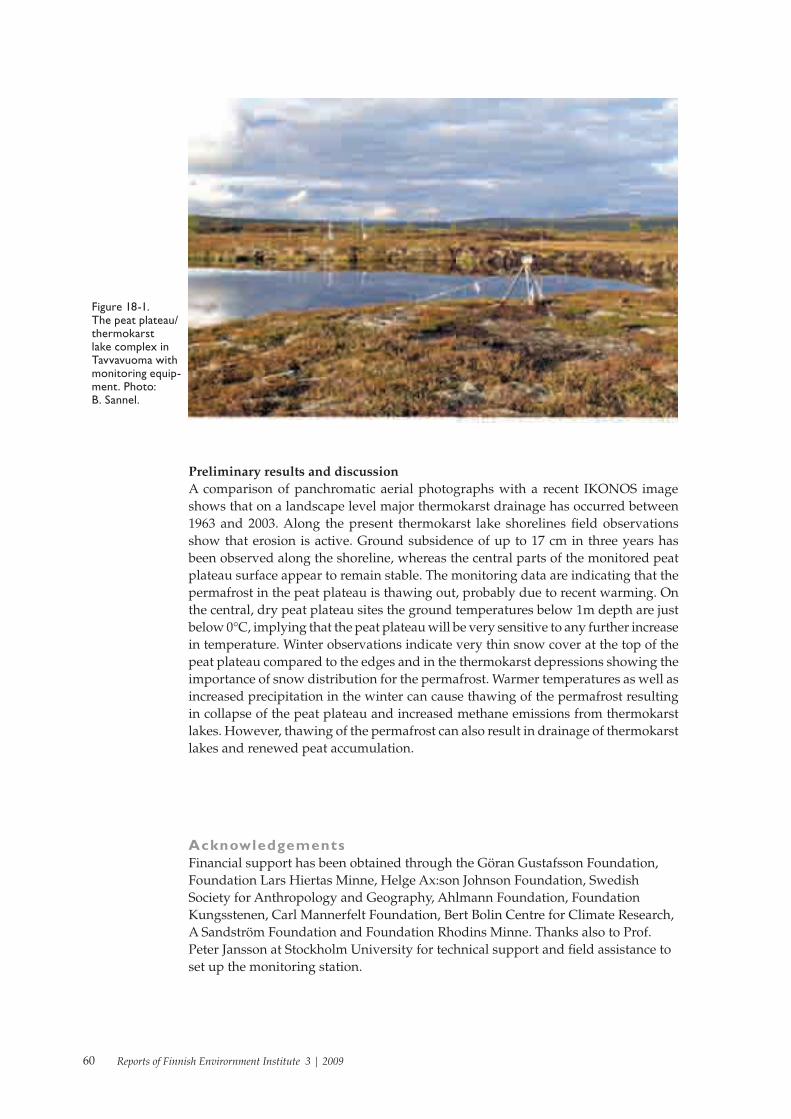
60 Reports of Finnish Envirornment Institute 3 | 2009
Preliminary results and discussionA comparison of panchromatic aerial photographs with a recent IKONOS image shows that on a landscape level major thermokarst drainage has occurred between 1963 and 2003. Along the present thermokarst lake shorelines �eld observations show that erosion is active. Ground subsidence of up to 17 cm in three years has been observed along the shoreline, whereas the central parts of the monitored peat plateau surface appear to remain stable. The monitoring data are indicating that the permafrost in the peat plateau is thawing out, probably due to recent warming. On the central, dry peat plateau sites the ground temperatures below 1m depth are just below 0°C, implying that the peat plateau will be very sensitive to any further increase in temperature. Winter observations indicate very thin snow cover at the top of the peat plateau compared to the edges and in the thermokarst depressions showing the importance of snow distribution for the permafrost. Warmer temperatures as well as increased precipitation in the winter can cause thawing of the permafrost resulting in collapse of the peat plateau and increased methane emissions from thermokarst lakes. However, thawing of the permafrost can also result in drainage of thermokarst lakes and renewed peat accumulation.
AcknowledgementsFinancial support has been obtained through the Göran Gustafsson Foundation, Foundation Lars Hiertas Minne, Helge Ax:son Johnson Foundation, Swedish Society for Anthropology and Geography, Ahlmann Foundation, Foundation Kungsstenen, Carl Mannerfelt Foundation, Bert Bolin Centre for Climate Research, A Sandström Foundation and Foundation Rhodins Minne. Thanks also to Prof. Peter Jansson at Stockholm University for technical support and �eld assistance to set up the monitoring station.
Figure 18-1. The peat plateau/thermokarst lake complex in Tavvavuoma with monitoring equip-ment. Photo: B. Sannel.

61Reports of Finnish Envirornment Institute 3 | 2009
ReferencesChristensen, T.R., Johansson, T., Åkerman, H.J., Mastepanov, M., Malmer, N., Friborg, T., Crill, P. &
Svensson, B.H. 2004: Thawing sub-arctic permafrost: Effects on vegetation and methane emissions. Geophysical Research Letters 31, L04501, doi:10.1029/2003GLO18680.
Mazhitova, G., Karstkarel, N., Oberman, N., Romanovsky, V. & Kuhry, P. 2004: Permafrost and infra-structure in the Usa Basin (northeast European Russia): Possible impacts of global warming. Ambio 33 (6): 289-294.
Oberman, N.G. & Mazhitova, G.G. 2001: Permafrost dynamics in the north-east of European Russia at the end of the 20th century. Norsk Geografisk Tidsskrift 55: 241-244.
Sollid, J.L. & Sørbel, L. 1974: Palsa bogs at Haugtjørnin, Dovrefjell, South Norway. Norsk Geografisk Tidsskrift 28: 53-60.
Zuidhoff, F.S. 2002: Recent decay of a single palsa in relation to weather conditions between 1996 and 2000 in Laivadalen, northern Sweden. Geografiska Annaler 84A (2): 103-111.
62 Reports of Finnish Envirornment Institute 3 | 2009
19 Effects of permafrost thawing on lake water organic carbon and primary production
Peter Rosén and Jan KarlssonClimate Impacts Research Centre, Umeå University, SwedenEmail: [email protected], [email protected]
A major part of the carbon pool of subarctic lakes is organic carbon (OC) imported from the catchment (Karlsson et al. 2003). Terrestrial organic carbon plays a central role in the functioning of these lake ecosystems and act asan important carbon and energy source for lake biota, affects biodiversity and pH in lake waters as well as pro-tecting aquatic organisms from harmful UV radiation (Schindler et al. 1996; Schindler et al. 1997; Molot et al. 2004; Evans et al. 2007). Input and respiration of terrestrial OC causes lakes to be net heterotrophic (del Giorgio and Peters 1994; Karlsson et al. 2007) and sources of carbon dioxide (CO2) to the atmosphere (Cole et al. 1994). Coloured organic matter is also an important factor controlling the penetration of the photo- is also an important factor controlling the penetration of the photo-synthetic active radiation (PAR) in the lake water (Schindler et al. 1997). Thus, the amount of terrestrial organic matter in the lake water will affect the extent of habitats available for photosynthesis in the lake.
The impact of lake water total organic carbon (TOC) concentrations and climate variables on benthic and pelagic primary producers was assessed during the past 45 years using the sediment record in one sub-arctic mire lake (Fig. 1). The lake showed large and synchronous change in the plankontic to benthic (P:B) ratio of diatoms and concentrations of TOC inferred from near infrared spectroscopy (NIRS). During periods of high inferred lake water TOC, the diatom community was dominated by planktonic diatoms and during periods of low TOC, benthic diatoms dominated. The stable carbon isotopic (δ13C) values of sediment organic matter were negatively cor- values of sediment organic matter were negatively cor- were negatively cor-were negatively cor-related to the inferred TOC concentration and P:B ratio. Probably terrestrial organic matter, by its strong effect on the penetration of light through the lake water, affected the habitats available for benthic photosynthesis and thus the δ13C of the sediment organic matter. It is possible that the large fluctuations in lake water TOC, the P:B ratio of the primary producers and the δ13C of sediment organic matter observed since 1989 in Vuolep Njakajaure are due to a combined effect of climate change and thawing permafrost in the catchment. Thawing permafrost can increase OC export from the mire or possibly via increased erosion. The hypothesis is supported by measurements of the active layer in the region. It has been observed that almost all mires in a transect of 100 km around Abisko have had permafrost at some time since the measurements of the active layer started 1978 and that the depth has increased by 0.69-1.26 cm yr-1 in the region since then (Johansson et al 2006; Åkerman and Johansson 2008). The annual temperature, annual precipitation, the duration of the ice free conditions and snow depth all showed increasing trends between 1959 and 2006 (Kohler et al 2006). The years 1989 and 1990 were especially warm with a mean annual temperature of 0.9 and 1.4°C and for 4 consecutive years the mean annual temperature was above 0°C. This corresponds to a period of increased TOC in Vuolep Njakajaure. This is followed by sudden drop in the NIRS inferred TOC around 1998 in Vuolep Njakajuare. In 1998, the number of ice-free days was only 140 days and mean annual temperature was -1°C, which is considerably lower than the mean for
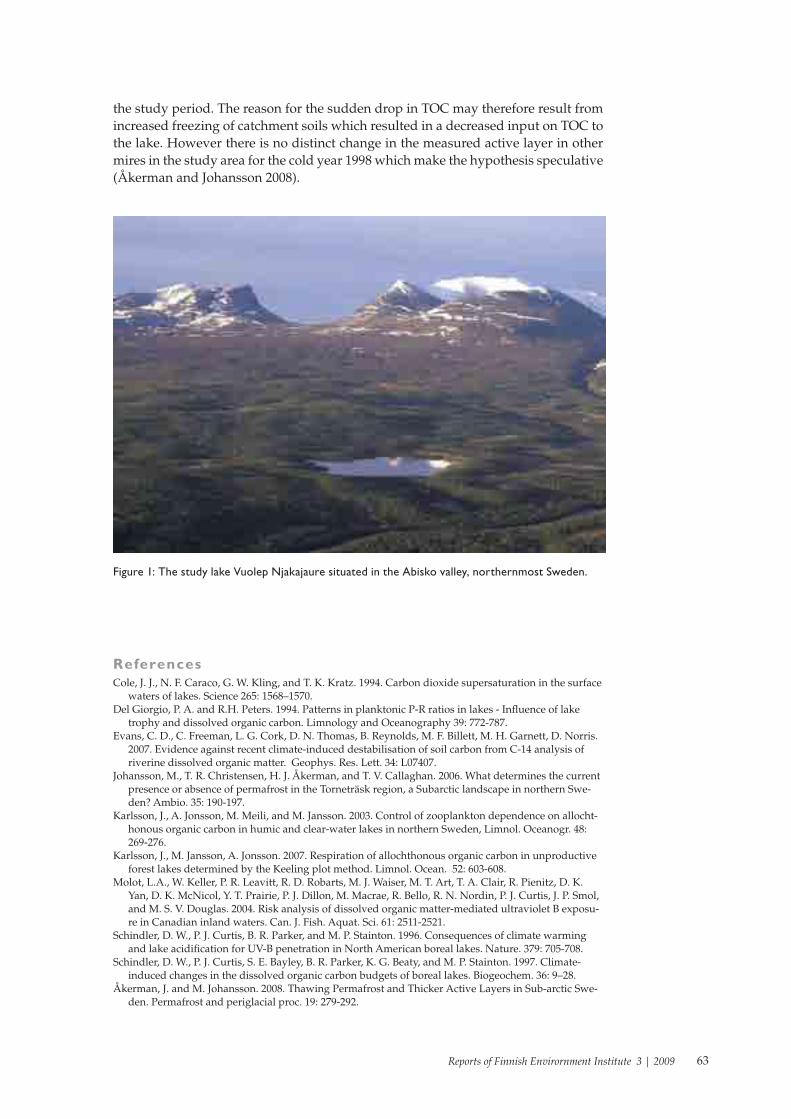
63Reports of Finnish Envirornment Institute 3 | 2009
the study period. The reason for the sudden drop in TOC may therefore result from increased freezing of catchment soils which resulted in a decreased input on TOC to the lake. However there is no distinct change in the measured active layer in other mires in the study area for the cold year 1998 which make the hypothesis speculative (Åkerman and Johansson 2008).
Figure 1: The study lake Vuolep Njakajaure situated in the Abisko valley, northernmost Sweden.
ReferencesCole, J. J., N. F. Caraco, G. W. Kling, and T. K. Kratz. 1994. Carbon dioxide supersaturation in the surface
waters of lakes. Science 265: 1568–1570.Del Giorgio, P. A. and R.H. Peters. 1994. Patterns in planktonic P-R ratios in lakes - Influence of lake
trophy and dissolved organic carbon. Limnology and Oceanography 39: 772-787.Evans, C. D., C. Freeman, L. G. Cork, D. N. Thomas, B. Reynolds, M. F. Billett, M. H. Garnett, D. Norris.
2007. Evidence against recent climate-induced destabilisation of soil carbon from C-14 analysis of riverine dissolved organic matter. Geophys. Res. Lett. 34: L07407.
Johansson, M., T. R. Christensen, H. J. Åkerman, and T. V. Callaghan. 2006. What determines the current presence or absence of permafrost in the Torneträsk region, a Subarctic landscape in northern Swe-den? Ambio. 35: 190-197.
Karlsson, J., A. Jonsson, M. Meili, and M. Jansson. 2003. Control of zooplankton dependence on allocht-honous organic carbon in humic and clear-water lakes in northern Sweden, Limnol. Oceanogr. 48: 269-276.
Karlsson, J., M. Jansson, A. Jonsson. 2007. Respiration of allochthonous organic carbon in unproductive forest lakes determined by the Keeling plot method. Limnol. Ocean. 52: 603-608.
Molot, L.A., W. Keller, P. R. Leavitt, R. D. Robarts, M. J. Waiser, M. T. Art, T. A. Clair, R. Pienitz, D. K. Yan, D. K. McNicol, Y. T. Prairie, P. J. Dillon, M. Macrae, R. Bello, R. N. Nordin, P. J. Curtis, J. P. Smol, and M. S. V. Douglas. 2004. Risk analysis of dissolved organic matter-mediated ultraviolet B exposu-re in Canadian inland waters. Can. J. Fish. Aquat. Sci. 61: 2511-2521.
Schindler, D. W., P. J. Curtis, B. R. Parker, and M. P. Stainton. 1996. Consequences of climate warming and lake acidification for UV-B penetration in North American boreal lakes. Nature. 379: 705-708.
Schindler, D. W., P. J. Curtis, S. E. Bayley, B. R. Parker, K. G. Beaty, and M. P. Stainton. 1997. Climate-induced changes in the dissolved organic carbon budgets of boreal lakes. Biogeochem. 36: 9–28.
Åkerman, J. and M. Johansson. 2008. Thawing Permafrost and Thicker Active Layers in Sub-arctic Swe-den. Permafrost and periglacial proc. 19: 279-292.
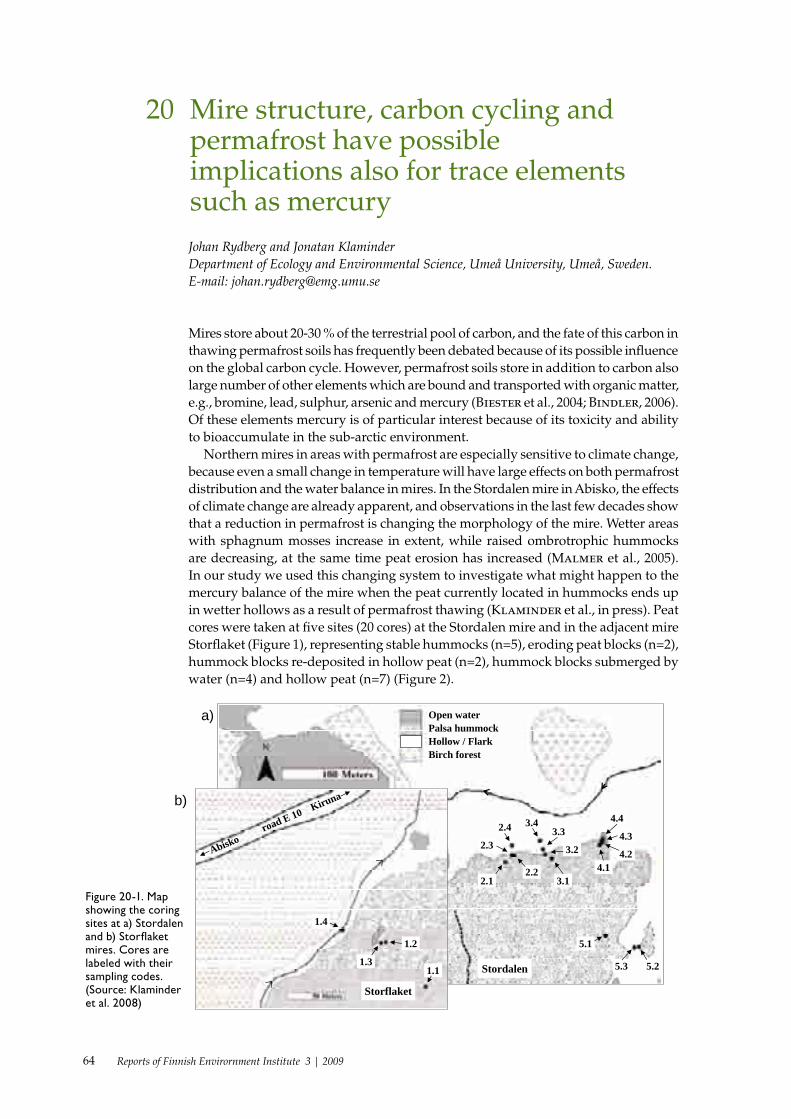
64 Reports of Finnish Envirornment Institute 3 | 2009
20 Mire structure, carbon cycling and permafrost have possible implications also for trace elements such as mercury
Johan Rydberg and Jonatan KlaminderDepartment of Ecology and Environmental Science, Umeå University, Umeå, Sweden.E-mail: [email protected]
Mires store about 20-30 % of the terrestrial pool of carbon, and the fate of this carbon in thawing permafrost soils has frequently been debated because of its possible influence on the global carbon cycle. However, permafrost soils store in addition to carbon also large number of other elements which are bound and transported with organic matter, e.g., bromine, lead, sulphur, arsenic and mercury (Biester et al., 2004; Bindler, 2006). Of these elements mercury is of particular interest because of its toxicity and ability to bioaccumulate in the sub-arctic environment.
Northern mires in areas with permafrost are especially sensitive to climate change, because even a small change in temperature will have large effects on both permafrost distribution and the water balance in mires. In the Stordalen mire in Abisko, the effects of climate change are already apparent, and observations in the last few decades show that a reduction in permafrost is changing the morphology of the mire. Wetter areas with sphagnum mosses increase in extent, while raised ombrotrophic hummocks are decreasing, at the same time peat erosion has increased (Malmer et al., 2005). In our study we used this changing system to investigate what might happen to the mercury balance of the mire when the peat currently located in hummocks ends up in wetter hollows as a result of permafrost thawing (Klaminder et al., in press). Peat cores were taken at five sites (20 cores) at the Stordalen mire and in the adjacent mire Storflaket (Figure 1), representing stable hummocks (n=5), eroding peat blocks (n=2), hummock blocks re-deposited in hollow peat (n=2), hummock blocks submerged by water (n=4) and hollow peat (n=7) (Figure 2).
Open waterPalsa hummockHollow / FlarkBirch forest
Abiskoroad E 10 K
iruna
1.4
1.3
1.2
1.1
2.12.2
2.3
2.4
3.1
3.2
3.33.4
4.14.2
4.3
4.4
5.1
5.25.3Stordalen
Storflaket
a)
b)
Figure 20-1. Map showing the coring sites at a) Stordalen and b) Storflaket mires. Cores are labeled with their sampling codes. (Source: Klaminder et al. 2008)
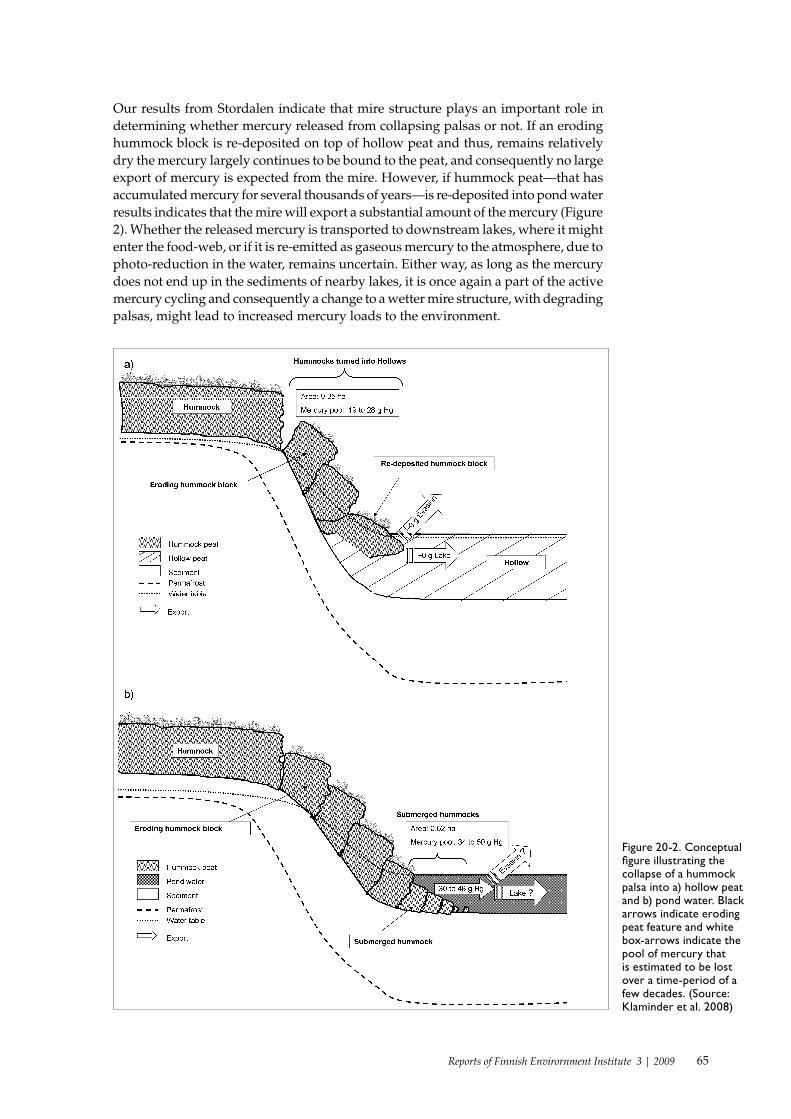
65Reports of Finnish Envirornment Institute 3 | 2009
Our results from Stordalen indicate that mire structure plays an important role in determining whether mercury released from collapsing palsas or not. If an eroding hummock block is re-deposited on top of hollow peat and thus, remains relatively dry the mercury largely continues to be bound to the peat, and consequently no large export of mercury is expected from the mire. However, if hummock peat—that has accumulated mercury for several thousands of years—is re-deposited into pond water results indicates that the mire will export a substantial amount of the mercury (Figure 2). Whether the released mercury is transported to downstream lakes, where it might enter the food-web, or if it is re-emitted as gaseous mercury to the atmosphere, due to photo-reduction in the water, remains uncertain. Either way, as long as the mercury does not end up in the sediments of nearby lakes, it is once again a part of the active mercury cycling and consequently a change to a wetter mire structure, with degrading palsas, might lead to increased mercury loads to the environment.
Figure 20-2. Conceptual figure illustrating the collapse of a hummock palsa into a) hollow peat and b) pond water. Black arrows indicate eroding peat feature and white box-arrows indicate the pool of mercury that is estimated to be lost over a time-period of a few decades. (Source: Klaminder et al. 2008)

66 Reports of Finnish Envirornment Institute 3 | 2009
ReferencesBiester H., Keppler F., Putschew A., Martinez Cortizas A., and Petri M. (2004) Halogen retention, organ-
ohalogens, and the role of organic matter decomposition on halogen enrichment in two Chilean peat bogs. Environmental Science & Technology 38(7), 1984-1991.
Bindler R. (2006) Mired in the past - looking to the future: Geochemistry of peat and the analysis of past environmental changes. Global and Planetary Change 53(4), 209-221.
Klaminder J., Yoo K., Rydberg J., and Giesler R. (2008) An explorative study of mercury export from a thawing palsa mire. Journal of Geophysical Research 113, G04034. DOI: 10.1029/2008JG000776.
Malmer N., Johansson T., Olsrud M., and Christensen T. R. (2005) Vegetation, climatic changes and net carbon sequestration in a North-Scandinavian subarctic mire over 30 years. Global Change Biology 11(11), 1895-1909.

67Reports of Finnish Envirornment Institute 3 | 2009
Appendices

68 Reports of Finnish Envirornment Institute 3 | 2009
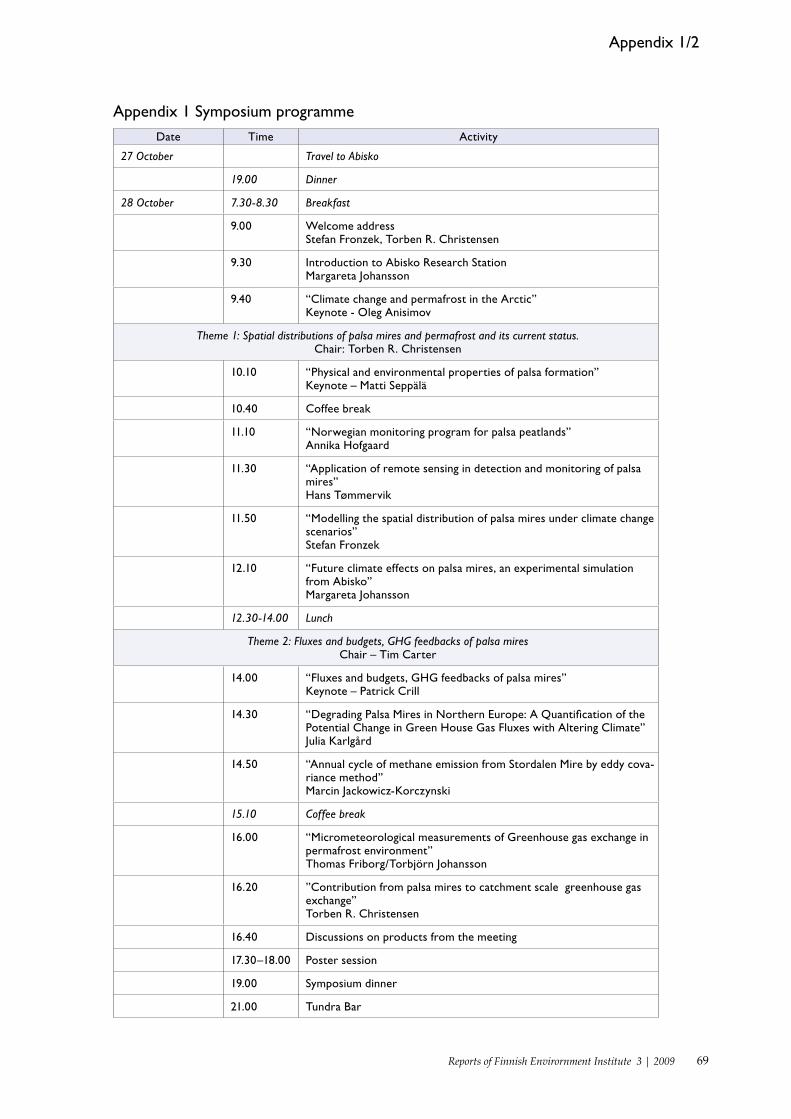
69Reports of Finnish Envirornment Institute 3 | 2009
Appendix 1 Symposium programmeDate Time Activity
27 October Travel to Abisko
19.00 Dinner
28 October 7.30-8.30 Breakfast
9.00 Welcome address Stefan Fronzek, Torben R. Christensen
9.30 Introduction to Abisko Research Station Margareta Johansson
9.40 “Climate change and permafrost in the Arctic” Keynote - Oleg Anisimov
Theme 1: Spatial distributions of palsa mires and permafrost and its current status. Chair: Torben R. Christensen
10.10 “Physical and environmental properties of palsa formation” Keynote – Matti Seppälä
10.40 Coffee break
11.10 “Norwegian monitoring program for palsa peatlands” Annika Hofgaard
11.30 “Application of remote sensing in detection and monitoring of palsa mires” Hans Tømmervik
11.50 “Modelling the spatial distribution of palsa mires under climate change scenarios” Stefan Fronzek
12.10 “Future climate effects on palsa mires, an experimental simulation from Abisko” Margareta Johansson
12.30-14.00 Lunch
Theme 2: Fluxes and budgets, GHG feedbacks of palsa mires Chair – Tim Carter
14.00 “Fluxes and budgets, GHG feedbacks of palsa mires” Keynote – Patrick Crill
14.30 “Degrading Palsa Mires in Northern Europe: A Quantification of the Potential Change in Green House Gas Fluxes with Altering Climate” Julia Karlgård
14.50 “Annual cycle of methane emission from Stordalen Mire by eddy cova-riance method” Marcin Jackowicz-Korczynski
15.10 Coffee break
16.00 “Micrometeorological measurements of Greenhouse gas exchange in permafrost environment” Thomas Friborg/Torbjörn Johansson
16.20 ”Contribution from palsa mires to catchment scale greenhouse gas exchange” Torben R. Christensen
16.40 Discussions on products from the meeting
17.30–18.00 Poster session
19.00 Symposium dinner
21.00 Tundra Bar
Appendix 1/2
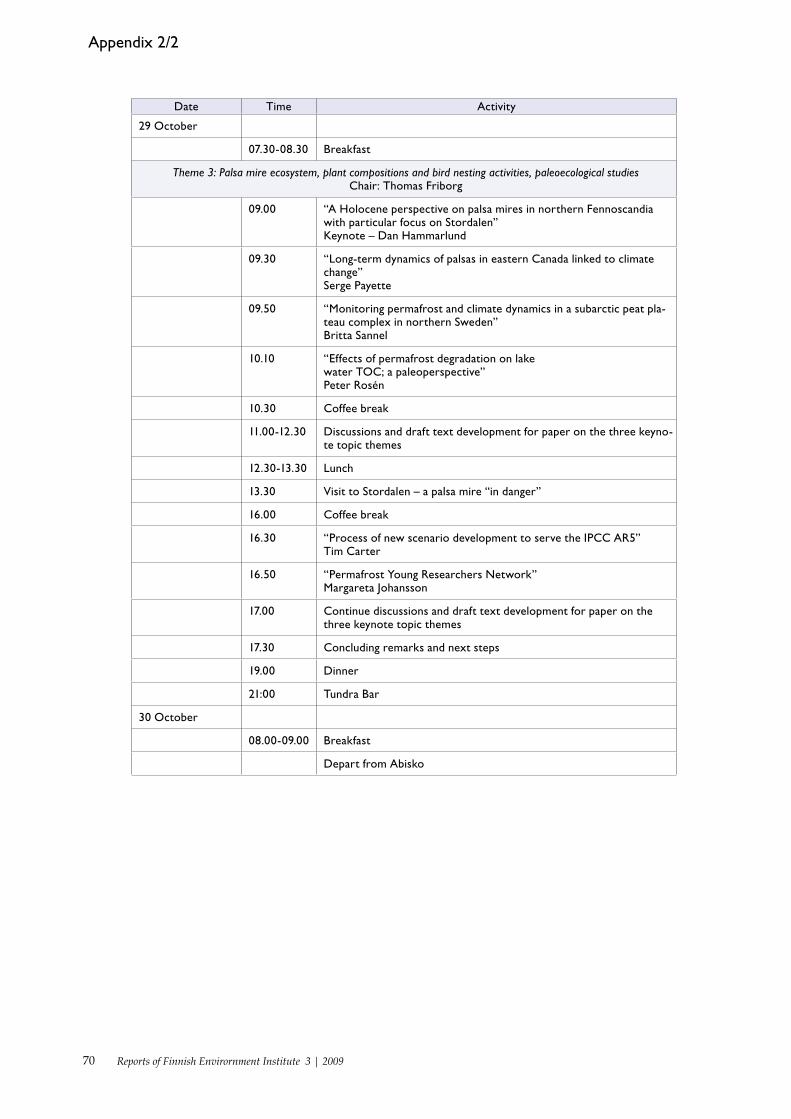
70 Reports of Finnish Envirornment Institute 3 | 2009
Date Time Activity
29 October
07.30-08.30 Breakfast
Theme 3: Palsa mire ecosystem, plant compositions and bird nesting activities, paleoecological studies Chair: Thomas Friborg
09.00 “A Holocene perspective on palsa mires in northern Fennoscandia with particular focus on Stordalen” Keynote – Dan Hammarlund
09.30 “Long-term dynamics of palsas in eastern Canada linked to climate change” Serge Payette
09.50 “Monitoring permafrost and climate dynamics in a subarctic peat pla-teau complex in northern Sweden” Britta Sannel
10.10 “Effects of permafrost degradation on lake water TOC; a paleoperspective” Peter Rosén
10.30 Coffee break
11.00-12.30 Discussions and draft text development for paper on the three keyno-te topic themes
12.30-13.30 Lunch
13.30 Visit to Stordalen – a palsa mire “in danger”
16.00 Coffee break
16.30 “Process of new scenario development to serve the IPCC AR5” Tim Carter
16.50 “Permafrost Young Researchers Network” Margareta Johansson
17.00 Continue discussions and draft text development for paper on the three keynote topic themes
17.30 Concluding remarks and next steps
19.00 Dinner
21:00 Tundra Bar
30 October
08.00-09.00 Breakfast
Depart from Abisko
Appendix 2/2
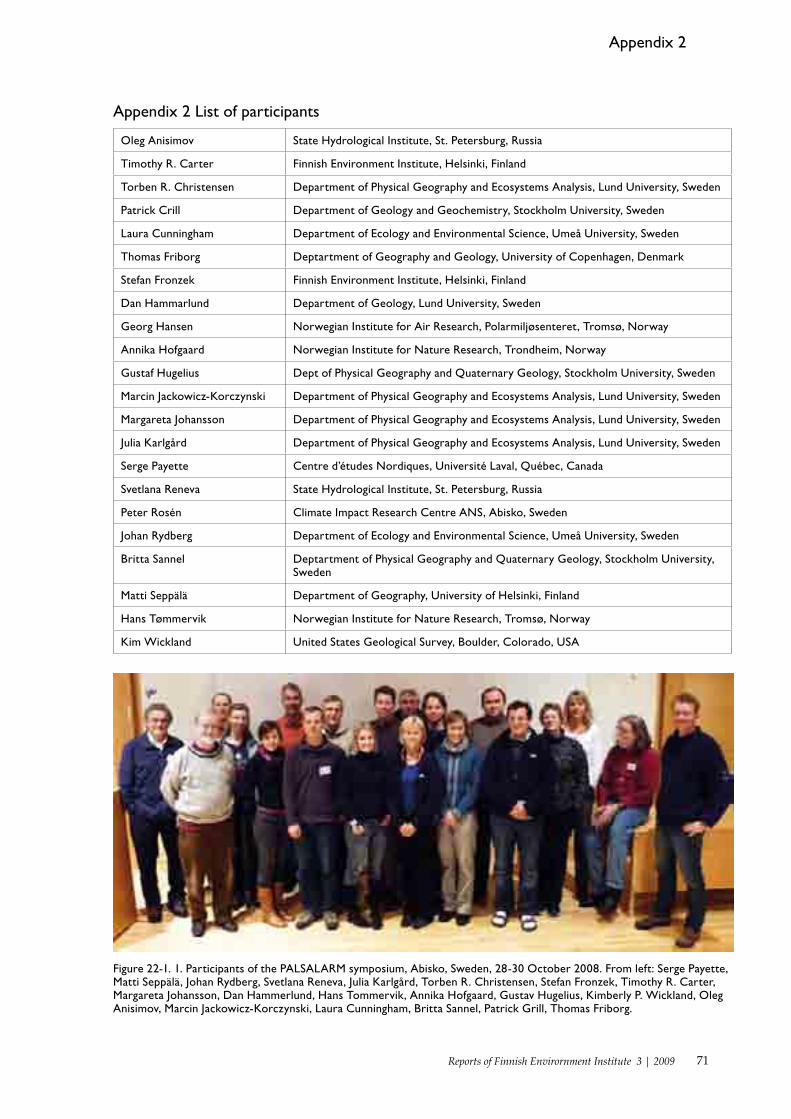
71Reports of Finnish Envirornment Institute 3 | 2009
Appendix 2 List of participants
Oleg Anisimov State Hydrological Institute, St. Petersburg, Russia
Timothy R. Carter Finnish Environment Institute, Helsinki, Finland
Torben R. Christensen Department of Physical Geography and Ecosystems Analysis, Lund University, Sweden
Patrick Crill Department of Geology and Geochemistry, Stockholm University, Sweden
Laura Cunningham Department of Ecology and Environmental Science, Umeå University, Sweden
Thomas Friborg Deptartment of Geography and Geology, University of Copenhagen, Denmark
Stefan Fronzek Finnish Environment Institute, Helsinki, Finland
Dan Hammarlund Department of Geology, Lund University, Sweden
Georg Hansen Norwegian Institute for Air Research, Polarmiljøsenteret, Tromsø, Norway
Annika Hofgaard Norwegian Institute for Nature Research, Trondheim, Norway
Gustaf Hugelius Dept of Physical Geography and Quaternary Geology, Stockholm University, Sweden
Marcin Jackowicz-Korczynski Department of Physical Geography and Ecosystems Analysis, Lund University, Sweden
Margareta Johansson Department of Physical Geography and Ecosystems Analysis, Lund University, Sweden
Julia Karlgård Department of Physical Geography and Ecosystems Analysis, Lund University, Sweden
Serge Payette Centre d’études Nordiques, Université Laval, Québec, Canada
Svetlana Reneva State Hydrological Institute, St. Petersburg, Russia
Peter Rosén Climate Impact Research Centre ANS, Abisko, Sweden
Johan Rydberg Department of Ecology and Environmental Science, Umeå University, Sweden
Britta Sannel Deptartment of Physical Geography and Quaternary Geology, Stockholm University, Sweden
Matti Seppälä Department of Geography, University of Helsinki, Finland
Hans Tømmervik Norwegian Institute for Nature Research, Tromsø, Norway
Kim Wickland United States Geological Survey, Boulder, Colorado, USA
Figure 22-1. 1. Participants of the PALSALARM symposium, Abisko, Sweden, 28-30 October 2008. From left: Serge Payette, Matti Seppälä, Johan Rydberg, Svetlana Reneva, Julia Karlgård, Torben R. Christensen, Stefan Fronzek, Timothy R. Carter, Margareta Johansson, Dan Hammerlund, Hans Tommervik, Annika Hofgaard, Gustav Hugelius, Kimberly P. Wickland, Oleg Anisimov, Marcin Jackowicz-Korczynski, Laura Cunningham, Britta Sannel, Patrick Grill, Thomas Friborg.
Appendix 2
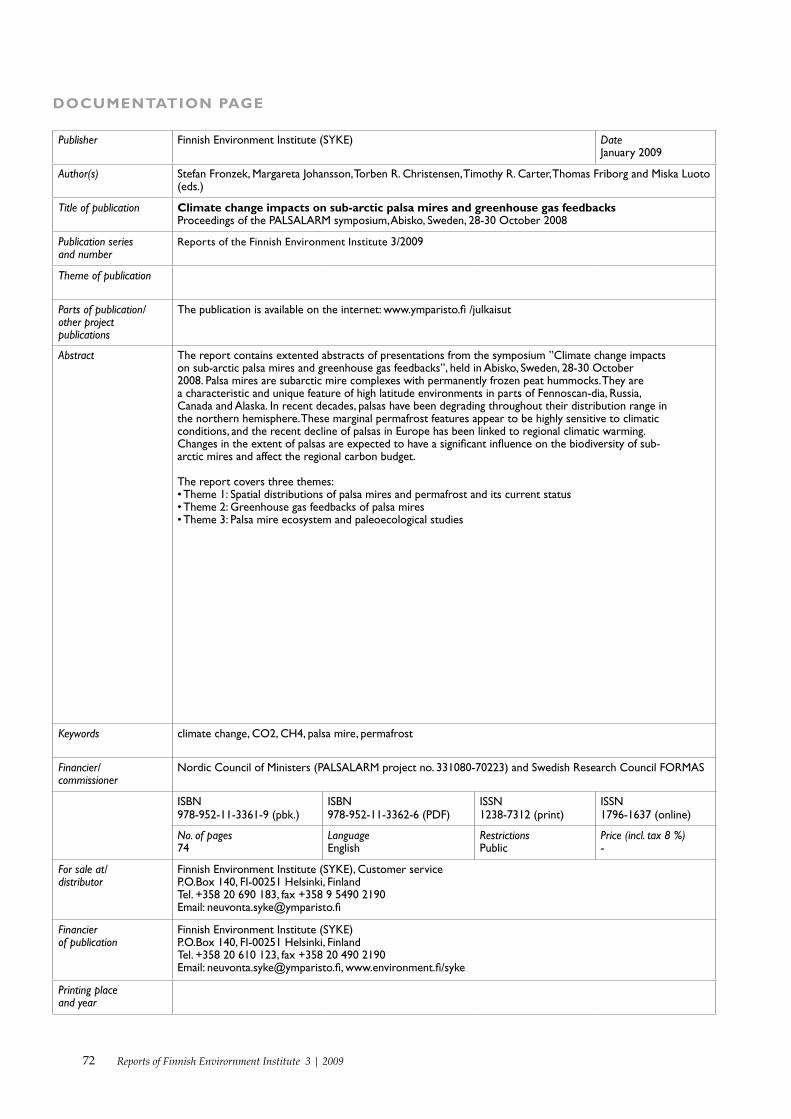
72 Reports of Finnish Envirornment Institute 3 | 2009
DOCUMENTATION PAGE
Publisher Finnish Environment Institute (SYKE) DateJanuary 2009
Author(s) Stefan Fronzek, Margareta Johansson, Torben R. Christensen, Timothy R. Carter, Thomas Friborg and Miska Luoto (eds.)
Title of publication Climate change impacts on sub-arctic palsa mires and greenhouse gas feedbacks Proceedings of the PALSALARM symposium, Abisko, Sweden, 28-30 October 2008
Publication seriesand number
Reports of the Finnish Environment Institute 3/2009
Theme of publication
Parts of publication/other projectpublications
The publication is available on the internet: www.ymparisto.fi /julkaisut
Abstract The report contains extented abstracts of presentations from the symposium ”Climate change impacts on sub-arctic palsa mires and greenhouse gas feedbacks”, held in Abisko, Sweden, 28-30 October 2008. Palsa mires are subarctic mire complexes with permanently frozen peat hummocks. They are a characteristic and unique feature of high latitude environments in parts of Fennoscan-dia, Russia, Canada and Alaska. In recent decades, palsas have been degrading throughout their distribution range in the northern hemisphere. These marginal permafrost features appear to be highly sensitive to climatic conditions, and the recent decline of palsas in Europe has been linked to regional climatic warming. Changes in the extent of palsas are expected to have a significant influence on the biodiversity of sub-arctic mires and affect the regional carbon budget.
The report covers three themes:• Theme 1: Spatial distributions of palsa mires and permafrost and its current status• Theme 2: Greenhouse gas feedbacks of palsa mires• Theme 3: Palsa mire ecosystem and paleoecological studies
Keywords climate change, CO2, CH4, palsa mire, permafrost
Financier/ commissioner
Nordic Council of Ministers (PALSALARM project no. 331080-70223) and Swedish Research Council FORMAS
ISBN978-952-11-3361-9 (pbk.)
ISBN978-952-11-3362-6 (PDF)
ISSN1238-7312 (print)
ISSN 1796-1637 (online)
No. of pages74
LanguageEnglish
RestrictionsPublic
Price (incl. tax 8 %)-
For sale at/distributor
Finnish Environment Institute (SYKE), Customer service P.O.Box 140, FI-00251 Helsinki, Finland Tel. +358 20 690 183, fax +358 9 5490 2190 Email: [email protected]
Financierof publication
Finnish Environment Institute (SYKE) P.O.Box 140, FI-00251 Helsinki, Finland Tel. +358 20 610 123, fax +358 20 490 2190 Email: [email protected], www.environment.fi/syke
Printing place and year
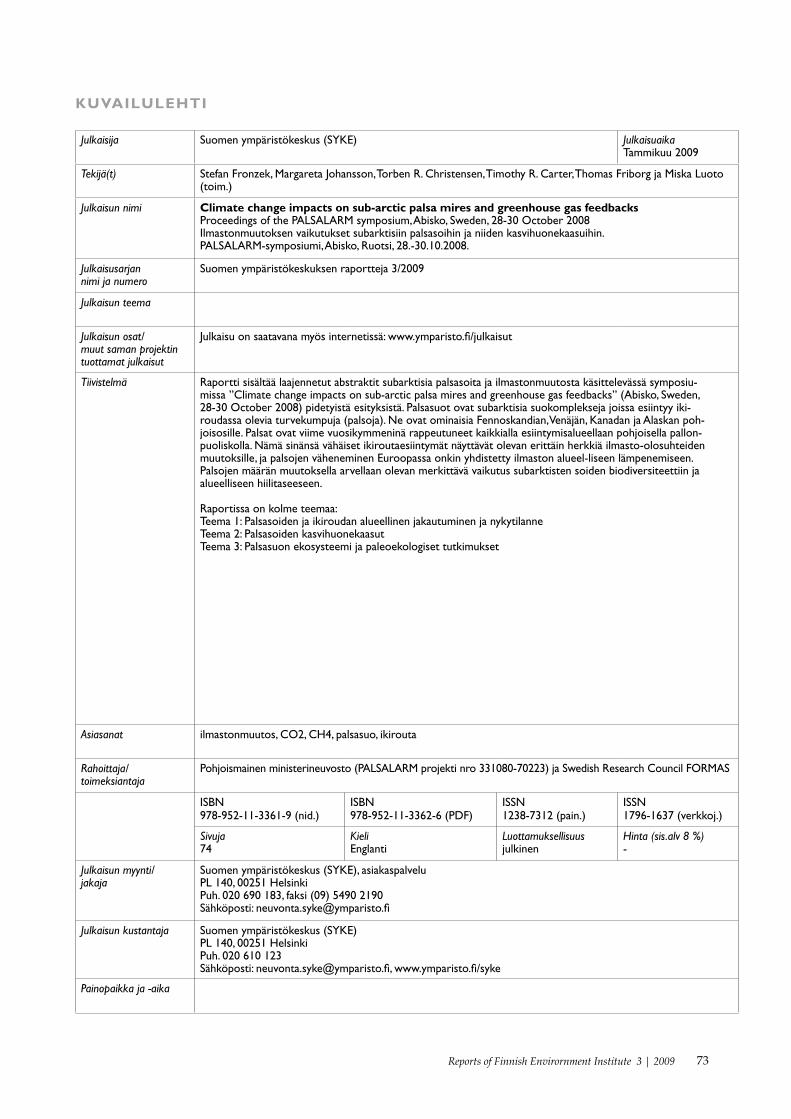
73Reports of Finnish Envirornment Institute 3 | 2009
KUVAILULEHTI
Julkaisija Suomen ympäristökeskus (SYKE) JulkaisuaikaTammikuu 2009
Tekijä(t) Stefan Fronzek, Margareta Johansson, Torben R. Christensen, Timothy R. Carter, Thomas Friborg ja Miska Luoto (toim.)
Julkaisun nimi Climate change impacts on sub-arctic palsa mires and greenhouse gas feedbacks Proceedings of the PALSALARM symposium, Abisko, Sweden, 28-30 October 2008 Ilmastonmuutoksen vaikutukset subarktisiin palsasoihin ja niiden kasvihuonekaasuihin. PALSALARM-symposiumi, Abisko, Ruotsi, 28.-30.10.2008.
Julkaisusarjan nimi ja numero
Suomen ympäristökeskuksen raportteja 3/2009
Julkaisun teema
Julkaisun osat/muut saman projektin tuottamat julkaisut
Julkaisu on saatavana myös internetissä: www.ymparisto.fi/julkaisut
Tiivistelmä Raportti sisältää laajennetut abstraktit subarktisia palsasoita ja ilmastonmuutosta käsittelevässä symposiu-missa ”Climate change impacts on sub-arctic palsa mires and greenhouse gas feedbacks” (Abisko, Sweden, 28-30 October 2008) pidetyistä esityksistä. Palsasuot ovat subarktisia suokomplekseja joissa esiintyy iki-roudassa olevia turvekumpuja (palsoja). Ne ovat ominaisia Fennoskandian, Venäjän, Kanadan ja Alaskan poh-joisosille. Palsat ovat viime vuosikymmeninä rappeutuneet kaikkialla esiintymisalueellaan pohjoisella pallon-puoliskolla. Nämä sinänsä vähäiset ikiroutaesiintymät näyttävät olevan erittäin herkkiä ilmasto-olosuhteiden muutoksille, ja palsojen väheneminen Euroopassa onkin yhdistetty ilmaston alueel-liseen lämpenemiseen. Palsojen määrän muutoksella arvellaan olevan merkittävä vaikutus subarktisten soiden biodiversiteettiin ja alueelliseen hiilitaseeseen.
Raportissa on kolme teemaa:Teema 1: Palsasoiden ja ikiroudan alueellinen jakautuminen ja nykytilanneTeema 2: Palsasoiden kasvihuonekaasutTeema 3: Palsasuon ekosysteemi ja paleoekologiset tutkimukset
Asiasanat ilmastonmuutos, CO2, CH4, palsasuo, ikirouta
Rahoittaja/ toimeksiantaja
Pohjoismainen ministerineuvosto (PALSALARM projekti nro 331080-70223) ja Swedish Research Council FORMAS
ISBN978-952-11-3361-9 (nid.)
ISBN978-952-11-3362-6 (PDF)
ISSN1238-7312 (pain.)
ISSN 1796-1637 (verkkoj.)
Sivuja74
KieliEnglanti
Luottamuksellisuusjulkinen
Hinta (sis.alv 8 %)-
Julkaisun myynti/ jakaja
Suomen ympäristökeskus (SYKE), asiakaspalvelu PL 140, 00251 HelsinkiPuh. 020 690 183, faksi (09) 5490 2190Sähköposti: [email protected]
Julkaisun kustantaja Suomen ympäristökeskus (SYKE) PL 140, 00251 HelsinkiPuh. 020 610 123Sähköposti: [email protected], www.ymparisto.fi/syke
Painopaikka ja -aika
74 Reports of Finnish Envirornment Institute 3 | 2009
PRESENTATIONSBLAD
Utgivare Finlands miljöcentral (SYKE) DatumJanuari 2009
Författare Stefan Fronzek, Margareta Johansson, Torben R. Christensen, Timothy R. Carter, Thomas Friborg och Miska Luoto (red.)
Publikationens titel Climate change impacts on sub-arctic palsa mires and greenhouse gas feedbacksProceedings of the PALSALARM symposium, Abisko, Sweden, 28-30 October 2008Klimatförändringens inverkan på subarktiska palsamyrar med återkopplingseffekter på växthusgaser Rapport från PALSALARM-projektets symposium ”Climate change impacts on sub-arctic palsa mires and green-house gas feedbacks”,Abisko, Sverige, 28.-30.10.2008
Publikationsserieoch nummer
Finlands miljöcentrals rapporter /200X
Publikationens tema
Publikationens delar/andra publikationerinom samma projekt
Publikationen finns tillgänglig också på Internet www.ymparisto.fi/julkaisut (på finska).
Sammandrag Rapporten består av utvidgade abstrakt av presentationer vid symposiet om klimatförändringens effekter på subarktiska palsamyrar med återkopplingseffekter på växthusgaser ”Climate change impacts on sub-arctic palsa mires and greenhouse gas feedbacks”, Abisko, Sverige, 28.-30.10. 2008. Palsamyrarna är subarktiska myrbildningar som består av torvkullar vars kärna är permanent frusen. De är karaktäristiska och unika för miljön vid höga latituder i delar av Fennoskandien, Ryssland, Kanada och Alaska. Under de senaste årtiondena har palsamyrarna minskat i hela sitt utbredningsområde på norra halvklotet. Dehär marginella uttrycken för permafrost verkar vara ytterst känsliga för klimatförhållandena och minskningen under senaste tid av palsamyrar i Europa har förklarats med att klimatet regionalt blivit varmare. Förändringar i palsamyrars utbredning väntas påverka både subarktiska myrars biodiversitet och regionala kolbalanser avsevärt.
Rapporten har tre teman:
• Tema 1: Utbredningen av palsamyrar och permafros i nuläget• Tema 2: Palsamyrarnas återkopplingseffekter på växthusgaser• Tema 3: Studier av palsamyrarnas ekosystem och paleoekologi
Nyckelord klimatförändring, CO2, CH4, palsamyr, permafrost
Finansiär/ uppdragsgivare
Nordiska ministerrådet (projekt PALSALARM nr 331080-70223) och Swedish Research Council FORMAS
ISBN978-952-11-3361-9 (hft.)
ISBN978-952-11-3362-6 (PDF)
ISSN1238-7312 (print)
ISSN 1796-1637 (online)
Sidantal74
SpråkEngelska
OffentlighetOffentlig
Pris (inneh. moms 8 %)-
Beställningar/ distribution
Finlands miljöcentral (SYKE), kundservice PB 140, 00251 Helsingfors Tfn. +358 20 690 183, fax +358 9 5490 2190 Epost: [email protected]
Förläggare Finlands miljöcentral (SYKE) PB 140, 00251 Helsingfors Tfn. +358 20 610 123 Epost: [email protected], www.miljo.fi/syke
Tryckeri/tryckningsortoch -år
ISBN 978-952-11-3361-9 (nid.)
ISBN 978-952-11-3362-6 (PDF)
ISSN 1796-1718 (pain.)
ISSN 1796-1726 (verkkoj.)
FIN
NIS
H E
NV
IRO
NM
EN
T IN
ST
ITU
TE
CL
IMA
TE
CH
AN
GE
IMP
AC
TS
ON
SU
B-A
RC
TIC
PA
LS
AM
IRE
SA
ND
GR
EE
NH
OU
SE
GA
SF
EE
DB
AC
KS
Top Related
Copyright © 2022 FDOKUMEN

