


Bahasa
Halaman
Hukum


Journal of Histochemistry & Cytochemistry 61(4) 272 –282© The Author(s) 2013Reprints and permission: sagepub.com/journalsPermissions.navDOI: 10.1369/0022155413477661http://jhc.sagepub.com
In recent decades, the importance of studies to characterize the genetic profile in healthy or pathological conditions has increased. This has led to a continued need for new strate-gies for high-throughput research to explore the temporal and spatial localization of proteins as well as new technolo-gies to improve data acquisition and analysis.
Immunohistochemistry (IHC) can be used to detect dif-ferential expression levels of specific antigens with the advantages of preserving protein localization and the pos-sibility of using little sample or samples preserved in paraf-fin. Immunohistochemistry has been widely used in tissue samples from cancer for detecting tumor progression and aggressiveness (Harrington et al. 2009; Laurinavicius et al. 2012; van Schaik et al. 2012). Recently, tissue microarrays (TMAs) have changed immunohistochemistry into a high-throughput methodology in which a single slide can hold up
to hundreds of samples that can be processed in one reac-tion. This ensures that the same conditions are applied to each sample and maximizes reproducibility (Dhir 2008; Jawhar 2009). The development of this new technology now raises the need for an automated means of quantifica-tion that can speed up the analysis without compromising the quality of the results.
IHC is commonly analyzed by qualified professionals using conventional optical microscopy, and although with practice comes experience, optical microscopy is still
477661 JHCXXX10.1369/0022155413477661Alvarenga et al.Manual and Automated Evaluations of TMA Patterns of Protein Expression2013© The Author(s) 2010
Reprints and permission:sagepub.com/journalsPermissions.nav
Received for publication June 27, 2012; accepted August 30, 2012.
Corresponding Author:Glaucia N. M. Hajj, PhD, International Research Center, A. C. Camargo Hospital, Zip Code: 01509-010, São Paulo, Brazil. E-mail: [email protected]
A Comparison between Manual and Automated Evaluations of Tissue Microarray Patterns of Protein Expression
Arthur W. Alvarenga, Claudia M. Coutinho-Camillo, Bruna R. Rodrigues, Rafael M. Rocha, Luiz Fernando B. Torres, Vilma R. Martins, Isabela W. da Cunha, and Glaucia N. M. HajjInternational Research Center, A. C. Camargo Hospital, National Institute of Science and Technology in Oncogenomics, National Institute of Translational Neuroscience, São Paulo, Brazil (AWA,CMC-C,BRR,RMR,VRM,IWDC,GNMH), and Institute Pelé-Pequeno Príncipe for Research on Pediatric Cancer, Curitiba, Brazil (LFBT)
Summary
Tissue microarray technology enables us to evaluate the pattern of protein expression in large numbers of samples. However, manual data acquisition and analysis still represent a challenge because they are subjective and time-consuming. Automated analysis may thus increase the speed and reproducibility of evaluation. However, the reliability of automated analysis systems should be independently evaluated. Herein, the expression of phosphorylated AKT and mTOR was determined by ScanScope XT (Aperio; Vista, CA) and ACIS III (Dako; Glostrup, Denmark) and compared with the manual analysis by two observers. The percentage of labeled pixels or nuclei analysis had a good correlation between human observers and automated systems (κ = 0.855 and 0.879 for ScanScope vs. observers and κ = 0.765 and 0.793 for ACIS III vs. observers). The intensity of labeling determined by ScanScope was also correlated with that found by the human observers (correlation index of 0.946 and 0.851 for pAKT and 0.851 and 0.875 for pmTOR). However, the correlation between ACIS III and human observation varied for labeling intensity and was considered poor in some cases (correlation index of 0.718 and 0.680 for pAKT and 0.223 and 0.225 for pmTOR). Thus, the percentage of positive pixels or nuclei determination was satisfactorily performed by both systems; however, labeling intensity was better identified by ScanScope XT. (J Histochem Cytochem 61:272–282, 2013)
Keywords
immunohistochemistry, tissue microarray, automated analysis
Article

Manual and Automated Evaluations of TMA Patterns of Protein Expression 273
subject to errors (Rojo et al. 2009). The pathologist typically interprets IHC results using a binary positive-negative end point or a three- to four-point scale, such as the HSCORE (McCarty et al. 1986) or the criteria of Allred et al. (1998). These methods are rarely reproducible, with high levels of intraobserver and interobserver variability.
Contrary to conventional microscopy, for which the evaluation criteria are qualitative or semiquantitative and result in categorical values for statistical analysis, com-puter-assisted microscopy generates a score that can be used to assign continuous values, resulting in a more finely graduated scale than Allred or the HSCORE that may increase the sensitivity and dynamic range of the in situ measurement of protein expression (Choudhury et al. 2010). It is still to be determined, however, if a greater dynamic range results in an analytical advantage because reports in the literature suggest that survival outcome in relation to immunohistochemical expression can be equally predicted by both human and machine (Ong et al. 2010).
Other advantages of automation include a shorter analy-sis time (Ong et al. 2010) and the elimination of the inherent variability of pathologist-based scoring because computer measurements are not subject to external factors, such as human fatigue, illumination, or ambient noise (Cregger et al. 2006). Therefore, the implementation of automated mechanisms and digital documentation is a goal for high-throughput IHC evaluation.
However, automated evaluation is also prone to errors due to the inability of the machine to deal with non-ideal situations, such as inadequate sample preparation, heteroge-neous tissues, uneven color patterns, and cells that appear merged, among others. In addition, each manufacturer uses a proprietary mathematical algorithm to deal with these situations. Thus, equipment should be independently tested for its ability to quantify immunohistochemistry reactions and deal with problems inherent to the technique itself.
Most studies in the literature evaluate automation methods using antibodies for nuclear or membrane epitopes (Hatanaka et al. 2003; Choudhury et al. 2010; Ong et al. 2010) because of its ability to clearly delineate a background area. However, a situation often observed in practice is that antigens may have nuclear and/or cytoplasmic localization that may reduce the reliability of the automated discrimination. In this work, we analyzed the expression patterns of the phosphorylated forms of AKT and mammalian target of rapamycin (mTOR), two proteins highly involved in the process of tumorigenesis (Sabatini 2006; Dancey 2010) that correlate with a worse prognosis in several tumor types (Hirashima et al. 2010; Kim et al. 2010; Korkolopoulou et al. 2012) and present nuclear and cytoplasmic distributions. We evaluated the interplatform reproducibility of two microscopy systems from different manufacturers in TMA samples and tested the reproducibility of these platforms against conventional microscopy analysis by two qualified observers.
Materials and MethodsSample Selection and TMAsFourteen brain samples from patients surgically treated for epileptic syndrome and 206 glioma samples, classified as grade I to grade IV according to the World Health Organization (WHO) classification, were selected from the formalin-fixed paraffin-embedded tissue bank of the Anatomic Pathology Department of AC Camargo Hospital (São Paulo, Brazil). A 1-mm punch was collected from representative tumor areas from each case and organized in a TMA.
Immunohistochemistry ReactionsTMA sections were deparaffinized by incubation at 60C for 24 hr, followed by two successive immersions in xylene at 56C for 30 min each, followed by hydration in solutions with decreasing concentrations of ethanol (100%, 95%, 80%, and 70%). For antigen retrieval, the slides were incu-bated in 10 mM citrate buffer (pH 6.0) in a pressure cooker for 30 min with a preheat of 14 min. To block endogenous peroxidase, sections were incubated in 10% H
2O
2. Sections
were incubated with pAKT (20 µg/ml; Cell Signaling Technology, Danvers, MA) and pmTOR (20 µg/ml; Cell Signaling Technology) antibodies diluted in 1% bovine serum albumin in PBS for 18 hr at 4C in a humid chamber. Secondary antibody staining was performed using a two-step procedure (Advance HRP; Dako, Glostrup, Denmark). First, the secondary antibody (Advance HRP Link) was diluted in PBS and incubated with the slides for 30 min at 37C, followed by washing with three changes of PBS for 3 min each. Slides were then incubated for 30 min at 37C with secondary antibody diluted in Tris-HCl buffer (Advance HRP Enzyme; Dako), followed by two washes in Tris-HCl buffer (pH 7.6) for 5 min each. Color was devel-oped by incubating the slides in substrate solution: 0.06% 3,3′-tetrahydrochloride diaminobenzidine (D-5637; Sigma, St. Louis, MO), 1% dimethylsulfoxide, and 0.06% H
2O
2 in
PBS for 5 min at 37C. The reaction was stopped by immersing the slides in 0.1 M Tris-HCl (pH 7.6). The sec-tions were counterstained with Harris hematoxylin, washed in water, and dehydrated through increasing concentrations of ethanol, followed by subsequent mounting. Each slide had a positive control consisting of tissue known to be positive for each antibody tested.
Image Analysis by ObserversTwo qualified observers (AWA and RMR) scored all TMA spots for the percentage of cells that stained positively in a blinded, independent manner: 0 (0%–10% of stained cells), 1 (10%–25% of stained cells), 2 (26%–50% of stained cells), 3 (50%–75% of stained cells), or 4 (greater than 75% stained cells). The average color of the spot was also graded
274 Alvarenga et al.
by the observer as staining intensity: 0 (no staining), 1 (weak staining), 2 (moderate staining), or 3 (strong stain-ing). A Quickscore (Q), ranging from 0 to 7 was generated by adding the percentage and intensity scores.
Image Analysis by Automated EquipmentThe analyses of the slides were made using the ScanScope XT from Aperio (Vista, CA) and the ACIS III from Dako. Each automated system generated a number of positive pixels and positive nuclei according to internal algorithms.
For the analysis that included the intensity of the stain-ing, the ScanScope internal algorithm was able to classify each pixel as 0 (negative, threshold 256–220), 1 (weakly positive, threshold 220–175), 2 (positive, threshold 175–100), or 3 (strong positive, threshold 100–0) and to count the number of pixels in each category. From these data, the HSCORE (Hatanaka et al. 2003) was calculated according to the formula HSCORE = Σ(i × Pi), where Pi = percentage of positive pixels, varied from 0% to 100%, and pixel stain-ing intensity i = 0, 1, 2, or 3. Hence, the range for the HSCORE was 0 to 300.
ACIS III performs an analysis based on hotspots. Hotspots from each sample were automatically chosen by the equip-ment, and the expression was calculated from the percentage of immunopositive cells and immunostaining intensity and was shown as a mean region score. We were unable to find the specifications used by the equipment for this scoring.
Statistical Analysis—κ TestThe comparisons between the two observers were per-formed by weighted κ testing. Weighted κ (Landis and Koch 1977; Kundel and Polansky 2003) is calculated by subtracting the proportion of the readings that are expected to agree by chance, which we will call ρ
e, from the overall
agreement, ρo, and dividing the remainder by the number of
cases for which agreement is not expected to occur by chance (equation 1). As the number of categories increases, there is more room for disagreement, and the relative importance of disagreement between categories may not be the same for adjacent categories as it is for distant catego-ries. A method for calculation has been developed that allows for differences in the importance of disagreements (equation 2), where w represents weight, i is the number of the row, j is the number of the column, and k is the total number of categories.
To classify the agreement strength of the κ coefficient, the classification established by Landis and Koch (1977) was used, in which the values of κ from 0.00 to 0.20 indi-cates negligible agreement, 0.21 to 0.40 indicates slight agreement, 0.41 to 0.60 indicates moderate agreement, 0.61 to 0.80 indicates great agreement, and 0.81 to 1.00 indicates excellent agreement.
Kappa testing requires that the same classification is used by the two subjects that performed the analysis. We thus can-not compare a score that varies from 0 to 4 with a percentage that varies from 0 to 100. Thus, to compare between manual and automated quantification, the percentage of positive pix-els or nuclei obtained by each automated system was scored from 0 to 4 according to same criteria used by the observers. The scores were then compared using κ.
When the intensity of the staining was also considered, the average intensity of each spot given by ScanScope was classified from 0 to 3 (0: threshold 256–220, 1: threshold 220–175, 2: threshold 175–100, 3: threshold 100–0), and the percentage of positive pixels was classified from 0 to 4 according to same criteria used by the observers. A Quickscore directly comparable to the one produced by the manual evaluation was generated by adding the percentage and intensity scores. Scores were compared using the κ test.
The scale for the ACIS III mean score for the hotspots could not be directly compared with the other measurements.
Statistical Analysis—Correlation IndexThe percentage of positive nuclei or the percentage of positive pixels given by ScanScope or ACIS III was plotted against each other, and a correlation index was calculated.
When the intensity values were also considered, the HSCORE generated from the ScanScope data and the hotspot mean value from ACIS III were plotted against each other or against the Quickscore generated by the observers. A correlation index was calculated for each plot.
Statistical tests were performed with GraphPad Prism (GraphPad Software, La Jolla, CA) or R software (R Core Team 2012).
ResultsTMAs containing 14 samples from non-tumoral brain tissue and 206 glioma tissue samples were subjected to immunohis-tochemistry reactions with antibodies to the phosphorylated form of AKT (Fig. 1) and mTOR (Fig. 2). The reactions were highly specific because a sharp and well-localized staining pattern with no background artifacts was observed (Figs. 1 and 2). It was also observed that the expression of the proteins presented variability between samples (Figs. 1 and 2). Even though we maximized the quality of our samples and immu-nohistochemistry reactions, there were some spots where a small defect in the tissue could represent a problematic area
κρ ρ
ρ( )
( ) ( )
( ).w
w w
wo e
e
=−
−1
wi j
kij = −−−
11
2
2
( )
( ). (2)
(1)
Manual and Automated Evaluations of TMA Patterns of Protein Expression 275
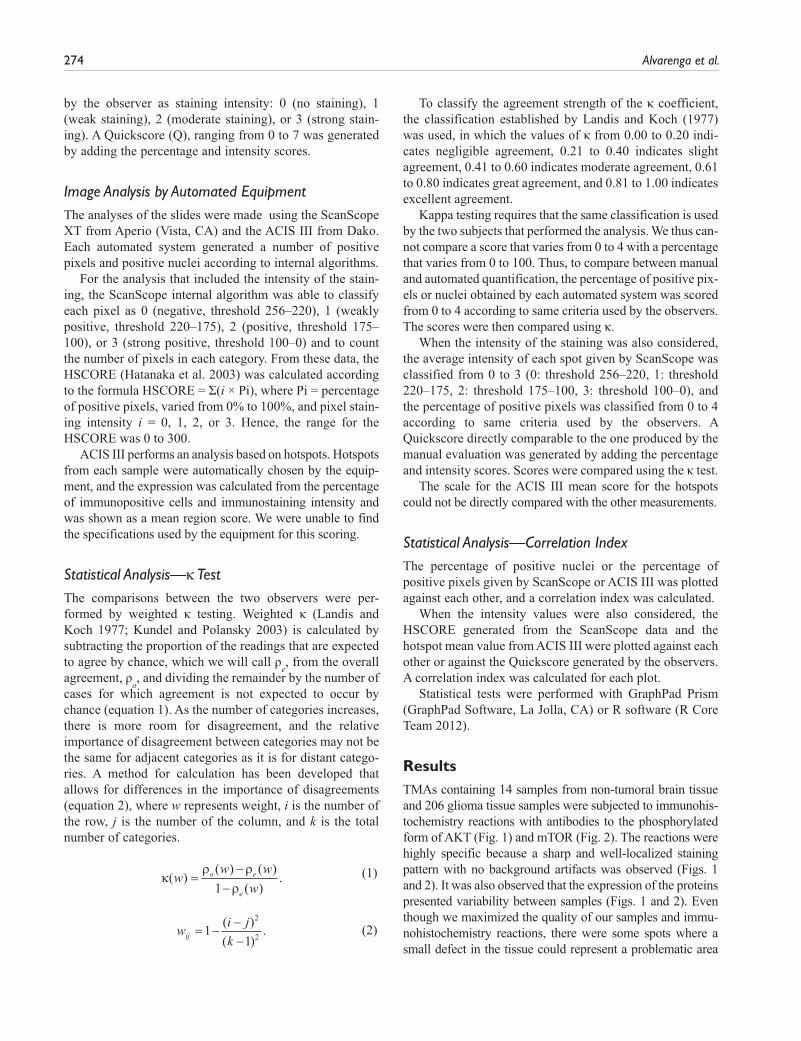
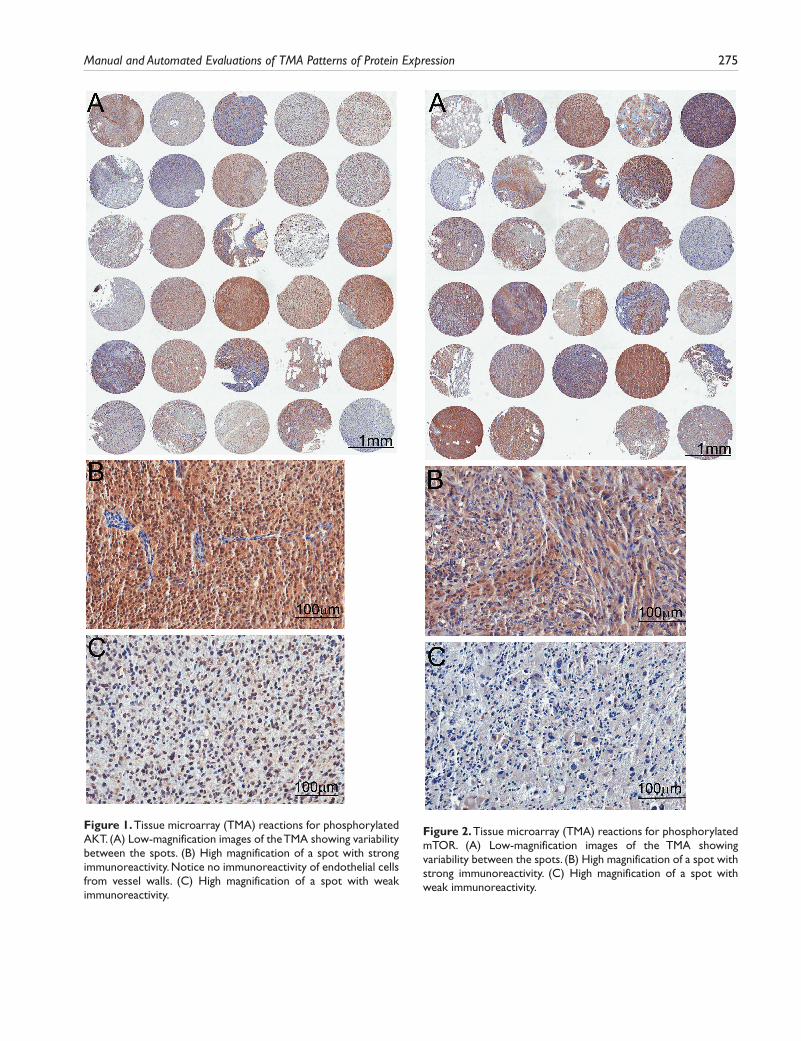
Figure 1. Tissue microarray (TMA) reactions for phosphorylated AKT. (A) Low-magnification images of the TMA showing variability between the spots. (B) High magnification of a spot with strong immunoreactivity. Notice no immunoreactivity of endothelial cells from vessel walls. (C) High magnification of a spot with weak immunoreactivity.
Figure 2. Tissue microarray (TMA) reactions for phosphorylated mTOR. (A) Low-magnification images of the TMA showing variability between the spots. (B) High magnification of a spot with strong immunoreactivity. (C) High magnification of a spot with weak immunoreactivity.

276 Alvarenga et al.
for the automated analysis. Those included the displacement or bending of the tissue, overlapping with other tissues, or hematoxylin precipitates and other waste that can be deposited in the tissue, causing a false-positive mark (Fig. 3).
Samples analyzed by two different observers were cate-gorized according to the percentage of positively labeled cells (Tables 1 and 2). The agreement between the two observers was calculated (Tables 1 and 2) and was consid-ered excellent (κ of 0.905 for pAKT staining and 0.805 for pmTOR staining).
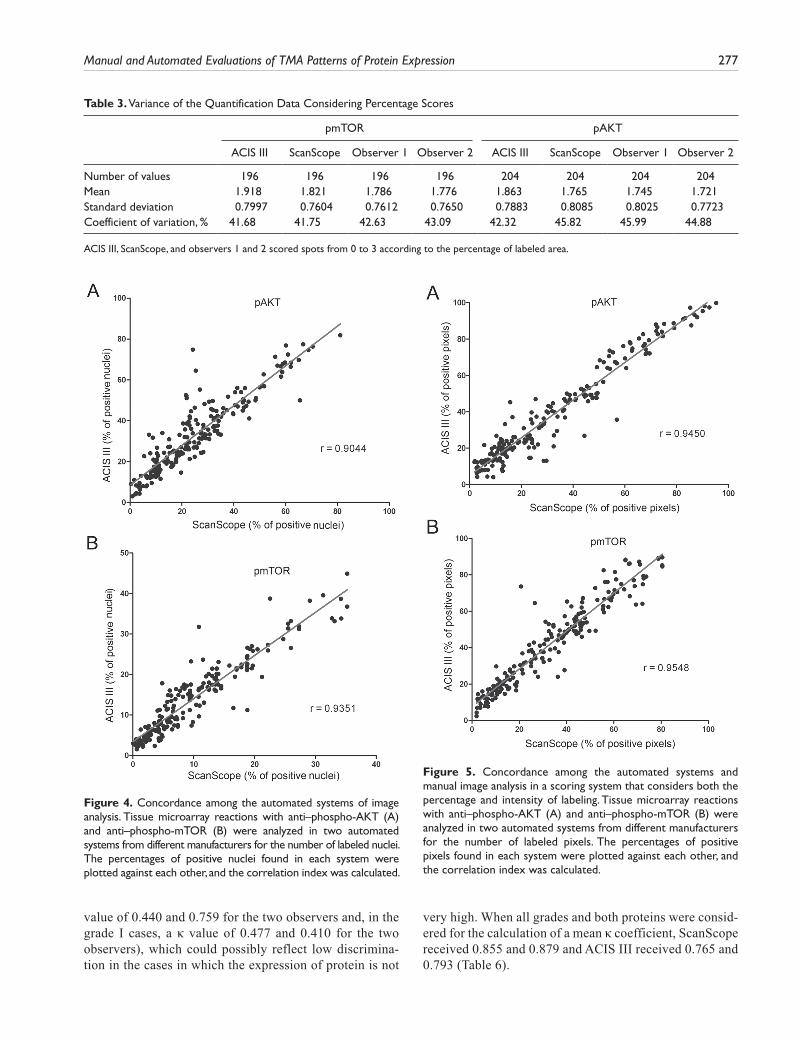
In the next step, samples were evaluated using two auto-mated systems. Two slides were analyzed, and measure-ments of the percentage of positively labeled nuclei and the number of positive pixels were taken, representing nuclear and total staining, respectively. For each evaluation method, a variance analysis was performed (Table 3) and was consis-tent among different methods. The measurements obtained by each system were plotted against each other to verify concordance, and the correlation index was calculated for each situation (Figs. 4 and 5). The correlation between the two automated systems was not perfect, reflecting the differ-ences in the algorithms used by each system. A high
correlation index between each system was observed, but that correlation varied with the antibody used (correlation index for ACIS III vs. ScanScope was 0.9044 and 0.9351 for the percentage of labeled nuclei with pAKT and pmTOR, respectively, and was 0.9450 and 0.9548 for the percentage of labeled pixels with pAKT and pmTOR, respectively).
We then applied the κ coefficient to analyze the confi-dence of the digital analysis systems (Tables 4 and 5). By applying the classification of Landis and Koch (1977), we observed that there was reproducibility between the two observers with Aperio, with great to excellent in all grades for gliomas and control tissues, with κ values ranging from 0.477 to 1.0 for pAKT and 0.571 to 1.0 for mTOR. These data demonstrate that the score obtained in ScanScope could be considered reliable for analysis. We performed the same procedure with the ACIS III equip-ment and observed that the κ value ranged from 0.410 to 1.000 for pAKT and 0.429 to 1.0 for mTOR, showing a moderate to excellent concordance between all tumor grades. ACIS III had a moderate reproducibility, espe-cially in the normal and low grades (in control cases labeled with pAKT, the concordance of ACIS III had a κ
Figure 3. Problematic situations in the digital image analysis. (A) Immunohistochemistry reaction denoting superposition of tissues in the slide, increasing the labeling color. (B) Evaluation of positive pixels by the ACIS III system, demonstrating that, in this case, the equipment was not able to discriminate the problematic areas. (C) Immunohistochemistry reaction denoting an unspecific deposit (arrow). (D) Evaluation of the number of positive nuclei performed by the Aperio ScanScope, demonstrating that, in this case, the apparatus was able to recognize the spot as unspecific staining (arrow). Scale bar: 50 µm.
Table 1. Tissue Microarray Analysis by Human Observers
Category Observer 1, No. (%) Observer 2, No. (%)
0 0 01 97 (47.78) 98 (48.27)2 66 (32.51) 59 (29.06)3 40 (19.70) 46 (22.66)κ 0.905
Each spot was given a grade according to the percentage of positively la-beled cells with the pAKT antibody. 0 = absolute lack of staining, 1 = 1% to 25% of stained cells, 2 = 26% to 50% of stained cells, and 3 = greater than 50% of stained cells. The percentage of samples in each category as accessed by observers 1 and 2 is indicated.
Table 2. Tissue Microarray Analysis by Human Observers
Category Observer 1, No. (%) Observer 2, No. (%)
0 0 01 97 (47.78) 98 (48.27)2 66 (32.51) 59 (29.06)3 40 (19.70) 46 (22.66)κ 0.805
Each spot was given a grade according to the percentage of positively labeled cells with pmTOR antibody. 0 = absolute lack of staining, 1 = 1% to 25% of stained cells, 2 = 26% to 50% of stained cells, and 3 = greater than 50% of stained cells. The percentage of samples in each category as accessed by observers 1 and 2 is indicated.
Manual and Automated Evaluations of TMA Patterns of Protein Expression 277
value of 0.440 and 0.759 for the two observers and, in the grade I cases, a κ value of 0.477 and 0.410 for the two observers), which could possibly reflect low discrimina-tion in the cases in which the expression of protein is not
very high. When all grades and both proteins were consid-ered for the calculation of a mean κ coefficient, ScanScope received 0.855 and 0.879 and ACIS III received 0.765 and 0.793 (Table 6).
Table 3. Variance of the Quantification Data Considering Percentage Scores
pmTOR pAKT
ACIS III ScanScope Observer 1 Observer 2 ACIS III ScanScope Observer 1 Observer 2
Number of values 196 196 196 196 204 204 204 204Mean 1.918 1.821 1.786 1.776 1.863 1.765 1.745 1.721Standard deviation 0.7997 0.7604 0.7612 0.7650 0.7883 0.8085 0.8025 0.7723Coefficient of variation, % 41.68 41.75 42.63 43.09 42.32 45.82 45.99 44.88
ACIS III, ScanScope, and observers 1 and 2 scored spots from 0 to 3 according to the percentage of labeled area.
Figure 4. Concordance among the automated systems of image analysis. Tissue microarray reactions with anti–phospho-AKT (A) and anti–phospho-mTOR (B) were analyzed in two automated systems from different manufacturers for the number of labeled nuclei. The percentages of positive nuclei found in each system were plotted against each other, and the correlation index was calculated.
Figure 5. Concordance among the automated systems and manual image analysis in a scoring system that considers both the percentage and intensity of labeling. Tissue microarray reactions with anti–phospho-AKT (A) and anti–phospho-mTOR (B) were analyzed in two automated systems from different manufacturers for the number of labeled pixels. The percentages of positive pixels found in each system were plotted against each other, and the correlation index was calculated.

278 Alvarenga et al.
We further expanded our analysis to include the data from the labeling intensity. Observer evaluation was based on a Quickscore that varied from 0 to 7 and considered the percentage of labeled area and mean intensity of the spot. ScanScope measurements of the percentage of labeled
pixels and pixel intensity were integrated into an HSCORE. ACIS III analysis was based on a mean value obtained from the intensity and percentage of labeling in automatically selected hotspots. A variance analysis was performed for each quantification method and, in this case, the variance
Table 4. Comparison between Observers and Digital Imaging Systems in the Total Expression of Phosphorylated AKT
Method Tissue κ Concordance Force
ScanScope × observer 1 Control 0.632 GreatScanScope × observer 2 1.000 ExcellentACIS III × observer 1 Control 0.440 ModerateACIS III × observer 2 0.759 GreatScanScope × observer 1 Grade I 0.784 GreatScanScope × observer 2 0.833 ExcellentACIS III × observer 1 Grade I 0.477 ModerateACIS III × observer 2 0.410 ModerateScanScope × observer 1 Grade II 0.786 GreatScanScope × observer 2 0.829 ExcellentACIS III × observer 1 Grade II 0.780 GreatACIS III × observer 2 0.824 ExcellentScanScope × observer 1 Grade III 0.851 ExcellentScanScope × observer 2 0.837 ExcellentACIS III × observer 1 Grade III 1.000 ExcellentACIS III × observer 2 0.696 GreatScanScope × observer 1 Grade IV 0.753 GreatScanScope × observer 2 0.815 ExcellentACIS III × observer 1 Grade IV 0.782 GreatACIS III × observer 2 0.829 Excellent
Table 5. Comparison between Human Observers and Digital Imaging Systems in the Total Expression of Phosphorylated mTOR
Method Tissue κ Concordance Force
ScanScope × observer 1 Control 1.000 ExcellentScanScope × observer 2 1.000 ExcellentACIS III × observer 1 Control 0.744 ModerateACIS III × observer 2 0.744 ModerateScanScope × observer 1 Grade I 0.805 GreatScanScope × observer 2 0.908 ExcellentACIS III × observer 1 Grade I 0.524 ModerateACIS III × observer 2 0.643 GreatScanScope × observer 1 Grade II 0.829 ExcellentScanScope × observer 2 0.872 ExcellentACIS III × observer 1 Grade II 0.683 GreatACIS III × observer 2 0.645 GreatScanScope × observer 1 Grade III 0.708 GreatScanScope × observer 2 0.571 ModerateACIS III × observer 1 Grade III 0.553 ModerateACIS III × observer 2 0.429 ModerateScanScope × observer 1 Grade IV 0.915 ExcellentScanScope × observer 2 0.931 ExcellentACIS III × observer 1 Grade IV 0.777 GreatACIS III × observer 2 0.827 Excellent

Manual and Automated Evaluations of TMA Patterns of Protein Expression 279
was not constant among the different methods (Table 7). ScanScope had a high correlation with the two observers for both pAKT and pmTOR (ScanScope vs. observer 1 correla-tion index of 0.946 and 0.851, respectively, and ScanScope vs. observer 2 correlation index of 0.851 and 0.875, respec-tively), demonstrating a concordance between the observer and automated evaluation (Fig. 6A, B). The κ index revealed a great reliability between ScanScope and the observers (κ of 0.754 and 0.737 for pAKT; κ of 0.663 and 0.727 for pmTOR) (Table 8).
The hotspot method of ACIS III had a low correlation with the observers (Fig. 6C, D, Table 8) with an index of 0.7189 for pAKT and 0.2232 for pmTOR relative to observer 1 and 0.680 for pAKT and 0.225 for pmTOR relative to observer 2. Accordingly, the correlation between both auto-mated systems varied between 0.7581 for pAKT and 0.2253 for pmTOR (Fig. 6E, F, Table 8). The ACIS III differences with respect to the observer or ScanScope were much greater in the TMA probed for pmTOR and could be due to the lower intensity of this staining when compared with pAKT. The κ reliability test between the observer and ACIS III could not be performed because the scoring system of ACIS III was different from the observer scoring method.
Altogether, these results indicate that there are variations among different systems. The automated analysis of the TMAs was very reliable for both systems when the percent-age of positive pixels was considered. When the intensity of the staining was also considered, the correlation between both automated systems and with the observers was lower; however, in our hands, ScanScope had a superior algorithm with a higher correlation index (0.8517 and 0.9461 for ScanScope vs. observer 1 and 0.2232 and 0.7189 for ACIS III vs. observer 1) (Table 8) with the observer and a κ value considered great (0.754 and 0.737 for ScanScope vs. observers 1 and 2 for pAKT and 0.663 and 0.727 for ScanScope vs. observers 1 and 2 for pmTOR) (Table 8). The ACIS III hotspot method was not so reliable when an automated selection of hotspots was used. Thus, in our hands, the Aperio system displayed a higher correlation with the results from human observers.
Discussion
The determination of protein expression levels by immuno-histochemical techniques has progressed toward a more quantitative type of assessment (Cregger et al. 2006; Kayser 2012) either for diagnostic purposes or clinical-pathological research (Jara-Lazaro et al. 2010; Laurinaviciene et al. 2011; Nap et al. 2012). Thus, it becomes essential to produce reliable and reproducible high-throughput analyses of protein expression. Automated analysis of protein expression in TMAs has become, then, an essential tool for high-throughput research projects and diagnostic tools.
However, when analyzing IHC reactions by a digital sys-tem, many problematic situations could arise (Krupinski et al. 2012). The quality of the immunohistochemistry reac-tions may be altered by improper fixation of the tissue or method of antigenic reactivation or antibody dilution, lead-ing to nonspecific signal or damaged tissue morphology, that hinders the analysis after scanning. False negatives also may arise due to the formation of air bubbles in the mount-ing of the slide. In these cases, it is important to evaluate how the automated system deals with problematic areas. Ideally, the machine should recognize and exclude areas with problems, but this is not always the case (Fig. 3). In these cases, the manual exclusion of problematic areas is always possible, although this will slow down the efficiency of the analysis. Therefore, it is important to evaluate the quality of each step to ensure maximum fidelity of the data obtained.
Another category that requires attention is the situation that relies on specific parameters of the algorithms used by each system. For example, the ACIS III system was less able to detect positive cells in control tissues, which could be due to the threshold used by the software to consider positive cells. Algorithms that measure cell nuclei can also give mistakes because nuclear sizes vary according to the cell type and region. In cases where two or more adjacent nuclei are considered as a single nucleus, or in cases where other structures may be considered a nucleus, a bias in the analysis can occur. The observer can manually exclude these problems, but again, this is not the ideal situation.
Our study was performed with the currently used TMA technology and automated analysis to evaluate the effect of potential biomarkers of interest. With this kind of approach, we showed a great (0.805) to excellent (0.905) concordance between human observers when the percentage of labeled pixels or nuclei was used and demonstrated that the scores generated by an automated analysis are consistent with the results generated by human observers in the identification of potential prognostic markers. When a more detailed analysis was performed, the concordance was reduced for both
Table 6. Comparison between Two Observers and Digital Imaging Systems Considering All Grades and the Two Antibodies Used
Method κ Concordance Force
ScanScope × observer 1 0.855 ExcellentScanScope × observer 2 0.879 ExcellentACIS III × observer 1 0.765 GreatACIS III × observer 2 0.793 Great

280 Alvarenga et al.
systems, particularly with pmTOR, which had a lower signal intensity. However, the ScanScope still showed a high cor-relation with the observers (0.8517 and 0.9461 for ScanScope vs. observer 1 and 0.851 and 0.875 for ScanScope vs. observer 2) (Table 8). In the majority of discordant cases, observers identified no staining that was classified by auto-mated systems as a weakly positive staining. However, a modification in the classification thresholds could improve this issue. It is worth noticing in Fig. 6A and B that each Quickscore category corresponds to a zone of HSCORE val-ues, thus meaning that automation gives a more precise value and thus represents an increase in the dynamic range of the classifications. Whether this increase in the dynamic range indeed improves the determination of survival out-come or other clinically relevant aspects is still unknown.
ACIS III did not have an algorithm that could produce a score similar to Quickscore to allow for κ statistics. However, the correlation between the data obtained from ACIS III and manual evaluation or ScanScope varied with the antibody used and was poor in the case of pmTOR (0.718 and 0.223 for ScanScope vs. observer 1 and 0.680 and 0.225 for ScanScope vs. observer 2) (Table 8). The ACIS III algorithm performs an automatic selection of hotspots instead of evalu-ating the whole tissue, which could have contributed to the discrepancies. Possibly, these discrepancies could be
minimized by manual selection of hotspots; however, this would reduce the speed and reproducibility of the analysis. Another difficulty observed was the absence of clear and adjustable parameters for quantification, such as the thresh-olds used, that could be adapted by the user.
In conclusion, automated technology provides us with high-throughput analysis, showing variable correlation between equipment and observers. In our hands, both sys-tems were able to distinguish positively labeled pixels, even though the Aperio ScanScope had the best discrimination algorithm. When a more refined type of analysis was per-formed, both systems were less correlated with the observ-ers. ScanScope still presented satisfactory results, but ACIS III showed a low correlation in some cases (correlation index of 0.223 and 0.225 for pmTOR, ACIS III vs. observ-ers 1 and 2). Thus, we believe that automated systems can be used for high-throughput analysis of TMAs; however, caution is advised when choosing the manufacturer and type of analysis. Because we observed variation among the results from the staining with different antibodies, a valida-tion procedure should be performed in cases where new antibodies are to be used. Even though care has to be taken in each pre- and postanalytical step, the benefit of its use in daily routine pathology laboratories can be important. In addition to providing reliable data, automated analysis of
Table 7. Variance of the Quantification Data Considering the Intensity and Percentage Scores
pAKT pmTOR
ScanScope Observer 1 Observer 2 ACIS III ScanScope Observer 1 Observer 2 ACIS III
Number of values 184 184 184 184 181 181 181 181Mean 63.07 3.440 3.533 2.008 22.61 2.508 2.133 1.958Standard deviation 54.46 2.142 2.062 1.213 22.37 2.094 1.968 0.9525Coefficient of variation, % 86.3 62.2 58.3 60.4 98.9 83.4 92.2 48.6
Table 8. Comparison between Observers, ScanScope, and ACIS III Considering All Grades and the Two Antibodies Used
Method Antibody Correlation Index (r) κ Concordance Force
Observer 1 × observer 2 pAKT 0.926 0.901 ExcellentScanScope × ACIS III 0.758 — —ScanScope × observer 1 pAKT 0.946 0.754 GreatScanScope × observer 2 0.851 0.737 GreatACIS III × observer 1 pAKT 0.718 — —ACIS III × observer 2 0.680 — —Observer 1 × observer 2 pmTOR 0.892 0.878 ExcellentScanScope × ACIS III 0.225 — —ScanScope × observer 1 pmTOR 0.851 0.663 GreatScanScope × observer 2 0.875 0.727 GreatACIS III × observer 1 pmTOR 0.223 — —ACIS III × observer 2 0.225 — —
— Indicates the analysis could not be performed.

Manual and Automated Evaluations of TMA Patterns of Protein Expression 281
TMAs decreases substantially the average time to diagnosis and includes tools to allow Internet sharing of information with other observers (Kldiashvili and Schrader 2011).
Declaration of Conflicting Interests
The authors declared no potential conflicts of interest with respect to the research, authorship, and/or publication of this article.
Funding
The authors disclosed receipt of the following financial support for the research and/or authorship of this article: This work was supported by a FAPESP (Fundação de Amparo a Pesquisa do Estado de São Paulo—São Paulo State Foundation) grant to GNMH (2012/04370-4) and VRM (2009/14027-2). A CAPES (Coordenação de Aperfeioçoamento Pessoal de Nível
Superior—Brazilian federal foundation for the support of science) fellowship to AWA is acknowledged.
References
Allred DC, Harvey JM, Berardo M, Clark GM. 1998. Prognostic and predictive factors in breast cancer by immunohistochemi-cal analysis. Mod Pathol. 11(2):155–168.
Choudhury KR, Yagle KJ, Swanson PE, Krohn KA, Rajendran JG. 2010. A robust automated measure of average antibody stain-ing in immunohistochemistry images. J Histochem Cytochem. 58(2):95–107.
Cregger M, Berger AJ, Rimm DL. 2006. Immunohistochemistry and quantitative analysis of protein expression. Arch Pathol Lab Med. 130(7):1026–1030.
Dancey J. 2010. mTOR signaling and drug development in cancer. Nat Rev Clin Oncol. 7(4):209–219.
Figure 6. Concordance among the automated systems of image analysis. Tissue microarray reactions with anti–phospho-mTOR (A, C, and E) and anti–phospho-AKT (B, D, and E) were analyzed in two automated systems from different manufacturers and by an observer to determine the number of labeled pixels. The percentages of positive pixels and pixel intensities given by the ScanScope algorithm were combined into an HSCORE. Automatic selection of hotspots and a mean value for percentage of labeling and intensity were given by the ACIS III system. The observer classified the percentage of staining from 0 to 4 and intensity from 0 to 3, and both values were combined into a Quickscore. Score values were plotted against each other, and the correlation index was calculated.

282 Alvarenga et al.
Dhir R. 2008. Tissue microarrays: an overview. Methods Mol Biol. 441:91–103.
Harrington AM, Hari P, Kroft SH. 2009. Utility of CD56 immu-nohistochemical studies in follow-up of plasma cell myeloma. Am J Clin Pathol. 132(1):60–66.
Hatanaka Y, Hashizume K, Nitta K, Kato T, Itoh I, Tani Y. 2003. Cytometrical image analysis for immunohistochemi-cal hormone receptor status in breast carcinomas. Pathol Int. 53(10):693–699.
Hirashima K, Baba Y, Watanabe M, Karashima R, Sato N, Imam-ura Y, Hiyoshi Y, Nagai Y, Hayashi N, Iyama K, et al. 2010. Phosphorylated mTOR expression is associated with poor prognosis for patients with esophageal squamous cell carci-noma. Ann Surg Oncol. 17(9):2486–2493.
Jara-Lazaro AR, Thamboo TP, Teh M, Tan PH. 2010. Digital pathology: exploring its applications in diagnostic surgical pathology practice. Pathology. 42(6):512–518.
Jawhar NM. 2009. Tissue microarray: a rapidly evolving diagnos-tic and research tool. Ann Saudi Med. 29(2):123–127.
Kayser K. 2012. Introduction of virtual microscopy in routine surgical pathology—a hypothesis and personal view from Europe. Diagn Pathol. 7:48.
Kim MK, Kim TJ, Sung CO, Choi CH, Lee JW, Kim BG, Bae DS. 2010. High expression of mTOR is associated with radiation resistance in cervical cancer. J Gynecol Oncol. 21(3):181–185.
Kldiashvili E, Schrader T. 2011. Reproducibility of telecytology diagnosis of cervical smears in a quality assurance program: the Georgian experience. Telemed J E Health. 17(7):565–568.
Korkolopoulou P, Levidou G, El-Habr EA, Piperi C, Adamopou-los C, Samaras V, Boviatsis E, Thymara I, Trigka EA, Sake-llariou S, et al. 2012. Phosphorylated 4E-binding protein 1 (p-4E-BP1): a novel prognostic marker in human astrocyto-mas. Histopathology. 61(2):293–305.
Krupinski EA, Silverstein LD, Hashmi SF, Graham AR, Weinstein RS, Roehrig H. 2012. Observer performance using virtual pathology slides: impact of LCD color reproduction accuracy. J Digit Imaging. 25(6):738–743.
Kundel HL, Polansky M. 2003. Measurement of observer agree-ment. Radiology. 228(2):303–308.
Landis JR, Koch GG. 1977. The measurement of observer agree-ment for categorical data. Biometrics. 33(1):159–174.
Laurinaviciene A, Dasevicius D, Ostapenko V, Jarmalaite S, Lazutka J, Laurinavicius A. 2011. Membrane connectivity estimated by digital image analysis of HER2 immunohisto-chemistry is concordant with visual scoring and fluorescence in situ hybridization results: algorithm evaluation on breast cancer tissue microarrays. Diagn Pathol. 6:87.
Laurinavicius A, Laurinaviciene A, Ostapenko V, Dasevicius D, Jarmalaite S, Lazutka J. 2012. Immunohistochemistry profiles of breast ductal carcinoma: factor analysis of digital image analysis data. Diagn Pathol. 7:27.
McCarty KS Jr, Szabo E, Flowers JL, Cox EB, Leight GS, Miller L, Konrath J, Soper JT, Budwit DA, Creasman WT. 1986. Use of a monoclonal anti-estrogen receptor antibody in the immu-nohistochemical evaluation of human tumors. Cancer Res. 46(8, Suppl):4244s–4248s.
Nap M, Teunissen R, Pieters M. 2012. A travel report of the imple-mentation of virtual whole slide images in routine surgical pathology. APMIS. 120(4):290–297.
Ong CW, Kim LG, Kong HH, Low LY, Wang TT, Supriya S, Kathiresan M, Soong R, Salto-Tellez M. 2010. Computer-assisted pathological immunohistochemistry scoring is more time-effective than conventional scoring, but provides no ana-lytical advantage. Histopathology. 56(4):523–529.
R Core Team. 2012. R: A language and environment for statisti-cal computing. Vienna, Austria: R Foundation for Statistical Computing.
Rojo MG, Bueno G, Slodkowska J. 2009. Review of imaging solutions for integrated quantitative immunohistochemistry in the pathology daily practice. Folia Histochem Cytobiol. 47(3):349–354.
Sabatini DM. 2006. mTOR and cancer: insights into a complex relationship. Nat Rev Cancer. 6(9):729–734.
van Schaik FD, Oldenburg B, Offerhaus GJ, Schipper ME, Vleg-gaar FP, Siersema PD, van Oijen MG, Ten Kate FJ. 2012. Role of immunohistochemical markers in predicting progression of dysplasia to advanced neoplasia in patients with ulcerative colitis. Inflamm Bowel Dis. 18(3):480–488.
Top Related
Copyright © 2022 FDOKUMEN

