


Bahasa
Halaman
Hukum

INTERNATIONAL JOURNAL OF CHEMICAL
REACTOR ENGINEERING
Volume 10 2012 Article A15
Development of Torrefaction Kinetics forBritish Columbia Softwoods
Jianghong Peng∗ Xiaotao T. Bi†
Jim Lim‡ Shabab Sokhansanj∗∗
∗The University of British Columba, [email protected]†The University of British Columbia, [email protected]‡The University of British Columbia, [email protected]∗∗The University of British Columba, [email protected]
ISSN 1542-6580DOI: 10.1515/1542-6580.2878Copyright c©2012 De Gruyter. All rights reserved.
Brought to you by | University of British Columbia (University of British Columbia)Authenticated | 172.16.1.226
Download Date | 4/16/12 8:11 PM
Development of Torrefaction Kinetics for BritishColumbia Softwoods∗
Jianghong Peng, Xiaotao T. Bi, Jim Lim, and Shabab Sokhansanj
Abstract
Torrefaction is a thermal treatment without air or oxygen in the temperaturerange of 473-573 K. The pyrolysis kinetics of three chemical components (cel-lulose, hemicelluloses, and lignin) and wood at low temperatures of relevance totorrefaction conditions have been reviewed. A series of thermogravimetric (TG)experiments have been carried out to study the intrinsic torrefaction kinetics ofmajor chemical components and British Columbia (BC) softwoods. The weightloss during BC softwood torrefaction was found to be mainly associated with thedecomposition of hemicelluloses, although there was also certain degree of de-composition of cellulose and lignin. The weight loss of the BC softwoods duringtorrefaction could be approximately estimated from the chemical composition ofwood species and the weight loss data for torrefaction of pure cellulose, hemi-celluloses, and lignin, respectively. Based on the fitting of the TG curves of BCsoftwoods and three chemical components, two different torrefaciton models wereproposed. The simple one-step (single-stage) kinetic model with the first order re-action can predict the reaction data reasonably well over the long residence time,with the final sample weight being strongly related to the torrefaction tempera-ture. A two-component and one-step first order reaction kinetic model, on the
∗Jiang Hong Peng, Department of Chemical and Biological Engineering, the University of BritishColumbia, Vancouver, BC, V6T 1Z3, Canada. Xiaotao T. Bi, Department of Chemical and Biolog-ical Engineering, the University of British Columbia, Vancouver, BC, V6T 1Z3, Canada. C JimLim, Department of Chemical and Biological Engineering, the University of British Columbia,Vancouver, BC, V6T 1Z3, Canada. Shahab Sokhansanj, Department of Chemical and BiologicalEngineering, the University of British Columbia, Vancouver, BC, V6T 1Z3, Canada, and Environ-mental Sciences Division, Oak Ridge National Laboratory, Oak Ridge, TN, 37831, USA. Pleasesend correspondence to Xiaotao T. Bi, Department of Chemical and Biological Engineering, theUniversity of British Columbia, Vancouver, BC, V6T 1Z3, Canada; tel.: +1 604 8224408; fax: 1604 8226003; email: [email protected]. Part of this work was presented at iSGA 2010: SecondInternational Symposium on Gasification and Its Application, December 5-8, 2010 at Fukuoka,Japan. The authors are grateful to the financial support from the Natural Science and EngineeringResearch Council (NSERC) of Canada and the Wood Pellet Association of Canada.
Brought to you by | University of British Columbia (University of British Columbia)Authenticated | 172.16.1.226
Download Date | 4/16/12 8:11 PM

other hand, gave improved agreement with data over short residence time, andcan be used to guide the design and optimization of torrefaction reactors over theweight loss range of 0 to 40% at the temperature range of 533-573 K, which coversthe typical range of industrially relevant operations.
KEYWORDS: torrefaction, TG tests, kinetics, model, BC softwood
Brought to you by | University of British Columbia (University of British Columbia)Authenticated | 172.16.1.226
Download Date | 4/16/12 8:11 PM
1. INTRODUCTION
Wood torrefaction is a thermal treatment of wood under atmospheric conditions without air or oxygen in the temperature range of 473-573 K, and usually, the reactions take place at low particle heating rates (<50 K/min) with a long residence time [Bergman, 2005]. As the wood pellet industry gained significant world market over last decade, the torrefaction technology has been explored for the production of torrefied wood pellets in order to increase the water resistance and heating value, reduce the transportation cost of wood pellets and prolong the shelf life of the pellets. The torrefied pellets appear to be especially suitable for replacing coal in thermal power plants [Peng et al., 2010], although other uses of the torrefied wood may also exist [Prins et al., 2006a; Bergman and Kiel, 2005; Couhert et al., 2009; Deng et al., 2009; Winkler, 2011].
In this study, the pyrolysis kinetics of cellulose, hemicelluloses, lignin, and wood at low temperatures of relevance to torrefaction conditions have been reviewed. Wood torrefaction kinetics was investigated in a TG analyser (TGA) for major BC softwood species (pine, fir and spruce), their mixtures (SPF, a mixture of spruce, pine and fir), and three major chemical components (cellulose, hemicelluloses, and lignin). The major chemical compositions were used in order to elucidate the reaction mechanism at low decomposition temperature. To obtain intrinsic torrefaction reaction kinetics, particles of less than 1 mm in diameter were selected to eliminate the limitation of internal heat and mass transfer [Prins et al., 2006; Maa et al., 1973], with the results being potentially applied directly to guide the development of fluidized bed torrefaction reactor systems where fine biomass particles are used. In the future work, the particle size effect of torrefaction will be investigated to elucidate the effect of internal heat and mass transfer effects for applications in a fixed bed torrefaction unit where large size particles are used.
2. REVIEWS OF MILD PYROLYSIS KINETICS
Torrefaction is a mild pyrolysis, with the pyrolysis being widely studied and documented. Several review papers on the reaction mechanisms and the kinetic models of pyrolysis have been published [Rousse, 2004; Mohan and Steele, 2006; Gronli, 1996; Blasi, 2008; Turner et al., 2010; van de Stelt et al., 2011; Chew and Doshi, 2011]. In this part, the mechanism and kinetics model for pyrolysis of wood and its major chemical compositions at low temperatures of relevance to torrefaction conditions have been reviewed.
1Peng et al.: Torrefaction Kinetics
Published by De Gruyter, 2012Brought to you by | University of British Columbia (University of British Columbia)
Authenticated | 172.16.1.226Download Date | 4/16/12 8:11 PM
The physical structures, major chemical compositions, and chemical structures of wood are extremely important for studying thermal chemical behaviours of wood (Orfao, 2001). Cellulose, hemicelluloses, lignin, and extractives are four major chemical compositions of wood. Wood is composed of microfibrils, bundles of cellulose molecules surrounded by hemicelluloses. In between the microfibrils, lignin generated from phenyl-propane molecules is deposited. Extractives are located in the epithelial cells lining the resin canals and flow in the resin canals in the wood. Extractives of wood include fats, waxes, alkaloids, proteins, phenolics, simple sugars, pectins, mucilages, gums, resins, terpenes, starches, glycosides, saponins, and essential oils and vary from species to species. Typically, the softwood consists of 42% cellulose, 27% hemicelluloses, 28% lignin, and 3% extractives; and the hardwood is 45% cellulose, 30% hemicelluloses, 20% lignin, and 5% extractives [Thomas, 1977]. Inorganic matter, also called ash, consists of less than 1% of content in wood (15% in some agricultural residues) [Blasi et al., 1999].
Generally, pyrolysis products are categorized into three groups: permanent gases (CO2, CO, CH4 and small amounts of H2 and C2 hydrocarbons), tars, and chars, or simply into volatiles (low molecular weight gaseous species, in addition to all condensable, aqueous and high molecular weight organic compounds or tars) and chars [Prins et al., 2006c]. Literatures generally agreed that the reaction temperature plays an important role in pyrolysis at different reaction conditions such as different experimental devices and different characteristics of samples, with different types of pyrolysis kinetics having been proposed. 2.1. Cellulose Cellulose is the most abundant organic substance of wood. The cellulose molecules (C6 polymers) consist of long linear chains of glucose molecules (normally 8,000-10,000 glucose molecules with a molecular weight range of 300,000-500,000) with a general formula of (C6H10O5)n, and form intra and intermolecular hydrogen bonds. Cotton almost is pure α-cellulose. Wood cellulose is mostly generated from the pulp and paper industry. With its fibrous structure and strong hydrogen bonding, cellulose provides wood’s strength and is insoluble in most solvents. Cellulose is the most extensively studied material in the field of biomass pyrolysis. Although a significant number of papers have been published, researchers still continue their efforts to improve the mechanisms and models of cellulose pyrolysis.
Shafizadeh (1982) proposed that in the range of 423-573 K cellulose decomposition followed a free radical reaction mechanism. From 423 to 523 K,
2 International Journal of Chemical Reactor Engineering Vol. 10 [2012], Article A15
Brought to you by | University of British Columbia (University of British Columbia)Authenticated | 172.16.1.226
Download Date | 4/16/12 8:11 PM
the cellulose macromolecules rapidly broke into glucose of a molecular weight of about 200, called the “reaction intermediate” (“active cellulose”, “anhydrocellulose”, or “levoglucosan”), resulting from the rupture of cellulose molecules without the weight loss [Golova, 1975]. The weight loss started at 523 K [Gaur and Thomas, 1998]. Between 523 and 573 K, the weight loss was caused by dehydration reactions via bond scission with the elimination of H2O, carbonyl and carboxyl group formation reactions with the elimination of CO and CO2, and limited devolatilization and carbonization for the production of final tars and chars [Halpern and Patal, 1969]. At temperatures above 573 K, the extensive devolatilization involving free radical cleavage of the glucosidic bond (the formation of tars and gases) and the extensive carbonization involving the formation of intermediate carbonium ions (the formation of chars) became dominant. The extensive devolatilization involves free radical cleavage of the glucosidic bond (end-group depolymerization), leading to the formation of tars and gases. The extensive carbonization involves the formation of intermediate carbonium ions (ring scission), leading to chars. The maximum weight loss of cellulose occurs at about 623K.
There are several kinetic models for cellulose pyrolysis. The simplest model for cellulose pyrolysis is a one-step model.
CharsVolatilesCellulose k +⎯→⎯
Table 1 shows some of the determined one-step first order reaction kinetics model equations for the pyrolysis of cellulose. The activation energy ranged from 89 to 260 kJ/mol.
Parks et al. (1955) suggested that cellulose first depolymerized to levoglucosan with a first order reaction. Then the levoglucosan proceeded with two reactions: to form chars with repolymerization and aromatization, and to crack to produce tars and gases.
GasesTarsanLevogluCellulose +→→ cos
↓
Chars
3Peng et al.: Torrefaction Kinetics
Published by De Gruyter, 2012Brought to you by | University of British Columbia (University of British Columbia)
Authenticated | 172.16.1.226Download Date | 4/16/12 8:11 PM
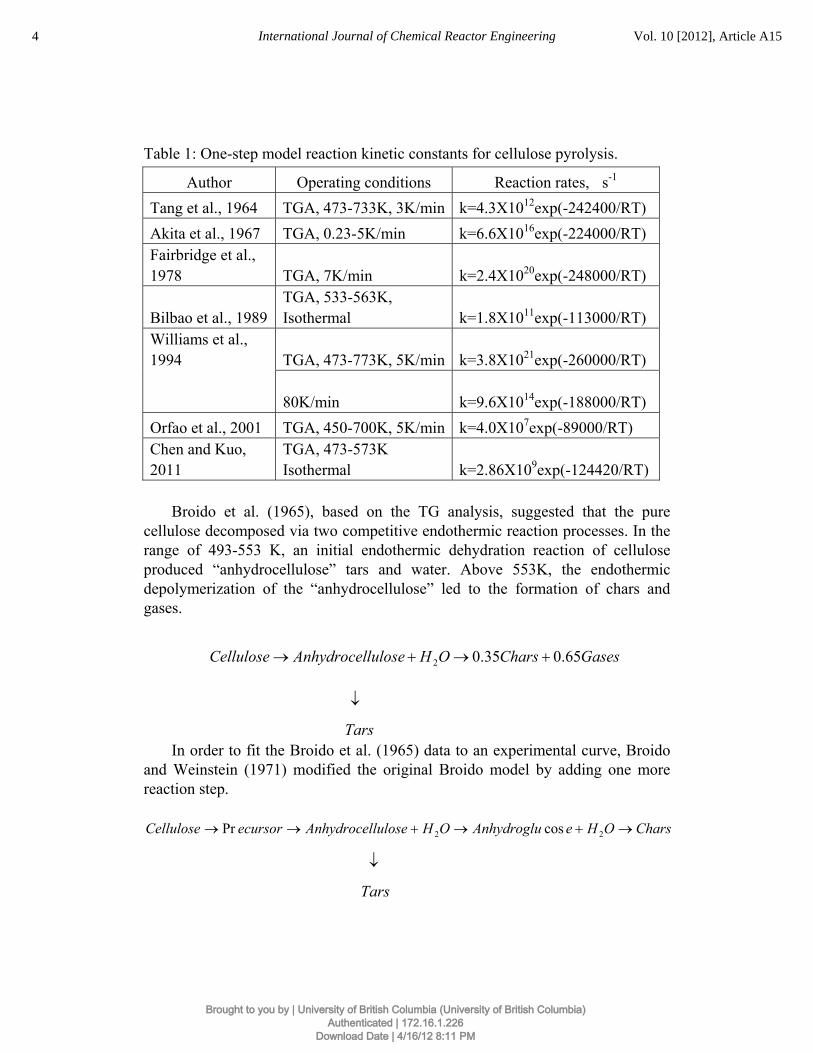
Table 1: One-step model reaction kinetic constants for cellulose pyrolysis.
Author Operating conditions Reaction rates, s-1 Tang et al., 1964 TGA, 473-733K, 3K/min k=4.3X10¹²exp(-242400/RT) Akita et al., 1967 TGA, 0.23-5K/min k=6.6X10¹⁶exp(-224000/RT) Fairbridge et al., 1978 TGA, 7K/min k=2.4X10²⁰exp(-248000/RT)
Bilbao et al., 1989 TGA, 533-563K, Isothermal k=1.8X10¹¹exp(-113000/RT)
Williams et al., 1994 TGA, 473-773K, 5K/min k=3.8X10²¹exp(-260000/RT)
80K/min k=9.6X10¹⁴exp(-188000/RT)
Orfao et al., 2001 TGA, 450-700K, 5K/min k=4.0X10⁷exp(-89000/RT) Chen and Kuo, 2011
TGA, 473-573K Isothermal k=2.86X10⁹exp(-124420/RT)
Broido et al. (1965), based on the TG analysis, suggested that the pure
cellulose decomposed via two competitive endothermic reaction processes. In the range of 493-553 K, an initial endothermic dehydration reaction of cellulose produced “anhydrocellulose” tars and water. Above 553K, the endothermic depolymerization of the “anhydrocellulose” led to the formation of chars and gases.
GasesCharsOHluloseAnhydrocelCellulose 65.035.02 +→+→
↓
Tars In order to fit the Broido et al. (1965) data to an experimental curve, Broido
and Weinstein (1971) modified the original Broido model by adding one more reaction step.
CharsOHeAnhydrogluOHluloseAnhydrocelecursorCellulose →+→+→→ 22 cosPr
↓
Tars
4 International Journal of Chemical Reactor Engineering Vol. 10 [2012], Article A15
Brought to you by | University of British Columbia (University of British Columbia)Authenticated | 172.16.1.226
Download Date | 4/16/12 8:11 PM
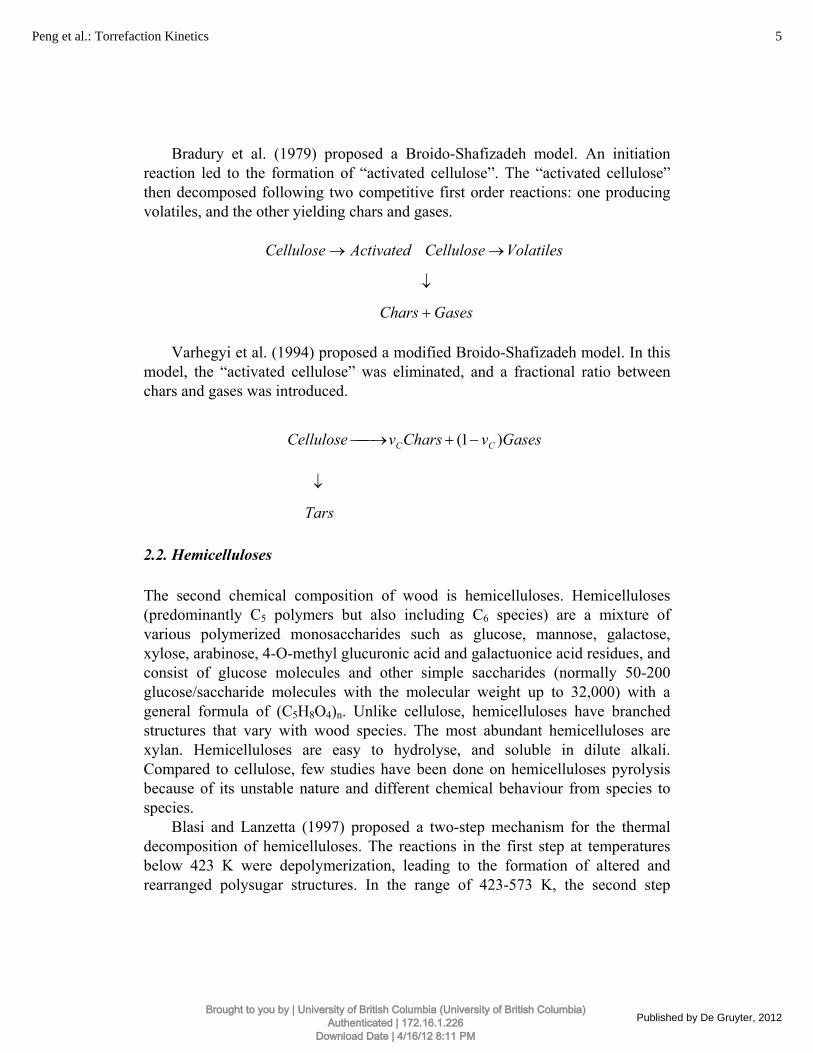
Bradury et al. (1979) proposed a Broido-Shafizadeh model. An initiation reaction led to the formation of “activated cellulose”. The “activated cellulose” then decomposed following two competitive first order reactions: one producing volatiles, and the other yielding chars and gases.
ActivatedCellulose → VolatilesCellulose →
↓
GasesChars +
Varhegyi et al. (1994) proposed a modified Broido-Shafizadeh model. In this model, the “activated cellulose” was eliminated, and a fractional ratio between chars and gases was introduced.
GasesνCharsνCellulose CC )1( −+⎯→⎯
↓
Tars
2.2. Hemicelluloses
The second chemical composition of wood is hemicelluloses. Hemicelluloses (predominantly C5 polymers but also including C6 species) are a mixture of various polymerized monosaccharides such as glucose, mannose, galactose, xylose, arabinose, 4-O-methyl glucuronic acid and galactuonice acid residues, and consist of glucose molecules and other simple saccharides (normally 50-200 glucose/saccharide molecules with the molecular weight up to 32,000) with a general formula of (C5H8O4)n. Unlike cellulose, hemicelluloses have branched structures that vary with wood species. The most abundant hemicelluloses are xylan. Hemicelluloses are easy to hydrolyse, and soluble in dilute alkali. Compared to cellulose, few studies have been done on hemicelluloses pyrolysis because of its unstable nature and different chemical behaviour from species to species.
Blasi and Lanzetta (1997) proposed a two-step mechanism for the thermal decomposition of hemicelluloses. The reactions in the first step at temperatures below 423 K were depolymerization, leading to the formation of altered and rearranged polysugar structures. In the range of 423-573 K, the second step
5Peng et al.: Torrefaction Kinetics
Published by De Gruyter, 2012Brought to you by | University of British Columbia (University of British Columbia)
Authenticated | 172.16.1.226Download Date | 4/16/12 8:11 PM
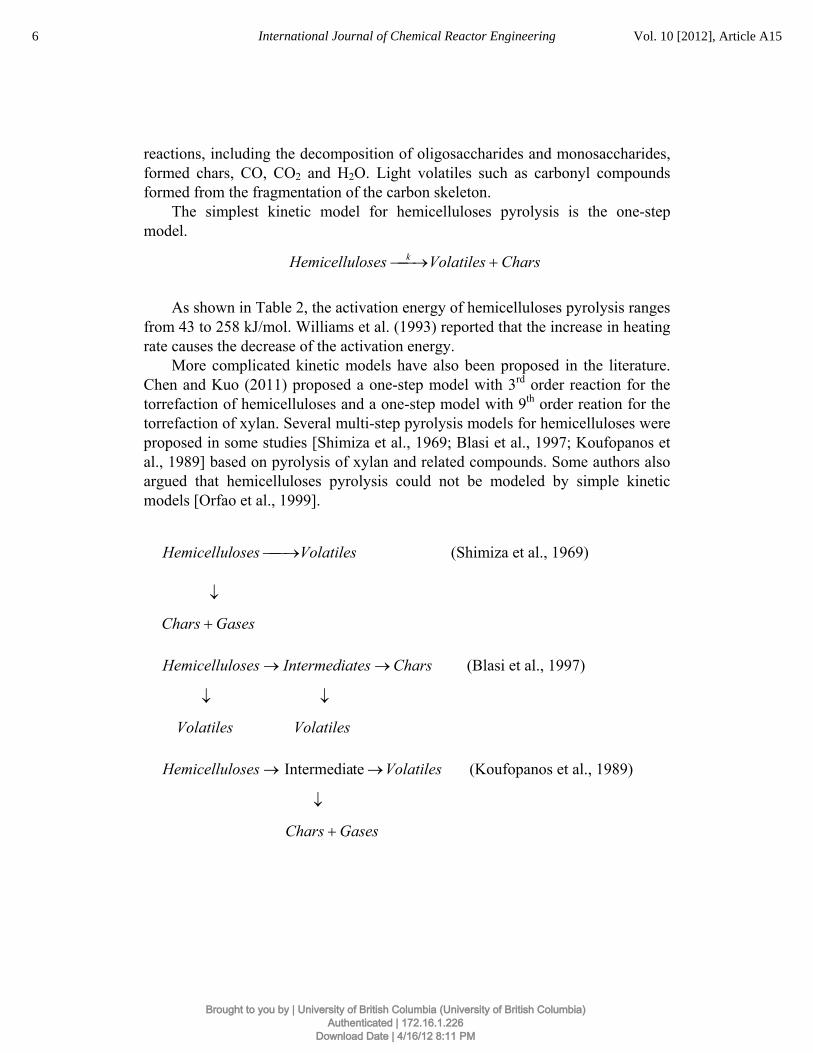
reactions, including the decomposition of oligosaccharides and monosaccharides, formed chars, CO, CO2 and H2O. Light volatiles such as carbonyl compounds formed from the fragmentation of the carbon skeleton.
The simplest kinetic model for hemicelluloses pyrolysis is the one-step model.
CharsVolatilesosesHemicellul k +⎯→⎯
As shown in Table 2, the activation energy of hemicelluloses pyrolysis ranges from 43 to 258 kJ/mol. Williams et al. (1993) reported that the increase in heating rate causes the decrease of the activation energy.
More complicated kinetic models have also been proposed in the literature. Chen and Kuo (2011) proposed a one-step model with 3rd order reaction for the torrefaction of hemicelluloses and a one-step model with 9th order reation for the torrefaction of xylan. Several multi-step pyrolysis models for hemicelluloses were proposed in some studies [Shimiza et al., 1969; Blasi et al., 1997; Koufopanos et al., 1989] based on pyrolysis of xylan and related compounds. Some authors also argued that hemicelluloses pyrolysis could not be modeled by simple kinetic models [Orfao et al., 1999].
VolatilesosesHemicellul ⎯→⎯ (Shimiza et al., 1969)
↓
GasesChars +
CharstesIntermediaosesHemicellul →→ (Blasi et al., 1997)
↓ ↓
Volatiles Volatiles
→osesHemicellul Volatiles→teIntermedia (Koufopanos et al., 1989)
↓
GasesChars +
6 International Journal of Chemical Reactor Engineering Vol. 10 [2012], Article A15
Brought to you by | University of British Columbia (University of British Columbia)Authenticated | 172.16.1.226
Download Date | 4/16/12 8:11 PM
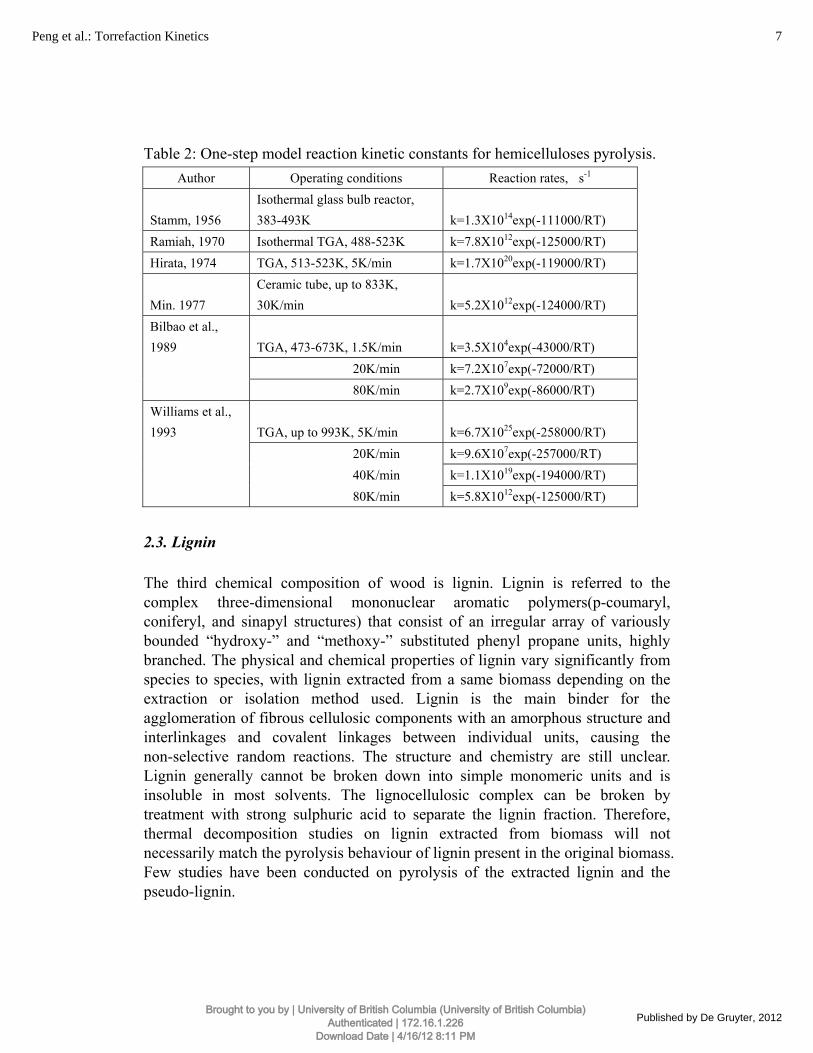
Table 2: One-step model reaction kinetic constants for hemicelluloses pyrolysis. Author Operating conditions Reaction rates, s-1
Stamm, 1956 Isothermal glass bulb reactor, 383-493K k=1.3X10¹⁴exp(-111000/RT)
Ramiah, 1970 Isothermal TGA, 488-523K k=7.8X10¹²exp(-125000/RT) Hirata, 1974 TGA, 513-523K, 5K/min k=1.7X10²⁰exp(-119000/RT)
Min. 1977 Ceramic tube, up to 833K, 30K/min k=5.2X10¹²exp(-124000/RT)
Bilbao et al., 1989 TGA, 473-673K, 1.5K/min k=3.5X10⁴exp(-43000/RT) 20K/min k=7.2X10⁷exp(-72000/RT) 80K/min k=2.7X10⁹exp(-86000/RT) Williams et al., 1993 TGA, up to 993K, 5K/min k=6.7X1025exp(-258000/RT) 20K/min k=9.6X10⁷exp(-257000/RT) 40K/min k=1.1X10¹⁹exp(-194000/RT) 80K/min k=5.8X10¹²exp(-125000/RT)
2.3. Lignin The third chemical composition of wood is lignin. Lignin is referred to the complex three-dimensional mononuclear aromatic polymers(p-coumaryl, coniferyl, and sinapyl structures) that consist of an irregular array of variously bounded “hydroxy-” and “methoxy-” substituted phenyl propane units, highly branched. The physical and chemical properties of lignin vary significantly from species to species, with lignin extracted from a same biomass depending on the extraction or isolation method used. Lignin is the main binder for the agglomeration of fibrous cellulosic components with an amorphous structure and interlinkages and covalent linkages between individual units, causing the non-selective random reactions. The structure and chemistry are still unclear. Lignin generally cannot be broken down into simple monomeric units and is insoluble in most solvents. The lignocellulosic complex can be broken by treatment with strong sulphuric acid to separate the lignin fraction. Therefore, thermal decomposition studies on lignin extracted from biomass will not necessarily match the pyrolysis behaviour of lignin present in the original biomass. Few studies have been conducted on pyrolysis of the extracted lignin and the pseudo-lignin.
7Peng et al.: Torrefaction Kinetics
Published by De Gruyter, 2012Brought to you by | University of British Columbia (University of British Columbia)
Authenticated | 172.16.1.226Download Date | 4/16/12 8:11 PM
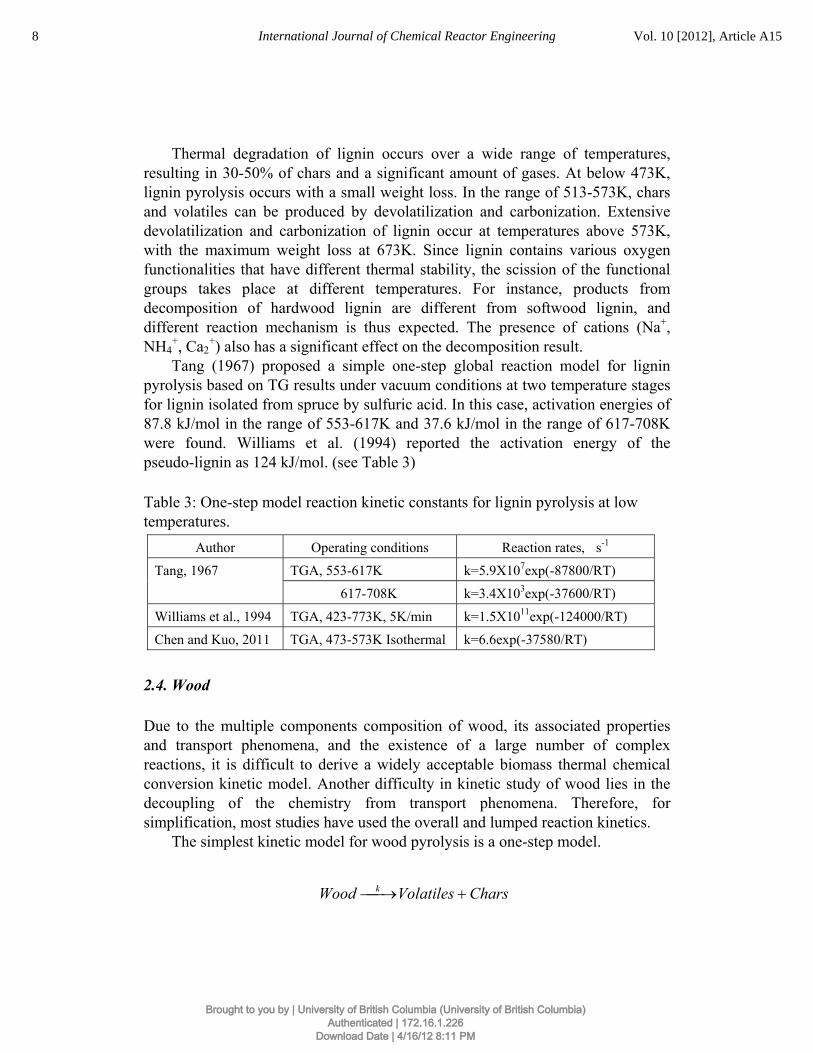
Thermal degradation of lignin occurs over a wide range of temperatures, resulting in 30-50% of chars and a significant amount of gases. At below 473K, lignin pyrolysis occurs with a small weight loss. In the range of 513-573K, chars and volatiles can be produced by devolatilization and carbonization. Extensive devolatilization and carbonization of lignin occur at temperatures above 573K, with the maximum weight loss at 673K. Since lignin contains various oxygen functionalities that have different thermal stability, the scission of the functional groups takes place at different temperatures. For instance, products from decomposition of hardwood lignin are different from softwood lignin, and different reaction mechanism is thus expected. The presence of cations (Na+, NH4
+, Ca2+) also has a significant effect on the decomposition result.
Tang (1967) proposed a simple one-step global reaction model for lignin pyrolysis based on TG results under vacuum conditions at two temperature stages for lignin isolated from spruce by sulfuric acid. In this case, activation energies of 87.8 kJ/mol in the range of 553-617K and 37.6 kJ/mol in the range of 617-708K were found. Williams et al. (1994) reported the activation energy of the pseudo-lignin as 124 kJ/mol. (see Table 3) Table 3: One-step model reaction kinetic constants for lignin pyrolysis at low temperatures.
Author Operating conditions Reaction rates, s-1
Tang, 1967 TGA, 553-617K k=5.9X10⁷exp(-87800/RT)
617-708K k=3.4X10³exp(-37600/RT)
Williams et al., 1994 TGA, 423-773K, 5K/min k=1.5X10¹¹exp(-124000/RT)
Chen and Kuo, 2011 TGA, 473-573K Isothermal k=6.6exp(-37580/RT)
2.4. Wood Due to the multiple components composition of wood, its associated properties and transport phenomena, and the existence of a large number of complex reactions, it is difficult to derive a widely acceptable biomass thermal chemical conversion kinetic model. Another difficulty in kinetic study of wood lies in the decoupling of the chemistry from transport phenomena. Therefore, for simplification, most studies have used the overall and lumped reaction kinetics.
The simplest kinetic model for wood pyrolysis is a one-step model.
CharsVolatilesWood k +⎯→⎯
8 International Journal of Chemical Reactor Engineering Vol. 10 [2012], Article A15
Brought to you by | University of British Columbia (University of British Columbia)Authenticated | 172.16.1.226
Download Date | 4/16/12 8:11 PM
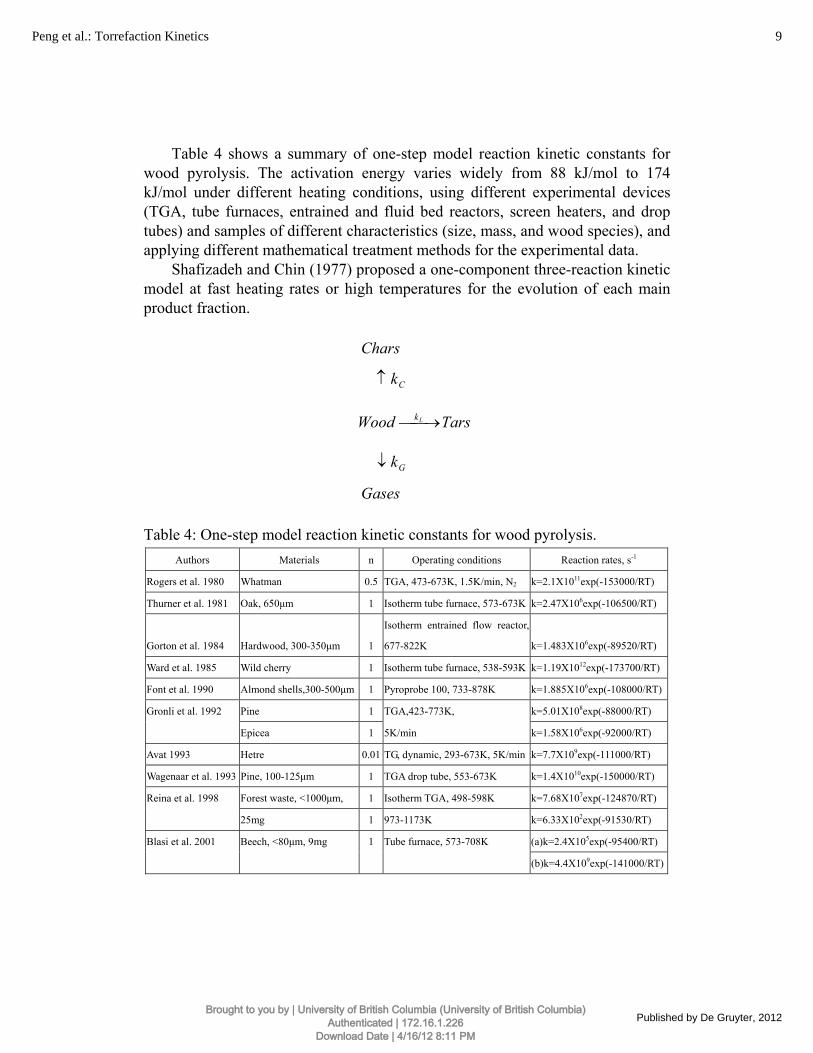
Table 4 shows a summary of one-step model reaction kinetic constants for wood pyrolysis. The activation energy varies widely from 88 kJ/mol to 174 kJ/mol under different heating conditions, using different experimental devices (TGA, tube furnaces, entrained and fluid bed reactors, screen heaters, and drop tubes) and samples of different characteristics (size, mass, and wood species), and applying different mathematical treatment methods for the experimental data.
Shafizadeh and Chin (1977) proposed a one-component three-reaction kinetic model at fast heating rates or high temperatures for the evolution of each main product fraction.
Chars
Ck↑
TarsWood Lk⎯→⎯
Gk↓
Gases
Table 4: One-step model reaction kinetic constants for wood pyrolysis. Authors Materials n Operating conditions Reaction rates, s-1
Rogers et al. 1980 Whatman 0.5 TGA, 473-673K, 1.5K/min, N2 k=2.1X10¹¹exp(-153000/RT)
Thurner et al. 1981 Oak, 650μm 1 Isotherm tube furnace, 573-673K k=2.47X10⁶exp(-106500/RT)
Gorton et al. 1984 Hardwood, 300-350μm 1
Isotherm entrained flow reactor,
677-822K k=1.483X10⁶exp(-89520/RT)
Ward et al. 1985 Wild cherry 1 Isotherm tube furnace, 538-593K k=1.19X10¹²exp(-173700/RT)
Font et al. 1990 Almond shells,300-500μm 1 Pyroprobe 100, 733-878K k=1.885X10⁶exp(-108000/RT)
Gronli et al. 1992 Pine 1 TGA,423-773K, k=5.01X10⁸exp(-88000/RT)
Epicea 1 5K/min k=1.58X10⁶exp(-92000/RT)
Avat 1993 Hetre 0.01 TG, dynamic, 293-673K, 5K/min k=7.7X10⁹exp(-111000/RT)
Wagenaar et al. 1993 Pine, 100-125μm 1 TGA drop tube, 553-673K k=1.4X10¹⁰exp(-150000/RT)
Reina et al. 1998 Forest waste, <1000μm, 1 Isotherm TGA, 498-598K k=7.68X10⁷exp(-124870/RT)
25mg 1 973-1173K k=6.33X10²exp(-91530/RT)
Blasi et al. 2001 Beech, <80μm, 9mg 1 Tube furnace, 573-708K (a)k=2.4X10⁵exp(-95400/RT)
(b)k=4.4X10⁹exp(-141000/RT)
9Peng et al.: Torrefaction Kinetics
Published by De Gruyter, 2012Brought to you by | University of British Columbia (University of British Columbia)
Authenticated | 172.16.1.226Download Date | 4/16/12 8:11 PM
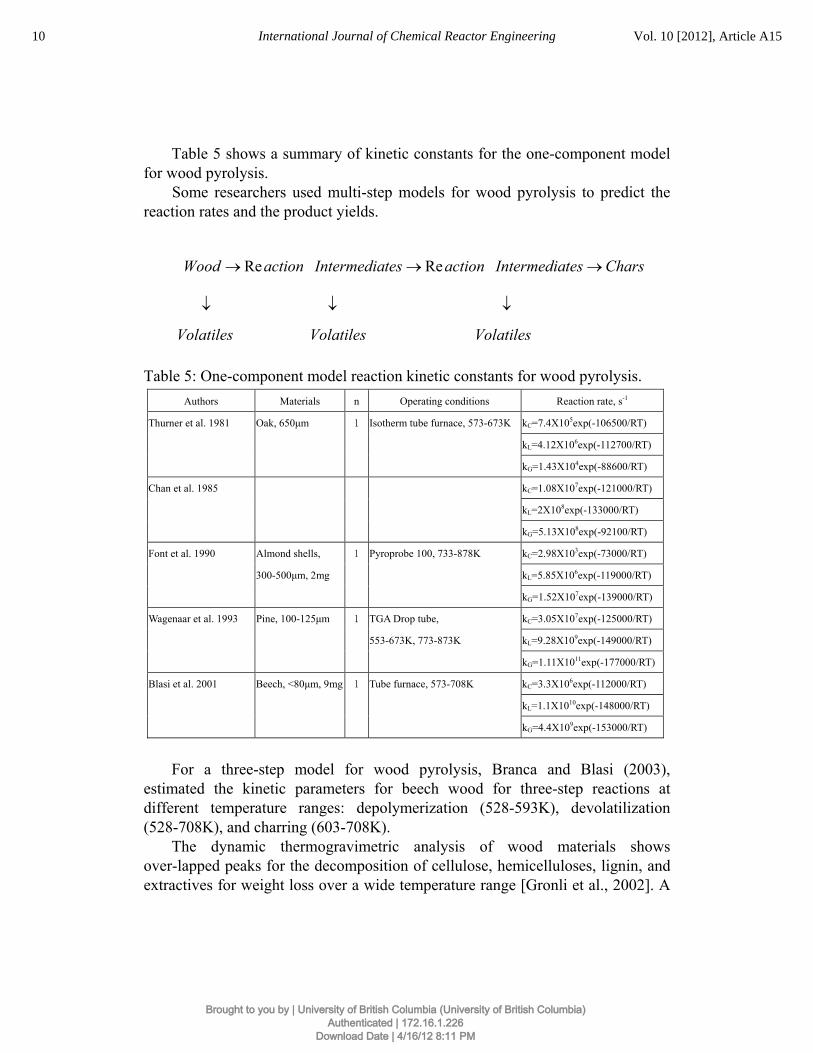
Table 5 shows a summary of kinetic constants for the one-component model for wood pyrolysis.
Some researchers used multi-step models for wood pyrolysis to predict the reaction rates and the product yields.
CharstesIntermediaactiontesIntermediaactionWood →→→ ReRe
↓ ↓ ↓
Volatiles Volatiles Volatiles Table 5: One-component model reaction kinetic constants for wood pyrolysis.
Authors Materials n Operating conditions Reaction rate, s-1
Thurner et al. 1981 Oak, 650μm 1 Isotherm tube furnace, 573-673K kC=7.4X10⁵exp(-106500/RT)
kL=4.12X10⁶exp(-112700/RT)
kG=1.43X10⁴exp(-88600/RT)
Chan et al. 1985 kC=1.08X10⁷exp(-121000/RT)
kL=2X10⁸exp(-133000/RT)
kG=5.13X10⁸exp(-92100/RT)
Font et al. 1990 Almond shells, 1 Pyroprobe 100, 733-878K kC=2.98X10³exp(-73000/RT)
300-500μm, 2mg kL=5.85X10⁶exp(-119000/RT)
kG=1.52X10⁷exp(-139000/RT)
Wagenaar et al. 1993 Pine, 100-125μm 1 TGA Drop tube, kC=3.05X10⁷exp(-125000/RT)
553-673K, 773-873K kL=9.28X10⁹exp(-149000/RT)
kG=1.11X10¹¹exp(-177000/RT)
Blasi et al. 2001 Beech, <80μm, 9mg 1 Tube furnace, 573-708K kC=3.3X10⁶exp(-112000/RT)
kL=1.1X10¹⁰exp(-148000/RT)
kG=4.4X10⁹exp(-153000/RT)
For a three-step model for wood pyrolysis, Branca and Blasi (2003),
estimated the kinetic parameters for beech wood for three-step reactions at different temperature ranges: depolymerization (528-593K), devolatilization (528-708K), and charring (603-708K).
The dynamic thermogravimetric analysis of wood materials shows over-lapped peaks for the decomposition of cellulose, hemicelluloses, lignin, and extractives for weight loss over a wide temperature range [Gronli et al., 2002]. A
10 International Journal of Chemical Reactor Engineering Vol. 10 [2012], Article A15
Brought to you by | University of British Columbia (University of British Columbia)Authenticated | 172.16.1.226
Download Date | 4/16/12 8:11 PM
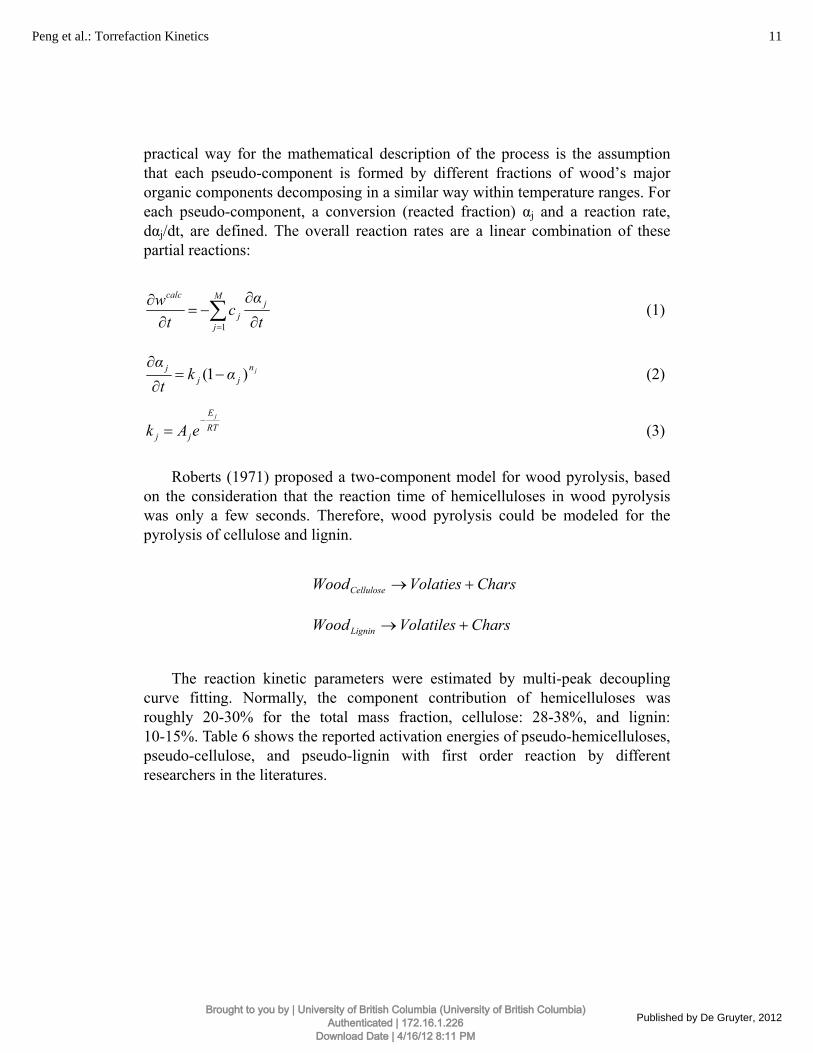
practical way for the mathematical description of the process is the assumption that each pseudo-component is formed by different fractions of wood’s major organic components decomposing in a similar way within temperature ranges. For each pseudo-component, a conversion (reacted fraction) αj and a reaction rate, dαj/dt, are defined. The overall reaction rates are a linear combination of these partial reactions:
tα
ct
w jM
jj
calc
∂
∂−=
∂∂ ∑
=1 (1)
jnjj
j αktα
)1( −=∂
∂ (2)
RTE
jj
j
eAk−
= (3)
Roberts (1971) proposed a two-component model for wood pyrolysis, based on the consideration that the reaction time of hemicelluloses in wood pyrolysis was only a few seconds. Therefore, wood pyrolysis could be modeled for the pyrolysis of cellulose and lignin.
CharsVolatiesWoodCellulose +→
CharsVolatilesWoodLignin +→
The reaction kinetic parameters were estimated by multi-peak decoupling
curve fitting. Normally, the component contribution of hemicelluloses was roughly 20-30% for the total mass fraction, cellulose: 28-38%, and lignin: 10-15%. Table 6 shows the reported activation energies of pseudo-hemicelluloses, pseudo-cellulose, and pseudo-lignin with first order reaction by different researchers in the literatures.
11Peng et al.: Torrefaction Kinetics
Published by De Gruyter, 2012Brought to you by | University of British Columbia (University of British Columbia)
Authenticated | 172.16.1.226Download Date | 4/16/12 8:11 PM
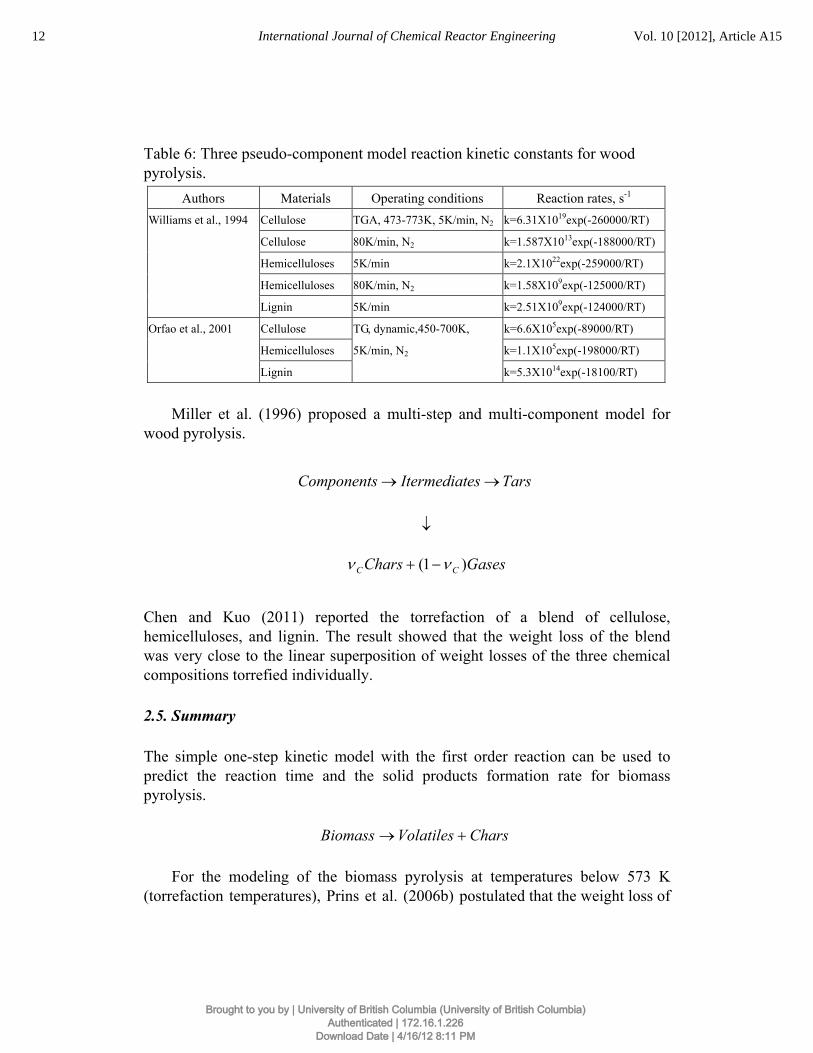
Table 6: Three pseudo-component model reaction kinetic constants for wood pyrolysis.
Authors Materials Operating conditions Reaction rates, s-1 Williams et al., 1994 Cellulose TGA, 473-773K, 5K/min, N2 k=6.31X10¹⁹exp(-260000/RT)
Cellulose 80K/min, N2 k=1.587X10¹³exp(-188000/RT)
Hemicelluloses 5K/min k=2.1X10²²exp(-259000/RT)
Hemicelluloses 80K/min, N2 k=1.58X10⁹exp(-125000/RT)
Lignin 5K/min k=2.51X10⁹exp(-124000/RT)
Orfao et al., 2001 Cellulose TG, dynamic,450-700K, k=6.6X10⁵exp(-89000/RT)
Hemicelluloses 5K/min, N2 k=1.1X10⁵exp(-198000/RT)
Lignin k=5.3X10¹⁴exp(-18100/RT)
Miller et al. (1996) proposed a multi-step and multi-component model for wood pyrolysis.
TarsesItermediatComponents →→
↓
GasesChars CC )1( νν −+
Chen and Kuo (2011) reported the torrefaction of a blend of cellulose, hemicelluloses, and lignin. The result showed that the weight loss of the blend was very close to the linear superposition of weight losses of the three chemical compositions torrefied individually. 2.5. Summary The simple one-step kinetic model with the first order reaction can be used to predict the reaction time and the solid products formation rate for biomass pyrolysis.
CharsVolatilesBiomass +→
For the modeling of the biomass pyrolysis at temperatures below 573 K
(torrefaction temperatures), Prins et al. (2006b) postulated that the weight loss of
12 International Journal of Chemical Reactor Engineering Vol. 10 [2012], Article A15
Brought to you by | University of British Columbia (University of British Columbia)Authenticated | 172.16.1.226
Download Date | 4/16/12 8:11 PM
biomass degradation was primarily from the decomposition of hemicelluloses based on data from willow (hardwood, deciduous wood), and suggested that the Blasi and Lanzetta (1997) model, a two-step kinetic model with parallel reactions to form solids and volatiles, was suitable for biomass torrefaction (mild pyrolysis). They further showed that for wood pyrolysis below 573 K, the reactions were the rate-limiting step for particles smaller than 2 mm where the impact of intraparticle heat and mass transfer becomes insignificant.
SolidstesIntermediaBiomass →→
↓ ↓
Volatiles Liquids At the temperatures above 573 K, the Broido-Shafizadeh model for biomass
degradation has been widely used [Bradbury et al., 1979], which involved an initiation reaction of biomass leading to the formation of “Intermediates”. Then the “Intermediates” decomposed following two competitive first order reactions, with one producing volatiles and the other yielding chars and gases.
VolatilestesIntermediaBiomass →→
↓
GasesChars +
3. EXPERIMENTAL
3.1. Equipment and Procedures A TG analyzer, SHIMADZU TGA-50, was used in this study. A sample of several (5-20) milligrams for each TG experiment was put into a platinum sample cell, which was then located on a sample pan hanging inside a furnace tube under a nitrogen flow rate of 50 ml (STP)/min. The instrument continuously monitored the change of sample weight as well as the temperature. The temperature was ramped from room temperature to 1073 K with the heating rate varied from 1 to 50 K/min.
Both dynamic thermal degradation and isothermal degradation have been performed. The temperature programs of the dynamic experiments were: (1)
13Peng et al.: Torrefaction Kinetics
Published by De Gruyter, 2012Brought to you by | University of British Columbia (University of British Columbia)
Authenticated | 172.16.1.226Download Date | 4/16/12 8:11 PM
heating from the room temperature to 383 K at a heating rate of 50 K/min, (2) holding at 383 K for 20 min to have the sample dried, (3) heating from 383 K to 1073 K at a heating rate of 1 K/min to complete the thermal degradation of the sample and to clean the sample pan. The low heating rate such as 1 K/min with small particle size aims to eliminate the internal heat and mass transfer effects.
The temperature programs for the isothermal experiments were: (1) heating from the room temperature to 383 K at a rate of 50 K/min, (2) holding at 383 K for 10 min to have the sample dried (Note that the dynamic TG results showed that the samples were completely dried in less than 5 min. So the holding time for drying in the isothermal experiments was decreased to 10 min.), (3) heating up to the torrefaction temperature at a rate of 50 K/min, (4) holding at the torrefaction temperature for 10 hours, (5) heating up to 1073 K at a rate of 50 K/min to complete the thermal degradation of the sample and to clean the sample pan. Several torrefaction temperatures were chosen for the isothermal experiments. To shorten the heating up time in the isothermal tests, a heating rate of 50 K/min was selected, which gave rise to less than 5% weight loss associated with the heating period for all tests carried out at 563 K. 3.2. Sample Five BC softwoods, pine, fir, and SPF woodchips from Fiberco, spruce woodchips from FPInnovations, and pine bark from Wood Pellet Association of Canada, have been tested in this study. SPF woodchips samples obtained from the wood industry was a mix of spruce, pine and fir woodchips, with pine as the major constitute. Samples have been prepared by drying at 378 K for 24 hours and crushed in a hammer mill (Glenmills Inc., USA; Model: 10HMBL) installed with a 0.79 mm screen.
Particle size distributions were determined by a Ro-Tap sieve shaker (Tyler Industrial Products, USA). Sieves of 18, 25, 35, 45, 60, 80, 100, 120, 170 and 230 meshes with corresponding opening size of 1.00, 0.707, 0.500, 0.354, 0.250, 0.177, 0.149, 0.125, 0.088 and 0.063 mm, respectively were used. Sieving time was controlled at 5 minutes for each test. In total, two replicates were measured for each sample. Figure 1 shows the measured particle size distribution of BC softwoods prepared from the hammer mill installed with 0.79 mm screen. It is seen that the particle size distributions of spruce, pine, fir and SPF are very close, but different from pine bark. The Sauter mean particle sizes were determined and given in Table 7. The small particle size ensures the elimination of inter- and intra-particle heat and mass transfer, so that intrinsic reaction kinetics can be obtained.
14 International Journal of Chemical Reactor Engineering Vol. 10 [2012], Article A15
Brought to you by | University of British Columbia (University of British Columbia)Authenticated | 172.16.1.226
Download Date | 4/16/12 8:11 PM
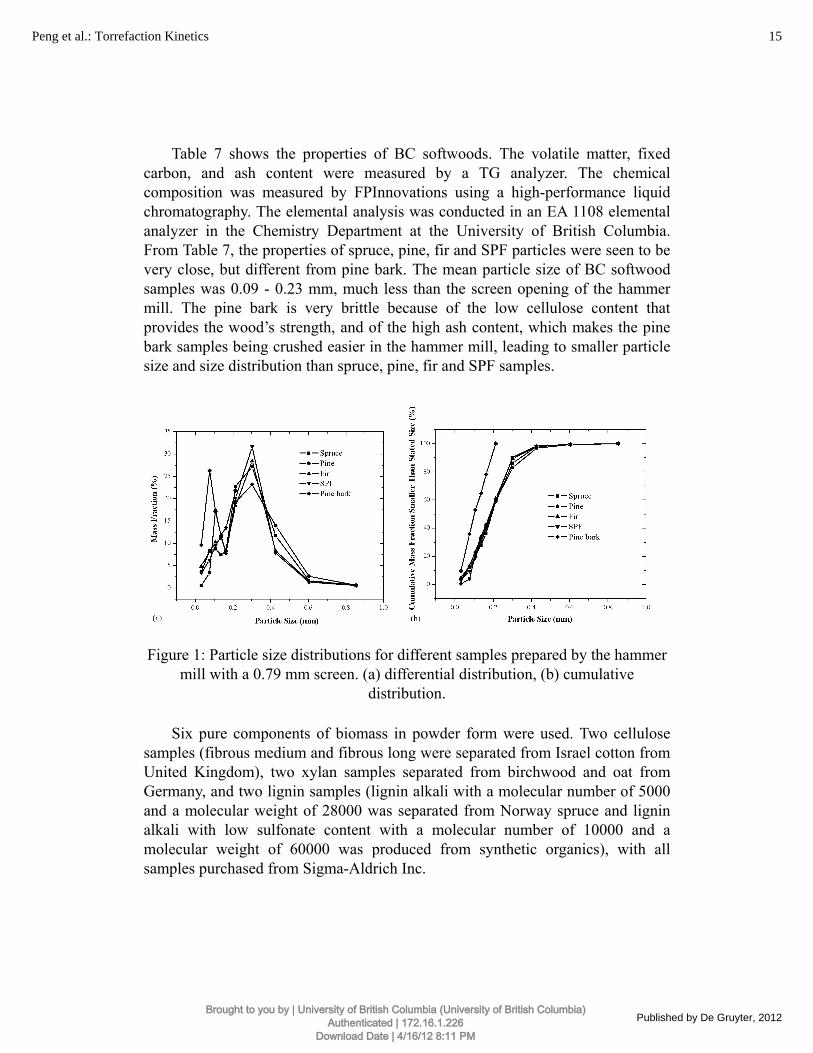
Table 7 shows the properties of BC softwoods. The volatile matter, fixed carbon, and ash content were measured by a TG analyzer. The chemical composition was measured by FPInnovations using a high-performance liquid chromatography. The elemental analysis was conducted in an EA 1108 elemental analyzer in the Chemistry Department at the University of British Columbia. From Table 7, the properties of spruce, pine, fir and SPF particles were seen to be very close, but different from pine bark. The mean particle size of BC softwood samples was 0.09 - 0.23 mm, much less than the screen opening of the hammer mill. The pine bark is very brittle because of the low cellulose content that provides the wood’s strength, and of the high ash content, which makes the pine bark samples being crushed easier in the hammer mill, leading to smaller particle size and size distribution than spruce, pine, fir and SPF samples.
Figure 1: Particle size distributions for different samples prepared by the hammer
mill with a 0.79 mm screen. (a) differential distribution, (b) cumulative distribution.
Six pure components of biomass in powder form were used. Two cellulose
samples (fibrous medium and fibrous long were separated from Israel cotton from United Kingdom), two xylan samples separated from birchwood and oat from Germany, and two lignin samples (lignin alkali with a molecular number of 5000 and a molecular weight of 28000 was separated from Norway spruce and lignin alkali with low sulfonate content with a molecular number of 10000 and a molecular weight of 60000 was produced from synthetic organics), with all samples purchased from Sigma-Aldrich Inc.
15Peng et al.: Torrefaction Kinetics
Published by De Gruyter, 2012Brought to you by | University of British Columbia (University of British Columbia)
Authenticated | 172.16.1.226Download Date | 4/16/12 8:11 PM
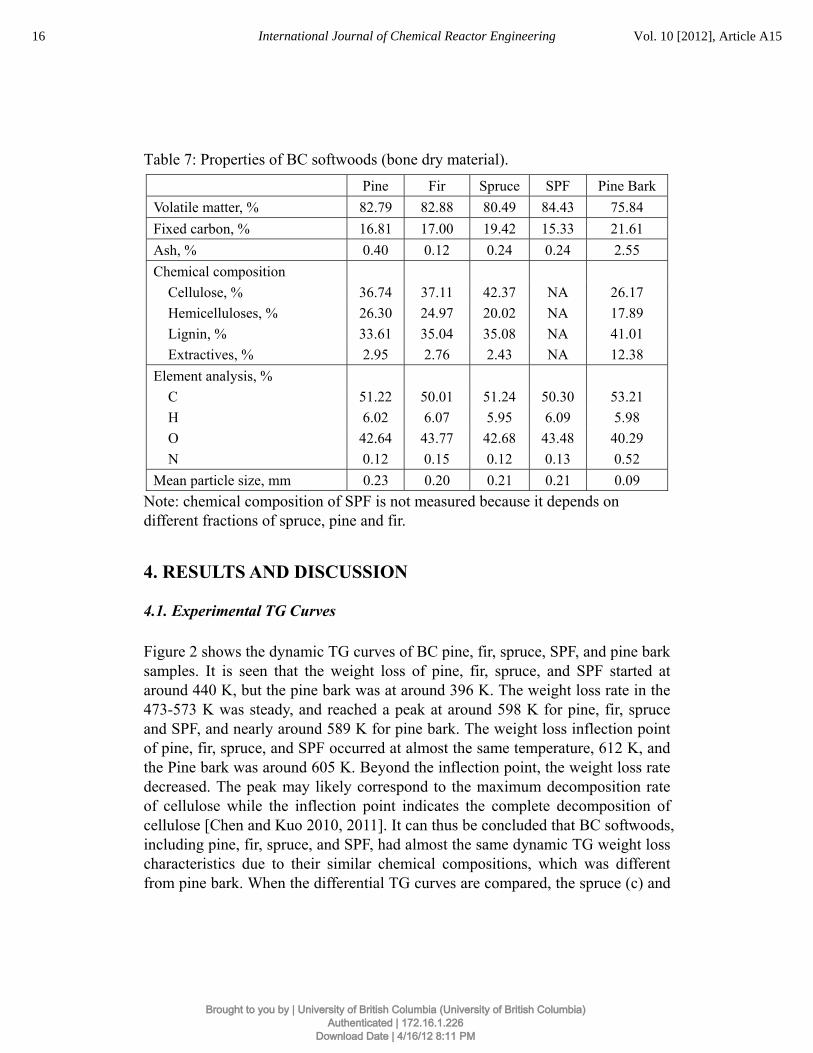
Table 7: Properties of BC softwoods (bone dry material). Pine Fir Spruce SPF Pine Bark
Volatile matter, % 82.79 82.88 80.49 84.43 75.84 Fixed carbon, % 16.81 17.00 19.42 15.33 21.61 Ash, % 0.40 0.12 0.24 0.24 2.55 Chemical composition Cellulose, % 36.74 37.11 42.37 NA 26.17 Hemicelluloses, % 26.30 24.97 20.02 NA 17.89 Lignin, % 33.61 35.04 35.08 NA 41.01 Extractives, % 2.95 2.76 2.43 NA 12.38 Element analysis, % C 51.22 50.01 51.24 50.30 53.21 H 6.02 6.07 5.95 6.09 5.98 O 42.64 43.77 42.68 43.48 40.29 N 0.12 0.15 0.12 0.13 0.52 Mean particle size, mm 0.23 0.20 0.21 0.21 0.09
Note: chemical composition of SPF is not measured because it depends on different fractions of spruce, pine and fir.
4. RESULTS AND DISCUSSION
4.1. Experimental TG Curves Figure 2 shows the dynamic TG curves of BC pine, fir, spruce, SPF, and pine bark samples. It is seen that the weight loss of pine, fir, spruce, and SPF started at around 440 K, but the pine bark was at around 396 K. The weight loss rate in the 473-573 K was steady, and reached a peak at around 598 K for pine, fir, spruce and SPF, and nearly around 589 K for pine bark. The weight loss inflection point of pine, fir, spruce, and SPF occurred at almost the same temperature, 612 K, and the Pine bark was around 605 K. Beyond the inflection point, the weight loss rate decreased. The peak may likely correspond to the maximum decomposition rate of cellulose while the inflection point indicates the complete decomposition of cellulose [Chen and Kuo 2010, 2011]. It can thus be concluded that BC softwoods, including pine, fir, spruce, and SPF, had almost the same dynamic TG weight loss characteristics due to their similar chemical compositions, which was different from pine bark. When the differential TG curves are compared, the spruce (c) and
16 International Journal of Chemical Reactor Engineering Vol. 10 [2012], Article A15
Brought to you by | University of British Columbia (University of British Columbia)Authenticated | 172.16.1.226
Download Date | 4/16/12 8:11 PM
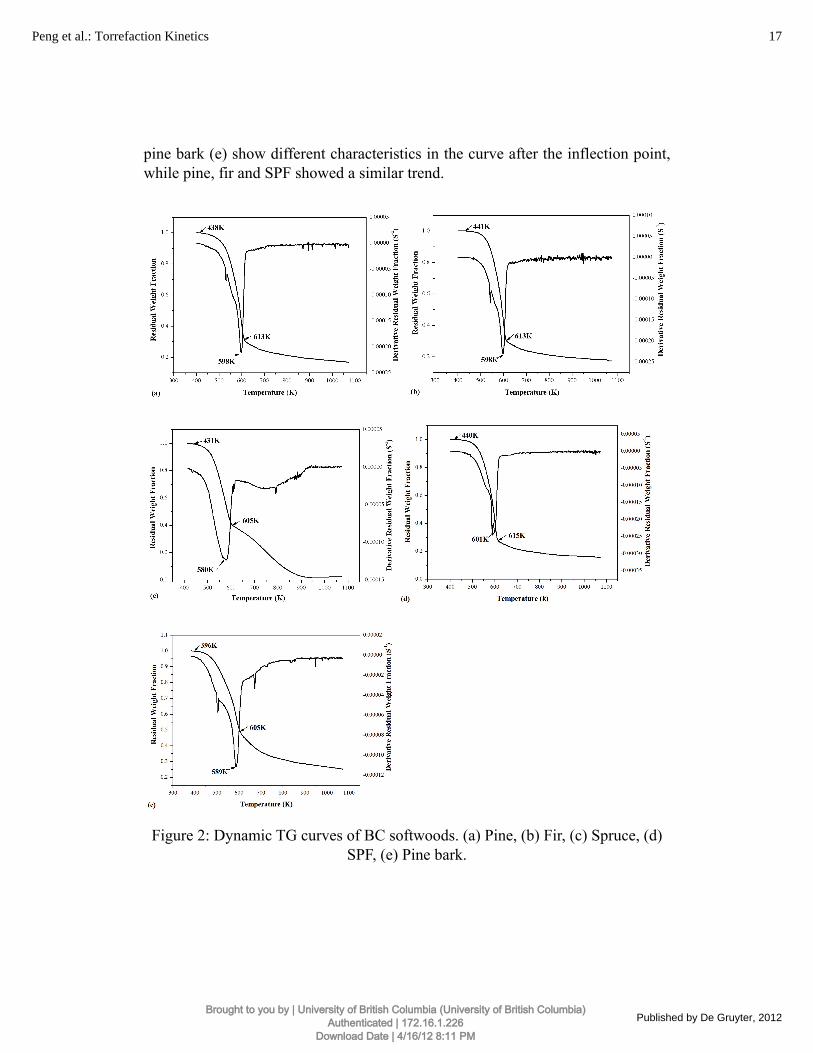
pine bark (e) show different characteristics in the curve after the inflection point, while pine, fir and SPF showed a similar trend.
Figure 2: Dynamic TG curves of BC softwoods. (a) Pine, (b) Fir, (c) Spruce, (d)
SPF, (e) Pine bark.
17Peng et al.: Torrefaction Kinetics
Published by De Gruyter, 2012Brought to you by | University of British Columbia (University of British Columbia)
Authenticated | 172.16.1.226Download Date | 4/16/12 8:11 PM
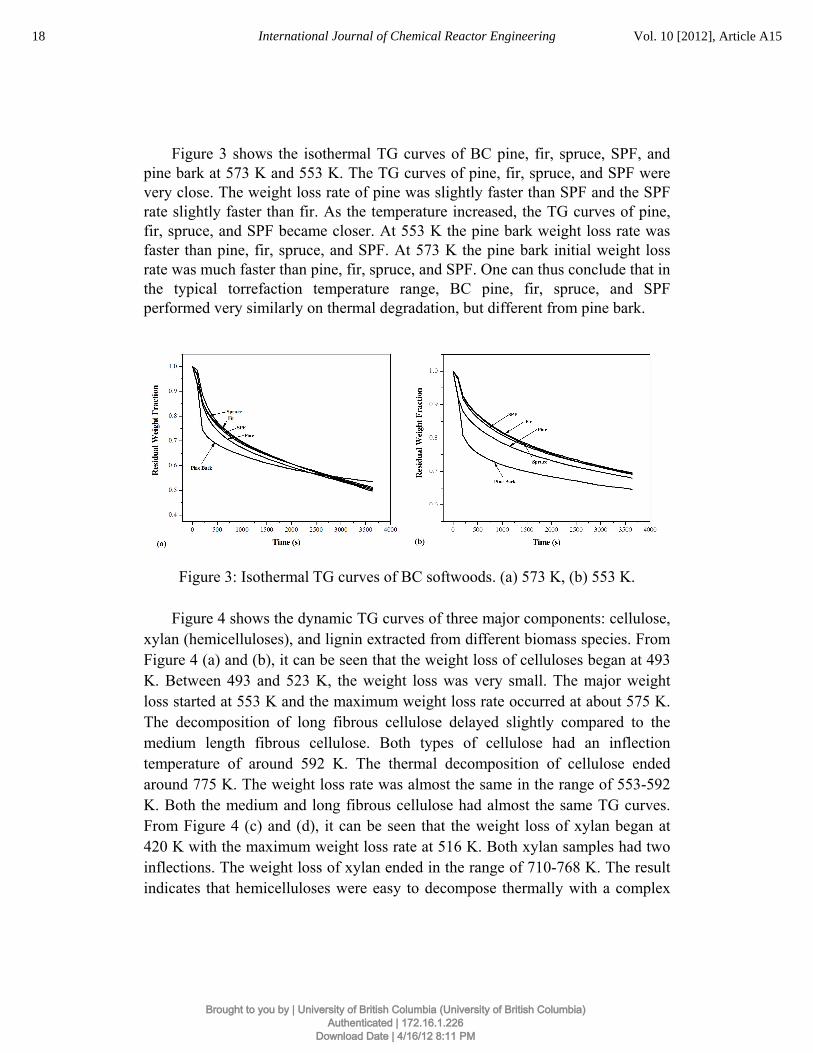
Figure 3 shows the isothermal TG curves of BC pine, fir, spruce, SPF, and pine bark at 573 K and 553 K. The TG curves of pine, fir, spruce, and SPF were very close. The weight loss rate of pine was slightly faster than SPF and the SPF rate slightly faster than fir. As the temperature increased, the TG curves of pine, fir, spruce, and SPF became closer. At 553 K the pine bark weight loss rate was faster than pine, fir, spruce, and SPF. At 573 K the pine bark initial weight loss rate was much faster than pine, fir, spruce, and SPF. One can thus conclude that in the typical torrefaction temperature range, BC pine, fir, spruce, and SPF performed very similarly on thermal degradation, but different from pine bark.
Figure 3: Isothermal TG curves of BC softwoods. (a) 573 K, (b) 553 K.
Figure 4 shows the dynamic TG curves of three major components: cellulose,
xylan (hemicelluloses), and lignin extracted from different biomass species. From Figure 4 (a) and (b), it can be seen that the weight loss of celluloses began at 493 K. Between 493 and 523 K, the weight loss was very small. The major weight loss started at 553 K and the maximum weight loss rate occurred at about 575 K. The decomposition of long fibrous cellulose delayed slightly compared to the medium length fibrous cellulose. Both types of cellulose had an inflection temperature of around 592 K. The thermal decomposition of cellulose ended around 775 K. The weight loss rate was almost the same in the range of 553-592 K. Both the medium and long fibrous cellulose had almost the same TG curves. From Figure 4 (c) and (d), it can be seen that the weight loss of xylan began at 420 K with the maximum weight loss rate at 516 K. Both xylan samples had two inflections. The weight loss of xylan ended in the range of 710-768 K. The result indicates that hemicelluloses were easy to decompose thermally with a complex
18 International Journal of Chemical Reactor Engineering Vol. 10 [2012], Article A15
Brought to you by | University of British Columbia (University of British Columbia)Authenticated | 172.16.1.226
Download Date | 4/16/12 8:11 PM
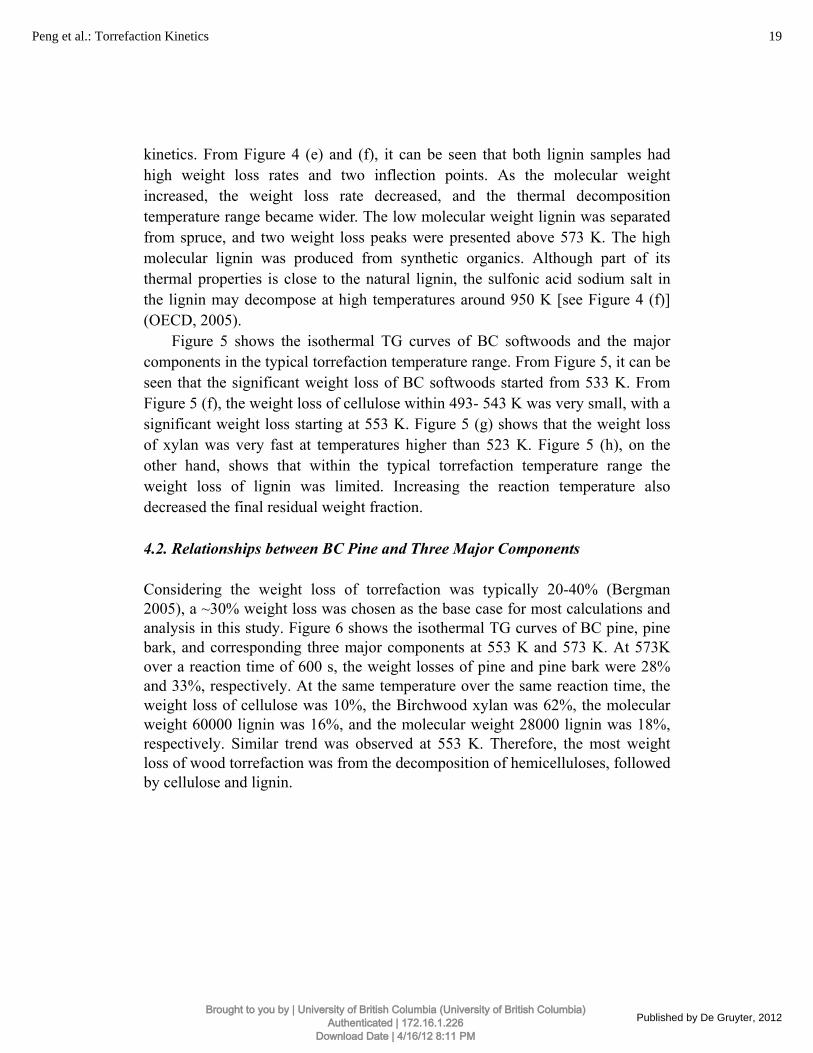
kinetics. From Figure 4 (e) and (f), it can be seen that both lignin samples had high weight loss rates and two inflection points. As the molecular weight increased, the weight loss rate decreased, and the thermal decomposition temperature range became wider. The low molecular weight lignin was separated from spruce, and two weight loss peaks were presented above 573 K. The high molecular lignin was produced from synthetic organics. Although part of its thermal properties is close to the natural lignin, the sulfonic acid sodium salt in the lignin may decompose at high temperatures around 950 K [see Figure 4 (f)] (OECD, 2005).
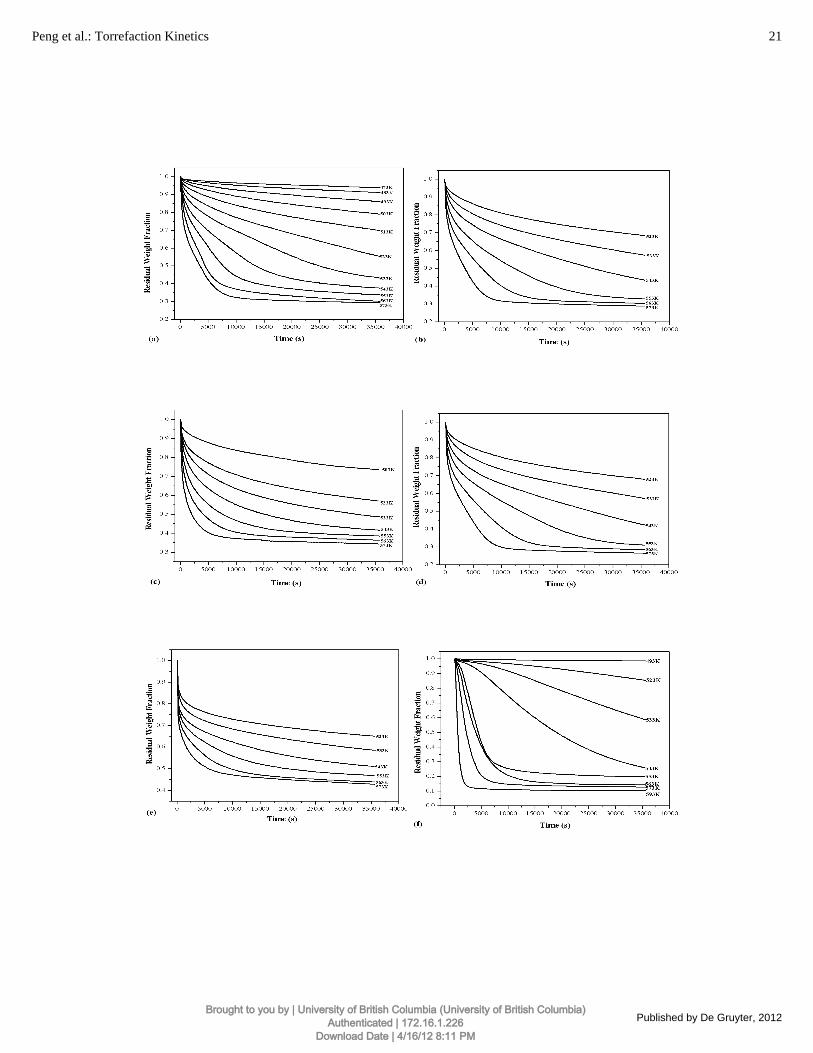
Figure 5 shows the isothermal TG curves of BC softwoods and the major components in the typical torrefaction temperature range. From Figure 5, it can be seen that the significant weight loss of BC softwoods started from 533 K. From Figure 5 (f), the weight loss of cellulose within 493- 543 K was very small, with a significant weight loss starting at 553 K. Figure 5 (g) shows that the weight loss of xylan was very fast at temperatures higher than 523 K. Figure 5 (h), on the other hand, shows that within the typical torrefaction temperature range the weight loss of lignin was limited. Increasing the reaction temperature also decreased the final residual weight fraction. 4.2. Relationships between BC Pine and Three Major Components Considering the weight loss of torrefaction was typically 20-40% (Bergman 2005), a ~30% weight loss was chosen as the base case for most calculations and analysis in this study. Figure 6 shows the isothermal TG curves of BC pine, pine bark, and corresponding three major components at 553 K and 573 K. At 573K over a reaction time of 600 s, the weight losses of pine and pine bark were 28% and 33%, respectively. At the same temperature over the same reaction time, the weight loss of cellulose was 10%, the Birchwood xylan was 62%, the molecular weight 60000 lignin was 16%, and the molecular weight 28000 lignin was 18%, respectively. Similar trend was observed at 553 K. Therefore, the most weight loss of wood torrefaction was from the decomposition of hemicelluloses, followed by cellulose and lignin.
19Peng et al.: Torrefaction Kinetics
Published by De Gruyter, 2012Brought to you by | University of British Columbia (University of British Columbia)
Authenticated | 172.16.1.226Download Date | 4/16/12 8:11 PM
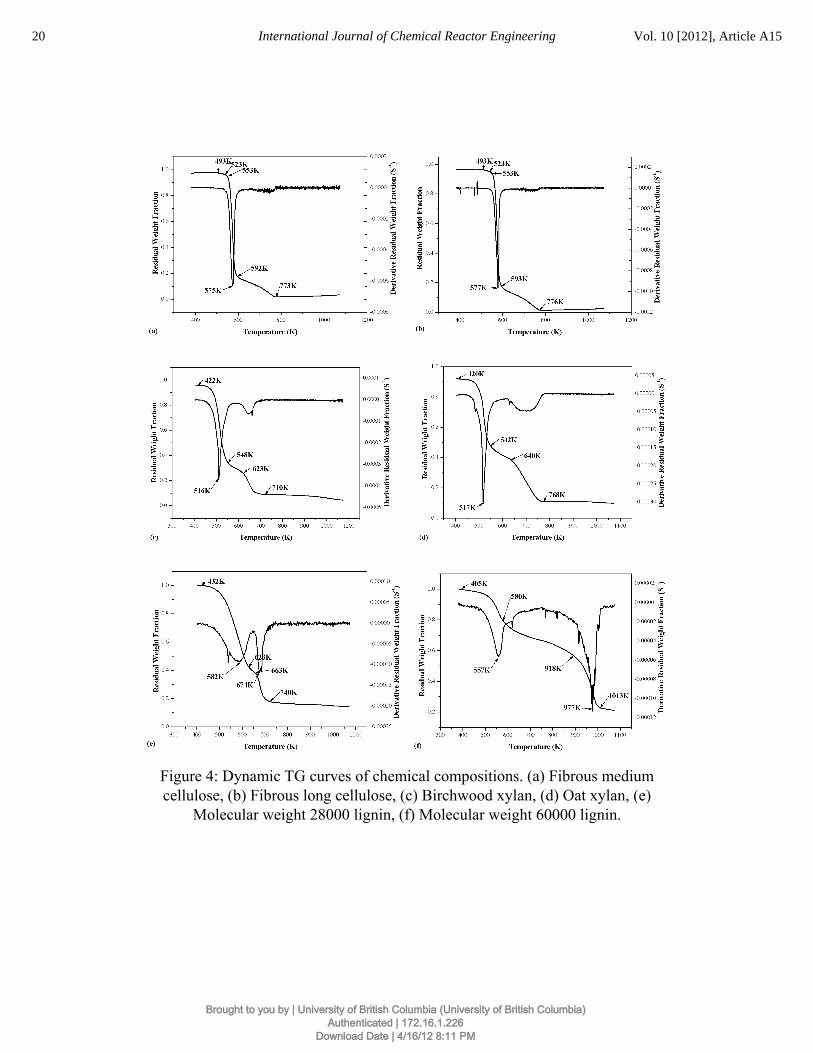
Figure 4: Dynamic TG curves of chemical compositions. (a) Fibrous medium cellulose, (b) Fibrous long cellulose, (c) Birchwood xylan, (d) Oat xylan, (e)
Molecular weight 28000 lignin, (f) Molecular weight 60000 lignin.
20 International Journal of Chemical Reactor Engineering Vol. 10 [2012], Article A15
Brought to you by | University of British Columbia (University of British Columbia)Authenticated | 172.16.1.226
Download Date | 4/16/12 8:11 PM
21Peng et al.: Torrefaction Kinetics
Published by De Gruyter, 2012Brought to you by | University of British Columbia (University of British Columbia)
Authenticated | 172.16.1.226Download Date | 4/16/12 8:11 PM
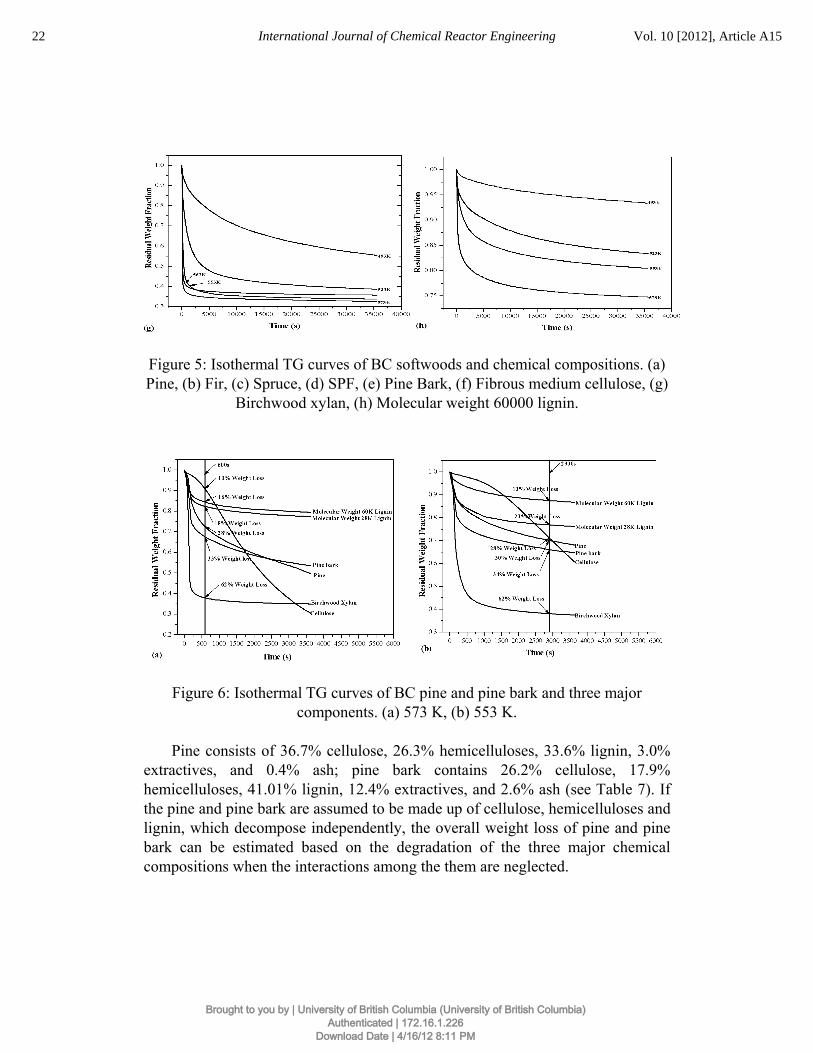
Figure 5: Isothermal TG curves of BC softwoods and chemical compositions. (a) Pine, (b) Fir, (c) Spruce, (d) SPF, (e) Pine Bark, (f) Fibrous medium cellulose, (g)
Birchwood xylan, (h) Molecular weight 60000 lignin.
Figure 6: Isothermal TG curves of BC pine and pine bark and three major
components. (a) 573 K, (b) 553 K.
Pine consists of 36.7% cellulose, 26.3% hemicelluloses, 33.6% lignin, 3.0% extractives, and 0.4% ash; pine bark contains 26.2% cellulose, 17.9% hemicelluloses, 41.01% lignin, 12.4% extractives, and 2.6% ash (see Table 7). If the pine and pine bark are assumed to be made up of cellulose, hemicelluloses and lignin, which decompose independently, the overall weight loss of pine and pine bark can be estimated based on the degradation of the three major chemical compositions when the interactions among the them are neglected.
22 International Journal of Chemical Reactor Engineering Vol. 10 [2012], Article A15
Brought to you by | University of British Columbia (University of British Columbia)Authenticated | 172.16.1.226
Download Date | 4/16/12 8:11 PM
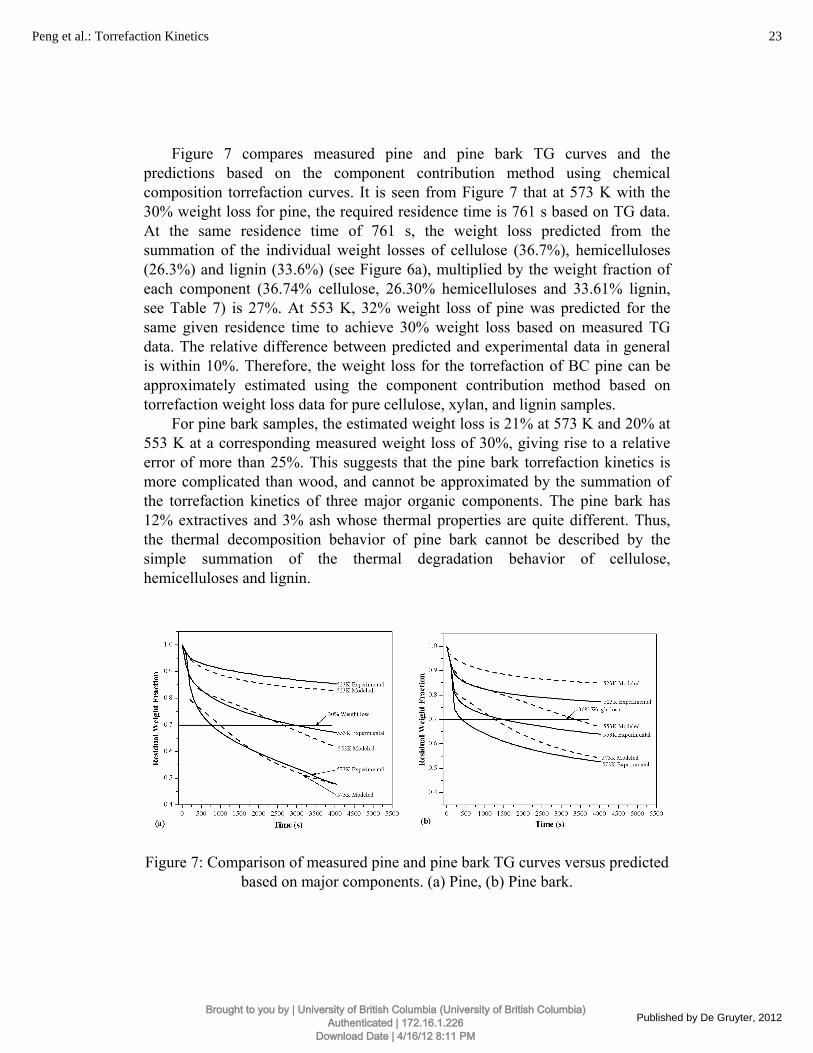
Figure 7 compares measured pine and pine bark TG curves and the predictions based on the component contribution method using chemical composition torrefaction curves. It is seen from Figure 7 that at 573 K with the 30% weight loss for pine, the required residence time is 761 s based on TG data. At the same residence time of 761 s, the weight loss predicted from the summation of the individual weight losses of cellulose (36.7%), hemicelluloses (26.3%) and lignin (33.6%) (see Figure 6a), multiplied by the weight fraction of each component (36.74% cellulose, 26.30% hemicelluloses and 33.61% lignin, see Table 7) is 27%. At 553 K, 32% weight loss of pine was predicted for the same given residence time to achieve 30% weight loss based on measured TG data. The relative difference between predicted and experimental data in general is within 10%. Therefore, the weight loss for the torrefaction of BC pine can be approximately estimated using the component contribution method based on torrefaction weight loss data for pure cellulose, xylan, and lignin samples.
For pine bark samples, the estimated weight loss is 21% at 573 K and 20% at 553 K at a corresponding measured weight loss of 30%, giving rise to a relative error of more than 25%. This suggests that the pine bark torrefaction kinetics is more complicated than wood, and cannot be approximated by the summation of the torrefaction kinetics of three major organic components. The pine bark has 12% extractives and 3% ash whose thermal properties are quite different. Thus, the thermal decomposition behavior of pine bark cannot be described by the simple summation of the thermal degradation behavior of cellulose, hemicelluloses and lignin.
Figure 7: Comparison of measured pine and pine bark TG curves versus predicted
based on major components. (a) Pine, (b) Pine bark.
23Peng et al.: Torrefaction Kinetics
Published by De Gruyter, 2012Brought to you by | University of British Columbia (University of British Columbia)
Authenticated | 172.16.1.226Download Date | 4/16/12 8:11 PM
4.3. A Kinetic Model for BC softwood Torrefaction over Long Residence Time Due to the complex compositions and structures of wood, and their associated transport properties, it is difficult to derive a widely acceptable thermal chemical conversion kinetic model for wood, even for compositions of wood, over a wide pyrolysis temperature range. Another difficulty is the mathematical method, including mathematical models and initial and boundary conditions, which also play an important role in the kinetic study. For torrefaction in a narrow and mild temperature range of 473-573K with low particle heating rate and long residence time, most residual weight fraction loss curves in Figure 5 seem to follow an exponential decay model, with different final residual weight fractions. Therefore, a simple one-step kinetic model may approximately describe the torrefaction of BC softwood.
The overall reaction equations for the one-step kinetic model with nth order torrefaction reaction can be written as:
nkdtd )1( αα −= (4)
)exp(RTEAk −= (5)
final
finalTGA
WWW
−
−=
1α (6)
If the overall torrefaction reaction is assumed to be first order, the residual
weight fraction (WTGA) can be expressed as:
])exp(exp[)1( tRTEAWWW finalfinalTGA −−×−+= (7)
The final residual weight fraction (Wfinal) can be obtained from the TG data if
the residence time is long enough. At 573 K, 563 K and 553 K over 10 hours, the residual weight fraction of pine, fir, spruce and SPF may approximately represent the final residual weight fraction. But at the low temperatures, a residence time of a few days may be required to reach the final residual weight fraction (Rousset et al., 2006). Therefore, the final residual weight fraction may be better obtained by directly fitting the TG experimental curve with the exponential decay model. In the current study, measured final residual weight was obtained for those
24 International Journal of Chemical Reactor Engineering Vol. 10 [2012], Article A15
Brought to you by | University of British Columbia (University of British Columbia)Authenticated | 172.16.1.226
Download Date | 4/16/12 8:11 PM
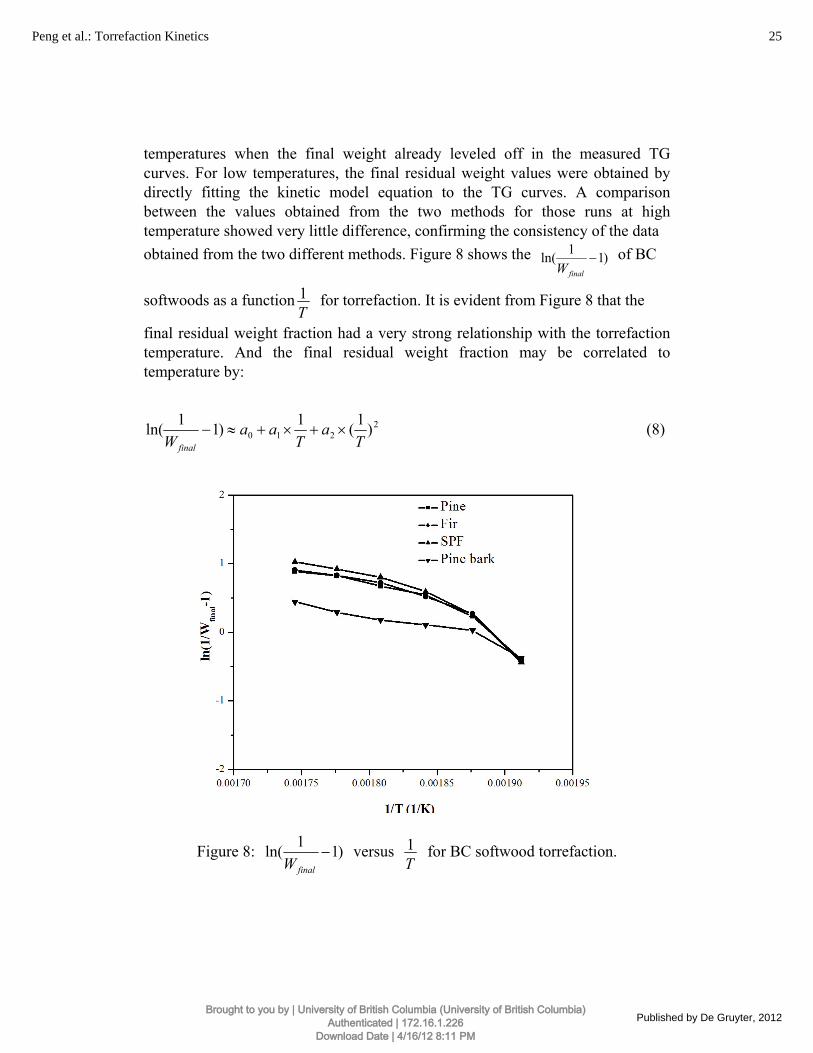
temperatures when the final weight already leveled off in the measured TG curves. For low temperatures, the final residual weight values were obtained by directly fitting the kinetic model equation to the TG curves. A comparison between the values obtained from the two methods for those runs at high temperature showed very little difference, confirming the consistency of the data obtained from the two different methods. Figure 8 shows the )11ln( −
finalW of BC
softwoods as a functionT1 for torrefaction. It is evident from Figure 8 that the
final residual weight fraction had a very strong relationship with the torrefaction temperature. And the final residual weight fraction may be correlated to temperature by:
2210 )1(1)11ln(
Ta
Taa
W final
×+×+≈− (8)
Figure 8: )11ln( −finalW
versus T1 for BC softwood torrefaction.
25Peng et al.: Torrefaction Kinetics
Published by De Gruyter, 2012Brought to you by | University of British Columbia (University of British Columbia)
Authenticated | 172.16.1.226Download Date | 4/16/12 8:11 PM
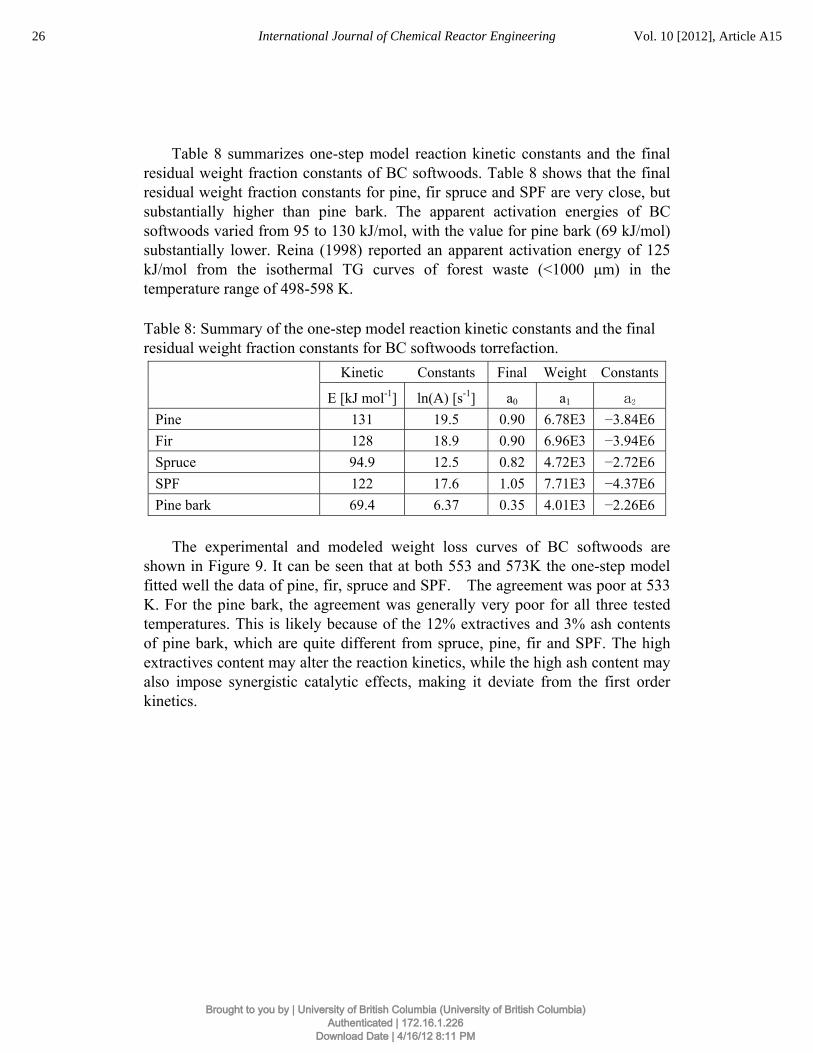
Table 8 summarizes one-step model reaction kinetic constants and the final residual weight fraction constants of BC softwoods. Table 8 shows that the final residual weight fraction constants for pine, fir spruce and SPF are very close, but substantially higher than pine bark. The apparent activation energies of BC softwoods varied from 95 to 130 kJ/mol, with the value for pine bark (69 kJ/mol) substantially lower. Reina (1998) reported an apparent activation energy of 125 kJ/mol from the isothermal TG curves of forest waste (<1000 μm) in the temperature range of 498-598 K.
Table 8: Summary of the one-step model reaction kinetic constants and the final residual weight fraction constants for BC softwoods torrefaction.
Kinetic Constants Final Weight Constants
E [kJ mol-1] ln(A) [s-1] a0 a1 a2
Pine 131 19.5 0.90 6.78E3 −3.84E6 Fir 128 18.9 0.90 6.96E3 −3.94E6 Spruce 94.9 12.5 0.82 4.72E3 −2.72E6 SPF 122 17.6 1.05 7.71E3 −4.37E6 Pine bark 69.4 6.37 0.35 4.01E3 −2.26E6
The experimental and modeled weight loss curves of BC softwoods are
shown in Figure 9. It can be seen that at both 553 and 573K the one-step model fitted well the data of pine, fir, spruce and SPF. The agreement was poor at 533 K. For the pine bark, the agreement was generally very poor for all three tested temperatures. This is likely because of the 12% extractives and 3% ash contents of pine bark, which are quite different from spruce, pine, fir and SPF. The high extractives content may alter the reaction kinetics, while the high ash content may also impose synergistic catalytic effects, making it deviate from the first order kinetics.
26 International Journal of Chemical Reactor Engineering Vol. 10 [2012], Article A15
Brought to you by | University of British Columbia (University of British Columbia)Authenticated | 172.16.1.226
Download Date | 4/16/12 8:11 PM
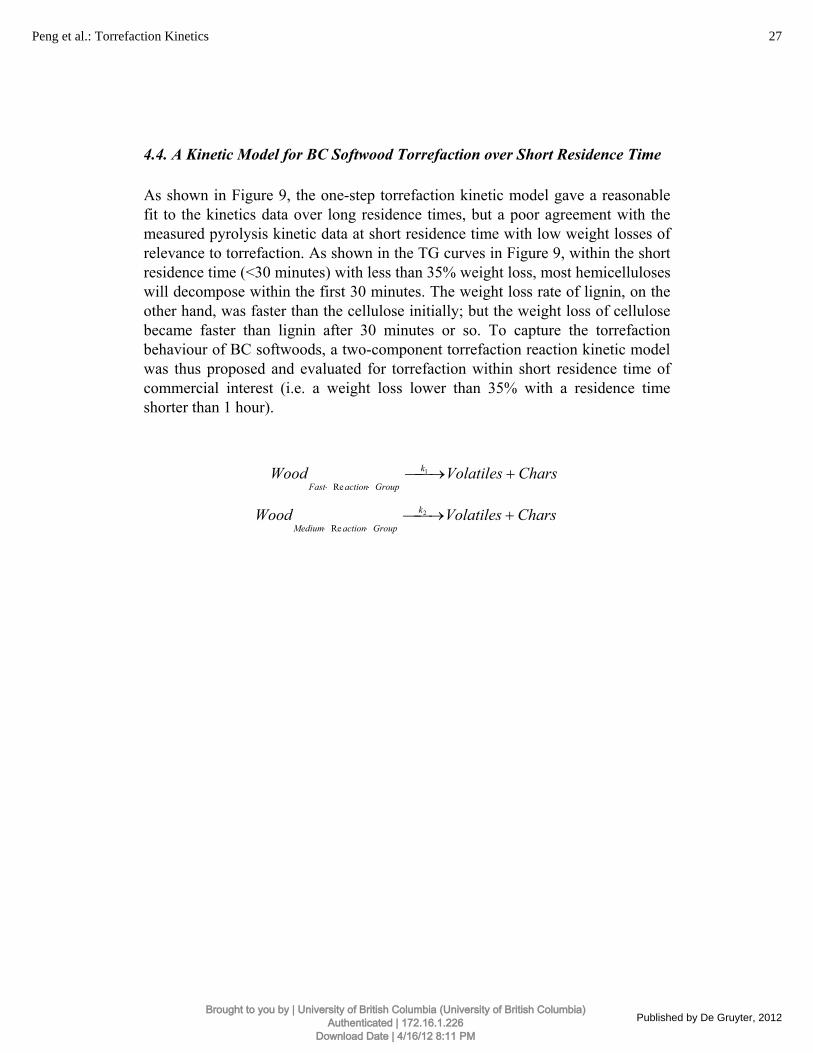
4.4. A Kinetic Model for BC Softwood Torrefaction over Short Residence Time As shown in Figure 9, the one-step torrefaction kinetic model gave a reasonable fit to the kinetics data over long residence times, but a poor agreement with the measured pyrolysis kinetic data at short residence time with low weight losses of relevance to torrefaction. As shown in the TG curves in Figure 9, within the short residence time (<30 minutes) with less than 35% weight loss, most hemicelluloses will decompose within the first 30 minutes. The weight loss rate of lignin, on the other hand, was faster than the cellulose initially; but the weight loss of cellulose became faster than lignin after 30 minutes or so. To capture the torrefaction behaviour of BC softwoods, a two-component torrefaction reaction kinetic model was thus proposed and evaluated for torrefaction within short residence time of commercial interest (i.e. a weight loss lower than 35% with a residence time shorter than 1 hour).
CharsVolatilesWood k
GroupactionFast+⎯→⎯
⋅⋅
1
Re
CharsVolatilesWood k
GroupactionMedium+⎯→⎯
⋅⋅
2
Re
27Peng et al.: Torrefaction Kinetics
Published by De Gruyter, 2012Brought to you by | University of British Columbia (University of British Columbia)
Authenticated | 172.16.1.226Download Date | 4/16/12 8:11 PM
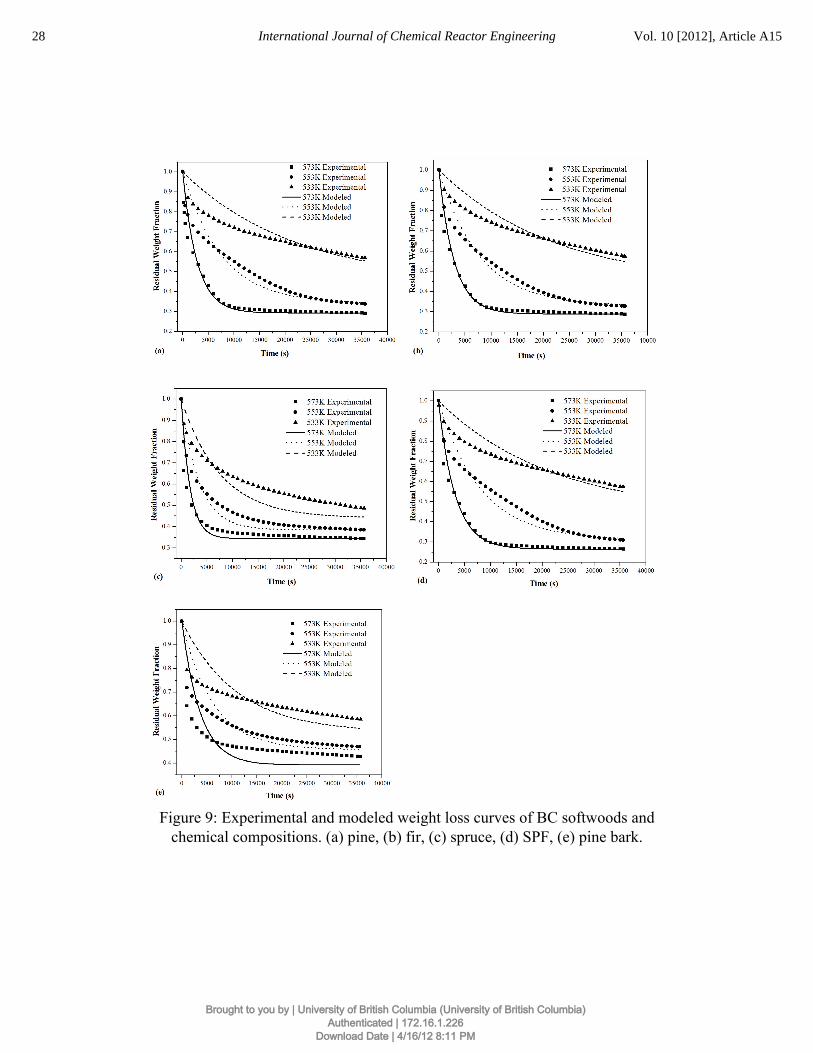
Figure 9: Experimental and modeled weight loss curves of BC softwoods and
chemical compositions. (a) pine, (b) fir, (c) spruce, (d) SPF, (e) pine bark.
28 International Journal of Chemical Reactor Engineering Vol. 10 [2012], Article A15
Brought to you by | University of British Columbia (University of British Columbia)Authenticated | 172.16.1.226
Download Date | 4/16/12 8:11 PM
For two reaction groups, the conversion (reacted fraction) α1, α2 and the
reaction rate, tα∂∂ 1 and
tα∂∂ 2 , are defined. The overall reaction rates are a simple
linear combination of these partial reactions without synergistic interaction:
)( 22
11 t
αCtαC
twcalc
∂∂
+∂∂
−=∂
∂ (9)
1
1
)1( 111 nRT
E
αeAtα
−=∂∂ −
(10)
2
2
)1( 222 nRT
E
αeAtα
−=∂∂ −
(11)
If the two overall reactions are assumed to be first order reactions, the
residual weight fraction (WTGA) of softwood samples is given by:
)exp()exp()1(21
221121 teACteACCCW RTE
RTE
TGA
−−−×+−×+−−= (12)
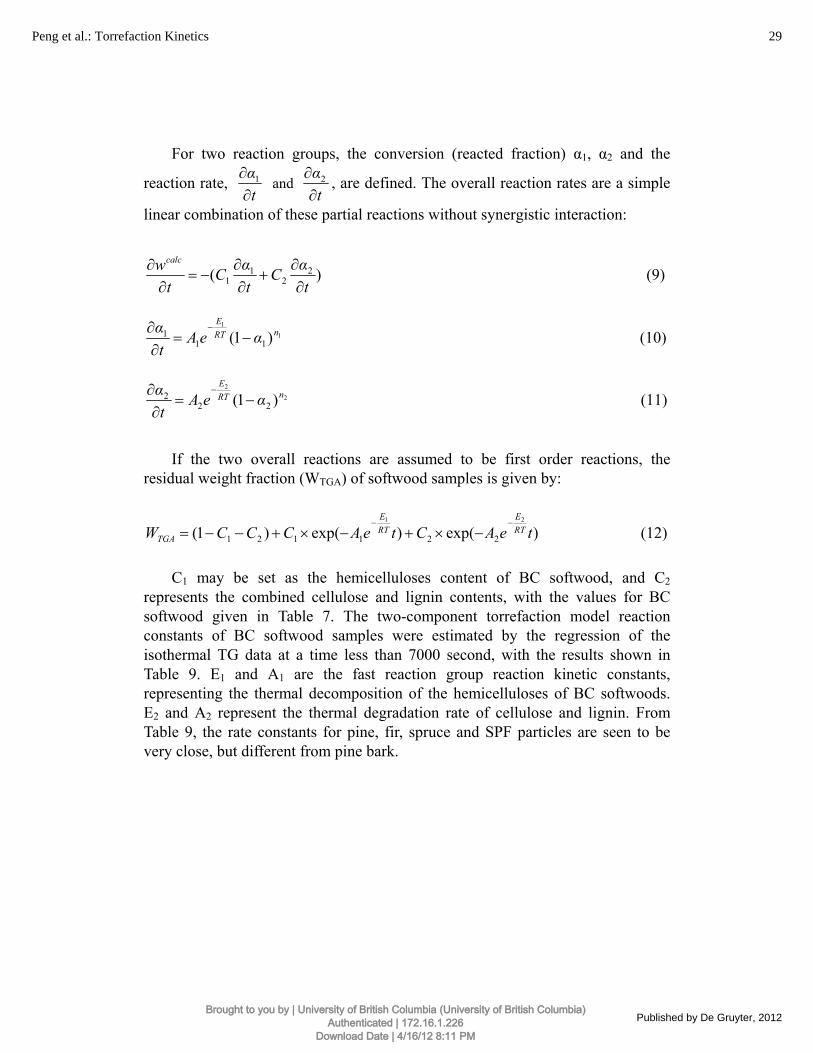
C1 may be set as the hemicelluloses content of BC softwood, and C2
represents the combined cellulose and lignin contents, with the values for BC softwood given in Table 7. The two-component torrefaction model reaction constants of BC softwood samples were estimated by the regression of the isothermal TG data at a time less than 7000 second, with the results shown in Table 9. E1 and A1 are the fast reaction group reaction kinetic constants, representing the thermal decomposition of the hemicelluloses of BC softwoods. E2 and A2 represent the thermal degradation rate of cellulose and lignin. From Table 9, the rate constants for pine, fir, spruce and SPF particles are seen to be very close, but different from pine bark.
29Peng et al.: Torrefaction Kinetics
Published by De Gruyter, 2012Brought to you by | University of British Columbia (University of British Columbia)
Authenticated | 172.16.1.226Download Date | 4/16/12 8:11 PM
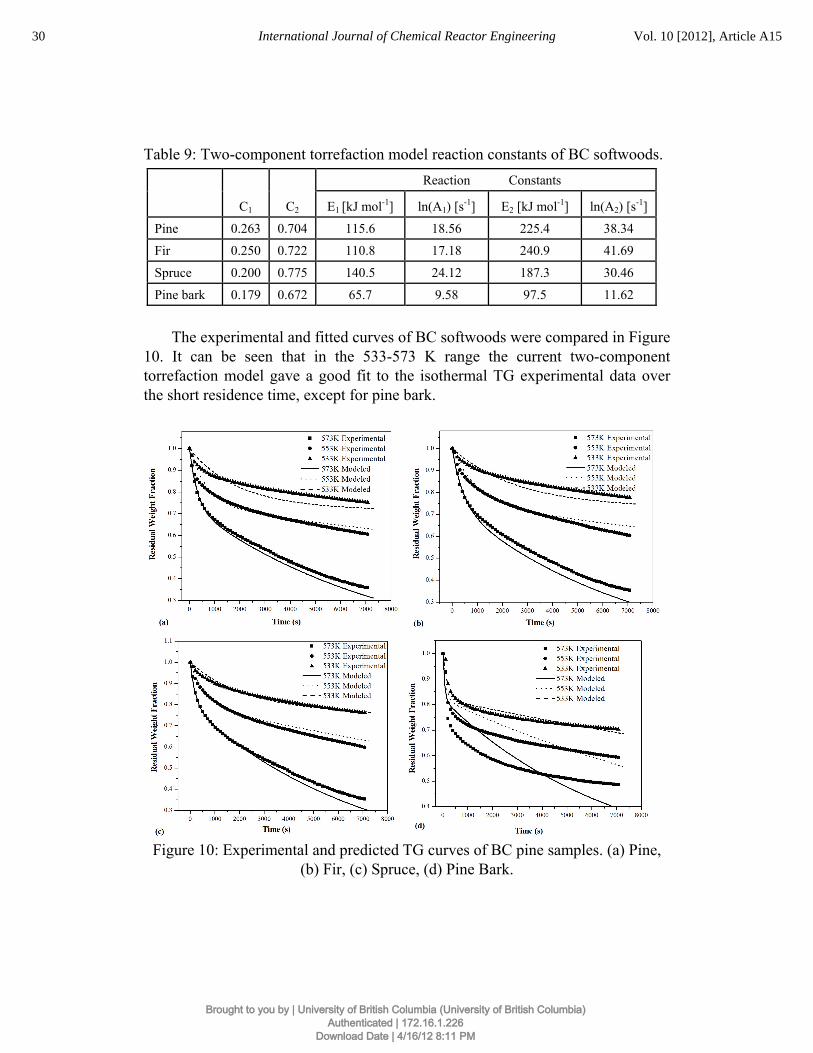
Table 9: Two-component torrefaction model reaction constants of BC softwoods. Reaction Constants
C1 C2 E1 [kJ mol-1] ln(A1) [s-1] E2 [kJ mol-1] ln(A2) [s-1]
Pine 0.263 0.704 115.6 18.56 225.4 38.34
Fir 0.250 0.722 110.8 17.18 240.9 41.69
Spruce 0.200 0.775 140.5 24.12 187.3 30.46
Pine bark 0.179 0.672 65.7 9.58 97.5 11.62
The experimental and fitted curves of BC softwoods were compared in Figure
10. It can be seen that in the 533-573 K range the current two-component torrefaction model gave a good fit to the isothermal TG experimental data over the short residence time, except for pine bark.
Figure 10: Experimental and predicted TG curves of BC pine samples. (a) Pine,
(b) Fir, (c) Spruce, (d) Pine Bark.
30 International Journal of Chemical Reactor Engineering Vol. 10 [2012], Article A15
Brought to you by | University of British Columbia (University of British Columbia)Authenticated | 172.16.1.226
Download Date | 4/16/12 8:11 PM
The thermal and chemical properties of pine bark are quite different from pine because of the 12% extractives and 3% ash contents. Thus, the pine bark torrefaction model with fixed C1 and C2 values based on hemicelluloses, cellulose and lignin many not be able to capture its complicated torrefaction behaviour. 4.5. Comparison of TG Kinetic Data with Fixed Bed Data One of the concerns for determining reaction kinetics using micrograms samples in a TG analyzer is its applicability for the prediction of torrefaction performance in large scale reactors. To confirm the applicability of the TG kinetics for the design of fixed bed and fluidized bed torrefaction reactors, experiments have also been carried in a fixed bed tubular reactor. The reactor has a 27.0 mm inside diameter and 575 mm in length made from stainless steel. The reactor is located inside an electrically heated furnace with a reaction zone of 102 mm in length. In the unit, the sample was heated up by both the preheated hot nitrogen flow and the electrical furnace. The hot nitrogen flows into the reactor from the top to the bottom, at a flow rate of 0.5 liter per minute. The temperature of the reactor zone was controlled by the electric power via a temperature controller. For each torrefaction run, 20-40 g samples were used. Detailed results on torrefaction in this fixed bed reactor will be reported in the future.
Same biomass samples prepared in the same batch for the TG tests were torrefied in the fixed bed reactor. The weight loss results from the fixed bed reactor are given in Table 10, together with the results from TG tests. It is seen that the weight loss data between TG analyzer and fixed bed tests are generally agree within 90%, except for the spruce sample which shows 20% lower weight loss from the fixed bed reactor than from the TG tests. These encouraging results give us the confidence in applying those kinetic equations for the modeling and design of torrefaction reactors in the future.
5. CONCLUSIONS
For the pine sample, the weight loss within the typical operating range of torrefaction can be reasonably predicted by the component contribution method based on the cellulose, hemicelluloses, and lignin fractions and their corresponding torrefaction kinetics, with less than 10% errors. However, such a component contribution method substantially underestimated the weight loss for the torrefaction of pine bark samples. The simple one-step kinetic model with the first order reaction can predict reasonably well the reaction kinetic data obtained
31Peng et al.: Torrefaction Kinetics
Published by De Gruyter, 2012Brought to you by | University of British Columbia (University of British Columbia)
Authenticated | 172.16.1.226Download Date | 4/16/12 8:11 PM
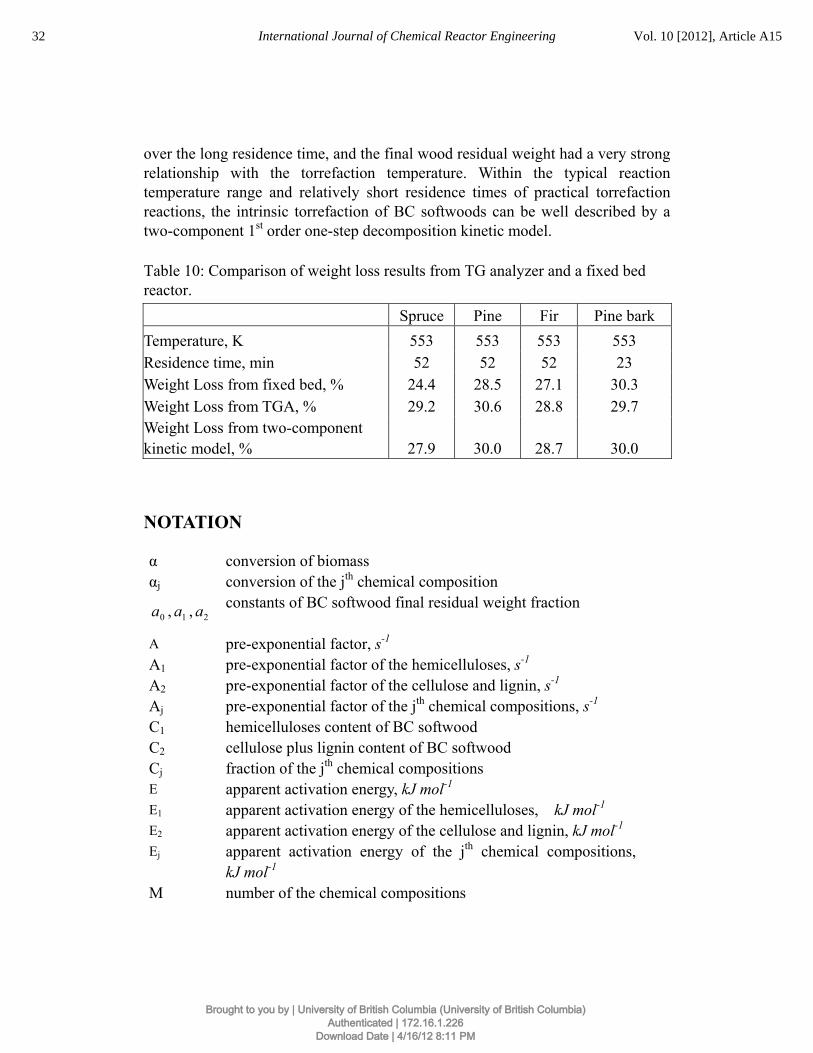
over the long residence time, and the final wood residual weight had a very strong relationship with the torrefaction temperature. Within the typical reaction temperature range and relatively short residence times of practical torrefaction reactions, the intrinsic torrefaction of BC softwoods can be well described by a two-component 1st order one-step decomposition kinetic model. Table 10: Comparison of weight loss results from TG analyzer and a fixed bed reactor. Spruce Pine Fir Pine bark Temperature, K 553 553 553 553 Residence time, min 52 52 52 23 Weight Loss from fixed bed, % 24.4 28.5 27.1 30.3 Weight Loss from TGA, % 29.2 30.6 28.8 29.7 Weight Loss from two-component kinetic model, % 27.9 30.0 28.7 30.0
NOTATION
α conversion of biomass αj conversion of the jth chemical composition
0a , 1a , 2a constants of BC softwood final residual weight fraction
A pre-exponential factor, s-1 A1 pre-exponential factor of the hemicelluloses, s-1 A2 pre-exponential factor of the cellulose and lignin, s-1 Aj pre-exponential factor of the jth chemical compositions, s-1 C1 hemicelluloses content of BC softwood C2 cellulose plus lignin content of BC softwood Cj fraction of the jth chemical compositions E apparent activation energy, kJ mol-1 E1 apparent activation energy of the hemicelluloses, kJ mol-1 E2 apparent activation energy of the cellulose and lignin, kJ mol-1 Ej apparent activation energy of the jth chemical compositions,
kJ mol-1 M number of the chemical compositions
32 International Journal of Chemical Reactor Engineering Vol. 10 [2012], Article A15
Brought to you by | University of British Columbia (University of British Columbia)Authenticated | 172.16.1.226
Download Date | 4/16/12 8:11 PM
n reaction order nj reaction order of the jth chemical compositions k global reaction rate, s-1 k1 global reaction rate of the fast reaction group, s-1 k2 global reaction rate of the medium reaction group, s-1 kC chars reaction rate kL tars reaction rate kG gases reaction rate R ideal gas constant, J mol-1 K-1 t reaction time, s T reaction temperature, K TGA thermogravimetric analyzer vC char ratio wcalc calculated overall weight loss Wfinal Fractional ratio of final residual weight over initial sample
weight WTGA Fractional ratio of residual weight over initial sample weight
REFERENCES
Akita, K., Kase, M., “Determination of kinetics parameters for pyrolysis of cellulose and cellulose treated with ammonium phosphate by differential thermal analysis and thermal gravimetric analysis”, Journal of Applied Polymer Science, 5(part A-1), 833-848 (1967).
Avat, F., “Contribution a letude des traitements thermiques du bois (200-300ºC): transformations chimiques et caracterisations physico-chimiques,” Saint-Etienne, Ecole nationale Superieure des Mines de Saint-Etienne, 237(1993).
Bergman, P. C. A., “Combined torrefaction and pelletisation the TOP process,” Energy Research Centre of the Netherlands report, ECN-C--05-073 (2005).
Bergman, P. C. A., Kiel, J. H. A., “Torrefaction for biomass upgrading,” Energy Research Centre of the Netherlands report, ECN-RX--05-180 (2005).
Bilbao, R., Millera, A., Arauzo, J., “Kinetics of weight loss by thermal decomposition of xylan and lignin. Influence of experimental conditions,” Thermochimica Acta, 143, 137-148 (1989).
33Peng et al.: Torrefaction Kinetics
Published by De Gruyter, 2012Brought to you by | University of British Columbia (University of British Columbia)
Authenticated | 172.16.1.226Download Date | 4/16/12 8:11 PM
Blasi, C. D., “Modeling chemical and physical processes of wood and biomass pyrolysis,” Energy and Combustion Science, 34, 47-90 (2008).
Blasi, C. D., Branca, C., “Kinetics of primary product formation from wood pyrolysis,” Ind Eng Chem Res, 40, 5547-5556 (2001).
Blasi, C. D., Signorelli, G., Russo, C. D., Rea, G., “Product distribution from pyrolysis of wood and agricultural residues,” Ind Eng Chem Res, 38, 2216-2224 (1999).
Blasi, C. D., Lanzetta, M., “Intrinsic kinetics of isothermal xylan degradation in inert atmosphere,” J. Anal. Appl. Pyrolysis, 40-41, 287-303 (1997).
Bradbury, A. G. W., Sakai, Y., Shafizadeh, F., “A kinetic model for pyrolysis of cellulose,” J. Appl. Poly. Sci, 23, 3271-3280 (1979).
Branca, C., Blasi, C. D., “Kinetics of the isothermal degradation of wood in the temperature range 528-708 K,” J Anal Appl Pyrol, 67, 207-219 (2003).
Broido, A., Kilzer, F. J., “Speculations on the nature of cellulose pyrolysis,” Pyrodynamics, 2, 151-163 (1965).
Broido, A., Winstein, M., “Proceedings of the 3rd International Conference on Thermal Analysis,” Ed. H. G. Wiedermann (1971).
Chan, W. R., Kelbon, M., Krieger, B. B., “Modeling and experimental verification of physical and chemical processes during pyrolysis of large biomass particle,” Fuel, 64, 1505-1513 (1985).
Chen, W. H., Kuo, P. C., “Torrefaction and co-torrefaction characterization of hemicellulose, cellulose and lignin as well as torrefaction of some basic constituents in biomass,” Energy, 36, 803-811(2011).
Chen, W. H., Kuo, P. C., “Isothermal torrefaction kinetics of hemicellulose, cellulose, lignin and xylan using thermogravimetric analysis,” Energy, 36, 6451-6460(2011).
Chew, J. J., Doshi, V., “Recent advances in biomass pretreatment – Torrefaction fundamentals and technology,” Renewable and Sustainable Energy Reviews, 15, 4212-4222, 2011.
Couhert, C., Salvador, S., Commandre, J-M., “Impact of torrefaction on syngas production from wood,” Fuel, 88, 2286-2290, 2009.
Deng, J., Wang, G. J., Kuang, J. H., Zhang, Y. L., Luo, Y. H., “Pretreatment of agricultural residues for co-gasificaion via torrefaction,” Journal of Analytical and Applied Pyrolysis, 86, 331-337, 2009.
Eskilsson, S., Hartler, N. Lagringshandbok för trädbränslen; Päivi Lehtikangas, SLU, ISBN 91-576-5564-2 (1999).
Fairbridge, Ross, R. A., Sood, S. P., “A kinetic and surface study of the thermal decomposition of cellulose powder in inert and oxidation atmospheres,” Journal of Applied Polymer Science, 22, 497-510 (1978).
34 International Journal of Chemical Reactor Engineering Vol. 10 [2012], Article A15
Brought to you by | University of British Columbia (University of British Columbia)Authenticated | 172.16.1.226
Download Date | 4/16/12 8:11 PM
Font, R, Marcilla, A., Verdu, E., Devesa, J., “Kinetics of the pyrolysis of almond shells and almond shells impregnated with CoCl2 in a fluidized bed reactor and in a pyroprobe 100,” Ind Eng Chem Res, 29, 1846-1855 (1990).
Gaur, S., Thomas, B., “Thermal data for natural and synthetic fuels,” Marcel Dekker, Inc., New York (1998).
Golova, O., “Chemical effects of heat on cellulose,” Russian Chemical Reviews, 44, 687-697 (1975).
Gorton, W. C., Knight, J.A., “Oil from biomass entrained-flow pyrolysis,” Biotechnol. Bioeng. Symp., 14, 15-20(1984).
Gronli, M.G., “A Theorical and Experimental Study of the Thermal Degradation of Biomass Pyrolysis, Wood, Tar, Char,” Ph.D. Thesis, Trondheim University, Trondheim, 1996.
Gronli, M. G., Blasi, C. D., “Thermogravimetric analysis and devolatilization kinetics of wood,” Ind Eng Chem Res, 41, 4201-4208 (2002).
Gronli, L.H.S.E.A., “Thermogravimetric analysis of four scandinavian wood species under non isothermal conditions,” Nordic Seminar on biomass combustion, Trondheim (1992).
Halpern, Y., Patal, S., “Pyrolytic reactions of carbohydrates, Part VII, Simultaneous DTA-TGA study of the thermal decomposition of cellulose in vacuo,” Israel J. Chem., 7, 685-691 (1969).
Hirata, T., Bull. Gov. For. Exp. Sta. Japan, 263, 1-11 (1974). Koufopanos, C. A., Maschio, G., Lucchesi, A., “Kinetic Modeling of the
Pyrolysis of Biomass and Biomass Components,” Can. J. Chem. Eng., 67, 75-84 (1989).
Maa, P. S., Bailie, R. C., “Influence of particle size and environmental conditions on high temperature pyrolysis of cellulosic material –I. Theoretical,” Combusion Science and Technology, 7,257-269 (1973).
Miller, R. S., Bellan, J., “A generalized biomass pyrolysis model based on superimposed cellulose, hemicellulose and lignin kinetics,” Combust Sci Technol, 126, 97-137 (1996).
Min, K., “Vapor-phase thermal analysis of pyrolysis products from cellulosic materials,” Combust. Flame, 30, 285-294 (1977).
Mohan, D. J., Steele, P. H., “Pyrolysis of wood/biomass for bio-oil: a critical review,” Energy & Fuels, 20, 848-889 (2006).
OECD SIDS, “SIDS initial assessment report for linear alkylbenzene sulfonate (LAS),” Paris, France (2005).
35Peng et al.: Torrefaction Kinetics
Published by De Gruyter, 2012Brought to you by | University of British Columbia (University of British Columbia)
Authenticated | 172.16.1.226Download Date | 4/16/12 8:11 PM
Orfao, J. J. M., Antunes, F. J. A., Figuereido, J. L., “Pyrolysis kinetics of lignocellulosic materials-three independent reactions model,” Fuel, 78, 349-358 (1999).
Orfao, J. J. M., Figueiredo, J. L., “A simplified method for determination of lignocellulosic materials pyrolysis kinetics from isothermal thermogravimetric experiments,” Thermochimica Acta, 380(1), 67-78 (2001).
Parks, W. G., M.H.G.R.G. Petrarca, A., Abst. of Papers, 127th ACS Meeting, Cincinnati, OH (1955).
Peng, J. H., Bi, H. T., Sokhansanj, S., Lim, J. C., Melin, S., “An Economical and Market Analysis of Canadian Wood Pellets,” Int. J. Green Energy, 7, 128-142 (2010).
Prins, M. J., Ptasinski, K. J., Janssen, F. J. J. G., “More efficient biomass gasification via torrefaction,” Energy, 31, 3458-3470 (2006a).
Prins, M. J., Ptasinski, K. J., Janssen, F. J. J. G., “Torrefaction of wood Part 1. Weight loss kinetics,” J.Anal. Appl. Pyrolysis, 77, 28-34 (2006b).
Prins, M. J., Ptasinski, K. J., Janssen, F. J. J. G. J., “Torrefaction of wood Part 2. Analysis of products,” Anal. Appl. Pyrolysis, 77, 35-40 (2006c).
Ramiah, M. V., “Thermogravimetric and Differential Thermal Analysis of Cellulose, Hemicellulose and lignin,” J. Appl. Polym. Sci., 14, 1323-1337 (1970).
Reina J, P. L., “Kinetic study of the pyrolysis of waste wood”, Ind Eng Chem Res, 37, 4290-4295 (1998).
Roberts, A. F., “The heat of reaction during the pyrolysis of wood,” Comb. Flame, 17, 79-86 (1971).
Rogers, F. E., Ohlemiller T. J., “Cellulosic insulation materiel-1. Overall degradation kinetics and reaction heats,” Combustion Science and Technology, 24, 129-137 (1980).
Rousset, P., “Choix et Validation Expérimentale d’un Modèle de Pyrolyse Pour le Bois Traité par Haute Température: de la Micro-particule au Bois Massif,” Ph.D. Thesis, ENGREF, Nancy, 2004.
Rousset, P., Turner, I., Donnot, A., Perré, P., “The choice of a low-temperature pyrolysis model at the microscopic level for use in a macroscopic formulation,” Ann. For. Sci. 63, 213-229 (2006).
Shafizadeh, F. J., “Introduction to pyrolysis of biomass,” Anal. Appl. Pyrolysis, 3, 283-305 (1982).
Shafizadeh, F., Chin, P., “Thermal deterioration of wood,” ACS Symp Ser, 43, 57-81 (1977).
Shimizu, K., Teramni, F., J. Jpn. Wood Res. Soc. 16, 114 (1969).
36 International Journal of Chemical Reactor Engineering Vol. 10 [2012], Article A15
Brought to you by | University of British Columbia (University of British Columbia)Authenticated | 172.16.1.226
Download Date | 4/16/12 8:11 PM
Stamm, J., “Thermal degradation of wood and cellulose,” Ind. Eng. Chem., 48, 413-417 (1956).
Tang, M. M., Bacon, R., “Carbonization of cellulose fibers-I. Low temperature pyrolysis,” Carbon, 2, 211-214 (1964).
Tang, W. K., “Effect of inorganic salts on pyrolysis of wood, alpha-cellulose and lignin”, Forest Prod. Lab, Madison, Wis., Paper 71 (1967).
Thomas, R. J., “Wood structure and chemical composition,” ACS Symposium Series, 43, 1-23 (1997).
Thurner, I., Roussent, P., Remond, R., Perre, P., “An experimental and theoretical ... thermal treatment of wood (Fagus sylvatica L.) in the range 200-260 oC,” International Journal of Heat and Mass Transfer, 4, 715-725 (2010).
Thurner, F., Mann, U., “Kinetic investigation of wood pyrolysis,” Ind Eng Chem Proc Des Dev, 20, 482-488 (1981).
Van der Stelt, M. J. C., Gerhauser, H., Kiel, J. H. A., Ptasinski, K. J., “Biomass upgrading by torrefaction for the production of biofuels: A review,” Biomass and Bioenergy, 35, 3748-3762 (2011).
Varhegyi, G., Jakab, E., Antal, M. J., “Is the Broido-Shafizadeh Model for Cellulose Pyrolysis True?” Energy Fuels, 8(6), 1345-1352 (1994).
Wagenaar, B. M., Prins, W., Swaaij van. W. P. M., “Flash pyrolysis kinetics of pine wood,” Fuel Proc Technol, 36, 291-302 (1993).
Ward, S. M., Braslaw, J., “Experimental weight loss kinetics of wood pyrolysis under vacuum,” Combust Flame, 61, 261-269 (1985).
Williams, P. T., Besler, S., “The Pyrolysis of Rice Husks in a Thermogravimetric Analyzer and Static Batch Reactor”, Fuel, 72, 151-159 (1993).
Williams, P. T., Besler, S., “Thermogravimetric analysis of the component of biomass,” Advances in thermochimical biomass conversion. A. V. Bridgewater. London, Blackie Academic & Professional (1994).
Winkler, W., “Briquetting features and advantages,” in: Biomass Pelletization Workshop, Vancouver, Canada, May 17-18 (2011).
37Peng et al.: Torrefaction Kinetics
Published by De Gruyter, 2012Brought to you by | University of British Columbia (University of British Columbia)
Authenticated | 172.16.1.226Download Date | 4/16/12 8:11 PM
Top Related
Copyright © 2022 FDOKUMEN

