


Bahasa
Halaman
Hukum

U.S. PROPERT Y MARKET OUTLOOK 2016: HOUSE VIEW

At the beginning of each year, USAA Real Estate Company (USAA RealCo) publishes its annual House View, which
highlights our Company’s economic outlook, real estate strategies, and market themes for the next 12 months.
The goal of this research-driven report is to articulate a thoughtful perspective that adds value to our current and future investors and partners. We are pleased to present
the 2016 House View as it represents the collective insights of our seasoned team of real estate professionals.

Base Case
The U.S. economy and real estate markets delivered another solid year of performance in 2015. Annual gross domestic product (GDP) growth is on pace to finish above 2.0% for the second consecutive year. While this measure does not constitute an economic surge, the consistent slow and steady growth has become a hallmark of the current economic expansion. The labor market moderated from its record-breaking pace of nearly 3 million jobs in 2014, but with the unemployment rate at 5.0% as of November 2015, a healthy debate has begun as to whether the labor market is at full employment. U.S. real estate markets have benefitted from this positive sentiment as core real estate cap rates fell to record lows across the country in 2015, driven by elevated demand from both foreign and domestic capital. Additionally, real estate fundamentals were healthy, with the exception of a few pockets of overbuilding. Demographics remain favorable as both Millennials’ and Baby Boomers’ work and lifestyle preferences are creating unique real estate opportunities. While some uncertainty will likely persist regarding interest rates and geopolitical affairs, we expect the U.S. economy and real estate markets to sustain this positive momentum and deliver solid performances in 2016.
U.S. PROPERTY MARKET OUTLOOK 2016: HOUSE VIEW 1
Investment Themes and Strategies
We believe there is a high probability for a mild recession somewhere between 2017 and 2019, particularly as the current real estate cycle approaches its later stages. The Federal Reserve is likely to continue raising short-term rates, and when combined with a slow growth environment, this could trigger an inversion of the yield curve. An inverted yield curve is a rare occasion in which long-term debt has a lower yield than short-term debt of the same credit quality – this occurrence has preceded the last seven U.S. recessions.1 Market participants often view this event as a turning point in the business cycle, foreshadowing a slowdown in the economy. Historically, the Federal Reserve’s decision to raise interest rates has been a catalyst for yield curve inversions. Given the central bank’s forecast for higher short-term rates, we believe it is time to start a defensive glide path and focus on income-oriented and less volatile assets. Our portfolio managers continue to structure their portfolios to weather a mild slowdown.
As always, we remain true to USAA RealCo’s Guiding Investment Principles:
A Acquire only high-quality assets with strong elements of design, size, and access such that the asset will outperform the greater marketplace over time
A Acquire assets in the best locations
A Acquire assets with broad appeal to future institutional purchasers
A Maintain discipline concerning replacement cost
GATEWAY MARKETS PRIMARY MARKETS
Boston Atlanta
New York Chicago
San Francisco Dallas/Ft. Worth
Seattle Houston
Washington D.C. Los Angeles
Miami
SECONDARY MARKETS
Minneapolis Orange County
Austin Philadelphia
Charlotte Phoenix
Denver San Diego
Nashville San Jose
Northern New Jersey Raleigh
1 McIntosh,Fitzgerald,andKirk,“WillanInvertedYieldCurvePredicttheNext Recession…Again?”InstitutionalRealEstateAmericas,September1,2015Vol.27, Number8,www.irei.com.
2 U.S. PROPERTY MARKET OUTLOOK 2016: HOUSE VIEW
Furthermore, we categorize gateway, primary, and secondary target markets as shown previously. Certainly, the classification varies by product type, but generally, these descriptions should hold true for office, multifamily, hotel, and retail.
For the industrial sector, other markets that warrant consideration include Baltimore, Central Pennsylvania, the Inland Empire, Salt Lake City, St. Louis, Indianapolis, Memphis, Tampa, Portland, Reno, Sacramento, and Kansas City. In addition, we would consider grocery-anchored retail in a broad range of larger population centers.
ACQUISITIONS CAPITAL
USAA RealCo has taken an increasingly cautious approach to acquiring stabilized core assets, as they have become fully priced in many markets. As a result, our team continues to focus on value creation opportunities with an emphasis on markets experiencing job and population growth, as these cities should outperform the broader market in a coming downturn. Furthermore, we favor properties with core-like characteristics, below-market rents (with near-term rollover), and upside potential from additional development rights that could be harvested in the future. In addition, asset enhancement via recapitalization, physical improvements, and the implementation of higher-quality management are all critical elements of our acquisition strategy. Given the abundance of capital chasing real estate today, we believe it is critical to pursue assets that offer attractive risk-adjusted returns rather than assume unwarranted risk in an effort to achieve yield. In 2016, USAA RealCo and its funds will allocate acquisition capital in the following areas:
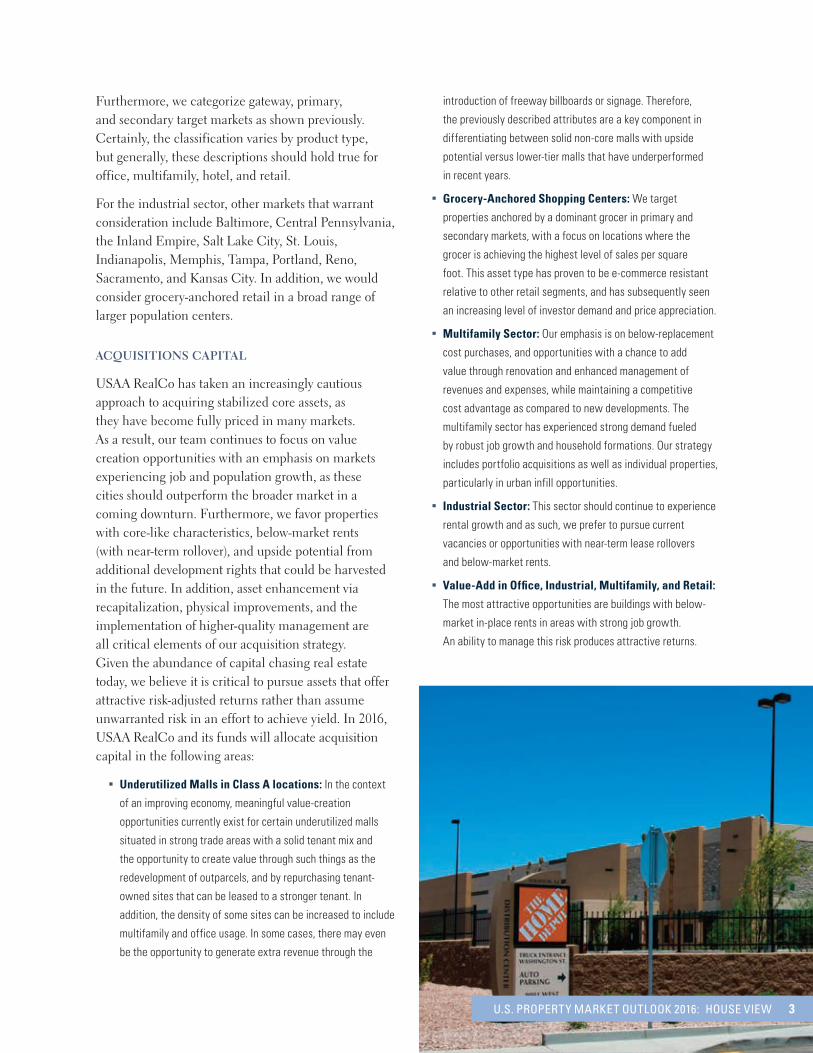
A Underutilized Malls in Class A locations: In the context
of an improving economy, meaningful value-creation
opportunities currently exist for certain underutilized malls
situated in strong trade areas with a solid tenant mix and
the opportunity to create value through such things as the
redevelopment of outparcels, and by repurchasing tenant-
owned sites that can be leased to a stronger tenant. In
addition, the density of some sites can be increased to include
multifamily and office usage. In some cases, there may even
be the opportunity to generate extra revenue through the
introduction of freeway billboards or signage. Therefore,
the previously described attributes are a key component in
differentiating between solid non-core malls with upside
potential versus lower-tier malls that have underperformed
in recent years.
A Grocery-Anchored Shopping Centers: We target
properties anchored by a dominant grocer in primary and
secondary markets, with a focus on locations where the
grocer is achieving the highest level of sales per square
foot. This asset type has proven to be e-commerce resistant
relative to other retail segments, and has subsequently seen
an increasing level of investor demand and price appreciation.
A Multifamily Sector: Our emphasis is on below-replacement
cost purchases, and opportunities with a chance to add
value through renovation and enhanced management of
revenues and expenses, while maintaining a competitive
cost advantage as compared to new developments. The
multifamily sector has experienced strong demand fueled
by robust job growth and household formations. Our strategy
includes portfolio acquisitions as well as individual properties,
particularly in urban infill opportunities.
A Industrial Sector: This sector should continue to experience
rental growth and as such, we prefer to pursue current
vacancies or opportunities with near-term lease rollovers
and below-market rents.
A Value-Add in Office, Industrial, Multifamily, and Retail:
The most attractive opportunities are buildings with below-
market in-place rents in areas with strong job growth.
An ability to manage this risk produces attractive returns.
U.S. PROPERTY MARKET OUTLOOK 2016: HOUSE VIEW 3
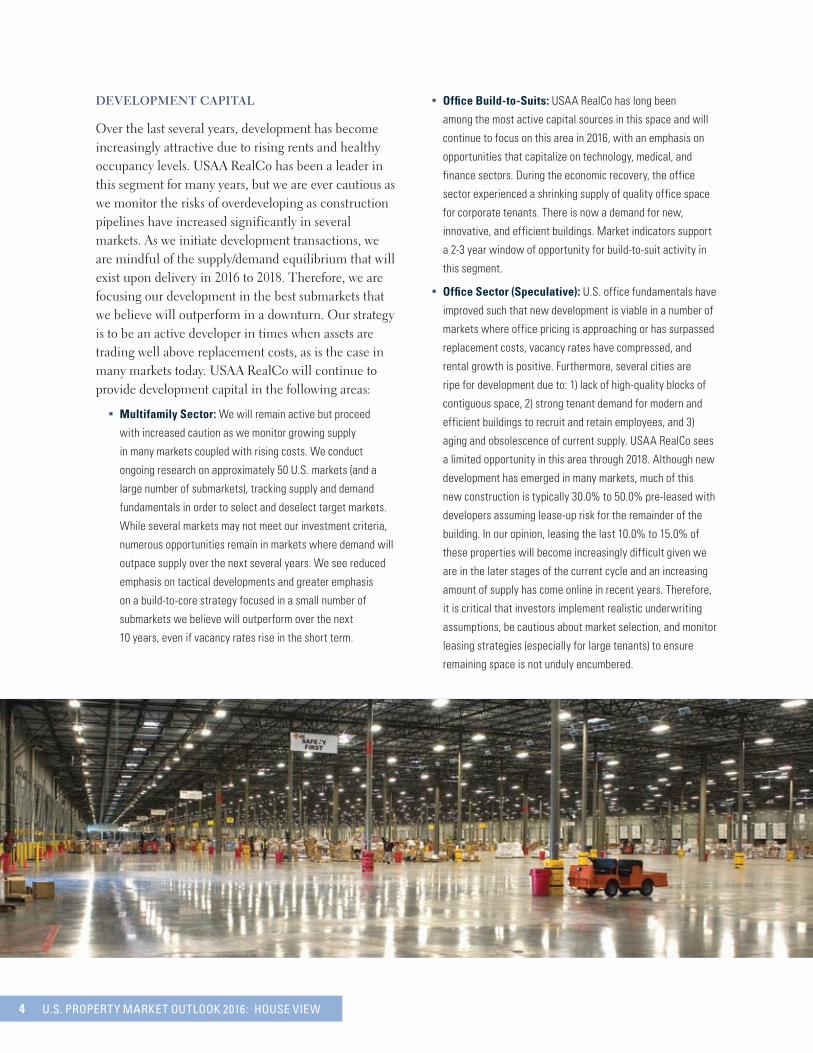
DEVELOPMENT CAPITAL
Over the last several years, development has become increasingly attractive due to rising rents and healthy occupancy levels. USAA RealCo has been a leader in this segment for many years, but we are ever cautious as we monitor the risks of overdeveloping as construction pipelines have increased significantly in several markets. As we initiate development transactions, we are mindful of the supply/demand equilibrium that will exist upon delivery in 2016 to 2018. Therefore, we are focusing our development in the best submarkets that we believe will outperform in a downturn. Our strategy is to be an active developer in times when assets are trading well above replacement costs, as is the case in many markets today. USAA RealCo will continue to provide development capital in the following areas:
A Multifamily Sector: We will remain active but proceed
with increased caution as we monitor growing supply
in many markets coupled with rising costs. We conduct
ongoing research on approximately 50 U.S. markets (and a
large number of submarkets), tracking supply and demand
fundamentals in order to select and deselect target markets.
While several markets may not meet our investment criteria,
numerous opportunities remain in markets where demand will
outpace supply over the next several years. We see reduced
emphasis on tactical developments and greater emphasis
on a build-to-core strategy focused in a small number of
submarkets we believe will outperform over the next
10 years, even if vacancy rates rise in the short term.
A Office Build-to-Suits: USAA RealCo has long been
among the most active capital sources in this space and will
continue to focus on this area in 2016, with an emphasis on
opportunities that capitalize on technology, medical, and
finance sectors. During the economic recovery, the office
sector experienced a shrinking supply of quality office space
for corporate tenants. There is now a demand for new,
innovative, and efficient buildings. Market indicators support
a 2-3 year window of opportunity for build-to-suit activity in
this segment.
A Office Sector (Speculative): U.S. office fundamentals have
improved such that new development is viable in a number of
markets where office pricing is approaching or has surpassed
replacement costs, vacancy rates have compressed, and
rental growth is positive. Furthermore, several cities are
ripe for development due to: 1) lack of high-quality blocks of
contiguous space, 2) strong tenant demand for modern and
efficient buildings to recruit and retain employees, and 3)
aging and obsolescence of current supply. USAA RealCo sees
a limited opportunity in this area through 2018. Although new
development has emerged in many markets, much of this
new construction is typically 30.0% to 50.0% pre-leased with
developers assuming lease-up risk for the remainder of the
building. In our opinion, leasing the last 10.0% to 15.0% of
these properties will become increasingly difficult given we
are in the later stages of the current cycle and an increasing
amount of supply has come online in recent years. Therefore,
it is critical that investors implement realistic underwriting
assumptions, be cautious about market selection, and monitor
leasing strategies (especially for large tenants) to ensure
remaining space is not unduly encumbered.
4 U.S. PROPERTY MARKET OUTLOOK 2016: HOUSE VIEW

A Government-Leased Office: We believe government leased
office properties offer an attractive opportunity at this point
in the cycle given the strong cash flow and limited ongoing
capital requirements. Government leases are naturally
defensive, as they have a tenant with high-quality credit and
are typically long-term agreements of 10 years or more. These
characteristics can help stabilize a multi-asset portfolio,
which is particularly beneficial late in the real estate cycle
as investors shift toward strategies that are more defensive.
Furthermore, this segment serves as an attractive alternative
to core assets which are fully priced in many markets.
A Industrial Build-to-Suits: USAA RealCo has been one of the
most active capital sources in this area as well, and we will
continue this trend in 2016 with an emphasis on opportunities
that capitalize upon e-commerce growth in the industrial
sector. However, pricing industrial build-to-suits will remain
challenging in the near term, as current yields on cost are at
historic lows. Moreover, interest rates and cap rates will likely
increase prior to the completion of projects commenced this
year, eroding potential development profits. Accordingly, we
will continue to be cautious in this area in 2016, focusing on
investments with a few distinct characteristics: 1) assets in
secondary markets, 2) properties with lower-profile tenants
that have good credit quality and offer above-market returns,
and 3) core markets that will outperform the broader market in
a higher interest rate environment.
A Industrial Sector (Speculative): Shrinking inventories
and rising rents continue to make this sector attractive, as
does a significant level of liquidity for completed projects. This
sector has attracted strong investor demand and construction
pipelines have surged in a number of markets, which we will
monitor accordingly. In particular, the light-bulk industrial
space (150,000 – 350,000 sq. ft.) offers strong investment
potential. This segment makes up approximately 20.0% of the
industrial square footage in the U.S., and only 20.0% of this
inventory is Class A. This product type can produce strong
and stable cash flow, and there is currently a high level of
obsolescence in the existing product. Given current economic
conditions, the market for this space is experiencing healthy
demand and absorption. Net absorption for Class A light-bulk
industrial space has been consistently positive since 2006,
with only one quarter experiencing negative net absorption
during that period. At the same time, new construction of
this space has been very limited, while vacancy rates remain
elevated compared to historical averages.
A Grocery Anchored Shopping Centers: Following a solid
year of development activity, 2016 should offer additional
opportunities for dominant grocers. It is worth noting that
numerous grocers are scaling down the size of their stores.
There is less activity in super-sized centers, while many
developers are focusing on community/neighborhood stores
of 60,000 square feet or less. Such downsizing is a reflection
of the grocery industry adjusting to a shift in consumer
purchasing behavior as customers are buying fewer items
per visit. Certainly, e-commerce is largely responsible for this
decline as more people are purchasing nonperishable items
online. As a result, the grocery industry is currently evolving
to better accommodate technology and consumer demand.
A Hotels: On a limited basis, we see a tactical opportunity
to develop select service hotels in markets with strong
fundamentals.
U.S. PROPERTY MARKET OUTLOOK 2016: HOUSE VIEW 5

Debt & Capital Markets
A Whole Loans: USAA RealCo is now offering whole loans on
institutional grade properties throughout the U.S. These loans
are long-term, fixed-rate transactions on major property sectors
in primary and secondary markets. Deal terms range from 5 to
30 years with loan-to-value (LTV) ratios of 50.0% to 75.0%.
A Stretch First Mortgages and Mezzanine Debt: Through
Square Mile, USAA RealCo will continue to expand its
activities in these areas with a focus on originating high-
quality mezzanine loans and B notes. These loans, offering
last dollar exposure between 65.0% and 85.0% of the capital
stack, are providing equity-like returns with lower risk and
strong current income and, in the case of some tax-sensitive
investors, superior after-tax returns as described in our recent
publication, The CRE Mezzanine Loan Opportunity (located at
www.usrealco.com).
A Capital Stack Restructuring: Square Mile will focus on
preferred equity investments that feature material sponsor
subordination, which perform better in downside scenarios,
often with a current income component. In addition, the firm
will target special situations equity investments including
investing in general partner-enhanced equity where Square
Mile strategically partners with operators utilizing third-
party limited partner capital to increase the returns through
participation in carried interest and other fees not typically
paid to managers and benefitting from cross-collateralized
cash flows.
DEBT AND CAPITAL MARKETS STRATEGIES
USAA RealCo and our affiliate Square Mile Capital Management (Square Mile) continue to manage various debt and preferred equity strategies, as these sectors offer attractive risk-adjusted returns at this point in the cycle that are consistent with our view towards defensive positions. By 2018, nearly $1.4 trillion in commercial real estate debt will mature, and neither market values nor available sources of conventional senior debt will support the complete recapitalization of such a large sum. USAA RealCo, in conjunction with Square Mile, is actively responding to this opportunity, as capital restructuring has become a critical component of our investment themes in 2016. As such, USAA RealCo continues to focus on the following areas:
6 U.S. PROPERTY MARKET OUTLOOK 2016: HOUSE VIEW
OTHER AREAS OF POTENTIAL INTEREST
While the areas listed previously reflect USAA RealCo’s focus for 2016, we will continue to advance opportunities in the following sectors:
A Senior Housing: As the Baby Boomer generation approaches
retirement age, the U.S. will experience a monumental
demographic shift resulting in heightened demand for senior
housing. Consequently, we are actively building a senior
housing platform that will work in concert with our existing
multifamily program.
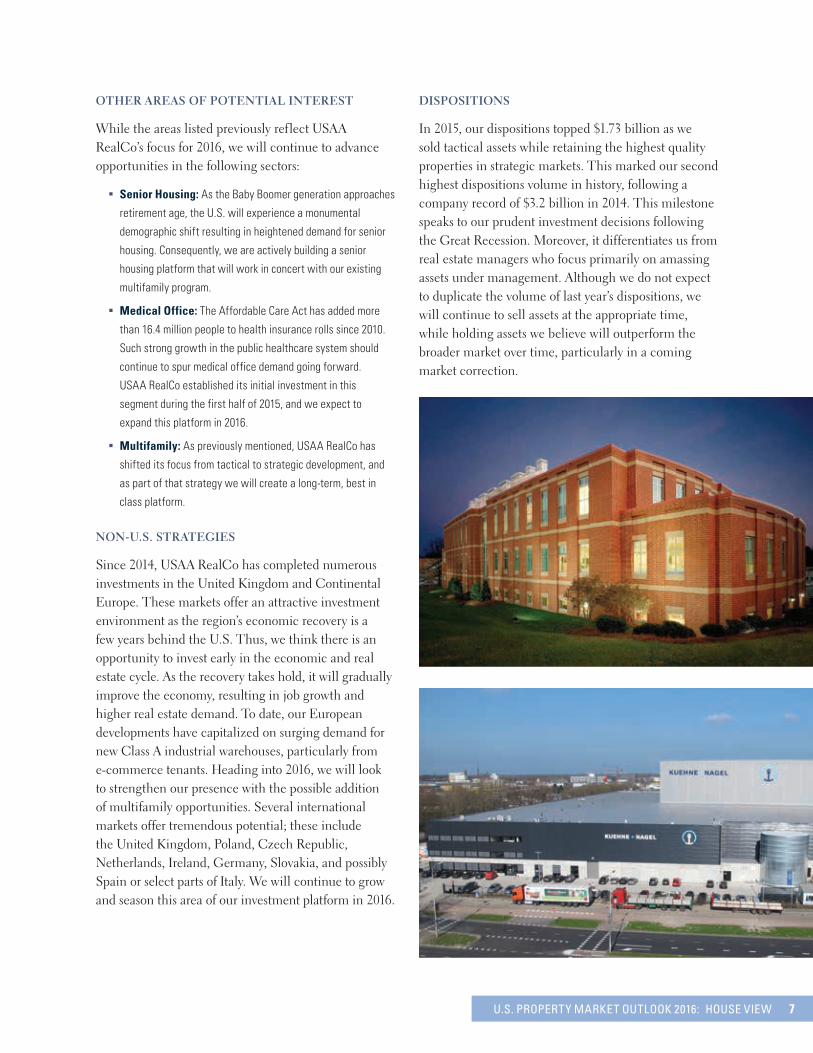
A Medical Office: The Affordable Care Act has added more
than 16.4 million people to health insurance rolls since 2010.
Such strong growth in the public healthcare system should
continue to spur medical office demand going forward.
USAA RealCo established its initial investment in this
segment during the first half of 2015, and we expect to
expand this platform in 2016.
A Multifamily: As previously mentioned, USAA RealCo has
shifted its focus from tactical to strategic development, and
as part of that strategy we will create a long-term, best in
class platform.
NON-U.S. STRATEGIES
Since 2014, USAA RealCo has completed numerous investments in the United Kingdom and Continental Europe. These markets offer an attractive investment environment as the region’s economic recovery is a few years behind the U.S. Thus, we think there is an opportunity to invest early in the economic and real estate cycle. As the recovery takes hold, it will gradually improve the economy, resulting in job growth and higher real estate demand. To date, our European developments have capitalized on surging demand for new Class A industrial warehouses, particularly from e-commerce tenants. Heading into 2016, we will look to strengthen our presence with the possible addition of multifamily opportunities. Several international markets offer tremendous potential; these include the United Kingdom, Poland, Czech Republic, Netherlands, Ireland, Germany, Slovakia, and possibly Spain or select parts of Italy. We will continue to grow and season this area of our investment platform in 2016.
DISPOSITIONS
In 2015, our dispositions topped $1.73 billion as we sold tactical assets while retaining the highest quality properties in strategic markets. This marked our second highest dispositions volume in history, following a company record of $3.2 billion in 2014. This milestone speaks to our prudent investment decisions following the Great Recession. Moreover, it differentiates us from real estate managers who focus primarily on amassing assets under management. Although we do not expect to duplicate the volume of last year’s dispositions, we will continue to sell assets at the appropriate time, while holding assets we believe will outperform the broader market over time, particularly in a coming market correction.
U.S. PROPERTY MARKET OUTLOOK 2016: HOUSE VIEW 7
Market Themes
U.S. ECONOMY: SLOW AND STEADY GROWTH
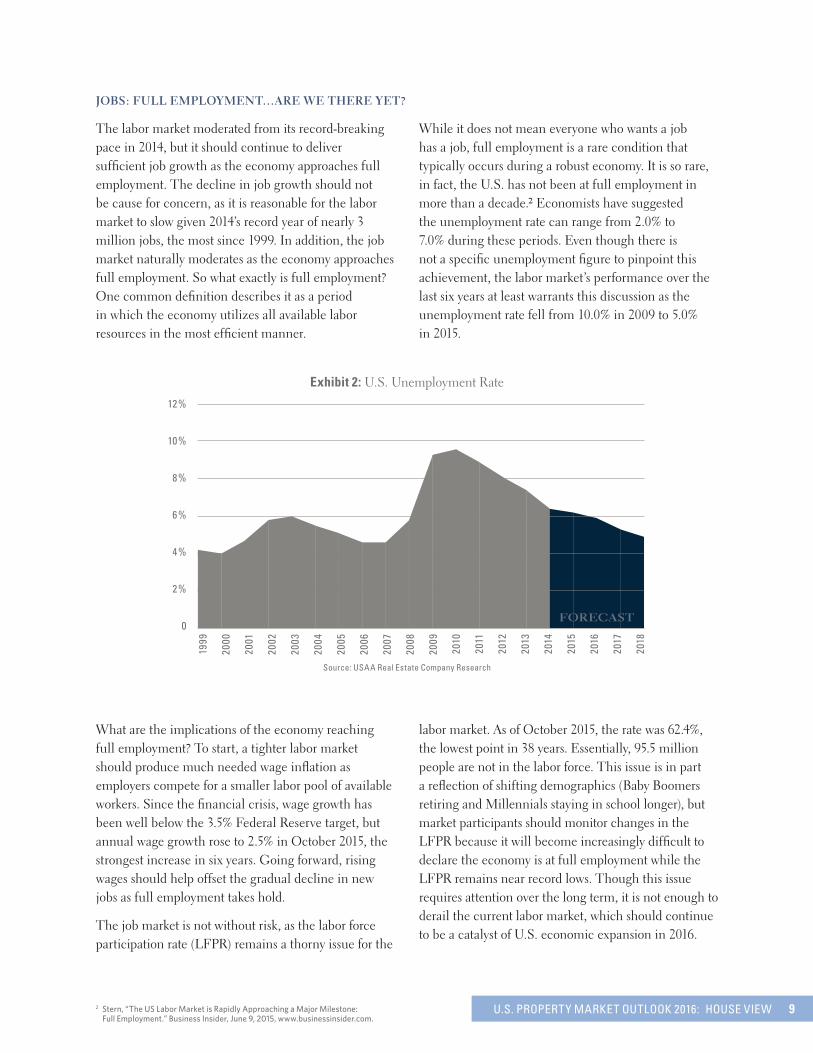
The U.S. economy should continue to expand at a slow and steady pace in 2016 with GDP expansion between 2.4% to 2.8%. Since the Great Recession ended, U.S. GDP growth has averaged 2.1% per year. The U.S. economy, however, has been more resilient than any other developed nation over the last five years, fueled largely by the domestic labor market, which is approaching full employment and has averaged more than 220,000 new jobs per month since 2013. Household balance sheets are healthier in large part due to a housing market that has begun to gain momentum after years of slumping performance, as well as more than $100 billion in savings from depressed oil prices over the past year, according to Capital Economics. Certainly, transitory factors (e.g. interest rate uncertainty and lagging retail consumption) might prove to be near-term headwinds, but we are confident the U.S. economy has enough momentum to support steady growth in 2016. Sources: USAA Real Estate Company Research
+80+68+15+30+47+63+57+45+30+0+0+42+30+47+32+40+37+47+48+450+0+0+0+0+0+0+0+0+5+47+0+0+0+0+0+0+0+0+0
1999
2000
2001
2002
2003
2004
2005
2006
2007
2008
2009
2010
2011
2012
2013
2014
2015
2016
2017
2018
6 %
5 %
4 %
3 %
2 %
1 %
0 %
-1 %
-2 %
-3 %
-4 %
Exhibit 1: Real GDP Growth
FORECAST
8 U.S. PROPERTY MARKET OUTLOOK 2016: HOUSE VIEW
JOBS: FULL EMPLOYMENT…ARE WE THERE YET?
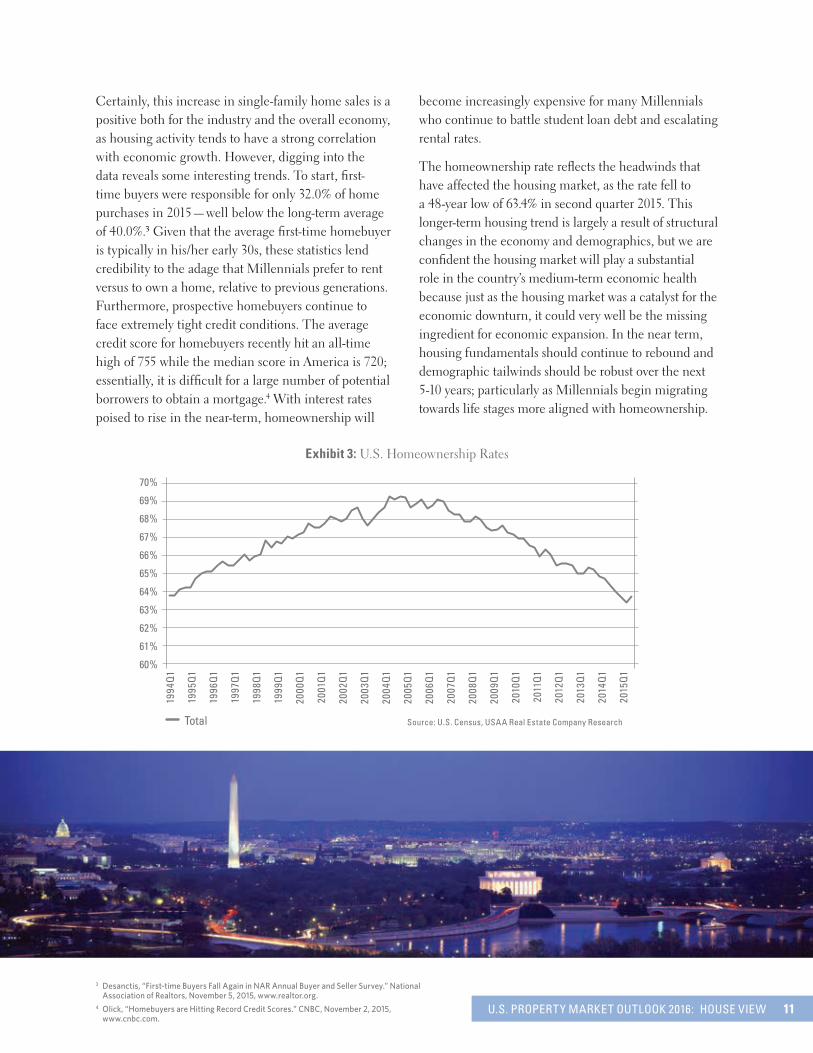
The labor market moderated from its record-breaking pace in 2014, but it should continue to deliver sufficient job growth as the economy approaches full employment. The decline in job growth should not be cause for concern, as it is reasonable for the labor market to slow given 2014’s record year of nearly 3 million jobs, the most since 1999. In addition, the job market naturally moderates as the economy approaches full employment. So what exactly is full employment? One common definition describes it as a period in which the economy utilizes all available labor resources in the most efficient manner.
While it does not mean everyone who wants a job has a job, full employment is a rare condition that typically occurs during a robust economy. It is so rare, in fact, the U.S. has not been at full employment in more than a decade.2 Economists have suggested the unemployment rate can range from 2.0% to 7.0% during these periods. Even though there is not a specific unemployment figure to pinpoint this achievement, the labor market’s performance over the last six years at least warrants this discussion as the unemployment rate fell from 10.0% in 2009 to 5.0% in 2015.
What are the implications of the economy reaching full employment? To start, a tighter labor market should produce much needed wage inflation as employers compete for a smaller labor pool of available workers. Since the financial crisis, wage growth has been well below the 3.5% Federal Reserve target, but annual wage growth rose to 2.5% in October 2015, the strongest increase in six years. Going forward, rising wages should help offset the gradual decline in new jobs as full employment takes hold.
The job market is not without risk, as the labor force participation rate (LFPR) remains a thorny issue for the
labor market. As of October 2015, the rate was 62.4%, the lowest point in 38 years. Essentially, 95.5 million people are not in the labor force. This issue is in part a reflection of shifting demographics (Baby Boomers retiring and Millennials staying in school longer), but market participants should monitor changes in the LFPR because it will become increasingly difficult to declare the economy is at full employment while the LFPR remains near record lows. Though this issue requires attention over the long term, it is not enough to derail the current labor market, which should continue to be a catalyst of U.S. economic expansion in 2016.
42+40+47+58+60+55+51+46+46+58+93+96+89+81+74+64+62+59+53+49FORECAST
1999
2000
2001
2002
2003
2004
2005
2006
2007
2008
2009
2010
2011
2012
2013
2014
2015
2016
2017
2018
12 %
10 %
8 %
6 %
4 %
2 %
0
Exhibit 2: U.S. Unemployment Rate
Source: USAA Real Estate Company Research
2 Stern,“TheUSLaborMarketisRapidlyApproachingaMajorMilestone: FullEmployment.”BusinessInsider,June9,2015,www.businessinsider.com.
U.S. PROPERTY MARKET OUTLOOK 2016: HOUSE VIEW 9

U.S. CONSUMERS: HEALTHY BALANCE SHEETS VS. SLUGGISH RETAIL GROWTH
U.S. consumers are still hesitant when it comes to discretionary spending, and household balance sheets are benefitting from this conservative behavior. Consumers have saved more than $100 billion from lower fuel prices over the past year and these savings are likely to continue in the near term. Furthermore, to the astonishment of many economists, people are not spending the money saved from lower gasoline costs. Near the end of 2015, the personal savings rate leaped to a three-year high of 5.6%. Conversely, household debt rose to its highest level since 2010, but much of this increase was due to mortgages, auto purchases, and student loans; such large-scale investments suggest consumers feel optimistic about their long-term prospects. When combining these factors with a robust labor market, upward pressure on employee wages and falling loan delinquencies, consumers are generally in a better position today than at any point since the recession.
Retail sales growth is not likely to surge in 2016. When measuring U.S. consumer purchasing power, however, it is critical to be mindful of recent conditions. In 2014, more Americans started working than in any year since 1999. It may take more time for workers to feel secure in their jobs, but they should eventually start spending on retail items and when combined with rising household incomes, the long-term retail sales outlook is more optimistic than the recent sluggish performance might indicate.
HOUSING MARKET: FUNDAMENTALS IMPROVE BUT HEADWINDS ARE STRONG
In many respects, homeownership has been largely absent from the economic recovery, but 2016 has the potential to be a breakout year if the market can overcome a few obstacles. In what seemed like an under-the-radar achievement, the housing market put together its strongest year since the recession; Americans are on pace to purchase roughly 5.8 million homes, up 4.0% from 2014. Worth noting, however, is that single-family home sales are still down almost 30% from their 2004 to 2006 averages.
10 U.S. PROPERTY MARKET OUTLOOK 2016: HOUSE VIEW
Certainly, this increase in single-family home sales is a positive both for the industry and the overall economy, as housing activity tends to have a strong correlation with economic growth. However, digging into the data reveals some interesting trends. To start, first-time buyers were responsible for only 32.0% of home purchases in 2015 — well below the long-term average of 40.0%.3 Given that the average first-time homebuyer is typically in his/her early 30s, these statistics lend credibility to the adage that Millennials prefer to rent versus to own a home, relative to previous generations. Furthermore, prospective homebuyers continue to face extremely tight credit conditions. The average credit score for homebuyers recently hit an all-time high of 755 while the median score in America is 720; essentially, it is difficult for a large number of potential borrowers to obtain a mortgage.4 With interest rates poised to rise in the near-term, homeownership will
become increasingly expensive for many Millennials who continue to battle student loan debt and escalating rental rates.
The homeownership rate reflects the headwinds that have affected the housing market, as the rate fell to a 48-year low of 63.4% in second quarter 2015. This longer-term housing trend is largely a result of structural changes in the economy and demographics, but we are confident the housing market will play a substantial role in the country’s medium-term economic health because just as the housing market was a catalyst for the economic downturn, it could very well be the missing ingredient for economic expansion. In the near term, housing fundamentals should continue to rebound and demographic tailwinds should be robust over the next 5-10 years; particularly as Millennials begin migrating towards life stages more aligned with homeownership.
Exhibit 3: U.S. Homeownership Rates
70 %
69 %
68 %
67 %
66 %
65 %
64 %
63 %
62 %
61 %
60 %
1994
Q1
1995
Q1
1996
Q1
1997
Q1
1998
Q1
1999
Q1
2000
Q1
2001
Q1
2002
Q1
2003
Q1
2004
Q1
2005
Q1
2006
Q1
2007
Q1
2008
Q1
2009
Q1
2010
Q1
2011
Q1
2012
Q1
2013
Q1
2014
Q1
2015
Q1
Source: U.S. Census, USAA Real Estate Company ResearchTotal
3 Desanctis,“First-timeBuyersFallAgaininNARAnnualBuyerandSellerSurvey.”National AssociationofRealtors,November5,2015,www.realtor.org.4 Olick,“HomebuyersareHittingRecordCreditScores.”CNBC,November2,2015, www.cnbc.com.
U.S. PROPERTY MARKET OUTLOOK 2016: HOUSE VIEW 11
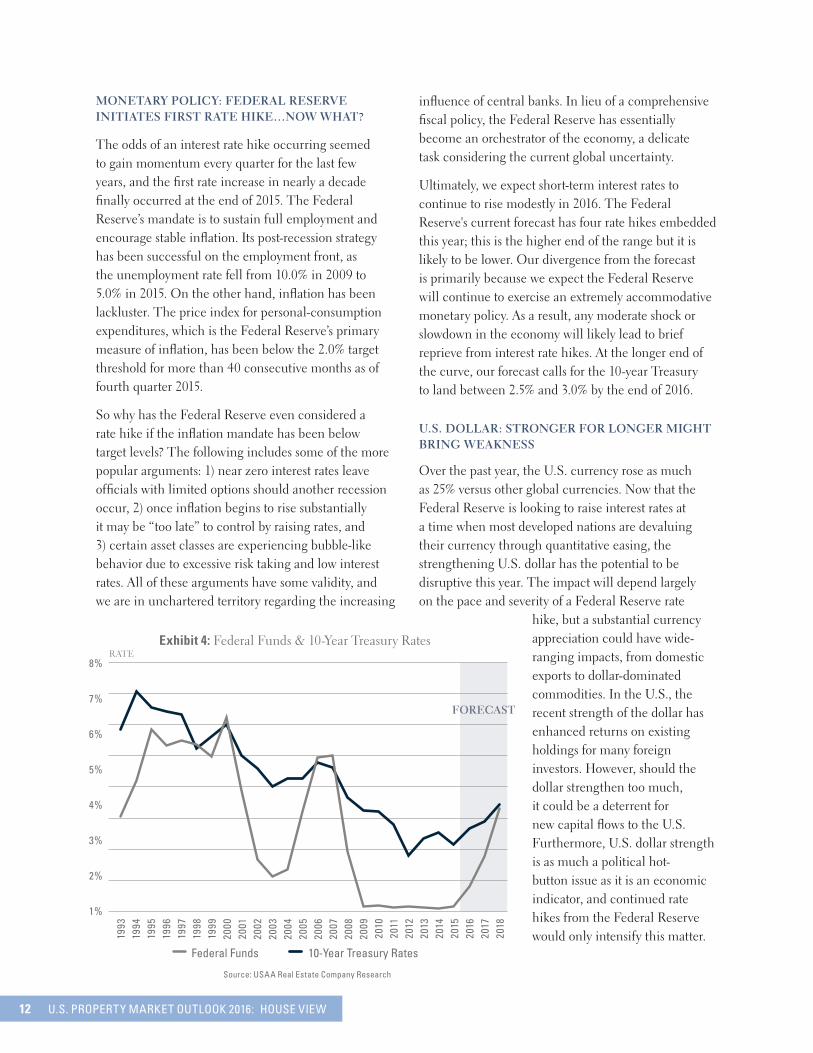
MONETARY POLICY: FEDERAL RESERVE INITIATES FIRST RATE HIKE…NOW WHAT?
The odds of an interest rate hike occurring seemed to gain momentum every quarter for the last few years, and the first rate increase in nearly a decade finally occurred at the end of 2015. The Federal Reserve’s mandate is to sustain full employment and encourage stable inflation. Its post-recession strategy has been successful on the employment front, as the unemployment rate fell from 10.0% in 2009 to 5.0% in 2015. On the other hand, inflation has been lackluster. The price index for personal-consumption expenditures, which is the Federal Reserve’s primary measure of inflation, has been below the 2.0% target threshold for more than 40 consecutive months as of fourth quarter 2015.
So why has the Federal Reserve even considered a rate hike if the inflation mandate has been below target levels? The following includes some of the more popular arguments: 1) near zero interest rates leave officials with limited options should another recession occur, 2) once inflation begins to rise substantially it may be “too late” to control by raising rates, and 3) certain asset classes are experiencing bubble-like behavior due to excessive risk taking and low interest rates. All of these arguments have some validity, and we are in unchartered territory regarding the increasing
influence of central banks. In lieu of a comprehensive fiscal policy, the Federal Reserve has essentially become an orchestrator of the economy, a delicate task considering the current global uncertainty.
Ultimately, we expect short-term interest rates to continue to rise modestly in 2016. The Federal Reserve's current forecast has four rate hikes embedded this year; this is the higher end of the range but it is likely to be lower. Our divergence from the forecast is primarily because we expect the Federal Reserve will continue to exercise an extremely accommodative monetary policy. As a result, any moderate shock or slowdown in the economy will likely lead to brief reprieve from interest rate hikes. At the longer end of the curve, our forecast calls for the 10-year Treasury to land between 2.5% and 3.0% by the end of 2016.
U.S. DOLLAR: STRONGER FOR LONGER MIGHT BRING WEAKNESS
Over the past year, the U.S. currency rose as much as 25% versus other global currencies. Now that the Federal Reserve is looking to raise interest rates at a time when most developed nations are devaluing their currency through quantitative easing, the strengthening U.S. dollar has the potential to be disruptive this year. The impact will depend largely on the pace and severity of a Federal Reserve rate
hike, but a substantial currency appreciation could have wide-ranging impacts, from domestic exports to dollar-dominated commodities. In the U.S., the recent strength of the dollar has enhanced returns on existing holdings for many foreign investors. However, should the dollar strengthen too much, it could be a deterrent for new capital flows to the U.S. Furthermore, U.S. dollar strength is as much a political hot-button issue as it is an economic indicator, and continued rate hikes from the Federal Reserve would only intensify this matter.
Exhibit 4: Federal Funds & 10-Year Treasury Rates
10-Year Treasury RatesFederal Funds
RATE
1993
1994
1995
1996
1997
1998
1999
2000
2001
2002
2003
2004
2005
2006
2007
2008
2009
2010
2011
2012
2013
2014
2015
2016
2017
2018
FORECAST
8 %
7 %
6 %
5 %
4 %
3 %
2 %
1 %
Source: USAA Real Estate Company Research
12 U.S. PROPERTY MARKET OUTLOOK 2016: HOUSE VIEW
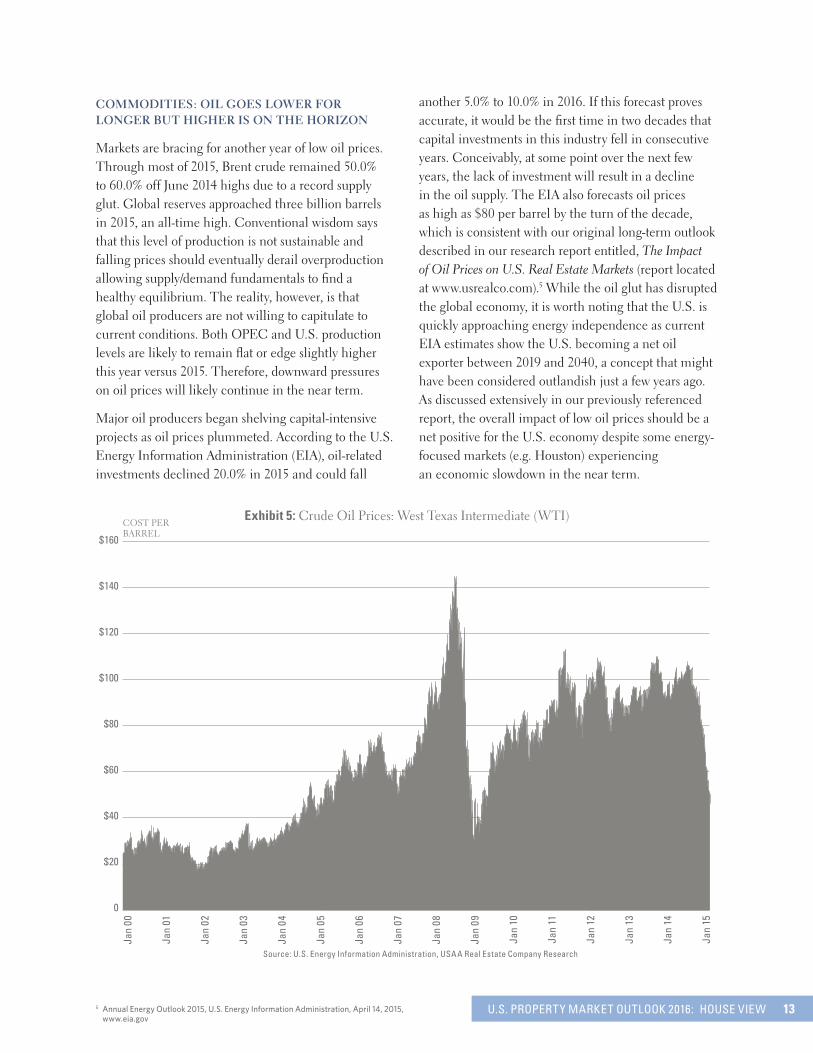
COMMODITIES: OIL GOES LOWER FOR LONGER BUT HIGHER IS ON THE HORIZON
Markets are bracing for another year of low oil prices. Through most of 2015, Brent crude remained 50.0% to 60.0% off June 2014 highs due to a record supply glut. Global reserves approached three billion barrels in 2015, an all-time high. Conventional wisdom says that this level of production is not sustainable and falling prices should eventually derail overproduction allowing supply/demand fundamentals to find a healthy equilibrium. The reality, however, is that global oil producers are not willing to capitulate to current conditions. Both OPEC and U.S. production levels are likely to remain flat or edge slightly higher this year versus 2015. Therefore, downward pressures on oil prices will likely continue in the near term.
Major oil producers began shelving capital-intensive projects as oil prices plummeted. According to the U.S. Energy Information Administration (EIA), oil-related investments declined 20.0% in 2015 and could fall
another 5.0% to 10.0% in 2016. If this forecast proves accurate, it would be the first time in two decades that capital investments in this industry fell in consecutive years. Conceivably, at some point over the next few years, the lack of investment will result in a decline in the oil supply. The EIA also forecasts oil prices as high as $80 per barrel by the turn of the decade, which is consistent with our original long-term outlook described in our research report entitled, The Impact of Oil Prices on U.S. Real Estate Markets (report located at www.usrealco.com).5 While the oil glut has disrupted the global economy, it is worth noting that the U.S. is quickly approaching energy independence as current EIA estimates show the U.S. becoming a net oil exporter between 2019 and 2040, a concept that might have been considered outlandish just a few years ago. As discussed extensively in our previously referenced report, the overall impact of low oil prices should be a net positive for the U.S. economy despite some energy-focused markets (e.g. Houston) experiencing an economic slowdown in the near term.
Exhibit 5: Crude Oil Prices: West Texas Intermediate (WTI)
Jan
00
Jan
01
Jan
02
Jan
03
Jan
04
Jan
05
Jan
06
Jan
07
Jan
08
Jan
09
Jan
10
Jan
11
Jan
12
Jan
13
Jan
14
Jan
15
Source: U.S. Energy Information Administration, USAA Real Estate Company Research
$ 160
$ 140
$ 120
$ 100
$ 80
$ 60
$ 40
$ 20
0
5 AnnualEnergyOutlook2015,U.S.EnergyInformationAdministration,April14,2015, www.eia.gov
COST PER BARREL
U.S. PROPERTY MARKET OUTLOOK 2016: HOUSE VIEW 13

6 Turse,“HowManyWarsIstheU.S.ReallyFighting.”TheNation,September24, 2015,www.thenation.com.7 McCarthy,“TheWaronTerrorhasCostTaxpayers$1.7Trillion.”Forbes, February3,2015,www.forbes.com.8 2016UnitedStatesBudgetEstimate,InsideGov,federal-budget.insidegov.com.9 Hewitt,“CapitalFlightfromChina:WhyInvestorsareTakingtheirMoney Elsewhere.”InternationalBusinessTimes,November9,2015,www.ibtimes.com.10Black,“WeNeedtoTalkabouttheGlobalEconomy.”Bloomberg,November18, 2015,www.bloomberg.com.11 Ibid.
GLOBAL OUTLOOK: GEOPOLITICAL INSTABILITY AND ECONOMIC UNCERTAINTY
Conditions are in place for 2016 to be a year of fervent geopolitical unrest. Violent conflicts are on the rise, from escalating tensions in the Middle East, Ukraine, and Africa to deadly terrorist threats across the globe. By some estimates, in 2015 U.S. forces executed military operations in at least 135 nations, an 80.0% increase in five years.6 The U.S. has managed to limit engagement with the use of air assaults, small tactical units, and economic sanctions. A number of nations (including the United States), however, could seek to engage a substantial number of ground troops in an effort to overthrow terrorist factions in the Middle East. The potential impact of a full-scale war could prove to be a heavy burden for the economy to overcome. Certainly, some industries (e.g., weapon producers, military services companies, and other defense contractors) would benefit from wartime inflation. Yet, given the country spent nearly $1.7 trillion on wars over the past 15 years – and currently faces a $426 billion budget deficit for fiscal year 2015 – the financial burden of committing ground troops to another open-ended war could lead to a dilemma between fiscal responsibility and the country’s moral obligation to maintain world peace.7, 8
Most developed countries limped into 2016, and the outlook will be slow to improve. China’s slowing growth recently prompted officials to lower interest rates six times in a 12-month period. Investor concerns sparked unprecedented capital flows out of the country in 2015 — an estimated pace of $100 billion per month this past summer.9 Additionally, China’s third quarter 2015 GDP dropped to its slowest pace (6.9%) since the global financial crisis – 2016’s GDP will likely be the lowest level in two decades.10 The Japanese economy continues to slump in and out of recession as government officials battle crippling deflation. As of third quarter 2015, the world’s third largest economy had been in recession four times since 2009. The country also faces structural challenges – it has the oldest population of any developed nation with nearly 25.0% of the country’s 128 million people over the age of 65 – which has become a drag on spending and inflation. The Eurozone has experienced slow economic growth as well. As a result, the European
Central Bank (ECB) has embarked upon a relentless commitment to maintain low and even negative interest rates in an effort to spur the economy. This initiative has been effective at attracting investment capital to the regions (particularly for real estate and stock market opportunities), but in doing so, European bond yields plummeted to the lowest point in five hundred years.11 To put this in perspective, as of November 2015 more than $2 trillion of euro-denominated debt (or one-third of euro zone securities) have yields that are less than zero.
The U.S., and to some degree the United Kingdom, have been the lone bright spots in an otherwise challenging growth environment. The International Monetary Fund (IMF) expects global GDP growth of 3.1% in 2015, which would be the slowest expansion since the financial crisis in 2009. The IMF’s 2016 forecast is slightly higher at 3.6%, but remains 20 basis points lower than their original estimate last July. Against this backdrop, it is no wonder the U.S. economy is attracting investment capital from around the world.
14 U.S. PROPERTY MARKET OUTLOOK 2016: HOUSE VIEW
Real Estate Fundamentals
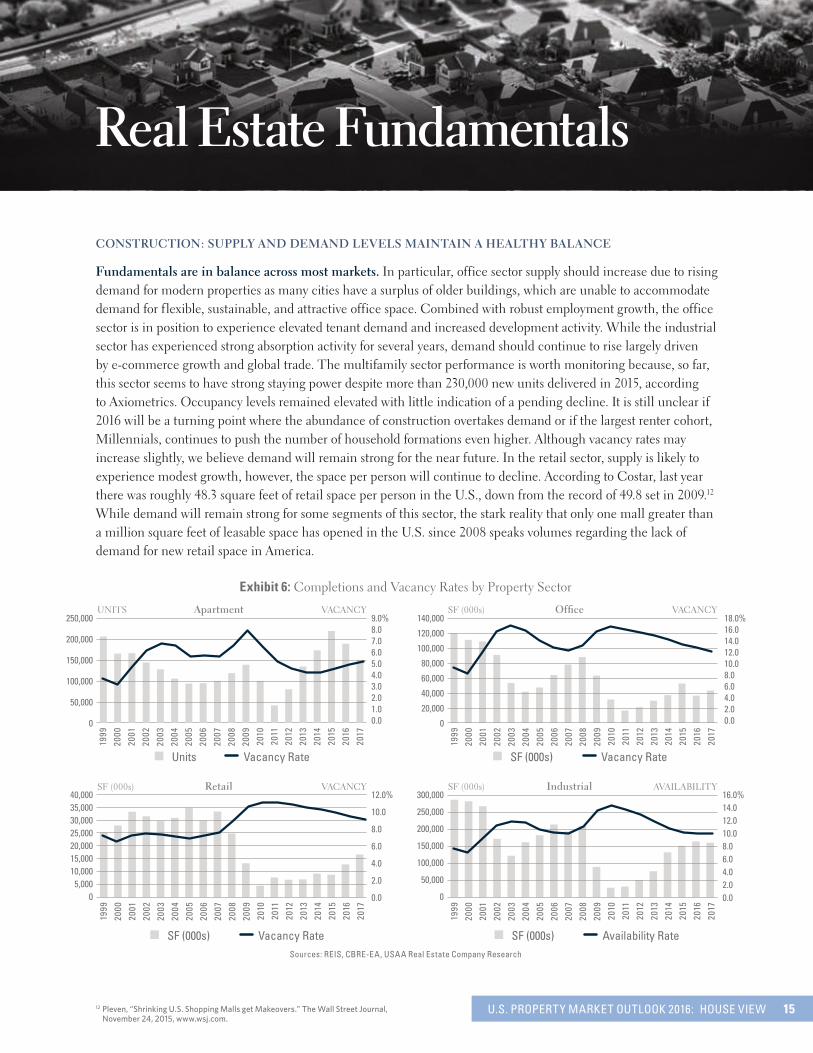
CONSTRUCTION: SUPPLY AND DEMAND LEVELS MAINTAIN A HEALTHY BALANCE
Fundamentals are in balance across most markets. In particular, office sector supply should increase due to rising demand for modern properties as many cities have a surplus of older buildings, which are unable to accommodate demand for flexible, sustainable, and attractive office space. Combined with robust employment growth, the office sector is in position to experience elevated tenant demand and increased development activity. While the industrial sector has experienced strong absorption activity for several years, demand should continue to rise largely driven by e-commerce growth and global trade. The multifamily sector performance is worth monitoring because, so far, this sector seems to have strong staying power despite more than 230,000 new units delivered in 2015, according to Axiometrics. Occupancy levels remained elevated with little indication of a pending decline. It is still unclear if 2016 will be a turning point where the abundance of construction overtakes demand or if the largest renter cohort, Millennials, continues to push the number of household formations even higher. Although vacancy rates may increase slightly, we believe demand will remain strong for the near future. In the retail sector, supply is likely to experience modest growth, however, the space per person will continue to decline. According to Costar, last year there was roughly 48.3 square feet of retail space per person in the U.S., down from the record of 49.8 set in 2009.12 While demand will remain strong for some segments of this sector, the stark reality that only one mall greater than a million square feet of leasable space has opened in the U.S. since 2008 speaks volumes regarding the lack of demand for new retail space in America.
Exhibit 6: Completions and Vacancy Rates by Property Sector
Sources: REIS, CBRE-EA, USAA Real Estate Company Research
Vacancy RateSF (000s) Availability RateSF (000s)
Vacancy RateSF (000s)Vacancy RateUnits
250,000
200,000
150,000
100,000
50,000
0
9.0%8.07.06.05.04.03.02.01.00.0
1999
2000
2001
2002
2003
2004
2005
2006
2007
2008
2009
2010
2011
2012
2013
2014
2015
2016
2017
UNITS VACANCYApartment
40,00035,00030,00025,00020,00015,00010,000
5,0000
12.0%
10.0
8.0
6.0
4.0
2.0
0.0
1999
2000
2001
2002
2003
2004
2005
2006
2007
2008
2009
2010
2011
2012
2013
2014
2015
2016
2017
SF (000s) VACANCYRetail16.0%14.012.010.08.06.04.02.00.0
300,000
250,000
200,000
150,000
100,000
50,000
0
1999
2000
2001
2002
2003
2004
2005
2006
2007
2008
2009
2010
2011
2012
2013
2014
2015
2016
2017
SF (000s) AVAILABILITYIndustrial
140,000
120,000
100,000
80,000
60,000
40,000
20,000
0
18.0%16.014.012.010.08.06.04.02.00.0
1999
2000
2001
2002
2003
2004
2005
2006
2007
2008
2009
2010
2011
2012
2013
2014
2015
2016
2017
SF (000s) VACANCYOffice
12Pleven,“ShrinkingU.S.ShoppingMallsgetMakeovers.”TheWallStreetJournal, November24,2015,www.wsj.com.
U.S. PROPERTY MARKET OUTLOOK 2016: HOUSE VIEW 15
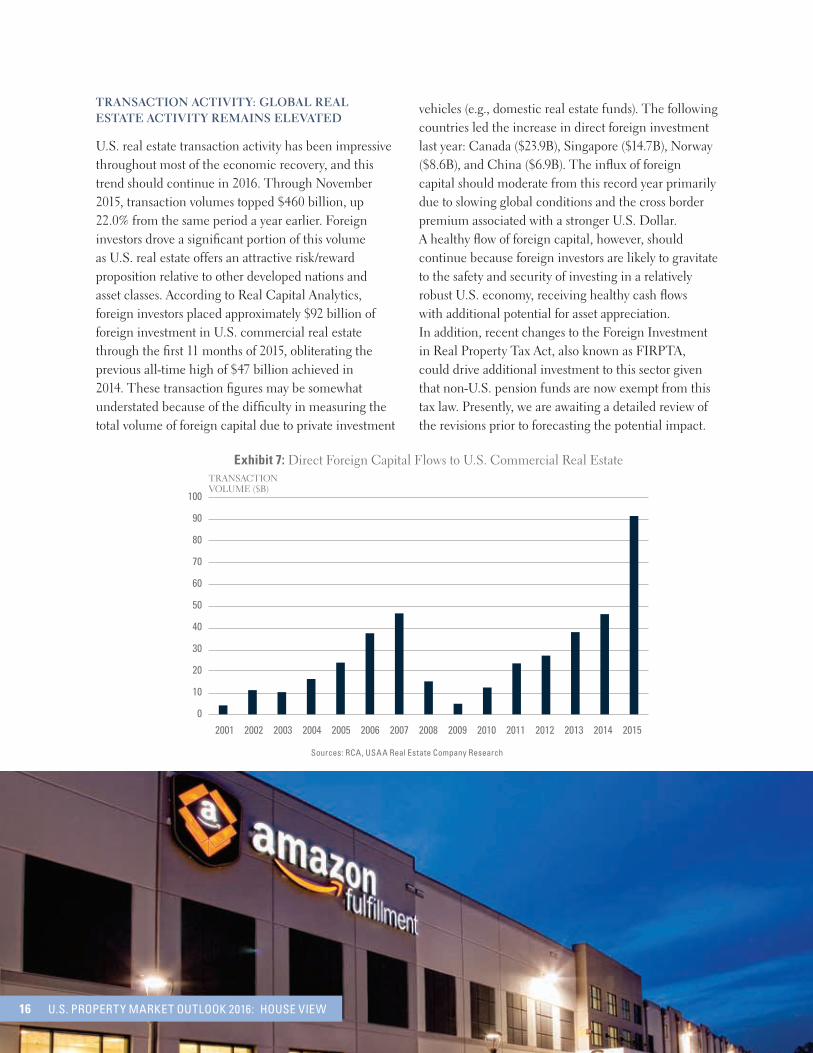
TRANSACTION ACTIVITY: GLOBAL REAL ESTATE ACTIVITY REMAINS ELEVATED
U.S. real estate transaction activity has been impressive throughout most of the economic recovery, and this trend should continue in 2016. Through November 2015, transaction volumes topped $460 billion, up 22.0% from the same period a year earlier. Foreign investors drove a significant portion of this volume as U.S. real estate offers an attractive risk/reward proposition relative to other developed nations and asset classes. According to Real Capital Analytics, foreign investors placed approximately $92 billion of foreign investment in U.S. commercial real estate through the first 11 months of 2015, obliterating the previous all-time high of $47 billion achieved in 2014. These transaction figures may be somewhat understated because of the difficulty in measuring the total volume of foreign capital due to private investment
vehicles (e.g., domestic real estate funds). The following countries led the increase in direct foreign investment last year: Canada ($23.9B), Singapore ($14.7B), Norway ($8.6B), and China ($6.9B). The influx of foreign capital should moderate from this record year primarily due to slowing global conditions and the cross border premium associated with a stronger U.S. Dollar. A healthy flow of foreign capital, however, should continue because foreign investors are likely to gravitate to the safety and security of investing in a relatively robust U.S. economy, receiving healthy cash flows with additional potential for asset appreciation. In addition, recent changes to the Foreign Investment in Real Property Tax Act, also known as FIRPTA, could drive additional investment to this sector given that non-U.S. pension funds are now exempt from this tax law. Presently, we are awaiting a detailed review of the revisions prior to forecasting the potential impact.
Sources: RCA, USAA Real Estate Company Research
100
90
80
70
60
50
40
30
20
10
0
2001 2002 2003 2004 2005 2006 2007 2008 2009 2010 2011 2012 2013 2014 2015
Exhibit 7: Direct Foreign Capital Flows to U.S. Commercial Real EstateTRANSACTION VOLUME ($B)
16 U.S. PROPERTY MARKET OUTLOOK 2016: HOUSE VIEW
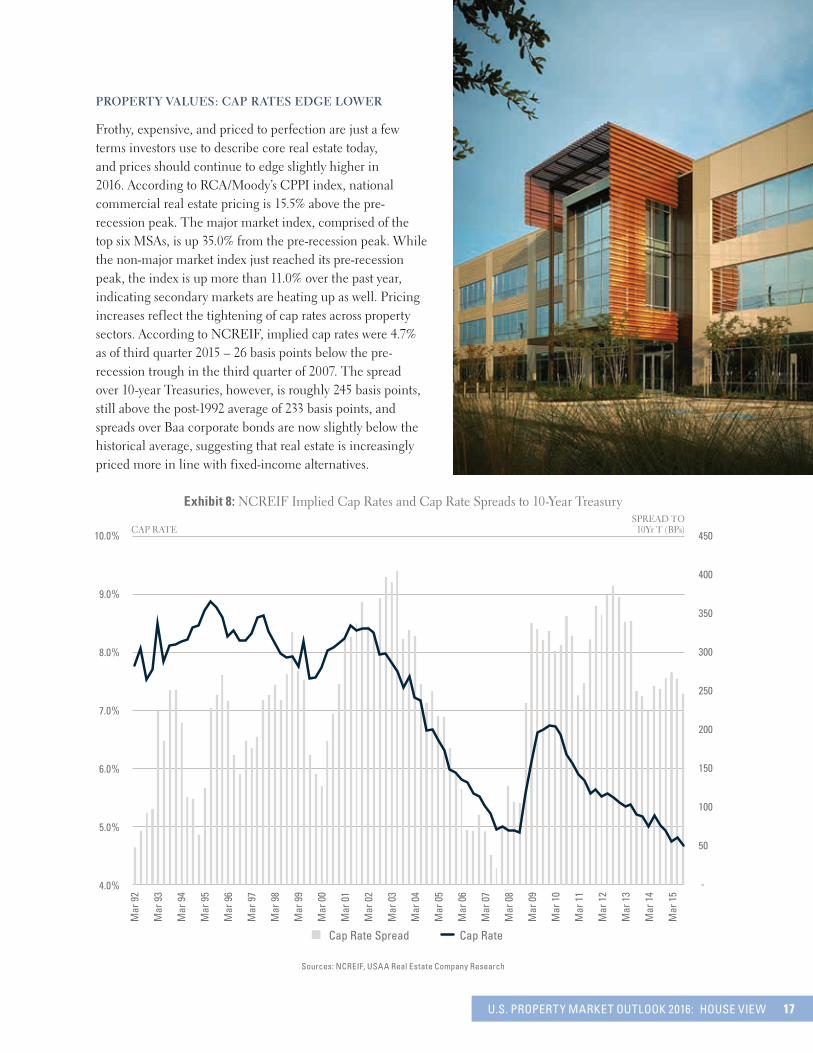
PROPERTY VALUES: CAP RATES EDGE LOWER
Frothy, expensive, and priced to perfection are just a few terms investors use to describe core real estate today, and prices should continue to edge slightly higher in 2016. According to RCA/Moody’s CPPI index, national commercial real estate pricing is 15.5% above the pre-recession peak. The major market index, comprised of the top six MSAs, is up 35.0% from the pre-recession peak. While the non-major market index just reached its pre-recession peak, the index is up more than 11.0% over the past year, indicating secondary markets are heating up as well. Pricing increases reflect the tightening of cap rates across property sectors. According to NCREIF, implied cap rates were 4.7% as of third quarter 2015 – 26 basis points below the pre-recession trough in the third quarter of 2007. The spread over 10-year Treasuries, however, is roughly 245 basis points, still above the post-1992 average of 233 basis points, and spreads over Baa corporate bonds are now slightly below the historical average, suggesting that real estate is increasingly priced more in line with fixed-income alternatives.
Exhibit 8: NCREIF Implied Cap Rates and Cap Rate Spreads to 10-Year Treasury
10.0 %
9.0 %
8.0 %
7.0 %
6.0 %
5.0 %
4.0 %
Mar
92
Mar
93
Mar
94
Mar
95
Mar
96
Mar
97
Mar
98
Mar
99
Mar
00
Mar
01
Mar
02
Mar
03
Mar
04
Mar
05
Mar
06
Mar
07
Mar
08
Mar
09
Mar
10
Mar
11
Mar
12
Mar
13
Mar
14
Mar
15
450
400
350
300
250
200
150
100
50
-
Cap RateCap Rate Spread
Sources: NCREIF, USAA Real Estate Company Research
CAP RATESPREAD TO
10Yr T (BPs)
U.S. PROPERTY MARKET OUTLOOK 2016: HOUSE VIEW 17
Conclusion
We remain cautiously optimistic regarding the U.S. economic and real estate market outlook in 2016. Investors will have to balance improving domestic fundamentals against increasingly uncertain global economic and geopolitical conditions. Many of the prevailing issues are unwieldy so we plan to focus on the things that we can control such as adhering to our investment principles, maintaining a disciplined due diligence process, and being selectively aggressive when opportunities arise. As the current real estate
cycle approaches its later stages, our portfolio strategy has become more defensive. We are actively pursuing stable assets that are capable of withstanding an economic downturn, as well as multiple debt strategies that enable us to participate at more attractive positions in the capital stack. It is too soon to call an end to the current bull market, but global economic instability and evolving monetary policy could make for a volatile investment environment in 2016.
18 U.S. PROPERTY MARKET OUTLOOK 2016: HOUSE VIEW

THE FOLLOWING ARE RECENT USAA REALCO RESEARCH REPORTS THAT ARE AVAILABLE ON OUR WEBSITE (USREALCO.COM):
A Real Estate Investing with Uncle Sam
A Will an Inverted Yield Curve Predict the Next Recession…Again
A How China’s Economic Malaise could affect U.S. Real Estate Markets
A E-Commerce: The Implications for Retail Real Estate
A E-Commerce: The Implications for Industrial Real Estate
A The Impact of Oil Prices on US Real Estate Markets
A USAA Eagle Real Estate Fund - Portfolio Construction Philosophy
A 2015 House View
A Mid-Year 2015 House View
U.S. PROPERTY MARKET OUTLOOK 2016: HOUSE VIEW 19

IMPORTANT DISCLOSURESThese materials represent the opinions and recommendations of the author(s) and are subject to change without notice. USAA Real Estate Company, its affiliates and personnel may provide market commentary or advice that differs from the recommendations contained herein. Certain information has been obtained from sources and third parties. USAA Real Estate Company does not guarantee the accuracy or completeness of these materials or accept liability for loss from their use. USAA Real Estate Company and its affiliates may make investment decisions that are inconsistent with the recommendations or views expressed herein.
The opinions and recommendations herein do not take into account the individual circumstances or objectives of any investor and are not intended as recommendations of particular investments or strategies to particular investors. No determination has been made regarding the suitability of any investments or strategies for particular investors.
Research team staff may make or participate in investment decisions that vary from these recommendations and views and may receive compensation based on the overall performance of the USAA Real Estate Company or its affiliates or certain investment funds or products. USAA Real Estate Company and/or its affiliates or clients may be buying, selling, or holding significant positions in investments referred to in this report.
USAA Real Estate Company Tel: 210.641.84169830 Colonnade Blvd., Suite 600 Fax: 210.641.8425San Antonio, TX 78230 Web: www.usrealco.comUSA E-mail: [email protected]
20 U.S. PROPERTY MARKET OUTLOOK 2016: HOUSE VIEW


USAA Real Estate Company 9830 Colonnade Blvd., Suite 600 San Antonio, TX 78230 USA
Tel: 210.641.8416 Fax: 210.641.8425 usrealco.com [email protected]
Top Related
Copyright © 2022 FDOKUMEN

