


Bahasa
Halaman
Hukum


72
BAB 5
SIMPULAN
5.1. Simpulan
Berdasarkan data penelitian yang telah diinterpretasikan, dapat
ditarik kesimpulan :
- Teknik likuisolid untuk membuat tablet lepas lambat klorfeniramin
maleat dengan menggunakan polimer hidrofilik guar gum dan tween
80 sebagai pelarut non volatile dapat memperlambat pelepasan obat.
- Jumlah tween 80 berpengaruh signifikan terhadap kekerasan tablet,
tetapi tidak berpengaruh signifikan terhadap Hausner ratio, Carr’s
index, kerapuhan tablet, dan konstanta disolusi. Konsentrasi guar
gum berpengaruh signifikan terhadap Hausner Ratio, Carr’s Index,
dan kekerasan tablet, tetapi tidak berpengaruh signifikan pada
kerapuhan tablet dan konstanta disolusi. Interaksi dari kedua faktor
hanya berpengaruh signifikan terhadap kekerasan tablet.
- Formula optimum tablet klorfeniramin maleat dapat diperoleh
dengan jumlah pelarut non volatile tween 80 sejumlah 12 mg dan
konsentrasi polimer hidrofilik guar gum 20% dari bobot tablet
dengan hasil teoritis Hausner Ratio sebesar 1,22; Carr’s Index
sebesar 17,66 %; kekerasan tablet sebesar 16,98 Kp; kerapuhan
tablet sebesar 0,16 %; dan nilai konstanta disolusi sebesar 0,0117
mg/menit.
5.2. Alur Penelitian Selanjutnya
Dapat dilakukan penelitian lebih lanjut mengenai tablet lepas
lambat likuisolid dengan mencari dan membuktikan formula optimum
terpilih, kemudian dibandingkan dengan hasil yang secara teoritis.
72

73
DAFTAR PUSTAKA
Al – Saidan, S., Krinaiah, Y., Patro, S., Satyanaryana, V., 2005, In vitro and In Vivo Evaluation of Guar gum Matrix Tablets for Oral Controlled Release of Water Soluble Diltiazem Hydrochloride, AAPS Pharm SciTech, 6 (1), 14-21. Anonim, 1979, Farmakope Indonesia, ed. III, Departemen Kesehatan RI, Jakarta, 6-8, 153. Anonim, 1995, Farmakope Indonesia, ed. IV, Departemen Kesehatan RI, Jakarta, 4, 166, 211, 449-450, 488-489, 515, 683, 783-784, 999-1000. Anonim, 1997, AHFS, Drug Information AMERICAN Society of Health Sytem Pharmacist, Inc., Bethesda, 13-15. Anonim, 2001, Merc index, Merck & Co Inc, Whitehouse Station. Anonim, 2011, Molecular Ingredients: Xanthan gum. Available at : http://wellspringchem.com/html products/html products/Microcrystaline-Cellulose-PH102-126.html Ansel, C. H. 1989. Pengantar Bentuk Sediaan Farmasi. Edisi keempat. Penerjemah Farida Ibrahim. Universitas Indonesia Press. Jakarta. Association of Official Analytical Chemist (AOAC), 1975, Infra Red and Ultraviolet Spectra of Some Compounds of Pharmaceutical Interest, Washington, D.C., 246.
Aulton, M.E., 2002, Pharmaceutics The Science of Dossage Form Design, 2nd Edition, Churchill Livingstone, UK. Banakar, U.V., 1992, Pharmaceutical Disolution Testing, Marcel Dekker Inc., New York, 19-25. Banker, G.S. and N.R. Anderson, 1986, Tablet, in: The Theory and Practice of Industrial Pharmacy: Tablet, L. Lachman, H.A. Lieberman, and J.L. Kanig (Eds.), 3rd ed., Lea and Febiger, Philadelphia, 259, 295, 299, 316 – 329.
73

74
Bolton. S., 1990, Pharmaceutical Statistic: Pratical and Clinical Applications, 2nd edition, Marcel Dekker, Inc., New York, 324-427. Chaplin M, [2006, April 19], Guar Gum, [Online], http://www.isbu.ac.uk/water/hygua.html. [2006, August 11]. Collet, J. and C. Moreton, 2002, Modified-release peroral dosage form. Pharmaceutical The Science of Dossage Form design, 2nd edition, De Montfort University, Leicester, 299-302. Costa, P. and Sousa Lobo, J.M., 2000, Modelling and Comparison of Dissolution Profiles, Journal of Pharmaceutical Sciences, European, 123-133. Forner, D.E., Anderson, N.R., Banker, G.S. Rosanke, T.W., and Gordon, R.E., 1981, Granulation and Tablet Characteristic, In Lieberman, H.A., Lachman, L., and Schwart, J.B. (Eds.): Pharmaceutical Dosage Form: Tablet, Volume 2, 2nd Edition, Marcel Dekker, Inc., New York. Green, J.M., 1996, A Practical Guide to Analytical Method Validation. Analytical Chemistry, 23, 305-309. Javadzadech, Y., M.R. Siahi, M.B. Jalali,and A. Nokhodchi, 2005, Enhancement of Dissolution Rate of Piroxicam Using Liquisolid Compacts, International Journal of Pharmaceutics, Farmaco Societa Chimia Italiana, 60, 361-365. Javadzadech,Y., Musaalrezaei, L., and A. Nokhodchi, 2008, Liquisolid Technique as a New Aproach to Sustain Propanolol Hydrochloride Release from Tablet Matrices , International Journal of Pharmaceutics, 102-108. Karmarkar, A.B., I.D.Gonjari, A.H. Hosmani, P.N. Dhabale, and S.B. Bhise, 2009, Liquisolid Tablets: A Novel Approach for Drug Delivery, International Journal of Health Research, 2(1), 45-50. Khan, K.A., 1975,The Concept of Dissolution Efficiency, J. Pharmac, 27, 48-49.
Kibbe, A.H. , 2000, Handbook of Pharmaceutical Excipients, 3rd ed., The Pharmaceutical Press, London, 102, 143, 305, 501, 555.

75
Kulkarni, Ajit S., A. Nagesh H., M. Madhav S., and G. Jayashree B., 2010, Liquisolid System : A Review, vol.3, Departement of Pharmaceutics, Satara College of Pharmacy, India, 797. Lachman L., Lieberman H.A., Kauig J.L (Eds.), 1994, Teori & Praktek Farmasi Industri II, (Suyatmi S, penerjemah), edisi 3, Penerbit Universitas Indonesia, Jakarta, 643-731. Maier, H., M. Anderson, C. Karl, and K. Majauson, 1993, Guar, locust bean, tara and fenugreek gums In: Industrial Gums : Polysaccharides and Their Derivaties, R. L. Whistler, and J. N. Bemiller (Eds.), 3rd ed., Academic Press, Inc., San Diego, 145-175. Martin, A., J. Swarbrick, dan A. Cammarata, 1993, Farmasi Fisik: Dasar-dasar Kimia Fisika dalam Ilmu Farmasetik, vol. 2, ed. 3, terjemahan Yoshita, Universitas Indonesia, Jakarta, 1135. Parrott, E.L., 1971, Pharmaceutical Technology Fundamental Pharmaceutics, 3rd ed., Burgess Publishing Company, Minneapolis, 17-19, 82, 160-162. Shargel, L. and A. B. C. Yu, 1999, Applied Biopharmaceutics and Pharmacokinetics, 4th ed. McGraw – Hill. New York, 8, 132, 169-200. Shervington, L.A. and A. Shervington, 1998, Guaifenesin, In: Analytical Profiles of Drug Substance and Excipients, H.G. Brittain (Ed.), vol. 25, Academic Press, London,152. Siregar, Ch. J. P., 1992, Proses validasi dan Manufaktur Sediaan tablet, In : Asyarie S., U. Mar’u, S. Badruzzaman (Eds), Prosiding Seminar Validasi di Industri Farmasi, Jurusan Farmasi FMIPA ITB, Bandung, 26 – 41. Spireas, S., 2002, Liquisolid System and Methods of Preparation Same, Pharmaceutical Research, vol 9, 1-6. Voigt, R., 1995, Buku Pelajaran Teknologi Farmasi, Terjemahan S. Noerono dan M. S. Reksohardiprojo, Gadjah Mada University Press, Yogyakarta, 163-210.
76
Wells, J.T., 1988, Pharmaceutical Pre formulation: The Physiochemical Properties of Drugs Substances, Ellis Howard, Chester, 209-211.
Yadav, V.B. and A.V. Yadav, 2009, Liquisolid Granulation Technique for
Tablet Manufacturing : an Overview, Journal of Pharmacy Research
2009, 2(4), 670-674. Zainuddin, M., 2000, Validasi Metode Analisis Kuantitatif Secara Spektrofotometris Ultra Ungu – Sinar Tampak (UV-VIS), Universitas Airlangga, Surabaya. Zhang, Y., Law, Y., and Chakrabarti, S., 2003, Physical Properties and Compact Analysis of Commonly Used Direct Compression Binders, AAPS PharmSciTech, 4 (4), article 62.

77
LAMPIRAN A
HASIL UJI MUTU FISIK MASSA TABLET
Mutu fisik yang diuji
Replikasi
Formula Tablet Likuisolid Klorfeniramin Maleat Persyaratan
FA FB FC FD
Hausner Ratio
I 1,20 1,22 1,24 1,24
< 1,25 (Wells, 1988)
II 1,20 1,24 1,23 1,24
III 1,23 1,21 1,24 1,23
Rata-rata 1,21 1,22 1,24 1,24
SD 0,02 0,02 0,01 0,01
Carr’s Index (%)
I 17 18 19,99 19,99
16 - 20 = cukup baik (Siregar,
1992)
II 16,99 19,99 19 19,99
III 19 18 19,99 19
Rata-rata 17,66 18,66 19,66 19,66
SD 1,16 1,15 0,57 0,57

78
LAMPIRAN B
HASIL UJI KERAGAMAN BOBOT TABLET LIKUISOLID KLORFENIRAMIN MALEAT
Hasil Uji Keragaman Bobot Tablet Formulasi A
No
Replikasi I Replikasi II Replikasi III
Bobot Tablet (mg)
Y (%)
Bobot Tablet (mg)
Y (%)
Bobot Tablet (mg)
Y (%)
1 512,3 99,03 508,4 100,11 505,6 99,17 2 511,1 98,80 501,8 98,81 506,9 99,43 3 497,6 96,19 510,6 100,54 516,8 101,37 4 510,7 98,72 509,9 100,40 490,9 96,29 5 509,4 98,47 510,1 100,44 510,5 100,14 6 506,7 97,95 509,9 100,40 511,5 100,33 7 510,3 98,64 513,5 101,11 520,1 102,02 8 498,5 96,36 511,5 100,72 509,7 99,98 9 509,8 98,55 517,3 101,86 515,5 101,12
10 509,6 98,51 510,3 100,48 519,3 101,86 Rata-rata 507,6 98,12 510,3 100,49 509,6 99,98
PK (%) 98,11 100,48 99,96
SD 1,01 0,77 1,68 KV 1,03 0,76 1,68
Keterangan: PK = Penetapan Kadar SD = Standart Deviasi KV = Koefisien Variasi

79
Hasil Uji Keragaman Bobot Tablet Formulasi B
No
Replikasi I Replikasi II Replikasi III
Bobot Tablet (mg)
Y (%)
Bobot Tablet (mg)
Y (%)
Bobot Tablet (mg)
Y (%)
1 510,6 98,66 503,4 98,09 490,8 96,96 2 515,2 99,55 501,4 97,71 508,7 100,50 3 520,8 90,63 510,5 99,48 508,9 100,54 4 509,6 98,46 514,0 100,16 510,1 100,77 5 511,6 98,85 519,7 101,27 505,5 99,87 6 507,9 98,13 500,9 97,61 490,5 96,90 7 510,5 98,64 500,5 97,53 513,5 101,45 8 510,3 96,36 510,8 99,54 507,9 100,34 9 520,9 98,60 500,8 97,59 510,4 100,83 10 519,8 100,43 500,9 97,61 512,4 101,23
Rata-rata 513,72 98,26 506,29 98,66 505,87 99,94
PK (%) 98,26 98,66 99,94
SD 0,97 1,35 1,64 KV 0,98 1,37 1,65

80
Hasil Uji Keragaman Bobot Tablet Formulasi C
No
Replikasi I Replikasi II Replikasi III
Bobot Tablet (mg)
Y (%)
Bobot Tablet (mg)
Y (%)
Bobot Tablet (mg)
Y (%)
1 506,7 100,94 511,9 101,42 510,4 99,10 2 497,9 99,19 498,7 98,80 509,1 98,85 3 504,0 100,40 487,8 96,64 520,1 100,99 4 508,1 101,22 501,3 99,32 510,8 99,18 5 507,9 101,18 509,4 100,92 514,7 99,94 6 508,1 101,22 510,4 101,12 508,0 98,64 7 499,6 99,53 509,8 101,00 505,5 98,15 8 501,3 99,86 505,9 100,23 511,3 99,28 9 508,2 101,24 501,1 99,28 519,7 100,91 10 502,5 100,10 504,1 99,87 507,6 98,56
Rata-rata 504,43 101,16 504,04 99,86 511,72 99,36 PK (%) 101,16 99,86 99,36
SD 0,78 1,44 0,96 KV 0,78 1,44 0,97

81
Hasil Uji Keragaman Bobot Tablet Formulasi D
No
Replikasi I Replikasi II Replikasi III
Bobot Tablet (mg)
Y (%)
Bobot Tablet (mg)
Y (%)
Bobot Tablet (mg)
Y (%)
1 510,3 98,68 516,4 100,52 490,6 95,56 2 510,5 98,72 510,4 101,32 507,9 98,93 3 504,7 97,60 501,9 99,63 509,6 99,26 4 518,3 100,23 509,5 101,14 497,8 96,96 5 506,2 97,89 507,7 100,78 517,7 100,83 6 505,2 97,69 515,1 102,25 518,6 101,01 7 500,6 96,80 500,6 99,37 500,3 97,45 8 500,1 96,71 501,3 99,51 509,6 99,26 9 508,9 98,41 500,7 99,39 516,7 100,64 10 507,6 98,16 502,3 99,71 495,5 96,51
Rata-rata 507,24 98,10 505,59 100,56 506,43 98,09
PK (%) 98,10 100,56 98,64
SD 1,02 0,99 1,93 KV 1,04 0,99 1,96

82
LAMPIRAN C
HASIL UJI KESERAGAMAN KANDUNGAN TABLET LIKUISOLID KLORFENIRAMIN MALEAT
Hasil uji Keseragaman Kandungan Tablet Formula A Replikasi I
Abs C sampel (µg/mL) W sampel (mg) C teoritis (µg/mL) Kadar (%) 0,169 12,07 500,3 12,01 100,56 0,163 11,63 500,8 12,02 96,74 0,171 12,22 510,4 12,25 99,79 0,169 12,07 510,2 12,24 98,61 0,165 11,78 500,4 12,01 98,06 0,17 12,15 510,5 12,25 99,16 0,171 12,22 511,6 12,28 99,56 0,172 12,30 511,5 12,28 100,18 0,175 12,52 510,8 12,26 102,15 0,168 12 510,1 12,24 98,02
Rata-rata 99,28 SD 1,53 KV 1,54
Hasil Uji Keseragaman Kandungan Tablet Formula A Replikasi II
Abs C sampel (µg/mL) W sampel (mg) C teoritis (µg/mL) Kadar (%) 0,17 12,15 510,8 12,26 99,10 0,169 12,07 512,7 12,30 98,13 0,171 12,22 509,4 12,23 99,99 0,173 12,37 510,8 12,26 100,93 0,176 12,60 510,4 12,25 102,59 0,176 12,60 514,9 12,36 101,94 0,179 12,82 511,6 12,28 104,42 0,17 12,15 510,5 12,25 99,16 0,171 12,22 518,6 12,45 98,21 0,169 12,07 508,7 12,21 98,90
Rata-rata 100,12 SD 1,69 KV 1,68

83
Hasil Uji Keseragaman Kandungan Tablet Formula A Replikasi III
Abs C sampel (µg/mL) W sampel (mg) C teoritis (µg/mL) Kadar (%) 0,169 12,07 500,8 12,02 100,46 0,17 12,15 509,4 12,23 99,38 0,176 12,60 508,5 12,20 103,22 0,179 12,82 510,6 12,25 104,62 0,169 12,07 495,5 11,89 101,54 0,168 12,00 500,5 12,01 99,90 0,172 12,30 512,8 12,31 99,93 0,17 12,15 508,9 12,21 99,47 0,175 12,52 510,2 12,24 102,27 0,174 12,45 509,8 12,24 101,73
Rata-rata 101,25 SD 1,75 KV 1,73
Hasil Uji Keseragaman Kandungan Tablet Formula B Replikasi I
Abs C sampel (µg/mL) W sampel (mg) C teoritis (µg/mL) Kadar (%)
0,174 12,45 506,7 12,16 102,36 0,175 12,52 497,9 11,95 104,79 0,174 12,45 504 12,10 102,91 0,171 12,22 508,2 12,20 100,22 0,17 12,15 507,4 12,18 99,77 0,169 12,07 508,6 12,21 98,92 0,17 12,15 509,6 12,23 99,34 0,172 12,30 501,3 12,03 102,22 0,174 12,45 508,2 12,20 102,06 0,167 11,93 502,5 12,06 98,88
Rata-rata 101,15 SD 2,00 KV 1,98

84
Hasil Uji Keseragaman Kandungan Tablet Formula B Replikasi II
Abs C sampel (µg/mL) W sampel (mg) C teoritis (µg/mL) Kadar (%) 0,175 12,52 511,9 12,29 101,93 0,173 12,37 498,7 11,97 103,38 0,171 12,22 497,8 11,95 102,32 0,169 12,07 501,3 12,03 100,36 0,168 12,00 513,9 12,33 97,30 0,169 12,07 510,9 12,26 98,48 0,173 12,37 509,8 12,24 101,13 0,175 12,52 505,9 12,14 103,14 0,173 12,37 511,1 12,27 100,87 0,168 12,00 504,2 12,10 99,17
Rata-rata 100,81 SD 2,01 KV 1,99
Hasil Uji Keragaman Kandungan Tablet Formula B Replikasi III
Abs C sampel (µg/mL) W sampel (mg) C teoritis (µg/mL) Kadar (%)
0,166 11,85 501,4 12,03 98,48 0,167 11,93 500,1 12,00 99,36 0,17 12,15 516,3 12,39 98,05 0,174 12,45 510,8 12,26 101,54 0,175 12,52 514,7 12,35 101,37 0,168 12,00 508,1 12,19 98,41 0,17 12,15 505,3 12,13 100,18 0,174 12,45 501,4 12,03 103,44 0,172 12,30 510,6 12,25 100,36 0,172 12,30 508,5 12,20 100,77
Rata-rata 100,20 SD 1,68 KV 1,68

85
Hasil Uji Keseragaman Kandungan Tablet Formula C Replikasi I
Abs C sampel (µg/mL) W sampel (mg) C teoritis (µg/mL) Kadar (%) 0,168 12 507,8 12,19 98,46 0,166 11,85 499,6 11,99 98,84 0,171 12,22 508,7 12,21 100,12 0,174 12,45 500,5 12,01 103,63 0,165 11,78 500,4 12,01 98,06 0,169 12,07 510 12,24 98,65 0,172 12,30 512,1 12,29 100,07 0,172 12,30 511,3 12,27 100,22 0,17 12,15 510,6 12,25 99,14 0,164 11,70 500,3 12,01 97,45
Rata-rata 9,46 SD 1,73 KV 1,74
Hasil Uji Keseragaman Kandungan Tablet Formula C Replikasi II
Abs C sampel (µg/mL) W sampel (mg) C teoritis (µg/mL) Kadar (%) 0,17 12,15 499,8 11,99 101,28 0,167 11,93 500,6 12,01 99,26 0,171 12,22 500,5 12,01 101,76 0,166 11,85 500,4 12,01 98,68 0,165 11,78 490,9 11,78 99,95 0,174 12,45 510 12,24 101,70 0,173 12,37 500,1 12,00 103,09 0,171 12,22 501,3 12,03 101,60 0,175 12,52 500,9 12,02 104,17 0,169 12,07 510,6 12,25 98,53
Rata-rata 101,00 SD 1,87 KV 1,85

86
Hasil Uji Keseragaman Kandungan Tablet Formula C Replikasi III
Abs C sampel (µg/mL) W sampel (mg) C teoritis (µg/mL) Kadar (%) 0,166 11,85 500,8 12,02 98,60 0,176 12,60 502,4 12,06 104,47 0,172 12,30 503,7 12,09 101,73 0,167 11,93 490,5 11,77 101,30 0,167 11,93 500,4 12,01 99,30 0,17 12,15 510,2 12,24 99,22 0,173 12,37 511,1 12,27 100,87 0,175 12,52 503,2 12,08 103,69 0,169 12,07 500,6 12,01 100,50 0,17 12,15 500,8 12,02 101,08
Rata-rata 101,08 SD 1,88 KV 1,86
Hasil Uji Keseragaman Kandungan Tablet Formula D Replikasi I
Abs C sampel (µg/mL) W sampel (mg) C teoritis (µg/mL) Kadar (%)
0,169 12,07 508,7 12,21 98,90 0,172 12,30 510,6 12,25 100,36 0,171 12,22 508,7 12,21 100,12 0,169 12,07 510,5 12,25 98,55 0,166 11,85 500,3 12,01 98,70 0,174 12,45 512,6 12,30 101,18 0,172 12,30 512,1 12,29 100,07 0,169 12,07 511,8 12,28 98,30 0,173 12,37 500,6 12,01 102,99
0,17 12,15 510,2 12,24 99,22 Rata-rata 99,84 SD 1,44 KV 1,44

87
Hasil Uji Keseragaman Kandungan Tablet Formula D Replikasi II
Abs C sampel (µg/mL) W sampel (mg) C teoritis (µg/mL) Kadar (%) 0,169 12,07 507,9 12,19 99,06 0,166 11,85 509,8 12,24 96,86 0,175 12,52 510,4 12,25 102,23 0,168 12,00 500,5 12,01 99,90 0,166 11,85 500,1 12,00 98,74 0,166 11,85 500,6 12,01 98,68 0,17 12,15 516,4 12,39 98,03 0,173 12,37 508,5 12,20 101,39 0,169 12,07 510,7 12,26 98,51 0,166 11,85 503,4 12,08 98,09
Rata-rata 99,14 SD 1,62 KV 1,63
Hasil Uji Keseragaman Kandungan Tablet Formula D Replikasi III
Abs C sampel (µg/mL) W sampel (mg) C teoritis (µg/mL) Kadar (%) 0,17 12,15 490,6 11,77 103,18 0,168 12,00 496,6 11,92 100,68 0,172 12,30 510,2 12,24 100,44 0,17 12,15 507,4 12,18 99,77 0,168 12,00 506,9 12,17 98,64 0,169 12,07 507,9 12,19 99,06 0,166 11,85 502,1 12,05 98,34 0,174 12,45 513,7 12,33 100,96 0,171 12,22 513,2 12,32 99,25 0,169 12,07 510,3 12,25 98,59
Rata-rata 99,89 SD 1,48 KV 1,48

88
LAMPIRAN D
HASIL UJI KEKERASAN TABLET LIKUISOLID KLORFENIRAMIN MALEAT
REPLIKASI I
No Kekerasan Tablet Likuisolid Klorfeniramin Maleat
(Kp) Formula A Formula B Formula C Formula D
1 17,8 10,7 10,7 5,4 2 17,3 11,1 10,7 5,0 3 17,8 10,2 10,2 5,5 4 17,9 10,0 10,4 6,7 5 17,0 10,0 10,1 6,9 6 17,3 11,2 10,8 5,4 7 17,5 10,2 9,8 6,3 8 17,8 10,5 10,6 6,9 9 17,5 10,2 10,7 5,0 10 17,2 10,4 9,9 6,1
Rata-rata ± SD 17,51± 0,31 10,45±0,43 10,39±0,36 5,92± 0,75
KV 1,77 4,11 3,46 12,67

89
REPLIKASI II
No Kekerasan Tablet Likuisolid Klorfeniramin Maleat
(Kp) Formula A Formula B Formula C Formula D
1 16,2 10,3 10,1 4,5 2 16,3 11,1 10,2 5,0 3 16,1 10,3 10,2 4,8 4 16,0 10,1 10,2 5,1 5 16,0 10,0 10,0 5,4 6 16,1 10,5 10,1 5,3 7 16,2 11,3 10,7 5,3 8 16,8 11,4 10,0 5,0 9 16,5 11,7 10,4 5,0 10 16,2 11,2 10,2 5,1
Rata-rata ± SD 16,24 ±0,25 10,79 ±0,61 10,21 ±0,21 5,05 ±0,26
KV 1,54 5,65 2,06 5,15
REPLIKASI III
No Kekerasan Tablet Likuisolid Klorfeniramin Maleat (Kp)
Formula A Formula B Formula C Formula D 1 17,5 11,7 10,2 4,8 2 17,4 11,5 10,1 4,8 3 16,7 10,8 10,1 5,2 4 17,0 10,7 10,3 5,6 5 17,3 10,5 10,8 5,2 6 17,2 10,4 10,1 5,0 7 17,2 10,4 10,1 5,0 8 17,1 11,9 10,2 4,5 9 17,3 10,5 10,7 5,2
10 17,2 10,1 10,3 5,3 Rata-rata ±
SD 17,19±0,22 10,89±0,62 10,29± 0,26 5,06 ± 0,31
KV 1,28 5,69 2,53 6,13

90
LAMPIRAN E
HASIL UJI KERAPUHAN TABLET LIKUISOLID KLORFENIRAMIN MALEAT
Formula Replikasi Berat awal Berat akhir Kerapuhan Rata-
rata ±SD
KV (gram) (gram) (%)
A I 10,05 10,03 0,19 0,16 II 10,13 10,12 0,09 ± 37,5 III 9,78 9,76 0,20 0,06
B I 10,11 11,10 0,09 0,097 II 9,90 9,89 0,10 ± 6,2 III 9,67 9,66 0,10 0,006
C I 10,00 9,99 0,10 0,13 II 9,78 9,76 0,20 ± 4,15 III 10,00 9,99 0,10 0,06
D I 9,41 9,39 0,21 0,17 II 10,40 10,38 0,19 ± 35,29 III 9,82 9,81 0,10 0,06
91
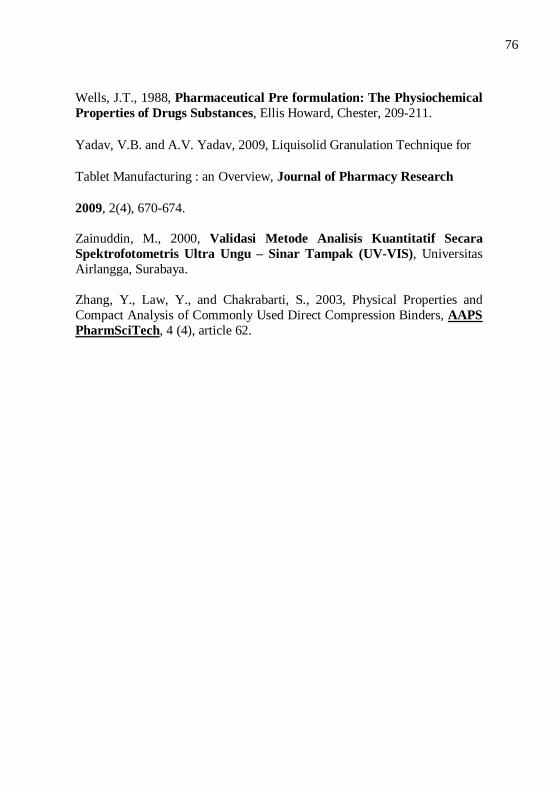
LAMPIRAN F
HASIL KLORFENIRAMIN MALEAT TERLARUT DALAM TWEEN 80 SELAMA 24 JAM
Absorbansi
Konsentrasi (µg/mL)
Dalam 50 mL(µg)
Konsentrasi sesungguhnya
(µg/mL)
Rata-rata ±
SD
Kelarutan
0,11 7,67 383,5 15.340 16.386 ± 0,45 1:61 0,121 8,49 424,5 16.980
0,12 8,42 421 16.840

92
LAMPIRAN G
HASIL PENETAPAN KADAR TABLET LIKUISOLID KLORFENIRAMIN MALEAT
FORMULA A
Replikasi Massa (mg) Absorbansi C sampel (ppm) C teoritis (ppm) % Kadar Rata-rata SD KV
1 500,1 0,165 11,78 12 98,11 2 500,7 0,169 12,07 12,02 100,48 99,52 1,24 1,25
3 500,2 0,168 12 12 99,96
FORMULA B
Replikasi Massa (mg) Absorbansi C sampel (ppm) C teoritis (ppm) % Kadar Rata-rata SD KV
1 500,6 0,167 11,93 12,01 99,26 2 500,5 0,166 11,85 12,01 98,66 99,29 0,64 0,65 3 500,3 0,168 12 12 99,94

93
FORMULA C
Replikasi Massa (mg) Absorbansi C sampel (ppm) C teoritis (ppm) % Kadar Rata-rata SD KV
1 500,4 0,17 12,15 12,01 101,16 2 500,7 0,168 12 12,02 99,86 100,13 0,93 0,93
3 500,1 0,167 11,92 12 99,36
FORMULA D
Replikasi Massa (mg) Absorbansi C sampel (ppm) C teoritis (ppm) % Kadar Rata-rata SD KV
1 500,2 0,165 11,78 12 98,10
2 500,3 0,169 12,07 12,01 100,56 99,10 1,30 1,31
3 500,6 0,166 12,01 12,01 98,64

94
LAMPIRAN H
HASIL UJI DISOLUSI TABLET LIKUISOLID KLORFENIRAMIN MALEAT
FORMULA A
Replikasi t (menit) A C (µg/mL) Wt (mg) % obat terlepas Wt∞-
Wt
30 0,062 4,09 3,68 31,26 7,79 60 0,081 5,51 4,96 42,10 6,51 120 0,103 7,15 6,43 54,65 5,04 180 0,122 8,57 7,71 65,49 3,76 240 0,126 8,87 7,979 67,77 3,49
I 300 0,137 9,69 8,72 74,05 2,75 360 0,149 10,58 9,52 80,89 1,95 420 0,154 10,96 9,86 83,74 1,61 480 0,158 11,25 10,13 86,02 1,34 540 0,161 11,48 10,33 87,74 1,14 600 0,166 11,85 10,67 90,59 0,81 660 0,172 12,30 11,07 94,01 0,40 720 0,178 12,75 11,47 97,43 0,0105 30 0,055 3,57 3,21 26,33 8,40 60 0,071 4,76 4,29 35,54 7,32 120 0,11 7,67 6,90 57,26 4,70 180 0,119 8,34 7,51 62,27 4,10 240 0,133 9,39 8,45 70,07 3,16
II 300 0,14 9,91 8,92 73,97 2,69 360 0,159 11,33 10,20 84,56 1,41 420 0,16 11,40 10,26 85,11 1,34 480 0,164 11,70 10,53 87,34 1,07 540 0,168 12 10,8 89,57 0,81 600 0,173 12,37 11,14 92,35 0,47 660 0,179 12,82 11,54 95,70 0,07 720 0,18 12,90 11,61 96,25 0,0119 30 0,048 3,04 2,74 22,84 9,00 60 0,064 4,24 3,81 31,80 7,93 120 0,122 8,57 7,71 64,28 4,03 180 0,125 8,79 7,91 65,96 3,83 240 0,134 9,4 8,52 71,00 3,22
III 300 0,138 9,76 8,79 73,24 2,96 360 0,156 11,10 9,99 83,32 1,75 420 0,169 12,07 10,87 90,60 0,87 480 0,173 12,37 11,14 92,84 0,60 540 0,179 12,82 11,54 96,20 0,20 600 0,182 13,04 11,74 97,87 0,00 660 0,177 12,67 11,40 95,08 0,34 720 0,182 13,04 11,74 97,87 0,0128

95
FORMULA B
Replikasi t (menit) A C sampel (µg/mL) Wt (mg) % obat terlepas Wt∞-Wt
30 0,051 3,27 2,94 24,70 8,73 60 0,063 4,16 3,75 31,46 7,93 120 0,079 5,36 4,82 40,49 6,85 180 0,107 7,45 6,70 56,28 4,97 240 0,107 7,45 6,70 56,28 4,97
I 300 0,115 8,04 7,24 60,79 4,43 360 0,138 9,76 8,79 73,76 2,89 420 0,145 10,28 9,26 77,70 2,42 480 0,153 10,88 9,79 82,21 1,88 540 0,166 11,85 10,67 89,54 1,01 600 0,174 12,45 11,20 94,06 0,47 660 0,176 12,60 11,34 95,18 0,34 720 0,181 12,97 11,67 98,00 0,0133 30 0,077 5,21 4,69 39,60 6,99 60 0,097 6,70 6,03 50,59 5,64 120 0,122 8,57 7,71 64,13 3,96 180 0,132 9,31 8,38 70,80 3,29 240 0,142 10,06 9,05 76,47 2,62
II 300 0,154 10,96 9,86 83,28 1,81 360 0,157 11,18 10,06 84,98 1,61 420 0,163 11,63 10,46 88,39 1,21 480 0,165 11,78 10,60 89,52 1,07 540 0,168 12 10,8 91,22 0,87 600 0,17 12,15 10,93 92,36 0,74 660 0,177 12,67 11,40 96,33 0,27 720 0,181 12,97 11,67 98,60 0,0091 30 0,064 4,24 3,81 31,81 7,99 60 0,085 5,81 5,23 43,57 6,58 120 0,097 6,70 6,03 50,29 5,78 180 0,121 8,49 7,64 63,73 4,16 240 0,134 9,46 8,52 71,01 3,29
III 300 0,144 10,2 9,19 76,61 2,62 360 0,153 10,88 9,79 81,65 2,01 420 0,158 11,25 10,13 84,45 1,68 480 0,168 12 10,8 90,05 1,01 540 0,171 12,22 11,00 91,73 0,81 600 0,18 12,90 11,61 96,77 0,20 660 0,181 12,97 11,67 97,33 0,13 720 0,183 13,12 11,81 98,45 0,0118

96
FORMULA C
Replikasi t (menit) A C sampel (µg/mL) Wt (mg) % obat terlepas Wt∞-Wt
30 0,055 3,57 3,21 26,45 8,46 60 0,074 4,99 4,49 36,96 7,19 120 0,091 6,25 5,63 46,36 6,04 180 0,104 7,22 6,50 53,56 5,17 240 0,132 9,31 8,38 69,05 3,29 I 300 0,141 9,99 8,99 74,03 2,69 360 0,147 10,43 9,39 77,35 2,28 420 0,152 10,81 9,73 80,11 1,95 480 0,159 11,33 10,20 83,99 1,48 540 0,162 11,55 10,40 85,65 1,28 600 0,166 11,85 10,67 87,86 1,01 660 0,175 12,52 11,27 92,84 0,40 720 0,181 12,97 11,67 96,16 0,0118 30 0,071 4,76 4,28 35,76 7,52 60 0,088 6,03 5,43 42,29 6,38 120 0,119 8,34 7,51 62,66 4,30 180 0,122 8,57 7,71 64,34 4,10 240 0,135 9,54 8,58 71,63 3,22
II 300 0,143 10,13 9,12 76,11 2,69 360 0,153 10,88 9,79 81,72 2,01 420 0,155 11,03 9,927 82,84 1,88 480 0,159 11,33 10,20 84,08 1,61 540 0,162 11,55 10,40 85,76 1,41 600 0,175 12,52 11,27 94,05 0,54 660 0,176 12,60 11,34 94,61 0,47 720 0,183 13,12 11,801 98,53 0,0099 30 0,078 5,28 4,75 39,88 6,78 60 0,084 5,73 5,15 43,26 6,38 120 0,121 8,49 7,64 64,11 3,90 180 0,139 9,84 8,85 74,25 2,69 240 0,145 10,28 9,26 77,63 2,28
III 300 0,148 10,51 9,46 79,31 2,08 360 0,151 10,73 9,66 81,00 1,88 420 0,155 11,03 9,93 83,26 1,61 480 0,157 11,18 10,06 84,38 1,48 540 0,163 11,63 10,46 87,76 1,07 600 0,168 12 10,8 90,58 0,74 660 0,173 12,37 11,14 93,40 0,40 720 0,179 12,82 11,54 96,78 0,0088

97
FORMULA D
Replikasi t (menit) A C sampel (µg/mL) Wt (mg) % obat terlepas Wt∞-Wt
30 0,067 4,46 4,02 34,12 7,72 60 0,081 5,51 4,96 42,11 6,78 120 0,084 5,73 5,16 43,82 6,58 180 0,098 6,78 6,10 51,81 5,64 240 0,122 8,57 7,71 65,50 4,03 I 300 0,133 9,39 8,45 71,78 3,29 360 0,143 10,13 9,12 77,48 2,62 420 0,152 10,81 9,73 82,62 2,01 480 0,167 11,93 10,73 91,18 1,01 540 0,169 12,07 10,87 92,32 0,87 600 0,175 12,52 11,27 95,74 0,47 660 0,178 12,75 11,47 97,45 0,27 720 0,182 13,04 11,74 99,74 0,0124 30 0,054 3,49 3,14 26,05 8,66 60 0,065 4,31 3,88 32,17 7,93 120 0,082 5,58 5,02 41,63 6,78 180 0,128 9,01 8,11 67,23 3,69 240 0,133 9,39 8,45 70,02 3,36
II 300 0,153 10,88 9,79 81,15 2,01 360 0,159 11,33 10,20 84,49 1,61 420 0,164 11,70 10,53 87,27 1,28 480 0,169 12,07 10,87 90,05 0,94 540 0,172 12,30 11,07 91,72 0,74 600 0,174 12,45 11,20 92,84 0,60 660 0,177 12,67 11,40 94,51 0,40 720 0,183 12,90 11,81 97,85 0,0129 30 0,056 3,64 3,28 27,69 8,26 60 0,064 4,24 3,81 32,23 7,72 120 0,092 6,33 5,70 48,12 5,84 180 0,109 7,60 6,84 57,76 4,70 240 0,131 9,24 8,31 70,25 3,22
III 300 0,137 9,69 8,72 73,65 2,82 360 0,143 10,13 9,12 77,06 2,42 420 0,148 10,51 9,46 79,89 2,08 480 0,157 11,18 10,06 85,00 1,48 540 0,159 11,33 10,20 86,14 1,34 600 0,167 11,93 10,73 90,68 0,81 660 0,177 12,67 11,40 96,35 0,13 720 0,179 12,82 11,54 97,48 0,0120

98
LAMPIRAN I
CONTOH PERHITUNGAN
Contoh perhitungan Carr’s Indexdan Hausner Ratio:
Formula A :
Berat gelas = 125,8641 g (W1)
Berat gelas + granul = 153,9399 g (W2)
V1 = 100 mL
V2 = 83 mL
Bj nyata = 1
12 )(V
WW = = 0,280758
Bj mampat = 2
12 )(V
WW = = 0,33826
% kompresibilitas = %100.
.1 xmampatBj
nyataBj
= 17%
Formula A:
Hausner Ratio = = 1,20
Contoh perhitungan akurasi & presisi:
Absorbansi = 0,14 → y = 0,0134x + 0,0072
Konsentrasi sebenarnya = 9,91 ppm
Konsentrasi teoritis = 9,76 ppm
% Bahan aktif +
matrik (mg)
Air Ad
Pipet (mL)
Air Ad
Konsentrasi (ppm)
100 503 100 0,8 10 9,76
Bj mampat
99
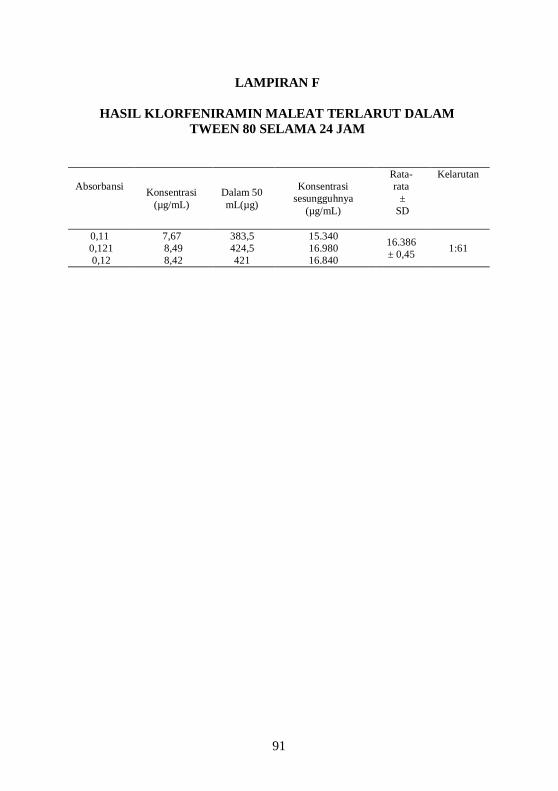
% perolehan kembali=(konsentrasi sebenarnya/konsentrasi teoritis) x 100%
= (9,91 /9,76) x 100%
= 100,56 %
Untuk menghitung % KV = %100xX
SD
= %10041,100
1,37 x
= 1,37 %
Contoh perhitungan % obat terlepas:
% obat terlepas = %100
100
dosisPKWt
Formula A replikasi 1 pada t = 30 menit
% obat terlepas = %26,31%100
12100
98,11473,68
Contoh Perhitungan Jumlah Klorfeniramin Maleat terlarut dalam
Tween 80:
Replikasi I:
Absorbansi Konsentrasi (µg/mL)
Dalam 50 mL(µg)
Konsentrasi sesungguhnya
(µg/mL) Kelarutan
0,11 7,67 383,5 15.340 1:65 Absorbansi = 0,11 → y = 0,0134x + 0,0072
Konsentrasi = 7,67 µg/mL
CTM 10,0020 g ad 25 mL → pipet 25µL ad 50 mL
Dalam 50 mL→7,67 µg/mL x 50 mL= 383,5 µg
Jadidalam25mLtween80=
L15.340µg/m mL µg/25500.383µg5,383µL25
25mLx1000
100
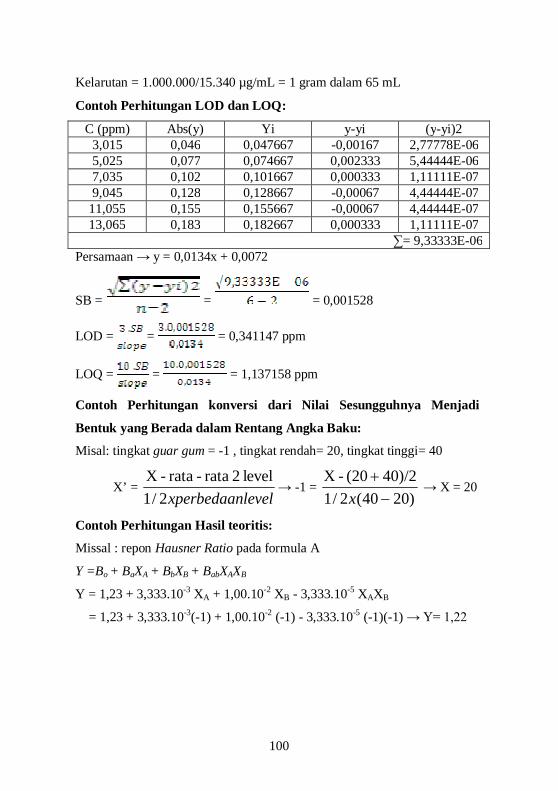
Kelarutan = 1.000.000/15.340 µg/mL = 1 gram dalam 65 mL
Contoh Perhitungan LOD dan LOQ:
C (ppm) Abs(y) Yi y-yi (y-yi)2 3,015 0,046 0,047667 -0,00167 2,77778E-06 5,025 0,077 0,074667 0,002333 5,44444E-06 7,035 0,102 0,101667 0,000333 1,11111E-07 9,045 0,128 0,128667 -0,00067 4,44444E-07
11,055 0,155 0,155667 -0,00067 4,44444E-07 13,065 0,183 0,182667 0,000333 1,11111E-07
∑= 9,33333E-06 Persamaan → y = 0,0134x + 0,0072
SB = = = 0,001528
LOD = = = 0,341147 ppm
LOQ = = = 1,137158 ppm
Contoh Perhitungan konversi dari Nilai Sesungguhnya Menjadi
Bentuk yang Berada dalam Rentang Angka Baku:
Misal: tingkat guar gum = -1 , tingkat rendah= 20, tingkat tinggi= 40
X’ = levelxperbedaan2/1level 2 rata-rata-X
→ -1 = )2040(2/1
40)/2(20-X
x
→ X = 20
Contoh Perhitungan Hasil teoritis:
Missal : repon Hausner Ratio pada formula A
Y =Bo + BaXA + BbXB + BabXAXB
Y = 1,23 + 3,333.10-3 XA + 1,00.10-2 XB - 3,333.10-5 XAXB
= 1,23 + 3,333.10-3(-1) + 1,00.10-2 (-1) - 3,333.10-5 (-1)(-1) → Y= 1,22

101
LAMPIRAN J
HASIL UJI F KURVA BAKU
REPLIKASI I
KONSENTRASI ABSORBANSI X2 Y2 XY
3,015 0,046 9,0902 0,0021 0,1387
5,025 0,077 25,2506 0,0059 0,3869
7,035 0,102 49,4912 0,0104 0,7176
9,045 0,128 81,8120 0,0164 1,1578
11,055 0,155 122,2130 0,0240 1,7135
13,065 0,183 170,6942 0,0335 2,3909 Persamaan Regresi pada replikasi 2 → Y = 0,0134X+ 0,0072
rhitung/rtabel: 0,9996/0,811
REPLIKASI II
KONSENTRASI ABSORBANSI X2 Y2 XY
3,015 0,047 9,0902 0,0022 0,1417
5,025 0,072 25,2506 0,0052 0,3618
7,035 0,106 49,4912 0,0112 0,7457
9,045 0,136 81,8120 0,0185 1,2301
11,055 0,161 122,2130 0,0259 1,7799
13,065 0,193 170,6942 0,0372 2,5215 Persamaan Regresi pada replikasi 2 → Y = 0,0146X + 0,0018
rhitung/rtabel: 0,9992 /0,811

102
REPLIKASI III
KONSENTRASI ABSORBANSI X2 Y2 XY
3 0,046 9,0721 0,0021 0,1386
5,02 0,074 25,2004 0,0055 0,3715
7,028 0,104 49,3928 0,0108 0,7309
9,036 0,126 81,6493 0,0159 1,1385
11,044 0,158 121,9699 0,0250 1,7450
13,052 0,185 170,3547 0,0342 2,4146 Persamaan Regresi pada replikasi 2 → Y = 0,0138X + 0,0048
rhitung/rtabel: 0,9993 /0,811
ƩX2 ƩXY ƩY2 N Residual SS RDF Replikasi I 458,5514 6,5054 0,0923 6 5,6848.10-5 4 Replikasi II 458,5514 6,7807 0,1003 6 2,6256. 10-5 4 Replikasi III 457,6393 6,5391 0,0935 6 3,8707. 10-5 4
Pooled regression 1,22. 10-4 12
Common regression 1374,7420 19,8252 0,2861 2,17.10-4 11
F hitung < F tabel 0,05 (3,12) = 3,1096 < 3,49.
Karena F hitung lebih kecil dari F tabel maka tidak ada perbedaan
bermakna antar persamaan regresi.

103
LAMPIRAN K
SERTIFIKAT ANALISIS KLORFENIRAMIN MALEAT

104
SERTIFIKAT ANALISIS GUAR GUM

105
SERTIFIKAT ANALISIS AVICEL PH-102

106
LAMPIRAN L
TABEL UJI F
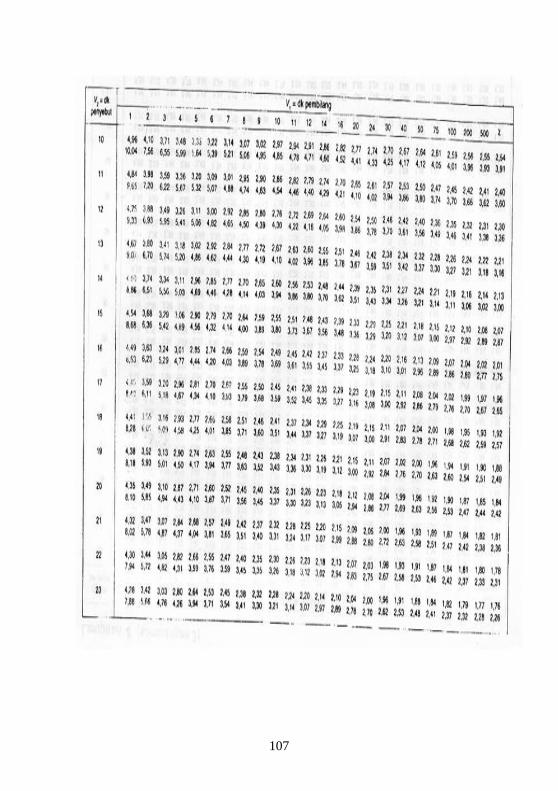
107

108
LAMPIRAN M TABEL UJI R

109
LAMPIRAN N
TABEL UJI T

110
LAMPIRAN O
HASIL UJI STATISTIK HAUSNER RATIO TABLET LIKUISOLID KLORFENIRAMIN MALEAT ANTAR
FORMULA
Descriptives
Hausner ratio
N Mean Std.
Deviation Std.
Error
95% Confidence Interval for Mean
Minimum
Maximum
Lower Bound
Upper Bound
A 3 1.2100 .01732 .01000 1.1670 1.2530 1.20 1.23
B 3 1.2233 .01528 .00882 1.1854 1.2613 1.21 1.24
C 3 1.2367 .00577 .00333 1.2223 1.2510 1.23 1.24
D 3 1.2367 .00577 .00333 1.2223 1.2510 1.23 1.24
Total 12 1.2267 .01557 .00449 1.2168 1.2366 1.20 1.24
Test of Homogeneity of Variances
Hausner ratio Levene Statistic df1 df2 Sig.
2.833 3 8 .106
ANOVA Hausner ratio
Sum of Squares Df Mean Square F Sig. Between Groups .001 3 .000 3.259 .081 Within Groups .001 8 .000
Total .003 11 Karena F hitung < F tabel0,05 (3,8) = 3,259 < 4,07; maka H0 diterima dan tidak
ada perbedaan bermakna antar formula.

111
LAMPIRAN P
HASIL UJI STATISTIK CARR’S INDEX TABLET LIKUISOLID KLORFENIRAMIN MALEAT ANTAR
FORMULA
Descriptives Carr’s index
N Mean Std.
Deviation Std.
Error
95% Confidence Interval for Mean
Minimum
Maximum
Lower Bound
Upper Bound
A 3 17.6633
1.15760 .66834 14.7877 20.5390 16.99 19.00
B 3 18.6633
1.14893 .66333 15.8092 21.5174 18.00 19.99
C 3 19.6600
.57158 .33000 18.2401 21.0799 19.00 19.99
D 3 19.6600
.57158 .33000 18.2401 21.0799 19.00 19.99
Total 12 18.9117
1.16178 .33538 18.1735 19.6498 16.99 19.99
Test of Homogeneity of Variances
Carr’s index
Levene Statistic df1 df2 Sig.
2.179 3 8 .168

112
ANOVA
Carr’s index Sum of
Squares df Mean Square F Sig.
Between Groups 8.220 3 2.740 3.308 .078
Within Groups 6.627 8 .828
Total 14.847 11
Karena F hitung < F tabel0,05 (3,8) = 3,308< 4,07; maka H0 diterima dan tidak
ada perbedaan bermakna antar formula.

113
LAMPIRAN Q
HASIL UJI STATISTIK KEKERASAN TABLET LIKUISOLID KLORFENIRAMIN MALEAT ANTAR
FORMULA Descriptives
Kekerasan Tablet
N Mean Std.
Deviation Std.
Error
95% Confidence Interval for Mean
Minimum Maximum Lower
Bound Upper Bound
A 3 16.9800 .66053 .38136 15.3392 18.6208 16.24 17.51 B 3 10.7100 .23065 .13317 10.1370 11.2830 10.45 10.89 C 3 10.2967 .09018 .05207 10.0726 10.5207 10.21 10.39 D 3 5.3433 .49943 .28835 4.1027 6.5840 5.05 5.92 Total 12 10.8325 4.32927 1.24975 8.0818 13.5832 5.05 17.51
Test of Homogeneity of Variances
Kekerasan Tablet
Levene Statistic df1 df2 Sig.
4.211 3 8 .046
ANOVA Kekerasan Tablet Sum of Squares df Mean Square F Sig.
Between Groups 204.674 3 68.225 365.294 .000 Within Groups 1.494 8 .187 Total 206.169 11
Karena F hitung > F tabel0,05 (3,8) = 365,294> 4,07; maka H0 ditolak dan ada
perbedaan bermakna antar formula.

114
Multiple Comparisons Kekerasan Tablet LSD
(I) FORMULA
(J) FORMULA
Mean Difference
(I-J) Std. Error Sig.
95% Confidence Interval
Lower Bound
Upper Bound
A B 6.27000* .35286 .000 5.4563 7.0837
C 6.68333* .35286 .000 5.8696 7.4970
D 11.63667* .35286 .000 10.8230 12.4504 B A -6.27000* .35286 .000 -7.0837 -5.4563
C .41333 .35286 .275 -.4004 1.2270 D 5.36667* .35286 .000 4.5530 6.1804
C A -6.68333* .35286 .000 -7.4970 -5.8696 B -.41333 .35286 .275 -1.2270 .4004 D 4.95333* .35286 .000 4.1396 5.7670
D A -11.63667* .35286 .000 -12.4504 -10.8230 B -5.36667* .35286 .000 -6.1804 -4.5530 C -4.95333* .35286 .000 -5.7670 -4.1396

115
*. The mean difference is significant at the 0.05 level. Keterangan: Hasil uji LSD dari keempat formula, diperoleh nilai sig. < (0,05) sehingga Ho ditolak (*), berarti rata-rata kekerasan tablet dari keempat formula menunjukkan bahwa ada perbedaan yang signifikan antar formula yaitu formula A dan formula D menunjukkan perbedaan yang signifikan terhadap semua formula; formula B menunjukkan perbedaan yang signifikan terhadap formula D, sedangkan untuk formula C tidak menunjukkan perbedaan yang signifikan terhadap formula B.

116
LAMPIRAN R
HASIL UJI STATISTIK KERAPUHAN TABLET LIKUISOLID KLORFENIRAMIN MALEAT ANTAR
FORMULA Descriptives
Kerapuhan Tablet
N Mean Std.
Deviation Std.
Error
95% Confidence Interval for Mean
Minimum
Maximum
Lower Bound
Upper Bound
A 3 .1600 .06083 .03512 .0089 .3111 .09 .20 B 3 .0967 .00577 .00333 .0823 .1110 .09 .10 C 3 .1333 .05774 .03333 -.0101 .2768 .10 .20 D 3 .1667 .05859 .03383 .0211 .3122 .10 .21 Total 12 .1392 .05230 .01510 .1059 .1724 .09 .21
Test of Homogeneity of Variances Kerapuhan Tablet
Levene Statistic df1 df2 Sig.
3.907 3 8 .055
ANOVA Kerapuhan Tablet
Sum of Squares Df Mean Square F Sig.
Between Groups .009 3 .003 1.154 .385 Within Groups .021 8 .003 Total .030 11
Karena F hitung < F tabel0,05 (3,8) = 1,154 < 4,07; maka H0 diterima dan tidak
ada perbedaan bermakna antar formula.

117
LAMPIRAN S
HASIL UJI STATISTIK KONSTANTA DISOLUSI TABLET LIKUISOLID KLORFENIRAMIN MALEAT ANTAR FORMULA
Descriptives
K disolusi
N Mean Std.
Deviation Std. Error
95% Confidence Interval for Mean
Minim Max
Lower Bound
Upper Bound
A 3 .011733 .0011590 .0006692 .008854 .014613 .0105 .0128
B 3 .011400 .0021284 .0012288 .006113 .016687 .0091 .0133
C 3 .010167 .0015177 .0008762 .006397 .013937 .0088 .0118
D 3 .012433 .0004509 .0002603 .011313 .013553 .0120 .0129
Total 12 .011433 .0015029 .0004339 .010478 .012388 .0088 .0133
Test of Homogeneity of Variances
K disolusi
Levene Statistic df1 df2 Sig.
1.636 3 8 .257

118
ANOVA
K disolusi Sum of
Squares df Mean
Square F Sig.
Between Groups .000 3 .000 1.287 .343
Within Groups .000 8 .000
Total .000 11
Karena F hitung < F tabel0,05 (3,8) = 1,287 < 4,07; maka H0 diterima dan tidak
ada perbedaan bermakna antar formula.

119
LAMPIRAN T HASIL UJI ANAVA HAUSNER RATIO KLORFENIRAMIN
MALEAT DENGAN DESIGN EXPERT Use your mouse to right click on individual cells for definitions. Response 1 hausner ratio ANOVA for selected factorial model Analysis of variance table [Partial sum of squares - Type III] Sum of Mean F p-value Source Squares df Square Value Prob > F Model 1.467E-003 3 4.889E-004 3.260.0806 not significant A-konsentrasi tween 1.333E-004 1 1.333E-004 0.890.3734 B-konsentrasi guar gum 1.200E-003 1 1.200E-003 8.000.0222 AB 1.333E-004 1 1.333E-004 0.890.3734 Pure Error 1.200E-003 8 1.500E-004 Cor Total 2.667E-003 11 The Model F-value of 3.26 implies there is a 8.06% chance that a "Model F-Value" this large could occur due to noise. Values of "Prob > F" less than 0.0500 indicate model terms are significant. In this case B are significant model terms. Values greater than 0.1000 indicate the model terms are not significant. If there are many insignificant model terms (not counting those required to support hierarchy), model reduction may improve your model.

120
Std. Dev. 0.012 R-Squared 0.5500 Mean1.23 Adj R-Squared 0.3812 C.V. % 1.00 Pred R-Squared -0.0125 PRESS 2.700E-003 Adeq Precision 3.771 A negative "Pred R-Squared" implies that the overall mean is a better predictor of your response than the current model. "Adeq Precision" measures the signal to noise ratio. A ratio of 3.77 indicates an inadequate signal and we should not use this model to navigate the design space. Coefficient Standard 95% CI 95% CI Factor Estimate df Error Low High VIF Intercept 1.23 1 3.536E-003 1.22 1.23 A-konsentrasi tween 3.333E-003 1 3.536E-003 -4.820E-003 0.011 1.00 B-konsentrasi guar gum 1.000E-002 1 3.536E-003 1.847E-003 0.018 1.00 AB - 3.333E-003 1 3.536E-003 -0.011 4.820E-003 1.00

121
Final Equation in Terms of Coded Factors: hausner ratio = +1.23 +3.333E-003 * A +1.000E-002 * B -3.333E-003 * A * B Final Equation in Terms of Actual Factors: hausner ratio = +1.22667 +3.33333E-003 * konsentrasi tween +1.00000E-002 * konsentrasi guar gum -3.33333E-003 * konsentrasi tween * konsentrasi guar gum The Diagnostics Case Statistics Report has been moved to the Diagnostics Node. In the Diagnostics Node, Select Case Statistics from the View Menu. Proceed to Diagnostic Plots (the next icon in progression). Be sure to look at the: 1) Normal probability plot of the studentized residuals to check for normality of residuals. 2) Studentized residuals versus predicted values to check for constant error. 3) Externally Studentized Residuals to look for outliers, i.e., influential values. 4) Box-Cox plot for power transformations. If all the model statistics and diagnostic plots are OK, finish up with the Model Graphs icon.

122
LAMPIRAN U
HASIL UJI ANAVA CARR’S INDEX KLORFENIRAMIN MALEAT DENGAN DESIGN EXPERT Use your mouse to right click on individual cells for definitions. Response 2 carrs index ANOVA for selected factorial model Analysis of variance table [Partial sum of squares - Type III] Sum of Mean F p-value Source Squares df Square Value Prob > F Model 8.22 3 2.74 3.31 0.0782 not significant A-konsentrasi tween 0.75 1 0.75 0.91 0.3692 B-konsentrasi guar gum 6.72 1 6.72 8.11 0.0215 AB 0.75 1 0.75 0.91 0.3692 Pure Error 6.63 8 0.83 Cor Total 14.85 11 The Model F-value of 3.31 implies there is a 7.82% chance that a "Model F-Value" this large could occur due to noise. Values of "Prob > F" less than 0.0500 indicate model terms are significant. In this case B are significant model terms. Values greater than 0.1000 indicate the model terms are not significant. If there are many insignificant model terms (not counting those required to support hierarchy), model reduction may improve your model.

123
Std. Dev. 0.91 R-Squared 0.5537 Mean18.91 Adj R-Squared 0.3863 C.V. % 4.81 Pred R-Squared -0.0043 PRESS 14.91 Adeq Precision 3.800 A negative "Pred R-Squared" implies that the overall mean is a better predictor of your response than the current model. "Adeq Precision" measures the signal to noise ratio. A ratio of 3.80 indicates an inadequate signal and we should not use this model to navigate the design space. Coefficient Standard 95% CI 95% CI Factor Estimate df Error Low High VIF Intercept 18.91 1 0.26 18.31 19.52 A-konsentrasi tween 0.25 1 0.26 -0.36 0.86 1.00 B-konsentrasi guar gum 0.75 1 0.26 0.14 1.35 1.00 AB -0.25 1 0.26 -0.86 0.36 1.00

124
Final Equation in Terms of Coded Factors: carrs index = +18.91 +0.25 * A +0.75 * B -0.25 * A * B Final Equation in Terms of Actual Factors: carrs index = +18.91167 +0.25000 * konsentrasi tween +0.74833 * konsentrasi guar gum -0.25000 * konsentrasi tween * konsentrasi guar gum The Diagnostics Case Statistics Report has been moved to the Diagnostics Node. In the Diagnostics Node, Select Case Statistics from the View Menu. Proceed to Diagnostic Plots (the next icon in progression). Be sure to look at the: 1) Normal probability plot of the studentized residuals to check for normality of residuals. 2) Studentized residuals versus predicted values to check for constant error. 3) Externally Studentized Residuals to look for outliers, i.e., influential values. 4) Box-Cox plot for power transformations. If all the model statistics and diagnostic plots are OK, finish up with the Model Graphs icon.

125
LAMPIRAN V
HASIL UJI ANAVA KEKERASAN TABLET KLORFENIRAMIN MALEAT DENGAN DESIGN EXPERT
Use your mouse to right click on individual cells for definitions. Response 4 kekerasan tablet ANOVA for selected factorial model Analysis of variance table [Partial sum of squares - Type III] Sum of Mean F p-value Source Squares df Square Value Prob > F Model 204.67 3 68.22 365.29 < 0.0001 significant A-konsentrasi tween 94.47 1 94.47 505.83 < 0.0001 B-konsentrasi guar gum 108.90 1 108.90 583.09 < 0.0001 AB 1.30 1 1.30 6.96 0.0298 Pure Error 1.49 8 0.19 Cor Total 206.17 11 The Model F-value of 365.29 implies the model is significant. There is only a 0.01% chance that a "Model F-Value" this large could occur due to noise. Values of "Prob > F" less than 0.0500 indicate model terms are significant. In this case A, B, AB are significant model terms.

126
Values greater than 0.1000 indicate the model terms are not significant. If there are many insignificant model terms (not counting those required to support hierarchy), model reduction may improve your model. Std. Dev. 0.43 R-Squared 0.9928 Mean 10.83 Adj R-Squared 0.9900 C.V. % 3.99 Pred R-Squared 0.9837 PRESS 3.36 Adeq Precision 46.638 The "Pred R-Squared" of 0.9837 is in reasonable agreement with the "Adj R-Squared" of 0.9900. "Adeq Precision" measures the signal to noise ratio. A ratio greater than 4 is desirable. Your ratio of 46.638 indicates an adequate signal. This model can be used to navigate the design space. Coefficient Standard 95% CI 95% CI Factor Estimate df Error Low High VIF Intercept 10.83 1 0.12 10.54 11.12 A-konsentrasi tween -2.81 1 0.12 -3.09 -2.52 1.00 B-konsentrasi guar gum -3.01 1 0.12 -3.30 -2.72 1.00 AB0.33 1 0.12 0.041 0.62 1.00
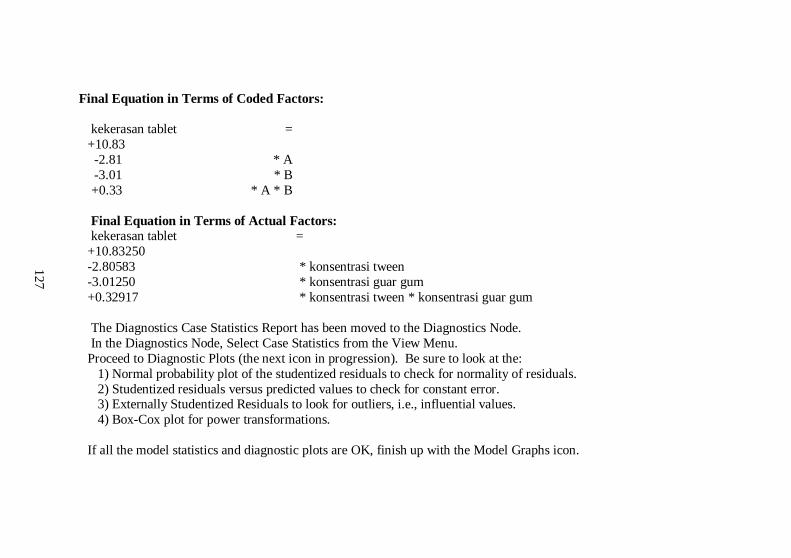
127
Final Equation in Terms of Coded Factors: kekerasan tablet = +10.83 -2.81 * A -3.01 * B +0.33 * A * B Final Equation in Terms of Actual Factors: kekerasan tablet = +10.83250 -2.80583 * konsentrasi tween -3.01250 * konsentrasi guar gum +0.32917 * konsentrasi tween * konsentrasi guar gum The Diagnostics Case Statistics Report has been moved to the Diagnostics Node. In the Diagnostics Node, Select Case Statistics from the View Menu. Proceed to Diagnostic Plots (the next icon in progression). Be sure to look at the: 1) Normal probability plot of the studentized residuals to check for normality of residuals. 2) Studentized residuals versus predicted values to check for constant error. 3) Externally Studentized Residuals to look for outliers, i.e., influential values. 4) Box-Cox plot for power transformations. If all the model statistics and diagnostic plots are OK, finish up with the Model Graphs icon.

128
LAMPIRAN W
HASIL UJI ANAVA KERAPUHAN TABLET KLORFENIRAMIN MALEAT DENGAN DESIGN EXPERT
Use your mouse to right click on individual cells for definitions. Response 3 kerapuhan tablet ANOVA for selected factorial model Analysis of variance table [Partial sum of squares - Type III] Sum of Mean F p-value Source Squares df Square Value Prob > F Model 9.092E-003 3 3.031E-003 1.15 0.3850 not significant A-konsentrasi tween 6.750E-004 1 6.750E-004 0.26 0.6258 B-konsentrasi guar gum 1.408E-003 1 1.408E-003 0.54 0.4848 AB 7.008E-003 1 7.008E-003 2.67 0.1409 Pure Error 0.021 8 2.625E-003 Cor Total 0.030 11 The "Model F-value" of 1.15 implies the model is not significant relative to the noise. There is a 38.50 % chance that a "Model F-value" this large could occur due to noise. Values of "Prob > F" less than 0.0500 indicate model terms are significant. In this case there are no significant model terms. Values greater than 0.1000 indicate the model terms are not significant. If there are many insignificant model terms (not counting those required to support hierarchy),
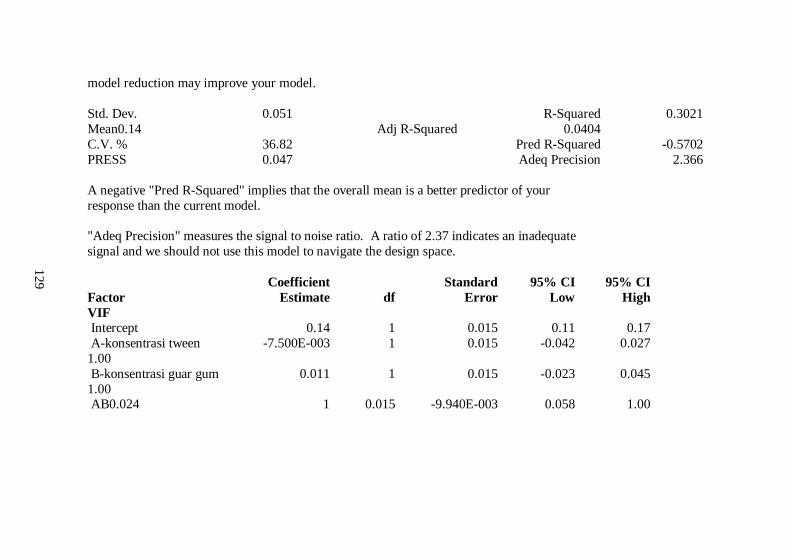
129
model reduction may improve your model. Std. Dev. 0.051 R-Squared 0.3021 Mean0.14 Adj R-Squared 0.0404 C.V. % 36.82 Pred R-Squared -0.5702 PRESS 0.047 Adeq Precision 2.366 A negative "Pred R-Squared" implies that the overall mean is a better predictor of your response than the current model. "Adeq Precision" measures the signal to noise ratio. A ratio of 2.37 indicates an inadequate signal and we should not use this model to navigate the design space. Coefficient Standard 95% CI 95% CI Factor Estimate df Error Low High VIF Intercept 0.14 1 0.015 0.11 0.17 A-konsentrasi tween -7.500E-003 1 0.015 -0.042 0.027 1.00 B-konsentrasi guar gum 0.011 1 0.015 -0.023 0.045 1.00 AB0.024 1 0.015 -9.940E-003 0.058 1.00

130
Final Equation in Terms of Coded Factors: kerapuhan tablet = +0.14 -7.500E-003 * A +0.011 * B +0.024 * A * B Final Equation in Terms of Actual Factors: kerapuhan tablet = +0.13917 -7.50000E-003 * konsentrasi tween +0.010833 * konsentrasi guar gum +0.024167 * konsentrasi tween * konsentrasi guar gum The Diagnostics Case Statistics Report has been moved to the Diagnostics Node. In the Diagnostics Node, Select Case Statistics from the View Menu. Proceed to Diagnostic Plots (the next icon in progression). Be sure to look at the: 1) Normal probability plot of the studentized residuals to check for normality of residuals. 2) Studentized residuals versus predicted values to check for constant error. 3) Externally Studentized Residuals to look for outliers, i.e., influential values. 4) Box-Cox plot for power transformations. If all the model statistics and diagnostic plots are OK, finish up with the Model Graphs icon.

131
LAMPIRAN X
HASIL UJI ANAVA KONSTANTA LAJU DISOLUSI KLORFENIRAMIN MALEAT DENGAN DESIGN EXPERT
Use your mouse to right click on individual cells for definitions. Response 5 K disolusi ANOVA for selected factorial model Analysis of variance table [Partial sum of squares - Type III] Sum of Mean F p-value Source Squares df Square Value Prob > F Model 8.087E-006 3 2.696E-006 1.29 0.3434 not significant A-konsentrasi tween 2.803E-006 1 2.803E-006 1.34 0.2807 B-konsentrasi guar gum 2.133E-007 1 2.133E-007 0.10 0.7578 AB 5.070E-006 1 5.070E-006 2.42 0.1584 Pure Error 1.676E-005 8 2.095E-006 Cor Total 2.485E-005 11 The "Model F-value" of 1.29 implies the model is not significant relative to the noise. There is a 34.34 % chance that a "Model F-value" this large could occur due to noise. Values of "Prob > F" less than 0.0500 indicate model terms are significant. In this case there are no significant model terms. Values greater than 0.1000 indicate the model terms are not significant. If there are many insignificant model terms (not counting those required to support hierarchy),
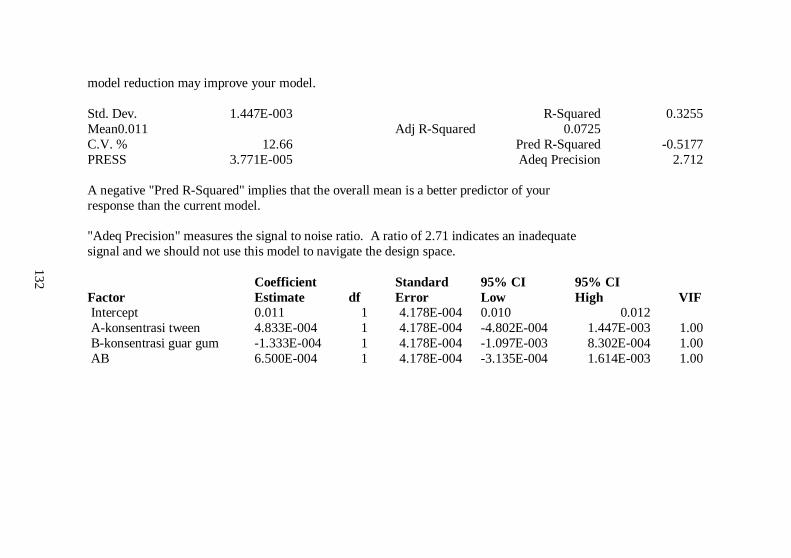
132
model reduction may improve your model. Std. Dev. 1.447E-003 R-Squared 0.3255 Mean0.011 Adj R-Squared 0.0725 C.V. % 12.66 Pred R-Squared -0.5177 PRESS 3.771E-005 Adeq Precision 2.712 A negative "Pred R-Squared" implies that the overall mean is a better predictor of your response than the current model. "Adeq Precision" measures the signal to noise ratio. A ratio of 2.71 indicates an inadequate signal and we should not use this model to navigate the design space. Coefficient Standard 95% CI 95% CI Factor Estimate df Error Low High VIF Intercept 0.011 1 4.178E-004 0.010 0.012 A-konsentrasi tween 4.833E-004 1 4.178E-004 -4.802E-004 1.447E-003 1.00 B-konsentrasi guar gum -1.333E-004 1 4.178E-004 -1.097E-003 8.302E-004 1.00 AB 6.500E-004 1 4.178E-004 -3.135E-004 1.614E-003 1.00

133
Final Equation in Terms of Coded Factors: K disolusi = +0.011 +4.833E-004 * A -1.333E-004 * B +6.500E-004 * A * B Final Equation in Terms of Actual Factors: K disolusi = +0.011433 +4.83333E-004 * konsentrasi tween -1.33333E-004 * konsentrasi guar gum +6.50000E-004 * konsentrasi tween * konsentrasi guar gum The Diagnostics Case Statistics Report has been moved to the Diagnostics Node. In the Diagnostics Node, Select Case Statistics from the View Menu. Proceed to Diagnostic Plots (the next icon in progression). Be sure to look at the: 1) Normal probability plot of the studentized residuals to check for normality of residuals. 2) Studentized residuals versus predicted values to check for constant error. 3) Externally Studentized Residuals to look for outliers, i.e., influential values. 4) Box-Cox plot for power transformations. If all the model statistics and diagnostic plots are OK, finish up with the Model Graphs icon.

134
LAMPIRAN Y
HASIL UJI STATISTIK HASIL PERCOBAAN DAN HASIL TEORITIS PADA UJI HAUSNER RATIO TABLET
KLORFENIRAMIN MALEAT
Paired Samples Statistics
Mean N Std.
Deviation Std. Error Mean
Pair 1 haunerpercobaan 1.2225 4 .02062 .01031
hausnerteoritis 1.2300 4 .01155 .00577
Paired Samples Correlations N Correlation Sig.
Pair 1 haunerpercobaan & hausnerteoritis
4 .980 .020

135
Paired Samples Test
Paired Differences
t Df Sig. (2-tailed)
Mean Std.
Deviation Std. Error
Mean
95% Confidence Interval of the
Difference Lower Upper
Pair 1 haunerpercobaan - hausnerteoritis
-.00750 .00957 .00479 -.02273 .00773 -1.567 3 .215
Hipotesa Pengujian :
Ho diterima jika Thitung (-1,567) < T 0,025 (3) (3,182), berarti hasil percobaan dan hasil teoritis pada uji disolusi
tidak berbeda bermakna antar formula.
136
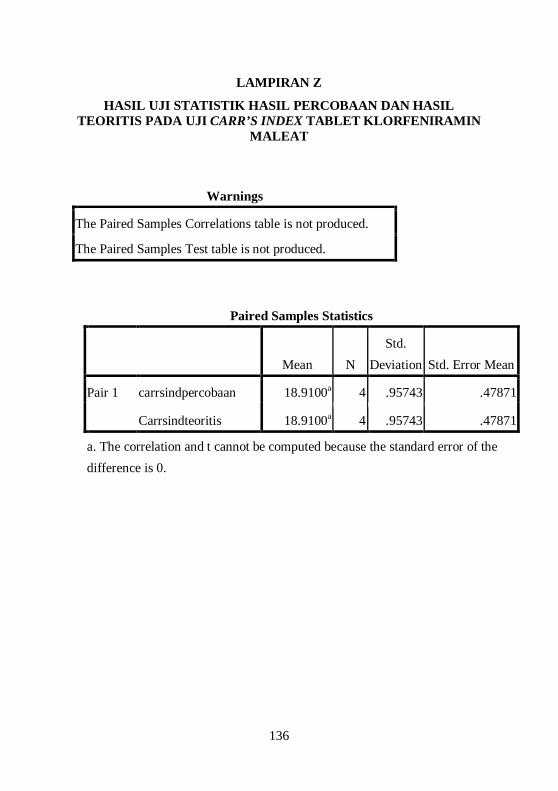
LAMPIRAN Z
HASIL UJI STATISTIK HASIL PERCOBAAN DAN HASIL TEORITIS PADA UJI CARR’S INDEX TABLET KLORFENIRAMIN
MALEAT
Paired Samples Statistics
Mean N Std.
Deviation Std. Error Mean
Pair 1 carrsindpercobaan 18.9100a 4 .95743 .47871
Carrsindteoritis 18.9100a 4 .95743 .47871
a. The correlation and t cannot be computed because the standard error of the difference is 0.
Warnings
The Paired Samples Correlations table is not produced.
The Paired Samples Test table is not produced.

137
LAMPIRAN AA
HASIL UJI STATISTIK HASIL PERCOBAAN DAN HASIL TEORITIS PADA UJI KEKERASAN TABLET KLORFENIRAMIN
MALEAT
Paired Samples Statistics
Mean N Std.
Deviation Std. Error
Mean
Pair 1 kekerasanpercobaan 10.8325 4 4.76997 2.38499
kekerasanteoritis 10.8300 4 4.77006 2.38503
Paired Samples Correlations N Correlation Sig.
Pair 1 kekerasanpercobaan & kekerasanteoritis
4 1.000 .000

138
Paired Samples Test Paired Differences
t df Sig. (2-tailed)
Mean Std.
Deviation Std. Error
Mean
95% Confidence Interval of the Difference
Lower Upper
Pair 1 kekerasanpercobaan - kekerasanteoritis
.00250 .00500 .00250 -.00546 .01046 1.000 3 .391
Hipotesa Pengujian :
Ho diterima jika Thitung (1,000) < T 0,025 (3) (3,182), berarti hasil percobaan dan hasil teoritis pada uji disolusi
tidak berbeda bermakna antar formula.

139
LAMPIRAN AB
HASIL UJI STATISTIK HASIL PERCOBAAN DAN HASIL TEORITIS PADA UJI KERAPUHAN TABLET KLORFENIRAMIN
MALEAT
Paired Samples Statistics
Mean N Std.
Deviation Std. Error
Mean
Pair 1 Kerapuhanpercobaan
.1393 4 .03290 .01645
kerapuhanteoritis .1218 4 .03275 .01637
Paired Samples Correlations N Correlation Sig.
Pair 1 Kerapuhanpercobaan & kerapuhanteoritis
4 .741 .259

140
Paired Samples Test Paired Differences
t df Sig. (2-tailed)
Mean Std.
Deviation Std. Error
Mean
95% Confidence Interval of the Difference
Lower Upper
Pair 1 Kerapuhanpercobaan - kerapuhanteoritis
.01750 .02363 .01181 -.02010 .05510 1.481 3 .235
Hipotesa Pengujian :
Ho diterima jika Thitung (1,481) < T 0,025 (3) (3,182), berarti hasil percobaan dan hasil teoritis pada uji disolusi
tidak berbeda bermakna antar formula.

141
LAMPIRAN AC
HASIL UJI STATISTIK HASIL PERCOBAAN DAN HASIL TEORITIS PADA UJI KONTANTA DISOLUSI TABLET
KLORFENIRAMIN MALEAT
Paired Samples Statistics
Mean N Std.
Deviation Std. Error
Mean
Pair 1 kdisolusipercobaan .011175 4 .0006652 .0003326
kdisolusiteoritis .011075 4 .0010275 .0005138
Paired Samples Correlations N Correlation Sig.
Pair 1 kdisolusipercobaan & kdisolusiteoritis
4 .896 .104

142
Paired Samples Test Paired Differences
t df Sig. (2-tailed)
Mean Std.
Deviation Std. Error
Mean
95% Confidence Interval of the Difference
Lower Upper
Pair 1 kdisolusipercobaan - kdisolusiteoritis
.0001000
.0005228 .0002614 -.0007319 .0009319 .383 3 .728
Hipotesa Pengujian :
Ho diterima jika Thitung (0,383) < T 0,025 (3) (3,182), berarti hasil percobaan dan hasil teoritis pada uji disolusi
tidak berbeda bermakna antar formula.
Top Related
Copyright © 2022 FDOKUMEN

