
Bahasa
Halaman
Hukum

77
BAB 5
SIMPULAN
5.1. Simpulan
Berdasarkan hasil penelitian yang telah dilakukan dan pengolahan
data secara statistik maka dapat diambil kesimpulan sebagai berikut:
1. Pemberian fraksi etil asetat ekstrak etanol daun tempuyung (Sonchus
arvensis Linn.) secara oral pada tikus putih jantan hiperurisemia
dengan dosis 1,0; 1,5 dan 2,0 g/kgBB, yang memberikan efek
penurunan kadar asam urat paling banyak adalah dosis 2,0 g/kgBB.
2. Hasil penelitian menunjukkan tidak ada hubungan yang linear antara
peningkatan dosis fraksi etil asetat ekstrak etanol daun tempuyung
dengan peningkatan penurunan asam urat dalam darah tikus putih
jantan.
5.2. Alur Penelitian Selanjutnya
Berdasarkan hasil penelitian yang telah dilakukan, dapat dilakukan
penelitian lebih lanjut mengenai:
1. Uji toksisitas daun tempuyung pada hewan coba.
2. Identifikasi jenis flavonoid yang terkandung dalam fraksi etil asetat
ekstrak etanol daun tempuyung.

78
DAFTAR PUSTAKA
Adnan, M., 1997, Teknik Kromatografi untuk Analisis Bahan
Makanan, Andi, Jogyakarta, hal. 9-10.
Backer, C.A., 1965. Flora of java : Spermathopyta vol. II. Groningen,
Noordhoff, p. 420
Brenner, G. M. & Stevens, C.W., 2006. Pharmacology 2nd
ed. Elsevier,
USA, p. 341-342.
Cronstein, B.N., and Robert T, 2006. The inflamantory Prosess of Gout
and its Treatment, Newyork : Biomed Central Ltd
Damayanti, D., 2012. Panduan Lengkap Mencegah & Mengobati Asam
Urat, Yogyakarta, hal.48-49, 98.
Departemen Kesehatan Republik Indonesia, 1977. Materia Medika
Indonesia. (Jilid I), Jakarta, hal 100-105.
Departemen Kesehatan Republik Indonesia, 1985. Cara Pembuatan
Simplisia, Jakarta, hal : 3
Departemen Kesehatan Republik Indonesia, 1991. Inventaris Tanaman
Obat Indonesia I. Jakarta.
Departemen Kesehatan Republik Indonesia, 1995, Farmakope Indonesia
(Jilid IV), Direktorat Jenderal Pengawasan Obat Dan Makanan, Jakarta, hal.
1191.
Departemen Kesehatan Republik IndonesiaI, 2000, Parameter Standar
Umum Ekstrak Tumbuhan Obat, Direktorat Pengawasan Obat
Tradisional, Jakarta, hal. 3, 10-39.
Dipiro, Joseph T., and Talbert L. Robert., 2005. Pharmacotheraphy: A
Patophysiology Approach. 6th
ed. USA: McGraw-Hill Companies.
79
Doyle, M.P., Mungall, 1980, Experimental of Organic Chemistry, John
Wiley and Sons, New York, pp. 24-34.
Ernst, M. E., Clark, E., Hawkinks, D. W., 2008. Pharmacology A
Pathophysiologic Approach, 5 th
ed, McGraw-Hill Companies Inc,
Singapore, hal. 1539-1547.
Farnsworth, N. R., 1966, Biological and Phytochemical Screening of Plants,
Journal of Pharmaceutical Sciences, 69 (3) : 225-268.
Gritter, J.R., J.M. Bobbitt dan A. E. Schwarting, 1991, Pengantar
Kromatografi, Penerbit ITB, Bandung, hal. 107-137.
Harborne, J.B., 1984. Metode Fitokimia Penuntun Cara Modern
Menganalisis Tumbuhan, Terbitan 2. (Padwinata, K. Peterjemah). ITB,
Bandung, hal. 4 -15, 69-102.
Hellmann, D.B., and Imboden, J.B., 2008. Arthritis And Musculoskeletal
Disorders, Tierney, M.L., Current Medical diagnosis and Treatment, 47th
ed., Mc Graw Hill companies, New York, page. 703-709.
Henry, J.B., 2001. Clinical Diagnosis and Management by Laboratory
Methods, 20 th
ed. W.B. Sounders Company, New York, page. 183-184.
Huether, S.E., McCance, K.L., 2008. Understanding Phatophysiology, 4th
ed. Elsevier., USA, p. 1053-1056.
Katzung, B. G., 2002. Farmakologi Dasar dan Klinik, salemba medika,
Jakarta, hal : 487-403.
Khayoon, W.S., Al-Abaichy, M.Q., Jasim, M., Al-Hamdany, M.A., 2008.
Spectrophotometric Determination of Allopurinol in Tablet Formulation.
Journal Of Physical Science. Vol 19 (2) : 3-30.
Koenhen,D.M. dan Smolders, C.A. 1975. The Determination of Solubility
Parameters of Solvent and Polymers by Means of Correlations with
Other Physical Quantities. The University of Technology, Enschede, The
Netherlands, 1172.

80
Krisnatuti, D., yenrina, R., Uripi, V.,2001. Perencanaan Menu Untuk
penderita Gangguan Asam Urat, Penebar Swadaya, hal: 5-14.
Kumar, P., Clark, M., 2004. Clinical Medicine, 5th
ed, Saunders,
Tottenham, p. 552-554.
Lehman, J.W., 2004, Microscale Operational Organic Chemistry,
Prentice hall upper Saddle River, New Jersey, hal. 634.
Markham, K.R., 1988. Cara Mengidentifikasi Flavonoid, (Padwinata, K.
Peterjemah). ITB, Bandung, hal.5.
Martindale the Extra Pharmacopoeia., 2005 34th
ed. The pharmaucetical
Press London, p. 401.
McPhee, S.J., Papadakis, M. A., 2008. Medicinal Diagnosis & Treatment.
47th
ed, McGraw Hill Medical., USA, p. 706-710.
Mitruka, J and H. M. Rawnsley, 1976, Animal For Medical Reasearch,
John Wiley and Sons, Newyork, 122.
Muhlisah, Ir. Fauziah, 2007, Tanaman Obat Keluarga, Penebar Swadaya,
Jakarta.
Mulya, M., and Suharman, 1995, Analisis Instrumental, Airlangga
University Press, Surabaya, hal. 61, 224, 374, 375, 404.
Neal, M. J., 2005. Medical Pharmacology at a Glance, 4th
ed, Blackwell
Publ. Co, Uk, p. 78-79.
Priyanto., 2008, Farmakologi Dasar, Leskonfi, Jawa barat, hal. 11-12
Ringerts, H., 1966. The Molecular and Crystal structure Of Uric Acid.
Acta Cryst. Vol 20, p. 397.
Robinson T., 1995, Kandungan Organik Tumbuhan Tinggi, edisi 6 (K.
Pudmawinata, penerjemah), ITB, Bandung, hal. 191-193, 208.
81
Rodwell, V.W., 2003. Metabolism Of Purine And Pyrimidyne
Nucleoside, 26 th
ed, McGraw-Hill Companies, New York, p. 293-299.
Rosita, S.M.D dan Moko, H, 1993. Kumis Kucing, Cabe Jawa Dan
Tempuyung. WartaTumbuhan Obat Indonesia, hal 11-13.
Ross and Wilson, 1988. Anatomy And Phatophysiology In Health And
Illness.
Schefler, W.C., 1987, Statistika untuk Biologi, Farmasi, Kedokteran,
dan Ilmu yang Bersangkutan, Penerbit ITB, Bandung, hal. 71-102.
Seran, Y. M., 2010, Pengaruh Ekstrak Daun Tempuyung (Sonchus arvensis
Linn.) Terhadap Kadar Asam Urat Dalam Darah Tikus Putih Jantan Galur
Wistar Hiperurisemia. Skripsi Jurusan Farmasi, Widya Mandala
Surabaya.
Sharp, P.E., and M.C. La Regina, 1998, The Laboratory Rat: A Volume
in the Laboratory Animal Pocket Referensi Series, CRC Press, Florida,
hal. 1.
Smith, J. B. dan S.Mangkoewidjojo., 1988, Pemeliharaan, Pembiakan
dan Penggunaan Hewan Percobaan di Daerah Tropis, Universitas
Indonesia, Jakarta, hal. 38, 49-55.
Soeroso, J. dan Algristian, H., 2012, Asam Urat, Penebar puls, Jakarta, hal.
88
Voigt, R., 1995, Buku Pelajaran Teknologi Farmasi, Edisi V. Penerbit
Gadjah Mada University Press, Yogyakarta, hal. 554, 570, 580-582.
Wagner, H. & Bladt, S., 2001, Plant Drug Analysis, 2nd
ed., Pringer, New
York, 195-197.
Wortmann, R.L., 2005. Disorder Of Purine And Pyrimidine Metabolism,
In : Bacher, I., Wald, B., Wilson (Ed), Horrison, Vol 16, Mc Graw Hill,
New York, p. 23.

82
Zainuddin, M., 2000, Metodologi Penelitian, Fakultas Farmasi Universitas
Airlangga, Surabaya, hal. 52-54.

83
LAMPIRAN A
SURAT DETERMINASI TANAMAN
84
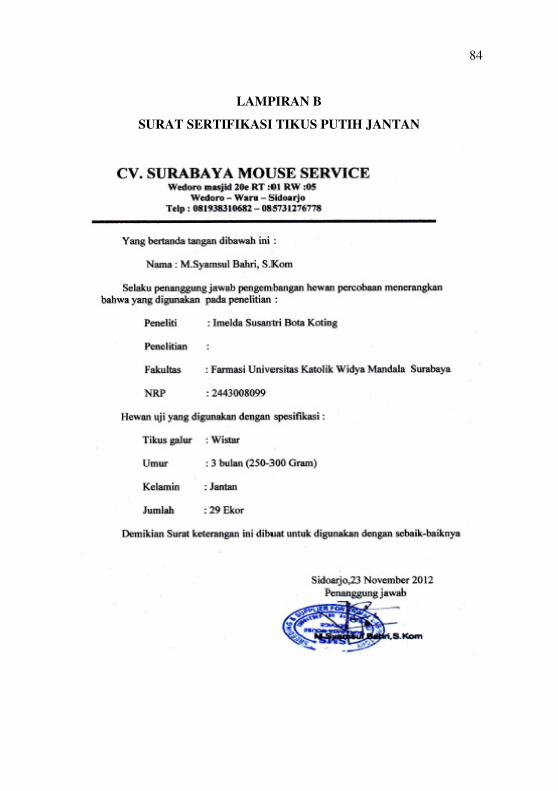
LAMPIRAN B
SURAT SERTIFIKASI TIKUS PUTIH JANTAN

85
LAMPIRAN C
HASIL PARAMETER SIMPLISIA
Hasil Perhitungan Penetapan Air Serbuk
Replikasi Kadar air serbuk
1
2
3
Rata-rata
9,1 %
9,2 %
9.1 %
9,13 %
Rata-rata :�,� � �,� � �,�
�� 9,13 %
Hasil Perhitungan Penetapan Kadar Abu Serbuk
No W
(krus
kosong)
(gram)
W
(bahan)
(gram)
W
(krus + abu)
(gram)
%
Kadar
Abu
1
2
3
Rata-rata
39,8212
29,7710
36,1525
2,0403
2,0159
2,0010
40,0700
30,0057
36,3882
12,19
11,64
11,77
11,86
Berat kurs kosong � serbuk� � Berat kurs kosong�
Berat Serbuk � 100%

86
Rata-rata :��,�� � ��,�� � ��,
�� 11,86 %
Hasil Perhitungan Kadar Sari Larut Etanol Serbuk
No
Berat cawan +
ekstrak setelah
diuapkan
Berat
cawan
kosong
Berat
serbuk
Kadar
Sari Larut
Etanol
(%)
1
2
3
Rata-rata
6,6460
29,4000
27,9370
26,4180
28,8290
27,3700
5,0330
5,0330
5,0150
4,53
11,34
11,30
9,05
Berat cawan � ekstrak� � Berat cawan kosong�
Berat Serbuk� 100%
Rata-rata : �,#� � ��,�� � ��,�$
�� 9,05 %
Hasil Perhitungan Penetapan Kadar Abu Ekstrak
No
W
(krus kosong)
(gram)
W (bahan)
(gram)
W
(krus + abu)
(gram)
%
Kadar
Abu
1
2
3
Rata-rata
20,2150
21,2250
20,5201
2,0525
2,0052
2,0352
20,4150
21,4250
20,7201
9,74
9,97
9,82
9,84

87
Rata-rata = 9,74 % + 9,97 % + 9,82 %
= 9,84 % 3
Hasil Perhitungan Randemen Ekstrak
Berat ekstrak kental x 100 %
berat serbuk
4,125,130 x 100 % = 20,62 %
2000
Hasil Perhitungan Harga Rf pada Pemeriksaan secara KLT
dengan Pelarut = butanol : asam asetat : air (4: 1: 5)
Contoh perhitungan :Rf : Jarak yang ditempuh oleh zat
Jarak yang ditempuh oleh fase gerak
1. Rf : �,#
' � 0,56 (Ekstrak etanol)
2. Rf : �,#
' � 0,81 (Fraksi etil asetat)
3. Rf : #,$
' = 0,62 (pembanding/rutin)
4. Rf : �,$
' = 0,5 (Fraksi air noda pertama dari bawah )
�,$
' = 0,68 (Fraksi air noda kedua dari bawah )
Rumus = (berat kurs kosong + seruk) - (Berat kus kosong)
x 100 % berat serbuk

88
LAMPIRAN D
PERHITUNGAN KONSETRASI SUSPENSI FRAKSI ETIL ASETAT
EKSTRAK ETANOL DAUN TEMPUYUNG (Sonchus arvensis Linn.)
Konsentrasi = Dosis x berat badan tikus__
Volume Pemberian x 1000
I. Konsentrasi = 1,0 g x 100g
1 ml x 1000
= 0,1 g/ml
= 10 g/100 ml
= 10 % b/v
II. Konsentrasi = 1,5 g x 100g
1 ml x 1000
= 0,15 g/ml
= 15 g/100 ml
= 15% b/v
III. Konsentrasi = 2,0 g x 100g
1 ml x 1000
= 0,2 g/ml
= 20 g/100 ml
= 20% b/v
89
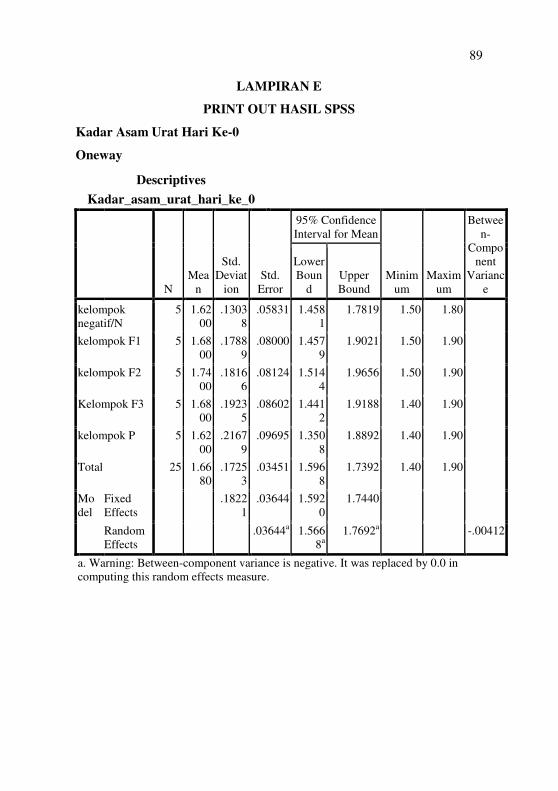
LAMPIRAN E
PRINT OUT HASIL SPSS
Kadar Asam Urat Hari Ke-0
Oneway
Descriptives
Kadar_asam_urat_hari_ke_0
N
Mea
n
Std.
Deviat
ion
Std.
Error
95% Confidence
Interval for Mean
Minim
um
Maxim
um
Betwee
n-
Compo
nent
Varianc
e
Lower
Boun
d
Upper
Bound
kelompok
negatif/N
5 1.62
00
.1303
8
.05831 1.458
1
1.7819 1.50 1.80
kelompok F1 5 1.68
00
.1788
9
.08000 1.457
9
1.9021 1.50 1.90
kelompok F2 5 1.74
00
.1816
6
.08124 1.514
4
1.9656 1.50 1.90
Kelompok F3 5 1.68
00
.1923
5
.08602 1.441
2
1.9188 1.40 1.90
kelompok P 5 1.62
00
.2167
9
.09695 1.350
8
1.8892 1.40 1.90
Total 25 1.66
80
.1725
3
.03451 1.596
8
1.7392 1.40 1.90
Mo
del
Fixed
Effects
.1822
1
.03644 1.592
0
1.7440
Random
Effects
.03644a 1.566
8a
1.7692a
-.00412
a. Warning: Between-component variance is negative. It was replaced by 0.0 in
computing this random effects measure.

90
Test of Homogeneity of Variances
Kadar_asam_urat_hari_ke_0
Levene Statistic df1 df2 Sig.
.690 4 20 .607
Post Hoc Tests
Multiple Comparisons
Kadar_asam_urat_hari_ke_0
Tukey HSD
(I) Kelompok
(J)
Kelo
mpo
k
Mean
Differenc
e (I-J) Std. Error Sig.
95% Confidence
Interval
Lower
Bound
Upper
Bound
kelompok
negatif /N
F1 -.06000 .11524 .984 -.4048 .2848
F2 -.12000 .11524 .833 -.4648 .2248
F3 -.06000 .11524 .984 -.4048 .2848
P .00000 .11524 1.000 -.3448 .3448
ANOVA
Kadar_asam_urat_hari_ke_0
Sum of
Squares Df Mean Square F Sig.
Between Groups .050 4 .013 .380 .821
Within Groups .664 20 .033
Total .714 24

91
Kelompok F1 N (-) .06000 .11524 .984 -.2848 .4048
F2 -.06000 .11524 .984 -.4048 .2848
F3 .00000 .11524 1.000 -.3448 .3448
P .06000 .11524 .984 -.2848 .4048
Kelompok F 2 N (-) .12000 .11524 .833 -.2248 .4648
F1 .06000 .11524 .984 -.2848 .4048
F3 .06000 .11524 .984 -.2848 .4048
P .12000 .11524 .833 -.2248 .4648
kelompok F 3 N (-) .06000 .11524 .984 -.2848 .4048
F1 .00000 .11524 1.000 -.3448 .3448
F2 -.06000 .11524 .984 -.4048 .2848
P .06000 .11524 .984 -.2848 .4048
kelompok
positif /P
N (-) .00000 .11524 1.000 -.3448 .3448
F1 -.06000 .11524 .984 -.4048 .2848
F2 -.12000 .11524 .833 -.4648 .2248
F3 -.06000 .11524 .984 -.4048 .2848

92
Kadar Asam Urat Hari Ke-11
Oneway
Descriptives
Kadar_asam_urat_hari_ke_11
N Mean
Std.
Deviat
ion
Std.
Error
95% Confidence
Interval for Mean
Mini
mum
Maxim
um
Betwee
n-
Compo
nent
Varianc
e
Lower
Bound
Upper
Bound
kelompok
negatif/N
5 3.760
0
.3049
6
.1363
8
3.3813 4.1387 3.40 4.20
Kelompok F1 5 3.620
0
.5585
7
.2498
0
2.9264 4.3136 3.20 4.60
Kelompok F2 5 3.540
0
.4037
3
.1805
5
3.0387 4.0413 3.10 4.10
Kelompok F3 5 3.700
0
.2738
6
.1224
7
3.3600 4.0400 3.30 4.00
kelompok
Positif/P
5 4.360
0
.2302
2
.1029
6
4.0741 4.6459 4.10 4.70
Total 25 3.796
0
.4522
9
.0904
6
3.6093 3.9827 3.10 4.70
Mo
del
Fixed
Effects
.3731
0
.0746
2
3.6403 3.9517
Random
Effects
.1457
9
3.3912 4.2008
.07844
Test of Homogeneity of Variances
Kadar_asam_urat_hari_ke_11
Levene Statistic df1 df2 Sig.
.897 4 20 .484

93
Post Hoc test
Multiple Comparisons
Kadar_asam_urat_hari_ke_11
Tukey HSD
(I) Kelompok
(J)
Kelom
pok
Mean
Difference
(I-J) Std. Error Sig.
95% Confidence
Interval
Lower
Bound
Upper
Bound
kelompok negatif F 1 .14000 .23597 .975 -.5661 .8461
F 2 .22000 .23597 .881 -.4861 .9261
F 3 .06000 .23597 .999 -.6461 .7661
P -.60000 .23597 .121 -1.3061 .1061
Kelompok F 1 N (-) -.14000 .23597 .975 -.8461 .5661
F 2 .08000 .23597 .997 -.6261 .7861
F 3 -.08000 .23597 .997 -.7861 .6261
P -.74000* .23597 .037 -1.4461 -.0339
ANOVA
Kadar_asam_urat_hari_ke_11
Sum of
Squares df Mean Square F Sig.
Between Groups 2.126 4 .531 3.818 .018
Within Groups 2.784 20 .139
Total 4.910 24

94
Kelompok F 2 N (-) -.22000 .23597 .881 -.9261 .4861
F 1 -.08000 .23597 .997 -.7861 .6261
F 3 -.16000 .23597 .959 -.8661 .5461
P -.82000* .23597 .018 -1.5261 -.1139
Kelompok F 3 N (-) -.06000 .23597 .999 -.7661 .6461
F1 .08000 .23597 .997 -.6261 .7861
F 2 .16000 .23597 .959 -.5461 .8661
P -.66000 .23597 .074 -1.3661 .0461
kelompok Positif N (-) .60000 .23597 .121 -.1061 1.3061
F 1 .74000* .23597 .037 .0339 1.4461
F 2 .82000* .23597 .018 .1139 1.5261
F 3 .66000 .23597 .074 -.0461 1.3661
*. The mean difference is significant at the 0.05 level.

95
Kadar Asam Urat Hari Ke-21
Oneway
Descriptives
Kadar_asam_urat_hari_ke_21
N Mean
Std.
Devi
ation
Std.
Error
95%
Confidence
Interval for
Mean
Mini
mum
Maxi
mum
Between
-
Compon
ent
Variance
Lower
Bound
Upper
Bound
kelompok
negatif
5 3.4800 .5718
4
.2557
3
2.7700 4.1900 3.00 4.20
Kelompok F 1 5 2.5600 .4722
3
.2111
9
1.9737 3.1463 2.00 3.30
kelompok F 2 5 2.4200 .2490
0
.1113
6
2.1108 2.7292 2.00 2.60
kelompok F 3 5 2.4000 .3391
2
.1516
6
1.9789 2.8211 2.00 2.80
kelompok P 5 2.2400 .2302
2
.1029
6
1.9541 2.5259 2.00 2.60
Total 25 2.6200 .5773
5
.1154
7
2.3817 2.8583 2.00 4.20
Mo
del
Fixed
Effects
.3949
7
.0789
9
2.4552 2.7848
Random
Effects
.2209
1
2.0067 3.2333
.21280

96
Post HocTests
Multiple Comparisons
Kadar_asam_urat_hari_ke_21
Tukey HSD
(I) Kelompok
(J)
Kel
om
pok
Mean
Difference (I-
J) Std. Error Sig.
95% Confidence
Interval
Lower
Bound
Upper
Bound
kelompok negatif F1 .92000* .24980 .011 .1725 1.6675
F 2 1.06000* .24980 .003 .3125 1.8075
F 3 1.08000* .24980 .003 .3325 1.8275
P 1.24000* .24980 .001 .4925 1.9875
Kelompok F 1 N(-
)
-.92000* .24980 .011 -1.6675 -.1725
F 2 .14000 .24980 .979 -.6075 .8875
F 3 .16000 .24980 .966 -.5875 .9075
P .32000 .24980 .705 -.4275 1.0675
Test of Homogeneity of Variances
Kadar_asam_urat_hari_ke_21
Levene Statistic df1 df2 Sig.
2.476 4 20 .077
ANOVA
Kadar_asam_urat_hari_ke_21
Sum of
Squares df Mean Square F Sig.
Between Groups 4.880 4 1.220 7.821 .001
Within Groups 3.120 20 .156
Total 8.000 24

97
kelompok F 2 N
(-)
-1.06000* .24980 .003 -1.8075 -.3125
F 1 -.14000 .24980 .979 -.8875 .6075
F 3 .02000 .24980 1.000 -.7275 .7675
P .18000 .24980 .949 -.5675 .9275
kelompok F 3 N
(-)
-1.08000* .24980 .003 -1.8275 -.3325
F 1 -.16000 .24980 .966 -.9075 .5875
F 2 -.02000 .24980 1.000 -.7675 .7275
P .16000 .24980 .966 -.5875 .9075
kelompok positif N
(-)
-1.24000* .24980 .001 -1.9875 -.4925
F 1 -.32000 .24980 .705 -1.0675 .4275
F 2 -.18000 .24980 .949 -.9275 .5675
F 3 -.16000 .24980 .966 -.9075 .5875
*. The mean difference is significant at the 0.05 level.
98
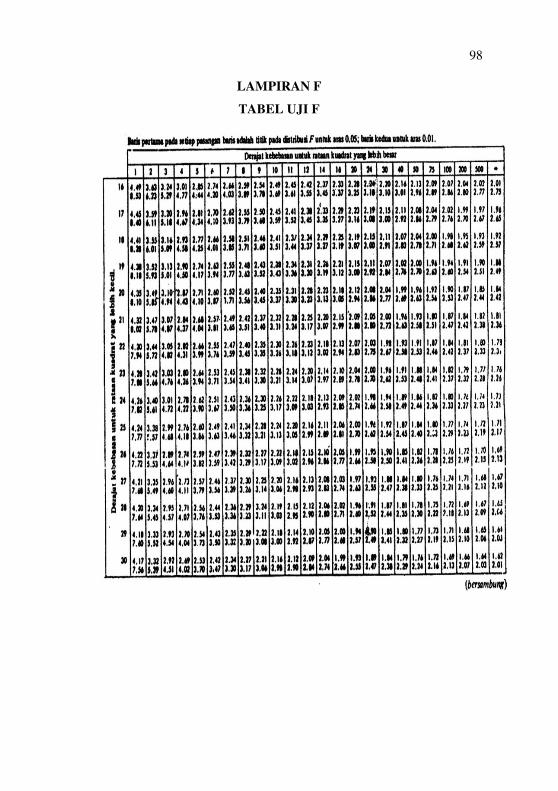
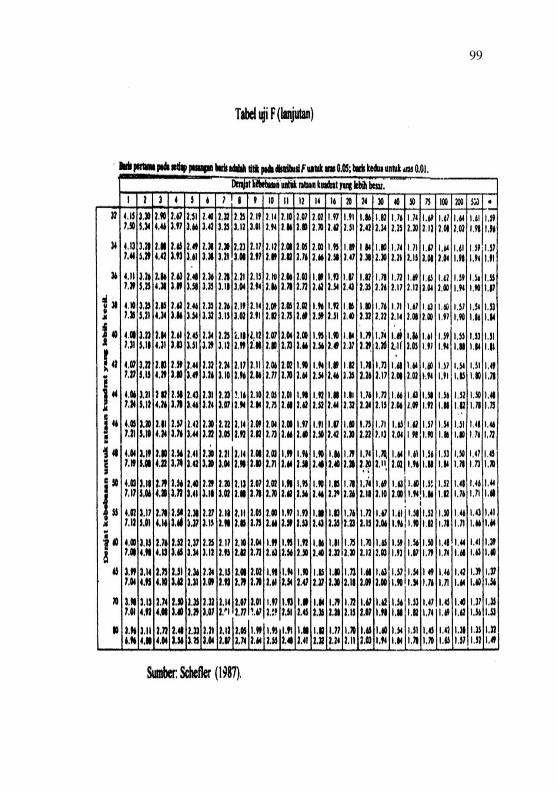
LAMPIRAN F
TABEL UJI F
99

100
LAMPIRAN G
TABEL KORELASI
Top Related
Copyright © 2022 FDOKUMEN

