Youth Research Compendium - Foresight For Development
358
-
Upload
khangminh22 -
Category
Documents
-
view
0 -
download
0
Transcript of Youth Research Compendium - Foresight For Development

1Institute of Economic Affairs

2Youth Research Compendium
Youth Research
CompendiumEdited by:
Angela KitongaKatindi Sivi Njonjo
Awuor Ponge

3Institute of Economic Affairs
Edited by: Angela KitongaKatindi Sivi Njonjo Awuor Ponge
Published by
© Institute of Economic Affairs (IEA), 2011
ACK Garden House, 5th Floor, Wing DBishops Road, 1st Ngong AvenueP.O Box 53989-00200Nairobi, KenyaTel: +254-20-2721262, 2717402Fax: +254-20-2716231E-mail: [email protected] Website: www.ieakenya.or.ke
With funding from
ISBN: 978-9966-1561-1-2
Design and layout and Printing Ascent
All rights reserved. No part of this book may be reproduced, stored in a retrieval system, or transmitted, in any form or by any means, electronic, mechanical, photocopying, recording or otherwise, without the prior permission of the publishers. The analysis and policy recommendations of this compendium do not necessarily reflect the views of the Rockefeller foundation or those of the Institute of Economic Affairs, its board or its members. Responsibility for the views presented herein rests with the authors.

4Youth Research Compendium
Content Page 3
Abbreviations 4
List of Tables 11
List of Figures 15
Preface 18
Acknowledgements 19
Profile of Contributors 20
1. Introduction and Overview 23
2. The Demographic Dividend: A Gift or a Curse? 39
3. The Unemployment Casualties 61
4. Education: Adequate and Equitable Provision? 89
5. Education: An Obsession with Increasing Access at the Expense of Quality 133
6. Health: Are Young People Really ‘Chillin’? 165
7. Family Ties or Family Lies? 197
8. Youth and Politics: Generational Missions 225
9. Vigilante Violence: Kenya’s Unholy Alliances 247
10. Crime: The Young and the Restless 279
11. Sports: On the Right Track 307
12. Entertainment: The Unbwogable Industry 329
Contents

5Institute of Economic Affairs
3-D Three-Dimensional
4-D Four-Dimensional
ACE Adult and Continuing education
ACRWC African Charter on the Rights and Welfare of the Child
AIC Africa Inland Church
AIC African Israel Church
AIDS Acquired Immunodeficiency Syndrome
AIE Annual Increase in Enrolment
AIP Annual Increase in Population
AIPC African Independent Pentecostal Church
ANC Ante Natal Care
ANCEFA African Network Campaign on Education for All
ANPPCAN African Network for Prevention and Protection against Child Abuse and Network
AOC African Orthodox Church,
ARH&D Adolescent Reproductive Health and Development
ARV Anti Retro-Viral
ASAL Arid and Semi-Arid Lands
ASFR Age Specific Fertility Rate
ASTs Age-Structural Transitions
AU African Union
BBC British Broadcasting Corporation
CAVI Citizens Against Violence
CBR Crude Birth Rates
CBS Columbia Broadcasting Systems
CCK Communication Commission of Kenya
CD Compact Disc
CDF Constituency Development Fund (CDF)
CDR Crude Death Rates
CHE Commission for Higher Education
CIA Central Intelligence Agency
CICRED Committee for International Cooperation in National Research and Demography
CIDA Canadian International Development Agency
CIPK Council of Imams and Preachers of Kenya
CJPB Centre for Justice and Peace Building
CLARION Centre for Legal Reform
CODESSRIA Council for the Development of Social Science Research in Africa
CPE Certificate of Education
Acronyms & Abbreviations

6Youth Research Compendium
CPRC Comprehensive Post rape Care
CRIMP Central Region Infrastructure Maintenance Programme
CSA Centre for the Study of Adolescence
CSI Crime Scene Investigation
CSIN Crime Scene Investigation - Nairobi
CYPA Children and Young Persons Act
DEMA Decentralisation of Education Management
DFID Department for International Development
DFRDS District Focus for Rural Development Strategy
DIT Directorate of Industrial Training
DJ Disc Jockey
DLTLD Division of Leprosy, Tuberculosis and Lung Disease
DVD Digital Video Disc
E&T Education and Training
EAA East African Association
EAAG East African Association Generation
EAR East African Records Limited
ECA Economic Commission for Africa
ECDE Early Childhood Development Education
EFA Education For All
EMI Electric Musical Industries
EMIS Education Management Information Systems
ERSWEC Economic Recovery Strategy for Wealth and Employment Creation
ESP Economic Stimulus Programme
EYC Elimu Yetu Coalition
FBI Federal Bureau of Investigation
FES Friedrich Ebert Stiftung
FGC Female Genital Cutting
FGM Female Genital Mutilation
FIDA International Federation for Women’s Rights
FIFA Federation of International Football Association
FKL Football Kenya Limited
FLEP Family Life Education Programme
FM (Radio) Frequency Modulation
FORD Forum for the Restoration of Democracy
FPE Free Primary Education
FY Financial Year
GATM Global Fund for AIDs, Tuberculosis and Malaria
GB Great Britain
GBV Gender Based Violence
GDP Gross Domestic Product
GER Gross Enrolment Rate
GFATM Global Fund to fight AIDS, TB and Malaria
GHCRE Geography, History, Civics and Religious Education
GN Generation Next
GNP Gross National Product
GoK Government of Kenya
GPI Gender Party Index
GST General Systems Theory
GSU General Service Unit

7Institute of Economic Affairs
HDTV High Definition Television
HELB Higher Education Loans Board
HESP High School Equalization Policy
HIV Human Immuno-deficiency Virus
HPV Human Papilloma Virus
IAAF International Association of Athletics Federations
ICPC International Centre for Prevention of Crime
ICPD International Conference on Population and Development
ICT Information Communication Technology
ICTJ International Centre for Transitional Justice
IDPs Internally Displaced People
IEA Institute of Economic Affairs
IEC Information, Education and Communication
IGA Income Generating Activities
IIEP International Institute for Educational Planning
ILFS Integrated Labour Force Survey
ILO International Labour Organization
IMF International Monetary Fund
IOC International Olympic Committee
IP (Online) Internet Protocol (Address)
IRBC Immigration & Refugee Board of Canada
IRIN Integrated Regional Information Networks
ISO International Organization for Standardisation
ISS Institute of Security Studies
ITNs Insecticide Treated Nets
ITs Institutes of Technology
JAB Joint Admissions Board
JDL Jewish Defense League
JKUAT Jomo Kenyatta University of Agriculture and Technology
KACE Kenya Advanced Certificate of Education
KAIS Kenya AIDs Indicator Survey
KANU Kenya African National Union
KAPEA Kenya Association of Private Employment Agencies
KASU Kenya African Study Union
KAU Kenya African Union
KBC Kenya Broadcasting Corporation
KBSA Kenya Boy Scouts Association
KCA Kikuyu Central Association
KCB Kenya Commercial Bank
KCB Kenya Copyright Board
KCC Kenya Creameries Corporation
KCDF Kenya Community Development Foundation
KCE Kenya Certificate of Education
KCPE Kenya Certificate of Primary Education
KCPS Kenya Contraceptive Prevalence Survey
KCSE Kenya Certificate of Secondary Education
KDHS Kenya Demographic and Health Survey
KEPI Kenya Expanded Programme on Immunization
KES Kenya Shillings
KESPA Kenya Service Provision Assessment

8Youth Research Compendium
KESSP Kenya Education Sector Support Programme
KESSP Kenya Sector Support Programme
KFC Kenya Film Commission
KFF Kenya Football Federation
KFS Kenya Fertility Survey
KHPF Kenya Health Policy Framework
KIHBS Kenya Integrated Household Budget Survey
KISA Kenya Independent Schools Association
KJSE Kenya Junior Secondary Education
KKESA Kikuyu Karinga Educational Schools Association
KKV Kazi Kwa Vijana
KLDT Kenya Land Defense Force
KLFA Kenya Land and Freedom Army
KNASP Kenya National Aids Strategic Plan
KNBS Kenya National Bureau of Statistics
KNCHR Kenya National Commission on Human Rights
KNDP Kenya National Development Plan
KNEC Kenya National Examinations Council
KNH Kenyatta National Hospital
KNSC Kenya National Sports Council
KNSP Kenya National Sports Policy
KNT Kenya National Theatre
KNYP Kenya National Youth Policy
KPA Kenya Provincial Association
KPLC Kenya Power and Lighting Company
KRFU Kenya Rugby Football Union
KSHs Kenyan Shillings
KSPA Kenya Service Provision Assessment Survey
KSSSA Kenya Secondary Schools Sports Association
KTCSA Kenya Teachers Colleges Sports Association
KTTC Kenya Technical Training College
KTTF Kenya Thabiti Task Force
KVF Kenya Volleyball Federation
LAC Latin America and Caribbean Countries
LATF Local Authority Transfer Fund
LCD Liquid Crystal Display
LegCo Legislative Council
LG Lost Generation
LHG Lancaster House Generation
LKWV League of Kenya Women Voters
LP Long Play
MARPs Most At Risk Populations
MCH/FP Maternal Child Health and Family Planning
MCSK Music Copyright Society of Kenya
MDGs Millennium Development Goals
MI Module I
MII Module II
MMG Mau Mau Generation
MMR Maternal Mortality Rates
MMUST Masinde Muliro University of Science and Technology

9Institute of Economic Affairs
MoE Ministry of Education
MoEST Ministry of Education Science and Technology
MoH Ministry of Health
MoYAS Ministry of Youth Affairs and Sports
MP3/MPEG-3 Moving Picture Experts Group – Audio Layer 3.
MRC Mombasa Republican Council
MSM Men having Sex with other Men
MSMEs Micro, Small and Medium Scale Enterprises
MTP Medium Term Plan
MYSA Mathare Youth Sports association
NACADA National Agency for the Campaign Against Drug Abuse
NARC National Rainbow Coalition
NASCOP National AIDS & STI Control Programme
NCAPD National Coordinating Agency for Population and Development
NCC Nairobi City Council
NCCK National Council of Churches of Kenya
NCCS The National Council for Children’s Services
NCDs Non-Communicable Diseases
NCPD National Council for Population and Development
NCST National Council for Science and Technology
NDP National Development Plan
NEAS National Employment Assurance Scheme
NEB National Employment Bureau
NEP North Eastern Province
NER Net Enrolment Rate
NFE Non-Formal Education
NGOs Non Governmental Organizations
NHIF National Hospital Insurance Fund
NHSSP National Health Sector Strategic Plan II
NIVTC National Industrial and Vocational Training Council
NLB National Labour Board
NLC Nomiya Luo Church
NMDC National Manpower Development Committee
NOCK National Olympic Committee - Kenya
NPC Nairobi Pentecostal Church
NPPSD National Population Policy for Sustainable Development
NPSSD National Population Policy for Sustainable Development
NRHS National Reproductive Health Strategy
NRR Net Reproduction Rate
NSSF National Social Security Fund
NTA National Taxpayers Association
NTV Nation Television
NYDP National Youth Development Programme
NYS National Youth Service
ODE Open and Distance Education
OECD Organization for Economic Co-operation and Development
OVC Orphans and Vulnerable Children
PA Physical Activity
PALA Presidential Active Lifestyle Award
PC Provincial Commissioner

10Youth Research Compendium
PE Physical Education
PE Present Enrolment
PEPFAR President’s Emergency Plan for AIDS Relief
PEV Post Election Violence
PHC Primary Health Care
PICK Party of Independent Candidates of Kenya
PIF Policy and Investment Framework
PLHIV People Living with HIV
PLTLD People Living with Tuberculosis and Lung Disease
PMCT Prevention of Mother to Child Transmission
PNC Post Natal Care
POA Platform of Action
POU Point of Use
PP Present Population
PRB Population Reference Bureau
PSSP Privately Sponsored Students Programme
PT Physical Training
PTA Parents Teachers Association
PTBR Pupil-Textbook Ratio
PTR Pupil-Teacher ratio
PVR Personal Video Recorder
RAAAPP Rapid Assessment, Analysis and Action Planning Process
RCS Relative Cohort Size
RH Reproductive Health
RH/FP Reproductive Health and Family Planning
RoK Republic of Kenya
SAfAIDS South Africa HIV/ AIDS Information Services
SAGAs Semi Autonomous Government Agencies
SAPs Structural Adjustment programmes
SAUVCA South African University Chancellors’ Association
SES Social Economic Status
SFD Social Fund for Development
SGBV Sexual and Gender Based Violence
SID Society for International Development
SIDA Swedish International Development Authority
SLDF Sabaot Land Defense Force
SOYA Sportsman of the Year Award
SP Short Play
SPREAD Strengthening Primary Education Project
SRH Sexual and Reproductive Health
SSA Sub-Saharan Africa
SSE Subsidised Secondary Education
SSMB Sports Stadia Management Board
SSP Self Sponsored Programme
STD Sexually Transmitted Diseases
STD Standard
STI Sexually Transmitted Infection
SWTS School-to-Work Transition Survey
TAM Technology Acceptance Model
TB Tuberculosis

11Institute of Economic Affairs
TFR Total Fertility Rate
THA Taita Hills Association
TIQUET Total Integrated Quality Education and Training
TIVET Technical, Industrial, Vocational Education and Training
TSC Teachers Service Commission
TTIs Technical Training Institutes
TV Television
TVT Technical and Vocational Training
TWLTW Together We Light the Way
UG Uhuru Generation
UMA Ukamba Members Association
UN United Nations
UNAIDS United Nations
UNCRC United Convention of the Rights of the Child
UNDP United Nations Development Programme
UNESCO United Nations Educational, Scientific and Cultural Organisation
UNFPA United Nations Fund for Population Activities
UNFPA United Nations Population Fund
UNICEF United Nations Children Fund
UoN University of Nairobi
UPE Universal Primary education
USA United States of America
USAID United States Agency for International Development
VCD Video Compact Disc
VCT Voluntary Counseling and Testing centers
VIP Very Important Person
VJ Video Jockey
VOC-TEC Vocational and Technical
VOD Video-on-Demand
VoK Voice of Kenya
WHO World Health Organization
WIPO World Intellectual Property Organization
WSO World Story Organization
YEDF Youth Enterprise Development Fund
YEI Youth Employment Inventory
YFS Youth Friendly Services
YK 92 Youth for KANU ‘92
YKA Young Kavirondo Association
YKA Young Kikuyu Association
YNA Young Nyika Association
YPs Youth Polytechnics
ZZVG Zungu Zungu Vigilante Group

12Youth Research Compendium
Table 1: Population size and growth indicators at a Glance: Kenya, 1948-2009 33
Table 2: Demographic characteristics of the youth population 37
Table 3: Trends in total fertility rate (Iran, 1977-2006) 42
Table 4: Trends in key Indicators of population change since 1948 45
Table 5: Trends in urbanization in Kenya 47
Table 6: Trends in Age specific Fertility rates (births per 1000 population) of youth (15-24)
population since 1975 49
Table 7: Projected ratios of the youth population to various segments of the population 50
Table 8: Estimated population size (‘000) by broad age-groups: Kenya, 1950 - 2050 51
Table 9: Estimated relative population size (Percent) by broad age-groups: Kenya, 1950 - 2050 51
Table 10: Estimated relative population size of the youth [15-24 years] to total population
(percent): Selected developing countries, 1950 - 2050 52
Table 11: Estimated relative population size of the youth [15-24 years] to total population (percent):
Selected developed countries, 1950 - 2050 52
Table 12: Estimated indicators of population growth: Selected developing countries, 1950 - 2050 53
Table 13: Estimated indicators of population growth selected developed countries 1950-2050 53
Table 14: Kenya’s employment creation policies and programmes (1964-2011) 64
Table 15: Distribution of Working Age Population, 1998/99 and 2005/06 66
Table 16: Labour Force Participation Rates, 1998/99 and 2005/2006 (Percent) 67
Table 17: Trends of Employment in Kenya (1986-2008) 69
Table 18: Employment-Population Ratio for Kenya (2000-2008) 69
List of Tables

13Institute of Economic Affairs
Table 19: Unemployment Rates in Kenya, 1978- 2005/06 (Percent) 70
Table 20: Unemployment Rates in Kenya by Age Group and Gender (percent) 71
Table 21: Wage Employment in Formal Sector by Gender, 1995 – 2008 (000s) 72
Table 22: Youth Employment Interventions in other Countries 80
Table 23: Primary to Secondary Transition Rates, 1998-2007 97
Table 24: Secondary School Enrolment by Form, 1999-2003 99
Table 25: Secondary School Enrolment by Form, 2004-2008 99
Table 26: Provincial Primary to Secondary Transition Trends in Transition 101
Table 27: Provincial Gross Secondary Enrolment 101
Table 28: Secondary Gender Parity Index by Province, 2002-2007 102
Table 29: Distribution of TIVET Institutions 104
Table 30: Enrolment by Gender In TIVET Institutions; 2002 – 2008 106
Table 31: Enrolment By Course And Gender in TTIs & ITs by Province, 2007 107
Table 32: Secondary to University Transition Rates, 1999/00-2002/03 109
Table 33: Secondary to University Transition Rates, 2004/05-2008/09 109
Table 34: Total Student Enrolment in Public and Private Universities 2000/01-2007/08 111
Table 35: Public Universities Student Enrolment by Mode of Study in, 2007/2008 112
Table 36: Student Enrolment in Public Universities by Gender 1999/00-2003/04 113
Table 37: Student Enrolment in Public Universities by Gender 2004/05-2007/08 114
Table 38: Actual and Projected Youth Population 1999-2019 120
Table 39: Indicators of Quality of Primary Education 137
Table 40: Actual MoE Expenditure (Recurrent and Development) 2002/03-2005/06 138
Table 41: Number of Classrooms and Pupil classroom ratio 141
Table 42: Number of Public and private Secondary Schools, 2003-2007 141
Table 43: Number of Textbooks in Primary by Subject and Standard, 2003 142
Table 44: Textbook Pupil Ratio by Subject and Standard, 2003 142
Table 45: Number of Teachers and Pupil-Teacher Ratios 146
Table 46: Number of Secondary School Teachers in Service; 2001-2009 147

14Youth Research Compendium
Table 47: Primary Teachers by Training 148
Table 48: Number of Secondary Teachers in Service; 2001-2009 149
Table 49: KCPE Mean Score by Gender and Province, 2003 – 2007 151
Table 50: KCPE Raw Mean Score by Gender and Subject, 2003 –2007 152
Table 51: Proportion of KCSE Candidates by Performance in Selected Subjects, 2003 –2007 154
Table 52: Effectiveness of Kenyan Universities in fostering attributes valued in management literature 156
Table 53: Age Specific Fertility Rates 167
Table 54: Young People ages 10-17 years infected by HIV, 2003-2005 171
Table 55: Trends on HIV Prevalence among women and men between 2003 and 2007 by age 177
Table 56: Some Key Indicators in RH and HIV 179
Table 57: Examples of Crime Control Vigilante Groups 252
Table 58: Examples of Privatized Official Vigilante Groups in Kenya 260
Table 59: Examples of Ethnic Vigilante Groups 264
Table 60: Number of crimes reported to the police stations between 2006 and 2010 by crime category 268
Table 61: Examples of criminal gangs in Kenya 268
Table 62: Primary to Secondary School Transition Trends by Province 270
Table 63: Juvenile and Youth Crime in Kenya (1931-1937) 288
Table 64: Juvenile Correctional Institutions opened 1957-1964 289
Table 65: Youth Delinquency and Crime in 1997 290
Table 66: Crime trends 1997-2001 291
Table 67: A Summary of Crimes Committed by Youth in Nairobi (2001) 292
Table 68: Convicted Prison Population by Age and Sex (2001- 2010) 293
Table 69: Type and Prevalence of Crime 2006-2010 294
Table 70: Crimes Committed according to Age and Gender, 2006-2010 295
Table 71: Gender and Crime Types (2007-2008) 296
Table 72: Number of Crimes Reported to Police by Province, 2007-2010 297
Table 73: Types of Crimes Committed across Geographical Regions 297
Table 74: Formation of National Sports Associations/Federations in Kenya 313

15Institute of Economic Affairs
Table 75: Kenya’s Performance in All- Africa Games (1965-2007) 314
Table 76: Medals won in the Commonwealth Games (1954-2010) 314
Table 77: Kenya’s Medal Tally in Olympic Games (1964 – 2008) 315
Table 78: Government Allocation to Sports during 2009/2010 Financial Year 323
Table 79: Registered Television Channels 345
Table 80: Registered Radio Frequencies 347

16Youth Research Compendium
Figure 1: Trends in Population size since 1948 (population at 1948=100) 34
Figure 2: Age structural transitions: Kenya, 1950 – 2050 34
Figure 3: Age structural transition, 1950 – 2050: Comparing Kenya’s 0-14 age group with developed
and developing countries 35
Figure 4: Age structural transition, 1950 – 2050: Comparing Kenya’s 15-64 age group with developed
and developing countries 36
Figure 5: Age structural transition, 1950 – 2050: Comparing Kenya’s 65+ age group with developed
and developing countries 37
Figure 6: Trends in Kenya’s youth population (15-24) size since 1969 (1969=100) 38
Figure 7: Kenya’s youth population as a percentage of the total population 38
Figure 8: Kenya’s Demographic Transition 39
Figure 9: Trend in percentage of Kenya’s youth population to the potential working population 39
Figure 10: Age structural transition, 1950 – 2050: Comparing Kenya’s 15-24 age group with developed
and developing countries 40
Figure 11: Trends in Kenya’s crude birth and death rates since 1962 44
Figure 12: Age patterns of urban population in Kenya 47
Figure 13: Trends in contribution (percent) of various age groups to the total fertility 48
Figure 14: Formal and Informal Sector Employment in Kenya, 1972-2008 (percent) 68
Figure 15: Trends in Employment and GDP Growth, 1986-2008 (percent) 68
Figure 16 : Youth Unemployment in Kenya by Age Cohorts (1978-2006*) 70
Figure 17: Primary school enrolment trends, 1960-2007 91
List of Figures

17Institute of Economic Affairs
Figure 18: Secondary School Enrolment Trends, 1960-2007 92
Figure 19: TIVET enrolment trends, 1960-2007 92
Figure 20: University enrolment trends 1971/72-2007/08 academic years 93
Figure 21: National Secondary Enrolment Trends, 1999-2007 98
Figure 22: Secondary School Enrolments by Gender, 1999-2007 100
Figure 23: Secondary Gender Parity Index by year, 1999-2007 100
Figure 24: Provincial Secondary School Enrolment Trends 102
Figure 25: Comparative Trends in Secondary Gender Parity Index by Province, 1999 and 2007 103
Figure 26: Enrolments at National Polytechnics 1999-2007 104
Figure 27: Enrolments in Other TIVET Institutions 1999-2007 105
Figure 28: Total enrolments in TTIs and ITs per Province, 2007 108
Figure 29: Secondary-University Transition Rate 1999/2000 -2007/2008 110
Figure 30: Total Student Enrolment in Public and Private Universities 2000/01-2007/08 112
Figure 31: Distribution of Kenyan Public University Student Population by Ethnic Origin 116
Figure 32: Framework for Understanding Education Quality 136
Figure 33: Lower Primary Pupil-Textbook Ratios in Nairobi Schools by Ownership 143
Figure 34: Upper Primary Pupil-Textbook Ratios in Nairobi Schools by Ownership 144
Figure 35: Primary Teacher Population 1999-2007 145
Figure 36: Pupil Teacher Ratio Trends, 1999-2007 146
Figure 37: Primary Teacher Proportions by Training Status 148
Figure 38: Secondary School Teacher Distribution by Training Status 149
Figure 39: KCPE performance Trends by Province, 2003-2007 151
Figure 40: Growth in KCPE Scores by Growth in Class Size 152
Figure 41: Growth in KCPE Scores by Poverty Rate 153
Figure 42: Mathematics Performance Trends in KCSE 153
Figure 43: English Performance Trends in KCSE 154
Figure 44: Kenya HIV Prevalence 1999-2005 171
Figure 45: Percent of those who have began childbearing by exact age 171
18Youth Research Compendium
Figure 46: Age at First Sex among Young People 173
Figure 47: Age at First Sex among Young People in Rural and Urban Areas 173
Figure 48: Child Bearing among Teenagers by Age 174
Figure 49: Child Bearing among Teenagers (15-19) by Region 174
Figure 50: Self Reported Prevalence of Sexually-Transmitted Infections (STI’s) and STI Symptoms by 176
Age and Gender
Figure 51: HIV Prevalence by Region 176
Figure 52: Multiple Sexual partners among men and women 178
Figure 53: Malaria prevalence by region 181
Figure 54: Proportion of Kenyan Adolescents and Youth Reporting Regular Use of Drugs 184
Figure 55: Reasons for Home Delivery among 15-19 year olds 187
Figure 56: Conceptual framework illustrating how the promotion of competencies at the 217
individual-level and system-level changes lead to desired youth development outcomes
Figure 57: Possible paths related to youth and family development 219
Figure 58: Annual crime statistics between 1997 and 2010 251
Figure 59: Police executions by tribe, method, gender and month of execution 257
Figure 60: Path to privatized state violence 258
Figure 61: Relationship between Youth and Crime in Kenya 284
Figure 62: Youth Convicted to Prisons (1971-1976) 288
Figure 63: Trend analysis of four crimes: 1994-2003 290
Figure 64: Crime Trends between 2001 and 2009 291
Figure 65: Crime by gender 2001-2009 294
Figure 66: Factors Influencing Performance in Sports in Kenya 308
Figure 67: Television consumption among 15-35 by TV Channel Preference 344
Figure 68: Radio consumption among 15-35 by Channel Preference 345

19Institute of Economic Affairs
That Kenya has a large and growing youthful population is an indisputable matter. The salience of this demo-graphic feature found empirical confirmation during the National Population and Housing Census held in 2009. With the established fact of a youthful population come a number of certainties and uncertainties in the medium to long term for the country. Because Scenarios building provide a useful methodology for examining and hold-ing conversations during periods of uncertainty, the opportunity opened up for the Institute of Economic Affairs (IEA-Kenya) to undertake its second Scenarios project based on examining the question of a large and growing youthful population.
This Research compendium contains a number of chapters covering various parts of the lives and state of play regarding experience and contributions of youth to education, technology, sports, health and demography, family formation, participation in politics, crime and vigilantism and employment. These eleven chapters reveal insights and create new understanding about the lives of youth based on careful review and subjecting common assump-tions to as strenuous tests as is possible. As you will note in looking further, the consolidated story about the youth in Kenya is neither as simple nor as simple nor as subject to hasty generalization as often encountered. Indeed, it is out of the realization of this complexity that the Institute of Economic Affairs (IEA-Kenya) commenced the scenarios project by examining the lives, perspectives and data about youth around the 11 themes. It is clear that this research journey has yielded particularly insightful lessons.
As a publication that sought to utilize the unvarnished information shorn of any imbalances, the research compen-dium has offered a decidedly comprehensive map of the lives of the country’s largest and distinct population. It is unsurprising that the youth are in some respects a homogenous group as they are also different in other ways. In short, it is insufficient to merely describe young Kenyans through the convenient tag of youth. Detailed examina-tion about how the facets of social, political and economic life of the youth fit together is one of the major goals for the publication and this has been deeply examined in this publication.
Finally, this compendium does not intend to tell the full story of the youth but has presented thorough exposes of features and dynamics of the life of Kenya’s young people. The pastiche that they create has been immensely useful in the completion of the Scenarios on the youth and which we are glad to present as a complementary publication to this compendium. That stated, it is not completely presumptuous to assert that this research compendium has relevance for policy audiences, the youth who are the subjects and other people who are curious to understand facts about a policy area in which opinions are legion. Picking just one of the pertinent conclusions, it is clear that the preponderance of youth in Kenya avails advantages in the form of Demographic dividend that is waiting to be harnessed. Should that opportunity be taken, we would be glad to refer to the Institute of Economic Affairs (IEA-Kenya), the publication and all researchers as having contributed to that subtle understanding. We hope that those who make reference to it find it as useful as the IEA-Kenya did in crafting the Scenarios stories.
Kwame Owino
Chief Executive Officer, IEA
Preface

20Youth Research Compendium
Institute of Economic Affairs (IEA-Kenya) through its Futures Programme hosted peer review meetings between 19th April and 30th April 2010 to evaluate all the papers in this research compendium. We are grateful to the fol-lowing individuals for giving invaluable comments that went to finalizing this work. Mr. David Kimani Kariuki, Ms. Manaan Mumma and Mr. Maina Monyoncho, Ms. Fiona Mati, Mr. Felix Okatch, Ms. Rachel Wariko, Ms. Veronica Nguti, Ms. Lisa Whitely, Ms. Pamela Wesonga, Ms. Rosemary Wanjala, Mr. Peter Wechuli, Mr. Boaz Munga, Dr. X. N. Iraki, Mr. Dominic Isaka, Mr. Kanja Waruru, Mr. Nahum Okwiya, Ms. Phanice Odhiambo, Mr. Darius Isaboke, Ms. Rachel Mbaria, Mr. David Otieno, Ms. Catherine Gitonga, Mr. Fredrick Ouko, Ms. Eunice Keta, Mr. Kimanzi Muthengi, Dr. Khatete Ibrahim, Prof. Grace Bunyi, Mr. David Mbuvi, Dr. Andrew Riechi, Mr. Charles Wafula, Dr. Laban Ayiro, Ms. Naomi Mathenge, Ms. Collete Aloo Obunga, Mr. Dominic Magwaro, Mr. George Kasera, Mr. David Kinyua, Ms. Fransisca Kanini, Ms. Anne Musya, Ms. Rahel Akumu Oyugi, Ms. Patri-cia Kinoti Ms. Helgar K. Mutua, Ms. Felicia Solomon, Mr. Tom Wolf, Mr. Patrick Mutwiri, Mr. Jacob Aketch, Mr. Oluniyi Carew, Mr. Paul Kipchumba, Mr. George Misati, Mr. Namenya Daniel, Ms. Caroline Kisato, Ms. Lainie Reisman, Mr. Wallace Kantai, Mr. Charles Matathia, Mr. Mikewa Ogada, Dr. Christine Wasanga, Ms. Anne Musya, Ms. Njagey Ann Rita, Ms. Hulda Ouma, Mr. Arthur Wandera, Mr. Emukule Ekirapa, Mr. Eric Muriithi, Pastor Gowi Odera, Ms. Pricilla Gitonga, Mr. Isiah Oyugi, Ms. May Wanjau, Ms. Anjella Nancie, Ms. Jennifer Anyetei, Ms. Jennifer Onyango, Mr. Change Otieno, Ms. Aimee Ongeso, Ms. Roselyn Kathambi, Ms. Lillian Auma, Ms. Millie Dok, Mr. Tim Rimbui, Ms. Muthoni Ndonga, Ms. Rachel Gichinga, Ms. Sandra Chege, Ms. Cathleen Muthoni, Mr. Gerry Gitonga, Dr. Adanje Mwisukha, Mr. Simon Munayi, Prof. Jacob S. Nteere, Mr. Mutinda Kisio, Dr. Mwangi Peter Wanderi, Mr. Wamunyu Wamburu, Dr. Jane Kamau, Ms. Carolyne Achieng, Mr. Walter Machio, Ms. Joy Mugambi, Mr. Kevin Kogema and Mr. Kerio Lorot, Mr. David Kimani Kariuki, Mr. Benson Kimithi, Ms. Caroline Njuki, Mr. Victor Kotonya and Mr. Chrispine Oduor.
The Futures programme is also indebted to Ms. Margaret Chemengich (former CEO of IEA), Mr. Kwame Owino, Ms. Miriam W. O. Omolo, Mr. John Mutua and Mr. Abraham Rugo for chairing various peer review sessions. We also appreciate Ms. Nancy Muigei for giving logistical support during the peer review sessions.
The trustees of the Youth Scenarios Project include: John Githongo, Betty Maina, Maina Kiai, Muthoni Wanyeki, Kanja Waruru, XN Iraki, Dr. Mshai Mwangola, Prof. Peter Lewa, Arthur Muliro and Robert Shaw.
The IEA is indebted to Friedrich Ebert Stiftung for funding the writing of 3 papers namely, The Demographic Divi-dend: a Gift or a Curse?, Health: Are Young People Really Chillin? and Youth and Politics: Generational Missions.
Acknowledgements

21Institute of Economic Affairs
Dr. Collins Omondi Opiyo holds a PhD and an A.M degree in Demography from Population Studies Center in University of Pennsylvania, an MPhil in Population Studies and an MA in Population Studies both from the United Nations Regional Institute for Population Studies (UN-RIPS), University of Ghana. He also has a Bachelor of Sci-ence from Kenyatta University, Kenya. He is currently the Chief Technical Adviser to the Namibia 2011 Census and the Director for Population and Social Statistics, Kenya National Bureau of Statistics.
Dr. Alfred Titus Agwanda Otieno holds a PhD in Population studies. He is currently a senior lecturer at the Popu-lation Studies and Research Institute, University of Nairobi. He has published two book chapters and recently co-authored one book on Urban Integration in Africa: a Socio Demographic Survey of Nairobi. He has also pub-lished and co-authored several papers in peer reviewed international journals such as Social Science and Medicine, Journal of Biosocial Sciences, Demography India and African Population Studies. He trains, monitors and evalu-ates population and health programs as well as developing strategic and implementation plans for organizations.
Dr. Jacob Omolo holds a BA (Economics), MA (Economics) from Kenyatta University, MA (Economic Policy Management) from Makerere University, Uganda and PhD (Labour Economics) from Kenyatta University. His areas of research interest include youth employment challenge, poverty-targeted employment creation strategies, wage determination, minimum wage policy, ripple effects of minimum wages and productivity management.
Dan K’Oliech is a Senior Research Officer at the Kenya Institute of Administration (KIA), Nairobi and has worked in the area of social research and policy analysis specializing in education research for the past eight years. He holds a Bachelors Degree in Education Science of Egerton University and is completing his Masters Degree in Eco-nomics of Education from Kenyatta University.
Rosemarie Muganda-Onyando is a social anthropologist who has conducted extensive research and advocacy in adolescent/youth and women’s reproductive health and rights. She is an avid advocate for the rights of young people and was instrumental in the development of the Adolescent Reproductive Health and Development Policy in Kenya. Rosemarie is currently pursuing a Masters in Health Policy from Kenyatta University, School of Pure and Applied Sciences. She has an MA (Development Studies) and a Graduate Diploma (Women Studies) both from Flinders University, Adelaide, Australia. Rosemarie also has a BA (Anthropology) from the Institute of African Studies, University of Nairobi.
Mary Mbulwa Mnjama holds an MA in Counseling Psychology from United States International University, Nairobi and a BA in Education from Kenyatta University. She has co-authored one book on HIV and AIDS Cur-riculum for Theological Institutions in East and Southern Africa. She is a part-time lecturer at Daystar University in the MA programme - Counseling Psychology and a facilitator for youth group therapies.
Edith Kaumbuthu is a counseling psychologist and an educationist. She has an MA in Counseling Psychology from United States International University, Nairobi and a BA in Education from Kenyatta University. She is a trainer and a counselor specializing on young people and trauma.
Profile of Contributors

22Youth Research Compendium
Dr. Mshai Mwangola is a performance scholar, actor, director and storyteller. She holds a doctorate in Performance Studies from Northwestern University, USA; a Masters of Creative Arts from the University of Melbourne, Austra-lia; and a Bachelor of Education from Kenyatta University, Kenya. Her doctoral dissertation on story-telling is an auto-ethnography of the Uhuru Generation. Her pedagogy, research, civic and creative work engages performance as both the process and product of meaning-making. Mwangola is a trustee of the IEA Youth Scenarios project.
Katindi Sivi-Njonjo is the Futures Programme Officer at the Institute of Economic Affairs. She holds an MSc, Or-ganizational Development and a BA, International Relations from United States International University-Nairobi. She also has training in Sociology (University of Nairobi), Scenarios building (Said Business School, Oxford Uni-versity) and Gender Budgeting (TGNP and GIZ). Katindi has researched and written on youth facts, youth demo-graphics, vigilantism and constituency strategic planning in Kenya.
John Mugo holds a PhD from the University of Hanover, Germany (Special Needs Education). He is currently the country coordinator of Uwezo Kenya, an initiative that assesses learning competences of children aged 6-16 years in Kenya. His areas of research interest revolve around quality of education, children and youth with behavioural disorders, youth and crime, and education of marginalized groups: children with disabilities and children of pas-toralist, nomadic and minority communities.
Dr. Elijah Gitonga Rintaugu is a Senior Lecturer, Department of Physical Education & Sports (University of Nai-robi) specializing in Foundations of sports, Social-Psychology of sports, Research methods in Human Movement, and Heath Education. He has a B.Ed, M.Ed and PhD in Physical Education and Sports from Kenyatta University. He has researched on factors affecting soccer in Africa, gender equity in sports and the contribution of sports in to Kenya’s GDP.
Dr. Andanje Mwisukha is a Lecturer and Chairman of the Department of Recreation Management & Exercise Sci-ence in Kenyatta University. He holds a B.Ed, M.Ed and PhD in Physical Education from Kenyatta University. His areas of specialization include Sports Management and Pedagogy administration of sports, leisure and recreation services in Kenya. He has published in refereed Journals and presented numerous academic papers in local and international conferences and workshops.
Mr. Simon Munayi holds a B.Ed (University of Nairobi) and M.Ed (Kenyatta University) in Physical Education. His areas of research include the intellectual disabled education, sport administration and sport tourism.
Dr. Donald Otoyo Ondieki, is a Lecturer at Kenyatta University, Department of Music and Dance, and part-time Lecturer at the Kenya Conservatoire of Music. He is a performing contemporary pianist, saxophonist and clari-netist; studio and radio producer; radio presenter of jazz programmes; adjudicator at the Kenya National Music Festivals; researcher and music educationist. He holds a Bachelor of Education (Arts), Master of Music (Perfor-mance) and PhD in Music Education and Performance from Kenyatta University.

23Institute of Economic Affairs

24Youth Research Compendium
OverviewGiven the central role young people played in the post election violence in 2007, the Institute of Economic Affairs (IEA-Kenya) sought to understand the state of youth in Kenya and explore the political, economic, social and environmental implications of a growing youth population now and in the future. In November 2010, IEA-Kenya published and launched the Youth Fact Book: Infinite Possibility or Definite Disaster? which generated consider-able debate on the age, gender, regional and socio-economic dynamics of Kenya’s youth. In this second publica-tion, the IEA-Kenya documents past trends which have contributed to the present state of affairs in youth demo-graphics, employment, education, health, family, participation, vigilantism, crime, entertainment and sports. The work also identifies driving forces that have influenced these trends while analyzing those that are likely to shape the future. This is with the aim of understanding possible opportunities and risks that lie ahead in a country that is experiencing a demographic shift from a child-rich to a youth-rich population structure. A review of relevant policies to appreciate existing opportunities and gaps in order to design possible interventions is also incorporated in the researches.
Study MethodologyThe development of this compendium followed an integrated and participatory approach, involving analysis of secondary information, and interactive peer review sessions with a team of experts constituted by IEA-Kenya. The studies relied on secondary information collected through review of relevant literature, government policy docu-ments and other publications and reports produced by international agencies. Both qualitative and quantitative approaches were used in analyzing and interpreting the data.
Limitations of the StudyThe main challenge for most researchers was unavailability of relevant data. Even in instances where data was obtained, it was not always available in forms sought by the studies. Considerable amount of time was, therefore, spent on data re-organization to conform to the study areas. Data also varied depending on the source. Taking cognisance of the above limitations, every effort was made by the researchers to select the most credible sources of data.
Introduction and Overview1Katindi Sivi Njonjo

25Institute of Economic Affairs
Defining YouthYouth form the central focus of this Compendium. However, young people are not a homogenous group. Differ-ences exist not just in terms of opportunities and societal outcomes, but also across geographical regions, gender traits, class, urban/rural status, and disability status. The term ‘youth’ therefore warrants an elaborate definition to contextualize the discussions carried throughout this publication.
While youth connotes a transition phase from childhood into adulthood, it presupposes a change from being de-pendent on others to being independent when people have to negotiate a complex interplay of both personal and socio-economic changes in order to take effective control of their own lives and assume social commitments. It is usually marked by certain rites of passage or other defining events such as gaining employment or establishing a family. Because this shift does not occur at the same time, there is no universal consensus on a clear-cut indicator when this happens thus making the concept problematic and ambivalent to define.
‘Youth’ is mostly determined by chronological age to provide some degree of objectivity though these age catego-ries also differ across space and time. The UN General Assembly for example defines youth as individuals aged between 15 and 24 while World Health Organization (WHO) defines young people as those aged between 10 and 19. The Commonwealth defines youth as the age bracket between 15 and 29 years, while the African Union (AU) defines youth as those aged between 15 and 35. Kenya’s constitution defines youth as all individuals in the republic who have attained the age of 18 years but have not attained the age of 35.
Similarly, the working definitions of youth in this research compendium vary but they have been contextualized to rationalize the age bracket used. Based on the population transitions of age cohorts from one age group to another, the ‘Demographic Dividend: a Gift or a Curse?’ paper has confined its description to the UN’s definition of youth being between 15 and 24 so that global comparisons are made possible. Whilst adhering to the constitutional defi-nition of youth in Kenya, various papers introduce caveats to the age brackets. The ‘Unemployment Casualties’ paper acknowledges the International Labour Organization’s (ILO) configuration of the working age population as starting from 15 years old hence the inclusion of 15 to 17 year olds. The ‘Education: Adequate and Equitable Provision? and the ‘Education: An Obsession with Increasing Access at the Expense of Quality’ papers focus on secondary, Technical, Industrial, Vocational and Entrepreneurship Training (TIVET) and university. However, the studies also include the primary education cycle for purposes of understanding underlying trends in these higher levels of education. Since the critical challenges facing youth are those related to sexuality and reproduction, the ‘Health: Are Young People Really ‘Chillin’? paper incorporates adolescents (i.e. the 10-19 year olds) and older women aged between 20 and 49 who are in their reproductive age. The ‘Family Ties or Family Lies’ captures younger groups of youth as it describes teenage pregnancies, teenage and child headed families as well as risky sexual behaviour of minors based on the fact that by age 19, 36% of girls in Kenya are already mothers, by age 15, 17% of young people are already sexually active and (according to 2009 data), 45% of 7-19 year olds who were sexually active had multiple sexual partners. ‘Crime: The Young and the Restless’ paper incorporates juvenile crime in its analysis thus incorporating 12 year olds. The paper also acknowledges the fact that in the young adult stage, a young person faces a double search for identity and independence hence extra vulnerability. Although most crimes in Kenya are committed by 16 to 25 year olds, the author caps the peak crime age limit at 29. The ‘Sports: On the Right Track’ paper acknowledges that by the age of 30, various anatomical and physiological variables like flexibility, agility and muscular endurance start declining thereby signifying the onset of the ageing process. For this reason, the sports definition of youth is capped at 29 years old. ‘Entertainment: The Unbwogable Industry’, defines youth from two perspectives. Those aged 15 – 17 years old who include high school students that are largely a target of various schools, church and religious organizations entertainment functions and those aged 18 – 35 years old targeted by various entertainment spots that restrict those under 18 years from accessing their venues. The ‘Youth and Politics: Generational Missions’ paper defines youth from the perspective of genera-tional missions which span several decades. As a result, youth are seen not so much as an age category but from a geo-political and socio-economic angle.

26Youth Research Compendium
Structure of the ReportChapter Two, titled ‘The Demographic Dividend: a Gift or a Curse?’ reviews population trends since independence with special reference to population growth, age structure, distribution, and its implications for socio-economic development. This is in light of the widespread reductions in fertility and mortality rates that have resulted in changes in the population growth rates and age structure including a shift to a large youthful population often referred to as a ‘youth bulge’ (which is yet to peak in Sub-Saharan Africa). This type of age structure is observed to have certain consequences but the provision of adequate education and employment opportunities has helped circumvent some of the problems in Southeast Asia. The paper asserts that youth bulges, as seen from the demo-graphic, socio-economic and even political viewpoints, will provide the main link to population and development issues and concerns.
Chapter Three, titled ‘The Unemployment Casualties’, asserts that the employment challenge has been growing over time with the youth and women being the main casualties of unemployment, underemployment or in the swelling ranks of the working poor. Though a number of policy interventions have been formulated and variously implemented since independence in 1963, to address the growing employment problem in Kenya, creation of ad-equate, productive and sustainable employment opportunities continue to be the greatest challenge. Unfortunately, the longer people stay out of work, the more their ‘employability’ deteriorates, making it progressively harder for them to gain employment. This is especially worrying for the youth who may get trapped into a lifetime of weak attachment to the labour market alternating between low paid insecure work and open unemployment.
Chapter Four, titled ‘Education: Adequate and Equitable Provision?’ examines existing access to education and equity issues in relation to gender and regional disparities. On the public side, it is clear that the introduction of Structural Adjustment Programmes (SAPs) in the mid 1980s negatively impacted the government’s ability to ad-equately and equitably provide education at all levels. On the private side, the introduction of cost-sharing had an adverse impact on access to primary and secondary school education. Evidence from post-independence enrolment trends in primary education show that the impact of political pronouncements that result into momentary increase in enrolments, often wane when the interventions are not sustained. This study also identifies some key areas in which policy gaps exist and continue to impede equitable provision and access to education among Kenya’s youth. The study identifies a number of measures to achieve the twin goals of equity and increased access to education by the youth.
Chapter Five titled ‘Education: An Obsession with Increasing Access at the Expense of Quality’ analyzes education in Kenya over the last decade and the implications of these trends on the quality of education provided at different levels. The study utilizes a context-input-process-outcome framework to analyze the quality of education offered at basic, tertiary and university levels. Findings indicate that the very successes registered in increased access to education in Kenya over the last decade have also become the source of quality challenges that bedevil the sector.
Chapter Six, titled ‘Health: Are Young People Really ‘Chillin’? highlights policy decisions made during the post independence period and their implications on the status of young people’s health. It also covers the current trends of youth health which are categorized into sexuality related challenges and non-communicable diseases. Individual and societal factors, institutional and structural factors, policy and legal factors, as well as economic and gender dimensions are highlighted as the main factors driving youth health. The paper is limited by a seeming bias on reproductive health and HIV and AIDS, due to the fact that the critical challenges facing youth are those related to sexuality and reproduction with HIV and AIDS occupying a central position. Reproductive health and HIV and AIDS data is also easily available and better disaggregated by age, gender and region. The general lack of disag-gregated data limits the analysis of other issues especially on the new and emerging lifestyle - related diseases. The paper concludes by highlighting some of the areas where more attention needs to be paid in addressing the health of young people in Kenya and its implication for the socio-economic development of the country.
Chapter Seven titled ‘Family Ties or Family Lies’ examines family development in Kenya and its impact on young people. The paper argues that family formation and structure has an impact on young people’s development which in turn affects future family formation and national development. The paper traces the historical and current developments of Kenyan families and examines factors that have contributed to certain patterns and trends. Cita-

27Institute of Economic Affairs
tion is made of regional and rural- urban disparities in family formation and structure. A review of national and universal policies and frameworks in regard to children and youth development has been attempted.
From the stereotypical outlook of youth as ‘leaders’ of tomorrow’, Chapter Eight, titled ‘Youth and Politics: Gen-erational Missions’ reiterates the challenge of understanding youth as significant players in politics. By tracing the evolution of current discourses, the paper shows the emergence of an aggressive youth that rejected prevailing perceptions and demanded a re-configuring of the social roles and responsibilities. This chapter, therefore, exam-ines their role in the national political life of the Kenyan nation through the ceremonial passing or non-passing of political responsibility from one generation to another. Youth is posited as a social category, a critical life-stage in which a generation is able to imagine itself as a distinct entity within society, identify a mission that meets the de-fining challenge of the time for which it is politically responsible, articulate a vision to work towards, and identify a strategy to achieve it. How each generation is able to do that determines its success.
Chapter Nine, titled ‘Vigilante Violence: Kenya’s Unholy Alliances’ details the numerous dimensions vigilantism subsumes as it takes on a spectrum of different forms, methods, motivations and causes beyond the narrow out-look of vigilantism as ‘taking the law into one’s own hands’. Through a multilevel analysis the behavioural and the subjective realities of these groups to abandon their original, usually legitimate course, and metamorphosize from one form of collective behavior to another is exposed. Whereas some attempt to present vigilantism as a form of ‘community policing’, the paper points out that this may not be an appropriate response to the problems of inse-curity because there lacks a distinction between vigilantism as a form of social control and vigilantism as merely deviant behavior. The study also affirms that vigilantism is not only confined to urban slums but is a countrywide problem that is embedded in our political, economic and social structures.
Chapter Ten, titled ‘Crime: The Young and the Restless’ draws from various theories and proposes a conceptual framework founded on human development, power struggle, social and economic injustice, the burden of soci-etal structure, differential learning and subculture to analyze crime by youth in Kenya. Historical trends reveal remarkable change in both form and magnitude. The traditional African setting presents extremely socialized models of crime prevention and control, based on the group identity, morality and ethics. However, this order is disrupted by the Western culture, which rapidly turns the African youth from an innocent defender of culture and morals to a villain and delinquent, incapable of adherence to the colonial rules. The proliferation of institutions of containment for youth experienced in the 1950s and into early 1960s is evident to this fact and points out to the urbanization of injustice at the time. This status quo is transferred to independent Kenya where more correctional institutions are founded in the 1960s and 1970s resulting to increased incarceration of youth. Growing unemploy-ment and shrinking opportunities exacerbate the crime problem thus crime by youth maintains a steady upward trend. Rising urban and rural poverty, high levels of unemployment, changing family patterns, and deteriorating environmental and health conditions are among the initial influences of crime. Drugs and substance abuse among youth has been linked to delinquency and crime, while ineffective justice system has been blamed for increasing levels of repeat offenders. Besides, the recent emergence of information societies and cyberspace inventions has been found to introduce highly unpredictable behaviour, rendering efforts to prevent crime almost helpless.
Chapter Eleven, titled ‘Sports: On the Right Track’ evaluates sports in Kenya from pre-colonial, colonial and post colonial periods with a particular emphasis on All Africa Games, Commonwealth Games and the Olympic Games. The various policies for youth sports in Kenya are weighted against other policies in Nigeria, England and USA to demonstrate mechanisms instituted elsewhere that makes youth participation in sports more efficient. The emerg-ing trends of youth in sports and recreation in Kenya are highlighted and various fundamental issues are raised with a view to strengthen youth participation in sports and recreation in Kenya.
Chapter Twelve, titled ‘Entertainment: The Unbwogable Industry’ presents entertainment in Kenya both as a cul-ture and as an economically viable industry for young people who are the major drivers, players and consumers of the industry. The paper outlines the current status of some of the entertainment sectors such as television, radio, music, recording, fashion, dance, internet, theatre and film and the narrowing of boundaries, through mergers, of such sectors as publishing, entertainment and telecommunications industries that were once considered separate. It analyzes the influence this sector has on young people’s popular culture, examines future opportunities such as

28Youth Research Compendium
the creation of a vibrant entertainment industry which has a capacity to enhance employment among the youth and the potential of contributing a large share of the country’s gross domestic product (GDP). The fast growth of the industry was noted alongside the resulting haphazard operations within it that have rendered most of its con-tribution to national revenue not being captured by government through taxes. The need for developing adequate policies that will enable the government capture the contribution of this industry and deepen recognition of its importance were highlighted.

29Institute of Economic Affairs

30Youth Research Compendium
Dr. Collins O. Opiyo and Dr. Alfred T. Agwanda,
The Demographic Dividend: A Gift or a Curse?2AbstractThe main objective of this paper was to review the population trends since independence with special reference to population growth, age structure, distribution, and its implications for socio-economic development. This is in light of the widespread reductions in fertility and mortality rates in Kenya and other developing countries, which have resulted in changes in the population growth rates and age structure. The growing interest in age structure and as-sociated changes stems from the recognition that people’s social and economic behaviour and needs vary at different stages of the life cycle, with varied impacts. Kenya’s population has continued to grow exponentially, currently in-creasing by nearly over 1 million people annually. The rate of growth is attributed to declining fertility and rapidly falling death rates. The rapid changes in population parameters have also had significant implications on the youth population. When compared to the total population though, the proportion of the youth population aged 15-24 has remained relatively steady since the late 1960s and forms the majority of the potential working population. Large youthful populations, often referred to as “youth bulges”, have been observed to have certain consequences. First, they are just at the beginning of childbearing and are mainly responsible for population momentum. Thus, the reproductive decisions that young people make determine future birth rates. The growing youth demographic is also manifested in the demand for employment. With the slow pace of job creation, this presents enormous chal-lenges. Further, majority of urban dwellers are in the age group 25-29, typically fueled by rural-urban migration. Migration patterns put further strain on urban areas and labor opportunities with more young people migrating in search of urban employment due to declining rural agricultural productivity. The urban crowding may also have links between youth bulges and violent crimes. Such a large population adds considerable burden on the country’s budget for provision of health, education and other social services. Notwithstanding, the developing countries Southeast Asia have, to some extent, circumvented some of the problems associated with large youth populations by providing adequate education and employment opportunities because youth bulges (which are yet to peak in Sub-Saharan Africa), as seen from the demographic, socio-economic and even political viewpoints, will provide the main link to population and development issues and concerns.

31Institute of Economic Affairs
Age Structure for Population and DevelopmentThe widespread decline in fertility, coupled with reductions in mortality in most developing countries, has resulted in changes in the age structure and population growth rates that have far-reaching consequences for sectors such as health, education, labour markets, and social protection. One of the major consequences of changes in the age structure is the growth of youth population. Most developing countries have witnessed unprecedented large youthful populations often referred to as ‘youth bulges1’ (when proportions and numbers of young adults peak in a society prior to an eminent decline). Currently, there are over 1 billion young people (aged 15-24) in the world today, which amounts to some 18% of the world’s total population of which 84 % live in developing countries.
The Importance of Age Structure Age structural changes have long been of great interest to mathematical demographers. More recently, however, interest in age structure has heightened among social scientists and economists. This stems from the recognition that people’s social and economic behaviour and needs vary at different stages of life and, therefore, changes in a country’s age structure can have a significant impact on its socio-economic development (Bloom 2003).
The importance of age structure of the population (the way in which population is distributed across different age groups at any given point in time) is easily understood via the emerging concept of Age-Structural Transitions (ASTs). Simply put, an AST is the passage of a birth cohort from one age group to the next one (usually in 5-year age groups e.g. 0-4, 5-9, 10-14, etc) or, in more common parlance, the passage of a birth cohort from one life cycle phase to another , e.g. from childhood to youth. This otherwise normal and natural phenomenon has become increasingly important in the 21st Century as the importance of compositional changes such as ASTs increase as factors of demographic change, relative to natural increase (the balance between births and deaths) [Pool and Wong, 2006].
The AST model comprises four phases. The first, being the “child-rich” phase, is characterised by accelerated increase in the number of children following the onset of (child) mortality decline. The second phase is character-ised by “expansion of young adult population” due to the continued decline of mortality and the onset of fertil-ity decline. This phase could start 15-20 years later than the “child-rich” phase. The third phase – expansion of middle-aged population – starts when the cohorts enlarged by mortality decline and increases in the number of birth reach middle ages. It could take 20-30 years after onset of the “young adult” phase or 4-5 decades to pro-duce sufficient numbers of middle-aged population. The final phase, expansion of the old age population, sets in after birth rates have dropped to very low levels. Needless to say, these phases mirror the well-known stages of the classical demographic transition theory, although the last phase and part of the third phase clearly lie outside of it (Adioetomo et al., 2006).
These fluctuations produce rapid shifts in the nature and magnitude of demands and needs of particular age groups, patterns that are relevant for public policy domains and market sector considerations. Clearly, the peak demands produced by large cohorts are followed – often in rapid successions – by reduced demands as smaller cohorts reach the same life cycle stage. At this juncture, however, it is worth noting that the AST waves (“peaks” and “troughs”) can be highly irregular (disordered cohort effects) across many nations – or even regions of one country – making formulation of generic models for planning and policy difficult (Adioetomo et al., 2006). Also, as a word of caution, it is observed that the AIDS epidemic can significantly alter their transitional path, and make them deviate markedly from past trends (Pool and Wong, 2006)2.
Regular tracking of population dynamics is, therefore, critical so as to anticipate the implications of the contem-porary population dynamics on prospects for population growth and socio-economic development. In spite of this reality (and the benefit of hindsight deriving from countries at advanced stages of demographic or age transition) ageing is still discussed as a ‘distant’ phenomenon among many Sub-Saharan African and other developing na-
1 Typically defined as the ratio of youth aged 15 to 24 to the entire adult population aged 15 and over2 Overall HIV prevalence among persons aged 15-49 declined slightly from 7 percent in 2003 to 6 percent in 2009 (KNBS and
ICF Macro, 2010). Huge differentials in infection levels exist by age and sex. Prevalence increases more than four (4) fold between age 15-19 and 25-44 years, while about 8.0% of women are infected, compared to 4.3% men.

32Youth Research Compendium
tions, even as the demographic window of opportunity threatens to close - and rapidly so. Age structural transi-tions are, therefore, an urgent and important issue for all developing (and even most developed) nations, and help to clarify the complex statistical relationship between population and development (Adioetomo et al., 2006).
Demographic Definition of youthIn the Kenyan constitution, youth is defined as individuals in the republic who have attained the age of 18 years but have not attained the age of 35 years (Republic of Kenya, 2010). This varies from the United Nations defini-tion which considers ‘youth’, as those persons between the ages of 15 and 24 years, without prejudice to other defi-nitions by Member States. This definition was made during preparations for the International youth Year (1985), and endorsed by the General Assembly (A/36/215 and resolution 36/28, 1981). This age cohort (15-24) forms the demographic definition of youth worldwide and this is the definition that will be used in this paper.
…The youth bulge is just a population wave – a problem of significant magnitude but temporary character – producing a peak pressure on needs and services that are appropriate to these stages. Such demographic changes present a ‘window of opportunity’ that could be exploited at the turn of the 21st Century. However, interventions must of necessity take cognisance of the velocity with which the wave moves from one life cycle stage to another!
Historical Analysis of DemographicsPolicies and ProgramsPopulation policies and programs in Kenya since independence can be described along four major phases: 1965-1978 period; 1979-1994 period, 1994- 2003 period and post 2003. These phases also duly coincide with major landmarks in demographic history of the country.
1965-1978 PeriodIn phase one, the concern was on high population growth and the official recognition of family planning pro-gramme. Although no major direct policy framework was developed, population issues were articulated in the subsequent 5-year development plans from 1966 to 1978. The thrust of Kenya’s population policy was based on the recommendations of the Population Council of New York Advisory Mission in 1965 and first articulated in the historic document, African Socialism and its application to Kenya, published in 1965 which stated that:
“the present high rate of population growth makes extensive and intensive provision of social services more expensive, the unemployment more intractable and saving for development harder than need be.” It further on recommended that “immediate steps need to be taken toward family planning education” (Republic of Kenya, 1965: 52).
One of the first policy responses was the establishment of the first national family planning programme in 1967 under the auspices of the Ministry of Health. This programme was to be an integral part of Kenya’s efforts to-wards social and economic development and was linked with maternal and child health programme that aimed at reducing the birth rate on a wholly voluntary basis with full respect for the wishes, religious beliefs and customs of individual parents. The programme was meant to safeguard the health of the mothers and children and linked to the beliefs and values of the people. The subsequent driving goals for the national development programs in the period 1966- 1978 were anchored on reducing the high population growth while the 1974-78 Development Plan recognized high unemployment, diminishing level of domestic savings and pressure on basic social services. Although reduction of birth rate was considered as a failure, the programme on the reduction of infant and child-hood mortality was considered successful by reducing the high infant mortality rates.
1979-1994 PeriodIn second phase, the government, in realizing the adverse socio-economic consequences of the rapid population growth, formulated integrated population policy guidelines in 1984, which accorded fertility reduction utmost priority. The family planning effort was enhanced and integrated in District Focus for Rural Development Strat-egy. The 1979 to 1983 Kenya National Development Plan emphasized the importance of creating attitudes that

33Institute of Economic Affairs
favour reduction in the average size of families through information, education and communication (IEC) activi-ties, strengthening service delivery points, expanding services to rural areas and the recruitment and training of rural family health field educators (Ajayi and Kekovole, 1998). The resultant effect was that in the period, family planning methods were promoted on the mass media particularly the radio which was owned by nearly half of the households according to household surveys at that time and at clinics. The major goal in this phase was expand-ing access to family planning particularly infrastructure and providing information and education. It focused on targeting of opinion leaders and President Moi also acted as a policy champion.
The major landmark of population policy and programme implementation therefore began by the creation of National Council for Population and Development (NCPD) in 1982 and holding of the leaders’ conferences 1984 and 1989 respectively. It is in this period that donor funding increased leading to the establishment of more service-delivery points and more public education. Available evidence shows that by the mid-1980s, more than 100 organizations in Nairobi alone were engaged in population activities (Krystall and Schneller, 1987). Between 1986 and 1989, planners became more interested on the economic impacts of population (Kelly and Nobbe 1990) and the Sessional Paper No 1 of 1986, continued to acknowledge the adverse effects of rapid population growth on economic development (Republic of Kenya, 1986). Similarly the Sixth 5-year Development Plan 1989-1993 elevated population size and growth as one of its key themes (Kelly and Nobbe, 1990). It particularly stressed on the need for integrated perspective toward population and development and planning.
The 1994-2003 Period The policy focus in this period was mainly aimed at implementing the International Conference on Population and Development (ICPD) held in Cairo. However, the 1997-2001 Kenya National Development Plan still emphasized the need to accelerate the rate of fertility decline through the expansion of child survival programs, use of modern contraception and increasing educational opportunities for girls.
At the ICPD conference, the international community embraced a new and broad concept of reproductive health and rights, including family planning and sexual health. It called for integrating family planning and maternal and child health care within a wider set of services including the control of HIV and sexually transmitted infections (STIs). Expanding access to services and meeting clients’ expressed needs and wishes were seen as essential to re-ducing unintended pregnancies, improving maternal health and curbing the HIV/AIDS pandemic (UNFPA, 2004).
The events and action plans at the ICPD resulted in a paradigm shift within the policy environment. First, the Kenya government through the Ministry of Health developed the National Reproductive Health Strategy of the 1997-2010 and its implementation plan for 1997-2003 which embraced family planning as one of the compo-nents. The strategy focused on reducing the level of unmet need for contraception and the program was reoriented to improve service quality; meet clients’ needs and desires and paying greater attention to reproductive rights in laws and policies. These expanded mandates were further spelt out in a comprehensive “Family Planning Policy Guidelines and Standards for Service Providers” revised in 1997 (MoH, 1997) from the previous edition issued in 1991. On the other hand NCPD published the national IEC strategy in 1996 to focus on the less educated women, but funding support dwindled in period 2000.
Secondly, Kenya government launched the Sessional Paper No. 1 of 2000 on the National Population Policy for Sustainable Development (NPSSD). The policy document acknowledged the continued unmet need for family planning, the provision of the quality services and the continued rural – urban differentials in fertility and mortal-ity outcomes and knowledge and use of contraceptives.
Thirdly, in 2003, Adolescent Reproductive Health and Development (ARH&D) Policy formulated jointly by the Ministry of Health and the Ministry of Planning and National Development was launched and its implementation plan launched in 2005. The ARH&D Policy defines the structures and key target areas for ensuring that adolescent health concerns are mainstreamed in all planning activities and advocates for its implementation through a multi-sectoral, interdisciplinary and multidimensional approach to ensure that adolescent health concerns are integrated in all activities. Furthermore, the policy responds to concerns of adolescents raised in the National Population Policy for Sustainable Development (NPPSD) of 2000, the National Reproductive Health Strategy (1997-2010),

34Youth Research Compendium
the Children’s Act (2001) and other national and international declarations and conventions on the health and development of adolescents and youth. ARH&D is grounded in the understanding that the relationship between a nation’s development and the health of its adolescents and youth is of paramount concern.
2003 to present Following the results of the 2003 Kenya Demographic and Health Survey (KDHS) and the Kenya Service Provi-sion Assessment Survey (KSPA) 2004, the Kenya Government in 2008 for the first time produced a comprehensive policy on reproductive health. The renewed calls for interventions to reduce unmet need for family planning, unplanned births and regional and socio-economic disparities on contraceptive use (Ministry of Health, 2008). However, the First Medium Term Plan (2008-2012) of the Kenya Vision 2030 (Republic of Kenya, 2008) has not made any provision for family planning programmes despite being hinged on poverty reduction and elimination of social inequalities. The broad development strategy may only influence the use of family planning indirectly through other measures such as increased schooling, reduction in childhood mortality and maternal mortality.
Population TrendsPopulation Size and GrowthTable 1 shows some of the indicators of population size and growth. According to the most recent census, Kenya’s population was 28.7 million in 1999 but is recorded as 39 million (Population Reference Bureau, 2010). Kenyan population growth rate rose steadily from about 2.5 percent per annum in 1948 to around 3.8 percent per annum in the 1980s – a pace described as one of the fastest ever recorded in history. Kenya’s population has continued to grow exponentially (see Figure 1) and by 2009, the population size was slightly over seven fold the population in 1948 and over four fold since 1962. While the population of 1948 doubled around 1975, the current population that increases by nearly over 1 million people annually is expected to double by the year 2034. The United Nation projects that Kenya’s population will reach 46 million by 2015, 57 million by 2025, and 85 million by 2050 (UN 2007) [see also Table 8]
Table 1: Population size and growth indicators at a Glance: Kenya, 1948-2009
Census Year
1948 1962 1969 1979 1989 1999 2009***Population (millions)
5.4 8.6 10.9 15.3 21.4 28.7 39.1
Annual growth rate (Percent per annum) 2.5 3.0 3.3 3.8 3.3 2.9 2.7Doubling times (Years)
27.7 23.1 21.0 18.2 21.0 23.9 25.7
Year of doubling time 1975 1985 1990 1997 2010 2022 2034Population size (at doubling times)
10.8 17.2 21.8 30.6 42.8 57.4 78.2
Absolute increase per annum (‘000) 135 258 360 581 792 850 1,017Size relative to 1948 (1948=100) 100 159.3 201.9 283.3 396.3 531.5 724.1Size relative to 1962 (1962=100) - 100 126.7 177.9 248.8 333.7 454.7
Source: Compiled from the Kenya Population Census Reports, 1948, 1962, 1969, 1979, 1989 and 1999 *** Based on projections

35Institute of Economic Affairs
Figure 1: Trends in Population size since 1948 (population at 1948=100)
Source: Authors own computation
Age Structural TransitionsFigure 2 [refer also to Tables 8, 9, 10, 11, 12 and 13] shows the past, present and projected future trends in age structure of the Kenyan population. The Figure depicts a population dominated by young people (aged 0-14 and, to a lesser extent, 15-24 years). However, the proportion of persons aged 0-14 years has been declining since the 1980s when it reached a peak of about 50%, while that of producers (aged 15-64 years) has been rising consis-tently, and projected to reach a high of about 65% in 2050. There are positive changes too in the proportion of youth (aged 15-24 years), but the gains are less dramatic over the entire forecast period. The elderly still constitute a relatively minuscule proportion of the Kenyan population, rising modestly to a little more than 6% in 2050. This pattern is consistent with the ASTs model discussed earlier, given Kenya’s population dynamics and level of socio-economic development.
Figure 2: Age structural transitions: Kenya, 1950 – 2050
Source: UNDP, 2007

36Youth Research Compendium
The age structure for Kenya is also compared with that of other developing and developed countries (Figures 3, 4 and 5). In contrast to other developing countries, Kenya had a higher proportion of young people from 1960s to 1990s, but the proportion has since declined to lower levels than African countries like Nigeria and Sierra Leone. However, the decline in the proportion of young population has been more dramatic in other developing (Brazil, Korea, China and Iran) as well as developed (United Kingdom, France, Sweden, USA and Italy) countries. The trend for the Republic of Korea stands out. Starting with a population as young as Kenya’s in the 1950s, the proportion has declined dramatically, and is projected to fall below Italy’s – the oldest population in the world by 2050.
Figure 3: Age structural transition, 1950 – 2050: Comparing Kenya’s 0-14 age group with developed and developing countries
Source: UNDP, 2007
Figure 4, however, shows that the proportion of producers (aged 15-64 years) has started rising in African coun-tries since the 1990s, after decades of nurturing large populations of children. It is expected that by about 2030 Kenya’s population aged 15-64 years will overtake that of the developed countries, reaching at least 65% by 2050.

37Institute of Economic Affairs
Figure 4: Age structural transition, 1950 – 2050: Comparing Kenya’s 15-64 age group with developed and developing countries
Source: UNDP, 2007
According to Figure 5 ageing is unlikely to be a big issue for Africa as it is to developed nations or other developing countries (in Asia and Latin America), at least not until 2050 after which the situation may change dramatically.
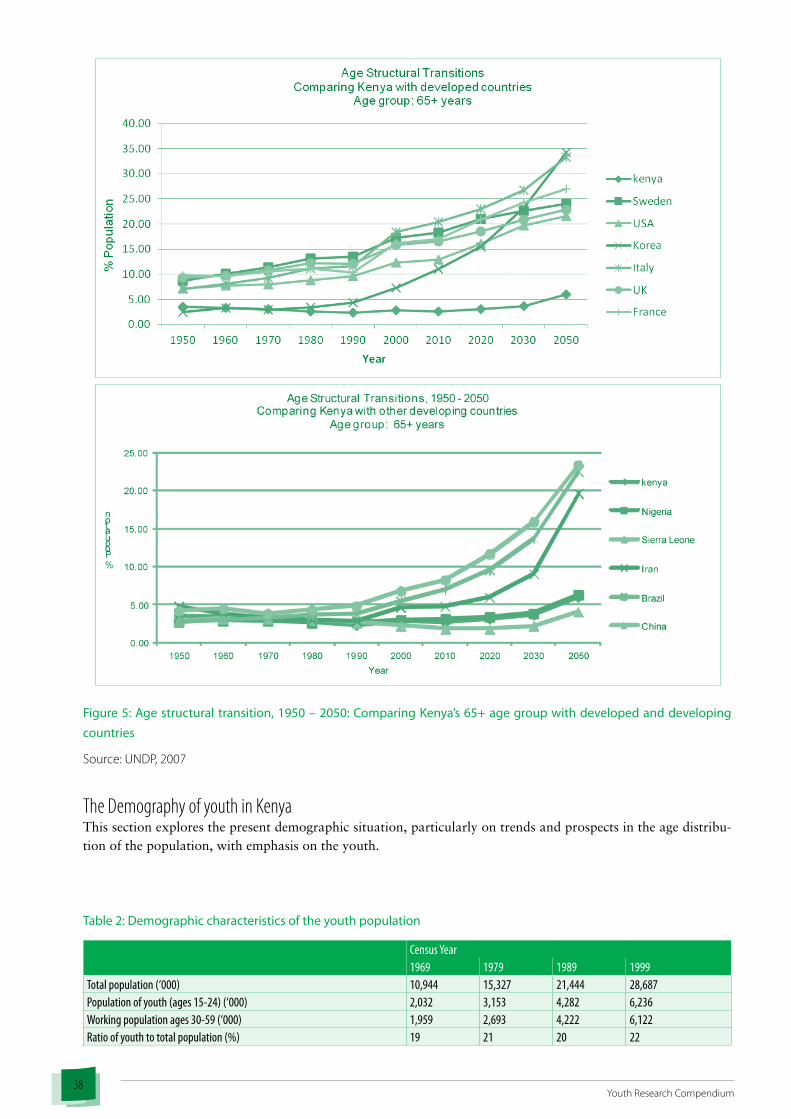
38Youth Research Compendium
Figure 5: Age structural transition, 1950 – 2050: Comparing Kenya’s 65+ age group with developed and developing countries
Source: UNDP, 2007
The Demography of youth in Kenya This section explores the present demographic situation, particularly on trends and prospects in the age distribu-tion of the population, with emphasis on the youth.
Table 2: Demographic characteristics of the youth population
Census Year1969 1979 1989 1999
Total population (‘000) 10,944 15,327 21,444 28,687Population of youth (ages 15-24) (‘000) 2,032 3,153 4,282 6,236Working population ages 30-59 (‘000) 1,959 2,693 4,222 6,122Ratio of youth to total population (%) 19 21 20 22

39Institute of Economic Affairs
Ratio of youth to Working population (%) 104 117 101 102Ratio of working population to total population (%) 18 18 20 21Population of youth relative to 1969 (1969=100) 100 140 196 262
Source: Compiled from the Kenya Population Census Reports, 1969, 1979, 1989 and 1999Table 2 shows the relative changes in youth population since independence. The absolute size of the youth popula-tion grew from about two (2) million in 1969 to about six (6) million in 1999. The pattern of growth reflects that of the overall population growth that is an exponential growth (as illustrated in Figure 6).
Figure 6: Trends in Kenya’s youth population (15-24) size since 1969 (1969=100)
Source: Compiled from the Kenya Population Census Reports, 1969, 1979, 1989 and 1999
The current youth population is almost three-fold the youth population since the late 1960s. The youthfulness of a population is always indexed by the median age. The median age3 declined from about 20 years in 1950s to about 18 years at the beginning of this Century (2000-2005), but is expected to reach 27 years in 2050 (UN , 2007).
When compared to the total population, the proportion of the youth population (15-24) has remained relatively steady between 1969 and 1999 as indicated on Table 2 and as illustrated in Figure 7.
3 Medianageisthatatwhichhalfthepopulationisaboveorbelow.

40Youth Research Compendium
Figure 7: Kenya’s youth population as a percentage of the total population
Source: Authors own computationAs noted earlier, Kenya predominantly has a young population that has been experiencing demographic changes. It is projected that the country will transition from a child rich to youthful population structure in the next 10-15 years as illustrated in Figure 8.
Kenya’sDemographicTransitions
Figure 8: Kenya’s Demographic Transition
Source: http://www.populationaction.org/Publications/Reports/The_Shape_of_Things_to_Come_Interactive_Database/Index.shtml
The youth have constituted a large part of the working population (15-60) since independence as illustrated in Figure 9.
Figure 9: Trend in percentage of Kenya’s youth population to the potential working populationSource: Authors own computation
Although the relative share of the youth population has nearly remained the same, the effect manifests in the ab-solute size, which has increased tremendously over the years.

41Institute of Economic Affairs

42Youth Research Compendium
Comparisons with Other CountriesThe youth population was estimated at 1.02 billion in 1995, about 18 percent of total world population (United Nations, 1997). Majority (84 percent) of these youth live in developing countries. The youth as a percentage of the total population has decreased in the developed countries, in most of Eastern Europe, and in a few countries of Western Asia. For example, in 1995, the youth population was as low as 12 percent in Germany and Finland. Youth as a percentage of the total population remains high in most of the developing world such as Indonesia where it reached 21 percent of the population (United Nations, 1997), just like Kenya at 22% in 1999 as indicated on Table 2.
Figure 10: Age structural transition, 1950 – 2050: Comparing Kenya’s 15-24 age group with developed and developing countries
Source: UNDP, 2007
As illustrated in Figure 10 the ‘youthfulness’ of Kenya’s population is typical of African countries, with the pro-portion of population aged 15-24 years being substantially higher than that of other developing and developed countries. For Kenya, the proportion of persons aged 15-24 years has been rising at a modest pace since the 1950s to a peak of about 22% in 2000s, and a projected gradual decline after 2030. This broad peak is symptomatic of decades of high fertility regimes, which remains relatively high several years after the onset of the transition. This might be deceiving, particularly because it doesn’t show an explicit “bulge”. The devil, as it were, is in the popula-tion momentum and its impact on population growth.

43Institute of Economic Affairs
Lessons from Other Countries Sub-Saharan Africa, Southern Asia, the Middle East, and the Pacific Islands are the regions with the most wide-spread youth bulges. Globally there are 62 countries that have 2/3 of their populations under the age of 30; these include Nigeria, Afghanistan, and Pakistan (Xenos, Kabav and Westley, 1999). Note that the pattern of growth of the youth population varies with the peak and magnitude of fertility decline experienced by a nation. Where fertility drops quickly from a very high to a low level, the youth bulge tends to be large.
Iran Evidence shows that the youth bulge is more evident in Iran than any other country in the world. This is because Iran has experienced the fastest fertility decline in the last two decades (as illustrated in Table 3). As a result of the rapid fertility decline, nearly one in three Iranians is between the ages of 15 and 29 while 60 percent of the Iranian population is under 30 (Population Reference Bureau, 2009). It is now hypothesized that the youth bulge, along with changes in women’s fertility and reproductive health, provide a backdrop for understanding Iran’s current political instability (Population Reference Bureau, 2009).
Table 3: Trends in total fertility rate (Iran, 1977-2006)
Births per woman1977 1996 2000 2006
Urban 4.5 2.2 1.8 1.8Rural 8.1 3.5 2.4 2.1Total 6.6 2.8 2.0 1.9
Source: Population Reference Bureau (2009).
The effect of the youth bulge is believed to have been manifested in the uprising following the disputed presidential election of June 12, 2009 (Population Reference Bureau, 2009). Social and political restrictions, coupled with high rates of unemployment and the cost of living, have made it increasingly difficult for young Iranians, pushing them to leave the country in large numbers to find jobs in places such as Canada and Australia. The unemployment rate for young people ages 15 to 24 is 23 percent, twice that of the total labour force.
Republic of KoreaKorea’s high birth rate of the 1950s began a dramatic transition downward starting in the early 1960s. According to United Nations estimates (United Nations, 1995:788) the Total Fertility Rate (TFR) was 6.07 in 1955 when the Net Reproduction Rate (NRR) was 2.28. However, the NRR had dropped below the replacement level by 1990, less than thirty years after fertility reduction had begun. The death rate had plummeted earlier following the classic contours of demographic transition.
The growth rate of the youth population rose dramatically and peaked by 1975. The youth share of the total Ko-rean population rose from around 17 percent in the 1950s and 1960s to its peak at 23 percent in 1980. During the 1970s the youth population expanded rapidly, and it continued to expand though less rapidly during the 1980s. By 1990 the youth population had peaked in absolute terms and began a long decline. The projection for the year 2025 suggests a youth share of only 12.4 percent.
One of the greatest manifestations of the youth bulge in Korea, is that the population aged 15-24 years increased from 3.8 to 8.8 million during 1950-90 ( a rise of 132% ) the school enrollments increased by 653% while the number of out-of-school youth declined from 5.1 to 3.6 million during 1990-2025 (Xenos et al., 1999). Thus, in the Republic of Korea the very rapid growth in the young single population owing to the youth bulge is countered by the rapid expansion of the number of youth in school (Xenos and Kabamalan, 2002).
The PhilippinesAlthough the onset of fertility decline in the Philippines began in the 1960s, (Xenos and Kabamalan, 2002) evi-dence shows that it has been slow. Between 1970 and 1996, the total fertility rate of the Philippines had decreased

44Youth Research Compendium
from 5.97 to 3.7, but the declines observed in the 1970s and 1980s failed to gain momentum in the 1990s. The inter-censal growth rates reached a maximum of three percent in the 1960s and gradually declined slightly above the two percent in the 1990-2000 periods. The median age of the Philippine population was 19.7 years in 1990, and 21.0 years in 2000 but is expected to rise to 26.5 years in 2015 and 28.4 years in 2020 (NSO, 1997; NSO, 2002). The proportion of people under age 15 is declining, but their absolute number continues to rise while the proportion of youth (aged 15-29) has reached its peak and is now gradually on the decline. Xenos (2003) estimates that the youth population (aged 15-24) will increase by as much as 259% in the 66 years that the Philippines will take to complete its demographic transition. The shift in age structure continues to pose immediate and continu-ing challenge of providing adequate economic opportunities, resources and services to an unprecedented number of people in the productive ages. Orbeta, (2002) described the challenge as daunting to the Philippine economy.
Other Lessons in History Goldstone (1991) drawing from time series data for England shows the relevance of youth bulge in Britain’s de-mographic history. Great Britain’s large population growth rates in the 17th Century resulted in a widespread con-viction in the 18th and 19th centuries that it faced a population/unemployment crisis. The government resolved part of the crisis by encouraging both out-migration on a grand scale and innovation, which eventually led to technological breakthroughs and the Industrial Revolution.
Population growth in 18th-century France too played a role in the French Revolution. France’s population grew from 24.6 million in 1740 to 28.1 million in 1790.The ratio of youth (under 18) to adults increased from 0.6 to 0.8. This helped to increase the demand for food at a time of stagnant supply levels, thereby driving up food prices throughout France. Inflation accelerated further as a result of increased urbanization because the velocity of money was higher in the cities than in rural areas. Consequently, the average French wage earners purchasing power was reduced, which had the ripple effect of creating a business downturn for the growing and increasingly powerful French artisan and merchant classes.
Other observers note that while the United Nation’s effort to spearhead a series of youth welfare related policies is commendable (such as International youth Year and World Program of Action for youth to the Year 2000 and Beyond) the range of approaches to social (Youth) policy stands out (Xenos and Kabamalan, 2002). Thus, while all governments see their youth both as assets and liabilities, there are marked differences in emphasis from one country to another. The world, therefore, is still a long way from formulating universal policy models that can navigate (developing) countries successfully through episodes of youth bulges.
Driving ForcesDeterminants of Population Change in Kenya Population growth rates in developing countries are largely driven by levels of fertility. The changes in fertility be-ing a result of complex processes that involve changes in the demand for children, the diffusion of new attitudes about birth control and greater accessibility to contraception provided by family planning programmes (Cleland and Wilson, 1987; Freedman and Freedman, 1991). Nevertheless, others argue that fertility changes are driven by shift in desired family size rather than by the efforts of family planning programs (Pritchet, 1994). Still, others have argued that family planning program effort makes an important contribution to contraceptive practice irrespective of social setting which in turn cause fertility change (Ross and Stover, 2001). Potts (1997) also argued that the unconstrained access to fertility regulating technologies was the primary factor responsible for fertility declines. These arguments raise two important but interrelated issues: changes in fertility levels occur not only as a result of changes in desired number births but also the ability of couples/individuals to implement their fertility desires.
Fertility change in Kenya, which has been a subject of numerous a demographic study and discussion, continue to raise a number of debates, even in recent decades (Bocquier et al., 2009). Initially, high fertility in Kenya was perceived to reflect the cultural and social norms supportive of large family sizes (Frank, 1984) in addition to persistently high infant mortality rates. It raised a simple argument that families were striving to have a high number of births to ensure that desired number of children survived through childhood. A number of researchers

45Institute of Economic Affairs
(see Caldwell, 1977; Boserup, 1985) in this period attributed high demand for children to a rise from costs and benefits of children. These can be categorized as: direct costs and benefits of children; the time costs of children; a Family’s wealth; tastes and norms.
Caldwell (1977) suggested that high fertility was indeed economically rational because families owned large tracts of land held by lineage and therefore increasing numbers of people provided the best form of investment avail-able to control land and associated products. Boserup (1985), claimed that as long as agricultural systems were subsistence-based where women and children performed most of the work, a father of a large family was seen to be more advantaged. Thus the systems encouraged reproductive culture that was shaped by a productive culture. Caldwell (1982) proposed that children also acted as old age social and economic security for very many families in developing countries. Studies explaining the changes in fertility in the 1980s and 1990s attributed rapid fertil-ity declines in this period to the economic downturn, government policy shifts and mass education. For example, Kelly and Nobbe (1990), attributed the observed decline in the birth rate to results from: socio political environ-ment and the provision of family planning services, which expanded greatly in the period; the improvements in child survival as a result of immunization programs; and the rising cost of education, which placed large demands on parents in the wake of dwindling national economic circumstances.
Indeed Robinson (1992), in a review of findings based on small-scale surveys conducted in a number of parts of the country, commented that declining fertility levels were occurring both in rural and urban areas, with many adults perceiving large families as presenting economic strain. Hammerslough (1991) noted that economic burden was one of the main driving forces behind the demand for fewer children. Some authors attributed the demographic changes in Kenya to the massive investments in human capital — particularly education. The policy emphasis on education throughout the country and the fact that parents highly valued education, which could be traced back to early missionary influences, caused an insatiable demand for education (Robinson, 1992) held true even among the uneducated, resulting in an increase in enrolment at all levels of schooling. However, the introduction of a fee-based cost-sharing approach in education in the 1980s to make parents offset some of the recurring costs of the enlarged education system made parents acutely aware of the cost of children in a direct financial sense (Ham-merslough 1991). The change towards smaller family size attributed to the rising cost of raising a child coincided with a major economic downturn in the country in the 1990s.
One other major factor less considered is the role of urbanization and migration. More than two decades ago, there were speculations that urban residence and occupational status were not important correlates of fertility in Africa (Cochrane and Farid, 1989). However, there is now evidence that a number of studies of determinants of fertility then failed to take into account the interaction between urbanization and other variables in determining fertility outcomes (Kravdal, 2000). This is an observation that had also been made by Davis (1963), particularly that before understanding national patterns of fertility decline account must be taken of the interrelationships between nuptiality, fertility and migration. More recently, Lindstrom and Saucedo (2000) have argued that despite the fact that fertility preferences may be strongly influenced by norms and values learned during childhood and reinforced during early adulthood, migrants moving to culturally distinct destinations slowly adapt to norms and values prevalent in the destination, including those governing family formation and reproduction.
Although the driving force of population growth in developing countries is highly attributable to the relative change in observed fertility patterns, mortality, particularly at infancy, plays a significant role too. The effects of infant mortality on fertility plays a pivotal role in the theories that explain fertility decline (Palloni and Rafali-manana, 1999) and in policies designed to change fertility levels in developing countries. Results from literature suggest that further mortality declines in developing countries are hard to achieve unless fertility declines further (Rosero-Bixby, 1997). The dramatic decline in fertility in Kenya in the mid 1980s was attributed to changes in in-fant mortality as a result of the expansion of the immunization campaigns (1990). The mechanisms through which the effects manifest are varied but it is hypothesized that couples who experience child losses are less likely to use contraception, tend to have shorter birth intervals and hence more children. The link between infant mortality and fertility is closely linked to three main issues:
• Both child mortality and fertility share a common set of determinants like mothers education, breastfeeding practices, etc

46Youth Research Compendium
• Lower fertility may reduce child mortality through reduction of maternal “depletion” associated with preg-nancies and lactation (Trussel and Pebley, 1984) and thereby diminishing sibling competition for scarce fam-ily resources and maternal care (Pebley and Milman, 1986) and decreasing rates of transmission of infectious diseases in child crowded environments (Blacker, 1987).
• Child survival affecting fertility due to either replacement effects or setting high goals for target family sizes in anticipation of child deaths (Olsen, 1983; Preston 1975; United Nations, 1987, 1988; Palloni and Rafali-manana, 1999).
Population Dynamics Table 4: Trends in key Indicators of population change since 1948
Period 1948 1962 1969 1979 1989 1999 2009*Total fertility rate 6.0 6.8 7.6 7.9 6.6 5.0 4.6**Crude birth rate (per 1000) 50 50 50 52 48 41.3 39Crude death rate (per 1000) 25 20 17 14 11 11.7 13Infant mortality rate (per 1000) 184 NA 118 104 66 77.3 52**Life expectancy at birth (years) 35 44 49 54 60 57 54Number of births p.a.(‘000) 270 430 545 796 1,027 1,185 1,525
Number of deaths p.a. (‘000) 135 172 185 214 235 336 508Absolute increase p.a. (‘000) 135 258 360 581 792 850 1,017
Source: Compiled from the Kenya Population Census Reports, 1948, 1962 1969, 1979, 1989 and 1999 2009* projected; ** KNBS and ICF Macro (2010)NA – Not Applicable
Table 4 provides information on key indicators of population change since 1948 with birth and death rates further illustrated in Figure 10. The crude birth rates (CBR) and crude death rates (CDR) in Figure 11 are the ultimate determinants of the population growth rate (rate of international migration in Kenya can be considered as some-what negligible). However, they are not the best indicators of fertility behaviour or basic mortality conditions since they are affected by age structure.
Figure 11: Trends in Kenya’s crude birth and death rates since 1962
Source: Compiled from the Kenya Population Census Reports, 1948, 1962 1969, 1979, 1989 and 1999
The total fertility rate (TFR) is the sum of age-specific fertility rates in a given year, and can be interpreted as the number of births a woman would have in her lifetime, given the age-specific probabilities of birth in that year. Unlike the crude birth rate, which is affected by the population age structure, the TFR is a useful summary of the actual fertility behavior of women in a given period. On the other hand, the crude death rate (CDR) is also highly affected by the population age structure, and is thus an imperfect measure of the actual mortality situation in a

47Institute of Economic Affairs
given period. The infant mortality rate, which measures the number of live births that die before age 1 divided by the total number of births (expressed per 1000 live births), is much better than the crude death rate at showing the decline in mortality.
The initial rise in population growth rate was attributed to high and rising fertility with rapidly declining mortal-ity rates. The peak change occurred between 1970s and 1980 when birth rates rose to the highest levels and death rates to the lowest levels. It is this period when Kenya marked the highest rate of natural increase. As a result of the rapidly changing birth and death rates, the absolute increase in population rapidly rose from 135, 000 persons per annum in 1948 to slightly over 1 million in the recent past.
Demographers use the term “demographic transition” to refer to the pattern of changes in fertility, mortality, and population growth. The demographic transition theory was formulated after observing that the demographic transition in both developed countries and some developing countries occurred with a high degree of regularity. With death rates falling, birth rates typically remain high for some period of time, which generates rapid popula-tion growth (see the Kenyan case in Figure 11). The pace at which mortality and fertility change and the length of time between mortality decline and fertility decline determines the rate of growth that will be observed during the demographic transition. The size of surviving birth cohorts during the demographic transition is usually influenced by a complex interaction of fertility, mortality, and population momentum. Decline in infant mortality plays the most important role in driving declines in the overall death rate during the demographic transition.
The trends in population change in Kenya have generated a lot of debate worldwide. Despite the high growth rates in the 1970s, Kenya experienced rapid decline in fertility between 1980s and 1990s thereafter the rapid decline plateau-ed somewhat. It is this period also when the rapid mortality decline experienced in the 1970s and 1980s reversed.
Migration and Urbanization – Aspects of Spatial PatternsMigration, besides fertility and mortality, is another component of population change. It is a complex phenom-enon compared with the other two mainly because migration must be defined in both spatial and temporal dimen-sions. The complexity of migration arises from the number of parameters that must be taken into account when describing population movement. These include type of change of boundary (internal vs. international); direction of the move (rural-rural, rural –urban etc); distance covered; timing and duration of stay (long term verses short term); and periodicity (repetitiveness). Different combinations of such parameters lead to different types of moves. Major studies on internal migration in Kenya began with the analysis of 1962 census data (Ominde, 1968) but the initial studies were heavily geared towards measurement of migration flows (Ominde, 1968; Rempell, 1977; Oucho, 1988) among others). However, these studies did not provide details on the nature and circumstances of migration (Oucho and Odipo, 2000).
Labour migration is also an important phenomenon because of its links to urbanization process in Kenya. As a way to escape poverty, many young people set out for better opportunities through migration. Indeed, migration to urban areas is unavoidable and even desirable as a way to improve allocation of human resources, especially in land-scarce countries.
While youth are more likely than older people to move from rural to urban areas or to move across urban areas, this increased youth migration has far-reaching impacts. It increases the strain for jobs without necessarily improv-ing the job conditions of those who are left in rural areas; impacts provision of public goods, education, utilities, housing, and infrastructure; and affects demographic and skills composition in both urban and rural areas. Given that about 70% of the African youth population is still in rural areas, and that urban areas have been very slow to create job opportunities for most new job seekers, there is a need for an integrated and coherent approach in which youth policies take cognizance of the rural-urban differentials in population/labour composition.

48Youth Research Compendium
Table 5: Trends in urbanization in Kenya
Year Population Urban (‘000) % Urban Urban annual growth rate (% per annum)
Role Migration in urban growth
1948 5,406 285 5.2 * *
1962 8636 671 7.8 6.3 46
1969 10,943 1,082 9.9 7.1 51
1979 15,334 2,314 15.1 7.9 57
1989 21,444 3,864 18 5.3 35
1999 28,686 5,954 20.8 4.4 33
Source: Bocquier et al., 2009*Data not available
The urban population growth has been increasing since independence. The share of the urban population increased from about 8% in 1962 to about 19% in 1999. At the time of Kenya’s first population census in 1948, there were 17 urban centers with an aggregate population of 285,000 persons. The urban population was proportionately small (5.2% of the total) but disproportionately concentrated in Nairobi and Mombasa (74% of the total urban population) with the majority of the urban dwellers being non-Africans. By 1962, the number of urban centers had doubled to 34 and the urban population increased to 671,000 persons. This represented an urbanization level of 7.8%. The urban growth rate stood at 6.3% per year. The urban population grew to 1,082,000 persons in 1969, growing at the rate of 7.1% per annum. In 1969 this represented 9.9% of the total population with Nairobi and Mombasa accounting for 67% of the total urban population. By 1979, the overall level of urbanization had risen to 15.1% with 91 urban centers (population of 2.3 million). Nairobi and Mombasa accounted for 51% of the total urban population. In 1999, about 20% of the population lived in urban areas, of which half were in Nairobi and Mombasa. The fundamental issue is the fact that the rate of urbanization is fast but dominated by only two centers (Nairobi and Mombasa). This is one of the impediments to sufficient expansion of the labour market and spread of the labour force as most industries and public offices are situated in the two cities.
The urban population is growing very fast while the economic growth and development transformations necessary to support it and enhance the quality of urban life are not occurring at the same rate. Most of the migrants come as young adults, usually after secondary school with employment as the motivation for migration. The majority of migrants were still males, a pattern that traces back to the pre-independence era until recently. However the sex distribution is more balanced now, a fact reflected in the male to female ratio, which has been reducing from one generation to the next (see Bocquier et al., 2009) for the case of Nairobi. Figure 12 displays typical age patterns of urban population in Kenya. Majority of urban dwellers are young adults in the age group 25-29 typically fu-eled by rural urban migration. The age patterns reflect the growing dominance of the urban population in Kenya.

49Institute of Economic Affairs
Figure 12: Age patterns of urban population in Kenya
Source: KDHS, 2003 and Census, 1989
Implication of youth Bulges: The Inescapables The past population dynamics lead to a number of important features of today’s youth demography. Most devel-oping countries that have experienced mortality decline while fertility remained high have witnessed unprecedent-ed large youthful populations often referred to as ‘Youth bulges (when proportions and numbers of young adults peak in a society prior to an eminent decline). There are several reasons why the attainment of this particular life cycle stage cannot be ignored (Pool, 2006): Attainment of biological maturation; completion of formal education; first entry to the labour market; migration – highest incidence and prevalence of geographic mobility; attainment of social maturity and onset of independence; and onset of family formation. Thus, the emphasis that national and international policy and decision makers place on the youth cohort derives from its significance with respect to the following, among other things: fertility – the youth is the group mainly responsible for population momentum; migration, particularly rural-urban migration – the propensity for geo-graphic mobility is most pronounced during this stage of the life cycle; labour force participation and human capital formation; and transformations in the social composition of youth, with emphasis on the urban youth, which again, have a direct bearing on a country’s population dynamics.
Fertility Demographic features of the youth transition are closely linked to their demographic behaviour. The future of population growth is largely a matter of future rates of childbearing, combined with present day age structure. The reproductive decisions that young people make thus determine their lifetime fertility rates and, subsequently, rate of population growth.
Table 6 below shows the age specific fertility rates for the youth in Kenya from various surveys since 1975. The third panel shows the contribution of the youth fertility to the overall fertility rates. It basically presents the rela-tive weight of youth fertility which has been increasing since 1975 from about 30 percent to nearly 40 percent in 2008. While the frequency of births among the youth is gradually declining it is still nevertheless high and makes a sizeable contribution to the overall high fertility.

50Youth Research Compendium
Clearly,thereproductivedecisionsofyouthwillshapethedemographicfutureofthecountrysincethe
relativeweightofyouthfertilityratesasashareoftotalfertilityhasincreasedinthelast30years.
Table 6: Trends in Age specific Fertility rates (births per 1000 population) of youth (15-24) population since 1975 - various surveys
Age Period 1975-1978 1984-1989 1990-1993 1995-1998 2000-2003 2005-
200815-19 168 152 110 111 114 10320-24 342 314 257 248 243 233Percent contribution of births in age group (15-24) to TFR
31.8 34.8 34.0 38.0 36.5 37.0
TFR 8.1 6.7 5.4 4.7 4.9 4.6Source: Kenya fertility survey, 1977/78; and Kenya Demographic and Health Surveys, 1988/89, 1993, 1998, 2003 and 2008/09
Figure 13: Trends in contribution (percent) of various age groups to the total fertility
Source: Kenya fertility survey, 1977/78; and Kenya Demographic and Health Surveys, 1988/89, 1993, 1998, 2003 and 2008/09
As indicated in Figure 13, 60.9% of births do occur between the ages of 15 and 29 but more importantly most peo-ple initiate sexual activity, are exposed to the risk of contracting sexually transmitted diseases, including Acquired Immuno-Deficiency Syndrome (AIDS), form their first stable union, and learn about and start to use contraceptive methods during this period in their life cycle. Available demographic data indicates that by age of 20, the majority of women are sexually active; slightly less than half have formed stable unions and over a third are mothers (KNBS et al., 2010). The continued early onset of childbearing will exacerbate the future population growth.
Labour and Human CapitalThe youth bulge that have produced the historically unprecedented numbers of young people in the world today have potentially important implications on the labour market opportunities, access to public resources, and access

51Institute of Economic Affairs
to family resources for youth (Lam, 2006). While there are many reasons to take note of the unprecedented size of current youth cohorts, for many economic issues, it may be the growth rate of the youth population, or its size relative to other age groups, that is critical. For some economic and social questions, it may be the percentage of the population in youth age groups that is most important while the youth population as a percentage of the total population may be important for some purposes. Two important strands of literature in economic demography have merged: those that have focused on relative cohort size (RCS) that is the impact of cohort size on the youth labour market and those that have focused on the ‘window of opportunity’ that arises from a favourable ratio of the working age population to the dependent population. The ratio of youth to the total population is around 20 percent but if the birth rate declines and adult mortality remains stable it is expected to decline slightly. How-ever, the youth are still expected to constitute a large chunk of the working age population in Kenya despite the expected decline.
Table 7: Projected ratios of the youth population to various segments of the population
Year 2009 2012 2013Ratio of youth to total population 20.3 19.4 19.1Ratio of youth to adult population age 15+ 35.7 33.9 33.3Ratio of youth to working population age (15-59) 38.8 36.8 36.1
Source: National Coordinating Agency for Population and Development, 2010
Economic theory predicts that the absolute size, relative size, and rate of growth of the youth population could all potentially have an impact on the wages and employment opportunities of young people. Which of these variables will have the largest impact will depend on the nature of the labour market, the degree of complementarity or substitutability of youth labour with other factors of production, and the speed of adjustment of other factors in response to changes in the supply of youth in the labour market.
International Labour Organization (2006) estimated that, worldwide, the ratio of the youth-to-adult unemploy-ment rate equals three although the youth made up 43.7% of the total unemployed people in the world despite accounting for only 25% of the working population. The resultant effect is that more than one third of the youth in the world is seeking but unable to find work, has given up on the job search entirely, or is working but still living below the $2 a day poverty line. In Sub-Saharan Africa, three in five of the total unemployed are youth (Interna-tional Labour Organization, 2006).
In Kenya, the continued youth demographic bulge is manifested in the demand for employment. Currently work-ing age population (15-64) is about 19.8 million, (54.2% of the total population) out of this 1.8 million are unem-ployed. Out of the currently unemployed working age population, 72 % are under age 30 while 51 % are under age 24 (Republic of Kenya, 2010). The unemployment rate among the youth stands at about 25% but skewed in favour of males. Female unemployment rate still stands at 27% against 22% among males. Similarly, unemploy-ment among the urban youth stands at 39% against rural 19%. Despite the gloomy statistics, nearly 500,000 young people enter the job market annually (Republic of Kenya, 2010).
Another important area in which there has been attention to the economic implications of relative cohort size is the literature on dependency burden and savings rates. This literature has a long history, going back to the work of Coale and Hoover (1958), who argued that countries with high population growth rates suffered from low sav-ings rates due to the high ratio of children and youth to the working-age population. The rapid rise in the ratio of the working population to the non-working population in East Asia between 1965 and 1990 is believed to have played an important role in driving the East Asian ‘economic miracle’ (Bloom and Williamson, 1998). However, this window of opportunity could close on Kenya and most, if not all, Sub-Saharan African countries, if policy makers in these countries do not adequately anticipate the demographic moment (favourable shift in population age structure – youth bulge).

52Youth Research Compendium
Crowding effect One important concept of youth population is the crowding effect. Macunovich (2000) pointed out how relatively large youth cohorts populate institutions and impinge on their operation. This effect is particularly manifested in the labour market crowding, crowding in families, and crowding in education. In each of these institutional sectors, though perhaps most obviously in labour markets, crowding may operate in a segmented fashion, af-fecting certain social categories with greater force than others. Similarly, Bloom and Freeman (1986) employ a generational crowding framework in which youth numbers influence politics through effects on the distribution of scarcities, and through the mal-distribution of loads or demands relative to the capabilities to meet those demands (Xenos, 2006).
Youth and civil conflicts Recent studies show that youth bulges could be associated with high risk of outbreaks of civil conflicts (Cincotta, 2005; Cincotta, Engelman, and Anastasion, 2003; Urdal 2006; 2007). Between 1970 and 1999, 80% of civil con-flicts occurred in countries where 60% of the population or more were under the age of thirty (Cincotta, et al., 2003). In countries where youth make up to 35 percent of the total adult population, the risk of conflict, ceteris paribus, increases by 150 percent compared to countries where youth make up only 17 percent of the adult popu-lation, as in most developed countries (Urdal and Hoelscher, 2009).
Projected youth Population 1950-2050Table 8 and 9 shows the estimated and projected population by broad age groups. The youth population rose from about 6.8 million in 2000 to 8.5 million in 2010 and is expected to reach 15.4 million in 2050. The share of youth population has, however, remained high at about one fifth of the total population and is not expected to change until 2050. Lam (2006) indicated that Kenya’s youth population is only likely to reach the peak after 2030. The implication of the projected population is such that there will be increased demand on the country resource to meet the needs of these growing and large populations.
Table 8: Estimated population size (‘000) by broad age-groups: Kenya, 1950 - 2050
Age group (in years)
Calendar Year 0-14 15-24 15-64 65+ 80+ Total
1950 2,417 1,150 3,421 218 - 6,077
2000 13,890 6,853 16,675 875 114 31,441
2010 17,500 8,472 22,287 1,075 156 40,863
2030 22,426 13,472 38,464 2,304 302 63,199
2050 24,568 15,453 55,675 5,166 686 85,410
Source: United Nations, 2007.
Table 9: Estimated relative population size (Percent) by broad age-groups: Kenya, 1950 - 2050
Age group (in years)
Calendar Year 0-14 15-24 15-64 65+ 80+
1950 39.8 18.9 56.3 3.6 -
2000 44.2 21.8 53.0 2.8 0.4
2010 42.8 20.7 54.5 2.6 0.4
2030 35.5 21.3 60.9 3.7 0.5
2050 28.8 18.1 65.2 6.0 0.8
Source: United Nations, 2007
Projected youth population to total population for selected countriesTables 10 and 11 show the share of the youth population to the total population for selected developing and de-

53Institute of Economic Affairs
veloped countries. In the 1950s, the proportion of the youth population was nearly the same for Kenya, Nigeria, China, South Korea and Iran. Nigeria and Kenya have maintained large youth proportions that are unlikely to change in the near future. However, China and South Korea will experience youth deficit in the near future hav-ing experienced youth bulges in the 1980s and 1990s although the Chinese experience was rather short. Iran that is currently undergoing a situation with peak proportion of youth population (i.e. when the country experienced largest proportion of the youth population) will experience declining share and likely to reach deficit after 2030. Table 11 shows a share of youth population for some selected developing countries. These are countries that are in the fourth stage of AST and mainly composed of aging population and deficit of the youth.
Table 10: Estimated relative population size of the youth [15-24 years] to total population (percent): Selected developing countries, 1950 - 2050
Calendar Year Kenya Nigeria China South Korea Iran
1950 18.9 18.8 18.3 17.1 17.3
2000 21.8 20.3 15.6 16.4 24.7
2010 20.7 20.0 16.9 13.6 21.8
2030 21.3 20.7 12.1 9.1 14.7
2050 18.1 17.4 10.4 8.7 11.2
Source: United Nations, 2007
Table 11: Estimated relative population size of the youth [15-24 years] to total population (percent): Selected developed countries, 1950 - 2050
Calendar Year Kenya United Kingdom United States Italy
1950 18.9 13.6 14.9 17.3
2000 21.8 12.2 13.9 11.7
2010 20.7 13.2 14.1 9.8
2030 21.3 11.9 12.9 9.8
2050 18.1 11.5 11.8 9.0
Source: United Nations, 2007
Tables 12 and 13 show some of population growth indicators (fertility rate and life expectancy at birth) estimated and projected to 2050 for developing and developed countries respectively. It shows the rapid fertility decline for China, South Korea and Iran accompanied by rapid increase in survivorship. The rapid change in the demographic situation (increased life expectancy and rapid fertility decline) is what produced rapid youth bulges in China, South Korea and more recently Iran.

54Youth Research Compendium
Table 12: Estimated indicators of population growth: Selected developing countries, 1950 - 2050
Calendar Year Kenya Nigeria China South Korea Iran
TFR eo TFR eo TFR eo TFR eo TFR eo
1950-1955 7.5 42.3 6.5 36.0 6.1 40.8 5.1 47.9 7.0 44.9
2000-2005 5.0 51.7 5.7 46.7 1.8 72.0 1.2 77.5 2.1 69.9
2010-2015 4.5 56.9 4.8 49.1 1.8 74.0 1.3 80.0 1.7 72.5
2025-2030 3.2 61.4 3.3 54.9 1.9 76.6 1.4 81.7 1.9 75.6
2045-2050 2.4 67.1 2.4 62.5 1.9 79.3 1.6 83.8 1.9 78.6
Source: United Nations, 2007.
Table 13: Estimated indicators of population growth selected developed countries 1950-2050
Calendar Year Kenya United Kingdom United States Italy
TFR eo TFR eo TFR eo TFR eo
1950-1955 7.5 42.3 2.2 69.2 3.4 68.9 2.4 66.3
2000-2005 5.0 51.7 1.7 78.5 2.0 78.3 1.3 80.2
2010-2015 4.5 56.9 1.9 80.1 2.0 79.9 1.4 81.6
2025-2030 3.2 61.4 1.9 81.9 1.9 81.4 1.5 83.3
2045-2050 2.4 67.1 1.9 84.1 1.9 83.3 1.7 85.4
Source: United Nations, World Population Prospects, 2007 RevisionTFR: Total Fertility Rate eo: Life Expectancy at Birth
Conclusion By way of conclusion, it is imperative to revisit the paper’s theme, which was to review Kenya’s population growth, distribution, and age structure, and their implications for socio-economic development. To put this in context, there are questions that might not have been answered directly by this paper, but that remain pertinent to the central theme:
• Is Kenya experiencing a youth bulge? If so, when will/did it peak, and how long will it last? If not – yet – when will it begin?
• Is Kenya preparing adequately for the youth bulge? Is the political and socio-economic policy environment proactive enough to reap the ‘bonuses’ that are likely to accrue from the demographic ‘window of oppor-tunity’?
• The flip-side of the youth bulge is population ageing. Are the socio-economic policies integrated enough to navigate the country through the youth bulge while at the same time anticipating the ageing process that will inevitably ensue?
Kenya does surely have a large population of young people and high rate of population growth. Such a large population adds considerable burden to the country’s budget for provision of health, education and other social services. For example, according to the rapid population projections model, if the birth rates and the growth rates continue at the present levels, the number of primary school students will increase from about 7 million at the pres-ent time to about 14 million by 2040 and about 14 million housing residences in the urban areas (Health Policy Initiative, 2009). However, Kenya is not alone. Many developing countries, especially in Sub-Saharan Africa, share the same fate, albeit with varied political and socio-economic development challenges. There is a good case here for integrated universal socio-economic models to help various countries adapt to and navigate these challenges.
High fertility rate is considered as Africa’s biggest demographic challenge. In the last 30 years, 45 percent of most African countries’ population has been below age 15 which implies a constantly rising number entering the labour force. The combination of population growth associated with high fertility rates and the slow pace of job creation presents challenges to its youth.

55Institute of Economic Affairs
Migration patterns put further strain on urban areas and labour opportunities. Young people are more likely than other age groups to migrate from rural to urban areas. Unemployment and underemployment in urban areas are associated with rural-urban migration. Despite increased rural-urban migration however, over 70 percent of the African youth population still live in rural areas.
As rural – urban migration increases, most migrants being youth are now living in increasingly crowded urban ar-eas. The urban crowding may have links between youth bulges and urbanization. However, there is currently little evidence that rapid urbanization affects the relationship between youth and conflict at the country level (Urdal and Hoelscher, 2009). Nevertheless violent conflict is increasingly taking the form of localized low-intensity disruption and outbreaks of violence. These youth bulges tend to increase the risk of low-intensity armed conflict outbreak very significantly.
Many countries, such as those in East and South-east Asia, have avoided conflict stemming from large youth populations in recent decades by providing education and employment opportunities to them. But what micro evidence tends to suggest is that it is really opportunities for the youth that matters – employment opportunities and education opportunities.
Some researchers (Xenos et al 2002) argue that the overall number of youth is not especially important in itself, but becomes so in interaction with prevailing social and economic institutions. However, few studies do recognize the importance of social composition or social demography within the youth populations (Xenos et al 2002).
According to Parliamentarians network (2010), there is an abundance of historical evidence establishing a direct link between societies with large proportions of young people and political and social violence, especially when employment prospects are severely limited. In addition many cities in the developing countries lack the infrastruc-ture and resources to support large bursts of population growth, yet more and more rural youth are moving to metropolitan areas in search of employment only to find inadequate economic opportunities. They warn that there exists false expectations that the educational opportunities afforded by recent development progress means there are more skilled workers in the world than available prospects because there is a fundamental disconnect between the demand for work and the supply of jobs.
Investing in the youth BulgeYouth bulges are becoming the order of the day in many developing countries owing to rapidly falling fertility rates everywhere and the significant gains made with respect to child survival. These ‘bulges’ will constitute the next generation of workers, parents, citizens and leaders. There are two possible scenarios for the Kenya age structural transition. The first scenario is a slow transition as experienced by Philippines in the South East Asia. Such a sce-nario will occur when fertility does not decline rapidly. The alternative scenario is that experienced by China and to some extent South Korea which is a rapid transition when fertility rapidly declines. The two scenarios have different implications on social and economic change. Under rapid change, there will be continued need to rapidly expand education, health and employment programs. However the period of expansion would be too short.
It is estimated that the number of young people aged 12-24 years currently stands at 1.3 billion, but will rise to about 1.5 billion by 2035, and decline gradually thereafter (Jimenez and Murthi, 2006). The World Bank (2007) suggests some universal policy directions to turn the ‘bulges’ into opportunities for investment, growth and pov-erty reduction based on lessons from various countries.
• Improve the quality of basic education. The dramatic progress in improvement of education for young people has not been necessarily matched with quality, especially at the secondary and tertiary levels. Also of critical concerns are the absence of standardized test scores comparable across schools and countries. Countries should also emphasize an important concomitant factor – the nutrition, health, and psychosocial development of pre-school-age children. Evidence from some countries show that enriched child care and pre-school programs have led to achievement of higher test scores and high school graduation rates.
• Meet demands for higher skill levels. Lack of proper standards in the education system confronts the youth

56Youth Research Compendium
with another challenge – meeting the demands for skills in the global economy. Even the growing demand for labour migration by developed countries requires higher-level skills that most youth lack.
• Ease labour market entry. Young people have a hard time getting started. Some wait a long time for a job; others take low-paying jobs to learn new skills. While ensuring that economic growth increases demand for workers of all ages, it is important that young people are able to compete on a more equal basis (many labour market regulations penalize new entrants in middle-income countries). Appreciable flexibility in regu-lations is also required to allow adequate participation of the unskilled as well.
• Trade and Labour Market Reforms. The returns to investment on the youth would be substantially en-hanced by trade and labour market reforms that seek to deploy human capital more efficiently. However, planners must endeavor to provide adequate protection to other groups as well while upholding competitive-ness and professionalism.
• Access to information. Provide better access to information concerning decisions that are being made to benefit youth, and where appropriate increase youth consultation and participation in decision-making that directly affects them.
• Risk analysis. Investigate, address, and develop targeted responses to particular risks or fears that preoccupy the youth.
Further considerations• This discussion has generated a compelling case for integrated universal (or generic) models that countries
can adopt to help navigate political and socio-economic development challenges posed by youth bulges. Relegating age structural transitions in developing countries, especially in Sub-Saharan Africa, will no doubt turn the emerging or imminent demographic windows of opportunity to a ‘curse’ rather than ‘gift’ or ‘divi-dend’.
• A comprehensive study on the youth Bulge can assume several dimensions. The UN forecasts that by about 2030, 60% of the world population will live in cities – and as many as 60 percent of urban residents will be under 18. And, if this trend continues, the plight of young people in the cities is likely to be one of the main challenges of the Century. Already, there are myriad and momentous challenges facing the youth in virtually all third world countries, including Sub-Saharan Africa where the bulges are yet to peak. Thus, the youth bulges, as seen from the demographic, socio-economic and even political viewpoints, will provide the main link to population and development issues and concerns. A comprehensive, empirical study is, therefore, advised - on implications of Kenya’s population growth, structure and distribution on socio-economic de-velopment and political reforms.

57Institute of Economic Affairs
ReferencesAdioetomo, S.R, G. Beninguissé, S. Gultiano (2006). policy implications of age-structural changes. In Pool, I.,
L. Wong, & E. Vilquin (Eds). Age structural transitions: Challenges for development (pp. 361 – 376). Paris: Committee for International Cooperation in National Research and Demography (CICRED).
Ajayi, A. & Kekovole, J. (1998). Kenya’s population policy: From apathy to effectiveness. In Jain A. (ed), Do Population Policies Matter: Fertility and Politics in Egypt, India, Kenya and Mexico (pp. 113 – 156). New York: The Population Council.
Blacker J. (1987). Health impact of family planning. Health Policy and Planning, 2 (3): 193 – 203.
Bloom D. and Williamson J.G. (1998). Demographic transitions and economic miracles in emerging Asia. World Bank Economic Review, 12: 419 – 455.
Bloom, D., Canning, D., & Malaney, P. (2000). Population dynamics and economic growth in Asia. Population and Development Review, Supplement 2000; 26: 257 – 290.
Bocquier P., Agwanda A.O.,Khasakhala A. and Owuor S. (2009). Urban integration in Africa: A socio-demographic survey of Nairobi. Dakar: Council for the Development of Social Science Research in Africa (CODESSRIA).
Boserup, E. (1985). Economic and demographic inter-relationships in Sub-Saharan Africa. Population and
Development Review, 11(3): 383 – 397
Caldwell, J.C. (1977). The economic rationality of high fertility: An investigation illustrated with Nigerian data. Population Studies 31(2): 5 – 27.
Caldwell J.C. (1982). Theory of fertility decline. London: New York Academic Press.
Central Bureau of Statistics, Kenya, Ministry of Health, Kenya and ORC Macro. (2004). Kenya Demographic and Health Survey 2003. Nairobi: CBS and Calverton, MD: ORC Macro.
Cinccotta R. (2005). State of the World 2005: Global security brief #2: youth bulge, underemployment raise risks of civil conflict. World Watch Institute.
Cincotta, R.P., Engelman,R. and Anastasion D. (2003). The security demographic: population and civil conflict after the cold war. Washington: Population Action International.
Cleland J., and Wilson, C. (1987). Demand theories of the fertility transition: iconoclastic view. Population Studies, 41:5 – 30.
Coale, A., & Hoover, E. (1958). Population growth and economic development in low-income countries, Princeton, N.J.: Princeton University Press.
Cochrane, S.H. & Farid, S.M. (1989). Fertility in Sub Saharan Africa: Analysis and explanation. World Bank - Discussion Papers, 43. 122 p.
Davis, K. (1963). ‘The Theory of Change and Response in Modern Demographic History.’ Population Index, 29(4): 345 – 366.
Frank, O. & McNicoll, G. (1987). An Interpretation of Fertility and Population Policy in Kenya. Population and Development Review, 13(2): 209 – 243.
Goldstone, J. A. (1991). Revolution and rebellion in the early modern world. Berkeley: University of California Press.
Hammerslough, C. R. (1991). Women’s groups and fertility transition in Kenya. Unpublished
Hammerslough, C. R. (1992). Proximity to contraceptive services and fertility transition in rural Kenya. International Family Planning Perspectives, 18(2): 54 – 58.
Health Policy Initiative. (2009). Rapid kenya, rapid population growth and development. November 2009 Task Order 1. USAID: Health Policy Initiative.

58Youth Research Compendium
International Labour Organisation [ILO]. (2006). Global employment trends for youth. Geneva: International Labour Organisation.
Jimenez, E.J., & M. Murthi. (2006). Investing in the youth bulge. Finance and Development, 43(3).
Kelley A.C. & Nobbe C.E.. (1990). Kenya at the demographic turning point: hypotheses and proposed research agenda. World Bank Discussion Paper No. 107. Washington D.C: The World Bank.
Kenya National Bureau of Statistics (KNBS), Ministry of Public Health, Ministry of Medical Services, National Coordinating Agency for Population and Development and ICF Macro. (2010). Kenya Demographic and Health Survey 2008-9. Nairobi: Calverton, MD: ICF Macro.
Kravdal, O. (2000). ‘A search for aggregate-level effects of education on fertility, using data from Zimbabwe.’ Demographic Research, 3(3): 1-35
Krystall, A. & Schneller, A. (1987). A guide to population activities in Kenya. Nairobi: The Ford Foundation and the National Council for Population and Development.
Lam, D. (2006). The demography of youth in developing countries and its economic implications. World Bank Policy Research. Working Paper 4022. Washington, D.C: The World Bank.
Lindstrom, D.P. & S.G. Saucedo. (2000). The short- and long-term effects of U.S. migration experience on Mexican women’s fertility. Social Forces, 80(4): 1341 – 1368.
Macunovich, D. J. (2000). Relative cohort size: source of a unifying theory of global fertility transition? Population and Development Review, 26(2): 235 – 261.
Ministry of Health. (1997). FP/RH policy guidelines and standards for service providers. Nairobi: Government Printers.
National Research Council. (1993). factors affecting contraceptive use in Sub-Saharan Africa. Washington, D.C: National Academy Press.
National Coordinating Agency for Population and Development. Ministry of Planning and National Development. (2005). adolescent reproductive health and development policy plan of action 2005 – 2015. Nairobi, Kenya.
National Coordinating Agency for Population and Development, Ministry of Health (MOH - Kenya), Central Bureau of Statistics and ORC Macro. (2005). Kenya service provision assessment (KSPA) 2004. Nairobi, Kenya.
National Coordinating Agency for Population and Development. (2010). State of Kenya population, 2008: Tracing the linkages: culture, gender and human rights. Nairobi, Kenya.
National Council for Population and Development. (1989). Kenya Demographic and Health Survey. Nairobi: Ministry of Finance and Planning.
National Council for Population and Development. (1993). Kenya Demographic and Health Survey. Nairobi: Ministry of Finance and Planning.
National Council for Population and Development. (1998). Kenya Demographic and Health Survey. Nairobi: Ministry of Finance and Planning.
National Council for Population and Development. (2000). Family Planning Financial Analysis and Projections for 1995 to 2020. Nairobi: NCPD, Division of Primary Health Care, Ministry of Health, Government of Kenya and the POLICY Project.
National Council for Population and Development. (2003). Family planning achievements and challenges. Nairobi: NCPD, Ministry of National Planning and Development, Division of Reproductive Health, Ministry of Health, Government of Kenya, Family Planning Association of Kenya and The POLICY Project.
NCAPD. (2005). Calling the Nation to Action. Fact sheet distributed at the parliamentary meeting on ‘repositioning

59Institute of Economic Affairs
population and reproductive health for the attainment of national and millennium development goals’, 19 April 2005, Nairobi.
NCAPD. (2006). Workshop of Parliamentary Network on Population and Development to be held on 5–6 May 2006: A summary of initiatives to work with MPs to lobby for support to population and development issues. Nairobi: NCAPD.
Olsen R. (1983). ‘Mortality Rates, Mortality Events and Number of Births.’ American Economic Review, 73: 29 – 32.
Ominde, S.H. (1968). Land and Population Movements in Kenya. Nairobi : Heinemann Publishers.
Oucho, J. O. (1988). Spatial Population Change in Kenya: A District Level Analysis.’ In S.H. Ominde (ed). Kenya’s Population Growth and Development in the year 2000 AD. Nairobi: Heinemann Publishers.
Oucho, J.O. & Odipo G. (2000). Estimation of Internal Migration in Kenya. In Oucho et al (Eds) Population and Development in Kenya: Essays in Honour of SH Ominde.
Palloni A. & Rafalimanana, H. (1999). The Effects of Infant Mortality on Fertility Revised: New Evidence from Latin America. Demography, 36(1): 41-58
Pebley, A. & Milman, S. (1986). Birth Spacing and Child Survival. International Family Planning perspectives, 12(3): 71 – 79.
Pool, I. (2006). Mapping Age-Structural Transitions: A Comparative Perspective. In Pool, I., Wong, L. & Vilquin, E. (Eds). (2006). Age Structural Transitions: Challenges for Development (pp. 21 – 57). Paris: Committee for International Cooperation in National Research and Demography (CICRED).
Pool, I. & Wong L.R. (2006). Age-Structural Transitions and Policy: An Emerging Issue. In Pool, I., Wong, L. & Vilquin, E. (Eds). (2006). Age Structural Transitions: Challenges for Development (pp. 3-19). Paris: Committee for International Cooperation in National Research and Demography (CICRED).
Potts, M. (1997). Sex and Birth Rate: Human Biology, Demographic Change and Access to Fertility-Regulation Methods. Population and Development Review, 23(1): 1 – 39.
Population Reference Bureau. (2009). World Population Data Sheet. Washington, D.C: Population Reference Bureau.
Population Reference Bureau. (2010). Country Summary Population Profiles. Retrieved from www.prb.org
Preston, S.H. (1975). Introduction, Seminar on Infant Mortality in Relation to Level of Fertility. Bangkok, Thailand: CICRED.
Pritchett, L. (1994). Desired Fertility and the Impact of Population Policies. Population and Development Review, 20: 155.
Rempell, H. (1977). An Analysis of Information on Inter-District Migration provided by 1969 Kenya Census. Discussion Paper No 244. Nairobi: Institute of Development Studies, University of Nairobi.
Republic of Kenya. (1965). African Socialism and its Application to Planning in Kenya. Sessional Paper No. 10 of 1965. Nairobi: Government Printers.
Republic of Kenya. (1984). Population Policy Guidelines. Sessional Paper No. 4. Office of the Vice President, Ministry of Home Affairs and National Heritage. Nairobi: Government Printers.
Republic of Kenya. (1986 ). Sessional paper No 1 of 1986, Economic Management for Renewed Growth. Ministry of Planning and Economic Development. Nairobi: Government Printers.
Republic of Kenya. (1991). Family Planning Policy Guidelines and Standards for Service Providers. The Family Planning Programme, Division of Family Health, Ministry of Health. Nairobi: Government Printers.
Republic of Kenya. (2001). Plan of Action to Implement the Sessional Paper No.1 of 2000 on National Population
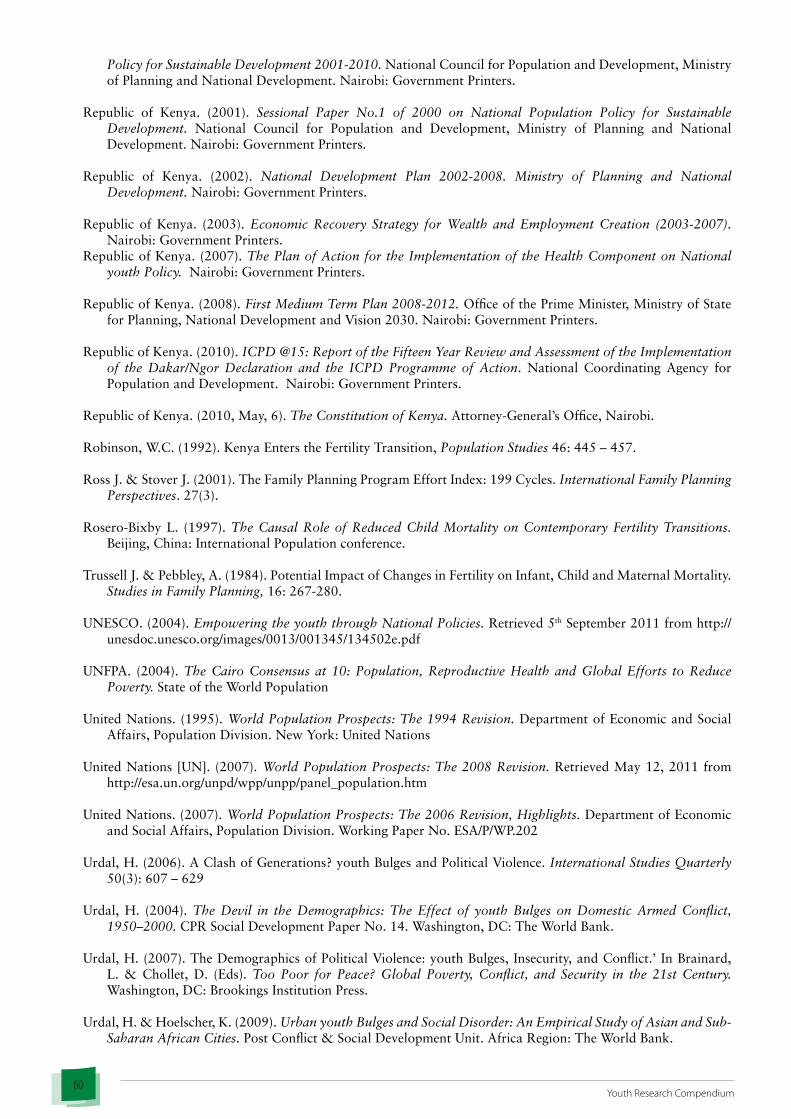
60Youth Research Compendium
Policy for Sustainable Development 2001-2010. National Council for Population and Development, Ministry of Planning and National Development. Nairobi: Government Printers.
Republic of Kenya. (2001). Sessional Paper No.1 of 2000 on National Population Policy for Sustainable Development. National Council for Population and Development, Ministry of Planning and National Development. Nairobi: Government Printers.
Republic of Kenya. (2002). National Development Plan 2002-2008. Ministry of Planning and National Development. Nairobi: Government Printers.
Republic of Kenya. (2003). Economic Recovery Strategy for Wealth and Employment Creation (2003-2007). Nairobi: Government Printers.
Republic of Kenya. (2007). The Plan of Action for the Implementation of the Health Component on National youth Policy. Nairobi: Government Printers.
Republic of Kenya. (2008). First Medium Term Plan 2008-2012. Office of the Prime Minister, Ministry of State for Planning, National Development and Vision 2030. Nairobi: Government Printers.
Republic of Kenya. (2010). ICPD @15: Report of the Fifteen Year Review and Assessment of the Implementation of the Dakar/Ngor Declaration and the ICPD Programme of Action. National Coordinating Agency for Population and Development. Nairobi: Government Printers.
Republic of Kenya. (2010, May, 6). The Constitution of Kenya. Attorney-General’s Office, Nairobi.
Robinson, W.C. (1992). Kenya Enters the Fertility Transition, Population Studies 46: 445 – 457.
Ross J. & Stover J. (2001). The Family Planning Program Effort Index: 199 Cycles. International Family Planning Perspectives. 27(3).
Rosero-Bixby L. (1997). The Causal Role of Reduced Child Mortality on Contemporary Fertility Transitions. Beijing, China: International Population conference.
Trussell J. & Pebbley, A. (1984). Potential Impact of Changes in Fertility on Infant, Child and Maternal Mortality. Studies in Family Planning, 16: 267-280.
UNESCO. (2004). Empowering the youth through National Policies. Retrieved 5th September 2011 from http://unesdoc.unesco.org/images/0013/001345/134502e.pdf
UNFPA. (2004). The Cairo Consensus at 10: Population, Reproductive Health and Global Efforts to Reduce Poverty. State of the World Population
United Nations. (1995). World Population Prospects: The 1994 Revision. Department of Economic and Social Affairs, Population Division. New York: United Nations
United Nations [UN]. (2007). World Population Prospects: The 2008 Revision. Retrieved May 12, 2011 from http://esa.un.org/unpd/wpp/unpp/panel_population.htm
United Nations. (2007). World Population Prospects: The 2006 Revision, Highlights. Department of Economic and Social Affairs, Population Division. Working Paper No. ESA/P/WP.202
Urdal, H. (2006). A Clash of Generations? youth Bulges and Political Violence. International Studies Quarterly 50(3): 607 – 629
Urdal, H. (2004). The Devil in the Demographics: The Effect of youth Bulges on Domestic Armed Conflict, 1950–2000. CPR Social Development Paper No. 14. Washington, DC: The World Bank.
Urdal, H. (2007). The Demographics of Political Violence: youth Bulges, Insecurity, and Conflict.’ In Brainard, L. & Chollet, D. (Eds). Too Poor for Peace? Global Poverty, Conflict, and Security in the 21st Century. Washington, DC: Brookings Institution Press.
Urdal, H. & Hoelscher, K. (2009). Urban youth Bulges and Social Disorder: An Empirical Study of Asian and Sub-Saharan African Cities. Post Conflict & Social Development Unit. Africa Region: The World Bank.

61Institute of Economic Affairs
World Bank. (2007). World Development Report 2007: Development and the Next Generation. Washington, D.C: The World Bank.
Xenos, P. (2003). Demographic Forces Shaping youth Populations in Asian Cities. In Lisa, M. Hanley, B., Ruble, A., Tulchin, J. S. & Varat, D. H. (Eds). youth, Poverty, and Conflict in Southeast Asian Cities. Washington: Woodrow Wilson International Center for Scholars.
Xenos, P. & Kabamalam, M. (2002). A Comparative History of Age structure and Social Transitions among the Asian youth. East-West Center Working Papers: Population Series.
Xenos, P. & Kabamalan, M. (2006). A Comparative History of Age Structure and Social Transitions among Asian youth. In Tuljapulkar, S. Pool, I. & Prachuabmoh, V. (Eds). Population, Resources and Development: Riding the Age Waves (Vol 1). New York: Springer.
Xenos, P. Kabamalan, M. & Westley S.B. (1999). A Look at Asia’s Changing youth Population. Asia Pacific Population Policy. 48: 1 – 4.
62Youth Research Compendium
The Unemployment Casualties3Dr. Jacob Omolo
AbstractThis Chapter looks at the youth employment and unemployment challenge in Kenya. It seeks to put into context the global, regional and national employment challenge and the place of the youth in the employment scenario. It has also highlighted the employment creation policies. Documentation is made of the government’s diagnosis of the nature of the employment problem in Kenya; past employment creation policies and programmes that have been developed by the Kenya government since attaining political independence in 1963, and the youth employ-ment situation in the country. A review of un/employment driving forces among young people is attempted. It starts with a discussion of the youth population growth in Kenya, then undertakes a comparative analysis of the youth employment policies and programmes in other countries. It also draws on lessons learnt for policy and pro-gramme gaps. It finishes with a proposition on the youth employment policy and programme for Kenya, and the attendant legal and institutional framework.

63Institute of Economic Affairs
IntroductionLack of adequate employment opportunities for the youth leads to social problems such as crime, drug abuse, van-dalism, religious fanaticism and general alienation. The exclusion of youth from a productive role in the economy has grim consequences as it perpetuates the vicious circle of poverty. The ills associated with unemployment will persist in the future unless a holistic approach is initiated to alter the employment challenges facing the youth.
The exclusion of youth from a productive role in the economy has grim consequences as it perpetuates the vicious circle of poverty.
A 2009 report by the International Labour Organization (ILO) illustrated that the world unemployment has re-mained almost constant at an average of 6.1 percent over the ten-year period between 1998 and 2008. Globally, the number of youth unemployed increased to 76 million with the youth-adult employment ratio remaining almost constant at 2:8 (ILO, 2009). According to the ILO Report, the rate of unemployment in Sub-Saharan Africa eased marginally from a ten year (1998-2008) average of 8.1 percent to 7.9 percent in 2008, with the youth bearing a relatively large burden of the unemployment.
The situation is not any different in Kenya where the employment challenge has been growing over time with the youth being the main casualties (Republic of Kenya, 2008b; 2008c). At independence in 1963, the Kenya government identified poverty and employment as the twin challenges facing the country. Nearly fifty years later, and despite numerous policy efforts, poverty and inadequate employment opportunities continue to afflict many Kenyans. Millions of Kenyans especially youth and women are unemployed, underemployed or in the swelling ranks of the working poor.
According to the Kenya Integrated Household Budget Survey (KIHBS, 2005/06), 12.7 million out of the 14.6 mil-lion labour force were reported as employed with the remaining 1.9 million people or 12.7 percent of the labour force being openly unemployed. Approximately 67 per cent of the 1.9 million unemployed in the country were the youth (Republic of Kenya, 2008c). In Kenya, youth comprises those people aged 18-35 years (Republic of Kenya, 2010).
A number of policy interventions have been formulated and variously implemented, since independence, to ad-dress the growing employment problem in Kenya. Key among those policies is the growth-oriented development strategy augmented by a high wage1 and Kenyanization2 policies adopted at independence (Republic of Kenya, 1964). The government undertook to engage in direct employment creation, regulate wages, operate employment exchange programmes, improve labour market information systems, and re-orient education and training systems to vocational and technical training areas as a means of promoting employment creation.
Other measures implemented in the 1960s and 1970s to address the country’s employment problem included pro-motion of growth and development of the informal and jua kali sector, adoption of fiscal policies, and short-term measures such as tripartite agreements entered into between government, employers and workers (Republic of Kenya, 1969; 1973). The tripartite agreements, which were entered into in 1964, 1970 and 1979 aimed at increas-ing employment levels by at least 10 percent. This was conditioned on workers and their trade unions observing a wage freeze besides refraining from any industrial action during the period of the agreement.
In the 1990s and early 2000s, government employment interventions targeted enhancing the acquisition and promotion of efficient use of labour market information, reliance on market forces to mobilize resources for sus-tained growth, provision of public infrastructure, industrialization, enhancement of private sector investment and participation in the economy, promotion of industrial harmony and productivity and liberalization of the labour market (Republic of Kenya, 1994a; 1994b; 1997a; 1997b; 1999; 2002). In 2003, the government of the National Rainbow Coalition (NARC) formulated a five-year development strategy dubbed Economic Recovery Strategy for
1 High wage policy – wages generally set at high levels in order to induce productivity. 2 Kenyanization – deliberate effort to integrate Kenyans into mainstream economic activities – both in public and private
sectors of economy. At independence the government envisioned that most activities would be carried out by Kenyans.

64Youth Research Compendium
Wealth and Employment Creation (ERSWEC), 2003-2007 (Republic of Kenya, 2003a). This strategy put a case for empowerment of the people through creation of employment and other income earning opportunities.
Despite all these interventions, creation of adequate, productive and sustainable employment opportunities contin-ue to be the greatest challenge in Kenya. The youth employment challenge has, particularly, been aptly recognized in the country’s long-term development blueprint: Vision 2030, the Medium Term Plan (2008-2012), and Labour, Youth and Human Resource Development Sector Plan (2008-2012). Experience shows that the longer people stay out of work, the more their “employability” deteriorates, making it progressively harder for them to gain employ-ment. This is especially worrying for the youth who may get trapped into a lifetime of weak attachment to the labour market alternating between low paid insecure work and open unemployment. Thus, the need to promote youth employment in Kenya cannot be gainsaid.
Nature of the Employment Problem in KenyaFor more than four and a half decades now, the Kenya government has continuously articulated the need to create sufficient employment opportunities to absorb the country’s growing labour force. Unemployment and underem-ployment have been identified as Kenya’s most difficult and persistent problems (Republic of Kenya, 1969; 1983; 2008b; 2008c). One of the earliest attempts to identify the nature and causes of unemployment in Kenya was made in the 1970-74 Development Plan (Republic of Kenya, 1969). In this Plan, the government identified four “kinds” of unemployment namely: urban unemployed, rural unemployed, educated unemployed and underemployed. The causes of such unemployment were given as high labour force growth, use of modern capital-intensive technology and attendant increase in labour productivity, and high wages and salaries, which triggered adoption of labour-saving techniques of production. According to the Plan, the identified causes of Kenya’s unemployment were linked to inadequate training and consequent lack of skills, shortage of land and other resources, rapid expansion in school enrolments, skills mis-match, and rural-urban migration.
Another stab towards understanding the nature and causes of unemployment in Kenya was made in 1983 in the Report of the Presidential Committee on Unemployment (1982/83) (Republic of Kenya, 1983) and the Sessional Paper No. 2 of 1985 on Unemployment (Republic of Kenya, 1985) which provided the government’s official re-sponse to the Committee’s Report. The Committee, in its Report, considered the problem of unemployment as one of lack of access to income earning opportunities, whether in wage or self-employment. Both the Report and the Sessional Paper identified the major causes of unemployment in Kenya as rapid growth of the labour force, low economic growth rate, job selectiveness, seasonality of some of the industries, and skills imbalance. Others were inappropriate technology and failure of development programmes to focus on areas with greater employment potential.
The latest government policy document, The Sector Plan for Labour, Youth and Human Resource Development Sector (2008-2012) contends that unemployment in Kenya is both structural and frictional in nature. According to the Plan, Kenya’s unemployment is mainly attributed to the slow growth and weak labour absorptive capacity of the economy, mismatch in skills development and demand, imperfect information flow and inherent rigidities within the country’s labour market (Republic of Kenya, 2008c).
The implication of all these is that without re-orientation of education and training in the country to respond to the needs of industry at the national, regional and global levels; the matching of school expansion with employ-ment absorptive capacity of the economy; improving productivity of land and other factors of production; and overall, rethinking the youth employment strategy, the youth employment problem would continue to be a chal-lenge in Kenya.
Employment Creation Policies and Programmes in Kenya: A HistoryEmployment creation policies in Kenya have been seen as part and parcel of the basic policies for economic growth and development (ILO, 1995; Republic of Kenya, 1964). The underlying premise, in this case, has been that faster economic growth would lead to employment creation and that income generation through employment would

65Institute of Economic Affairs
lead to improvement in the standards of living and eradication of poverty. Table 14 gives a summary of the focus of employment creation policies and programmes that have been formulated by Kenya since independence.
Table 14: Kenya’s employment creation policies and programmes (1964-2011)
Employment Creation Interventions Period1963-1979 1980-1989 1990-2011
Kenyanization √ × ×Tripartite Agreements √ × ×Wage Restraint √ √ √Economic Growth √ √ √Macroeconomic Management × √ √Fiscal Measures √ × √Industrial Policy √ √ √Agricultural Promotion √ √ √Infrastructure Development √ × √Public Works √ √ √Education and Training √ √ √Active Labour Market Policies √ √ √Informal Sector Development √ √ √Productivity Promotion √ √ √Rural Development × √ √Employment and Labour Market Policies √ √ √Legal and Legislative Reforms × × √
Source: Government policy documents (various)
The summaries in Table 14 show that the main focus of the Kenya government since independence has been attain-ment of rapid economic growth as an avenue for employment creation. Within this context, long-term measures such as management of macroeconomic fundamentals such as savings, investments, incomes and population have been pursued to facilitate job creation. At the same time, medium and short-term measures have also been imple-mented to create jobs on a more intermediate basis. Some of the measures that have also permeated through the country’s employment creation regimes are the public works and skills upgrading programmes.
As of 2011, the government is implementing numerous public works programmes. One such programme is the Kazi Kwa Vijana (KKV) programme, which was launched in March 2009. The objective of the KKV programme was to facilitate income earning opportunities amongst the youth. The KKV programme encompasses many proj-ects, each running between 3–6 months. These projects include: trees for Jobs; rehabilitation of irrigation schemes; and the Nairobi River Basin rehabilitation and restoration.
Public works programmes similar to the KKV initiative have been used extensively in developing countries as a social safety net and short-medium term means of employment creation. As reported in Martin (2003), one of the most ambitious of such programmes is India’s National Employment Assurance Scheme (NEAS). This programme seeks to give employment to a maximum of two adults per family, assuring unskilled manual work for 100 days during the agricultural off-season, and concentrating on drought-prone, desert, tribal and flood-prone areas. An-other large-scale public works programme is operated by the Social Fund for Development (SFD) in Egypt, with projects covering productive infrastructure (irrigation, drainage, protection of agricultural land), economic infra-structure (roads, channels), social infrastructure (public building restoration, potable water provision) and health and education. Non-Governmental Organizations (NGOs) are involved in managing and the private sector in implementing the programme’s construction and maintenance activities. A minimum of 25 percent of a project’s budget has to be spent on labour, and at least half of the workers should be locally recruited. Salaries are no higher than in local labour markets.
Kenya’s KKV is a fairly recent initiative. However, a preliminary review of the KKV shows that it is not as effective as anticipated. A review of the KKV programme against some of the identified features of effective public works

66Youth Research Compendium
programme based on international experiences shows some gaps. A Youth Employment Inventory (YEI) of 289 countries undertaken by Betcherman, et al. (2007) and Puerto (2007), for example, highlights some of the impor-tant features of an effective public works programme.
According to the inventory, an effective public works programme should: offer/pay a sufficient wage rate; target the poorest households especially when employment cannot be provided to all who require jobs; help create assets that benefit the poor; and create economic opportunities for locals such as to supply non-wage inputs. Others are that such programmes should: have work schedules that are harmonized with the survival requirements and cop-ing strategies of the poorest households; be located close to where the poorest live to maximize their participation; and have an exit strategy to allow long term employment opportunities to enable the poorest to lift themselves out of poverty.
The KKV programme uses low wage rates as self-targeting criteria for the youth. However, care should be taken not to set the wages at very low levels to violate the existing minimum wage legislations, encourage exploitation of the youth, trigger erosion of the social protection objective of the programme and impose unintended harmful impacts to the youth and their families. At the same time, the wages should not be set at very high levels to create distortions in the labour market, encourage ineffective targeting of the youth and corrupt practices. In addition, the KKV programme, as presently structured, does not effectively target the youth from the poorest households. It merely employs the principle of “first come first served” to enlist beneficiaries.
Care should be taken not to set the KKV programme wages at very low levels to violate the existing minimum wage legislations, encourage exploitation of the youth and trigger erosion of the social protection objective of the programme
Most of the KKV activities last for up to 3 months only. Given the short term nature of the KKV projects, they may offer an appropriate response to temporary shocks but may fail to address long term development needs. Public works projects with short durations may not effectively tackle youth employment challenge. They can only act as a stop gap measure to cyclical unemployment and address youth school to work transition but may not lift its beneficiaries out of unemployment. Malawi, for example, implements the Central Region Infrastructure Mainte-nance Programme (CRIMP). This programme suggests that 18 months is the minimum duration required to begin addressing youth unemployment and chronic poverty.
Public works projects with short durations may not effectively tackle youth employment challenge. They can only act as a stop gap measure to cyclical unemployment and address youth school to work transition but may not lift its beneficiaries out of unemployment.
A relatively long duration allows participants to build up assets and later concentrate efforts in income generation activities. International experiences also show that the KKV programme can have greater impact on youth employ-ment if the programme is made to be of a longer duration in addition to meeting the other conditions of an effec-tive public works project. Some of the projects within the KKV programme such as the Nairobi River Basin Reha-bilitation and Restoration, Routine Maintenance of Road projects, and Trees for Jobs have wide scope for creating permanent jobs since the services are required on a continual basis. This contention is supported by the fact that the Ministry of Youth Affairs and Sports (MOYAS) has entrenched Trees for Jobs as one of their flagship projects for long term implementation under the Vision 2030. At the same time, the KKV programme require an effective exit strategy to protect its beneficiaries that have attained the “cut-off age” from shifting back to unemployment. In this respect, skills’ training is a priority intervention that needs to be integrated in the KKV programme.
The Kenya government has, over the period, operated the National Youth Service (NYS) as an avenue for acquisi-tion of practical life and employment skills by the youth. The NYS, having been established in 1964, has over the years equipped the youth with life skills through Technical and Vocational Training (TVT). It also offers para-military training to youth aged between 18 and 22 years. The unit is fully recognized as a military reserve for the nation (Republic of Kenya, 2008c). Up to late 1980s, the NYS had a compulsory pre-university programme. This programme targeted successful graduates of the Kenya Advanced Certificate of Education (KACE) for a six-month

67Institute of Economic Affairs
pre-university training. The goal was to inculcate into the freshers the right attitude towards work and imbue a culture of tolerance and nationalism in them. This programme was, however, discontinued in 1990 probably due to its limited impact and sustainability challenges. Since then, the NYS training has been voluntary in nature with market driven orientation.
Working Age Population and Labour Force Participation Rates in KenyaThe working age population and labour force participation rates are important determinants of employment. In Kenya the working age population includes persons between 15 and 64 years. Table 15 shows the distribution of Kenya’s population aged 15-64 years by activity status for the years 1998/99 and 2005/20006.
Table 15: Distribution of Working Age Population, 1998/99 and 2005/06Age Cohort
Employed Unemployed Inactive* Total
1998/99 2005/06 1998/99 2005/06 1998/99 2005/06 1998/99 2005/0615-19 843,909 1,056,015 270,217 352,357 2,349,270 3,210,685 3,463,396 4,619,057
20-24 1,435,405 1,895,834 533,078 605,167 485,067 992,053 2,453,550 3,493,054
25-29 1,584,271 2,088,468 291,679 388,747 165,931 335,359 2,041,881 2,812,574
30-34 1,541,604 1,897,206 185,927 154,360 94,668 169,153 1,822,199 2,221,097
35-39 1,533,196 1,497,662 140,147 122,725 91,739 101,214 1,765,082 1,721,601
40-44 1,128,190 1,357,371 113,165 92,262 68,964 91,978 1,310,319 1,541,611
45-49 992,261 1,070,783 88,596 64,636 67,260 81,760 1,148,117 1,217,179
50-54 702,199 787,417 66,839 38,666 82,769 95,607 851,807 921,69055-59 412,639 624,308 64,235 26,350 87,107 91,389 563,981 742,047
60-64 351,936 432,972 46,739 11,024 106,457 96,536 505,132 540,532
Total 10,525,609 12,708,035 1,800,623 1,856,294 3,599,231 5,266,112 15,925,463 19,830,441
Source: Republic of Kenya (2003b; 2008a)
Table 15 illustrates that the country’s working-age population increased from 15.9 million persons in 1989/99 to 19.8 million persons in 2005/2006. The largest rise in the working-age population over the period was recorded among the youth cohort of 15-30 years. The data presented in Table 15 also reveals that an increasing proportion of the country’s working age population is inactive. In this context, inactive labour consists of all those persons within the working age who are outside the labour market. Inactivity may be voluntary (persons who prefer to stay at home or still in school/college) or involuntary (prefer to work but discouraged and give up searching for jobs).
Table 15 illustrates that the proportion of the inactive labour to the working age population increased from 22.6 percent in 1998/99 to 26.6 percent in 2005/2006. The data presented shows that majority of the inactive popu-lation were between the age of 15 to 19 years. At the same time, Kenya’s labour market participants (employed and unemployed) increased from 12.3 million persons in 1998/1999 to 14.6 million persons in 2005/2006. This represents a 18.2 percent increase over the period. The table also shows that by 2006, about 14 million Kenyans were participating in the labour force with 12.7 million employed and 1.85 million being unemployed.
Table 16 gives a summary of labour force participation rates for different working age cohorts over the period 1998/1999 and 2005/2006.
Table 16: Labour Force Participation Rates, 1998/99 and 2005/2006 (Percent)
Age Cohort 1998/99 2005/06
Male Female Total Male Female Total
15 – 19 28.1 30.5 29.3 30 30 30
20 – 24 66.6 69.8 68.3 73 68 70

68Youth Research Compendium
25 – 29 91.5 87.7 89.4 93 82 87
30 – 34 96.6 91.6 94.1 97 86 91
35 – 39 97.4 92.3 94.8 98 90 94
40 – 44 97.5 92.9 95.2 98 90 94
45 – 49 95.6 90.7 93.4 96 89 92
50 – 54 94 86.9 90.3 93 85 89
55 – 59 87.8 82.5 85.1 92 82 87
60 – 64 85 77.4 80.9 89 76 82
Average 74.7 72.6 73.6 76 70 73
Source: Republic of Kenya (2003b; 2008a)
The data given in Table 16 shows that labour force participation rates for the youth aged 15-24 years increased, albeit marginally while for the participation rates for the other age cohorts (25 to 54) declined. Over the period, the female labour force participation rates edged downwards for all the age groups with the highest being among the youth cohorts of 25-29 and 30-34, which declined by nearly 6 percent. Overall, females had a lower labour force participation rates than males in both periods.
Employment Trends in KenyaTable 17 gives a summary of the formal and informal sector employment in Kenya over the period 1986-2008.
Table 17: Trends of Employment in Kenya (1986-2008)
Year Total Employment(Millions)
Proportion of Total (percent) Employment Growth (percent)
Formal Informal Formal Informal1986 1.537 79.4 20.6 4.00 9.721987 1.615 78.3 21.7 3.60 10.761988 1.736 77.5 22.5 6.40 11.431989 1.796 76.2 23.8 1.63 9.741990 1.894 74.4 25.6 3.07 13.081991 2.557 56.4 43.6 2.27 130.371992 2.753 53.1 46.9 1.39 15.781993 2.998 49.2 50.8 0.96 17.891994 3.356 44.9 55.1 2.03 21.551995 3.859 40.3 59.7 3.39 24.431996 4.314 37.3 62.7 3.21 17.591997 4.707 34.9 65.1 2.22 13.201998 5.100 32.9 67.1 2.17 11.661999 5.493 30.7 69.3 0.63 11.182000 5.912 28.7 71.3 0.36 10.862001 6.367 26.3 73.7 -1.06 11.222002 6.852 24.8 75.2 1.37 9.852003 7.330 23.6 76.4 1.65 8.732004 7.999 22.1 77.9 2.14 11.282005 8.505 21.3 78.7 2.66 7.362006 8.993 20.7 79.3 2.54 6.602007 9.479 20.1 79.9 2.80 6.082008 9.946 19.5 80.5 1.78 5.72
Source: Republic of Kenya, various Economic Surveys
Figure 14 schematizes the changing importance of the formal sector to total employment in Kenya over the period 1972-2008.
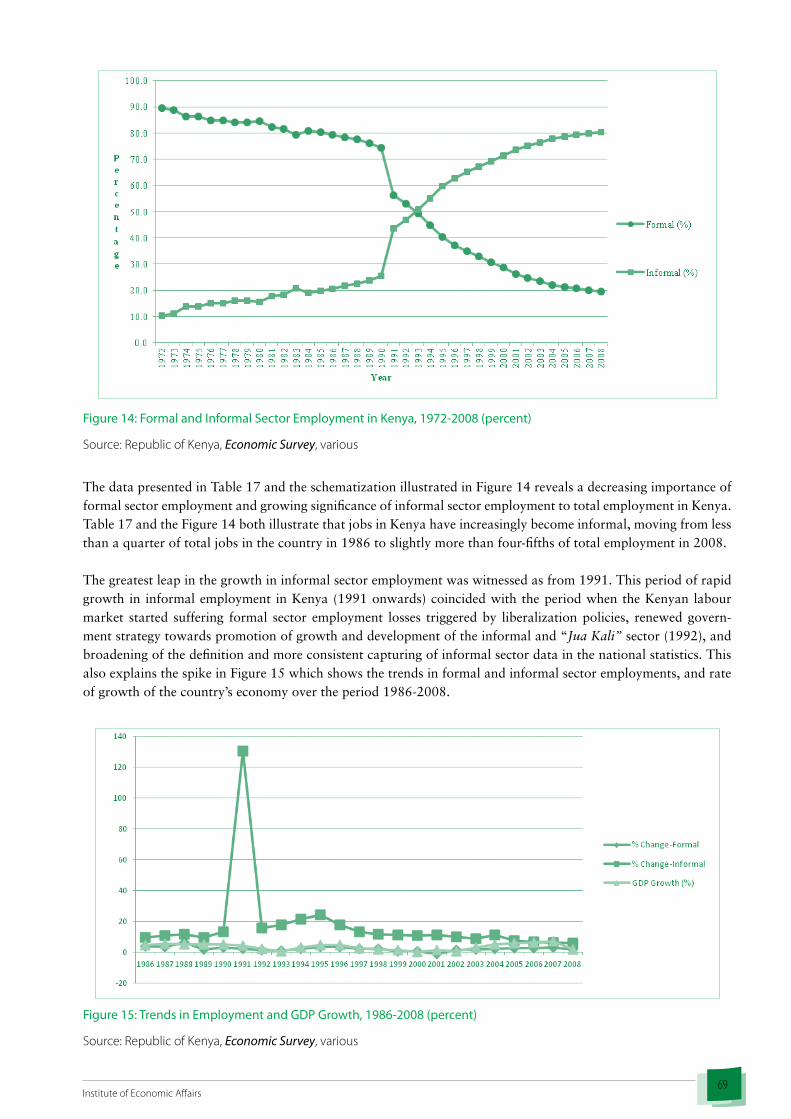
69Institute of Economic Affairs
Figure 14: Formal and Informal Sector Employment in Kenya, 1972-2008 (percent)
Source: Republic of Kenya, Economic Survey, various
The data presented in Table 17 and the schematization illustrated in Figure 14 reveals a decreasing importance of formal sector employment and growing significance of informal sector employment to total employment in Kenya. Table 17 and the Figure 14 both illustrate that jobs in Kenya have increasingly become informal, moving from less than a quarter of total jobs in the country in 1986 to slightly more than four-fifths of total employment in 2008.
The greatest leap in the growth in informal sector employment was witnessed as from 1991. This period of rapid growth in informal employment in Kenya (1991 onwards) coincided with the period when the Kenyan labour market started suffering formal sector employment losses triggered by liberalization policies, renewed govern-ment strategy towards promotion of growth and development of the informal and “Jua Kali” sector (1992), and broadening of the definition and more consistent capturing of informal sector data in the national statistics. This also explains the spike in Figure 15 which shows the trends in formal and informal sector employments, and rate of growth of the country’s economy over the period 1986-2008.
Figure 15: Trends in Employment and GDP Growth, 1986-2008 (percent)
Source: Republic of Kenya, Economic Survey, various

70Youth Research Compendium
The trends in formal and informal sector employment depicted in Table 17 and Figures 14 and 15 show that the employment creation interventions implemented by the country facilitated growth in informal sector employment more than it did to formal sector jobs. Over time, the rate of growth in formal sector employment in Kenya has been low averaging 2.23 percent per annum compared to 17.22 percent per annum for the informal sector. During the period under analysis (1986-2008), the country’s economy grew at an average rate of 3.52 percent.
Even though no reliable statistics are available on the dynamics of the jobs, it may as well be true that much of the informal sector jobs may have been accounted for by relocation or switching of workers from formal to informal sectors of the economy due to the negative effects of Structural Adjustment Programmes (SAPs), which were imple-mented in the 1980s; liberalization policies, which were deepened in 1990s; and increased globalization. Figure 15 also reveals that while informal sector employment grew rapidly, growth in formal sector employment was sub-dued and mirrored the dismal performance of the economy over the period. This does not, however, provide suc-cinct information on the causal relationship between the rate of growth of the economy and employment in Kenya.
It is clear that the Kenyan labour market is dual in nature: presenting the formal sector alongside the informal sec-tor. The trends and dynamics of employment in Kenya discussed above shows that majority of the jobs are created in the informal sector. However, the informal sector jobs are precarious in nature as characterized by job insecurity, poor wages and terms and conditions of employment, lack of social protection, weak safety and health standards, and low job tenure. Even though informal sector employment has been a key driver to reducing unemployment in Kenya, informality remains a major productivity trap. Thus, without strategic interventions to formalize and improve the informal sector jobs, the sector cannot be relied on to effectively address the country’s youth employ-ment problem and poverty reduction goals.
Employment-Population Ratio for KenyaEmployment-population ratio is one of the indicators used to assess the ability of an economy to create em-ployment. It is defined as the proportion of a country’s working age population (15+) that is employed. A high employment-population ratio means that a large section of the country’s population is employed, while a low ratio means that a large proportion of the population is not involved directly in market related activities. Such a scenario could be because the section of the population that is not engaged is either unemployed or out of the labour force altogether.
Table 18 gives a comparative analysis of Kenya’s employment-population ratio by labour force, sex and youth cohorts over the period 2000-2008.
Table 18: Employment-Population Ratio for Kenya (2000-2008)
Indicator/Year 2000 2001 2002 2003 2004 2005 2006 2007 2008Working Age 73.2 73.1 72.9 72.8 72.7 72.8 72.9 72.9 73.0Males 79.2 78.9 78.8 78.6 78.6 78.6 78.8 78.7 78.7Females 67.4 67.3 67.1 67.0 67.0 67.0 67.2 67.2 67.3Youth 61.1 60.5 60.0 59.6 59.3 59.2 59.2 58.8 58.7
Source: International Labour Organization (2009)
Table 18 shows that while the employment-population ratio for Kenya remained almost constant at 73 percent over the nine-year period between 2000 and 2008, the ratio exhibited marginal declines between 2000 and 2004, before increasing dismally to reach 73 percent in 2008. During the period 2004-2008, the global employment-population ratio averaged 60 percent while that of Sub-Saharan Africa (SSA) was 65 percent (ILO, 2009). Table 18 also reveals that the employment-population ratio has been higher for males than for females, while the youth have continued to bear the greatest brunt of the employment problem.
The implication of Kenya’s employment-population ratio is that even though the Kenyan economy may have real-ized net employment creation (after taking into account the new jobs and lost jobs over time), the rate at which the net jobs were created was not the same as the rate of labour force growth. This effectively meant that more job seekers, both the new labour market entrants and those out of employment through the various labour sepa-

71Institute of Economic Affairs
ration mechanisms, ordinarily remained out of employment for a longer period hence swelling the ranks of the discouraged job seekers. The other implication for Kenya as may be derived from the table is that there continues to be disproportionate participation of men and women, and the youth in the country’s economic activities. These negative differences in access to employment opportunities by women and the youth are reflections of decent work deficits in the country.
Youth Employment in KenyaThe employment challenge in Kenya has grown over time. As illustrated in Table 19, the level of unemploy-ment in Kenya increased from 6.7 percent in 1978 to 25.1 percent in 1998/1999 before easing to 12.7 percent in 2005/2006. Table 19 also reveals considerable variations in unemployment amongst the different age cohorts, with the youth category recording relatively higher rates of unemployment.
Table 19: Unemployment Rates in Kenya, 1978- 2005/06 (Percent)
Age Cohort 1978 1986 1998/99 2005/0615 – 19 26.6 36.2 47 2520 – 24 18.5 29.2 47.3 24.2
25 – 29 4.8 8.6 25.1 15.7
30 – 34 2 2.7 14.3 7.5
35 – 39 1.8 2.1 12 7.6
40 – 44 0.7 0.7 11.2 6.4
45 – 49 1.1 2 14.7 5.7
50 – 54 1.4 0.9 18.9 4.7
55 – 59 1.5 4.1 40.6 4
60 – 64 3.2 45.2 2.5
Total 6.7 9.7 25.1 12.7Republic of Kenya, Statistical Abstract, various
Figure 16 gives a graphical presentation of the open unemployment rates amongst the youth cohorts of 15-19; 20–24; 25-29; and 30-34 years, and compares this trend with the total unemployment rates over time.
Figure 16 : Youth Unemployment in Kenya by Age Cohorts (1978-2006*)
Source: Republic of Kenya, Statistical Abstract, various*Years included as per data availableTable 19 and Figure 16 demonstrate the variation of unemployment trends of youth cohorts, with youth un-

72Youth Research Compendium
employment rate being relatively higher than the total unemployment rate. Table 19 shows that in 1998/99, for example, the unemployment rate among the youth categories was 47 percent (15–19 years); 47.3 percent (20–24 years); 25.1 percent (25–29 years); and 14.3 percent (30-34 years). Even though the unemployment rate in the economy eased in 2005/2006, the youth unemployment levels were still comparatively high at 25 percent (15–19 years), 24.2 percent (20–24 years), 15.7 percent (25–29 years) and 7.5 percent (30-34 years).
The trends support the assertion by Coenjaerts, et al. (2009) that young people face specific challenges in access-ing the labour market and this lowers their chances of finding decent employment. According to the authors, the youth face three main difficulties in employment. These are higher chances of losing their jobs during economic downturns under the last-in-first-out approach to staff reduction; barriers to entry arising from lack of or inad-equate work experience; and path dependence, which dictates that early unemployment increases the likelihood of subsequent unemployment.
Gender disaggregated data on unemployment presented in Table 20 shows relatively high unemployment rates for females compared to males. This is the case for all age groups.
Table 20: Unemployment Rates in Kenya by Age Group and Gender (percent)
1998/99 2005/06*
Age (years) Total Males Females Total Males Females15 – 19 24.3 21.8 26.4 19 19.2 18.8
20 – 24 27.1 19 33.9 32.6 31.1 33.8
25 – 29 15.5 8.2 21.6 20.9 20.2 21.5
30 – 34 10.8 4.8 16.8 8.3 8.1 8.5
35 – 39 8.4 5 11.8 6.6 6.6 6.6
40 – 44 9.1 7.8 10.6 5 5.6 4.5
45 – 49 8.2 4.9 12.5 3.5 3.5 3.5
50 – 54 8.7 6.3 11.1 2.1 2.6 1.7
55 – 59 13.5 14.2 12.7 1.4 2 0.9
60 – 64 11.7 7.5 15.7 0.6 1.1 0.2
Total 14.6 9.8 19.3 12.7 11.2 14.3Source: Republic of Kenya, Statistical Abstract, various* Data not available in intervening years between 1998/99-2005/6
The data summarized in Table 20 shows that overall, the unemployment rates for women eased from 19.3 percent in 1998/99 to 14.3 percent in 2005/2006. However, the male unemployment increased by 1.4 percentage points from 9.8 percent in 1998/99 to 11.2 percent in 2005/2006. The UNDP (2010) citing an ILO Report of 2005 ar-gued that female unemployment rates are underestimated in many countries, including Kenya. According to the ILO, the underestimation is attributed to the fact that: women are disproportionately engaged in unpaid work in the home and hence not counted as unemployed; women are more likely to be discouraged to actively search for a job; official unemployment rates mask the reality that women are in the informal sector (ILO 2005 in UNDP 2010).
Female unemployment rates are underestimated in many countries, including Kenya.
As already discussed, there are youth and gender related inequities in access to employment opportunities in Kenya (Tables 16 and 20). Equality in access to employment opportunities, including pay, is a key component of decent work. Consideration of gender issues in development has been identified as the greatest good by many countries (Hafkin, 2002). This is because gender disparities create inefficiencies, hamper growth and lower the potential well being of a society. Accumulated empirical evidence demonstrates the centrality of gender equality for equitable economic growth and poverty reduction.

73Institute of Economic Affairs
Women’s participation in formal sector employmentTable 21 gives a summary of the level of participation of women in formal sector employment in Kenya.
Table 21: Wage Employment in Formal Sector by Gender, 1995 – 2008 (000s)
Year Women Men Total Women (%)1993 341.0 1,133.9 1,474.9 23.11994 347.6 1,156.8 1,504.4 23.11995 407.8 1149.2 1157.0 26.21996 461.3 1157.5 1618.8 28.51997 473.4 1174.0 1647.4 28.71998 487.1 1177.8 1664.9 29.31999 490.5 1183.1 1673.6 29.32000 500.6 1194.8 1695.4 29.52001 496.7 1180.4 1677.1 29.62002 503.4 1196.3 1699.7 29.62003 511.2 1216.1 1727.3 29.62004 521.3 1242.4 1763.7 29.62005 532.3 1275.4 1807.7 29.42006 562.7 1297.0 1859.7 30.32007 575.5 1334.3 1909.8 30.12008 586.8 1356.7 1943.5 30.2
Source: Republic of Kenya: Economic Survey, various
Table 21 shows that the proportion of women employed in the formal sector increased marginally from 26.2 percent in 1995 to 29.5 percent in 2000, depicting a 3.3 percentage point increase over the five-year period. The proportion of women in formal sector employment remained constant at 29.6 percent in the period 2001-2004 but declined to 29.4 percent in 2005. It then increased marginally to average 30.2 percent over the 2006-2008 period.
Trends exhibited in Table 21 show that even though there were some gains in employment during the period, the opportunities were not accessed by women and men equally as would be expected under the decent work frame-work. The negative impact of such inequity in employment is worsened by the fact that on average, men earn more than women. Results of the 1998/99 Integrated Labour Force Survey (ILFS), for example, showed that the mean monthly earnings from paid employment for males is about 1.5 times that of females (Republic of Kenya, 2005).
Mean monthly earnings from paid employment for males is about 1.5 times that of females
Increased Casual Labour EmploymentAnalysis of the employment data for Kenya shows, an increasing trend in the engagement of workers on casual terms of employment. The data shows that the proportion of casual workers in the formal sector gradually in-creased from 17.9 percent in 2000 to 21.2 percent in 2005, 29.7 percent in 2006 and 32.2 percent in 2008 (Re-public of Kenya: Economic Survey, various). The increase in formal sector employment between 2002 and 2003, for example, was wholly attributed to the increase in the number of casual workers.
There’s an increasing trend of hiring casual workers in formal sector. In 2008, proportion of casual labourers in formal employment was 32.2 percent.
While the number of workers on regular terms remained constant at 1,381.1 thousands in 2002 and 2003, the number of casual employees increased by some 27.6 thousands, out of whom about 32 percent were women. In 2008, there were 625.6 thousand workers on casual terms out of whom, 36.6 percent were women. The relatively high unemployment levels amongst the youth and particularly the women, also suggests their disproportionate share in precarious employment.

74Youth Research Compendium
It is noted that most employers in Kenya, including the public sector have resorted to the increasing use of ca-sual, temporary, part-time, contract, sub-contracted and outsourced workforces to ostensibly reduce labour costs, achieve more flexibility in management and exert greater levels of control over labour. This trend allows the de-politicization of hiring and firing that makes it easier for companies to avoid labour legislation and the rights won by trade unions. The trend is mainly attributed to the drive for global competitiveness and weak enforcement of labour legislations, with the youth bearing the brunt of such trends.
Most employers in Kenya, including the public sector have resorted to the increasing use of casual, temporary, part-time, contract, sub-contracted and outsourced workforces
The nature of employment of casual workers, for example, does not facilitate their enjoyment of the fundamental rights of workers such as freedom of association and collective bargaining, right to paid leave (sick, maternity and annual leave), and the right to social protection as provided under the National Social Security Fund (NSSF) and the National Hospital Insurance Fund (NHIF). This revelation contrasts sharply with the country’s desire to reduce poverty and enhance social protection.
The nature of employment of casual workers, does not facilitate their enjoyment of the fundamental rights of workers such as freedom of association and collective bargaining
Overall, the casual relationships between employers and workers have impaired labour relations, eroded worker protection and transferred additional responsibilities, such as social and trade union protection, job security, and wage negotiations to the worker. This leads to lack of motivation and increases shirking, which decreases effort. This could partly explain the persistently low levels of labour productivity, low enterprise competitiveness and the slow economic growth rates in Kenya.
Un/Employment Driving ForcesKenya’s youth are faced with several employment challenges. The youth constitute more than 67 per cent of the unemployed in Kenya. The high unemployment rate amongst the youth has variously been attributed to low absorptive capacity of the economy, weak implementation and coordination of youth targeted employment in-terventions, lack of appropriate skills, and job selectiveness (Republic of Kenya, 2008b; 2008c). It has often been argued that youth bulges are likely to experience unemployment because of their ability to substantially increase the supply of labour at the entry node of the labour market.
Youth unemployment is believed to cause grievances both in the labour market and within the social and political setups of a country, particularly if youth expectations are raised through expansion in education. Education not only increases the value of a person’s labour but also raises the person’s expectations of a relatively high income. This means that the educated youth experience a greater gap between expectations and actual income when they face unemployment.
The youth employment challenge in Kenya is conceived as a complex function of weak employment policy frame-work, lack of employability, weak entrepreneurship culture and unequal opportunities. Others are inadequate involvement of the youth in policy formulation and implementation, child labour and migration as discussed hereunder:
Lack of EmployabilityOne of the key challenges facing the Kenyan youth is lack of appropriate education, relevant training and the knowledge and skills required to enhance their absorption into the labour market. At the same time, there are too many unproductive and precarious jobs offering poor terms and conditions of employment in the country. As reported in UNDP (2010), the United Nations Educational, Scientific and Cultural Organization (UNESCO) argues that too many students are graduating from schools without mastering a set of minimum skills. This means that the focus of education by most countries is on access to education with disproportionate attention to quality. This state of affairs projects negatively on the employability of the graduands.

75Institute of Economic Affairs
In practice, there are many complex structural and frictional constraints related with lack of employability. Most employers in Kenya, for example, insist on looking for “experienced workers” while the youth, expectedly, lack the required work experience. Majority of employers in both private and public sectors of the economy mostly define experience in terms of the number of years spent in previous employment. They also put past experience as a minimum qualification requirement for most jobs.
However, Kenya lacks a framework for industrial attachment and an apprenticeship system to enable trainees or fresh graduates from various levels of education and training to acquire practical skills necessary for the work en-vironment. Consequently, new labour force entrants lack the required practical experience to undertake assigned tasks, necessitating re-training with its attendant incremental costs. The lack of practical skills by majority of the youthful job seekers aggravates the unemployment situation by adding to the pool of ‘educated’ unemployed.
Kenya lacks a framework for industrial attachment and apprenticeship to enable trainees or fresh graduates from various levels of education acquire practical skills necessary for the work environment.
Even though the Directorate of Industrial Training (DIT) is mandated with streamlining industrial attachment in the country, the institution is faced with operational rigidities and inefficiencies. Notwithstanding the fact that most education and training institutions have put industrial attachment as part of completion requirements for their programmes, the attachment programme is not coordinated and integrated into the entire education and training curricula. This leaves room for haphazard implementation of the industrial attachment by the training providers and the attaching institutions.
Limited number of places for industrial attachment is the other problem that undermines the effectiveness of the industrial attachment programme. This is mainly attributed to reluctance by majority of employers to offer attach-ment places to the trainees. Most employers are unwilling to accept trainees for industrial attachment due to its likely costs, particularly in relation to insurance cover for workplace accidents and diseases, medical costs, slow down in work, and breakdown in machinery and equipment due to poor handling.
Most employers are unwilling to accept trainees for industrial attachment
At the same time, the insider-outsider theory play-out in industrial attachment. In this case, the existing employees view the attaches as a threat to their continued employment. On the whole, the employers are also unwilling to provide the attaches with even nominal allowance to cover for their basic transport needs and other logistics. This is despite the fact that in some organizations, the attaches undertake substantive duties, which would otherwise have been performed by a fulltime employee. The industrial attachment framework in Kenya thus begs the ques-tion as to whether it is degenerating into a new source of cheap labour or does it still provide effective opportuni-ties for acquiring practical work skills!
Is the industrial attachment framework in Kenya degenerating into a new source of cheap labour?
Lack of coordination between educational institutions and IndustryEffective coordination between education, training institutions and industry is critical for skills development and the resultant employability of the youth and the entire labour force. Minimal coordination, if any, exists between government, employers, training providers and policy research institutions. This is reflected in the development and implementation of education and training curricula which is done without effective consultation and collabo-ration with relevant stakeholders, especially industry.
Minimal coordination, if any, exists between government, employers, training providers and policy research institutions.

76Youth Research Compendium
Kenyan tertiary institutions have, for example, continued to develop training programmes, which are regarded to be commercially viable without much assessment of their relevance or the matching of the skills imparted through such programmes to the needs of industry and the labour market in general. On the whole, skills development in the country has continued to be undertaken without due regard to labour market requirements.
Skills development in the country has continued to be undertaken without due regard to labour market require-ments
The lack of monitoring indicators through information systems and long-term evaluation evidence, may lead to budget cuts, hindering programmes sustainability. For instance, it would be important to undertake monitoring and evaluation of the KKV programmes. This would be useful in determining the success or failure of the KKV programme in order to modify it, or determine whether to increase focus on it if successful.
Overall, increasing global competitiveness requires re-orientation by economies to keep pace with global challeng-es, especially the fast changing technologies. In Kenya, a technological gap has been witnessed in various sectors of the economy, with the most affected being manufacturing, agriculture, and information and communication technology. The rapidly changing nature of employment and work requirements has brought about the need for retraining of the Kenyan workforce for increased efficiency and productivity.
Increased conversion of middle-level colleges, especially national polytechnics and technical institutions into pub-lic universities however, weakens the skill upgrading nexus between secondary, tertiary institutions and universi-ties. This has impacted greatly on the employability of the youth. In the whole, the skills mis-match experienced in Kenya has seen a significant proportion of educated youth remaining unemployed for long periods.
Inadequate Employment CreationKenya’s labour market is dual in nature, presenting a growing informal sector employment characterized by pre-carious jobs with a subdued growth in formal sector employment. Thus, even though the formal sector jobs are relatively preferred, they are few and cannot match the demands of the growing labour force. The Kenya govern-ment has, overtime, pursued a number of policies to trigger formal employment particularly within the private sector (Kulundu, 2003). These include pursuit for rapid economic growth, active labour market policies, reviewing the tax regime, simplification of licensing procedures, and implementation of programmes for strengthening the business environment, including enforcement of competition policies.
Available data shows that growth in formal employment in Kenya has been sluggish. Employment in the sector rose by a dismal 1.2 percent between 1998 and 2001 before growing to 2.6 percent in 2002-2009 (UNDP, 2010). Public sector employment, on the other hand, declined by 7.4 percent in 1998-2002 but regained and recorded an average growth of 0.3 percent in 2002-2004 (UNDP, 2010). The informal sector employment growth was 10 percent in 1998-2001; 6.4 percent in 2002-2005; and 12.3 percent in 2006-2008. However, the country’s working-age population increased by 24.5 percent from 15.9 million persons in 1989/99 to 19.8 million persons in 2005/2006 (Republic of Kenya, 2003b; 2008a). The largest rise in the working-age population over the period was recorded among the youth cohort of 15-30 years.The Kenyan employment scenario shows that even though employment creation in Kenya has been deemed to be explained by growth in the country’s Gross Domestic Product (GDP), the same is not supported by available data. As noted by Dantwala (1990), GDP growth, though necessary, is not sufficient for solving the employment problem in a country. It is safe to say within this context that even though Kenya has historically and continues to rely on economic growth to deliver the much needed employment opportunities, achievement of this will continue to be elusive. This is largely explained by the inability of the country to register a high and sustained economic growth rate compatible with meaningful employment creation (Omolo, 2002; World Bank, 2008). According to the World Bank (2008), meaningful GDP growth-targeted employment creation can only be achieved if an economy registers at least a 7 percent growth rate and sustains it over decades.
As much as this task is daunting, achievements of some 13 economies of the world show that it is surmountable. The economies that have managed to register a GDP growth rate of 7 percent and over, and the period during which
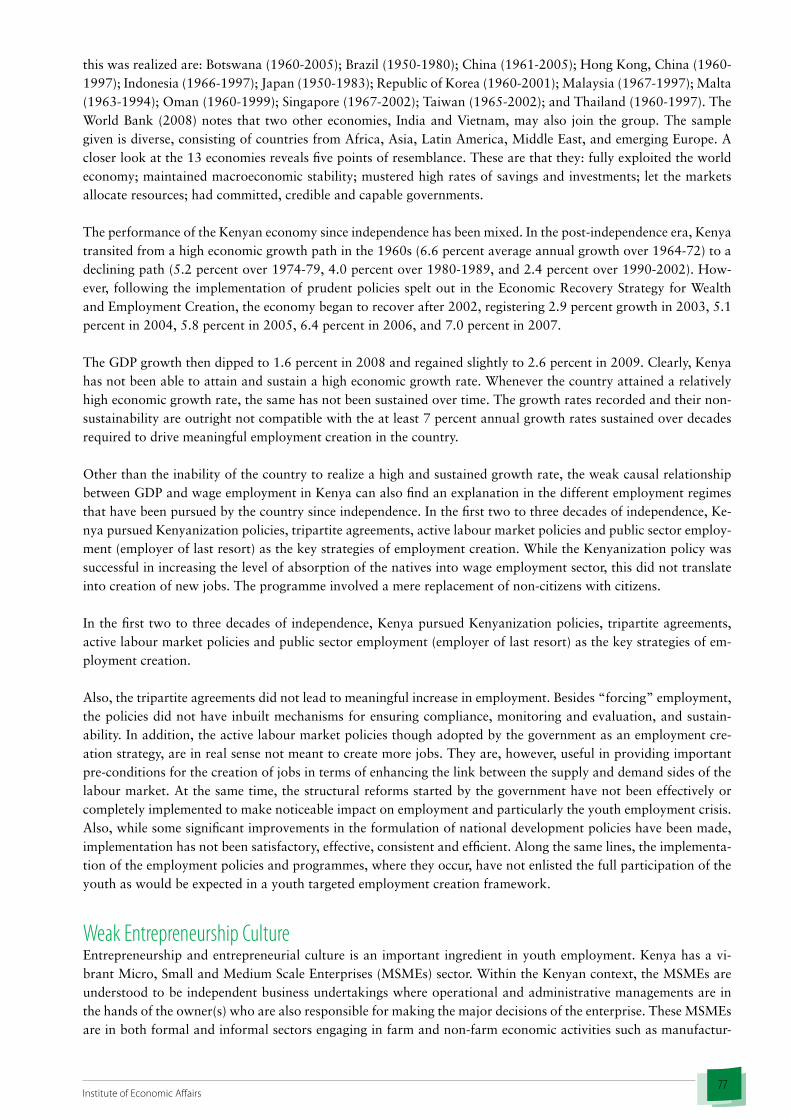
77Institute of Economic Affairs
this was realized are: Botswana (1960-2005); Brazil (1950-1980); China (1961-2005); Hong Kong, China (1960-1997); Indonesia (1966-1997); Japan (1950-1983); Republic of Korea (1960-2001); Malaysia (1967-1997); Malta (1963-1994); Oman (1960-1999); Singapore (1967-2002); Taiwan (1965-2002); and Thailand (1960-1997). The World Bank (2008) notes that two other economies, India and Vietnam, may also join the group. The sample given is diverse, consisting of countries from Africa, Asia, Latin America, Middle East, and emerging Europe. A closer look at the 13 economies reveals five points of resemblance. These are that they: fully exploited the world economy; maintained macroeconomic stability; mustered high rates of savings and investments; let the markets allocate resources; had committed, credible and capable governments.
The performance of the Kenyan economy since independence has been mixed. In the post-independence era, Kenya transited from a high economic growth path in the 1960s (6.6 percent average annual growth over 1964-72) to a declining path (5.2 percent over 1974-79, 4.0 percent over 1980-1989, and 2.4 percent over 1990-2002). How-ever, following the implementation of prudent policies spelt out in the Economic Recovery Strategy for Wealth and Employment Creation, the economy began to recover after 2002, registering 2.9 percent growth in 2003, 5.1 percent in 2004, 5.8 percent in 2005, 6.4 percent in 2006, and 7.0 percent in 2007.
The GDP growth then dipped to 1.6 percent in 2008 and regained slightly to 2.6 percent in 2009. Clearly, Kenya has not been able to attain and sustain a high economic growth rate. Whenever the country attained a relatively high economic growth rate, the same has not been sustained over time. The growth rates recorded and their non-sustainability are outright not compatible with the at least 7 percent annual growth rates sustained over decades required to drive meaningful employment creation in the country.
Other than the inability of the country to realize a high and sustained growth rate, the weak causal relationship between GDP and wage employment in Kenya can also find an explanation in the different employment regimes that have been pursued by the country since independence. In the first two to three decades of independence, Ke-nya pursued Kenyanization policies, tripartite agreements, active labour market policies and public sector employ-ment (employer of last resort) as the key strategies of employment creation. While the Kenyanization policy was successful in increasing the level of absorption of the natives into wage employment sector, this did not translate into creation of new jobs. The programme involved a mere replacement of non-citizens with citizens.
In the first two to three decades of independence, Kenya pursued Kenyanization policies, tripartite agreements, active labour market policies and public sector employment (employer of last resort) as the key strategies of em-ployment creation.
Also, the tripartite agreements did not lead to meaningful increase in employment. Besides “forcing” employment, the policies did not have inbuilt mechanisms for ensuring compliance, monitoring and evaluation, and sustain-ability. In addition, the active labour market policies though adopted by the government as an employment cre-ation strategy, are in real sense not meant to create more jobs. They are, however, useful in providing important pre-conditions for the creation of jobs in terms of enhancing the link between the supply and demand sides of the labour market. At the same time, the structural reforms started by the government have not been effectively or completely implemented to make noticeable impact on employment and particularly the youth employment crisis. Also, while some significant improvements in the formulation of national development policies have been made, implementation has not been satisfactory, effective, consistent and efficient. Along the same lines, the implementa-tion of the employment policies and programmes, where they occur, have not enlisted the full participation of the youth as would be expected in a youth targeted employment creation framework.
Weak Entrepreneurship CultureEntrepreneurship and entrepreneurial culture is an important ingredient in youth employment. Kenya has a vi-brant Micro, Small and Medium Scale Enterprises (MSMEs) sector. Within the Kenyan context, the MSMEs are understood to be independent business undertakings where operational and administrative managements are in the hands of the owner(s) who are also responsible for making the major decisions of the enterprise. These MSMEs are in both formal and informal sectors engaging in farm and non-farm economic activities such as manufactur-

78Youth Research Compendium
ing, mining commerce, industry and social services. MSMEs are more effective in the utilization of local social and natural resources, and employing simple and affordable production technology. The MSMEs are also positioned to satisfy limited demands brought about by small and localized markets due to their lower overheads and fixed costs.
Although MSMEs are dynamic and employment generating entities, they are not socially and economically pref-erable jobs by the youth. MSME employment regarded as a “wait” employment by majority of the youth or where workers who have been offloaded from the formal sector seek refuge. In most cases, the youth look upon the formal sector as their main employment option and their impression is that self- employment is the second or third rate choice for those who cannot find wage employment. At the same time, even though MSMEs have been aggressively promoted by the government and various stakeholders as a labour sponge, the sector still lacks requisite infrastructure to make the enterprises productive and sustainable, particularly in providing employment and income generation opportunities, and exploiting the potential of the youth. Besides, the youth still lack the necessary empowerment and correct attitudes to venture into the MSME sector.
There exists numerous and complex constraints that face young entrepreneurs in the process of owning, manag-ing, operating and developing their enterprises. In the case of Kenya, many MSMEs remain informal because the administrative procedures for business registration are too cumbersome, long-winded and/or costly. The barriers to setting new businesses are particularly high for the youth who on the other hand face complex entrepreneurship barriers. These structural problems include: lack of voice and representation; inadequate access to credit and seed funding; isolation and lack of support
These make it difficult for the youth owned enterprises to gain a foothold in the modern expansive business. In-adequate access to effective business advisory and support services, absence of entrepreneurship mentorship pro-grammes, also remains part of the key challenges facing youth integration into the MSMEs and national economic grid. Overall, promotion of entrepreneurship and nurturing of an entrepreneurial culture should be seen as one of the ways out of youth unemployment crisis.
Inadequate access to effective business advisory and support services, absence of entrepreneurship mentorship programmes, also remains part of the key challenges facing youth integration into the MSMEs and national eco-nomic grid.
Unequal Opportunities for Young Women and MenThe desirable situation in Kenya is that boys and girls should have equal access to education and often girls are doing better than boys at school. But unemployment has continued to be higher among women than men. Women face various structural constraints on their effective participation in economic activities (Okojie, 2003). These include poor customary laws and norms which impede women to greater extent than men from obtaining land, credit, productive inputs, education, information, and health care; coexistence of multiple laws, which create ambivalence (for example customary and statute laws relating to marriage and inheritance; gender bias in access to basic human resource development services such as education, training and health, resulting in gender gaps in adult and or youth literacy rates; and time poverty resulting from women’s multiple and competing reproductive and productive responsibilities. Regardless of these poor customary laws and norms, labour markets also exhibit discriminatory policies, structural barriers and other prejudices that inhibit majority of female youth from entering and staying in the job market.
labour markets also exhibit discriminatory policies, structural barriers and other prejudices that inhibit majority of female youth from entering and staying in the job market.
MSMEemploymentregardedasa“wait”employmentbymajorityoftheyouthorwhereworkerswhohavebeenoffloadedfromtheformalsectorseekrefuge.

79Institute of Economic Affairs
Inadequate Involvement in Policy Formulation and ImplementationMost youth employment policies often consider the youth unemployment challenges as a consequence of the fail-ure of the youth themselves to prepare for the world of work. Such policy interventions and prescriptions have often stereotyped youth as a burden, risks to be managed or threats to be contained. This has made some young people also to start viewing themselves as a problem and a burden to the society. The effect of all these is that youth employment interventions have often been designed and implemented without the involvement and participation of the youth themselves.
It is important to recognize that while youth unemployment is a problem, the youth are the solution. The youth can play a decisive role in solving their employment challenge if they are involved in the policy formulation and implementation. This can be achieved by giving them the right tools, and knowledge and empowerment to use them. (See also Chapter on Youth Participation by Mshai Mwangola).
Child Labour Child labour refers to work that is mentally, physically, socially or morally dangerous and harmful to children; and interferes with their schooling (Republic of Kenya, 2008a). Kenya’s Employment Act (2007) defines a child as a person who has not attained the age of eighteen years. Child labour can, therefore, be harmful or detrimental to children by depriving them the opportunity to attend school; by obliging them to leave school prematurely; or by requiring them to attempt to combine school with other chores. Child labour continues to be one of the greatest challenges in most countries, especially in developing ones. Child labour is a global problem with regional, sub-regional, national and local variations.
A 2006 report by the ILO estimated that there were 317 million economically active children globally, out of whom about 69 percent (218 million) were engaged as child labourers (ILO, 2006).
Many attempts have been made to link socio-economic fundamentals, particularly poverty and economic growth to incidences of child labour. Blunch and Verner (2000), in a study on Ghana, established a positive relationship between poverty and child labour. The researchers also found evidence of a gender gap in child labour linked to poverty. In this perspective, Blunch and Verner (2000) found that girls as a group across urban, rural and poverty sub-samples were consistently found to be more likely to engage in harmful child labour than boys. This finding may, however, be attributed more to cultural norms than discrimination. The researchers also found evidence of a gender gap in child labour linked to poverty.
Along the same lines, Edmonds and Pavcnik (2004) argued that child labour declines dramatically with improve-ments in household living standards. According to the researchers, child labour is responsive to unexpected chang-es in a family’s economic environment, and poor local institutions such as ineffective or expensive schools associ-ated with poverty, leaves children with very few viable options other than work. Within this framework, Edmonds and Pavcnik (2004) claimed that 75 percent of cross-country variation in child labour can be explained by income variation. Krueger (1996) demonstrated a strong correlation between child labour and poverty while Dehejia and Gatti (2003) added that income is the single most important household level predictor of child labour. Poverty is intertwined with economic growth and income distribution.
The socio-economic status of the household head is an important determinant of child labour
Kenyan data on child labour mirrors the dynamics of the country’s rate of growth and incidence of poverty. Ke-nya’s economic growth rate averaged 2.1 over the period 1991-2000, and 4.6 percent over 2001-2007. In tandem with this, the incidence of poverty declined from 56 percent in 2000 to 46 percent in 2005/2006. With respect to child labour, the 2005/2006 KIHBS6 report showed that the total number of working children declined from 1.9 million in 1999 to 1.01 millions in 2005/2006. This represents a drop of 46.8 percent.
6 The Kenya Intergrated Household and Budget Survey has been conducted intermittently, depend-ing on availability of funds.
80Youth Research Compendium
The nature of employment may also have an effect on the incidence of child labour. Kenya has, for example, con-tinued to witness increased precarious employment. This is manifested in the burgeoning informal sector employ-ment, rapid casualization of jobs and adoption of other forms of employment such as outsourcing and short-term contracts. As argued by Blunch and Verner (2000), the socio-economic status of the household head is an impor-tant determinant of child labour. Children of self employed workers, irrespective of the sector, are more likely to engage in harmful child labour activities than children from households whose heads are in formal employment. The same is true for children of workers from the informal sector. Children of self employed workers, are more likely to engage in harmful child labour activities than children from households whose heads are in formal employment
Child labour affects skills formation and employability of the youth. It also reduces employment opportunities available to the labour force besides weakening the bargaining power of the workers. This is reinforced by the fact that children are more likely to be involved in exploitative and hazardous forms of work which not only compro-mise their human capital development, health, safety, dignity and morals, but also deny them the right to grow, develop and enjoy their childhood. This negatively affects the human capital base and employability. At the same time, child labour makes it more challenging for households and governments to break the vicious cycle of poverty. Overall, with the inequities in access to employment opportunities, the youth in Kenya stand to be the greatest casualties of the child labour menace.
…with the inequities in access to employment opportunities, the youth in Kenya stand to be the greatest casual-ties of the child labour menace.
MigrationMigration, particularly rural-urban migration is one of the key youth employment challenges in Kenya. The pat-tern of development in Kenya has, in the past, been biased towards urban areas. Even though various development plans formulated and implemented by the country since independence have recognized the importance of directing more attention to rural areas, basic infrastructural support required to stimulate expansion of productive activities and employment creation have not kept pace with the growing labour force.
Thus, the rural economies have remained deficient in terms of their employment potential and income earning op-portunities with a disproportionate burden on the youth. Coupled with the job-selectiveness, especially amongst the youth and the fact that most white collar jobs, which are mostly preferred by the youth are to be found in the urban areas, the Kenyan economy has witnessed tremendous surge in rural-urban migration involving the youth.
As argued by Macharia (2003) people have continued to migrate into the urban areas even in the face of declining probabilities of securing a white or blue collar job. This, the author contends, has been heightened by the rapid expansion of the informal sector, which increased the hopes of the people with entrepreneurial traits. In line with this argument, it is not only the desire for urban employment that pulls people into the urban areas but also the hope of engaging in the expansive informal sector.
Youth Employment in other CountriesYouth unemployment is a pervasive problem. A number of countries faced with similar challenges have developed and implemented various labour market programmes and interventions aimed at redressing the youth employment problem. One of the comprehensive surveys of interventions to address youth employment is provided by Betcher-man, et al. (2007) and Puerto (2007). This is based on findings of a Youth Employment Inventory (YEI) of 289 interventions implemented in 84 countries representing all regions of the world. The interventions are categorized based on a framework developed by Godfrey (2003). The framework for the YEI comprises two key elements: (i) increasing labour demand and (ii) increasing the ability of integration of workers to enable them take advantage of employment opportunities as labour demand increases. Table 22 gives a summary of the youth employment interventions that have been implemented in various countries and their outcomes.

81Institute of Economic Affairs
Table 22: Youth Employment Interventions in other Countries
Target Group Implementation Design and risks
Impact and Outcomes
Developed Countries Non-developed Countries
Making the labour market work better for young people
Youth 14 to 30 of age.Also open to workers of all ages (i.e. public works programmes.)Unemployed workers in advanced and transition countries; and poor youth in developing countries.Low levels of education are common among beneficiaries.Rural and urban focus.Some orientation towards women in developing and transition economies
Wage subsidies are provided upon hiring an entitled unemployed worker during a specified period.Public works programmes offer temporary employment, mainly in the public sector. They are not youth-specific in general, but can be designed to pay particular attention to young people.It is key to target firms and sectors with potential to create human capital accumulation among the young.There is a risk of increasing welfare dependency among beneficiaries.
Wage subsidies have positive outcomes for youth, increasing employment rates, duration and earnings, Successful examples: U.S YIEPP and the Belgian Employment Plan.
Public works present mixed results. Positive outcomes indicate greater employment probability of about 26% with respect to the control group. Successful examples:American Conservation & Youth Service Corps.
Wage subsidies have improved employment outcomes with net employment effect from 12 to 15.6%. Young women and low educated participants tend to benefit the most. The impact on monthly earnings is slightly negative. Successful examples: Czech Republic’s wage Subsidy Programme and Poland’s intervention works Programme.Public works present mixed results. Positive outcomes indicate greater employment probability of about 6% with respect to the control group. Cost-effectiveness remains to be tested. Successful examples: Bulgaria’s Temporary Employment Programme.
Improving chances for young entrepreneurs
Youth 14 to 35 years of age.Unemployed workers in advanced and transition countries; and poor youth in developing countries.Low levels of education are characteristic in developing countries.Rural and urban focus.Some orientation towards women in developing economies
Entrepreneurship schemes go from basic training on managerial skills and the creation of business plans, to more comprehensive programmes including further training in accounting, taxes, sales, internships in local businesses and start-up loans.Credit market failure limits entrepreneurial possibilities among the young due to lack of credit history, collateral, etc.There is great and increasing participation of NGOs in design and implementation.The lack of success/failure indicators (i.e. information systems and long-term evaluation evidence) may lead to budget cuts, hindering programmes sustainability.
There is no evaluation evidence in OECD countries.
Evidence from countries in transition shows positive effects on employment and cost-effectiveness. Successful examples: Bulgaria’s Self-employment Programme.Evidence from developing countries show an increase of 7.8 percentage points in the probability of having a business operating, and an 8 percent increase in the beneficiaries’ average income. Successful examples; Peru’s Formacion Empresarial de la Juventud and Calificacion de la Juvenes Creadores de Microempresas.
Target Implementation Design and Risks
Impacts and Outcomes
Developed countries Non-developed countries
Skills training for young people

82Youth Research Compendium
Youth 14 to 30 years of age.Unemployed and disadvantaged youth with low levels of education (i.e. school dropouts). There is a distinct urban focus in developing countries.Some orientation towards women in transition economies.
Comprises non-formal vocational skills training, second chance programmes and apprenticeship systems.Training systems include public-private alliances in the design and provision of services, creating cost-sharing structures and allowing consistency between courses and skills demanded by the market.Sanction schemes have been designed to reduce the probability of dropping out.
Cross-country evaluations in OECD countries suggest non-significant labour market impacts. There are some positive effects for adult women and educated men, but in general negligible and negative effects for youth. Successful examples: Finland’s Active labour market policy and U.S. Summer Youth Employment and Training Programme.
There are positive impacts from training with relatively proven cost-effectiveness. Programs increased the likelihood of employment among the young between 6 and 57 percent. This wide range of effects on employment is mostly determined by gender and education level: women and the low educated tend to obtain higher gains than the rest. Successful examples: Brazil’s PLANFOR and Bulgaria’s Re-training Programme (Guaranteed & Non-guaranteed jobs).
Making training systems work better for young people
Disadvantaged and unemployed youth with low education levels.Rural and urban focus.Wide orientation towards women, particularly teenage mothers in developed countries.
These programmes offer information networks, vouchers and subsidies to allow young people to acquire training.The lack of evaluating evidence in developing countries may lead to budget cuts, hindering programmes sustainability.Risk of increased welfare dependency.
Programmes report positive but no lasting impacts on the labour market.
There is no solid evaluation evidence in developing countries. Kenya’s Jua Kali Pilot Voucher Programme reported net improvements in terms of job creation, productivity and business profits, but is overall effectiveness remains to be tested.
Comprehensive interventions
Youth 14 to 30 years of age.Un/underemployed youth, with low income and education level.Rural and urban areas are equally served with some focus in the main cities in developing countries.Some orientation towards women in developing economies
Encompasses job and life skills training (in classroom and/or on-the-job). Apprenticeship and entrepreneurship schemes, information, counseling, placement, financial incentives (to employers and beneficiaries) and other support services.Most programmes are publicly sponsored.Quality and relevance of training is key to ensure success and sustainability.Very large-scale programmes may experience coordination problems between local and central agencies.Excessive costs may defer the returns of positive net gains and hinder sustainability.
Evidence from OECD countries suggests mixed effects from comprehensive programmes. A cross-programme study in the U.S. found very moderate and often negative impacts on the labor market. When impacts were positive they were surpassed by programme costs. In other countries (Canada’s Employability Improvement Programme, U.K. New Deal for Young People and the U.S. Job Corps.
Comprehensive programmes reported positive outcomes on employment and earnings. Evidence from Latin America and Caribbean Countries (LAC) shows 10 to 21 percent increase in the employment probabilities, and about 10 to 26 percent net increase in earnings. The most benefited were the youths and women. Programmes are also cost-effective. Successful examples: Jovenes Programmes.
Improving Life Skills for the Youth

83Institute of Economic Affairs
Youth ages 16-29 looking for workEmployers looking for qualified applicants for entry-level jobs
Targeted Skills-Team work-Communication-Conflict management-Creative thinking-Responsibility-Values/citizenship-Self awareness-Time management-Personal hygiene and grooming-Ethical behaviour at workplace.Implementation Design-Short-term training that responds to the labour market needs -Comprehensive curriculum that includes technical training as well as life skills and job seeking skills development-Information and Communication Technology-Internships with local employers(duration 7-8 months including internship)
-Between 2002 and 2006, about 12,000 youth benefitted the project-89% course completion (11% dropout)-51% job placement of which 57% with formal permanent contracts; 74% with one or more benefits; 85% working 35+ hours per week; 52% report using ICT; 40% return to school compared to 26% at baseline; 27% neither studying nor working; favourable employers’ ratingsSuccessful Example: Entra 21 youth employment programme in 18 LAC
Betcherman, et al. (2007) and Puerto (2007)
Lessons Learnt from the International ExperiencesProgrammes implemented by various countries targeting youth employment in particular, can be grouped into two broad categories. Those that are focused on prevention of potential unemployment problems among the youth after formal schooling and remedying interventions. Prevention measures are mainly associated with early and sustained interventions towards addressing unemployment problem by increasing future employment outcomes. Remedying interventions address market failures (labour, credit and training market) such as improving labour market regulations. Several lessons can be learnt from the programmes. Some of these include:
• Training is the dominant form of intervention used to integrate young people into the labour market.
• Interventions are often targeted at low-income or poorly-educated young people, particularly in less devel-oped countries.
• Programme success is not determined by the type of intervention. There are no major differences across types of interventions in terms of impact. Accordingly, policy-makers should consider which type of intervention best addresses the problem of concern.
• Interventions tend to be more successful in developing and transition countries than in advanced economies.
• There is a potential learning process in the implementation of youth employment interventions: newer inter-ventions perform better than older ones in terms of impact.
• Interventions targeting poor youth have higher probability of improving employability and earnings than otherwise.

84Youth Research Compendium
Youth Employment Policy and Programme for KenyaPolicy responses can be categorized into two: preventive and curative. The foregoing analyses show that the youth employment interventions in Kenya appear to have mostly been curative in nature. In this case, the policies have attempted to identify who and where the unemployed youth are and tried to deal with their problem. This essen-tially implies treating the symptoms of youth unemployment and not its causes. For effectiveness, there is need for Kenya to shift the emphasis from curative to preventive interventions. This entails moving away from treating the symptoms of youth unemployment to dealing with the causes of the youth employment problem. In this case, focus should be on analyzing and understanding the causes of youth unemploy-ment in the country and devising strategies to deal with it. This makes it imperative that the employment challenge facing the youth is broken down into its main causes and specific strategies designed and implemented to deal with the specific types of the youth unemployment. This view prefers formulation and implementation of coherent and comprehensive tracks of programmes and strategies for promotion of youth employment in the country. Such pro-grammes may be modeled along thematic areas such as school to work transition survey, labour market informa-tion and the KKV programme. Others are entrepreneurial potential, and skills of the youth as discussed hereunder:
School-to-Work Transition SurveyA School-to-Work Transition Survey (SWTS) should be the entry point in designing and implementing an effec-tive youth employment intervention in Kenya. The SWTS would help assess the relative ease or difficulty of the youth’s transition from school-to work-life. The variables that could be under investigation should include but not limited to: education and training experience; perceptions and aspirations in terms of employment; job search process; barriers to and supports for entry into the labour market; the preference for wage employment or self-employment; attitudes of employers towards young workers. Without a comprehensive SWTS, the country risks continuing to design and implement ineffective youth employment policy programmes.
School-to-Work Transition Survey (SWTS) should be the entry point in designing and implementing an effective youth employment intervention
Labour Market InformationInterventions within this track of programmes are relevant to Kenyan situation as majority of the youth do not possess appropriate labour market skills, knowledge and attitude. Majority of the Kenyan youth are out of school and are not involved in productive labour market activities. Programmes under this theme should be aimed at enhancing access to information through formulation and implementation of active labour market policies, which integrate access to labour market information, career guidance and counseling, offering job search skills, and placements.
Active labour market policies are expected to contribute to a highly effective supply of labour by ensuring that the unemployed youth are actively seeking jobs and have the qualifications needed to fill new positions. Active labour market policies also provide a targeted effort towards preventing marginalization and long-term unemployment by ensuring that the unemployed youth maintain their qualifications. Training is a key component of the active labour market policy. Training is important regardless of employment status, and it plays a separate and vital role in improving the employability and productivity of the labour force. This is underscored by the fact that education and training in Kenya is fairly of a general nature, with curricula which are more often than not poorly aligned to the needs of industries and the labour market in general.
Education and training in Kenya is fairly of a general nature, with curricula which are more often than not poorly aligned to the needs of industries and the labour market in general.
The other active labour market policy that has been implemented by the Kenya government is the provision of public employment services. This has been undertaken through the National Employment Bureau (NEB). The NEB was established in 1986 as a department within the ministry responsible for labour matters. The department is mandated to provide public employment services such as registration and placement of job seekers. Inbuilt
within this mandate is the collection, analysis and dissemination of labour market information. The mandate of the NEB is executed through 21 regional offices. At the same time, a number of private employment agencies have sprung up to possibly fill the void left by the NEB, and the growing levels of unemployment in the country. The pri-vate employment agencies are galvanized under the Kenya Association of Private Employment Agencies (KAPEA).
It is also noted that effective execution of the NEB mandate and ensuring that the Kenyan labour market works better for the youth requires capacity building and general investment in the Bureau. To undertake its mandate effectively, the NEB should be capacitated to obtain, analyze, document, update and store in a retrieval form the profiles of job seekers, identify vacancies in organizations, and popularize their mandate and functions. These fundamentals require strong legal and institutional setting. Labour market information is a key ingredient to re-orientating education and training, enhancing job matching, actualizing effective employment services and job-search infrastructure, which Kenya cannot afford to do without.
To undertake its mandate effectively, the NEB should be capacitated to obtain, analyze, document, update and store in a retrieval form the profiles of job seekers, identify vacancies in organizations, and popularize their mandate and functions.
The ‘Kazi Kwa Vijana’ Programme The Kazi Kwa Vijana (KKV) programme is a key youth-targeted public works programme in Kenya. It, however, requires effective targeting. This is crucial since evidence from other countries indicates that the effectiveness of public works projects may be diminished or made marginal if the programmes are not well targeted. Currently, the KKV programme does not effectively target the youth from the poorest households. It merely employs the prin-ciple of “first come first served” to enlist beneficiaries. As the initiative progresses, it would be advisable to design and adopt a more effective targeting strategy that reaches the youth from the poorest households, if the KKV is to achieve its intended objectives and to disabuse the perception that is generally held among the youth that the intervention benefits the old than the young. An exit strategy is also crucial for the KKV programme. This should protect its beneficiaries that have attained the “cut-off age” from shifting back to unemployment.
Entrepreneurial Potential of the YouthYouth employment interventions should increasingly target the enhancement and promotion of the youth entrepre-neurial potential. This can be achieved within the framework of the Youth Enterprise Development Fund (YEDF) integrated with schemes to promote linkages between youth enterprises with medium and large firms, mentoring programmes, entrepreneurial exchange initiatives, and exhibitions to promote markets and market information.
Equally important is the need to change the attitude and perception of the society and the youth about the infor-mal/jua kali sector. The negative attitude and perception about the sector discourages many youth from venturing into it, as they do not want to be viewed as failures in life. Without proper strategic interventions to exploit the entrepreneurial potential of the youth and work on the attitudinal change, the youth employment challenge will grow with serious social, economic and political ramifications.
Skills of the YouthThe 8-4-4 system of education was geared towards imparting appropriate skills to enhance self-employment. However, due to the high costs, poverty and lack of facilities, there have been high rates of dropouts. Most of the youth either drop out of school or graduate without necessary skills for self-employment. The country’s training institutions are not only inadequate but also lack the essential facilities and technology to prepare students for the challenging labour market. Equally, there is obsession for establishment of commercial colleges and other train-ing institutions to fill the void but with manifestations of uncoordinated curricula and programmes. At the same time, there is craving particularly in the conversion of public middle level colleges into universities. This limits the development of critical skills of the youth.
There is the need to change the attitude and perception of the society and the youth about the informal/jua kali sector

85Institute of Economic Affairs
within this mandate is the collection, analysis and dissemination of labour market information. The mandate of the NEB is executed through 21 regional offices. At the same time, a number of private employment agencies have sprung up to possibly fill the void left by the NEB, and the growing levels of unemployment in the country. The pri-vate employment agencies are galvanized under the Kenya Association of Private Employment Agencies (KAPEA).
It is also noted that effective execution of the NEB mandate and ensuring that the Kenyan labour market works better for the youth requires capacity building and general investment in the Bureau. To undertake its mandate effectively, the NEB should be capacitated to obtain, analyze, document, update and store in a retrieval form the profiles of job seekers, identify vacancies in organizations, and popularize their mandate and functions. These fundamentals require strong legal and institutional setting. Labour market information is a key ingredient to re-orientating education and training, enhancing job matching, actualizing effective employment services and job-search infrastructure, which Kenya cannot afford to do without.
To undertake its mandate effectively, the NEB should be capacitated to obtain, analyze, document, update and store in a retrieval form the profiles of job seekers, identify vacancies in organizations, and popularize their mandate and functions.
The ‘Kazi Kwa Vijana’ Programme The Kazi Kwa Vijana (KKV) programme is a key youth-targeted public works programme in Kenya. It, however, requires effective targeting. This is crucial since evidence from other countries indicates that the effectiveness of public works projects may be diminished or made marginal if the programmes are not well targeted. Currently, the KKV programme does not effectively target the youth from the poorest households. It merely employs the prin-ciple of “first come first served” to enlist beneficiaries. As the initiative progresses, it would be advisable to design and adopt a more effective targeting strategy that reaches the youth from the poorest households, if the KKV is to achieve its intended objectives and to disabuse the perception that is generally held among the youth that the intervention benefits the old than the young. An exit strategy is also crucial for the KKV programme. This should protect its beneficiaries that have attained the “cut-off age” from shifting back to unemployment.
Entrepreneurial Potential of the YouthYouth employment interventions should increasingly target the enhancement and promotion of the youth entrepre-neurial potential. This can be achieved within the framework of the Youth Enterprise Development Fund (YEDF) integrated with schemes to promote linkages between youth enterprises with medium and large firms, mentoring programmes, entrepreneurial exchange initiatives, and exhibitions to promote markets and market information.
Equally important is the need to change the attitude and perception of the society and the youth about the infor-mal/jua kali sector. The negative attitude and perception about the sector discourages many youth from venturing into it, as they do not want to be viewed as failures in life. Without proper strategic interventions to exploit the entrepreneurial potential of the youth and work on the attitudinal change, the youth employment challenge will grow with serious social, economic and political ramifications.
Skills of the YouthThe 8-4-4 system of education was geared towards imparting appropriate skills to enhance self-employment. However, due to the high costs, poverty and lack of facilities, there have been high rates of dropouts. Most of the youth either drop out of school or graduate without necessary skills for self-employment. The country’s training institutions are not only inadequate but also lack the essential facilities and technology to prepare students for the challenging labour market. Equally, there is obsession for establishment of commercial colleges and other train-ing institutions to fill the void but with manifestations of uncoordinated curricula and programmes. At the same time, there is craving particularly in the conversion of public middle level colleges into universities. This limits the development of critical skills of the youth.
There is the need to change the attitude and perception of the society and the youth about the informal/jua kali sector

86Youth Research Compendium
There is also no linkage between the training institutions and the formal and informal (jua kali) sector. The youth trained in these institutions cannot, therefore, be immediately absorbed into the job market. To enhance technical and vocational training for the youth, the following strategies should be prioritized: developing a labour market driven curriculum for use in technical and vocational training institutes; promoting the exchange of information, knowledge and human resources between the public and the private institutions as well as increasing bursary provision for needy students in Youth Polytechnics; maintaining and improving access to technical and vocational skills through the expansion of Youth Polytechnic subsidized tuition and re-introduction of Jua Kali Voucher training programme; provision and improvement of existing technical and vocational training facilities for the youth and mainstreaming youth with special needs in youth vocational training; formulating and reviewing of the education and training policy as well as creating linkages between training institutions and the private sector through research, internship opportunities and finance and encouraging the private sector to get involved in tech-nical education and training. Care should be taken not to make internship and industrial attachments as avenues of cheap labour.
To address the problem of skills mismatch with the labour market, the business community needs to be closely engaged with educational and training institutions. Some aspects of the relationship can include: industrialists sit-ting in as members of the boards of educational and training institutions so as to provide input into the curricular for students to learn skills needed by the industries; school-Industry Link programmes that aids students in appre-ciating the relevance of learned theories in the world of work; teacher placements in businesses/industries during school holidays to facilitate sensitization of teachers on the skills their students need to acquire; setting up career advisory services and making this accessible to all job seekers looking for information and guidance. This should be both online and phone in. Courses offered by educational and training institutions in the country and what jobs they can lead to should also be availed through websites.
REFERENCESBetcherman, G., Martin, G., Susana, P., Friederike, R., and Antoneta, S. (2007). A Review of Interventions to
Support Young Workers: Findings of the Youth Employment Inventory. Social Protection Discussion Paper No. 0715. Washington, DC: The World Bank.
Bunch, N-H. and Verner, D. (2000). Revisiting the Link Between Poverty and Child Labour: The Ghanian Experience. Journal of Economic Literature
Coenjaerts, C.E., Ernst, C., Firtuny, M., and Rei, D. (2009). Youth Employment. Youth Employment Network :OECD.
Dantwala, M.L. (1990). Search for an Employment-Oriented Growth Strategy: A Discussion. Economic and Political Weekly, 25 (21), 1147-1162
Dehejia, R.H. and Gatti, R. (2003). Child Labor: The Role of Income Variability and Credit Constraints Across Countries. Revision of NBER Working Paper No. 9018
Edmonds, E.V. and Pavcnik, N. (2004). Child Labour in the Global Economy. NBER Working Paper, 10317
Hafkin, N.J. (2002). Gender, Information Technology and Development: An Overview. Wageningen
International Labour Organization [ILO]. (1995). Employment Policy and Programme for Kenya. East Africa Multidisciplinary Advisory Team. Addis Ababa: ILO.
International Labour Organization [ILO]. (2009). Key Indicators of the Labour Market, KILM 2009. Geneva: ILO.
Kulundu, D.M. (2003). Globalization and Labour Market in Kenya. Discussion Paper 6, Nairobi: KIPPRA
Krueger, A.B. (1996). Observations on International Labour Standards and Trade. NBER Working Paper 5632
Macharia, K. (2003). Migration in Kenya and its Impact on the Labour Market. A Paper prepared for the Conference on African Migration in Comparative Perspective, Johannesburg South Africa, 4 – 7 (June)

87Institute of Economic Affairs
Martin, G. (2003). Youth Employment Policy in Developing and Transition Countries-Prevention as well as Cure. Social Protection Discussion Paper Series, No. 0320, Social Protection Unit, Washington D.C : The World Bank
Okojie, C.E.E. (2003). Employment Creation for Youth in Africa: The Gender Dimension. Paper prepared for the Expert Group
Omolo, O.J. (2002). An Overview of Incomes and Wage Policy in Kenya: Effectiveness and Constraints to Productivity Enhancement. A paper presented during a Productivity Policy and Legal Framework Workshop, Mombasa.
Puerto, O.S. (2007). Meta-analysis of the Youth Employment Inventory, Washington, D.C : The World Bank. Republic of Kenya. (1964). National Development Plan, 1964-1970. Nairobi: Government Printer.
Republic of Kenya. (1969). National Development Plan, 1970-1974. Nairobi: Government Printer.
Republic of Kenya. (1973). Sessional Paper No. 10 of 1973: Employment. Nairobi: Government Printer.Republic of Kenya. (1983). Report of the Presidential Committee on Unemployment, 1982/83. Nairobi:
Government Printer.
Republic of Kenya. (1985). Sessional Paper No. 2 of 1985: Unemployment. Nairobi: Government Printer.
Republic of Kenya. (1994a). National Development Plan, 1994-199., Nairobi: Government Printer.
Republic of Kenya. (1994b). Sessional Paper No. 1 of 1994: Recovery and Sustainable Development to the Year 2010. Nairobi: Government Printer.
Republic of Kenya. (1997a). National Development Plan, 1997-2001. Nairobi: Government Printer.
Republic of Kenya. (1997b). Sessional Paper No. 2 of 1997: Industrialization. Nairobi: Government Printer.
Republic of Kenya. (1999). National Poverty Eradication Plan. Nairobi: Government Printer.
Republic of Kenya. (2002) National Development Plan 2002-2008: Effective Management for Sustainable Economic Growth and Poverty Reduction. Nairobi: Government Printer.
Republic of Kenya. (2003a). Economic Recovery Strategy for Wealth and Employment Creation, 2003-2007. Nairobi: Government Printer.
Republic of Kenya. (2003b). Report of 1998/99 Labour Force Survey. Central Bureau of Statistics & Ministry of Planning and National Development, Nairobi: Government Printer.
Republic of Kenya. (2005). Key Gender and Employment Issues in Agriculture and Rural Development as Aspects of Poverty Reduction Strategy: Kenya Country Study. Ministry of Labour and Human Resources Development, Nairobi: Government Printer.
Republic of Kenya. (2007). Vision 2030 Strategy for National Transformation: Accelerating Equitable Economic and Social Development for a Prosperous Kenya. Ministry of State for Planning, National Development, Nairobi: Government Printer.
Republic of Kenya. (2008a). Analytical Report: 2005-06 Labour Force Survey. Central Bureau of Statistics & Ministry of Planning and National Development, Nairobi: Government Printer.
Republic of Kenya. (2008b). First Medium Term Plan: Kenya Vision 2030-A Globally Competitive and Prosperous Kenya. Office of the Prime Minister, Ministry of State for Planning, National Development and Vision 2030, Nairobi: Government Printer.
Republic of Kenya. (2008c). Sector Plan for Labour, Youth and Human Resource Development, 2008-2012. Ministry of Labour, Nairobi: Government Printer.

88Youth Research Compendium
Republic of Kenya. (2010). The Proposed Constitution of Kenya. Attorney-General’s Office, Nairobi: Government Printer.
Semboja, H.H.H. (2005). A Concept Paper on Promoting Opportunities for Youth Employment in East Africa. Prepared for the ILO regional Office and presented at the EAC Meeting of Labour Commissioners, Silver Springs Hotel, Nairobi, Kenya, on December 2005. Washington, D.C : The World Bank.
United Nations Development Programme [UNDP]. (2010). Kenya National Human Development Report 2009: Youth and Human Development-Tapping the Untapped Resource. Nairobi: Kenya
Urdal, H. (2006). A Clash of Generations? Youth Bulges and Political Violence. International Studies Quarterly, 50: 607 – 629.
Ware, H. (2004). Pacific Instability and Youth Bulges: The Devil in the Demography and the Economy. Canberra: Australian Population Association
World Bank. (2008). The Growth Report: Strategies for Sustained Growth and Inclusive Development. Commission on Growth and Development, Washington, D.C: The World Bank.

89Institute of Economic Affairs
Box 1: National Industrial Institutions At the industrial level, institutions such as the National Manpower Development Committee (NMDC) which were meant to provide the framework for interaction between training providers and industry are no longer functional. The mandate of the NMDC is supposed to be performed under the National La-bour Board (NLB) established in 2007. However, the board is yet to become fully operational. The NLB was created under Section 5(1) of the Labour Institutions Act (2007).
Labour market information & flowThe Kenya government has over time attempted to improve labour market information and its flow. One of such attempts was the establishment of the National Employment Bureau (NEB) in 1986. The NEB was established as, and remains, a department within the ministry responsible for labour matters. Part of the mandate of the NEB is provision of employment services in terms of registration and placement of job seekers. Inbuilt in this mandate is the collection, analysis and dissemination of labour market in-formation. As of 2010 (October), the NEB had 21 regional offices. Simultaneously, a number of private employment bureaus have sprung up possibly to fill the void left by the NEB, and the growing levels of unemployment. The private bureaus are concentrated in the main urban centres, leaving the rural areas largely uninformed of the employment trends and dynamics.
A major pre-requisite of the employment services of the NEB is the willingness and ability of employers to report vacancies and terminations to the bureau. The institutional framework of the NEB is also based on assumption that employers would be willing to source suitable job seekers from the bureau to fill existing positions. This would then make NEB an employment reference point. For effective execution of its mandate, the bureau needs the requisite capacity to obtain, analyze, document, update and store, in a retrieval form, the profiles of job seekers, identify vacancies in organizations, and popularize their mandate and functions. These fundamentals require strong legal and institutional setting, which have largely been lacking at the NEB.
Before the enactment of the Employment Act (2007) and Labour Institutions Act (2007), the NEB only relied on the Legal Notice No. 156 of 1977, which made it mandatory for all employers to report vacan-cies (Republic of Kenya, 1983). The legislation did not, however, bestow any power on the employment officers to facilitate execution of their registration and placement mandate. Thus, the NEB would only get employers to declare vacancies and terminations through moral persuasion. The legislation was hardly enforced by government nor adhered to by employers.
The NEB continues to suffer from human, financial and physical resource capacity limitations, with considerable impact on the effectiveness of their services and outreach. Compounded with this, is the unavailability of national skills and industry demands database, and the burgeoning unemployment lev-els, which makes it easier for employers to recruit job seekers right outside their gates. Equally, with the limited regulation and supervision of the private employment bureaus, one cannot rule out the possibility of extortion of the job seekers by some of the bureaus.

90Youth Research Compendium
Education: Adequate and Equitable Provision?4Dan K’oliech
AbstractThis study examines education of youth in Kenya by focusing on past educational developments, trends, and poli-cies, as they relate to the present provision and access to education. In the analysis, specific focus has been placed on the existing access and equity issues in relation to gender and regional disparities. Owing to the varying con-textual definitions of the youth as an age category, this study focused on levels of education that are deemed most representative of the youth population aged 15-34, namely, secondary, Technical, Industrial, Vocational and En-trepreneurship Training (TIVET) and university. However, the study also focuses on the primary education cycle for the purposes of understanding the forces responsible for the present trends. It attempts to establish past driving forces and their residual effect on present education provision and access among the youth. On the public side, it is clear that the introduction of Structural Adjustment Programmes (SAPs) in the mid 80s negatively impacted the government’s ability to adequately and equitably provide education at all levels. On the private side, the introduc-tion of cost-sharing had an adverse impact on access to primary and secondary school education. Evidence from post-independence enrolment trends in primary education show that the impact of political pronouncements that result into momentary increase in enrolments often wane when the interventions are not sustained. This study also identifies some key areas in which policy gaps exist and continue to impede equitable provision and access to education among Kenya’s youth, key among these include: inappropriate legal framework; increasing private and public cost of education; poor governance and management; the HIV and AIDS problem; gender mainstreaming; Educational Management and Information System (EMIS); special education; the needs of marginalized groups; alternative channels of delivery; and education financing. To achieve the twin goals of equity and increased access to education by the youth, the study identifies a number of measures which include: partnerships between state and non-state actors to expand educational opportunities at all levels; targeted provision of educational opportu-nities among disadvantaged populations and regions; enhancement and sustenance of the Free Primary Education (FPE) and Subsidised Secondary Education (SSE) programmes for primary and secondary education respectively; provision of Adult and Continuing Education (ACE) and Non-Formal Education (NFE) to enhance access among out of school and difficult to reach youth populations; provision of special education to capture youths with dis-ability; and development of new financing instruments to diminish the cost burden on the lower income quintile groups.
91Institute of Economic Affairs
Contextualizing EducationA country’s most important resource is not its raw materials or its geographical location but the skills of its people (Commission on Growth and Development, 2008; Kok, 2004; OECD, 2004). It is widely accepted that the quan-tity and quality of education that the society makes attainable by the youth, largely determines the direction and ways in which the lives of its youth are shaped. As an integral measure of human capital, the level of educational attainment can be seen to impact youths in the following ways; (i) it enhances economic growth as it increases not only the productivity of the person being educated but also the productivity of his/her co-workers (Hall, 2006; Hanushek 2002); (ii) it significantly enhances the capacity of youths to appropriate the emerging benefits of glo-balization (La Cava, Clert and Lytle, 2004); (iii) educated youth positively impact the micro-economies7 of their families and even communities (Manda, Mwabu and Kimenyi, 2002). They could act as role models to family members and their peers who, in turn, strive to attain higher levels of education. On the other hand, youths with better education will possess a set of socio-economic attributes which ensure equally good, if not better, levels of education for their off springs (Dasgupta, 1998); (iv) appropriate formal and informal education to the youth, also determines their employability and engagement in economic activities with meaningful returns (Hall, 2000; Wambugu, 2003); (v) youth engagement in meaningful economic activities effectively eradicates youth poverty and hunger and as argued by Dasgupta, well nourished, as opposed to under-nourished people, often able to under-take productive work thus able to pull themselves out of the poverty trap.
Globally, since 1995, the number of children completing primary school has continued to increase, and four out of five young people in the eligible age group are now in secondary school. Tertiary enrolment has risen as well. It is estimated that some 100 million youth are presently engaged in university-level studies worldwide. The current generation of youth is the best educated so far. However, by 2005 it was estimated that 113 million children were not in school, and 130 million young people were illiterate (United Nations, 2005).
Rich and poor countries alike increasingly recognize that they will pay a high price if they fail to strengthen na-tional skills (DFID, 2007, 2008). The global economic crisis has raised the stakes, pushing learning and skills up the political agenda. While all sections of society have been affected, the economic downturn has left its deepest imprint on vulnerable unskilled workers, especially the youth (ILO, 2009; OECD, 2009). Countries that fail to nurture these skills through effective learning face a bleak future (Commission on Growth and Development, 2008; Kok, 2004; OECD, 2004).
The History of Access to Education in Kenya: 1960-2007This section reviews the history of access to education at the different level over the period spanning 1960-2007. Of particular interest in the enrolment trends in the 47 year period under review is how access to various levels of education has varied under different political regimes in Kenya.
Primary EducationData presented in Abagi’s work on Education in the Next Millennium (Abagi, 1999), shows that by 1963 a total of 891,103 children were enrolled in primary schools. By 1965, primary enrolments had increased to a total of 1,010,889 pupils. Illustrations on Figure 2.1 demonstrate the impact of previous presidential decrees on the provi-sion of state subsidized primary education on enrolment. The trends present 3 major transitions in which these decrees were characterized by a steep increase in primary enrolments. The first drastic increase in primary enrol-ments took place between 1973 and 1974 when, in December 1973, President Kenyatta declared primary educa-tion for grades 1-4 as free. In this instance, enrolments increased by 971,892 from 1,816,017 in 1973 to 2,787,009 in 1974. The impact of a second decree by President Moi was to be seen in the significant increase in enrolments from 2,994,894 in 1978 to 3,697,146 in 1979 following the presidential decree of 1979 on free primary educa-tion. The third pronouncement whose effects on access to primary education is still being felt to date is president Kibaki’s decree of 2003 which resulted in an increase in enrolments from 6,062,742 in 2002 to 7,159,523 in 2003.
Away from the presidential pronouncements, enrolment trends during the intervening periods between the decrees present a worrying picture. Of note, is the near plateau phase in enrolments between 1974 and 1978 and between 1989 and 2002 when enrolments appeared to have virtually stagnated. These periods were characterized by ex-
7 As used here, a micro-economy is an economy as small as that of a household or and extended family.

92Youth Research Compendium
treme levels of cost-recovery in primary education where parents were expected to foot virtually all input and supply costs with the exception of teachers. The access situation was particularly dire based on the fact that the population of children in the primary school was on the increase while enrolments virtually stagnated. The high cost of primary education to most families in the lowest income quintile effectively increased the opportunity cost of schooling at this level, hence non-participation by the majority of children from such economic backgrounds.
Figure 17: Primary school enrolment trends, 1960-2007
Source: Compiled from Republic of Kenya (1974-2010) Statistical Abstract, MOE, Education Statistical Booklet (various)
The post independence access history can therefore be segmented into three main regimes that coincide with the three presidents. Evidence from the plateau phases that emerged immediately after the Kenyatta and Moi era pro-nouncements suggest that when initial state backed interventions are not sustained, the impacts of the pronounce-ments on enrolments eventually wane off and the access situation inevitably relapses back to cost-influenced disparities. The post 1989 plateau phase was particularly adversely impacted by the Structural Adjustment Pro-grammes (SAPs) whose introduction in the education sector meant that parents and communities had to shoulder up to 80 percent of the real costs of providing education at this level (Oxfam GB and ANCEFA, 2005).
Secondary EducationAt independence in 1963, secondary school enrolments were still low at only 30,120. The growth in access at this level remained generally slow for the period between 1960 and 1974. Illustrations on Figure 18 suggest near stagnation in enrolments between 1989 and 2002. There was a significant increase in enrolments from 768,695 in 2002 to 868,623 in 2003. This was attributable to the positive impacts of FPE that freed household resources to enable households to send more children to low cost day schools. The high increase in secondary enrolments between 2003 and 2007 is attributable to a combination of the legacy effects of FPE and the emergence of low cost day secondary schools.

93Institute of Economic Affairs
Figure 18: Secondary School Enrolment Trends, 1960-2007
Source: Compiled from Statistical Abstract (Republic of Kenya 1974-2010), Education Statistical Booklet (MOE, various)
Technical EducationTechnical education has traditionally faced neglect with the government allocating more resources to the provi-sion of primary and secondary education. By 1963, only 1,202 students were enrolled in what were then known as institutions of training in trade. By 1980, total enrolment in technical education institutions was yet to reach the 10,000 mark. The period between 1984 and 1999 was characterized by fluctuations in enrolment. Enrolment in Technical Institutes and Technical Training Institutes (TTIs) began on a rising path in 1999 and has remained so since7.
Figure 19: TIVET enrolment trends, 1960-2007
Source: Compiled from Statistical Abstract (Republic of Kenya 1974-2010), Education Statistical Booklet (MOE, various)
7. Enrolments exclude National Youth Polytechnics and Youth Polytechnics.

94Youth Research Compendium
University EducationTotal enrolments of Kenyan students at the then University of East Africa by 1971 was 3,139. Increase in univer-sity enrolments remained gradual and by 1988 student population still remained less than 10,000. It is noteworthy that in 1982 no enrolments were recorded in Kenya’s public universities. This was due to the government direc-tive that led to the closure of these universities after the attempted coup d’état of August 1982. It was a decision taken by President Moi’s government because, it was believed, university students had been sympathetic to the coup plotters and even came out to openly support the coup on the day it was staged. Enrolments appear to have stagnated between 1990 and 1999, which coincides with the period when admissions into public universities were capped at 10,000 based on Structural Adjustment Programme (SAP) recommendations by the World Bank for cost containment in publicly provided university education (Wandiga, 1997). The post 1999 period has seen a tremen-dous increase in university enrolments. Between 1999 and 2007, total enrolments in public universities increased by 155.2 percent from 38,043 to 97,107. This was as a result of the opening of private entry streams in all public universities coupled with the establishment of two more fully fledged public universities; Maseno and Masinde Muliro universities and the opening up of more constituent colleges.
Figure 20: University enrolment trends 1971/72-2007/08 academic years
Source: Compiled from Republic of Kenya (1974-2010), Statistical Abstract; Republic of Kenya (1999-2009), Economic Survey; MOE, Education Statistical Booklet (various).
Policy Shifts and their Impact on Access and Quality of Basic Education This section reviews the impacts of past driving factors including the, political pronouncements, policy and legal frameworks, curriculum innovations and paradigm shifts which have shaped the present education provision situ-ation in Kenya both directly and indirectly. Although the indirect effects can be said to be residual in nature, their impacts nonetheless, continue to shape the present.
Post-Independence Quest for Qualified Replacement ManpowerThe education policy at independence in 1963 placed greater emphasis on the expansion of higher education with the aim of providing highly skilled personnel to replace the departing colonialists. Towards this end, the new

95Institute of Economic Affairs
government set up the Ominde Commission in 1963 to assess the existing education resources and give policy guidelines for education. Among other things, this report stated that “at present stage of the development of the country, secondary school is not only the place of education for higher responsibility, it is also the door to the modern world; it has almost become a symbol of modernity” (Republic of Kenya, 1964:68).
Although Abagi (1999) noted that the 1963 KANU Manifesto and the Sessional Paper No. 10 of 1965 supported the Ominde Commission by committing to offer seven years of free primary education, at that point, policy pronouncements indicated that secondary, commercial, technical and higher education were considered more important than primary education. As a result, education in high school and in public universities became highly subsidized by government while less investment was put on primary education (Republic of Kenya, 1964). The government thus placed more emphasis on the expansion of higher levels of education while at the same time, providing facilities for a gradual increase in primary school enrolment (Bogonko, 1992; Sifuna, 1990). Diminished state focus on primary education is evident from the fact that, although enrolment at primary school improved, the rate of increase over the period 1964-69, for example was only 8.9 percent from 1,110,899 to 1,209,670 pupils.
The Impact of Presidential Decrees on the Provision of Free Primary Education (FPE)A major policy shift in 1973 emerged in the form of a presidential decree that put into effect the provision of “free” education in the first four grades of primary schooling. This had a dramatic positive quantitative impact as enrol-ment in class one in 1974 rose by a million (Abagi, 1999, Sifuna, 2007) where total enrolment figures for standards 1-4 pupils increased from 1.8 million in 1973 to 2.8 million. In 1978, the government further abolished all forms of school levies in all public schools and in the following year, it introduced the free milk scheme for primary school-going children. The two measures increased enrolment from 2,994,849 pupils in 1978 to 3,698,241 in 1979; an increase of 23.48 percent. Most recently, in its review of the FPE programme declared by the new govern-ment in 2003, Elimu Yetu Coalition (2003) documents an increase of 104 percent in enrolments from 6,131,000 in 2002 to 7,208,100 in 2003. Looking and the access dynamics in the post-Universal Primary Education (UPE) pronouncements of the past, the challenge, therefore , is in sustaining the gains made from the latest attempt by the Kenya government at UPE.
The Emergence of Concern over Quality and RelevanceThe preoccupation with mere expansion of secondary and tertiary education lost its allure to issues of quality and relevance of education in the early 1970s. This change was necessitated by two factors. The first was an increase in the cost of education due to quantitative expansion at all levels, and the second factor was the difficulty of obtaining wage employment due to an influx of primary and secondary school leavers against declining opportu-nities (Republic of Kenya, 1976). Coincidentally, by this time the education sector in Kenya was characterized by two main features which were central to the emerging problems. First, formal education was seen by the public as the best path to individual and societal economic advancement. Second, as noted by the Gachathi report, “it also became evident that the objective, structure, and content of the present formal education system were highly selective. The aim of the system appeared to produce few individuals who were well equipped for placement in the modern formal sector of the economy, the large majority of Kenyans were left to survive on the less remunerative means (Republic of Kenya, 1996: ix)” In addition, the 1970s were also characterised by heightened rural-urban migration that robbed these areas of their most productive workforce. This trend further strengthened the quality debate and emerging assertions that the education system was producing graduates with a white-collar job mind set (Abagi, 1999).
The Use Curriculum Innovation to Solve the Unemployment ProblemBy early 1970s, it had become obvious that the existing education model was not going to solve the emerging unemployment problem. In its efforts to address the problem, the government embarked on diversification of the curriculum as well as expansion of technical/vocational education institutions. Towards this end, village polytech-nics that focus on training skills were established in almost every district. By 1970, there were 15 technical schools and, as indicated in the 1970-74 Development plan, their enrolment levels were to be expanded (Anderson, 1970;

96Youth Research Compendium
Sifuna, 1992). The construction of a National Industrial and Vocational Centre (NIVTC) in Nairobi was also pro-posed by the government around the same time. The Kenya polytechnic was also expanded to offer a wide range of technical and industrial courses with aid from UNESCO and other donors. With technical assistance from the Swedish International Development Authority (SIDA), the government also invested on ambitious programmes of expanding technical secondary schools and modernizing their workshops through in the early 1970s. These schools had a dual track of academic and vocational education. Industrial education was also introduced in 35 secondary schools. The Canadian International Development Agency (CIDA) funded the building of a technical teachers’ college to train teachers for vocational subjects (Republic of Kenya, 1976:51). The failure of curriculum innovation towards a more practical technical education was, however, evident from the political slogans and pronouncements of 1970s among politicians, policy makers and planners which urged people to “go back to the land”. The earlier enthusiasm for the expansion of secondary and tertiary education had subsided. The influence of Foster’s (1965) paper titled “Vocational Education Fallacy” resonated strongly with Kenyan educational re-searchers who started questioning the relevance of calls for vocationalization of education (Sifuna, 1990; Sheffield, 1974).
The Impact of Education System Overhaul from 7-4-2-3 to 8-4-4 The overhaul of the system of education was necessitated by the fact that, despite the government and develop-ment partners’ concentration of resources, the immense political commitment to the education sector, problems persisted through 1980s. The education budget had become disproportionately high. Compared to 18 percent at independence, budget allocations to the sector had risen to 30 percent of the recurrent budget by 1983. The coun-try was experiencing stagnation and reduction in enrolment at both primary and secondary levels, while gender disparities remained wide at the tertiary level (Abagi, 1999). A number of studies indicated that the number of chil-dren excluded from formal schooling, especially in ASAL areas continued to increase. The quality and relevance of education was being questioned, as education was examination-oriented and focused more on rote learning (Court, 1979, Republic of Kenya, 1981; Eshiwani, 1986; Sifuna, 1997).
In 1981, the government made a decision to change the structure of the education system from the 7-4-2-3 system of education that was inherited from the colonial government to the 8-4-4 system. The new system was a product of the presidential working party on the second national University in Kenya. Although the recommendation to change the system of education was not part of the terms of reference given to the working party, the government decided to go along with the recommendation to re-structure the entire education and training systems with the view of making them more practical (Abagi, 1999, Ojiambo, 2009). The 8-4-4 system of education came into ef-fect in January 1985. The rationale for the new system was that it would respond to the challenges of the national development and enhance the participation of the youth in the national development endeavour (Republic of Kenya, 1981; 1988a). The shift in concern from access to education to the relevance and quality of education was evident not only in the shift to the 8-4-4 system, but also in the number of curriculum innovations that took place in the 1980s (Abagi, 1999).
The Secondary Admission Quota System and its inequality consequencesThe introduction of the quota system of admission into secondary schools in 1980s was another major policy shift that has had a major ‘legacy effect’ on equity in access to education. In this policy, 85 percent of the students being admitted into provincial and district secondary schools were to originate from those regions (Republic of Kenya, 1998). Although the policy was understood to have been intended for increasing regional equity in the provision of education and minimizing costs to parents by reducing travelling expenses to schools, in essence, in-creased inequity and inequality, with regions having less resources getting relatively less access to education and, hence, performing poorly in national examinations (Abagi, 1999; Ojiambo, 2009). In his analysis on the impact of politics on education, Amutabi (2003) contends that the introduction of the quota system was merely an attempt to ensure that prospective Form1 seekers from politically correct regions, with better developed secondary school systems, dominated access to schools within those regions.

97Institute of Economic Affairs
Structural Adjustment Programmes and their Impacts on Costs Recovery and Private Costs of EducationAs a result of the Structural Adjustment Programmes (SAPs) imposed by the World Bank and the International Monetary Fund (IMF) in 1980s, new policies in cost recovery in education were introduced by the government. Through Sessional paper No. 6 of 1988, the government withdrew financial support for teaching and learning materials in primary and secondary schools and introduced cost-sharing in the educational sector whereby parents were to foot the teaching-learning material costs. On the other hand, the role of constructing physical facilities including classrooms and workshops was now allocated to the communities. The government’s sole role was now confined to teachers’ salaries and subsidizing costs of special science equipment (Republic of Kenya, 1988b). The philosophy behind the provision of free education which was mooted at independence and further reiterated by government in 1975 was revised by the government following donor pressure. Cost-sharing was also extended to the university level of education. At universities, strategies such as “pay-as-you-eat” were introduced and trainees in teachers’ colleges now had to pay fees (Wandiga, 1997).
Coupled with the policy of cost-sharing, this period also marked the gradual re-allocation of public financial re-sources from primary to tertiary education. In 1979 and 1980s, 60 percent of the recurrent budget in education went to primary education and 14 percent to secondary and university education. In contrast, by 1996, primary education received 50 percent of the education budget (Abagi, 1999). By the same year, four more universities had been created, with an enrolment of about 40,000 students. Following the unprecedented expansion of uni-versity education, the university budget grew to claim 20 percent of the total budget in 1990/91 and 16 percent in 1996/97 (Ministry of Education, 1996).
The Harambee School MovementCommunity financing of education through the Harambee9 movement has been a major feature of Kenyan edu-cation system. The roots of movement can be traced to the colonial days, when local communities established and supported their own institutions, which were known as “independent schools”. They were independent in the sense that they were supported by the communities in contrast to the colonial state or missionaries. However, after independence, the Harambee school movement in its present form, became prominent (Mwiria, 1990). The biggest contribution of the Harambee schools in the immediate post independence period was the expansion of access to secondary education among Africans whose access was greatly limited by the colonial regime (Schilling, 1972). In the recent years, what were formerly Harambee schools that served communities that were erstwhile under-supplied with government supported secondary education have since been taken up by the government and converted into district or provincial secondary schools. Today, these schools have significantly expanded access to secondary education. However, it would appear that by default, the Harambee system also skewed the provision of secondary education more towards high potential regions whose populations already had resources to pool together for funding these schools in the first place (Mwiria, 1990). The development of community secondary schools in Kenya have also been shown to have intensified with the introduction of cost-sharing policy and tended to be concentrated in urban informal settlements and other deprived areas (Onsomu, Mungai, Oulai, Sankale and Mujidi, 2004).
A recent policy shift in education relates to the draft Master Plan on Education and training that was aimed at guiding the development of the country’s education sector in the 21st Century. The plan identifies problems that exist in relation equity and relevance of education and training to labour market needs. The Master Plan also fo-cuses on the country’s ultimate goal becoming a newly industrialized country (NIC) by the year 2020. This drive towards NIC status provides the impetus for producing relevant human resources through education and training (Republic of Kenya, 1994).
9 Harambee is Swahili for pulling together towards common social-economic ends

98Youth Research Compendium
Access, Participation and Disparities in Youth Education and Implications for the Present State of AffairsAccess and Participation in Secondary Education This section delves into an analysis of education access trends over the last ten years. Except for cases where data were not available, 1999 was set as the base year to analyse trends in secondary education spanning the last decade and the implications these have affected the present state of secondary education.
Primary to Secondary Transition RatesAs an indicator of learner survival beyond the primary education cycle, the primary secondary transition rate shows the proportion of primary school completers who proceed to Form 1 in the subsequent year. Analysis on Table 23 shows that the overall transition rate remained below 47 percent between 1999 and 2004. National transition rates rose above the 50 percent mark for the first time in 2005 with boys transiting at 57.7 percent and girls at 54.2 percent. The 2007 transition rate further increased to 59.6 percent. The increase in the transition rates can, in part, be attributed to re-entry of drop outs associated with FPE.
Table 23: Primary to Secondary Transition Rates, 1998-2007
Year in Std 8
Year in Form 1
Enrolment In Std 8 (‘000) Enrolment In Form 1 (‘000) % Transiting to Form 1
Boys Girls Total Boys Girls Total Boys Girls Total1998 1999 221.0 215.3 436.3 105.2 95.8 201.0 47.6 44.5 46.11999 2000 246.6 228.0 474.6 108.1 97.2 205.3 43.8 42.6 43.32000 2001 235.6 227.8 463.4 112.2 103.4 215.6 47.6 45.4 46.52001 2002 261.7 246.6 508.3 116.2 105.2 221.5 44.4 42.7 43.62002 2003 296.9 244.5 541.3 129.4 121.7 251.1 43.6 49.8 46.42003 2004 280.8 267.5 548.3 132.6 118.6 251.2 47.2 44.3 45.82004 2005* 343.0 314.8 657.7 198.0 170.6 368.3 57.7 54.2 56.02005 2006 335.5 307.9 643.5 195.7 173.0 368.7 58.3 56.2 57.32006 2007 372.3 332.7 704.9 210.3 210.1 420.5 56.5 63.2 59.6
Source: Society for International Development, 2006, and Statistics Section, MoE
From the data in Table 23, it is also noteworthy that during the period under review, it is only in two transition years 2002-2003 and 2006-2007 when the proportions of girls transiting from Std 8 to Form 1 were higher. In terms of absolute numbers, however, the number of boys transiting to Form 1 remained consistently higher for the entire period. Considering the fact that there is near gender parity during standard 1 entry, these findings sug-gest that the female youth is more disadvantaged in terms of access to secondary education.
Gross Enrolments in Secondary Education As shown on Figure 21, during the 1999-2007 period, there was a significant increase in the population of students attending secondary education from 738,918 in 1999 to 1,180,267 in 2007, representing a 60 percent increase. On average, there was a 6.6 percent annual increase in the population of students attending secondary school dur-ing the period under review.

99Institute of Economic Affairs
Figure 21: National Secondary Enrolment Trends, 1999-2007
Sources: Author based on data in MoEST 2005; MoE EMIS, 2008
Secondary School Enrolment by FormAvailable data (Table 24 and Table 25) shows that total Form 1 enrolments increased by 198,554 from 189,119 in 1999 to 387,673 in 2008, representing a 95 percent increase. Over the same period, Form 4 enrolments also rose by 95 percent from 152,124 in 1999 to 297,301 in 2008. The highest increments in form1 enrolments were recorded during the 2000-2001 transition (+12.9 percent) and again during the 2007-2008 transition (+23.9 per-cent). The significantly high increase in Form1 enrolments between 2007 and 2008 can in part be attributed to the introduction of the subsidy in secondary school tuition which has in effect made secondary schooling more afford-able particularly in day schools which are becoming increasingly popular outside the non-poor groups. In addi-tion, affordability of secondary education has significantly improved access among the youth from poor families who could not afford the unsubsidized costs. Another factor to which increments in secondary school enrolments can be attributed is the re-entry policy for student-mothers who, a majority of whom never got an opportunity to rejoin school in the past.

100Youth Research Compendium
Tabl
e 24
: Se
cond
ary
Scho
ol E
nrol
men
t by
Form
, 199
9-20
03
1999
2000
2001
2002
2003
Form
MF
TM
FT
MF
TM
FT
MF
T
I97
,231
91,88
818
9,11
911
0,053
98,70
620
8,75
912
1,992
113,7
5423
5,74
613
6,006
120,7
4025
6,74
612
9,403
121,6
6025
1,06
3
II98
,066
86,92
218
4,98
810
4,078
93,55
019
7,62
810
6,725
95,58
920
2,31
410
8,576
97,47
020
6,04
612
1,765
116,2
8123
8,04
6III
90,29
377
,871
168,
164
98,61
087
,346
185,
956
103,3
3990
,351
193,
690
99,17
997
,470
206,
046
106,6
8897
,220
203,
908
IV82
,632
69,49
215
2,12
491
,700
78,38
117
0,07
198
,920
86,98
718
5,90
799
,303
85,88
118
5,18
410
2,732
84,20
718
6,93
9
Tota
l37
3,440
327,0
9870
0,53
840
4,441
357,9
7376
2,41
443
0,976
386,6
8181
7,65
744
3,064
393,4
5783
6,52
146
0,588
419,3
6887
9,95
6
Sour
ce: K
enya
Nat
iona
l Bur
eau
of S
tatis
tics;
Stat
istic
al A
bstr
acts
200
3-20
09, E
cono
mic
Sur
veys
200
2-20
09
Tabl
e 25
: Sec
onda
ry S
choo
l Enr
olm
ent b
y Fo
rm, 2
004-
2008
1*
2004
2005
2006
2007
2008
Form
MF
TM
FT
MF
TM
FT
MF
TI
146,1
4512
6,557
272,7
0213
9,469
124,3
8426
3,853
161,5
8813
7,873
299,4
6117
0,297
142,6
7231
2,969
207,2
1218
0,461
387,6
73
II12
4,585
114,0
5323
8,638
122,8
6710
9,471
232,3
3813
2,015
119,0
7725
1,092
173,4
4414
9,602
323,0
4619
6,500
163,1
6435
9,664
III11
7,975
105,1
1822
3,093
120,9
1210
7,770
228,6
8212
0,978
115,4
4323
6,421
157,9
0313
4,765
292,6
6818
1,775
155,7
9833
7,573
IV10
1,301
89,41
619
0,717
110,9
0998
,367
209,2
7613
1,471
111,6
1524
3,106
137,7
4911
3,835
251,5
8416
1,026
136,2
7529
7,301
Tota
l49
0,006
435,1
4492
5,150
494,1
5743
9,992
934,1
4954
6,072
484,0
081,0
30,08
063
9,393
540,8
741,1
80,26
774
6,513
635,6
981,3
82,21
1
Source:R
epub
licofK
enya;K
enyaNationalB
ureauofStatistics,StatisticalAbstracts2003-2009,E
cono
micSurveys2002-2009
* Thelatestenrolmentd
ataavailablefrom
themostcrediblesource;theM
oEEMISsectio
ndo
notin
clud
eenrolm
entand
otherin
dicatorsfo
r2009.

101Institute of Economic Affairs
Gender Disparities in National EnrolmentComplete data on secondary school enrolment were available for the period spanning 1999-2007. In terms of gender, the population of male students enrolled in secondary schools has remained consistently higher than those of the females for entire period under review. As illustrated on Figure 22 the Gender Parity Index (GPI) during the period under review was less than 1 implying that there were more boys relative to girls accessing secondary education.
Figure 22: Secondary School Enrolments by Gender, 1999-2007
Sources: MoE, 2008, Republic of Kenya, Statistical Abstracts 2000-2009
National Secondary Gender Parity Levels The Gender Parity Index (GPI) shows the number of enrolled females as a proportion of enrolled males. Where there is parity in enrolment, the GPI has a value of one and if the number of enrolled females is less than that of males, the GPI will be less than one. In instances where more females than males are enrolled, the GPI has a value of more than one. At the national level, the overall GPI depicted a near parity during the period 1999 to 2001, before declining marginally to 0.92 in 2002 as illustrated in Figure 23. Again in 2003, possibly owing to the knock on effect of FPE, which resulted in a surge in female enrolment in secondary schools, the national GPI rose in fa-vour of girls to 1.04 before reverting to a declining trend ending with the lowest of 0.82 in 2007.
Figure 23: Secondary Gender Parity Index by year, 1999-2007Sources: Statistics Section, MoEST and EMIS, MoE

102Youth Research Compendium
Regional Disparities in Primary to Secondary Transition Results on Table 26 indicate that by the base year, 1999, the Primary to Secondary transition rate was lower than the national average of 39.9 percent in the following provinces; Coast (32.6 percent) and Nairobi (29.0 percent), Nyanza (39.4 percent), Rift Valley (32.9 percent) and Eastern (38.7 percent). It is noteworthy that in 2004, imme-diately after the re-introduction of the free primary education (FPE) programme in Kenya, significant increments in the primary to secondary transitions were recorded in all the eight provinces. Comparatively, Secondary school education seekers in Coast, Nyanza and Rift Valley provinces increased significantly.
Table 26: Provincial Primary to Secondary Transition Trends in Transition
1999 2000 2001 2002 2003 2004 2005 2006 2007 2008*Coast 32.6 31.0 33.4 32.5 31.0 52.1 34.0 39.0 40.0 46.1Central 46.3 48.6 46.9 57.3 58.5 59.6 63.7 64.7 57.4 64.2Eastern 38.7 36.3 38.2 47.5 48.9 51.2 49.4 53.5 46.8 51.2Nairobi 29.0 29.6 27.0 32.5 33.5 34.5 50.9 58.3 38.0 45.9R. Valley 32.9 34.2 37.2 21.1 21.6 41.7 48.5 54.3 42.5 46.7Western 53.2 49.4 51.0 52.6 53.7 55.8 52.0 59.8 49.5 60.1Nyanza 39.4 42.4 50.0 35.4 36.1 47.3 57.1 63.6 50.2 56.8N. Eastern 43.2 46.4 52.8 42.9 43.8 44.9 45.1 44.2 40.5 45.7Total 39.9 40.1 40.9 41.7 42.6 50.6 52.1 59.7 59.7 59.9
Source: Kenya National Bureau of Statistics, 2003-2009
Illustrations on Table 26 show that at the provincial level, primary to secondary transition rates remained highest in Western province between 1999 and 2000. In 2001, the highest transition rates were recorded in North Eastern province. Beginning 2002, Central province has consistently registered highest transition rates.
Provincial Gross Secondary EnrolmentTotal enrolment increased from 738,918 in 1999 to 926,149 in 2004, representing an increase of 25.3 percent. This was as a result of increase in enrolments in both public and private schools, which were recorded at 661,824 and 77,094 respectively in 1999; and 841,604 and 84,541 in 2004 respectively (MoE, 2005). The highest annual increase of 13 percent was recorded between 2002 and 2003 (Table 27).
Table 27: Provincial Gross Secondary Enrolment
1999 2000 2001 2002 2003 2004 2005 2006 2007Province
Coast 42,076 42,353 43,284 42,136 49,356 55,367 48,291 58,473 65,304
Central 153,770 156,618 165,707 169,416 171,281 187,392 181,078 204,142 223,244
Eastern 136,085 131,005 140,224 144,803 166,887 177,103 172,678 183,518 214,037
Nairobi 26,004 23,628 19,429 16,700 20,212 29,708 28,459 29,694 49,728
Rift Valley 153,688 155,557 159,604 159,447 183,258 204,374 204,613 243,148 266,305
Western 96,717 94,009 91,673 98,232 109,503 118,226 117,303 120,338 145,697
Nyanza 125,416 129,675 128,347 132,737 155,670 148,469 16,9644 182,982 206,994
N. Eastern 5,162 5,241 5,255 5,224 12,451 5,511 6,084 7,785 8,997
Total 738,918 738,086 753,523 768,695 86,8618 926,150 928,150 1,030,080 1,180,306Source: Republic of Kenya (various), Kenya National Bureau of Statistics, Statistical Abstracts 2003-2009
As illustrated on Figure 24, central province recorded the highest enrolments between 1999 and 2002. The Rift Valley province on the other hand has continued to record the highest enrolments since 2003. The bottom three provinces in terms of secondary school populations, in descending order, have been; Coast, Nairobi and North Eastern Provinces. Although these trends show regional disparities in terms of absolute enrolments, they do not

103Institute of Economic Affairs
necessarily illustrate inequality. This is more so because, the densely populated parts of Rift Valley and Central have higher densities of children and youth of school-going-age, hence higher enrolments relative to other less densely populated regions. However, this very high potential nature has a profound impact on access to paid-for secondary school education because average household incomes are higher in such regions thus giving the youth from such regions an upper hand in accessing secondary education.
Figure 24: Provincial Secondary School Enrolment Trends
Sources: Republic of Kenya; Statistical Abstracts, 1999-2007
By relating the data on enrolments to those on primary to secondary transition rates, it emerges that although Rift Valley province records highest secondary school enrolments, its low primary to secondary transition rates suggest that it also has the highest level of wastage in terms of youth exclusion from participating in secondary education, at least in gross numbers.
Provincial Secondary Gender Parity Index There were glaring regional differences in the gender parity index. While the GPI remained comparatively higher in Central, Western, and Eastern provinces during the period under review, Nairobi10 and North Eastern have reg-istered significantly low GPIs. In particular, during the period 1999 to 2004, the overall GPI depicts near parity as indicated in Table 6.3. However, there exist regional gender disparities across the provinces. North Eastern and Nairobi provinces depict the widest disparities ranging from 0.54 in 1999 to 0.73 in 2004 as compared to Central Province with 1.09 in 2004 and 1.3 in 1999 (Table 28).
Table 28: Secondary Gender Parity Index by Province, 2002-2007
Province 1999 2000 2001 2002 2003 2004 2005 2006 2007Coast 1.04 1.07 1.02 0.98 0.93 0.85 0.89 0.80 0.78
Central 1.30 1.22 1.17 1.12 1.20 1.09 1.00 0.99 0.96
Eastern 1.12 1.10 1.05 1.01 1.10 1.02 0.96 0.94 0.86
Nairobi 0.54 0.68 0.64 0.61 0.55 0.73 0.72 0.69 0.78Rift Valley 0.97 0.98 0.94 0.90 1.01 0.98 0.83 0.82 0.82
Western 1.10 1.07 1.02 0.98 1.22 1.06 0.84 0.91 0.80
10 The GPI for secondary education in Nairobi is particularly low due to the large poor population in informal settlements. Among such households, selective enrolment of boys by their families, to the disadvantage of girls, is the norm rather than exception
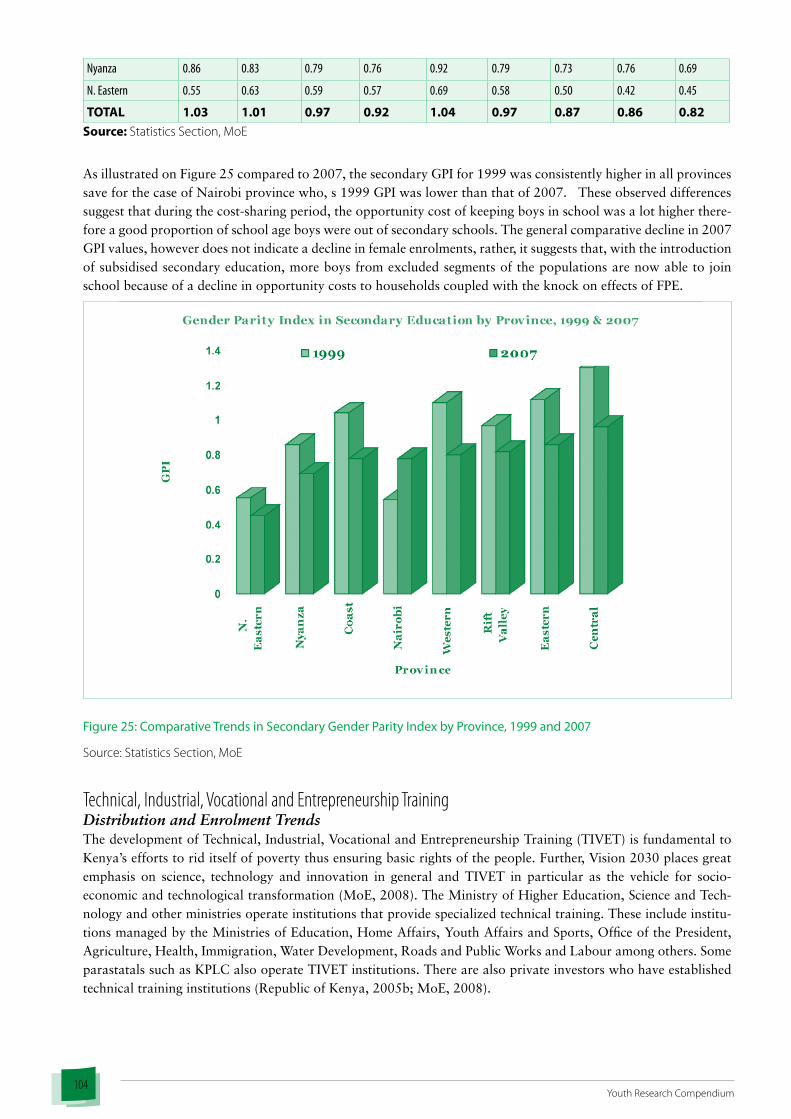
104Youth Research Compendium
Nyanza 0.86 0.83 0.79 0.76 0.92 0.79 0.73 0.76 0.69
N. Eastern 0.55 0.63 0.59 0.57 0.69 0.58 0.50 0.42 0.45
TOTAL 1.03 1.01 0.97 0.92 1.04 0.97 0.87 0.86 0.82Source: Statistics Section, MoE
As illustrated on Figure 25 compared to 2007, the secondary GPI for 1999 was consistently higher in all provinces save for the case of Nairobi province who, s 1999 GPI was lower than that of 2007. These observed differences suggest that during the cost-sharing period, the opportunity cost of keeping boys in school was a lot higher there-fore a good proportion of school age boys were out of secondary schools. The general comparative decline in 2007 GPI values, however does not indicate a decline in female enrolments, rather, it suggests that, with the introduction of subsidised secondary education, more boys from excluded segments of the populations are now able to join school because of a decline in opportunity costs to households coupled with the knock on effects of FPE.
Figure 25: Comparative Trends in Secondary Gender Parity Index by Province, 1999 and 2007
Source: Statistics Section, MoE
Technical, Industrial, Vocational and Entrepreneurship Training Distribution and Enrolment Trends The development of Technical, Industrial, Vocational and Entrepreneurship Training (TIVET) is fundamental to Kenya’s efforts to rid itself of poverty thus ensuring basic rights of the people. Further, Vision 2030 places great emphasis on science, technology and innovation in general and TIVET in particular as the vehicle for socio-economic and technological transformation (MoE, 2008). The Ministry of Higher Education, Science and Tech-nology and other ministries operate institutions that provide specialized technical training. These include institu-tions managed by the Ministries of Education, Home Affairs, Youth Affairs and Sports, Office of the President, Agriculture, Health, Immigration, Water Development, Roads and Public Works and Labour among others. Some parastatals such as KPLC also operate TIVET institutions. There are also private investors who have established technical training institutions (Republic of Kenya, 2005b; MoE, 2008).

105Institute of Economic Affairs
Number and Distribution of TIVET Institutions There are two (2) Polytechnic University Colleges, Kenya Polytechnic University College in Nairobi and Mombasa Polytechnic University College in Coast Province, two national polytechnics, Kisumu and Eldoret and one Techni-cal Teachers College, KTTC, in Nairobi. By 2007, there were nineteen (19) technical training institutes (TTIs) and seventeen (17) Institutes of Technology (ITs) spread across all provinces but with greater concentration in urban areas and high potential areas. The distribution of the TIVET institutions has a bearing on access to TIVET and also disparities in access across regions. There was no significant change in the number of TTIs and ITs in the country between 2002 and 2007, however, the number of Youth Polytechnics and private sector TIVET institu-tions rose by 8 percent and 16 percent, respectively, over same period.
Table 29: Distribution of TIVET Institutions
Ministry/Organization TypeNo. of Institutions2002 2007
Ministry of Education Science & Technology Polytechnic University Colleges 0 2National Polytechnics 4 2Technical Training Institutes 19 19Institutes of Technology 16 17Kenya Technical Teachers College 1 1
Other Ministries Vocational and skills Training Centres 4 4Youth Polytechnics 600 650Other Technical Training institutions 40 40
Private Sector, Religious Organizations and NGOs Vocational and Skills Training Institutions 800 930TOTAL 1484 1665
Source: MoE, 2008
Enrolment in TIVET InstitutionsNational PolytechnicsTotal gross enrolments in National polytechnics remained on a general upward trend between 1999 and 2006. There were however some marginal declines in the between some years; 1999-2000 (-5.9 percent), 2002-2003 (-4.0 percent), 2003-2004 (-5.5 percent). A significant decline of 46.5 percent was registered from 20,495 in 2006 to 10,974 in 2007. The decline in enrolments in National polytechnics is attributable to the fact that the Kenya and Mombasa polytechnics have since been elevated to Polytechnic University status. This has lead to the elimination of some non-degree courses for which majority of students enrolled (Figure 26).
Figure 26: Enrolments at National Polytechnics 1999-2007
Sources: Republic of Kenya (2005-2009): KNBS, Statistical Abstracts

106Youth Research Compendium
Other TIVET InstitutionsSave for the marginal decline in gross enrolments in the other TIVET institutions from 31,019 in 1999 to 31,113 in 2000, total enrolments in these institutions have been on an upward trend. Between 1999 and 2003, enrolments increased by 36 percent. A significant increase in enrolments of 139.2 percent was recorded between 2006 and 2007 from 50,645 to 121,136. This increment was attributable to an increase in youth polytechnic enrolments (Figure 27)
Figure 27: Enrolments in Other TIVET Institutions 1999-2007
Source: MoE, 2008
Gender Disparities in Polytechnics and other TIVET institutionsIn analysing gender trends and disparities in access to TIVET, enrolment trends spanning 1999-2007 were consid-ered for national polytechnics and other TIVET Institutions that include TTIs, ITs, and Youth Polytechnics.
National PolytechnicsData for 1999 enrolments show that access to education in national polytechnics, remained disproportionately skewed in favour of males with females constituting about 39 percent. In 2000, female participation declined sig-nificantly by about 10 percentage points to 29.2 percent of all enrolments. National polytechnic enrolment data for subsequent years further show that the female enrolments have remained below the 38 percent mark since.
Other TIVET InstitutionsTrends in combined gender enrolment for other TIVET institutions which include; Technical training institutes, Institutes of technology and Youth polytechnics presented in Table 4.4.7, show that females dominate enrolments in these institutions. In 1999, for example, the number of enrolled females, 16,744 constituted 54 percent of all total enrolments. Female domination of enrolment in these institutions increased to 56.6 percent in 2000 before rising again to 57.0 percent in 2001. Over the subsequent years, there have been fluctuations in the female share of all enrolments but this has remained above the 52 percent mark. However, the 2007 data suggest a significant decline in female participation to 47.8 percent.

107Institute of Economic Affairs
Tabl
e 30
INST
ITUTIO
N19
9920
00
2001
20
02
2003
20
04
2005
20
06
2007
M
FM
FM
FM
FM
FM
FM
FM
FM
F
Nat
iona
l Po
lyte
chni
cs
Keny
a 2,7
201,7
392,9
791,2
284,5
231,3
8581
1948
3477
3848
6363
8634
9964
1035
4964
0533
2926
4211
56
Mom
basa
1,7
841,1
411,9
4380
13,5
671,0
9231
4914
0126
4713
9027
7824
3631
1126
3132
6527
1016
9075
4
Kisum
u 68
944
164
626
678
524
094
741
093
742
111
2447
613
4961
914
1071
016
5912
99
Eldor
et
664
425
833
343
647
515
1527
660
1523
684
1675
725
1759
820
1834
832
1207
567
SUB-
TOTA
LS58
5737
4664
0126
3895
2232
3213
742
7305
1284
573
5811
963
7136
1262
976
1912
914
7581
7198
3776
TOTA
L96
0390
3912
754
21,04
720
203
1909
920
248
2049
510
,974
% b
y G
ende
r61
.039
.070
.829
.274
.725
.365
.334
.763
.636
.462
.637
.462
.437
.663
.037
.065
.634
.4
Oth
er T
IVET
TTTIs
5942
3799
4960
3280
5295
4160
5547
4539
7436
5648
9653
8350
9846
8684
9925
8731
8508
6526
ITs48
7520
4043
8028
9546
7436
7248
9840
0747
9939
2747
1537
5549
0439
4349
6141
0455
3450
40
SUB-
TOTA
LS
Yout
h Poly
.3,4
5810
,905
4,150
11,45
04,9
8012
,023
5975
1262
471
7113
255
8605
1391
886
9114
196
8714
1421
015
,528
15,48
9
SUB-
TOTA
LS14
275
1674
413
490
1762
514
949
1985
516
420
2117
019
406
2283
022
973
2602
324
441
2682
323
600
2704
529
570
2705
5
TOTA
LS31
,019
31,1
1534
,804
37,5
9042
,236
48,9
9651
,264
50,6
4556
,625
% b
y G
ende
r46
.054
.043
.456
.643
.057
.043
.756
.345
.954
.146
.953
.147
.752
.346
.653
.452
.247
.8
Gra
nd T
otal
4062
240
154
4755
858
637
6243
968
095
7151
271
140
6759
9
Tabl
e 30
: Enr
olm
ent b
y G
ende
r In
TIVE
T In
stitu
tions
; 200
2 –
2008
Sour
ce: R
epub
lic o
f Ken
ya (v
ario
us),
Keny
a N
atio
nal B
urea
u of
Sta
tistic
s, St
atis
tical
Abs
trac
ts 2
002-
2008

108Youth Research Compendium
Regional Disparities in Polytechnics and other TIVET InstitutionsIn terms of access to TIVET, there are relatively high enrolments in Nairobi, Rift Valley, Nyanza, Central and Eastern provinces which together account for 84.9 percent of the total enrolments in TTIs and ITs. The remaining 15.1 percent is the contribution of the other three provinces. In particular, Rift Valley (4,294; 20 percent), Nyanza (4,028; 19 percent), Nairobi (3,504; 17 percent), Eastern (3,087; 15 percent), and Central (3,028; 14 percent) were the five top ranking provinces, respectively in terms of enrolments. However, the population of those enrolled in these institutions is quite small relative to the estimated number of youth who are left out of other education and training institutions.
Table 31: Enrolment By Course And Gender in TTIs & ITs by Province, 2007
Courses
ProvinceNa
irobi
R. Va
lley
Wes
tern
Nyan
za
Cent
ral
Easte
rn
Coas
t
North
Easte
rn
Tota
ls
Engineering Male 1163 1640 291 923 1054 950 133 13 5905Female 71 298 50 31 62 181 1 3 697Total 1234 1938 341 954 1116 1131 134 16 6602
ICT Male 127 214 72 18 149 39 45 39 703Female 67 199 87 31 175 37 77 37 710Total 194 413 159 49 324 76 122 76 1413
Health/ Applied Science
Male 391 63 79 353 104 … 120 … 1038Female 529 96 194 991 136 … 100 … 1946Total 920 159 273 1344 240 … 220 … 2984
Business Studies Male 413 515 261 425 399 390 89 27 2519Female 538 489 362 726 580 577 97 41 3410Total 951 1004 623 1151 979 967 106 68 5929
Institutional Management
Male 36 44 25 52 85 66 13 … 522Female 153 161 104 310 238 417 214 … 1710Total 189 205 129 362 323 483 347 … 2232
Agriculture Male … 240 203 95 … 121 29 … 573Female … 370 76 37 … 104 … … 587Total … 610 279 132 … 225 … … 1160
Clothing Technology Male … … 0 … 10 12 … … 22Female … … 32 … 36 230 … … 298Total … … 32 … 46 242 … … 320
Others Male 14 5 … 8 … … … 27Female 2 0 … 28 … … … 30Total 16 5 … 36 … … … 57
Totals Male 2144 2681 931 1874 1801 1578 601 79 11689Female 1360 1613 905 2154 1227 1509 622 44 9434Total 3504 4294 1836 4028 3028 3087 1223 123 21123
… No enrolments Recorded Source: DTE, MoE, 2008
TIVET enrolments reported in North Eastern, Coast and Western were still very low relative to the other prov-inces. The skew in access to TIVET draws in part from the fact that TIVET institutions are concentrated in regions with higher agro-economic potential coupled with higher aggregate demand in those regions arising from popula-tion demographics there. Political patronage has also played some role in the concentration of institutions in some parts of the country (Figure 28).

109Institute of Economic Affairs
Figure 28: Total enrolments in TTIs and ITs per Province, 2007
Soure: MOE, 2008
University EducationCurrently there are 23 legally recognized universities in Kenya. Seven are public universities while 21 are private. Of the 21 private universities, 11 are chartered12; four are registered3 while the remaining six have letters of interim authority13.
Access and Participation
Public Universities Admission PolicyAt the policy level, direct student admission in Kenyan universities, both public and private, is pegged on the attainment of a minimum Grade C+ in KCSE. However, not all the candidates who fulfil this requirement get automatic admission into public universities due to the limited number of places and inability of many families to meet the high cost of university education. In the 2003/04 academic year, for example, the Joint Admissions Board (JAB) admitted only 10,791 students (25.3 percent) into public universities out of the 42,721 who had attained the minimum qualification. The proportion of admitted female students compared to male students has remained lower over the years at below the 40 percent mark.
Secondary School-University Transition RatesTables 32 and 33 below present the changes in secondary-university transition trends in the period spanning 1999/2000 – 2008/2009 academic years. In the base academic year (1999/00), out of a total of 169,357 candidates who were registered for the KCSE in 1997, only 30,243 candidates constituting 17.9 percent met the minimum university entry requirement of C+ and above. In the base year, only 8,150 KCSE candidates who constituted 4.8 candidates were admitted to public universities. In the following 2000/2001 academic year, the transition rate rose marginally by 0.3 percent to 5.1 percent followed by another marginal increase of 1.1 percentage points to 6.2 per-cent during the 2001/2002 academic year. Although the population of registered KCSE candidates has increased in absolute terms from 169,357 during the 1997 exam year to 276,191 in the 2006 KCSE year, the effective increase
11 Chartered universities are those that have been fully accredited by CHE.12 Registered universities are those that started offering degrees before the establishment of CHE in 1985. CHE issued them
with certificates of registration upon their fulfilment of the requirements set out in the Universities Rules (1989).

110Youth Research Compendium
in the transition rate has only been marginal. In terms of gender equity, much as the number of male students admitted compared to female has remained higher, the proportion has declined from 64.6 percent in 1999/00 to 62.1 percent in 2002/03. This marginal decline suggests that if the fall in male proportions was driven by an at-tempt to improve gender equity in admissions, then the efforts are hardly effective. The main strategy that has been employed over the years to ensure progress towards gender equity in regular admissions in public universities has been the affirmative process where female candidates are admitted at a point below the entry cut off for males.
Table 32: Secondary to University Transition Rates, 1999/00-2002/03
KCSE Year 1997 1998 1999 2000 2001
Year of Admission 1999/00 2000/01 2001/02 2002/03 2003/04
No. % No. % No. % No. % No. %
Candidates Registered 169,357 100 173,792 100 178,608 100 194,798 100 198,356 100
No. qualified for admission (C+ and above)
30,243 17.9 30,666 17.6 40,471 22.7 42,158 21.6 42,158 21.6
Candidates Admitted
8,150 4.8 8,899 5.1 11,147 6.2 11,046 5.7 11,046 5.6
No. of Male 5,261 64.6 5,783 65.0 7,204 64.6 6,865 62.1 6,865 62.1
No. of Female 2,889 35.4 3,116 35.0 3,943 35.4 4,181 37.9 4,181 37.9
… No dataSource: Commission for Higher Education
Table 33: Secondary to University Transition Rates, 2004/05-2008/09
KCSE Year 2002 2003 2004 2005 2006Year of Admission 2004/05 2005/06 2006/07 2007/08 2008/09
No. % No. % No. % No. % No. %Candidates Registered 207,730 100 222,676 100 260,665 100 243,319 100 276,1912 100
No. qualified for admission (C+ and above)
49,870 24.0 58,240 26.2 68,040 26.1 62,926 25.9 74,282 26.9
Candidates Admitted
11,000 5.3 11,000 4.9 16,000 6.1 17,000 7.0 … …
No. of Male … … … … … … … … … …
No. of Female … … … … … … … … … …
… No data Source: Commission for Higher Education
As illustrated in Figure 29 the Secondary to University transition rates have fluctuated over the past ten academic years. The rate rose from 4.8 percent in 1999/2000 to a high of 6.2 percent during the 2001/2002 academic year. However, the rate declined in the subsequent admissions and remained below the 6 percent mark before rising again to 6.1 and 7.1 percent during the 2007/08 and 2008/2009 academic years, respectively.

111Institute of Economic Affairs
Figure 29: Secondary-University Transition Rate 1999/2000 -2007/2008
Source: Author, using data from CHE
These low Secondary-University transition rates are an indication of an almost elitist publicly provided university education. In effect, this leaves the majority of the candidates who qualify for university admission, with mean grades of C+ and above, to either compete for the marketized and expensive private entry scheme or opt for other less costly forms of tertiary education. In the worst of instances, many deserving cases for university are forced to terminate their education at the end of O-Level. Based on the existing data presented elsewhere on this paper it is argued here that, even though admissions through the private entry scheme appears to be improving access to university education by taking in more qualified students, it only helps in widening the inequality gap in access to University education. This is because, often, students from the more economically privileged families dominate such access. Efforts have been made by university education financing institutions such as HELB to offer future in-come contingent loans to students enrolled on the private entry scheme, however, the amount of full loan offered, KES 60,000, still constitutes an insignificant proportion of the unit-costed fees, which are as high as KES 500,000 for high-cost programmes such as medicine.
Student Enrolment in Public and Private UniversitiesTotal gross enrolments within individual public Universities have increased overtime. While the total gross enrol-ment in public universities was 50,704 during the 2000/01 academic year, the enrolments increased by 30,787 to 81,491 during the 2004/2005 academic year, representing a 60.7 percent increase. Between 2004/05 to 2007/08, enrolments increased by 19.2 percent 81,491 to 97,107, respectively.
Significant gross enrolment increments were also recorded within individual universities. At the University of Nai-robi for example, total student populations increased by 154.3 percent from 14,833 during the 2000/01 academic year to 36,399 during the 2007/08 academic year. Inter-stream enrolment comparisons show that, whereas enrol-ments in the private/part-time stream increased by 520.2 percent from 3,109 in 2000/01 to 19,285 in 2007/08, enrolments in the full time stream increased by only 15 percent from 11,724 to 17,054 over the same period.
In private universities, total enrolments increased by 148.9 percent from 8,491 in 2000/01 to 21,132 in 2007/08. Between 2000/01 and 2006/07 student enrolments in private-unaccredited universities was on an impressive up-ward trend before declining steeply by 80.3 percent from a total of 4,944 in 2006/07 to estimated total enrolment of 975 in 2007/08. This sudden decline can be attributed to more unaccredited private universities getting accredi-tation before the start of the 2007/08 academic year (Table 34).

112Youth Research Compendium
Table 34: TotalStudentEnrolmentinPublicandPrivateUniversities2000/01-2007/08
INSTITUTION 1999/2000 2000/2001 2001/2002 2002/2003 2003/2004 2004/2005 2005/2006 2006/2007 2007/2008*
Nairobi … 14,833 24,696 25,689 26,712 32,974 33,705 34,939 36,339Full time … 11724 13174 13591 14009 15,237 16,225 16,394 17,054Part Time … 3109 11522 12098 12703 17,737 17,480 18,545 19,285Kenyatta … 9953 11815 15735 15776 16,055 15,683 16,736 18,597Full time … 7529 9367 8301 8716 7,200 7,303 8,351 9,333Part Time … 2424 2448 7434 7060 8,855 8,380 8,385 9,264Moi … 8,519 9,338 10,823 10,447 12,010 12,145 14,663 14,832Full time … 7,209 7,245 7,281 7,318 7,499 7,511 9,208 9,312Part Time … 1310 2,093 3,542 3,129 4,511 4,634 5,455 5,520Egerton … 8,985 9,101 9,362 9,352 8,597 8,498 12,169 12,467Full time … 8,108 8,214 8,458 8,403 7,500 7,212 10,702 10,959Part Time … 877 887 904 949 1,097 1,286 1,467 1,508Jomo Kenyatta
…4,280 3,680 4,588 4,657 6,274 5,880 6,305 7,962
Full time … 1,821 1196 2,055 1,997 3,200 3,256 2,700 3,372Part Time … 2,459 2,484 2,533 2,660 3,074 2,624 3,605 4,590Maseno … 4,134 4,048 5,635 5,607 5,581 4,704 4,715 5,686Full time … 3,149 3,054 4,621 4,542 4,350 3,526 3,165 3,820Special … 985 994 1014 1065 1,231 1,178 1,550 1,866Masinde Muliro
…… … 80 165 - 1,062 1,810 1,224
Full time … … … … … - 602 1,042 687Part Time … … … … … - 460 768 537TOTAL … 50,704 62,678 71,912 72,716 81,491 81,677 91,337 97,107Private Universities
…
Private Accredited
…7,143 7211 7639 8021 8,342 8,839 15,948 20,157
Private Unaccredited
…1348 1460 1490 1520 1,708 1,800 4,944 975
SUB-TOTAL
…8,491 8,671 9,129 9,541 10,050 10,639 20,892 21,132
GRAND TOTAL … 59,195 71,349 81,041 82,257 91,541 92,316 112,229 118,239* Provisional; …Data unavailableSource: Commission for Higher Education
Trends presented in Figure 30 further illustrate that over the period spanning 2000/01 to 2007/08 academic years, student populations in both public universities had increased by nearly 100 percent, while increase in enrolments in private universities, was well above 100 percent. It is also evident that the private/part-time stream in public uni-versities and increase in the number of private universities are the new frontiers for expanding access to university education in Kenya. Although, significant increments in enrolments have been recorded in private universities, this increment is more as a result of an increase in the number of newly established private universities than internal expansion of enrolment capacities of individual private universities.

113Institute of Economic Affairs
Figure 30: Total Student Enrolment in Public and Private Universities 2000/01-2007/08
Source: Commission for Higher Education
Comparative Enrolment in Public Universities by Mode of StudyThe private entry scheme in Kenya’s public universities was pioneered by the University of Nairobi for the first time during the 1998/1999 academic year. Over time, it has emerged as a policy that serves two fundamental functions; expanding access and the revenue base for public universities. Candidates who meet the minimum uni-versity entry requirements but are not admitted by JAB can still access public university education through the pri-vately sponsored mode of study. In this entry scheme, students and their families individually pay the full unit cost of the courses they are undertaking. This mode of study has proved popular in the recent past. Table 35 presents a comparison of student enrolments in public universities by mode of study during the 2007/2008 academic year.
Table 35: Public Universities Student Enrolment by Mode of Study in, 2007/2008
Admission StreamInstitution JAB Private Total Private as % of TotalNairobi 16,394 18,545 34,939 53.1
Kenyatta 9,586 2,968 12,554 23.6
Moi 9,208 5,455 14,663 37.2
Egerton 10,702 1,467 12,169 12.1
JKUAT 2,598 5,458 8,056 67.8
Maseno 3,193 1,807 5,000 36.1
MMUST 950 1,219 2,169 56.2
Total 52,631 36,919 89,550 41.2
Source: Commission for Higher Education
As shown on Table 35, the private entry scheme has significantly increased access to university education in Kenya to a point where in some of the public universities like Nairobi, JKUAT, and Masinde Muliro University of Science

114Youth Research Compendium
and Technology, the private entry stream accounts for more than 50 percent of all recorded enrolments. Although other universities seem to have recorded lower proportions for the private entry scheme, it can be observed that the estimates presented by CHE are quite conservative and the real enrolments in the private stream are probably higher in these other public universities.
Gender Disparity in University EnrolmentsOverall, gender disparities in enrolments have persisted in University education. Out of a total enrolment of 59,195 recorded in public and private universities during the 2000/2001 academic year, 21,781 who constituted 36.8 percent; were female. In the following academic year, 2001/2002, female enrolments increased marginally to 38.7 percent before declining again to 36.8 percent during the 2002/2003 academic year. During the 2003/2004 academic year, female enrolments represented 37.2 percent of the total. At the individual institution level, female under representation has persisted through the years. During the 2000/2001 academic year, for example, female enrolment constituted only 29 percent at the University of Nairobi.
Gender Disparities by Mode of Attendance in Public UniversitiesIn public universities, some interesting trends can be discerned from the variations in enrolment figures depend-ing on the geographical location of the university. At Kenyatta, female participation in the part-time stream has improved to 53.1 percent compared to 33.5 percent female participation in the full-time stream during same year. This higher female participation in the part-time stream at Kenyatta University is attributable to the high admis-sions of females into education and social science programmes that form the majority of programmes offered at the University (Table 36).
At the University of Nairobi, female participation in the part-time stream has improved to 36.9 percent, during the 2007/2008 academic year compared to 35.3 percent female participation, in the full-time stream during same year. The data shows no significant difference in female enrolments between the two streams, a fact that can be attributed to the presence of many engineering and technical programmes at the University, in which female under-participation counters their possible high enrolments in social sciences and humanities.
At JKUAT, female participation was 28.6 percent and 31.2 percent in the full –and part-time programmes, re-spectively, during the 2001/2002 academic year. The 2007/2008 data show that, female participation in the two streams was 21.1 percent and 39.2 percent, respectively. Whereas the lower female participation in the full-time stream is attributable to the fact that JKUAT’s regular programmes are dominated by technical degree pro-grammes, the improved female participation on the part-time stream is attributable to the many social science and humanity degree and diploma programmes that the university offers on its part-time stream.
Table 36: Student Enrolment in Public Universities by Gender 1999/00-2003/04
INSTITUTION 1999/2000 2000/2001 2001/2002 2002/2003 2003/2004
Male Female Total Male Female Total Male Female Total Male Female Total Male Female TotalNairobi … … … 10532 4301 14833 15426 9270 24696 16200 9489 25689 16992 9720 26712Full time … … … 8383 3341 11724 8724 4450 13174 9163 4428 13591 9603 4406 14009Part Time … … … 2149 960 3109 6702 4820 11522 7037 5061 12098 7389 5314 12703Kenyatta … … … 5943 4010 9953 6831 4984 11815 10737 4998 15735 10753 5023 15776Full time … … … 4510 3019 7529 5384 3983 9367 4972 3329 8301 5221 3495 8716Part Time … … … 1433 991 2424 1447 1001 2448 5765 1669 7434 5532 1528 7060Moi … … … 4,753 3,766 8,519 5,469 3,869 9,338 6,274 4,549 10,823 5,804 4,643 10,447Full time … … … 4,046 3,163 7,209 4,066 3,179 7,245 4,086 3,195 7,281 4,107 3,211 7,318Part Time … … … 707 603 1310 1,403 690 2,093 2,188 1,354 3,542 1,697 1,432 3,129Egerton … … … 6,629 2,356 8,985 6,816 2,285 9,101 6,975 2,387 9,362 6,908 2,444 9,352Full time … … … 5,981 2,127 8,108 6,161 2,053 8,214 6,307 2,151 8,458 6,207 2,196 8,403Part Time … … … 648 229 877 655 232 887 668 236 904 701 248 949JKUAT … … … 2,992 1,288 4,280 2,565 1,115 3,680 3,184 1,404 4,588 3,202 1,455 4,657

115Institute of Economic Affairs
Full time … … … 1,301 520 1,821 857 339 1196 1,442 613 2,055 1,373 624 1,997Part Time … … … 1,691 768 2,459 1,708 776 2,484 1,742 791 2,533 1,829 831 2,660Maseno … … … 2,596 1,538 4,134 2,530 1,518 4,048 3,505 2,130 5,635 3,428 2,179 5,607Full time … … … 1,994 1,155 3,149 1,922 1,132 3,054 2,885 1,736 4,621 2,777 1,765 4,542Special … … … 602 383 985 608 386 994 620 394 1014 651 414 1065Masinde Muliro
… … … … … … … … … 67 13 80 110 55 165
Full time … … … … … … … … … … … … … … … Part Time … … … … … … … … … … … … … … … SUB- TOTAL … … … 33,445 17,259 50,704 39,637 23,041 62,678 46,942 24,970 71,912 47,197 25,519 72,716Percent Female
… … … 34.0 36.8 34.7 35.1
… … … Private Universities
… … …
Private Accredited
… … … 3,093 4,050 7,143 3,122 4,089 7211 3,476 4,163 7639 3,650 4,371 8021
Private Unaccredited
… … … 876 472 1348 949 511 1460 748 742 1490 763 757 1520
SUB-TOTAL … … … 3,969 4,522 8,491 4,071 4,600 8,671 4,224 4,905 9,129 4,413 5,128 9,541Percent Female
… … … 53.3 53.1 53.7 53.7
OVERALL TOTAL
… … … 37,414 21,781 59,195 43,708 27,641 71,349 51,166 29,875 81,041 51,610 30,647 82,257
… No Data/No enrolmentsSources: Republic of Kenya – Economic Surveys (2000-2009), Statistical Abstracts (2000-2009), CHE
Table 37: Student Enrolment in Public Universities by Gender 2004/05-2007/08
INSTITUTION 2004/2005 2005/2006 2006/2007 2007/2008* Public Universities Male Female Total Male Female Total Male Female Total Male Female TotalNairobi 21,268 11,706 32,974 21,940 11,765 33,705 22,513 12,426 34,939 23,513 12,826 36,339Full time 9,987 5,250 15,237 10,800 5,425 16,225 10,858 5,536 16,394 11,340 5,714 17,054Part Time 11,281 6,456 17,737 11,140 6,340 17,480 11,655 6,890 18,545 12,173 7,112 19,285Kenyatta 11,252 4,803 16,055 10,896 4,787 15,683 8,845 7,891 16,736 10,172 8,425 18,597Full time 4,313 2,887 7,200 4,356 2,947 7,303 5,066 3,285 8,351 5,826 3,507 9,333Part Time 6,939 1,916 8,855 6,540 1,840 8,380 3,779 4,606 8,385 4,346 4,918 9,264Moi 6,796 5,214 12,010 6,831 5,314 12,145 8,604 6,059 14,663 8,674 6,158 14,832Full time 4,304 3,195 7,499 4,311 3,200 7,511 5,654 3,554 9,208 5,700 3,612 9,312Part Time 2,492 2,019 4,511 2,520 2,114 4,634 2,950 2,505 5,455 2,974 2,546 5,520Egerton 6,351 2,246 8,597 6,262 2,236 8,498 8,163 4,006 12,169 8,262 4,205 12,467Full time 5,540 1,960 7,500 5,322 1,890 7,212 7,319 3,383 10,702 7,408 3,551 10,959Part Time 810 287 1,097 940 346 1,286 844 623 1,467 854 654 1,508JKUAT 4,315 1,959 6,274 4,207 1,673 5,880 4,460 1,845 6,305 5,450 2,512 7,962Full time 2,201 999 3,200 2,240 1,016 3,256 2,176 524 2,700 2,659 713 3,372Part Time 2,114 960 3,074 1,967 657 2,624 2,284 1,321 3,605 2,791 1,799 4,590Maseno 3,413 2,168 5,581 2,826 1,878 4,704 2,778 1,937 4,715 3,487 2,199 5,686Full time 2,660 1,690 4,350 2,106 1,420 3,526 1,888 1,277 3,165 2,370 1,450 3,820Special 753 478 1,231 720 458 1,178 890 660 1,550 1,117 749 1,866Masinde Muliro
… … … 775 287 1,062 1,154 656 1,810 946 278 1,224

116Youth Research Compendium
Full time … … … 420 182 602 620 422 1,042 508 179 687Part Time … … … 355 105 460 534 234 768 438 99 537TOTAL 53,394 28,097 81,491 53,737 27,940 81,677 56,517 34,820 91,337 60,504 36,603 97,107Percent Female
34.5 34.2 38.1 37.7
Private Universities
Private Accredited
3796 4546 8,342 4,215 4,624 8,839 8,975 6,973 15,948 9,688 10,469 20,157
Private Unaccredited
801 907 1,708 853 947 1,800 2,853 2,091 4,944 583 392 975
SUB-TOTAL 4,597 5,453 10,050 5,068 5,571 10,639 11,828 9,064 20,892 10,271 10,861 21,132
Percent Female
54.3 52.4 43.4 51.4
OVERALL TOTAL
57,990 33,551 91,541 58,805 33,511 92,316 68,345 43,884 112,229 70,775 47,464 118,239
* Provisional Source: Commission for Higher Education
Gender Disparities by Type of UniversityWhereas female participation in public University education has remained below the 40 percent mark, female participation in private universities has consistently remained higher than 50 percent, save for the 2006/2007 academic year when female proportion fell to 43.4 percent. Data on enrolments in public universities suggest that female participation in university education has improved from 34 percent in 2001/2002 to 38.1 percent and 37.7 percent during the 2006/2007 and 2007/2008 academic years, respectively.
Regional Disparity in University EducationAt the University level, no explicit data existed showing how access to education at this level varies by regions. However, an attempt is made in this section to estimate these regional variations based on data on ethnic inequali-ties14 in access to university education. Although the parent data used in the subsequent review and analysis is a bit out-dated15, there is no evidence yet that these trends have changed much, more so upon the introduction of privately sponsored university education.
Using data from the British Council (1996), Mwiria and Ng’ethe (2007) observed that those communities that made the earliest contact with the European settlers, missionaries and colonial authorities have tended to enjoy greater access to formal higher education than their counterparts in other regions, with students from ASAL re-gions being the most under-represented in University education. The problem of under-participation in education among the youth of nomadic communities has a historical dimension. Achoka, Odebero, Maiyo, Ndiku and Mua-luoko (2007) contend that as early as the inception of Western education, schooling in ASAL areas of the country was treated less seriously than in high potential agricultural areas. Neither outside religion nor formal education was adapted to the nomadic existence because the acceptance of either without adjustments would have required major changes in the nomads’ way of life. Following independence in 1963, as in the colonial era, the ASAL re-gions had not been integrated into the mainstream socio-economic development agenda.
This massive neglect coupled with insecurity, banditry and the nomadic nature of the indigenous populace, appears to have prolonged the under-development which has, in turn, limited the provision of education to pastoral com-munities in ASAL areas, especially the education of girls (Achoka et al., 2007; Mwiria and Nge’the, 2007; Alwy
14 Although the data presented here represents ethnic groups, they also imply the regional disparities based on the fact that Kenya’s provinces are divided in such a way that each represents at least one dominant ethnic group e.g. the Kikuyu in Central province, the Luo in Nyanza provine and Luhya’s in Western province.
15 In Kenya, ethnicity remains a highly emotive and politically sensitive subject, thus very few published literature exist on direct ethnic dis-parities. It is for these reasons that, generally, studies on ethnicity are a path many researchers opt not to tread.
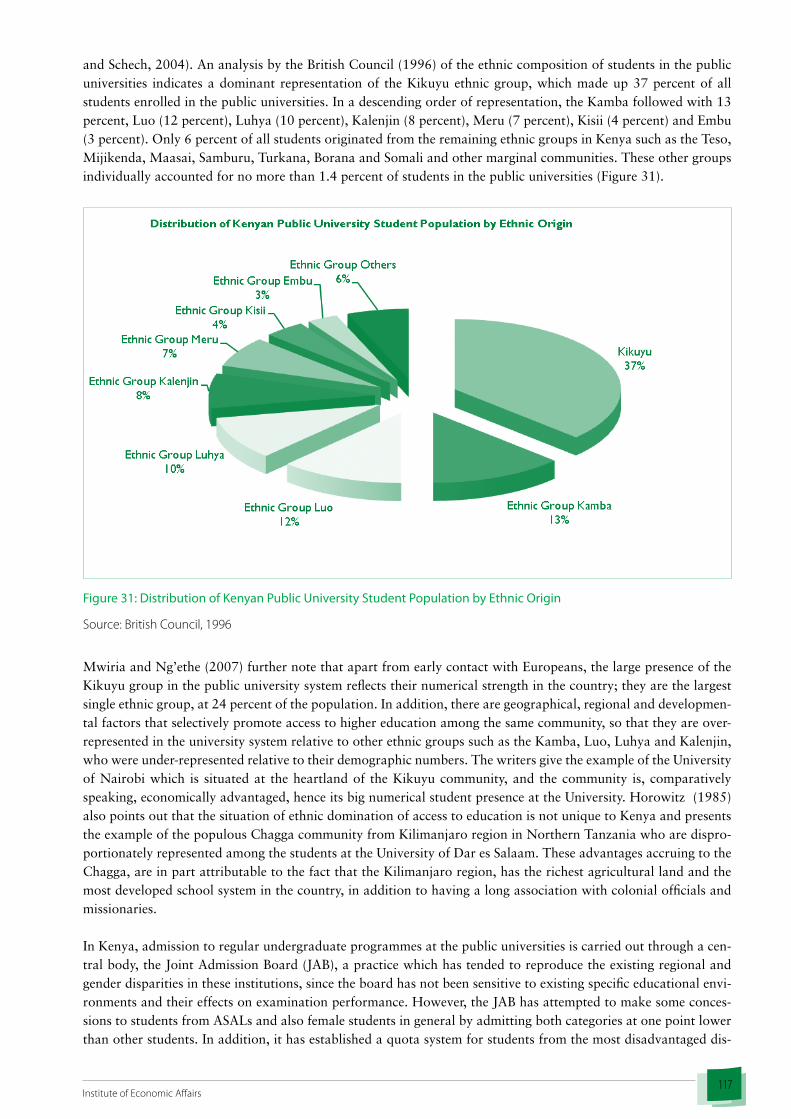
117Institute of Economic Affairs
and Schech, 2004). An analysis by the British Council (1996) of the ethnic composition of students in the public universities indicates a dominant representation of the Kikuyu ethnic group, which made up 37 percent of all students enrolled in the public universities. In a descending order of representation, the Kamba followed with 13 percent, Luo (12 percent), Luhya (10 percent), Kalenjin (8 percent), Meru (7 percent), Kisii (4 percent) and Embu (3 percent). Only 6 percent of all students originated from the remaining ethnic groups in Kenya such as the Teso, Mijikenda, Maasai, Samburu, Turkana, Borana and Somali and other marginal communities. These other groups individually accounted for no more than 1.4 percent of students in the public universities (Figure 31).
Figure 31: Distribution of Kenyan Public University Student Population by Ethnic Origin
Source: British Council, 1996
Mwiria and Ng’ethe (2007) further note that apart from early contact with Europeans, the large presence of the Kikuyu group in the public university system reflects their numerical strength in the country; they are the largest single ethnic group, at 24 percent of the population. In addition, there are geographical, regional and developmen-tal factors that selectively promote access to higher education among the same community, so that they are over-represented in the university system relative to other ethnic groups such as the Kamba, Luo, Luhya and Kalenjin, who were under-represented relative to their demographic numbers. The writers give the example of the University of Nairobi which is situated at the heartland of the Kikuyu community, and the community is, comparatively speaking, economically advantaged, hence its big numerical student presence at the University. Horowitz (1985) also points out that the situation of ethnic domination of access to education is not unique to Kenya and presents the example of the populous Chagga community from Kilimanjaro region in Northern Tanzania who are dispro-portionately represented among the students at the University of Dar es Salaam. These advantages accruing to the Chagga, are in part attributable to the fact that the Kilimanjaro region, has the richest agricultural land and the most developed school system in the country, in addition to having a long association with colonial officials and missionaries.
In Kenya, admission to regular undergraduate programmes at the public universities is carried out through a cen-tral body, the Joint Admission Board (JAB), a practice which has tended to reproduce the existing regional and gender disparities in these institutions, since the board has not been sensitive to existing specific educational envi-ronments and their effects on examination performance. However, the JAB has attempted to make some conces-sions to students from ASALs and also female students in general by admitting both categories at one point lower than other students. In addition, it has established a quota system for students from the most disadvantaged dis-

118Youth Research Compendium
tricts. Nevertheless, these measures do not seem to have helped much. One possible solution is the decentralization of admissions to university level, but even here there is the danger of favouritism. This is illustrated by the Egerton University diploma programmes, which admit at the university level. Here, the locally dominant ethnic group is over represented, but perhaps this simply reflects the fact that many local people apply for the programmes be-cause they are near home (Mwiria and Nge’the, 2007).
To compound the problem of equity, the existing trend towards the privatization of higher education might ex-acerbate inequality in access by excluding those who cannot afford to pay. Kenyatta University has been at the forefront of decentralizing admissions to the University and therefore doing away with JAB. It has begun to admit students on a semester basis, as opposed to the JAB practice of admitting once a year. Students can now take any courses offered during any semester provided they meet the course requirements. One consequence of this reform is the gradual abolition of the academic year (Ibid).
Much as some writers on ethnic inequalities in education in Sub-Saharan Africa (Mwiria and Ng’ethe, 2007; Horowitz, 1985) seem inclined towards the white-settler contact theory as a sufficient explanation for the present imbalances in access to all forms of formal education including university, it is argued here that this only holds if earlier access by the older generations has had a dynastic effect. In the absence of this dynastic effect, regional imbalances in access to formal education can almost exclusively be explained by differences in agro-economic potential which has a bearing on household incomes and, to some extent, political patronage. This argument is particularly relevant to the eras when cost-sharing was practiced in virtually all levels of formal education.
Driving Forces Expected to Shape the Future of Education and Assumptions Driving Forces and their Possible ImpactDiminished Gender Disparity in Education: Sustaining both FPE and SSE positively impact efforts at bridging the gender gap in access at the primary and secondary levels of education now and in the future. On the other hand, the affirmative policy of admitting women and candidates from marginalised region at one point less than the JAB cut-off point and the expansion of private universities, where female enrolments have remained traditionally higher, have a combined effect of bridging the gender gap in access to university education.
Regional equity in youth access to education: In addition to the FPE and SSE, the present efforts at infusing eco-nomic stimulus to the education sector are expected to lead to improved supply of both primary and secondary education in a way that diminishes the existing regional inequalities.
Subsidized Secondary Education (SSE): There is evidence that the government’s decision to subsidise tuition costs in both public day and boarding secondary schools has presently lead to an increase in gross and net enrolment rates in education at this level. This increase in enrolment is more pronounced in public day schools where the majority of the hitherto cost-excluded groups can now access schooling opportunities. Coupled with the rising demand for secondary education, arising from FPE, subsidization of secondary education creates a new immediate and future demand potential that could outstrip supply in the near future.
Quota system in Access to Secondary Education: As already demonstrated elsewhere in this paper, the introduction of the quota system in secondary school admissions in Kenya has been a major contributor to regional inequalities in access to post primary education. Although this policy was masked as an attempt at improving equity in access while diminishing costs of access to secondary education, it has essentially achieved the converse. In practice, it would appear the system was a purely political decision to skew access to quality education in some areas which, by design, were already receiving disproportionate state support to expanded quality education. Another adverse effect of the quota system is failure of secondary education at improving national cohesion through cross-cultural interaction, where students get an opportunity to attend school in a multicultural environment, away from their home districts, that are most likely to be dominated by students from their own ethnic communities. To date, there is no justification in both fact and practice that warrants the continued implementation of this policy. In refer-ence to the admission quota policy under the 8-4-4 system of education, Ojiambo (2009) argues that available evidence seems to suggest that the change of the system was more political than an educational need. Amutabi

119Institute of Economic Affairs
(2003:135) also notes that “the system was introduced partly as result of the Mackay Report and also as a politi-cal self-actualization by the government…. inherent in the system was a hidden motive of an apparent settling of some imbalance and political scores”. If secondary education to the youth is to be relied on as an instrument for promoting national cohesion, then the quota system must be dispensed with, and a better system of student place-ment introduced.
Expansion and Improvement of Quality of Secondary Education: The present economic stimulus programme for education which intends to establish two centres of excellence in every constituency is one strategy that is expected to address issues of expansion and improvement of the quality of secondary education supplied. To some extent, it may also address inequalities in access to quality secondary education. Currently, it is the high potential regions, which already have a disproportionate concentration of the best provincial and district secondary schools, that end up admitting 85 percent or more from within their boundaries; to the exclusion of those from the economically disadvantaged regions with few or low quality schools.
Elevation of Middle Level Public Institutions: The emerging trend in which public universities, wishing to expand presence into some parts of the country, end up taking over existing middle level colleges has both positive and negative consequences. On the positive side, the provision of university education undergoes both quantitative and spatial expansion at minimal cost to the parent university. On the negative side, however, these takeovers impede the supply of middle level education and training. For example, the impact of the elevation of The Kenya and Mombasa polytechnics on the supply of TIVET opportunities is evident in the decrease in enrolment figures for 2006 and 2007. The situation is aggravated by the fact that some facets of TIVET have such high unit costs that the private sector would find it unviable to invest in their provision. Continued government participation in the provision of TIVET, away from takeovers, is therefore critical to addressing market failure.
Expansion of Public and Private University Education: Study data indicates , already, most public universities in urban locations, like Nairobi and Kenyatta, are attracting enrolments in this stream that outstrip enrolments in the regular/government sponsored scheme. Given the revenues that public universities draw from enrolments in the private stream, evidence exists that part of this revenue has been spent in expanding facilities and improving faculty remuneration hence improving the quantity and quality of education offered to the youth at this level. In addition, the private entry stream has been made more flexible to attract students who are already at work. Col-lectively, all these strategies have the net effect of improving access to university education not only among the youth but also other non-youth segments of the population.
Using their increased resource bases from the self-sponsored stream, public universities are today able to complete their unfinished capital projects that were financed under the World Bank financing of the early 1990s. This has significantly improved the institutions’ capacities to host more students through the completion of lecture hall complexes and accommodation facilities. To improve their reach to potential students, most public universities have since set out more satellite campuses in rural locations, a strategy that is set to make university education, more accessible and affordable since potential students in these rural locations can attend classes from home.
The recently recorded increase in the number of both accredited and un-accredited private universities has had a major impact on access to university education. Against the evidence that female participation in university educa-tion has remained traditionally higher than that of males in private universities, expansion of university education in this stream is expected to improve the overall gender parity in access to university education.
Role of HELB Financing: The introduction of means tested loan financing of university education to coincide with the introduction of cost-sharing in public universities has made it possible for most students from poor families to continue with their university education. The expansion of the loan financing of university education by HELB to cover privately sponsored students in both private and public universities will remain critical in equitable access to University education in the future through increased private access by meriting but poor students who miss out on government sponsorship.
Role of Devolved Public Funding: Emerging and existing devolved funds, such as the Constituency Develop-ment Fund (CDF), are already being used innovatively by constituencies to finance students pursuing tertiary and

120Youth Research Compendium
university education. The CDF fund has since become a significant source of financing that supports the youths’ quest for post-secondary education. With improved structures and targeting in allocation, the CDF fund portends improved access to higher education by meriting youth from poor backgrounds who would otherwise miss out on education at that level.
Institutional and State backed Scholarships: Scholarships from foreign governments and organizations adminis-tered by the Kenya government and those awarded by institutions like the Directorate of Industrial Training and the National Council of Science and Technology also have the potential to open up access to higher education. When these financing options are expanded to cater for significant proportions of higher education seekers in the future, such efforts can free up other funding sources to absorb more beneficiaries.
Extreme inequality in Access to University Education: Efforts at gradual privatisation of university education in public universities coupled with attempts to implement the real unit-costing of various degree programmes may, in the end, lead to increased access by students from non-poor backgrounds much to the exclusion of the poor. Not-ing that higher education, more so at the university level has been shown to have higher private rates of returns, it can be projected that disproportionate access to education at this level by the already non-poor, will only widen the existing socio-economic inequalities.
Government Inability to Finance and Sustain FPE and SSE: Current projections show significant increases in the population of the school going population. Considering the apparent economic stagnation of the late 2000’s and donor threats to withdraw support for the FPE programme, the government stands a real risk of being unable to finance and sustain the FPE and SSE programmes, especially where the economic performance fails to improve. By the 2011/2012 financial year, the Ministry of Finance had already shown predatory behaviour in its budgeting by failing to allocate funds for employing some 28,000 teachers required to fill the existing teacher deficit. Where the economy stagnates in the future and no external budget support would be available, the FPE and SSE programmes may well be among the next causalities of this predatory behaviour at treasury.
Disproportionate increase in Demand for Secondary Education: As access to primary education increases, a sub-sequent demand potential for secondary education will be created. This increased aggregate demand for secondary education has the potential to become disproportionate to the rate of quantitative expansion of secondary educa-tion. Because of legacy effects, the FPE programme that, is expected to improve access at the lower level, actually poses the threat of producing many more primary graduates that cannot find places in secondary schools thus a huge proportion of youth population without a chance for finding economically meaningful employment.
Elitist access to Secondary Education: Closely related to the risk of demand for secondary education being dispro-portionate to supply, is the new threat of an elitist access to secondary education. Based on the law of demand and supply, once the secondary places become incommensurate to the demand, there will be a natural trend to raise admission cut-offs making it much harder for the majority of average KCPE performers to access quality second-ary education.
Disproportionate Funding for Education Sub-sectors: As demand for primary and secondary education grows, as evidenced by population projections for the school age population, the government will be compelled to re-allocate more and more resources to the provision of education at these levels. This, as has been seen in education budgetary allocations immediately after the introduction of FPE, is invariably expected to lead to disproportion-ately low budgetary allocations to the other sub-sectors of education provision.
Donor withdrawal from Supporting FPE and SSE: The present lack of accountability in the management of FPE and SSE funds, including those received by the government from donors, has eroded donor confidence. This has adverse implications on future donor support to the FPE and SSE programmes. Moreover, even at the time of the study, one of the donors, the DFID had already discontinued its future support to basic education in the country and instead opted to channel such future resources through Non-Governmental Organizations. The challenge aris-ing from this approach is that this mode of financing is unlikely to have the same significant impact as when the funds are efficiently managed centrally by the government.

121Institute of Economic Affairs
Youth Bulge and Insecurity Implications of Unemployed Youth: Youth access to basic education is generally expected to improve significantly in the foreseeable future. However, should the many interventions being imple-mented by the state and non-state actors fail to result in the desired levels of youth participation in basic educa-tion, the country is likely to end up with a sizeable population of primary and secondary school dropouts. These dropout youth are most likely to be jobless and would easily slide into crime hence general insecurity in the coun-try. Evidence on the insecurity implications of a huge unemployed youth population can be drawn from the Arab revolts and overthrow of governments in North Africa and theMiddle East witnessed in the first decade of the 21st century.
Current Assumptions about the Future of Education in KenyaThis section makes inferences on some assumptions for the future of education provision and access based on the identified past and present trends that are expected to shape the future.
Increased State Participation in the Provision of Basic Education: In view of the present government commitment to provide Free Primary Education and Subsidised Secondary Education, it is expected that in the near future, more government resources for education will be concentrated in these two levels. It is expected that the government’s efforts at expanding the scope of basic education will be informed by evidence in literature that indicates a higher social rates of return for basic education compared to tertiary and university education. However, the expected future prioritization of basic education will be largely dependent on political goodwill from future governments.
Diminished Direct State Provision of Tertiary and University Education: As a consequence of the present gradual attempts to privatize tertiary and university education coupled with the demand for the inclusion of secondary education as part of basic education, in the future, more government resources will most likely be skewed towards the provision of education at the primary and secondary levels. In addition, evidence from the reviews show that the provision of secondary education has a much higher unit cost16 compared to the primary level, thus, future attempts by the government to increase access at this level can be expected to draw allocations from the other sub-sectors, particularly the higher education level.
Increased Demand for Secondary Education: By 1999, the total population of youth in the age bracket 15-34 was 10,181,978 constituting slightly over one third (35.5 percent) of the total population. In relation to the 1999 population data, present estimates by the Kenya National Bureau of Statistics (KNBS, 2009) suggest an increase in the population of youth aged 15-34 years to 13,665,378 in 2009. By 2019, the population of youth in this age group is expected to increase by 76 percent relative to their population in 1999 (Table 38).
Table 38: Actual and Projected Youth Population 1999-2019
1999 2009 2019*
15-19 Male 1,681,984 2,123,653 2,891,325
Female 1,721,194 2,045,890 2,931,815
Total 3,403,635 4,169,543 5,823,14020-24 Male 1,328,529 1,754,109 2,183,634
Female 1,504,389 2,020,998 2,230,315Total 2,832,918 3,775,103 4,413,949
25-29 Male 1,094,909 1,529,116 1,896,049
Female 1,164,594 1,672,110 1,936,280
Total 2,259,503 3,201,226 3,832,32930-34 Male 840,692 1,257,035 1,891,152
Female 845,230 1,262,471 1,923,786Total 1,685,922 2,519,506 3,814,938
Total Youth 10,181,978 13,665,378 17,884,356
16 InKenya,thecostofeducatingonesecondaryschoolstudentperyearhasbeenshowntobe1000percentofthatofeducatingaprimaryschool,pupilinayear.InclusionofsecondaryeducationintobasiceducationanditsUniversalizationwillcertainlyincreasegovernmentbudgetforbasiceducation
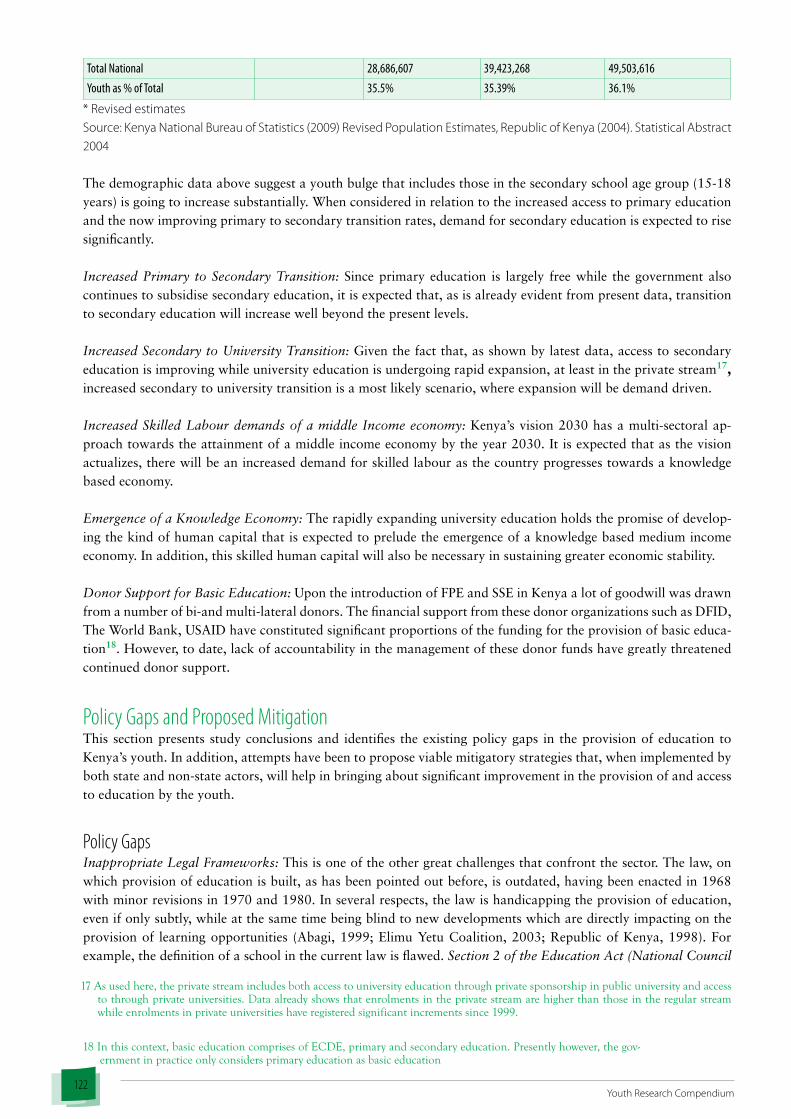
122Youth Research Compendium
Total National 28,686,607 39,423,268 49,503,616
Youth as % of Total 35.5% 35.39% 36.1%
* Revised estimatesSource: Kenya National Bureau of Statistics (2009) Revised Population Estimates, Republic of Kenya (2004). Statistical Abstract 2004
The demographic data above suggest a youth bulge that includes those in the secondary school age group (15-18 years) is going to increase substantially. When considered in relation to the increased access to primary education and the now improving primary to secondary transition rates, demand for secondary education is expected to rise significantly.
Increased Primary to Secondary Transition: Since primary education is largely free while the government also continues to subsidise secondary education, it is expected that, as is already evident from present data, transition to secondary education will increase well beyond the present levels.
Increased Secondary to University Transition: Given the fact that, as shown by latest data, access to secondary education is improving while university education is undergoing rapid expansion, at least in the private stream17, increased secondary to university transition is a most likely scenario, where expansion will be demand driven.
Increased Skilled Labour demands of a middle Income economy: Kenya’s vision 2030 has a multi-sectoral ap-proach towards the attainment of a middle income economy by the year 2030. It is expected that as the vision actualizes, there will be an increased demand for skilled labour as the country progresses towards a knowledge based economy.
Emergence of a Knowledge Economy: The rapidly expanding university education holds the promise of develop-ing the kind of human capital that is expected to prelude the emergence of a knowledge based medium income economy. In addition, this skilled human capital will also be necessary in sustaining greater economic stability.
Donor Support for Basic Education: Upon the introduction of FPE and SSE in Kenya a lot of goodwill was drawn from a number of bi-and multi-lateral donors. The financial support from these donor organizations such as DFID, The World Bank, USAID have constituted significant proportions of the funding for the provision of basic educa-tion18. However, to date, lack of accountability in the management of these donor funds have greatly threatened continued donor support.
Policy Gaps and Proposed MitigationThis section presents study conclusions and identifies the existing policy gaps in the provision of education to Kenya’s youth. In addition, attempts have been to propose viable mitigatory strategies that, when implemented by both state and non-state actors, will help in bringing about significant improvement in the provision of and access to education by the youth.
Policy Gaps Inappropriate Legal Frameworks: This is one of the other great challenges that confront the sector. The law, on which provision of education is built, as has been pointed out before, is outdated, having been enacted in 1968 with minor revisions in 1970 and 1980. In several respects, the law is handicapping the provision of education, even if only subtly, while at the same time being blind to new developments which are directly impacting on the provision of learning opportunities (Abagi, 1999; Elimu Yetu Coalition, 2003; Republic of Kenya, 1998). For example, the definition of a school in the current law is flawed. Section 2 of the Education Act (National Council
17Asusedhere,theprivatestreamincludesbothaccesstouniversityeducationthroughprivatesponsorshipinpublicuniversityandaccesstothroughprivateuniversities.Dataalreadyshowsthatenrolmentsintheprivatestreamarehigherthanthoseintheregularstreamwhileenrolmentsinprivateuniversitieshaveregisteredsignificantincrementssince1999.
18Inthiscontext,basiceducationcomprisesofECDE,primaryandsecondaryeducation.Presentlyhowever,thegov-ernmentinpracticeonlyconsidersprimaryeducationasbasiceducation

123Institute of Economic Affairs
for Law Reporting, 2009) defines a school as “an institution in which not less than ten pupils receive regular in-struction or assembly of not less ten pupils for the purposes of receiving regular instruction which provides regular instruction by correspondence p.6”. This definition alone excludes those educational institutions or assemblies: for which an individual other than the Education Minister is responsible; those which in the opinion of the Educa-tion Minister are wholly or mainly of religious character; or those which serve the purpose of training persons for admission to the ordained ministry of a religious order. With the new law reforms under the new Constitution, it is expected that the Education Act will be strengthened to eliminate the present legal challenges to the provision of education and management of the sector.
While the law is clear on several other fronts, the ministry has failed to implement part of it. Those regulations that have not been followed to the letter include those of registration regulations which are frequently flouted, particu-larly by those private schools run on commercial basis. Secondly the law on the closure of private schools is rarely enforced. When the law is applied, it is done selectively. The import of this is that parents are left at the mercy of unscrupulous private suppliers especially of the commercial category. The challenge for the Ministry therefore is to come up with workable legal requirements which it should ensure are adhered to (Elimu Yetu Coalition, 2003). There is need to harmonize the Children’s Act with FPE in a revised Education Act. The former makes education compulsory but does not make it free. If the current or a future government was to backtrack on the FPE policy, parents will not be able to do anything yet the law will compel them to ensure the enrolment of their children. This is an anomaly which needs to be corrected (Ibid).
Increased cost of education: The introduction of 8-4-4 system of education with its numerous examinable subjects and the implementation of cost-sharing in the education sector was a major blow to the majority of parents in the low income groups in terms of increasing financial expenditure in educating their children and specifically in pur-chasing textbooks. In addition, parents had to meet the costs of classroom construction supply of desks and activ-ity fees. The financial difficulties were heightened by increasing poverty levels that affect most of the population.
With per capita income of just about $1600 and up to 48 percent of the population living below the poverty line, the escalating costs of education have had negative impacts on access, equity and quality. While the situation has changed with the introduction of free primary education, previous studies indicated that direct household contri-bution to the cost of education remained fairly high averaging between 72 and 100 percent (NGO Council, 1997; MoE 1998, Republic of Kenya, 2010). At the secondary school level where the free education policy had not been implemented and parents still met the costs of education, it was estimated that the average proportion of costs borne by households were 46.2 percent for day schools 63.8 percent for boarding schools and an overall average of 56.6 percent for day and boarding schools (Karani, Gituro, Anyangu, Okumbe and Getaro, 1995). The situa-tion has changed with the introduction of government supported free secondary tuition, however, the charging of illegal levies by school heads and inflation have largely eroded any intended gains in reducing the education cost burden on households.
Governance and Management: The education enterprise in Kenya is not under a single institution but spread among a number of ministries and government departments. Even within the MoE, there are divisions, depart-ments of specialised agencies which have not always co-ordinated their work very well. According to Elimu Yetu Coalition and Commonwealth Fund (2003), this has resulted into inefficiency, duplication of efforts and even wastage of time and resources. While a strictly centralised system has its own shortcomings, co-ordination of key functions is crucial in ensuring the effective implementation of policy and programmes. Abagi (1999) however faults the centralization that characterises facets of education management in Kenya. He contends that, because of centralization, the attendant bureaucracy is responsible for rigidities and sluggishness, which adversely affect decision making and resource distribution.
HIV and AIDS Pandemic: The HIV and AIDS pandemic is one of the crucial challenges facing not only access to quality education but educational development in all its facets. The challenges are however not limited to the edu-cation sector. The pandemic poses serious threats to the society as a whole and its students in particular. A study by Yildiz (2002) estimated that nationally, up to 20 percent of pupils between 14 and 17 years were infected, ma-jority of them being girls. Although the exact magnitude of the HIV and AIDS problem in education is not yet to

124Youth Research Compendium
be documented on a national basis, there are indications that the sector is losing many qualified human resources from the pandemic in a way that affects access to education (Elimu Yetu Coalition and Commonwealth Fund, 2003). In some areas like Nyanza province, it was estimated that on average, 10 to 20 teachers die of the disease monthly, followed by Rift Valley, Central and Western provinces. Parents also die of the disease leaving orphaned children who drop out of school. Often the older children take up the role of heads of such families. By 2003, the disease was estimated to have orphaned over 700,000 children and UNICEF estimated that the number was expected to reach 1.2 million by 2005 (UNICEF/GoK, 1997). Although the estimates presented by Yildiz (2000), UNICEF/GoK (1997) and Abagi (2001) are evidently exaggerated, as has been confirmed in a downward review of HIV prevalence by UNAIDS rates, leading to new population projections, the effect of the pandemic on education cannot be ignored. Both state and non-state actors should therefore play their role in implementing the education sector HIV/AIDS policy.
Mainstreaming Gender in Education: In an educational setting, gender dynamics could be analysed from two perspectives namely; efforts at achieving gender parity in participation and policy measures put in place to ad-dress gender concerns. While the primary participation rates point at progress towards parity, there is a wide gap between participation of females and males in urban secondary schools compared to the females. The male GER at this level is close to 50 percent of that for females. Overall, enrolment rate in North Eastern province is just about 15 percent with the rate of girls being only 10.6 percent. In terms of enrolment, therefore, challenges still remain in closing the gap between girls and boys especially on a region to region level (Abagi,1999; Mugisha 2005; Wainaina 2006).
On the second level, it is instructive that Kenya has since formulated a national gender policy on education. The overall objective of this policy is to establish mechanisms to eliminate all gender disparities in education, training, and research in relation to access, enrolment, retention, completion, performance, transition, quality and out-comes (Republic of Kenya, 2007). However, the formulation of the national gender in education has translated to very little progress in the mainstreaming of gender issues in the day-to-day running of education institutions in a way that improves gender parity in access and provision of quality education to the youth.
Educational Management Information System (EMIS): An up to date, accurate and complete database on educa-tional participation, institutions, size structures, finance, personnel, etc is crucial for both planning and decision making. Its importance for research purposes or even mere reference by education officers themselves cannot be gain said. However, EMIS systems in Kenya are weak and characterised by lack of skilled personnel and equip-ment. To compile its EMIS reports, MoE relies on schools to be providing data through monthly returns and yearly reports to the headquarters. This often leads to delays in compilation thus impeding efforts to use data based evi-dence for timely policy formulation and implementation in the education sector. The EMIS system used by MOE was recently hit by a breakdown and no statistical summaries have been available since 2007.
Special Needs Education: This is one of the areas ignored or at least not given adequate attention by the govern-ment. Whereas the ministry recognises the need to train teachers to can attend to children and youth with special needs and went ahead to put up the Kenya Institute for Special Education, little has happened by way of direct gov-ernment support. The few initiatives have invariably been donor funded. A listing of donors to special education in the CESA Report (1994) illustrates their immense contribution relative to government support to the subsector. The Special Needs Education (SNE) situation in Kenya is in sharp contrast to the situation in Uganda where the government offers support to all institutions providing special education to enable them operate more effectively and efficiently (Hyde, et al. 2001). The official policy on disabled children in Uganda, for example, is to provide free education (Elimu Yetu Coalition and Commonwealth Fund, 2003).
Addressing the Needs of the Marginalized Groups: An analysis of access to education in Kenya by socio economic groups shows that, on the whole, access to primary schooling appears to be adequate for most groups in Kenya, with the exception of the poorest 20 percent of the population in both rural and urban areas. However, masked in this general trend of near parity in access to primary education are the regional or district disparities in access. While the primary GER is in the range of 88 percent, the GER is less than 50 percent in districts like Garissa, Wajir, Mandera, Marsabit and Samburu (Deolalikar, 1999).

125Institute of Economic Affairs
At the secondary school level, there have been major disparities across rural and urban areas and among economic groups within these areas in the secondary GER. The latter is more than two times as large in the urban areas (52 percent versus 22 percent). In the rural areas, the secondary GER varies from a low of 9.6 percent for the poorest quintile to a high of 34 percent for the richest (Deolalikar, 1999). In Kenya therefore, schooling is less affordable for the poor than for the non-poor. This very fact leads to a reduced demand for schooling among the poor and explains why there is greater disparity across economic groups in secondary than primary enrolment ratios with private costs of secondary schooling being significantly higher than that of primary schooling. For the poor, ba-sic survival necessitates that they spend most of their income on food, making education a second priority. Data shows that the poor spend much more (of the less they earn) on food than on education (NGO Council, 1997).
Alternative Channels of Education Delivery (Adult, Continuing and Non-Formal Education): Despite the inter-ventions and initiatives launched by the government, access and equity in Adult and Continuing education (ACE) and Non-Formal Education (NFE) are characterised by low participation rates, and regional and gender disparities that arise from long history of neglect (Republic of Kenya, 2005b). The quality and relevance of ACE and NFE are affected by lack of a clear policy, a negative image, lack of clear transition mechanisms, and an un-coordinated large number of service providers. The Education Financing Problem: By 1997, the government spent only KES 2,774 (US$35.6) per primary school pupil and KES 9,418 (U$120.7) per secondary school student while expenditure per university student was KES 115,812 (US$1,484.8), meaning that the government spent as much as 42 times on a university student as on a primary school pupil (Abagi, 1997). Ironically, the KES 1,020 that government gives per pupil as under the FPE programme is not even half the 1997 estimates (EYC, 2003). However, it can be pointed out that Abagi’s estimates must have been gross averages that included teacher salaries while the present unit allocation per pupil excludes teacher salaries and other administrative costs. Further, the huge expenditure on general administration and plan-ning means that only a small proportion of the education budget is spent on the provision of crucial teaching and learning materials and the physical expansion of basic education facilities.
As pointed out in Republic of Kenya (2005a), the average government spending on education and training, ex-cluding the share by households has ranged between 5 and 7 percent of the GDP. At the national level, recurrent government expenditure on education has been higher than any other social sector. The proportion was 73 percent of social sector expenditure during the 2004/05 fiscal year. In addition, education recurrent budget has risen from 35 percent of public sector recurrent budget in 2000 to 39 percent in 2004. The current heavy investment that is borne, to a large extent, by the government alone, calls for a review to ensure important policy option in partner-ship between government and non-public providers of education and training that can help reduce public financ-ing. Without a working partnership on financing, it will be hard to address the problems of inadequate access, inequality, low quality and current heavy household burden (Republic of Kenya, 2005a).
Proposed Mitigation The section, presents the proposed mitigatory measures that, if implemented, can significantly improve both equity in access and the quality of education and training provided at primary, secondary, ACE, TIVET and university education levels.
Primary EducationTo improve access and equity in the provision and access to education at this level, the following measures need to be undertaken:
• Sustaining the provision of free and compulsory education for all children to ensure all excluded groups are included
• Initiating working Partnerships between the government and parents; communities, civil society, develop-ment partners, private sector and other stakeholders to ensure effectiveness of free primary education
• Development of strategies to enhance participation of children in special circumstances, including orphans, children in urban slums and ASALs

126Youth Research Compendium
• Expanding the school feeding programme to cover children in all needy areas
• Formation of partnerships between government and other stakeholders to ensure; barrier free primary schools for those with special needs
• Development of programmes aimed at sensitization of parents on the need to enrol and retain girls in schools and make the school environment gender sensitive
• Initiation of alternative modes of provision of education, such as mobile schools among nomadic groups.
Secondary EducationTo improve access and equity in the provision of and access to education at this level, the following measures need to be undertaken:
• Provision of support to poor and disadvantaged students through secondary bursaries
• Provision of targeted support for the development of infrastructure in areas where parents are not able to provide such support
• Provision of support to targeted boarding schools in ASALs, and other deserving areas especially for girls
• Partnerships between government and parents, communities, private sector and other stakeholders in pro-viding and expanding secondary education
• Regular review and rationalization of fees and levies charged in secondary schools in order to contain private costs of education
• Implementation of affirmative action in secondary education to address the needs of the marginalized and/or those in difficult circumstances
• Identification and provision of educational support to youth with special talents and abilities
• Improving the expansion of secondary school education, by promoting private sector participation in the development of secondary schools through the provision of incentives
• Enhanced provision of both public and privately funded bursaries and devising better methods of targeting and disbursement
• Mobilization of additional resources to finance the construction of schools and provision of equipment to deserving areas, especially ASALs and urban slums
• Promotion of the development of more day-schools, and establishment of 3-streams in schools, especially in high population density areas
• Improving the quality of secondary school education through the development of two centres of excellence, each for girls and boys, at the constituency level
• Sensitization of communities and stakeholders to discard socio-cultural practices that prohibit effective par-ticipation of girls and boys in secondary school education, and enforcement of legislation against the viola-tion of children’s rights
Adult and Continuing and Non-Formal EducationAlthough the youth continue to remain statistically invisible in ACE and NFE as presently constituted, the study recognizes the potential that these streams hold in improving access to education among the youth segment of the population, especially among those in difficult circumstances such as out-of-school youth, youth in informal urban settlements, youth in ASAL and other marginalised regions. To this end, the following measures can be employed:
• Promotion of learning and training opportunities to ensure access by all learners including hard to reach segments of the population
• Public-private partnerships to develop the necessary capacities for the development and management of a national ACE and NFE system
• Establishment of distance education programmes for ACE and NFE learners to reach more youth

127Institute of Economic Affairs
• Collaboration between government and all partners and stakeholders to develop and implement special ACE and NFE programmes to cater for the un-reached and hard to reach, such as nomadic groups and youth with special needs
• Registration of all eligible learners in NFE centres for purpose of national examinations.
Technical Industrial, Vocational, and Entrepreneurship TrainingAs far as the present and future interest of the youth is concerned, the overall objective of TIVET is to provide and promote life-long education and training for self-reliance. However, coupled with other policy limitations, provi-sion of and access to TIVET by the youth is still beset by a number of supply and demand challenges. To mitigate these supply and demand challenges; the following measures can be implemented:
• Given the overall high unit-cost for the Provision of some facets of TIVET, appropriate incentives such as non-taxation of equipment purchase and co-financing can be provided to the private sector by the govern-ment to promote private sector participation in the provision of TIVET
• There should be partnerships between the government and the relevant stakeholders in the development of a comprehensive national skills training strategy
• Provision of loans and bursaries to enhance access to TIVET taking special account of marginalized groups, such as female students and the physically handicapped
• Integrating the provision of TIVET in secondary schools with the infrastructure, equipment and staff to offer the curriculum
• Rehabilitation and expansion of public TIVET institutions to ensure improved access and quality training
• Provision of alternative paths for TIVET graduates to access higher education and training
• Development of TIVET institutions in parts of the country where none exist and enhancing capacity of the Higher Education Loans Board (HELB) to provide loans to TIVET trainees.
University EducationDespite the rapid expansion of higher education over the last decade, challenges of access and equity still abound. To address the challenges that constrain access and equity, both state and non-state actors can implement the fol-lowing measures
• Promotion of the expansion of university education and training in tandem with population growth and the demand for university places and research facilities
• Promoting public-private sector partnerships in the development of university education and training
• Provision of targeted scholarships and means-tested bursaries loans to the needy taking into account gender parity concerns
• Establishment of a robust national accreditation system with credit transfers to enable easier vertical and horizontal student movement
• Improvement of state capitation and monitoring of internally generated financial resources in individual universities to ensure efficiency in use of resources for expansion
• Promotion of open universities, and distance education to increase learning opportunities

128Youth Research Compendium
References
Abagi, O. (1997). Public and private investment in primary education in Kenya: An agenda for action. Nairobi: Institute of Policy and Analysis Research.
Abagi, O. (2001). Situational analysis of education in Kenya. Background document prepared for ActionAid Kenya.
Abagi, O. (1999). Education for the next millennium. In Kimiyu, P., Wagacha, M and Abagi, O. (Eds). Kenya’s strategic policies for the 21st century - Macroeconomic and sectoral choices. Nairobi: Institute of Policy and Analysis Research.
Achoka, J.S.K., Odebero, S.O., Maiyo, J.K., & Mualuoko, N., J. (2007). Access to basic education in Kenya: inherent concerns. Educational Research and Review, 2(10): 275-284.
Alwy, A. & Schech, S. (2004). Ethnic inequalities in education in Kenya. International Education Journal, 5(2): 266-274.
Amutabi, M. (2003). Political interference in the running of education in post-independence Kenya: A critical retrospection. International Journal of Educational Development 23(2): 130-141.
Anderson, J.E. (1970). The Struggle for the School. London: Longhman.
Bachu, A. (1995). Fertility of American women: June 1995. In U.S. Bureau of the Census, Current Population Report Series, 420-499. Washington, DC: Government Printing Office.
Bogonko, S.N. (1992). A History of Modern education in Kenya, 1895-1991. Nairobi: Evans Brothers (Kenya) Ltd.
British Council (1996). Report on socio-economic study of access to university education, perfomance, equity and gender issues. Nairobi: British Council.
CESA Team. (1994). Comprehensive education sector analysis: Draft Report. Nairobi: Ministry of Education/UNICEF Kenya.
Commission on Growth and Development. (2008). the growth report: strategies for sustained growth and inclusive development. Washington, D.C.: The World Bank.
Court, D. (1979). Education, society and development. Nairobi. OUP.
Dasgupta, P. (1998). The economics of poverty in developing countries. suntory and toyota international centres for economics and related disciplines. Discussion No. DEDPS/9, London: London School of Economics and Political Science.
Denison, E., F. (1985).Trends in american economic growth, 1929-1982. Washington, DC: Brookings Institution.
Deolalikar, A. B. (1999). Primary and secondary education. Oxford: Elsevier Science.
DFID (2007). Technical and vocational skills development. Briefing; a DFID practice paper. London: Department for International Development.
DFID (2008). Jobs, labour markets and shared growth: the role of skills. Briefing; a DFID practice paper, TD/TNC 95.324.) London, UK Department for International Development.
Eldah, N., O., Mungai, E., N., Oulai, J., N., Sankale, D., J., & Mujidi, J. (2004). Community schools in Kenya case study on community participation in funding and managing schools. Paris: IIEP /UNESCO.
Elimu Yetu Coalition & Commonwealth Fund (2003). reform agenda for education sector in kenya: setting beacons for policy and legislative framework. Nairobi: Capital Colours Design Limited.
Eshiwani, G. S. (1986). Implementing educational policies in Kenya. Washington D.C.: The World Bank.

129Institute of Economic Affairs
Foster, P. (1965). The vocational school fallacy in development planning. In Anderson, C. A. & Bowman, C.,J. (eds.), Education and economic development. Chicago: Aldine Publishing Company.
Friedman, Milton (1964). Capitalism and Freedom. Chicago: University of Chicago Press.
Griliches., Z, and Jorgenson, D. (1970). Notes on the role of education in production functions and growth accounting. In W. Lee Hansen (Ed) education, income, and human capital, pp. 71-127. New York: Columbia University Press.
Grossman, M. (1976). The Correlation Between Health and Schooling. In Nestor E. Terleckyj (Ed) Household production and consumption, pp. 147-211. New York: National Bureau of Economic Research.
Hall Hall, C., J. (2000). Returns to investment in education. Washington, D.C.: Joint Economic Committee.
Hall, C., J. (2006). ‘Positive externalities and government involvement in education.’ Journal of Private Enterprise, XXI (2).
Hanushek, E. (2002). Publicly provided education. In Alan J. Auerbach and Martin Feldstein, (Eds.) Handbook of public economics. pp. 2045-2141. Amsterdam: North-Holland.
Horowitz, D. (1985). Ethnic groups in conflict. Berkeley: University of California Press.
Hyde, K.A.L., Ekatan, A., Kiage, P. & Barasa, C. (2001). The impact of HIV/AIDS on formal schooling in Uganda. Brighton: Centre for International Education, University of Sussex.
ILO. (2009). The financial and economic crisis: a decent work response. ILO Governing Body, Committee on Employment and Social Policy. (GB.304/ESP/2.). Geneva: ILO.
Karani, F.A, Gituro, W., Anyangu, M., Okumbe, M. & Getaro, K. (1995). Cost and financing of education in Kenya: Access, quality and equity in secondary education. Nairobi: World Bank and Ministry of Education.
Kenya National Bureau of Statistics. (2009). Revised population estimates. Nairobi: KNBS.
King, E.M., & Smith, J.P.(1988). Computing economic loss in case of wrongful death. (R-3549-ICJ) Santa Monica: The Rand Corporation.
Knight, J. (1996). Human capital in economic development: Editorial introduction. Oxford Bulletin of Economics and Statistics, 58(1).
Kok, W. (2004). Facing the challenge. the lisbon strategy for growth and employment. Luxembourg: European Commission
La Cava, G., Clert, C. & Lytle, P. (2004). Investing in youth empowerment and inclusion: A social development approach; insights from the ECA and LAC regions. Social Development Papers: Paper No. 60 / February 2004. Washington D.C.: The World Bank.
Leitch Review of Skills. (2006). Prosperity for all in the global economy – world class skills. Final report. Norwich: UK Treasury.
Lewin, K, and Caillods, F. (2001). Financing secondary education in developing countries: Strategies for sustainable growth. IIEP–UNESCO, Paris.
Manda, D., K, Mwabu, G. & Kimenyi, M., S. (2002). ‘Human capital externalities and returns to education in Kenya.’ KIPPRA Discussion Paper No.13. Nairobi: KIPRRA.
Manduvi-Moyo, J., & Lewin, K.,M. (Eds.) (2001). Financing secondary education in Zimbabwe: Access, Equity and Effciency revisited. Paris: UNESCO.
Ministry of Education. (1996). Report of Consultative Meeting between Ministry of Education and other partners in education development. Nairobi, July 31.
Ministry of Education. (1998). Public expenditure review, 1998. Nairobi: MoE.

130Youth Research Compendium
Ministry of Education. (2005). ‘Education Statistical Booklet, 1999-2004.’ Nairobi: MOE
Ministry of Education. (2008). ‘Education Statistical Booklet, 2003-2007.’ Nairobi: MOE
Mugisha, F. (2005): School enrolment among Urban non-slum and rural children in Kenya: Is Urban Advantage Eroding? International Journal of Educational Development, Vol. 26 No.5, 471-482.
Mwiria, K. (1990). Kenya’s harambee secondary school movement: The contradictions of public policy. Comparative Education Review, 34 (3): 350-368.
Mwiria, K. & Nge’the, N. (2007). Public university reform in Kenya: Mapping the key changes of the last decade. In Mwiria, K. & Nge’the, N. (Eds.) Private and Public Universities in Kenya. Nairobi: E.A.E.P.
National Council for Law Reporting. (2009). Laws of Kenya: The education ACT. Revised Edition 2009 (1980). Nairobi: National Council for Law Reporting
National Council of NGOs. (1997). Position paper of the voluntary sector on the education and training master plan, 1997-2010. Nairobi: ActionAid.
OECD. ( 2004). Innovation in the knowledge economy. implications for education and learning. Paris: Organisation for Economic Co-operation and Development. (Knowledge Management.)
OECD. (2009). International Development Statistics: Online Databases on Aid and Other Resource Flows. Accessed on 13 July 2011 from www.oecd.org/dac/stats/idsonline. Paris: Organisation for Economic Co-operation and Development, Development Co-operation Directorate, Development Assistance Committee.
Ojiambo, P. C. (2009). Quality education and its role in national development: A case study of Kenya’s Educational Reforms. Kenya Studies Review. 1(1): 133-149.
Onsomu, E. N., Mungai, J. N., Oulai, D., Sankale, J & Mujidi, J. (2004). Community schools in Kenya: Case study on community participation in funding and managing schools. Paris: UNESCO International Institute for Educational Planning. IIEP Working Document.
Otiende, J. E., Wamahium, S. & Karagan, A.M. (1992). Education and development in Kenya. A historical perspective. Nairobi: Oxford University Press.
Oxfam GB and ANCEFA. (2005). UPE Myth or reality: A review of experiences, challenges and lessons from East Africa. Nairobi: Sanabora Design House.
Republic of Kenya. (1964). Report of the Kenya Education Commission. Nairobi: government Printer.
Republic of Kenya (1976). Report of national committee on educational objectives and policies. Nairobi: Government Printer.
Republic of Kenya. (1981). Report of the presidential working party on the establishment of the second university in Kenya. Nairobi: Government Printer.
Republic of Kenya. (1988a). Report of the presidential working party on education and manpower training for the next decade and beyond. Nairobi: Government Printer.
Republic of Kenya. (1988b). Sessional Paper No.6 on Education and training for the next decade and beyond. Nairobi: Government Printer.
Republic of Kenya. (1994). Sessional Paper No.1 on Recovery and sustainable development to the year 2010. Nairobi: Government Printer.
Republic of Kenya. (1996). Industrial transformation to the Year 2020. Nairobi: Government printer.
Republic of Kenya. (1998). Master plan on education and training. 1997-2010. Nairobi: Jomo Kenyatta Foundation.
Republic of Kenya. (2002). Analytical report on population projections Volume VII. Nairobi: Government Printer.

131Institute of Economic Affairs
Republic of Kenya. (2004). Statistical Abstract 2004. Nairobi: Government Printer.
Republic of Kenya. (2005a). Kenya National Youth Policy. Nairobi: Government Printer.
Republic of Kenya. (2005b). Sessional Paper No.1 on A policy framework for education, training and research. Nairobi: Government Printer
Republic of Kenya (2007). Gender and Education Policy. Nairobi: Government Printer.
Republic of Kenya (2010). Economic Survey 2010. Nairobi: Government Printer.
Schilling, D. G. (1972). British policy for African education in Kenya, 1895-1939. PhD. Dissertation, University of Wisconsin.
Sheffield, J.R. (1974). Education in Kenya: An historical study. New York: Teachers College Press.
Sifuna, D. N. (1990). Development of education in Africa. Nairobi: Initiatives.
Sifuna, D. N. (1992). An introductory history of education. Nairobi: Nairobi University Press.
Sifuna, D. N. (1997). The governance of kenyan public universities. Nairobi: Lyceum Educational Consultants.
Sifuna, D. N. (2007). ‘The challenge of increasing access and improving quality: an analysis of universal primary education interventions in Kenya and Tanzania since the 1970s.’ International Review of Education, 53(5 & 6).
Smith, A. (1976). The wealth of nations. 1776. Reprint. Chicago: University of Chicago Press.
Society for International Development. (2006). Readings on inequality in Kenya: Sectoral dynamics and perspectives. Nairobi: Regal Press.
Stabler, E. (1969). Education since Uhuru. The schools of Kenya. Middle Town, Connecticut: Wesleyan University Press.
Ubi, E. N. (2007). African Youth Charter: Prospects for the development of the African youth. Paper presented in a Workshop on the Appropriation, Dissemination and Implementation of Regional Instruments and Endogenous Democratic Governance and Conflict Prevention Mechanisms in West Africa Dakar & Saly, Senegal 16 - 19 October 2007
UNESCO. (2001). Financing secondary education in developing countries: Strategies for growth. Paris: UNESCO.
UNESCO. (2010). EFA Global Monitoring Report 2008. Education reaching the marginalised. Paris: UNESCO.
UNICEF/GoK. (1997). Situational analysis of women and children in Kenya 1997. Nairobi: UNICEF/GoK.
United Nations. (2003). World Youth Report: The global situation of young people. New York: United Nations.
United Nations. (2005). World Youth Report; Young people today, and in 2015. New York: United Nations.
United Nations. (2007). World Youth Report: Young people’s transition to adulthood: Progress and Challenges. New York: United Nations.
Vasconcelos, A. V., Garcia, M. C., Mendonca, M., Pacheco, M., das Gracas Braga Pires, C. Tassi-tano & C. Garcia. (1995). ‘Sexuality and AIDS Prevention among Adolescents from Low-Income Communities in Recife, Brazil.’ Women and AIDS Research Program, 11. Washington, D. C.: ICRW.
Wainaina, G. (2006). An inequality perspective of education structure and performance, Readings on Inequality in Kenya. Nairobi: Society for International Development.
Wambugu, A. (2003). Essays on earnings and human capital in Kenya. Göteborg University. Department of Economics.

132Youth Research Compendium
Wandiga S.O. (1997). Capacity building and industrial development in higher education in Kenya. a case study of public universities investment project (1991-1994). Paris: IIEP/UNESCO.
Wolfinger, R. E. & Rosenstone S. J. (1980). Who Votes? New Haven: Yale University Press.
World Bank. (2006). World Development Report 2007: Development and the next generation. Washington, D.C.: The World Bank.
World Bank. (2000), World Development Report, 2000/2001: attacking poverty. New York: Oxford University Press.
World Bank. (2005). Expanding opportunities and building competencies for the young people: A new agenda for secondary education. Washington, D.C: The World Bank.
Yildiz, N. E. (2000). Situational analysis of basic education in Kenya: A Coutry Programming Strategy for the Canadian International Development Agency (CIDA). Nairobi: CIDA.
Zaidi, S. M. H., Kim, Y., Guzman, R. P. & Chomchai, P. (1980). The role of the university in national development: four asian case studies. New York: Vikas. Ltd.

133Institute of Economic Affairs

134Youth Research Compendium
Education: An Obsession with Increasing Access
at the Expense of Quality5Dan K’oliech
AbstractThis paper analyses education in Kenya over the last decade and the implications of these trends on the quality of education provided at different levels. The study utilizes a context-input-process-outcome framework to analyse the quality of education offered at basic, tertiary and university levels. Findings indicate that the very successes registered in increased access to education in Kenya over the last decade have also become the source of quality challenges that bedevil the sector. The main quality challenges in the country’s primary education include: high pu-pil enrolments and congestion; declining teaching staff numbers; lack of teacher motivation; inadequate teaching-learning facilities; inappropriate teacher training and pedagogy skills and, in some instances, high pupil textbook ratios. Poverty and large class sizes were also found to have significant impacts on the quality of education at this level as seen in low Kenya Certificate of Primary Education (KCPE) scores among schools in high poverty regions and those with high enrolments. Threats to quality secondary education arise from the unregulated expansion of private secondary education, the emergence of low-end public schools, especially in the day-school category. Most newly established day schools are faced with poor facilities and gross under-staffing forcing these schools to rely on non-professionals or poorly remunerated graduate teachers. The fate of private secondary schools is even worse where little or no government regulation, in the face of their profit-motive, allows the proprietors to open schools under very poor conditions with hardly any professional staff to teach learners. Overall, investments in improving the quality of basic education can be viewed as self-financing because it will significantly reduce inefficiency-related costs arising from dropouts, repetitions and low transitions to subsequent levels. The main quality challenges facing Technical, Industrial, Vocational Education and Training (TIVET) education is low state funding against the high unit-costs associated with training at this level. The lower end of TIVET that includes technical institutes and youth polytechnics remain most threatened by the funding problem. This has resulted in lack of essential equipment, poor remuneration to staff who, in turn, lack the motivation to offer meaningful train-ing. The net result has been public disillusionment and negative attitude by prospective trainees and their families towards TIVET as an option for acquiring skills for self-reliance. To raise the quality of basic education provided in the country, the study recommends hiring and equitable deployment of trained teachers in primary and second-ary schools, provision of targeted in-service training to improve performance and the gender gap in mathematics and language performance at both secondary and primary levels. Improving quality in TIVET institutions can be

135Institute of Economic Affairs
achieved through increased funding to these institutions, hiring and deployment of trained instructors and tutors and a review of the TIVET curriculum to align it to market and industry needs. Key reforms in university educa-tion to raise quality standards should include periodic external peer reviews of programmes; sustainable exchange programmes; improved staff remuneration; rationalisation of class-size; expansion and upgrading of facilities, a shift in teaching approaches from lecture methods to more learner centred pedagogies and collaboration with the public and private sector to establish functional internship programmes.
IntroductionThis paper delves into reviews and analysis of the quality of education offered at the primary, secondary and tertiary levels. Evidence exists in literature pointing at the fact that, in most of Sub-Saharan Africa (SSA), there has been a preoccupation with increasing access and equity in basic education much to the exclusion of quality interventions (Abagi and Odipo, 1997; Sifuna and Sawamura, 2010). Sifuna and Sawamura (2010) further point out that between the 1970’s and 1980’s most education policy makers and governments in SSA countries were more concerned with access and participation. However, the authors note that, over time, focus is beginning to shift away from the quantity of education provided at both basic and tertiary levels to the quality of this provision.
The analysis of the quality of education presented in this paper is largely premised on the input-process-output model of quality analysis. Anderson (2002) and Verspoor (2003) contend that in terms of input-process-output measures of quality, it is generally believed that intervening at the school and classroom level is crucial in rais-ing the quality of primary education in Sub-Saharan Africa. Ultimately, educational quality is obtained through pedagogical processes in the classroom where knowledge, skills, dispositions are acquired. The reviews on qual-ity of education provided is based on the on input-process and output indicators for which most recent data are available. Noting that this is not the only plausible model of judging quality, this paper elects to use it for lack of substantive data and literature on other frameworks/models for analysing quality education.
The Quality DebateIn basic education, the goal of achieving Universal Primary Education (UPE) has been on the international agenda since the Universal Declaration of Human Rights affirmed, in 1948, that elementary education was to be made freely and compulsorily available for all children in all nations. This objective was restated subsequently on many occasions, by international treaties and in United Nations conference declarations. Most of these declarations and commitments are, however, silent about the quality of education to be provided (UNESCO, 2004).
The definition of quality education places strong emphasis on what is called “desirable dimensions of quality”, as identified in the Dakar Framework which include learners, environments, content, processes and outcomes. These are founded on ‘the rights of the whole child and all children, to survival, protection, development and participa-tion’ (UNICEF, 2000).
According to Ngware, Oketch and Eze (2008) the concept of ‘quality of education’ has been difficult to define. The writers contend that debate on quality of education has focused on learning achievement, relevance of the curriculum to labour markets and/or the social, cultural and political environment in which the learner finds him/herself, as well as conditions of learning including teachers and facilities. Grisay and Mahlck (1991), on the other hand, hold the view that the notion of quality of education should go beyond student results and look at the de-terminants such as provision of teachers, buildings, equipment, and curriculum among others. Drawing from the arguments advanced by Grisay and Mahlck, Ngware et al (1991) conclude that the quality of education comprises three interrelated aspects namely; quality of human and material resources available for teaching (inputs), qual-ity of teaching practice (process) and the quality of results (outputs and outcomes). According to Ngware et al. (2008), the first two are inputs into the schooling process.
Taking the contending dimensions and perceptions of quality education into consideration, this review would be incomplete without giving due cognisance to the contention surrounding the concept of quality. Most writers point out that there has never been a universally accepted definition of quality (Abagi, 1999; SAUVCA, 2002; Sifuna

136Youth Research Compendium
and Sawamura, 2010). Sifuna (2007) lends credence to this assertion by observing that as a concept, quality is becoming increasingly popular in the discourse about education especially in developing countries. However, there is hardly any consensus on what the term means and on a universal way of measuring it.
Literature on quality education is replete with evidence on the links between good education and a wide range of economic and social development benefits (Sifuna and Sawamura, 2010). Better school outcomes, as reflected in student scores, are related to higher income in later life, productivity and economic growth (Sifuna and Sawamura, 2010; Lazear, 2003). Empirical work has also demonstrated that high quality schooling improves national eco-nomic potential (UNESCO, 2004).
Historical Perspective of Quality of Education in Post-Independence KenyaReviews are presented on how policy developments since independence have imparted the quality of education at different levels. According Sifuna (2007), the government’s policy on slow growth at primary level of educa-tion while favouring the rapid expansion of secondary and tertiary education underwent a major change in 1971 when a presidential decree removed all user charges for children in grades 1-4 in high difficulty districts. Around the same time, parents and communities mounted pressure on schools for the adoption of English as opposed to mother tongue and Kiswahili as the medium of instruction.
In his study on Challenges of Increasing Access and Improving Quality, Sifuna (2007) further cites two presi-dential decrees in 1973 and 1978 which had the net effect of significant increase in primary school enrolments. However, in each instant where increase in enrolments was decree-driven, many schools got overwhelmed with the high numbers of incoming students. Amutabi (2003) points out that it was not uncommon to find classes be-ing conducted in the open, under trees or in church buildings to supplement the available space. As a result, many schools introduced double sessions/shifts with morning and afternoon sessions. Abagi (1999) and Wandiga (1997) also point at the adverse effects of structural development programmes on the education sector which restricted government support to teacher salaries while at the same time introducing cost-sharing in education at all levels. The implementation of SAPs had a devastating impact on access and quality of education in both basic and higher education.
Conceptual Framework for Analyzing Quality of EducationTaking cognisance of the diverse definitions of quality education, the analysis presented in this paper is premised on the context, input, process and outcome framework shown on Figure 32
Contextual Indicators The bulk of literature on quality education tends to concentrate on the input, process and outcome/output dimen-sions of the concept (Sifuna and Sawamura, 2010; Ngware et al. 2008; UNSECO, 2004; Abagi and Odipo, 1997; World Bank, 1994). In addition to the most common three tier analysis of quality education, a fourth dimension, the contextual and policy environment, which according to Ngware et al. (2008) do influence the quality of educa-tion but, over which, the school system has little direct control over is included in this analysis. One example of contextual factors is the financial resources available to a school system which is an input the school has no direct control over. In Kenya, for example, the decision by the immediate post-independence government to place more emphasis and resources on the provision of university education had an adverse impact on the provision of basic education at the primary and secondary levels (Abagi, 1999; Sifuna 2007). The Sessional Paper No. 1 of 2005 also cites income and growth potential, population growth and structure and public sector structure and performance as some examples of the macroeconomic indicators which potentially impact the development of the education sector and also the quality of education provided (Republic of Kenya, 2005). As illustrated on Figure 32, contex-tual factors interact with all stages of the input-process-outcome system of quality education.

137Institute of Economic Affairs
Figure 32: Framework for Understanding Education Quality
Source: UNESCO (2004), Sifuna and Sawamura (2010), Ngware et al. (2008), World Bank (1994), with Author’s Modifications
Input IndicatorsThe success of teaching and learning is likely to be strongly influenced by the availability of resources to support it and the way resources are managed. Inputs are critical in enhancing the teaching and learning process and, in turn, affect the range and types of outputs. The main input variables are material resources, human resources and the governance of these resources. Material resources include; textbooks and other learning materials, classrooms, libraries, school facilities, and other infrastructure. Human resources include teachers especially pupil-teacher ratios, teacher salaries, managers, administrators, support staff, supervisors and inspectors. School governance re-lates to ways in which the school is organised and managed. (Sifuna and Sawamura, 2010). Sifuna (2007) contends that some important factors that impact on teaching and learning include strong leadership, a safe and welcoming school environment, and good community involvement for achieving good results. The framework implies that, as input factors, learner characteristics are shaped by the in-school process factors which eventually lead to the outcomes.
Process IndicatorsThe teaching and learning process closely relates with the support system of inputs and other contextual factors. Teaching and learning are key for human development and change. It is in this process that the impact of curricula and teaching methods, as well as learners’ motivation, are felt. It also includes students’ time spent on learning, assessment methods and monitoring students’ progress (Sifuna and Sawamura, 2010).
Context Economic and Labour market conditions Socio-cultural and religious factors Aid Agencies
Educational knowledge and support infrastructure Public resources available for education Competitiveness of the teaching profession National governance and management strategies
Philosophical standpoint of teacher and learner Peer effects Parental support Time available for schooling and homework
National standards Public expectations Labour market demands Globalization
Learner Side Inputs: Leaner Characteristics • String parent and
community support • Effective support from
education system • School Readiness • Prior knowledge • Barriers to learning
Enabling Inputs
• Teaching and Learning • Physical infrastructure and facilities • Human resources: teachers, principals,
inspectors, supervisors, administrators • School governance
Outcomes • Literacy, numeracy
and life skills • Creative and
emotional skills • Values • Social benefits
The Process: Teaching/Learning • Learning time • Teaching methods • Assessment, feedback, incentives • Class size
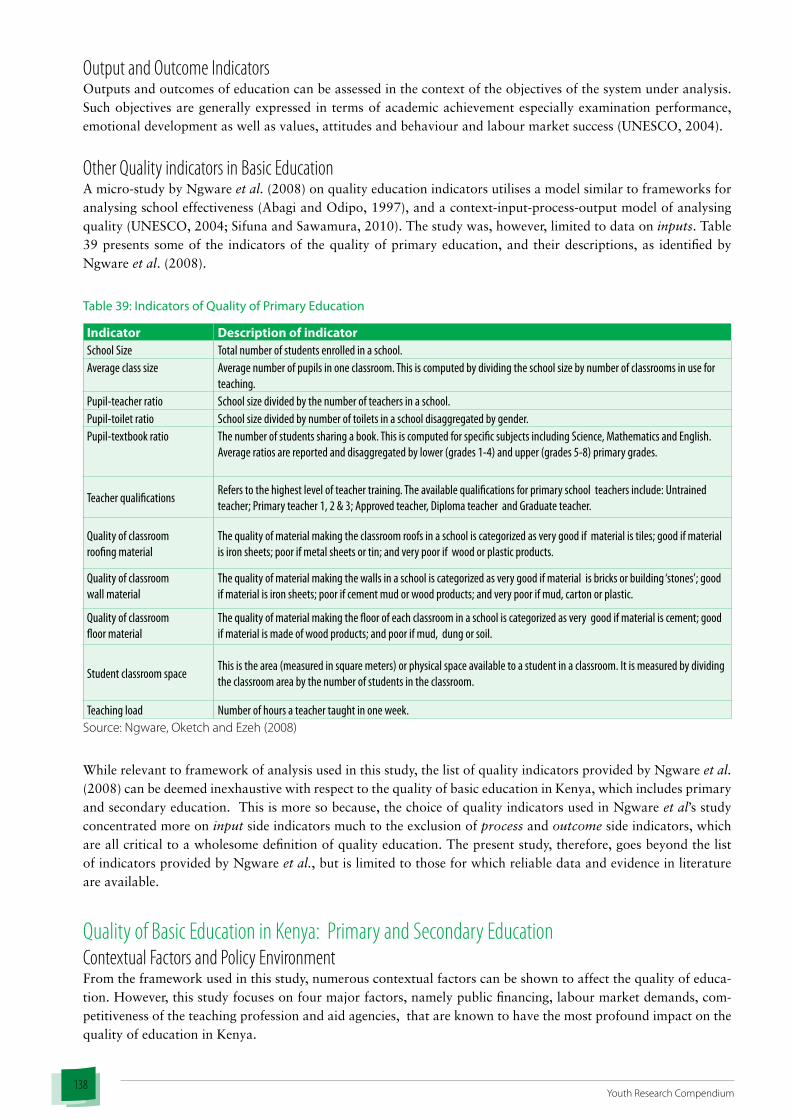
138Youth Research Compendium
Output and Outcome IndicatorsOutputs and outcomes of education can be assessed in the context of the objectives of the system under analysis. Such objectives are generally expressed in terms of academic achievement especially examination performance, emotional development as well as values, attitudes and behaviour and labour market success (UNESCO, 2004).
Other Quality indicators in Basic EducationA micro-study by Ngware et al. (2008) on quality education indicators utilises a model similar to frameworks for analysing school effectiveness (Abagi and Odipo, 1997), and a context-input-process-output model of analysing quality (UNESCO, 2004; Sifuna and Sawamura, 2010). The study was, however, limited to data on inputs. Table 39 presents some of the indicators of the quality of primary education, and their descriptions, as identified by Ngware et al. (2008).
Table 39: Indicators of Quality of Primary Education
Indicator Description of indicator School Size Total number of students enrolled in a school. Average class size Average number of pupils in one classroom. This is computed by dividing the school size by number of classrooms in use for
teaching. Pupil-teacher ratio School size divided by the number of teachers in a school. Pupil-toilet ratio School size divided by number of toilets in a school disaggregated by gender. Pupil-textbook ratio The number of students sharing a book. This is computed for specific subjects including Science, Mathematics and English.
Average ratios are reported and disaggregated by lower (grades 1-4) and upper (grades 5-8) primary grades.
Teacher qualifications Refers to the highest level of teacher training. The available qualifications for primary school teachers include: Untrained teacher; Primary teacher 1, 2 & 3; Approved teacher, Diploma teacher and Graduate teacher.
Quality of classroom roofing material
The quality of material making the classroom roofs in a school is categorized as very good if material is tiles; good if material is iron sheets; poor if metal sheets or tin; and very poor if wood or plastic products.
Quality of classroom wall material
The quality of material making the walls in a school is categorized as very good if material is bricks or building ‘stones’; good if material is iron sheets; poor if cement mud or wood products; and very poor if mud, carton or plastic.
Quality of classroom floor material
The quality of material making the floor of each classroom in a school is categorized as very good if material is cement; good if material is made of wood products; and poor if mud, dung or soil.
Student classroom space This is the area (measured in square meters) or physical space available to a student in a classroom. It is measured by dividing the classroom area by the number of students in the classroom.
Teaching load Number of hours a teacher taught in one week. Source: Ngware, Oketch and Ezeh (2008)
While relevant to framework of analysis used in this study, the list of quality indicators provided by Ngware et al. (2008) can be deemed inexhaustive with respect to the quality of basic education in Kenya, which includes primary and secondary education. This is more so because, the choice of quality indicators used in Ngware et al’s study concentrated more on input side indicators much to the exclusion of process and outcome side indicators, which are all critical to a wholesome definition of quality education. The present study, therefore, goes beyond the list of indicators provided by Ngware et al., but is limited to those for which reliable data and evidence in literature are available.
Quality of Basic Education in Kenya: Primary and Secondary EducationContextual Factors and Policy EnvironmentFrom the framework used in this study, numerous contextual factors can be shown to affect the quality of educa-tion. However, this study focuses on four major factors, namely public financing, labour market demands, com-petitiveness of the teaching profession and aid agencies, that are known to have the most profound impact on the quality of education in Kenya.

139Institute of Economic Affairs
Public Financing: In terms of sector budgeting, the primary level of education remains the most heavily funded segment accounting for over one-half of all recurrent and development expenditure in the sector. The significant increase in the proportion of sector expenditure going to primary education from 46.2 percent during the 2002/03 financial year (FY) to 57.4 percent during the 2003/04 FY is attributable to the introduction of FPE in 2003 (Oti-eno and Colclough, 2007).
In her analysis on patterns and trends of education financing in Kenya, Oyugi (2010) notes that there is a partner-ship between the government, communities and households. However, the author observes, in most developing economies, public spending on social services, including education, has all along been rising without achievement of the desired outcomes such as quality and quantity. In Kenya for instance, public expenditure on education has had the highest budget allocation relative to other social services. In 2010/11 financial year, the government increased the allocation to education from 9.2 percent in the 2009/10 to 14.1 percent of its budget (Republic of Kenya, 2010). This translates into one of the highest expenditure levels per-student out of the education GDP in Africa. The share of education out of the Government budget and commitment to education is comparable to that of a middle income country (Oyugi, 2010). It is noteworthy, however, that impact of increased enrolments in pri-mary schools and the stagnating or declining teacher population continue to impede the attainment of minimum quality standards despite the proportionate increase in public expenditure at this level.
Table 40: Actual MoE Expenditure (Recurrent and Development) 2002/03-2005/06
Sub-vote (Total) 2002/3%
2003/4 %
2004/5 %
2005/6%
General Administration and planning* 15.6 6.2 6.5 9.0 Primary Education 46.2 57.4 56.1 53.6 Teacher Education 0.2 0.5 0.4 0.6 Special Education 0.2 0.2 0.3 0.2 Early Childhood Education 0.3 0.2 0.0 0.0 Secondary Education 24.4 22.5 22.4 21.8 Technical Education 1.4 1.6 2.1 2.0 University Education 11.3 11.0 11.8 12.8 Miscellaneous Services 0.4 0.3 0.4 0.0 Total Expenditure 100.0 100.0 100.0 100.0
Source: Otieno and Colclough, 2007
Labour Market Demands: Kenya’s education system, especially at the higher education level, has been faced by the perennial labour market concerns over the quality of university graduates, especially from public universities. A study by Delloite and Touch (1994) on general graduate competence, discipline, creativity, adoptability and responsibility of university graduates found that employers in the country rated graduates from foreign universi-ties more favourably than those from local public and private universities. Gibbons et al. (1994) advance two contending theories on forms of knowledge production. In their view, ‘Mode 1’ form of knowledge production holds that universities are inherently insular institutions that tend to retain their traditional curricula, pedagogical approaches and disciplines. In the ‘Mode 2’ form of knowledge production, however, Gibbons et al also point out that universities are under pressure from the general society and the labour market to change. In this respect, according to Riechi (2010), the massification of university education has changed the traditional client base of the university with the demand for higher education being driven by more diverse groups and interests. The author further observes that quest to give graduates a competitive edge in both the local and international market has added further pressure for change forcing universities to become more concerned about knowledge production, innovation and the relevance of the education and training they offer to the greater society. From the foregoing, it is clear the ‘mode 2’ of knowledge production is labour market driven and plays a major role in internal changes in universities with profound positive impacts on the quality of education and training that they provide. The emer-gence of what Riechi terms ‘enterprise professions’ in Kenya’s universities is evidence of the impact of the labour market influences on the evolution of type and quality of education that institutions offer.

140Youth Research Compendium
Competitiveness of the Teaching Profession: As pointed out by Sifuna and Sawamura (2010), the quality of teach-ers is not only determined by the quality of their qualifications. The authors contend that in addition to other fac-tors, a teachers’ motivation is critical to their commitment to work and this, in turn, impacts the quality of their teaching. Juma and Ngome (1999) found that the overall teacher motivation levels in Kenya were generally low. In part, these low level of teacher motivation were attributed to poor conditions of work that were characterised by low pay, high cost of living especially in urban areas and lack of promotion on merit. Such conditions, the authors contend, provide an enabling environment for teacher disillusionment with their work and so that they only make half hearted attempts at performing their duties. Obviously, such a situation portends grave consequences for the quality of education offered. Waswa, Akhaukwa and Shitanda (2004) coin the phrase “the Mwalimu19 misconcep-tion” and note that for unexplained reasons, “teachers” at all levels of education have been and continue to be as-sociated with low pay and enormous workloads. Citing the case of teacher experiences in ASAL areas, MoEST and UNICEF (1999), observed that teachers are not impressed by the combination of erratically paid low salaries, iso-lation, lack of teaching resources and harsh life conditions. In these circumstances, their motivation is very low and absenteeism is high and to a certain extent structural. For example, teachers may have to travel long distances with no public transport in order to buy food or collect their wages. From the literature, it is evident that the teaching profession in Kenya lacks the necessary competitive edge over other professions and this, in turn, leads to teacher apathy and lethargy hence poor quality education at virtually all levels. As evidence of low motivation, pay-related teacher and lecturer strikes have been common occurrences in the recent past in Kenya. The ‘moonlighting’ prob-lem among university lecturers identified by Ngome et al. (2007) is indeed a manifestation that, as a result of low pay, lecturers have to engage in numerous part-time jobs and hardly have time to complete coursework with their full-time students. To address the “teacher” competitiveness and motivation problem, Abagi (1999) recommended a review of terms of service for teachers and lecturers at all levels.
Aid Agencies: Traditionally, the education sector in Kenya has benefited immensely from donor funding. In some instances, entire programmes aimed at improving education provision with implications for quality improvement have been solely donor funded. An example of donor contribution towards the improvement of quality education was the Strengthening Primary Education Project (SPREAD). The project set out to raise the quality of teaching and learning in key subjects (Mathematics, Science and English) through in-service teacher training. This was delivered through a national network of Teachers Advisory Centres and by improving links between in-service training and pre-service training (DFID, 1999). In another example of donor support, Sifuna (2007) observes that before the introduction of FPE in 2003, with donor support, the Kenya government was able to improve text-book supply in ASAL and poor regions where pupil-textbook ratios had been as high as 17:1. Giving an example of donor contribution to raising the quality of textbooks provided under FPE in Kenya, Rotich and Musakali (2006) noted that local book publishers, especially the indigenous, had blamed three international aid agencies funding the free primary education for imposing stringent printing standards that are impossible to meet. “Both printers and publishers say the conditions set jointly by UK’s Department for International Development (DFID), the World Bank and the Swedish International Development Agency (SIDA) are impossible to meet” (Rotich and Musakali, 2006:353). To meet these conditions, the writers observed, local publishers opted for offshore printing. Of course, the claims leveled by printers and publishers can be dismissed as merely convenient and tailored to get away with low quality textbook supplies as they satisfy their profit motives.
At university level, donor support in terms of World Bank loans had played a vital role in initiating several physical infrastructure projects to expand capacities and improve quality in early 1990s. However, due to the mismanage-ment of these at university level funds most of the projects remained incomplete for the next two decades before they could be completed using internally generated funds (Mwiria and Ng’ethe, 2007; Wandiga, 1997). According to Otieno and Colclough (2007) whereas the capital development in universities is still supported by government, donor contribution remains significant. Abagi (1999) identifies the lack of sustainability in donor funding as one of the problems facing donor funded education programmes. Where external funding for education programmes end abruptly, interventions aimed at improving quality of education can become unsustainable to the government. Further, the writer points at the fact that some of the externally funded education programmes are often donor-driven and do not seem to address the basic education quality problems in the country. Otieno and Colclough (2007) also reinforce this assertion by noting that donor countries use international assistance to advance their own interests, and one of the ways of doing that was to influence education policy. In the days before ‘policy dia-
19Mwalimu is a general Swahili reference to a teacher

141Institute of Economic Affairs
logue’ became commonplace, this was judged to be achieved mainly by seconding technical experts to help with policy formulation and design of education programmes.
Input IndicatorsThe number of input indicators of education can be many and varied depending on the context and type of educa-tion being analysed. The quality of basic education in Kenya has been analysed based on a few selected indicators, which include classrooms, textbooks, teacher and teacher training.
Physical Facilities: ClassroomsPhysical facilities that are considered as critical input determinants of quality of education, especially at the basic education level, include classrooms, desks, latrines, libraries and other stationery. Since independence, communi-ties have played a leading role in co-financing education. In Kenya, most of primary schools and their physical infrastructure have been developed through community efforts (Eshiwani, 1986). It is the communities that have traditionally provided finances, labour and played supervisory roles over school development projects. Between the 1980s and 1990s when Structural Adjustment Programmes (SAPs) were being implemented, the communities’ contribution towards the development of schools constituted an estimated 80 percent of all costs. Government and NGO contributions were estimated to constitute 19 percent and 1 percent, respectively (Oxfam GB and AN-CEFA, 2005; Elimu Yetu Coalition, 2003). Sifuna and Sawamura (2010) also point out that outside gazeted mu-nicipalities, it is the parents and communities that bore the responsibility of providing physical facilities including classrooms, latrines and teachers houses. This transfer of costs to parents and communities has traditionally led to quality differentials in the provision of primary education between the high and low agro-economic potential re-gions in Kenya (Mwiria and Ng’ethe, 2007). While the regions with higher agro-economic potential had been able to develop better school systems with adequate classrooms, poorer regions were faced with the challenge of in-ability to raise finances for the construction of the much needed classrooms to expand access to primary education.
As an input factor, the number of classrooms available has a bearing on the ability of schools to accommodate emerging demand for school places. Where the supply of classrooms is limited, classrooms are often congested hence higher pupil-classroom and pupil-teacher ratios. These have a bearing on the quality of education that chil-dren go through, in part, because congested classrooms are unconducive to effective teaching and learning while high pupil numbers make it difficult for teachers to give individualised attention to pupils (Bergmann, 1996).
Available data on Table 41, shows that, overall, the total number of primary school classrooms available country-wide had increased significantly from 188,133 in 1999 to 234,666 by 2007, representing an increase of 24.7 per-cent. Over the same period, the corresponding change in pupil-classroom ratio was an increase from 31:1 in 1999 to 43:1 in 2007. These trends suggest that the rate of increase in pupil numbers was higher than that of classrooms. The evidence on increasing pupil-classroom ratios is supported by a formative evaluation of the FPE programme conducted by Elimu Yetu Coalition in 2003. According to Elimu Yetu (2003), the increase in enrolment as a result of the FPE programme had created considerable pressure on facilities. The report further points out that the prob-lem was further exacerbated by a directive by the then Ministry of Education Science and Technology (MoEST) which held that ‘FPE does not require parents and communities to build new schools. The government has stopped the building of new schools and is encouraging communities to improve, refurbish and use existing facilities such as community and religious buildings. Where necessary and possible, use locally available materials’ (MoEST, 2003:4). As a result of this directive, parents and communities have neither been willing nor able to put up addi-tional classrooms and facilities such as toilets and desks. Most primary school classrooms have therefore remained congested due to a high influx of pupils. “Most teachers who took part in the study also complained of congestion at a level which made a mockery of efforts at providing quality education” (Elimu Yetu Coalition, 2003:17).
From the trends on pupil classroom ratios (Table 41) and the evidence found in the past studies on the impact of FPE on the quality of education across the country, it can be concluded that FPE has had a strong contribution towards improving access, but remains confronted by serious quality challenges in terms of disproportionate pupil numbers relative to available spaces. In providing answers to why the rich left the public school system, Bold, Kimenyi, Mwabu and Sandefur (2010), in their study on Free Primary Education in Kenya: Enrolment, Achieve-

142Youth Research Compendium
ment and Accountability, contend that the fall in net enrolment in government primary schools in response to the abolition of fees was prima facie evidence that school quality declined. The writers refer to this as the “revealed preference argument” for a deterioration in quality and further argue that enrolment data between public and private schools may elucidate mechanisms linking FPE to changes in school quality.
Table 41: Number of Classrooms and Pupil classroom ratio
Number of Classrooms Pupil classroom ratio
1999 2000 2001 2002 2003 2004 2005 2006 2007 1999 2000 2001 2002 2003 2004 2005 2006 2007
PROVINCE
Coast 13,824 11,756 11,135 11,135 12,583 13,852 13,819 14,555 15,111 26.5 30.7 32.4 32.8 36.5 38.0 38.4 38.4 53.2
Central 22,176 24,455 23,808 23,808 24,043 23,530 22,784 22,398 35,371 21.6 34.5 32.3 33.5 35.3 36.2 36.4 36.1 39.4
Eastern 37,948 37,274 38,774 38,774 41,178 42,070 41,833 42,416 44,459 28.4 29.1 28.5 29.6 31.3 32.1 32.1 32.0 38.7
Nairobi 3,817 3,801 3,790 3,790 4,008 4,305 4,245 4,400 11,188 39.5 38.3 38.1 38.3 48.1 47.2 45.0 44.0 46.7
Rift Valley 47,708 45,532 47,829 47,829 51,409 52,928 53,887 55,347 61,531 29.9 30.9 30.3 30.9 33.5 33.5 33.8 34.0 42.7
Western 24,841 24,854 24,868 24,868 27,229 28,873 28,615 28,569 25,528 33.9 33.4 33.6 35.4 38.4 37.8 37.8 38.1 52.6
Nyanza 36,466 34,061 34,300 34,300 38,456 38,184 37,599 39,153 39,015 27.8 29.7 28.0 29.6 33.3 33.0 32.7 32.6 44.7
North eastern
1,333 1,343 1,480 1,480 1,743 1,801 1,701 1,989 2,463 35.4 34.6 33.1 32.6 37.0 37.4 40.1 40.6 63.1
GRAND TOTAL
188,113 183,076 185,984 185,984 200,649 205,543 204,483 208,827 234,666 31.0 31.3 30.5 31.6 34.4 34.7 34.7 34.7 42.9
Source: MoE, 2008
Data on levels of classroom provision at secondary school level was lacking. To fill this gap, the number of schools over the 2003-2007 period have been used as a proxy indicator for trends in classroom provision. It is generally assumed that with every new school come more classrooms. Though valid, the reliance on school growth data alone, however, denies us the opportunity to confidently report on the changes in pupil-classroom ratios and their possible impact on the quality of teaching and learning. Nationally, the number of private secondary schools underwent a tremendous growth by 167.4 percent from only 488 schools in 2003 to 1,305 schools in 2007. Public secondary schools, on the other hand, grew by 1,544 from 3,583 in 2003 to 5,127 in 2007, representing an in-crease of 43.1 percent. Although fewer, it is evident that the private secondary stream was growing faster than the public one. One explanation for this is the increased demand for secondary school places arising from the legacy effects of the FPE programme and the profit-motive in the private sector. It is therefore apparent that demand for secondary school places outstrips public supply hence a rapid expansion of private provision.
Table 42: Number of Public and private Secondary Schools, 2003-2007
Province 2003** 2004** 2005 2006 2007*Pu Pr Pu Pr Pu Pr Pu Pr Pu Pr
Coast 143 43 142 43 144 43 145 43 177 103 Central 661 65 683 65 683 80 690 81 837 168 Eastern 706 90 713 90 713 194 713 196 1,111 168 Nairobi 48 47 48 47 48 47 47 47 55 283 Rift Valley 813 164 818 164 818 220 818 223 1,178 376 Western 453 17 453 18 453 52 453 52 642 46 Nyanza 737 62 740 62 740 75 741 75 1,083 148 North Eastern 22 0 25 2 25 15 28 44 13 Subtotal 3,583 488 3,622 491 3,624 715 3,635 727 5,127 1,305 TOTAL 4,071 4,113 4,339 4,362 6,432 * Provisional ** Revised
Source: MOE, 2008Pu=Public, Pr=Private

143Institute of Economic Affairs
Teaching-Leaning Materials: TextbooksAs teaching and learning materials, textbooks are critical inputs in the provision of quality education. This is more so because they are a translation of the curriculum into the actual content that is delivered to learners. Hanushek (1995), Pritchett and Filmer (1999) in Gelwwe, Kremer and Moulin (2007) argue that increasing educational ex-penditure will have a limited impact on learning in distorted educational systems. However, even sceptics about the impact of education spending in such circumstances believe that providing textbooks in environments where they are scarce can substantially increase test scores (Heyneman, Farrell and Sepulveda-Stuardo, 1978; Fuller, 1986; Lockheed and Hanushek, 1988; and Fuller and Clarke, 1994). Indeed some political economy models of distortion in education expenditure suggest that non-teacher inputs will have a large impact on student performance relative to the impact of increased spending on teachers (Pritchett and Filmer, 1999). Gelwewe et al. (2007) cite increased World Bank loans to Kenya after the end of the Moi regime, for a massive textbook supply program as evidence that policy makers believe supply of textbooks can improve the quality of education provided.
Levels of Textbook Provision in Primary SchoolsBefore 2003, it was the responsibility of parents to buy both text and exercise books used by their children. Obvi-ously, under such circumstances, even the best of EMIS systems would face challenges in accounting for the level of textbook provision in schools. The study therefore relies on the latest available data at the national level and data drawn from other sample based studies. In absolute numbers, public primary schools had approximately 9 million textbooks by the year 2003 for the five core subjects as shown in Table 43
Table 43: Number of Textbooks in Primary by Subject and Standard, 2003
Subject
Grade English Maths Science Kiswahili GHCRE Total
Standard 1 520,909 424,653 437,226 321,731 7,620 1,712,139
Standard 2 249,057 210,662 216,733 123,410 4,138 804,000
Standard 3 312,779 247,883 255,883 146,730 3,283 966,558
Standard 4 284,705 251,992 265,783 181,547 9,212 993,239
Standard 5 408,983 370,776 381,344 359,087 15,979 1,536,169
Standard 6 224,064 198,891 207,268 147,281 14,349 791,853Standard 7 271,384 245,306 249,628 183,523 17,797 967,638
Standard 8 266,722 229,268 251,666 187,611 18,209 953,476
TOTAL 2,538,603 2,179,431 2,265,531 1,650,920 90,587 8,725,072Source: Statistics Section, MoE
Pupil Textbook RatioData on primary school textbook provision levels in 2003 show that, overall, English, Mathematics, and Science subjects had attained a Pupil:Textbook Ratio (PTBR) of 2:1, 3:1 and 3:1, respectively, as compared to 4:1 and 71:1 for Kiswahili and GHCRE, respectively. The results show that, on average, most of the schools had attained the target of 3:1 pupil: textbook ratio in lower primary for English and Science subjects. Most schools were, however, yet to attain the recommended pupil: text book ratios of 2:1 in upper primary schools.
Table 44: Textbook Pupil Ratio by Subject and Standard, 2003
Grade English Mathematics Science Kiswahili GHCRE
Standard 1 2:1 3:1 3:1 4:1 164:1Standard 2 4:1 5:1 4:1 8:1 234:1Standard 3 3:1 4:1 1:4 6:1 273:1

144Youth Research Compendium
Standard 4 3:1 3:1 3:1 5:1 95:1Standard 5 2:1 2:1 2:1 2:1 51:1Standard 6 3:1 4:1 4:1 5:1 53:1Standard 7 3:1 3:1 3:1 4:1 41:1Standard 8 2:1 2:1 2:1 3:1 29:1Total 2:1 3:1 3:1 4:1 71:1Lower Primary 3:1 4:1 3:1 5:1 207:1Upper Primary 3:1 3:1 3:1 3:1 49:1
Source: Statistics Section, MoE
The Pupil Textbook Ratio situation in Urban Schools Unlike the case with rural schools, where virtually all are publicly owned, urban schools tend to have diverse types of ownership with non-state ownership constituting a significant proportion of all schools. A recent study by Ngware et al. (2008) on the impact of type of school ownership on quality of education provided in terms of pupil: textbook ratios found out that most government, private religious and Private NGO owned schools in Nai-robi had pupil: textbook ratios which approximated the government recommended level of 3:1 for lower primary and 2:1 for upper primary. At the lower primary level, most community schools appear to have higher pupil: text book ratios above the government recommended level of 3:1. While the ability of most public schools to meet the recommended level of textbook provision is attributable to high levels of government provision through the FPE programme, low levels of provision in community schools draws from the fact that these community schools operate in poor neighbourhoods where most parents cannot afford textbooks besides being excluded from state provision (Figure 33).
Figure 33: Lower Primary Pupil-Textbook Ratios in Nairobi Schools by Ownership
Source: Ngware et al. 2008
Scatter plot distributions in Figure 34 show that, overall, the pupil textbook ratios in upper primary was much lower than the government recommended levels for most schools, irrespective of type of ownership.

145Institute of Economic Affairs
Figure 34: Upper Primary Pupil-Textbook Ratios in Nairobi Schools by Ownership
Source: Ngware et al. 2008
Secondary SchoolsSecondary education curriculum has undergone a number of changes. Some of the most notable changes are recent ones that followed the partial implementation of the recommendations of Koech Commission report on Totally Integrated Quality Education and Training (TIQUET), even after its rejection by the government (Ojiambo, 2009). As noted in Republic of Kenya (2005), although the Koech report was not implemented, allegedly due to the cost implications, some of its recommendations such as curriculum rationalization were adopted and implemented. This saw a significant reduction in the number of examinable subjects in KCSE. Reviews conducted in this study were, however, unable to locate any credible data on the pupil: textbook ratio situation in Kenya’s secondary schools. In part, the lack of data on the pupil: text book ratio situation at the secondary school level can be at-tributed to the fact that, prior to the introduction of free secondary tuition in 2008, the responsibility of buying textbooks remained that of parents hence the difficulty in accounting for privately owned books in schools for each subject.
Teacher Provision and Implications for QualityAccording to Keagakwa (2011), the teacher is without doubt one of most significant contributors to the quality of education at any level of the education system. In fact, individual teacher qualities, character, qualifications and professional competence are the pedestals on which a successful education system ultimately depends. In terms of teacher contribution to the quality of education offered at a given level, Kadzamira and Rose (2003) point out that the problem of poor professional qualification is compounded by the inadequacy of teachers. In addition to the proportions of untrained teachers, continued teacher development through in-servicing, in both pedagogy and management, which in the literature on school effectiveness is considered a necessary condition for sustaining and improving achievement, is neither regular nor systematic. As outlined in World Bank (1994), a capable teaching force is defined by demonstrated subject mastery; their experience; stability in school; and their full-time-ness in school. In primary schools, efforts at providing quality primary education in Kenya have been dogged by a huge teacher deficit, training and competency, motivation and distribution challenges (Sifuna, 2007).
Number of Teachers: Teacher population trends for all the eight provinces show a decline or stagnation for the period spanning 1999-2003. In its report, Monitoring of FPE, Elimu Yetu Coalition (2003), pointed out that as a result of the FPE programme, the situation of teaching force in most districts was, on the whole, very poor. In their study on the quality of education in urban regions in Kenya, Ngware et al. (2008) found that schools in

146Youth Research Compendium
informal settlements had relatively high pupil: teacher ratios than those in formal settlements. The authors noted that a difference in pupil: teacher ratio across school ownership and location is another reflection of inequality of access to quality education in urban Kenya. According to Elimu Yetu Coalition (2003), the PTR problem is further aggravated by the ban on school levies, which makes it difficult for school Parents Teachers Associations (PTAs) to hire more teachers. Although the average PTR was 57:1, at the time of the study, PTRs of as high as 90:1 were recorded in some schools, especially in the lower grades.
Figure 35: Primary Teacher Population 1999-2007
Source: Compiled from MoE
Pupil Teacher Ratios: Trends on Figure 36 show that, prior to introduction of FPE in 2003, the pupil: teacher ratios in most schools remained below the optimal level of 40 pupils to 1 teacher. However, as more new enrol-ments and re-entry cases were recorded with the introduction of FPE, the PTRs for five out of the eight provinces namely Coast, Nairobi, Western, Nyanza and North Eastern rose above the 40:1 mark. Figure 36 shows that PTRs for Central, Eastern and Rift Valley provinces have remained below the optimal level. These trends suggest an inequitable distribution of teachers across regions of the country. From the evidence on PTRs by province, it can be concluded that, where PTR is the sole determinant of the quality of primary education, only three provinces are likely to record better quality education based on outcomes. The provincial aggregates, however, mask the intra-province disparities in teacher deployment in districts and divisions within a given province. Increase in PTR either suggests a faster rate of increase in pupil numbers relative to the number of teachers or a decline in the number of teachers. The evidence found in data showing an increase in enrolments and on Figure 35 showing a decline in teacher population suggests that the PTR situation in Kenya’s public primary schools after 2003 is characterized by both conditions.

147Institute of Economic Affairs
Figure 36: Pupil Teacher Ratio Trends, 1999-2007
Source: Uwezo (2010)
In its report on Are our Children Learning? Uwezo (2010) lends credence to the trends illustrated on Figure 36 by pointing out that there exists an acute shortage of teachers in most public primary schools with most reporting shortages of at least 4 teachers. The report interprets such deficits to mean that, at any one time, schools lacking teachers would have 4 classrooms without a teacher during lessons. Table 45 presents details of teacher popula-tion and PTRs across the eight provinces over the 1999-2007 period.
Table 45: Number of Teachers and Pupil-Teacher Ratios
Number of Teachers Pupil Teacher Ratios
1999 2000 2001 2002 2003 2004 2005 2006 2007 1999 2000 2001 2002 2003 2004 2005 2006 2007
Coast 11,139 10,784 10,426 10,398 11,217 9,967 10,455 10,922 10,898 32.9 33.5 34.6 35.1 40.9 52.3 50.7 50.9 53.2Central 26,280 26,867 26,619 24,176 24,689 22,135 21,882 20,914 20,301 31.9 31.4 31.0 33.0 34.4 38.2 37.9 38.3 39.4Eastern 37,745 37,779 37,510 36,386 37,839 35,102 35,593 35,591 34,901 29.2 28.7 29.3 31.5 34.1 38.4 37.7 38.7 38.7Nairobi 4,721 4,521 3,710 4,117 4,390 3,634 4,095 4,046 3,870 31.9 32.2 34.4 35.3 43.9 53.7 46.7 46.4 46.7Rift Valley
47,781 46,603 47,150 44,685 46,960 44,106 45,517 45,052 45,052 29.9 30.2 31.0 33.1 36.7 40.0 40.0 41.6 42.7
Western 24,128 23,707 22,885 21,933 21,443 21,484 21,812 21,491 21,784 34.9 35.0 36.3 40.1 48.8 50.2 49.6 50.5 52.6
Nyanza 32,815 33,217 32,429 29,467 29,936 27,796 28,909 29,395 27,182 30.9 30.5 30.7 34.4 42.8 43.8 42.6 44.6 44.7North Eastern
1,131 1,182 1,118 1,262 1,094 1,144 1,222 1,424 1,423 40.3 40.8 41.1 38.2 58.9 56.1 55.8 55.3 63.1
Non-Returns
1,054 12,816 1,548 - 5,742
TOTAL 185,740 184,660 181,847 172,424 178,622 178,184 171,033 169,311 173,153 31.2 31.0 31.6 34.1 38.7 40.0 42.3 42.5 42.9
Source: Teachers Service Commission

148Youth Research Compendium
Similar to the case of primary education, the provision of quality secondary education in Kenya continues to face a number of challenges that include a huge teacher deficit, training and competency, motivation and distribu-tion challenges. The number of serving secondary school teachers increased by 2,492 between 2001 and 2005, representing an increase of 5.5 percent. However, in 2006, the number of teachers declined by 10.9 percent from 47,435 to 42,403 before increasing again by 13.4 percent to a total of 48,087 in 2009. Although the number of serving secondary school teachers recorded increases, these were only marginal and not proportionate to increases in student enrolments hence increasing pupil: teacher ratios in secondary schools. This, coupled with the govern-ment’s insistence on non-employment of more teachers to fill the teacher-demand gap, and instead opting for poorly remunerated interns, has had an adverse effect on the quality of education offered at the secondary level.
Table 46: Number of Secondary School Teachers in Service; 2001-2009
2001 2002 2003 2004 2005 2006 2007 2008 2009Trained 43,090 44,005 44,792 46,479 46,436 42,183 44,076 42,867 47,958Untrained 1,853 1,896 2,242 1,105 999 220 229 149 129Total 44,943 45,901 47,034 47,584 47,435 42,403 44,305 43,016 48,087
Source: Ministry of Education, EMIS Section, 2011
As already seen from data on number of secondary schools, the high rate of expansion of privately supplied sec-ondary education poses several quality concerns. First, the subsector is largely unregulated with little adherence to quality assurance structures. Second, apart from a few high-end private schools, most expansion of privately supplied secondary education is concentrated among the poor where communities cannot pool resources to es-tablish low-cost public day schools. Because of the demand, suppliers are most concerned with returns on their investment and have least regard for quality while the communities, on their part, place value on access regardless of quality. Third, because of the profit motive, players in privately supplied secondary education tend to engage either unqualified staff or qualified but poorly paid staff whose low motivation greatly impedes quality teaching and learning.
Teacher TrainingAccording to Ngware et al. (2008), teachers who are well grounded in their content areas and have greater knowl-edge of teaching and learning are more highly rated and more successful with students in fields ranging from basic education to vocational education. Kunje (2002) Sifuna and Sawamura (2011), observe that there has been a steady improvement in the training of primary teachers in many Sub-Saharan countries since independence, with the proportion of professionally unqualified teachers declining as much as 30 percent. However, the authors note, the UPE intervention has contributed to an increase in numbers of unqualified teachers. In Malawi, for example, the government responded to increased demand by recruiting 18,000 untrained teachers, but these were insuffi-cient and also meant that a large proportion of the teaching force were inexperienced and unqualified.
Trends on Figure 37 and data on Table 47 show that, overall, the population of untrained primary school teach-ers, as a proportion of total teaching force, has declined to insignificant levels in the last decade. The decline in numbers of untrained teachers is attributable to a deliberate policy by the Teachers Service Commission (TSC) to phase out non-professional teachers from the service. However, this official data camouflages the reality in which, as a result of the surge in enrolments and the government’s freeze on mass teacher employment between 1999 and 2003, individual schools have had to engage PTA teachers in an effort to contain the problem of acute teacher defi-cit. This has negatively affected the quality of primary education in many parts of the country where enrolments have surged due to the FPE programme.
The Sessional Paper No.1 of 2005 (Republic of Kenya, 2005) identifies the quality of learning as one major chal-lenge facing primary education in the country. While the policy ideally expects each teacher to be able to teach all the seven subjects taught at the primary level of education, the two years for training are not adequate for the trainees to acquire mastery of subject content and skills of pedagogy in all these seven subjects. This compromises the quality of teaching offered after the training.

149Institute of Economic Affairs
Figure 37: Primary Teacher Proportions by Training Status
Source: Authors own from MoE
Table 47: Primary Teachers by Training
TRAINED 1999 2000 2001 2002 2003 2004 2005 2006 2007 2008 2009*
Graduate .… .… .… .… 264 647 890 1,020 1,078 1,148 1,509Approved .… .… .… .… 15,787 35,909 47,202 40,874 43,168 43,013 43,807S1/Diploma .… .… .… .… 3,011 1,896 8,813 13,787 14,587 14,510 14,619P1 .… .… .… .… 128,156 114,670 95,701 93,275 98,991 99,401 99,381P2 .… .… .… .… 23,606 19,307 15,165 11,418 12,018 11,987 11,985P3 .… .… .… .… 3,849 2,777 1,793 1,698 1,801 .… .…TOTAL 180,164 173,005 177,752 175,792 174,673 175,206 169,564 162,072 171,643 170,059 171,301Trained as % of Total
96.5 96.7 98.3 98.7 98.9 99.0 99.1 99.4 99.1 100.0 100.0
UNTRAINEDK.C.E./K .C.S.E.
.… .… .… .… .… .…722 453 688
.… .…
K. J. S. E .… .… .… .… .… .… 101 63 113 .… .…C. P. E./ Others
.… .… .… .… .… .…646 405 713
.… .…
TOTAL 6446 5894 3,108 2,245 1,900 1,682 1,469 921 1,514 .… .…GRAND TOTAL
186,610 178,899 180,860 178,037176,572 176,887 171,033 162,993 173,157 170,059 171,301
Untrained as % of Total
3.5 3.3 1.7 1.3 1.1 1.0 0.9 0.6 0.9 0.0 0.0
Source: Ministry of Education
The population of trained secondary teachers has fluctuated over time. Overall, the population of trained teachers increased by a mere 4,868 from 43,090 in 2001 to 47,859 in 2009, representing an 11.3 percent increase over a period of 9 years. Available EMIS data shows that over the same period, the number of students rose by 4.6 per-cent from 3,162,179 in 2001 to 3,308,251 in 2009. The rate of increase in the number of trained teachers seems to be higher than the rate of increase in enrolments but, because of the historical high levels of teacher deficit, an increase of 11 percent is still insufficient to cure the teacher deficiency problem.
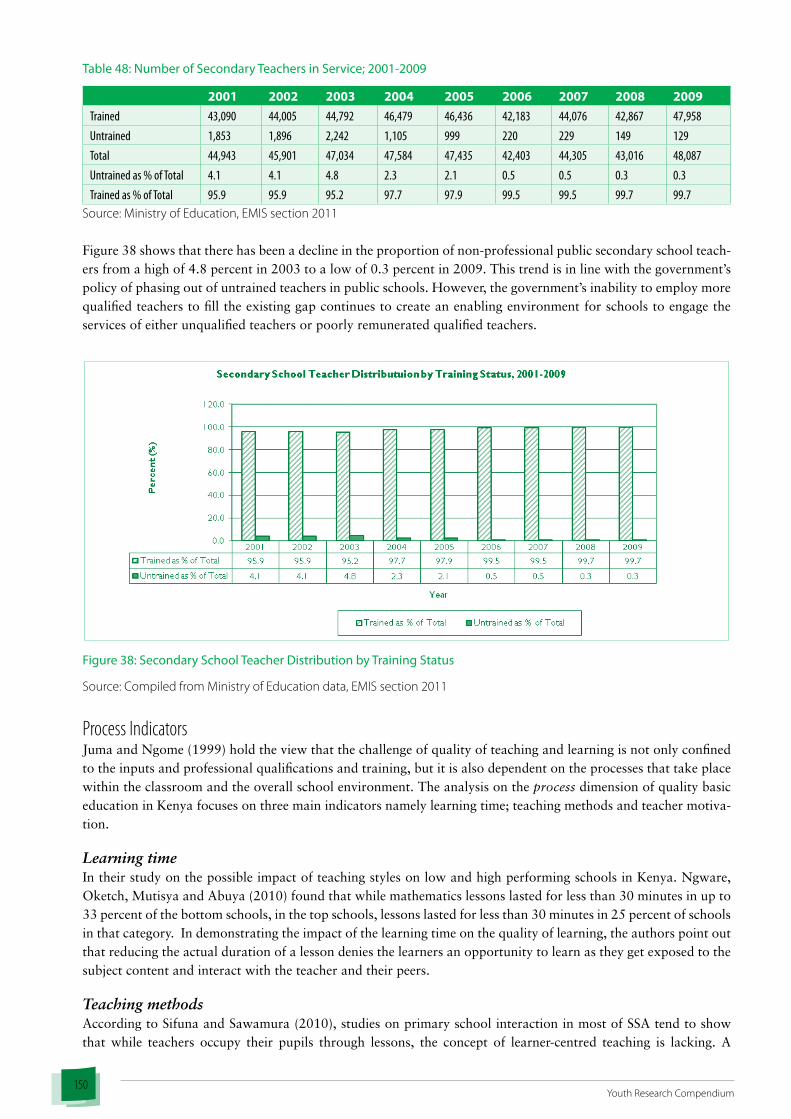
150Youth Research Compendium
Table 48: Number of Secondary Teachers in Service; 2001-2009
2001 2002 2003 2004 2005 2006 2007 2008 2009Trained 43,090 44,005 44,792 46,479 46,436 42,183 44,076 42,867 47,958Untrained 1,853 1,896 2,242 1,105 999 220 229 149 129Total 44,943 45,901 47,034 47,584 47,435 42,403 44,305 43,016 48,087Untrained as % of Total 4.1 4.1 4.8 2.3 2.1 0.5 0.5 0.3 0.3Trained as % of Total 95.9 95.9 95.2 97.7 97.9 99.5 99.5 99.7 99.7
Source: Ministry of Education, EMIS section 2011
Figure 38 shows that there has been a decline in the proportion of non-professional public secondary school teach-ers from a high of 4.8 percent in 2003 to a low of 0.3 percent in 2009. This trend is in line with the government’s policy of phasing out of untrained teachers in public schools. However, the government’s inability to employ more qualified teachers to fill the existing gap continues to create an enabling environment for schools to engage the services of either unqualified teachers or poorly remunerated qualified teachers.
Figure 38: Secondary School Teacher Distribution by Training Status
Source: Compiled from Ministry of Education data, EMIS section 2011
Process IndicatorsJuma and Ngome (1999) hold the view that the challenge of quality of teaching and learning is not only confined to the inputs and professional qualifications and training, but it is also dependent on the processes that take place within the classroom and the overall school environment. The analysis on the process dimension of quality basic education in Kenya focuses on three main indicators namely learning time; teaching methods and teacher motiva-tion.
Learning timeIn their study on the possible impact of teaching styles on low and high performing schools in Kenya. Ngware, Oketch, Mutisya and Abuya (2010) found that while mathematics lessons lasted for less than 30 minutes in up to 33 percent of the bottom schools, in the top schools, lessons lasted for less than 30 minutes in 25 percent of schools in that category. In demonstrating the impact of the learning time on the quality of learning, the authors point out that reducing the actual duration of a lesson denies the learners an opportunity to learn as they get exposed to the subject content and interact with the teacher and their peers.
Teaching methodsAccording to Sifuna and Sawamura (2010), studies on primary school interaction in most of SSA tend to show that while teachers occupy their pupils through lessons, the concept of learner-centred teaching is lacking. A

151Institute of Economic Affairs
teacher-centred and lecture-driven pedagogy are prevalent across the interaction process. Due to the high degree of use of choral responses and lack of follow-up to individual answers through teacher probes and comments, pupils are rarely encouraged to contribute and extend their contributions. Hardman, Abd-Kadir and Smith (2008) also points out that rather than allowing pupils to play an active part in the classroom discourse by answering questions, contribution of points to a discussion and explaining and demonstrating their thinking to the class, the lecture and drill approach means that pupils often remain passive. There is normally very little assessment of pupils understanding of concepts before moving to the next part of the lesson coupled with a tendency to teach the top and middle of the class to the exclusion of the less fast learners (Arthur, 2001).
Ngware et al. (2010) observe that, often, teachers are trained on how to develop effective teaching aids using lo-cally available cheap materials during their pre-service and in-service training on pedagogical skills. The authors identify the fact that visual aids break the monotony and provide a visual stimulant to reinforce what the learners hear from their teacher and peers. Interactive tools such as video programs and resource packs also constitute important teaching aids though they may be expensive for most Kenyan schools. In their study, the authors found that half of the lessons in the bottom schools used individual seatwork during teaching, with more than one-third using whole-class responses while fourteen percent used recitation. The authors, therefore, conclude that a majority of the mathematics lessons in the bottom schools are less interactive. In the top schools’ lessons, on the other hand, more than one-third used individual seatwork, with a similar proportion utilizing whole-class activ-ity. Twenty eight percent, double the proportion in the bottom schools under a similar teaching activity, utilized recitation. From their findings, Ngware et al. (2010) further conclude that the disproportionate use of passive ap-proaches of teaching largely explains the low performance in mathematics in the bottom schools.
Teacher motivationOne of the process factors identified by Juma and Ngome (1999) with an impact on the quality of education pro-vided is teacher motivation and inspiration. In their study on Teacher motivation, thinking and practice in Kenya, the writers found that, overall, teacher motivation appeared low. The principal concerns expressed by the teachers who took part in the study were poor conditions of service; housing, especially in the high cost urban areas; lack of promotion on merit; inadequate involvement in school planning; poor quality school management and support systems; and poor relations with parents. The study also found that these low levels of teacher motivation seemed to manifest themselves in poor performance in the classroom. ‘Teachers hardly spend any time preparing their les-sons, they don’t use schemes of work, nor do they keep records of work covered by pupils…discipline relies too heavily on punishment…’ (Juma & Ngome, 1999: 34). The general lack of motivation to Kenyan teachers is seen in the many strikes and strike threats that both primary and secondary teachers have been engaged in to force gov-ernment to improve their remuneration levels. In such conditions, teachers can hardly be effective in their work.
Outcome and Output IndicatorsWithin the present framework of analysis on quality education, the main indicators of quality include literacy, numeracy and life skills, creative and emotional skills, values and social benefits. Owing to challenges of locating compelling data, relevant past studies and literature on most of these outcome/output indicators, the analysis con-centrates on examination performance in KCPE and KCSE and recent findings on quality of primary education in Kenya as measured by literacy and numeracy levels. Also reviewed is the evidence on the impact of class size and poverty levels on KCPE performance. Sifuna and Sawamura (2010) observe that too many people, including edu-cation experts, “education quality” is often defined by performance in national examinations. The mastery of the curriculum is measured by national examinations. The best indicator of quality of an education is high scores on national examinations. Samoff, (2007) contends that among observers with an examination orientation towards the definition of quality education, a given system of education is deemed to be of high quality merely because learners post high examination scores. In emphasising the test score-quality link, Eldridge (2011) opines that the realisation that increasing school budgets did not necessarily translate into better performance provided impetus in the late 1980s for the compilation and administering of specially designed achievement tests which focused on student performance rather than school budgets as the definitive measure of education quality. The subsequent section looks at primary and secondary examination performance trends, and what these trends possibly portend for the quality of education provided at each level.

152Youth Research Compendium
KCPE PerformanceIn its annual EMIS report, MoE (2008) cites a study carried out on impact of FPE illustrating the positive impact of a pro-poor policy that resulted in a 22 percent increase in enrolment. There was evidence of significantly faster progress in relatively poorer districts. However, the report notes, this enrolment increase led to large class sizes especially in poorer areas. Despite, a strong negative relationship between growth in class sizes and KCPE perfor-mance, overall KCPE performance remained stable within poorer districts. The report concludes that, there is a significant role for resources (proxied by class size) in determining educational achievement.
KCPE performance trends on Figure 39 indicates that while mean scores have declined in Coast and Eastern provinces over the period under review, mean scores for North Eastern province generally increased over the same period. Of note, is the observation that KCPE mean scores for Nairobi province were consistently higher than the midpoint score of 250 marks for the entire period. Performance in Coast, Central, Eastern, Nyanza and North Eastern provinces have, however, remained below the 250 mark. Rift Valley and Western provinces recorded mean scores that were only marginally below the midpoint score of 250 marks. Other factors being equal, where KCPE performance is the sole indicator of quality then, overall, Nairobi province primary schools can be said to offer better quality education compared to the other seven provinces.
Figure 39: KCPE performance Trends by Province, 2003-2007Source: Compiled from Ministry of Education data, EMIS section 2011
Table 49 presents detailed KCPE performance trends by province and gender over the 2003-2007 period. In all the provinces and across the years, the male KCPE mean score remained consistently higher than those for females. Evidence on Table 50 on raw mean scores by subject also indicate, that while female candidates record better scores in the languages, English and Kiswahili, male candidates have dominated science and mathematics.
Table 49: KCPE Mean Score by Gender and Province, 2003 – 2007
Province 2003 2004 2005 2006 2007Male Female Total Male Female Total Male Female Total Male Female Total Male Female Total
Coast 262.3 245.5 255.1 256.8 243.3 251.0 251.8 229.9 242.4 243.4 223.2 234.8 252.3 233.0 244.1
Central 248.8 236.3 242.4 245.0 235.5 240.1 252.1 242.4 247.2 250.0 240.5 245.3 248.3 239.7 244.0 Eastern 253.4 238.9 245.9 251.3 240.3 245.7 244.6 231.9 238.2 245.2 231.2 238.2 244.2 232.6 238.4
Nairobi 273.0 267.6 270.3 269.5 267.7 268.6 275.2 265.4 270.2 275.4 265.8 270.6 272.2 262.6 267.4
Rift Valley 260.6 243.7 252.5 258.0 242.6 250.7 258.8 241.3 250.5 259.7 244.1 252.4 256.8 239.7 248.8 Western 260.9 243.2 252.1 262.0 246.6 254.5 258.9 242.0 250.7 260.5 244.3 252.7 262.2 248.8 255.7
Nyanza 250.0 227.8 240.3 254.3 233.4 245.2 252.7 233.2 244.3 252.1 233.0 243.8 250.3 232.0 242.3 North Eastern
205.3 180.5 198.6 218.9 194.3 212.7 228.8 181.2 216.7 234.7 212.4 229.3 231.2 210.7 225.8
National 254.9 239.3 247.4 254.0 240.6 247.5 252.9 237.5 245.6 252.6 237.8 245.6 252.2 237.5 245.3 Source: MoE, 2008: Statistical Booklet, 2003-2007

153Institute of Economic Affairs
Table 50: KCPE Raw Mean Score by Gender and Subject, 2003 –2007
Subject 2003 2004 2005 2006 2007
Male Female Total Male Female Total Male Female Total Male Female Total Male Female Total
English 37.5 38.5 38.0 40.0 41.0 41.0 48.5 48.9 49.3 48.5 48.8 49.2 48.6 48.7 49.1
Kiswahili 50.0 51.5 50.5 43.0 44.0 43.5 48.5 49.1 49.3 48.5 49.2 49.3 48.3 49.1 49.1
Mathematics 47.0 42.0 44.0 49.0 44.0 47.0 51.5 47.1 50.0 51.3 47.3 50.0 51.6 46.9 49.9
Science 46.0 40.0 43.0 47.0 42.0 44.0 52.6 46.0 50.1 52.6 46.2 50.1 52.3 46.2 50.0
GHCR 57.5 55.0 56.0 60.5 57.0 58.5 51.8 46.5 49.9 51.8 46.3 49.8 51.5 46.7 49.8 Source: MoE, 2008: Statistical Booklet, 2003-2007
Class size and povertyEvidence from analysis based on combined Education Management Information Systems (EMIS), Kenya Inte-grated Household Budget Survey (KIHBS) and Kenya National Examinations Council (KNEC) data, presented in MoE (2008), show that two intervening factors, class-size and poverty have significant impact on KCPE scores.
The Impact of Class-Size on Achievement: As illustrated on Figure 40, when other factors remain the same, class-size is inversely related to the annual growth rate in KCPE mean scores. In other words, while districts with declining class sizes record higher annual increments in their KCPE mean scores, those with expanding class sizes recorded declines in annual mean score rates. This finding from the combined data presents a compelling case for the rationalization of class sizes if quality, as measured by KCPE scores, is to be guaranteed.
Figure40: Growth in KCPE Scores by Growth in Class Size
Source: MoE, 2008: Statistical Booklet, 2003-2007
The Impact of Poverty on Achievement: Scatter plot distributions on Figure 41 show only marginal annual in-crements in KCPE scores with higher poverty levels. These trends indicate that poorer districts have only slightly improved in KCPE scores. This, according to MoE (2008), may be due to the fact that pupil teacher ratios have increased more in poorer districts where enrolment has been high, and higher class sizes, for those taking KCPE

154Youth Research Compendium
exams, are associated with lower performance. As already demonstrated in Figure 40, there is a strong relation-ship between increasing class sizes and declining KCPE scores.
Figure 41: Growth in KCPE Scores by Poverty Rate
Source: MoE, 2008: Statistical Booklet, 2003-2007
Kenya Certificate of Secondary Education: Some Gender Dimensions An analysis of the KCSE performance data reveals glaring gender differentials in the level of performance between subjects that are predominantly science based and languages. This section isolates candidate performance trends in mathematics and English language in an attempt to show the trends in these gender based performance differ-entials.
Performance in mathematics was not very impressive, with less than 35 percent of candidates from both sides of the gender divide found within the grade A to D+ bracket. The proportion of male candidates in the grade A to D+ bracket was higher throughout the entire period under review. Conversely, whereas the proportion of male candidates found in the grade D to E bracket was 70 percent or lower, the proportion of female candidates in the same grade bracket was 80 percent or higher save for year 2003 when it was at 79 percent (Figure 42).
Figure 42: Mathematics Performance Trends in KCSESource: Author, based on data from MoE, 2008

155Institute of Economic Affairs
Performance in KCSE English examinations have generally improved since 2003. While less than 50 percent of both male and female candidates attained scores within the grade A to D+ bracket in 2003, The proportion of female candidates in the grade A to D+ bracket was marginally higher in 2003, but recent data shows that male candidates have generally closed the gap.
Figure 43: English Performance Trends in KCSE
Source: Author, based on data from MoE, 2008
From the subject performance by gender, seen on Figures 42 and 43, it can be deduced that, the KCSE subject performance scenario mimics that of KCPE where girls perform better in languages while boys register better per-formance in sciences and mathematics. At the KCSE level, however, boys seem to have attained parity with girls in English scores. The consistent female underperformance in sciences and mathematics at both primary and second-ary levels points to possible socio-cultural and probably biological factors being responsible for these gender per-formance differentials and not variations in school quality between the predominantly girl and boy schools. These trends also suggest that the same factors behind the gender differentials in performance in science, mathematics and languages in primary education seem to have a ‘dynastic effect’ all the way to secondary education. Table 51 presents KSCE performance trends by gender over the 2003-2007 period.
Table 51: Proportion of KCSE Candidates by Performance in Selected Subjects, 2003 –2007
Subject Year 2003 2004 2005 2006 2007Gender A-D+ D-E A-D+ D-E A-D+ D-E A-D+ D-E A-D+ D-E
English (101)
Male 48.17 51.83 56.92 43.08 66.63 33.37 63.19 36.81 65.50 34.50 Female 48.63 51.37 55.02 44.98 66.56 33.44 62.86 37.14 64.77 35.23
Mathematics (121)
Male 34.07 65.93 33.51 66.49 28.94 71.06 31.17 68.83 31.81 68.19 Female 21.33 78.67 20.56 79.44 16.17 83.83 18.96 81.04 17.96 82.04
Biology (231)
Male 61.71 38.29 66.66 33.34 62.04 37.96 56.48 43.52 64.72 35.28 Female 48.47 51.53 58.07 41.93 49.20 50.80 43.37 56.63 52.27 47.73
Physics (232)
Male 56.63 43.37 63.48 36.52 64.07 35.93 65.17 34.83 68.62 31.38 Female 50.63 49.37 56.18 43.82 59.37 40.63 62.89 37.11 63.36 36.64
Chemistry (233)
Male 42.53 57.47 47.02 52.98 43.78 56.22 22.16 77.84 45.22 54.78 Female 30.04 69.96 34.58 65.42 32.08 67.92 30.72 69.28 32.25 67.75
Source: MoE, 2008: Statistical Booklet, 2003-2007

156Youth Research Compendium
Literacy and NumeracyA recent study by Uwezo (2010) christened Are Our Children Learning? found that many children of primary school age were unable to demonstrate basic reading and numeracy skills. Of the children in class two, only 33 percent could read a paragraph of their level. Another third could however not read, even a word. The study also found that 50 out of every 1000 pupils completing class 8 could not read a class two story. Girls were also found to be better readers than boys in both English and Kiswahili in six out of eight provinces but boys were generally better off in terms of numeracy skills. The study concludes that these low competencies may be affecting perfor-mance at higher levels. Of note, was the finding showing that there are more non-readers in public primary schools than in private ones. This points at quality differentials between public and private schools as seen in learning outcomes. Chinapah (1997) and Fredricksson (2004) reinforce the notion that private schools have a quality edge over public ones. ‘Private schools have traditionally produced higher-achieving pupils. School facilities are usually better, teachers are better trained (and often better paid) and family educational background is usually higher. At the basic education level in most countries, private schools tend to draw children from families with relatively higher socioeconomic levels, and from urban or semi-urban areas’ (Frederickson, 2004:7).
The quality differentials between private and public schools, notwithstanding, the Uwezo (2010) study noted that learners performed much better when given application mathematics or ‘ethno’ mathematics as opposed to ab-stract numeracy problems. Based on this finding, the study concludes that that there is a need to relate mathemati-cal concepts to real life situations, and minimize the abstract nature of mathematics depicted in the curriculum.
Social SkillsIdeally, one of the most important outcomes of a quality education should be relevant life skills that encompass survival skills and social cohesion. The inability of the country’s school system to impart crucial social skills to learners can also be inferred from the rampant cases of social ills bedevilling the youth such as drug and sub-stance abuse, crime, unwanted pregnancies, juvenile delinquency, and high prevalence of HIV and AIDS among the youthful population (UNESCO, 2004). It is therefore not surprising that these ills are most prevalent among the least educated youth. Another aspect of the education system that has an impact on socialisation is the school admission system. As presently designed, the Kenya’s secondary education admission system confines a majority of the learners to schools within their local communities. In the end, those who exit the system at the secondary level, who are the majority, have little appreciation of cultural and ethnic diversities in the country. In addition, the present TSC and civil service staff deployment system seems to favour the deployment of locals within their home regions. These practices have aggravated historically bad ethnic tensions since most Kenyans do not get to live and socialise with people outside their ethnic groups. Although the admission and teacher deployment problem is more of a structural/contextual than an in-school factor, it nonetheless, has an adverse impact on the extent to which schools can empower learners with skills to facilitate social cohesion.
Economic SuccessIn his work on education and development, Pscharopoulos (1995) considers education the route to economic prosperity, the key to scientific and technological advancement, an avenue for combating unemployment, the foundation of social equality, an instrument for wealth distribution, and the spearhead of political socialization and cultural diversity. Ojiambo (2009) describes the present system of education as one that provides a rigid and antiquated curriculum that stifles creativity and innovation, and thus, obviously producing unemployable and de-pendent graduates at all levels. Ojiambo (2009), citing Republic of Kenya (1979; 1980) notes that the existing cur-riculum at the time was overly academic, narrow and examination driven. The system was therefore not meeting its stated objectives of producing highly skilled manpower to industrial and economic development. As observed in Republic of Kenya (1988), these arguments against the 7-4-2-3 system of education presented a rationale for the introduction of the 8-4-4 system of education, which was thought of as being capable of giving its graduates the necessary scientific and practical knowledge necessary for self and salaried employment. According some critics of the 8-4-4 system, most notable among them Amutabi (2003), even a mere cursory observation of the economic outcomes of the 8-4-4 system shows that, at best, they remain tangential to the initially stated objectives. In Amu-tabi’s view, the two decades plus of experimentation with the 8-4-4 system of education has been the single most expensive form of socio-economic experimentation in Kenya’s history yet.

157Institute of Economic Affairs
Tertiary EducationTIVETPresently, TIVET institutions are operated by the Ministry of Higher Education, Science and Technology together with other ministries. These include institutions managed by the Ministries of Education, Home Affairs, Youth Af-fairs and Sports, Office of the President, Agriculture, Health Immigration, Water Development, Roads and Public Works and Labour among others. Some parastatals such as KPLC also operate TIVET institutions. There are also private investors who have established technical training institutions (MoE, 2008). The main quality challenges that TIVET education faces is low state funding that does not take into account the high unit-costs associated with offering training at this level. Technical institutes and youth polytechnics are the most threatened by the funding problem which is responsible for lack of essential equipment and poor remuneration to staff. Their staff obviously lack any motivation to concentrate on their work. From a purely administrative position, the diverse management of TIVET institutions makes it very difficult to have standardised quality indicators for this subsector. From the findings on the absence of data and dearth of literature on quality of TIVET education, this study recommends further studies in the future to assess quality issues in this level of education.
University EducationIdeally, an analysis on the quality of university education offered to the youth in Kenya should be based on most if not all indicators used for the other lower levels. However, the structure of university education is as diverse as the legal framework upon which these institutions are founded. For example, whereas public universities are established by different Acts of Parliament, private universities are established by charters awarded by the Com-mission for Higher Education (CHE). Sifuna and Sawamura (2010) concur with this assertion and argue that quality in the context of university education is hard to define precisely, especially because institutions have broad autonomy to decide their own missions and visions. The level of attainment of quality indicators for private and public universities depends largely on their age (how long they have been in existence), the level of state and donor funding, the type of leadership, level of collaboration with other local and foreign institutions, proximity to urban centres and other universities and the amount of internally generated financial resources at an institutions disposal. Because of these myriad points of divergence, it becomes quite difficult to identify common indicators of quality of provision of university education in Kenya. Perhaps owing to this challenge there is a dearth of literature focusing on the quality of university education in Kenya. As a result of the foregoing limitations, this paper departs from a data-based analysis of quality of education at this level and confines itself to a review of what existing literature says on the subject.
Quality of Academic programmesMwiria and Ng’ethe (2007) note that Kenyan employers have expressed their concerns about the ability of univer-sity graduates to respond flexibly and competently to industry needs. A study by Deloitte and Touch (1994) on em-ployer perceptions on the effectiveness of public, private and foreign universities at fostering general competence, initiative, discipline, creativity, adaptability and responsibility found that, save for adaptability, private universities received much higher scores compared to public ones (Table 52).
Table 52: Effectiveness of Kenyan Universities in fostering attributes valued in management literature
Attributes of EffectivenessPublic Private ForeignVE ME NVE VE ME NVE VE ME NVE
General Competence 17 73 10 28 72 0 57 39 4Initiative 10 52 38 33 72 6 57 39 4Discipline 7 48 45 17 56 11 35 61 4Creativity 10 62 38 11 61 22 48 48 4Leadership 14 52 34 17 78 11 48 52 0Adaptability 66 7 27 17 72 11 43 48 9Responsibility 7 41 52 17 67 16 35 61 4
VE= Very Effective, ME= Moderately Effective, NVE=Not Very EffectiveSource: Mwiria and Ng’ethe, 2007

158Youth Research Compendium
In their focus on the reforms and the quality problem in university education in Kenya, Ngome et al. (2007) note that most lecturers are aware of the quality challenges that their graduates face. The writers contend that it is common knowledge that students prefer the expository method of teaching in which they simply take notes during lectures, memorize facts and figures and then reproduce them during examinations. The authors further argue that this attitude is reinforced by the reality of teaching-learning and resource scarcity at a level that leaves the ‘talk and chalk’ method as the only viable option.
Another distressing indicator of the poor of the Quality University of education in Kenya is students’ poor com-mand of written and spoken English grammar. According to Indagasi (1991), a lot of time is spent in re-teaching undergraduates studying languages and linguistics on the basic rules of writing. What is interesting from Indan-gasi’s observations is the fact that they were made over two decades ago before secondary schools started facing serious teacher shortages and universities had not started congesting lecture halls with students in their thousands. It can only be imagined that the situation could be worse today more so among students enrolled in non-language programmes.
Learning TimeIn accounting for the use of teaching-learning time at public universities, Ngome et al. (2007) note that there is a disturbing level of inefficient use of the part of the 14 week semesters. This arises from the fact that, while one week is usually lost at the start of a semester, one week spent on revision and another two weeks are used for ex-aminations. The authors, therefore, argue that in a four year degree programme, students end up losing a total of 32 weeks which are equivalent to two semesters or a whole academic year. The problem of inefficient utilisation of teaching and learning time in public universities is made worse by lecturers’ lateness in starting their lectures each semester as they shuttle from one institution to another in the course of their ‘moonlighting’ in search of extra pay. The result is loss of substantial time which leads some lecturers to resort to unscrupulous options such as selective covering of their course outlines with focus only on areas from where they have set examinations.
Regulation Challenges: Accreditation and Quality AssuranceOnyango (2002) also identifies another quality concern where universities, that evidently lack the capacity to offer certain programmes, opt to offer them on their self-sponsored streams to get the high revenues with which these programmes are associated. The writer gives the examples of Kenyatta and Egerton Universities that had started medical degree courses but lacked the resource persons and facilities to mount quality programmes in these areas of study. Because of lack of strong independent external quality assurance structures, some public universities tend to abuse their autonomy to mount programmes that they can hardly assure their quality.
Physical Structures and FacilitiesLong before the introduction of privately sponsored programmes in Kenyan public universities, which was pio-neered by University of Nairobi in 1999, most institutions had started experiencing capacity strains due to increas-ing enrolments. Upon the introduction of self-sponsored programmes, public universities have continued to reel under the strain of student congestion in practically all facilities from lecture halls, to buses, hostels, laboratories and libraries. A study by Hughes and Mwiria (1990) found that in Kenyatta University, for example, lecturers in some of the faculty of education had to repeat the same lecture up to four times to different groups of students because of high enrolments. Ngome et al. (2007) also cite the case of Moi University where a good proportion of nearly 2000 education students attending lecturers conducted by microphone were forced to listen to the pro-ceedings through the window. They also noted that, as late as 2007, not much had changed in the area of facility constraints. What is surprising is the contention that even as recent as the end of the last decade, when universities were already generating revenues from internal income generating activities (IGAs), the facility constraints still persisted.
Number and Quality of FacultyUsing data from Commissioner for Higher Education, a study by Mwiria and Ng’ethe (2007), shows that student-academic staff ratios in public universities were at a low of 9:1 (JKUAT, UoN) and a high of 18:1 (Maseno) during the 1994/95 academic year. Over the years, the ratios had increased to a low of 12:1 (Nairobi) and a high of 33:1 (Maseno) during the 2001/02 academic year. These ratios are, however, not very useful measures of the impact of

159Institute of Economic Affairs
staffing on quality of university education because of their generic basis of computation. Even where these ratios are to be relied on as indicators of the quality of education, the situation has certainly changed, for the worse, since the introduction of self-sponsored programmes that has attracted a high influx of students. Notwithstanding the generally low student-lecturer ratios, anecdotal evidence shows that faculties with high student enrolments have up 1,000 students or more being handled by one lecturer. Further to the problem of high student numbers, Murunga (2001) observed that, as a result of low pay relative to other forms of employment, some of the best lecturers have left their teaching jobs in public universities to either join the private sector or better paying universi-ties or job opportunities outside the country. Data presented by Mwria and Ng’ethe (2007) also shows that, save for the case of the University of Nairobi, most public universities had fewer professors with most of their faculty concentrated in the lecturer and assistant lecturer ranks.
Driving Forces Expected to Shape the Future and Assumptions Driving ForcesIn view of the present dynamics in the education sector and the quality education situation in Kenya, the follow-ing factors are expected to be the driving forces that will mostly likely determine the future of quality education in the country.
Kenya Education Sector Support Programme (KESSP) Initiatives: KESSP comprises 23 different investment pro-grammes, which include quality assurance and standards. By seeking to improve education through its programmes on infrastructure, pre- and- in-service teacher education, secondary education and monitoring and evaluation, KESSP has laid the groundwork for improving the quality of basic education. With funding and effective imple-mentation, the TIVET and university education investment, the programmes are also expected to significantly raise the quality of higher education.
Economic Stimulus Investments: The most important contribution of the economic stimulus programme (ESP) in education is the provision of funding for the establishment of model schools at the primary level and centres of excellence at secondary in each county. These model schools and centres of excellence serve as the starting points in school quality improvement.
Quality Assurance Structures: Quality assurance structures in existence at both basic and higher education levels play a role in improving the quality of education. The challenges facing these structures currently include funding, personnel and implementation.
ISO Certification in Universities: To an extent, the quest for ISO certification by public universities compels them to implement and adhere to certain minimum quality standards. When the structures set in such quest are main-tained, they play a major role in quality assurance. The challenge, therefore, is not in acquiring ISO certification but in sustaining the structures on whose basis the certification was obtained.
Impacts of Increased Public University Revenues: Until the turn of the last decade, public universities had tradi-tionally suffered gross under funding in the form of low direct government capitation. There is evidence that, using their internally generated financial resources from private entry streams, public universities are today capable of expanding physical facilities, implementing modest improvements in staff remuneration and improving the supply of teaching-learning materials and equipment. All these can be seen as positive impacts of improved revenues on the provision of quality university education.
The Legacy Effects of FPE and SSE: Primary schools continue to receive more pupils because of FPE while more pupils are also enrolling in secondary schools. The increased secondary school enrolments are the product of both free tuition in public schools and a surge in demand for places by primary school leavers. The net results of the legacy effects of FPE and SSE are increased pupil-textbook ratios, pupil-teacher ratios and pupil-classroom ratios which are known to portend adverse effects on quality.

160Youth Research Compendium
Disproportionate Public University Enrolments: Owing to rising demand, the legacy effects of SSE and the rev-enue-driven private admissions in public universities, quality is likely to decline because of constraints related to inadequate inputs, facilities and personnel against rising enrolments.
Labour Market Standards: The labour market continues to raise the bar on the specific qualities they want to see in new graduates. These labour market concerns have often influenced a re-thinking of pedagogies and curriculum diversification and innovations with aim of improving the quality of higher education.
Public-private Partnerships: Increased public-private partnerships in education sector invariably leads to borrow-ing of best private sector practices that help in improving public sector efficiency in education service delivery hence quality education. Decentralization of Education Management: The move towards Decentralisation of Education Management (DEMA) is intended to make education administration and management more efficient by placing the necessary input and process factors within close proximity to the Point Of Use (POU). This will eliminate the bureaucracy and inefficiencies associated with centralisation thus contracting the lead times in decision making, supplies and implementation. As a result of improved decentralisation, local authorities will hire teachers and avail school sup-plies more efficiently in a way that significantly improves quality.
Assumptions about the Future of Quality Education in KenyaIn this section, inferences are made from some assumptions on how the present driving forces are expected to shape the future in terms of quality of education provided at different levels.
Neighbourhood effects of Centres of Excellence: The main principle behind the model primary schools and centre of excellence secondary schools is to offer the best standards of quality education in selected institutions. These centres are also expected to produce positive neighbourhood effects in the communities where they and help raise the standards of existing and new schools to conform to the standards of the centres of excellence.
Competition driven Improvement in Quality: With the decentralisation of government functions including the management of the education sector, through county governments, competition in improving education outcomes between various counties, in terms of examination performance, may arise. Such a situation will create a situation of competition-driven improvements in the quality of education.
Pathologies of Decentralisation: One of the demerits of DEMA is the problem of inequitable distribution of edu-cation resources and inputs. In the future, each county government may develop its own development priorities which could take away critical supply and input resources from education. In such a situation, contrary to expecta-tion, DEMA may in fact lead to a decline in the quality of education.
RecommendationsPrimary Education: Efforts to elevate the quality of primary education in Kenya should concentrate on the fol-lowing interventions:
• Hiring and deployment of more trained teachers to meet the ever increasing teacher deficit and tame the ever increasing pupil-teacher ratios
• Rapid and carefully planned expansion of physical facilities to match the pupil influx rate under FPE so as to curb congestion
• Resuscitation and development of sustainable systems for the defunct EMIS department to supply reliable data that are crucial for planning and implementation of programmes
• Provision of targeted in-service training to subject teachers to improve their pedagogical skills in mathemat-ics, science and languages to help eliminate the gender-based differentials in performance.

161Institute of Economic Affairs
• Regular inspection by quality assurance officers and follow up by local education administrators to ensure the recommendations of quality audits are implemented by schools, communities, MoE, TSC and other stakeholders.
• Affirmative intervention on quality improvement in pockets of high poverty and marginalised regions. This is relevant because evidence suggests low achievement in regions with higher poverty levels.
Secondary Education: Policy directions to be adopted to improve the quality of secondary education include:• Hiring and deployment of more trained teachers to meet the ever increasing teacher deficit
• Regulation of private supply of secondary education to ensure high quality in the private stream
• Deliberate targeting of newly established low-cost day schools for quality improvement
• Provision of targeted in-services to subject teachers to improve their pedagogical skills in mathematics, sci-ences and languages to help eliminate the gender-based differentials in performance.
TIVET Education: To significantly improve the quality of TIVET, the following approaches should be adopted:• Harmonization of the sub-sector to place institutions under a common management and regulation
• Increased funding to improve facilities
• Hiring and deployment of more trained tutors to resuscitate and sustain defunct departments
• Review of training curriculum and programmes to align them to market and industry needs
University Education: Interventions towards the attainment of quality university education in Kenya should in-clude:
• Establishingstructuredandsustainableacademicexchangeprogrammesforstudentsandstaffaimedatborrowingofbestpracticesintheprovisionofqualityeducation
• Implementingperiodicexternalpeerreviewsofprogrammeswiththeaimofimprovingtheirquality
• Standardisationofprogrammestoensurecomparablequalityinfulltimeandpart-timeprogrammesand,wherepos-sible,integrateselfsponsoredandregularprogrammes
• Redirectingoftheprivateentrystreamrevenuestowardsexpansionoffacilities
• Improvementofremunerationtofacultytomotivateandensuretheircommitmenttoservice
• Realignmentofcurriculumtomarketandindustryneeds
• Increasedbudgetaryallocationstoresearchandinnovation
• StrengtheningCHE’sregulatoryroleandextendingitsmandatetocoverpublicuniversitiesthroughtheharmonisationofthismandatewiththevariousuniversityACTs.
• Ashiftinteachingandtrainingfromtheexpositoryapproachtomoreleanercentredapproachestoensurequalityeducationforcreativityandinnovationasopposedtorotelearningbasedonmemorizationandreproductionoflecturecontentinexaminations.
• Adoptionofaunit-costbasedfinancingofuniversityeducationtoensuresufficientfundingfordifferentdegreepro-grammes
• Collaborationwiththeprivateandpublicsectorstocreatefunctionalinternshipprogrammesforcontinuingstudentsandfreshgraduates.

162Youth Research Compendium
References
Abagi, O. (1999). Education for the next millennium. In: Kimuyu, P., Wagacha, M., and Abagi, O. (Eds.), Kenya’s strategic policies for the 21st century: Macroeconomic and sectoral choices. Nairobi: Institute of Policy Analysis & Research.
Abagi, O. & Odipo, G. (1997). Efficiency of primary education in Kenya: Situational Analysis and Implications for Educational reform. Nairobi: Institute of Policy Analysis & Research.
Amutabi, M. (2003). Political interference in the running of education in post- independence Kenya: A critical retrospection. International Journal of Educational Development 23(2): 130-141.
Anderson, J. (2002). School improvement through teacher development: Case studies of Aga Khan Foundation projects in East Africa. The Netherlands: Swets & Zetlinger.
Arthur, J. (2001). Perspectives on educational language policy and its implementation in African classrooms: A comparative study of Botswana and Tanzania. Compare, 31(3).
Bergmann, H. (1996). Quality of education and demand for education. Evidence from developing countries, International Review of education, 42(6).
Bold, T., Kimenyi, M., Mwabu, G., & Sandefur, J. (2010). Free primary education in Kenya: Enrolment Achievement and Accountability. A DFID Funded iiG Research programme report.
DFID (1999). Strengthening Primary education in Kenya. Evaluation summary report. London: DFID.
Deloitte and Touche (1994). The Commission for Higher Education Private Universities Study: Final Report. Nairobi: Commission for Higher Education.
Eldridge, M. (2011). Quality of education and the labour market: A conceptual and literature overview. Stellenbosch Economic Working Papers: 07/1. Matieland: University of Stellenbosch.
Elimu Yetu Coalition and Commonwealth Fund. (2003). Reform agenda for education sector in Kenya: Setting beacons for policy and legislative framework. Nairobi: Capital Colours Design Limited.
Eshiwani, G. S. (1986). Implementing educational policies in Kenya, Washington D.C.: The World Bank.
Fredriksson, U. (2004). Quality education: The teacher’s key role. Retrieved July 15, 2011 from www.ibe.unesco.org
Fuller, B. (1986). Raising school quality in developing countries: What investments boost learning? Washington D.C.: The World Bank.
Fuller, B. & Clarke, P. (1994). Raising school effects while ignoring culture? Local conditions and the influence of classrooms, tools, rules and pedagogy. Review of Educational Research, 64(1), 119-157.
Gibbons, M., Limoges, C., Nowotny, H., Schwartzman, S., Scott, P., & Trow, M. (1994). The new production of knowledge: the dynamics of science and research in contemporary societies. London: SAGE.
Glewwe, P., Kremer, M., & Moulin, S. (2007). Many Children Left Behind? Textbooks and Test Scores in Kenya. (Unpublished).
Grisay, A. and Mahlck, L. (1991). The quality of education in developing countries: a review of some research studies and policy documents. Paris: International Institute of Educational Planning.
Hanushek, E., A. (1995). Interpreting recent research on schooling in developing countries. World Bank Research Observer, 10, 227-246.
Hardman, F., Abd-Kadir, J., & Smith, F. (2008). Pedagogical renewal. Improving the quality of classroom interaction in Nigerian primary Schools. International Journal of Educational Development, 28(6).

163Institute of Economic Affairs
Heyneman, S. P., Farrell, P. J, & Sepulveda-Stuardo, M A. (1978). Textbooks and achievement: What We Know. World Bank Staff Working Paper No. 298.
Hughes, R., & Mwiria, K. (1990). An essay on the implications of university expansion in Kenya. Higher Education, 19: 215-37.
Indangasi, H. (1991). Teaching English at university level in Kenya. Paper presented at Seminar on Teaching of English and Literature organized by the British Council, Nairobi.
Juma, M., & Ngome, C. (1999). Teacher motivation and practice: National primary baseline study. Nairobi: Ministry of Education and Human resource Development, Kenya.
Kadzamira, E. & Rose, P. (2003). Can free primary education meet the needs of the poor? Evidence from Malawi, International Journal of Educational Development, 23(5).
Keagakwa, D. (2011). The role of teachers in national development. Retrieved July 10, 2011 from http://www.tec.org.bw/tec_doc/role_teachers.pdf
Lazear, E.P. (2003). Teacher incentives, Swedish Economic Review, 10.
Lockheed, M., E., & Hanushek, E. (1988). Improving educational efficiency in developing countries: What do we know? Compare 18(1):21-38.
MoE (2008). EMIS Statistical Booklet. Nairobi: MoE
MOEST & UNICEF (1999). Comprehensive education sector analysis report. Nairobi: Government Printer.
MoEST (2003). Free primary education: Every child in School. Nairobi: MoEST
Murunga, G. (2001). Private universities in Kenyan higher education experience’. CODESRIA Bulletin 1&2. Dakar: CODESRIA.
Mwiria, K., & Nge’the, N. (2007). public university reform in Kenya: mapping the key changes of the last decade. In Mwiria, K., & Nge’the, N. (Eds.) Private and Public Universities in Kenya. Nairobi: E.A.E.P.
Ngome, C., Ouma-Odero, D., Wawire, V. & Wesonga, D. (2007). Private provision of higher education in kenya: trends and issues in four universities. In Mwiria, K., & Nge’the, N (eds). Private and Public Universities in Kenya. Nairobi: E.A.E.P.
Ngware, M., Oketch, M. & Ezeh, A., C. (2008). What quality of primary education are children in urban schools receiving? Evidence from Nairobi. APHRC Working paper No. 39, 2008. Nairobi: APHRC.
Ngware, M., Oketch, M., Mutisya, M., & Abuya, B. (2010). Classroom observation study. A report on the quality and learning in primary schools in Kenya. Nairobi: APHRC.
Ojiambo, P., C. (2009). Quality Education and its role in national Development: A case Study of Kenya’s Educational Reforms. Kenya Studies Review. 1 (1): 133-149.
Onyango, D. (2002). Hard Lessons in Varsity Parallel Classes. Sunday Nation, 4 August. Nairobi.
Otieno, W. & Colclough, C. (2007). Financing education in Kenya: Expenditure, outcomes and the role of international aid. London: RECOUP.
Oxfam GB & ANCEFA (2005). UPE Myth or reality: A review of experiences, challenges and lessons from East Africa. Nairobi: Sanabora Design House.
Oyugi, L. (2010). Public expenditure tracking of secondary education bursary scheme in Kenya. Nairobi: IPAR.
Pigozzi, M. J. (2004). Quality education and HIV/AIDS. Draft, June. Paris: UNESCO.
Pritchett, L., & Filmer,. D. (1999). What education production functions really show: A positive theory of education expenditures. Economics of Education Review, 18(2): 223-239.

164Youth Research Compendium
Psacharopoulos, G. (1995). Building human capital for better lives, Washington DC: World Bank.
Republic of Kenya. (1988). Report of the presidential working party on education and manpower training for the next decade and beyond. Nairobi: Government printer.
Republic of Kenya. (2005). Sessional Paper No.1 on A policy framework for education, training and research. Nairobi: Government Printer.
Republic of Kenya. (2010). Human Development sector Report 2010: Achieving growth Through targeted Effective and Efficient Public Spending. Retrieved July 22, 2011 from www.finance.go.ke/index.php?option=com_docman&task=doc
Riechi, A., O., R. (2010). Demand for regular Academic Programmes offered in Kenya’s Public Universities and their relevance to the Labour Market. Discussion Paper No. 113/2010. Nairobi: IPAR.
Rotich, D.,C., & Musakali, J. (2006). Evaluation and Selection of School Textbooks in Kenya: The Role of the Ministerial Textbook Vetting Committee. Retrieved July 10, 2011, from www.caen.iufm.fr/colloque_iartem/pdf/chebutukrotich_musakali.pdf
Samoff, J. (2007). Education quality: The disabilities of aid. International Review of Education. 53 (5&6).
Sifuna, D. (2007). The challenges of increasing access and improving quality: An analysis of universal primary education primary education interventions in Kenya and Tanzania since the 1970s. International Review of Education, 53 (5&6).
Sifuna, D., N., & Sawamura, N. (2010). Challenges of quality education in Sub-Saharan African Countries. New York: Nova Science Publishers, Inc.
South African University Chancellors’ Association [SAUVCA]. (2002). Quality assurance in South African universities. Views from SUAVCA’s National Quality Assurance Forum.
UNESCO (2000). World Education Forum: Final report (Dakar, Senegal). Paris: UNESCO.
UNSECO (2004): Education for All: The quality imperative. Paris: UNESCO Publishing.
Uwezo (2010). Are our children learning? 2009 learning assessment. Nairobi: Uwezo.
Vespoor, A. M. (Ed). (2003). The Challenge of learning: Improving the Quality of Basic Education in Sub-Saharan Africa. Paris: ADEA.
Wandiga S.O. (1997). Capacity Building and Industrial Development in Higher Education in Kenya. A case study of Public Universities Investment Project (1991-1994). Paris: IIEP/UNESCO.
Waswa, F., Akhaukwa, P., & Shitanda, D. (2004). Analysis of remuneration disparities within public universities in kenya: towards reversal of brain drain and brains in the drain. Disparities in Science, Technology, Environment, HIV/AIDS and Education. Vol.2, 159-169. Nairobi: Oakland Media Services Ltd.
World Bank. (1994). Planning and monitoring the quality of primary education in Sub-Saharan Africa. Washington, D.C.: The World Bank.

165Institute of Economic Affairs

166Youth Research Compendium
Health: Are Young People Really ‘Chillin’?6Rosemarie Muganda-Onyando
Abstract This paper looks at the health status of young people in Kenya. It highlights policy decisions made during the post independence period and their implications on the status of health of the population including that of young people. It also covers the current trends of youth health which are categorized into sexuality related challenges and non-communicable diseases. Individual and societal factors, institutional and structural factors, policy and legal factors, as well as economic and gender dimensions are highlighted as the main factors driving youth health which can be biological or non-biological. The paper is limited by a seeming bias on reproductive health and HIV and AIDS due mainly to two reasons. First, the critical challenges facing youth are those related to sexuality and repro-duction while HIV and AIDS for example occupies a central position in the lives of young people. Secondly, data and statistics on reproductive health and HIV and AIDS is better disaggregated and more easily available. The general lack of disaggregated data limits the analysis of other issues especially on the new and emerging lifestyle related diseases. Where possible, in this report attempts have been made to take into account the gender dimension and regional variances to the issues discussed. The paper highlights some of the areas where more attention needs to be paid in addressing the health of young people in Kenya and its implication for the socio-economic develop-ment of the country.

167Institute of Economic Affairs
IntroductionIn sub-Saharan Africa young people aged 15-24 account for about one-fifth of the total population of the con-tinent (Economic Commission for Africa [ECA], 2009). Keeping this large segment of the population healthy is critical to the socio-economic and political development of any country. There is growing evidence that healthy and happy adolescents can contribute well to their communities as young citizens and prepare well for their future roles and responsibilities (United Nations, 2007). In Africa, young people continue to face formidable hurdles in accessing quality education, finding decent jobs and maintaining good health, particularly in light of their vulner-ability to HIV and AIDS. The situation is more uncertain for youth in conflict and post-conflict situations. Young women are also faced with great barriers and vulnerabilities than their male counterparts (Centre for the Study of Adolescence & Population Action International 2009; UNICEF, 2009).
In Kenya the health status of young people is driven by a combination of determinants including individual and societal factors coupled with institutional, economic and global factors. While data on lifestyle changes is limited, anecdotal evidence shows that lifestyle related health conditions such as diabetes and hypertension are on the increase. Cultural and societal practices such as Female Genital Cutting (FGC) and early marriage also tend to have a negative bearing on the health of young women. The use of drugs and alcohol and associated risk taking behaviour is contributing to accidents and injury. In recent years however, the sexual health of young people has become one of the most critical challenges with a significant bearing on both their current status and future. High fertility levels as well as high teenage pregnancy rates have serious negative consequences on young people. Early childbearing disrupts the pursuit of education and limits future opportunities for socio-economic growth. But it is the emergence of HIV AND AIDS and its impact that is having considerable effect on the health and lives of young people in Kenya. The epidemic has both direct and indirect impact (NACC, 2006). It has changed the family land-scape, resulting in a re-organization of roles and responsibilities, disrupting the lives of young people and driving up health care costs. Apart from increasing orphan-hood, HIV AND AIDS also increases vulnerability of young people and puts them at risk of exploitation. The disruption of family cohesion and the trauma associated with the same is a serious threat to the mental health of young people. In addition, the high burden on young people working as care givers to family members jeopardizes their ability to prepare for the future as some may have to leave school to be able to fend for themselves and their families.
Health seeking patterns as well as access to information critical to decision making also affects the health and general well being among young people. Access to health services is limited by cost, availability and acceptability of these services as well as capacity of health sector to meet the health care needs of young people.
For several decades after independence, a non-responsive policy and legal framework hindered the development of health programmes for youth in Kenya. However over the past decade, the policy and legislative framework for youth health has improved significantly resulting in the creation of a facilitative environment conducive for the promotion of youth health. But despite this, there is a serious mismatch between policy priorities and investment in their implementation, limiting their potential contribution to the improvement of young people’s health. Sub-sequently, the existence of a good policy and legal environment has not translated into positive health outcomes for young people.
The mismatch between policy priorities as outlined in government policy documents and plans and the lack of investment in their implementation limits their contribution to the improvement of young people’s health. For example, the Adolescent Reproductive Health and Development Policy had a 10 year implementation plan, but no corresponding budgetary allocation to support the same
Historical AnalysisSince independence the health sector has gone through major policy shifts which have in turn impacted on the health and general well being of various segments of the population including that of young people.

168Youth Research Compendium
Immediate Post Independence PeriodAt independence in 1963, the government introduced ambitious health initiatives aimed at combating disease in the country and improving the health status of the people. Initiatives included free out-patient health services and hospitalization for all children under 5 years in public health facilities. During the 1960s the integrated Maternal Child Health and Family Planning (MCH/FP) program was expanded to ensure the immunization of children against major preventable diseases while at the same time, the accelerated expansion of maternal healthcare ser-vices was also pursued. The country adopted the National Family Planning Program in 1967 embarking on inten-sive campaigns to contain high fertility rates. Although these efforts contributed to the improvements in key health indicators such as immunization coverage, ante and post natal care (ANC and PNC), it marked the beginning of the marginalization of adolescents and youth and the lack of investment in programmes specifically targeted at this age segment.
The period was also characterized by a steady increase in fertility rates among 15-19 and 20-24 year olds from the 83/1000 recorded in the 1962 census to 111/1000 recorded in the 1969 census to a high of 179/1000 for 15-19 years in the 1979 census. The 20-24 age group continued to post the highest Age Specific Fertility Rates (ASFR) of all age groups, peaking at 369/1000 in 1978. Between them, the two groups contributed significantly to overall fertility. In certain parts of the country, motherhood and childbearing continued to occur at relatively lower ages with serious socio-medical and economic consequences. Table 53 shows the Age Specific Fertility Rates from vari-ous surveys between 1962 and 1989.
During the same period Maternal Mortality Rates (MMR) dropped from 690/100,000 experienced during the early post independence period to about 500/100,000 in the 1980s. Since then there has been limited change in MMR. Currently rates vary between 418/100,000 contained in the KDHS (KNBS, 2010a) and 560/100, 000 (UNICEF, 2009). There are major variations by region with certain parts of the country regis-tering rates as high as 1200/100,000. In areas where childbearing begins early such as in North Eastern, Nyanza and Coast provinces, maternal mortality and morbidity rates are higher.
Table 53: Age Specific Fertility Rates
Age Specific Fertility Rates from Various Surveys and Censuses, Kenya
Age1962 Census 1969 Census 1977 NDS 1977/78
KFS1979 Census
1984 KCPS 1989 KDHS 1993 DHS1990-992
1998 KDHS1995-1997
2003 KDHS 2008/09 KDHS
15-19 83 111 135 177 179 143 152 110 111 114 10320-24 207 284 365 369 368 358 314 257 248 243 23825-29 223 290 361 356 372 338 303 241 218 231 21630-34 203 253 316 284 311 291 255 197 188 196 17535-39 163 200 231 216 226 233 183 154 109 123 11840-44 109 121 133 132 105 109 99 70 51 55 5045-49 63 60 56 51 14 66 35 50 16 15 12Total Fertility Rate
5.3 6.6 8.0 7.9 7.9 7.7 6.7 5.4 4.7 4.9 4.6
Age Specific Fertility Rates Are per 1000 women. Rates refer to the three year period preceding the surveys except for 1989 KDHS, which used a five year period.
Sources: Central Bureau of Statistics, 1984; 1989; 1993, 2003; 1999 Census and KNBS, 2010a,
people contributed significantly to overall fertil-ity with the 20-24 age group recording some of the highest fertility rates of all the age segments.

169Institute of Economic Affairs
Text box 1: Key Developments during the 1960s with a Bearing on Young People’s Health
• Creation of the National Family Planning Program in 1967• Expansion of the integrated Maternal Child Health and Family Planning (MCH/FP) programme spurred by government acknowledgement of the need
to promote family planning. • Emphasis during this period was put on mothers and children, mainly those under five and efforts intensified on improving immunization and child
survival, which did not have an immediate direct benefit for adolescents and youth. • The steady rise in fertility among young people ages 15-19 and 20-24 continued
The 1970s: The Primary Health Care DecadeThe primary health care concept adopted by government in the 1970s resulted in a comprehensive approach to health care, but with a bias towards children and mothers. During this decade prevention and health promotion were vigorously pursued with the aim of reducing the disease burden and mortality from easily preventable health conditions. Activities focused on expanding access to immunization of children, prevention of water borne dis-eases especially among children under five and promotion of community based health education and promotion. Adolescents and youth were not a major beneficiary of health initiatives because fertility and sexual health were the most critical issues in youth health. The economic crisis which begun during this period also had a major impact on the ability of Kenya’s government to meet the health care needs of its citizens including young people.
Text Box 2: Key Developments with a Bearing on Young People’s Health during the 1970s
• Economic crisis arising from the oil crisis of 1973 • The introduction of primary health care with strong focus on children and women• Strengthening of preventive and promotive health with a specific focus on child survival focusing mainly on reducing morbidity and mortality among
children under 5 years• Reduction of government spending on health sector and deterioration in service delivery• Beginning of austerity measures in social sectors• Reduction in service utilization by the people due to introduction of user fees
The 1980s: The Lost Decade and a Period of Declining Health Fortunes for Kenya During the 1980s the country experienced serious challenges in the social sectors due to a combination of global as well as internal factors. The introduction of Structural Adjustment Programmes (SAPs) by the International Monetary Fund (IMF), poor economic performance against a rapidly growing population coupled with poor governance, corruption and mismanagement had disastrous effects on social services including health. Measures included the introduction of cost- sharing in public health facilities in 1992 which exacerbated the situation for the poor, many of whom already had difficulties accessing health care. The result of the SAPs included: limited access to health care: cost cutting measures that limited the range of health care services for all age segments; loss of staff to private sector and neighboring countries; and drug and supply shortages in public health facilities. The introduction of user fees was to have a major impact on service utilization especially among those who depended on the public health sector. Studies have shown that in Africa, user fees was a financial barrier to access to health services and that the abolition of user fees had generally positive effects on the utilization of services (Ridde and Morestin, 2010; Mwabu, Mwanzia and Liambila; 1995).
A review of the impact of user fees on utilization of STI treatment services at Nairobi’s Special Treatment Clinic for Sexually Transmitted Diseases (STDs) showed a 40% reduction in the number of male clients (Moses, Plum-mer, Manji and Bradley, 1992). Among women the attendance rate reduced to 65% of the pre-user-charge level. When the user fees were suspended, attendance levels rose for both men and women. According to the study, the introduction of user fees probably increased the number of untreated STDs in the population, with potentially serious long-term health implications.
Another study conducted in 1995 to assess the demand effects of user charges within the district health care system in Kenya showed that attendance and service utilization in public clinics dropped by about 50% during the period of cost-sharing (Mwabu, Mwanzia & Liambilia, 1995). This led to the suspension of the scheme for about 20

170Youth Research Compendium
months. During a 7 month period after the suspension of fees, attendance at government health centers increased by 41% while at the same time there was a significant movement of patients from the private sector to government health facilities. The study also looked at the impact of fees on revenue and service quality in government facilities. It established that revenue generated by user fees covered 2.4% of the recurrent health budget, but government bureaucracy hindered about 40 percent of health facilities from using the revenues collected.
During the same period government spending on health also declined from 9.3% to 8.5% between 1979/80 and 1991/92 reaching a low of 7.4% in 1988/89. Mismanagement and inefficiency resulted in serious leakage, severely limiting the capacity of most public health facilities to meet the needs of Kenyans especially in rural areas.
While available data is not disaggregated by age, it is safe to assume that young people were disproportionately affected as they were probably less likely to access treatment from private sector sources than adults who might have been able to pay for services elsewhere.
The emergence of HIV and AIDS during this period was one of the most significant developments whose impact on the health status of young people was to be felt more during the mid 1990s. Prevention efforts during the 1980s and early 1990s were guided by an assumption that HIV was a problem of certain high risk categories such as commercial sex workers. A shift in focus began in the mid 1990s when surveillance data highlighted trends that confirmed the spread of HIV among other segments of the population including young people (NASCOP, 1995).
During the same period, young people in the age group 20-24 age-group continued to post the highest total fertil-ity rates of all age groups. DHS data shows evidence of fertility decline among all age groups except among young people during the period. Fertility rates ranged from 152 births per 1000 women in the youngest age group 15-19 to over 300 for women 20-24 and 25-29 years (CBS, 1989) as indicated on Table 53.
Text Box 3: Key Developments during the 1980s with a Bearing on Young People’s Health
• Reduction of government spending in the health sector• Introduction of user fees which affected youth access to health care services• Reduction in service utilization by the people especially the poor • The emergence of HIV AND AIDS – first case reported in 1983• Migration of staff from the public health facilities to the private sector• Chronic shortage of supplies in public health facilities including stationery• High levels of corruption and significant leakage of health resources
The 1990s: New and Emerging Health ChallengesThe challenges and policy shifts of the 1980s spilled over into this decade with mixed results. Some of the policies pursued by government had a direct impact in improving the health status of Kenyans. For instance, the Crude Birth Rate (CBR) dropped from 20 per 1000 in the early 1960’s to 12 per 1000 in 1993 and the Total Fertility Rate (TFR) dropped from 8.1 children per woman to 5.4 children by 1993. Among adolescents and youth, fertility levels declined during the same period. There was also a slight decline in teenage pregnancy and associated nega-tive consequences. This was short lived as trends began to increase by the end of the 1990s.
However, these dramatic gains were to be substantially reversed in the mid to late 1990s as investment and donor support dwindled, mismanagement escalated and staff migrated from the public to private sectors as well as to other countries in search of better opportunities. The significant declines experienced in fertility also began to stall. According to the KDHS (1998), fertility levels remained high among 15-19 and 20-24 age groups with teenage pregnancy rates experiencing little or no change. At the same time the devastating effects of HIV and AIDS on young people increased during this period.
The effect of the HIV epidemic also began to be felt throughout the health sector as it impacted on various aspects including staffing, supplies, budgets and the pattern of disease burden among other things. It contributed to in-creased mortality and morbidity, raising health care costs and severely burdening an already strained health care system as well as stretching already limited household resources.

171Institute of Economic Affairs
To deal with the situation, government initiated the Health Sector Reform Programme, which began in 1994 within the Kenya Health Policy Framework (KHPF) aimed at improving the quality of service delivery and making services affordable and more accessible. These efforts did not have an immediate positive impact and the situation continued to deteriorate. Key health indicators continued on a worsening trend.
To deal with the effects of adolescent fertility and related negative consequences, the government initiated the Family Life Education Programme (FLEP) in the early 1990s. The opposition to this programme from religious groups especially the Catholic Church was so intense that the government was forced to pull the plug on an initia-tive it had already piloted for several years and was ready to scale up. The opposition centered on content, context and responsibility – what would be taught, where and whose responsibility it was to provide the sex education to young people. The church argued that it was the responsibility of the parents despite evidence that parents were ill equipped to do so.
At global level, the 1994 International Conference on Population and Development (ICPD) held in Cairo, Egypt had significant implications for the health of young people, particularly in the area of reproductive health and HIV and AIDS. The conference set a clear agenda and put targets for adolescent reproductive health. The ICPD Plat-form of Action (ICPD, PoA) clearly outlined the key actions that countries including Kenya needed to undertake to enhance the health and general well being of young people. This included the enactment of legislation and the strengthening of institutional structures to facilitate access to reproductive health services. According to ICPD (1994), the ICPD conference goals for youth reproductive health included:
• Reduction of maternal mortality Ratios (MMR) to half of 1990 levels by 2000, and by another half by 2015. In countries where maternal mortality is exceptionally high, the goal was to reach fewer than 60 maternal deaths per 100,000 births by 2015.
• Universal access by 2015 to the widest possible range of safe and effective family planning methods, including barrier methods, and to the following related reproductive health services: essential obstetric care, prevention and management of reproductive tract infections including sexually transmitted infections.
• Expansion of skilled delivery services to at least 60 percent of all births in countries where maternal mortality is high, and to 90 percent worldwide, by 2015.
• Elimination of unmet need for family planning by 2015
• Reduction of vulnerability to HIV and AIDS infection. By 2010, at least 95 percent of men and women aged 15 to 24 should have access to preventive methods such as female and male condoms, volun-tary testing, counseling, and follow-up. Global HIV infection rates in this age group should be reduced by 25 percent by 2010
Text Box 4: Key events during the 1990s with a Bearing on Young People’s Health
Increased funding and initiatives for youth healthThe arrival of new initiatives and the increase in investment for fighting certain diseases and health conditions such as the Global Fund to fight AIDS, TB and Malaria (GFATM), the Roll Back Malaria Initiative contributed positively to the health and general well being of Kenyans. The new initiatives led to increased investment in the health sector with improved fortunes for all segments of the population. While some of the efforts tended to favour certain groups, the general population benefited from improved availability of medicines and supplies and improved capacity of health care providers.
Policy and legislationThere was the Health Sector Reform Programme, which began in 1994 within the Kenya Health Policy Framework (KHPF); The Reproductive Health / Family Planning and Standards for Service Providers which was released in 1997; The National Reproductive Health Implementation Plan for the years 1999-2003 which was developed to guide the implementation of reproductive health programmes for all age groups; and the International Conference on Population and Development (ICPD) held in Cairo set the Agenda for Adolescent Health.
Worsening of key health indicatorsIncreasing negative impact of HIV on young people and the general population. Teenage pregnancy rates remained high during the period
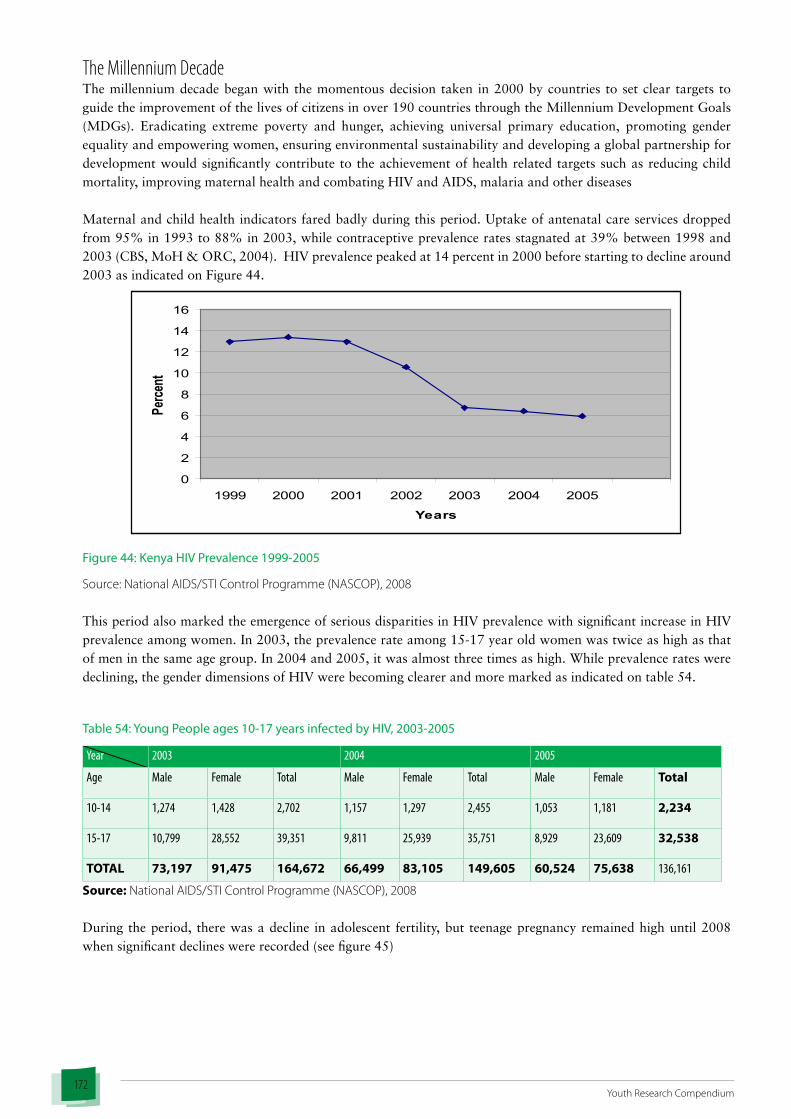
172Youth Research Compendium
The Millennium DecadeThe millennium decade began with the momentous decision taken in 2000 by countries to set clear targets to guide the improvement of the lives of citizens in over 190 countries through the Millennium Development Goals (MDGs). Eradicating extreme poverty and hunger, achieving universal primary education, promoting gender equality and empowering women, ensuring environmental sustainability and developing a global partnership for development would significantly contribute to the achievement of health related targets such as reducing child mortality, improving maternal health and combating HIV and AIDS, malaria and other diseases Maternal and child health indicators fared badly during this period. Uptake of antenatal care services dropped from 95% in 1993 to 88% in 2003, while contraceptive prevalence rates stagnated at 39% between 1998 and 2003 (CBS, MoH & ORC, 2004). HIV prevalence peaked at 14 percent in 2000 before starting to decline around 2003 as indicated on Figure 44.
0
2
4
6
8
10
12
14
16
1999 2000 2001 2002 2003 2004 2005
Years
Perce
nt
Figure 44: Kenya HIV Prevalence 1999-2005
Source: National AIDS/STI Control Programme (NASCOP), 2008
This period also marked the emergence of serious disparities in HIV prevalence with significant increase in HIV prevalence among women. In 2003, the prevalence rate among 15-17 year old women was twice as high as that of men in the same age group. In 2004 and 2005, it was almost three times as high. While prevalence rates were declining, the gender dimensions of HIV were becoming clearer and more marked as indicated on table 54.
Table 54: Young People ages 10-17 years infected by HIV, 2003-2005
Year 2003 2004 2005
Age Male Female Total Male Female Total Male Female Total
10-14 1,274 1,428 2,702 1,157 1,297 2,455 1,053 1,181 2,234
15-17 10,799 28,552 39,351 9,811 25,939 35,751 8,929 23,609 32,538
TOTAL 73,197 91,475 164,672 66,499 83,105 149,605 60,524 75,638 136,161
Source: National AIDS/STI Control Programme (NASCOP), 2008
During the period, there was a decline in adolescent fertility, but teenage pregnancy remained high until 2008 when significant declines were recorded (see figure 45)
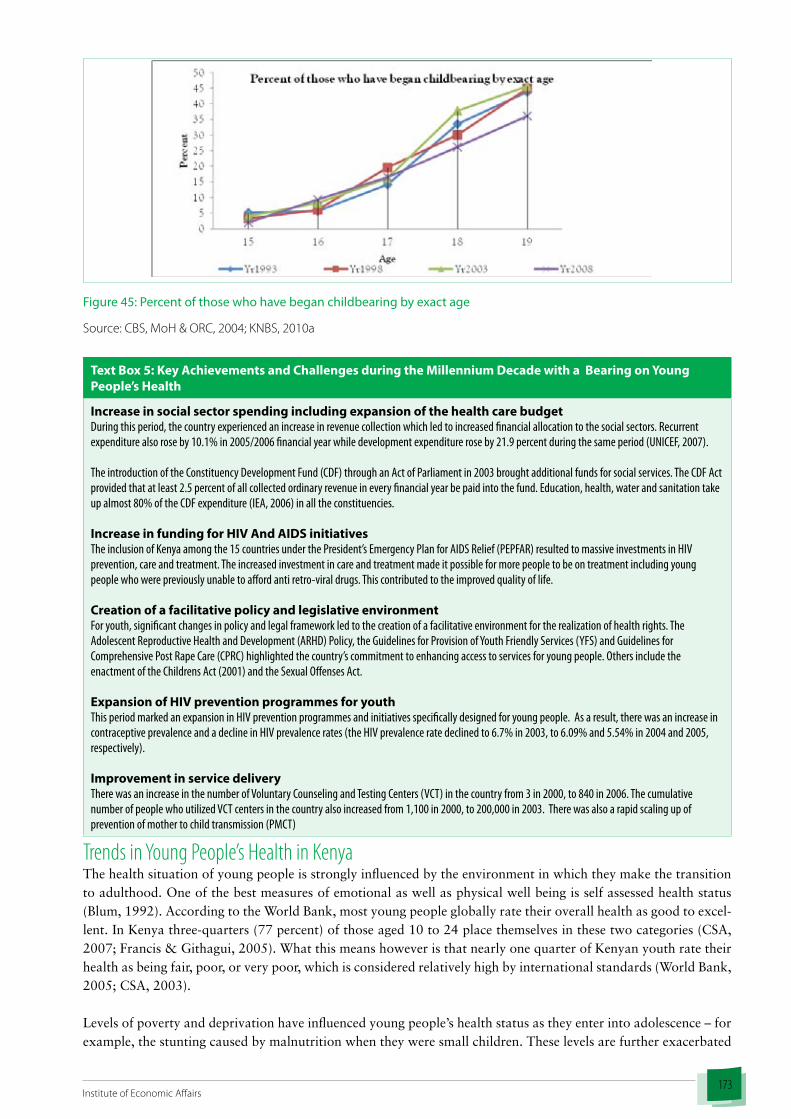
173Institute of Economic Affairs
Figure 45: Percent of those who have began childbearing by exact age
Source: CBS, MoH & ORC, 2004; KNBS, 2010a
Text Box 5: Key Achievements and Challenges during the Millennium Decade with a Bearing on Young People’s Health
Increase in social sector spending including expansion of the health care budgetDuring this period, the country experienced an increase in revenue collection which led to increased financial allocation to the social sectors. Recurrent expenditure also rose by 10.1% in 2005/2006 financial year while development expenditure rose by 21.9 percent during the same period (UNICEF, 2007).
The introduction of the Constituency Development Fund (CDF) through an Act of Parliament in 2003 brought additional funds for social services. The CDF Act provided that at least 2.5 percent of all collected ordinary revenue in every financial year be paid into the fund. Education, health, water and sanitation take up almost 80% of the CDF expenditure (IEA, 2006) in all the constituencies.
Increase in funding for HIV And AIDS initiativesThe inclusion of Kenya among the 15 countries under the President’s Emergency Plan for AIDS Relief (PEPFAR) resulted to massive investments in HIV prevention, care and treatment. The increased investment in care and treatment made it possible for more people to be on treatment including young people who were previously unable to afford anti retro-viral drugs. This contributed to the improved quality of life.
Creation of a facilitative policy and legislative environmentFor youth, significant changes in policy and legal framework led to the creation of a facilitative environment for the realization of health rights. The Adolescent Reproductive Health and Development (ARHD) Policy, the Guidelines for Provision of Youth Friendly Services (YFS) and Guidelines for Comprehensive Post Rape Care (CPRC) highlighted the country’s commitment to enhancing access to services for young people. Others include the enactment of the Childrens Act (2001) and the Sexual Offenses Act.
Expansion of HIV prevention programmes for youthThis period marked an expansion in HIV prevention programmes and initiatives specifically designed for young people. As a result, there was an increase in contraceptive prevalence and a decline in HIV prevalence rates (the HIV prevalence rate declined to 6.7% in 2003, to 6.09% and 5.54% in 2004 and 2005, respectively).
Improvement in service deliveryThere was an increase in the number of Voluntary Counseling and Testing Centers (VCT) in the country from 3 in 2000, to 840 in 2006. The cumulative number of people who utilized VCT centers in the country also increased from 1,100 in 2000, to 200,000 in 2003. There was also a rapid scaling up of prevention of mother to child transmission (PMCT)
Trends in Young People’s Health in KenyaThe health situation of young people is strongly influenced by the environment in which they make the transition to adulthood. One of the best measures of emotional as well as physical well being is self assessed health status (Blum, 1992). According to the World Bank, most young people globally rate their overall health as good to excel-lent. In Kenya three-quarters (77 percent) of those aged 10 to 24 place themselves in these two categories (CSA, 2007; Francis & Githagui, 2005). What this means however is that nearly one quarter of Kenyan youth rate their health as being fair, poor, or very poor, which is considered relatively high by international standards (World Bank, 2005; CSA, 2003).
Levels of poverty and deprivation have influenced young people’s health status as they enter into adolescence – for example, the stunting caused by malnutrition when they were small children. These levels are further exacerbated

174Youth Research Compendium
by the violence and exploitation which often characterizes their environment. The environment also includes cultural factors which in many cases are protective and health supporting but in other cases, they threaten their health, such as Female Genital Mutilation (FGM) and early marriage. The use of drugs and alcohol and associated risk taking behaviour is contributing to accidents and injury. In recent years however, the sexual health of young people has become one of the most critical challenges with a significant bearing on both their current status and future.
Sexuality Related Challenges and Impact on Young People’s HealthGlobally ill health arising from sexual and reproductive health such as pregnancy related complications and child birth, sexually transmitted infections, including HIV and reproductive health cancers account for over one third of the disease burden among women of child bearing age (15-49) and one–fifth of the burden for the whole popula-tion. In developing countries, complications of pregnancy and child birth are the leading cause of death and dis-ability among women aged 15-49 (UNICEF, 2009; Women Deliver, 2010).
Age at first sex among young peopleIn Kenya some of the major challenges facing young people are related to sexuality and reproduction. Sexual activ-ity is high among the youth in Kenya, begins early and is often unprotected. The median age at first sex has risen from 16.7 in 1998 to 17.5 in 2008/09 (KNBS, 2010a) with women living in rural areas having their first sexual encounter almost two years earlier than those living in urban areas. Among women aged 20-49 median age at first sex increased slightly from 17.8 years to 18.2 years, while that of men aged 20-54, increased from 17.1 to 17.6 years (KNBS, 2010a). KDHS data further indicates that almost 7 out of 10 young people have had sex by the age of 20. This forms the bulk of school going youth (CSA, 2007). Figure 46 depicts age at first sex among young people by gender while Figure 47 depicts age at first sex among young people in rural and urban areas.
Figure 46:AgeatFirstSexamongYoungPeopleSource: KDHS, 2009
Figure 47: Age at First Sex among Young People in Rural and Urban Areas
Source: KDHS, 2009

175Institute of Economic Affairs
Teenage Pregnancies and high fertility levels among young people Early and unprotected sexual activity is associated with among other things, high rates of teenage pregnancies. A 2003 national survey of secondary school students showed that 13% of students had experienced their first pregnancy by the age 14, while 10% of girls interviewed had been pregnant and had either given birth or had an abortion (CSA, 2007). According to the 2009 KDHS, generally, the percentage of teenagers who had begun child bearing declined from 23% in 2003 to 18% in 2009. The proportion of teenagers who had begun child bearing increased dramatically and by age 19, 36% of girls are already mothers as depicted in Figure 48.
Figure 48: Child Bearing among Teenagers by Age
Source: KDHS, 2009.
Teenage pregnancies are slightly higher in urban than in rural areas. 32% of uneducated teenagers have begun child bearing compared to only 10% of those with some secondary education. More teenagers from poor house-holds are likely to begin child bearing earlier than their counterparts from wealthier households. There are also significant regional disparities as shown in Figure 49.
Figure 49: Child Bearing among Teenagers (15-19) by Region
Source: KDHS, 2009

176Youth Research Compendium
Nyanza (27%) and Coast (25.7%) Provinces have the highest numbers of teenagers who have begun giving birth. Central (10.1%), Eastern (13.5%) and Nairobi (13.9%) Provinces have the lowest numbers of teenagers who have begun giving birth.
3 out of 10 girls will be pregnant in their teens in Western province while almost 1 in every 4 adolescents aged 15 to 19 will have begun childbearing in Rift Valley, Nyanza, North Eastern and Coast provinces.
While Kenya’s overall fertility rate seems to be reverting to the decline observed from the mid-1970s to the late 1990s, the 20-24 age group still has the highest Total Fertility Rate (TFR) in the country (KNBS, 2010a), (refer to Table 53).
The effect of teenage pregnancy on the future of the individual, their families and society in general is serious. Early child bearing predisposes young people to several socio-medical and economic challenges. The risk of dying from pregnancy related causes is twice as high for 15-19 year olds as for women over the age of 20 years because their bodies are not yet developed enough to cope with the rigors of child birth. Girls below the age of 15 are five times more likely to die from childbirth (UNICEF, 2009). Teenage pregnancy has other negative implications for both mother and baby. Children born to very young mothers are prone to higher risks of morbidity and mortality. Early childbearing also exposes young people to a long childbearing period which often contributes to large family sizes with relatively poorer quality of life.
Again, young girls who get pregnant while still at school often have to discontinue their education, thereby com-promising their future chances of economic independence. Every year it is estimated that between 10,000 and 13,000 teenage girls drop out of school due to pregnancies, which are mostly unplanned (CSA, 2007). While en-rolment at primary school entry level is almost the same for boys and girls, until girls reach puberty, transition to secondary school is lower for girls than boys. At ages 16 to 20 years, only 35% of girls are still in school compared to almost half of their male counterparts.
Some of the factors contributing to the high fertility among young people include low level of contraceptive use - although DHS data confirms that knowledge of contraceptives is high, use remains low with prevalence lowest for women in the age cohort 15-19 (22.5%) and 20-24 years (35.7%) compared to 54.9% among 30-40 years, and 52.5% among 40-44 years (KNBS, 2010a). The break down in traditional family systems, influence of the mass media, urbanization, lack of access to information and services also exacerbate the high fertility rates.
Abortion and young people’s healthThe other consequence of teenage pregnancy that also has a significant bearing on the health of young people is unsafe abortion. While abortion affects women of all ages within the reproductive age group, adolescents and young women are more affected. According to recent statistics the number of young women experiencing abor-tion complications is out of proportion with their numbers in the total population. Adolescents account for 16% of complications compared to 11% among those over 34 years and abortion related morbidity and mortality is higher among young women (Gebreselassie, et al, 2004). Compared to older women, adolescents are also more likely to have an abortion later in pregnancy and choose an unsafe provider thus placing themselves at greater risk. Young women account for 7 out of 10 women admitted to public health hospitals with abortion-related compli-cations and about 4 out of 10 women who die from unsafe abortion complications are adolescents 15 -19 years.
Sexually Transmitted Infections (STIs) There is a high incidence of sexually transmitted infections among young people. Information about the incident of Sexually Transmitted Infections (STIs) is a useful marker of unprotected sexual intercourse. Until 2003 KDHS, tracking of STI epidemics, was mainly from sero-prevalence testing among pregnant women attending antenatal care clinics. This may be indicative of the higher STD infection rates among women as indicated on Figure 50. Women’s STI infection is about 2.5 times higher that of their male counterparts in all the age cohorts. STI infec-tion has been rising with age, more dramatically for women than men between the age of 15 and 39. After that age, infection rates begin to drop.

177Institute of Economic Affairs
Figure 50: Self Reported Prevalence of Sexually-Transmitted Infections (STI’s) and STI Symptoms by Age and Gender
Source: KDHS, 2009
STIs include, but are not limited to Herpes Simplex Virus (HSV-2) which is a leading cause of genital ulcer disease around the world. Infection is life-long (infected people have it for the rest of their lives because there is no cure), but symptoms can be controlled with drugs. According to NASCOP (2007), about 7 million people in Kenya are infected with HSV-2. Generally, prevalence is highest among widowed women and polygamous men. The preva-lence is highest in Nyanza then Coast and Western provinces for both men and women. It is higher in urban areas for both men and women and among people with more than 10 lifetime sexual partners (see Figure 52 for data on multiple sexual partners by age). HSV-2 is also high among uncircumcised men. Syphilis is another cause of genital ulcer disease around the world. Syphilis is easily curable and it is estimated that 356,000 people are infected nationwide. Generally, prevalence is highest among widowed men and women as well as polygamous men. In Eastern and Nyanza Provinces for both men and women; in lowest wealth quintile for women and in the middle wealth quintile for men; among people with more than 4 lifetime sexual partners; and among uncircumcised men.
HIV and AIDS and implications for the health of young people
Figure 51: HIV Prevalence by Region
Source: Kenya AIDS Indicator Survey [KAIS], 2007

178Youth Research Compendium
The youth are at the axis of the HIV and AIDS crisis in Kenya. Over 50% of those infected with HIV and AIDS are young people. According to the 2007 KAIS (NASCOP, 2009), prevalence among young people is 12% compared to 7.4% of the general population. Figure 51 shows HIV prevalence by region.
Among 15-19 year olds, urban prevalence was higher than rural prevalence, while among 20-24 age cohorts, rural prevalence was higher than the urban prevalence.
There are wide gender disparities in HIV infections with young women aged 15-24 years being up to 5 times more likely to be infected than their male counterparts. Trends show increasing prevalence among 15-19 year olds even as declines are recorded among the 20-24 age-group.
According to both KDHS and the KAIS, in 2003 prevalence among 15-19 increased from 0.4 to 1 percent among men in 2007 and from 3 to 3.5 percent among young women. Among the 20-24 year olds, prevalence declined from 2.4 to 1.9 among men and from 9 to 7.4 women respectively as indicated on Table 55.
Table 55: Trends on HIV Prevalence among women and men between 2003 and 2007 by age
Age Group Male Female Year year
2003 2007 2003 200715-19 0.4 1 3 3.520-24 2.4 1.9 9 7.425-29 7.3 7.3 12.9 10.230-34 6.6 8.9 11.7 13.335-39 8.4 9.3 11.8 11.240-44 8.8 10.2 9.5 10.245-49 5.2 5.6 3.9 8.850-54 5.7 8.3 na 8.3
Source: NACSOP, 2009
HIV prevalence is consistently high among young men who are uncircumcised. According to NASCOP (2008), HIV prevalence was approximately five (5) times greater than among circumcised men.
Several factors are responsible for the rapid spread of HIV among young people in Kenya. The lack of adequate information, risk taking behavior and religious and cultural practices that hinder the public discussion of sexuality, as well as the practices that promote chauvinistic male practices are contributing factors.
Risk taking fuelling the spread of HIV among young people: According to the latest KDHS, although the levels of high risk sexual behaviour have universally dropped considerably from the 2003 levels, young people aged 15-24 years are still the most likely to engage in such behaviour compared to other age cohorts (See Figure 52 below). The consequences of such behaviour are serious life threatening risks including high prevalence of sexually trans-mitted and reproductive tract infections among young people. A repeated episode of pelvic inflammatory disease in women increases the risk of infertility and cervical cancer, a factor which may partly explain the upsurge in certain types of cancer among young women in Kenya.

179Institute of Economic Affairs
Women and Men aged 15-64 years who reported one or more non-married or non-cohabiting sexual partenerships in the year before the survey by five-year age group, Kenya 2007.
40.3
21.3
13.19.8 11.4
8.15 6 5.7
2
14.1
91.4
71.7
34.8
20.314.3
10.6 11.17.9
5.2 5.8
28
0
20
40
60
80
100
15-19 20-24 25-29 30-34 35-39 40-44 45-49 50-54 55-59 60-64 total
Age Group (years)
Any
Non-
Mar
ried/
Non-
coha
biting
Sex
ual
Partn
ersh
ips (%
)women men
Figure 52: Multiple Sexual partners among men and women
Source: NASCOP, 2008.
• Lack of adequate information: Most youth have heard of HIV and AIDS but there is a greater need for en-hanced behavioral change interventions. Recent studies clearly show evidence of behaviour change among all age groups, but at the same time, continued risk taking especially high risk sexual encounters among young people points to the need to accelerate efforts in this area.
• Limited access to services: In recent years there has been an increase in programmes involved in provision of prevention and life skills education to young people. These programmes have had the effect of creating demand for HIV-related services which are often severely lacking. The link to services is often weak and few organizations have established linkages and networks for service provision.
• Health seeking behaviour of youth: Additionally, few young people seek HIV counseling and testing due to limited services designed specifically for youth, particularly in rural areas. Stigma which is still associated with the virus despite tremendous progress over the years also plays a role in hindering access to services. A vast majority of Kenyan youth do not believe themselves to be at risk of contracting HIV (almost 8 out of 10) and believe that pregnancy is a far greater risk than HIV. Even those who have information about HIV and AIDS do not protect themselves because of lack of adequate decision making skills, social support or the inability to adopt safe sexual behaviour. Also related to access of services is the fact that adolescents delay in seeking medical care. Every year one out of 20 adolescents contracts an STI, some of which can cause lifelong health problems if left untreated yet most will either seek care very late or not at all. The decision to seek care or not is also influenced by a variety of other factors including poverty and destitution.
Impact of HIV on Young PeopleHIV and AIDS has had both direct and indirect impact on the lives of young people. Apart from increasing or-phan-hood, HIV also increases vulnerability of young people and puts them at risk of exploitation. The disruption of family cohesion and the trauma associated with HIV and AIDS is a serious threat to the mental health of young
people. Young people are often forced to take up adult roles and responsibilities and have to fend for siblings when parents or guardians fall ill or die. This is in addition to the high burden on young people working as caregivers to family members as a result of the high disease burden resulting from
HIV and AIDS. It is estimated that about 13% of youth are caregivers to sick parents or family members, severely compromising their ability to make smooth transition to adulthood.
Adolescents delay in seeking medical care. Every year one out of 20 adolescents contracts an STI, some of which can cause lifelong health problems if left untreated yet most will either seek care very late or not at all

180Youth Research Compendium
The socio-economic implications are even more significant as large numbers of HIV infected youth puts a strain on the health sector, and the economy overall. The agricultural sector in certain parts of the country is already experiencing challenges related to the high disease burden associated with HIV and AIDS. HIV and AIDS related challenges are a cause for school drop-out in Kenya. Young people leave school either to take care of sick parents and family members or to take up roles when their parents die. According to the Ministry of Education, by 2020 an estimated 11.8% of all young people below 15 years of age will be orphaned mainly due to AIDS (MOE, 2009).
Additionally, there are young people who are born HIV positive. A combination of fear and unwarranted shame prevents mothers from disclosing to their children their HIV status. The youth are subsequently ill-equipped to understand the impact of their status which may cause failure to adhere to medication with the attendant detri-ment to their health. They may also engage in risky sexual behavior which could affect those that they engage in sexual activity with.
There has been a rapid scale up of activities in various areas such as Voluntary Counseling and Testing (VCT), Prevention of Mother to Child Transmission (PMTCT), and access to treatment. With support of the President’s Emergency Plan for AIDS Relief (PEPFAR) and the Global Fund to fight AIDS, TB and Malaria (GFATM), there has been a steady increase in the number of people on HIV treatment throughout the country. Table 56 shows some key indicators in RH and HIV.
Table 56: Some Key Indicators in RH and HIV
Indicator Rate
Contraceptive Prevalence Rate 46HIV Prevalence (Adult population) 7.1HIV Prevalence among men 15-24 1.4% of HIV Prevalence among women 15-24 5.6ANC attendance at least one visit (mothers below 20 years) 93 %ANC Attendance at least one visit women 15-49 91.5Delivery in a health facility –women below 20 years 46.6Knowledge of contraception among men aged between 15 – 49 years 95Knowledge of contraception among women aged between 15 – 49 years 97Delivery in health facility women 20-34years 42.7Delivery with skilled attendance below 20 years 47.7Delivery with skilled attendance 20-34 43.9Teenage Pregnancy Rate 21 %% of women and girls who have undergone FGM 32 % of women who have ever experienced physical and sexual violence in the year preceding the latest KDHS
39
Source: KNBS, 2010a; NASCOP, 2008
The Twin challenge of HIV and AIDS and TB among young peopleClosely related to HIV and AIDS is tuberculosis whose impact on young people is increasingly being felt in Kenya. The resurgence of Tuberculosis (TB) has had a devastating impact on the fight against HIV and AIDS in Kenya. Statistics from the Ministry of Health showed that 116,000 new TB cases are diagnosed annually. TB and HIV and AIDS have been known to be intimately linked, fuelling each oth-er and making integrated management mandatory. TB is the lead-ing cause of death among People Living with HIV (PLHIV), and HIV is the greatest driver behind the nearly three-fold rise in Ke-nya’s TB burden over the last ten years. About half of the 1.2 million HIV-positive people in Kenya also have TB. In 2007, there were 117,000 cases of TB in Kenya and the disease killed about 74,000 people (NASCOP, 2009).
The World Health Organization notes that Tuberculosis is increasingly occurring in younger, economically productive mem-bers of society, especially girls and women, closely resembling the trend in HIV preva-lence

181Institute of Economic Affairs
Kenya’s national TB burden remains high. According to the Division of Leprosy, Tuberculosis and Lung Disease (DLTLD), the National AIDS and STI Control Programme (NASCOP), TB case notification rose six-fold from 53/100,000 persons in 1990 to 338/100,000 in 2007. The number of TB patients is projected to increase from 120,000 recorded in 2009 and to 130,000 in 2010.
Detection and treatment of TB has been strengthened for all age groups. Kenya has 1,909 TB treatment sites; 930 (49%) provide TB diagnostic services. In 2007, Kenya achieved a TB case detection rate of 70%, and a treatment success rate of 85%. The national HIV prevalence among TB patients in 2007 was 48%, but exceeded 80% in some settings.
There has been a rapid scale up in the number of health facilities offering TB services. TB and HIV services are delivered to patients in Kenyan public and mission hospitals free of charge. Between 2005 and 2008, there was a massive scale up of facilities offering TB treatment which increased from 1,600 to 1,909, and those offering TB diagnosis from 619 to 930. More than 80% of TB patients receive HIV testing, and 80-90% of co-infected pa-tients are put on treatment.
Non-Communicable Diseases (NCDs) and Young PeopleAccording to the Ministry of Health, non-communicable diseases (NCDs) are the leading cause of outpatient and in-patient morbidity in Kenya today. Some of the non-communicable diseases common in Kenya include: can-cers; chronic obstructive airway diseases (Chronic bronchitis, Emphysema, and Asthma); neurological disorders (Epilepsy Neuropathies – sensory, motor or autonomic); endocrine disorders (Hyperthyroidism, Hypothyroidism and Cushings syndrome); musculoskeletal disorders (Rheumatoid arthritis, Osteoarthritis and Osteoporosis); and injuries including (Road traffic injuries, Interpersonal and self directed injuries (violence) and occupational injuries including sporting injuries).
CancersThe emergence of cancer among the youth is increasingly becoming a serious medical challenge in the country. According to latest trends recorded at the Kenyatta National Hospital, cancer cases among young people form a significant proportion of the 3,000 to 4,000 new cancer cases reported to the hospital every year. The hospital proposes multi-sectoral awareness campaigns in varying age groups to reduce the prevailing cancer situation to enable early diagnosis. Unfortunately it is difficult to understand the magnitude of cancer among young people due to poor data collection. One type of cancer which is showing increasing trends among HIV positive women is cancer of the cervix. The World Health Organization (WHO) estimates that about 2,635 Kenyan women are diagnosed with cervical cancer every year and about 2,111 die from the disease. It is the most prevalent cancer among women in the country. Cervical cancer is mainly caused by a sexually transmitted virus the Human Papil-loma Virus (HPV). HPV is a common sexually transmitted infection (STI) that can cause genital warts, while some types of HPV can also cause cervical cancer. About 40 percent of women in the general population are estimated to carry cervical Human Papilloma Virus (HPV) infection - a leading cause of cervical cancer - at any given time.
Factors such as co-infection with HIV contribute to cervical HPV infection progressing to cancer. HIV weakens the immune system and makes HIV-positive women very susceptible to persistent Human Papilloma Virus that devel-ops into cancer of the cervix. It also takes a shorter time for HPV to develop into full blown cancer of the cervix among women infected with HIV. Given the high HIV prevalence among young women in Kenya, HIV prevention programmes must be deliberately designed to take into account the relationship between HIV and cervical cancer.
Studies have shown that HPV is higher among women who have multiple sexual partners and unprotected sex (see Figure 52). In Kenya sexual activity begins early and is often unprotected. A study by Centre for the Study of Adolescence, found that 4 in 10 Kenyan girls had sex before the age of 19, many of them as early as 12. DHS data also shows early sexual debut with regional variations (CSA, 2009; KNBS, 2010a).
Many people especially in rural areas do not know about cervical cancer, hence extensive education and awareness campaigns about the disease are important for prevention as well as for promoting early detection and treatment. Medical professionals strongly recommend that all women over the age of 21 be screened for cervical cancer at

182Youth Research Compendium
least once every 6 months. Pap smear tests - which check for changes in the cells of the cervix - are available at most district health facilities in Kenya, but according to the World Health Organization, less than 6 percent of women access them. Government needs to invest in making the HPV vaccine - which protects against four major types of HPV, including two types that are responsible for 70 percent of cervical cancers - widely available in public hospitals.
Malaria Malaria is the leading cause of morbidity and mortality in Kenya. An estimated 25 million out of a population of 40 million Kenyans are at risk of malaria. It accounts for 30-50% of all out-patient attendance and 20% of all admissions in health facilities. An estimated 170 million working days are lost to the disease each year. Malaria is also estimated to cause 20% of all deaths in children under five although there has been a declining trend in recent years (KNBS, 2010a). The most vulnerable group to malaria infections are pregnant women and children under 5 years of age.
Malaria is often associated with young children and pregnant women, but adolescents and youth in malaria en-demic areas are also affected. Significant efforts have been made to check the malaria epidemic in the country, but the problem is yet to be contained.
Figure 53: Malaria prevalence by region
Source: KDHS, 2008/09
The 2008/09 KDHS report indicates that considerable numbers of Kenyan households (61%) owned Insecticide Treated Nets (ITNs) (KNBS, 2010a). A 2003/04 study conducted by UNICEF also showed that most young people did not sleep under nets to protect themselves from malaria. The net is also largely associated with pregnant women and young children and not with youth or men especially in the way they are marketed. Malaria and mal-nutrition have been known to depress the immune system to a point where it increases the likelihood of infection from sexual intercourse significantly. Thus, continued malaria control is a key element for the youth.
Mental Health According to the World Health Organization, mental health is generally a neglected area in Kenya yet the country has poor mental health indicators showing 7% male and 10% females have attempted suicide while 7% females have self-reported depression (WHO, 2001). Globally, three times more women than men report attempting sui-cide, but men are more likely to succeed (CSA & UNICEF, 2005). In Sub-Saharan Africa men are almost five times

183Institute of Economic Affairs
more likely to die from suicide than women. While there are no national figures on suicide rates for young people in Kenya, global figures from WHO indicate a worldwide suicide rate of 19.2 per 100,000 among 15 to 24 year old males and 5.6 per 100,000 among females in the same age group. A 2004/05 study conducted in Kenya by the Centre for the Study of Adolescence and UNICEF showed that about 10.2 percent of young males and 6.9 percent of young females report being depressed nearly all the time to the point of giving up (CSA/UNICEF, 2004). These rates of depression especially for males are significantly high.
Despite this, the country invests limited resources for mental health promotion. Estimates by the WHO made at the beginning of the decade estimated that less than 1 percent of all health care spending in Kenya is devoted to mental health and there are only 0.2 psychiatrists and 0.01 psychologists per 100,000 people (WHO, 2001).
It is therefore not surprising that the mental health of young people continues to receive little attention. Yet available information on their mental health shows high levels of both depression and thoughts of and attempts at suicide. Some of the most common worries and con-cerns cited by young Kenyans in a 2004/05 CSA survey
included fear of contracting AIDS, getting pregnant, being sexually or physically abused, and fear of losing parents to AIDS.
The impact of a safe and supportive environment and its contribution to sound mental health is often ignored by many young people and society in general. Changes taking place during the transition to adulthood can have ma-jor implications on the health status of youth. There are physiological and psychological changes occurring during this period that have significant bearing on the health status of youth both now and in the future. The transition from school or college into the job market usually ushers a period of uncertainty especially in difficult economic times. According to the Kenya National Bureau of Statistics (KNBS, 2009), about 67 percent of unemployed are young people between the ages of 16-30, of which over 90% have no skills or vocational training (Refer to the employment paper for more details). The mental health implications are serious as stress is likely to set in when youth are unable to secure employment to support both themselves and their families.
Most of those leaving rural areas to look for economic prospects in urban areas often end up in crowded informal urban settlements lacking the most basic services such as water and sanitation. Conditions in the informal urban settlements require both psychosocial and logistical competence on the part of the youth who either end up living in these places or drift between rural areas and new peri-urban areas. Coping with life in some of these urban en-vironments can have severe strain on many young people living away from home for the first time and can result in serious psychological problems.
Media has both direct and indirect impact on the health of youth. Media can be a powerful tool in relaying mes-sages and information that promote healthy lifestyles. There is evidence that a significant proportion of young people rely on electronic media such as television and radio for information on health (KNBS, 2010). Exposure to media images of unobtainable consumer lifestyles that contrasts sharply with real living conditions contribute to higher levels of anxiety, compulsive behavior and consequent deterioration in mental and physical health of people generally and youth in particular.
Economic deprivation and poverty often impact negatively on young people’s mental health. Young people living in poverty are more likely than others to be depressed. According to a UNICEF and CSA survey conducted in 2003/04 young people with inadequate access to food at home are six to nine times more likely to report being depressed to the point of giving up nearly all the time (CSA &UNICEF, 2004). Depression in young people often leads to other mental disorders, such as anxiety, disruptive behaviour, or substance abuse and can also contribute to physical illnesses, such as diabetes. In addition, depres-sion in children and adolescents is associated with an in-creased risk of suicidal behaviour. Apart from widespread depression, young people in Kenya have an alarmingly high rate of attempted suicides.
Less than 1 percent of all health care spending in Ke-nya is devoted to mental health and there are only 0.2 psychiatrists and 0.01 psychologists per 100,000 people
Economic deprivation and poverty often impact negatively on young people’s mental health. Young people living in poverty are more likely than others to be depressed.

184Youth Research Compendium
Anecdotal evidence from media reports indicate that the consequences of poor mental health are contributing to the rise in alcohol and drug abuse, interpersonal violence and self harm including self inflicted violence and suicide. There is a clear dearth of research in this area making it difficult for a clear assessment of the linkages. Currently the ability of the health sector to absorb youth who suffer from increased stress and frustration or clinical depres-sion is limited.
There is significant evidence to show that mental health promotion can contribute to a reduction in personal, social and economic costs that arise from poor mental health. Mental health promotion strategies can reduce de-pression and suicide rates as well as behavioral problems. Yet in Kenya health promotion has remained relatively under-funded with more emphasis being placed on curative services. Although trends indicate that this is shifting, the health budget is still heavily skewed in favour of curative health, and health promotion financing is still rela-tively small. There is also limited research on the cost of mental health in Kenya.
Life Style Related Health Conditions Globalization and urbanization are drivers in nutritional health of populations worldwide. Although urbanization and affluence can bring about positive improvements in young people’s diets, it also brings a number of unhealthy diet changes such as increased consumption of excessive amounts of saturated fats, sugars, salt and processed foods (Njung’e, 2009). This, combined with more sedentary lifestyles, is causing dramatic increases in the preva-lence of overweight or obese youth and risk factors for a number of chronic diseases such as Type II Diabetes, cardiovascular diseases and certain forms of cancer. These medical conditions which were previously associated with older people are fairly common among the youth due mainly to changing lifestyles.
As Kenya becomes more prosperous and urbanized, acquiring some of the benefits of industrialized countries such as reduction in mortality and morbidity from infectious diseases, a new trend is emerging, of increased prevalence of chronic non-communicable diseases and associated risks. Chronic diseases associated with obesity and over-weight are rising faster than in the developed world (Onywera, Adamo, Sheel et al., 2011). Growing affluence and rapid urbanization have been associated with a nutrition-physical activity transition defined by a shift in dietary practices from traditional agrarian to one dictated mainly by market forces leading to over-consumption of cheap, energy dense food (Onywera, Adamo, Sheel et al., 2011). Additionally, the shift from high energy activities to more sedentary lifestyles coupled with different modes of transportation is contributing significantly to increasing obesity and overweight among Kenyans (Onywera, Adamo, Sheel et al., 2011).
The First Annual Kenya Diabetes Summit held in 2008, reported that the prevalence of diabetes lies between 6 and 10%, with young people accounting for 15% of all sufferers, a factor attributed mainly to the adoption of pro-cessed and junk foods and inadequate exercise (Ngirachu, 2008).
A recent study of 9-13 year olds found that children in Kenya, 6.8% of boys and 16.7% of girls in urban school settings were overweight or obese (Onywera, Adamo, Sheel et al., 2011). According to the study, boys and girls in rural areas are less obese due to their active nature and engage-ment in regular energy consuming activities, compared to their urban counterparts who spend most of their time in-
doors watching television. Subsequently, urban children were being exposed to a more obesogenic lifestyle due to their “sit and reach values” among other factors (Onywera, Adamo, Sheel et al., 2011:3-4).
Under Nutrition The reverse burden of under-nutrition is characteristic in Kenya due to food insecurity in the country. A recent study revealed that lack of food in certain parts of the country is causing young girls to engage in transactional sex for food. A 2009 study of 1,495 pre-school children between the ages of 3 and 5 years in Kenya, found that 30% of the children were stunted, approximately 16% were underweight, 4% were wasted, approximately 18% were overweight and 4% were obese while 8% showed signs of both obesity and stunting (Gewa, 2009). The study confirms the presence of both under- and over-nutrition among Kenyan pre-school children and highlights the need
The prevalence of diabetes is estimated at be-tween 6 and 10 percent. Young people now ac-count for almost 15 percent of people with dia-betes in Kenya. The burden of diabetes on youth includes pain, anxiety and reduced quality of life

185Institute of Economic Affairs
to shift focus on expanding efforts to prevent and treat malnutrition within this population while at the same time, promote healthy lifestyles and eating habits from an early age.
Under nutrition can have serious direct health effects on youth. Under-nutrition can lead to stunting which has severe consequences for child survival and future development of young people. Another dimension to under-nu-trition occurs with micronutrient deficiencies. This is a very common phenomenon in famine prone areas of the country where food aid distributed to alleviate hunger usually consists of maize or other starch rich foods. This has particularly severe consequences for young mothers during the pre-conception period as they are likely to de-liver babies with defects or children who are likely to suffer wasting and stunting.
Under-nutrition in the youth increases the likelihood of contracting diarrhoea, malarial and respiratory infections. Additionally, there is rapid physical growth during adolescence. Nutrition at this time is especially important. For example, the iron needs of adolescents are increased by growth, development and menstruation, but are hampered by malaria, hookworm and schistosomiasis (bilharzia), which affect young people disproportionately (UNICEF, 2007). This is even more so in the case of girls who become pregnant while still adolescents. The lack of adequate
nutrition and micronutrients has a great impact on the develop-ment of young people during this period. Younger adolescents who do not have access to adequate food are more likely to be stunted than older ones and contrary to expectations. Boys are almost twice as undernourished as girls.
Drug and Substance AbuseThe use of alcohol and other drugs has increased in Kenya over the past decade. Statistics from the National Agency for the Campaign Against Drug Abuse (NACADA) reveal an upward trend in drug and alcohol abuse among young people in Kenya. A 2009 survey showed that 70% of youth out-of-school and 28% of youth in school abuse alcohol in Kenya.
Figure 54: Proportion of Kenyan Adolescents and Youth Reporting Regular Use of Drugs
Source: Population Communication Africa, (2001).
Figure 54 indicates that regular drug use increases with age and is highest among the 23-24 year olds. Use of hard drugs such as cocaine, heroin and mandrax has increased in the country (NACADA, 2009).
A similar survey conducted in 2002, revealed that more than 22% of primary school children and 68% of univer-sity students had taken alcohol. A 2004/05 study conducted by UNICEF and CSA also revealed that an increasing proportion of young people were taking alcohol (CSA &UNICEF, 2005). Ministry of Health statistics indicate that those most likely to use drugs were poor, unemployed, and likely to still be in school or college. Young people from unstable family situations including affluent families where parents and guardians are largely absent and compensate for their absence with excessive monetary “affection” were also affected.
Under-nutrition can lead to stunting which has severe consequences for child survival and future development of young people

186Youth Research Compendium
While drug and alcohol abuse is common among both sexes, young men are more likely than their female counter-parts to use drugs. There is a gender dimension to this phenomenon, societal expectations, division of labour and nature of upbringing thus predisposing male youth to engage more in drug abuse. A Nairobi Urban Slum Survey revealed that adolescent males are 20 times more likely to use drugs and 5 more times likely to consume alcohol than girls. Also being out of school increases this risk especially if the person is not involved in gainful activities (Otieno and K’Oliech, 2003).
The most commonly abused substances are alcohol (inclusive of local brews), khat (miraa), cannabis, glue, heroin and other injectables and oral drugs. Evidence suggests a close relationship between substance abuse, violence and risky sexual behaviour, consequences of which include unplanned pregnancies, STIs, HIV and violence among others.
The few rehabilitation programmes and counseling centers that are available to youth in the country tend to be urban based. The reach of such institutions is mainly limited to small numbers of urban based youth. There is also limited integration of RH and HIV and AIDS interventions. For RH and HIV and AIDS programmes to succeed, greater emphasis must be placed on reducing drug and alcohol abuse as the two are intrinsically linked. There is clearly, an urgent need for a dual approach that focuses on prevention but at the same time invests in treatment and rehabilitation. Currently there is little investment from government in tackling this problem despite the fact that in certain parts of the country such as Coast and Central provinces, the situation is critical.
Clever advertising and marketing in the media and sponsorship of various sporting and other events further exerts influence on the behaviour and health of the youth. Young people do not perceive themselves as being at high risk of the entirely avoidable burdens of morbidity, mortality and disability associated with the use of these substances.
Sexual and Gender Based ViolenceGender Based Violence takes various forms and can range from physical assault and the infliction of psychologi-cal trauma and physical pain through practices such as female circumcision. Although the Childrens Acts (2001) outlaws all forms of abuse and exploitation, incidences of female genital cutting, child marriages and sexual abuse among minors remain high in most parts of the country.
According to the KDHS-2009, 39% of women aged 15-49 years have been physically or sexually abused. There are significant regional differences with Nyanza and Western being the provinces with the highest SGBV rates in the country (KNBS, 2010a). There is also evidence that between 40-60% of violence victims are aged below 16 years. Although both boys and girls experience violence, girls are up to three times more likely to experience vio-lence than boys.
Women in Nyanza province are most likely to experience physical violence (57%), followed by those in Western (45%), Rift Valley (36%), Central (34%), Eastern (33%), Coast (32%), North Eastern (32%) and Nairobi has the lowest (29%) (KNBS, 2010a). Increased sexual violence against women and girls, including rape, is fuelling the spread of HIV AND AIDS among females in Kenya. For victims of rape, anti-HIV treatment, as a “post-exposure prophylaxis,” is available in only 73 district hospitals and in only one of the eight provincial hospitals.
Major Drivers of Youth Health in KenyaThe health of young people is driven by several factors which can be categorized as health and non-health related factors and can be biological or non-biological. These can further be broken down as follows: individual and soci-etal factors; institutional and structural factors; policy and legal factors; economic and gender dimensions.
For RH and HIV and AIDS programmes to succeed, greater emphasis must be
placed on reducing drug and alco-hol abuse as the two are intrinsically
linked

187Institute of Economic Affairs
Individual and Societal FactorsRisk taking and high risk behaviour: Risk taking behaviour among young people is having a considerable impact on health especially on HIV AND AIDS and related conditions. Recent DHS data shows decline in risk taking related to sexual behaviour among all age groups except the youth resulting in serious life threatening situations including high prevalence of sexually transmitted and reproductive tract infections among young people. Although recent data indicates a drop in risk taking behaviour among young people, this age group is still the one most likely to engage in risk taking behavior
Though the use of condoms for prevention has slightly increased particularly among men, it is still the lowest among young people. Stigma associated with the purchase of condoms is a big hurdle. Majority of the youth aged 15-35 years give religion and fear of publicly purchasing the condom as major reasons for engaging in unprotected sex.
Retrogressive cultural and traditional practices which have persisted in Kenya have also had a negative impact on young people especially girls. Such practices include early marriage and female genital cutting (FGC). Despite the existence of legislation prohibiting FGC and early marriage, these harmful cultural practices continue to have a negative impact on the lives and health of girls in Kenya. Although the prevalence of FGC has shown declining trends, almost 32% of Kenyan women have undergone circumcision. According to data from the (KNBS, 1998, 2003, 2008/09) in some parts of the country such as Kisii , Kuria, Meru and among the Somali community, FGC is almost universal with over 90% of girls having undergone FGM. A 2007 study conducted by the Centre for the Study of Adolescence among in-school adolescents in Nyanza Province showed that girls who had undergone cir-cumcision were more likely to have had sex than their uncircumcised counterparts (CSA, 2007). This predisposes girls to the risk of early pregnancy. Circumcision also puts pressure on girls to leave school and get married. FGC is a form of gender-based violence. Whatever age at which FGC occurs, psychosocial and bio-medical consequences and complications are often manifest during late adolescence in the forms of diminished self-esteem, depression, anxiety, urinary tract infections, difficult child labour, infertility and vaginal fistulae.
Early and forced marriage: In Kenya more than half of the female population is married by their 20th birthday. Although the age at first marriage has shown increasing trends, early marriage is still common among certain com-
munities in Kenya and is widely practiced in Northern Eastern, Rift Val-ley, Nyanza and Coast Provinces where girls as young as 12 years are already married, often to much older partners. Girls who marry early usually begin child bearing early, often before their bodies are physically well developed putting them at greater risk of maternal mortality.
Policy, Legal and Institutional FactorsMismatch between government policies and resource allocation: Despite the existence of various policies outlining the government’s commitment to meeting the health care needs of its people, there is a serious mismatch between policy pronouncements and financial allocations to the health sector. The Adolescent Reproductive Health and Development Policy is yet to be fully implemented as the government has not yet made any financial commitment for the same despite the existence of an implementation plan. The government relies too much on development partners allocating little or no resources in reproductive health.
Institutional and structural problems in the health sector: The health sector is critically understaffed with staffing levels substantially below international minimum standards and MOH expected norms. There are also regional disparities in distribution of staff. 6 out of 10 employees of the ministry of health are working in urban areas giv-ing an urban/rural ratio of 59/30. This affects young people’s access as well especially if they live in rural areas. If the nearest health facility cannot meet their needs they are often reluctant to travel further unless they are critically ill. The 2008-09 Demographic and Health Survey shows that 44.8% of young women aged below 20 years who delivered at home cited distance to health facility as the main reason (see figure 55).
Girls who had undergone circum-cision were more likely to have had sex than their uncircumcised counterparts

188Youth Research Compendium
Reason For not Delivering in Health Facility for girls 15-19 years
05
101520253035404550
Cost too
much
Facility
not o
pen
Too fa
r/ no tra
nsport
Poor quality
servi
ce
No female provid
er
Husband
/family
did not a
llow
Not nece
ssary
Not custo
mary
Abrupt Delive
ry
Reason
Perc
enta
ge
Figure 55: Reasons for Home Delivery among 15-19 year olds
Source: KNBS, 2010.
Inadequate access to Health Care services: Where young adults live in Kenya is a major determinant of their access to health facilities and services. Youth who live in rural areas experience less exposure to RH and associated infor-
mation and have fewer educational opportunities and skill build-ing interventions available to them. They also tend to live under stricter social, cultural and gender norms that may negatively impact their sexual knowledge and awareness. In rural areas RH and HIV and AIDS services are typically limited in capacity which restricts youth’s ability to access them. Other barriers in-clude long traveling distances to health facilities, poor infra-
structure, service fees and concerns about privacy especially within small tight-knit communities. Conversely, however, living in a rural area can offer some protection to a young person in the form of greater community cohe-sion and reduced likelihood of family disintegration which can help safeguard against early sex and stress.
Youth Friendly Services (YFS) are largely lacking in public health facilities in Kenya. Only 12% of health facilities in the country provide such services. These are not evenly distributed, they are far apart and almost all of them are located in urban centers. In the provinces, the availability of these services is grossly limited. Most facilities offer-ing Youth Friendly Services lack adequate capacity to offer comprehensive range of services. One of the key ob-stacles in the implementation of the previous National AIDS Strategic Plan (NASP) was inadequate youth friendly support services. Kenya’s high population has put pressure on delivery of services in the country as witnessed in the low access rates to health services and lack of adequate health professionals.
Economic FactorsHigh levels of Poverty: An estimated 46% of the Kenyan population lives below the poverty line. Kenya’s econom-ic growth has not been sufficient to create productive employment opportunities to absorb the increasing labour force of about 500,000 young people into the labour market annually. Only about a quarter of young people are absorbed into the work force every year leaving a large proportion without a means to support themselves. The inability to meet basic needs such as food and proper shelter has a direct bearing on the physical and mental health of young people.
Poverty is a major risk factor for unhealthy sexual behaviour among Kenya’s youth. Limited access to economic and educational opportunities increases the risk of early and unprotected sexual activity and encourages cross-generational and commercial sex. It also amplifies other risky behaviour such as alcohol and drug abuse and leads
Youth who live in rural areas experience less exposure to RH and associated infor-mation and have fewer educational op-portunities and skill building interventions available to them.

189Institute of Economic Affairs
to crime and violence. At the same time, poverty can be a consequence of risky sexual behaviour – for instance when an adolescent girl gets pregnant and drops out of school this can perpetuate poor health and educational outcomes.
Poverty and material deprivation have remained key factors especially in influencing the choices and the circum-stances of young girls. Girls are sometimes forced into activities that expose them to sexual exploitation and survival sex in exchange for money and other basic items. In such situations, the young girls are not in a position to negotiate safe sex and are often at risk of pregnancy and STIs including HIV. Several studies have shown that young women exchange sex for money or gifts. A 2009 study conducted by the Centre for the Study of Adoles-cence in over 100 secondary schools showed high levels of unprotected sexual activity among young people as well as involvement in transactional sex was to meet basic needs such as food and clothes.
Cost and affordability of services: The introduction of cost sharing in public health facilities deters many young people from receiving healthcare services especially among those from poor families. Many of them can neither afford the cost of treatment nor the drugs prescribed.
Widening disparities and inequalities in access to health care: There is also evidence of widening gaps and dispari-ties in access to health care. In many parts of the country especially rural areas, many people do not have access
to basic health care. Among nomadic and pastoralist communities mortality and morbidity from common and preventable illnesses still remain high. Disparities are manifested in distribution of staff as well as facilities. For example 42 percent of doctors and 30% of nurses are in Nairobi and Rift Valley (urban and peri-urban areas) provinces alone.
Statistics indicate that many Kenyans cannot access medical care. It is estimated that about 23% of the sick do not seek medical care, either because they cannot afford it, or cannot access health facilities. About 40% of those who do not seek treatment cite cost as a major barrier. Currently only 30% of rural population has access to health facilities within 4kms, compared to 70% of urban dwellers. In the arid and semi-arid areas, the situation is even worse. For young people who have no income the situation is even worse as most would not be able to seek care. The result often is that even conditions that would have been dealt with early are only treated when the situation is critical, which may sometimes be too late.
Sexual and reproductive health and impact on youth healthHigh Fertility and related consequences: The high levels of fertility among youth forms one of the most important determinants of health in Kenya. High fertility accompanied by low contraceptive prevalence contributes to high rates of early childbearing which in turn predispose women to risks of pregnancy complications. The increase in contraceptive use that is currently being experienced in Kenya could contribute to reduction in fertility rates lead-ing to positive results. Contraceptive use is already showing upward trend. CPR increased considerably from 6.7% in 2003 to 22.5% in 2009. Contraceptive use among sexually active, unmarried young women also increased between 2003 and 2008. But young women’s power in deciding when to use condoms is compromised by gender inequities among other factors.
HIV and AIDS is a major driver of the health of young people in Kenya: HIV and AIDS remains one of the major drivers of youth health in Kenya today. In recent years the HIV prevalence has shown declining trends among certain age groups. Currently prevalence is estimated at about 7%. While recent data indicates that most new infections are occurring among married couples and those in long term relationships, young people continue to
The introduction of cost sharing in public health facilities deters many young people from receiving health-care services especially among those from poor families
Most of the young people who do not use services cite cost as a major reason for home deliveries. 1 in 5 young women aged 15-19 who delivered at home did so because they could not afford to pay the fees despite the fact that public health facilities charge relatively low fees (KNBS, 2010).

190Youth Research Compendium
bear the brunt of the epidemic with a significant proportion of new infections still occurring among this segment of the population. There are major variations based on gender with more women likely to be infected with HIV than men. Young women ages 15-24 are up to five times more likely to be infected with HIV than their male counterparts of the same age group. This has serious implications for social capital formation and subsequently socio-economic and political development.
Falling HIV prevalence is likely to contribute to improvements in health outcomes for young people and reduce mortality and morbidity. According to a recent UNAIDS report (UNAIDS, 2010) the number of young people infected with HIV in Africa fell by up to 25 percent in 16 of the 25 countries hardest hit by the virus. In Kenya, the infection rate among people aged 15 to 24 fell from about 14 percent in 2000 to 5.4 percent in urban areas in 2010. This drop is attributed in part to a change in sexual behaviour, reduction in number of sexual partners and increased condom use as well as improvements in access to HIV related services.
The Great Gender Divide and impact on healthGender is a social construct of how males and females behave and are expected and conditioned to behave under different circumstances. Kenya is a patriarchal society where the status of women is relatively low with gender inequity influencing decisions affecting various aspects of life. Gender has a direct influence on health especially reproductive health at various levels - access to contraception, access to ante-natal care and safe delivery, vulner-ability to HIV infection, stigma and discrimination. The decision to seek care for instance is not often the women’s even though she may be the one at risk of severe ill health or even death. Evidence has shown that women have
little or no control over their reproductive health and of-ten rely on their husbands or partners or even in-laws before a decision is taken even if the delay to seek care can result in death. Two of the major causes of maternal mortality and morbidity are the delay to take a decision and the delay in seeking care.
This reality is often lost on programme planners who fail to understand the gender dynamics that have a major bearing on decision making and health seeking behaviour. For instance, programmes that emphasize abstinence and faithfulness as part of HIV prevention, do not always take into consideration the context within which sexual activity occurs for many Kenyan youth. Sex-role stereotypes prevent women from even knowing they experience discrimination, sexual coercion, exploitation or abuse.
Cross-generational sex is also a problem. Young women engage in relationships with older men with longer sexual histories, often in exchange for money or gifts, quite oblivious of the dangers that such unions pose. Not only are they exposed to risk of infection, but their inability to negotiate for safe sex increases vulnerability to violence as well. There are few programmes dedicated specifically to addressing the issue of cross-generational sex.
Young men face their own set of challenges such as, pressure to be sexually experienced and demands to achieve financial self-reliance. This pressure influences decisions to migrate to urban centers and across international borders in search of employment and in the process exposure to homelessness, substance abuse and risky sexual behavior.
For women division of roles and responsibilities within the home can also be a source of ill health. In many com-munities women work very hard and are often overworked. Not only are they involved in food production, but they are overwhelmingly the care givers. Since women are always caring and providing for others, they often over-look their own health and mostly seek care when they are already very ill.
Programmes need to be developed to meet the needs of young men and to transform the negative gender norms that lead to poor health outcomes for males and females alike. Evidence suggests that the more gender issues are integrated and explicitly addressed within programmes, the greater the likelihood of improved health outcomes for both young men and women.
This drop is attributed in part to a change in sexual behaviour, reduction in number of sexual partners and increased condom use as well as improvements in access to HIV related services.

191Institute of Economic Affairs
Conclusion: What Does the Future Portend?Kenya’s youth population is burgeoning – currently they make up a large proportion of the country’s population. But as they transit to adulthood, they are being confronted with major challenges that not only threaten their health now, but also offer limited guarantees for the future. Young people’s susceptibility to disease and ill-health varies, depending on both biological and non-biological factors with significant variations within and between regions and socio-economic backgrounds across the country.
Recognizing this complex interrelation between biological and non-biological factors is important in the planning and designing of programmes that target young people. In order to make a significant difference in the lives of young people in Kenya, it is necessary to address the underlying and basic causes that hinder comprehensive ac-cess to health care services – both curative and preventive. Irrespective of where the young people live, access to services is crucial if they are to having a positive effect on their health and behaviour. To succeed health policies, strategies, services and programmes that target youth have to be interdisciplinary and must adopt a multi sectoral approach that extends beyond the health sector to include economic empowerment and greater participation in all areas of governance. Such programmes must recognize gender dynamics and the other factors at play in the lives of young people.
To be successful, programmes and interventions must target not only the individual, but take into account the context in which young people live and experience life. For example, while it is important to support young people to acquire skills required to sustain abstinence and promote sexual responsibility, efforts should be made to ensure that parents, community leaders and other duty bearers play their roles effectively in facilitating young people’s transition to a secure and sustainable adulthood. Programmes that support youth to acquire important life skills, by building and maintaining self-esteem are important in giving tools for responsible decision making especially in areas related to sexuality. Young people with high self esteem and good negotiation skills stand a better chance of rebuffing unwanted sexual advances, preventing early and unwanted pregnancy and staying free of Sexually Trans-mitted Infections including HIV.
The youth are a diverse group with wide ranging needs, experiences, and lifestyles. For example, young people in Kenya’s rural areas differ in many aspects from their urban counterparts. They are more likely to experience early child bearing and drop out of school. They also have limited access to services and opportunities for training and employment. Improving access to school, particularly higher education can help bridge these gaps and enable youth from various backgrounds and regions across Kenya acquire self-efficacy, a critical component of health which in itself is a crucial part of social capital formation. Education should be relevant to the needs of young people with clear links created between training institutes and industry. Skills must match the manpower needs of the country and deliberate efforts must be made by both public and private sector to ensure the same. It is clear that policies exist that provide a very good framework for dealing with issues affecting the health of young people. However, it is critical to now implement these policies and enforce existing laws, including the constitution. Cur-rently, a mismatch exists between the priorities outlined by government in key policy documents and allocation of resources for implementation.
There are also opportunities for funding health initiatives for young people and it is important to explore the ex-tent to which devolved funds could be used for this purpose especially to strengthen health promotion and preven-tive activities that involve and benefit young people.
While government investment in social sectors has in-creased with improvement in revenue collection experi-enced in the new millennium years, there is need to raise budgetary allocation to the health sector and specifically to activities that target youth in order to improve access
While it is important to support young people to acquire skills required to sustain abstinence and promote sexual responsibility, efforts should be made to ensure that parents, community leaders and other duty bearers play their roles effectively in facilitating young people’s transition to a secure and sustainable adulthood
Improving access to school, particularly higher education can help bridge these gaps and en-able youth from various backgrounds and regions across Kenya acquire self-efficacy, a critical compo-nent of health

192Youth Research Compendium
to services for this group. It is also important that health programming goes beyond reproductive health and HIV and AIDS where the bulk of the investment in health is currently concentrated. While acknowledging the vulner-ability of young people to HIV infection and the negative contribution of reproductive health and related condi-tions to the health and well being of youth in Kenya, there must also be a broader approach that includes a focus on new and emerging non-communicable lifestyle related medical conditions as well.
Additionally, more emphasis needs to be put on preventive and promotive health to promote healthy life styles among young people and to influence more positive choices and decisions regarding health and general well be-ing. Investment in life skills education that starts early and targets young people before they reach puberty could contribute to significant reductions in teenage pregnancy and related complications.
There is an urgent need to invest in advocacy for programmes that recognize young people’s right to health and fulfill their needs, that recognize gender dynamics and the impact on equitable access to care, that respect and guarantee privacy and confidentiality and that understand the diversity of youth and their needs and ensure that these are taken into account in the design and implementation of programmes.
Youth participation in identifying problems and developing solutions is critical in ensuring that health policies and programmes address their needs adequately. The main focus of any programme targeting young people must be to help them acquire skills that promote decision making that will positively affect their health and their prospects for the future. If society abdicates its responsibility to support the development of young people and fail to equip them with the knowledge and resources they need to make informed choices, then the process of transition to adulthood will be derailed with disastrous consequences for society as a whole.
It is clear that much of what needs to be done is known. Improving the socio-economic and political environment, strengthening policy implementation, increasing investment in health promotion and service delivery are critical if the health status of young people is to be improved.
The optimism, dynamism and energy that characterizes youth should give young people an edge in realizing their potential to contribute to society and participate more effectively in shaping their future and that of Kenya. However, it is critical that steps are taken to promote and safeguard their health as an investment for now and the future.
There is an urgent need to invest in advocacy for programmes that recognize young peo-ple’s right to health and fulfill their needs, that recognize gender dynamics and the impact on equitable access to care

193Institute of Economic Affairs
ReferencesAd Hoc Working Group for Youth and the MDGs. (2005). Youth and the Millennium Development Goals:
Challenges and Opportunities for Implementation. Final Report of the Ad Hoc Working Group for Youth and the MDGs’, April 2005.
Ad Hoc Committee on Health Research Relating to Future Intervention Options. (1996). Investing in health research and development. Geneva: World Health Organization. Retrieved 22 August 2011 from http://www.who.int/tdr/publications/publ ications/investing_report.htm
Blum, R.W., Nelson-Mmari, K. (2004). The Health of Young People in a Global Context. Adolescence Health, 35 (5):402-418.
Central Bureau of Statistics (CBS) [Kenya], Ministry of Finance and Planning. (1970). 1969 Population Census. Vol, 4. Nairobi: CBS
Central Bureau of Statistics [Ministry of Planning and National Development]. (2002). AnalyticalReport on population projections, Kenya 1999 population and housing census. Vol. 7. Nairobi: CBS.
Central Bureau of Statistics [Ministry of Planning and National Development] and UNICEF. (2003). Multiple indicator cluster survey (MICS) Report, 2000. Nairobi: CBS and UNICEF.
Central Bureau of Statistics, Ministry of Health, ORC Macro. (2004). Kenya Demographic and Health Survey 2003. Calverton, Maryland, USA: CBS, MOH, ORC Macro.
Central Bureau of Statistic, Ministry of Health. (2005). Kenya Service Provision Assessment 2004. Nairobi, CBS
Central Bureau of Statistics (CBS). (2006). Revised population projections for Kenya: 2000-2010.Nairobi: CBS.
Central Bureau of Statistics (CBS). (2006) Kenya integrated household budget survey (KIHBS). Nairobi, CBS
Centre for the Study of Adolescence (CSA). (2007). Adolescence in Kenya: The Facts. Nairobi, CSA
Centre for the Study of Adolescence (CSA) and Population Action International (PAI). (2009). Measure of Commitment: Reproductive Risk Index for sub Saharan Africa. Nairobi, CSA
Centre for the Study of Adolescence (CSA). (2009). Knowledge Attitude and Practice: Adolescent Sexual and Reproductive Health in Kenya. Nairobi, CSA
Centre for the Study of Adolescence (CSA) and UNICEF. (2005). The Situation of Children in Kenya: A National Survey. Nairobi, CSA
Chankova, S., Kombe, G. Muchiri, S., Decker, C., Kimani G., and Pielemeier, N. (2006). Rising to the Challenges of Human Resources for Health in Kenya: Developing Empirical Evidence for Policy Making. Bethesda, MD: The Partners for Health Reformplus Project, Abt Associates Inc.
Economic Commission for Africa (ECA). (2009). Africa Youth report 2009: Expanding opportunities for and with Young People in Africa. Addis Ababa, ECA.
Gebreselassie, H. et al. (2004). The Magnitude of Abortion Complications in Kenya. BJOG: An International Journal of Obstetrics and Gynecology, 111, 1-7
Gewa, C.A. (2009). Childhood Overweight and Obesity among Kenyan pre-school children: Association with Maternal and Early Child Nutritional Factors. Public Health Nutr. 2010 Apr; 13(4):496-503. Epub 2009 Nov 5.
Francis, P. and Githagui, N. (2005). Youth in Kenya: Force for Change or Lost Generation? Presentation at the World Bank ESSD Week, Session on “Youth: Assets for Social and Economic Transformation”

194Youth Research Compendium
Glenngård, A.H., and T.M. Maina. (2007). Reversing the trend of weak policy implementation in the Kenyan Health Sector – A Study of Budget Allocation and Spending of Health Resources Versus Set Priorities. Health Res Policy Sys. 5(1):3. Doi: 10.1186/1478-4505-5-3.
Hazen A., Ehiri J.E. (2006). Road Traffic Injuries: Hidden Epidemic in Less Developed Countries. J Natl Med Assoc, 98: 73–82
Health Policy Initiative. (2007, October). Kenya adopts first national reproductive health policy. Retrieved from http://www.healthpolicyinitiative.com
Huchko M.J. et al. (2011). Building Capacity for Cervical Cancer Screening in Outpatient HIV Clinics in the Nyanza Province of Western Kenya. Int J Gynecol Obstet. doi:10.1016/j.ijgo.2011.02.009
Institute of Economic Affairs (IEA). (2006). Citizen’s Report Card. Nairobi: IEA.
IRIN/PlusNews. (2011). Cervical Cancer: Little-Known Killer of HIV-Positive Women
Khayesi, M. & Peden, M. (2005). Road safety in Africa. BMJ 331: 710–711
Kamadi, G. (2010). Prolonged Drought Drives Surge in Forced Marriages. Nairobi: Thompson Reuters Foundation. Retrieved on September 6, 2010 from http://www.alertnet.org/db/an_art/60167/2010/02/8-160037-1.htm
Kenya National Bureau of Statistics (KNBS) and ICF Macro (2010a). Kenya Demographic and Health Survey 2008-09. Calverton, Maryland: KNBS and ICF Macro.
Kenya National Bureau of Statistics (KNBS). (2010b.) Kenya Population and Housing Census, 2009. Nairobi, Ministry of Planning and National Development
PlusNews, Kenya: The Fringe Benefits of Male Circumcision Rollout. Retrieved on January 6, 2010 from http://www.plusnews.org/Report.aspx?Report ID=87640
Kenya National Bureau of Statistics (KNBS). (2007). Kenya Integrated Household Budget Survey (KIHBS) 2005/06. Nairobi: KNBS
Kenya National Bureau of Statistics (KNBS). (2008). Well-Being in Kenya, a socio-economic profile. Nairobi: KNBS
Kenya National Bureau of Statistics (KNBS). (2009). Economic survey 2009, Government Printer,Nairobi: KNBS Mario, J., Azevedo, Gwendolyn S., Prater and Sandra C. Hayes. (2010). ‘Human Immunodeficiency Virus and
Tuberculosis co-infections in Kenya: Environment, Resources and Culture.’ International Journal of Sociology and Anthropology 2(4): 55-65.
Mwabu, Germano, Mwanzia, J. and Liambila, W. (1995). ‘User Charges in Government Health Facilities in Kenya: Effect on Attendance and Revenue.’ Health Policy and Planning 10(2): 164-170
Republic of Kenya. (2010). Budget Estimates for the 2010/2011 Financial Year. Ministry of Finance
Ministry of Health (MOH) [Kenya]. (2001). AIDS in Kenya. Nairobi: MOH.
Ministry of Health. (2005). AIDS in Kenya: Trends, Impact and Challenges. Nairobi: NASCOP, MOH.
Ministry of Health (MOH) [Kenya]. (1996). National Reproductive Health Strategy (1997 -2010). Nairobi: MOH.
Ministry of Health (MOH). (1998). Implementation Plan for the National Reproductive Health Strategy: 1999-2003. MOH
Ministry of Health (MOH). (2001). AIDS in Kenya: Background, Projections, Impact, Implementations, and Policy. 6th Edition. Nairobi: MOH ad NACC.

195Institute of Economic Affairs
Ministry of Health (MOH) [Kenya]. (2004). The Second National Health Sector Strategic Plan: 2005-2010. Nairobi: MOH.
Moses, S., Plummer, F. A., Manji, F. and Bradley, J. E. (1992). ‘The Impact of User fees on Attendance at a Referral Centre for Sexually Transmitted Diseases in Kenya’. The Lancet 340 (8817): 463-466.
Muganda-Onyando, R. and Omondi, M. (2007). Down the Drain: Counting the Cost of Teenage Pregnancy and School Drop-out in Kenya. Nairobi: Centre for the Study of Adolescence (CSA).
NASCOP2004). National Estimates of HIV AND AIDS in Kenya in 2003. Nairobi: NASCOP
National AIDS and STI Control Programme, Ministry of Health, Kenya. (2007). Kenya AIDS Indicator Survey - Preliminary Report. Retrieved from www.aidskenya.orghttp://www.aidskenya. rg/public_site/webroot/cache/article/file/KAIS__Preliminary_Report.pdf.
NACC. (2006). Kenya National AIDS Strategic Plan (KNASP) 2005/06- 2009/10). Nairobi, NACC.
National AIDS/STI Control Programme (NASCOP), Kenya. (2008). 2007 Kenya AIDS Indicator (KAIS) Survey: Final Report. Nairobi, NASCOP.
NASCOP. (2008). National Guidance for Voluntary Male Circumcision in Kenya. Nairobi, Ministry of Health
National Council for Population and Development (NCPD). (1985). Kenya Contraceptive Prevalence Survey (KCPS), 1984. Nairobi, NCPD
National Council for Population and Development (NCPD) [Kenya]. (2000). National PopulationPolicy for Sustainable Development. Sessional Paper No. 1. Nairobi: NCPD.
National Council for Population and Development (NCPD) [Kenya] and Institute for Resource Development/Macro Systems Inc. (IRD). (1989). Kenya Demographic and Health Survey 1989. Columbia, Maryland: NCPD and IRD.
National Council for Population and Development (NCPD) [Kenya], Central Bureau of Statistics (CBS), and Macro International Inc. (MI). (1994). Kenya Demographic and Health Survey 1993.
Calverton, Maryland: NCPD, CBS, and MI.
National Council for Population and Development (NCPD) [Kenya], Central Bureau of Statistics (CBS), and Macro International Inc. (MI). 1999. Kenya Demographic and Health Survey 1998. Calverton, Maryland: NCPD, CBS, and MI.
National Council for Population and Development (NCPD). (2003). Adolescent Reproductive Health and Development Policy. Nairobi: NCPD
Njung’e, C. (2009). How Junk Food is Creating a Colony of Overweight Children. The Daily Nation, September 15.
Odero, W. (1998). Alcohol-Related Road Traffic Injuries in Eldoret, Kenya. East Afr Med J 75: 708–711.
Odero, W. (1995). Road Traffic Accidents in Kenya: An Epidemiological Appraisal. East Afr Med J 72: 299–305
Odero, W., Garner, P., Zwi, A. (1997). Road Traffic Injuries in Developing Countries: A Comprehensive Review of Epidemiological Studies. Trop Med Int Health 2: 445–460.
Odero, W., Khayesi, M., Heda, P.M. (2003). Road Traffic Injuries in Kenya: Magnitude, Causes and Status of Intervention. Inj Control Saf Promot 10: 53–61
Onywera, V.O., Adamo, K.B., Sheel, A.W., et al. (2011). Child Obesity and Fitness Levels among Kenyan and Canadian Children from Urban and Rural Environments: A KIDS-CAN Research Alliance Study. International Journal of Pediatric Obesity, 2-2(6):e225 - e232)
Onywera, V.O., Adamo, K.B., Sheel, A.W., et al. (2010b). Emerging Evidence of the Physical Activity Transition in Kenya. Journal of Physical Activity and Health

196Youth Research Compendium
Otieno, W, and K’Oliech, D. (2003). Factors Affecting Transition to Secondary Education in Africa. Nairobi: African Population and Health Research Centre
Ringheim, K. & Gribble, J. (2010). Improving the Reproductive Health of Sub-Saharan Africa’s Youth. Washington: Population Reference Bureau.
Republic of Kenya. (2003). Economic Recovery Strategy for Wealth Creation. Nairobi: Government Printers.
Republic of Kenya. (2008). Marriage Act Chapter 150, Laws of Kenya. Nairobi: National Council for Law Reporting
Republic of Kenya. (2001).The Children’s Act Cap 586, Laws of Kenya. Nairobi: Government Printers.
Ridde, V. and Morestin, F. (2010). ‘A Scoping Review of the Literature on the Abolition of User fees in Health Care Services in Africa.’ Health Policy and Planning.
Ringheim, K. and Gribble, J. (2010). Improving the Reproductive Health of Sub-Saharan Africa’s Youth. Washington: Population Reference Bureau.
UNAIDS. (2010). AIDS Epidemic Update, 2010. Geneva, UNAIDS
United Nations. (2005). World Youth Report 2005, Young People Today, and in 2015. New York: United Nations.
United Nations. (2007). ‘Report of the Secretary-General: Goals and Targets for Monitoring the Progress of Youth in the Global Economy’. A/62/61/Add.1.
UNICEF. (2007). Progress for Children: A World Fit For Children Statistical Review, Number 6. New York, UNICEF.
UNICEF. (2009). The State of the World’s Children 2009: Maternal and Newborn Health. New York, UNICEF
UN Millennium Project. (2007). Millennium Development Goals Mid-Term Country Report. New York, 2007
WHO/ICO Information Centre on HPV and Cervical Cancer (HPV Information Centre). (2007). Retrieved from www.who.int/hpvcentrehttp://www.who.int/hpvcentre/publications/HPVReport2007.pdf?
World Health Organization (WHO). (2000). Obesity: Preventing and Managing the Global, Epidemic, Technical Report Series, 894.
Women Deliver. (2010). Youth Guide to Action on Maternal Health, A tool Kit. Washington DC. Women Deliver

197Institute of Economic Affairs
198Youth Research Compendium
7 Family Ties or Family Lies?Mary Mbulwa Mnjama & Edith Kaumbuthu
AbstractThis chapter looks at trends in youth and family development in Kenya. It seeks to show how family formation and structure impacts youth development. Youth development determines future families and national development. It looks at traditional Kenyan family and traces its historical development. An examination of some factors that have contributed to this development has been carried out and citations made of regional and rural- urban disparities in family formation and structure. It discusses factors that have influenced family development including colonialism, urbanization, education, cultural and religious practices, gender, media and technology and income levels. Various views of psychologists in and out of Kenya are explored and an analysis made of the psychological view of the impact of family on the youth development. It argues that positive youth development is possible with appropriate interventions. It finishes with the argument that national policies need to be supplemented by interventions directly targeting parents and the youth.
IntroductionThe family is the most fundamental and dynamic unit in any society. Psychologists agree that the family as the pri-mary agent of socialization and determines the behaviour of young people. The family is usually the major source of basic necessities in life. It also forms the base for parenting, defines social and moral norms, and provides chil-dren and young people role models in preparation for adulthood and service to the nation. The family is charged with the responsibility to care and to bring up all its members. Any nation seeking maximum development must be interested in the quality of its citizens. It is in the family that these citizens are first molded and mentored for responsibility. Strong families translate to strong nations and weak families to weak nations.
The strength of a family depends on its formation and structure. Family structure determines parenting styles, which predict the child’s well being, psychological development, academic performance, and social competence, including future family formation.
The family institution is very dynamic and changes as values and social norms evolve. Psychologist Urie Bronfen-brenner (1917-2005) views the family as an ecological system, in that what affects one member affects the other

199Institute of Economic Affairs
and the whole system including the nation. To survive change, families must be resilient. A resilient family has well adjusted and competent members, capable of bringing up upcoming generations. Just like all adapting organisms, families need some form of internal organization. Globally, governments and scholars are waking up to the reality, that trends in family formation and structure can no longer be ignored as they directly and indirectly impact on national development. Africa is faced with nu-merous challenges due to socio–economic and political factors. If Africa is to develop and achieve the Millennium Development Goals (MDGs), the welfare of families must be the beginning point. This calls for proper critical assessment, of family development and its impact on the youth who will form future families.
In response to this need, in 2010 scholars, researchers and practitioners from various disciplines of family and community management in Africa held the Pan African Family Strength Conference in Kenya, hosted by Kenyatta University. In her message during the conference, Prof. Olive Mugenda, Vice Chancellor, Kenyatta University noted that, “ The African Family has not so far been well conceptualized and its understanding is marred by myths often associated with controversial traditional practices.”
Some of the key issues deliberated in this conference were: changing family value systems; transformation of pa-triarchal family system; economic practices such as tourism and its impact on family values and structure; positive traditional family values that can enrich modern marriages; rituals that can promote holistic development of the child and the impact of absent fathers on child’s development.
The contemporary Kenyan family is undergoing rapid socio-cultural transformation. This has led to varied ways of family formation and diverse patterns of family structures in search of the best fit. With a wide range of fam-ily diversity that keeps on mutating with every social and economic change, it is not easy to clearly conceptualize family in Kenya today without a look at its historical development and factors that have shaped its formation and structure. Understanding factors that have shaped and continue to shape family patterns will help to anticipate possible future family models. This, is a key aspect in formulation and implementation of national policies and frameworks related to family and the youth.
The Kenyan Family in the PastIn the pre- colonial traditional Kenyan society, there was much stability in the family institution. Marriage was considered normal, natural and was fully expected. Family formation was not only a family but a communal affair, governed by community’s standards and expectations (Wasanga & Maingi, 2010). Marriage was also a union of families, not just an alliance of two people. Parents and other relatives were involved in family forma-tion by selection of marriage partners, including parent arranged marriages. Courtship was taken seriously and great care taken in choosing the bride and the groom. The role the family and the community played in establish-ment of marriage unions extended to its maintenance and stability. However, with divorce not being an option, couples were committed to keeping the family healthy and strong. Most marriages were between people from the same ethnic groups though there were interethnic marriages between neighbouring communities. Marriages were mainly polygamous, with a man having two or more wives. In many communities, sex before marriage was strictly prohibited and girls who became pregnant before marriage were stigmatized.
Family structure started forming after marriage (Tumuti, 2010). The family system was patriarchal and extended, meaning that system was male dominated. This patriarchal extended family structure worked as a welfare system that ensured all members were loved and cared for. Within this structure, children occupied the central place. They were raised up in a close knit family group and responsibility for their holistic development was shared by the family members. These strong families translated into strong communities where each member’s welfare was of paramount importance. However, patriarchy reduces women and makes them the second rate gender by denying them power and ownership, and at times access to resources (Kinyanjui & Gichui, 2010).
What was expected in traditional Kenyan family was a father, mother, children, grandparents and other relatives, each playing significant role in the family. The father was the head of the family, breadwinner, property owner and protector. His primary role was to love his wife or wives and children and to mentor young boys in prepara-tion for adult life. In the absence of the father, a male relative preferably an uncle became a symbolic father

200Youth Research Compendium
figure. Mothers were expected to stay at home, bear children, perform household chores like cooking, and to guide their daughters. In the absence of a mother, there were surrogate mothers, mostly aunties. Fathers would be out with their sons either grazing animals or carrying out any other activity, while mothers stayed at home with their daughters to perform household chores.
Grandparents were viewed as repositories of family traditions, knowledge and cultural values. Through proverbs, stories, myths and songs, they imparted to the young generation standards that were tested and proved to work (Mwiti & Al Dueck, 2006). Relatives included several generations of cousins, uncles and aunties all living close to one another. They all formed a strong kinship that provided economic, social and psychological security to all its members.
Children were expected of every marriage and were considered a blessing to the family and the primary reason for marriage (Mberengwa, 2010). The more children a family had the better. Due to the importance placed on chil-dren as carriers’ of family lineage, parents trained their children from childhood with the aim of imparting family and societal values. They were responsible for ensuring that their children grew into the type of youth the society wanted and needed. Children were required to obey their parents and other adult members of the community by adhering to societal norms and expectations.
Communities also had ways of training children and young people (Mwiti &Al Dueck, 2006). Training was sys-tematic and it was underlain by values of community solidarity and continuity. Issues to do with family took a major part of the training as it was believed that the survival of any community lay with the young people and the family. There were set goals to be achieved at each level of training and rites of passage to mark transitions from one stage to another. Training was also cohort-based to ensure that no young person was left out. These cohorts created positive peer pressure as members of the group were accountable to each other (Mwiti & Al Dueck, 2010).
Social controls against immorality, including circumcision of girls to preserve virginity, were strong and enforced as foundational values in youth development. Virginity at marriage was extremely valued in Somali culture who believed that this was the most valid means of ensuring that a girl remains virgin until marriage (Jaldesa, Askew, Njue & Wanjiru, 2005). During the “initiation schools” the youth were given sex education, taught matters of marriage and how to perform other adult duties. They were taken through tests of endurance and courage through exposure to challenging situations, in preparation for adulthood.
Discipline was instilled from a tender age with punishments given to anyone who dared to disobey the set of so-cietal norms. Child socialization was a must to impart societal values. With a very strong community and kinship system, families in Kenya in the past were more stable than contemporary families. Mwiti and Al Dueck (2006), attributes the current instability of families to a broken culture where children are living with unclear value system due to erosion of African traditional ways of life as a result of various factors.
Factors that have Influenced Family Development in KenyaContemporary Kenyan family is undergoing rapid social-cultural transformation. Various forces have shaped and influenced the ways family form, and what and how family functions to meet the changing demands on peoples’ lives (Wilsons, 2010). Change in family formation and structure in Kenya can be attributed to the following related factors.
ColonialismWith the onset of colonialism in the 19th Century, Kenyans were thrust into a new political system, modernity and westernization (Mwiti & Al Dueck, 2006). In the mid-19th century, fathers increasingly moved out of home for economic reasons. Men came to spend less and less time in a parental role as they came to be seen primarily as economic providers for the family (Griswold, 1993 as cited in Kimani & Kombo, 2010). This brought rapid socio–economic changes with great repercussions for the family

201Institute of Economic Affairs
Many men left their homes as they were conscripted into the army to either defend or fight against the colonial government, or to fight during the first and second world wars. Also due to heavy taxation imposed on Africans, and the need to catch up with modernity, fathers moved from their homes in rural areas to look for jobs in urban centers thus separating them from their families. As fathers became economic providers only, spending less time in parental roles of guidance and mentorship, family instability occurred. The traditional powerful and protective patriarchal family system that cushioned children, gave way to a matriarchal family system in some parts of Kenya like Central Province where many men joined the liberation struggle against the colonial government.
A study conducted by Kimani & Kombo (2010) indicated that both daughters and sons were affected by their father’s absence. Sons were more likely to be violent due to frustrations associated with lack of role models. Lack of adequate family provision led to school dropout with girls becoming pregnant and getting into early marriages. The possible outcome of a very strong matriarchal family system is role confusion due family disruption and dis-organization (Turner & Helms, 1995).
According to Kimani & Kombo (2010), the role of the father is particularly important in determining the child’s emotional, social and academic development. There is direct co–relation between father’s absence in a child’s life with poverty, maternal and child health, incarceration, crime, teen pregnancy, child abuse, drug and alcohol abuse, education and childhood obesity.
Though some families are able to adjust and cope with changes in family structure, some families are not. The ef-fects of failure to adjust can be manifested through parenting styles and the behaviors of the children.
Psychologically, family separation is rated as one of the most traumatic experiences for all the family members, because it creates uncertainty and unpredictability. Traumatic events cause anxiety and stress and also produce feelings of inferiority. Traumatized people are normally angry with themselves and the world. They unknowingly vent out their anger through self-defeating behaviors directed toward themselves or others. These behaviors in-clude alcohol and substance use and abuse, risky sexual activities and aggression. Traumatized children learn to hit back in anger or become unduly aggressive while others withdraw into childhood depression (Mwiti, 2009)
Children who develop these kinds of behaviors have problems in forming lasting relationships. According Centre for Justice and Peace Building (CJPB, 2006), many traumatized children and young people adopt behavioural cop-ing mechanisms that affect their ability to develop constructive social relationships with peers and adults. These behaviors affect all areas of life including learning or refusal to continue with school. Dropping out of can lead and early pregnancies and that may end up with one becoming poor, and subsequently, a parent incapable of educating their own children. Stressed parents can be aggressive towards their children leading to disciplinary and motiva-tional problems in children. Where a family gives support and satisfaction to its members, the members are likely to feel a sense of belonging and psychological satisfaction (Mugenda & Ondigi, 2010).
The Absentee FatherThe effects of change in family structure can be carried to adulthood. For example, there are women who may not value marriage and married life as they grew up seeing their mothers carry out all the family responsibilities in the absence of their fathers. On the other hand, some young married men could be relegating their marital and parental responsibilities to their wives as they saw their fathers do. Without adult male role models, and with hard working mothers, these young men were socialized to believe that fathers have no roles to play in the affairs of the family and that families can ran smoothly in their absence. With no wars to fight, no jobs in the urban centers and the unwillingness to practice farming in the rural areas, most of the young men turn to alcohol and other substances as a way of escape, in turn becoming absent fathers. They are also a burden to the family and a source of embarrassment, trauma and low self- esteem to their children. Their inability to provide for the family leads to further frustrations.
In the recent past Kenya has witnessed women demonstrating against their husbands and their sons who spend their waking hours in bars taking alcohol, leaving them to shoulder all family responsibilities. Such fathers are likely to bring up children with inadequate social skills necessary in marriage. Parents who abuse alcohol and other

202Youth Research Compendium
substances are also more likely to abuse their children physically, emotionally, sexually or through neglect. Any form of child abuse is traumatic as it threatens the child’s sense of safety.
UrbanizationUrbanization leads to great mobility as people migrate from rural to urban areas in search of jobs and better living conditions. Urbanization and mobility has scattered many people and split families (Mwiti, 2005). This has led to different forms of family structures and family formation in urban and rural areas, with the rural area maintaining a close knit traditional kinship family structure. The kinship social structure in rural areas promotes early mar-riage (KDHS, 2010). On average, women aged 25 – 34 years in urban areas marry three years later than their rural counterparts, while men in the same age bracket in urban areas marry two years later than their counterparts in rural areas (KDHS, 2010). This shows delayed pattern in family formation in urban areas. Also marriages in ur-ban areas are likely to be interethnic (Bongraats, 2006). This could be attributed to the embracing of cultural and ethnic diversity that is widespread in the urban centers. Families in urban centers are likely to have few children than those in the rural areas. Total fertility rate (TFR) in urban areas declined from 3.1 in 1995–1998, to 2.9 in 2006–2008, while it remained at 5.2 during the same period in rural areas (KDHS, 2010). This can be attributed to socio-economic factors especially education that empowers women to make informed decisions about their reproductive health and use of contraceptives.
EducationEducation is one of the major factors that influence youth development, family formation and structure in Kenya. This is regard to time of marriage, number of children in the family and in making decisions for the family.
Education started shaping family and youth development in Kenya from the inception of western education during colonial times from 1895 through 1963. Western culture was introduced to Kenya mainly through the education system. Parental roles and responsibilities started changing in areas where schools were started. Schools for the African children often included feeding programs, doubling as child care centers in plantations. This meant that parents were relieved of some parental responsibilities so that they could be free to offer labour to the white set-tlers. With time there was some disconnect between children and their parents at a very tender age, a trend that has continued to date.
Teachers had a lot of authority and were expected to instill discipline and impart moral values to the young people as part of their village responsibility to raise up the youth within the expected ethical standards. Schools were seen not only as an extension but in a real sense an essential part of the family with regard to the nurturing of young people. This could be the reason for the belief that sex education is the responsibility of the teachers. The implica-tion for this was that parents started delegating a very crucial role of youth guidance to the teachers who could only do so much.
Education created social and economic disparities between the urban and rural areas, directly impacting family and youth development. According to KDHS (2010) a woman’s level of education is positively related to age at first marriage and fertility. In rural areas marriages occur early at the age of 20–24 compared to 25 and above in urban areas. Fertility rate is also higher in rural areas with an average of 5.2 children per woman in rural ar-eas compared to 3.1 in urban areas. Regionally Nairobi Province has the lowest fertility rate at 2.8 children per woman while North Eastern Province has the highest at 5.9 (KDHS, 2010). Though there has been a decrease in the proportion of women and men with no education since 2003 from 23 to 19% for women, and 16 to 13% for men, twice as many women and men in the rural areas still have no education at all compared to those in urban areas (KDHS, 2010).
With the introduction of Free Primary Education in 2003, primary school enrollment rates increased, although about 1.5 million children are still out of school (Department of Children Services, 2008). The enrollment for pri-mary level is 89.1%, with girls being more disadvantaged in accessing formal education (Help Age International, 2008). Since 2003, there was a slight decrease in proportion of children and young adults who have never attended school, particularly among those age 10–19 years (KDHS, 2010). The increase in school enrollment must have had some impact on age of child bearing and teenage pregnancy. Child bearing declined from 23% in 2003 to 18% in

203Institute of Economic Affairs
2008–2009, while teenage mothers declined from 19% in to 18% (KDHS2010). This implies that people are more informed of their choices about reproductive health and the use of family planning methods. The highly educated are likely to delay marriage as they spend many years in school and college receiving instruction. Again, parents with higher levels of education tend to encourage their children to complete their studies before getting married. Women without secondary or higher education are twice likely to marry at the age of 20 than those with education (Bongaarts, 2006). The uneducated young people are more likely get into marriage and begin child bearing earlier compared to those who are educated. Low levels of education or no education has been attributed to high poverty levels making it difficult for parents to take their child to school. This traps families into a cycle of early marriages, early child bearing, and poverty. Women in the lowest wealth quintile have highest rates of illiteracy, standing at 47% compared to that of women in the highest wealth quintile at 9% (Help Age International, 2008). Illiteracy and poverty are associated with challenges in parenting, with poor and parents with low levels of education being more accommodating of early marriages for their children. Teenagers from poorer households (24%) are more likely to have began child bearing than those from wealthier household (16%) (KDHS, 2010).
Erulkar, (2006), notes that 60% of the boys and 78% of the girls aged 15 -17 in the slum areas in Nairobi were not attending school due to poverty. This means that over 60% of adolescents in the slum areas in Nairobi were likely to get married before their 20th birthday. School enrolment and continuity determines age of marriage. Gender and regional disparities, particularly in arid, semi- arid, slums where enrollment is low, will translate into disparities in family formation and structure.
Education also not only empowers people economically but in decision making, improving the quality of family life for most of people who are educated. Women with fewer children, those who live in urban areas, those with some secondary or higher education and those in wealthiest quintile are more likely to make financial decisions jointly with their spouses (KDHS, 2010). This shows that the traditional patriarchal family set up is changing to be more egalitarian with education. Quest for education can also have some negative effects on family and youth development. Parents who double work with studies may find it a challenge to balance the two with their parental responsibilities.. Dobson (2007) says that people who have crowded lives suffer from fatigue and irritability. Ir-ritability produces indifference which can be interpreted by the child as lack of love.
Cultural and Religious PracticesCulture can be defined as people’s way of life. Culture influences our world view and behaviour. Kenya is multi- ethnic with 43 major ethno-linguistic groups (KDHS, 1998). Diverse expectations about family formation and structure exist across these different ethnic and religious groups.
Female circumcision is a cultural practice that is practiced in some communities in Kenya. Ethnically, female circumcision is more prevalent among the Somali (98%), the Kisii (96%) and the Maasai (73%) (KDHS, 2010). There are varied views associated with the practice and circumcision. Most of these communities believe female circumcision preserves girl’s virginity and prevents immorality. Twenty five (25) percent of circumcised women approve of the practice as a way of gaining social acceptance and qualify for marriage.
This practice is also more prevalent in rural areas compared to urban areas, and among women with no educa-tion. Fifty four (54) percent of women with no education were circumcised compared to only 19% with secondary education (KDHS, 2010). Although circumcision is meant to preserve virginity and morality, the practice may be counterproductive and actually lead to early marriages going by the fact that majority of those circumcised are women with no education and low education levels enter early marriages. North Eastern Province that has high prevalence rate of female circumcision (95%) also has a high rate of early marriages (KDHS, 2010).
Wife inheritance is another cultural practice that has influenced family development in some parts of Kenya. In communities that practice wife-inheritance, widows may not have been given a chance in spousal selection and family formation.
Religious beliefs and norms directly or indirectly influence individual’s orientation toward family formation and structure. Most religions are against premarital sex and encourage those interested in marriage to go through for-

204Youth Research Compendium
mal or informal premarital counseling in preparation for marriage life. There are also divergent views on the use of contraceptives and this can influence family sizes. Divorce is discouraged and couples are supported in their marriage. Religious beliefs influence decisions on almost all areas of reproductive health. There are differences on female circumcision between main religions in Kenya and between denominations. The proportion of Muslim women who are circumcised is about double that of Christian women, with Christians at 23.5%, Muslims 51.4% and those with no religion 38.3% (KDHS, 2010). According to the survey, 87% of women in North Eastern Province believe female circumcision is required by their religion. Several reasons are given for female circumci-sion by Somali, including a means of controlling female sexuality and a perceived requirement of Islam (Jaldesa, Askew, Njue and Wanjiru, 2005).
Christianity also dealt away with some cultural practices, like polygamous marriages and, opposed some aspects of the payment of bride price, a practice that had great cultural value in traditional marriages as family relations were cemented during negotiations.
Christian and Hindu teachings recognize monogamous marriages , but African customary marriages and Islamic marriages accept polygamous marriages so long as one is able to take care of his wives and children (Kenya, 2002b cited in Wilson, 2010).
Religion also has an impact on education and therefore an indirect impact on the time of first marriage. In some Islamic communities in Kenya most children are not enrolled for Early Childhood Education (ECD) as they attend ‘Madarasa’ where they are taught the Islamic faith. Delay in enrollment for formal education is one factor that discourages children to continue with education. Girls who drop out of school at an early age are more likely to enter into early marriage. Integration of Madarasa and ECD is one way to ensure that girls remain in school (KCDF, 2008).
GenderGender disparity has been a major concern in the whole world since 1980s. Since 1995 Beijing Conference on gen-der mainstreaming, there has been a clamor for equality of men and women through the affirmative action which demands recognition of the worth of women’s contribution to society and opportunities to show their capabilities hence equalizing opportunities to work, education, politics and business among others.
Family formation and structures have been influenced by the shift in gender relations from patriarchy to a more gender inclusiveness paradigm. In Kiambu District, in Central Kenya, the shift has opened up women’s power in decision-making, thereby widening their autonomy, empowerment, leading to loss of male dominance in the fam-ily (Wamue & Njoroge 2010). The diminishing dominance of men in family has enabled more women and girls to make autonomous decisions in regard to careers, marriage and family. Traditional gender roles that required a married woman to stay at home while the husband went out to look for opportunities have changed.
According to KDHS (2010), 57% of women and 86% of men aged 15–49 are in employment. Since 2003, pro-portion of working women and men who are employed in professional, technical and managerial occupations in-creased with 62% of women employed all year (KDHS 2010). Since majority of Kenyans get married at the age of 24–25, majority of the people in employment have families. Slightly over 52% of employed women have a child under age six, with 17% having relatives looking after their children and 15% a child looking of other children (KDHS, 1998). Gender roles and family structures have changed. Both men and women are increasingly absent from their homes leaving children under the care of domestic workers who may not have the necessary training or experience to carry out this delicate parenting role. The trend of children taking care of other children has a nega-tive impact on the stability of families (Bongraats, 2006).
Parents are now supposed to strike a balance between other responsibilities and parenting for family stability. Children require a stable family environment to fully achieve developmental milestones. A stable family environ-ment is one where there is predictability and clear boundaries in regard to roles and responsibilities, for both parents and the children.

205Institute of Economic Affairs
Gender inclusiveness has also impacted on the way boys and girls are socialized. Traditionally there was gender discrimination against girls (Richler & Sherr, 2009). Today the focus has changed to the girl child to almost the exclusion of the boy child. Gender inclusiveness has helped women to participate in making household decision and on their reproductive health. Education of women is associated with low fertility as it informs them about their options regarding methods of contraception (KDHS, 2003).
There is regional disparity in regard to gender inclusiveness. For example, men in Central Province are more likely to approve women participation in decision making than men in North Eastern Province (KDHS, 2010). This could be an indication that family structure in North Eastern Province is more patriarchal compared to Central Province where men are more likely to have gender egalitarian beliefs. Fertility rate is also high in North Eastern Province (5.2 children per woman) compared to Central Province (3.4 children per woman which could be an indication that women Central Province are more likely to make reproductive health decisions.
Media and TechnologyInformation, communication and technology (ICT), has both negative and positive effects on family formation and structure. Children, young people and adults are all influenced by what they hear, see and read through the media. Children and adolescents are influenced more because they are still in the process of development and their minds are very impressionable with any kind of information. Children and adolescents may not differentiate between reality and fiction, real people and actors. Media and especially the television have great influence on the behavior of adolescents affecting their values and their lives (Mwiti, 2005). Overconcentration in watching television, imitation of behaviors and violence are some of the symptoms that reveal the influence of mass media especially upon adolescents (Mwiti, 2005).
The media subtly passes on some values in regard to sexual relationships, finding a partner, marriage relationships, and parenting and on how children should relate with their parents and others in authority. Some of the foreign and local programmes on television channels advance pre- marital sex, marriage unions without commitment, divorce, infidelity, rebellion, violence and substance use and abuse. The values passed on, whether bad or good, are often replayed in real life.
Families living in urban areas and those with high education levels and wealth are more vulnerable to foreign ideologies due to accessibility to newspapers, television, radio and internet. Studies in the USA show that children between the age of 6 and 18 years spend about 15,000 hours watching television and by the age of 14, an average child in America will have watched 18,000 murders (Dobson, 2007 ). This trend is quickly catching up with the young people in Kenya making them vulnerable to some negative ideologies and practices in regard to family for-mation and structure. KDHS (2010) estimates that 57% of people in urban centers have television sets and 18% in rural areas, while 82% own radios in urban centers and 71% in rural areas. Parents allow heinous behavior and language in their homes through the television that they would otherwise forbid (Mwiti, 2005). Apart from the television, the internet has become a major source of information, entertainment and social networking. It has both positive and negative impact on family formation and structure.
Kikech & Kebaya (2010) note that technology has become a useful and indispensable tool in strengthening family relationships, although it is also endemic due to isolation and addiction. Many parents working away from home now can keep in touch with their family members and offer emotional support which is necessary for the develop-ment of their children. This way children may not fell abandoned and rejected.
According to Communication Commission of Kenya (CCK), liberation of telecommunications market in Kenya in 1999 led to growth of internets services (CCK, 2007). The Commission however admits that the greatest chal-lenge is lack of local content and regulation of the incoming content. This means that negative foreign ideologies on family formation and structure are likely to penetrate into the Kenyan market.
Although access to technology has bridged the gap that exists among family members, attitudes and behaviors learnt by young people through its use have impacted heavily on the family. Marital secrets that were earlier meant for adults are now readily available to all including young people, leading too lack of respect accorded to marriage

206Youth Research Compendium
in the past. The use of the cell phone has come to unearth an ugly side of infidelity in marriage and relationships, leading to break-up, separation and divorce.
The pornography challengeReports from teachers, parents and cybercafés indicate that pornography in Kenya is rampart among the young people. The infiltration of pornography in Kenya can be understood going by Dobson’s (2007) assertion that the internet had 160,000 pornographic sites. This is a relatively conservative figure today considering the rapid growth in technology and accessibility in the last few years. A cell phone is all one needs to access any site of choice in the internet, which parents may not be able to regulate. Adults as well as young people and children can getting addicted to the internet spending a lot of time and money that can be used in studies or for the development of the family. Parents must take the responsibility model healthy marital relationships, and to monitor the programmes their children are watching which requires discipline from childhood (Mwiti, 2005).
Income LevelsHard economic times can impact negatively on the family as parents struggle to cope at the expense of bringing up children. According to KDHS (2008 -2009), wealth is concentrated in urban areas with 79% of the urban popula-tion in the highest wealth quintile and the lowest wealth quintile in the rural areas. Nairobi Province has 96% of the population in the highest wealth quintile while three quarters of the population in North Eastern Province is in the lowest wealth quintile
Household composition including size of the household, sex of the head of the household is associated with wel-fare of the household. Households headed by women are typically poor than those headed by men. Economic resources are also limited in large household than small household. Mean size population of Kenyan household is 4, 6% in rural areas and 3.1% in urban areas.
Availability of facilities also determines the welfare of the family. 91% of households in urban areas have im-proved source of drinking water compared to 54% in rural areas collecting drinking water. Half Kenyans do not have adequate housing with majority having only room for sleeping.
People in low wealth quintile are more likely to have their children marry early because of dropping out of school and for economic reasons, including earning through payment of the bride price. High income levels are known to be key determinants of individual and family wellbeing. Economic resources increase the sense of control over life, as well as access to stable social relationships (Mugenda & Ondigi, 2010).
Emerging Family StructuresDue to diverse factors that have continued to influence family development, family formation and family patterns in have evolved in varied ways. Family patterns include a wide diversity of customs surrounding family formation and structure across ethno-linguistic groups (Wilson, 2010). Current trends in family formation and structure in Kenya are a blend of traditional African family system with emerging forms of family structure in search of the best fit. Goldenberg & Goldenberg (1996) assert that well functioning families are hierarchically organized with parents exercising more power than the children and older children having more responsibilities than younger ones. A family’s transactional pattern regulates behaviors of its members (Goldenberg & Goldenberg, 1996). Mi-nuchin (1974) feels that dysfunction in the family occurs when there are unclear levels of authority and power and when there is confusion in regard functions of family members.
In family formation, education, urbanization and gender paradigm shift could have led to greater independence from parents in selection of marriage partners though parents are most likely to be involved in marriage nego-tiations. This is what psychologists would refer to as differentiation of self or individuation. Differentiation or individuation describes the ability to function autonomously in significant relationships without being controlled or experiencing inordinate responsibility to imitate others (Goldenberg & Goldenberg, 1996). It is distinct from

207Institute of Economic Affairs
emotional distancing since it includes closeness with family members while remaining autonomous (Lawson & Brossart, 2001).
Reduction in the role of the family in selection of marriage partners is associated with an increased likelihood that women marry outside their ethnic groups and decline in women entering polygamous marriages (Bongraats, 2006).Youth today are meeting marriage partners through many ways including social network. Sex before marriage is also on the increase. By the age of 18, 55% of young people are already sexually active (Sivi-Njonjo, 2010). Divorce rates in Kenya is said to be on increase, separating parents from their children, though no survey has been conducted to estimate the number of children separated from their parents (Committee on the Rights of the Child, 44th Session).
The Modern Extended FamilyIn the traditional African context, the family unit was much extended and included parents, children, grandpar-ents, uncles and other relatives through birth, marriage or adoption. Extended family also included persons being supported economically by the family including house servants (Gichinga, 2007).
With modernization and changing socio –economic set-up, contemporary extended family structure, also referred as quasi- extended comprises biological parents, children, blood relatives, and to some extent relatives by mar-riage, unlike in the past where even servants were considered to be part of the family. This means that the family as welfare and social support system has been drastically reduced. However, this quasi l extended family structure has some negative impact of dependence. When one member of the family network fails to perform the expected roles, other members of the family suffer due to this interdependence as they have to take on the neglected roles. This has created dependency with some members of the family relying on others. Those in employment and those living in urban areas with this kind of family arrangement are likely to bear the greatest responsibility of taking care of the needy relatives. The employed are forced to shoulder the financial burden of their unemployed relatives, while the urban dwellers take in relatives who migrate to towns in search of jobs, placing a heavy financial and emotional burden on the family.
This high dependency not only compromises holistic development of children in a home but also creates tension in marriages, sometimes leading to break – ups of the union. Dependency retards economic development due to reduced income for saving. Despite the challenges of contemporary extended family, it still plays an important role of social support to its members and in creating a sense of belonging to the children and young people.
Monogamous Nuclear FamilyMonogamous nuclear family in Africa is culturally perceived as comprising a father, mother and children (Kimani & Kombo, 2010). This non-extended family system is now widespread in Kenya due to changing social economic environment. This kind of family is found in both urban and rural areas. With the erosion of some social structures that supported the traditional extended family and the challenges of contemporary extended family structure, monogamous nuclear family may be the most favorable structure and the best home environment to bring up chil-dren especially if it is devoid of domestic disharmony and family conflicts. Children brought up in a stable family environment, where there is love and understanding and where their physical, emotional and relational needs are adequately met, tend to have high self regard (Mwiti, 2005).
However, though monogamous nuclear family is gaining popularity, it is faced with similar challenges of physical-ly and emotionally absent parents.. Parents can be absent from their families due to among other reasons jobs, al-coholism or extramarital affairs. Both daughters and sons are affected in the situation of absent parent or parents, especially when family’s provision is inadequate or one parent is too stressed to give the children adequate atten-tion. Pressure from work, the home, financial difficulties and a history of maltreatment in the parent’s background and low levels of self- esteem are frequently cited as reasons for violence among parents (Turner and Helms, 1995).
Boys are likely to be more affected by their father’s absence due lack of a role model to identify with and can be re-bellious. Girls with absent mothers are likely to get pregnant and marry early due to lack of guidance on sexuality.

208Youth Research Compendium
The way in which children are socialized in the family to a large extent determines their future behaviors. Research indicates that many abusive parents were abused when they were youngsters (Elder, 1992, cited in Turner and Helms, 1995).
Due to uncertainty which causes anxiety, children and young people from families where parents are physically and emotionally absent may suffer from stress and fail to concentrate on their studies leading to poor performance and poverty. Poverty is a predisposing factor to teenage pregnancies, early family formation and single parents headed families.
Single Parent Families These families are headed by a single parent- mother or father- with biological, fostered or adopted children. Single parents may be widowed, separated, divorced or never married women or men.
Kenya has a high number of female headed household. This can be evidenced by trends in family development from KDHS (1998, 2003 and 2010). In 1998, 9% of women were divorced, separated or widowed compared to 11% in the same category in 2008 and 2009. Four percent of the men were divorced, separated or widowed in 1998 and the figure did not change significantly in 2008–2009. This means that the number single women headed households is more and on increase than single men headed household,
The number of women married or living with a man was 59% in 1998 compared to 58% in the period 2008 to 2009. This means that majority of Kenyans are either in marriage or in some union though the number is decreas-ing. A higher proportion of men aged 30 - 34 compared to women were married or in a form of union. This could point to a trend of women opting to stay out of marriage.
Though no actual figures were given on divorce rate, the surveys indicated that the proportion of divorced women was low in all ages especially for those less than 25 years. This could mean that divorces are occurring latter into marriage, probably among couples with children, Divorce or separation is a traumatic event for children. Many children would prefer unhappy marriage to divorce. Adjustment by children to the separation of their parents involves deep-seated feelings of anxiety, insecurity and divided loyalties (Gillis, 1996). Psychologists agree that children who leave or are left by their parents feel rejected and at a loss. The loss children feel as a result of di-vorce is similar to that experienced when a parent dies. These can impact on the development of the children and in forming family relations latter in life. Studies indicate that children in single parent homes are likely to have emotional and behavioral problems (Mwiti, 2005).
Teenagers who experience parental divorce may be especially sensitive to the instability of marriages and may view cohabitation as a way to avoid divorce and to test the relationship (Murithi, Mugenda, and Ngige, 2010) However, some children of divorced parents show remarkable resilience in face of multiple stressors in life. Factors associated to resiliency are assurances from other family members, teachers and friends (Turner & Helms, 1995).
Though single parenting can be draining, it has its rewards because of steady and undivided standards of discipline within the home and in encouraging children to be more self reliant. However, single parents face numerous prob-lems, mainly financial due to conflicts associated with balancing between employment and home responsibilities (Turner and Helm, 1995). Mwiti (2005) asserts that in a single parent family where the spouse is widowed and the living parent is present and caring; children are emotionally healthier than other single homes as memories of the values the dead parent stood for continue to influence children’s behavior. With social support and non discrimi-native working environment against women, most single parents can reorganize effectively to offer physical and emotional support to their children.
Patterns of single parenthood among the educated in urban areas especially women can be is attributed to the need to pursue careers and professional growth without hindrances. Being a single parent gives a person autonomy, with no absolute influence or authority over them from a man. In the rural areas single parenthood among young women can be attributed mainly to early sexual activities leading early pregnancies.

209Institute of Economic Affairs
Blended FamiliesThese are families where each spouse comes to marriage with their own children. A blended family is not a new idea in Kenya. In traditional African societies, there were cases of widows and widowers who got married with children and either got more children in the new union or concentrated on bringing up those who were already there. Contemporary blended families range from the multi-parent, multigenerational blended families composed of the remarriage of older widows and widowers to younger spouses and the recombinant complex stepfamily involving children of both the first marriage and those of the remarried couple multigenerational mixed-age mar-riages of couples with a large age range (Wilson, 2010).
Though some of the contemporary blended families have done well, majority have faced major challenges in re-gard to disciplining the children.
Polygamous FamiliesPolygamous marriages in Kenya are practiced mainly by men (polygyny), where a man has two or more wives. Polygamy is determined by among other things socio–economic and cultural factors, including religion. Accord-ing to KDHS (2008 – 2009) 13% of currently married women live in polygamous unions. Polygamy is said to be highest in the rural areas and among the people with low education levels and low income quintiles. According to Sivi-Njonjo (2010), North Eastern Province has the highest proportion of women (36%) in polygamous families and Nairobi the lowest (2. 4%). North Eastern Province has the highest number of women in polygamous unions because it is predominantly a Muslim region and Islamic faith allows polygamy. In Nairobi the cost of living is too high and most people prefer very small nuclear families. Nyanza Province is said to have the highest number of polygamous men (13.5%) and Central Province the lowest number of polygamous men (0.5%). The high number of polygamous men in Nyanza Province could be due to cultural factors such as wife inheritance which is very prevalent in the region. The low levels of polygamous men in Central Province could be a historical development where the emergence of a strong matriarchal family system led women to choose to remain out of marriage than be in polygamous unions.
Apart from the traditionally known polygamous unions, there is an emerging trend of such marriages due to fam-ily separation. Rural – urban migration has mostly contributed to this trend where married men and women who leave their homes in search of jobs in urban areas and getting married to another man or wife while maintaining contact with the family in the rural areas. This phenomenon is also being experienced where one spouse leaves the country and marries again in a foreign country leaving the children with the partner in Kenya.
Cohabitation Cohabitation, also known as living together with a person of the opposite sex without being legally married, is becoming more normative among young adults in Kenya (Stella, Barbara & Bessie, 2003 as cited in Ngige, Mu-gendi and Mureithi, 2010). Cohabitation is increasing with change in sexual values and wide spread acceptance of permissiveness (Turner and Helmes, 1995). Reasons for the increase in cohabitation include career or educational commitments; increased tolerance of such arrangements by society, parents, and peers; improved birth control technology; desire for a stable emotional and sexual relationship without legal ties; and greater disregard for convention ( Ngige, Mugendi and Mureithi , 2010). Cohabitation has implications for adolescents and future family formation and structure. Children learn either functional or dysfunctional behaviors in the family through observing and interpreting the family structure (Lawson, Lawson and Rivers, 1996). Similarly, as family roles and rules begin to develop, so do family values. Though children have options of accepting or rejecting any or all of the family values and are not bound by pure imitation of their parents, parents often approve children who mirror their values (Lawson, Lawson and Rivers, 1996).
Child - Headed FamiliesHIV and AIDS has greatly contributed to the emergence of child – headed families in Kenya. In 2004, UNICEF estimated that by 2010, 20 million children in Africa below the age 15 will have lost one or both parents to HIV and AIDS related illnesses. In 2005, it was estimated that out of 2.4 million orphans in Kenya, 0.5 million were double orphans, having lost both parents (Department of Children Services, 2008). The devastating consequences

210Youth Research Compendium
of HIV and AIDS is seen through death of family members of prime working age which impacts family livelihoods and ability to provide for and protect its members (Richler & Sherr, 2009). Traditionally, orphans and vulnerable children (OVC) were absorbed into the extended family system. Today, there are children orphaned as a result of HIV and AIDS living in extended families but no survey has been undertaken to estimate the figures (Committee on the Rights of the child, 44th Session). HIV and AIDS has changed the family landscape resulting in the reor-ganization of roles and responsibilities as well as disrupting the lives of young people. With the change of family structure, many OVC are under the care of their siblings who have no choice but to drop out of school to fend for themselves and their brothers and sisters, mostly under very poor conditions. Poverty impacts negatively on children as they are deprived of their basic needs for survival (Department of Children Services, (2008). Accord-ing to the Rapid Assessment, Analysis and Action Planning Process - RAAAPP (2004), as cited in Committee on the Rights of the Child 44th Session, about 12% of Kenyan households are comprised of orphans looking after themselves.
Young people and children who take on adult responsibilities are known to have arrested psychosocial develop-ment. Psychosocial developments are social and psychological changes that occur as a person matures. Psychologi-cal development is indicated by among other things self- awareness or the ability to understand self, including the emotions and behavior. Peer interaction is crucial to an individual’s psychosocial development.
Children overwhelmed by parental responsibilities have no time to interact with others through play, leaving then with inadequate psychosocial skills, vulnerable and easily taken advantage of. For example, sexual abuse cases among girls headed families have been reported, in some cases by the very relatives who should be the source of protection.
A rapid assessment by Oasis Africa Counseling and Training Centre (2007), on psychosocial support services pro-vided to OVC indicated that sexual abuse was high among this population in Nairobi. Sexual abuse is very trau-matic to children and young people and if not dealt with, it can cause traumatic stress with serious consequences for both the individual and their families, resulting to cycles of trauma.
Many orphaned girls who experience sexual abuse become mothers too young, and are forced to drop out of school and sometimes marry the abuser. They also take in care giving roles, neglecting their own developmental needs (UNICEF, July 2004). Child-headed households can therefore be a great source of risk due to lack of parent-ing skills and possible emotional instability common in traumatized children.
Granny- Headed FamiliesIn these families, grandparents take care of their grandchildren following the death of one or both parents, divorce or early teenage pregnancies. Such grandparents offer the most needed psychosocial support to these children and therefore become a protective factor for their growth and resiliency. However, due to their developmental stage some grandparents may not have the energy, resources and skills to bring up children in this modern world. In such cases children under their care are vulnerable and predisposed to any forms of abuse, ranging from, child labour, neglect, physical, emotional and sexual abuse. Sexual abuse can lead to teenage pregnancies, early marriages, and, and missing out on education opportunities.
In cases where grannies are too old to take care of children, they may end up in children’s homes and other insti-tutions under caregivers who may not have the experience and the ability to offer effective psychosocial support.
Teenage FamiliesTeenage families could be as a result of teenage pregnancy leading to early marriages. Teenage is a period of tran-sition between childhood and adulthood, meaning that the youngster has not attained full physical, social and emotional maturity. This leads to inexperienced child rearing practices compromising the quality of parent-child attachment. Due to lack of social skills and hurried family formation, most of the teenage marriages end up in divorce leaving the children with no secure base for proper growth and development. Teenage pregnancy has a high prevalence rate in Kenya. According to reports from Kenyatta National Hospital, more than 11% of the total

211Institute of Economic Affairs
deliveries at the hospital are by adolescent mothers (Mwiti, 2005). By the time girls are 19 in Kenya, 36% of them are already mothers (KDHS, 2010).
Street FamiliesThere is an estimated 200,000 –300,000 children living and working in the streets of major cities in Kenya (De-partment of Children Services, 2008). Most of these children are orphans and runaways from traumatizing family situations, enticed by the imagined freedom that awaits them in the streets Adolescents run away from homes to escape from pressure and conflict (Turner & Helms 1995). Without good family relationships, children are more likely to become involved in delinquent behaviour (Mwiti, 2005). Family failure to meet the child’s basic needs is seen by the increased number of children in the streets (UNICEF, 2006).
Once in the streets these children and young people form gang families with their peers for emotional, social and material support. Though gang members provide acceptance and imagined sense of security away from home, street children are faced by many challenges such as sexual abuse, being recruited to drug use and trafficking, and all forms of crime. These street children may end up with multiple sexual partners resulting to teenage- mothers with children whom they cannot identify their real fathers. Parental responsibility is the therefore left to mothers who are emotionally, financially and physically stressed to effectively carry out the delicate role.. Children brought up in the hard life of the streets are likely to be rebellious and to have early pregnancies and marriages and may abuse drugs to cope. The Street Families Rehabilitation Fund (SFRTF) caters for abandoned and street children. In the year 2004/2005, 6,000 children were removed from streets and placed in schools, rehabilitation centers and in employment (Committee on the Rights of the Child 44th session). However, a lot more needs to be done to tackle this problem.
Same Sex Unions (Homosexuality)Homosexuality refers to sexual attraction and emotional attachment to persons of the same sex (Turner and Homes, 1995) . This trend has caught up in Kenya with many schools reporting incidences of gay and lesbian re-lationships. There is no general consensus as to why one individual should be more susceptible to homosexuality than the other. Theories vary from the influence of unresolved childhood conflicts to inappropriate role models, imitative behavior and seduction by older persons during formative years (Gillis, 1996).
Impact of Contemporary Family Structure on Youth DevelopmentYouth development to a large extent is influenced by their families. The family is a social unit that is very dynamic but also faces a series of challenges in the course of change. When the structure of the family is transformed, the position of its members is altered accordingly (Corsin, 1996). At different periods, the family is required to adapt and restructure (Minuchin, 1994). Problems occur when a family with a dysfunctional family structure encounters a transition point and is not able to adapt to the changing conditions (Minuchin, 1994).
A functional family has a structure where levels of authority are clear and members play their expected roles and needs of all members are adequately met. A dysfunctional family structure has unclear levels of authority and role confusion and emotional and physical needs of the family members are not adequately met. Bowen believed that, flow of family life underpins all human behavior (Goldenberg & Goldenberg, 1996).
Any change in the family structure has some impact on the young people as they themselves are undergoing devel-opmental changes that they may not understand. Psychologists also agree that, there are some critical periods in the course of a human development that influence personality. The critical periods are the time when the environ-ment, and especially the family, has the greatest impact on individual (Turner & Helms, 1996). Some of the critical stages in human development is when children are between 0 and 2 years and during adolescence. Children form emotional attachments with the caregiver when they are very young. A child’s parents and the emotional atmo-sphere at home greatly influence the kind of a person the youngster will become (Turner and Helms, 1996). Ado-lescence is a period when young people are forming their identity, when they re examine old values and attitudes as they experiment with new ones (Turner and Helms, 1995). It is necessary for an adolescent to have a good solid home that provides all the parental attention needed through maturation process (Mwiti, 2005).

212Youth Research Compendium
Parenting StylesParenting styles at this point have great influence on the youngsters’ behavior. Parents have the s power to build or destroy their children (Mwiti, 2006). Mbevi (2009) see the family as a place to provide a loving nurturing en-vironment for support and training in values and support. Mwiti, (2005) also notes that, it is in the family where values are transmitted from one generation to another. Whatever happens at home affects an individual’s life significantly as families make or break a person. Broken families often produce broken people. Healthy families nurture healthy people and healthy communities.
When parents are not able to balance parental responsibilities, they adopt various parenting styles. According to Turner and Helms (1996), parenting styles determine personality and social development of the youth. They give three styles of parental control as authoritarian, authoritative and permissive. Authoritarian parents use force on their children and may be physically and emotionally abusive. Authoritative parents are democratic; they listen to their children but make the final decision. Permissive parents have less or no control over their children. They allow their children to do whatever they want. Parents who are not able to balance parental responsibilities are likely to be authoritarian and submissive. Some permissive parents allow their children to do whatever they wish, as a bargain for the parents’ freedom to engage in other responsibilities uninterrupted.
Authoritarian parents use force on their children because they may not have time to listen or reason with their children or are too stressed with them. Children brought up in such families grow up lacking parental love and at-tachment, and during adulthood they may have no emotional attachment with their parents, spouses and children. They often have discipline and motivational problems and are known to be more rebellious than children brought up in an environment where parents have time to talk and listen to their children (Turner & Helms, 1995). There is need for parents to be available to help their children to successfully navigate through developmental challenges. Healthy families have strong family structures that enable the youth to build social competences necessary for positive develop. Broken families have weak structures that compromise youth development. Families with broken structures predispose children and young people to neglect, physical, sexual and emotional abuse.
Increased Demand for early childhood development (ECD) servicesPre-colonial traditions remain deeply entrenched in the values of many Kenyan families, few communities have been untouched by the rapid social, economic, and cultural changes brought on by urbanization, dislocation, glo-balization, and austerity measures associated with structural adjustments, increasing poverty, and the impact of HIV and AIDS (Swadener, Kabiru, & Njenga, 2000). The demand for early childhood development (ECD) services has increased considerably in Kenya as a result of:-
Changing family structures and lifestyles. The number of extended families continues to decrease, and more par-ents are working outside the home. Many households are headed by single parents, primarily mothers or grand-mothers; one third of rural households are headed by women (1) (Adams & Mburugu, 1994).
These rural households, as well as those on agricultural plantations and in some urban areas, have the greatest need for alternative child care. Mothers are away from home most of the day, often having no choice but to leave their children without adequate care (Njenga & Kabiru, 2001).
Child AbuseCases of child abuse are on the increase in Kenya, in contrast to the past where child protection and care took the centre stage both in families and the community. Most child abuse cases are committed by trusted adults with parents among the most offenders. A study by CSA (2003), shows that 4.5% of sexual perpetrators were aunts and uncles and 2.8% were parents, while 10% of physical abuse cases are by fathers. A survey on child abuse in Kenya by African Network for the Prevention and Protection Against Child Abuse and Neglect (ANPPCAN) (as cited in Mwiti, 2005) indicated that 7.6% of the respondents aged 9–17 had been sexually abused in Kenya. Cases of abuse in the country reflect what is happening in the family. Families are interpreters of societal values, rules and behaviors (Lawson, Lawson and Rivers, 1996). Whatever happens in the family reflects the society. Young people also learn values, rules and behaviors from the family.

213Institute of Economic Affairs
Child abuse can occur in any family set up though teenage, child–headed, granny–headed and single headed fami-lies are more vulnerable to incidences of child abuse. This is attributed to high stress levels associated with parents and caregivers in these families. Most of the problem behaviours among young people have the root cause from the family history of child abuse. The physical, psychological and social impact of abuse can have far reaching consequences including family formation latter in life.
Abused children may turn out to be delinquent involving themselves in drugs, alcohol, running away from school and having suicidal tendencies (Mwiti, 2006). Mwiti (2005) also lists stunted maturation, low self esteem and depression as the effects of child abuse. Families can have positive or negative impact on youth development. This is reflected in their leisure activities, programmes they watch on television, the kind of people they communicate with through social network, how they take care of their physical needs, how they handle their sexuality, drug use patterns and attitude toward school and work and in life.
Suicide and Suicidal TendenciesThere is an alarming high rate of attempted suicide among young people in Kenya. For males it has been recorded at 6.8%, and 10% for females having attempted suicide atleast once (CSA 2003). Suicide is associated with de-pression and hopelessness. Events found to be instrumental in precipaitating suicide attempts include break–up of an important relationship, parental rejection, feelings of isolation, extreme pressure at home or at school or “copy-cat; behaviors (Gills, 1996). Young people in Kenya are worried about thier welfare and the support, contracting HIV and AIDS, getting pregnant and being sexually or physically abused (CSA, 2003). Some of the issues in the family that can also affect the youth are: absent parents; lack of emotional care and love; divorce; not knowing their biological fathers; poverty; substance and alcohol use by the parents; physical and sexual abuse; death of par-ents, HIV and AIDS in the family; rejection; marital discord; lack of guidance and discipline at home; and family violence. Young people engage in anti-social activities as a coping mechanism or to get attention (Mwiti, 2005).
Substance Use and AbuseA baseline survey by National Campaign against Drug Abuse (NACADA) on substance use and abuse among the youths in Kenya found out that Kenya is undergoing rapid social and economic changes that encourage substance use (NACADA, 2001). The study identified majority of the young people, who abused drugs as those in second-ary schools and colleges mainly from rich or middle–class families. Substance use and abuse is prevalent in both rural and urban areas.
The risk of exposure to drug use was associated with parents’ level of education, occupation and residence. Young people in urban areas and those with educated parents are at a higher risk of exposure to drugs than those in rural areas whose parents have no education. The risk factors are probably determined by affordability and avail-ability. The educated parents are likely to be wealthy and so can afford to give their children money. This shows the impact of socio-economic status of the parents on drug use patterns and the impact of urbanization on youth development.. It could also be a reflection of modernism where some parents expose their children to alcohol and drugs or an indication that these parents are very busy with little or no time to monitor their children. Parental substance use and abuse is also a powerful influence in the young people’s substance use patterns. Alco-holics and addicts may ignore parenting and in some cases project their problems to children (Lawson, Lawson, & Rivers, 1996). Children at times mirror their parents’ behaviour in search for acceptance. Many young people under stress at home or school may take drugs or alcohol to boost their courage.
Risk Taking BehavioursRisk taking behaviours include early sexual activity, multiple sexual partners, unprotected sex, use of contracep-tive pills to avoid pregnancy, binge drinking and unhealthy eating habits, lack of adequate exercise and sleep and poor hygiene. Risk taking behaviors are associated with low self- worth. Self –worth can be defined as great respect for self. Mwiti (2005) attributes low self worth among young people to negative early experiences like

214Youth Research Compendium
child abuse, family instability and parental shortcomings such as alcoholism, divorce, separation and step – family situation, among other factors.
Young people are engaging in risk taking behaviors and health is a medium priority (see Sivi- Njonjo 2010). Obe-sity is becoming a problem with 40% of the young people in urban areas being obese compared to 20% in rural areas. Obesity is associated with unhealthy diet and lack of exercise, all pointing to parenting style.
Risky sexual behaviors such as multiple sexual partners, not using protection and early sexual activities not only lead to early pregnancies but also expose young people to HIV and STI infections. Early child bearing disrupts pursuit of education therefore limiting opportunities for socio-economic growth. Unhealthy sexual activity is a risk factor for HIV and AIDS.
Parents are shying away from the responsibility of teaching their children about reproductive health and so they rely on the media, religious institutions and peer to pass on this kind of information to their children. This attitude started during the colonial period when teachers were expected to give both academic and social instruction to their students, leading to some disconnect between parents and their children
Lack of sexual and reproductive health information and poverty are some of the factors contributing to early sexual activities and teenage pregnancies. Commenting on early pregnancies in Western Kenya, Otieno, (2011, August 30: pp 18 -19) gave poverty, lack of role models and being enticed with money as some of the reasons for early sexual activity and pregnancies.
Indiscipline, Crime and ViolenceYoung people are involved in high levels of indiscipline in and out of school (NPI-A, 2009). There is a marked decline in the level of dicipline and good manners among the youth Simatwa (2010), notes that students with low levels of academic drive were the ones who lead strikes in learning institutions. Academic drive has been associ-ated to emotional stability of the learner and the role a parent plays in the education of the child. Low academic drive could be as a result of poor links between students, teachers and parents, translating to behaviour problems.
A crime survey in Nairobi in 2002 indicates that youth deliquency and crime is a major problem (UN Habitat, 2002). The study showed that young people were mainly arrested due to theft, assault, drug possession, mugging and manslaughter. A survey in Kenya prisons indicates that most of the prisoners had unstable family backgrounds (KDHS, 2010). Mwiti (2005) believes that many youth make bad choices at every available opportunity because they were never allowed to make bad choices in a protective environment. With a stable family environment young people can be supported to make right choices in life.
Most young people have positive attitudes toward life depite the type of family they come from. Some of the posi-tive aspects of youth development are value for education and entrepreneurial skills. Education is highly valued in Kenya as an important means to achieving economic opportunities and social mobility. According to CSA (2003), majority of young people desire careers in disciplines such as law, medicine and engineering. However most of these young people do not achieve their dreams due to dropping out of school. Only 22.2% of eligible student join secondary school (Ministry of Education, 2000). Inability to pay school fees is one reason for dropping out of school.
Youth Policies and ProgramsPeople, programs and institutions involved in youth development are working toward positive results in the lives of youth. Some have clearly defined these desired positive results—or outcomes—in an attempt to more effectively work toward them.
Youth developmentYouth development is not a highly sophisticated and complicated prescription for “fixing those troubled kids.” Youth development is about people, programs, institutions and systems which provide all youth—”troubled” or

215Institute of Economic Affairs
not—with the supports and opportunities they need to empower themselves. For a nation like Kenya with such a rich diversity of youth, this requires youth development in all shapes and sizes:
• An adult who volunteers time to mentor or tutor a young person (Home)
• A school that partners with community-based organizations to keep its doors open until 10 pm and provide all youth a safe, supervised place to be with homework support, activities, physical and mental health ser-vices (School & Home)
• A leadership development program that offers rival gang members neutral territory where they can relate to one another as individuals and build skills (Community)
• A city government that engages youth in the policy making process through youth councils and youth posi-tions in government departments (Nation)
• A religious institution that provides youth access to computers and the necessary training (Church)
• A local business which employs youth in meaningful and relevant work (Institutions / organizations).
These in addition to the important national youth serving organizations like Boys and Girls Clubs, 4-K, Boy and Girl Scouts are a sampling of the myriad types of youth development supports and opportunities which all too few youth are able to take advantage of. The challenge is to make such supports and opportunities the rule rather than the exception for all youth.
There are many efforts to define the outcomes of youth development, and while language may differ from place to place most express the results that most people want for their own children. These outcomes include but move above and beyond the academic skills and competencies which are the focus of most schools. They include:
Aspects of Identity Areas of Ability
A Sense of Safety and Structure High Self-Worth and Self Esteem Feeling of Mastery and Future Belonging and Membership Perception of Responsibility and Autonomy A Sense of Self-Awareness and Spirituality
Physical Health Mental Health Intellectual Health Employability Civic and Social Involvement
People, programs and institutions who work with youth are engaged in youth development if there is strong evi-dence of the following practices:
Supports: Motivational, emotional and strategic supports to succeed in life. The supports can take many different forms, but they must be affirming, respectful, and ongoing. The supports are most powerful when they are offered by a variety of people, such as parents and close relatives, community social networks, teachers, youth workers, employers, health providers, and peers who are involved in the lives of young people.
Opportunities: Chances for young people to learn how to act in the world around them, to explore, express, earn, belong, and influence. Opportunities give young people the chance to test ideas and behaviors and to experiment with different roles. It is important to stress that young people, just like adults, learn best through active participa-tion and that learning occurs in all types of settings and situations.
Quality services: Services in such areas as education, health, employment, and juvenile justice which exhibit: (1) relevant instruction and information, (2) challenging opportunities to express oneself, to contribute, to take on new roles, and be part of a group, and (3) supportive adults and peers who provide respect, high standards and expectations, guidance and affirmation to young people.
Youth development is a relatively new theme in Kenya and, as such, there are few programs devoted to this issue. Both the government and non-state actors play an integral role in youth development.

216Youth Research Compendium
Government: The Youth Division of the MGSCSS takes the lead on youth issues, having prepared a Youth Policy in 2003. Other government agencies with a role to play in youth policy include the Ministry of Education (general education and vocational training), the Ministry of Labour (youth employment), the Ministry of Planning and Na-tional Development (population, sexual and reproductive health education, and adolescent reproductive health), the Ministry of Health (health and HIV and AIDS issues), and the Ministry of Transport and Communication (information and communication technology). Each of these ministries has developed policies related to young people. What is consistent across all of these agencies is that they are all finding it difficult to translate their policies into actions partly because young people’s issues cover so many different sectors.
Non-state Actors: Besides the government, non-state actors, including NGOs, the private sector, faith-based in-stitutions, and communities play a role in youth development. NGOs, for example, have been involved in provid-ing education, training, and health care. The private sector and other non-state actors play a significant role in providing education in Kenya from the early childhood to the tertiary level. Most hospitals in the national health system are run by the private sector or faith-based institutions. Many NGOs are involved in providing sexual and reproductive health education and services, and some are now making efforts to provide financial services and ICT services targeted to young people.
Youth-led Groups: Young people have also formed groups to act on their own behalf. These groups are involved in income-generating activities, recreation, education, and advocacy and awareness (for example, about environ-mental conservation and HIV and AIDS prevention). These groups play a positive role in the lives of young people, including being a source of information, giving them a sense of belonging and self esteem, and helping them to feel empowered through their collective action.
Principles, Approaches, and DirectionsGiven the importance of youth development in the context of Kenya’s future, policymakers need to take urgent action to move the youth development agenda forward.
Actions are required from the macro level (by improving public institutions such as the educational system, the public health care system, and changing socio-cultural norms and values) to the micro level (promoting supportive families, communities, neighbourhoods, and local institutions and organizations for youth development). Because youth development is a new issue, little in the way of empirical evidence is available on best practices in terms of approaches and interventions. Lessons from international experience, however, suggest that youth programs should be based on the following principles (see Barker and Fontes, 1996, James, 1997 and 1999, and Holland, 2005).
a. Ensuring the presence in young people’s lives of caring, knowledgeable adults (parents, teachers, mentors, community members, and program directors) or other trained individuals who understand and care about young people, and who can provide support to them over the long-term.
b. Setting high standards and expectations for the young people themselves, which means guiding their behav-iour and insisting that they take full personal responsibility for their actions.
c. Providing young people with a sense of community.
d. Helping young people acquire and keep jobs, including connecting them with jobs and employers, encour-aging them to pursue their goals and succeed at work, and mentoring and training them while on the job.
e. Looking at young people as an asset rather than as a problem to be solved because they will behave accord-ing to the expectations that are placed on them.
f. Devising a comprehensive approach to youth development that considers the complex nature of the chal-lenges faced by young people rather than adopting\ many piecemeal activities.
g. Understanding that young people are comprised of many subgroups with very different needs. For example, very different approaches are necessary to deal with those young people who are already engaged in risky behaviour and are no longer linked to formal institutions (like schools) than to deal with young people who have some protective factors in their lives.

217Institute of Economic Affairs
h. Focusing on prevention rather than mitigation because it is more cost-effective and because it saves many young people from falling into lives of poverty and suffering. However, given the Kenyan context and the issues identified in this study, youth development should also follow these additional key principles:
• Focus on Youth Participation: Changing attitudes about the appropriate role of young people in society and, in turn, providing them with real opportunities to participate and express themselves must be a fundamental principle of youth development, particularly in Kenya and other African countries that tend to value the elderly at the expense of young people. Encouraging young people’s participation in society and political life builds their self-esteem and gives them an opportunity to make a positive contribution to their communities, it also helps change the negative images associated with young people.
• Apply a Gender Dimension to Youth Development: Youth development is intrinsically linked to prevailing gender roles and expectations in that young men and women face different risks and opportunities.
• Use the Media to Reach the Masses: Using the media and social marketing –which draws on commercial marketing principles – has been highly effective worldwide in changing social norms and behaviour and meeting nutrition, family planning, and health objectives. In the case of young people, social marketing can be used to target the whole population or specific groups (for example, young people themselves or the parents of at-risk youth). In Africa, using the media, particularly the radio, to reach target groups with information has been found to be cost- effective.
Schools, Education, and the School-to-Work TransitionEducation is obviously central to youth development. While the government has made major efforts to improve the education system, much remains to be done, particularly at the secondary level where access and relevance continue to be key constraints. Moreover, schools can be a risk factor for children given the incidence of sexual abuse by teachers. At the same time, schools can be a positive force in the lives of young people as a place where they can interact and be socialized and that provides them with supportive teachers.
HIV and AIDS and Health ServicesAs in other African countries, HIV and AIDS is probably the most serious risk to young people in Kenya, and therefore swift and decisive action is being taken as follows:-
a. Integrate HIV and AIDS education in schools
b. Provide Youth-friendly health services
c. Facilitate Public health campaigns
Community and Neighbourhood Support for Young PeopleCommunity-driven development (CDD) is an important method for engaging and involving young people in mak-ing the decisions that affect their communities. Because Kenya has applied this concept in both urban and rural areas, it should be possible to reach a large number of young people through existing CDD programs.
Youth Institutions and OrganizationsYouth institutions and organizations can provide many benefits for young people. They give them a sense of be-longing and connectedness, provide them with positive role models and opportunities to learn, and engage them in activities with a social purpose (such as HIV prevention, conservation, peer education, and recreational and cultural activities). With this in mind, recommendations have been made towards:
a. Inter-ministerial Youth Committee
b. National Youth Service
c. National Youth Council

218Youth Research Compendium
Identifying and addressing policy gapsAtoolthatcanhelpidentifyandaddresspolicygapsinyouthandfamilydevelopmentisusingDurlak&Weissberg’s model below. There are threemajor parts that emphasize settings for interventions,Interventionfocusintermsofindividualorsystem-levelchangeandtypesofoutcomestoconsider.
Figure 56: Conceptual framework illustrating how the promotion of competencies at the individual-level and system-level changes lead to desired youth development outcomes (Durlak & Weissberg, 2007).
Interventions occur and vary in their goals and scope in three different contexts namely, family, school and community. The first desired outcome of PYD interventions is enhanced social and emotional competencies which are mediators of ensuing changes in later behavior and functioning.
The personal and social competencies frequently targeted in programs include self-awareness, self-management, social awareness, relationship skills, and responsible decision-making (Collaborative for Academic, Social, and Emotional Learning, 2003). Depending on the intervention’s intent, youth with enhanced social and emotional competencies should do better in school, demonstrate more pro-social behavior, have more effective peer and adult relationships, and show fewer negative outcomes (Greenberg et al. 2003). While having in mind the environmental influences and changes, interventions can emphasize individual-level change by working directly with the youth.
Unfortunately, not all family, school and community environments are termed as conducive for positive development for some youth. In order to curb this, change in the settings that support and reinforce competencies should occur so that the social settings that shape youth’s lives become more favorable to personal growth and development.
Many different outcomes such as positive changes appearing in personal, social and academic areas amongst the youth may result due to the intervention. According to research, there are system change variables. Systemic change attempts to change the roles, behaviors, and relationships among members of one or more social systems. This involves efforts to adjust the organizational structure and daily practices of the relevant system or group for example school, family, and attempts to forge synergistic links or connections between one or more systems.
School-oriented system changes focus on school-wide change, changes in classroom organization and routine and psychosocial environment of classrooms and the entire school.

219Institute of Economic Affairs
School-wide change: Involves all school staff in promotion of positive youth development. The management and school staff should work as a team to re-examine different aspects of school policies and routines, assess local needs and resources, develop strategic plans, and initiate and monitor development efforts.
Changes in classroom organization: This can be done by modifying daily routines and practices. Several programs trained teachers in proactive methods of classroom management, which refers to a comprehensive set of strategies for establishing and maintaining an orderly, cooperative, and productive learning environment that fosters appropriate student behavior and investment in learning, and prevents behavioral disruptions (Gettinger, 1988). In other cases, classroom change involved the formation of student work groups for special social projects, or classroom-wide meetings and new procedures addressing special topics such as conflict resolution or bullying (Kenney & Watson, 1996).
Psychosocial environment: An affirmative psychosocial environment can be formed by creating a positive, engaging and caring classroom. This can be attempted through classroom, small group or school-wide events, creating student task groups, or special projects and exercises designed to promote more opportunities for positive student-to-student and teacher-to-student communication and support. Youth’s perceptions of interpersonal relationships, opportunities for personal development, and system maintenance and change in their psychosocial environment are correlated to certain desirable positive outcomes. These can include high self-esteem, better academic performance and increased educational interest and commitment and avoiding risky and/or unhealthy behavior.
Family-oriented system change involves changing parenting practices and/or family environment. The implementation of training sessions in order to enhance parents’ understanding of normal development, increase their sensitivity to their child’s needs, and to improve their childrearing practices, should be carried out through such tactics as consistency of discipline and limit-setting, increasing the use of praise and attention, and decreasing the use of punishment and criticism.
Community-oriented system changes can be characterized by forming connections with pro-social adults. Forging connections between youth and adults emphasizes the relational structures of social systems. Extensive research data support the notion that the existence of trusted adults who can be protectors, advisors, role models and skill-builders can be an important influence at all stages of a young person’s development (Catalano et al., 2002; National Research Council & Institute of Medicine, 2002). Such connections can be attempted in mentoring studies for youth, after-school programs, recreational and social activities led by adults.
Although psychosocial solutions in many areas may give predominant weight to individual-level as opposed to system-level change (See Figure 1), the situation is more balanced in the Positive Youth Development. PYD challenges the recognition of the importance of improving the major social systems that affect youth. Attempts at systemic change are most commonly exemplified by programs seeking to improve aspects of a school’s psychosocial climate, to enhance the family environment or modify parenting practices, to connect young people to pro-social adult models through mentoring relationships and after-school programming, and to forge connections between families, schools, and CBOs (Durlak & Weissberg, 2007).
The National Longitudinal Study on Adolescence of the National Academy of Sciences, which looked at both risk and protective factors as they relate to adolescent health, analyzed the role of the family in youth development. This study found that “family connectedness,” defined as caring support and a consistent emotional bond, is a significant protective factor for youth.1
Community provides youth with the supports and opportunities they need along the way. Thus, youth development is also a process in which family and community must actively participate
Building Quality Community-based youth developmentAccording to the framework below, the long-term goals of community-based youth development initiatives are to improve the long-term life chances of young people:

220Youth Research Compendium
• To become economically self-sufficient,
• To be healthy and have good family and social relationships, and
• To contribute to their community.
The issues facing Kenya’s young people are vast and complex but they are not insoluble. Young people constitute a vital human resource that needs to be tapped. In the final analysis, when we develop Kenya’s young people, we are developing Kenya’s future. The importance of investing in young people is well summarized in the following excerpt from a World Bank Social Development Paper, “Investing in Youth Empowerment and Inclusion” (World Bank, 2004c).
“Everywhere from Kabul to Nairobi to Tirana, young people desire more access not just to job opportunities, but to a better quality of life, including leisure, information and entertainment. Everywhere they resent being margin-alized in decision-making processes and are eager to have greater control over their lives. Unless these gaps are addressed, conflict, violence, and a missed generation for global development will be the costs of neglect that more developed societies will also pay one way or another…”
Many psychologist researchers have focused on the primary agent of socialization, the family, in their search and explanation for behaviour that violates social norms as was experience during the post election violence and con-tinue to manifest daily in Kenya. McCord and McCord (1964) concluded, on the basis of literature reviewed that lack of attention and severe parental rejection was the primary causes of such behaviour.
Other several studies are reported to have related such behaviour to parents’ inconsistencies in disciplining their children and in teaching them responsibility toward others, to physical abuse and parental loss (Marshall & Cook-ie, 1999; Jojnson et al. 1999). It is also indicated, the fathers of psychopathologic children are likely to be similar in their behaviour. In addition, several aspects of family life were found through research to be consequential. Both
inconsistent discipline and no discipline at all predicted behaviour that violates social norms.<?>Resnick,MichaelD.etal.(1997)Protecting Adolescents from Harm: Findings from the National Longitudinal Study on Ado-
lescent Health. Minneapolis:AdolescentHealthProgram.
Figure 57: Possible paths related to youth and family development

221Institute of Economic Affairs
Strategies Individual and family resource managementFamily strengthening in youth development provides guidance to policymakers and practitioners about ways to increase the likelihood that young people will become successful adults.
Public and private funders and youth organizations This can build neighborhood infrastructures that enhance the development of young people by bringing together community programs, schools, peers, neighbors, and, especially, family members. Connecting and focusing these efforts so that they are collective, cumulative, and consistent strengthens the resources available for young people. Other contributions to the field have emphasized the relationships between families and their communities and the ways that these connections can strengthen families’ capacities to help themselves.
Importance of “family capital”This includes “the resources and capacities families use inside the family and those it exercises in its social relations with others.”2 She argues that comprehensive strategies must connect interventions in the family to the commu-nity, and vice versa.
“Collective parenting” for the social networks and community resources These contribute to effective parenting, because families are stronger and youth receive more support when com-munity institutions and families share common values and expectations of youth. In neighborhoods defined as “dangerous,” families need to create broader networks of support in order to be successful in the role of parenting. In this context, youth organizations are an important resource for families.
The Economic Divide This has widened for families in Kenya. The situation is such that the rich are getting richer and the poorer are getting poorer. Personal savings rates are low and few have adequately prepared to achieve financial goals to fund higher education, retirement, and long-term health care. The fiscal products and services industry, together with the high-speed changes in technology, information availability, and public policy have become complex, there-fore demanding a financially literate consumer. Financial security contributes to emotional stability in families, strengthened communities, and a nation better able to leave a thriving economic legacy for the generations to come. Managing money effectively to meet present needs and future goals is a skill that has to be learned by the family. By doing so, the capacity to establish and maintain economic security is strengthened.
Community economic development creates jobs so individuals have money to manage. Money decisions for fami-lies have psychological and sociological impacts as well as economic ones. Financial security is the ability to meet future needs while keeping pace with day-to-day obligations. Preparation for potential long-term care costs and potential retirement entails careful planning, saving, and debt control in the family financial setting. This will help improve financial behaviors leading to financial security in the future, increase economic vitality and quality of life of families and the community as a whole. Youth are affected directly and indirectly by poor family resource management. Youth living in low income regions such as Kibera and Kibagare slums in Nairobi feel the impact of unsafe housing, poor health care, high crime rate, and general overcrowding. Families are encouraged to:
• Plan for retirement and potential long-term costs,
• Act to save and invest. For example the old mutual fund.
• Evaluate to assure actions are on track to achieve financial goals.
2 Ooms, Theodora. (1996) Where is the Family in Comprehensive Community Initiatives for Children and Families? Washington D.C.: Family Impact Seminar.

222Youth Research Compendium
Ecological Counseling Ecological Counseling states that the person is inextricably situated within radically specific and interdependent ecological systems. Additionally, the individual carries particular capacities, limitations, temperaments, preferenc-es, symbolic representation systems and personal historicity through the varying environmental settings in which the person lives. The interactions between the person and environment result in the construction of the individual ecological niches. These niches are what we experience as our world.
Ecological counseling seeks to understand people’s ecological niches and assist them to live a satisfying life. This is accomplished by improving one’s interactional quality, or concordance, through counseling intervention at both the personal and environmental levels.
Ecological Counseling has implications for clinical counseling practice, counselor training, group work, career counseling, social service delivery, research, social justice initiatives, community intervention, consultation, super-vision, and human growth & development.
ConclusionUnlessthereis positive parenting practices put in place, the future trends are likely to see counselling rooms fre-quented by what is known as the identified patient from families, either as a problematic child both in the family and school. Parenting cannot be delegated, as seems to be the emerging trend from parents. Teachers and school authority including religious instructors will not provide the quick fix that parents are expecting. The burden placed on these institutions is overwhelming and to say the least, unrealistic.
Helping youth toward positive development requires concerted effort from families, the community, public and private organisations. The “Collective parenting” makes families stronger. Young people receive more support in their development when community institutions and families share common values and expectations of youth.
Although political and harsh economic challenges have some adverse social effects ion Kenyan families, leaving young people with scars of these changes, there is hope if programmes and intervention measures target the family as the main social fabric of the society. Health families produce health young people.
ReferencesAffairs, I. o., & Development, S. f. (2001). Kenya at the Crossroads; scenarios for our future. Nairobi: Institute of Economic Affairs.
Africa, N. P. (2009). A Review of Challenges Faced by Kenyan Youth: Peace Agenda in Youth Development. Nairobi: NPI- Africa.
Bongaarts, J. (2006). Late Marriage and HIV Epidemic in Sub- Saharan Africa. No. 216. New York. Population Council, Inc
Coalition on Child Rights Protection in Kenya (2002). Nairobi. The African Network for Prevention & Protection against Child Abuse and Neglect
Committee on the Rights of the Child, 44th Session: Response by the Government of Kenya
Communication Commission of Kenya: Report on Internet Market Analysis Study May,200. Retrieved from http/www.cck.go.ke/htm/tel. June 2007
Corsin, A. (1996). Concise Encyclopedia of Psychology. 2nd Ed. New York: John Wiley & Sons
Centre for Justice and Peace Building (CJP) 2006: Youth STAR: When Violence and Trauma Impact Youth: Facili-tators Manual. Harrisonburg, The Practice Institute, Eastern Mennonite University

223Institute of Economic Affairs
Dobson, J. (2007). The New Hide and Seek. Grand Rapids. Baker Publishing Group.
Erulkar, A. (2006)- Seeds: Tap and Reposition Youth(TRY): Providing Social Support, Savings and Microcredit Opportunities for Young Women in Areas with HIV Prevalence. New York. Population Council.Gichinga, E. M. (2007). Counselling in the African Context. Nairobi: Don Bosco Printing Press
Gillis, H.(1996). Counseling Young People. Pretoria: Lynn Publications.
Government of Kenya [GoK]. (1989). Demographic and Health Survey 1989. Republic of Kenya: National Coun-cil for Population and Development and Ministry of Home Affairs and National Heritage.
Government of Kenya [GoK]. (2007). Kenya Vision 2030. Nairobi: Kenya
Government of Kenya [GoK]. (2007, August). Kenya Integrated Household Budget Survey – 2005/06. Nairobi: Kenya National Bureau of Standards
Government of Kenya [GoK]. (2010). Kenya Demographic and Health Survey 2008-09. Nairobi: Kenya
Goldenberg, I & Goldenberg, H. (1996) Family therapy. An overview. Pacific Groove. Brooks/Cole Publishing company
Help Age International (2008).Regional consultative Meeting Report on social Protection and HIV and AIDS.
Jaldesa, W. G, Askew, A, Wanjiru, M (2005). Female Genital Cutting among the Somali of Kenya and Manage-ment of its Complications. Frontiers in Reproductive Health. Population Council
KCDF (2008). Annual Report 2007/2008: Reclaiming Kenya: The Power of Communities
Kikech, B & Kebaya, C ((2010). Department of English & Linguistics. Kenyatta University Nairobi. Technology and Family RelationshipsKinyanjui , M. N & Gichui , W( 2010). Institute for Developing Studies and Population Research Institute.Univer-sity of Nairobi. Kamweretho: Voices from Below and the Politics of Motherhood in a Developmental Context.
Kimani E.N & Kombo, K ( 2010). Department of Gender and Development and Department of Educational Foundations, Kenyatta University. Challenges Facing Nuclear Families With Absent Fathers in Gatundu North District, Central Kenya
Kyomo, A. A., & Selvan, S. G. (2004). Marriage and Family in African Christianity. Nairobi: Action Publishers.
Lawson, W.G., Lawson W, A., & Rivers, P.C (1996). Essentials of Chemical Dependency Counseling. Maryland: Aspen Publishers. Lawson, D & Brossart, D (2001). Family Process: Intergenerational transmission. Individuation and intimacy across three generations. Retrieved June 25, 2004. Http://www.findarticles.com/cf
Maxmen, J.S & Ward, N.G (1995). Essentials of Psychopathology and its Treatment. 2nd Ed. New York. W. W. Norton & Company
Mberengwa, L. R. (2010) “African Family Structures and Values that Continue to Contribute to their Survival and Wellbeing”
Mbevi, S (2009). Gideon’s Action: Praying Effectively for Our Families. Nairobi. Ascent Ltd.
Ministry of Education (2002): Secondary School Enrollment Report

224Youth Research Compendium
Ministry of Education (2007): Elimu News Letter Issue No. 2
Ministry of Planning & National Development and Ministry of Health (2003). Adolescent Reproductive Health: Development Policy
Minuchin, S. (1974). Families and Family Therapy. Massachusetts: Harvard University Press
Murithi, N. Mugenda, M.O and Ngige, W. (2010). Department of Community Resource Management and Exten-sion, Kenyatta University). Factors Associated with Cohabitation Among University Students In Nairobi, Kenya.
Mwiti, G. (2005). Moving on Towards Maturity. Nairobi: Evangel Publishing House
Mwiti, G. (2006).Child Abuse, Prevention, Detection and Counseling. Nairobi: Evangel Publishing House
Mwiti,G. and Aldueck, (2006), Christian Counseling: An African Indigenous Perspective. California: Pasadena, Fuller Seminary Press.
Mwiti, G. (2009). Crisis & Trauma Counseling: A Community – Based Approach for Resiliency Reconciliation and Renewal. Nairobi. Evangel Publishing House
NACADA, (Draft Report 2001): National Baseline Survey on Drug and Substance Abuse Among the Youth in Kenya
NPI- A (2009). Peace Agenda in Youth Development: Nairobi Peace Initiative Africa.
Sivi-Njonjo, K. (2010). Youth Fact Book: Infinite possibility or definite disaster? Nairobi: Institute of Economic Affairs Oasis Africa (2007), A Rapid Assessment on OVC Psychosocial Support Services Provided by CAP Kenya Grant-ees. Nairobi
Ondigi A, N. & Mugenda, O. (2010). “Psychosocial Determinants of Quality of Life among Kenyan Families” ). Community Resource Management and Extension, Nairobi, Kenyatta University.
Otieno, J. (2011, August 30). Easy but Rough Road Child Mothers Take. The Standard pp 18 – 19
Plan (2008). Learn without Fear: The Global Campaign to end Violence in Schools. Working Plan. Chobham House, Christchurch Way. Plan Limited
Richler, L and Sherr, L. ( August 2009). Psychological and Social- Medical Aspects of AIDS/HIV: The Joint Learn-ing Initiative on Children and HIV/AIDS (JLICA). Strengthening Families – Learning Group 1. Vol, 21 Number S
SAfAIDS(2009). Redifining Child Rights within a Cultural Framework in the Era of HIV: Engaging Communities in the Exploratory Dialogue: Uzumba and Maramba Community Dialogues Study. Pretoria
Simatwa, J. O. (2010). ‘The Role of Guidance and Counselling in Promoting Student Discipline in Secondary Schools in Kenya: A Case Study of Kisumu District. Educational Research and Reviews.5 (5): 263-272.
The Proposed Constitution of Kenya, 6th May 2010, Nairobi Government Printer.
Tumuti, D.W (2010) “Issues in Family Formation and Family Structure in the Contemporary Kenyan Society: Implication to Marriage and Family Counseling”, Nairobi: Kenyatta University.
Turner, S. J, and Helms, B. D. (1995). Life Span Development. Fifth Edition. New York: Harcourt Brace College Publishers

225Institute of Economic Affairs
UNICEF (2004). Africa’s Orphaned Generations. UNICEF HIV/AIDS Unit, the United Nations Children’s Fund, New York
UNICEF(2004). The Frame Work for the Protection, Care and Support of Orphans and Vulnerable Children Liv-ing in a World with HIV/AIDS. UNICEF and UNAIDS
UNICEF (2007). Promoting the Rights of Children with Disabilities. Innocenti Research Centre
UNICEF (2006). The Extent and Effects of Sex Tourism and Sexual Exploitation of Children on
UNICEF (2008). The State of Africa’s Children: Child Survival
UN Habitat (2002). Youth and Crime in Nairobi
Wasanga, C & Maingi, L.W (2010). “The Role of African Traditional Cultures in Family Formation and the Ef-fect of Modernity on Family Strength”, Department of Psychology. Kenyatta University, Nairobi.
Wamue, G, N. & Njoroge, N. W (2010). The Impact of Gender Paradigm Shift within the Family Structure in Kiambu. Department of Gender and Development Studies. Nairobi: Kenyatta University. Unpublished.
Wilson, S. N (2010). “Diverse and Changing Families of Contemporary Kenya: Historic, Extant, and Emerging Structures and Patterns.” Unpublished

226Youth Research Compendium
Youth and Politics: Generational Missions8Dr. Mshaï Mwangola
Abstract22
Each generation, out of relative obscurity, must discover its own mission; fulfil it or betray it (Frantz Fanon)The cliché that has characterized the speeches of post-colonial era Kenyan government leaders with regard to the nation’s youth more than any other is ‘‘youth are leaders of tomorrow’’. In the last three decades and until fairly recently, youthfulness was generally performed in the public sphere as a negative when it came to the question of political leadership. Kenya as a country has had an established trend requiring one to make a name elsewhere before making a plunge into politics. For most of the first four decades of the post-colonial period, one could be forgiven for assuming that for youth, the present exists in the passive tense, functioning purely as a transitory period to a future in which they can actually begin to participate in society. Thus, the challenge of understanding Kenyan youth as active participants in society, and especially as significant players in politics, is one that has been largely ignored or superficially treated in reflections on Kenya. In political analyses, youth are considered most of-ten as societal burdens of one nature or another, who have to be accommodated or carefully ‘handled.’ There has been little change in attitude since cabinet minister Tom Mboya qualified the statement ‘‘youth are …important to the nation’’ with the observation, ‘‘their energies must be channelled to useful and productive purposes’’ (Mboya, 1963:54). For the first forty years after independence, Kenyan “youth remained on the periphery of the country’s affairs and their needs and aspirations were not accorded due recognition. They had been excluded from design-ing, planning and implementing programmes and policies that affect them and the country at large’’ (NYPSC, 2003:25). With the transition from one millennium to another however, an aggressive youth discourse emerged, that rejected prevailing perceptions of youth and demanded a re-configuring of the social roles and responsibilities of this category. This chapter examines the role of youth in the national political life of the Kenyan nation. It traces the evolution of current discourses that challenge understandings of youth as inherently incapable of offering sig-nificant leadership in the political realm. It affirms the importance of identifying historical continuums manifest in the present, suggesting traditions influencing the emergence of future youth generations in Kenya.
22Developedoutof“LeadersofTomorrow?TheYouthandDemocratizationinKenya”.Ithanktheeditors,GodwinMurunga,andShadrackNasong’oofthevolumeinwhichitappeared,Kenya:TheStruggleforDemocracyfortheirinputintothatchap-ter.ThischapterhasbenefitedfromnumerousdiscussionsforwhichIamgratefultodifferentcolleaguesassociatedwiththeCouncilfortheDevelopmentofSocialScienceResearchinAfrica.IalsoacknowledgetheinputoftheIEAYouthScenariosteam,especiallytheeditorofthisvolumeKatindiSiviNjonjoandmyfellowtrustee,JohnGithongo.

227Institute of Economic Affairs
Contextualizing Politics and the Principle of Generational SuccessionPoliticsI define politics here as the sphere of negotiation by conflicting perspectives on the management of a society. Youth can be considered in relation to this as the liminal life-stage of preparation before an individual or generation moves centre the political stage, assuming leadership in society as a result of proven ability to manage responsibil-ity on its behalf. This does not mean that youth cannot be politically influential. Indeed, this is the time when an individual or collectivity theoretically and practically defines, in the words of Frantz Fanon, a life mission that is commensurate with the historical realities and social context of its life, and prepares or is prepared (by others) to live it out. This preparation may take the form of apprenticeship to mentors or the assumption of particular tasks for the society under the direction, in consultation or with the guidance of those entrusted with societal authority. However, it is only when an individual or generation becomes dominant as a player on the political stage that this liminal life-stage comes to an end with the graduation of that person or collective to the social category of adult-hood.
The Principle of Generational Succession It is useful to think of tradition as the continuation of the past through the present to the future, not as the reten-tion of fossilized irrelevancies, but rather as the contextualized perpetuation of legacy. The repetition of significant elements with critical difference in deference to the changing historical context in which they occur allows the continuation of practices and processes that a society finds valuable. Thus tradition is not about “photocopying” the past in the present, but rather finding continuity of useful elements through the recognition of the lessons of lived experience in forging the future. An understanding of the past out of which the present has emerged enables a more nuanced appreciation of the alternatives for political engagement most feasible for Kenyan youth in the twenty-first century. In recognizing how specific practices are manifested within particular socio-cultural contexts, one can begin to identify commonalities through Kenyan history and recognize on today’s context what might be termed as “Kenyan” practice.
Of particular interest here is what I might define as the ceremonial passing of political responsibility of a nation from one generation to another. One of the nations incorporated into the new colony that would evolve with time into the nation-state of Kenya, the Agikuyu, provides an example of this practice in what was celebrated by the beginning of the twentieth century as Itwika, the ritualistic promulgation of a new constitution. In his ethno-graphic study Facing Mount Kenya, Jomo Kenyatta used this practice to cast British rule as inferior to that which they had replaced. Narrating the origins of the tradition, Kenyatta draws from collective memory to recount the overthrow of a despot by courageous youth, a political revolution culminating in the installation of a new govern-ment (Kenyatta, 1978: 187). A system of generational succession was instituted as a safeguard against a return to despotic rule. Thus, the original Itwika, a specific event, became the genesis for a ritual, the ceremonial handover of political power from one generation to another, said to occur every quarter century or so. Casting the British colonial policy of indirect rule as the unpopular and undemocratic imposition of a system of autocratic chieftaincy that effectively stripped people of their right to choose their own leadership, Kenyatta encouraged a similar chal-lenge to colonialism. He argued this would result in the revolutionary replacement of despotic colonial dictator-ship with ‘‘a new order where every section of the community would have a practical part to play in the people’s government’’ (Kenyatta, 1978: 19 8).
If this is an apt description of the promise of the cessation of colonial rule, it is equally true of the desire motivating political change in each of the eras of democratic transition since.1 Fundamental to the spirit of what the Agikuyu called ‘Itwika’ is indeed what many hoped a system of regular, “free and fair” multi-party elections, and more recently, a new constitutional dispensation, would guarantee: effective and efficient “changing of government in rotation through a peaceful constitutional revolution’’ (Kenyatta, 1978: 196). Itwika could therefore be described as a celebration of the concept of democracy that was instrumental in enabling the regular inauguration of a new generation of political leadership in the Agikuyu community. Other (ethnic) nations also conscripted into the new nation-state of Kenya would also, in their own way, inaugurate a new generation to take over the leadership of that nation after enacting a constitution that served as a covenant with the rest of the society. In some cases, this was
23Forfurtherexplicationonthedifferenterasofdemocratictransition,seeMwangola,“LeadersofTomorrow?”

228Youth Research Compendium
tied to a monarchical system, with the changeover becoming most apparent at the death of the old ruler and the installment of the new, although in some cases, a covert change of power might have already happened, sometimes severally, in the lifetime of a long-lived monarch. In others, where a system of shared power invested the same in a council of sorts, this might be only apparent gradually, when one might suddenly notice that the leadership of a council had changed, almost imperceptibly, so that the most influential voices in a council might differ, sometimes radically, over a period of a few months or years. The Agikuyu provide an interesting case study in that the marked transition of power from one generation to another was a social rite of passage for a generation as important as that of the individual graduating from one stage of life to another, with the political class entering into a covenant with the rest of the nation that was ritualistically invoked at the beginning of its term in office.
This system was, by no means, as idyllic in terms of representation as Kenyatta would make it seem in his account. Only a select number of individuals, generally males of a particular generation and social status were members of the council working out the details of each such constitution.24 While some members of the society participated in one way or the other in the selection of the leaders or council members, others were conspicuous by their absence, and had to accept unquestioningly those chosen for positions of leadership, regardless of whether or not they were representative or sympathetic to their interests. As in other democracies, there were those - young women in particular in this case - who were either invisible or erased from overt political influence. Still, if one thinks of democracy a verb in the subjunctive tense, as opposed to a noun denoting an ideal state of representation, it be-comes possible to see systems such as this as being democratic in the same way that Ancient Greece, for example, is considered by some to be the birthplace of contemporary systems of democracy. Once the transitional ceremony was completed, the governance of the nation passed on to devolved levels of government. The devolution of power transferred authority over specific sections of the community to a series of governing councils, giving voice in vary-ing degrees, and power over different spheres and in different ways to those not represented fully at these senior levels of government. Older women, for example, had their own council, with its own sphere of authority. Male youth, too, had a measure of responsibility in the Njama ya ita (the council of war) whose members were expected to ensure that the interests of all young people were taken into consideration in deliberations.
I have chosen to use as an example Kenyatta’s description of Itwika here, as it is perhaps the best-known example of the performance of pre-colonial Kenyan forms of democratic governance, due to the seminal place of Facing Mount Kenya as an academic auto-ethnographical study of an African people. However, it is only one example of enduring principles that make manifest political traditions as ‘a changing same,’ the past recurring in the present; what Margaret Drewal calls ‘repetition with a significant difference’ (Drewal, 1991). It illustrates the principal of generational succession in social and political leadership common to many indigenous communities, especially those preferring decentralized systems of government, which continues to influence practices and discourses of democracy in Kenya today.
The concept of generational groupings makes it possible to organize the society on the basis of social responsibility and rights. In theory, each generation, in itself made up of several age groups, passes through four distinct phases: child-hood, youth, adult-hood, and elder-hood.25. In child-hood, a generation has negligible influence on policy making, while in youth it is prepared for the responsibilities of leadership through the supervised performance of selected duties. In adult-hood it assumes the leadership of the nation through the performance of delegated author-ity, finally taking on in elder-hood, the ultimate socio-political authority, overseeing the smooth running of the nation. Comparatively few individuals ever attain the ultimate socio-political authority invested in the elder-hood.
24Thiswaspractically illustratedinearly2011bythelogicgoverningtheinviteestoameetingofeldersandleaderscalledbyhisson,UhuruKenyatta,todiscussthepolitical,economicandsocialfutureoftheAgikuyucommunity.Womenwereexplicitlybarredfromthemeeting.ProtestationslevelledattheconvenorsthatthisamountedtogenderdiscriminationwereparriedwiththeargumentthatthiswasinlinewithAgikuyucustom,whichprovidedforgenderedmeetings.Inthiscase,“custom”wasapparentlyconsideredasahistoricallystatictruism,inwhichAgikuyuwomenareapparentlynotdefinedaseithereldersorleaders.ThislogicdefiedthefactthatyoungerKenyattahadtakenanoathinhisroleasDeputyPrimeMinisterandamemberoftheCabinetofKenyatodefendaconstitu-tionthatexplicitlybannedgenderdiscrimination.AmongstthepoliticalleadersfromthiscommunityexcludedfromthemeetingonthesegroundswerefemalemembersofParliament,includingtheleaderofapoliticallyinfluentialpoliticalpartyandcabinetministers(one,aseniormemberofthewiderKenyattafamily).Iamnotawareofanysubsequentoccasionwherethe“women’sonly”meetingwasheldtocomplementthisparticulargathering.Journalists,bothmaleandfemale,werealsobannedfromthegathering–despitehavingreceivedofficialinvitationstocovertheoccasion.
25 Thesetermsareusedassocial,notbiological,terms.Thereiscertainlyarelationshipbetweenthetwo,although,asisarguedhere,onecanbebiologicallyamemberofonecategorywhilesociallythememberofanother.

229Institute of Economic Affairs
Those who do, even when they appear to exercise such authority only sparingly,holdamorallegitimacybeyondanymilitaryorothermight.Thereisanexpectationthatthosewholivelongenoughtodosowillhavelearnedtobalancetheaccruingrightsofsuchpowerwithasenseofresponsibilitytothenation.
By mandating a regular transfer of power from one generation to another at appropriate intervals, nations that used this political system made it difficult for socially irresponsible individuals or groups of people to accumulate too much power or entrench themselves in positions of political power. Generally, generations were offered the incentive of different and socially superior levels of authority and responsibility to motivate them to cede power when the time came to move on. They had to also ensure they had adequately mentored those who replaced them, since the latter were the ones they had to work most closely with to ensure the longevity of their own legacy.
Three important features of this kind of politics are worth noting here. First is the elevation of the group above the individual, although this by no means should be interpreted to suggest that the individual is irrelevant. This dis-tributes the responsibilities of governance amongst all those being entrusted with leadership, who were collectively accountable to and for the nation during the tenure of the term they were granted. Individuals can certainly attain positions of ‘first among equals’ in formulating, articulating, influencing or enforcing policy. However, the expec-tation was that they would then conform to the agreed vision. Secondly, different generations may be entrusted to carry out political or social action, bear political responsibility of the governance of the nation, and wield moral authority over the rest of the leadership; thus it is important to distinguish and identify which generation is so-cially attributed with each of these. Religious or moral authority (sometimes invested in the same individuals or institutions), is considered superior to political leadership; thus those in political positions or leading political or social action have to be careful to both respect those holding authority over them and perform ably so as to ensure their own graduation to these superior levels of leadership at the appropriate time. Finally, the event that ushers a generation into its era of responsibility is regarded as the inauguration of a covenant with the nation, not the pinnacle of its political era. The success of that generation in achieving its historical mission rests on the extent to which it translated that covenant into lived reality for the nation. This is the yardstick by which that generation is to be judged – and remembered – in the future.
This generational principle continues to be an important aspect of Kenya’s post-colonial period. In reality, there is discordance between the theory and lived experience. However, as is demonstrated below, it has significantly influenced the role of youth in contemporary Kenyan politics. Frantz Fanon (1963) argues the importance of the identification of a specific historical mission for different generations within the post-colonial context, stating that “each generation must, out of relative obscurity, discover its mission; fulfil it, or betray it” (Fanon, 1963:169). A generational mission is determined by the historical context in which it exists. It emerges out of the realities, chal-lenges and dreams that characterize the lived experience of the era and is the articulation of a collective strategy in response. Fanon (1963) does not suggest that every individual within a particular generation has to conform to that mission, or be committed to its success. Indeed, that is the first challenge for a generation – recruiting the critical mass of members to identify possibilities and then agree on a single historical mission, and finally, commit to strategies for its fulfilment. At any one of these three stages, it is possible that a generational mission may abort; hence Fanon’s warning of potential failure.
A generation may struggle with identifying its mission, or with agreeing on a strategy, or in finding enough com-mitment amongst its members to fulfil it. Certain individuals may be instrumental in proposing, articulating, and leading each peer group in carrying out the agenda that successfully fulfils the generation’s historical mission. It is however the active commitment of a critical mass of people to the agenda of translate an agreed-upon mission that enables a generation to translating the theory into the lived experience that determines its historical success or failure as a generation. The critical mass does not have to even be in numerical majority; individuals or significant groups within the generation may oppose or abort the historical mission identified with its cohort. This is what raises the dramatic tension of a generational narrative. The reality of the possibility of intentional or accidental betrayal gives each generation its historical imperative for the definition, articulation and implementation of its mission.
This chapter shall engage the efficacy of different Kenyan youth generations in meeting Fanon’s challenge. As it is a study of generations in the life-stage of youth, the focus in each case shall be on the period before the ceremonial

230Youth Research Compendium
rite of passage event that ushers it into the next stage – that of the political responsibility of adult-hood. It will also reflect on the ways in which particular elements recur as tradition in shaping generations within this liminal life-stage, and on the influence that each generation has on those that come behind it.
Looking Back: A Kenyan Political TraditionThe imposition of colonial rule in Kenya resulted in the systematic erosion of all existing forms of democracy. The colonial authorities operated from the basic assumption that all African forms of governance were primitive at best and non-existent at worst, and they made every effort to replace such political systems with what they thought of as ‘civilized rule.’ The first two decades following the imposition of colonial rule in this region through the creation of a new political entity named the East African Protectorate in 1895 were dominated by a final wave of localized resistance to the new British administration. This was also in effect, a futile battle to retain the political status quo. One cannot talk about Kenyan politics until a foundation for a shared identity that accepted a different political reality had been established and the majority of its people—those now bearing the identity of Kenyans—began to develop this larger notion of a shared community that transcended ethnic boundaries. This period is significant because it established a foundation for the development of an endogenous political culture.
From the very establishment of the country, youth were important participants in the politics of what would be-come the Republic of Kenya, engaging the state in three different ways: outright resistance, measured cooperation, and unquestioned allegiance. There were those who led resistance efforts against the invading colonial forces, sometimes without waiting for the express direction of their elders who were the governing authority. Others, recognizing the futility of direct opposition, co-operated with local communal authority in negotiating the balance of power under the new system imposed by the colonial state in an effort to reconfigure the political dynamics of the day to their personal or collective advantage. Still others seized the opportunity to shift their allegiance from communal to colonial authority, aware that the latter would facilitate the by-passing of the strictly regulated po-litical hierarchy for those it deemed useful to its own interests. However, as this transitional youth generation was born in the pre-colonial era when Kenya was yet to be imagined into being as a distinct entity, this chapter will concentrate instead on its successors: the youth generations of the colonial and post-colonial eras.
The Colonial Era Youth GenerationsThe East African Association Generation (EAAG)The consolidation of colonial rule saw the gradual erosion of the majority of existing indigenous political systems, gradually affecting other sectors of the social infrastructure. As a social category, the seminal colonial-era youth generation - those who were born as British rule carved a colony out of diverse nations - were the first to live out fully the everyday consequence of empire, subject to a colonial reality whose centre considered them marginal peripheries. They were the first to experience the bewildering clash forcing a life-choice between indigenous and colonial systems of governance, education and religion, with far-reaching consequences not only for themselves, but also for their families and descendents. In many cases, when the colonial authorities demanded taxes, forcing communities or individuals to seek economic alternatives outside the familiar, it was they who either left home in search of money, or were instrumental in reconfiguring the new realities at home to deal with the consequences of changed family lifestyles or livelihood options. Many flocked to urban centers and the newly declared ‘White’ farms and estates where new alliances began to develop among individuals and communities who hitherto had very little to do with each other. Those remaining in the geographical familiar still had to deal with a radically transformed social landscape, altering beyond recognition age-old patterns of authority, responsibility and interac-tion.
As a youth generation, this was also the first “abandoned” generation, struggling to make sense of realities inher-ent in a new dispensation incomprehensible to the generations preceding them. Where vertical forms of mentorship collapsed, this generation turned increasingly inwards, seeking out peer networks whose shared experience offered practical alternatives for negotiating the unknown. This was then the generation first faced with the challenge of beginning the imagination of a new kind of national identity, extending beyond the geo-political boundaries of the ethnic states hitherto in place within the context of British imperialism. The new youth generation emerging with the establishment of the new Kenya Colony at the end of the first two decades of the twentieth century would

231Institute of Economic Affairs
become the first to seriously begin to consider on its own the possibilities of not just alliances across ethnic divides, but an expanded understanding of community, reaching towards what would later become a national identity articulated as “Kenyan”.
Where vertical forms of mentorship collapsed, this (EAAG) generation turned increasingly inwards, seeking out peer networks whose shared experience offered practical alternatives for negotiating the unknown.
It can be argued that it was the very character of the social category “youth” that facilitated the beginnings of the project of imagining into being a distinct nation, Kenya.26 Those in more senior ‘adult’ categories, by virtue of growing to maturity in a world defined by the ethnic nation, had already committed to, and thus were charged with the guardianship of, ethnic states. It would be left to those who had never experienced the lived, unchallenged reality of such states to begin the project of reaching beyond them. This does not mean that there was a clean and complete break with the past. The earliest forms of what may be termed political activity engaging state policies within British colonialism, as opposed to resistance against its imposition, were still ethnic-based in organization. However, the focus for the emerging youth generation had shifted from the inward core at the heart of the familiar pre-colonial (ethnic) nation to beginning to consider the external. This manifested itself in the form of the new and larger imperial state even as the site of engagement remained the local reality of colonial policies as experienced by ethnically defined populations. In organizations such as the Young Nyika Association, the Young Kavirondo Association, and the Young Kikuyu Association, another aspect of identity began to challenge the primacy of ethnicity as an organizational principle – a generational affiliation only incidentally about age and more about a shared state of mind defined by a historical context and its exigencies.
While these organizations may not have had a long-term perspective in their agenda in terms of an independent post-colonial republic, they did evolve out of a determination to influence a different kind of relationship with the colonial authority, with consequent benefits to themselves and their communities. In urban centers in particular, amongst youth who had acquired some Western education or exposure to a different social dispensation, this began to evolve into identification with something larger, the beginnings of a sense of racial solidarity with those who were also part of the new political entity. The transformation of one such organization, the Young Kikuyu Association, into the East African Association (EAA) under the leadership of the charismatic Harry Thuku, sig-nalled a movement away from the strategies and institutions of resistance movements centralized on the restora-tion of pre-colonial ethnic polities to the beginnings of what would later be identified as the struggle for national independence.
The EAA is best known for the 1922 sit-in outside the Kingsway (now Nairobi Central) Police Station to protest the arrest of Thuku. This ended in tragedy when police and settlers shot at the growing crowd of unarmed dem-onstrators. Indeed, one can argue that this became the seminal event giving notice to the maturation of a new generation of youth. In setting up first the YKA and later the EAA, Thuku inspired a new generation of his peers into alternative engagement with the colonial authorities. He defied the authority of conservative elder-dominated Kikuyu Association and mobilized beyond a monolithic ethnic base, recruiting membership and partnership from other ethnic communities as far away as the Uganda Protectorate. The commitment of the EAA in addressing grievances affecting youth, both male and female attracted a wide following. The EAA’s investment in such issues as its opposition to the hated Kipande system and the system of coerced or forced labour affecting both young men and women, which disproportionately affected urban youth of all ethnicities turned it, and Thuku in particular, into a potential threat to the colonial status quo. Thuku’s arrest brought into the open the success of the EAA in imagining a new dispensation. The crowd of thousands who turned out and camped outside the police station to demand his release transcended boundaries of ethnicity, gender and class. The women led the gathered protesters in refusing to accept a negotiated settlement with the colonial state. Official records point to their obduracy as the critical factor in the spectacular collapse of the jittery police. The ensuing tragedy transformed the demon-stration into a very public rite of passage, performing the arrival of a new generation whose questioning of the socio-political status quo, despite its acceptance of colonial rule, went beyond the actions of a single individual. Proscribed after Thuku’s arrest and subsequent deportation, EAA may have been short-lived in terms of the length of time it was in active existence, but had far-reaching impact on the political scene. It set into motion the first
26I owe my understanding of a nation or a generation as a constructed entity “imagined into being” to Benedict Anderson’s Imagined Com-munities.

232Youth Research Compendium
era of democratic transition in the new political entity Kenya, forcing the colonial state into significant political concessions such as the Devonshire Declaration which pronounced that very year that African interests, and not those of any of the settler communities, ought to be paramount in the colony. However, quick to recognize the political potential of inter-ethnic alliances, the colonial state then moved quickly to shut the door to other such endeavours of this nature.
It is fair then to give the name of this relatively small, but critically important mass of activists to this, the first of Kenya’s youth generations. Identifying this generation as the East African Association Generation (EAAG) does not imply that all youth in Kenya at the time subscribed to, or were even aware of, the activities of the organiza-tion. Rather, the argument is that this tiny core of urban youth influenced the destiny of the entire nation in a way that no other group of its generation did. The EAA established the potential of a small but well organized and well placed group of political activists to influence the destiny of the emerging nation of Kenya. Generational peers based elsewhere in the colony - in organizations such as the Ukamba Members Association and the Taita Hills Association - took up its mantle, working with its successor, the Kikuyu Central Association in close peer partnerships that recognized the potential of trans-ethnic activism. Like the EAA, these organizations focused on the practical challenges of local populations, but were externally focused in seeking alliances with others sharing the historical mission of a changed colonial reality. They made their mark on the national political scene before their proscription - in the case of the three mentioned above, all in 1940; their leadership jailed together by a colonial state that recognized the pattern that pointed to similarities rather than differences amongst them. Run-ning through their activism, despite the different issues at the core of each organization’s agenda, were strategies of solidarity, with strikes, issue-based newspapers and the development of anti-colonial social institutions such as schools and churches as weapons against unpopular colonial policies.
A defining context for this generation was war, in particular the British engagement in the two World Wars, which extended to the hapless subjects of the Crown who had no say in the matter of their involvement. The EAAG’s entry onto the national political stage followed the end of the First World War. Its influence waned with the end of the Second World War. These wars saw the recruitment and compulsory requisitioning of thousands of young men incorporated into the British army as carrier corps serving outside the country. While many never returned, those who did brought back a new perspective of themselves and the world.
The first war was particularly significant in shattering the mental fairytale of the invincible British, the limits of the local familiar, and the apparent impossibility of political change. A new sense of belonging to, and the possibility of engaging, a world greater than that prescribed by the presence of the colonial state gave the veterans and those they interacted with on their return a new perspective, several becoming politically active as a result. No wonder Harry Thuku could imagine into being the possibility of a direct engagement with the British state itself – bypass-ing the representatives of the Crown in the colony – addressing through telegram for example, the then Prime Minister Winston Churchill on issues that Thuku felt the state should, and could address. The war too provided a rallying point beyond the boundaries of the ethnic and geographic familiar, as the population suffered from the economic cost of funding them. Hut tax, which often became the responsibility of those in the household able to work outside the home increased, while wages had suffered severe cuts.
Those who remained in the rural areas did not escape: compulsory labour in many areas affected women as well as men, especially since the forced conscription of young men depleted the numbers of those available for state-sponsored projects. The continued annexation of prime land in particular areas to encourage and provide for new White settlers particularly in the dire economic period following the war and the imposition of prohibitions favouring settler agriculture, only increased the indigenous people’s grievances. It was the youth transitioning to adult-hood in this period who were forced to practically reckon with the realization that past traditions of resource ownership, use and inheritance - especially with regard to land and livestock - would no longer be a guarantor for their future and that of their descendants. The pressure to find new ways to make ends meet, to support families and communities struggling to survive in a new dispensation - elements that would become all too familiar as characteristic of the Kenyan story in the succeeding eras - became part of the motivation to push for fundamental change in governance.

233Institute of Economic Affairs
For the EAAG, which came of age in the early 1920s in the historical context of a newly imposed colonial reality as well as the socio-economic lived exigencies of the World War I, political engagement was defined by the necessity of forging a new direction outside the familiarity of indigenous systems of governance and economics privileging generational structures of authority. It was therefore a transitional generation, forced to not only deal with the challenges of its own historical moment, but also charged with the making of new social institutions to prepare succeeding generations for the new dispensation. The predecessors of the EAAG had struggled to make sense of the fast-changing realities of colonial rule, and thus proved unprepared in many significant ways to mentor them in preparation for the challenges they would have to take on as adults. Determined not to be caught flat footed, the EAAG began to lay the foundation for the preparation of a new generation, seeking to leave as legacy a generation equipped to meet the challenges of formulating an adequate response to the challenges of colonialism.
The Mau Mau Generation (MMG)Two social institutions introduced by the colonial state stood out as potential keys to influencing the next genera-tion: the school and the church. Both challenged existing social institutions and processes, having proved effective in inculcating an alternative value system challenging indigenous systems of authority. The school – especially at the post-primary level - was a particularly important institution in this regard, as it removed young people in a crucial formative stage from the primacy of indigenous socialization agents. The church replaced the ultimate reli-gious authority invested in the elders and other guardians of the indigenous cosmologies and institutions with the logic of the imperial mission.3 As run by missionaries, these institutions were designed to produce a new breed of leaders, loyal subjects whose allegiance was unquestionably to the British crown. While succeeding to some extent, they also produced the political activists among the Wasomi who became the leadership of the most effective of the ethnic based organizations, those who would lead the opposition to colonial rule. Recognizing by experience and observation the value of capturing these spheres of influence for the benefit of the African people, the political activists of the EAAG turned to the mission church and school as models for new, endogenous institutions that kept many of the fundamental principles of the new order, while challenging its political framework.
The new “African” schools and churches became alternative sites to engage young minds in the re-imagination of the status quo, facilitating the emergence of new forms of political engagement. These anti-colonial schools (including those sponsored by the moderate Kenya Independent Schools Association and radical Kikuyu Karinga Educational Schools Association) and churches such as the African Independent Pentecostal Church, the African Orthodox Church, the Nomiya Luo Church and the African Israel Church had only limited numbers in terms of those who actually attended them. They did however introduce into the public sphere a new discourse impossible to ignore, one that challenged the thinking even of those who attended the colonial institutions. Rather than resist the concept of formal schooling, which removed children and youth from general society for significant periods of time, the African schools embraced its potential as a space for socio-political formation that challenged the logic of the colonial state. Similarly, the endogenous churches re-captured the religious sphere as a site for nurturing active anti-colonial political discourse, thus repeating age-old traditions where the spiritual became the motivation for political engagement,4 but in this new context within the new cosmology introduced as Christianity.
By the beginning of the decade of the 1940s, it was clear that there was a new youth generation on the scene, eager to graduate into the politically influential social category of adult-hood. The impetus swung to more radical poli-tics. The internal politics of the influential Kikuyu Central Association (KCA) illustrates the growing impatience of the youth with political activism that seemed reformative as opposed to transformative in nature.5 A decade after its formation in the mid-1920s as successor to the banned EAA, the KCA was fractured by inter-generational fac-tional quarrelling, after younger members of the association challenged the ideological leadership of its president, Harry Thuku, the renowned leader of the EAA. He had assumed leadership of KCA on his release from detention, but those who looked forward to a return to the days of fiery activism were to be sorely disappointed to find his
6 WhilethisisgenerallytrueformostoftheKenyaColony,partsofmodern-Kenya,especiallysignificantpartsofwhatlaterbecametheCoastandNorth-Easternprovinceswereanexceptiontothis.Inotherplaces,thechurchexistedinuneasycompetitionwithothercodes,butwasprivilegedbythecolonialstatewithanofficiallegitimacythatoftencontradictedthenumberofitsadherents.
7 Amongstthebetter-knownoftheseersleadingtheresistancetotheimpositionofthecolonialstateareMePohooftheGiriyama,Orkoi-yotKimnyolearapSamoioftheKalenjin,SyotunewaKathyukeoftheKambaandLokirojamoftheTurkana,allwhoweresignificantplayersintheintegration/assimilationoftheseethnicnationsintowhatistodayknownasKenya.
8 SeeShadrackNasong’o’scharacterizationofreformative,redemptiveandtransformativesocialmovementswhichareallimportantinthisera.“Negotiating”22.

234Youth Research Compendium
politics transformed into a policy of cooperation with the state. Thuku himself was frustrated with the younger members of the association who insisted on an increasingly aggressive transformative political agenda. He resigned from the KCA presidency, and led its moderate faction into forming the breakaway Kenya Provincial Association (KPA). The historical era of the ethnic-based association as the political strategy of choice was fast coming to an end, precipitated in particular by the banning of the most radical of such organizations in 1940. While the more moderate ethnic organizations such as KPA were not immediately proscribed, they found themselves sidelined by a population that was becoming increasingly militant. Dire socio-economic conditions increasingly worsened by the new World War made it difficult to sell their patient strategy of cooperation with the state.
A world war would therefore, once again, define the historical context for another youth generation. Its end brought back veterans with a transformed world view, disabused of the notion of an invincible British Empire. They were resentful at the cost of war that devastated the local economy, and full of bitterness over the incalculable loss in terms of human life for a conflict that made little sense on the ground. The following five years proved crucial in changing the destiny of the nation; by the end of the decade of the 1940s, the majority of the African population was seething with antipathy and frustration. The historical mission of the youth generation that gradu-ated to adult-hood in this decade was clear: the end of the colonial era.
In this, the Kenya Colony echoed events all over the British empire, which would unravel during the 1950s fol-lowing the seminal event of India’s independence in 1947. This was the context that produced the most politically significant cohort of the new generation: the Kenya Land and Freedom Army (KLFA), also known as the Mau Mau.30 Colonial propaganda castigated the KLFA fighters as “ignorant, gullible young people who had been led astray by ruthless African demagogues’’ (Maloba, 1989:189–190). In truth, it was the bitter realities of the politi-cal, economic and social discrimination imposed by a colonial system that reduced Africans to the bottom rungs of an exploitative racial hierarchy that was the KLFA’s most effective recruitment tool.
Most attention on the politics of the youth generation that succeeded the EAAG has been placed on what is most popularly known today as the Mau Mau rebellion. It provided the defining battle-ground for the negotiation of this generation’s historical mission and the best strategy for its achievement. Even those who did not get directly caught up in the physical war between the KLFA and the British state were affected by the psychological context John Lonsdale refers to as “Mau Maus of the mind” (Lonsdale, 1990). Essentially, what can be regarded as the Mau Mau Generation (MMG) was caught in between those who insisted on independence as an imperative and those who were in outright opposition to it. Hindsight suggests that the former may have won the battle to iden-tify the generation’s historical mission, but failed in its execution of a strategy to achieve it; polarized between those who were convinced that this was the opportune moment for independence, and others who argued that the colony was not as yet ready for it. Even amongst those who agreed on the mantra of “Uhuru Now”, the popula-tion was divided between those who were in sympathy to the mission of the KLFA once it was launched, and those conflicted as to the strategy of violence they had resorted to.
The colony of Kenya in the 1950s was a deeply polarized space, particularly after the imposition of the State of Emergency that begun in 1952 with the arrest, detention and jailing of the most influential political leaders of its African population. With this state action, the simmering potential for violence flared into the Mau Mau war. The epicenter of the rebellion was without doubt the Central region of the nation, but it had far reaching conse-quences all over Kenya. Thousands vanished into the forests harbouring the movement, while others disappeared from their loved ones into the other extreme of state detention camps, many of them scattered in other parts of the country. Many more went into hiding to avoid being arrested, while some initially hostile or ambivalent about the movement were recruited into the ranks of KLFA sympathisers, especially with the introduction of draconian measures such as forced labour that made an already difficult life even more gruelling. With many Africans repu-diating the violent strategy that was ultimately identified with the KLFA, the country was polarized between KLFA sympathisers and those who sided with the colonial state; few had the luxury to sit on the fence. The colonial army
30 CarolSichermandiscussestheuseofthetwotermsKLFAandMauMauandthemythsandassociationssurroundingboth(214–217).Whileacknowledging,asshedoes,thatsomeconsidertheterm“MauMau”derogatory,IprivilegeitsuseheresinceitisthetermwhichismostwidelyusedinKenyatorefertothisresistancemovement(eventhoughsomearguethatMauMauwaslargerthanthecoreKLFA)andisconsideredbythemajorityofKenyanseitherasabenigntermorcarryingpositiveconnotationsassociatedwithresistancetoWesternimperialism.

235Institute of Economic Affairs
and civil service fighting the KLFA itself had many Africans in its ranks, as well as the support of many others such as members of established missionary churches or prosperous entrepreneurs. In terms of outreach, the psychologi-cal war had an impact far beyond the statistics of physical casualties and damage with incalculable effect on the nation-state that was to emerge. There is no doubt then that Mau Mau signified many different things at one and the same time, as well as at dif-ferent times to one and the same individual, community or society. Regardless of who actually joined the battle and physically fought for or against the Kenya Land and Freedom Army, and who did not; irrespective of where one lived within the area under the jurisdiction of the British Governor of the Kenya Colony, the idea of Mau Mau irrevocably defined the circumstances of one’s life, both before and during the State of Emergency that arguably precipitated the actual armed rebellion. It so captured the spirit of its time, that E. S. Atieno Odhiambo argues it to be “a conjecture, a meeting-point for all the forces of history, economic, social and ideological, that shaped Kenyan societies in the first half-century”, begetting sibling resistance efforts, “other Mau Maus” which were built on the foundation of cultural nationalism, unity, brotherhood and struggle and which decried betrayal in all forms (Atieno Odhiambo, 1995: 38-39). Thus this youth generation, even those within it opposed to the KLFA, can be defined as the Mau Mau Generation (MMG).
This chapter will not explore the strategy of violence that has been most associated with this generation. However, while recognizing the presence of other alternatives of political engagement such as the deployment of media in the tradition of Kenyatta’s Mwigwithania by activists such as Paul Ngei, it is important to emphasize the reality of violence as a factor, either as a strategy to be deployed in service of the generational agenda, or as a deterrent to be avoided at all costs (this includes the fear of state violence against one’s person, community or institution) on the activism of the MMG and its successor.31 This is true regardless of what plan of action particular activists favoured. Attention needs to be paid on the lingering effects on a generation, particularly in its most critically formative period, of a socio-political context dominated by the reality as well as looming potential of political violence. During the political tenure of the MMG, fear ruled, even where there was no actual physical fighting, dominating discourse in the public sphere as well as the policy and actions of the colonial state.
Non-violent alternatives to achieving the goal of independence were generally pushed to the periphery. The la-bour movement, for example, began to evolve during the 1940s to inherit the political mantle of the ethnic-based movements, providing an alternative space of trans-ethnic, and even multi-racial, organization. Its political poten-tial became glaringly clear after two major general strikes came close to crippling Mombasa (1947) and Nairobi (1950), proving even more devastating than the ethnic strikes of the 1930s. Afraid of the potential power of mass-action, the government was quick to act. Its response was swift and ruthless; the most prominent and experienced trade unionists such as Chege Kibachia, Fred Kubai and Makhan Singh were arrested and jailed. By the end of the decade, the orphaned labour movement in Kenya was not only reliant on much younger and less experienced lead-ers such as Tom Mboya, but also cautious about confrontational activities that could get even these into trouble with the state. Its ranks were further depleted when the State of Emergency was imposed in 1952. It never really fulfilled its potential as an alternative centre of power separated from the politicians; in the confusing upheaval of the State of Emergency, it would become increasingly incorporated into the political movement as an appendage of career politicians.
One of the least talked about, but most influential and long-lasting effects of the state-instituted measures that defined the State of Emergency was that by the time this period ended, the majority of the leadership of the MMG had been edged out from the political leadership of the nation. This was done through a systematic process of the outright silencing of its leading voices, suppression of its most effective organizers, and the strategic marginaliza-tion of almost all its political avenues of engagement, both radically militant and moderately conservative.
With the critical mass of the MMG leadership removed from active engagement in the political sphere by the onset of the State of Emergency, there was a vacuum to be filled. The emerging youth generation found itself suddenly thrust into adult-hood, forced to step into the shoes of its older sibling.
31 SeeFrantzFanon’siconicexplicationonviolenceinrelationtodecolonisationintheopeningchapter“ConcerningViolence”ofTheWretchedoftheEarth,wherehespecificallymentionedMauMauwithregardtothepower-gamesthatareplayedinthenegotiationsleadinguptodecolonisation(61)

236Youth Research Compendium
The Lancaster House Generation (LHG)What would ultimately turn into the most successful strategy towards gaining Kenya’s legal independence from Britain began quietly in the mid-1940s, with such an unassuming nature that many initially dismissed its potential to become the vehicle of change. Earlier on in 1907, under pressure from European settlers demanding greater say in the affairs of the colony, the state had agreed to the formation of a Legislative Council (LegCo), with an initial representation taken exclusively from that sector of the population. Asian representatives were the next to be included, with the interests of the African majority being entrusted to a state appointed European member. It was not until 1944 that this nominated representative was himself selected from those he was to speak for, with Eliud Mathu becoming the first African to sit in the council. With little indication on the part of either state or the rest of the overwhelmingly European membership that LegCo might look kindly on the vision of independence – par-ticularly in the racially polarized context following the war - not many paid much attention to the space afforded by the council until the State of Emergency crippled other forms of political engagement.
LegCo became the only legal space remaining with the potential for national political engagement. Within a year of Mathu’s appointment to the council, a “thinking group” had been formed with state approval. The group was to serve two purposes: as a support organization for Mathu, who had the responsibility of representing the entire African population in the council, and, or so the state hoped, as a learning space to nurture an understanding about the processes of public affairs in a younger generation of educated Africans. In other words, it was primar-ily set up to mentor a new generation in preparation for a future in which its members might take a more central role in matters of state under the careful guidance of the British crown. Initially named the Kenya African Union (KAU), the support group was quickly re-named the Kenya African Study Union (KASU) to counter state discom-fort with the appearance or potential of national political engagement. However, it took only one year before the group dropped the pretence of being apolitical, reverting to the original name, openly campaigning for increased political influence in LegCo. By the time the State of Emergency was imposed, KAU was actively pushing for the election of several African members to the council. It is this group (KAU) that would become the catalyst for the inauguration of a new generation into adult-hood following the abrupt removal and subsequent effective absence of the MMG from the political front.
During the tumultuous decade dominated by the Mau Mau war, KAU used its platform to steadily campaign for an expanded and elected African membership of Legco. By 1957, the first African elected members, eight in num-ber, took their seats in LegCo.32 Only Oginga could claim to belong to the MMG, and even he would have been considered as one of its youngest members in terms of age. The rest were members of a new youth generation, which would be associated with the political negotiations for independence at Britain’s historic Lancaster House, when the time came for Kenya’s representatives to follow the footsteps of other British colonies in writing its con-stitutional contract out of colonialism.
The Lancaster House Generation (LHG) was prematurely thrust on stage as the political leadership of the nation, barely beginning to emerge as a distinct entity within society before it found itself stepping into the shoes, and assuming the burden of its elder siblings. Its leaders were supremely conscious of the price of political violence, perceived or real, and instead opted for the LegCo and the state-sanctioned path of democratic transition rejected by the radicals of the MMG as their avenue of choice to political emancipation. The question of a generational historical mission was taken out of their hands and decided by the circumstance of their unexpectedly early el-evation to the mantle of political responsibility – they inherited the quest for independence from the MMG. This was affirmed by the greater realities facing the British Empire sparked off by Indian independence in 1947. If the MMG in its youth had been conflicted by the question of timing, the LHG, by the end of its brief stint as the youth generation, was firmly committed to the transition to independence sooner rather than later. The threat that Kenya would go the way of South Africa and Rhodesia into becoming an independent state under the minority rule of a White settler community had disappeared by this time with the State of Emergency just over eight years after its imposition. Even the British government had become resigned to the fact that independence would not take another decade or so to become reality. Not only did the LHG adopt the historical mission of the MMG, it identified as its strategy for attaining it the
32 Allmale,thesewereBernardMate,TomMboya,DanielarapMoi,JamesNzauMuimi,MasindeMuliro,RonaldNgala,OgingaOdingaandLawrenceOguda
237Institute of Economic Affairs
alternative route of measured cooperation with the British state that the most influential leaders of the MMG had rejected. Ironically, it was the context created by the MMG that made possible the ultimate achievements of the LHG. Although the British state ultimately won the actual armed conflict against the KLFA, by the time the State of Emergency was lifted, Kenya was clearly on the way to constitutional conferences at Lancaster House in Lon-don, following the route to independence taken by other British colonies such as Ghana and Nigeria.
Thus it was that this new generation came to age within a context both fraught with the difficulties and dire cir-cumstances of the State of Emergency, and the hope and burgeoning excitement of certain independence. It was also yet another generation to be deprived of the benefit of mentorship through apprenticeship to its immediate predecessors. As Oginga Odinga, one of the very few political leaders of the MMG to survive what effectively amounted to a purge of his peers during the State of Emergency, stated in a controversial statement to LegCo in June 1958, the political leadership of the nation were those who remained behind bars. Those of the MMG whose moderate agenda or strategy had kept them out of trouble and able to carry on with their political activi-ties found themselves without social legitimacy to claim national leadership. At the same time, the transition from colonialism to independence would bring with it a new dispensation; virgin territory for the generation emerging into leadership to explore. Perhaps it is not surprising that even after stepping up to the historical demands of the moment and effectively taking on the political leadership of the nation, the LHG needed the moral legitimacy of older politicians such as Jomo Kenyatta (of the EAAG) and Odinga Oginga (of the MMG) to feel comfortable in the office it now held. The honorary titles that were almost instantly bestowed on such politicians, “Mzee, Baba wa Taifa” Kenyatta and “Jaramogi” Odinga Oginga, signalled a relationship that differentiated the two most prominent politicians of the independence period from the colleagues.33 In doing so, the LHG effectively deployed the social capital offered by these two to validate its own position in the eyes of a nation that might otherwise chal-lenge the ascendancy of a generation, whose predecessors might challenge for the right to complete an unfinished agenda. A generational takeover from the MMG to the LHG was quietly carried out behind the scenes, behind the towering figures of the two politicians who would come to symbolize the ideological divide in the nation.
The Post Colonial Era GenerationsThe Lost Generation (LG)Having edged out its predecessors prematurely, the LHG had at its disposal the luxury of more time than might have been expected to fulfil its mission, before there was any question of a political handover to the succeeding youth generation. It became clear with time however, that the LHG had no intentions of handing over, the re-sponsibility of political power to any other generation. In the first two decades of independence, it systematically worked to subtly undermine - and finally erase - the social authority of elder-hood traditionally considered of more weight than political power that members of previous generations might have deployed to call it to account. With the exception of a handful of individuals, as mentioned earlier, previous generations were quietly sidelined in the new government and put on the periphery in both national memory and platforms of action. The LHG progres-sively attacked endogenous social checks and balances against the abuse of political power. Its leaders argued, for example, for a strict separation between religion and politics, which echoed Western traditions of liberal democ-racy but contradicted indigenous checks and balances making political leadership answerable to those who had graduated to the ranks of spiritual and social elder-hood. At the same time, the LHG as a generation abdicated its responsibility of mentorship to its immediate junior. The generation that was to succeed the LHG was still firmly in child-hood when the LHG became the generation - in-adult-hood, still far from prepared to undertake its own journey of maturity through youth. This gave the LHG valuable time to consolidate an adjusted understanding of this social stage. By the time the new generation was in a position to enter the liminality of youth, it found this stage re-articulated in the colonial image as the source of “watu wa mikono” – labour to be deployed at the service of the agendas of those in power.
33 “Mzee,BabawaTaifa”means“TheElder,theFatheroftheNation”inKiswahili.Jaramogiisanhonoraryname,bestowedondescend-entsofRamogi,themythicalfatheroftheLuopeople.However,itisemployedasatitleofrespectonthoseconsideredtheleader(inthepatriarchalsenseof“father”)ofafamily,aclanorthecommunityatlarge.ItisnotablethatthisisatitlethatcametobeassociatednationallywithOdingaOginga,sothatinKenya,eventoday,anyreferenceto“Jaramogi”isassumed,unlessotherwisestated,torefertohim.Decadesafterhisdeath,nootherKenyanleaderhas“inherited”thistitleonthenationalstage.Thesetwopoliticians,KenyattaandOdinga,thusacquiredthemantleof“fathers”ofthenation,withOdingaperformingtheroleofthealternativetothepresident.Attemptstotransferthetitleof“fatherofthenation”tosuccessivepresidents,suchasMoiandKibakiwerelesssuccessful–Moiwasinitiallycastas“BabaMoi”butthisseemedtocatchonmorespecificallyinrelationtotheyoungermembersofsociety,andnotthenationasawhole.

238Youth Research Compendium
It was the LHG that introduced the concept of party “youth wings”, whose role was not to mentor a new genera-tion of political leaders, but rather to serve the whims of those in power. Those allowed to progress through the ranks to attain positions of influence were kept under tight rein to ensure that they continued to serve the agendas of the political godfathers to whom they owed allegiance. Any who developed enough independence to question the status quo, much less begin to offer legitimate alternatives to it, were ruthlessly sidelined; sometimes by being brutally murdered. The LHG would therefore hang on to political power at the cost of the following generation, which lingered on forlornly in the liminality of youth long after individual members had physically become grand-parents. The definition of youth in the public realm dominated by politics diverged drastically from that in the private realm defined by social roles.
That critical period before the new cohort could effectively begin to function as a generation, LHG were afforded the time it needed to entrench a new discourse excluding that social category from any influential societal leader-ship. It was afforded little space to develop an agenda or mission independent of its predecessor, for so long that it eventually acquired the tag, the Lost Generation (LG). As illustrated below, the adjective “lost” here applies to the opportunities lost to this generation in this critical stage of youth – the opportunity to identify its own historical mission, that to formulate strategies towards its fulfilment, and a reasonable length of time to serve the nation as the generation of political responsibility after it graduated to adult-hood, due to the advanced age of its members at that point. It was during the political tenure of the LHG that the dis-association of youth with age within the political realm was normalized in Kenyan society. By the beginning of the new millennium, it was possible for the government to talk about a Youth Fund whose criteria of eligibility recognized anyone below the age of fifty. A new discourse of exclusion erased youth from active participation in the affairs of the nation.
Ironically, this new conceptualization of youth was most influentially articulated by the very man who had most overtly performed the very opposite in colonial Kenya. Tom Mboya was a charismatic trade unionist–politician widely acknowledged as the most precocious of his generation, having achieved the pinnacle of political promi-nence when he was much younger than his peers, chairing the All Africans People Conference in Ghana at only 28 years of age. An acknowledged leader in the trade union movement at 22 years of age, Mboya had been one of the first elected members of LegCo, proving himself adequate to the challenge created by the sudden removal of the more experienced and influential leaders of first, the trade union movement, and then of Kenya’s political leader-ship in the early 1950s. He quickly became one of the most powerful ministers in the post-colonial government, credited with the articulation of the seminal Government of Kenya Sessional Paper No. 10 on African Socialism and its Application to Planning in Kenya of 1965, that charted the economic destiny of the nation. Yet, he was also amongst those who most persuasively championed the new perspective of youth merely as important human resource to be exploited for “productive” purposes. This became the government strategy, not only articulated in official statements, but also translated into public policy, as illustrated for example in the formation of the Na-tional Youth Service (NYS). It was Mboya who was the most successful re-articulator of the concept of youth as a political category of limited influence but significant utility.
The new youth were those in the service of political patrons. Some of them would perpetually remain “watu wa mikono”. Others used their position to “prove” themselves to those in power, in the hope of gradually elevating themselves in time into positions of leadership and influence. This latter group were people who understood the category “youth” as a period of challenge and testing – those who were determined to make it merely a stepping-stone to bigger things. Their participation in the kind of “youth” activities most associated with Kenyan politics was strategic in ensuring their individual graduation from this social category. Thus, the LHG perpetuated the idea of individual as opposed to collective with regard to the political sphere.
The most visible manifestation of youth as “watu wa mkono” as a factor in Kenyan politics during this period was the ubiquitous presence of the party “youth wings.” The Kenya African National Union (KANU) ruled virtually as the sole political party for most of the first four decades of independence. With regard to the LG, it is the official KANU youth wing that is therefore most notoriously associated with the abuses of power that confirmed local associations of youth with violence when it comes to political issues. It operated as the de facto police in many parts of the country during its peak at the climax of the Nyayo era, with the power to mete out instant (in)justice to anyone who crossed its path. KANU youth wingers were almost never identified as individuals in the public
239Institute of Economic Affairs
realm – their red uniforms gave them a faceless identity affirming their marginal role in decision-making forums. In addition, there was also what might be referred to as “party youth” who served the party in one capacity or another, sometimes even rising through the ranks to become elected officials, on whom the party relied on to carry out tasks, some of an unsavoury nature. There were also those who eventually managed to work their way through the ranks of party youth to become influential players in their own right, such as Emmanuel Karisa Maitha, David Mwenje and Fred Gumo, although a glass ceiling limited the extent of their ambitions.
Those challenging the status quo may not always have had an officially recognized “youth wing” since they them-selves operated underground for most of this period, they did have youth cells that operated on a similar basis. They were most manifest in the publication and circulation of political literature in the alternative press tradi-tion of colonial period youth. Then, Jomo Kenyatta of the EAAG (M igwithania), Achieng’ Oneko and Oginga Odinga (Ramogi) and Paul Ngei (Uhuru Wa’Afrika) had used their publications to provoke discussion of pressing political issues and court support for a radical political agenda. In the same vein, publications such as Pambana and Mpatanishi introduced Kenyans in the 1970s to 1990s to the revolutionary agendas of the December Twelve Movement, Mwakenya, the February Eighteenth Revolutionary Movement and other underground organizations, leading to the detention, arrest, trial or imprisonment on one variation or another of the charge of sedition. Amongst those affected included Willy Mutunga, Koigi wa Wamwere, Njeru Kathangu, George Anyona, Maina wa Kinyatti and Wahome Mutahi.
Ultimately, the most influential political leadership of the LG emerged out of two streams. The first group cultivat-ed through direct apprenticeship over a long period of time to the political heavyweights of the preceding genera-tions. This category was dominated by “political sons” – such as Katana Ngala, Michael ‘Kijana’ Wamalwa and the brother-duo of Oburu Odinga and Raila Odinga, who inherited precious capital from their biological fathers in terms of reputation and power base.34 Others could be thought of ideological off-spring; most famously perhaps the group of “Young Turks” (many drawn from the professional class discussed below) initially loyal to Jaramogi Odinga Oginga, who continued after his death to rise to the top ranks of Kenyan politicians. These “apprentices” were sometimes encouraged to take initiative in carrying out the broad mandate with which they were associated, but this was always subject to the ultimate approval of their mentors. They would spend years in building a career, patiently working on agendas associated with others already in the national political limelight thus establishing their own credibility as politicians in their own right.
The second category of political leaders was drawn from the professional class, particularly those working within civil society. Members of this group tended to be generally well educated, possessing at least an undergraduate degree, and work experience of several years working in a particular field. Several had lived outside Kenya for a while; some forced into exile for political reasons, others as part of their professional trajectory. They returned to Kenya as indelibly transformed as had the colonial era war veterans. As noted above, some joined the political camps of particular senior politicians; others preferred to maintain their independence from these godfathers, and worked patiently to build their own individual careers.
Two sites are particularly important worth noting in terms of their role in nurturing the careers of the political leadership of the LG: intellectual institutions and professional bodies, the latter in particular associated with the legal field. Those from the former gained their work experience in a variety of local and international institutions. The latter primarily distinguished themselves through legal work and activism carried out within Kenya.
There were public intellectuals such as Peter Anyang’ Nyong’o, Mukhisa Kituyi and Apollo Njonjo, whose trajec-tory to politics took them through a variety of spaces after they left the physical space of the academy, working in research institutes, non-governmental organizations and civil society. The most important institution in terms of nurturing Kenyan politicians of this generation was indisputably the University of Nairobi, and to a lesser extent,
34Their fathers were respectively: Katana Ngala, William Wamalwa and Oginga Odinga. Depending on how strictly one demarcates the boundaries of the Uhuru Generation, one might include here as well Uhuru Kenyatta and Musalia Mudavadi, sons of Jomo Kenyatta and Moses Mudavadi. With the exception of Margaret Kenyatta who served as Nairobi mayor, political daughters were not a feature of the Kenyan political scene.

240Youth Research Compendium
other Kenyan and East African universities notably the University of Dar es Salaam and Makerere University.35 By 1970, the newly incorporated University of Nairobi (UoN) provided the ideal space for the LG in terms of the nurturing of competing ideas challenging the hegemony of prevailing political, social and cultural ideologies. In a continental era where discourses on post-colonialism and political ideologies jostled for supremacy, the univer-sity offered a platform for the examination of the course Kenya had taken in comparison to the paths chosen by the other emerging nations, particularly its neighbours. As the political space for dissenting voices shrunk in the decades of the 1970s and 1980s, it remained as one of the few “safe” spaces for guarded political exchange. This is not to suggest that there were not challenges even here; there were still those who paid the price in terms of de-tention, imprisonment or expulsion from the university for exercising their right to free speech.36 Still, compared to other public spaces, the university nurtured provocative intellectual discussion on issues that would have been considered treasonous anywhere else. The UoN, and the other (public) universities that developed henceforth also provided willing and able mentors in the form of politically committed faculty, many not much older than the students, who fostered the lively and vibrant academic debates.
The 1970s (and later on, the 1980s) were a vibrant time for student activism, with the university providing one of the very few stages for overt expression of competing perspectives on sensitive issues of national interest, particu-larly those of a radical bent. Kenyans first began to hear of political luminaries such as Philomena Chelegat Mutai, Mwandawiro Mghanga, and James Orengo when they were student leaders at the university. The radical politics they became famous for in parliament was first nurtured during this important period of their lives. The university provided a training ground through which a select number of students honed their skills through demonstrations, artistic productions, speeches at campus kamukunjis (political meetings) and internal publications, while engaging on an intellectual level on competing ideologies that would later become the basis for their politics. Long before the “Young Turks” of the LG graced newspaper pages dodging tear-gas and riot-gear clad police, they faced the dreaded General Service Unit (GSU) baptized ‘Guza Serikali Uone’ in student demonstrations that sympathisers accused the authorities of turning violent. Indeed, several were harassed, suspended and even expelled from the university. In the worst cases, arrested and jailed. They could count themselves amongst the more fortunate – some of their compatriots were permanently psychologically scarred and even silenced by this kind of harrowing experi-ences; and even killed as a direct consequence of their activities or position as student leaders.37
35 AsthefirstandonlydegreegrantinguniversityinstitutionofthecolonialerainEastAfrica,Makererewasarguablythemostinfluen-tialacademicspaceintermsofshapingtheLHG.UoNwasinitiallystartedastheRoyalTechnicalCollege,beforeevolvingintotheUniversityCollege,Nairobi,theKenyancampusoftheUniversityofEastAfricafollowingindependence.ItfinallybecomeKenya’sfirstfullyfledgeduniversity,justaboutthetimetheLGwasgraduatingfromschooltobeadmittedtherein.KenyanstudentswouldcontinueforawhiletogotobothUgandaandTanzania.TheFacultyofLawattheUniversityofDaresSalaam,forexample,enjoyedanunparalleledreputationastheleadinginstitutionofitskindintheregionforalongtimeevenafterotheruniversitiesintheregionestablishedtheirownfacultiesoflaw.ManyofKenya’sleadingLGLawyersareDaresSalaam,notUoN,alumni.TheUoNremainedKenya’ssoleuniversityuntil1984,andisthereforetheinstitutionmostcloselyassociatedwiththeLG,althoughseveralofitsmembers(suchasEdwardOyugi,MainawaKinyattaandAlAminMazrui),didgoontoteachatotheruniversitiessuchasKenyattaUniversity.AstheKenyattaUniversityCollege,thelatterhadservedasthecampushomeoftheUniversityofNairobi,FacultyofEducationfromthetimeofthatuniversity’sincorporationuntil1985whenitbecameafullyfledgeduniversityinitsownright.
36 Their fathers were respectively: Katana Ngala, William Wamalwa and Oginga Odinga. Depending on how strictly one demarcates the boundaries of the Uhuru Generation, one might include here as well Uhuru Kenyatta and Musalia Mudavadi, sons of Jomo Kenyatta and Moses Mudavadi. With the exception of Margaret Kenyatta who served as Nairobi mayor, political daughters were not a feature of the Kenyan political scene. 36 Thearrest,trialandimprisonmentofAbdalatifAbdallahin1969forthepublicationofwhatwastermedaseditiouspamphlet,(Kenya Twendapi?)markedanewlowinstate-academyrelationsinKenya.LaterotherssuchasEdwardOyugiandMainawaKinyattiwouldfindthemselves inthesamesituation.Othersignificantoccurrences includedthebanningordenialofperformancerightsforacademicorcreativework,(suchasthestatehaltingofthestagingofAlAminMazrui’splayKilio cha Haki);thedetentionwithouttrialofacademicstaff(suchasisrecordedinNgugiwaThiongo’sprisonnotespublishedasthebookDetained;AWriter’sPrisonDiary);theperiodicarrestandholdinginpolicecellsforunspecifiedlengthoftimewithoutpropertrialofthosesuspectedofundergroundpoliticalactivism(includingthatofthefirstfemaleUoNdeanMicereGithaeMugo.whofoundherselflockedupwithmenwithnoefforttoholdherinseparatespaces),andtheforcingintoexileofmanyothermembersoftheuniversitycommunity(includedNgugiwaMirii,E.S.AtienoOdhiamboandKamonjiWachira).Althoughthesemembersoffacultydidnotgoontopoliticalcareers,theirpoliticalactivismhadatangibleeffectontheirgeneration.
37 TitoAdungosi,theill-fatedchairoftheStudentOrganisationofNairobiUniversityatthetimeofthe1982coupattemptwasarrestedalongsideotheruniversityleadersinretaliationforthesupportthatseveralstudentsgavethecoupleadersbeforeitbecameapparentthatitwouldnotbesuccessful.Theharassmentofhisfamilycontinued.Hisunexpecteddeathduringhisjailtermturnedhimintoanationalmartyr.Notonlywasthereunprecedentedpoliceinterference(andpresence)athisfuneral,thestatesetupapolicepost,ironi-callynamedafterhim,nexttohisfamily’shomesteadwhichcontinuedtoendureasapoignanttestimonialtothecircumstancesofhislifeanddeathdecadesaftertheevent.SeeTheOtherSideofPrison:TheRoleofWomenLeftBehindforaccountsoftheharrowingexperiencesoftheseactivistsandtheirfamilies.

241Institute of Economic Affairs
The other significant site: law, produced some of Kenya’s best known politicians of this historical cohort. They came to public notice through different kinds of legal work. Some such as Paul Muite, Kiraitu Murungi and Mu-tula Kilonzo made their names as members of legal teams working with on controversial “political cases” or for prominent politicians. Others came through other routes: James Orengo began his activism as a student, Martha Karua sat as a court magistrate before joining civil society and Gitobu Imanyara’s The Nairobi Law Monthly had a readership who prized its political interventions as much, if not more, as its legal contributions. Oki Ooko Om-baka and Kivutha Kibwana extended their academic work into civil society, founding organizations such as the Centre for Legal Reform (CLARION) in Kibwana’s case before successfully entering politics.
The Lost Generation’s youth was thus characterized by the emergence onto the Kenyan stage of a vibrant, ar-ticulate and increasingly powerful civil society. Its members became increasingly politicized in tackling critical national challenges that the government and those working within the limitations of the political sphere seemed either unable or unwilling to tackle. The struggle to entrench the principle of human rights for all, particularly those previously marginalized by the state, transformed the political landscape and became the dominant focus of the different groups of LG political and civil rights activists in the final decade of the twentieth century. Non-governmental organizations such as the International Federation for Women’s Rights (FIDA), CLARION, and the League of Kenya Women Voters became nurturing grounds for political careers. This was the generation that legitimized organized civil society as an influential alternate space for political action.38
In discussing the youth period of the LG, one needs to take into account an extra-ordinarily long period of time, during which this cohort underwent transformation within itself and in relation to the changing political context within which it was located. Historically, its focus on pluralistic politics as a marker of democracy reflected global politics of this era, ultimately manifesting on the African continent in what has been referred to as the epoch of the “Second Independence”. In hindsight, it is significant that the first tangible political presence of this new genera-tion became visible in the Kenyan public sphere in the late 1960s and early 1970s with the climax of the ideologi-cal battle between the two factions of the LHG from 1966 to 1969, resulting in the effective death of political pluralism of Kenya. Political neophytes at this point in time, the LG’s influence at this stage of Kenyan history was limited until it asserted itself forcefully as the decade of the 1990s ushered in the return of multi-party democracy. The LG’s leadership and investment in this issue, first in restoring pluralism to the constitution and later in the struggle to see that provision translated into full implementation, became its public performance of its claim to political maturity.
The first decade of the new millennium catapulted the LG into a new phase, forced to challenge the LHG for its turn at the helm of national leadership. By then, it had become clear that the LHG had no intentions of grace-fully surrendering its place in the political limelight, despite finally conceding it had now entered uzee, elderhood. Rather, the core at its leadership fought to retain its political authority by insisting on age as a marker of essential experience and wisdom needed at the helm of the nation.39 Previously, the year 1992 had acquired a particular significance for the nation of Kenya, marked by the repeal of the infamous Section 2A of the Constitution. A decade earlier, the amendment introducing Section 2A had legalized Kenya’s de facto one-party status. The 2002 general election was historic in not only giving the nation alternatives in terms of political parties but also in terms of presidential candidates for the first time in its history. These presidential elections merely confirmed the LHG’s continued dominance of the Kenyan political scene. Those held five years later can be considered as pivotal, the rites of passage ushering in the new generation onto the political centre-stage.
The 1997 elections provided the nation with its first real opportunity to elect as its president a member of the LG. Raila Odinga, Michael Kijana Wamalwa and Charity Ngilu all made respectable showings at the polls. By 2002, the winning presidential candidate, Mwai Kibaki, although a member of the LHG himself, relied heavily on the
38 Organizedcivilsocietyisheredefinedasthoseformallyconstitutednon-stateorganisations.39 Having deployed the figure of the elder in Kenyatta and Odinga strategically to enhance their own credibility, the LHG had put aside this
category in terms of deploying societal authority until it was revived by the nation’s second president, Daniel arap Moi. Moi travelled the length and breadth of the country being made an elder of the different Kenyan communities to legitimize his position as not only the ultimate political authority in the nation, but also the only one wielding the moral authority superior to that of a mere politician. Other politicians too began to claim the position of national elder in a similar fashion. Ironically, when the LG began to progressively clamour for its right to lead the nation, its presidential hopefuls – regardless of age – also began to traverse the country competing amongst them-selves for recognition as an “elder” from as many ethnic communities as possible.

242Youth Research Compendium
support of an alliance otherwise made of LG political heavyweights for his success. This time, the LHG while finally conceding that the LG had finally graduated into social adult-hood, was busy at work to re-fashioning the category of elder-hood as not only the ultimate moral authority of the nation, but also the flag-bearers of political responsibility, making the LG little more than junior partners in government. Hence, the first decade of the new millennium would be characterized by a continuing battle for power between the LG and the LHG, providing the context for the emergence of the next youth generation.
The Uhuru Generation (UG)The new generation that emerged into the public sphere did so with intense self-examination, reflected in Njonjo Mue’s seminal articulation published in 2000 as “The Uhuru Generation”.40 It sought, first to distinguish itself as a distinct entity from preceding generations and, secondly, to define a role for itself within the present that would support a historical mission for the future. The latter became increasingly necessary as the LG attained the social category of adult-hood and set about consolidating its historical mission which remained closely intertwined with the expanding of popular participation in governance through the entrenchment of the practice of pluralistic poli-tics in Kenya. An intense debate greeted the first attempts at identification and definition of a new generational en-tity, with many questioning the desirability, viability and timing of these efforts. As has been demonstrated above, generational thinking is not a new concept to Kenyan politics; however, the enduring vibrancy of what might be identified as the Uhuru Generation discourse has demonstrated a national re-thinking within the Kenyan public sphere of the roles and responsibilities of the socio-political category of youth.
The name of this new generation is taken from its identification with the elusive promise of Uhuru, the state be-yond the achievement of mere political independence defined in the words of Amilcar Cabral as “the complete liberation of the productive forces and the construction of economic, social and cultural progress of the people” (Cabral, 1973:52). The symbolic date of 12th December 1963 serves both to mark the birth of a new independent nation, and that of this new generation. This provides the controversial but important psychological break with the LG.41 As the first truly post-colonial era generation, members of what is now known as the Uhuru Generation (UG) are the first to be Kenyan citizens from birth, in contrast to predecessors born in the colonial era, including the LG, who had once been British subjects.
The UG’s process of imagining itself into being has coincided with the national struggle for a new constitution culminating in the promulgation of Kenya’s second constitution in August 2010. Just as the campaign for political pluralism defined the coming of age of the Lost Generation, so too has the struggle for a new constitution defined that of the UG. As it is turning out, “uhuru” in the Cabralian sense will be most realistically achieved within the current historical period through the translation of Kenya’s second constitution into lived reality for its citizens. This will be the single most defining challenge for this generation. It is likely to continue to be a complicated, contested process on many levels, destined to dominate the most politically influential decades of this cohort and determine its place in history.
What can be termed as “Uhuru Generation discourse” ought then to be understood in the light of three things: the history of the nation delineated above, a local socio-political context that offered limited political space for those categorized as youth by the time of its emergence into the Kenyan public sphere, and a global context offering the same group unprecedented opportunities.
40 MuewasnotthefirsttomoottheideaofanUhuruGeneration,buthisinterventionbroughtwhathadbeenessentiallyacovertdis-cussionhappeningin“safeUGspaces”intothepublicsphere,andhasremainedthemostdefinitiveintermsofbringingtheissuesofthisgenerationtothetable.IhavediscussedthegenesisandearlyevolutionoftheUhuruGenerationin“PerformingOurStories,PerformingOurselves.”
41 Asisthenormwithallgenerations,somemembersofaparticularcohortmaybemarginallyolderoryounger(intermsofphysicalyears)thantherest.Iamnotinclinedtosplithairsovertheexactbirth-dateofparticularindividualsinthisregard;therearehoweverthosewhohavemadethechoiceof“anarbitrarydate”amatterofindignantrebuttalwhenthequestionofdefinitioncomesup.ItdoesnothowevernowseemtobeamatterofanyseriousdisputethattheUhuruGenerationcanbearticulatedasadefiniteentitywithintheKenyansociety.The“closingdate”ofthisgeneration,markingthecut-offwithwhatIamterminghere“GenerationNext”forwantofabetterterm,willprobablyonlyemergeasthatgenerationbeginstoimagineitselfasadistinctentityincontrasttotheUG.Whileabirthdatedoesnotinanywaydefineacommitmenttoahistoricalmission,itprovidesausefuldemarcationpointindistinguishingbetweentwogenerations.Thosewhoshareasocio-historicalcontextandthelivedrealitiesthataccompanyitarecalledtodealwiththeconsequencesthereofandthusarefacedwithpeculiarchallengesthatwillbetheyardstickbywhichtheywillbejudgedbyhistory.

243Institute of Economic Affairs
As in previous generations, the articulating of a generational agenda for this cohort began within a small group but grew to have implications far beyond it. As long as the LG remained socially categorized as youth within the socio-political context created and tightly controlled by the LHG, there was little imperative towards the delineation of a new generation. Many of the same factors and contexts discussed above in relation to the LG therefore apply to the formation of the UG, although it must be noted that the historical circumstance of timing have mediated the experience of the latter. Understanding the UG needs to take into consideration the ways in which that cohort has been shaped by circumstances that are similar, yet different, from the generation that preceded it.
Educational institutions continued to be a critical arena of engagement for the UG as for its predecessor. However it was much less marked than it had been for the LG’s youth. By the time the first members of the UG arrived at the University of Nairobi after the year-plus long closure of the institution following the 1982 coup, it was to find a changed environment. The government that had hitherto allowed a certain extent of radical discourse to flourish was now ruthless in its scrutiny of anything that challenged the status quo. Many a radical faculty had fled into exile and those who remained found it more difficult than ever before to keep dissident spaces functioning. Politi-cal activism took a more covert nature. A critique of the government was more likely to be found on theatrical stages as opposed to political platforms or class lecterns; allegories and allusion becoming a prized language of discourse. The government also took more of an active interest in student and faculty politics, banning the respec-tive umbrella bodies, and infiltrating university campuses with its agents. By the late 1980s, it was commonplace to see faculty and student district associations from all over the country trooping to State House to pay their respects and pledge their loyalty to the president, for which they were well rewarded in cash and kind. Student activism did not however disappear entirely. It gradually became more and more associated with internal campus issues rather than matters of national concern. By the new millennium, when national politics featured on campus discussions, it was more in relation to the “sponsoring” of particular factions as student leadership elections by political parties and less with regard to engaging student populations in ideological debates.
Although less prominent in the public eye, secondary school students were active in the risky business of engaging and provoking public debate on national issues as is evident by the original creative items presented for the annual Kenya National Schools and Colleges Drama and Music Festivals. Socio-political issues tend to dominate the festi-vals, enabling festival observers to use each annual festival to gauge grassroots opinion on the most volatile issues of the day. Attempted government censorship of the content of the festival entries became especially aggressive in the latter part of the 1980s, with the students, under the guidance of their teachers, stretching the creative envelope to see how much political critique they could cram into it without disqualification. The dramatic process of bring-ing the items to the various stages provided rich opportunities for both the schools and their audiences to engage sensitive matters. These included political assassinations and election related violence, presidential commissions on volatile issues such as land, and the otherwise taboo imaginations on alternative leadership and the elimination of corruption and impunity in high places of government. Perhaps the greatest value of such interventions was less in terms of their impact on the public sphere and more as a realm of political education for those who participated.
Religious spaces also continued to provide the environment for youth to imagine alternatives to the political reali-ties of the day. These institutions, processes and groupings remained fertile sites for the nurturing political alterna-tives. Some were redemptive in nature, focusing on the question of spiritual development to the extent of all else. Others took on a more revolutionary or transformative agenda. Of particular note was the controversial move-ment known as Mungiki. Most accounts credit an older religio-political organization Hema ya Ngai wi Mwoyo (the Tent of the Living God) as having a prominent influence on its formation. Worth noting is that the latter was founded by Ngonya wa Gakonya at the same age that Tom Mboya had achieved continental recognition in Accra. Hema later transformed itself into a political party espousing a radical religious agenda (the Democratic Move-ment) even as it incubated Mungiki. Mungiki itself was founded by seven dissatisfied Hema members, including the then 15 year-old (Ibrahim) Waruinge Ndura, at that time in his first year at secondary school but destined to assume national prominence as national co-ordinator of the sect. The movement’s spiritual leader, Maina Njenga, insisted that he received the prophetic calling to lead the movement in a vision he had as a 16-year-old secondary school student.

244Youth Research Compendium
“Not yet Uhuru”, the rallying cry of the opposition became the genesis for its philosophy, initially articulated by a female secondary school headmistress at least three years before the sect began to actively constitute itself among a core of young idealists. Mungiki was thus a child of intense intellectual engagement with the prevailing context – a factor that continued to characterize the sect’s discourse. Mungiki has been singled out for mention here because of its prominence in the public imagination and discourse42 and also because it testifies to the continuing importance of educational and religious spaces as sites for nurturing social and political agendas.
As noted above, party youth wings had flourished during the youth of the preceding generation. The return of multi-party politics in the early 1990s brought a resurgence of politically motivated youth violence initially chal-lenged through these organs. However, the expansion of democratic space during this time rendered more difficult the brazen impunity of the official party youth wings, be they those associated with those in government or those of the opposition. As their power and visibility waned, they reconstituted themselves into two categories. On one hand, there were many vigilante groups bearing names such as Jeshi la Mzee (the Elder’s army), Kaya Bombo Youth, and Baghdad Boys, whose names and conduct encouraged public association of youth with political vio-lence, and in particular with such violence being perpetuated in the service of “elders”. This was most spectacu-larly demonstrated in the run-up and aftermath of the hotly contested and ultimately controversial 2007 general election.
The other heir to the youth-wing legacy was the phalanx of sophisticated “lobby groups” that first emerged in the run-up to the 1992 elections. If the vigilante groups had favoured the stick as their modus operandi, the lobby groups preferred to dangle the carrot. In contrast to the “goon squad image” of the vigilante groups, the lobby groups presented a highly articulate, well educated, and most of all, moneyed face, designed to impress, attract, and ultimately motivate Kenyans into voting for their sponsors. Instead of brute force, groups like Youth for KANU ’92 (YK ’92) refined the culture of “buying” public support. YK ’92 became a conduit for so much (newly minted) money at election period that the newly issued banknote for five hundred Kenya shillings became infor-mally known as “Jirongo,” the name of the YK ’92 chairman. YK ’92 was credited in some quarters with KANU’s success in the 1992 general election becoming the inspiration for myriad other youth groups on both sides of the political divide. Some of the founders and members of such groups may have been motivated by ideological com-mitment to the particular political philosophies of the parties or individuals they supported. For most however, it was the flashy personal success of some members of the “inner circle” of YK ’92 that provided the inspiration for their political activities. While not all of the YK ’92 members had political ambitions, over ten went on to become government ministers within the next decade, including UG politicians like Cyrus Jirongo, and William Ruto, who would go on to play kingpin roles in both the final months of the Moi regime, and on into the Kibaki era.
One of the interesting twists to emerge in the last decade - and which may well be the distinguishing factor of the UG’s youth - has been the reversal of the “invisible youth” policy. The influence of the various manifestations of the youth lobby declined dramatically as ‘youthfulness” became a positive quality for aspiring candidates to flaunt. This was best demonstrated during the 2002 election period when a wave of new young candidates whose brand was freshness and new ideas joined the established candidates on the front-row of election campaign platforms. Whereas youthfulness had been previously been a synonym for political naïveté and thus glossed over wherever possible, it now became equated with the push for a new moral order. KANU used the presidential candidature of political novice Uhuru Kenyatta, backed by the best known of YK ’92’s success stories, to launch its “kizazi kipya, mwongozo mpya” (a new generation, a new leadership) campaign.43 Meanwhile, the “elders” of the opposition began to highlight their association with its own “youth brigade.” Candidates who a decade earlier would have attracted only minimal interest in media coverage like Yvonne Khamati, Najib Balala, Jackson Mwalulu, Cecil Mbarire and Danson Mungatana suddenly became the focus of public attention. With time however, it became
42John Githongo observes that by 2010, vigilante groups were springing up in different parts of the country at a hitherto unprecedented rate, partly inspired, provoked or influenced by the idea of Mungiki. Mungiki arguably occupies a psychological space in the Kenyan imagina-tion today, in terms of its association with youth violence, comparable perhaps only to the colonial-era KLFA. Ambivalence characterizes public discourse on “Mungikis of the mind”, to borrow from Lonsdale’s conceptualization, evidence of the critical void – of a social and economic nature in addition to its political role – that such groups seek to fill in the absence of alternatives.
43Seenote10above.Therearethosewhoargue12thDecember1963tobemerelyasymbolicdate,andwhowouldthereforeincludeindividualsbornafter1960(whenitbecameclearthatKenyawasheadingforindependencesoonerratherthanlater)suchasUhuruKenyatta(born1961)andMusaliaMudavadi(bornin1960)tobetotheUG.Othersaremuchmorerigidonthedateandinsistthatitshouldbeadheredtoliterallyasacut-offpointbetweentheLostandUhurugenerations.

245Institute of Economic Affairs
apparent that the integration of youth into the top echelons of the powers-that-be was, for this moment at least, largely cosmetic. However, the UG had been successful in launching itself into the public sphere as a politically influential cohort with the potential of doing much more than merely supporting the agendas of its elders.
It is intriguing to watch how the UG has reflected the global historical context in different ways. Two examples worth noting in this regard are: the re-imagining of youth as a social category; and a new understanding of nation-as-community. The re-positioning of youth as a political influential social cohort has transfixed the world, particu-larly in the revolutionary uprisings in North Africa and the Middle East. While the UG’s entrance into the national public sphere has not been as dramatic, it is part of a bigger historical moment as significant as those influencing its predecessors. Another interesting connection with its global peers has been its embrace of the possibilities of the age of the Internet and increased accessibility to the world. In the same way the EAAG re-imagined “nation” beyond the bounds of ethnicity and the confines of a limited geographical space, so too has the UG extended Kenya into an imagined community stretching beyond the geographical confines of its political boundaries. The Kenyan diaspora of the UG is able to identify and participate in Kenyan national affairs in ways hitherto only a dream to those of other generations, not only has dual citizenship become a right under the 2010 Constitution, but many more than at any other time in the past are now able, through the Internet and regular visits home, to be partici-pants in social and political processes in the country even as they continue to study and work elsewhere.
The implications of all this are continuing to unfold even as the UG moves towards its own transition from youth into adult-hood. They must be considered alongside other factors that are shaping not only the UG’s growth into political adult-hood, but also in terms of influencing the next youth generation that is already beginning to imag-ine itself into being in its own right. Currently, it is difficult to demarcate between these two generations – a situa-tion that is likely to continue until the UG becomes the generation-in-adult-hood. As has been the case for the UG itself, the next generation will only then be able to define itself both in relation to the UG, and as its own entity.
Looking Forward: Generation Next (GN)This discussion has explored youth in Kenya as a socio-political category under-girded by endogenous traditions which continue within the present and are likely to influence the future. I argue that discussions on the emerging youth generation need to take into account the continuities from the past that will influence its formation. I have posited youth as a social category, a critical life-stage in which a generation is able to imagine itself as a distinct entity within society, identify a mission that meets the defining challenge of the time for which it is politically responsible, articulate a vision to work towards and identify a strategy to achieve it. Determinants to the success of any generation include the socio-political local and global context within which it must make its contribution and its relationship with the preceding generations. I have indicated the important role played by formative social institutions in influencing a generation towards the formulation of its agenda. I emphasize the role played by a critical core of people – often comparatively tiny - in the identification, definition and articulation of a generational historical mission. I propose that we take seriously the importance of longitudinal generational relationships.
It is currently impossible to definitely predict what the historical mission of the generation following the UG will be. Generational missions are dependent on the context within which generations live, and influenced by a range of factors, from both within and without the nation. Unforeseen circumstances on the local and international front might well end up determining the defining context for Generation Next; however the unfolding narrative of the Kenyan nation will play at least an equally important role in determining what it will have to deal with. As the past five generations have demonstrated, both global imperatives and local priorities will have to be taken into account in formulating the foundational task for this cohort.
Generation Next will continue into the 21st century the journey through nationhood began by the EAAG in its envisioning of a people united within common borders by a shared identity, without the stifling hierarchy of ethnic or racial difference. The MMG took the dream a step further, replacing the certainty of colonial rule and exploitation with the demand for independence under a majority (African) government. The LHG achieved the legal status of independence from Britain, while the LG widened the scope of political engagement, further chal-lenging the institutional status quo that had concentrated the political power of the nation in the hands of a tiny minority. With each, that “new order where every section of the community would have a practical part to play

246Youth Research Compendium
in the people’s government’’ seems to become more attainable. It is now up to the UG to take on the challenge of entrenching a new constitutional dispensation, preparing the way for Generation Next’s contribution to the mak-ing of this nation. Generation Next will be the biggest generational cohort Kenya has ever seen so far, given the youth bulge Kenya will experience in the next 10 to 20 years. The expansion of political space that the UG has already created for youth is likely to continue, ensuring that this category of the population will play a politically significant role. This suggests an urgent need for Generation Next in the areas of mentorship and the development of productive vertical generational relationships, facilitating its preparation for the responsibilities that lie ahead, including that of pass-ing on the baton to its own successor. Several of the challenges of the past five decades, particularly the troubling questions of social and economic inequalities and regional imbalances in terms of development, may, depending on the success of the UG in fulfilling its historical mission, persist into the tenure of Generation Next. It will have to find ways to address the challenges of its own demographic profile. Its numbers make high unemployment figures probable pointing to the need to find creative strategies to facilitate the management, ownership and deployment of natural resources and other economic factors, both local and global in nature. It will have to think about the provision and quality of critical social services and institutions within the context of the historical realities of the first quarter of this millennium. It must negotiate its way through a world in which old and new forms of globaliza-tion have a tangible impact on local realities unmatched in history. There is also the question of how it deals with the continuing evolution of democratic discourses enabling Kenya’s transition through the next stage of growing into nationhood. The extent of its success in meeting the challenge of defining and meeting its historical mission will be determined by those to whom it will bequeath its legacy.
References
ABANTU for Development and Amka-Space for Women’s Creativity. (2004). The Other Side of Prison: The Role of Women Left Behind. Nairobi: ABANTU for Development.
Anderson, B. (1991). Imagined Communities: Reflections on the Origin and Spread of Nationalism. Rev. edition. London and New York: Verso.
Atieno Odhiambo, E.S. (1995). The Formative Years. In Ogot B.A. and Ochieng’ W.R. (Eds.) Decolonization and Independence in Kenya: 1940-93 (25-47). London: J. Currey; Athens: Ohio UP.
Cabral, A. (1973). Return to the Source: Selected Speeches. New York: Monthly Review Press.
Drewal, M. (1991). Yoruba Ritual : Performers, Play, Agency. Bloomington Ind.: Indiana UP.
Fanon, F. (1963). The Wretched of the Earth. Paris: Presence Africaine
Githongo, J. (not dated). “From Madharau to Heshima.” Mansc.
Kenyatta, J. (1978). Facing Mount Kenya: the Traditional Life of the Gikuyu. Nairobi: Kenway Publications.
Lonsdale, J. (1990). Mau Maus of the Mind: Making Mau Mau and Remaking Kenya. The Journal of African History, 31(3), 393 – 421.
Maloba, W. (1989). Nationalism and Decolonisation. In Ochieng’ W.R. (Ed.) A Modern History of Kenya, 1895-1980: In Honour of B.A. Ogot (173 -201). Nairobi: Evans Brothers (Kenya) Ltd.
Mboya, T. J. (1963). Freedom and After. Nairobi: East African Educational Publishers.
Mue, N. (2001, July 1). The Uhuru Generation - The Messiah Within: Redeeming the Soul of Our Generation. Retrieved October 20, 2004 from http://www.africawired.com/TheSoulofourNation.htm
Murunga, G. R. & Nasong’o, S.W. (Eds). (2007). Kenya: The Struggle for Democracy. New York: CODESRIA.
Mwangola, S.M. (2010). Performing Our Stories, Performing Ourselves: In Search of Kenya’s Uhuru Generation. Diss. Northwestern U, Evanston.

247Institute of Economic Affairs
Mwangola, S.M. (2007). Leaders of Tomorrow? The Youth and Democratisation in Kenya. In Murunga, G. R. and Nasong’o, S.W. (Eds). Kenya: The Struggle for Democracy (pp.129 – 163). New York: CODESRIA.
Nasong’o, S.W. (2007). Negotiating New Rules of the Game: Social Movement, Civil Society and the Kenyan Transition. In Murunga, G. R. & Nasong’o, S.W. (Eds). Kenya: The Struggle for Democracy (Pp.19 – 57). New York: CODESRIA.
National Youth Policy Steering Committee (NYPSC). (2003, November 21). Draft of the National Youth Policy. The East African Standard, p.24 – 25.
Sicherman, C. (1990). Ngugi wa Thiong’o: The Making of a Rebel: A Source Book in Kenyan Literature and Resistance. New York: H. Zell Publishers.

248Youth Research Compendium
Vigilante Violence: Kenya’s Unholy Alliances9Katindi Sivi Njonjo
AbstractIn an attempt to review Vigilantism in the Kenyan context, this paper gives a broader definition of vigilantism beyond ‘taking the law into one’s own hands’ and details the numerous dimensions vigilantism subsumes as it takes on a spectrum of different forms, methods, motivations and causes. By classifying vigilante action into vari-ous typologies, the paper provides: an interactive analysis to understand behavioural activities of these groups; a phenomenological analysis to give a subjective reality of these groups; and a multi-level analysis in order to understand the groups at multiple levels drawing from various disciplines and theories. The paper also establishes the motivation for vigilante action among young people while analyzing its character to metamorphosize from one form of collective behavior to another. It concludes with an assessment of driving forces that have shaped the past and the present to determine possible future trends. Most vigilante accounts in Kenya are confined to urban slums with mention of a few groups in rural areas. However, the paper confirms that vigilantism is a countrywide problem that is embedded in our political, economic and social structures. Though vigilante groups are evidently viewed by many as an appropriate response to the problems of insecurity, and indeed there has even been an at-tempt to present them as a form of ‘community policing’, the analysis suggests a lack of distinction between vigi-lantism as a form of social control and vigilantism as merely deviant behavior.

249Institute of Economic Affairs
What is Vigilantism?Most commentaries on vigilantism seem to have generally adopted the limited context of vigilante activities as ‘private self help when the official agencies of rule enforcement have failed in some way’ (Rosenbaum & Seder-berge, 1976). In fact, vigilantism is commonly summarized as ‘taking the law into one’s own hands’ (Goldstein, 2003; Rattner & Yagil, 2004; de la Roche, 1996; Rosenbaum & Sederberge, 1976), which according to Johnson (1996:232) is a problematic conception because it causes confusion. In Johnson’s (1996) view, ‘writers who have examined the phenomenon have considerable disputes among themselves as to its precise character: whether or not it is essentially violent, conservative, extra-legal, organized, and directed only towards crime; whether it can be undertaken by agents acting on behalf of the state (such as the police) as well as by private citizens; and whether it is a genuine social movement or a mere social reaction. It is with these varied perspectives that the definitions occur.
Definitions of VigilantismThe term vigilante has a Spanish origin that means “watchman” or “guard”44 and a Latin origin, “vigilans/vigi-lantis”- the present participle of “vigilare” which means to ‘watch’.
Johnson (1996) defines the concept of vigilantism from a criminological lens. He looks at the necessary features of vigilantism which involve: planning and premeditation by those engaging in it; its participants are private citizens whose engagement is voluntary; it is a form of autonomous citizenship and, as such, constitutes a social move-ment; it uses or threatens the use of force; it is a reaction to real or perceived deviance; and it aims to control crime or other social infractions by offering assurances (or ‘guarantees’) of security both to participants and to others. According to him, this approach does not assume vigilante engagement to be extralegal. In fact, the social signifi-cance of vigilante activity is the confirmation of some fundamental social structural flaw.
Roche (1996) defines vigilantism as one of the varieties of collective behavior – the others being lynching, rioting and terrorism. According to him, each type depends on the level of organization and level of personal responsibil-ity.
In a review of vigilantism in South Africa, Harris (2001) defines vigilantism as a blanket term for activities that occur beyond the parameters of the legal system, purportedly to achieve justice. It covers a wide range of actions and involves an eclectic assortment of perpetrators and victims. Vigilantism can exist as an isolated, spontaneous incident or as an organized, planned action. It traverses local communities, as well as regional areas. Broadly, achieving justice is the apparent motivation for, and desired outcome of, vigilante actions. For this reason, vigilan-tism is often defined in relation to the formal criminal justice system and the law.
Typologies of VigilantismAs the definitions suggest, vigilantism subsumes a number of dimensions thus making the exact meaning of the term very difficult to pin down and analyze. Contemporary vigilantism must therefore be viewed as taking on a spectrum of different forms, methods, motivations, and causes (Harris, 2001). Typologies45 of vigilantism can help us contextualize these different forms, methods, motivations and causes.
‘Browns’ TypologyBrown (1975) classifies vigilantism from a historical and twentieth century perspective. Through his analysis of North American historical vigilantism in the eighteenth century, which he refers to as classic vigilantism, he identifies the phenomenon as a popular movement of citizens engaged in self-protection, what Johnson (1996), Rosenbaum & Sederberge (1976) refer to as crime control vigilantism. Huggins (1991) interprets this definition to mean organized, extra-legal movements, the members of which ‘take the law into their own hands’. Huggins however cautions that this definition may be misleading because not all cases of vigilantism are organized. In Latin
44 (http://www.apsu.edu/oconnort/3410/3410lect04a.htm)
45 Theauthorhascategorizedthesetypologiesaccordingtotheauthorsthatconceptualizedthem

250Youth Research Compendium
America for example, some are relatively spontaneous, or clandestine, not showing the continuing public presence and standing, and the brazen assertion of legitimacy of the older North American vigilante organization.
‘Rosenbaum and Sederberge’ TypologyRosenbaum & Sederberge (1976: 548-559) classify vigilantism according to intended purposes of vigilante action which can be largely grouped into: crime control vigilantism; social group control vigilantism; and regime control vigilantism.
Crime control vigilantism which is similar to Browns (1975) description of classic vigilantism is directed against people believed to be committing acts proscribed by the formal legal system. Such acts harm private persons or property, but the perpetrators escape justice due to governmental inefficiency, corruption, or the leniency of the systems due process. As such, private citizens take matters into their own hands and restore “law and order” as they share certain values with the established legal system and are attempting to extend the enforcement of these shared norms into their neglected communities.
Sederberg (1978), Culberson (1990), Johnston (1996), and Moses (1997) give the essential defining elements of crime control vigilantism. They argue that it embodies the following: a social reaction to crime; actions taken by civilians (whether as individuals, or as members of clandestine groups, large crowds, or mass movements) as opposed to government officials; a response that involves violence that exceeds the legitimate use of force in self-defense; an intent to inflict punishment and pain in order to avenge a previous wrong or to deter future mis-conduct or to incapacitate dangerous persons; a belief that the resort to force is necessary and justifiable because government agents cannot or will not provide protection or enforce the law; and a recognition that the remedies undertaken are illegal, since governments claim a monopoly over the legitimate use of force in the form of police and military action.
Social group control vigilantism is directed against low-ranked segments of society to keep them from rising above their socially prescribed positions. The diverse manifestations of this form of vigilantism may be roughly distinguished according to whether the identity of the target group is basically communal (i.e., having a primor-dial characteristic such as race, religion, caste, tribe, and the like), economic, or political. Examples of communal group control include: racial attacks in the United States where anti-black violence was viciously mounted by the Ku Klux Klan to terrorize Negroes back into their “’proper position” after the upward mobility they experienced during the Reconstruction; communal tensions in Malaysia in May 1969 which exploded into several weeks of bloody riots and an estimated 200 Chinese were killed because the dominant Malays resisted relinquishing sig-nificant control of the system to the Chinese community and the Chinese would not submerge their culture into that of the Malay; tribal violence in Africa, where the anti-Ibo attacks in Northern Nigeria in May and September 1966 were rooted in resentment against the economic inroads the industrious Ibos had made in the North; and religious attacks in Egypt in the 1930s when the Society of the Muslim Brothers repelled their countrymen for spurning religious orthodoxy and adopting Western culture. Similar violence has been exercised against heretical sects by orthodox Muslims in Pakistan and in Northern Ireland where the Catholic minority has been periodically victimized by the violence of the dominant Protestants.
Economic group control mainly revolves around class consciousness. An example of this type of social group con-trol includes the crashing of the upward mobility of peasant groups in Chile’s lake region during the Allende era that stimulated landowners to take defensive action.
Political group control revolves around state officials being tolerant of the violence of dominant communal or eco-nomic groups. Although the formal system is supposedly evenhanded in enforcing the law, the occupants of official positions may identify with the dominant communal groups and essentially support their efforts to maintain the status quo. The subtle official support of one side may range from biasing the manner in which these individuals fulfill their duties to an apparently deliberate policy of coercion towards deviant groups. At its extreme, this official support in violation of its own formal standards becomes a program of terror. Individuals and groups espousing dissident political views may suffer the loss of their formally guaranteed rights. This official form of social group control is common in more authoritarian regimes and ranges from terror and torture to the subtle evasion of

251Institute of Economic Affairs
defendant rights. In such cases, authoritarian elements may consider “democratic” guarantees as hindrances in dealing with revolutionary or even reformist, movements.
While politically motivated vigilantes enjoy the sympathy, and even support, of their national governments, some governments pretend to be unaware of their activities. However, vigilantism of this nature may persist despite repudiation by the central government, when local governmental officials conspire with the vigilantes. In develop-ing countries, the central government may be unable to fully eradicate vigilante activities supported by civilian or military leaders on the local level.
Regime control vigilantism is directed against a formal political order judged to have outlived its usefulness. Violence is intended to alter the regime, in order to make it a more effective guardian of the ‘people’. Examples include coups d’états in Thailand, Brazil, and Argentina. In many instances, this violence does little to alter the fundamental power relationships because political officeholders and even constitutions exist at the discretion of powerful social and political groups. While it is conceivable that private individuals or groups as such may engage in this type of action, the vigilantes generally either occupy official positions (e.g., in the army or the bureaucracy) or have powerful official allies. Some coups undoubtedly bring about significant alterations in the social base. Others may be reactionary, in the sense that previously disestablished groups regain their former position. Possible deep divisions among the groups included in the establishment could be another cause of this form of violence. Consequently, one establishment group may use extralegal coercion as a means of reducing or eliminating another group’s relative power position. In some cases, such action would alter the status quo.
Whereas these categorizations are meant for systematic comprehension of vigilante action, it is important to note that some vigilante groups may properly conform to one of the categories. For example, Rabbi Meir Kahane’s Jew-ish Defense League (JDL) which patrols American neighborhoods in order to prevent crimes against Jews, could be considered a communal social group control vigilante because it protects the Jewish establishment in areas where blacks are becoming the majority. Other vigilante groups are dynamic and conform to more than one category. The Society of the Muslim Brothers in Egypt and the White Hand of Guatemala for example began their existences as social group control vigilante organizations, but eventually undertook regime control activities.
‘Huggins’ TypologyHuggins (1991:4) classifies vigilante types according to the activities in Latin America. They include: lynching – which involves citizens action against another citizen presumed to have committed a crime or violated some social norm which may or may not result to the victims death; justiceiros (Justice makers) – who assassinate presumed criminals and alleged - usually poor - trouble makers and are sometimes on/off duty police and military, sometimes civilians; uprisings (citizens attacks on authority) – which involves citizens redressing deficiencies in their justice systems for example through street riots in a violent signaling of their disapproval of police corruption demand-ing more protection and greater police accountability; and death squads - characterized by violations of human rights. According to Huggins, one set of vigilante acts (lynchings, uprisings and freelance justice makers) represent, sometimes indirectly, citizen demands for more personal security and/or accountable law and order. Another set (death squads and on-duty police violence) represents actions by the state and its agents against groups of citizens perceived as threatening to security and ‘law and order’.
How Different Typologies of Vigilantism Have Manifested in Kenya Crime Control VigilantismCrime had been increasing between 1997 and 2000 before declining in 2001 by 6% and a further 6% in 2002 as a result of community involvement. In Nairobi for example, the introduction of hotlines and police information service expanded beyond the police stations contributed to the decline (CBS & MPND, 2002 & 2003). Reported crime increased by 10% between 2002 and 2003 because of increased awareness of the citizens rights and the democratic evolution in the country at the time (CBS & MPND, 2004). A further increase of reported crime in 2004 by 8.4% was reported. A decline of 25% was noted between 2004 and 2007 and this is attributed to the introduction of special police units leading to a reduction in rape cases and robberies along the major highways.

252Youth Research Compendium
Community policing initiatives also contributed to the reduction of crime (CBS & MPND, 2006; KNBS & MPND 2007; KNBS, 2008). Crime however rose again between 2007and 2009 before falling by 2% in 2010 (KNBS 2009 – 2011) as indicated on figure 58
Figure 58: Annual crime statistics between 1997 and 2010
Source: KNBS (2011 – 2008), KNBS and MPND (2007), CBS & MPND (2002 – 2006)
According to Anderson (2002), urban crime has been sharply rising since the 1980s - a period of rapid growth in the urban population, combined with acute housing shortages, declining economic prosper-ity, rising urban unemployment and the collapse of many institutions of municipal govern ment. The increasing proliferation of crime control vigilante groups is therefore a reflection of these growing crimi-nal activities in urban slums and the inadequacy, inefficiency and corruption of the police in these areas (Anderson, 2002; ICTJ, 2010; NTA, 2009 March; Okombo & Sana, 2010; Muller, 2008). Wairagu, Kamenji and Singo (2004) as cited by Keriga & Bujra (2009, March) confirm this when they say that the existence of vigilante groups in urban slums is founded on public anxiety about the levels of crime within their areas and ineffectiveness of police in tackling criminal elements. In their view, the rise of vigilantes in slums also paints the picture of in-equality as the more affluent areas, such as Muthaiga, Runda, and Lavington benefit from the protection provided by private security. Githongo (2008) attributes it to increase in unemployed youth. ‘On the old railway landhies estate at Muthurwa, just to the east of the city centre, there are no fewer than four separate vigilante groups, all organized and paid for by residents for their own protection. In Kongo-Soweto, one of Nairobi’s newer slums, each local neighbourhood also has its own vigilante group. A militia styling itself as the ‘Group of Forty’ has been operating at night on the Dandora estates since November 2001, the name recalling the famous Eastland gangsters of the 1940s who collected funds for the Mau Mau movement. Another vigilante group gathers near the mosque in Pangani each evening and is organized to prevent burglaries and muggings, believed to arise from the area’s proxim-ity to the slums of the Mathare Valley. In parallel to these groups operating on behalf of residential communities, retailers and commercial business people have also organized for their own security even in relatively low-income areas. For example in Ngara West, close to the city centre, there is a vigilante patrol protecting properties, includ ing kiosks and stores, each evening’ (Anderson, 2002: 543).
A report by Anyumba (2003), lists Zungu Zungu vigilante group (ZZVG) which consists of residents in Shauri Moyo estate as another group. It has links with the Kenya Police, Nairobi City Council’s (NCC) City Inspectorate, other Community Crime Prevention Associations (CMCA’s) and other vigi-lante groups. They see the major crime prevention challenges as: general lawlessness; carjacking; the utilization of the estate as a hide-out for hard drug barons and sophisticated criminals; concealing stolen

253Institute of Economic Affairs
property in the estate; and kidnapping and sale of minors. The informers are mainly residents, domestic workers, grounds men, passersby and business people in the area. Their crime prevention approaches include: use of code words; blowing whistles; ululating; contacting the police through hotlines; foot patrols and beats; dog patrols; street lighting improvement; and clearing of overgrown vegetation in the area. Mathare Progressive Youth Group (MPYG) was formed in 1999 by unemployed youth living in Mathare valley, initially a discarded quarry and one of Nairobi’s large informal settlements. They provide services in the slum, particularly in Mathare area 4, to get a legitimate income. These services include garbage collection, provision of security through visible policing and apprehending law break-ers. The group works with the Kenya Police, Nairobi City Council’s (NCC) City Inspectorate and the Provincial Administration.
According to Keriga & Bujra (2009, March: 9) and Anderson (2002), ‘Taliban, formed in the late 1990’s, was seen as a response to the growing criminal incidences in the Kariobangi North area. In addition to providing pri-vate security, the Taliban are said to protect the property and livelihoods of businesses and retailers. Mungiki also provide the much needed security in addition to water and transport services. It has spread to other low income and informal settlements mainly in Nairobi; particularly the slums of Korogocho, Githurai, Kariobangi, Mathare, Kayole, and Dandora’.
Examples of Crime control vigilante groups46, documented from various sources are tabulated on Table 57 .
Table 57: Examples of Crime Control Vigilante Groups47
Group Area of Operation Ethnic Affiliation Operation Source of Information
Mungiki All of Central province; Laikipia, Nakuru, Naivasha,Korogocho, Githurai, Kariobangi, Mathare, Kayole and Dandora
Kikuyu Security provision for residential homes and small businesses, rent and transport extortion, water and sanitary provision
Keriga & Bujra (2009, March); Anderson (2002); IRIN (2008, February 22); KNDR (2009)
Taliban Kariobangi North, Mathare, Huruma, Baba Dogo, and Kariobangi South
Luo Security and matatu extortion Anderson (2002); IRIN (2008, February 22); Gecaga (2007) ; KNDR (2009)
Baghdad Boys Kibera, Nyanza Luo Security IRIN (2008, February 22); Gecaga (2007) ; KNDR (2009)
Kosovo Kibera Luo and Luhya Security IRIN (2008, February 22); Gecaga (2007) ; KNDR (2009)
Siafu Kibera Luo Security KNDR (2009)Bukhungu Kibera Luhya Security KNDR (2009)Labour Youth Kibera Nubi Security KNDR (2009)Muungano wa Wanavijiji (The Organization of the Villagers)
Nairobi slum areas such as Kibera, Korogosho, Mathare
Mixed Established among the slum-dwellers of the city to fight evictions and protect tenants.
Anderson (2002)
Group of Forty Dandora Estates Mixed Security Anderson (2002)Kamjesh Kariobangi, Huruma, Dandora Mixed (Kikuyu, Luo,
Maasai, Kisii and the Luhya) but dominated by Kikuyu and Luo Youth
Levied matatus (Mini buses)plying the Kariobangi-city route by helping them fill up with passagers in return for a token Sh20 (an equivalent of US$ 0.4 then) per vehicle. The maintained a semblance of order and security in the bus terminus which was crime prone
Gecaga (2007); IRIN (2008, February 22) ; KNDR (2009); Okombo & Sana, (2010).
46Becauseoftheclandestinenatureofthesegroups,itisnotpossibletocaptureallofthem.Afieldsurveywouldhelpestablishwhotheyare,wheretheyoperatefromandotheractivitiestheyareinvolvedin.
47 Thegroupsinthissectionaredepictedfromtheircrimecontrolperspective.Thistabledoesnotenumeratetheothervigilantefunctions
androlesagroupdoesoutsidecrimecontrol.

254Youth Research Compendium
Bakongo Kawangware Congolese Security Okombo & Sana, (2010).Borana Korogocho Somali and Borana
communitySecurity Okombo & Sana, (2010).
Zungu Zungu Shauri Moyo Mixed residents Security Anyumba (2003)Mathare Progressive Youth Group
Mathare Valley, area 4 Mixed tribes of young men
Security, garbage collection Anyumba (2003)
The Hague Kirinyaga District Residents of Kirinyaga Counter Mungiki harassment and provide security
Nation and Standard Newspapers dated April 2009
Chinkoror Mainly Borabu and Gucha Abagusii Guarding territory against cattle rustlers and other perceived “enemies”
IRIN (2008, February 22); www.Kisii.com; KNDR (2009)
Sungusungu Suneka, Bonchari and the suburbs of Kisii town
Kuria and Abagusii Security and resolve domestic disputes
Fleisher, (2000); www.Kisii.com
Kebago Kisii Abagusii Security KNDR (2009)Other Community Crime Prevention Associations (CMCA’s)
City Estates Mainly residents of that particular estate
Security and crime prevention
Source: Various
From the above summary and following anecdotal evidence, most crime control vigilante action in Kenya is exer-cised by organized groups. These groups tend to coalesce mostly around ethnic lines with the support of residents in a particular area. Only a few crime control vigilante action is by individuals forming impromptu gatherings to lynch criminals like in Latin America. Though most groups are concentrated in urban slums as Anderson (2002), Keriga & Bujra’s (2009, March), Okombo & Sana (2010), and NTA (2009, March) assert, as evidenced by Table 57 and as will be witnessed throughout this report, vigilantism is a countrywide problem that is embedded in our political, economic and social structures.
Vigilantism is a countrywide problem that is embedded in our political, economic and social structures.
Can Vigilante Groups Provide Legitimate Community Policing?There has even been an attempt to present vigilante groups as a form of ‘community policing’ (Anderson, 2002). In the 1997 police service’s annual report (GoK, 1997), community policing is defined as ‘a concept that involves recruiting civilians as police reserve officers and the construction of police offices and residential houses on a harambee48 basis’ and is listed as one of the strategies to curb crime. This is because the forty-thousand force is overstretched and struggling to check escalating crime (Standard, April 22 2009). According to the article, a big number is deployed either as bodyguards and drivers or sentries at the homes of Very Important Persons (VIPs) such as cabinet ministers, diplomats, visiting dignitaries, judges and influential businessmen. This raises concerns that such deployments increase pressure on an already strained force at the expense of the war against crime. The Police Commissioner denies these claims saying that the forty-thousand police officers are adequate to provide security across the country. However, this is contradictory to the Police Strategic Plan 2004-2008 (Kenyan Police, 2004) which envisions a reduction of police-to-population ratio from 1:811 to 1:65049. The Central Provincial Commissioner (PC), also challenges the Police Commissioner’s statement when he admits that there is a shortage of police officers and that the government cannot at the moment send officers to many Constituency Development Fund (CDF) built police posts. According to the Saturday Nation, (April 25 2009), officers have cited limited resources, shortage of police officers and inadequate fuel allocation as reasons why the police cannot curb crime effectively.
Ruteere and Pommerolle (2003), view the concept of community policing as ambiguous and in practice, it may operate to reinforce undemocratic and oppressive structures in the Kenyan society. According to Baker (2002) as quoted by Anderson (2002), there is a blurred distinction between the formal policing undertaken by the agents of the state, and policing undertaken by a variety of private security forces including vigilantes. First and foremost, in Bakers view, vigilantes are dangerous to public order precisely because ‘they are prepared
48Harambee isKiswahiliforself-help.49UnitedNations(UN)standardsrecommendtheratioof1:400.

255Institute of Economic Affairs
to break the law to achieve their goals of protection and investigation, often using violent methods of control’. According to Brown (1975) and Madison (1973), vigilantes unleash violence portraying themselves as acting in self-defense and with the aim of restoring order. The fact that the response exceeds legitimate force does not qualify as self defense but as serious human rights abuses. Methods of punishment include mutilation in pub-lic, torture and illegal detentions, often with a view of extracting confessions (Human Rights Watch report, 2008) as depicted on case study 1.
Case Study 1: Bizare Sungusungu Killings
The Sungusungu group was founded in early 2002 by the local administration, political leaders and a few locals, because the government was not providing adequate security. Its members are mainly young men drawn from the Kisii community. Apparently, residents voluntarily contributed funds for the purchase of phones, weapons and flashlights as well as paying a monthly allowance to the youth who volunteer to patrol their neighbourhoods at night. The group had wide support due to the drastic reduction of crime. It was however banned by the Kenyan Police as well as community policing and children’s rights boss, in the wake of complaints from Gucha villagers that the community policing agents had turned into terror thugs. The group has been linked to a series of bloody executions (even of innocent people) in Suneka, Bonchari and the suburbs of Kisii town. Executions (of mostly thieves and witches) are carried out at night. The group lynches suspected lawbreakers, mutilates bodies (includ-ing chopping off victim’s private parts), burning etc. They have even gone as far as dictating how and where their victims are to be buried. They also run courts to resolve cases involving domestic violence.
Source: http://mongare.files.wordpress.com/2010/10/file-pic-of-man-burning-in-kisii1.jpg Source: http://www.kenyanlist.com/kls-wmk. php?path=attachments/
/20050311083631-lynching.jpg
Local politicians dare not speak against the gruesome executions even in the face of a nationwide outcry because doing so would cost them votes. Source: Kisii.com (2009, May 19; 2010, November 24; 2010, November 23; 2011, February 15)
Second, it becomes clear that vigilantism presents a social reaction to crime as being about rule of passion over reason because it does not guarantee a process of proving the villain guilty before action is taken against them. Because of the nature of vigilante groups to offer ‘instant justice’, innocent people have died as a result of mistaken identity. According to Integrated Regional Information Networks (IRIN, 2008 June 23) this is a classic example of mob law gone wrong.
Third, if the members of that group are of a clandestine nature, it does not rule out the fact that they could be out-right criminals. It therefore becomes difficult to distinguish who is legitimately out there to flash out crime - though in an unlawful manner and who is taking advantage of the situation to commit crime. Fourth, the fact that it is a system that could be used to avenge may mean that people could be punished for personal vendetta rather than a legitimate crime they committed. In Kirinyaga, about 500 members of a vigilante

256Youth Research Compendium
group killed Ms Jane Nyaruai, the head teacher of Kiangai Primary School. The group set her house and her car on fire before slashing her with Pangas. However, it has turned out that a family member may have set up the slain teacher following a dispute over the estate of her late husband. Residents said the gangs are now being used to settle scores (The Standard, April 25th 2009).
Fifth, vigilantism turns victims into victimizers. The method used to suppress crime by vigilantes often triggers counter attacks from retaliatory groups creating a more militant environment contrary to the initial group’s inten-tion to restore security in their communities as demonstrated in case study 2.
Case Study 2: The Mathira Massacre
‘The Hague’ vigilante groups are a team of four groups, formed to fill the security gap, in Kirinyaga District. The groups have grown in strength and numbers as a response to frequent attacks by the Mungiki criminal gang that has taken advantage of perceived laxity of security officers (Sunday Nation, April 25th 2009) and lack of justice (The Standard, April 29th 2009). Members of ‘The Hague’ killed fifteen people they accused of belonging to the proscribed Mungiki sect. When these groups started the anti-Mungiki campaign, residents were full of praise, following years of living under the gang’s stranglehold. Overnight, extortion was dismantled, eliciting cheers from the public. Traders from Kagumo market were especially happy, because Mungiki members who had been demanding protection fees went underground. What was not known to them was that the criminal gang was going to retaliate. On the morning of April 21st 2009, twenty-nine villagers had been hacked to death, an incident that has come to be referred to as the ‘Mathira massacre’ (Saturday Nation, April 25th 2009).
Sixth, the fact that remedies taken are illegal, contradict the laws of governance for a country which proclaims the up-holding of the rule of law. More concerned with suppressing disruptive behavior than with respecting due process, grants qualified approval to vigilantism’s simple, direct, swift, certain, and severe punishments as a ratio-nal response to the inadequacies, delays, and uncertainties of an allegedly “ineffectual” criminal justice process (Hofstadter & Wallace (Eds), 1970; Madison,1973; and Brown,1975). Legislation to compel law enforcement authorities to investigate, arrest, and prosecute ringleaders (Hofstadter and Wallace (Eds), 1970; Moses, 1997) should be put in place. This sympathy towards the role of vigilantes by formal structures and law makers coupled with the absence of laws and regulations to counter these illegal acts, gives room for vigilante groups and other criminal gangs to become more vicious. By supporting these groups, the government authorities are effectively tell-ing the population that it is acceptable to use extreme violence to achieve any ends (Human Rights Watch, 2008)
This sympathy towards the role of vigilantes by formal structures and law makers coupled with the absence of laws and regulations to counter these illegal acts, gives room for vigilante groups and other criminal gangs to become more vicious.
Lastly, proponents of vigilante groups argue that there has been significant drop in criminal activities. However, countervailing forces and ideologies insist that the police and prosecutors press charges against those who exceed the legal limits of the legitimate use of force in self-defense. The tenets of professionalism espoused by law enforce-ment officials proclaim that the criminal justice process must be controlled by experts, not laymen who want to break rules and impose their own notions of just deserts. Civil rights and civil liberties organizations advance the argument that due process safeguards and constitutional guarantees must be followed in order to protect innocent persons from being falsely accused, mistakenly convicted, and unjustly punished. Vigilante “justice” has been ex-posed as too swift and too sure, with its kangaroo courts and railroading of suspects, and too severe, with vicious beatings and brutal on-the-spot executions as punishments that do not fit the crime.

257Institute of Economic Affairs
Social Control Vigilantism50 From Rosenbaum and Sederberge’s (1976) accounts, social control vigilantism has sub-types which for purposes of distinction can be categorized into two: those carried out at the public level by the state, what Rosenbaum and Sederberge’s refer to as “official vigilantism”; and those carried out at the private level, what Rosenbaum and Sederberge’s refer to as “group control vigilantism” and includes ethnic, class, moral and religious group control. According to Brown (1975), group control vigilantism happens to maintain communal, ethnic and other sectarian order and values.
Official Vigilantism A first sub-type of social control vigilantism is “official vigilantism” which according to Huggins (1991), repre-sents actions by the state and its agents against groups of citizens perceived as threatening to security and ‘law and order’. State agents carry out this form of vigilantism either: directly (direct official vigilantism) where on/off duty police and/or military officers openly assassinate presumed criminals and alleged trouble makers; or through private proxies (private official vigilantism) where coercion orchestrated by the state against real or perceived op-ponents to its authority and policies is carried out by non-state actors, such as paramilitaries, and militias, who are directly or indirectly supported by the government. The state supports these groups to get weapons, personnel, logistics, and intelligence, financial sponsorship and it refuses to quell the repressive activities of these informal groups for political gain (Roessler, 2005). A Kenyan analysis seems to suggest a manifestation of both. ‘Direct’ Official Vigilantism in KenyaHuman rights campaign groups have severally condemned the Kenyan Police Force for carrying out executions without proper investigations. According to the People’s Daily Online (January 28, 2007), their ‘shoot to kill policy’ of notorious criminals without due process emanated from a directive by the Kenyan Internal Security Minister who said the government would not allow criminals to continue killing police officers. He instructed police to shoot and kill any armed criminals because trying to arrest them meant they risked being shot. On duty police are therefore known to shoot compliant suspects in broad day light at point-blank range, a phenomenon that resembles Latin America’s justiceiros incidences.
One such example is the elaborate documentation of extra-judicial executions by the Kenya National Commission on Human Rights (KNCHR, 2008 September). Close to 500 people were executed between June and October 2007 by officers of the Kwekwe anti-Mungiki police squad51. The report revealed egregious violations of the law and fundamental human rights. These acts may have been committed pursuant to official policy sanctioned by the political leadership, the Police Commissioner and top police commanders. Whereas initially the police mainly used firearms to execute the suspects, they subsequently changed their modus operandi to using such methods as strangulation, drowning, mutilation and bludgeoning as indicated in the post-mortem reports. The change of strat-egy was to make members of the public believe that rival Mungiki gangs are responsible for the killings. Several witnesses told the KNCHR that the killer squads carried machetes, iron bars, ropes and other crude weapons in their vehicles. Their bodies were deposited in various mortuaries in the country, some left in the wild and others dumped in various locations such as forests, desolate farms, rivers and dams.
50Brown(1975)alsoreferstoitasNeo-Vigilantism
51KwekwesquadaresaidtobeaSpecialCrimeUnitmandatedtocurbtheMungikimovementandotherallegedcriminals
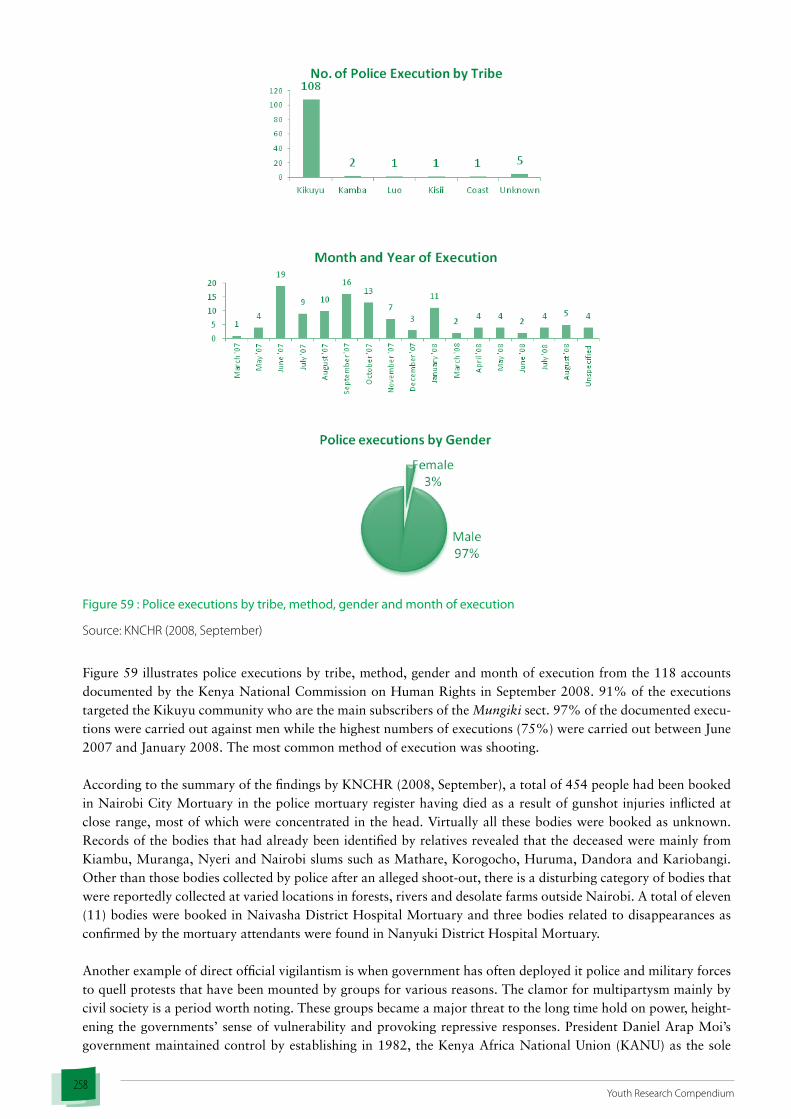
258Youth Research Compendium
Figure 59 : Police executions by tribe, method, gender and month of execution
Source: KNCHR (2008, September)
Figure 59 illustrates police executions by tribe, method, gender and month of execution from the 118 accounts documented by the Kenya National Commission on Human Rights in September 2008. 91% of the executions targeted the Kikuyu community who are the main subscribers of the Mungiki sect. 97% of the documented execu-tions were carried out against men while the highest numbers of executions (75%) were carried out between June 2007 and January 2008. The most common method of execution was shooting.
According to the summary of the findings by KNCHR (2008, September), a total of 454 people had been booked in Nairobi City Mortuary in the police mortuary register having died as a result of gunshot injuries inflicted at close range, most of which were concentrated in the head. Virtually all these bodies were booked as unknown. Records of the bodies that had already been identified by relatives revealed that the deceased were mainly from Kiambu, Muranga, Nyeri and Nairobi slums such as Mathare, Korogocho, Huruma, Dandora and Kariobangi. Other than those bodies collected by police after an alleged shoot-out, there is a disturbing category of bodies that were reportedly collected at varied locations in forests, rivers and desolate farms outside Nairobi. A total of eleven (11) bodies were booked in Naivasha District Hospital Mortuary and three bodies related to disappearances as confirmed by the mortuary attendants were found in Nanyuki District Hospital Mortuary.
Another example of direct official vigilantism is when government has often deployed it police and military forces to quell protests that have been mounted by groups for various reasons. The clamor for multipartysm mainly by civil society is a period worth noting. These groups became a major threat to the long time hold on power, height-ening the governments’ sense of vulnerability and provoking repressive responses. President Daniel Arap Moi’s government maintained control by establishing in 1982, the Kenya Africa National Union (KANU) as the sole

259Institute of Economic Affairs
legal political party, and the office of the president assumed ultimate power. Opposition movements were crushed, and political dissidents were detained, tortured, and killed openly by the state forces. In August 1991, political op-ponents of the government formed an umbrella alliance, the Forum for the Restoration of Democracy (FORD), to challenge Moi’s monopoly of power. In early October 1991 a political rally calling for multipartyism was banned by the government, and more than three hundred people were arrested preemptively. Less than six weeks later, the government arrested the country’s first vice president, Oginga Odinga, and other leaders of the FORD alliance for planning to hold a demonstration in support of democracy.
According to Ajulu (1998), the developments in the run up to the 1997 elections bore a striking similarity to the 1992 electoral period which had produced a similar controversial result. First, a series of violent confrontation between the security apparatuses of the state and the opposition alliance had been provoked. In July 1997 barely five months away from the elections, political mobilization, which started with the Limuru Convention on consti-tutional reforms, culminated in the Saba Saba52 confrontation with President Moi’s feared paramilitary force, the General Service Unit (GSU), which left ten people dead, most of them students, and hundreds injured. A week later, the security forces again stormed a peace prayer in Nairobi’s main Anglican church, and left a prominent church leader and opposition activist, Reverend Njoya for dead.
‘Private’ Official Vigilantism in KenyaAccording to Roessler (2005), governments turn to party loyalists to counter the growing number of real or perceived political challengers with a deniable, expendable, and cheap alternative to the army, security, or police forces. In the early 1990s, African autocratic governments relied on abusive policies and these groups to counter opposition groups and resist democratic reforms pressured on them by donors. Figure 60 illustrates the path to privatized state violence.
Figure 60: Path to privatized state violence
Source: Roessler (2005)
In Kenya, as accounted by Roessler (2005), the international community, also started to weigh in and threatened to terminate Kenya’s aid if government did not open its political system and improve its human rights record. Moi continued business as usual despite the external conditionalities but in December 1991, one month after the suspension of donor assistance, the government lifted a ban on opposition political parties and legalized multipar-tyism though President Moi repeatedly warned that democracy would descend the country into ethnic violence.
According to Kagwanja (2005), it is in this period that KANU instituted a reign of state-sponsored vigilante terror in urban areas using militias called Majeshi ya Wazee (‘armies of the elders’), with the aim of derailing democracy. Accounts by Okombo & Sana (2010) suggest that unemployed youth received between Sh100 (approximately UD$ 2 at the time) and an equivalent of Sh300 (approximately US$ 6) for activities such disrupting political rallies or circulating threat leaflets, and between Sh300 (approximately US$ 6) and Sh500 (approximately US$ 10) for
52OnJuly7,1997,citizensdefiedapreviouslyunchallengeableregimetomaketheirwaytoNairobi’sKamukunjigroundstopressthecasefordemocracy.Thegovernmentrespondedinaregularfashion,andmanypeoplewerekilledinbrutalsuppression

260Youth Research Compendium
assignments deemed more challenging such as beating or killing opponents with crude weapons, petrol-bombing party offices, burning opponents’ homes, etc. The Jeshi also benefited from free food, alcohol, cigarettes and drugs. Some politicians who developed intimate relations with group leaders would even pay their rent or secure govern-ment employment for them. Most were initially recruited from among criminal gangs who terrorized estates and Matatu touts. Later, the university student community provided a fertile ground for recruits.
As Kenyans went to the polls in 1992 against the background of land clashes, suspicion of rigging and opposition disunity, political thugs discovered the need to get more organized and structured in order to make better gains from politicians. Thus, better organized and structured groups emerged in Nairobi after the general election, and by the end of the 1990s, Jeshi-ism had become an organized industry with well-defined supply and demand lines (Okombo & Sana, 2010).
The period preceding the 1992 elections proved to be bloody. Though the government asserted the violence was spontaneous, a deeper look at the violence reveals that it was incited by members of the Kalenjin and Maasai eth-nic groups, including elites close to Moi who feared democracy would undercut their privileged status and favor larger ethnic groups, like the Kikuyu and the Luo, who supported the FORD opposition alliance (GoK, 1992; Hu-man Rights Watch, 1993). According to Kagwanja (2005), the KANU elite embarked on playing the ethnic card by underwriting ‘tribal militias’ to assault rival ethnic groups with spears, arrows or swords. According to Roessler (2005), they claimed the Rift Valley as their “traditional homeland” and publicly vowed to keep “foreigners” (that is, Kikuyu) out of the province. Their motives were clearly political: to disrupt and disenfranchise pro-opposition communities, reward KANU and Moi supporters with lucrative land plots, and deter individuals from joining the opposition parties. Moi’s government succeeded in concealing its role in grossly violating the human rights of its citizens.
In Kagwanja’s (2005) view, the public security forces, which were accused of disproportionately promoting and favoring Kalenjin officers, guaranteed Moi their loyalty during the transition to multipartyism, and thus failed to intervene to stop the ethnic violence. In some instances, the security forces supported the Kalenjin Warriors. As the violence continued, it spread to other parts of the country. Violent irregulars attacked opposition strongholds in the Western Province near the Uganda border in an effort to disenfranchise pro-opposition ethnic blocs there, too. Similar violence erupted in Nyanza Province. Over 1,500 people were killed, and 300,000 people were displaced. The government-sponsored political disorder and the skilful use of patronage strained the tenuous opposition co-alition. Less than five months before the election, the FORD party fragmented due to elite infighting. Moi won the election with only 36.35 percent of the total vote. Despite the wide spread violence and displacement, the election was legitimized by an observer group from the Commonwealth, who declared that the elections “directly reflect, however imperfectly, the expression of the will of the people.” Moi’s regime tried to weaken the democratically empowered opposition by sponsoring armed irregular units to attack Luo, Luhya, and Kikuyu communities, the ethnic groups that comprised the dominant opposition political parties. Wary of the signals massive human rights abuses would send to the international donor community, the regime publicly distanced itself from the violence by portraying the “ethnic clashes” as “solely based on a land dispute” or blamed the opposition “tribalists” for instigating the violence and “provoking civil war.”
According to Kagwanja (2005), between 1991 and 1998, violence linked to ‘tribal militias’, such as the Maasai Morans, Kalenjin Warriors, and Kaya Bombo (Digo of the Kenya Coast), claimed an estimated 3,000 lives and displaced nearly half a million Kenyans.
Inanelaborateaccountofthe2007postelectionconflictasdepictedbyCaseStudy3,youngKalenjin
menwereralliedandtrainedtoflashoutthe“blemishes”(NjoguEd,2009p.280-284).

261Institute of Economic Affairs
Case Study 3: Kalenjin Warriors in 2007 post election violence
Danny53, explains the way Kalenjin local and political leaders as well as wealthy businessmen incited, equipped and fully funded young men to defend their community during the height of campaigns and after elections. They were asked to flash out the ‘madoadoa’54 from their community with the claim that ‘the foreigners had oppressed their people and finished them when the Kibaki government took over and sacked many Kalenjin employees. The outsiders had also grabbed their land and were now taking a different political stand from the dominant stand taken by the Kalenjin. When the violence started, the young men were informed about weapons that had come from Mt. Elgon. In some areas like Nandi and Cheptirwai, some warriors were taken to be trained on how to use guns by the retired or ex-military men. Others were armed with bows and arrows to chase away, mainly Kikuyus. The young men were organized in groups like a battalion and patrolled in shifts. Most of the young men according to Danny had no choice but to comply with orders and participate otherwise one risked being beaten, cursed and ex-communicated from the community.
A week or two into the 2007 post-election crisis, armed groups using the Mungiki name and style of operation be-gan to ‘defend the Kikuyu’ who, up to this point, had been largely on the receiving end of the explosion of violence. In all likelihood, these groups were organized and sponsored by politicians. Around the end of January, Mungiki groups attacked, on a large scale, the Luo and others in the Rift Valley towns of Naivasha and Nakuru which had a strong Kikuyu population (Harneit-Sievers & Peters, 2008; Kenya Thabiti Taskforce, 2009). In popular percep-tions, these attacks marked the re-establishment of a ‘balance of terror’ in the ethnic warfare that the Kenyan post-election crisis had degenerated into.
Meanwhile, from the onset of the multiparty era in the early 1990’s, individual politicians mobilized young men in their rural areas to disrupt rallies and intimidate supporters of other contenders.
Table 58: Examples of Privatized Official Vigilante Groups in Kenya
Name of Vigilante Group (s)
Area of Operation
Reason for Existence and source of information
KANU Youth Wingers formed in the 1960s
Countrywide During the clamor for Independence, many African young men in the Kenya Boy Scouts Association (KBSA) left and joined youth wings of political parties that promised their members jobs and positions of authority. By 1963, KANU youth wingers began acting as self-appointed policemen and judges while collecting money for their “services”. In particular, Kikuyu leaders of a section of the KANU Youth Wing in Kiambu were planning to form a new military organization to replace the Kenyan Army under the leadership of former Mau Mau generals. The youth wingers disdained rival groups, and often attacked uniformed scouts as government stooges (Parsons, undated). According to Okombo & Sana (2010), the mid- 1980’s though marked the rise of political thuggery in its current form. The KANU government allowed the provincial administration to allocate civilians security management duties in the slums. Ideal recruits were youth of average education aged between 20 and 35. These young men would later be recruited as Youth Wingers to ensure compliance.
Sri Lanka and the Kuzacha Boys formed in the 1980s
Slums and estates in Mombasa district
Activities linked to rival political factions in the town (Anderson, 2002)
Baghdad Boys formed in 1991 Nyanza province and Kibera
Formed at the time of the Iraq war in 1991 when Kenya was experiencing an outburst of political violence prior to the 1992 elections, the Baghdad Boys targeted opponents of a prominent Kisumu political clique. The group achieved national notoriety after its members successfully broke into a police station and a chief’s camp to free detained colleagues (Anderson, 2002; IRIN, 2008, February 22)
Kaya Bombo Youth formed in 1997
Kwale district Instigated by prominent politicians and with the support of the government and military. They were deployed to foment ethnic violence in the run-up to the 1997 elections at the coast. The group is blamed for the massacre of 70 people in Kwale, and the murder of six policemen at Likoni (Anderson, 2002).
Chinkororo formed in the 1990s
Kisii According to Anderson (2002), they muster support during political campaigns.
53Nothisrealname
54AKiswahiliwordmeaningblemishesandreferringtonon-Kalenjincommunities

262Youth Research Compendium
Amachuma formed in the 1990s
Kisii According to the Nation (13 March 2002) as quoted by the IRBC (2002, December 5), Amachuma, means ‘a piece of metal’. According to Kisii.com (2009 May 19), Amachuma is loosely used in light of the metaphore above to mean any tough youth that hangs around politicians during campaigns. These young people are used as bodyguards or to “protect vested interests” of politicians.
Jeshi la Mzee/Majeshi ya Wazee formed in April 1997
Nationwide KANU, determined to contain opposition activities, the Moi government transformed Vijana na KANU (which was a remnant of the Youth for KANU 92) into president’s civilian army – jeshi la mzee (Okombo & Sana, 2010). According to Anderson (2002), they: disrupted a pro-reform rally at Nairobi’s Kamukunji grounds; played a pivotal role in the election campaign of Fred Gumo, the KANU candidate in Nairobi’s Westlands Con stituency; disrupted Charity Kaluki Ngilu’s presidential campaign in the Kamba area; were caught on camera in 1999 attacking and inflicting serious injuries upon Presbyterian Church of East Africa (PCEA) clergyman Timothy Njoya, who was part of a peaceful demonstration near to the parliament buildings in Nairobi
Jeshi la Embakasi Nairobi’s Eastlands area
Were supporters of the late David Mwenje and have been linked to land protests and terrorizing tenants in Nairobi estates. It is rumored that members of the Jeshi la Embakasi are also active supporters of Mungiki (Anderson, 2002).
Runyenjes Football Club Runyenjes, Embu Formed as a sports association by local MP Njeru Kathangu and used as a base for mobilizing his political support (Anderson, 2002).
Jeshi la King’ole Ukambani Formed to counter external political aggression in the Ukambani region by John Harun Mwau, formerly director of the Kenya Anti-Corruption Authority (KACA) and leader of the opposition Party of Independent Candidates of Kenya (PICK). The football club became a vehicle for the mobilization of political support for rallies and other public events, could disrupt activities and are said to have been ruthlessness in dealing with their paymaster’s rivals.The group had 400 recruits (Anderson, 2002).
NDP supporters Langata constituency in Nairobi
Well organized in defending Raila Odinga political interests (Anderson, 2002).
Hit Squad Murang’a district Employed by Joseph Kamotho (Anderson, 2002).Jeshi la Mbela Taita- Taveta. Private militia owned by Darius Mbela (Anderson, 2002).Kalenjin warriors Rift Valley Young men in these ethnic groups undergo circumcision as a rite of passage, and as a result, develop
a certain esprit de corps with their age mates, a trait that facilitates mobilization. It is these young Kalenjin men that form the Kalenjin warrior groups (IRIN 2008, February 22).
Maasai Morans Rift Valley Mobilized by politicians to perpetuate conflictMungiki Central Nairobi, Rift
ValleyProvinces
Politicians have used the Mungiki to intimidate Kenyans into supporting particular parties or candidates. The Mungiki also believe that the political leadership of this country should always be headed by a Kikuyu, as prophesied by Mugo wa Kibiru. So they accept as true that it is upon them to organize a revolution to usurp political power and ‘return’ it to the Kikuyu (gucokia uthamaki kwa nyumba ya mugikuyu), from whom it was stolen after the death of Jomo Kenyatta, the first president of Kenya. For this to happen, they believe, violence and bloodshed similar to the MauMau liberation struggle is inevitable. They accuse the government of pursuing policies that impoverish Kenyans. Therefore, they do not respect the law, which they perceive as perpetuating tyranny (Kamungi, 2002 December)55
Source: Various cited
Anderson (2002) in reviewing vigilantism in Kenya from the context of political violence argues that vigilante groups in Kenya will again be used as political instruments in the electoral struggle.
Group Control VigilantismA second sub-type of social control vigilantism is “group control vigilantism” that occurs at the private level by social groupings. Group control vigilantism has diverse manifestations and is roughly distinguished according to whether the identity of the target group has a primordial characteristic such as class, race, religion, caste, tribe etc. In Kenya, group control vigilantism has manifested itself in four distinct ways: ethnic (mainly due to political and economic reasons), moral, religious and class.
Ethnic VigilantismThis is violence intended to regulate pariah ethnic groups. The multi-ethnic dimension in Kenya is closely linked to what Richardson & Sen (1996) refer to as big tribes using the political system to close and exclude others leading
55Thisisacontradictiontotheirpracticesbecausetheyextortpoorpeoplefortheirowngain

263Institute of Economic Affairs
to beliefs, attitudes and behavior of dominance and subordination hence turbulence. Subordinate groups endure discrimination for some time but a sense of shared deprivation strengthens identification with their own (ethnic) group. This provides a basis for political mobilization along ethnic lines. Often, the tribal leaders of the subordi-nate group may make timely political statements and in the end, the subordinate (ethnic) group having radicalized their ideas engages in contestation action against the dominant group. According to Kenya Thabiti Taskforce (2009), ethnic vigilantism in Kenya also has very close inter-linkages with economic causes of conflict which relate to means of livelihood including ownership and control of means of production such as land, capital and labour. According to Brown (2003), land scarcity and its distribution aggravated by other factors such as a high rate of population growth and environmental degradation, has contributed to the violent “clashes” in Kenya.
The issue of land in Kenya became contentious on the arrival of colonial settlers and related disputes among the varying communities began soon after independence when Government established various mechanisms to enable Africans access land. Majority of land buying companies were established in Central Province and individuals from this region benefited from sale of land in Rift Valley. Resettlement of Kikuyu’s in Mpeketoni’s Coast province by Kenyatta’s government as well as ownership of huge tracts of land by the political elite in Coast and Rift Valley are worth noting. A sense of resentment soon began to develop towards these new land owners, with indigenous communities at large never accepting the new title deed owners who had more legitimate right over the land (Keriga & Bujra, 2009, March: 10). According to Muchai (2002), the advent of multi- party politics and increased population made it increasingly difficult for both the indigenous communities and new farm owners, often referred as ‘foreigners’ to live together in harmony. Since multi-party politics were usually formed along tribal affiliations, it became easy to incite politically based tribal clashes between communities. In Muchai’s (2002) view, this period also marked the beginning of land related clashes56 in 1991 in the Rift Valley, Coast, Nyanza and Western Prov-inces, incidences that would later repeat themselves in 1997, 1998 and 2002. Most clashes (53.3%) were confined to Rift Valley, Nyanza (26.7%), Eastern and Coast provinces (each experiencing 6.7%).
A good example of ethnic vigilantism is portrayed in Rift valley by the Kalenjin Warriors groups. According to IRIN (2008, February 22), well organized community defense training forms an integral part of the transition from childhood to adulthood in the seven ethnic groups collectively known as Kalenjin in Rift Valley. Young men in these ethnic groups undergo circumcision as a rite of passage, and as a result, develop a certain esprit de corps with their age mates, a trait that facilitates mobilization. It is these young Kalenjin men that form the Kalenjin Warriors groups. Wafula Okumu, of the South African-based Institute of Security Studies (ISS), tells IRIN of two such groups that caused conflict in the Uasin Gishu district during the 2007 post election violence: People’s Libera-tion Army reported to be “liberating” land owned by Kikuyus in the region; and Group of 4157 who are reportedly well-organized and commanded, “probably by people with a military background”.
Other such ethnic vigilante occurrences have been instigated by groups such as the Sabaot Land Defence Force (SLDF) incorporating inter alia, the Kenya Land Defence Force (KLDF) which is a mutation of Mooreland Forces around Mt. Elgon, Mombasa Republican Council (MRC) which is also associated with the Mulungunipa For-est Group in Kwale, Chinkororo in Kisii, pastoral groups such as the Pokot ponchons, Oromo Liberation Front (OLF) of Ethiopia operating from bases in Upper Eastern Province and other cattle rustling outfits in the North among others58.
According to IRIN (2008, February 22), SLDF has been blamed for most of the violence that has rocked the Western district of Mt Elgon in the past two years. It was formed after claims of injustice over land allocation in a settlement scheme in the district. The Mt Elgon conflict involves two main clans of the dominant Sabaot com-munity - the majority Soy clan and the minority Ndorobo clan - and revolves around disputed government alloca-tion of land to squatters in a settlement scheme known as Chebyuk. The district has an estimated population of 150,000. Government officials estimate 45,000 people have been displaced and 132 killed since 2006. The group
56Landclashesisatermthatreferstotheviolentconfrontationbetweendifferentethnicgroupsoverlandproblems(Muchai: 2002:80),andoccursinareaswherelandisperceivedtotraditionallybelongtocertaincommunities.
57Apparentlyitisabout41tribesofKenyaagainsttheKikuyu
58Thislistofnamesiscontainedinanunpublishedreport,‘Kenya’ssilentsocialinsurgentsholdinguscaptiveaswedillydally’byAliKorane,aformerPermanentSecretaryforHomeAffairsinKenyaandisnowasecurityandlawenforcementconsultant.

264Youth Research Compendium
was officially headed by a man called Wycliffe Matakwei Kirui Komon and SLDF was the most powerful and best-armed group operating in that region. Its hit-and-run attacks from the Mt Elgon forest were a major challenge for the authorities to quell the rebellion.
According to Oyugi (2002), the indigenous groups of Coast Province have long complained of domination by watu wa bara59 in terms of economic opportunities. Indeed such sentiments have often taken the form of calls for a majimbo (neo-federal) system of government by leading politicians from the Coast province, notably Cabinet Minister Shariff Nassir. It should be recalled that on the eve of independence, a leading Coast politician - Ronald Ngala - led the pro-majimbo group. According to the Standard (4th June 2011), the Mombasa Republican Council (MRC) claims to be an education campaign movement about rights and resources, particularly land, among Coast residents. They argue that Coast has been marginalised since Independence and has remained underdeveloped and poor hence the reason for seeking self-determination. In a memorandum presented to Coast Provincial Com-missioner by the MRC Likoni branch chairman Rashid Kivyaso on May 6, the group noted that after the 2007 post-election violence, the Government decided to buy land to resettle Internally Displaced Persons (IDP’s) but the squatter problem of landlessness at the Coast was not addressed. The group also complained about Coast com-munities getting a raw deal during the recruitment of youth into the police service [and other employment oppor-tunities]60, claiming those from other parts of Kenya have been taking up the opportunities. The MRC spokesman Mohamed Rashid Mraja claims that 80 per cent of Coast residents are living as squatters on their own land.
The report says that the movement would embrace dialogue in addressing the grievances, adding they do not target to uproot wabara61. The officials of the movement also disassociate themselves with Al-Shabaab62 and the 1997 Likoni clashes63. They claim that they are branded inciters and accused of military training in Mulungunipa forest and taking oaths. MRC has been outlawed by the government based on the Prevention of Organized Crimes Act 2010. Devolution is seen as one of the ways in which the group will advance its course.
Chinkororo are traditional warriors of the Abagusii community. According to Kisii.com (2009 May 19), they are much like the Morans of the Maasai community. They are to be found in Borabu and Gucha districts which border the two communities the Abagusii have since time immemorial had adversarial relations with the Kipsigis and the Maasai. Chinkororo are mobilized when there is an ethnic conflict and the government is not quick enough to provide security. They protect the Abagusii families living along the two districts’ borders, pursue stolen livestock and sometimes – admittedly – engage in acts of cattle rustling in order to compensate those whose livestock is stolen but never recovered.
According to Kamungi (2002, December), among pastoralist communities, the traditional practice of cattle raiding was done seasonally as a rite of passage into adulthood, and to obtain cattle for bride price. Raiding was also a means of restocking after calamities such as prolonged drought. Cattle were a status symbol, and raids part of the communities’ history. Given their purpose, raids were predictable, infrequent and controlled not to cause death or harmfully affect the lives or livelihoods of the society. The Pokot, Turkana, Marakwet, Tugen and Keiyo raided each other, but lived harmoniously until the onset of multi-party politics in the 1990s, when the raids eventually acquired belligerent and criminal tendencies. As the practice gained political character, the introduction of small arms changed the nature of the raiding custom and increasingly, communities are amassing weapons for their own security, and to carry out raids and retaliation missions. In March 2001, failure to return stolen animals resulted in the death of more than 58 Marakwet when Pokot raiders attacked Kasegei, Kaptul, Kwenoi, Katemunge, Karawi,
59Upcountrycommunities60Authorsownemphasisfromotherreadingsthatsuggestcoastaltribesareviewedaslazyandthereforegetbypassedwhenit
cametojobrecruitmenteveninCoast.Allthejobsthereforewentto‘watuwabara’i.e.non-coastalcommunities61In1997,sixpolicemenwerekilledwhenlocalraidersarmedwithtraditionalweaponsandgunsrampagedthroughthe
LikoniareaintheCoastprovinceofKenya.Apolicestationandoutpostweredestroyed,alongwithcountlessmarketstallsandoffices.ManyKenyansfromnon-indigenoustribeslikeLuo,Luhya,KambaandKikuyuwereeitherkilledormaimed.MoreinformationcanbeaccessedfromtheAkiwumiCommissionOfficialTranscript,July21,1998.
62Ashortenedversionof‘watuwabara’i.e.non-coastalcommunities63Anecdotalevidencesuggeststhatthewordmeansyouth.Al-ShabaabissaidtobeamilitantjihadistgroupwithinUnion
ofIslamicCourts(UIC),anorganizationsomeofwhosemembersaresuspectedbytheUSgovernmentofsupportingter-rorism.

265Institute of Economic Affairs
Kacheturgut, Kakimoi and Kisang villages and burnt over 600 houses. They also drove an unknown number of cattle stolen from the Marakwet. Before this attack, the Pokot had warned that they would ‘teach the Marakwet a lesson that they would not forget.’ Ensuing insecurity forced more than 7,000 Marakwet to seek shelter and refuge in caves (Lagams) along the Cherangany escarpment, while others migrated to neighbouring TransNzoia and Uasin Gishu districts.
The Oromo Liberation Front (OLF) is a nationalist group in Ethiopia that has been designated as a terrorist group (Barno, 2007). In Kenya however, OLF is regarded as a cattle rustling outfit in Upper Eastern region of Kenya. Their incursions have led to deaths of many pastoralists in that region.
Table 59: Examples of Ethnic Vigilante Groups64
Name of Vigilante Group (s)
Area of Operation Reason for Existence
Chinkororo formed in the 1990s
Kisii Chinkororo is a term used to describe the traditional warriors of the Abagusii community. They protect the Abagusii families living along the Gucha and Borabu districts’ borders, pursue stolen livestock and sometimes – admittedly – engage in acts of cattle rustling in order to compensate for stolen livestock. (Kisii.com, 2009 May 19).
Sabaot Land Defense Force (SLDF)
Mt. Elgon area Disputed allocation of land in a government scheme between the majority Soy and minority Ndorobo
Pokot Ponchons Pokot Cattle rustling outfitsOromo Liberation Front (OLF) Upper Eastern Cattle rustling outfitsMombasa Republican Council (MRC)
Coast Support the cessation of Coast province
Mungiki Central, Rift Valley and Nairobi
Defend Kikuyu’s and mount retaliatory attacks against enemy communities
Group of 41 Uasin Gishu Is a sub-group of the Kalenjin warriors claiming to be mobilizing all other tribes against the Kikuyu (IRIN 2008, February 22).
People’s Liberations Army Uasin Gishu Is a sub-group of the Kalenjin warriors reported to be “liberating” land owned by Kikuyus in the region (IRIN 2008, February 22)
Balarget Land Defense Force
Molo, Mau Kenya National Dialogue and Reconciliation [KNDR], (2009)
Kalenjin Land Defenders Molo, Mau Kenya National Dialogue and Reconciliation [KNDR], (2009)Kalenjin Youths Molo Kenya National Dialogue and Reconciliation [KNDR], (2009)Kalenjin Warriors Rift Valley Young men in these ethnic groups undergo circumcision as a rite of passage, and as a result,
develop a certain esprit de corps with their age mates, a trait that facilitates mobilization. It is these young Kalenjin men that form the Kalenjin warriors groups (IRIN 2008, February 22).
Source: Various
Moral VigilantismAccording to Roche (1996), vigilantism can manifest itself as a moralistic response to deviant behaviour. A dem-onstration of this type of vigilantism in Kenya was in February 2010 when a group calling itself ‘Operation Gays Out’ took to the streets with the intention of flushing out a gay couple that was intending to get married. Accord-ing to the Sunday Nation (February 12th, 2010), dozens of Christian and Muslim youth led by Sheikh Hussein Ali, the Council of Imams and Preachers of Kenya (CIPK) Kikambala region coordinator and National Council of Churches of Kenya (NCCK), Kilifi district representative Bishop Laurence Chai stormed the apartment where three men — including a gay couple — had been staying. The angry group arrested five suspected homosexuals, including two who were rescued from youths baying for their blood. Women who were among protesting locals, yelled at the top of their voices and called for an operation to flush out lesbians also claimed to be living among locals. “God created men to provide sexual pleasure to us (women). What will happen now that they have turned to each other? Who will marry our daughters,” shouted a woman. The two clerics declared having successfully stopped the homosexual nuptials that they said was announced to take place in the town 20 days earlier. “We
64Itisimportanttonotethatmostcrimecontrolvigilantegroupswithadistinctethniccharacterwouldalsofallintothis

266Youth Research Compendium
thank God for saving this town from being turned to Sodom and Gomorrah65 of this era as we may have been on the verge of being doomed,” said Bishop Chai.
According to the East African (November 15, 2000), Mungiki, a movement that initially claimed cultural and religious revival, advocate another way of life, another value system as a result of the failure of the Westerniza-tion project. Members who subscribe to the taking of snuff, sporting dreadlocks, praying facing Mount Kenya and circumcising their women as a religious practice crusade against drunkenness, broken families and vices like prostitution. On the Kenyatta Day (October 20, 2000) weekend, its members tried to hold a prayer meeting in Nairobi’s Kayole Estate but were stopped by armed police. Enraged, they proceeded to attack women in the area whom they deemed “improperly” dressed because they were wearing trousers. Six women were stripped naked in a frenzy recorded by press cameras. According to a report by LandInfo (2010, January 29) quoting IRIN (2008, Februsary 22), Mungiki holds trials for people who violate its strict rules of dress or behavior, detaining, maiming and even killing those it finds guilty.
Religious VigilantismGroup control vigilantism may also be employed when religious values are threatened by the spread of secular-ism, heresy, or competition with another faith. According to a perception study commissioned by the Institute of Economic Affairs (IEA, 2009), Kenyans are overwhelmingly religious with well over 90 percent being religious. The vast majority belong to a Christian denomination with a sizeable minority being Muslim. There seems to be a general acknowledgement that there are religious differences that may cause people to treat each other with a certain level of prejudice but not to worrying levels. However, Muslims feel most aggrieved by unequal or suspi-cious treatment by government and people from other faiths who label them as ‘terrorists’. People’s opinions of other religions seem to emanate from existing stereotypes, hearsay or a personal encounter with an individual, sometimes in a non-religious context, rather than from accurate information about that religion. The standard measure used to judge other religions is often one’s own practices and beliefs which are perceived by the individual as the right ones.
The fact that religion in Kenya has historically been ethnic and regionally based is also cited as one of the points of conflict (Kenya Thabiti Taskforce, 2009). According the task force, the perpetrators of the 2007 post election vio-lence attacked churches66 and not mosques. Most of the respondents to a survey carried out by the team attributed the burning to harboring Kikuyu ethnic group members (57%), breakdown of religious morals and values (22%), and the fact that the church leadership had openly taken political sides in the 2007 elections (20%).
The Constitutional contestation about Kadhi’s courts and the predominant fear among Christians that Muslims want to take over Kenya and eventually make it an Islamic64 nation65 has also antagonized relations between Muslims and Christians (Tayob, undated). While Christian leaders argue that the inclusion of the courts in the constitution is giving preferential treatment to one religion over others, Muslims feel that their exclusion from the Constitution reinforces their continued marginalization in the national body politic69.
In an elaborate account by Barno (2007), the anarchy in Somalia is a source of international, insurgent, national-ist and Islamic extremist terrorism both to itself and the region. The porous Kenya Somalia border potentially creates a haven for criminal gangs, drug traffickers, pirates and terrorists (Makinda, 2007). Al-Shabaab, a word purported to mean youth is, according to Barno (2007), ‘the group that forms the core military wing of Union of Islamic Courts (UIC) in Somalia. The UIC, which replaced hostile warlords in Mogadishu, is said to be more pur-poseful and organized and appeals to religion and nationalism in its mission to unite Somalia. The UIC is however
65ThesearecitiesintheBible(Genesischapters18and19)thatweredestroyedbecauseofsin.Homosexualityislistedinthesepassagesassin
66Accordingtoamemberofthetaskforce,therewere400churchesburntduringthe2007postelectionviolenceandnotasinglemosquewastouched.
67 CitingtheAbujaDeclarationasthe‘hiddenagenda’68 According to theWorldDirectoryofMinoritiesandIndigenousPeoples (seehttp://www.minorityrights.org/3951/kenya/muslims.
html),some(Christian)leadersraisedthespecterofKenyabecominglikeNigeriaorSudan,specificallyraisingfearsthatSharialawcouldbeappliedinthepredominantlyMuslimNorth-EasternandCoastalprovincestoabuseChristians.
69 Bythetimethispaperwasconcluded,theConstitutionhadbeenpassedinAugust2010andtheprovisionsoftheKadhi’scourtswereretainedintheconstitution

267Institute of Economic Affairs
causing great concern in Kenya because its core leadership consists of former Al-Ittihad al-Islami (AIAI) group – loosely translated as striving in the way of Islam and is reported to have links with al-Qaeda. AIAI’s aim was to establish an Islamic state and the creation of a greater Somalia. It grew between 1984 and 1991, taking mainly the disadvantaged and penetrating all spheres of the society. It soon started engaging in business, especially commer-cial activities in small towns and cities. As it grew, the AIAI spread its wahhabist ideology70 through products of academic scholarships to Saudi Arabia and Egypt, thus attracting many converts by its fierce criticism of scientific socialism and traditional shaafism in sermons after evening prayers. Its preaching was punctuated with calls to adopt Sharia law and bring sustainable law and order. The collapse of Said Barre’s regime allowed the financially stable, nationalist and highly organized AIAI to supplant government structures, take over businesses, set up schools, establish Islamic courts and even enlist its own army. However, the civil war destroyed the AIAI when clan loyalties overcame religious differences and they were outwitted by clan-based militias. Today, the group is said to have retreated to its massive economic ventures especially in Kenya and Djibouti. Counter terrorism officials insist that al-Qaeda operatives involved in the 1998 and 2002 attacks in Kenya and Tanzania are sheltered by AIAI/UIC elements in Mogadishu’. Various media reports claim that this group has set up infrastructure within Kenya to train its military and are recruiting young Kenyan Somali men to join the group.
Class VigilantismAccording to the Kenya Thabiti Taskforce (2009), though the 2007 post election violence started as inter-ethnic, it quickly began gaining an intra-ethnic-interclass dimension. In Kisumu for example, young Luo rioters after ‘driv-ing out all the enemies’, started harassing their compatriots accusing them of being ‘too healthy’ or ‘too happy’. It seemed as if the problem was not among the warring ethnic communities but among the ‘poor’ versus the ‘rich’ within each ethnic group. According to Richardson & Sen (1996), it is typical of ethnic conflict to have an intra-ethnic and inter-class dimension as a way of solidifying the group as a strategy for greater militarized conflict.
Regime Control VigilantismGovernment or regime ineffectiveness suggests that vigilante action may be directed against the regime itself, if the established sectors find their lack of capabilities too frustrating. Regime control vigilantism, then, is establishment violence intended to alter the regime, in order to make the “superstructure” into a more effective guardian of the “base’’ (Rosenbaum & Sederberge’s, 1976). A perfect example in Kenya is the attempted coup to overthrow Moi’s government on 1 August 1982. Huggins (1991) suggests another form of regime control to include uprisings and protests. A classic example is in North Africa where popular protests were held in various countries and in Egypt, toppled the dictator government. Such protests in Kenya were seen in the 1990’s during the clamor for multi-party democracy by mainly civil society organizations to 2002 when the Moi Regime ended.
The Chameleonic Nature of Vigilantism As with any classification, the categorization of vigilante action may seem to oversimplify reality, for human beings can have multiple purposes for their actions and can fill multiple roles which overlap rather than neatly compart-mentalize (Rosenbaum & Sederberge, 1976: 10). This is true for Kenya especially in the case of crime control and the various aspects of social control vigilantism because they are so intertwined and almost not mutually exclusive.
Interestingly, most vigilante groups start off with legitimate courses that are endorsed by the people whether it is to provide security or whether it is to protect themselves and their values. However, their character is not silod to one form as witnessed in the previous accounts. Vigilante groups can change to other forms of collective behavior. A security sector reform report by ICTJ (2010) confirms this when they argue that the character of vigilantes, militias and gangs can metamorphosize from one form to another, often for sustenance. Vigilantes can acquire traits similar to those of militias by acquiring weapons; choosing a leader and wielding of immense power in ad-dition to politicization of their activities and operations. Once politicized, vigilantes and militias easily degenerate into criminal gangs when the political elite cease to fund them usually after helping the politicians to attain their political objectives.
70Islamic religious thought that requires Muslims to live like the prophet Mohamed

268Youth Research Compendium
Militia groups According to Shultz, Farah, and Lochard (2004), a militia in today’s context is a recognizable irregular armed force operating within the territory of a weak or failing state. The members of militias often come from the under classes and tend to be composed of young males who are drawn into this milieu because it gives them access to money, resources, power, and security. Not infrequently they are forced to join; in other instances it is seen as an opportunity or a duty. Militias can represent specific ethnic, religious, tribal, clan, or other communal groups. They may operate under the auspices of a factional leader, clan, or ethnic group, or on their own after the break-up of the states’ forces. They may also be in the service of the state, either directly or indirectly. Generally, members of militias receive no formal military training. Nevertheless, in some cases they are skilled unconventional fighters who acquire weapons. Within the parameters of this general characterization, militias can vary widely in terms of how they organize, recruit, operate, and conduct themselves thus requires close attention to the cultural and political context in which they exist.
Alvarez (2006) says that militias, often referred to as paramilitary organizations or sometimes are created in order to engage in acts of collective violence. Members of militia groups often believe in the cause in which they serve, but also feel no compunction about exploiting the situation for personal gain. They are trained in violence and are a particularly deadly form of social organization frequently implicated in the worst excesses of the regimes which they serve, including mass murder, genocide, rape, torture, and various other human rights violations. According to Human Rights Watch (2003), militias engage in “systematic and indiscriminate attacks on civilians, [including] summary executions, arbitrary arrest and detention, disappearances, torture, rape, pillage, corporal punishment and other violent acts.” They have been central players in the politics and usually operate under the control of a recognized and powerful leader.
The description of militia groups in Kenya is as described by privatized official vigilante groups enumerated on Table 58
Criminal gangsShultz, Farah, and Lochard (2004) on the other hand refer to criminal gangs as armed criminal groups possessing a clandestine or secret hierarchical structure and leadership whose primary purpose is to operate outside the law in a particular criminal enterprise. Such groups frequently engage in more than one type of criminal activity and can operate over large areas of a region and globally. Often, these groups have a family or ethnic base that enhances the cohesion and security of its members. These armed groups typically maintain their position through the threat or use of violence, corruption of public officials, graft, or extortion. The widespread political, economic, social, and technological changes occurring within the world allow organized crime groups to pursue their penultimate objec-tive—to make as much money as possible from illegal activities—in ways that their earlier counterparts could not. It is important to note that once the groups mature, they no longer rely on the hierarchical leadership for their sur-vival. These groups have a code of behavior that entails “allegiance, rituals, ethnic bonds…[to] help to engage the compliance and loyalty of individuals within the organization.” These “ties that bind” allow group members to trust one another in ways that are very personal, reducing the likelihood of law enforcement infiltrating the group.
In Kenya, criminal gang activities range from pick-pocketing, snatch & grab attacks to bank robberies, carjack-ings, accosting people withdrawing money from Automated Teller Machines (ATM) to targeting people in parking lots or entertainment spots and dragging them into waiting vehicles only to demand ransom from their families. Other forms of crime which may or may not be committed by criminal gangs as reported to the police are tabu-lated below.

269Institute of Economic Affairs
Table 60: Number of crimes reported to the police stations between 2006 and 2010 by crime category
Crime Category 2006 2007 2008 2009 2010
Homicide 2,090 1,912 2,037 2,214 2,239
Offences against morality 3,525 3,673 3,116 4,068 4,817
Other offenses against persons 18,723 17,831 16,496 20,539 20,012Robbery 5,234 3,492 3,401 2,938 2,843
Breakings 7,420 6,337 6,626 7,053 6,453
Theft of stock 2,209 1,568 2,269 2,876 2,244
Stealing 10,874 10,749 11,435 11,972 11,986
Theft by servant 2,700 2,169 2,387 2,732 2,591
Vehicles and other thefts 1,660 1,221 1,387 1,439 1,365
Dangerous drugs and criminal damage 5,821 5,401 4,407 5,541 5,081
Traffic offences 62 46 120 59 103
Criminal damage 3,518 2,770 3,760 3,417 3,327Economic crimes 1,873 1,908 1,898 2,324 2,662Corruption 252 177 133 158 62Offences involving police officers 76 32 33 56 37Offences involving tourists 84 10 6 5 1Other penal code offences 6,104 3,732 3,994 4,864 4,956
Source: Economic Survey, 2011
Groups listed in Kenya as criminal gangs are as tabulated on Table 61
Table 61 : Examples of criminal gangs in Kenya
Name Group (s) Reason for Existence and/or Source of Information‘The Army / Boys of Beirut’ Gun-wielding hijackers and muggers who pounce on motorists and commuters (Daily Nation, 10
April 2006) Kenya: Eastlands: Where Life is Nasty, Brutish And Short)Bumps Ahead Daily Nation (19 February 2010) Karanja Youth andKaberenge Daily Nation (19 February 2010) Yes We Can71 Daily Nation (19 February 2010) 12 Flamingos Daily Nation (19 February 2010) Bunkers72 also referred to as 14 Gendarmerie Daily Nation (19 February 2010)
Kosovo73 also referred to as the 12 Disciples Daily Nation (19 February 2010) Tuff Gong Daily Nation (19 February 2010) Dego Youths Daily Nation (19 February 2010) 40 Ndugus Daily Nation (19 February 2010) ODM Youths Daily Nation (19 February 2010) Darajani Daily Nation (19 February 2010) Jipange74 Daily Nation (19 February 2010)
Super 75 Daily Nation (19 February 2010)
Thaai76 Daily Nation (19 February 2010)
71 This is a contradiction to their practices because they extort poor people for their own gain
72 Not yet profiled by the police73 Currently redundant but are reviving with new names74 Currently redundant75 Not yet profiled by the police76 Is said to be a version of Mungiki77 Is said to be a version of Mungiki

270Youth Research Compendium
Wailer groups77 Daily Nation (19 February 2010) Kenda Kenda Daily Nation (19 February 2010) Bantu Daily Nation (19 February 2010) Ngoroko Daily Nation (19 February 2010) Nyalenda Base Daily Nation (19 February 2010) The Chief Squad Daily Nation (19 February 2010)Nyamasira Massive Daily Nation (19 February 2010) Baghdad for Peace Daily Nation (19 February 2010) Karamojong Boys Daily Nation (19 February 2010) Saba Saba Daily Nation (19 February 2010) Artur Margaryan Daily Nation (19 February 2010) Kebago Daily Nation (19 February 2010) Angola Msumbiji The Standard (20 October 2010)Banyamulenge The Standard (20 October 2010)Charo Shutu The Standard (20 October 2010)Coast Housing Land Network The Standard (20 October 2010)Congo by Force The Standard (20 October 2010)Dallas Muslim Youth The Standard (20 October 2010)Japo Group The Standard (20 October 2010)Kamkunji Youth Group The Standard (20 October 2010)Makande Army The Standard (20 October 2010)Sakina Youth The Standard (20 October 2010)Siafu The Standard (20 October 2010)
Source: Various cited
From the accounts of this paper, Mungiki elicits all the typologies of vigilantism discussed and has spiraled down to a gang at one point or another as illustrated in Case Study 4.
Case Study 4: The Mungiki: A Case of Vigilantism, Militia Grouping and Criminal Gangsterism
Different authors give different perspectives of the Mungiki sect. Wamue (2001) traces the group’s origin and religious character to an evangelical sect known as the ‘Tent of the Living God’, founded in the Laikipia district, in 1987, under the leadership of the charismatic preacher, Ngonya wa Gakonya. The movement initially drew upon Kikuyu traditional values in establishing an indigenous alternative to the materialism of the many evangeli-cal Pentecostal churches. Mungiki’s supporters were initially predominantly young (under 30) and as the movement has grown, it has attracted a high proportion of Kikuyu’s displaced from the Rift Valley districts during the 1992 and 1997 elections. As a result, it has become firmly embedded among the urban poor of Nairobi’s slum estates and from Wamue’s perspective, the group speaks for the poor and dispossessed, but with a distinctively Kikuyu voice. Turner and Brownhill (2001) see the movement as representing a ‘rebirth’ of the Mau Mau struggle of the 1950s for ‘land and freedom’. They describe Mungiki’s support for Rift Valley farmers displaced in 1992 and 1997 ethnic clashes and empha size the growing role of Mungiki in urban protests against oppressive land lords and corrupt urban ‘land-grabbers’. Kagwanja’s (2003) mention is of the movement as having descended to political tribalism and how its programmes and activities have accentuated insecurity, violated human rights and dis-rupted public order demonstrates Anderson’s (2002) view of Mungiki as being clearly more complex, multi-faceted, heterogeneous and decentralized. As one scholar77 puts it, Mungiki is a pseudo-religious, pseudo-political and quasi military organization which expresses the hopelessness that has been created by the deteriorating economic situation. Anderson (2002) views the sect as materialist - with reference to extortions and control of matatu terminuses; instrumentalist - owing to the fact that the movement has evi-dently participated in political violence; and ethnocentric in character as it calls for kikuyu political unity and cultural consolidation. Anderson (2002) finds it hard to reconcile the strident, violent, criminal and in-creasingly intimidatory tactics employed by the movement in Nairobi’s slums with Wamue’s conclusion that Mungiki’s ‘core values’ remain essentially rooted in an apolitical and passive rural support base.
77Dr. Edward Kisiangani as cited in Reuters, 19th April 2002 by David Mageria

271Institute of Economic Affairs
Who Executes Vigilante Violence and Why?Reports on vigilante activity mostly point to unemployed young men as perpetrators of the violence (IRIN 2008, February 22). In their view, these young men are mostly aged between 20 and 35. According to Youth Agenda (2008), youth involvement in the 2007 post election violence (a form of privatized official vigilantism) was extensive. They were involved in 7% of all the incidences of the pre-planned violence, contributed 7% of all the finances that went into the electoral violence and executed 55% of all the violence. Members of various vigilante groups comprise of mainly young men aged between 15 and 35. Between 2001 and 2010, 62% of crime in Kenya (which can be largely attributed to criminal gang activities) was committed by young men aged 16 and 25 (Various Economic Surveys).
In establishing the reasons that contributed to the post-election violence, Kenya Thabiti Taskforce (2009) found out that idleness (which caused youth to be paid to cause violence) and lack of economic empowerment were the most (93.8%) cited reasons. According to Brinkman (2001) as quoted by Kenya Thabiti Taskforce (2009), socio-economic factors have frequently been important causes of violent conflicts. Many of these conflicts in his view are as a result of unequal distribution of jobs, licenses, contracts, taxation, subsidies, investments and services across different groups in the country more than poverty. Other reasons included:
EducationLow transition rates from primary to secondary school as indicated on Table 62 and the inability to access post secondary education for most young people coupled with poor educational conditions and low quality training and relevance of the education they receive, excludes them from most white collar jobs that require high level skills.
Table 62: Primary to Secondary School Transition Trends by Province
1999 2000 2001 2002 2003 2004 2005 2006 2007 2008* Average 1999-2008
Coast 32.6 31.0 33.4 32.5 31.0 52.1 34.0 39.0 40.0 46.1 37.17
Central 46.3 48.6 46.9 57.3 58.5 59.6 63.7 64.7 57.4 64.2 56.72
Eastern 38.7 36.3 38.2 47.5 48.9 51.2 49.4 53.5 46.8 51.2 46.17
Nairobi 29.0 29.6 27.0 32.5 33.5 34.5 50.9 58.3 38.0 45.9 37.92
R. Valley 32.9 34.2 37.2 21.1 21.6 41.7 48.5 54.3 42.5 46.7 38.07
Western 53.2 49.4 51.0 52.6 53.7 55.8 52.0 59.8 49.5 60.1 53.71
Nyanza 39.4 42.4 50.0 35.4 36.1 47.3 57.1 63.6 50.2 56.8 47.83
N. Eastern 43.2 46.4 52.8 42.9 43.8 44.9 45.1 44.2 40.5 45.7 44.95
Total 39.9 40.1 40.9 41.7 42.6 50.6 52.1 59.7 59.7 59.9 48.72
Source: Kenya National Bureau of Statistics, 2003-2009
UnemploymentThe Central Intelligence Agency (CIA) estimate Kenya’s unemployment to be at 40%. According Omolo (See Chapter 3), youth overall unemployment [from independence until 2005/2006] was at least double the national unemployment rate. Omolo states that Kenya’s unemployment is mainly attributed to the slow growth and weak labour absorptive capacity of the economy, mismatch in skills development and demand, imperfect information

272Youth Research Compendium
flow and inherent rigidities within the country’s labour market. According to the rate at which the net jobs were created was not the same as the rate of labour force growth. This is evidenced by the fact that the informal sector has been growing at an average rate of 17.2% per annum compared to the formal sector which has been growing at an average of 2.23% per annum while the country’s working age population increased by 24.5% between 1999 and 2006. This effectively means that more job seekers, both the new labour market entrants and those out of employment through the various labour separation mechanisms, ordinarily remain out of employment for a longer period hence swelling the ranks of the discouraged job seekers.Youth unemployment increased from 6.7 percent in 1978 to 25.1 percent in 1998/1999 before easing to 12.7 per-cent in 2005/2006. Unemployment is severe among youth in urban (33%) areas than in rural areas (17%). How-ever, the most affected are young women whose unemployment rate in urban areas is 40%. Idle youth therefore agree to form gangs, vigilante and militia groups. The Kenya Thabiti Taskforce (2009) noted a significant number of youth who perceived discrimination on tribal basis as the cause of their unemployment.
InequalityBrinkman (2001) as quoted by Kenya Thabiti Taskforce (2009) notes that liberalized and globalized markets not only provide many opportunities but also sharpen the distinction between losers and winners. The winners are increasingly the educated, skilled and know how to use new technology. In Brinkman’s view, it is not surprising that parts of Kenya with better social and economic infrastructure tend to have dominant representation in both political and economic institutions of the country.
According to Society for International Development [SID] (2004), Kenya espouses various types of inequalities. These include differences in share income and social services across regions, gender and specific segments of the population. The country’s top 10% households control 42% of the total income while the bottom 10% control less than 1%. The difference in life expectancy between Central and Nyanza provinces is a staggering 19 years. The doctor patient ratio in central is 1:20,700 but in North Eastern it is 1: 120,000. 93% of women in North Eastern province have no education at all compared to only 3% in central province. While inequality is a visible and significant phenomenon in Kenya, it has an uncannily low profile in political, policy and scholarly discourse.
It is this skewed distribution of resources78 according to Freeman (2005) as quoted by Kenya Thabiti Taskforce (2009), rather than poverty is what escalates conflict.
Patron-client relationships between youth and politiciansKagwanja (2005) locates the utilization of youth in politics within patron-client relationships where generational identities have been manipulated and instrumentalized by Africa’s patrimonial elite. Quoting Cruise O’Brien, he says that Africa’s young people, ‘are very poorly equipped to make their opposition effective. With their limited resources they are easily manipulated by their elders’79
What future Vigilante trends therefore should we expect? According to Sivi-Njonjo (2011, May & 2010), Kenya in the next 10-15 years will transition from a child rich to a youth rich population structure. This is mainly due to the fact that many women are giving birth later, spacing their children more or giving birth to fewer children. According to the UN (2007), fertility rates are expected to decrease from the current 4.6 in 2009 to about 3.6 in 2025. IMR is also expected to decrease from 52 to 49 chil-dren per 1000. This will reduce the population annual growth from 2.7 to 2 in 2025. However, population will increase from the current 40 million people in 2010 to 57.6 million people in 2025. The median age of Kenyans is expected to reach 20 years in 2025 from the current 18 years. This situation is likely to resort to various opportuni-ties and challenges.
78Freemanreferstothisasrelativedeprivation,atermhedefinesasaconditioninwhichpeopledeprivedofsomethingtheyhad,butsubsequentlylost,orwhenothershavegainedrelativetothem.Mostformsofdeprivationlikelytoleadtoconflictarepoliticalandeconomicinnature.
79DonalB.CruiseO’Brien,‘Alostgeneration:youthidentityandstatedecayinWestAfrica’,inRichardWerbnerandTer-enceRanger(eds),Post-Colonial Identities in Africa (ZedBooks,London,1996),p.55.

273Institute of Economic Affairs
This rapid population increase will strain the environment due to overuse of natural resources such as water and land. With more people demanding for scarce resources, environmental degradation and global warming, re-source conflicts can only escalate, militarizing the environment even more.
Rapid population increase will be the result of Kenya’s youth bulge given the fact that the highest proportion of Kenyans will be in their reproductive age. This places more demands on social amenities such as education, health care and sanitation infrastructure. Low supply of these essential services would cause more disgruntlement from an already relatively deprived segment of the population which would worsen future conflicts as argued by Free-man (2005). However, if Kenya adequately increased its social financing and ensure equal and quality provision of education, health and sanitation facilities to all youth at all levels, quality of life would improve and eventually bring about chances of better socio-economic opportunities. Like in Korea during the peak of its youth bulge in the mid seventies, the governments increase in education by 653% while reducing the number of out-of-school youth from 5.1 to 3.6 million, enabled the country to reduce the rate of population increase and eventually increased its workforce as a result of more qualified and highly skilled youth released to the job market thus reducing the dependency ratio and propelling the country from a low income to a high income country (Opiyo & Agwanda, Unpublished).
There will be a continued demand for more employment due to the increasing number of youth joining the job market at a faster rate than the jobs are being created. Currently, out of the unemployed working age popula-tion, about 70% are under age 30 (Omolo, unpublished). Given that unemployment among urban youths is much higher, large cohorts of idle youth will be easy to recruit to gangs, militia, vigilante and terrorist groupings.
Many of the countries with young and youthful populations have among the world’s weakest economies due to high dependency ratios. According to PAI (2010), between 1970 and 1999, these countries experienced an average annual economic growth rate of 3.6 percent. This growth can increase if young people are economically empow-ered to allow greater personal savings and investments. However, continued denial of economic opportunities to them will lead to a shrinking per capita income. Unemployment eventually leads to frustrations that trigger politi-cal instability, making it even more difficult for poor countries with large youth populations to generate economic growth and encourage the foreign and domestic investment needed to generate new jobs. In a capitalist society, the distinction between the have and the have not’s is very clear. Drawing from discourses of political theory and sociology of collective behavior and mass movement, increased poverty and inequality among Kenyan youth can only increase attacks and counter attacks between the have and the have-nots.
An increasing number of 15-29 year olds will inevitably increase the rate of rural to urban migration beyond the current urban annual growth rate of 4%. This is due to the fact that most migrants to urban areas come as young adults (15-29) to look for employment in cities. Development transformations necessary to support this growth and enhance the quality of urban life is not occurring at the same rate (Sivi-Njonjo, 2011). If this trend continues, a faster increase of informal settlements80 will be witnessed. From the findings of this paper, low security enforce-ment in slums mean more people are likely to self organize to provide their own security because they are neglected by security apparatus hence an increase in crime control vigilante activity.
During the 2007 campaigns, ODM politicians rallied supporters around the political philosophy of Majimbo.81 However, the local people operationalized majimbo to entail eviction of other non indigenous ethnic groups de-clared as a political enemy (Kenya Thabiti Taskforce, 2009). The devolution process is viewed by some as an opportunity to advance this (majimbo) course. Unresolved historical injustices especially around land and ethnic politics could escalate the social control vigilante game beyond the current proportions. On the other hand, de-volution is an opportunity for counties to strengthen their autonomy from central government. To weaken that autonomy, state privatized violence will remain a salient coercive strategy for central government, if it is in its interest to maintain total control of all regions
According to the Kenya Thabiti Taskforce (2009), young people are so disillusioned by the political leadership. A continued weak democratic government with a low political will and inadequate resources to effectively integrate
80 Also referred to as slums81Regionalism

274Youth Research Compendium
youth into meaningfully participating in decision making will further escalate their feelings of exclusion. As a result, young people will perpetuate cycles of political instability, ethnic wars, revolutions, and anti-regime activi-ties whether through self organization or by political manipulation. As these groups grow and muscle economic strength (though their metamorphosis into gangs and militias), these patron-client relationships will weaken caus-ing these groups to become political, economic or social mafias. With the adoption of the new Constitution, it means that political power will be redistributed and the current political class may not be as politically powerful as the old constitutional dispensation allowed them to be. As a result, this class of individuals can be relegated mainly to controlling economic and social wealth they have ac-quired without political control. At the point where this group feels that their interests are not being looked after by the incumbent, they could consolidate themselves and instigate regime control vigilantism in a bid to reinstate themselves by choosing one of their own or someone they can manipulate.
Most of the political class will also try to sabotage the constitutional provisions that do not favor their interests. One of the provisions Members of parliament already want to amend is the two thirds majority of a particular gender in public service. Women and civil society groups are likely to vehemently contest such a move. Numerous attempts of that nature would spark sporadic riots and protests
Increased fear by Christians that Muslims want to take over could lead to religious vigilantism. On the other hand, continued suspicions and exclusion of minority religious groups especially through external influences regarding the terrorist threats linked to radical Muslim groups could increase incidences of religious vigilantism and increase the religious divide in Kenya. According to Botha (2007: 36), ‘a more militant version of Islam is spreading through the use of internet, which has proved a valuable resource not only for spreading radical ideals, but also for recruiting, communicating with and training decentralized independent cell structures throughout the world’.
As youth become more westernized, liberal social norms and values will take root. An increased moral vigilantism type is likely to increase to sanction unwanted social behavior
Global trends such as cyber-vigilantism which have already emerged elsewhere to go after sexual predators, terror-ists, spammers, auction frauds, and copyright infringers on the Internet will begin to catch up here with increased use of ICT.
The continued existence of porous borders with Somalia, Ethiopia, Sudan and Northern Uganda fosters an en-vironment that is amenable to exploitation by extremists and criminal groups. In addition to a lack of adequate border security, Kenya like many other African countries also relies on corrupt intelligence personnel. Unless we establish effective, transparent, accountable and responsible governments and without substantial capacity build-ing in the areas of analysis, detection and prevention, Kenya will increasingly find it difficult to keep out such elements (Makinda, 2007). According to Barno (2007), Somali-based international terrorist groups may have set up infrastructure within the country and it is plausible that they could have local sympathizers and supporters. Continued marginalization of young people, especially in northern Kenya could increase their enrolment in these groups. As a result, the government would increase its official social control vigilantism to combat the influence of these groups.

275Institute of Economic Affairs
References
Ajulu, R. (1998). Kenya’s democracy experiment: the 1997 elections. Review of African Political Economy, 25 (76), 275-285
Alvarez, A. (2006). Militias and Genocide. War Crimes, Genocide, & Crimes against Humanity, (2), 1‐33. Retrieved September 26, 2011 from http://www.aa.psu.edu/journals/war-crimes/articles/V2/v2a1.pdf
Anderson, D. (2002). Vigilantes, violence and the politics of public order in Kenya. African Affairs, 101 (405), 531-555
Anyumba, G. (2003). Planning for crime prevention: The case of the city of Nairobi. Pretoria: SaferAfrica
Baker, B. (2002). Living with non-state policing in South Africa: The issues and dilemmas. The Journal of Modern African Studies, 40 (1), 29-53
Barno, R. (2007). Africa’s responses to the terrorism threat: Perspectives from the IGAD region. In Okumu, W & Botha, A (Eds). Understanding Terrorism in Africa: In Search for an African Voice (pp. 93-100). South Africa, Institute of Security Studies.
Beja, P. (2011, June 4). Why coastal ‘rebels’ won’t give up fight for secession. The Standard. Retrieved August 30, 2011 from http://www.standardmedia.co.ke/specialreports/InsidePage.php?id=2000036563&cid=259
Botha, A. (2007). Africa’s Vulnerability to terrorism and its Ability to Combat it. In Okumu, W & Botha, A. (Eds). Understanding Terrorism in Africa: In Search for an African Voice (pp. 23-41). South Africa, Institute of Security Studies.
Brown, R. M. (1975). Strain of violence: Historical studies of American violence and vigilantism. New York: Oxford University Press
Brown, S. (2003). Quiet Diplomacy and Recurring “Ethnic Clashes” in Kenya. In Chandra, L.S. and Wermester, K. (Eds), From Promise to Practice: Strengthening UN Capacities for the Prevention of Violent Conflict (69-100). Boulder: Lynne Rienner
Burrows, W. E. (1976). Vigilante! New York: Harcourt Brace Jovanovich
Central Bureau of Statistics [CBS] & Ministry of Planning and National Development [MPND]. (2006). Economic Survey 2006. Nairobi: Government Printer
Central Bureau of Statistics [CBS] & Ministry of Planning and National Development [MPND]. (2005). Economic Survey 2005. Nairobi: Government Printer
Central Bureau of Statistics [CBS] & Ministry of Planning and National Development [MPND]. (2004). Economic Survey 2004. Nairobi: Government Printer
Central Bureau of Statistics [CBS] & Ministry of Planning and National Development [MPND]. (2003). Economic Survey 2003. Nairobi: Government Printer
Central Bureau of Statistics [CBS] & Ministry of Planning and National Development [MPND]. (2002). Economic Survey 2002. Nairobi: Government Printer
Central Intelligence Agency (CIA). World Fact Book. Retrieved August 31, 2011 from https://www.cia.gov/library/publications/the-world-factbook/geos/ke.html
Culberson, W. C. (1990).Vigilantism: political history of private power in America. Westport, Conn: Praegerde la Roche, R. S. (1996). Collective Violence as Social Control. Sociological Forum, 11 (1), 97-128Eye for an Eye Justice System. (2009, April 29). The Standard, p.5.
Fleisher, M. L. (2000). ‘Sungusungu’: State-Sponsored Village Vigilante Groups among the Kuria of Tanzania. Africa: Journal of the International African Institute, 70 (2), 209-228. Retrieved August 30, 2011 from http://

276Youth Research Compendium
www.jstor.org/pss/1160816
Freeman, D. (2005). An Explanation of Conflict; Ethnicity, Deprivation and Rationalization. Conference paper read at Kentucky Political Science Association Conference, 4 March 2005.
Gecaga, M.G. (2007). Religious Movements and Democratization in Kenya: Between the Sacred and the Profane. In Murunga G.R. and Nasong’o, S.W. (Eds). Kenya: the struggle for democracy (pp.58-89). New York: CODESRIA
Githongo J. (2008). Kenya-Riding the Tiger. Journal of Eastern African Studies, 2 (20), 359 -367
Githongo, J. (2000, November 15). Why Won’t the State Clip Them Dreadlocks? The East African. Accessed on 31st August 2011 from http://www.cesnur.org/testi/mungiki_007.htm#Anchor-49575
Goldstein, D.M. (2003). In Our Own Hands: Lynching, Justice, and the Law in Bolivia. The Journal of the American Ethnological Society, 30 (1), 22-43
Government of Kenya. (1992). Republic of Kenya, Report of the Parliamentary Select Committee to Investigate Ethnic Clashes in Western and Other Parts of Kenya. Nairobi
Government of Kenya. (1997). Annual Report of the Commissioner of Police. Nairobi: Kenya Police
Harneit-Sievers, A. & Peters, R. (2008). Kenya’s 2007 general election and its aftershocks. Hambur, GIGA Institute of African Affairs, Afrika Spectrum, 43( 1):133-144
Harris, B. (2001, May). As for violent crime that’s our daily bread: Vigilante violence during South Africa’s period of transition. Violence and Transition Series, (Vol. 1). Retrieved September 26, 2011 from http://www.csvr.org.za/docs/vigilantism/asforviolentcrime.pdf
Hofstadter, Richard, & Wallace, Michael, eds. 1970. American Violence: A Documentary History. New York: Knopf
Huggins, M. K. (1991). Vigilantism and the state in modern Latin America: essays on extralegal violence. New York: Praeger publishers
Human Rights Watch. (1993). Human Rights Watch, Divide and Rule: State-Sponsored Ethnic Violence in Kenya. New York
Human Rights Watch. (2008, March, 16). Ballots to Bullets: Organized Political Violence and Kenya’s Crisis of Governance, Vol. 20, No.1 (A). Retrieved September 26, 2011 from http://www.hrw.org/sites/default/files/reports/kenya0308web.pdf
Immigration and Refugee Board of Canada [IRBC]. (2002, December 5). Kenya: A group called Amachuma; its purpose, membership, activities, and relations with authorities. Retrieved August 30, 2011 from http://www.unhcr.org/refworld/docid/3f7d4dba7.html
Institute of Economic Affairs. (2009). ‘The Kenya Divides’ Perception Study (Volume 1A). Nairobi, Kenya
Integrated Regional Information Networks [IRIN]. (2008, February 22). Armed and dangerous. Retrieved August 30, 2011 from http://www.irinnews.org/report.aspx?reportid=76896
Integrated Regional Information Networks [IRIN]. (2008, June 23). Ghana: Vigilante groups fill security vacuum. Retrieved August 6, 2009 from http://www.unhcr.org/refworld/docid/486261232.html
International Centre for Transitional Justice [ICTJ]. (2010). Briefing: Security Sector Reform and Transitional Justice in Kenya. Nairobi, Kenya
Johnson, L. (1996). What is Vigilantism? British Journal of Criminology, 36 (2), 220–236.Kagwanja, P.M. (2003). Facing Mount Kenya or facing Mecca? The Mungiki, ethnic violence and the politics of
the Moi succession in Kenya, 1987-2002. African Affairs, 102, 25-49. Retrieved September 26, 2011 from http://www.kenyanpundit.com/wp-content/uploads/2008/04/kagwanja-on-mun.pdf
277Institute of Economic Affairs
Kagwanja, P.M. (2005). Power to Uhuru: Youth Identity and Generational Politics in Kenya’s 2002 Elections. African Affairs, 105 (418), 51–75. Retrieved August 31, 2011 from http://www.kenyanpundit.com/wp-content/uploads/2008/04/kagwanja-on-youth.pdf
Kamungi, P.M (2002, December). Kenya’s Internally Displaced Persons: Numbers and Challenges. Unpublished
Kenya National Bureau of Statistics [KNBS] & Ministry of Planning and National Development. (2007). Economic Survey 2007. Nairobi, Government Printer
Kenya National Bureau of Statistics [KNBS]. (2008). Economic Survey 2008. Nairobi, Government Printer
Kenya National Bureau of Statistics [KNBS]. (2009). Economic Survey 2009. Nairobi, Government Printer
Kenya National Bureau of Statistics [KNBS]. (2010). Economic Survey 2010. Nairobi, Government Printer
Kenya National Bureau of Statistics [KNBS]. (2011). Economic Survey 2011. Nairobi, Government Printer
Kenya National Commission on Human Rights [KNCHR]. (2008, September). The Cry of Blood: Report on Extra-Judicial Killings and Disappearances. Retrieved September 23, 2011 from http://www.ediec.org/fileadmin/user_upload/Kenia/KNCHR_REPORT_ON_POLICE.pdf
Kenya National Dialogue and Reconciliation [KNDR]. (2009, May). Status of Implementation of Agenda Items 1-4, Second Review Report. Nairobi: KNDR Monitoring Project.
Kenya Police. (2004). The Kenya Police Service: Strategic plan, 2004-2008. Nairobi, Kenya Police Service
Kenya Thabiti Taskforce (2009). The root causes and implications of the post election violence in 2007. Nairobi: Inter-Religious Forum.
Kenya: Eastlands: Where Life is Nasty, Brutish and Short. (2006, April 10) Daily Nation. Retrieved September 3, 2011 from http://www.ecoi.net/file_upload/1226_1289223796_q12962-kenya.pdf
Kenya: Gangs Now Engage in Criminal Activities. (2010, February 19). Daily Nation. Retrieved September 3, 2011 from http://www.ecoi.net/file_upload/1226_1289223796_q12962-kenya.pdf
Kenya: The Force Behind Terror Gangs. (2002, March 13). The Nation
Kenyan Police Order Shoot, Kill Armed Criminals. (2007, January 28). People’s Daily Online. Retrieved September 2, 2011 from http://english.peopledaily.com.cn/200701/28/eng20070128_345416.html
Keriga L. and Bujra A. (2009, March). Social Policy, Development and Governance in Kenya: A Profile on Crime and Insecurity in Kenya. Nairobi: Development Policy Management Forum (DPMF). Retrieved August 30, 2011 from http://www.dpmf.org/dpmf/downloads/Crime%20&%20Insecurity%20in%20Kenya%20-%20Feb%2017.pdf
Kimani N. (Ed). (2009). Healing the Wound: Personal Narratives about the 2007 Post-Election Violence in Kenya. Nairobi: Twaweza Communications Ltd.
Kisii.com. (2009, May 19). Sungusungu, Chinkororo and Amachuma: Get your facts right. Retrieved August 30, 2011 from http://www.kisii.com/commentaries/45-sungu-sungu-chinkororo-and-amachuma-get-the-facts-right
Kisii.com. (2010, November 23). Sungusungu Vigilante group unleashes terror against its targets with ruthlessness and impunity. Retrieved August 30, 2011 from http://www.kisii.com/the-news/721-sungu-sungu-vigilante-group-unleashes-terror-against-its-targets-with-ruthlessness-and-impunity
Kisii.com. (2010, November 24). Top cop slaps ban on Kisii vigilante group. Retrieved August 30, 2011 from http://www.kisii.com/the-news/631-top-cop-slaps-ban-on-kisii-vigilante-group
Kisii.com. (2010, November, 24). Top Cop slaps ban on Kisii vigilante group. Retrieved August 30, 2011 http://www.kisii.com/the-news/631-top-cop-slaps-ban-on-kisii-vigilante-group

278Youth Research Compendium
Kisii.com. (2010, November23). Sungusungu vigilante group unleashes terror against its targets with ruthlessness and impunity. Retrieved August 30, 2011 from http://www.kisii.com/the-news/721-sungu-sungu-vigilante-group-unleashes-terror-against-its-targets-with-ruthlessness-and-impunity
Kowalewski, D. (1996). Countermovement Vigilantism and Human Rights. Crime, Law & Social Change, 25, 63-81
LANDINFO (2010, January 29). Kenya: Mungiki – Abusers or Abused? Norway: Country of Origin Information Centre. Retrieved August 31, 2011 from http://www.landinfo.no/asset/1123/1/1123_1.pdf
Madison, A. (1973). Vigilantism in America. New York: Seabury Press
Makinda, S.M. (2007). History and Root Causes of Terrorism in Africa. In Okumu, W & Botha, A. (Eds). Understanding Terrorism in Africa: In Search for an African Voice (pp. 15-21). South Africa, Institute of Security Studies.
Moses, N. (1997). Lynching and Vigilantism in the United States: An Annotated Bibliography. Guilford, Conn: Greenwood Press
Muchai A. (2002). Kenya Crime Survey 2002: Security Research and Information Centre
Mueller, S. D. (2008). The Political Economy of Kenya’s Crisis. Journal of Eastern African Studies, 2 (2), 185 – 210
Mukinda, F. (2010, February 19). All out war against organized gangs. Daily Nation. Retrieved September 23, 2011 from http://www.nation.co.ke/News/All+out+war+against+organised+gangs/-/1056/1037000/-/fjfj9w/-/index.html
Daily Nation. Mungiki leaders convert to Islam. (2000 September 3).
Daily Nation. Mungiki men in bid to join Islam. (2000, June 1).
National Taxpayers Association (NTA). (2010, March). Scoping Study Public Security Services in Kenya. Nairobi: Kenya.
Ndegwa, C. (2011, February 15). Police vigilance lacking in dealings with vigilante groups. The Standard. Retrieved August 30, 2011 from http://www.standardmedia.co.ke/pointblank/InsidePage.php?id=2000029210&cid=480&
Night of Terror Leaves up to 30 People Dead. (2009, April 22). The Standard, p.4.
Nina D. (undated). ‘Dirty Harry is Back: Vigilantism in South Africa – The (re)emergence of ‘good’ and ‘bad’ community’. Retrieved August 31, 2011 from http://www.isa.co.za
Okombo O. & Sana O. (2010). Balaa Mitaani: The Challenge of Mending Ethnic Relations in the Nairobi Slums. Nairobi: CAVI & FES.
Omolo, J. (2011). Youth Unemployment in Kenya. In Kitonga A., Sivi-Njonjo, K. & Ponge A. (Eds.) Youth Research Compendium. Nairobi: Institute of Economic Affairs.
Opiyo C.O. and Agwanda A.T. (2011). Population Growth and Structure and its Implications on Socio-Economic Development in Kenya. In Kitonga A., Njonjo, K.S. & Ponge A. (Eds.) Youth Research Compendium. Nairobi: Institute of Economic Affairs.
Oyugi W.O. (2002). Conflict in Kenya: A Periodic Phenomenon. Nairobi: Republic of Kenya. Retrieved August 30, 2011 from http://voiceofnomads.com/downloads/ConflictinKenyaaPeriodicPhenomenon.pdf
Parsons, T. H. (undated). No More English than the Postal System: The Kenya Boy Scout Movement and the Transfer of Power. Retrieved August 30, 2011 from http://www.artsci.wustl.edu/~tparsons/journal_articles/postal_system.pdf
Police Stretched by other Duties. (2009, April 25). Saturday Nation, p.6.

279Institute of Economic Affairs
Rattner, A. and Yagil, D. (2004). Taking the law into one’s own hands on ideological grounds. International Journal of the Sociology of Law, 32 (1), 85-102
Refugee Documentation Centre of Ireland. (2010, November 2). General information about criminal gangs in Kenya. Retrieved September 2, 2011 from http://www.ecoi.net/file_upload/1226_1289223796_q12962-kenya.pdf
Richardson, J.M. & Sen, S. (1996). Ethnic Conflict and Economic Development: A Policy Oriented Analysis. School of International Service: American University.
Roessler, P. G. (2005). Donor-Induced Democratization and the Privatization of State Violence in Kenya and Rwanda. Comparative Politics, 37 (2)
Rosenbaum, H. J. and Sederberg, P.C. (1976). Vigilante Politics. New York: University of Pennsylvania Press.
Ruteere, M and Pommerolle, M. (2003). Democratizing Security or Decentralizing Repression? The Ambiguities of Community Policing in Kenya. African Affairs, 102, 587-604
Sederberg, P.C. (1978). Phenomenology of Vigilantism in Contemporary America—An Interpretation. Terrorism, 1 (3), 287–305.
Sivi-Njonjo, K. (2010). Youth Fact book: Infinite Possibility of Definite Disaster? Nairobi, Institute of Economic Affairs.
Sivi-Njonjo, K. (2011, May). Changing Age Structures in East Africa and their Future Implications. Retrieved August 31, 2011 from http://api.ning.com/files/cdhzTCVx8viRbdIP6rv8Sh8m4ZFLa0eWNsWOKD815GS3T7nctVsND2clJChoFSMDipP7G18dgV-bcNrK5eb1Sia7ae3c0A2L/ChangingAgeStructuresinEastAfricaandtheirFutureImplicationsfinal.pdf
State outlaws 33 criminal gangs. (2010, October 20). The Standard. Retrieved September 3, 2011 from http://www.ecoi.net/file_upload/1226_1289223796_q12962-kenya.pdf
Swanepoel, L. & André, D. (2007). Vigilantism as a feature of political decay in the post-1994 South African dispensation. Acta Academica, 39 (1), 123-145
Tayob, A. (undated). Kadhis courts and the constitution: Changing Approach to politics and state among Kenyan Muslim leaders. Retrieved August 31, 2011 from http://uct.academia.edu/AbdulkaderTayob/Papers/739049/Kadhis_Courts_and_the_Constitution_Changing_Approach_to_Politics_and_State_among_Kenyan_Muslim_leaders
The truth Behind Central Blood Bath. (2009, April 22). The Standard, p.5.
Transformation from Religious Sect to Murderous Gang Appears Complete. (2009, April 22). The Standard, p.4.
Turner, T.E. and Brownhill, L. S. (2001). Mrican Jubilee: Mau Mau resurgence and the fight for fertility in Kenya, 1986-2002. Canadian Journal of Development Studies, 22, l037-1088
Villager Kill Widow as Wave of Revenge Attacks Continue Unabated. (2009, April 25). Saturday Nation, p.5.
Wamue, G.N. (2001). Revisiting our Indigenous Shrines through Mungiki. African Affairs, 100 (400), 453 –467
Woman Killed as Gang Hunts Mungiki Suspects. (2009, April 25). The Standard, p.8.
Youth Agenda. (2008). Who is guilty? Youth perspective on the 2007 pre-polls electoral violence in Kenya. Nairobi: Youth Agenda

280Youth Research Compendium
Crime: The Young and the Restless 10Dr. John Kabutha Mugo
AbstractThis paper focuses on the past and present trends of crime perpetrated by young people in Kenya, and moves on to explore various driving forces. Drawing from various theorists, the paper proposes a conceptual framework founded on human development, power struggle, social and economic injustice, the burden of societal structure, differential learning and subculture. Historical trends of crime by youth reveal remarkable change in both form and magnitude. The traditional African setting presents extremely socialized models of crime prevention and control, based on the group identity, morality and ethics. However, this order is disrupted by the Western culture, which rapidly turns the African youth from an innocent defender of culture and morals to a villain and delinquent, incapable of adherence to the colonial rules. The proliferation of institutions of containment for youth experi-enced in the 1950s and into early 1960s is evident to this fact and points out to the urbanization of injustice at the time. This status quo is transferred to independent Kenya where more correctional institutions are founded in the 1960s and 1970s resulting to increased incarceration of youth. Growing unemployment and shrinking opportuni-ties exacerbate the crime problem thus crime by youth maintains a steady upward trend. Several driving forces of crime have emerged from the analysis. Rising urban and rural poverty, high levels of unemployment, changing family patterns, and deteriorating environmental and health conditions are among the initial influences. Drugs and substance abuse among youth has been linked to delinquency and crime, while ineffective justice system has been blamed for increasing levels of repeat offenders. Besides, the recent emergence of information societies and cyberspace inventions has been found to introduce highly unpredictable behaviours, rendering efforts to prevent crime almost helpless. This de-linking of crime from the physical space presents high uncertainties for the future in regard to crime prevention and control. Various models of crime intervention have been analyzed. They en-compass facets of encouraging pro-social behaviour, improving neighbourhoods for crime prevention, reducing opportunities to commit crime through increased surveillance and participation of local communities, as well as strengthening reintegration to avert recidivism82. The paper proposes different perspectives for mitigating against crime committed by young people in Kenya. These include institutionalizing knowledge-based crime management, enhancing stakeholder participation in crime prevention, within the broader sense of addressing the myriad of challenges facing the Kenyan youth.
82 Recidivismisatechnicaltermreferringtorelapseoftheoutcomesofrehabilitation,throughwhichapersongetsbacktocommittingcrimeagain

281Institute of Economic Affairs
IntroductionDefinition of Youth from a Criminological PerspectiveLike in other countries, youth in Kenya constitute a heterogeneous category in terms of gender, social class, race, ethnicity, political positioning and age. This renders the definition of youth and youth analysis rather complex, because the categories intersect in multiple ways (De Boeck & Honwana, 2005). Nevertheless, there have been numerous attempts to define youth within various contexts, while laying focus especially on distinguishing youth from children and adults, and clarifying the various intersections.
This paper adopts a definition of youth from a crime perspective, as proposed by Blatier (2002). In this definition, youth fall into two categories: the adolescent (12 years onwards), and the young adult (from around 25 to 29 years of age). In the former category, the young person undergoes rapid physical, intellectual, affective and ethic formation, typified by the search for an identity. Blatier argues that peer influence, which is a key reference for adolescence, is predominant for engaging in violent acts or behaviour against the law or un-civic attitudes, more than any other influence. In the young adult stage, the young person faces a double search: entering the labour market and building of own family. This stage presents extra vulnerability, as resources to meet the financial de-mands of sustaining a family, funding further training and meeting the basic needs of life are often overwhelming, and subsequently significant susceptibility to engage in law-breaking behaviour. Considering these developmental and social dimensions, and for purposes of this paper, youth will be understood as any person aged between the age of 12 and 29 years. Following the definition adopted by this paper (12-29 years), youth constitute 37 percent of the Kenyan population, or 14.1 million persons (KNBS, 2010).
Despite constituting majority of the population in Kenya, concerns have been voiced that youth are often placed at the periphery of the public sphere (Francis & Githagui, 2005; Mugo, Oranga & Singal, 2010). Subsequently, youth are confronting a myriad of challenges and bearing the burden of unemployment, poor health and limited opportunities for education and training. Of particular concern to this paper is the risk that youth face in recruit-ment into crime and the subsequent consequences of incarceration and maiming or even death.
Understanding CrimeCrime is generally understood as any act or omission that is against public law. In the United States of America, differentiation is made among various terms related to crime. The term offense, which is mostly taken as synony-mous to crime, refers to any crime not indictable but punishable, summarily or by the forfeiture of a penalty (Duff & Green 2005). Felony is taken to refer to a serious crime punishable by imprisonment (at least one year). On the other hand, misdemeanour is a crime for which the punishment is usually a fine and/or up to one year in a county jail. In this sense, all crimes that are not felonies are misdemeanours (Duff & Green, 2005).
In defining crime, differences emerge between the sociological, criminological and the legal definitions. For in-stance, Blackburn (1993) defines crime as ‘acts attracting legal punishment and offences against the community’ (p5). The author argues that crime (an act that violates law) can only be committed if two basic conditions are met: if there is an actus reus (guilty act), where the act has been voluntarily carried out, and second, if there is mens rea (guilty mind), established intention to commit the act. In this understanding, crime therefore precludes cases where an act is conducted involuntarily (but note that ignorance of law does not apply as ‘involuntary’), or carried out without any proven intention (like cases of mental illness) (Sammons, undated).
Conversely, legal definitions are based on the two principles that guide criminalization of behaviour: the harm principle and legal moralism, or the premises of harmfulness and wrongfulness (Duff & Green 2005). In this view, crime is seen to present a balance between harmfulness and wrongfulness, whose punishable extents are stipulated by the various written codes of public law.
In Kenya, the penal code spells out the different behaviour that should be understood as crime (in this case combin-ing misdemeanour and felony). Under this code, homicide is defined as the severest crime, and which encompasses all capital offenses including murder, manslaughter and other offenses that cause death. The other category spelt out is offenses against morality, which touch on the wrongfulness principle. These include defilement, incest, sod-

282Youth Research Compendium
omy and other offenses. Third category includes (other) offenses against persons, which include assault and creat-ing disturbance. Smaller categories include robbery, theft and economic crimes (including corruption).
While this paper acknowledges the worth of sociological definitions, the adopted understanding leans more on the legal definition of crime. This choice is tutored by the mere fact that most data analyzed in this paper emanates from the legal system, rather than from criminological research.
This paper attempts a conceptual review of the relationship between youth and crime in Kenya, with view of gen-erating knowledge on emerging trends from the past and present as well as the driving forces, and with the view of portraying future scenarios that may cause variations to these trends.
Scope and limitations This paper is constructed from literature review, and does not draw from any field data. As such, the arguments contained herein are limited to the perspectives present in available literature. While this review may contribute valuable analyses and dimensions that have not been presented before, it falls short of confirmation from youth themselves, and certain views may be skewed, depending on reliability of analyses conducted by prior studies.
Secondly, most of the literature analyzed on youth and crime portray youth as perpetrators, rather than victims of crime. This view may not be representative of the status quo, and presents a weak-line for this paper. While atten-tion is laid on Kenyan data and Kenyan trends, case studies are drawn from other countries, with the view of pre-senting effective practices experienced in other contexts, and which may inspire local interventional frameworks.
Analytical FrameworkThe rising of crime in recent decades and the emergence of new forms of crimes has become a major concern for nations, and many states are investing heavily in its prevention. While extra caution must be taken against label-ling youth as synonymous to crime, various analyses around the world (and later in this paper) have illustrated that among the various demographic categories, youth are the most vulnerable to indulgence in crime. It has been claimed that history of youth is thoroughly mixed with the history of delinquency and gangism (De Boeck & Hon-wana, 2005). Historical analyses have argued that youth as a distinct category emerged and was first described during explosion of the modern European cities, during the industrial capitalism of the 19th century. Advancing this theory, Hebrige (in De Boeck & Honwana, 2005:5) has claimed that youth first showed their insolent face across modern Britain ‘in the delinquent crowds that gathered in manufacturing towns’. The initial documentation of youth in Europe thus, describes an extremely problematic urban category, law-breaking and nuisance to public order.
Gang membership is today estimated to be in the millions worldwide, with institutionalized youth gangs concen-trated in cities that have high violence rates (UN Habitat, 2007). Subsequently, crime and violence are fundamental threats to human security and safety from crime, and violence – including the resulting fear and insecurity – is increasingly being acknowledged internationally as a public good, as well as a basic human right (UN Habitat 2007:45).
The question can be raised: what then, is it that shapes this dominant youth agency, and their susceptibility to law-breaking behaviour? For close to a century, sociologists and psychologists have intensively belaboured the explanation of crime, and proposed numerous theories in understanding of crime and delinquency. These theories assume biophysical, psychoanalytic, behaviourist and interactional dimensions. To address the above question, let us consider a few perspectives presented by theorists, among them Foucault (1982), Pyle (1995), Merton (1968), Sutherland (1939), Wolfgang and Ferracuti (1967) and others.

283Institute of Economic Affairs
Theories of CrimeFoucault’s Theory of Power and ResistanceIn a dimension presented in The Subject and Power (1982), Foucault argues that human behaviour is primarily shaped by power relations as antagonism strategies or resistance. Power resistance is attributed to the ‘opposition to the power of men over women, of parents over children...of administration over the ways people live’ (p. 780) [rich over the poor, political elite over the masses83].
In this perspective, the human subject is at the middle of the power struggles linked to knowledge, competence and qualifications. However, Foucault argues that these struggles or opposition are not targeted at individuals, or group, or elite, or class, but rather a technique, a form of power. There are three basic types of struggles – against forms of domination, against forms of exploitation which separate individuals from what they produce, or against that which ties the individual himself and submits him to others in this way (struggles against subjection, subjec-tivity and submission). Violence, which is a form of crime, is essentially a voice against these forms of domination and exploitation. Applying this view on the Kenyan scenario for instance, youth violence, which has prominently emerged as a widespread phenomenon during moments of political controversy and especially in times of elections (1992, 1997 and lately 2007-2008), are forms of resistance towards regimes, tribes and social classes perceived as oppressive.
This perspective, presents an extremely refreshing insight to understanding youth and crime. However, Foucault’s theory is about the ‘human subject’ rather than youth, and just leaves us to speculate, that the character (human subject) presented by Foucault, typifies the struggles of youth in many societies, as consistent victims of the various forms of domination and power deficiencies. The perspective overlooks rational decisions that individuals make, based on perceived benefits of engagement in common activity. The view presents a picture of a subject, victim or captive of power, and overlooks the numerous cascades that emerge from ‘subject interrelations’. In understanding crime therefore, Foucault offers extremely insightful notions, but which are however in themselves inadequate to understand crime. While a reasonable proportion of crime depicts opposition and struggle, other forms of crime present rational decisions that individuals make, not necessarily bearing the intent to defy legal systems.
Pyle’s Economics of CrimeIn a publication titled ‘Cutting the costs of crime’, Pyle (1995) concurs with Becker (1968), in advancing the per-spective that people commit crime if the expected benefit [of committing crime] outweighs the expected benefit (utility) from legitimate activity. Where crime is prevalent, what may be evident are situations of legitimization of illegitimate activity, thus rationalizing crime as the better option for economic endowment.
The author argues that what deters potential criminals is first, the level of probability of being caught and pun-ished, and secondly the amount of punishment if caught. In times of financial need therefore, human beings weigh the options based on benefits (utility) of their activity against the cost of consequences (being caught and pun-ished). This indicates that some forms of crime, like corruption, may be producing more crime, through reducing the likelihood or intensity of consequences.
This view presents a controversy, on whether crime escalates with rates of unemployment. Pyle’s view is that there may not be any significant relationship between these two variables. While low income may motivate some individuals to commit crime, economic decline may also reduce the opportunities for potential criminals (p. 27).
This view presents a critical dimension to this paper, of the perceived benefits of crime, and how these may be guiding youth engagement in crime. Still, laying blame on the inefficiency of law-enforcement and weak surveil-lance as possible contributors to youth crime. However, the model overlooks other sociological and psychological determinants of crime, and the non-financial benefits of crime. The view that crime can be eliminated or signifi-cantly reduced through increasing surveillance and punishment, while applicable to a certain limit, is seen as rather inadequate in inspiring effective interventional frameworks.
83Author’saddition

284Youth Research Compendium
Merton’s Strain Theory (Anomie) Merton strain theory proposes that crime and deviance are products of certain strain, referred to as anomie, which features prominent disparity between societal expectations and institutionalized means (Merton, 1964; Merton 1968; Merton 1969). Primarily, people resort to crime when the legitimate means of achieving laid-down goals are insufficient, leading to the option of illegitimate means. In his argument, the society places the yoke of expectations (socially-approved goals) on the individual, while the institutionalized means of attaining these expectations are often inadequate. This leads to various adaptations of the individual (Merton 1968):
• Conformity: the individual accepts the social goals, and also resorts only to the system’s legitimate means;
• Innovation: the individual accepts the goals, but not necessarily the socially approved means;
• Ritualism: the individual approves of the institutionalized means, but loses sight of the goals;
• Retreatism: the individual rejects the goals as well as the institutionalized means;
• Rebellion: the individual disapproves of the goals and legitimized means by creating a parallel system of goals and means, often oppositional to that of the society.
In this theorization, youth committing crime are either retreatists or rebels, who have rejected societal systems and structures, and often substitute them. Thus, committing crime is blamed on the rigidity of society’s organization, especially the unjustified burdening of individuals with expectations not with reference to the limited access to resources (emanating from inequitable distribution) (Lamnek, 1999).
This strain theory presents us with rich thoughts on how societal structures, and the avenues available to youth, may be leading to deviance and crime. Within this view, and linking to Foucault’s and Blatier’s views, youthhood presents itself with a myriad of challenges including powerlessness, situations that cause strain and frustration. This loading of youth may be responsible for the constellation of reactions. However, the view falls short of stat-ing the role of the individual within this arrangement. All is blamed on the society, and this view then limits the understanding of individual differences among youth and other perpetrators of crime.
Sutherland’s Theory of Differential AssociationDifferential Association was first proposed by Edwin Sutherland (Sutherland 1939; Sutherland 1955). The theory suggests that young people learn crime, just as they learn many other things. This learning occurs through a system of associating with groups, within which law-breaking is widely defined as acceptable. Thus, young people learn criminal skills from associating with groups where such skills are mediated.
The theory of Differential Association also deals with young people in a group context, and looks at how peer pressure and the existence of gangs could lead them into crime. Sutherland (1968) suggests the nine principles through which young people learn criminal behaviour. Among them, criminal behaviour, like any other behaviour, is learnt through interaction with other persons in a process of communication. This learning takes place within intimate peer groups. When criminal behaviour is learned, the learning includes techniques of committing the crime (which are sometimes very complicated, sometimes simple) and the specific direction of motives, drives, rationalizations and attitudes.
Sutherland’s theory has been widely utilized to critique institutionalized arrangements for criminal rehabilitation. For instance, while prisons and juvenile correctional facilities are seen to provide room for reform, the differential association facilitated by confinement is seen to provide room for learning of increased criminal behaviour.
While Sutherland’s view may be instrumental in understanding how people (especially youth) learn crime, the view is limiting in understanding the different contexts within which crime is committed, and the influence of social contexts to committing crime.
The Sub-culture theoryEmerging from the Chicago sociological school as explanation to the rising youth crime and gang-building in the United States (Lamnek, 1999), the theory of subculture (and cultural conflict) offers a different understanding. This theory states that in the complex norm system of the society, norms, symbols and values do not mean the
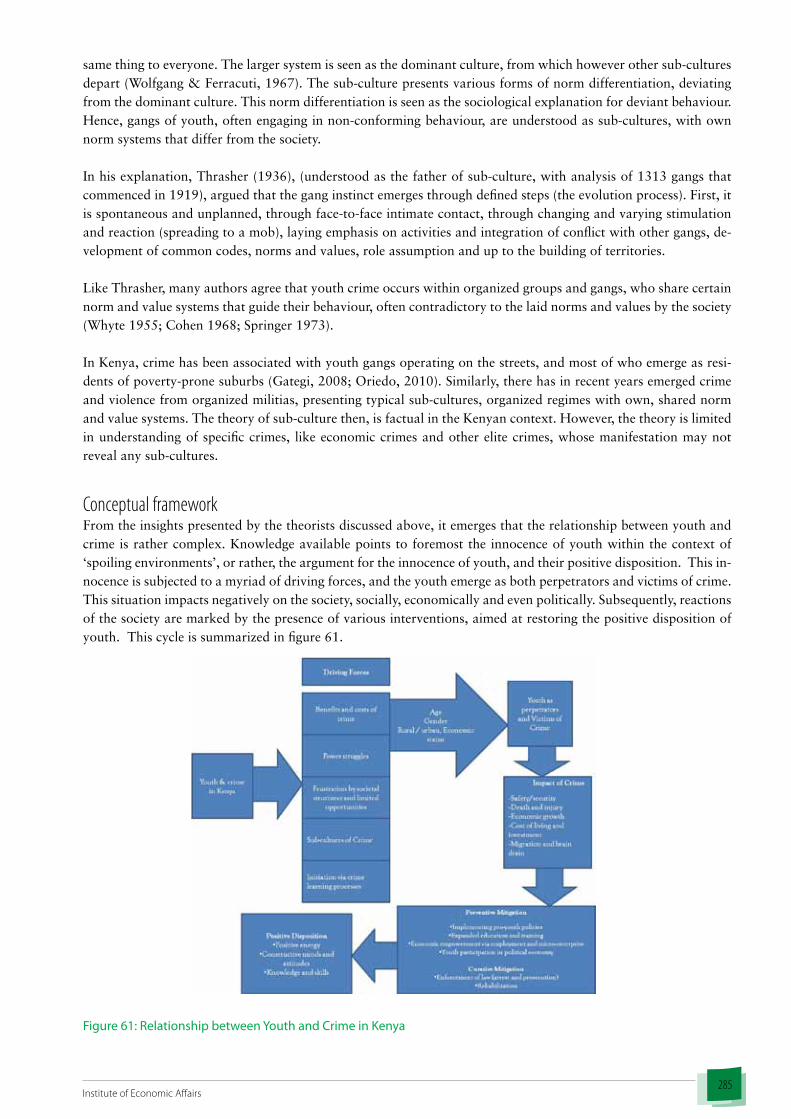
285Institute of Economic Affairs
same thing to everyone. The larger system is seen as the dominant culture, from which however other sub-cultures depart (Wolfgang & Ferracuti, 1967). The sub-culture presents various forms of norm differentiation, deviating from the dominant culture. This norm differentiation is seen as the sociological explanation for deviant behaviour. Hence, gangs of youth, often engaging in non-conforming behaviour, are understood as sub-cultures, with own norm systems that differ from the society.
In his explanation, Thrasher (1936), (understood as the father of sub-culture, with analysis of 1313 gangs that commenced in 1919), argued that the gang instinct emerges through defined steps (the evolution process). First, it is spontaneous and unplanned, through face-to-face intimate contact, through changing and varying stimulation and reaction (spreading to a mob), laying emphasis on activities and integration of conflict with other gangs, de-velopment of common codes, norms and values, role assumption and up to the building of territories.
Like Thrasher, many authors agree that youth crime occurs within organized groups and gangs, who share certain norm and value systems that guide their behaviour, often contradictory to the laid norms and values by the society (Whyte 1955; Cohen 1968; Springer 1973).
In Kenya, crime has been associated with youth gangs operating on the streets, and most of who emerge as resi-dents of poverty-prone suburbs (Gategi, 2008; Oriedo, 2010). Similarly, there has in recent years emerged crime and violence from organized militias, presenting typical sub-cultures, organized regimes with own, shared norm and value systems. The theory of sub-culture then, is factual in the Kenyan context. However, the theory is limited in understanding of specific crimes, like economic crimes and other elite crimes, whose manifestation may not reveal any sub-cultures.
Conceptual frameworkFrom the insights presented by the theorists discussed above, it emerges that the relationship between youth and crime is rather complex. Knowledge available points to foremost the innocence of youth within the context of ‘spoiling environments’, or rather, the argument for the innocence of youth, and their positive disposition. This in-nocence is subjected to a myriad of driving forces, and the youth emerge as both perpetrators and victims of crime. This situation impacts negatively on the society, socially, economically and even politically. Subsequently, reactions of the society are marked by the presence of various interventions, aimed at restoring the positive disposition of youth. This cycle is summarized in figure 61.
Figure 61: Relationship between Youth and Crime in Kenya

286Youth Research Compendium
Source: Author’s Own Analysis
Impact of Crime on SocietyThough much is written about crime, limited attention has been focused on the impact of crime on society and economies. Findings suggest that in the year 2000, more than 500,000 people across the globe were victims of homicide (UN Habitat, 2007). Thus, the negative effects of crime on society are enormous. Crime has been found to adversely impact on safety and security, negatively affecting economic growth. Directly, crime leads to higher expenditure in healthcare and policing, while resultant incarceration, maiming or death leads to loss of income. For instance, the collapse of the Brazilian public hospital system during the 1980s and 1990s has been attributed to large numbers of homicides and criminal injuries (UN Habitat, 2007).
In many African cities, the impact of robberies and burglaries in cities of developing countries manifests in the growing demand for private security and the proliferation of gated communities. The growing levels of robbery and breakages push investors and inhabitants to invest in private security guards and other security enhancement measures, which push higher the cost of living (UN Habitat, 2007). Similarly, crime-prone areas and cities have influenced fleeing of investors and enormous strain on insurances. Related to this is the brain drain, when local experts migrate out of their own countries in search of safer places to live and work. Anecdotal evidence has also been produced, that rising crime levels have depressed property values, creating negative bearing on investment in certain locations. If valued in monetary terms, the impact of crime on society can be devastating.
Historical Trends of Crime in Kenya Present and Past Trends Youth in traditional Africa bore many positive labels. In general, the style of living in African traditional setting was characterized by perpetuation of group culture and identity and the maintenance of social stability, rather than individual advancement (Otiende, Wamahiu & Karugu, 1992). Emphasis on strongly-sanctioned moral education and ethics responsibly brought up young persons strongly grounded in respect of self and others, and the youth emerged as strong defenders of the group identity. Conversely, youth were perceived as the transitional genera-tion, bridging childhood and adulthood. The energies and potentials of youth were tapped positively, bearing responsibility of providing security to the community, and slowly assuming responsibility over the community’s assets, under mentorship of the older generations. Claim has been made that crime was extremely low and highly-sanctioned, and that crimes such as theft, assault, rape, treachery were rare, and considered as attempts to create disharmony within families and the entire community (Otiende et al, 1992). Persons engaging in crime received immediate punishment, and judicial proceedings were based on the principles of compensation and reconciliation rather than retribution (Simutanyi, 2009) an aspect that strengthened social harmony.
This organization was disrupted by entry of the European culture in the 19th century, first introduced by the mis-sionaries, and closely followed by colonial mastery. The Western education is held responsible for loosening the African traditional systems of discipline (Eshiwani, 1993), and indeed the eventual criminalization of youth that has persisted to the present.
In Colonial Kenya, imposition of foreign domination and attempts to disorganize African communities were met by intense opposition, and this led to the labelling of youth as ‘problematic and law-breaking’, deviant persons emerging as confronters to colonial mastery. Most cited social problem was the refusal of youth to carry their iden-tity cards (Kipande) (Ole Kwallah 2001, cited in Mugo, 2004). Indeed, the first formal youth institutions formed (alongside the white schools), were the juvenile correctional centers (from around 1900), to take care of ‘wayward youth’ (Mugo, Musembi & Kamau-Kang’ethe, 2006). The colonial Ministry of Community Development in Ke-nya, which was formed after 1945, first and foremost targeted ‘youth containment’ (Mugo, 2004).
The current system of juvenile correction however dates back to around 1910, when the Kabete Approved School was formed. This School was mandated to cater for youth who had been imprisoned for failure to register them-selves to receive identity cards, and those who did not carry their identity cards (kipande) around (Ole Kwallah 2001, in Mugo 2004). However, records on the number of ‘imprisoned’ youth during the period have not been

287Institute of Economic Affairs
accessible. The circumstances surrounding incarceration of youth during the early decades of colonialism seem to revolve around governance: failure of youth to abide by colonial law, either resulting from outright defiance or ignorance of regime requirements.
Campbell (2002) argues that it was the metropolitan trend towards a more rehabilitative and separatist system that shaped management of the juvenile delinquency in colonial Kenya. During the 1930s, the colonial govern-ment introduced a modified version of the British borstal system in Kenya, which, according to Campbell, did not only constitute a reform agenda in controlling African delinquents, but also introduced a racial twist in making it more acceptable to the colonial environment. Nevertheless, delinquency and crime perpetrated by youth continued to present a key social challenge to the colonial master, increasingly during the inter-war period. Indeed, African social offenders became the subject of serious state interest during this epoch (Campbell, 2002). During this time, it is apparent that crime was defined purely by non-adherence to the regime requirements, while power inequali-ties and oppression influenced certain struggle and emancipation (better understood through Foucault’s theory).
A different argument on the driving forces of crime during the inter-war period (1931-1937) is presented by An-derson (1991). To Anderson, juvenile and youth crime was a strong feature of the ongoing urbanization in the 1930s, marked by sharp increase in the amount of cognizable crime in settled urban areas in Kenya. Consistently, an increasing proportion of convicted persons included children and youth. Anderson argues that youth crime remained persistently high, as the emergence of urban areas continued to soar. Going with the emerging trends of population pressure and growing unemployment, subcultures that favoured crime continued to dominate. The table 63 below summarizes the frequency of juvenile and youth crime in Kenya during the interwar period (1931-1937).
Table 63: Juvenile and Youth Crime in Kenya (1931-1937)
Crime/Offence 1931 1932 1933 1934 1935 1936 1937
Against person 23 23 18 21` 22 23 30Malicious injury 11 9 4 5 2 9 6Against property (including Stock and produce)
302 324 254 250 204 195 254
Highway, revenue and social economy 177 367 167 211 202 201 350Employment ordinance 51 18 5 3 6 6 29Township/municipal rules 228 217 246 383 172 89 I62Native registration ordinance 10 08Resident native 1 3 4Other offences 11 13 12 24 14 10 4Total 814 982 710 897 622 524 735Total Adult Convictions 43,911 46,051 44,353 50,465 50,465 46,613 50,072
Source: Anderson 1991
The table indicates that through this period, crime was highly urbanized. More than 58 percent of all crimes committed by youth during these years revolved around highway, revenue and social economy, as well as non-adherence to township and municipal rules. Second to these was damage of property, including stock and produce, which accounted for 34 percent of all offences. While the urban crime may be related to the sudden changes and need for adjustment, and the disparity between the expectations of society and the available legitimized means (anomie), damage of property may be better understood either from the power struggle perspective, or from the economics of crime, assuming that damage accrued some perceived benefits to the youth.
With the heightening of struggle for independence during the post second world war era, the number of incarcerat-ed youth continued to rise. In 1946, the colonial government set up a Committee on Children and Young Persons, to advice on youth policy. The committee recommended, inter alia, drafting of the Children and Young Persons

288Youth Research Compendium
Act, seen as a way of imposing colonial ideology and subordinating African law to European Statutes (Mugo et al 2006:7). This new law was seen as a way of institutionalizing the containment of youth, a form of legal control. Modes of punishment were stipulated, as well as legalization of the already-existing correctional institutions. In-creasing surveillance and highlighting punishment, better understood from Becker’s perspective (as cited in Pyle, 1995), was seen as the solution to the rising social crises.
As a critical marker of a growing social problem, a series of youth correctional institutions (approved schools) were opened up in the 1950s and into the early post independence era (early to mid 1960s). Seven institutions were opened up within 7 years, as summarized below.
Table 64: Juvenile Correctional Institutions opened 1957-1964
Institution Year opened
Dagoretti Approved School 1957
Mweru Approved School 1958
Othaya Approved School 1959
Kalimoni Approved School 1959
Nakuru Children’s Remand Home 1959
Shimo la Tewa 1964
Kirigiti 1964
Source: Mugo et al, 2006
The rapid establishment of these institutions may be interpreted as reactions to the rising incidence of juvenile and youth crime, and indeed the agency of youth in the struggle against the power inequalities and social injustices of the colonial administration.
Alongside this, it has been documented that concerns were raised in the 1950s, about the many minors who had been detained along adults in the Manyani concentration camp. These concerns culminated into the colonial gov-ernment commissioning an officer, Geoffrey Griffins, to assess the situation and recommend action. This mission identified around 2,000 children and youth, who were transferred to Wamumu for rehabilitation and eventual reintegration (Mugo, 2004). Evidence exists, that the most common crime imposed on youth during this era was offence against property, which included theft, housebreaking and forgery (Mugo et al 2006).
After independence in 1963, the confusion that had ensued during the years of emergency, and which had caused massive displacement of persons, did not permit restoration of social order. The rapid urbanization and move-ment of persons after independence brought with it new challenges, a new breed of unemployed youth in the city, caused by lack of training and skills to take up the white-collar jobs, or what Foucault refers to as power struggles linked to knowledge, competence and qualification (1982:781). Alongside this were the massive transition needs of youth previously employed by the white settlers. Consequently, crime by youth did not relent, it only acquired new shapes.
During the 1970s and through to the 1980s, crime acquired a modern nature, with the Children and Young Per-sons Act (Cap 141) being the main legal instrument for adjudication. With the rapid population growth of the 1970s and 1980s, youth in Kenya rapidly emerged as a marginalized category. During this time, there were three institutions rehabilitating youth: the Shimo la Tewa (Mombasa) and Shikusa (Kakamega), and the Youth Cor-rective Training Centre (Kamiti). Available records have indicated that many youth were convicted to prisons, especially those aged 21-25 years.
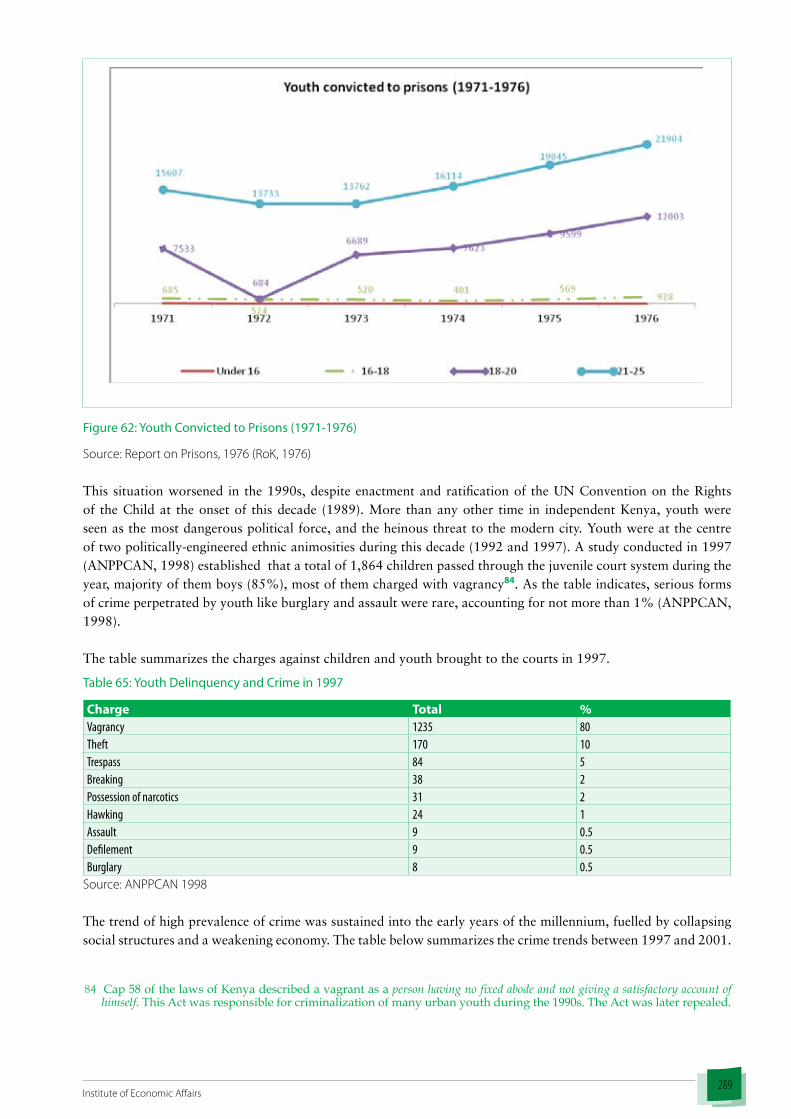
289Institute of Economic Affairs
Figure 62: Youth Convicted to Prisons (1971-1976)
Source: Report on Prisons, 1976 (RoK, 1976)
This situation worsened in the 1990s, despite enactment and ratification of the UN Convention on the Rights of the Child at the onset of this decade (1989). More than any other time in independent Kenya, youth were seen as the most dangerous political force, and the heinous threat to the modern city. Youth were at the centre of two politically-engineered ethnic animosities during this decade (1992 and 1997). A study conducted in 1997 (ANPPCAN, 1998) established that a total of 1,864 children passed through the juvenile court system during the year, majority of them boys (85%), most of them charged with vagrancy84. As the table indicates, serious forms of crime perpetrated by youth like burglary and assault were rare, accounting for not more than 1% (ANPPCAN, 1998).
The table summarizes the charges against children and youth brought to the courts in 1997.
Table 65: Youth Delinquency and Crime in 1997
Charge Total %Vagrancy 1235 80Theft 170 10Trespass 84 5Breaking 38 2Possession of narcotics 31 2Hawking 24 1Assault 9 0.5Defilement 9 0.5Burglary 8 0.5
Source: ANPPCAN 1998
The trend of high prevalence of crime was sustained into the early years of the millennium, fuelled by collapsing social structures and a weakening economy. The table below summarizes the crime trends between 1997 and 2001.
84Cap 58 of the laws of Kenya described a vagrant as a person having no fixed abode and not giving a satisfactory account of himself. This Act was responsible for criminalization of many urban youth during the 1990s. The Act was later repealed.

290Youth Research Compendium
Table 66: Crime trends 1997-2001
Type of crime
Year Total
1997 1998 1999 2000 2001
Murder Including Attempt 1,642 1,637 1,625 1,807 1,688 8,399
Manslaughter 14 5 16 18 8 61
Rape (Including Attempt) 1,050 1,329 1,465 1,675 1,987 7,506
Assault 10,288 10,847 11,891 13,035 12,611 58,672
Other Offenses against Person 2,601 2,920 3,173 3,563 3,020 15,277
Robbery and Allied Offences 7,465 8,303 8,612 8,923 9,180 42,483
Breakings 12,619 11,382 9,940 10,712 10,363 55,016
Theft of Stock 2,630 2,333 2,278 2,906 2,327 12,474
General Stealing 10,462 9,899 9,591 10,129 8,919 49,000
Theft of Motor Vehicle 989 1,081 1,004 896 960 4,930
Theft of Motor Vehicle Parts 1,062 934 770 748 753 4,267
Theft From Motor Vehicles 634 624 526 569 558 2,911
Theft of Bicycles 682 596 552 836 565 3,231
Theft by Servant 3,641 3,230 3,075 3,221 2,757 15,924
Dangerous Drugs 3,722 5,171 5,912 5,481 5,300 25,586
Handling Stolen Property 336 347 384 361 347 1,775
Corruption 148 145 43 42 23 401
Causing Death by Dangerous Driving 275 304 259 346 301 1,485
Other Offences against Property 3,120 3,168 3,359 3,555 3,073 16,275
All Other Penal Code Offences 9,581 9,418 10,415 11,320 10,612 51,346
Total 72,961 73,673 74,890 80,143 75,352
Source: Economic Survey, 2002
Assault (16%), breaking (15%), general stealing (13%), robbery and allied offences (11%) and dangerous drugs (7%) were the most recurrent crimes between 1997 and 2001. Crime had been steadily increasing between 1997 and was highest in 2000 before declining in 2001 by 6%. Among the least reported cases were those involving corruption and manslaughter.
Another crime survey conducted in 2001 by Assiango, Stavron, Ravestijn and Jackson focused on the family and socio-economic backgrounds of 65 young offenders aged between 14 and 25 years, their personal characteristics, experiences in crime, reasons and motivations for being involved in crime, opinions and hopes for the future. Ma-jority of the participants said that their involvement in crime was influenced by family deficiencies, while others indicated money (67%), peer pressure (13%) and survival (13%) as causes.

291Institute of Economic Affairs
Table 67: A Summary of Crimes Committed by Youth in Nairobi (2001)
Non-violent crimes PercentTheft from houses 63.3
Snatching/pick pocketing 60Robbery with force or threat of force 56.7Shop lifting 40.0Theft from/of vehicles 23.3Violent crimes PercentSexual offences 53.3
Assault/mugging with force 30.0Car Jacking 23.3
Source: Assiango, et al. (2001)
From the table, it is notable that newer forms of crime were being committed by youth, among them carjacking and shop lifting. Nevertheless, the commonest crime was theft, while sexual offenses constituted majority of the violent crimes committed by the youth. Most of the participants reported to have committed their first offence be-tween the ages of 12 and 15 years of age (30%) or between 16 and 19 years (23%). The study further established that poverty (40%), alcohol and drugs (23%) were responsible for increased vulnerability of youth to re-commit crime.
Findings of this study are confirmed by a historical analysis of four crime types (robbery, stealing, assault and rape) over a ten year period, 1994 to 2003.
Figure 63: Trend analysis of four crimes: 1994-2003
Source: Muchai, 2003
This trend analysis points to general increase in crime rates over the period, with the exception of stealing. Assault was steadily increasing, attaining a peak in 2003. Cases of rape were also consistently rising gradually.
Recent years have witnessed explosion of youth crime in the country. The table below summarizes the population of persons convicted to prisons between 2001 and 2009.

292Youth Research Compendium
Table 68: Convicted Prison Population by Age and Sex (2001- 2010)
Year Gender Under 16 16-17 18-20 21-25 26-50 50+ Total
2001 Male 9 3,057 11,751 17,786 24,071 5,178 61,852 Female 2 448 1,537 1,986 3,279 326 7,378 Total 11 3,505 13288 19,772 27,350 5,504 69,2302002 Male 2 2,476 14,258 21,320 27,187 5,752 70,995 Female 0 521 1,722 2,184 3,455 565 8,447 Total 2 2997 15980 23,504 30,642 6317 79,4422003 Male 1 5,465 17,465 26,382 28,629 6,150 84,092 Female 0 644 3,071 2,776 3,304 333 10,128 Total 1 6,109 20,536 29,158 31,933 6,483 94,2202004 Male 166 3,706 19,134 27,921 19,846 8,559 79,332 Female 0 351 2,874 3,780 3,290 562 10,857 Total 166 4,057 22,008 31,701 23,136 9,121 90,1892005 Male 2 3,293 16,685 30,440 33,339 5,936 89,695 Female 0 548 2,198 4,333 4,298 624 12,001 Total 2 3,841 18,883 34,773 37,637 6,560 101,6962006 Male 1,077 4,455 20,710 27,838 37,005 6,700 97,785 Female 12 367 2,797 3,894 5,666 613 13,349 Total 1,089 4,822 23,507 31,732 42,671 7,313 111,1342007 Male 135 2,787 16,301 24,244 29,830 6,791 80,088 Female 0 260 2,071 3,047 3,869 435 9,682 Total 135 3,047 18,372 27,291 33,699 7,226 89,7702008 Male 154 1,959 16,225 20,471 29,339 11,301 79,449 Female 0 263 2,690 2,472 3,257 283 8,965 Total 154 2,222 18,915 22,943 32,596 11,584 88,4142009 Male 24 2,890 21,770 30,822 32,970 8,286 96,762 Female 25 207 2,453 4,247 3,856 482 11,270
Total 49 3,097 24,223 35,069 36,826 8,768 108,2702010 Male 43 2,139 17,605 24,449 27,519 6,557 78,362 Female 17 413 1,784 3,526 3,901 628 10,269
Total 60 2,552 19,389 28,025 31,420 7,185 88,631Source: Economic Survey, 2006 and 2011
Figure 64: Crime Trends between 2001 and 2009
Source: Economic Survey, 2006 and 2010

293Institute of Economic Affairs
The trends indicate that 57% of crime was committed by 16-25 year olds as indicated in the figure above. Crime has been increasing and peaked up in 2006 by reducing by 19.2% and further by 1.5% before increasing by 22.2% in 2009.
This historical reflection points to not only changes in magnitude of crime, but also evident revolution in the forms of crime that Kenyan youth have committed over the years. While crime was defined by non-adherence to colonial rules in the early years of the 20th century, the crime scene was rapidly attacked by ‘urban crimes’ in the 1930s, and a subsequent explosion of juvenile correctional institutions during the 1950s. This latter decade was marked by unique power struggles and the agency of youth, defined by colonial administration as crime. The shape of crime by youth did not change much in early years of post-independence Kenya, only that migration trends and explosion of the urban environments brought with them new challenges for youth. New power struggles emerged later in the 1980s and 1990s, as neo-liberation struggles against the political and social injustices were experienced during this era. New forms of crime emerged during this era, from the involvement of youth in ethnic violence, to carjacking and other forms of crime in the urban environment.
Type and prevalence of crimeDeeper categorization yields 13 categories of crime, including homicide, offenses against morality, robbery, break-ings, theft, dangerous drugs, traffic offenses, criminal damage, economic crimes, corruption, offenses involving police officers, offenses involving tourists and other penal code offenses (Prisons Department Categorization, adopted by KNBS, 2009).
The crime of homicide is the most serious, and involves all capital offenses (for persons over 18), which may include murder, manslaughter, infanticide, suicide, procuring abortion, concealing birth and causing death by dangerous driving. Offenses against morality encompass defilement, incest, sodomy, bestiality, indecent assault, abduction and bigamy. Other offenses against persons include assault, creating disturbance and affray, while robbery includes robbery itself, robbery with violence, car-jacking and cattle rustling. Theft includes all forms of stealing and handling of stolen property. The table below summarizes prevalence of these forms of crime (among all age categories), from 2006-2008.
Table 69: Type and Prevalence of Crime 2006-2010
Crime 2006 2007 2008 2009 2010 2010% % increase/ decrease 2006-10
Theft 17,443 15,707 17,449 Other offenses against persons 18,723 17,831 16,496 20,539 20,012 38 6.9Offenses against morality 3525 3673 3116 4068 4817 9 36.7Breakings 7,420 6,337 6626 7,053 6,453 12 -13.0Dangerous drugs 5,821 5,401 4,407 5,541 5,081 10 -12.7Other penal code offenses 6,104 3,732 3,994 4,864 4,956 9 -18.8Criminal damage 3,518 2,770 3,760 3,417 3,327 6 -5.4Robbery 5,234 3,492 3401 2,938 2,843 5 -45.7Homicide 2090 1912 2037 2214 2239 4 7.1Economic crimes 1,873 1,908 1,898 2,324 2,662 5 42.1Corruption 252 177 133 158 62 0 -75.4Traffic offenses 62 46 120 59 103 0 66.1Offenses involving police officers 76 32 33 56 37 0 -51.3Offenses involving tourists 84 10 6 5 1 0 -98.8TOTAL 72,225 63,028 63,476 53,236 52,593 100 -162
Source: Economic Survey, 2011

294Youth Research Compendium
The analysis reveals that theft and other offenses against persons accounted for close to 50% of all offenses com-mitted during the period. In 2010, homicide and economic crimes accounted for only 4% and 5% of the crimes committed respectively. Over the period, major increase was experienced in the areas of economic crimes (42%) and offenses against morality (36.7%). On the other hand, there was major reduction in offenses involving tourists (98.8%) and corruption (75.4%).
Considering other dimensions of analysis, it emerges that crime in Kenya has various dimensions, among them age, gender and geographical dimensions.
Crime and Age in KenyaData available from the prisons department reveals that crime is strongly associated with age. Crime is predomi-nantly committed by persons aged between 16 and 25 years. Table 7 gives a summary of the crimes committed between 2006 and 2008, considering the categories of age and gender.
Table 70: Crimes Committed according to Age and Gender, 2006-2010
Year Sex Under 16 16-17 18-20 21-25 26-50 Over 502006 Male 1077 4455 20710 27838 37005 6700
Female 12 367 2797 3894 5666 613Total 1089 4822 23,507 31732 42671 7313
2007 Male 135 2787 16301 24244 29830 6791Female 0 260 2071 3047 3869 435Total 135 3047 18372 27291 33699 7226
2008 Male 154 1959 16225 20471 29339 11301Female 0 263 2690 2472 3257 283Total 154 2222 18915 22943 32596 11584
2009 Male 24 2890 21770 30822 32970 8286Female 25 207 2453 4247 3856 482Total 49 3097 24223 35069 36826 8768
2010 Male 43 2139 17605 24449 27519 6557Female 17 413 1784 3526 3901 628Total 60 2552 19389 28025 31420 7185Population* 6,431,272 1,358,409 2,021,189 2,715,999 6,869,042 814,702Weight** 0.17 23.4 63.2 38 4 10.1TOTAL 1378 10091 60794 81966 108966 26123
Source: Analyses from Economic Survey, 2007, 2008, 2009, 2010Notes85
This analysis indicates that one in every two (53%) of the crimes committed in Kenya, is committed by a person aged between 16 and 25 years. In 2007 for instance, youth aged between 16 and 25 years committed 48, 710 of the 89, 770 crimes committed in that year (54.3%). The proportion of youth committing crime (as proportion of total crimes committed) seems higher for women than for men. On average, women aged 16-25 years committed 56% of all offenses during the three years. If data for the persons aged 15 years and those aged 26-30 (to include all youth 15-30 years) were to be isolated, this proportion would even be higher, probably not less than 75 percent.
85-populationaccordingtothe1999census.Intheanalysis,‘under16’iscalculatedaspersonsagedbetween8and15years,while‘over50’includespersonsagedbetween51and70years(assumingthatprobabilityofcommittingcrimeforpersonsaged7andbelowandthoseaged71andaboveisnegligible).
**-calculatedasproportionofthosecommittingcrimeagainstthetotalpopulation,dividedbynumberofyearsinthecluster.Forinstance,forage16-17:(10091/1,358,409)(63/2).Totalnumberofyearsinanalysisis63(8-70),whilenumberofyearsinclusteris2(16-17).

295Institute of Economic Affairs
This trend is confirmed after weighting the age crime rates against the population. The highest proportion of crime is committed by persons aged 18-20 (63.2), followed by those aged 21-25 (38). Thus, the possibility that a person aged between 16 to 25 years would commit crime is around 41.5, as compared to a 4 chance among those aged 26 to 50 years. The analysis infers that effective crime prevention and mitigation in Kenya must essentially focus on youth.
Crime and Gender in KenyaAnalyses conducted indicate that crime in Kenya is highly gendered. Looking at all crimes committed by youth, male youth commit around 89% of the cases, with female youth committing only around 11%. The figure below summarizes the number of male and female prison convicts, between 2001 and 2009.
Figure 65: Crime by gender 2001-2009
Source: Economic Survey, 2006, 2010
Female and male youth differ in the type of crimes they commit. An analysis was conducted for 8 types of crimes between 2007 and 2008. The table below summarizes results of this analysis.
Table 71: Gender and Crime Types (2007-2008)
2007 2008Crime Category Male Female Male Female Total Male Total Female % Male % Female
Homicide 1681 338 1937 350 3618 688 84 16
Against morality 19114 4299 16,246 3996 35360 8295 81 19
Robbery and Theft 5229 30 3630 54 8859 84 99 1
Dangerous drugs and criminal damage
2585 5166 351 3833 2936 8999 25 75
Economic crimes and corruption
50 3 37 21 87 24 78 22
Assault 10,454 2862 9,414 2518 19868 5380 79 21
Infanticide and procuring abortion
5 21 2 17 7 38 16 84
Concealing birth 3 38 24 68 27 106 20 80
Source: KNBS, 2009
From the analysis, it emerges that there are ‘female crimes’ and ‘male crimes’. Women committed basically three types of crimes: infanticide and procuring abortion (84%), concealing birth (80%) and dangerous drugs and criminal damage (75%). On the other hand, men dominated five crimes, thus: Robbery and theft (99%), homicide

296Youth Research Compendium
(84%), offenses against morality (81%), assault (79%) and economic crimes and corruption (78%). The distinc-tion between the female and male crime is very clear, with high levels of predictability.
Geographical Distribution of Crime in KenyaLike age and gender, it is emerging that crime in Kenya has a geographical dimension. Against all claims that mod-ern crime is predominantly urban in nature, the highest number of crime cases was recorded in Rift Valley province (22.5%). The table below summarizes the crime cases in 2007 and 2008, by province.
Table 72: Number of Crimes Reported to Police by Province, 2007-2010
Province 2010 % 2009 % 2008 % 2007 % Average
Nairobi 6102 8.7 4712 6.5 4667 6.8 6395 14.3 9.1Rift Valley 19056 27.1 19716 27.4 9945 13.3 12590 22.1 22.5Central 9215 13.1 9929 13.8 12130 17 10187 13.1 14.2Eastern 9203 13.1 10003 13.9 9704 18.2 9615 13.8 14.7Nyanza 7859 11.2 8721 12.1 8739 15.6 7756 11.4 12.6Coast 9458 13.4 9291 12.9 8739 15.6 8182 13.7 13.9Western 8305 11.8 8610 12.0 7402 12.1 7088 10.3 11.5North Eastern
1216 1.7 1020 1.4 849 1.5 786 1.3 1.5
70414 100.0 72002 100.0 60961 100.1 69030 100 Source: Economic Survey, 2011
From the table above, it is implied that more than one in every five crimes committed is likely to be in Rift Valley Province. Central and Eastern provinces account for around 14% each, of the crime committed nationally. Con-sidering that the population of Rift Valley is much higher than other provinces, it then means that per capita crime may be most prevalent elsewhere. The likelihood that crime will be committed in Nairobi is around 9%, while the likelihood in North Eastern stands at only 1.5%. However, these statistics require weighting against the actual population in these provinces, to be able to arrive at a more accurate conclusion.
Furthering this discussion, new dimensions emerge when one considers the various crimes most rampant across the geographical regions. The table below presents this analysis.
Table 73: Types of Crimes Committed across Geographical Regions
Crime Category Nairobi Central Coast Eastern NEP Nyanza Rift/V Western TotalHomicide 134 378 274 371 22 340 291 227 2037% 6.6 18.6 13.5 18.2 1.1 16.7 14.3 11.1 100Offenses against morality and against persons
764 3393 2553 3410 381 3331 3029 2718 19579
% 3.9 17.3 13 17.4 1.9 17 15.5 13.9 100Robbery, breakings and stealing 1865 4168 3530 3012 242 2569 3373 2451 21210% 8.8 19.7 16.6 14.2 1.1 12.1 15.9 11.6 100Theft of stock 17 287 212 480 18 330 566 357 2267% 0.7 12.7 9.4 21.2 0.8 14.6 25 15.7 100Economic crime and corruption 383 388 317 253 14 165 267 222 2009% 19 19.3 15.8 12.6 0.7 8.2 13.3 11 100
Total 3163 8614 6886 7526 677 6735 7526 5975 47102% 6.7 18.3 14.6 16 1.4 14.3 16 12.7 100
Source: KNBS 2009a NEP - North Eastern Province
297Institute of Economic Affairs
The analysis indicates that all crimes are prominent in Central province, unlike other provinces. In this province, robbery, theft and economic crimes are especially high. In Nairobi, economic crimes are most rampant, while theft of stock and crimes against persons are rare. In Coast province, robbery and theft are common, while theft of stock is low. Eastern and Rift Valley share in high incidence of stock theft and relative low incidence of economic crimes. Offenses against morality are high in Eastern (17.4), Central (17.3) and Nyanza (17) provinces. Homicide is highest in Central (18.6) and Eastern (18.2) provinces.
It is therefore, concluded that type of crime has a general geographical dimension. Indeed, with such estimates, it may be possible to predict crime across the geographical areas, and even base prevention and mitigation responses on such analysis.
The Criminal Justice SystemThe criminal justice system in Kenya is regulated by several acts of parliament including the Prisons Act, Proba-tion Act and the Children Act. International instruments guiding the Criminal Justice Reform include the UN Code of Conduct for Law Enforcement Officials (General Assembly resolution 34/169, annex), United Nations Rules for the Protection of Juveniles Deprived of their Liberty (Assembly resolution 45/113, annex), Procedures for the effective implementation of the Basic Principles on the Independence of the Judiciary (Economic and Social Council resolution 1989/60, annex) , United Nations Standard Minimum Rules for the Administration of Juvenile Justice (The Beijing Rules) (Assembly resolution 40/33, annex) , Procedures for the effective implementation of the Standard Minimum Rules for the Treatment of Prisoners (Council resolution 1984/47, annex), United Nations Standard Minimum Rules for Non-Custodial Measures (The Tokyo Rules) (Assembly resolution 45/110, annex) , Implementation of the Declaration of Basic Principles of Justice for Victims of Crime and Abuse of Power (Council resolution 1989/57) and Guidelines on Justice in Matters involving Child Victims and Witnesses of Crime (Council resolution 2005/20, annex).
Various institutions are responsible for youth offenders in Kenya. These include the police department, prisons department, department of children services, and the judiciary and probation departments.
The police department arrests and confines youth, and presents them to court for hearing. The Children’s Act (Cap 586) was enacted in 2001, replacing the Children and Young Persons Act (CYPA) which consolidated all laws dealing with children and youth (under 18 years), and spelt out clearly the procedure of dealing with child offenders. This law mandates the Children’s Court to adjudicate all cases of child offenders, apart from that of murder and where children are charged jointly with adults (Article 184). Article 17 of the Children’s Act (2001) stipulates that no child (person under the age of 18 years) shall be subjected to torture, cruel treatment or punish-ment, unlawful arrest or deprivation of liberty, and further on, that a child offender shall be separated from adults in custody. Article 186 stipulates the rights and privileges of juvenile offenders, among them the right to legal representation, child-friendly hearing, privacy and the right to appeal. Further on, Article 191 lays down the 12 options for disposing cases involving child offenders (GoK, 2002).
Previous accounts have blamed the police of brutality and abuse of children and youth under custody. In the late 1990s, much outcry was raised against the department for utilizing the vagrancy act to harass children and youth (Human Rights Watch, 1997; ANPPCAN, 1998). Assiango, et al (2001) noted that the justice system in Kenya was putting a lot of emphasis on punishment [retributive justice], while arrests of youth were extremely rampant. The youth offenders overwhelmingly claimed that the police had used unnecessary force during their arrests and 53% of these participants claimed that the police officers had attempted to solicit a bribe or had threatened them. More than 50% of these offenders were denied their basic rights of communication that is they were not permitted to make a telephone call either to their relatives or friends while in the police cells. Around 27% of them were beaten by the police while under custody.
This act has since been repealed and since 2001, the department has initiated various reforms with view of im-proving police skills and knowledge of children and youth rights. One initiative has been the creation of the Child Protection Units and Child Help Desks at police stations countrywide. However, these units and desks, and gener-

298Youth Research Compendium
ally the resource level still remain inadequate to cater for the protection needs of children and youth entering the justice system.
The judiciary is charged with the responsibility of hearing cases, and making appropriate disposition. Cases of youth under 18 years are heard by children’s magistrates in children’s courts or in separate hearing sessions for children, with exception of youth who have committed murder and those charged jointly with adults. Pending finalization of cases, youth under 18 years are held in the Children Remand Homes (run by the department of children services), while older youth are either put in the adult remand prisons or in the limited youth remand facilities at Kamiti, Shimo la Tewa and Kakamega. If the court commits the person to rehabilitation, children aged between 10 and 15 years are sent to the Children Rehabilitation Schools (formerly approved schools), while those aged 16 and above are taken to the borstal institutions and youth rehabilitation and training centre, run by the Prisons Department. Other youth are handed over to the Department of Probation Services for community-based rehabilitation.
Borstal institutions are established under the Borstal Institutions Act, and are meant to rehabilitate youth aged above 16 years, and who have committed crime. There are two borstal institutions, one at Shimo la Tewa, and the other one in Kakamega – Shikusa borstal. Rehabilitation is offered mainly through vocational training. The Youth Rehabilitation and Training Centre is placed at the Kamiti Maximum Prison. This institution takes care of youth who have committed serious crime not punishable by death.
Driving ForcesFrom the analytical framework stipulated in section 2, several driving forces are highlighted. These include: ben-efits and costs of crime; power struggles; limited opportunities and societal frustrations; subcultures of crime; and initiation via crime learning processes.
Benefits and Costs of CrimeRecent trends have strengthened control of the political elite and the culture of impunity (indicated by various media reports, especially in regard to post-election violence and the ICC process). In the wake of the new consti-tution (promulgated in August 2010), which criminalizes corruption, various political icons in government have been identified as figures of corruption, and several of them have either stepped aside voluntarily, or ordered out of office by the executive. However, several others who had either been mentioned in drug dealing corruption were still holding public offices in November 2011. Analysis indicates that such impunity, which indeed idolizes corruption and amassing of wealth, has over time propagated the ‘get rich quick’ culture among youth. This cul-ture, blamed along other causes, has heightened law-breaking behaviour among Kenyan youth. While rewarding economic criminals has been an explosive preserve of the political class, effects of the negative modelling for young generations are only being felt now. This feeling was conveyed by the National Youth Forum convened on 12th November, 2010 in Nairobi, described as…the frustration of the Kenyan youth at the incessant state of confusion, indecisiveness, infighting, backstabbing, cartelism, impunity and corruption within parliament, cabinet and high levels of government… (Resolution of the Second Annual Youth Conference, November 2010).
Power StrugglesYouth and power struggle is not a new phenomenon in Kenya. Over the country’s history, youth have been identi-fied as drivers of resistance. For instance, various media accounts have documented that after the assassination of Tom Mboya in 1969, youth went on rampage in Kisumu and caused massive destruction of property, almost paralyzing business in this city. Similarly, youth were at the epicenter of power struggles of the late 1980s and into the early 1990s, driving for multiparty democracy. It has been claimed further, that youth were the key perpetra-tors of pre-election violence in 1991 and 1997. However, the climax of youth and power struggle was experience after the elections in 2007. (See also in this book, “Vigilante Violence”, by Sivi-Njonjo).
This incidence, it has been claimed, marked unimagined heights of youth criminalization, as mercenaries of the political elite. By the end of 2011, two years down the line, many youth were still held captive in jails, as defense-

299Institute of Economic Affairs
less victims of manipulation and power struggle. This ‘victimization’ reveals the vulnerability of youth, their pow-erlessness determined by in access to national resources. As long as youth are unemployed, unskilled, uninformed; as long as no avenues are availed to positively consume the energies of youth, this trend is likely to persist. From the analysis, it seems certain that youth are the leading victims of power struggles, and are synonymous with any political violence. It may seem likely, that youth will be at the centre of the next power struggle, if no drastic mitigation measures are taken.
Limited Opportunities and Societal Frustrations (and subcultures of crime)The analysis indicates that youth have limited access to the turbines of national production, to the infrastructure of economic and social production. The inequalities that exist between the wealthy and the poor are mostly felt by the youth, who have to seek opportunities for education, training and gainful employment. When these needs are not met, what results is frustration and stress. Following the frustration theories (Merton and others), youth react differently. The most prominent reaction to this structure of circumstance is rebellion, and the tendency to inno-vate their own ways of life as coping mechanism. Vigilantism (Mungiki, Kamjesh and other vigilante groups), hip hop culture and other inventions are products of the existing societal structure, mostly perceived as ‘anti-youth’. The rise in crime, including such crimes as illegal electricity and water connections, car-jacking, forgery and fraud are clear manifestations of a frustrated generation of young people, claiming space for survival, desperately raising voices to be heard.
It is highly probable that if these frustrations are not mitigated, crime would persist in the next decade, and more sophisticated forms of it would emerge, in a way that existing security infrastructure will not cope.
Poverty and social stratification The UN Habitat (2007) observes that in many African cities, more than 50% of the urban population are under the age of 19.8 years. They are adversely affected by rising urban poverty, high levels of unemployment, changing family patterns, and deteriorating environmental and health conditions.
Besides these, poverty and lack of opportunities for youth have been widely acknowledged as important factors influencing the rising indulgence of youth in crime and violence (UN Habitat, 2007). Notably, high incidence of crime concentrates in urban slum areas and in some rural areas where income opportunities are few, and where many youth have lost confidence. However, it has also been argued that not all poor people are resorting to crime and violence for survival, and generalized labelling should be avoided. Many poor communities have low crime levels, because there are other social and cultural values that act as controls for human behaviour (UN Habitat, 2007). Thus, high crime rates must also be blamed on both the erosion of social and cultural fabric, and frail government security systems.
Youth unemployment and unresponsive education system Recent studies have identified soaring rates of youth unemployment as a strong factor for explaining youth crime in Kenya (Gategi 2008; GoK 2002; Mhola, Ndung’u & Ngesa 2009; CSIN 2008; UN Habitat 2005/2007). Re-ports indicate that the number of new jobs created declined from 485,500 in 2007 to 467,300 in 2008 (KNBS, 2009). The annual average inflation rate in 2008 was 26.2%, heavily constraining the various sectors of the economy. A total of 7, 935,100 engaged in the informal sector in 2008 as unskilled or semi-skilled artisans, with earnings hardly enough to guarantee basic daily survival. The economy is only able to absorb 25% of the youth, leaving 75% to bear the burden of unemployment (GoK, 2002). With increasing cost of living and no productive employment, these youth are strained by economic pressures of maintaining better standards of living. It has been estimated that ‘each year in Africa, there would be 8.7 million new entrants into the labour markets for whom jobs would have to be found’ (UN Habitat, 2005). The push for one to earn income for survival is high; hence crime may present itself as a quick economic option.
Though the education sector in Kenya has in the recent past achieved commendable gains in terms of enrolment and retention rates, limited opportunities for education and training may be contributing to crime and violence

300Youth Research Compendium
among youth. While transition rates to secondary and higher institutions remain low, most post-secondary edu-cation institutions remain largely inaccessible to the poor. Subsequently, many youth have only attained primary education, which is mostly inadequate for securing any economically viable opportunities. Even where little op-portunities may be available, the bulk of youth is engaged in the informal sector.
Frail Justice SystemThe justice system has been blamed for the rising levels of crime. In a recent study, Crime Scene Investigation Nairobi (CSIN, 2008) identified various factors contributing to crime in Kenya. Making reference to the way post-election violence was handled in 2008, the centre noted that Kenya was full of repeat offenders, pointing to either underlying causes to crime, or faulty systems of rehabilitation, lack of DNA Forensic evidence in cases of rape and increase in abuse of alcohol and drugs. Anecdotal accounts of the justice system have claimed that the rehabilita-tion facility lacks basic facilities, and is short of the minimum requirements for any meaningful rehabilitation. The staff members are untrained on participatory methods of working with youth, and punishment and retribution are utilized as the principal means of rehabilitation.
The consequence of ineffective rehabilitation systems, rates of recidivism have been high, and many adults serving prison sentences have previously been committed to the rehabilitation schools, borstal institutions and the youth rehabilitation centre, indicating that they just graduate from one institution to the next (Muchemi, 2010). Nota-bly, the system lacks preventive focus, and the approach of dealing with youth crime in Kenya has been totally of reactive and curative nature, basing on retributive rather than reconciliatory and restorative principles. Instead of mitigating against youth crime, the frail institutions aggravate crime through perpetuation of aggression.
Initiation via Crime Learning ProcessesLooking at the current youth criminalization trends, and the breakdown of surveillance mechanisms in the era of mobile phones and internet (especially through the social networks), peer learning and peer pressure have grown into massive forces of crime initiation. The principles advanced by Sutherland (differential association and dis-sociation) have become real in our Kenyan context. True to this, various studies have pointed out the growing abuse of drugs among Kenyan youth, the growing prominence of youth gangs and front peers (mercenaries of the numerous arson incidences in Kenyan secondary schools), to cite but a few. Understanding this force from a differ-ential association point of view, it seems that the numerous pressures confronting youth are shared through both structured and unstructured process in neighbourhoods, schools, youth groups and so on, creating immense peer pressure that most youth are unable to resist. And agreeing with one writer, …barbarism comes in many forms, but when it leads to murder, then clearly, there is something very wrong in society (Editorial of The East Africa Standard, 18 October 2010, alluding to the numerous cases of arson in Kenyan schools).
Drug and Substance abuseAnother key determinant factor identified for youth crime is drug and substance abuse among youth (GoK, 2002). Generally, substance abuse is understood as the use of any chemical substance without medical consultation or supervision that may lead to loss of productivity or damage to the body (NACADA, 2004). Various sources of information have raised alarm that substance abuse among Kenyan youth has been on rapid rise (King’endo 2010; UN 2007), and have linked this phenomenon to crime and delinquency (NACADA, 2004). In a study of about 4,500 youth aged 10 to 24 years, NACADA (2004) established that drugs mostly abused by youth included alco-hol, tobacco, marijuana, khat (miraa) and inhalants in that order. A more recent study of drug abuse in secondary schools in Nairobi (King’endo, 2010) has established that 43% of all students in Nairobi schools may be taking alcohol. Other widely abused drugs include various stimulants (khat and cocaine) (31%), tobacco (22%) and can-nabis (15%).
The studies cited above have linked substance abuse to delinquency and crime, especially the habit of resorting to unlawful means of getting money in order to afford the drugs. Besides, drunkenness and drug use is known to influence higher incidence of risky sexual behaviour and increased cases of assault, among other law-breaking behaviour.

301Institute of Economic Affairs
InescapablesAs a result of national and global trends, Kenya will also have to deal with older forms of crime but in larger mag-nitude, as well as newer forms of crime happening elsewhere in the globe than it has. These include:
The information age and advent of Cyber crime It has been claimed that the future of today’s information societies is contingent upon the evolution of cyberspace as a complex human and technical system (Mansell & Collins, 2005:1). Indeed, the emergence of information societies has been met with cries of pessimism as regards crime prevention. For instance, recent cyberspace inven-tions like the widely used Facebook among the youth have introduced highly unpredictable behaviours, rendering efforts to prevent crime almost helpless.
Moore (2005) defines cybercrime as any crime that involves a computer and a network, where the computers may or may not have played an instrumental part in the commission of the crime. This crime type has emerged very prominently during the last decade, and as the BBC has claimed, cyber crime is one of the fastest-growing criminal activities on the planet, [and Kenya is no exception]. Probably, cybercrime is one of the most prevalent forms of crime in Kenya, though there are no comprehensive records. Cyber crime encompasses hacking of information and data, copyright infringement, child pornography and child grooming, and the various other forms of piracy. Cybercrime is also manifested through uploading of obscene or offensive content onto the inter-net, internet homicide (where murder victim and perpetrator connect online), web-based fraud and forgery, drug trafficking, and cyber warfare (and creation and spreading of viruses and spam), all through to cyber terrorism.
A survey on crime and security conducted by CSI and FBI in 2000 established that 90% of US companies had detected computer security breaches in the previous year, while 74% acknowledged financial losses as a result of the breaches of security. Twenty five percent (25%) of respondents had detected penetration from outside their company, while an overwhelming 79% detected employee abuse of the internet, for example downloading por-nography or pirated software.
Globally, the loss incurred through cybercrime is immense. While the German Foreign Minister estimated the global loss through cybercrime at USD 40 billion a year, the CSI/FBI study quantified the financial losses of the 273 responding institutions to USD 265 million.
Kenya has not been spared by cybercrime either. In an article published on the East African Standard (13th August 2008), Muthoga Kioni warned of mushrooming cybercrime in Kenya. Noting that Kenya was at the threshold of a cyber boom, the author urged for speedy development of legislation so as to effectively protect electronic com-merce, and urged the judiciary to permit the admissibility of electronic evidence in judicial proceedings.
While Kenya largely lacks the structures to fight cybercrime, concerns have been raised that going with the current trends, the country will continue to bear massive losses through cybercrime. This links to the global dilemmas of data storage and access, management of cyber evidence, privacy protection and identification, among others (Mansell & Collins, 2005).
Terrorist Movement in Horn of AfricaRecent trends have put Kenya on focus, as the boiling pot of terrorism in the Horn of Africa region. Kenya has been both a target and launching pad for terrorist activity, including targeted pirate activities along the Soma-lia and Kenya Indian Ocean waters. Even the 2010 terrorist activity in the city of Kampala has been linked to mercenaries in Nairobi, portraying Kenya as a dangerous transit point for trans-border terrorist movement. The uncontrolled and ever-worsening security situation in Somalia poses specific threat to Kenya and region, and what is even more worrying is that an immediate solution is not foreseeable. Adding to this, Kenya’s weak capacity to control movement along the long Somalia border presents unique vulnerabilities. Considering all these dimen-sions, it is expected that fundamentalist activity may intensify, as Kenya tightens her grip on global policies and alliances with the West (USIP, 2004).
302Youth Research Compendium
Sophistication of FraudBank frauds are on the rise, and are taking more sophisticated forms. Various media reports have presented young people who are well educated and IT savvy as major proponents of the increase of fraud. From the printing and sale of University degree certificates, to bank frauds and fraudulent dealings in the corporate sector, the IT-elo-quent youth stand in the middle of a growing and extremely frightening crisis. In this respect, Kenya will have to contend with these forms of crime in the near future, and investment in the containment of these crimes is urgently
called for. The longer it takes, the more sophisticated fraud crimes become.
Interventions and Programming to Curb CrimeInterventions and programmes for youth and crime can be categorized into two: reactive and proactive, or preven-tive and curative. Prevention is usually conceptualized at three levels: primary, secondary and tertiary. Primary prevention encompasses all activities targeted at children and youth in strengthening positive behaviour, before any problem behaviour has been noted. School-based prevention, improving housing and neighbourhoods, edu-cating parents and forming of child support clubs may be examples of primary prevention. Secondary prevention involves reactions to early signs, or early intervention. Guidance and counselling, administration of certain be-haviour therapies for youth showing signs of risk and so on, are examples of secondary prevention. On the other hand, tertiary prevention involves all activities targeting youth who have already been convicted, to avert further deterioration or recidivism. Youth rehabilitation and probation are therefore forms of tertiary prevention.
The UN guidelines for the prevention of crime (UN, 2002:2) suggest that crime prevention must be based on four key pillars. Foremost, crime prevention must promote the well-being of people and encourage pro-social behaviour through social, economic, health and educational measures, with a particular emphasis on children and youth, and focus on the risk and protective factors associated with crime and victimization (prevention through social development or social crime prevention). Secondly, crime prevention interventions must seek to change the conditions in neighbourhoods that influence offending, victimization and the insecurity that results from crime by building on the initiatives, expertise and commitment of community members (locally based crime prevention). Third, the initiatives must prevent the occurrence of crimes by reducing opportunities, increasing risks of being apprehended and minimizing benefits, including through environmental design, and by providing assistance and information to potential and actual victims (situational crime prevention). Lastly, the interventions must focus on preventing recidivism by assisting in the social reintegration of offenders and other preventive mechanisms (rein-tegration programmes).
Following up especially on the second pillar, the UN Habitat has been propagating urban safety and security through effective urban planning, design and governance. This has been led by the proposition that there is a rela-tionship between the characteristics of the built environment and the opportunity to commit crime (UN Habitat, 2007). In this thinking, manipulation of the built environment is seen to harbour the potential for reducing or
even eliminating the opportunity to commit crime. However, there exists no documented evidence, as to whether this has worked for Kenya or not. In other countries, community-based initiatives have covered a broad spectrum of approaches including information-gathering, processes for determining policies and projects, implementation, and creating opportunities for communities (and youth) to take initiatives themselves (ICPC 2005; UN Habitat 2007).
Case Study 5: Safer Cities - Dar es Salaam Project
The city of Dar es Salaam, like many other African cities, has grown rapidly over the last few decades, yielding to the challenges of overcrowding and congestion; sprouting of informal settlements, and increase in crime. This rising insecurity has caused strain on the crime and surveillance services. To address these challenges, the Safer Cities project was initiated in 1997, in partnership with the UN Habitat. This project sought to build concrete lo-cal partnerships to develop locally based solutions to prevent crime in their neighbourhoods and build awareness among communities about safety and security.

303Institute of Economic Affairs
The strategy addressed three key areas i) law enforcement including the creation and training of the City Auxiliary Police, the development of neighbourhood watch groups (Sungusungu), and the development of Ward Tribunals to expedite minor offences; ii) social and economic issues including job creation and skills training, cultural, and recreational activities for youth at risk; and iii) environmental design includ-ing the use of women’s safety audits to identify needs for safety enhancement.
The project has reaped several outcomes in crime prevention and reduction. Institutional capacity and skills in crime prevention at the municipal level have been embedded, co-ordinated and strengthened by the project. Citizens now have a better understanding of prevention, and of the benefits of develop-ing their own crime prevention initiatives, and a programme to integrate youth into the local authority decision-making framework is underway. The project seeks to embark on a third phase - ‘rolling out’ the Safer Cities approach to other urban centres in Tanzania; seven municipalities have already requested assistance. The Safer Cities Dar es Salaam project won the award for best crime prevention initiative at the Africities Summit in 2000 in Windhoek, Namibia, and in 2003 in Yaoundé, Cameroon, and was nominated Best Practice by the 2004 Dubai International Award for best Practice.
Marcus (2004) argues that the success of projects to prevent crime must ensue through social development and active participation of all partners in their conception, execution and assessment. This has been referred to as the principle of co-production, the process that allows all central and local state agencies like civil society and private sector institutions, and the residents involved to participate jointly in building safer living environments for the mutual benefit of all. Co-production is based on the fact that everyone is responsible for safety and not only the criminal justice system. This premise comes from the multi-causal nature of crime and from the anti-social behav-iour, as well as from the need for a coordinated and integrated multi-sectoral solution. This principle has inspired many interventions in South America.
Case Study 6: Peru - Local Citizens Security Committees
Peru was affected by a 2-decade civil war, which caused a near collapse of the security forces. To recover from this, the country opted for a participatory approach to the creation of a national citizen security system. Created in 2003, this security system seeks creation of citizen security committees at national, regional, provincial and local levels. The local committees are multi-sectoral, chaired by the mayor and include representatives of the police and justice systems, health, education, and civil society organiza-tions, and are mandated to develop local safety diagnoses and implement and evaluate strategic safety plans.
The aim of this initiative is to build the capacity of civil society on citizen security, strengthen their abil-ity to support local crime prevention efforts and improved police community relations; build capacity of the police service, local authorities and community groups to ensure that their intervention is effective and sustainable; improve local perceptions of safety and security in selected areas; as well as build and consolidate social capital in community groups.
Results indicate that this initiative is consolidating social capital at the local levels for improvement of security for all citizens in the selected areas.
Reactive or curative interventions, on the other hand, are led by the principal of intervening after something has occurred. Arresting youth who have committed crime, or declaring curfew and other restrictions in areas where violence has erupted are typical forms of the reactive approach. In Kenya, it may be claimed that reactive strength-ening of the formal criminal justice system and policing has traditionally been the main tool for responding to youth crime and violence. However effective this may be, the approach fails on the fact that justice systems may never reduce crime in the country, and reacting after something has already happened would be like mopping a floor while the tap is still running (Mugo, 2004).

304Youth Research Compendium
The UN Guidelines for Crime Prevention (2002) have been instrumental in setting out the basic principles on which good crime prevention should be developed, and outlining the range of strategies and practices which can be used to develop safer, healthier communities. These guidelines define the key principles that should steer effec-tive crime prevention, among them, that, all levels of government should play a leadership role; crime prevention should be integrated in a cross-cutting way into all social and economic policies and programmes including em-ployment, education, health, housing and urban planning, justice and social services; strategies should be built on co-operative partnerships between government institutions and ministries, community and non-government orga-nizations, and the business sector and civil society; there must be adequate funding and other resources, and clear accountability to ensure the implementation and sustainability of strategies; strategies and interventions should be based on a sound knowledge base about the causes of crime and effective practices; all crime prevention initiatives must respect human rights and the rule of law; account must be taken of the links between local and transnational organized crime; and crime prevention strategies should take particular account of the different needs of men and women, and the most vulnerable members of society (UN, 2002).
Case Study 7: Canada – School-based Crime Prevention
Together We Light the Way (TWLTW) was a project formed in a school community in Ontario, Canada, as way of confronting the rising crime and family violence. The school was posting the lowest academic performance in the region, linked to a myriad of social problems. Subsequently, students were at the centre of vandalism and breakage, targeted at especially the local business community.
The aim of the project was to prevent crime at the level of children, nurturing them into the values of respect, motivation to succeed academically, interact and play co-operatively with peers and interact re-spectfully with members of the community. Conversely, the entire community was brought in to actively share responsibility for the children’s safety, well-being and education.
Results demonstrate considerable progress in learning employable skills and habits; a 76% reduction in violence and bullying; improved attitudes, values, and behaviours toward school; and the creation of productive partnerships. There was a 92% increase in parental, business and community partner in-volvement with the children, schools and communities, as well as outstanding improvement in academic performance of the school.
Considering the Kenyan social, economic and political contexts, several lessons can be drawn from the three cases cited above, and the intervention analysis conducted earlier. Overall, it is seen as critical to institutionalize an in-tegrated approach to crime intervention. This approach should be guided by the key elements of Effective Local Leadership, Creation of Technical Teams, Local Diagnosis and Strategy Design, Design and Implementation of Focused Local Strategies and Evaluation.
Institutionalizing Knowledge-Based Crime ManagementLack of accurate information on the main problems affecting significant sectors of youth population is probably the biggest challenge in youth intervention (Lunecke & Vanderschueren, 2004). For Kenya, it is key to initiate ac-tion research for generating evidence on crime and crime interventional approaches, for improved crime manage-ment. Most critical is generation of baseline data through crime scanning and mapping. There is need to create a stronger data base, while coordinating all data sources including schools, villages, hospitals, police department, children services, social services, judiciary and other institutions. Managing this data would offer adequate back-ing for crime monitoring and evaluation.
To achieve this, the contribution of local universities is most vital. Kenyan Universities must be seen (and must consider themselves) as key stakeholders in youth crime management. Investing more in crime research and link-ing more to other partners would contribute immensely to the building of knowledge-based crime management systems in Kenya.

305Institute of Economic Affairs
Co-production and Insisting on Stakeholder ParticipationThe overall process of co-production constitutes a valuable lesson for Kenya’s youth crime management agenda. Even though community policing, the initiative introduced by the police department a few years ago, is based on co-production, there is need to strengthen the participation of all partners, and especially locally-based institu-tions. Beyond mounting media campaigns, it would be critical to actively involve local communities in proactive management of crime.
Building Capacities for Crime PreventionAs noted in this paper, there is need to continue building capacity, not only of the formal justice system, but also of other partners and local communities. Capacities to predict crime, manage data, communicate and prevent youth crime are most critical for Kenya.
Influencing PolicyExamples from around the world have indicated that having specific policies, for instance a paper on youth and crime, is vital. For Kenya, it is critical to develop clear and widely shared policies on crime prevention, and espe-cially targeted at the youth. Such policies must pay due attention to emerging crimes, like cybercrime.
Addressing the Challenges Facing Youth in KenyaThis is the most fundamental intervention. The government and general citizenry must endeavour to continually confront the myriad of challenges facing youth in Kenya. Key among them is the challenge of education and train-ing, drugs and substance abuse as well as unemployment. Expanding horizons for youth is probably the only way to reduce crime and the violence prevalent among the young people.
References
ANPPCAN (1998). Children in the Dock. A situational Analysis of the Juvenile Justice System in Kenya. Arcadia Communications, Nairobi, Kenya.
Assiango, J., Stavron A., Ravestijn & Jackson A. (2001).Youth and Crime in Nairobi. Un-Habitat. Safer Cities Programme.
Blatier, C. (2002). Delinquency of Minors (2nd Edition). Presses Universitaires de Grenoble.
Campbell, C. (2002). Juvenile Delinquency in Colonial Kenya, 1900-1939. The Historical Journal, Vol.45, No.1,pp 129-151.
Cohen, A.K. (1968). Deviance and Control. Englewood Cliffs.
Colony and Protectorate of Kenya (1958). Treatment of Offenders Annual Report, 1958.
Colony and Protectorate of Kenya (1959). Treatment of Offenders Annual Report, 1959.
Crime Scene Investigation Nairobi (CSIN) (2008). Quantitative Research Findings on Rape in Kenya between Dec. 2007 and June 2008.
De Boeck. F. & Honwana, A. (2005). Children and Youth in Africa. Agency, Identity and Place. In Honwana A. And De Boeck F. (eds), Makers and Breakers: Children and Youth in Postcolonial Africa. Oxford: James Currey.
Duff, R.A. & Green, S.P (2005). Introduction: The Special Part and its Problems. In R.A Duff and S.P. Green (eds). Defining Crimes: Essays on the Special Part of the Criminal Law. Oxford: Oxford University Press.
Eshiwani, G.S. (1993). Education in Kenya since independence. Nairobi: East African Educational Publishers.

306Youth Research Compendium
Foucault, M. (1982). The Subject and Power. In Critical Inquiry, Vol. 8, No. 4 (pp 777-795). www.jstor.org/stable/1343197
Francis, P. and Githagui, N., (2005). Youth in Kenya: Force for change, or lost generation? Paper presented during the WB ESSD Week Session on ‘Youth: Assets for Social and Economic Transformation’ . March 31, 2005
Gategi, C.W. (2008).Youth and Crime. Retrieved from www.korogocho.org/English/index-php, 27th March 2010.
Government of Kenya (GoK) (2007). Ministry of Youth Affairs, Kenya National Youth Policy 2007. Nairobi: Government Printers.
Government of Kenya (2002). The Children Act, 2001. Kenya Gazette Supplement No. 95Government of Kenya (GoK) (2002). Kenya National Youth Policy.
Human Rights Watch (1997). Juvenile Injustice: Police abuse and detention of street children in Kenya. New York: Human Rights Watch.
International Centre for Crime Prevention (ICPC) (2005). Urban Crime Prevention and Youth at Risk. Compendium of Promising Strategies and Programmes from around the world. Retrieved from www.crime-prevention-intl.org, on April 4 2010.
Kenya Police Department (2009).Comparative Provisional Crime Figures for 2006.2007 and 2008.
Kenya National Bureau of Statistics (2011). Economic Survey 2011. Nairobi: Government Printer.
Kenya National Bureau of Statistics (2009). Economic Survey 2009. Nairobi: Government Printer.
Kenya National Bureau of Statistics (KNBS) (2010). Kenya Population and Housing Census 2009. Nairobi: Government Printer.
King’endo, M. (2010). Incidence and extent of substance abuse among secondary school students in Nairobi: Implications for specialized intervention. Kenyatta University, Doctor of Philosophy thesis.
Lamnek, s. (1999). Theorien abweichenden Verhaltens (7th ed.).Munich: Wilhem Fink
Lunecke A. & Vanderschueren, F. (2004). Anti-social behaviours and delinquency in adolescents, in prevention of youth delinquency. Ministry of Interior Affairs, Chile.
Mansell, R. & Collins, B.S. (eds) (2005). Trust and Crime in Information Societies. Cheltenham: Edward Elgar.
Marcus, M.(2004). Citizen Security Policies in Europe and Latin America: Lessons and Challenges. Ministry of Interior Affairs/IDB, Citizen Security Division Chile.
Merton, R.K. (1969). Social Theory and Social Structure, 9. New York.
Merton, R.K. (1968). Social Theory and Social Structure. New York.
Merton, R.K. 1964 anomie, anomia and social interaction: contexts of deviant behaviour, in M.B. Clinard (ed). Anomie and deviant behaviour. A discussion and critique. New York
Moore, R. (2005) “Cybercrime: Investigating High-Technology Computer Crime,” Cleveland, Mississippi: Anderson Publishing.
Muchemi, N. (2010). Educational Outcomes in rehabilitation of child offenders in Kenya. Life stories of graduates of Othaya Rehabilitation School, Nyeri. An ongoing M.Ed study at Kenyatta University.
Mugo, J.K., Oranga, J. & Singal, N. (2010). Testing Youth Transitions in Kenya: Are Young People with Disability Falling through the Cracks? Working Paper for the Research Consortium on Outcomes of Education and Poverty (RECOUP), University of Cambridge.
Mugo, J.K., Musembi, D. and Kamau-Kang’ethe, R. (2006). Juvenile Justice and Management of Child Offenders in Kenya. An annotated bibliography of research 1958-2005.

307Institute of Economic Affairs
Mugo, J.K. (2004). Rehabilitation of Street Children in Kenya: Approaches, Quality and Challenges. Frankfurt: IKO.
Muola J.M., Ndung’u M.N & Ngesa F. (2009). The Relationship between Family Functions and Juvenile Delinquency: A Case of Nakuru Municipality, Kenya. African Research Review, Vol.3 No.5.
NACADA (2004). Youth in Peril Alcohol and Drug Abuse in Kenya. A Baseline Survey report. Nairobi: NACADA.
Ndichu, E. (2008). Saving the Young; Social Workers’ Perception of Juvenile Crime Prevention in Sweden. MSc. Thesis, Goeteborgs University, Sweden.
Oriedo, M. (2010). Saving Youth in Slums from Life of Crime. The East African Standard, 17 February 2010.
Otiende, J.E., Wamahiu, S.P. & Karugu, A.M. (1992). Education and Development in Kenya: A Historical Perspective. Nairobi: Oxford University Press.
Plecas, D., Evans, J. & Dandurand, Y. (1998). Migration and Crime: A Canadian Perspective. Vancouver: The International Centre for Criminal Law Reform and Criminal Justice Policy.
Republic of Kenya (RoK) (1976). Annual Report on the Administration of Prisons in Kenya (1976). Nairobi: 1976.
Sammons, A. (undated). Problems in Defining Crime. Psychlotron Resources. www.psychlotron.org.uk/newResources/criminological/A2_AQB_crim_problemsDefiningCrime.pdf, retrieved 25 May 2010.
Simutanyi, N. (2009). African Debate on Social Justice. Lusaka: Centre for Policy Dialogue.
SOS Sahel/IIED (2010). Planning with Uncertainty: Using scenario planning with African Pastoralists. Springer, W. (1973). Krininalitaetstheorien und ihr Realitaetsgehalt. Stuttgart.
Sutherland. E.H. (1968). Theory of Differential Association. In F. Sack and R. Koenig (eds.). Kriminalsoziologie. Frankfurt
Sutherland, E.H., Cressey, D.R. (1955). Principles of Criminology (5). Chicago.
Thrasher, F.M. (1936). The gang. A study of 1313 Gangs in Chicago. Chicago.
United Nations (2002). United Nations Guidelines for the Prevention of Crime – 2002. Draft Resolution II – Action to promote effective crime prevention. Retrieved from http://www.e-doca.eu/content/docs/UNguidelines.pdf, on 13 April 2010.
UNFPA (2003). State of the World Population 2003: Investing in Adolescents’ Health and Rights. New York: UNFPA.
UN Habitat (2007). Enhancing Urban Safety and Security. Global Report on Human settlements (2007).
United States Institute of Peace (USIP). (2004). Terrorism in the Horn of Africa. Special Report, January 2004. http://www.usip.org/files/resources/sr113.pdf, retrieved 30. Dec. 2010.
Wolfgang, M.E. & Ferracuti, F. (1967). The Subculture Of Violence. Toward An Integrated Theory In Criminology. London.
Whyte, W.F. (1955). Street Corner Society. The Social Structure of an Italian Slum. Chicago, enlarged edition.

308Youth Research Compendium
Sports: On the Right Track 11By Dr. Elijah Rintaugu, Dr. Andanje Mwisukha and Simon Munayi
AbstractThis paper is written on the premise that Kenyan youth participation in sports and recreation is not well docu-mented. The paper therefore tracks sports in Kenya from pre-colonial, colonial and post colonial periods with a particular emphasis on All Africa Games, Common Wealth Games and the Olympic Games. It highlights personal and external factors that have influenced youth participation in sports and recreation in Kenya. The various poli-cies for youth sports in Kenya are weighted against other policies in Nigeria, England and USA to demonstrate mechanisms instituted elsewhere that makes youth participation in sports more efficient. The emerging trends of youth in sports and recreation in Kenya are highlighted and various fundamental issues are raised with a view to strengthen youth participation in sports and recreation in Kenya.

309Institute of Economic Affairs
Contextualizing Sports in and Recreation in KenyaSports86 and recreation87 activities can contribute immensely towards the enhancement of the growth, develop-ment, health and general quality of life of the youth. In theory and practice, these activities include both indoor and outdoor activities, as well as physically active and passive pursuits that are meaningful and enjoyable to the participant (Torkildsen, 1992). The main distinguishing factor between these forms of activities and others in which people may participate for enjoyment is that they must be morally and socially acceptable and contribute to the wellbeing of the participants (Cordes & Ibrahim, 1999). The development, organization and coordination of youth sports and recreation activities and programmes should therefore be done in a way that ensures that they uphold societal values, and contribute to their wellbeing.
If logically coordinated and conducted, the whole array of sports and recreation activities is beneficial to par-ticipants. The benefits are broadly categorized as psychological, physical and social (Beashel & Taylor, 1992; Payne & Hahn, 2000). Some of the physical benefits include enhancement of physical fitness and health, while the psychological benefits include management of stress, escape from personal pressure, having rest, building self-confidence and self-image and sublimation. Development of friendships, interaction and bonding with others, learning of sportsmanship and socially acceptable behaviour constitute some of the social benefits of the activities (Cordes & Ibrahim, 1999). It is due to these benefits that sports and recreation translate into large economic in-dustries involving many people of all age categories.
As much as the benefits of participation in sports and recreation are well documented (Beashel & Taylor, 1992; Cordes & Abraham, 1999 Payne & Hahn, 2000), Kenya’s youth participation in sports and recreation is not. Al-though participation in sports is thought to ensure that the youth expend their surplus energies in socially accepted activities, documented evidence does indicate that many young people are involved in contraindicative practices such as drug use and substance abuse, organized gangs and are a vulnerable group in terms of teenage pregnan-cies, early marriages, HIV and AIDS among other vices (Gitonga,1998; Republic of Kenya, 2005). They were also adversely involved as main actors in the Post-Election Violence (PEV) of 2007/8.
Conceptual FrameworkThe issues revolving around youth and their participation in sports and recreation in Kenya will be conceptualized under the factors which influence performance in any type of sporting endeavours, and with specific reference to the Kenyan situation as shown in the figure 66 below.
Figure 66: Factors Influencing Performance in Sports in Kenya Source: Njororai, 2003.
86Anyactivityinvolvingphysicalexertionandskillthatisgovernedbyasetofrulesorcustomsandoftenundertakencom-petitively
87Sociallyacceptedactivitiesengagedinduringfreetimeforenjoyment,amusement,relaxationandhealth.Thesemayin-cludesports,games,exercises,amongothers(BeaselandTaylor,1992)

310Youth Research Compendium
External factorsExternal factors are associated with conditions such as climate, weather conditions and altitude. This could par-tially explain the reason for the establishment of numerous training camps for long distance running in the Rift Valley province which has many areas of high altitude. Other external factors include socialization agents such as family, learning institutions, availability of teachers/coaches, peer group influence and general community influ-ence with regard to participation in sport and recreational activities (Njororai, 2003).
It is important to note that sociological factors have seen talent identification and nurturing being dichotomized along different ethnic groups and regions. For instance, in Kenya, the Rift Valley region is associated more with athletics, while Western and Luo Nyanza are identified with football. However, some sports such as volleyball, basketball and rugby have athletes coming from different parts of the country possibly due to the influence of educational institutions and more aptly the secondary schools where competition in sports is deeply entrenched and cherished (Wamukoya, 1994).
Schools are credited with the provision of facilities, equipment and teachers or coaches who ensure that pupils con-tinue participating in sports activities. However, the schools determine the kinds of sports activities given preferen-tial treatment (Gitonga, 1998). It is notable that secondary schools have been used as a medium to introduce new disciplines through their sports competitions. However, some sports disciplines have tended to be dominant in cer-tain schools. Former European schools appear to put a lot of emphasis on the modern games that they introduced in the country such as rugby, tennis and cricket while Asian schools tend to put emphasis on hockey and cricket.
Other external factors include political influence through sports policies, sports clubs and sports organizations as well as general management and administration of sports in the country. For instance, the perennial wrangles in various sports organizations which are supposed to be dealt with through administrative mechanisms and within specific policy frameworks have adverse implications on the development of sports in the country. Financial poli-cies revolving around sponsorship and incentives also determine, to a large extent, the country’s participation in major international sports events (Rintaugu, 2005).
Personal FactorsPersonal qualities of age, weight, height, physique and genetic endowment have a lot of implications on perfor-mance of the sport that one ventures into. For example, Kenya’s athletes in long distance races are quite unique in terms of physique and genetic composition from the rugby players. Whereas the athletes appear more ectomor-phic (lean), the rugby players, on the other hand predominantly appear mesomorphic (muscular) in stature. Simi-larly, physical conditions of speed, flexibility, endurance, agility and strength are essential requisites in different sporting events. Kenyan athletes’ excellent performance in the long distance races can be attributed to endurance, while the sprint events in which Kenya’s performance has been dismal require strength and speed.
A combination of psychological factors such as will-power, motivation, incentives and mental focus together with technical and tactical factors are crucial to performance in soccer in which Kenya has continuously performed dismally. Most of the time, the national soccer team is composed of new players who meet with new coaches and team managers on the eve of crucial matches. Furthermore, soccer training camps are too short and uncoordinated to allow the players to master the necessary team chemistry in terms of psychological preparation, tactical and technical improvement.
Historical Perspectives of Youth Sports and Recreation in KenyaThe current status of youth sports and recreation in Kenya is a product of events that have unfolded from the pre-colonial, colonial and post-colonial eras. In order to shape the future of youth sports and recreation, it is inevitable to have an analysis of historical events that have contributed to the current status of youth sports and recreation.

311Institute of Economic Affairs
Sports during the Pre-Colonial Period (before 1895)Early forms of sports and recreation activities are popularly referred to as ‘traditional sports and games’ or as ‘indigenous sports and games’ (Asembo, 2003). These early forms of sports and games were closely related to the activities that people engaged in to avail food and defend themselves against aggressors. The most prominent sports and recreation activities in most traditional Kenyan communities included: spear-throwing that was related to hunting and need for defense against hostile environments (Mazrui, 1986); running/racing which was geared towards meeting the need for food through hunting; swimming was also a common activity that was learnt due to the need for fishing and communication across large rivers and lakes; and wrestling was also widespread as a way of identifying strong members who would be relied upon to defend their communities.
However, for better understanding and appreciation of these games, scholars and researchers have classified them under different categories (Wanderi, 2000; Njororai, 2003). These include: games of physical challenge which comprised of traditional forms of wrestling, tug-of-war and the like; games of physical skill and strategy which included javelin-like throwing activities, cone activities, bow and arrow throwing, rolling, hoop play and others; group interaction games such as hide-and-seek games, singing and dancing; games of imagination in which par-ticipants initiated or aped the characters or traits attached to animals; mind games which were basically memory and problem-solving games that focused mainly on devising strategies of defeating opponents; games of seasonal context which were engaged in during certain seasons of the year like hunting of certain species of animals and swimming during rainy seasons.
Although the traditional forms of games were mainly for community survival and defense, they were beneficial in a number of other ways, including: preservation of the peoples’ culture; fostering and maintaining community or group identity and developing character and personality traits.
Because various communities in Kenya had a sporting culture, and the fact that some of the traditional sports were more or less similar to the ones that were introduced by the colonialists, this provided ready opportunities for the entrenchment of regulated ‘western’ or ‘modern’ sports.
Sports during the Colonial Period (1895-1963)The colonization of Kenya by the British in 1895, their declaration of the country as a colony of Britain in 1920 and their subsequent rule up to 1963 marked another chapter for sports in Kenya. It was during that colonial rule that the modern forms of sports and games were introduced in the country while the traditional ones were discarded as being primitive. The various forms of sports and games that had been popularized in Europe (in Britain in particular), North America and Asia during the World War I and II were also imposed on Kenya (Nteere, 1982; Nteere, 1990). The key milestones that were realized during this period were: introduction of the modern sports in Kenya, some of which were, unfortunately, played along racial lines. For instance, tennis, cricket, rugby and football were introduced by the British in the first part of 20th Century while Basketball was introduced by American missionaries in 1950s. According to Bhushan (1988), rugby and tennis were games that were strictly for whites only and hockey was preserved for Kenyans and Indians; development of Physical Training curriculum for schools that focused on the teaching of the modern sports; introduction of competitive sports in schools, commu-nities and international levels in the 1950s. This marked Kenya’s international competitions debut at the Olympic Games held in 1956 in Melbourne, Australia; open spaces were set-aside in urban and rural areas to accommodate sporting activities. The colonial authorities allocated some fiscal resources for the establishment of sporting facili-ties and purchase of sports equipment. For instance, the introduction of swimming programmes in some schools is traced to the pre-independence period during which facilities were constructed; the colonial authorities also appointed several education commissions that highlighted the teaching of Physical Training (PT) and drill in the elementary schools. A good example is the Fraser Report on Education of 1909 which emphasized on drill and PT as one of the mandatory subjects at the elementary schools level. The Phelps – Stokes Commission Report of 1924 also highlighted the inclusion of recreation in school curriculum, and the main focus was PT and simple Calisthenics (East African Protectorate). The purpose of recreation was to develop learners’ character through PT; founding of several national sports associations/federations that played a role in the management and administra-tion of sports in the country as indicated on table 74 below

312Youth Research Compendium
Table 74: Formation of National Sports Associations/Federations in Kenya
Sports Federation Year Founded
Kenya Rugby Football Union 1921
Kenya Golf Union 1928
Kenya Amateur Athletic Association 1950
Kenya Cricket Association 1953
National Football Association 1956
Kenya Hockey Union 1956
Kenya Amateur Wrestling Association 1956
Source:Nteere,(1990)p.89
It is notable that these Federations/Associations have continued to administer and manage different sports disci-plines in Kenya to date with diverse levels of success. However some of these associations are characterized by lack of transparency, accountability, ineptness, perennial wrangles and undemocratic practices.
Sports and Recreation in the Post – Colonial Period (1963 to date)From the time Kenya attained independence from the British colonial rule in 1963, the successive post-colonial governments continued to embrace and develop sports. A number of measures and strategies were put in place to enhance the management and administration of sports in the country. The key milestones in creating structures of sports management include:
• Etablishment of the Kenya National Sports Council (KNSC) in 1966 to coordinate the activities of the na-tional sports federations and also assist in the preparation of national teams for the All-Africa Games
• Creation of the department of sports in the ministry in charge of sports in 1989 as a government arm that oversees sports programmes and activities in the country
• Establishment and operations of the National Olympic Committee of Kenya (NOCK) to facilitate Kenya’s participation in the Olympic Games
• Establishment of national sports federations to coordinate and organize sporting activities in their respective sports disciplines
• Establishment of national sports federations for educational institutions to oversee sports programmes in the institutions
• Government’s provision of ‘some’ funding for sports development in the annual financial budget; establish-ment local authorities welfare departments in the cities, municipal and county councils whose responsibili-ties, among others, to render sports services
• Establishment of a substantial number of government departments and other quasi – government organiza-tions (parastatals) to have sports departments that organize and coordinate sports programmes for their employees.
Soon after independence, the post-colonial government sought to re-structure the education system in the country so as to infuse and propagate the traditional values of the indigenous people that had been eroded by the colonial masters. As such, several national commissions on education were appointed for this purpose, and their recom-mendations had some direct influence on the teaching of Physical Education (PE)88 and development of sports for
88Anintegralpartoftheeducationprocesswhichhasasitsaim,thedevelopmentofphysically,mentally,emotionallyandsociallyfitcitizensthroughthemediumofphysicalactivitieswhichhavebeenselectedwithaviewofrealisingtheseout-comes(Beasal&Taylor,1992;Coakley,2005).IntheKenyancontext,PEwillrefertotheactivitieswhicharescheduledintheschoolstimetableforlearnerstogooutoftheclassroomsandgetengagedinphysicalactivitiesundertheguidanceofateacher.

313Institute of Economic Affairs
the youth in schools. The Kenya Education Commission (Ominde Commission) of 1964, for instance, emphasized on the inclusion of PE as a co-curricular activity in the schools curriculum. However, the subsequent commis-sions, committees and working parties on Education in Kenya such as National Committee on Education and Policies (Gachathi Report) of 1975, Presidential Working Party (Mackay Report) of 1981 and the Presidential Working Party (Kamunge Report) of 1988 only examined education system in total but did not focus on, or make recommendations on the status of PE and sports in the school system. This could explain the lukewarm attention accorded to PE and sports in schools, yet the youth need early initiation into PE and sports for their growth and development, character development and for talent identification. Since Physical Education is considered to be the foundation for future sports participation and performance of the youth, the Presidential Decree of 1980 of making PE a mandatory subject in all schools and the Teachers Training Colleges was a landmark decision for the future of youth in sports and recreation because, in principle, it stimulated the elevation of the level and status of PE and sports in educational institutions.
Due to the emphasis put on excelling in sports, it is at the advent of the post-colonial era that the country began to register substantial successes in the All-Africa Games, Commonwealth Games and Olympic Games as shown in the table 75 below.
Table 75: Kenya’s Performance in All- Africa Games (1965-2007)
MEDALS YEAR VENUE GOLD SILVER BRONZE TOTAL RANKING1965 Brazzaville, Congo 8 11 4 23 3
1973 Lagos, Nigeria 9 11 18 38 3
1978 Algiers, Algeria 11 8 8 27 4
1987 Nairobi, Kenya 22 25 16 63 4
1991 Cairo, Egypt 13 17 18 48 4
1999 Johannesburg, South Africa 10 10 20 40 6
2003 Abuja, Nigeria 5 5 4 14 9
2007 Algiers, Algeria 13 15 10 38 6
TOTAL 91 102 98 291 Source: Njororai,(2004)p.105.
Table 75 shows that Kenya’s performance was very impressive as from 1965 to 2007 with 91 gold medals, 102 silver medals and 98 bronze medals. It is however important to note that majority of the medals were won in ath-letics and boxing. It is also notable that the best overall ranking of Kenya in the championships has was position three in 1965 and subsequently in 1973, while the worst ranking was position 9 in 2003. However, Kenya has continued to stamp her authority as a powerhouse in sports in Africa.
Beyond the impressive performance in the All-Africa Games, Kenya’s performance in the larger Commonwealth Games is presented in table 76 below.
Table 76: Medals won in the Commonwealth Games (1954-2010)
MEDALS YEAR VENUE GOLD SILVER BRONZE TOTAL1954 Vancouver, Canada - - - -
1958 Cardilt, Wales - - 2 2
1962 Perth, Australia 2 2 1 5

314Youth Research Compendium
1966 Kingston, Jamaica 4 1 3 8
1970 Edinburg, Scotland 5 3 6 14
1974 Christchurch, New Zealand 7 2 9 18
1978 Edmonton, Canada 7 6 5 18
1982 Brisbane, Australia 4 2 4 10
1986 Edinburg, Scotland - - - -
1990 Auckland, New Zealand 6 9 3 18
1994 Victoria, Canada 7 4 8 19
1998 Kualalampur, Malaysia 7 5 4 16
2002 Manchester, England 4 8 4 16
2006 Melbourne, Australia 6 5 7 18
2010 New Delhi, India 12 11 9 32
TOTAL 71 58 75 204Source: compiled from http://www.espnstar.com.
Table 76 shows that Kenya has won 71 gold medals, 58 silver medals and 75 bronze medals since the inception of the games. In the recently concluded 2010, Commonwealth Games, Kenya was able to win some medals in its non-traditional sport of swimming and emerged sixth overall out of the 36 countries which were in the medal bracket.
A summary of the medals that the country has won in the Olympic Games in the post-colonial era are as presented on table 77 below.
Table 77: Kenya’s Medal Tally in Olympic Games (1964 – 2008)
MEDALSYEAR VENUE DISCIPLINE Gold Silver Bronze Subtotal Total Ranking in
athletics1964 Tokyo, Japan Athletics _ _ 1 1 1 201968 Mexico city, Mexico Athletics 4 3 1 8 9
3Boxing _ _ 1 11972 Munich, West Germany Athletics 2 2 2 6 9
5Boxing _ 1 2 31976 Montreal, Canada Boycotts - - - - - -1980 Moscow, Russia Boycotts - - - - - -1984 Los Angeles, USA Athletics 1 - 1 2 3 14
Boxing 1 11988 Seoul, South Korea Athletics 4 2 1 7 9 4
Boxing 1 - 1 21992 Barcelona, Spain Athletics 2 4 2 8 8 41996 Atlanta, USA Athletics 1 4 3 8 8 42000 Sydney, Australia Athletics 2 3 2 7 7 42004 Athens, Greece Athletics 1 4 2 7 7 42008 Beijing, China Athletics 5 5 4 14 14 3
TOTAL 23 28 24 75 75Source: Compiled from http://www.databaseolympics.com.

315Institute of Economic Affairs
From table 77, it is apparent that since 1964, Kenya has won a total of 75 Olympic medals with 23 being gold medals, 28 silver medals and 24 bronze medals. The largest proportion of these medals (91%) has been won in athletics and 9% have been won in boxing. Although Kenya has also been presenting teams in field hockey, volley-ball (women), swimming, rowing, judo, shooting, weightlifting and wrestling during the Olympics, there has not been much success in these sports disciplines. Even in field hockey in which Kenya displayed credible performance in the 1970s and 1980s, the country was relegated to the last position in 1988 and never qualified for the Olympic Games thereafter.
Driving Forces for Sports Participation among the Youth in KenyaAs observed by Coakley (2005), socialization into sports is an ongoing rather than a discrete process. Conse-quently, different socio-cultural and economic forces continue to influence youth in sports and recreation. In sum-mary, some of the driving forces that influence youth into involvement in sports and recreation in Kenya include: significant others such as family, friends, teachers and coaches; socializing agencies such as educational institu-tions/schools, NGOs, religious organizations and mass media; government policies and institutions such as sports associations/federations and local authorities; corporate partnerships; and sports icons.
Significant OthersThe role of significant others such as family, friends, teachers and coaches continues to ensure that youth are intro-duced and encouraged in sports. Significant others can be role models, pay activity fees, training partners, provide encouragement and reinforcement, evaluators of performance, instructors etc. Consequently, they play the role of initiating and exposing young people to play and assist in identifying talent (Rintaugu, 2005). However, sports and recreational activities are not appreciated by all. Some parents for example can insist that they send children to school to study and not play sports. However with increased earnings and fame by elite athletes, some parents are encouraging their children to balance their pursuit for education with sports.
Socializing AgenciesSocializing agencies such as educational institutions/schools, NGOs, religious organizations, and mass media con-tinue to influence socialization of the youth into sports.
Educational Institutions/schoolsSchools continue to provide affordable sports facilities, equipment and programmes, teachers/coaches and an envi-ronment that is conducive for sports participation. Some educational institutions have rich histories of combining both sports and academia through competitions such as inter-house, inter-streams and inter-classes games. Some secondary schools like Friends School Kamusinga have continued to dominate in secondary school sports competi-tions in hockey, rugby, and basketball and at the same time performed well in drama and music festivals. Further, the school continues to perform very well in national examinations (Rintaugu, 2005).
In the 2010 secondary schools games competitions, the success of national schools like Maseno high school in basketball and Mangu High School in hockey is indicative of the fact that good academic performance and ex-cellence in extra-curricular activities can occur in tandem. These schools serve as important reservoirs of sports talent. Other such institutions that have been keen and embraced particular sports disciplines should be identified jointly by the Ministry of Youth and Sports, Ministry of Education and the various national sports federations and established as ‘model’ schools or ‘centers of sports excellence’. The schools would be evenly spread throughout the country and a regional balance ensured where school-based and vacation-based sports programmes will be run. The inclusion of such a move in the sports policy would be imperative so that the implementation and operation of the centers is not hampered by other political interests.
Physical Education (PE) is taught at almost all levels of education. While at primary school it is compulsory, in secondary school it is scheduled in the time table. However, the importance of PE has not received homogenous ap-preciation in all the secondary schools. PE periods are used to teach and revise mathematics and sciences because the school curriculum seems to emphasize the cognitive domain of learning at the expense of the effective and

316Youth Research Compendium
psychomotor domains of education. The PE Curriculum is not also given the requisite respect it deserves due to the fact that it is not examined. Indeed as the philosophers of the mediaeval period like Plato, Socrates and Aristotle noted, a healthy mind needs to survive in health body.
Non-Governmental OrganizationsIn Kenya, various Non-Governmental Organizations (NGOs) have come out explicitly to support and sponsor youth sport events. UNICEF in collaboration with other partners has continued to organize soccer tournaments exclusively for young children. Recently UNICEF in collaboration with the Ministry of Education sponsored se-lected secondary school students to improve their sporting skills in 8 secondary schools and selected some ‘centers of excellence’ in different sport disciplines. The Mathare Youth Sports Association (MYSA) has continued to partner with other agencies such as United Nations High Commission for Refugees (UNHCR), World Lutheran Foundation and the Netherlands Government to champion the course of HIV/AIDS awareness, garbage collection, environment and conflict resolution (Nyanjom, 2010).
Case Study 8 : The Mathare Youth Sports Association (MYSA)
The Mathare Youth Sports Association (MYSA) was started in 1987 to assist youth Mathare slums in Nairobi to get involved in active sports (mainly football) as a way of keeping young people from engaging in anti-social behaviour. MYSA has been able to link participation in sports with environmental clean-ups, AIDS prevention and leadership training among over 20,000 young people who are involved. The key achievements of MYSA include: community service in terms of conducting clean-up activities that are geared towards improving the environment in the slums; creating awareness on key social issues such as HIV and AIDS and drug use and abuse; fighting pover-ty in the slums by creating job opportunities and seeking scholarships for young people to pursue their education; initiation of the Jailed Youth Programme whose main objective is to assist youth from the slums get released from remand homes or jail and reunite them with their families; initiate football tournaments between different ethnic communities after the 2008 post-election violence in order to promote peace and reconciliation. The initiative has been extended to Kakuma refugee camps.
MYSA launched a sport and community leadership academy in 2000 for all its zones. The academy courses aim to help these young athletes to: improve their fitness, training, diet and performance; increase their knowledge and skills in coaching and refereeing; understanding and coping better with personal health and adolescent life chal-lenges among their peers and expanding their organizational and leadership in order to help other young people in their schools and community.
It is notable that MYSA has been able to transform the lives of thousands of youth in their zones and it would be prudent for other similar organizations to be started countrywide.
Source: http://www.mysakenya.org/
Religious OrganizationsSome religious institutions have provided minimal facilities for youth to be involved in sports and recreational ac-tivities such as Nairobi Pentecostal Church (NPC) which sponsors teams to play basketball in the national leagues. It is notable that the first basketball court in this country was pioneered by the Catholic Church at Kilimambogo Teachers College. Up to date, basketball is well established within the environs of Kilimambogo parish.
Mass MediaBoth print and electronic mass media have continued to exert a lot of influence on youth participation in sports and recreation. Youth soccer tournaments like Sakata ball are captured live by the media. The global coverage of international sporting events including the availability of exclusive sports channels influence many young people into sports. The premier leagues in England attract a lot of interest and followership across the country. Many youngsters continue to rally their support behind Manchester United, Arsenal, Chelsea and Liverpool among oth-ers. The print media on the other hand carries 4 pages on sports daily.

317Institute of Economic Affairs
Government Policies and InstitutionsThe role of government in promoting youth sports and recreation is paramount. Its share of functions include: formulation of sports/recreation policies and facilitation of sports programmes; development of public sports and recreation management structures, development of facilities, and protection of public interests in matters of sports and recreation.
Through the Presidential decree of 1980 that made PE and sports compulsory in all educational institutions en-sured that up to date, PE is scheduled in the school timetable in both primary and secondary schools and is an examinable subject in Teacher training colleges.
To underscore the governments concern about sports in Kenya, the President Mwai Kibaki asserted that ‘the government plans to take sports more seriously. Not only is it an important pastime but Kenyans are good at it. Success in sport changes the lives of many Kenyans every year. It gives us something to be proud of as a nation and also promotes healthy lifestyles. The government plans to deal with corruption and mismanagement in this sector as these trends negatively affect our athletes and have undermined the standards of sports like soccer’ (Nyanjom, 2010pg.6).
The Ministry of Youth and Sports (MOYAS) was created among other things to enhance youth participation in sports. Subsequently, the government through Vision 2030 committed to remit one million Kenya shillings (ap-proximately US$10,000) per constituency for sports and recreation.
Government policies created in relation to sports and recreation include the Kenya National Youth Policy (KNYP) and the draft Kenya National Sports Policy (KNSP). These continue to enhance the positive impact of sports on youth development.
Kenya National Youth Policy (KNYP) KNYP acknowledges that participation in physical activities contributes to promotion of peace, unity and under-standing among the youth and to a great extent reduces idling. Consequently, KNYP proposes the following broad strategies to address the concerns of sports and recreation for the youth in Kenya.
• Establish and improve accessibility to recreation and sporting facilities in schools, communities, villages and provide them with trained personnel to assist in identifying and developing young people’s talents.
• Use sporting activities as a channel of advocacy and campaign for behavioural change in areas such as HIV/AIDS and drug abuse among the youth. After the post electoral conflict in 2008, promotion of peace and national cohesion has become a major agenda. Consequently, sports have been used as the vehicle to imple-ment this programme.
• MOYAS is responsible for sports activities and will liaise with youth organizations to ensure that sports men and women are protected from exploitation by clubs and sport agencies.
• Improve the remuneration given to sports persons who represent the nation in various sporting disciplines.
• Promotion of traditional games as a way of recreation and culture preservation.
• Gazetting of sporting facilities and recreational spaces.
• Encourage youth representation in sports decision making bodies countrywide.
• Streamline the dysfunctional National Youth Development Programme (NYDP) by creating awareness at community level and solicit financial support from private sector, development partners and other stake holders to make sports more effective.
Although KNYP has good provisions, it also has shortfalls. First, KNYP addresses the Kenyan youth as a block in terms of years, yet the youth are operating at different levels of maturation and growth. Second, KNYP gives no credence to sports or youth engaged in sports outside the formal institutions yet a significant number of youth operate outside these formal set-ups. Third, KNYP does not acknowledge that a majority of the youth are engaged
318Youth Research Compendium
in passive sporting leisure activities such as watching sports on TV, cheering ongoing matches or playing sports computer games.
Kenya National Sports Policy (KNSP)The Session Paper No.3 of 2005 on Sport Development (March,2005) referred to as the draft Kenya National Sports Policy (KNSP) requires sports organizations to enhance investment and funding especially for grassroots programmes based on comprehensive, integrated medium and long-term development plans with accompany-ing annual work plans. It acknowledges different categories of sports, both traditional and modern such as mass sports from competitive sports and sports for the aged, disabled, youth and women. It calls for establishment of a national sports institute which would set standards, carry out training documentation and archive records. It rec-ognizes the destructive potential of disputes requiring the development of an “ultimate, authoritative and neutral dispute resolution mechanism (Nyanjom, 2010). The draft policy still remains a good blue-print which is yet to be passed by parliament.
However, as far as youth and sports are concerned the KNSP does not indicate when, where and how the above proposals will be implemented. It also does not capture the time-frame for implementation and does not show the role of the central government, local authorities’ and other agencies in sports development. The draft does not capture the aspirations of youth outside formalized settings. The draft is also very general and does not capture the fact that different sports disciplines in this country enjoy different status. Football for example is played in every village while rugby, cricket and hockey can be categorized as elite sports only accessible to a few young people.
Other Countries policies and programmesCountries like Nigeria, England and USA have policies and programmes that help improve their sports perfor-mance.
NigeriaNigeria has a National Sports Development Policy (Federal Republic of Nigeria, 1989) which identifies five specific programme areas: sports development; voluntary organization; research and planning; education and training; and mobilization of resources for sports. The Government also publishes guidelines for implementing the sports development policy. The national sports policy summarizes the role of government sports development as: policy formulation; coordination and monitoring; staff development; resource mobilization; and research funding. To illustrate governments’ commitment towards sports promotion, General Ibrahim Babangida, a former Nigeria Head of State was quoted staying “we as a nation are entitled to a great deal of pride in the achievement of our sports men and women over the years for the honours done to us a nation by the successes of athletes and that is the reasons why winners are handsomely rewarded for them to continue to do well in their sports (Ikulayo, 1994:39).”
United States of AmericaIn the USA, Presidents’ Council on physical fitness and sports advice the president through the Secretary of Health and Human services about physical activity, fitness and sports and recommends programs to promote regular physical activity for the health of Americans. The US congress is involved in several aspects of sports, notably: gender equity in college athletics; illegal drugs in professional sports; sports broadcasting; and the application of anti-trust law to sports leagues for example the Title IX Education amendments of 1972 which states that “No person in the US shall on the basis of sex be excluded from participation, be denied the benefits of or be subjected to discrimination under any education program or activity receiving federal assistance” (McPherson, Curtis and Loy, 1989: 541).
Today, the President’s Council promotes daily moderate physical activity for disease prevention and health, vigor-ous physical activity, stretching and strength training for fitness, and added health benefits, including values of sportsmanship. It collaborates with federal state and local agencies, private sector and non-profit organizations to achieve mutual goals and objectives. The President’s Council has assembled different honours and awards to

319Institute of Economic Affairs
ensure that Americans head a physically active lifestyle. Some of the Awards include: Presidents Challenge; the Presidential Active Lifestyle Award (PALA); state champion award; and national school demonstration program.
EnglandIn England there have been very numerous policy statements on youth sports and recreation. For example, in December 2002 the government published ‘Game Plan’ a strategy for delivering government’s sports and physi-cal activity objectives (Maguire, 1999). The review of national sport effort and resources (Lloyd, 2005) identified that with so many interested parties, it was vital to develop a system for the delivery of sport in England which is simple, systematic and joined-up overcoming the inefficiencies indentified in Game Plan. Game Plan lay emphasis on collaboration between local authorities, other public sector agencies, and partners, involvement of community members not only in planning and decision making but also in measuring the performance of public sector agen-cies. The Game Plan was out to increase participation in cultural and sporting opportunities by adults and young people, as well as increase participation in educational institutions.
Beyond the Game Plan, the ambition of ‘Sport England’ is to lead and support the development of a holistic, coher-ent and equality-assured department of sports that ensures everybody no matter where they live or their personal circumstances is able to access high quality sporting opportunities and truly meets their personal needs (Sports England, 2007). Other sports policies in England address issues bordering on volunteering in sport, healthy poli-cies as well as performance in global competitions. It is important to note that just like in USA, sports policies in England cater for sports and recreation, healthy and physical activity patterns. The policies also address healthy issues of people in the lower economic status, environmental sustainability and raising the standards of physical activity and sports in physical educational institutions.
Also published in 2004 ‘The framework for Sport in England’ envisions England to be the most active and suc-cessful sporting nation in the world. The target of the framework was to increase participation in sports and ac-tive recreation in England by 1% annually. The expected outcomes of the framework for sports in England was: improving levels of performance in sports; widening access to sports and active recreation; improving health and well being; creating stronger and safer communities; improving education; and benefiting the economy.
It is apparent that the policies in the USA and England are multi-faceted, multi-sectoral and all encompassing as opposed to the policies in Kenya and Nigeria which are geared towards sports competitions. Time has come for the government of Kenya to worry about the fitness levels of its people by putting in place policies which will trigger mass participation in regular physical activities as opposed to competitive sports only.
National Sports Federations (NSFs)Sport Federations such as KFF, KVF and KRFU continue to have youth competitions such as under-17 and under 20’s. They second coaches to regions and schools where their sports disciplines are dominant. They also enhance their sports through youth centers and competitions. Thus, the federations/associations identify and develop talent by coordinating, organizing and running youth sports programmes. However some of these federations are yet to have countywide access and many times their impact is only felt in urban areas. Athletics Kenya has invested heavily in all the provinces and it works hand in hand with primary schools and secondary schools. It has com-petitive units within the Kenya police, armed forces and the universities. This may be the reason behind Kenya’s dominance in athletics as talent is identified and nurtured early from all the provinces.
National Olympic Committee (NOCK)The main function of the National Olympic Committee of Kenya (NOC-K) which is an affiliate of the Internation-al Olympic Committee (IOC) is to ensure the country’s participation in the Olympic Games. Other than working closely with the national sports federations to identify and assemble young sportsmen and sportswomen for the Olympic Games, NOC-K is charged with the responsibility of fund-raising for the country’s participation in the games. It is notable that NOC-K has done this over the years, but with minimal success.
320Youth Research Compendium
Local AuthoritiesOne of the key responsibilities of the local authorities is to render social and welfare services to the public. Within this broad area of responsibility are provisions of sports and recreation services. The local authorities are specifi-cally expected to: set aside space for youth sports and recreation; assist with development and maintenance of sports facilities; and be involved in the coordination and organization of sports and recreation programmes for the youth. It is notable that some renowned Kenyan boxers like Robert Wangila (a gold medalist in 1984 Seoul, Korea Olympic Games) learnt and mastered boxing from various city council facilities like Kaloleni and Bahati social halls.
Corporate PartnershipsCorporate partnerships such as Standard Chartered Bank of Kenya, National Bank, KCC, Eveready, Kenya Com-mercial Bank (KCB), Kenya Airways, Brookside Dairy, East African Portland Cement and Safaricom continue to sponsor sporting activities in different disciplines and different levels of competitions. Some of the corporate bod-ies have been keen on giving financial rewards to medals-winners after international competitions. A number of successful athletes are being used as ambassadors of various corporations such as coca-cola.
Due to the popularity of sports in Kenya, many commercial organizations in the country have been keen on adver-tising and marketing their goods and services through sporting activities thus enabling them to maximize profits through increased sales of their products and services. The recently concluded Africa Athletic Championship hosted in Nairobi had Safaricom and National Bank of Kenya as the major sponsors. In 2010, KCB sponsored Sa-fari rally, National Cross-country and tennis championships by over Kshs.30 million (approximately US$300,000)
Sports Icons and their FoundationsKenyan sports icons have continued to influence youth in Kenya into sports through global recognition and the financial rewards they receive. Through local initiatives and foundations, Kipchoge Keino, Tecla Loroupe and Henry Wanyoike have been some of the role models that have influenced young athletes in Rift valley.
Kipchoge KeinoKipchoge Keino1 directed his energy and resources towards the development of education and support for the disadvantaged people in the country. He set up the Kipkeino School which houses, feeds and educates orphans in Eldoret. The Kipkeino secondary school has integrated environmental care and Olympic values in the curriculum to enable students to learn about environmental conservation, values of respect for others, fair play and excellence.
Tecla Cheptike LoroupeTecla Cheptike Loroupe, a three-time World Half-marathon champion, established the Tecla Loroupe Peace Foun-dation in 2003 whose main objectives are to bring about social interaction and integration among warring com-munities in the greater Horn of Africa and encourage development and other social change processes. The foun-dation organizes annual peace races among various communities within the region which encourage interaction and building trust among the warring communities. The peace races include: the Moroto-Uganda Peace Race; Southern Sudan Peace Race; Tana-River Peace Race; Kapenguria Peace Race; Maralal Peace Race; Turkana peace race; and the Great Turkwel Peace and beauty pergent . To reduce cattle rustling, the foundation has set up the Tecla Loroupe reformed warriors rehabilitation and training camp which provides support to warriors to engage in competitive sports, business enterprises and small scale agricultural business and facilitates them in the warrior-to-warrior peacemaking.
The Tecla Loroupe foundation is also involved in the development of education. In addition to the establishment of the Tecla Loroupe Academy, the foundation supports and strengthens existing schools by providing them with computers and learning materials such as books, pens, writing chalk and desks. The foundation in collaboration with its partners pays fees for children from poor families and assists children in the greater horn of Africa who have excelled in examinations to secure scholarships for further studies both locally and abroad. The key pro-
1 AlegendaryathleteandhonorarymemberoftheInternationalOlympicCommittee
321Institute of Economic Affairs
grammes of the Tecla Loroupe foundation include: peace building and conflict mitigation; education for peace programme; enterprise and livelihood programme; environment for peace; research, media and communication.
Henry WanyoikeHenry Wanyoike has been involved in community development projects in the country. Visually-impaired, Wan-yoike has been a world record holder of 5,000 and 10,000 meters races in the Paralympic games, and has been the fastest visually-impaired marathon and half-marathon runner in the world. He started and registered the Henry Wanyoike foundation which is involved in many activities, one being environmental conservation through tree-planting. The foundation has also been involved in seeking financial support for the internally displaced persons, orphans, disabled, vulnerable children and youth for their socio-economic empowerment by organizing sponsored running events and partnering with corporate organizations. The foundation supports the disabled through socio-economic empowerment. It gives grants to start income generating programs, paying school fees for the disabled and advocates for disability rights.
Macdonald MarigaThe recent success of Mariga with Inter-Milan FC, is likely to influence a significant number of young people to continue exploiting their opportunities in soccer.
Social cultural factors influencing youth into sportsSports are recognized as a symbol of national unity in Kenya. Sports have rightly acted as a tool for integration and co-existence of the people (Mwisukha and Gitonga, 2009). Whenever local teams compete against foreign ones, Kenyans regardless of ethnic, racial and religious differences come together in solidarity to support their teams. Sports are used as a tool for bringing about national popularity and recognition. Indeed, our prowess in athletics, rugby and cricket has brought pride and international recognition to Kenya. The ceremonial presentation of med-als to successful sportsmen and women has helped a great deal in exposing Kenya to the rest of the world.
The post election violence (PEV) in the 2007 has led many NGOs and religious institutions to use sports as a me-dium of peaceful co-existence and conflict resolution. It is notable that the Tecla Loroupe Peace Foundation has done remarkable work of reducing tension among warring communities in the Great North region of East Africa.
Modern sports effectively provide an avenue through which people can express and preserve their cultural heri-tage. Through traditional dances, songs, warrior and warrior-like activities, magic and superstitious acts, tradi-tional beliefs and practices which characterize Africa’s culture can be expressed. For example, the Isukuti beats are always heard when AFC Leopards are playing a match.
Sports and Economic DevelopmentSport has played a vital role towards national development in Kenya. The Ministry of Youth and Sports has em-ployed personnel to handle sport matters up to the District level and the Ministry of Education employs inspectors and coordinators of sport activities, universities and all educational institutions have employed personnel to cater for the sports needs of the students. The army, National Youth Services, the police and the prisons often use ex-cellence or talent in sports as one criterion for recruitment of officers. It is common to find that a majority of the medals won in the Olympics has been by athletes from the uniformed forces.
Parastatals, NGO’s and some private sector organizations employ sports and recreational managers, coaches and trainers for their institutions. Good examples of these parastatals include Kenya Ports Authority, Kenya Pipeline, Kenya Power and Lighting Company, and Kenya Commercial Bank. However, the collapse of some major sport competitions like KECOSO left some of the parastatals not unable to recruit athletes.
Both private and public organizations have set-up recreational facilities such as stadia, swimming pools and fitness facilities to cater for the employees sporting and recreational needs. Personnel are equally employed to carry out routine maintenance and sports/recreational related work.

322Youth Research Compendium
The prevalence of athletic scholarships has also enabled many youth to venture into sports.
Hosting of major continental and international events such as All-Africa Games in 1987, Safari Sevens, Golf tournaments, International Cross-Country in 2008 in Mombasa and the Senior African Athletic Championship in 2010 in Nairobi is a gateway to tourism. The Lewa downs Marathon is double-edged as it is meant to ensure environmental conservation but also encourage tourism. Through a multiplier effect, people visiting the Rift val-ley to scout for athletic talent improve businesses in the region especially in airports, hotels, bars and restaurants.
During the 2004 Olympic Games in Athens, Kenya’s contingent of 78 people (51 athletes and 27 officials) costed Kshs. 48 million (approximately US$ 480,000) to participate in the games. Consequently this translated into Kshs. 6.8m (approximately US$ 68,000) for each medal won and each person in the contingent used up Kshs.615, 384 (approximately US$ 6,154).
According to Mwisukha and Gitonga (2009), approximately Kshs.500 million (approximately US$ 5,000,000) a year is earned by athletes in prize money and endorsements in Europe, Asia and America come back into the local economy. Some of the richest Kenyan athletes have invested heavily in high-rise buildings, high altitude training camps and colleges, farms and agricultural enterprises.
The President’s speech on 28th March 2010 during the closing ceremony of 2010 Kenya Open Golf championship, outlined the government allocations to sport during this financial year as shown in the table 78
Table 78: Government Allocation to Sports during 2009/2010 Financial Year
ACTIVITY AMOUNT (KSHS) (in Millions)
AMOUNT (in US$)
Refurbishing of warm-up track at Nyayo Stadium 18 180,000
Rehabilitation of Mombasa Municipal Stadium 29 290,000
Upgrading of Kipchoge Keino Stadium, Eldoret 100 1,000,000
Construction of talent Academy at Kasarani 100 1,000,000
Rehabilitation of Moi International Sports Complex, Kasarani 900 9,000,000
All Africa Athletic Championship 200 2,000,000
TOTAL 1,337 13,470,000
Source: Presidential speech on 28th March 2010.
The above allocation of Kshs.1.347 billion (Approximately US$ 13.47 million) excludes the amount of money used to fund different teams involved in external competitions, sport officers and the Ministry of Youth and Sports.
Uncertainties and Emerging TrendsAs much as Kenya has asserted its authority in global competitive sports especially in athletics (long distance races), swimming and rugby (sevens version), there are underlying uncertainties and emerging trends that are likely to influence sports in the future. These include but are not limited to the following.
Management of sportsThe management of our sports federations and associations is currently by old people. Emerging trends where young people are vying for executive positions in the federations/associations will influence sports the direction sports takes in the future.

323Institute of Economic Affairs
Due to the lack of effective and efficient coordination of soccer activities in the country, there have been perennial wrangles within and between FKL, KFF, FIFA and the Kenya government. Consequently, the government is not able to properly manage football due to the influence of FIFA. Kenyans are thus putting their efforts towards the organization of sports outside the government and many soccer competitions in and between constituencies, estates and provinces such as ‘Ligi Ndogo’ and ‘Sakata Ball’ are organized by different private parties with the support of corporate and non-governmental organizations. These wrangles affect the performance of the national football team, Harambee Stars. As a result, majority of the youth are keen on football matches from other coun-tries like Europe. Needless to say, the FA league in England attracts a lot of attention while matches involving the national team attract very few spectators. It is also apparent that majority of Kenyans are shifting their interests into other sports disciplines like rugby, athletics and cricket. These disciplines have their federations or associa-tions being doing well not only in performance but also in the administration and management of the sports.
Revival of traditional sportsIt is notable that there are concerted efforts by different groups to revive some traditional sports and games. For example, bull fighting is gaining a lot of mileage in Western province. Boat races in Lake Victoria and in the Indian Ocean together with donkey races and cultural festivals in Lamu are attracting a lot of funding from the corporate and non-governmental organizations. All in all, the concern is how to modernize the traditional sports and games to create and maintain interest and support. Anecdotal evidence suggests that there are efforts towards registration of Kenya Federation of Traditional Games and Sports (KFTGS).
Merging sports with other social issuesKenya’s hosting of major continental and international events has led to the merging of sports events with tourism. As noted earlier, the Lewa Downs marathon and the Sokoto marathon were organized to incorporate environ-mental conversation and tourism. Other such initiatives include the Standard Chattered Marathon which seeks to raise funds for the treatment of the visually impaired. Dettol heart runs seek to raise surgery funds for children with heart conditions while cancer walks e.g. by Nairobi hospital in 2011 is organized to help raise funds for the treatment of cancer patients. Merging of sports with addressing various social issues is likely to increase.
Talent developmentThere has been an increasing recognition that youth can make a livelihood out of talent. As a result, the formaliza-tion of talent identification and nurturing through talent academies is being done. It is very common to see parents especially of the upper and middle classes accompanying their children over the weekends into the various sports centers/talents academies for training and competition. When some of the parents are not able, they hire part-time coaches to train their children.
The aerobics crazeThe emergence of aerobics and gymnasium centers in the urban and pre-urban areas has been as a result of the “fitness boom” of the 1980’s. Consequently, a significant number of youth are concerned with their fitness levels and appearance/bodily appeal than in competitive sports.
The provision of dual citizenshipThe new Constitution in Kenya has ushered in the dual citizenship under the Bill of Rights thus creating a situation where elite sports men and women will enjoy Kenya’s citizenship and that of another country. This implies that the sports men and women will have to make decisions as to which country to represent during global competi-tions. The sports persons are likely to be based in foreign countries where the sports infrastructure is very good. However, it also means that they are not present as role models to young up-coming sports men and women. Though this is likely to increase remittances from the Diaspora, it may also imply that the elite athletes invest their resources elsewhere and not necessarily in Kenya.

324Youth Research Compendium
Hosting prestigious sporting eventsKenya is a leader in selected sports in the region thus international events will continue to be hosted in the country thus promoting tourism and economic development
The uneven distribution of sports infrastructureThe uneven distribution of sports infrastructure and resources especially in urban and rural areas has left some sports only tenable in urban settings. The same case applies to the disparity in sport infrastructure between the affluent suburbs and the slums in urban areas. This creates a situation where some sports are not taught to the majority poor like golf and cricket thus minimizing our competitive potential.
The enactment of a sports policyA sports policy levels the playing field and creates parameters within which to operate from. Recently the Minis-ter for youth and sports re-launched the sports policy which is yet to be debated in parliament. The absence of a sports policy 47 years after independence negates the objectives of proactive planning and effective management of sports.
Infiltration of vices that limit youth participation in sportsPresence of organized militia groups, vigilantes and gangs directly affects youth participation in sports. Forceful recruitment into the group’s membership curtails opportunities for these young people to participate in sports. Practices such as sniffing of tobacco and other drugs as well as heavy alcohol consumption are counterproductive in sports.
Nature of selection of top sports men and womenThe natural selection demands that only the best survive. There are very limited opportunities for young people with rudimentary skills and great potential to perfect their skills. This means that unless one is very good, the system of selection kills rather than nurtures potential. As a result, there is a lot of unexploited talent and there are inadequate opportunities (in terms of consistent training and encouragement) for the youth to feel that sports is an avenue for career development.
Way Forward In order to lay a foundation for talent identification and development in sports among young people who spend a significant proportion of their time in school, the teaching of PE in primary schools, secondary schools and colleges needs to be enforced. It is through the teaching of PE that motor development, exposition of talent, stimulation of the interest of youth in play and cultivation of a sporting culture amongst the youth can be made possible. Suc-cess in enforcing the teaching of the subject will be achieved if the government and other stakeholders adequately employ the necessary human resource who ensuring quality training.
The annual inter-school and inter-colleges tournaments have been emphasized upon and regularly organized as a major avenue for identification of sports talent. The games teachers and technical personnel in the sports fed-erations are involved in the organization of the championships and scouting for the required talent. However, other than the few who move on to participate at the national level, majority of the talented youth are not given an opportunity to advance their skills. Through consistent training MYSA has produced a few players in major European soccer clubs. Numerous athletic training camps in Rift Valley have also produced world beaters in the long distant races. This evidences the fact that such organizations countrywide can help maximize sports potential among our young people.
The availability and condition of sports facilities is a factor that has a great bearing on exposure of youth to sports. Deliberate efforts by the principal stakeholders (Government, local authorities, parastatals, non-governmental or-

325Institute of Economic Affairs
ganizations, SSMB, formal institutions and private initiatives) must therefore, be made to avail accessible outdoor and indoor sports facilities for the youth with minimal bureaucratic and financial requisites.
In order to ensure effective and efficient coordination of sports programmes in the country, the hierarchy of sports management should be streamlined. The Department of Sports, the Kenya National Sports Council and the Na-tional Sports Federations must be seen to operate as a team. Additionally, a fit and proper persons test should be adopted and stringently carried out to ensure that clubs are owned and/or run by people who want to see clubs succeed and espouse values aimed at promoting the greater interests of the sport.
In order to attract more youth into sports and enhance their chances of excelling, the national sports federations should consider introducing and nurturing professional sports. Indeed, many countries in the developed world have made a tremendous shift from sports amateurism to sports professionalism.
So as to regulate the management of youth sports and recreation, the enactment and enforcement of a national sports policy to give direction to the development of sports and recreation is mandatory. The policy should specify the structure and hierarchy for sports management in the country, including clearly outlining the roles of the vari-ous organizations in the management of sports. There should also be consideration for the provision of a contribu-tory retirement scheme for national sports teams as incentive for their service to the country.
The exodus of elite athletes to other countries denies the country the benefit of sharing the glory of their successes. The new constitution which has provision for dual citizenship may curtail the above scenario. However, address-ing the factors that motivate them into leaving the country such as state-of-the-art facilities and equipment, attrac-tive remuneration and professional technical personnel will have to be addressed.

326Youth Research Compendium
ReferencesAsembo, J.M. (2003). ‘Sports in Kenya’, In L O, Amusa & A.L Toriola (Ed). Sport in Contemporary African
Society: An Anthology. AAHPER-SD, Technikon Pretoria South Africa.
Beashel, P. & Taylor J. (1992). Sport Examined, Walton, Thomas Nelson & Sons Limited.
Bhusahn (1988). Cheza Kenya. Nairobi: Newspread International.
Coakley, J.J. (2005). Sports in Society, Issues and Controversies, St. Louis: Jimes Mirrow – College Publishing.
Cordes, K. A & Ibrahim, H. M. (1999) Applications in Recreation and Leisure, for today and the future, Boston: WCB/Mcgraw –Hill.
Emiola, L. (1994). ‘Sports in Nigeria’ In L.O Amusa(Ed) Proceedings of the First African Regional Conference in Physical Education, Recreation Sports and Dance. Gaborone Botswana. pp.184-189.
Federal Republic of Nigeria. (1981). National Policy on Education, Lagos: NERDC Press.
Federal Republic of Nigeria. (1989a). Sport Development Policy for Nigeria, Lagos: Ministry of Youth and Sports.
Federal Republic of Nigeria. (1989b). Guidelines for implementation of the sports Development Policy for Nigeria. Lagos: Ministry of Youth & Sports.
Gitonga, E.R. (1998). ‘The Effects of Participation in Competitive Sports on Academic Performance of Secondary School Students in Nairobi Province. Unpublished M.Ed thesis, Kenyatta University, Nairobi, Kenya.
Green, M. & Houlihan, B. (2005). Elite Sport Development: Policy Learning – London: Routledge
Houlihan, B. (2004) ‘Sports Globalization: The State and the Problem of Government’, In T. Slack (ed). The Commercialization of Sport, London: Routledge.
Ikulayo, P.B (1994) ‘Competitive Sports in Africa with particular reference to Nigeria’, In P. Dulfy & L. Dugdale (eds), HPER-moving towards the 21st century. PP 149-160, Champaign 114: Human Kinetics.
Kindiki, J.N. (2009). ‘Effectiveness of Communication on Students Discipline in Secondary Schools in Kenya, Educational Research and Review, 4 (5):252-259.
Lloyd, C. (2005). Introduction, Growing up Global: The changing Transitions to Adulthood in Developing Countries, Washington DC: National Academies press.
Maguire, J. (1999). Global Sport: Identities, societies and civilizations. Cambridge. Policy press.
Malhman, P. M., Asembo, J. M. & Korir, M. (1994) ‘A Target-oriented Analysis of Sport in Kenya. Journal of East African Research and Devepment 24: 102-117.
Mazrui, A. A. (1986). The Africans: A Triple Heritage, London: BBC Publications.
Mcpherson, B.D., Curtis, J.E. & Loy, J.W. (1989). The Social Significance of Sport: An Introduction to the Sociology of Sport. Champaign: Human Kinetics Books.
Munayi, S. (2000). ‘Which Way Kenyan Sports: Towards a National Policy’, In W.W.S. Njororai J.M. Asembeo & O.P. Munayi (Eds). Physical Education, Recreation, Sport and Health in Kenya: Priorities for the 21st Century. Proceedings of the Second Kenya conference of KAHPER-SD 4-5 Sept Egerton University P.47-54.
Mwisukha, A. & Gitonga, E.R. (2009). ‘Leisure Sports Participation Patterns of Post-graduate Students: The Case of Kenyatta University, Nairobi - Kenya’, Journal of Education Reseach and Development 4(1):57-63.
Mwisukha, A. & Wanderi, P.M. (2009). ‘Review of Management Issues and Challenges in Kenya’s Sports as a Basis for Future Development. Journal of Education Research and Development 4(1):80-85.

327Institute of Economic Affairs
Nigeria Handbook. (1999). Abuja, Nigeria: Federal ministry of information and culture P.1.
Njororai, W.W.S. (1998). ‘Gender and Sport Socialization in Kenya’. Journal of Eastern Africa Research and Development 26: 24-31.
Njororai, W.W.S. (2003). ‘The Diversity of Sport in Kenya’, In L. O. Amusa and A. L. Toriola (Eds), Sport in Contemporary African Society: An Anthology. Mokopane: AFAHPERSD pp.199-231.
Njororai, W.W.S. (2004). Analysis of Kenya’s performance in the middle and long distance races in Olympic games,1956-2000. International Journal of Emotional Psychology and Sport Ethics,6:102-107.
Njororai W.W.S, Mwisukha A, Onywera, V.O. & Rintaugu E.G. (2005). Analysis of Factors that affect the Standard of Soccer in Africa. The Case of East African Countries. Report of the Joao Havelange research scholarship, July 2005.
NOCK. (2004). Report of Athens 2004 Olympic Games. Nairobi: Government Printer.
Nyanjom, O. (2010). Foul Play! The Crisis of Football Management in Kenya. Report of Africa Centre for Open Governance, July 2010.
Nteere J.S. (1982). The Historical Background to the Development of Physical Education in Kenya. Un-published M. Ed thesis, University of Manchester.
Nteere J.S. (1990). A Comparative Assessment of the Central Organization for Amateur Sport in England and Kenya. Unpublished PhD Thesis, University of Manchester, Manchester city, England.
Payne, W. A. & Haln D. B. (2000). Understanding your Health. Dubuque, Boston: Burr Ridge.
Republic of Kenya. (1988). Report of the Presidential Working Party on Education and Training for the next decade and beyond (Kamunge Report). Nairobi: Government printer.
Republic of Kenya. (1976). Report of the National Committee on Education Objectives and Policies. (Gachathi Report). Nairobi: Government printer.
Republic of Kenya. (1981). The Presidential Working Party on the Second University in Kenya. Nairobi: Government Printer.
Republic of Kenya. (2005). Sessional Paper No. 3 of 2005 on Sport Development, Nairobi: Government Printer.
Reuters. (2008). Kenya athletes deny helping Rift Valley killings. Retrieved in March 20 2011 from file://local host/f:/Kenya.html.Mackey report
Rintaugu, E.G. (2005). Socialization into Sports of Kenya Secondary School Athletes. Unpublished PhD Thesis, Kenyatta University, Nairobi Kenya.
Rintaugu, E.G, Murithi, M. Kinyua, N. (2009). The Grand Coalition Government in Kenya: A Recipe for Sport Development in Kenyan Universities. Paper presented during the FISU Conference, Belgrade Serbia, June 2009.
Sport England. (2007). Comprehensive performance Assessment: Sporting the cultural Block. Retrieved on March 20 2010 from http:i/www.sportengland.org/wmcpa leaflet mar ob. Pdf
Sports England. (2004). Annual Report 2003 – 2004. London: Sport England.
Toriola, A. L, Adetoror, A.H, Toriola, O.M & Igbokwo, N.U. (2000). ‘A Comparative Analysis of Youth Sport Programmes in Botswana and Nigeria’, International Sports Studies 22 (2).
Torkilden, G. (1992). Leisure and Recreation Management, London: Routledge.
UK Sport. (2005). Funding Agreement between the UK Sports Council and the DCMS for 2003 – 2006. London: UK Sport.

328Youth Research Compendium
United Nations. (2005). World Youth Report 2005: Youth at nations. Retrieved March 30 2010 www.un.org/youth
Wamukoya, E.E.K. (1994). An Analysis of Secondary School Physical Education Curriculum in Kenya. Unpublished Ph.D Thesis, Manchester: University of Manchester.
Wanderi P.M. (2000). Traditional Games of the People of Mt. Kenya Region: A Cultural –Educational Appraisal. Unpublished PhD Thesis, Kenyatta University.
Website Sourceshttp://www.espnstar.com.http://www.databaseolympics.com.http://www.mysakenya.org/

329Institute of Economic Affairs

330Youth Research Compendium
Entertainment: The Unbwogable Industry!12Dr. Donald Otoyo Ondieki
AbstractThis article presents the historical, current and futures scenario on youth and entertainment in Kenya both as a culture and as an economically viable industry. The article undertook a descriptive and analytical literature review approach with the purpose of exploring the youth and entertainment in Kenya. The article proposes a conceptual framework drawn from the Stewardship Theory, Performance Theory, Systems Theory, Technology Acceptance Model and Situated Learning Theory. These theories engage the youth as major drivers, players and consumers in the entertainment industry. Therefore, youth in Kenya were defined and profiled from the entertainment perspec-tive. Their past and present trends, driving forces, influences and impact from mass media, youth popular culture, technology and its impact on entertainment were also highlighted. Some of the outlined entertainment sectors included television, radio, music industry, recording industry, fashion, dance, internet, theatre and film. Current assumptions, including narrowing boundaries of industries that were once considered autonomous through merg-ers of such sectors as publishing, entertainment and telecommunications were examined. Future opportunities such as the creation of a vibrant entertainment industry which has a capacity to enhance employment among the youth and the potential of contributing a larger share than the tourism industry towards the country’s Gross Domestic Product (GDP) alongside the risks arising from failure to maximize on the opportunities presented were also examined. Results largely confirmed the entertainment industry as an important tool for national develop-ment that needs to be promoted and protected since it highly engages the youth as significant drivers, players and consumers. The fast growth of the industry was noted alongside the resulting haphazard operations within it that have rendered most of its contribution to national revenue not being captured by government through taxes. The current scenario consequently heralds the need for developing adequate policies that will enable the government capture the contribution of this industry and deepen recognition of its importance especially in addressing the youth scenario.

331Institute of Economic Affairs
IntroductionDefining EntertainmentEntertainment can be defined as any kind of activity, performance and or engagement that provides amusement for people in a passive way i.e. without actively getting involved like reading a comic book or in an interactive way i.e. actively getting involved, like dancing to music in a concert. These activities, performances and engagements come in different forms that include: performing arts such as music, theatre, art and fashion; mass media entertainment that comes in the form of radio, television, movies, newspapers and newspaper pull-outs; technological innova-tions that comprise of CDs (Compact Discs), DVDs (Digital Video Discs), MP3 players, IPods and I Pads; telecom-munication innovations such as internet and media enhanced mobile phones; performances in the form of festivals, drama and live concerts in theatres, road-shows and stadia; popular culture in the form of fashion designs, the Matatu90 culture; and religious and corporate organized events thus demonstrating how broad the industry is.
From the entertainment perspective, the youth can be defined in two categories. Those aged 15 – 17 years old and those aged 18 – 35 years old. The first category comprises of high school students. They are normally a target of various schools, church and religious organization entertainment functions. This differentiation is made clear by various entertainment spots that restrict those under 18 years versus those that are open and do not screen the ages of their patrons. Most entertainment spots that exercise the over 18 rule regard their targeted patrons as slightly mature and thus they package their services differently but essentially, the main source of entertainment in terms of music, fashion and culture is almost entirely the same for all 15 – 35 years olds.
According to Nyariki et al. (2009), the entertainment industry has enormous potential. • The total value-added of copyright-based industries in 2007 amounted to about KSHs 85.21 billion, which
represented 5.32% of Kenya’s GDP.
• The contribution to the country’s total value-added by the core industries was KSHs 36.94 billion (2.3%), the interdependent industries KSHs 34.78 billion (2.17%), the partial industries KSHs 6.56 billion (0.41%), and the non-dedicated support industries KSHs 6.92 billion (0.43%).
• The entire copyright-based industries contributed KSHs 114.23 billion out of the national gross output rep-resenting 3.76% of the gross output.
• The contribution of the copyright-based industries to the national economy on the basis of GDP was higher than that of the agricultural sector (2.3%), education (2.5%), and healthcare (3.9%) and compared favor-ably with the contributions of the other main sectors of the Kenyan economy such as fisheries (5.4%) and manufacturing (6.2%).
Wako (2007) also quantifies the amount of resources lost in the industry. It is estimated that right holders lose an estimated 30 billion shillings per annum to trade counterfeit and piracy. According to the Kenya Revenue Author-ity, counterfeiting and piracy costs the Government of Kenya 6 billion per annum in lost revenue collection.
Despite the economic prospects, government often groups the industry with the informal sector. Many policy documents also overlook the various facets of entertainment such as: press and literature; music, theatrical pro-ductions and opera; motion pictures and video; radio and television; photography, visual and graphic arts. The industry is also often bundled up with sports and recreation departments with sports getting more prominence. However, there is evidence that the sector offers unparalleled employment potential for the youth, which, if given appropriate operational support, budgetary allocation and policy framework from the government may not only yield high employment for the youth but also contribute to national growth while engaging youth in a culture they relate with.
This study views entertainment as an industry on its own. The study further proposes the entertainment industry to be closer to the ministries of culture (since it encompasses lifestyles and cultures) or that of youth (since they are its major drivers, players and consumers) than it is related to sports (where it is erroneously considered as part of recreation).

332Youth Research Compendium
Conceptual FrameworkThe conceptual framework emanating from the theories discussed present an interesting relationship between youth and entertainment. The Performance theory engages the youth with entertainment through interaction with the processes of creation and performance resulting in entertainment. This marries well with the Situated Learning Theory which brings to light the learning process that begins with participation and ends up in community practice that leads the youth into forming identities and membership. The Situated Learning Theory broadens the scope of the study away from focusing on individuals and instead leads to focusing on groups and behaviour systems thus leading us to the Systems Theory. The Systems Theory gives insight into the intricate interplay of the various sectors of the entertainment industry and how they interrelate to form a bigger system of entertainment while also focusing on the roles the youth play and the impact this has on them. The Technology Acceptance Model (TAM) provides a theoretical framework of understanding the rising innovations and technologies against a background of pre-existing platforms. This indicates the continuity of this challenge as long as technology continues to pro-vide for useful and easy to use innovations. TAM offers the youth and the processes of entertainment with user friendliness of technology while the Situated Learning Theory addresses the forming of youth culture and identities occasionally inspired by these technological advancements. Finally the Stewardship Theory addresses the manage-ment of the industry by bringing on board the government involvement. The Stewardship Theory addresses the entertainment industry’s potential and how that can be tapped through improved management that brings the government on board.
Youth Entertainment in Kenya: Trends from the pastIn Kenya, youth entertainment is still evolving from the days of open air mobile cinemas sponsored by the govern-ment which were held in market places and fields in most major towns and villages (these were very popular in the 1970s, 1980s until the mid-1990s), to the current state of the art cinema theatres with technology heading towards three-dimensional (3-D) and four-dimensional (4-D) theatres. This concept of watching movies has also evolved from video cassettes medium to video compact discs (VCD), digital video discs (DVD) and now to smaller gadgets like IPods and I Pads that can still serve the same function of storing and playing back movies. The following sec-tion, guided mainly by the Technology Acceptance Model (TAM) and the Systems Theory, outlines developments in some of the various sectors informing the entertainment industry that influence the youth as much as they are influenced by the youth in Kenya.
Television EntertainmentThe television sector has also grown from large black and white shutter television sets, to sets with colour, flat screen – liquid crystal displays (LCD), plasma and now high-definition (HDTV) sets that can even play movies straight from a memory stick. In Kenya, the television channels have also increased from the one government run station (until 1990s) to a liberalized industry that has seen the evolution into digital and cable television provid-ers like DStv and ZUKU. The country is currently moving its entire television signal from analogue to digital and consequently mapping out a new entertainment arena with clear television signals countrywide. Digital television technology has also been advanced to provide technology that can record television programmes for later view-ing when one is not available at home. According to the Communication Commission of Kenya (CCK), in the year 2007 there were 368 registered television frequencies in the country (Nyariki et al., 2009). This increase was evident as from the 1990s after the liberalization of the airwaves that were previously dominated by the govern-ment owned station, Kenya Broadcasting Corporation (KBC). During the era of the state owned KBC as the only broadcaster, there were very few local television productions. The pictures below showcase some of the veterans in television production who still are active in the industry to date.

333Institute of Economic Affairs
Text box 1: Key Developments in Television Entertainment
• The first television station can be dated back to 1961, but it was first a private enterprise serving European clientele. It was later transformed into a national station.
• Initially, it was all black and white until 1984 when Voice of Kenya (VoK) went into full colour. • Television and video have now become the most powerful medium in the media industry. • Since the advent of multi-party politics in the 1990s that were accompanied by the opening of the democratic space that saw the liberalization of the
television sector there has been a high demand for broadcasting frequencies (Nyariki et al., 2009)• In the 1970s and 1980s, there was an increase of local programmes that were mainly comedies like “Vioja Mahakamani”, “Plot 10” and “Vitimbi”. • Later on, there was an attempt on drama in local programmes like “Tushauriane”, “Usiniharakishe” and “Ushikwapo Shikamana” that were later to be
banned by the government. • With the advent of liberalization, the television sector though reluctant at first warmed up to local productions. • The entry of youth comedians like “Redikyulas” changed the television comedy scene taking it to another level. The popularity of this show raised the
interest in local productions. • These productions went beyond the studio produced programmes of the 1970s to 1990s and have evolved to soaps, drama and action packed
programmes like; “Wingu La Moto”, “Better Days”, “Tahidi High”, “Wash & Set”, “Makutano Junction”, “Cobra Squad”, “Guy Centre”, “Mother-in-Law” and “Papa Shirandula” among others.
These developments in the television sector have consequently provided better employment and remuneration terms for youthful thespians that now are able to balance between theatre and television.
Radio EntertainmentText box 2: Key Developments in Radio Entertainment
• With the transistor radio becoming fairly affordable in the 1970s, the people in the academy began to go out and collect then record traditional music. • The state-run Voice of Kenya (VoK), which had Kiswahili, English and vernacular stations, was the only radio station in Kenya (Odhiambo, 2007). It was
later named Kenya Broadcasting Corporation (KBC) and was liberalized in the late 1990s. • This saw a rise to a high number of stations and satellite radio offering a wide variety of programmes and music genres. This was important because
for a long time, the radio entertainment exposed Kenyans to too much foreign music and this was detrimental to the local music industry. The scenario has since changed and much more Kenyan music is being played
• Most radio stations target the youth as consumers. The radio industry is therefore filled with youth presenters and radio controllers for effectiveness in delivery. The latest being the recent appointment of Walter Mongare aka Baby J. Nyambs as the radio programmes controller at the state-run KBC. He becomes one of the youngest to hold that position
There has been increased awareness synchronizing entertainment and education in the radio industry as elaborated by Odhiambo (2007) when he discusses the “joker” concept. Odhiambo (2007) describes the “joker” concept as the radical and innovative aspect of FM radio stations broadcasting in Kenya when a youthful comedian is en-gaged as a co-presenter in the radio programmes where s/he plays the role of a social provocateur.
This concept has been youth-driven and thus has set pace for more youth involvement in the industry. Odhiambo (2007) states that the dialogic sites situated within the trope of playing betwixt and between edutainment have made it possible for the FM stations to intervene on issues and matters that are of great concern to the general pub-lic. Kiss 100FM, Easy FM and Classic 105FM are good examples that have not only pioneered but also perfected the “joker” concept on radio stations in Kenya
The Recording IndustryOndieki (2010b) highlights Jambo Records which was established around 1930 but was first documented in 1946 as the first recording studio in Kenya. This studio produced light jazz, swing, Cuban rhumba, and melange, mixed with ethnic styles. There were commercials by Africans as early as 1943. Fadhili Williams was first recorded here and so was his famous hit song ‘Malaika.’ The church too became the place for musicians to make commercial music. The dissemination of Makwaya style began in 1954/55, when the Kijabe African Inland Church (AIC) established a recording studio. This led to the creation of recording choral groups mainly based in schools and

334Youth Research Compendium
churches. The recording industry at Kijabe set up stylistic standards for recording, with the main style being the ‘Lutheran chorale’ and this took root as the right way of singing (Kidula, 2000).
Kenya has since been the centre of the music and media industry in East Africa. The market – economy policies of Kenya attracted investments from the international music industry in a number of projects. One such project was the now defunct record pressing plant in Nairobi - East African Records Limited (EAR). Another was a modern recording studio complex built with funds from Columbia Broadcasting System (CBS). This influx of foreign capital contributed to the development of the music and media scene in Nairobi. The South African Gallo Records established a subsidiary in Kenya as early as the 1940s. At the beginning of the 1950s, the company was still releasing many phonograms, but went into receivership in 1986. Electric Musical Industries’ (EMI) operation, which was set up in 1977, went into bankruptcy in 1978 not because of the recording industry but due to the shift-ing of company assets into the pocket of the local manager. In the early 1980s, CBS started a local subsidiary and was soon claiming 30% of the market. The CBS studio facilities were later leased to a local company, Crawford Productions, and the subsidiary concentrated on distribution. By the end of the decade, it was completely run by local management with little interference from the Mother Company. Kenya’s first-locally-owned phonogram company, Mwangaza Music, was founded shortly after independence in 1965 as a brain-child of Adam Kutahi. (Ondieki, 2010a).
Both the larger and smaller companies in Kenya had small studios and thus, no 21-36-track studios existed. In 1988, Nairobi’s most sophisticated studio was the 16-track facility leased by Crawford Productions from CBS. A typical small record company was one run by musician Joseph Kamaru, in a two storey commercial building in River Road, Nairobi, where recordings were made in a tiny studio with simple 4-track equipment. With the cassette takeover of the 1980s, Kenya got its own township pirate companies mostly operating in Nairobi’s River Road area. Nonetheless, Kenya has a fairly up-to-date copyright Act from 1983 (revised in 2001) that provides legal action against the production of cassette pirates, but very little action seems to have been taken. (Ondieki, 2010b).
Since the mid- 1980s, cassettes gradually replaced vinyl discs to become the main medium of recorded music. The growth of the cassette market (both legal and private) finally led Polygram to cease record productions in Nairobi and to sell the record presses in 1990. The development of computer based recording technologies in Kenya in the 1990s saw the mushrooming of recording studios owned by the musicians themselves and not the record compa-nies. This has been evolving to-date and now musicians can easily record their music without being controlled by the record company markets. This has led to the present revolution in the music industry in Kenya. It is important to note that despite these facilities being available, they are not affordable to all musicians especially those from the lower and mid-lower classes. Government intervention to zero-rate taxes on all music and studio equipment in the country could foster development of the industry. The present scene in the recording industry is captured under the section on youth entertainment popular culture.
Text box 3: Key Developments in Recording Industry
• 1930s: Jambo Records first recording studio was established in Kenya• 1930s to date: Kenya a recording hub for East and Central Africa• 1943: African commercials recorded• 1954/55: Kijabe Africa Inland Church gospel recording studio established• International record companies that opened projects in Kenya included;
• East African Records Limited (EAR)• Columbia Broadcasting System• Gallo Records• Electric Musical Industries (EMI)• Local Production Companies included;• Crawford Productions• Mwangaza Music• Joseph Kamaru’s Studio• 1990s: Mushrooming computer-based recording studios

335Institute of Economic Affairs
The Music IndustryThe recording industry has evolved from the big multinational companies that controlled most recording fran-chises in the country since the inception of the industry in the 1940s to new technology that enabled the youth to establish small home-based studios. This has enabled some youth to record their music cheaply and thus venturing in the enterprising entertainment industry.
The growth and development of popular music has been closely associated with both the recording and broad-casting industries. It is evident that during the early 1900s, local popular music recordings were unheard of. The only recordings available, in semblance, if any were the field recordings done by ethnomusicologists and anthro-pologists. The very first of these recordings of African music are credited to the German Carl Meinhof in 1902. (Harrev, 1991) It was not until the 1920s that records from Europe, India and America found their way to few Kenyans who could afford them, mainly Christian families, teachers and Indian businessmen. The first recording by an East African is attributed to the famous Siti Binti Saad from Zanzibar. This was in 1928 and she had to travel to Bombay to record a Kiswahili song in “Taarab” style on “His Masters Voice” label. (Harrev,1991). In Kenya, the first recording studio was established in the 1930s. According to the Kenya Broadcasting Corporation information booklet, the first wireless broadcasting station was started in August, 1928 (Okumu, 1998). It is true that the establishment of broadcasting services in Kenya went a long way in shaping Kenyan popular music.
The Second World War (1939 – 1945) has served as a very important historical event in many fields of study such as history, economics, geography and other social sciences. In the study of music too, the war had the same effect of demarcating a musical era in Kenya. The returning war veterans who had seen battle in as far places as Burma, came back to Kenya and further popularized popular music styles. The electric guitar made its appearance around late 1950s to early 1960s and several musicians including Paul Mwachupa and Gabriel Omolo acknowledge Fundi Konde and Fadhili Williams as the first Kenyans to use the electric guitar (Okumu, 1998). These two pioneers were recording assistants with East African Records from as early as 1955. Around the same time, music boxes (juke-boxes) appeared in African bars, in areas like Pumwani, Bahati, Jerusalem and along River Road. This further catapulted popular music especially for those who could not afford gramophones and records. (Harrev, 1991). The Music industry in Kenya today has evolved from the cassette-based 1980s to the CD based late 1990s and to the current mixture of CD, DVD and soft-copy MP3 formats of circulation into media players and mobile phones.
With all these multi-national recording companies setting-up in Kenya, Nairobi became an active music recording and production centre in East and Central Africa. Musicians travelled all the way from DRC Congo and Tanza-nia to have their music recorded (Wallis and Malm 1984; Okumu 1998; Ondieki 2010b). As a harbour of music recording and thus entertainment, Nairobi played host to Kenyan and guest artists from around Eastern Africa among other international artists (Wetaba, 2009; pp 220). This partly explains the dominance of music from out-side Kenya in the country. Music recorded in Kenya would be easily played and marketed in the Kenyan media courtesy of sponsorship from these production houses (Rule, 1987). The present scene in the music industry is partly captured under the youth entertainment culture.
Text box 4: Key Developments in Music Industry
• 1928: First East African recording by Siti Binti Saad from Zanzibar• 1930s – 40s: Recording studios established• 1950s: Electric guitar enters the Kenyan music industry• Fundi Konde and Fadhili Williams among the first Kenyans to use electric guitar• Late 1950s: Juke-boxes in African bars• 1960s – 70s: Phonograms dominate the music industry• 1980s: Cassettes enter the Kenyan market along with it piracy• 1990s: CDs enter the Kenyan music industry• 2000s: DVDs and soft copy MP3 formats in circulation• 2010: Currently media players and mobile phones in dominance

336Youth Research Compendium
Fashion EntertainmentFashion is sensitive among the youth and they view it as part of their entertainment activities as they strive to keep up with the ‘au courant’ popular culture. Youth spend time and money where possible in dressing according to the latest fashions. These fashion designs and practices are mainly determined and influenced by the popular culture through tools of mass media. The fashion of Kenyan youth has changed since the traditional days of painting of faces using ore and colour producing herbs for body decoration and fragrance, through westernization of our dress codes, to afro-hairstyles, belly-bottom trousers, to sagging trousers and current designer labeled outfits, among many other fashion trends. To the upper class market, the fashion trends are extended to the cars they drive while in the lower middle classes, it is evident in the Matatu that they ride in as public means of transport. Further dis-cussion on fashion and Matatu are featured in the youth entertainment and popular culture.
Theatre SceneThe theatre scene in Kenya can be dated back to 1952 when the Kenya National Theatre (KNT) was opened by the colonial administration to serve its own self-centered interests (Mwangola, 2008). Other Little Theatres soon followed in places like Kitale and Mombasa. This scenario prohibited popular indigenous theatre, which had traditionally existed from yore. The theatre scene did not change after independence in 1963 towards furthering African theatre appreciation as expected but instead remained under the colonials still living in Kenya. Change was later to come in the 1970s through the University of Nairobi lecturers such as Owuor Anyumba, Taban lo Liyong’ and James Ngugi, among others.
This increase in theatre numbers has not necessarily spelt good times to the theatre scene even though the theatre scene is today contributing great thespians to the radio, film, commercials and television markets (Mutunga, 2009).
This contribution by the local theatre can be witnessed through the talent developed into the media industry. With the inception of radio comedy that was pioneered by radio presenter Caroline Mutoko and comedian Walter Mong’are aka Baby J. Nyambs, the theatre scene has since seen great thespians turn radio presenters. This scenario as analyzed by Mutunga (2009), indicates the possibility that current favourite radio and television presenters or news anchors are accomplished thespians in their own right.
Text box 5: Key Developments in Theatre
The number of theatres has increased all over the country with Nairobi boasting the highest number which include:• The Kenya National Theatre • GoDown Arts Centre• Phoenix, Kenya Cultural Centre • Visa Orshwal Auditorium• Goethe Institute (run by the German Embassy) • French Culture and Cooperation Centre (run by the French Embassy) • Braeburn Theatre • Brookhouse TheatreAccomplished thespians who are also radio/TV presenters include: • Kazungu Matano on QFM’s Tabaradi • Jalang’o (Felix Oduor) and Larry Asego on the Big Breakfast on Kiss FM • Mwalimu King’ang’i (Daniel Ndambuki) on Classic Breakfast • Charles Kiarie on Capital FM’s Urban Nights • Godfrey Odhiambo in Bob Nyanja’s film, Malooned • Misiko Andere on Nation Television NTV This Morning• Janet Kanini-Ikua on NTV Tonight • Judge Ian (Mbugua) in Tusker Project Fame• John Sibi-Okumu in Zain Africa Challenge • Anthony Kinuthia as Peter Marangi in the Duracoat television radio and print commercials • Charles Bukeko in Coke commercial.

337Institute of Economic Affairs
Film IndustryThe film industry in Kenya has for a very long time been renowned as location for external film industries as high-lighted in the World Story Organization (WSO) report by Edwards (2008). According to the Kenya Film Commis-sion (KFC) website (2010), the first film productions were from Hollywood and were dated as early as the 1930s.
All the films mentioned above as an example are all foreign productions telling foreign stories and merely using Kenya as the landscape to their stories. The WSO report (Edwards, 2008) then questions “What of Kenyan films made by Kenyans, telling Kenyan stories?” Since 1930 to the turn of the century, there have been no major Kenyan films produced that have made a mark on global audiences, other than wildlife films, such as those shot by Na-tional Geographic, Discovery Channel, or BBC. Indigenous films in Kenya have been confined to selected Kenyan audiences without international release (Edwards, 2008; Kihang’ah, 2008).
Recently, there have been some changes that saw the short film Kibera Kid showcasing local Kenyan talent in film festivals around the world, winning seven awards (Oladipo, 2007). More Kenyan productions like Mob Doc have made it to the big screen featuring for three weeks in Kenya’s largest 18-screen theatre chain Nu-Metro currently named Silverbird. One of the main problems facing the film industry in Kenya and Africa as a whole as highlighted by Isabel Balsiero (2002) is the lack of legislation and rules of practice for the film industry, therefore, filmmakers find themselves in a tight spot to finance their work, let alone distribute their films.
Riverwood, as is commonly referred to, is currently the centre of indigenous filmmaking in Kenya. Riverwood derives its name from the name of the street on which it thrives on, that is, River Road, found in downtown Nai-robi, Kenya. This River Road area is a neighbourhood that embodies the lively, often boisterous and sometimes violent urban life in Africa as explained by Njeri Kihang’ah (2008). Kihang’ah highlights Riverwood’s fame for quick and sloppy productions that can take as few as three days to produce and circulate alongside it being the hub of piracy in Kenya.
Text box 6: Key Developments in the Film Industry
• The 1930s productions included African Holiday, Stanley and Livingstone, and Trader Horn among others. • The 1950s showcased Hollywood star-studded films such as The Snows of Mount Kilimanjaro, King Solomon’s Mines and Mogambo that highlighted
the beautiful Kenyan landscape. • The year 1981 saw the production of an acclaimed television miniseries, The Flame Trees of Thika, based on the white settler memoir of Elspeth Huxley
which was produced by the British Broadcasting Corporation (BBC). • The winning Best Picture at the Academy Awards in 1985 of the film Out of Africa, based on the life of Danish citizen Karen Blixen, brought worldwide
attention to Kenya and was to be the turning point of films made in Kenya. • Recently, there have been more productions such as the German film Nowhere in Africa, which received the 2003 Academy Award for Best Foreign
Language Film, and The Constant Gardener.
Technological advancement has had a visible impact on the key sectors of the entertainment industry including television, radio, film, music and recording industries. Democracy and liberalization of the 1990s also played a big part in opening up entertainment in Kenya. Bad governance and lack of proper policies have also curtailed the industry’s successes. The potential that Kenya holds as a central hub in the entertainment industry, needs to be fully taken advantage of before it is outlived by emerging hubs in the east African Community, by fully utilizing the untapped potential of the industry such as film.
Dance EntertainmentWhen it comes to dance in Kenya, what comes to mind sometimes are traditional dances that are seen on national day celebrations, tourist hotels, and music and drama festivals. But the introduction of modern dance competitions in the 1980s and 1990s saw the popularity of such dance groups as the “Rare Watts” rise to become household names. The growth of the dance sector has been slow since then. But recent efforts among the youth with sponsor-ship from various corporate companies have led to a revival of the sector. In Nairobi’s Buru Buru estate, a new swimming dance style has gained popularity with the youth becoming a sensation. The new swim style is among

338Youth Research Compendium
the many swings and bops introduced by the Sawala Dance Group whose members have taken what is now be-coming a popular trend among Kenyan youths ‘street dance’. Dancing is not only becoming a pastime for many, but is now providing a lifeline for youth to earn some money through performances at functions including con-certs, weddings, entertainment spots, churches, company events, competitions and world tours (Makeni, 2009).
So far, Kenya has had several dancing competitions like ‘Can You Dance Competitions’ and ‘Malta Guinness Street Dance’, which have been an attraction to many youth. The ‘Win-a-Car’ dancing competition was one of the inaugural competitions in Kenya in the 1980s and early 1990s. These competitions launched professional dancing careers for several Kenyan youth including Rare Watts’ Fernando Aluang’a. Currently, many youth groups are taking advantage of dancing competitions sponsored by companies (Makeni, 2009). In 2005, the Dance-mania competition rejuvenated a new passion in dancing and opened doors, which in the recent past, were mainly a pre-serve of a few professional dance groups including Sarakasi, Eclipse Dancers and the Safari Cats.
According to the Safari Park Hotel management, the employer and facilitator of the Safari Cats, so far, more than 300 dancers have acquired professional skills with the Safari Cats91. A good number of them are living and working abroad and some are involved in various charity projects particularly is child welfare and street children rehabilitation programmes92. The Safari Park Hotel facilitates for the training of the dancers who are thereafter employed as permanent staff of Safari Cats. The Safari Cats dancers have the liberty to seek career opportunities at any given time and this has seen the group rejuvenated by younger dancers through continuous training. The success of the Safari Cats and Sarakasi Dancers both locally and internationally, and that of Fernando Aluang’a, who was one of the Rare Watts trio in the 1990s, but currently performs in Europe and round the world, give insight into the career opportunities for the youth within this sector of the entertainment industry. The acknowl-edgement of dance as a career opportunity for the youth can be theorized further using the Performance Theory and the Situated Learning Theory where apart from the economic gain there is evidence of social and cognitive development as well.
Internet-based EntertainmentClearly, the world of entertainment of today would be drastically different if the internet never existed. One may argue that if the internet never existed, no services such as file-sharing or iTunes93 would exist today. This file-sharing of audio and visual content is accessible over the internet via uploading and downloading to computers or personal audio-visual devices. One innovation of internet mass media is YouTube, and other video blogging networks. YouTube first was activated in February 2005 and by February 2008, the site was grabbing one-third of the estimated 10 billion views of online videos that month. These sites give anyone with access to the internet, the opportunity to broadcast either themselves, or any other sorts of video media, onto the internet. YouTube has provided many Kenyan youth who have not been able to have their songs or performances covered by the media an opportunity to post the same for the world to see. This has also enabled artists share performance clips of their shows with friends and thus keeping them in touch with their progress and activities. Some of the significant sites among Kenyan youth in this respect are www.easafricantube.com, www.kelele.com, www.kenyans.org, www.youtube.com and www.myspace.com.
Internet downloading is a significant new source of audio-visual content and, as such, competes for listening and viewership time with both conventional radio and television platforms. Audio downloading is becoming popular among youth in Kenya alongside the use of MP3 players, MP3 enabled phones, radio enabled phones, among oth-er gadgets that they use to download and store downloaded music thus, providing them with new ways to access audio content. A case study of music downloads in Kenya indicates that when Safaricom (one of the major mobile service providers in Kenya) launched their ‘Skiza’, a ring-back tune service, gospel artistes were on top of the list
91Daily Nation: - Lifestyle |The Safari Cats. http://www.nation.co.ke/magazines/lifestyle/-/1214/667236/
92Daily Nation: - Lifestyle |The Safari Cats. http://www.nation.co.ke/magazines/lifestyle/-/1214/667236/
93Apple in 2003 introduced an online music site called the iTunes Music Store that enabled computer users to purchase and download
music.

339Institute of Economic Affairs
of musicians whose music was downloaded most frequently (Daily Nation’s Buzz magazine94). According to data released by the Music Copyright Society of Kenya (MCSK), Tanzanian songbird Rose Muhando’s song Yesu ni Bwana was downloaded 43,648 times, netting her Sh77,000/- in just one month. Marion Shako and the late An-gela Chibalonza followed closely in earnings with the songs Ahadi Zake and Uliniumba Nikuabudu respectively. This is an indicator on how new technologies can be embraced productively and also on the potential the music industry has towards economic contribution. This report indicates that audio downloading has positive effects on the entertainment industry not only by perceived ease of use but also on economic contributions.
One of the global phenomena of the 21st century is the innovation of social networking sites such as Facebook and Twitter, among others. Of these sites, Facebook.com, which was created in 2004, is among the popular social networking sites among the Kenyan youth today. The site is currently accessible via mobile phones supported by the local mobile phone service providers including Safaricom, YU, Orange and Airtel. It is now among the 100-most-visited websites in the world (Holder, 2006). The site basically redefines social networking by allowing users to create and maintain virtual persistent profiles which contain personal, academic, and contact information. In Kenya, many youth in schools and colleges have social networking accounts like Facebook.com. This is con-tinuously changing the way the youth communicate amongst themselves. Many youth related functions, camps, concerts and information are widely advertised free of charge on these sites through the creation of fun pages and posting of notices to friends and friends of friends thus creating a rigorous network chain.
The Makmende phenomenon95 is a fictional Kenyan superhero character which has enjoyed a popular resurgence after an adaptation by Kenya’s musical group ‘Just A Band’ in the music video for their song Ha-He on their sec-ond album, 82 (2009). The video became the first viral internet sensation in Kenya and has hit in a big way on social sites such as Facebook and Twitter. The word Makmende is a Sheng96 word which means “to want to be a hero”97. The name supposedly originated from a mispronunciation of Clint Eastwood’s phrase “Go ahead, make my day” (Mek ma nday) from his 1983 movie Sudden Impact98. The word Makmemde made its way into Kenyan streets in the 1990s whereby the streets bad guy wannabe would be called out and asked “Who do you think you are? Makmende?” Anyone who thought they could do the impossible or a particularly difficult task was always asked whether they thought they were Makmende since only Makmende could do or attempt to do the impossible. The character Makmende is associated with the fashion wear of the early 1980s. He is portrayed with long afro hair and bell bottom trousers that were the trend then.
The video, directed by Jim Chuchu and Mbithi Masya, of the musical group ‘Just A Band’ became a viral internet sensation and Kenyans launched an internet campaign for the “Makmende” on Facebook, Twitter and other social networks. The video references ‘blaxploitation’ and ‘kung-fu’ movies in its style and features Makmende fight-ing with a variety of humorously named characters in a fictional city. The cover graphic of the video has a black and white monotone portrait picture of Makmende placing a red head band across his forehead with the words ‘Makmende Amerudi’ which is Kiswahili for ‘Makmende is Back’. The success of this video and the subsequent internet discussion has centered on the ways in which Kenyans were adopting social networks. The impact of this story through social networks was global and as a result the Makmende story has also featured on Cable News Network (CNN) by David McKenzie. The Makmende phenomenon helps prove there’s a ready and extremely in-fluential online market in Kenya. This can be appropriated in many ways from the economic gains it portrays for the entertainment industry to providing the government with ways of interacting and engaging the youth towards a prosperous nation.
94www.nation.co.ke/magazines/buzz/-/441236/636540/-/hc0c69z/-/index.html95www.makmende.com <URL: http://www.makmende.com96Sheng is a fast growing language among the youth in Kenya where they formulate new words; de-contextualize
the meanings of existing words; or simply cutting and mixing sections of words from English, Kiswahili or in-digenous languages; thus developing a new language.
97 Sheng-Kamusi. 1997. http://www.sheng.co.ke/kamusi/kamusi.asp?s_word=makmende. Retrieved August 24, 2010.
98http://en.wikipedia.org/wiki/Makmende

340Youth Research Compendium
Institutionally Organized EntertainmentThe youth do often engage in entertainment activities that are institutionally organized. Institutions involved in youth entertainment include schools, churches and religious organizations, commercial companies and organiza-tions, entertainment companies, media companies and organizations, hotel and tourism industries, among others. More often than not, these entertainment activities lean towards edutainment than just general entertainment.
A brief gestalt on the church institutions in regard to youth and entertainment reveals that recently, there has been a rise of trendy churches that have transformed themselves to attract the youth by providing edutainment activities that endear the youth. According to Mwaniki (2009), these trendy churches have endeavored to fulfill spiritual needs of the youth using the youth’s language and style, while acting as new meeting places for the youth. They have setup young disc jockeys (DJ), video jockeys (VJ), trendy hip-hop attire (fashion and dress code) and language code familiar with the youth. This scenario has contributed to further rise of gospel music and film. Gospel music and film productions have been the bestselling in Kenya over the decades (Kidula, 1998 & 2000) and these youth-driven and centered edutainment activities have propelled the gospel scene ever further.
In Nairobi, some churches indicated that, as a means to reach the youth, they engage youthful preachers, have up-to-date websites, sell their music and sermons on CD and DVD, and attract prominent preachers and musicians from other countries. In Nairobi, these churches include Mavuno, Nairobi Lighthouse, Baptist Church Parklands, Nairobi Pentecostal Church, Deliverance Church Umoja, Jesus Celebration Centre and Nairobi Chapel. In Eldo-ret, they include Neno Evangelism, Deliverance Church, The Door, Church of the Living God, and Lord’s Shep-herd (Mwaniki, 2009). These churches also use social websites like Facebook and YouTube to communicate with the youth congregation and to pass their messages across.
This scenario in the new churches has provided the youth not only with the religious messages but also edutain-ment as well. The enjoyment and fun of the youth and the exploitation of their talents is the driving factor through which these new churches thrive to pass their religious messages. This in turn has provided the youth with a reliable and moral source of edutainment that is intended to keep them away from other forms of pass-time that are considered immoral such as alcohol intake, drug and substance abuse. These churches thrive in attracting the youth without compromising on the delivery of their religious teachings. The youth in turn view going to church and participating in church activities as a creative yet spiritual source of entertainment. They spell a ready market for gospel music, film and theatre thus can be seen playing a supportive role in the entertainment industry.
The Current Trends and Effects on Youth Entertainment and Popular CultureYoung people are constantly engaged in various forms of identity play. The various identities they negotiate are fluid, context specific and fluctuating since most of these are cast in a discursive force confined by space and time (Wetaba, 2009). This perspective is used in analyzing youth identities as played out in current entertainment trends.
Dress CodeDress code is one way the youth express their culture. They tend to be fashion-conscious and trendy and this is informed by the entertainment industry. New demands and tastes keep emerging among the youth in what they term as ‘cool’ dress codes. The young ladies tend to prefer dress codes that outline their figures, including tight pants, and a scantly covered or partially exposed upper body. Even when the weather dictates a warmer dress code they still would rather stick to their style labeled “freeze and shine”. The “baggy” dress code is still popular among the male youths and the label of the designer wear and style matters a lot even if it is an imitation. The latest style that has stuck for a while is the wearing of “sagging” trousers that expose the inner wear, mostly again a designer or stylish inner wear. Wearing dreadlocks is also often seen as a fashion statement of recognition and reconnection with Kenya’s struggle for independence from the British as well as a Rastafarian culture.
It is trendy and a part of the youth culture to not only gravitate around particular fashion styles, but also gravitate around eating spots for a meal, a drink, relaxing, and, or dating as well. This is a popular youth culture of ‘hang-

341Institute of Economic Affairs
ing out’. As captured in the Situated Learning Theory, it is one of the ways through which the youth socialize and pass time which in their language is refered to as ‘kill time’. Another entertainment phenomenon that is gradually growing in Kenya and especially among the youth and adults is the annual festivals such as Luo Night, Ingo Night, Kalenjin Night, Kamba Night, Mugithi and Coast Night. These are among some of the biggest cultural events with music, fashion and food from the specific ethnic communities that bring people together to celebrate cultural preservation.
Literature and EntertainmentThe youth do use entertainment to voice their suffering and frustrations. Despite the difficulty, they on the other hand glorify slum life and culture acknowledging positive attitudes and potential to better its place in society (We-taba, 2009). One good example that is geared towards this development of positive attitudes is Kwani Project, a venture that is helping to market the creativity of youth in the ghettos through entertainment. The project holds Open Mic Poetry Night, an event for talented artistes monthly. This project is a literary forum and journal initi-ated in 2003 by Binyavanga Wainaina with the aim of nurturing young upcoming artistic talent in Kenya. In this regard, entertainment therefore functions as a source of hope and a means of developing positive attitudes among the youth, thus a tool of communication.
The Hip-Hop CultureThe 1990s marked a new era of democratization that resulted in a new generation of urban Kenyan youth enter-tainers particularly musicians Hardstone and Kalamashaka who nurtured and pioneered the emergence of Kenyan Hip-Hop. This culture officially set off with the recording of Uhiki by Hardstone, a song sung in a mixture of Kikuyu, English and Kiswahili, and other local languages, opening up a new entertainment space in Kenya (Mu-gambi 2001; Samper 2004; Hip-Hop Colony 2005; Nyairo and Ogude 2005; Wetaba 2009). The enthusiasm that resulted allowed room for the otherwise marginalized youth to emerge into the public entertainment sphere.
According to Samper (2004: 37), “Kenyan rap is a hybrid cultural form that is deeply implicated in the definition and negotiation of youth identity.” He observes that Kenyans have taken a Western art form and made it their own by using Sheng, drums and African-inspired beats, and talking of local realities. Samper (2004), Mungai (2004 and 2007), Ogechi (2005), Nyairo and Ogude (2005) and Wetaba (2009), have been instrumental in giving insights into the Hip-Hop culture. Nyairo and Ogude (2005), for example, offer an interesting analysis of the song Unbwogable by Gidi Gidi and Maji Maji, and the employment of its text in for a political course. Samper (2004) gives a captivating analysis of the use of Sheng by Kenyan youth rappers. In his analysis, Samper notes that the Hip-Hop culture in Kenya is fairly strong and growing, particularly with regard to youth’s use of street Language (Wetaba, 2009). Through this genre as part of the music industry in Kenya, many artists are able to earn a source of livelihood. They not only get to be famous but also make money from it.
Matatu Culture and Graffiti among the youth in KenyaAccording to Mungai and Samper (2006), Matatu in Kenya are painted in different colours and have names, symbols, cartoons, and other images designed on them. The authors further observe that, the designs on Matatu articulate powerful, relevant, and timely social, political, economic, and cultural commentaries. Mungai (2004, 2007) gives a detailed study of Matatu culture, an issue at the core of youth expression (Wetaba, 2009). Accord-ing to Wetaba (2009), though the images of American Hip-Hop and popular culture have been strong in Kenya, the advent of Kenyan Hip-Hop saw a gradual shift especially in Matatu graffiti with an increasing emphasis on Kenyan artistes and their music. The Matatu culture therefore plays a role in publicizing and transmitting youth culture. Use of Kenyan celebrities in the Matatu industry not only attracts young customers but also furthers dis-course on popular culture, subculture and youth in the urban centre (Wetaba, 2009). The preference of a particu-lar Matatu or “Manyanga” (trendy minibuses) by the youth is phenomenal. Apart from the graffiti decorations described above, these Matatus often play loud music both by local and international artists and some even screen their videos too as preferred by the youth.
Matatus have also been an important channel for conveying Kenyan music and movie productions to the public. Many artists supply free cassettes, CDs, VCDs and DVDs of their new releases to Matatu crew (Wetaba 2009: pp

342Youth Research Compendium
230). The Matatus not only move around the city, but always have an audience both in the passengers and people passing by, thus offering an advantage in publicizing the music and video productions. Today, all Matatus contrib-ute to the MCSK royalty charges of the music they play through licenses that they must obtain to be in operation. This has boosted the revenue collection of the MCSK and the government, seen that most artists pay tax and is a way of channeling royalties to the registered artists of the society.
Talent Award EventsWithin the entertainment industry, stakeholders have initiated talent award events as a form of incentive. Kisima Awards, CHAT Awards, Pwani Awards, Buzz Music Awards, Groove Awards and Kalasha Film and Television Awards have become major Kenyan events that recognize artistes who excel. These events also provide occasions for artistes to come together and compete for the given prizes, ratings and status. Some of these awards extend to artists from the East African region. Ted Josiah is credited with having conceptualized the idea of Kisima Music Awards around 1994/1995with the aim of setting up an awards scheme to showcase and reward musical perfor-mance of young Kenyan artists (Wetaba 2009; Githagui 2005; Kidula 2005). CHAT Awards is partly sponsored by Fanta and The Insyder, a monthly music and leisure magazine for youth. KORA Awards remain the most coveted treasure for most Kenyan artists as they have continental recognition. The Groove Awards are unique as they focus on the gospel genre and the Kalasha Film and Television Awards focus on the Kenya film and television industries. These events not only boost the morale of artists but also brighten their future chances and careers.
These events are organized and sponsored by major corporate and multinational entities. Tusker Project Fame, for example, has organized talent promotional events since 2004 for the whole of the East African region, where the winning artists get big recording contracts for one year.
Producers, DJs and VJs in the IndustryThe music industry today and the youth entertainment culture have been shaped partly by the producers, produc-tion houses and DJs in the industry. Such production houses as Ogopa DJs, Homeboyz, Mandugu Digital, Calif Records, Samawati Studios, Blu Zebra and Jikoni; and producers Tabu Osusa, Ted Josiah, Musyoka, Clemo, R-Kay, Chris Adwar and Andrew Madebe; have been instrumental in fashioning and nurturing the Kenyan music industry through local genres including Genge (associated with Calif Records), Boomba and Kapuka (both associ-ated with Ogopa DJ’s). Computer-based recording technology has simplified studio set-up and increased music production opportunities. Some leading production houses like Blu Zebra and Calif Records are set up in private houses where the producers reside. This kind of studio set-up is done normally in one of the bedrooms and thus the term ‘bedroom studios’. This is a means of making recording more affordable to upcoming artists since the cost of rent is absorbed easily and thus not passed down to the recording artist.
The advent of Hip-Hop brought with it new forms of relationships between artists and DJs/VJs in the music industry (Wetaba, 2009). DJs and VJs have gradually transcended their initial position to become musicians (Fikentscher, 2000). One local example is DJ/VJ Space (Arthur Wandera) who holds a Bachelor of Music degree from Kenyatta University. Presently in Kenya Djing (art of disco jockeying) is becoming a schooled art where acad-emies have been set up to train artists into the art of sampling, mixing and looping. In Nairobi, such academies are Homeboyz, Code Red, Ogopa DJs, and Samehewa Entertainment. Another section that has been growing very fast is that of Gospel DJs and VJs that have led to television programmes such as the Stomp. All these avenues are ex-panding daily the potentiality of the industry and thus creating more and more job opportunities for young people.
The Cognitive Impact: Values and LifestylesThe issue of cognitive impact from the youth entertainment and popular culture deserves mention considering that the youth do look up to the popular entertaining artistes as their role models and thus tend to copy what these artistes stand for. This concern has been brought to light mainly through musical productions such as Wee Kamu (Sheng meaning - you come), Keroro (Sheng meaning - alcohol), Hunipati (Kiswahili meaning – you can’t get me), Manzi wa Nairobi (Sheng meaning – girl from Nairobi), by Nonini; Juala (Sheng meaning – plastic paper bag) (also known as Manyake - Sheng meaning sexual goods) by Circute and Joel which seems to sensationalize drink-ing alcohol, sex, money and girls. The lyrics in some of these songs are deemed inappropriate when played publicly

343Institute of Economic Affairs
in supermarkets, Matatus, and or when young children learn them and start singing along. Though in some cases, the controversy exists between the actual and intended meaning of the song versus the perceived meaning. The song Juala by Circute and Joel aims at marketing the use of condoms among the youth for HIV/AIDS prevention. But the public adopted the title Manyake from the chorus to connote sexual and bodily appeal.
Apart from the few artistes who produce songs with explicit messages on sex, money, girls and alcohol, explicit messaging, some artistes are influenced by ideologies like the Marxist philosophy and sing about social issues such as corruption in society. These include Mashifta, Kalamashaka, Eric Wainiaina, K-South, Mwafrika and Muki Ga-rang. Some songs like Chonga Viazi by Boomba Clan provide commentaries and discursive space for happenings in society, while other songs like Unbwoggable by Gidi Gidi and Maji Maji have been packaged as socio-political and used for political campaigns. The above examples give insight to the various messaging themes the youth iden-tify with which can be summed up as including various inadequacies in society, social commentary, crime, artists battles for supremacy, romance and relationships, corruption, unfulfilled promises by politicians, alcoholism, HIV and AIDS, neo-colonialism, advancing gospel and evangelism (Wetaba, 2009).
Discotheques and ‘Pubcotheques’The months of June and July 2010, saw uncertainties linger over the discotheque ‘Florida Mad House’ with the threat of closing it down. This was one of the few remaining discotheques and major entertainment spot in Nai-robi, Kenya. Back in the 1980s and 1990s, Nairobi among other towns, boasted of several discotheques includ-ing Visions, Lora Blue, Bubbles and Jungle Club. It was a different era of clubbing and entertainment in Kenya. These discotheques could not allow anyone dressed in sports, hats, t-shirt, or a dress code deemed inappropriate to get in. And the culture of the day was for one to go home, freshen up and look their best, before going to the discotheques which normally opened from 9pm. Today, this culture is no more and instead we have the so called ‘pubcotheque’1. In this culture, the bar seems to have become the nightclub. The youth today, have grown know-ing the bar as the nightclub and thus the lost the formal presentation discotheques provided. This has resulted in the coining of the name ‘pubcotheque’99 to refer to the clubbing witnessed in bars mostly by the youth.
EdutainmentThis discussion is premised on the understanding that, entertainment lyrics and messages are afforded prominence compared to the art itself say music, literature, drama or art (Hager 1984; Rose 1994; Toop 2000; Hess 2007). The need for artists to express themselves and educate while entertaining can be linked with the African oral cul-ture. Some of the issues, values negotiated from their messages include: colonial and neo-colonial relationships; fun; love relationships; HIV and AIDS pandemic; social commentaries; corruption and bad governance; unfulfilled political promises; mchongoano100;alcoholism and evangelism. From the above subjects that the youth express themselves in, edutainment clearly remains at the foreground.
Another front towards edutainment is the project Pamoja Mtaani. This is a video game project that is targeting slum children. The game is packaged with interesting messages including HIV and AIDS awareness thus serving a perfect example of edutainment via technology.
The media clearly stands out and ranks as the biggest form influencing sexual patterns among the youth through entertainment. The media thus plays a crucial role in informing the youth and the public on reproductive health. A good current example is the sensitization of the youth on the advantages of male circumcision done through the media. In summary the media stand out as a strong force with great cognitive impact on influencing various inadequacies in society, sexual patterns among young people, politics, value perceptions, language, culture and information on reproductive health.
99Banda, T. K. (2010). Daily Nation, Buzz Magazine. Saturday, June 26, 2010.100This is competitive duel with a focus on denigrating one’s opponent for fun. It exists in many Kenyan communities’ youth leisure
and children play games (Wetaba, 2009).

344Youth Research Compendium
The concept of edutainment is wide spread within the entertainment industry in Kenya. Many organizations, multi-national companies, churches, local artistes and even government use this concept to reach out to the youth with the effort of enriching their livelihoods, values and lifestyles. The Permanent Presidential Music Commission, an arm of government under the Ministry of Culture and National Heritage, has been organizing annual youth camps where excelling talent from the Kenya Schools and Colleges Music Festivals are given an opportunity to de-velop their talent. This program engages various sectors including local artists like Eric Wainaina, Babra Guantai, Jamnazi, Sarakasi Dancers; trainers from the academia, music business personalities, Kenya Music Copyright So-ciety (MCSK) personnel and government policy makers. The program unfortunately only runs once a year for two weeks due to funding constraints. These kinds of programs if expanded would facilitate the education of youth and enlightening them of the operations of the entertainment industry and thus giving them insights on how they could excel in it. Some of the youth from these camps have made it to the newly started Talent Academy.
One of the challenges facing government currently when it comes to youth entertainment is the way the industry cuts across government ministries. For example: the Kenya National Music festivals are run by the Ministry of Education; the Cultural Music Festivals, the Kenya Cultural Centre that also manages the Kenya National The-atre and the Permanent Presidential Music Commission are under the Ministry of Culture and National Heritage; youth related policies and affairs are under the Ministry of Youth and Sports. Therefore, there is need to re-structure, consolidate, streamline and or centralize these departments for effective planning and policy enactment.
Driving Forces and their Futures ImplicationsTelevision EntertainmentThe high numbers of registered television channels are likely to positively influence the future of television enter-tainment, courtesy of the liberalization of the industry.
Table 79: Registered Television Channels
Unit 2003 2004 2005 2006 2007
Television Frequencies
No. 137 148 244 348 368
Source: Nyariki et al., 2009
This competition is evident today and bound to escalate to greater heights all for the better of the entertainment industry. Local channels have lately invested big time in the reality television which has dominated broadcast programming. Examples of recent local corporate sponsored reality shows include “Tusker Project Fame”, “Pop Idols”, “The Presenter”, “Can You Dance”, “Sakata” and “Pilsner Mfalme”. These increased investments in lo-cal productions have led to an economic boom within the industry. This boom is bound for further growth as the cable and satellite television compete for market share, and the expected telecommunication companies entry into the television market via TV over IP (television over online internet protocol address). The TV over IP concept is likely to lead to television companies, cable companies and web sites converging. Television viewership in Kenya is headed towards high-definition (HDTV) and blu-ray DVDs which are expected to revolutionize television en-tertainment. In the year 2010, the Multi-Choice company that runs the digital television DStv launched a mobile phone that has satellite television initially targeting the 2010 World Cup football tournament in South Africa. This has marked yet another technological advancement into entertainment that provides easier access to the digital television that is today popular mainly in public entertainment spots in line with the TAM theory.The statistics below indicate the popularity of stations that have higher local content and local productions on air among the youth aged 15 – 35.
Figure67:Televisionconsumptionamong15-35byTVChannelPreference

345Institute of Economic Affairs
Source: Telmar
Apart from the liberalization of the airwaves in the 1990s, the other driving force in the growth of local television
productions is the government policy that demands 30% of the programming to be local content. The initial target was to get it to 60% as is the case with South Africa and thus the reason behind South Africa’s success. The media companies initially complained of lack of local content but their ability to sponsor in-house productions can now be challenged towards the 60% target. This will greatly promote Kenyan content and also provide greater op-portunities towards the creation of jobs for the youth, consequently raising our GDP and will reduce expenditure in the importation of foreign content. The future of the television entertainment is headed towards production of quality local television programmes. This consequently calls for support towards theatre development which is currently feeding the television entertainment with the necessary talent. This also calls for creation or expansion and modernization of training institutions in theatrical arts, film production and mass media so as to equip the sector with professional staff.
There are of course futuristic problems that will result from young people watching too much television that must be anticipated. More often than not they would be exposed to intense violence or censorship that is not always there on every program. Too much television may also lead to laziness, weight gain and may need replacement with sports and clubs to avoid physiological and psychological effects. Currently, there are a number of activities that turn television watching into a game, an exercise or to chores. Other future effects will be seen with the grow-ing number of television stations that is likely to pose challenges to the government when it comes to enforcement of government policies, monitoring and censorship. There is also a possible boom in the stations that are enter-tainment based than those that offer news, sports and other services.
Radio EntertainmentThe radio industry today has been propelled by the availability of small pocket FM receivers, mobile handsets with FM receivers and affordability of the FM receivers thus allowing the youth to tune in to their favourite radio stations even when on the move. Nyariki et al., (2009) indicates that the Communications Commission of Kenya (CCK) by the year 2007 had 127 registered radio frequencies in Kenya.

346Youth Research Compendium
Table 80: Registered Radio Frequencies
Unit 2003 2004 2005 2006 2007
Radio Frequencies
No. 60 77 89 123 127
Source: Nyariki et al., 2009
The high numbers of registered radio channels are likely to positively influence the future of radio entertainment. Currently there are probably more radio stations than the media schools can produce presenters for. This could somehow explain the reason why most media houses are turning to the music and theatre industries for personali-ties that they could employ as radio presenters. These personalities also tend to be young and therefore enjoy the liking of their fellow young people. Many of these radio stations like the Homeboyz radio station are owned by young people. Others like the Kenyatta University radio station are run by university students and mainly only target the youth too. The statistics below give an indicator of youth radio consumption countrywide.
Figure 68: Radio consumption among 15-35 by Channel PreferenceSource: Telmar
Though satellite radio is a growing phenomenon, it is not as common in Kenya. For example, DStv, one of the leading satellite television providers in the country offers a good portion of the radio channels as part of the tele-vision package. Kenyans can thus be said to be very keen on their local radio channels though most of the youth expect a wider variety of songs aired with more local content than currently witnessed. What is expected to grow is the era of radio via IP that will mark the beginning of digital radio in Kenya. This may encourage more listenership especially at work stations via the computer. This system may also make it easier for the music organization bodies to effectively update their records, especially the Music Copyright Society of Kenya (MCSK), the body charged with collecting royalties for the musicians, since it will easily provide data on songs aired. The system may assist in the enforcement of policies stipulating the required percentage of local content to be aired by the radio stations.

347Institute of Economic Affairs
Countries with successful entertainment industries like South Africa have policies governing the percentage of lo-cal content to be aired slated at 60%. Kenya is currently striving with a similar policy but only slated at 20% for radio. An increase of this percentage may translate into the creation of employment among the youth since the media will constantly need new music to spice up their programming.
With the current rise of radio stations, the future is bound to engage more competition and more radio stations which in turn are bound to put pressure on more local music production. The study proposes: (i) the enactment of the minimum of 60% local content policy on air play; (ii) the enforcement of all radio channels to pay their royalties to MCSK; (iii) investment to empower and equip the MCSK with technology and labour-force that can effectively monitor the air content play versus the sums collected.
Though the boom of radio stations may have positive economic impact, the future poses challenges in policy en-forcement that has in the past led to negative propaganda. On the other hand radio provides a listening culture to the youth. The future scenario here is likely to lead towards a more anti-social culture among the youth, with most of them only keen to listen to their favourite music and radio stations using ear plugs and consequently blocking the rest of the world around them and leading to individualism.
The future scenario here is likely to lead towards a more anti-social culture among the youth, with most of them only keen to listen to their favourite music and radio stations using ear plugs and consequently blocking the rest of the world around them and leading to individualism.
Recording IndustryTechnological innovations have also seen the development of media from pocket radios to walk-man, disc-man, Mp3 players, IPods (digital music players) and now I Pads to name but a few. These innovations have also im-parted on the recording industry which initially began with cutting records and has developed into production of both digital sound and visual recordings. Today’s musicians have to produce both the audio recording in CD form and a Video recording of the same to cater for the audio-visual mediums and the mass media industries. These technological advancements in the recording industry are bound to improve the quality of Kenyan recorded music and also due to the various options available for setting up studios; they could offer employment to a good population of the youth.
With the rapid growth being experienced within the radio and television sectors, the study projects an increased demand on local music production which could translate to a boom in the recording industry. To curb piracy and more so the issue of royalties payable by the television and radio sectors, the study proposes that, all recordings must be copyrighted or registered by MCSK or any other authorized body before being aired by media agencies. This will ensure that all musicians, artists and producers collect their due royalties. The study also proposes capital support from the government towards youth producers to assist them establish professional recording studios. The future scenario here will be a booming industry that the government is likely to have no control of and thus billions will continue to be lost through exploitation, counterfeit and piracy.
Music IndustryThe evolution of the music industry has seen the youth influence media houses and entertainment spots into play-ing more local music than has been witnessed in the past. This has been made possible by the increasing number of computer-based recording studios that have made music production more affordable. The increase in local record-ings combined with the increase in radio stations has also boosted the industry in terms of growth and productiv-ity. The youth today are also driving towards live performances of music and this is witnessed by the high concert attendance of live performances be the local or foreign artistes. Issues of piracy, proper environment created by effective policy-making and implementation still daunt the industry to-date. The failure to recognize and support the youth who are significant drivers of the industry is also an impediment to the industry.
The music industry is one sector that has a promising future and one that is also plagued with various bottlenecks

348Youth Research Compendium
including piracy and the government’s failure to crack it down. This also means a lot of revenue is lost in this il-legal trade. This problem demands proper policy formulation and execution of its operation. This study proposes that piracy be fought by way of engaging the pirates officially so that they can be involved in legal and controlled distribution of the music. This can be achieved by tax exemptions which will ensure that the cost of producing and distributing music for the musicians and the pirates is essentially the same thus, giving the pirated product no advantage at all. This approach has been used in Nigeria and recorded great success. This idea of using the pirates in legitimate business also ensures that their source of livelihood is enhanced but in a legal manner. The government should find means of facilitating financial support to help the youth record their music, market and distribute it professionally and also offer opportunities for their training in contract signing and music business. Tax exemption on musical instruments and studio equipment is bound to complement that on computers in shap-ing and developing the entertainment industry. Lastly, the study proposes the formulation of official artiste bodies that would represent the youth and negotiate for them within the entertainment industry. The music industry in Kenya is headed towards a future where the youth now appreciate music by local Kenyan youth. This is bound to make it a self-sufficient industry and provide easy market for the local music products.
Fashion EntertainmentThe Hip-Hop culture has been instrumental in the development of fashion and the fashioning of artists. This youthful trend has given rise to leading fashion houses that have risen to become international production lines including Clad Nine and Nairobi wear, both brands established by childhood friends who grew up in Nairobi101. Another youth clothing line is Jamhuri Wear which is now based in New York and worn by the likes of Akon and American Rapper Jay-Z102, and was founded by a young Kenyan born and raised designer Jeffrey Kimathi103. MAU MAU University Clothing Co. founded by hip hop entrepreneur Kevin Ombija is yet another flourishing youth fashion house, whose t-shirts have developed a cult following in Kenya and with Kenyans abroad. Other notable Kenyan hip hop fashion brands include Fundi Frank, Stitch Styles and Ruff Wear. The success of all these youth in the fashion sector as local and international youth designers, who have been dressing many youths in-cluding Kenyan and international artists for several years now, clearly indicates the potential of the fashion sector. Ruffwear International as a clothing line is run by gospel artist Rufftone, and particularly targets gospel artists. This sector, if supported by government, could possibly revive the once thriving textile industry in Kenya alongside artworks on cars owned by the youth and that on Matatu which have created another automobile fashion sector. Recently, the trends in this automobile fashion have been heavily influenced by emanating local young stars. This brings out the youth as significant drivers and consumers of their own products and casts attention to the driving forces youth culture such as Hip-Hop culture have in the entertainment industry.
Theatre SceneThe contributions of various theatre groups including Phoenix players, the Mbalamwezi players, Heartstrings Kenya, Sterling Quality Entertainment and vernacular theatre groups have gone a long way in keeping the sector alive. Today, large youthful crowds gather in various entertainment spots for the live stand-up comedy shows and skits by their favourite artistes. This has made live recording of these comedy shows to be crowd pullers country-wide. Apparently, this interaction of the theatre and media has provided stable and sustainable employment to the youth while opening up wide career horizons for the entertainment industry. There is need to promote and protect the theatre scene in the country due to its potential and nurturing nature of great talent. These theatre houses could act as training centers as well if well-equipped and funded. This way, the country can bridge between such backgrounds as the Kenya National Schools Drama Festivals and the industry. Currently, the main driving force of the theatre scene is television, film, radio and commercials.
Film IndustryInsight into the film industry in Kenya brings to foreground the driving forces which include our country’s re-nowned fame as a location for shooting film, the potential and talent in local productions, and, a ready consumer
101 http://en.wikipedia.org/wiki/Kenyan_hip_hop102 Mwaniki (2009b)103Kelley (2009)
349Institute of Economic Affairs
market. Guiding youthful talents into this unexploited industry through film education, funding, tax relief and subsidies on film equipment, among others could possibly steer future growth in the industry.
SummaryThese developments over time have impacted on the youth in Kenya in several ways. Considering the youth are not only the highest consumers but also significant drivers of these developments and changes. The new innovations mainly target the youth as the ready market and also depend on the youth in a large way for their implementa-tion. This is evident in the youth-driven programming evident in the film, radio and television sectors. The youth in Kenya and especially those from urban areas tend to quickly adapt to the technological innovations. They are brisk to discard old technology, practices and fashion in order to adapt into what they consider au courant at any given time. Mostly, these changes are influenced by engagements with the social systems such as mass media, peer influences, socio-economic, socio-technical, globalization, antiquated trends versus au fait, among others. Several of the Kenyan youth with the exception of those from marginalized areas are au fait with the global trends in en-tertainment. Though, due to the socio-economic disparities and marginalization, scores of Kenyan youth remain aware but unable to practice these global trends. As a result, in some cases, they emulate these trends and end up creating their own local versions of these trends. A good example of some of these trends emulated by the youth in Kenya is the recent production of local soap operas as an emulation of foreign soap operas screened on local television channels leading to new local markets in television entertainment.
The future scenario in the entertainment industry in Kenya is mainly headed towards mergers of industries that were once considered autonomous. These mergers are bound to narrow down the lines between various sectors such as publishing, entertainment and telecommunication. Advancements of technology has it now that one can watch their television channels via mobile phone, one can read newspaper articles via mobile phone or computer without actually buying a television set or the newspaper. The merging scenario is being witnessed between the some sectors in the entertainment industry in Kenya including mobile service providers and television service pro-viders. These technological advancement mergers may see the youth access more facilities with fewer gadgets as significant drivers, players and consumers in the industry. Technology is therefore bound to be a continuous chal-lenge for the industry offering easier to use facilities while posing other scenarios and challenges ahead. Another possibility is that of entertainment through edutainment substituting classroom learning in many sectors through many avenues including computer games and software.
Technological advancements have also made the setting up of television and radio stations easier and affordable than before. This has seen the radio and television stations increase in number necessitating the increase of me-dia training colleges. Even this has not exactly solved the problem that has resulted in the television and radio industries employing young musicians and thespians as presenters. This increase in stations has also led in more employment opportunities, increase in local content being featured in the television and radio sectors as the young musician and thespian presenters target the same audiences. This scenario points towards more employment op-portunities and high demand in local content in the television, radio and film industries, while at the same time posing physiological and psychological challenges like weight gain, laziness, violence, sexual patterns, social be-haviour and therapeutic effects.
This paper highlights the lack of policies that could govern and lead to a better entertainment industry. The paper gives the Nashville Experience as a model of a music industry that turned around a poor locality to billions of dollars a year in income. According to Schultz and Gelder (2008), the three ingredients that led to the emergence of the music industry in Nashville were: (i) Strong and unique cultural traditions; (ii) A strong and stable legal institutional environment, which offered protection to property rights, including copyright; (iii) Conditions which provided the prospect of financial return for the investments of forward-thinking entrepreneurs. Therefore, in or-der to ensure strong and credible institutions that support the development of the local entertainment industry, we recommend that the Government of Kenya: (i) Enact, implement and enforce effective copyright laws; (ii) Reduce intervention in royalty collection; (iii) Reduce taxes and regulatory burdens in the entertainment industry.

350Youth Research Compendium
The proposed fundamental areas drawn from the findings of the study supported by the projections for interven-tion in Vision 2030 for policy mitigation are highlighted in text box 7.
Text box 7: Proposed fundamental areas drawn from the findings of the study supported by the projections for intervention in the Vision 2030 for policy mitigation
• The governing of television and radio industries by a 60% local content policy that should be enacted and enforced
• Formulation of official artiste bodies that would represent the youth in various fields and negotiate for them within and outside the entertainment industry.
• Support towards theatre, music and other visual and performing arts development which are currently feeding the television, film, radio, and advertising, among other entertainment sectors with the necessary talents. This support could be in several ways including the building of professional academies of visual and performing arts country wide
• Create opportunities for the training of youth in contract signing and music business. This can be facili-tated by their official artiste representative bodies and professionals in liaison with the government
• The government needs to bridge between backgrounds such as the Kenya National Schools Drama Festi-vals, the Kenya National Schools and Colleges Music Festivals and the industries in ways including clear channels for identifying and developing young talent
• Enforcement of laws requiring all radio and television channels and other industry-players to pay their royalties to MCSK.
• Investment to empower and equip the MCSK with technology and labour-force that can effectively moni-tor the air content play versus the royalties collected.
• All recordings and artistic productions must be copyrighted or registered by MCSK or any other autho-rised body before being aired by media agencies. This will ensure that all musicians, artists and producers collect their due royalties.
Policies needed:
• To promote and protect the theatre scene in the country due to its potential and nurturing nature of great talent. These policies should address various fields including government funding, talent development, exchange programmes and career development.
• To improve management of the Kenya Cultural Centre and the Kenya National Theatre
• To construct, equip and fund performing houses and recording studios enabling them to act as training centers as well.
• To support the dance and choreography sector
Conclusion The results presented in this study from sections of the entertainment industry, for example, the estimated 40 bil-lion film industry, the estimated 30 billion music industry, and, the contribution of the copyright-based industries to the national economy are indicators of the potential the entertainment industry holds. The copyright-based industries as a sector of the entertainment industry in the year 2007 made a contribution of 5.3% to the total value-added, about 3.8% to the national gross output, and 3.3% to the total national workforce signifying the importance of the entertainment industry to Kenya’s economy. Yet these figures were less the estimates made from film and music industries among others, and the estimated right holders’ loss of 30 billion shillings per annum to trade counterfeit and piracy products and 6 billion per annum lost revenue collection that could propel the GDP contribution from the industry even higher.
Although the entertainment industry in Kenya contributes significantly to the national economy, with the copy-right-based sector alone, excluding the other sectors of entertainment, as quoted above contributing 5.3% of the

351Institute of Economic Affairs
total value-added national gross output, the industry faces a number of challenges that require attention. The value of this sector and the youth who are significant drivers, players and consumers, require more recognition than what they are currently receiving from policy-makers. The youth-driven entertainment industry as an important tool of national development needs to be promoted and protected. The fast growth of the industry has resulted to haphazard operations within the industry and most of their contribution to national revenue is not captured by the government through taxes therefore, implying that the industry’s contribution to the GDP is underestimated. The government can address this loss of revenue and other problems facing the youth and entertainment through the application of the Stewardship theory. This theory proposes the need for collective goals and decision-making between the government and the youth with the success and accomplishment of the entertainment industry as the incentive towards goal alignment.
There is need to conduct a major study that indicates the contribution of the entire entertainment industry to the national economy. This should be preceded by other regular studies to monitor the performance of the entertain-ment industry as a way of keeping track of the activities and contribution to the national economy due to the in-dustries fast growth rate. Piracy is yet another unreported contribution to the national economy and its stemming down will in return reflect a higher contribution to both the national economy and to the youth-drivers as well. There is need for the development of adequate policies that will enable the government to capture the contribution of this industry and deepen the recognition of its importance especially in addressing the youth needs. Existing policies should be strengthened and enforced. A proactive approach based on the Stewardship theory is necessary to promote and engage a purely youth-driven industry.
There is dire need for local capital investments in the industry. The government should directly intervene in the industry and indirectly by encouraging financial institutions to invest in the industry and provide access to funding that is currently limited due to the view of the industry as an informal sector. There is also need for training pro-grammes and career development opportunities to enable the youth run their businesses effectively. These training programmes will facilitate professionalism and provide skills in packaging, marketing, advertising, production and distribution of entertainment packages. The need to encourage Kenyan youth to pay low-level taxes that could go straight into entertainment and consequently steer the industry from the current unmonitored status is of great importance too. The study therefore, highlights entertainment in Kenya as a lucrative industry that contributes immensely in multiple ways towards the country’s economy and also underlines the youth as significant drivers of the entertainment industry as well as major consumers.
Text box 8: Proposed Interventions for the industry
• This study proposes that piracy be fought by way of engaging the pirates officially so that they can be in-volved in legal and controlled distribution of the music, film, and other copyrighted productions. This can be achieved by tax exemptions which will ensure that the cost of producing and distributing for the ar-tistes and the pirates is essentially the same thus giving the pirated product no economic advantage at all.
The government should facilitate:
1. Local capital support towards youth producers to assist them establish professional recording studios.
2. Local financial support to help the youth record their music, market and distribute it professionally.
3. Tax exemption on musical instruments and studio equipment to complement that on computers in shap-ing and developing the entertainment industry. This would lead towards quality productions and quality sound.
4. Public awareness and training on the effects of piracy alongside training on how to identify pirated goods.
5. The establishment of a department of Youth and Entertainment in the Ministry of Youth and Sports, through re-structuring, consolidating, streamlining and or centralizing all the departments on youth and entertainment found in Ministry of Education, Ministry of Culture and National Heritage and Ministry of Youth and Sports for effective planning and policy enactment.

352Youth Research Compendium
References
Adejunmobi, M. (2002). English and the Audience of an African Popular Culture: The Case of Nigerian Video Film. Cultural Critique, No. 50, (74-103). University of Minnesota Press. Retrieved on February 16, 2010 from: http://www.jstor.org/stable/1354689
Adesanya, A. (2000). From Film to Video. In: Haynes, J. (ed) In Nigerian Video Films, (37-50). Athens: Ohio University Press.
African Union (AU), (2006). The African Youth Charter. Addis Ababa: African Union.
Agawu, K. (2003). Representing African Music: Postcolonial Notes, Queries and Positions. New York: Routledge
Amin, S, (1997). Capitalism in the age of globalization. Cape Town: IPSR.
Balseiro, I. (2002). Africa and the Centenary of Cinema. Review of Symbolic narratives/African film: audiences, theory and the moving image. H-S Africa, H-Net Reviews. Retrieved on April 23, 2010 from http://www.h-net.msu.edu/reviews/showrev.php?id=6754
Barber, K. (1982). Popular Reactions to the Petro-Naira. Journal of Modern African Studies, Vol. 20, No. 3, (431-50).
Bebey, F. (1975). African Music: A people’s Art. New York: Lawrence Hill.
Bender, W. (2004). “Modern African Music – an Autonomous Music.” In Stig-Magnus Thorsen (ed), Sounds of Change: Social and Political Features of Music in Africa. Stockholm: Sidastudies, pp 87-106.
. (1991). Sweet Mother: Modern African Music. Chicago: University of Chicago Press.
Bijker, W. E. Hughes T. P. & Pinch T. (eds) (1989). The Social Construction of Technological Systems: New Directions in Sociology and History of Technology. Cambridge: MIT Press.
Brubaker, R. & Cooper, F. (2000). “Beyond Identity.” In Theory and Society. Vol. 29, pp 1-47.
Burgess, T. (2005). “Introduction to Youth and Citizenship in East Africa.” In Africa Today. Vol. 51 No. 3, pp vii-xxiv
Cerulo, K. A. (1997). “Identity Construction: New Issues, New Directions.” In Annual Review of Sociology. Vol. 23, pp. 385-409.
Chau, A. Y. (2006). Drinking Games, Karaoke Songs, and “Yangge” Dances: Youth Cultural Production in Rural China. Ethnology, Vol. 45, No. 2, (161-172). University of Pittsburgh Retrieved on 29/03/2010 from http://www.jstor.org/stable/4617572
Comaroff, J. & Comaroff J. (2005). Reflections on youth: from the past to the post colony. In: Honwana, A. & Boeck, F. (eds) Makers and breakers: children and youth in postcolonial Africa. Oxford: James Currey.
Davis, F. (1989). “Perceived Usefulness, Perceived Ease of Use, and User Acceptance of Information Technology.” MIS Quarterly. pp. 319-340.
Davis, J. H. Donaldson, L. and Schoorman, F. D. (1997a). Toward a stewardship theory of management. Academy of Management Review, No. 22, (20–47). Retrieved on May 10, 2010 from: http://jpart.oxfordjournals.org
________. (1997b). The distinctiveness of agency theory and stewardship theory. Academy of Management Review, No. 22, (611–3). Retrieved on May 10, 2010 from: http://jpart.oxfordjournals.org
Diouf, M. (2005). “Afterword.” In Alcinda Honwana and Filip De Boeck (eds), Makers and Breakers: Children and Youth in Postcolonial Africa. Oxford: James Currey, pp. 229-234.
Ducheneaut, N. & Moore, R. J. (2003). Gaining more than experience points: Learning social behavior in multiplayer computer games. Palo Alto: PARC.

353Institute of Economic Affairs
Edwards, J. R. (2008). Building a Self-sustaining, Indigenous Film Industry in Kenya. A study on behalf of the World Story Organization. Retrieved on April 23, 2010 from http://www.kenyafilmcommission.com
Edwards, P. (1995). From Impact to Social Process: Computers in Society and Culture. In: Sheila J. Gerald E. M. James C. P. & Pinch, T. (eds) Handbook of Science and Technology Studies, (257-285). Thousand Oaks: Sage.
Ejiro, Z. (1998). We Are the Leaders. Nigerian Videos, Vol. 4, No. 3, (18-19).
Federal Republic of Nigeria, (2001). National Youth Policy and Strategic Plan of Action. Abuja. Retrieved on March 23, 2010 from: www.youth-policy.com/policies/Nigeria %20National%20Youth%20Policy%20&%20Plan%20of%20
Fikentscher, K. (2000). “You Better Work!”: Underground Dance Music in New York. Middletown: Wesleyan University Press.
Frith, S. (1981). Sound Effects: Youth, Leisure and the Politics of Rock ‘n’ Roll. New York: Pantheon Books.
Geertz, C. (2001). “Thick description: Towards an Interpretative Theory of Culture.” In Michael Martin, Lee C. M. (Eds), Readings in the Philosophy of Social Science. Cambridge: MIT Press, pp. 213-232.
. (1973). The Interpretation of Cultures. New York: Basic Books.
Githagui, M. (2005). “Music: Rewarding Achievers in the Music Industry.” In Pulse. 3rd July, p. 3.
Goines, L. (1972). “Musics of Africa South of the Sahara.” In Music Educators Journal. Vol. 59 No. 2, pp 46-51.
Government of Pakistan, (2007). Ministry of Youth affairs. National Youth Policy. Islamabad. Retrieved on March 23, 2010 from: www.pakistan.gov.pk/divisions/ContentInfo.jsp?DivID=47
Government of Sierra Leone, (2003). Ministry of Youth and Sports. Sierra Leone National Youth Policy. Retrieved on March 23, 2010 from: www.daco-sl.org/encyclopedia/4.../4.../National_Youth_Policy.pdf
Greeno, J. (1996). The Situativity of Knowing, Learning and Research. American Psychologist, Vol. 1, No. 53, (5-26).
Hager, S. (1984). Hip Hop: The Illustrated History of Break Dancing, Rap Music, and Graffiti. New York: St. Martin’s Press.
Harrev, F. (1991). Jambo Records and the Promotion of Popular Music in East Africa. Perspectives on African Music, No. 9, (103 – 138). Bayreuth African Services.
Hartung, P. J. (2002). Development through work and play. Journal of Vocational Behavior, Vol. 61, pp. 424-438.
Haynes, J. & Onookome, O. Evolving Popular Media: Nigerian Video Films. In: Haynes, J. (ed) In Nigerian Video Films, (51-88). Athens: Ohio University Press.
Hess, M. (2007). Is Hip-Hop Dead?: The Past, Present and Future of America’s most Wanted Music. Waterport: Praeger Publishers.
Honwana, A. and Filip, De Boeck (eds). (2005). Makers and Breakers: Children and Youth in Postcolonial Africa. Oxford: James Currey.
James, Allison, Jenks, C. & Prout, A. (1998) . Theorizing Childhood. New York: Teachers College Press.
Kelley, K. J. (2009). Kenyan Designer Turns Heads in Harlem. Daily Nation Newspapers, Lifestyle Magazine, Friday, February 21. Retrieved from http://www.nation.co.ke/magazines/lifestyle/-/1214/533158/-/8vovwhz/-/index.html on 30/08/2010.
Kenya Film Commission, (2010). http://www.kenyafilmcommission.com/Home/
Kenya National Bureau of Statistics, (2009). Kenya Facts and Figures 2009. Retrieved on February 23, 2010 from: www.knbs.go.ke
354Youth Research Compendium
Kidula, J. N. (1998). Sing and Shine: Religious Popular Music in Kenya. Unpublished PhD Thesis: University of California
Kidula, J. N. (2000). Polishing the Lustre of the Stars: Music Professionalism Made Workable in Kenya. Ethnomusicology, Vol. 44, No. 3, (408-428). University of Illinois Press. Retrieved on February 16, 2010 from http://www.jstor.org/stable/852492
Kidula, J. N. (2005). “The Local and Global in Kenyan Rap and Hip-Hop Culture.” A paper read at the College Languages Association Meeting in 2005 under the title “The Impact of Hip-Hop and Rap on Local and Global Identity and Media Production in Kenya.” College Language Association Convention, UGA, Athens, GA April 6-9.
Kihang’ah, N. (2008). Lights, camera, action!. Daily Nation Newspaper, Friday, July 18; (1-3).
__________. (2008). Location Kenya yet to be on a roll. Daily Nation Newspaper, Friday, August 22. Retrieved on April 23, 2010 from http://www.nation.co.ke/magazines/weekend/-/1220/461582/-/wb1se3z/-/index.html
Kumbe, S. & Njung’e, C. (2009). Youth Spending Sh197bn a Year. Daily Nation Newspaper, Friday, January 30.
Lave, J. & Wenger, E. (1991). Situated Learning: Legitimate Peripheral Participation. New York: Cambridge University Press.
Longhurst, B., et al. (2008). Introducing Cultural Studies. Harlow: Pearson Education Limited.
Lukalo, K. F. (2006). Extended Handshake or Wrestling Match?: Youth and Urban Culture Celebrating Politics in Kenya. Discussion Paper 32. Uppsala: Nordiska Afrikainstitutet.
Makeni, J. (2009). Street dancing now becoming popular among youth in the city. Daily Nation Newspaper, Saturday, August 22; (28).
Merriam, A. P. (1964). The Anthropology of Music. Evanston: Northwestern University Press.
Mugambi, N. M. (2001). “Rap Music Made in Kenya: How Kenyan is it?” M.A. Project, Kenyatta University, Nairobi.
Mungai, Mbugua wa. (2007). “‘Kaa Masaa, Grapple with Spiders’: The Myriad Threads of Nairobi Matatu Discourse.” In James Ogude and Joyce Nyairo (eds), Urban Legends, Colonial Myths: Popular Culture and Literature in East Africa. Trenton: Africa World Press Inc.
. (2004). “Identity Politics in Nairobi Matatu Folklore.” PhD Dissertation. Hebrew University, Jerusalem.
Mungai, Mbugua wa, Samper, D. A. (2006). “‘No Mercy, No Remorse:’ Personal Experience Narratives about Public Passenger Transportation in Nairobi, Kenya.” In Africa Today. Vol. 52 No. 3, pp 51-81.
Mutunga, K. (2009). The Big Theatrical Turnaround. Daily Nation Newspaper, Sunday, December 27.
Mwangola M. S. (2008). Njia Panda: Kenyan Theatre in Search of Identity. In: Njogu, K. (ed) Getting Heard: [Re]claiming Performance Space in Kenya, (1-24). Nairobi: Twaweza Publications.
Mwaniki, P. (2009). Gospel with Attitude. Daily Nation Newspaper, Saturday, February 21.
. (2009b). Jamhuri Wear: Star Label. Daily Nation Newspaper, Lifestyle Magazine, Firday, October 30. Retrieved from http://www.nation.co.ke/magazines/buzz/-/441236/679522/-/h9h3o7z/-/index.html on 30/08/2010.
National Democratic Party (2003). National Youth Policy - Egypt. Retrieved on April 5, 2010 from: http://www.ndp.org.eg/en/Policies/NationalYouthPolicy.aspx#3.
Nketia, K. J. H. (1974). The Music of Africa. New York: W.W. Norton and Company.Nyairo, J. W. and Ogude, J. (2005). “Popular Music, Popular Politics: Unbwogable and the Idioms of Freedom in
Kenyan Popular Music.” In African Affairs. Vol. 104 No. 415, pp 225-249.
355Institute of Economic Affairs
Nyariki, D. Et al. (2009). The Economic Contribution of Copyright-Based Industries in Kenya. Nairobi: The World Intellectual Property Organization & Kenya Copyright Board.
Nzewi, M. (2003). “Acquiring Knowledge of Musical Arts in Traditional Society.” In Anri Herbst, Meki Nzewi, Kofi Agawu (eds), Musical Arts in Africa. Pretoria: Unisa Press, pp 13-37.
Okumu, C. C. (1998). The development of Kenyan Popular Guitar Music: A Study of Kiswahili Songs in Nairobi. Unpublished M.A. Thesis, Kenyatta University.
Odhiambo, T. (2008). A Provisional Commentary on Current Popular Print Media for Youth Readers in Kenya. Retrieved on February 24, 2010 from: www.strathmore.edu/rso/research-week/2008/.../paper-todhiambo.doc
Ogechi, N. O. (2005). “On Lexicalization in Sheng.” In Nordic Journal of African Studies. Vol. 14 No. 3, pp.334-355
Oladipo, T. (2007). Kenya’s Kibera Kid Savors Stardom. BBC.com. Retrieved on April 23, 2010 from http://news.bbc.co.uk/2/hi/africa/6935607.stm
Ondieki, D. O. (2010a). The Development of the Popular Music and the Recording Industry in Kenya. A commissioned paper presented on April 13, 2010 during the 6th National Symposium on Kenyan Music organized by the Permanent Presidential Music Commission held at Government Training Institute. Mombasa: Kenya.
Ondieki, D. O. (2010b). The Analysis of Zilizopendwa for the Development of Instructional Materials for Music Education. Unpublished PhD Thesis, Kenyatta University.
Rauterberg, M. (2004). Positive Effects of Entertainment Technology on Human Behaviour In: Rene Jacquart (Ed.) Building the Information Society. Netherlands: Kluwer Academic Press, pp. 51-58. Retrieved on August 30, 2010 from citeseerx.ist.psu.edu/viewdoc/download?doi=10.1.1.108.5480
Republic of Kenya, (2007). Kenya Vision 2030. A Globally Competitive and Prosperous Kenya. Final Draft retrieved from the Permanent Presidential Music Commission, Ministry of National Heritage and Culture on April 8, 2010.
Republic of Kenya, (2006). Ministry of Youth affairs. Kenya National Youth Policy. Retrieved on March 23, 2010 from: www.youthaffairs.go.ke
Republic of Kenya, (2002). Ministry of Home Affairs, Heritage and Sports. Kenya National Youth Policy. Retrieved on March 23, 2010 from: www.youthpolicy.com/.../Kenya%20National%20Youth%20Policy.pdf
Republic of South Africa, (2009). National Youth Commission. The National Youth Policy 2009 – 2014. Retrieved on March 23, 2010 from: http://www.polity.org.za/polity/govdocs/policy/intro.html
Republic of South Africa, (2006). National Youth Commission. Integrated Youth Development Strategy for South Africa (IYDS): final draft. Pretoria: NYC.
Republic of South Africa, (2002). National Youth Commission. National Youth Development Policy Framework (NYDPF) 2002 – 2007. Pretoria: The Presidency of South Africa.
Republic of South Africa, (2000). National Youth Commission. National Youth Policy. Retrieved on March 23, 2010 from: http://www.polity.org.za/polity/govdocs/policy/intro.html
Republic of South Africa, (1997). Department of Welfare. White Paper for Social Welfare. Retrieved on March 23, 2010 from: http://www.welfare.gov.za/Documents/ 1997/wp.htm.
Republic of Zambia, (1994). Department of Youth Development. National Youth Policy. Retrieved on March 23, 2010 from: www.youth-policy.com/.../Zambia%20National%20Youth%20Policy.pdf
Roger, Y. J. Et al. (1998). Advances in Information Technologies: The Business Challenge. (eds) IOS Press. Retrieved on February 3, 2010 from http://books.google.com/books

356Youth Research Compendium
Rose, T. (1994). Black Noise: Rap Music and Black Culture in Contemporary America. Hanover, NH: Wesleyan University Press, University Press of New England.
Rule, S. (1987). “Indigenous Benga Musicians Struggle to be Heard over Western Pop.” In The New York Times. August 16.
Samper, D. A. (2004). “‘Africa is Still Our Mama’: Kenyan Rappers, Youth Identity, and the Revitalisation of Traditional Values.” In African Identities. Vol. 2 No. 1, pp 37-51
Saracho, O. N. & Spodek, B. (1998). A play foundation for family literacy. International Journal of Educational Research, Vol. 29, pp. 41-50.
Schechner, R. (1988). Performance Theory. London and New York: Routledge.
Schultz, M. & Gelder, A. (2008). Nashville in Africa: Institutions, Entrepreneurship and Development. London: International Policy Press. Retrieved on August 25, 2011 from www.policynetwork.net/sites/default/files/ 0811 _IP_Nashville_in_Africa.pdf
Stets, Jan E. & Burke, P. J. (2000). “Identity Theory and Social Identity Theory.” In Social Pyschology Quarterly. Vol. 63, pp 224-237
Stone, R. (2008). “African Music in a Constellation of Arts.” In Ruth M. Stone (ed), The Garland Handbook of African Music. New York and London: Routledge, pp 7-12
Stryker, S. (1980). Symbolic Interactionism: A Social Structural Version. Menlo Park, CA: Benjamin Cummings.
Subrahmanyam, K., Kraut, R. E., Greenfield, P. M. & Gross, E. F. (2000). The impact of home computer use on children’s activities and development. Children and Computer Technology, Vol. 10, No. 2, pp. 123-144.
Toop, D. (2000). Rap Attack 3: African Rap to Global Hip Hop. London: Serpent’s Tail.
Tracy, H. (1961). “The Importance of African Music in the Present Day.” In African Affairs. Vol. 60 No. 239, pp 155-162
Turner, V. (1988). The Anthropology of performance. New York: PAJ Publications.
. (1982). From Ritual to Theatre: The Human Seriousness of Play. New York: PAJ Publications.
UNESCO, (2004). United Nations Educational Scientific and Cultural Organization. Empowering Youth Through National Policies. Retrieved on March 23, 2010 from: http://www.unesco.org/youth
Van Slyke, D. M. (2006). Agents or Stewards: Using Theory to Understand the Government-Nonprofit Social Service Contracting Relationship. Journal of Public Administration Research and Theory. Oxford University Press. Retrieved on May 10, 2010 from: http://jpart.oxfordjournals.org
Von Bertalanffy, L. (1972). “The History and Status of General Systems Theory.” In The Academy of Management Journal. Vol. 15 No. 4, General Systems Theory, pp. 407-426
. (1968). General System Theory: Foundations, Developments, Applications. Revised edition. New York: George Braziller.
Wako, A. (2007). Promoting Better Legislation and Enforcement of Intellectual Property Rights in Kenya. A Keynote Address by Honourable Amos Wako, Attorney General Of Kenya, during the Third Global Congress on Combating Counterfeiting and Piracy at the International Conference Centre in Geneva, Switzerland on January 30, 2007. Retrieved on August 22, 2011 from www.wipo.int/enforcement/en/global_congress/docs/amos_wako.doc
Wallis, R. and Malm, K. (1984). Big Sounds from Small Peoples: The Music Industry in Small Countries. London: Constable and Company.
Watson, R. (2008). Future Files: 5 Trends That Will Shape the Next 50 Years. Retrieved on February 3, 2010 from http://books.google.com/books

357Institute of Economic Affairs
Wetaba, A. N. R. (2009). Kenyan Hip-Hop as a site of Negotiating Urban Youth Identities in Nairobi. Gottingen: Sierke Verlag.
Wilson, D. (2006). CBC Reporting on Today’s Entertainment Trends. Retrieved on February 4, 2010 from http://www.maxxomedia.com/blog
Yan, Y. (1999). Rural Youth and Youth Culture in North China. Culture, Medicine, and Psychiatry. No. 23, (75-97).

358Youth Research Compendium