Youth poverty in Europe: what do we know?
63
YOUTH POVERTY IN EUROPE: WHAT DO WE KNOW? Arnstein Aassve, Maria Iacovou and Letizia Mencarini ISER Working Papers Number 2005-2
Transcript of Youth poverty in Europe: what do we know?

YOUTH POVERTY IN EUROPE: WHAT DO WE KNOW?
Arnstein Aassve, Maria Iacovou and Letizia Mencarini
ISER Working Papers Number 2005-2

Institute for Social and Economic Research The Institute for Social and Economic Research (ISER) specialises in the production and analysis of longitudinal data. ISER incorporates the following centres:
• ESRC Research Centre on Micro-social Change. Established in 1989 to identify, explain, model
and forecast social change in Britain at the individual and household level, the Centre specialises in research using longitudinal data.
• ESRC UK Longitudinal Centre. This national resource centre was established in October 1999 to
promote the use of longitudinal data and to develop a strategy for the future of large-scale longitudinal surveys. It was responsible for the British Household Panel Survey (BHPS) and for the ESRC’s interest in the National Child Development Study and the 1970 British Cohort Study
• European Centre for Analysis in the Social Sciences. ECASS is an interdisciplinary research
centre which hosts major research programmes and helps researchers from the EU gain access to longitudinal data and cross-national datasets from all over Europe.
The British Household Panel Survey is one of the main instruments for measuring social change in Britain. The BHPS comprises a nationally representative sample of around 5,500 households and over 10,000 individuals who are reinterviewed each year. The questionnaire includes a constant core of items accompanied by a variable component in order to provide for the collection of initial conditions data and to allow for the subsequent inclusion of emerging research and policy concerns. Among the main projects in ISER’s research programme are: the labour market and the division of domestic responsibilities; changes in families and households; modelling households’ labour force behaviour; wealth, well-being and socio-economic structure; resource distribution in the household; and modelling techniques and survey methodology. BHPS data provide the academic community, policymakers and private sector with a unique national resource and allow for comparative research with similar studies in Europe, the United States and Canada. BHPS data are available from the Data Archive at the University of Essex http://www.data-archive.ac.uk Further information about the BHPS and other longitudinal surveys can be obtained by telephoning +44 (0) 1206 873543. The support of both the Economic and Social Research Council (ESRC) and the University of Essex is gratefully acknowledged. The work reported in this paper is part of the scientific programme of the Institute for Social and Economic Research.
Acknowledgement: This paper forms part of the project “Poverty Among Youth: International Lessons for the UK”, funded by the Joseph Rowntree Foundation Grant no. 803554 under the Ladders Out Of Poverty programme. We would like to thank Chris Goulden of JRF, and Paul Gregg, Simon Burgess, Jackie Scott, Elaine Squires and Simon Lunn of the project advisory group, for comments on earlier versions of the paper. The ECHP data used in the analysis were produced and made available by Eurostat. All errors and inconsistencies in the paper are our own.
Readers wishing to cite this document are asked to use the following form of words:
Aassve, A., Iacovou, M. and Mencarini, L. (January 2005) ‘Youth Poverty in Europe: what do we know?’, Working Papers of the Institute for Social and Economic Research, paper 2005-2. Colchester: University of Essex.
For an on-line version of this working paper and others in the series, please visit the Institute’s website at: http://www.iser.essex.ac.uk/pubs/workpaps/
Institute for Social and Economic Research University of Essex Wivenhoe Park Colchester Essex CO4 3SQ UK Telephone: +44 (0) 1206 872957 Fax: +44 (0) 1206 873151 E-mail: [email protected] Website: http://www.iser.essex.ac.uk
January 2005 All rights reserved. No part of this publication may be reproduced, stored in a retrieval system or transmitted, in any form, or by any means, mechanical, photocopying, recording or otherwise, without the prior permission of the Communications Manager, Institute for Social and Economic Research.

ABSTRACT
This paper has two purposes: to review the literature on poverty among young people, and to
present descriptive statistics on the extent of youth poverty across Europe. We find that although
there is a well-developed literature on poverty among households in general, and on specific
subgroups such as children and older people, very little research has focused on poverty among
young adults. Using the European Community Household Panel (ECHP) we find that the extent of
youth poverty varies greatly across the European Union, being higher in Southern European
countries, as well as in the ‘liberal’ regimes of the UK and Ireland. This result is not unexpected,
since these are countries where underlying rates of poverty among the general population are
high. However, there are also large variations in the extent of youth poverty within countries,
between what we might term “younger youth” (aged 16-19) and “older youth” aged (25-29). In the
UK, poverty rates among “younger youth” are much higher than among “older youth”, suggesting
that poverty among young people is closely associated with child poverty. However, in the
Scandinavian countries, poverty peaks dramatically in the early twenties, indicating that in these
countries, poverty is associated with leaving home.

1
1) INTRODUCTION
This paper is concerned with poverty among youth: that is, poverty among those who
are no longer children, but who belong to an age group many of whose members have
not yet completed all the processes of transition to adulthood. We take an international
perspective, comparing 13 of the 15 states who were members of the EU before its
enlargement in 20031.
Because the transition to adulthood takes place at different ages in different countries,
the chronological age which we identify with the state of “youth” varies from country to
country, and thus, defining the groups of people we consider as “young” forms a non-
trivial part of the work of this paper.
Why look at youth? Seebohm Rowntree (1901) in his study of poverty in York,
observed that the incidence of poverty varied over the life cycle. Vulnerable stages were
childhood; the “family” years, when parents would have many mouths to feed but little
contribution to the family income from children; and old age. Less vulnerable stages
were “youth”, where a young person would be economically productive, but without
dependents; and the “empty nest” phase, when parents would still be economically
active, but their children would either be contributing to the family income, or have left
home.
However, there are reasons to believe that youth may no longer be such an
economically untroubled stage of the life-cycle as it once was. With increasing levels of
participation in higher education, young people are spending longer dependent on the
state or their families for financial support, and without earned incomes of their own.
Additionally, changes to youth labour markets over recent decades mean that when
young people do enter the labour market, they may spend considerable periods without
a job (Russell and O’Connell 2001), or in low-waged or insecure employment. Young
people are also vulnerable in other areas, being more likely than those in other age
groups to experience problems with housing (Rugg 1999), drug abuse (Boys, Marsden
1 Sweden and Luxembourg have been omitted from the analysis for considerations related to available data.

2
and Strang 2001), and mental health (Shucksmith and Spratt 2002). As becomes clear in
Section 3, a great deal of research exists about the multiple dimensions of vulnerability
facing young people. However, much less has been written about how the often
precarious situation of young people maps on to their economic situation, and the
degree of poverty experienced by young adults.
This lack of research on poverty among young people is particularly striking when
viewed against the rather large body of research on poverty among other age groups at
high risk – particularly children, among whom poverty, and the later effects of poverty,
have been comprehensively documented (Bradbury and Jantti 1999, Cantillon and Van
den Bosch 2002, and many others). Across Europe, families with children are found to
be at a substantially higher risk of poverty than other family types, though the relative
risk varies widely between countries.
The factors associated with child poverty are substantially the same in all countries.
Children nearly always live with one or both of their parents, and most children are too
young to be economically active. Thus, holding adult income in the household constant,
families with children have the same resources distributed among a greater number of
people, and are therefore more likely to be poor. Additionally, adult income in families
with children tends to vary with the number and ages of children. The more children a
mother has, the less in general are her incentives to go out to work; mothers of younger
children do less paid work than mothers of older children or women who are not
mothers.
The factors associated with poverty among young adults are more complicated. First,
young people’s incomes are more variable than those of children – both between
countries, and within countries. Young people may be in education; they may have a job
(low-waged or better-paid); they may be unemployed; they may be caring for children;
or they may be out of the labour market for other reasons. The proportions of young
people in each of these situations vary between countries, and the incomes associated
with each situation vary between countries and also within each country.

3
Second, young people’s living arrangements vary more than those of children – and
again, this variation is observed both within and between countries. Many young people
live with their family of origin; others have left home and live alone, or with a partner,
or with friends. Some have children of their own, with or without a partner. For young
people with low or no earnings, living with their parents may protect them against
poverty – although conversely, the extra burden their presence places on household
finances may throw the whole household into poverty. Young people whose own
earnings are relatively high may not be poor if they live apart from their families of
origin, and if they do live at home, they may act as a resource for their families of
origin, increasing household equivalent income to a level higher than it would otherwise
have been (Canto-Sanchez and Mercader-Prats 1999).
This paper attempts to shed light on how this complicated nexus of living arrangements,
economic status and income impacts on poverty for young people across Europe.
Most of the analysis in this paper is carried out at the single-country level, presenting
statistics separately for each country. However, for the purposes of discussion and
synthesis, it can be useful to think in terms of clusters of countries. One of the most
commonly used groupings is the typology of welfare states proposed by Esping-
Andersen (1990), which identifies the following groups:
(1) The ‘social-democratic’ regime type, with high levels of state support
and an emphasis on the individual rather than the family, typified by the
Scandinavian countries (here, Denmark and Finland and also the
Netherlands2).
(2) The ‘liberal’ regime type (modest welfare state provisions with an
emphasis on means-testing, typified by the US, with the UK and
Ireland, here considered, moving in this direction).
(3) The ‘conservative’ regime type (with an emphasis on insurance-based
benefits providing support for the family rather than the individual,
2 The Netherlands occupies a slightly ambiguous position in this classification, displaying features of both the Social-democratic group (Esping-Andersen 1990) and the Conservative group (Esping-Andersen 1999). For the purposes of this paper, we allocate the Netherlands to the Social-democratic group, since in

4
typified by a group of countries including France, Germany, Austria,
and Belgium)
Ferrara (1999) proposes the addition of a fourth category for the Southern European
countries which were excluded in Esping-Andersen’s original typology:
(4) The ‘residual’ regime type (minimal welfare benefits typified by the
Southern European countries of Portugal, Spain and Greece. Italy,
allocated to the ‘conservative’ group by Esping-Andersen, also has
many features of its welfare system in common with other countries in
this group).
As well as providing a convenient and theoretically-motivated means of simplifying the
interpretation of our analysis, this type of welfare-regime analysis also prompts us to
consider the links between the welfare state and youth poverty: to what extent can youth
poverty be relieved by welfare state benefits, or state intervention in the labour market?
The paper is structured as follows. Section 2 discusses definitions of “youth”, and
assesses the definition most appropriate for this analysis. Section 3 is devoted to
poverty, investigating which definitions of poverty are the most appropriate for our
current purposes, and also reviewing the literature on cross-national poverty analysis,.
In section 4, the literature relating to poverty among young people is discussed. Section
5 introduces data from the European Community Household Panel (ECHP), which is
used for analysis in later sections of the paper. Section 6 presents a descriptive overview
of the situation of young people’s living arrangements and activity status. Section 7
moves the focus specifically to poverty, and presents analysis of young people’s
vulnerability to poverty, relative to their counterparts in other countries, and also
relative to other age groups in their own countries. We also assess the relative risk of
poverty on young people by family status and employment status. Section 7 concludes.
For clarity and legibility, the majority of findings in the paper are presented graphically.
Should the reader require the exact numbers on which graphs are based, these are given
in the Appendix for all graphs except 7.1-7.6 and 7.12.
terms of family formation transitions and the availability of welfare benefits, it has more in common with this group.

5
2) WHAT IS YOUTH?
One reason why youth poverty is such a difficult issue is because there is no unique or
clear-cut definition of “youth”. The “young” constitute a group of individuals located
somewhere between childhood and adulthood, but the notion of “youth” does not lend
itself to definition as a lifecycle period in the same way as other groups such as
“children” or the “elderly” might be defined.
The United Nations defines youth as composed of individuals aged between 15 and 24
years of age3. The European Union follows this definition, both in its programmes
targeted at young people and in its White Paper on Youth (European Commission
2001). The UK’s Economic and Social Research Council’s Youth, Citizenship and
Social Change programme used a working definition of youth as 15-25 (Catan, 2004),
and the Joseph Rowntree Foundation’s Young People programme looked at those aged
16-25 (Jones, 2002). National bodies often define the lower age band as the statutory
minimum school leaving age in their country – so, for example, the British Office for
National Statistics usually defines “young adults” as aged between 16 and 24 years of
age (Office for National Statistics 2004).
Although a definition of youth as starting around the mid-teens and ending around the
mid-twenties is common, there is a degree of arbitrariness to this type of definition, and
increasingly, social scientists are moving away from definitions based on upper and
lower age limits, and moving towards conceptualising youth as a process of transition –
or rather, multiple transitions – to adulthood. These transitions include, but are not
limited to, completing one’s education; finding a job; leaving the parental home;
forming a marital or cohabiting union; and having one’s own children (see, for example,
Schizzerotto and Lucchini 2004).
Traditionally, these transitions took place during the late teens or early twenties for most
individuals, and they took place close together: so, for example, a young man would
typically leave school, get a job, find a partner, find his own home, and become a father,
3 The United Nations General Assembly defined ‘youth’ as those persons falling between the ages of 15 and 24 years inclusive. This definition was made for International Youth Year, held around the world in 1985. All United Nations statistics on youth are based on this definition, as illustrated by the annual

6
during the space of only a few years. However, in recent decades, the transition to
adulthood has become more protracted, with many of the traditional markers of
adulthood occurring later, sometimes not until the early thirties or beyond. Schizzerotto
and Lucchini’s (2004) analysis of birth cohorts over a 60-year period show that
throughout Europe, the age of leaving school has increased as educational standards
have improved – for all groups, but most dramatically for Southern European women,
who towards the end of the 20th century were spending around six years longer in
education than at the beginning of the 20th century. As a result of this, and also as a
result of increasing spells of unemployment among young people, the entry to first
employment now occurs later – in France and Italy over six years later at the end of the
century than at the beginning. Leaving home is also occurring increasingly late (see
Corijn and Klijzing 2001 for data on this and other demographic transitions, covering 10
European countries). An extreme example of late home-leaving is Italy, where the
median age for leaving home is almost 30 for men: by age 24, only a small fraction of
men have left home. Likewise, in many countries, late fertility is increasingly the norm:
in the Netherlands, the mean age for a first birth among women is 29 and only a
minority of women (or men) have become parents by their early twenties (Iacovou,
2002).
Clearly, a definition of “youth” which ends at the mid-twenties fails to include large
numbers of people who have completed many (or, indeed, any) of the transitions to
adulthood. Because of this, studies which conceptualise youth as a process of transition
often include individuals in their analyses who are rather older than those considered as
“young” by the conventional definitions. One of the very few existing studies devoted
specifically to youth poverty also adopts a higher upper age limit: in this case, 29 years
(Cantó-Sanchés & Mercader-Pratz, 1999).
In this paper, we follow the approach of adopting a wide age range for youth, from 16 to
294, breaking this down into three subgroups: 16-19, 20-24, and 25-29.
yearbooks of statistics published by the United Nations system on demography, education, employment and health. 4 The full range of ECHP data is available only for individuals aged 17 and over, though data on household structure is available for 16-year-olds.

7
3) POVERTY
Measuring poverty
An individual may be defined as poor if the income of the household in which he or she
lives falls below a certain minimum required level. In the developed world5, poverty is
normally measured by comparing a household’s net income, adjusted for the number of
people in the household, to a given poverty threshold, most frequently taken as 50 or 60
percent of median household income in that country. In less developed countries, an
absolute measure is normally used (see Ravallion & Bidani, 1994), typically constructed
on the basis of the expenditure needed to purchase enough food to provide a dietary
intake of 2100 calories per day.
The advantage of using a relative measure of poverty is that it indicates an individual’s
position in the income distribution relative to others within his or her own country.
Moreover, and important in our setting, is that it makes comparisons between countries,
even countries with different per capita incomes, relatively easy (see for instance Layte
and Whelan 2002)6.
However, there are drawbacks to this method. Bradshaw (2001) argues that relative
measures of poverty based on a proportion of median income have little basis in
science, and that these measures are really indicators of inequality rather than poverty.
At the very least, work using median-based poverty measures should be supplemented
by work using alternative measures, based for example on subjective notions of income
sufficiency, or material deprivation.
An additional problem with measures of poverty based on relative income is that having
made the decision to use them, it is not clear what constitutes an appropriate poverty
threshold. Often a threshold of 60 per cent of the median is chosen, but many papers
5 The United States is an exception among Western countries: since the 1960s, the US Government has defined poverty in absolute terms, in terms of an "absolute poverty line" which is the threshold below which families or individuals are considered to be lacking the resources to meet the basic needs for healthy living; having insufficient income to provide the food, shelter and clothing needed to preserve health. The construction of this poverty threshold is complex and not described here. 6 Some authors, for example Berthoud (2004) and Immervoll, Sutherland and de Vos (2000) use a poverty line based on an EU-wide measure of median income: however, the usual practice is to use country-specific median income.

8
also use alternative poverty thresholds of 40, 50 and 70 percent of median net household
income (see Whelan et al 2003). In this paper, for consistency with the Eurostat
definition, we use 60 per cent of median income as a main poverty indicator, but we
also explore how our findings change when lower poverty thresholds are set.
Equivalence scales
When assessing economic wellbeing, any measure of household income must be
adjusted to reflect the needs of the people living within the household. Larger
households need more income than smaller households to attain the same standard of
living; adults have different needs than children. Additionally, there are economies of
scale, meaning (for example) that two adults can live together more cheaply than they
could live separately. Adjustment for household composition is conventionally done by
calculating an equivalence scale, which is a number reflecting the needs of the
household, and dividing total household income by this equivalence scale.
Three commonly-used equivalence scales are shown in Table 1: the OECD scale, the
modified OECD scale, and the McClements (1977) scale (which in the table is shown
TABLE 1 EQUIVALENCE SCALES
McClements
OECD Modified OECD
Couple as base
Single person as
base
Head 1 1 0.61 1
Partner/Spouse 0.7 0.5 0.39 0.64
Other second adult 0.7 0.5 0.46 0.75
Third adult 0.7 0.5 0.42 0.69
Subsequent adults 0.7 0.5 0.36 0.59
Each child aged 0-1 0.5 0.3 0.09 0.15
Each child aged 2-4 0.5 0.3 0.18 0.30
Each child aged 5-7 0.5 0.3 0.21 0.34
Each child aged 8-10 0.5 0.3 0.23 0.38
Each child aged 11-12 0.5 0.3 0.25 0.41
Each child aged 13 0.5 0.3 0.27 0.44
Each child aged 14-15 0.7 0.5 0.27 0.44
Each child aged 16-18 0.7 0.5 0.36 0.59

9
firstly with a childless couple as the unit for comparison, and next with a single adult as
the reference unit). Traditionally the McClements scale has been used to calibrate
poverty in Britain, although this will be replaced by the modified OECD scale, which is
generally used in international comparative work, and hence is the scale we use in this
paper.
Two points should be raised in relation to equivalence scales. First, the use of
equivalence scales assumes that household members share their income equally, which
is not necessarily the case in practice. In fact, there is ample evidence to suggest that the
hypothesis of “income pooling” among married couples may be rejected (Browning et
al 1994; Lundberg et al 1997), and that bargaining models (e.g. McElroy and Horney
1981) may more accurately reflect human behaviour. However, for the kind of analysis
we are attempting in this paper, the assumption of income pooling may be the best we
can make.
Secondly, poverty statistics are sensitive to the choice of equivalence scale: for
example, scales which weight children more heavily will generate higher estimates of
poverty among families with children (Aassve et al 2004). However, it has also been
shown that in comparative studies, the actual poverty ranking of countries tends to be
unaffected by the choice of equivalence scale (e.g. de Vos and Zaidi, 2003).
Temporal issues in poverty
Analysing poverty rates across countries gives an indication of where poverty rates are
highest, but gives no information about the duration of poverty spells experienced by
individuals or households, or the factors which influence moves into and out of poverty.
The introduction of the European Household Panel Survey (ECHP) in 1994, together
with other national panels, such as the BHPS, GSOEP, and PSID, has led to several
comparative studies of poverty dynamics - though so far, none focusing on young
people.
Analysis of these data sources (Layte and Whelan 2001, Fouarge and Layte 2003 and
others) shows that in general, most poverty spells are short; recurrent poverty is
frequent, and few individuals are poor for long periods. However, exit rates from
poverty decline with the time spent in poverty, and across Europe there is a “hard core”
of cumulatively disadvantaged households who suffer long-term poverty and
10
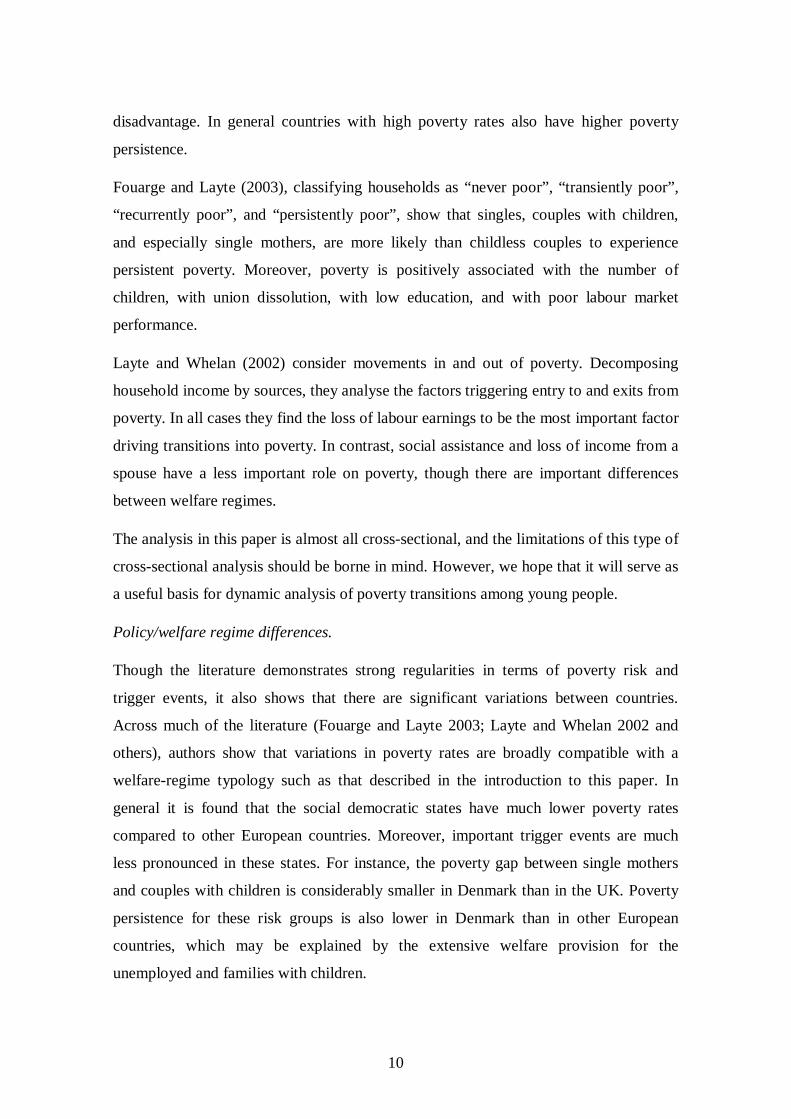
disadvantage. In general countries with high poverty rates also have higher poverty
persistence.
Fouarge and Layte (2003), classifying households as “never poor”, “transiently poor”,
“recurrently poor”, and “persistently poor”, show that singles, couples with children,
and especially single mothers, are more likely than childless couples to experience
persistent poverty. Moreover, poverty is positively associated with the number of
children, with union dissolution, with low education, and with poor labour market
performance.
Layte and Whelan (2002) consider movements in and out of poverty. Decomposing
household income by sources, they analyse the factors triggering entry to and exits from
poverty. In all cases they find the loss of labour earnings to be the most important factor
driving transitions into poverty. In contrast, social assistance and loss of income from a
spouse have a less important role on poverty, though there are important differences
between welfare regimes.
The analysis in this paper is almost all cross-sectional, and the limitations of this type of
cross-sectional analysis should be borne in mind. However, we hope that it will serve as
a useful basis for dynamic analysis of poverty transitions among young people.
Policy/welfare regime differences.
Though the literature demonstrates strong regularities in terms of poverty risk and
trigger events, it also shows that there are significant variations between countries.
Across much of the literature (Fouarge and Layte 2003; Layte and Whelan 2002 and
others), authors show that variations in poverty rates are broadly compatible with a
welfare-regime typology such as that described in the introduction to this paper. In
general it is found that the social democratic states have much lower poverty rates
compared to other European countries. Moreover, important trigger events are much
less pronounced in these states. For instance, the poverty gap between single mothers
and couples with children is considerably smaller in Denmark than in the UK. Poverty
persistence for these risk groups is also lower in Denmark than in other European
countries, which may be explained by the extensive welfare provision for the
unemployed and families with children.

11
In this paper, the majority of the analysis is done on single countries, and reported in a
country-by-country form. However, it is presented in a way which facilitates
interpretation on a welfare-regime basis.
4) POVERTY AMONG YOUTH: THE LITERATURE
Child Poverty
We have already remarked that in contrast to the lack of research on youth poverty,
there exists an extensive and well-developed literature on child poverty. This is not the
place to attempt even a partial review of this literature, but we will touch on a few of the
results, since many results which apply to child poverty are also relevant to youth
poverty. One reason for this is that many young people still living at home are similar to
children in many dimensions, perhaps differing only in terms of a year or two in age
(Beaujot and Liu 2002; Cantillon and Van den Bosch 2003). Additionally, somewhat
older groups of young people are likely to have young children themselves, and
therefore child poverty impacts on their households, as parents.
Findings based on the Luxembourg Income Study (LIS) demonstrate that Nordic and
Northern European countries have low rates of child poverty, whereas Southern
European and English-speaking countries tend to have high rates (Garfinkel et al. 2004).
Children are generally more likely to be poor if living with a lone mother, but variations
in rates of lone motherhood are not an important reason for the variations in child
poverty across countries.
Income transfers and other welfare state services are clearly important for the living
standards of poor children, and these have been the focus of much previous research on
child (and adult) poverty. Bradbury & Jantti (1999) examine the historical, political and
economic developments that have led to the different structures of welfare state
institutions, and characterise countries as ‘welfare leaders’, which tend to have low
poverty rates, and ‘welfare laggards’ which have much higher child poverty rates. In
this context, the English-speaking countries stand out: even though they are usually
categorised as ‘welfare laggards’ because of their low aggregate levels of social
expenditures, the tight targeting of this expenditure means that in most cases (with the
exception of the US) they actually provide quite substantial income transfers to their

12
most needy children. The living standards of these children, however, remain relatively
low because of low labour market incomes. The higher living standards of the most
disadvantaged children in the ‘welfare leaders’ (particularly the Nordic countries) is due
to the higher market incomes in these families. Because of their well-known rigidities
continental European labour markets do a better job in providing resources to the most
disadvantaged children. The reasons for this are likely to be found in both employment
and wage rates (for both mothers and fathers), as well as in other factors such as
household composition and self-employment patterns.
Vulnerability among youth
Although there are few studies dealing specifically with poverty among young people,
there are a large number of studies dealing with aspects of vulnerability among young
people, showing clearly that young people are more vulnerable than older adults to a
range of problems. Young people are more likely than older adults to be unemployed.
Hammer (2003) reports that across Europe in 2000, young people were more than twice
as likely as older adults to be unemployed, with youth unemployment standing at 16%,
against 7% for adults; young people were also disproportionately likely to be long-term
unemployed, with 40% of unemployed youth falling into this category. Young adults
are at a higher-than-average risk of unemployment (Russell and O’Connell 2001), or
insecure employment, or low-waged employment; they are also relatively likely to
experience problems with housing (Rugg 1999), drug abuse (Boys, Marsden and Strang
2001), and mental health (Shucksmith and Spratt 2002). Palmer, North, Carr and
Kenway (2003) examine young people’s well-being on a variety of indicators, and point
out that well-being in the young adult years is an important determinant of well-being
later in life A great deal of research exists about the multiple dimensions of
vulnerability facing young people. However, much less has been written about how the
often precarious situation of young people maps on to their economic situation, and the
degree of poverty experienced by young adults.
Poverty among youth
The relatively few studies focusing on poverty among young people are based mainly
on two data sources: the cross-sectional Luxembourg Income Study (LIS) and the
longitudinal European Community Household Panel (ECHP).

13
Iacovou and Berthoud (2001), using data from the BHPS, find that across Europe, the
risk of poverty falls with age over the age range 17-30, and until the end of the twenties,
it is higher for young people who have left the parental home. Throughout the age
range, the risk of poverty is a few percentage points higher for women than for men.
They find that various factors - being in employment, having a working partner, and
living in one’s family of origin - protect against poverty, and that the risk of poverty is
highest for those people for whom none of these protective factors is present. They find
young people in the Social democratic group of countries to be least likely to have no
protective factors present, and most likely to be poor given the absence of protective
factors.
Kangas and Palme (2000) use LIS data to study variations in poverty rates over the life
cycle in eight OECD countries. They find high rates of poverty among those aged 24
and under, when these are considered as an age group, and also when childless young
people under 24 are considered as a life-cycle stage.
Smeeding and Ross Phillips (2002) use LIS data from seven countries (France,
Germany, Italy, Sweden, the UK, the US and the Netherlands) to analyse the economic
sufficiency of young people’s earnings, and the incidence of poverty on young people.
They find that in all countries, only a minority of young people of either sex in their late
teens and early twenties are able to support themselves with their earnings alone –
though wages for this age group in Britain are rather higher than elsewhere. Even when
social transfers are taken into account, a significant proportion of young people remain
unable to support themselves – and much less, a family – before their mid- to-late
twenties. Although income sufficiency increases markedly through the early twenties,
poverty rates decline much more slowly over this age group, indicating that young
people with low earnings are protected from poverty to a degree because of living with
their families of origin.
Fahmy (2002), using a 1999 sample of British people aged, finds that on a range of five
poverty measures, those aged 16-24 are more likely to be poor than those aged 25-34
years. For example, using a measure of poverty based on 60% of median income and
the OECD equivalence scale, 33% of those in the 16-24 age group were poor, compared
with only 16% of those aged 25-34 years.

14
The European commission report on poverty (Eurostat 2002) is based on ECHP data,
and focuses on measures of household living standards broken down by age. It emerges
clearly that across Europe, the incomes of young people below age 24 are below
national averages. In all countries except Luxembourg, the incomes of those aged 18-24
are lower than average incomes: for Europe as a whole, youth incomes are only 91% of
average incomes. Across Europe, the only groups poorer than young people are children
and older people over age 65: this holds true for a majority of countries, including the
UK. These lower incomes translate into a higher poverty risk, with young people at a
disproportionate risk of poverty across Europe. Using an alternative approach which
assesses the risk of poverty as a function of an individual’s position in the income
distribution, young people appear at even greater risk of poverty relative to other
groups: this relative risk is particularly high in Scandinavian countries. Looking at
measures of deprivation rather than income poverty, the age profile of those at risk is
unchanged, with young people at higher risk of deprivation than older groups. However,
the differentials in risks are less marked when non-monetary indicators are considered,
which may be related to the fact that many young people continue to rely on support
from parents through transfers-in-kind.
Risk factors for poverty
Human capital and labour market factors such as low educational levels, unemployment
and low pay are risk factors for poverty among young people. Canto-Sanchez and
Mercader-Prats (1999) study entry-level jobs held by new school leavers (aged 16 to 29)
one year after leaving education in different selected European countries, and find that
the labour market varies markedly between countries. In Spain, more than 80 per cent of
school leavers hold a temporary job, the majority because they could not find a
permanent job. The key role of education has also been highlighted by Pavis, Platt and
Hubbard (2000), who point out that simply getting a job is not enough to avoid social
exclusion: even if they find a job, those with low educational levels may remain trapped
in poorly paid low quality employment.
Living arrangements are also important. As well as the protective effect of living in the
family of origin referred to by Berthoud and Iacovou (2001), the family structure of
young people who have left home plays a crucial role. The risk of poverty is elevated
15
for households in which the head is female, young, a single parent or has not finished
upper secondary schooling, as well as for households in which no adult is employed for
a significant part of the year (OECD 2001). In fact, the risk of poverty for single-adult
families with children is about double the average risk for the entire population in
Germany, the Netherlands, and the United Kingdom, as well as in the United States.
Mejer (2000), using the ECHP, confirms that a relatively high proportion of the low-
income population are young people, and finds that single parents, who are often young
adults, have some of the highest poverty rates, especially in the UK.
Smeeding et al (1999) and Berthoud and Robson (2003) confirm that in most Anglo-
Saxon nations, single parenthood is a strong risk factor for youth poverty. In both the
US and the UK, former teen mothers are markedly more likely than women who first
gave birth in their twenties not to be in work and to be in the bottom fifth of the income
distribution. Teenage motherhood is much less common in continental Europe, but it is
still the case that former teen mothers fare much less well on average in later life – for
example they are twice as likely to be in the bottom fifth of the income distribution. The
figures display considerable variation from country to country, but teen mothers are
nearly always found to be at some disadvantage on a range of measures. These
associations may in part reflect a causal relationship, but the degree of causality is not
clear, since teenagers who become mothers are considerably different from other
teenagers. The extent of the causality running from low income, teen motherhood or
some other dimension of child well-being to future outcomes clearly matters a great
deal for the design of policy. Micklewright (2004) asks whether greater income
transfers to families in poverty will have much effect on children’s outcomes, or
whether they will just increase current living standards of the poor – a reasonable goal
in itself, but a different goal.
5) DATA: THE ECHP
Data come from the European Community Household Panel (ECHP), a set of
comparable large-scale longitudinal studies set up and funded by the European Union.
The first wave of the ECHP was collected in 1994 for the original countries in the
survey: Germany, Denmark, the Netherlands, Belgium, Luxembourg, France, the UK,
Ireland, Italy, Greece, Spain and Portugal. Three countries were late joiners to the

16
project: Austria joined in 1995, Finland in 1996 and Sweden in 1997. All countries
except Luxembourg and Sweden are included in the analysis; Luxembourg is omitted
because of an extremely small sample, Sweden because the data do not form a panel7.
Eight waves of the ECHP were collected in total, with the last wave collected in 2001.
TABLE 2: SAMPLE SIZES (ALL WAVES)
Age 16-19 Age 20-24 Age 25-29 UK 5,153 7,389 7,675 Ireland 6,119 6,883 5,170 Austria 3,248 3,998 3,989 Belgium 3,146 3,663 3,821 France 7,053 9,050 9,246 Germany 6,659 8,106 10,148 Denmark 2,391 3,174 3,667 Finland 4,026 4,147 3,136 Netherlands 5,400 5,528 6,769 Greece 6,370 7,709 7,531 Italy 8,538 12,833 13,720 Portugal 7,194 9,509 8,121 Spain 8,835 12,534 12,098
In the ECHP, each individual is asked about his or her income from earnings; private
and state pensions and benefits; and other sources, such as rental and investment
income, and private transfers. Additionally, information is gathered about any other
income (nearly always a rather small proportion) accruing to the household rather than
individuals within the household, and the assumption is made that this income should be
attributed equally to each individual living in the household.
However, all this information is collected retrospectively, and covers the calendar year
prior to the survey interview. Thus, for example, Wave 1 interviews in 1994 contain
information about individuals’ income in 1993, Wave 2 interviews in 1995 contain
information about individuals’ income in 1994, and so on. This presents a problem
when computing household equivalent income, for the following reason. Adding
together the incomes of all individuals present in a household in Wave 2 (for example)
7 For the purposes of cross-sectional analysis this is not a problem – but because household income is measured retrospectively, it makes it impossible to analyse the links between living arrangements and incomes.

17
gives the sum of all the 1994 incomes for those present in the household in 1995 – but
because household composition changes year-on-year, this total may include some
individuals who were not living in the household in 1994, and may omit some
individuals who were present in that year. For population groups for whom household
structure is relatively stable, the problems arising from this inaccuracy may not be
serious. However, for young people, for whom household structure is likely to be fluid,
and highly dependent upon the sufficiency of current incomes, the problems are
potentially serious.
We take the following approach, suggested by Heuberger (2003). To compute
household equivalent income in year t, we use income data pertaining to year t collected
at year t + 1, summing this over all the individuals present in the household at year t and
using an equivalence scale based on the numbers and ages of individuals present at year
t. The reader should note that this procedure was not possible using Finnish data, and
thus for Finland, all data relates to incomes for year t – 1.
6) YOUNG PEOPLE’S LIVES: DESCRIPTIVE STATISTICS
Before analysing poverty among youth, it is useful to take an overview of factors which
are related to the incidence of poverty. One such factor is living arrangements, which
affect the incidence of poverty for two principal reasons. First, via the numerator of the
household equivalent income calculation: young people living alone will have only their
own incomes contributing to the numerator, whereas those living with other adults will
have the incomes of the other adults contributing. Second, via the equivalence scale,
which serves as the denominator of the household equivalent income calculation: this
denominator will be 1 for young people living alone, and greater than 1 for those living
with other people – whether adults or children. Because additional household members
feature in both the numerator and denominator of the calculation, it is not clear a priori
what effect they will have on poverty rates. However, we may expect that in general,
additional adults in employment will increase household equivalent income, whereas
additional adults without employment, and children, will decrease it. The age at leaving
home, and living arrangements on leaving home are highly diverse in Europe (see

18
Aassve et al. 2004 and Iacovou 2002 for detailed accounts of this), and as we shall show
later, these variations are closely linked to poverty rates.
Figure 6.1 shows the proportion of young people who have left the parental home, for
three different age groups: the “younger young” aged 16-19; those aged 20-24; and the
“older young” aged 25-29. The numbers on which this graph is based are given in the
Appendix.
Figure 6.1: Percentage of young people who have left home, by age group and country
0%
20%
40%
60%
80%
100%
Fin
lan
d
De
nm
ark
Ne
the
rla
nd
s
UK
Ire
lan
d
Fra
nce
Ge
rma
ny
Au
stri
a
Be
lgiu
m
Po
rtu
ga
l
Sp
ain
Italy
Gre
ece
SocialDemocratic
Liberal Corporatist Southern European
Age 16-19 Age 20-24 Age 25-29
♦ In every country, the proportion of young people who have left home rises with
age group.
♦ In the youngest age group, the highest proportion of young people who have left
home is to be found in the UK, where it stands at nearly 12%, compared with
7% in the Scandinavian countries and 3% or lower in the Southern European
countries.
♦ For the 20-24 and the 25-29 age groups, the highest proportion of young people
who have left home is found in the social democratic countries, and the lowest in

19
the Southern European countries. For example, among those aged 25-29, in the
social democratic countries over 90% have left home, while the corresponding
proportion in the Southern countries is well under half this level.
♦ Behaviour falls quite neatly into welfare regime clusters on this indicator, with
the exception of the “liberal” cluster, where the UK occupies an intermediate
position between the social democratic and conservative clusters, while Ireland
shares all the features of the Southern European countries.
Of course, whether or not a young person has left the parental home is only one of many
aspects of his or her living arrangements. Table 6.2 summarises the living arrangements
of young adults aged 20-24 (corresponding tables for those in the other two age groups
are to be found in the Appendix). In this table, living arrangements are categorised as
follows:
1. “Living with a parent figure”, including natural parents, step-parents,
grandparents, parents-in-law, or parents of a partner. This category corresponds
closely to, but is not identical to, the “living at home” category in the previous
graph. We prefer this classification for our later poverty analysis, because co-
residence with any of these parent figures may provide similar protection against
poverty as living with one’s own parents.
2. “Couple, no children”
3. “Couple, with children”
4. “Single, living alone”
5. “Lone parent”
6. “Other”. Categories 2-5 exclude those living with any adults other than a spouse
or partner (for example, siblings, cousins or flatmates). Anyone who lives in a
household not including a parent figure, but including one or more adults other
than a spouse or partner, is placed in this “other” category.

20
Table 6.2: Living arrangements of young men and women aged 20-24
Men With parent figure
Couple, no children
Couple, with
children
Single, living alone
Lone parent
Other
Finland 55.8 14.5 3.6 25.5 0.0 0.6
Denmark 57.6 14.4 2.9 23.5 0.0 1.7
Netherlands 63.9 10.5 1.1 23.2 0.0 1.2
UK 67.4 8.7 6.3 10.1 0.0 7.5
Ireland 92.6 1.2 1.1 2.8 0.0 2.3
France 78.2 7.7 2.2 10.3 0.0 1.7
Germany 83.2 5.7 1.9 8.4 0.0 0.8
Austria 81.7 4.9 4.5 7.7 0.0 1.2
Belgium 90.1 4.7 1.5 3.2 0.0 0.6
Portugal 93.4 2.4 2.5 0.4 0.0 1.4
Spain 96.7 1.0 1.1 0.6 0.0 0.6
Italy 96.4 0.6 0.7 1.6 0.0 0.8
Greece 90.1 1.0 1.1 6.5 0.0 1.4
Women With parent figure
Couple, no children
Couple, with
children
Single, living alone
Lone parent
Other
Finland 32.8 24.9 8.4 31.6 2.1 0.3
Denmark 35.3 27.4 8.6 24.9 1.2 2.6
Netherlands 44.3 27.7 4.7 22.2 0.1 1.1
UK 48.7 17.5 10.9 11.0 5.0 7.0
Ireland 82.8 2.5 5.0 3.5 3.0 3.3
France 62.5 16.8 6.9 11.3 0.9 1.7
Germany 64.6 12.5 6.6 13.6 2.0 0.8
Austria 64.9 11.2 7.9 11.4 1.4 3.1
Belgium 79.2 10.6 6.9 1.6 1.4 0.4
Portugal 86.8 4.6 5.7 1.0 0.2 1.7
Spain 91.8 3.5 2.6 1.1 0.1 1.0
Italy 90.8 3.9 3.7 1.2 0.0 0.5
Greece 77.9 4.2 9.6 5.2 0.1 3.1 One thing which is immediately apparent is that there are large gender differences in
living arrangements.
♦ Far fewer young women than young men live with parents. This effect is large:
in most countries, the gap between men and women is of the order of 10
percentage points.
21
♦ Young women are correspondingly more likely than young men to live as part of
a couple: particularly as part of a childless couple in the social democratic
countries, and part of a couple with children in the Southern countries.
♦ The proportions living alone do not vary so markedly between men and women,
although women are somewhat more likely than men to live alone.
♦ Lone parenthood in this age group is virtually the exclusive confine of women:
rates of lone parenthood are highest in the UK at 5%, and lowest in the Southern
countries (well under 1%).
Comparing living arrangements between countries, we observe that:
♦ As observed before, living with parents is most common in the Southern
countries, and least common in the social democratic countries
♦ Living alone, or living with a partner in a childless union, is far more common in
the social democratic countries than anywhere else – and far less common in the
southern countries.
♦ The proportions of men and women living with both a partner and children do
not vary much between countries – with the exception of the UK, where the
proportion of women becoming mothers early is higher than elsewhere.
♦ The country with much the highest proportion of young men and women in the
“other” category is the UK, with over 7% of both sexes living in such
arrangements. The proportion in the other age groups in this category is lower,
but is still much more common in the UK (and to a lesser extent Ireland) than
anywhere else in Europe.
Figure 6.3 explores the phenomenon of non-standard living arrangements further,
plotting the numbers of young people living with siblings or unrelated adults, both as a
proportion of all young people, and as a proportion of those who have left home.

22
Figure 6.3: Percentage of young people in non-standard living arrangements, by country and age group. Upper panel shows percentages of all young people, lower panel shows percentages of those who have left home.
The upper panel of Figure 6.3 confirms that non-standard living arrangements are
relatively uncommon everywhere except the UK and Ireland, and that in most countries
they are most common in the 20-24 age group. The lower panel (note the difference in
vertical scales) shows that as a proportion of those who have left home, the picture
changes, with the proportion living in non-standard arrangements being highest not in
the UK, but in the Southern countries and Ireland (where this group accounts for over
25% of those who have left home), and to a lesser extent the corporatist countries.
Why are these living arrangements so much more common in certain places, and at
certain stages of the life-cycle, than others? One reason may be the available housing
stock: if accommodation of a suitable size and price for young people is not available,
0%
20%
40%
60%
80%
Fin
lan
d
De
nm
ark
Ne
the
rlan
ds
UK
Ire
lan
d
Fra
nce
Ge
rman
y
Au
stri
a
Be
lgiu
m
Po
rtu
ga
l
Sp
ain
Italy
Gre
ece
SocialDemocratic
Liberal Corporatist Southern European
0%
2%
4%
6%
8%
Fin
lan
d
De
nmar
k
Ne
the
rlan
ds
UK
Ire
lan
d
Fra
nce
Ge
rma
ny
Au
stri
a
Be
lgiu
m
Po
rtu
gal
Sp
ain
Italy
Gre
ece
Age 16-19 Age 20-24 Age 25-29

23
the decision to share housing may be based on economic necessity. This is further
supported by the fact that as an alternative to living at home, this living arrangement is
so much more common in the youngest age group. The degree to which these non-
standard living arrangements protect young people against poverty would be a fruitful
line for further research.
Activity status
Another factor which affects poverty rates is young people’s activity status – what they
are doing with their time, and whether it brings in an income. In the ECHP, respondents
are asked to state their main activity, which we group into four categories:
♦ Being in unpaid education or training
♦ Being in paid work or self-employment, or on a paid apprenticeship (15 or more
hours per week)
♦ Unemployed and seeking work (ILO definition)
♦ Other – including working or studying less than 15 hours per week, doing
military service, looking after children, and working unpaid in the family
business.
The proportions of men and women in each activity status are shown in Table 6.4
below. There are variations by age and sex, which are largely as expected. The
proportion in education or training falls with increasing age, in all countries. There is no
marked pattern of gender differences: as a rule, men’s and women’s participation rates
are similar in each countries, though in many countries they are slightly higher for
women.
The proportion in employment rises with increasing age, and for each age group it is
higher for men than for women. This gender difference is particularly marked for the
oldest age group, in which family formation has led many women into the “other”
category.

24
Unemployment rates tend to rise in each country between the 16-19 and the 20-24 age
groups, reflecting the higher availability for work of the 20-24 group. After this,
unemployment rates remain fairly constant between the 20-24 and 25-29 age groups.
The “other” category is by definition rather heterogeneous. In the youngest age group,
men in several countries (including Finland, Austria, Spain and Greece) by virtue of
military or community service requirements. In the middle age group there is no clear
pattern of gender differences. In the oldest age group, women are much more likely than
men (and much more likely than younger women) to be in this category, almost entirely
due to their higher level of domestic commitments.
Moving on to cross-country differences, we observe that the UK has a particularly high
proportion of men and women aged 16-19 in the “other” category, and particularly low
rates of educational participation. It is known that over the period studied, post-
compulsory educational participation was lower in the UK than in most other European
countries; however, it is likely that some young people whose main activity is education
(perhaps for less than 15 hours per week) have been allocated to the “other” category.
Of particular interest in the study of young people’s economic sufficiency are
employment and unemployment rates. These vary widely between countries. For
example, 55% of Austrian men in the youngest group are defined as employed (though
this will include many on paid apprenticeship schemes), compared to only 6% in
Belgium (where participation in education is nearly universal up to age 18). More
tellingly, unemployment rates range from under 2% in the Netherlands to over 16% in
Italy.
For the 20-24 age group, differences in employment rates have evened out somewhat,
but differences in unemployment rates remain enormous: for men, they range from
under 6% in Denmark, the Netherlands and Austria, to with 24% in Italy. As we will see
in the next section, many of these cross-national differences appear to have a direct
relationship to differences in youth poverty rates.

25
Table 6.4: Activity status among young people, by sex, country and age.
Age Men Women
group: Student Emp- loyed
Unem-ployed
Other Student Emp- loyed
Unem-ployed
Other
16-19 Finland 76.7 10.7 3.8 8.8 86.7 7.9 3.4 2.0
Denmark 62.2 32.2 3.8 1.8 73.4 20.8 2.4 3.5
Netherlands 78.8 18.4 1.6 1.2 85.2 12.7 1.5 0.6
UK 29.3 47.0 8.0 15.8 28.5 42.2 5.4 23.9
Ireland 57.9 30.3 9.8 2.0 68.1 19.9 8.6 3.4
France 76.9 13.3 6.2 3.7 87.3 5.3 4.8 2.6
Germany 85.5 8.5 2.0 4.0 88.3 6.4 1.7 3.7
Austria 34.0 55.2 2.9 7.9 55.9 38.4 4.4 1.2
Belgium 91.1 5.9 2.3 0.7 94.6 3.2 1.7 0.5
Portugal 49.8 38.5 4.5 7.3 62.6 24.4 5.7 7.3
Spain 64.7 14.4 11.9 9.0 78.8 6.5 10.8 3.9
Italy 66.8 13.1 15.6 4.6 73.2 7.6 13.9 5.3
Greece 64.3 10.8 5.9 19.1 71.9 5.4 13.8 8.9
20-24 Finland 35.9 40.8 13.0 10.3 49.7 31.8 8.6 9.9
Denmark 25.4 64.5 5.9 4.2 32.8 52.3 7.8 7.2
Netherlands 46.8 46.5 4.6 2.2 41.3 47.2 6.4 5.2
UK 12.1 71.1 11.1 5.7 11.2 64.7 5.8 18.4
Ireland 22.2 60.3 13.7 3.8 22.1 54.5 10.4 13.1
France 37.1 37.7 13.2 12.1 42.7 31.8 16.2 9.3
Germany 35.5 43.2 7.8 13.5 37.6 46.8 7.6 8.1
Austria 20.7 68.6 4.5 6.2 25.0 63.7 4.2 7.1
Belgium 54.0 37.3 8.0 0.8 53.4 30.5 12.9 3.3
Portugal 24.2 59.8 7.9 8.1 34.8 49.5 8.4 7.4
Spain 38.4 38.4 16.2 7.1 46.2 25.9 20.6 7.4
Italy 31.1 36.4 24.2 8.4 38.8 25.4 24.2 11.7
Greece 25.6 36.4 15.4 22.6 27.8 29.8 23.8 18.7
25-29 Finland 11.7 73.6 13.1 1.5 13.6 54.8 13.2 18.5
Denmark 13.3 78.0 8.2 0.5 18.0 62.3 14.6 5.2
Netherlands 9.8 83.5 5.1 1.6 6.1 69.4 9.5 15.1
UK 2.0 85.5 7.8 4.8 2.0 67.1 2.8 28.1
Ireland 4.6 73.9 16.6 4.9 3.1 61.2 5.9 29.9
France 5.0 77.1 11.2 6.8 5.1 62.7 15.9 16.4
Germany 15.3 74.2 7.8 2.6 9.6 66.0 7.9 16.5
Austria 10.7 83.6 3.8 2.0 7.1 73.6 3.3 16.0
Belgium 8.0 81.1 8.7 2.2 4.9 73.4 12.6 9.1
Portugal 5.0 84.2 5.4 5.4 7.2 72.2 6.8 13.8
Spain 9.3 67.5 16.8 6.4 12.0 44.6 21.2 22.2
Italy 12.9 62.6 19.3 5.2 13.4 46.1 17.2 23.3
Greece 3.7 71.3 12.2 12.8 2.3 46.2 16.4 35.1

26
7) PATTERNS OF POVERTY AMONG YOUTH IN
EUROPE
Age-poverty profiles
We now present poverty data derived from the ECHP. Figures 7.1 to 7.3 show
smoothed poverty rates, by age, for the age range 0-70, in each country (in each
country, poverty rates rise after age 70). For clarity, three graphs are presented, showing
the UK plotted together with 1) Ireland and the Social Democratic countries, 2) the
Conservative countries, and 3) the Southern countries. On each graph, the poverty rate
for the UK is shown by the bold black line. Numbers relating to these graphs,
summarised by age group, may be found in the Appendix.
“Poor” people here are defined as those living in households whose equivalised income
is less than 60 per cent of median net equivalised household income in their own
country, using the modified OECD equivalence scale.
Figure 7.1: Poverty rates in the UK, Ireland and the Social Democratic countries
0%
10%
20%
30%
40%
0 10 20 30 40 50 60 70
Age
% p
oo
r (i
nco
me
un
der
60%
med
ian
)
Finland DenmarkNetherlands UKIreland

27
Figure 7.2: Poverty rates in the UK and the Conservative countries
0%
10%
20%
30%
40%
0 10 20 30 40 50 60 70
Age
% p
oo
r (i
nco
me
un
der
60%
med
ian
)
UK France Germany
Austria Belgium
Figure 7.3: Poverty rates in the UK and the Southern European countries
0%
10%
20%
30%
40%
0 10 20 30 40 50 60 70Age
% with income under 60% of median
UK Portugal Spain
Italy Greece

28
As is clear from these figures, the UK has some of the highest child poverty rates in
Europe, rivalled only by Italy, Spain and Ireland. High levels of child poverty in the UK
are not a new finding (Micklewright 2004, Bradbury and Jäntti 2001, and many others).
However, child poverty has been at the centre of UK government anti-poverty measures
since 1997, and recent evidence indicates that child poverty in the UK has indeed
declined in recent years (Brewer et al. 2005). We will later examine how the incidence
of child poverty has changed over the period in question.
After childhood, UK poverty rates show a steady decline with age, until around age 53,
when they start rising again. Thus, in the UK, poverty rates among young people are
lower than those among children, but higher than those of any other age group, until
well into retirement age. We also observe that the “younger young” are at substantially
higher risk of poverty than the “older young”.
This U-shaped pattern of poverty observed in the UK is very different from the three-
peaked pattern noted by Rowntree (1901), with the absence of a middle “childbearing”
peak perhaps due to a far greater diversity in the ages at which people become parents.
In fact, the only country where this three-peaked pattern is at all in evidence is Ireland.
The age-poverty profiles of other groups of countries all show distinct patterns. The
social democratic group of countries have much the lowest poverty rates in Europe (in
Finland and Denmark, poverty rates are well under 10% over most of the age range
considered) and in contrast to the UK, child poverty rates are very low. However, in all
social democratic countries, poverty rates peak dramatically in the early twenties, rising
to almost 20% in Denmark, and almost 30% in Finland. These are some of the highest
youth poverty rates in Europe, and are particularly striking in the context of low overall
poverty rates in these countries.
The most likely explanation for these high rates of youth poverty may be found in
Figure 6.1, which shows that young people in social democratic countries leave home at
an extremely early age, and are therefore unlikely to have high enough earnings at the
time of home-leaving to protect them against poverty. How much of a problem are high
rates of youth poverty in these countries? If (a) they are generated by large numbers of

29
young people having brief spells in poverty around the time of home-leaving, which end
quickly on finding employment, and (b) they are spells of moderate rather than extreme
poverty, then they may present less of a problem than appears at first sight. We return to
these questions later in the paper. We also investigate whether these high poverty rates
are an artefact of living arrangements, since young people in social democratic countries
are much more likely to live alone on leaving home.
The Conservative countries (Figure 7.2) exhibit much flatter poverty-age profiles – at
least up till retirement age. In these countries, child poverty rates are slightly higher than
those for prime-aged people, but much lower than child poverty rates in the UK. Youth
poverty rates are also lower than in the UK, with the exception of France, which
exhibits a pattern akin to the social democratic pattern, though much less marked.
Austria and Germany are interesting in that they show absolutely no elevated level of
poverty among youth. What is special about these countries? One explanation may be
their low levels of youth unemployment, as depicted in Table 6.4. This, in combination
with the fact that young people in these countries tend leave the parental home at a
higher age than in the Social Democratic states, may generate low youth poverty rates.
Figure 7.3 compares poverty rates in the UK with those in Southern European countries.
In these countries, poverty rates are generally high, particularly in Spain and Italy for
the younger group, and in Portugal and Greece for older people. In all Southern
European countries, child poverty rates are higher than in the other groups of countries,
except the UK and Ireland. Youth poverty rates in Spain and Greece are very similar to
those in the UK, while those in Portugal are lower, and those in Italy are very high.
Again, Table 6.4 provides an indication of the reasons behind these differences. Levels
of youth unemployment are low in Portugal, intermediate in Spain and Greece, and very
high in Italy. It is noticeable that in the southern European countries, there is no peak in
poverty rates either in the early twenties, or at any age which might be associated with
leaving home. Rather, in all these countries, poverty rates reach a peak towards the mid-
teens (possibly associated with older teenagers’ increased contribution to the
equivalence scale), and fall throughout the twenties.

30
The next three graphs (Figures 7.4 to 7.6) are similar to the previous set, but they use a
poverty threshold of 40% of median net equivalised household income, rather than the
60% used in the previous graphs. We include these graphs to deal with the arguement
that a threshold of 60% of median income may not represent particularly serious
poverty in an affluent country. By contrast, 40% of median income represents arguably
serious poverty in any country. To facilitate comparisons, the graphs are drawn with the
same axes as the previous set, even though the incidence of poverty is lower.
There are many similarities between the two sets of graphs – most countries display
similarly shaped age-poverty profiles under the two thresholds, and the rankings also
remain similar. However, there are some differences. Results are summarised overleaf.
Figure 7.4: Poverty rates in the UK and the social democratic countries (40% median)
0%
10%
20%
30%
40%
0 10 20 30 40 50 60 70
Age
% p
oo
r (i
nco
me
un
der
40%
med
ian
)
Finland DenmarkNetherlands UKIreland

31
Figure 7.5: Poverty rates in the UK and the Conservative countries (40% median)
0%
10%
20%
30%
40%
0 10 20 30 40 50 60 70
Age
% p
oo
r (i
nco
me
un
der
40%
med
ian
)
UK France Germany
Austria Belgium
Figure 7.6: Poverty rates in the UK and the Southern European countries (40% median)
0%
10%
20%
30%
40%
0 10 20 30 40 50 60 70Age
% w
ith
in
com
e u
nd
er 4
0% o
f m
edia
n
UK Portugal Spain
Italy Greece

32
♦ The only countries where the shape of the poverty profile is very different under
the two thresholds are the UK and Ireland. In the UK, a social-democratic-type
peak emerges around age 20, indicating that on this measure of more severe
poverty, young people in the UK are more likely than those in any other age
group to be poor.
♦ In Ireland, although poverty rates using the 60% threshold were among the
highest in Europe, there are very low levels of poverty under the 40% threshold.
♦ The peak in poverty rates among young adults is still present in the social-
democratic countries, ranging from 8% in Denmark to over 12% in Finland.
♦ Poverty rates in the conservative countries are even flatter under the lower than
the higher threshold, particularly for older people. There is still a peak in the
early twenties for France, but less pronounced.
♦ Southern countries still have the highest poverty rates in general, and for all
countries the fall in poverty rates throughout the twenties is still visible (except
for Portugal, where the fall occurs earlier).
Poverty and leaving home
We now consider how poverty rates are linked with residential status. Figure 7.7 shows
poverty rates by whether a young person is still living in the parental home, for three
age groups: 16-19, 20-24, and 25-29.
The grey lines indicate poverty rates among those young people who have left home,
and the black lines indicate poverty rates among those remaining in the parental home.
For each country, the left-hand column indicates poverty rates among those aged 16-19,
the middle column indicates poverty rates among those aged 20-24, and the right-hand
column indicates poverty rates among those aged 25-29.

33
Figure 7.7: Poverty rates, by whether young people live with their parents (3 bars are given for each country, showing respectively the age groups 16-19, 20-24, 25-29).
0%
20%
40%
60%
80%
100%
. FIN DEN NETH UK IRE FRA GER AUS BEL POR SPA ITA GRE
Social Democratic Liberal Corporatist Southern
Left parental home Still in parental home

34
From this graph, we observe that:
♦ Of those remaining in the parental home, the proportion who are poor decreases
with increasing age, in every single country. This accords with intuition: those in
older age groups are more likely to have a job, and higher wages within jobs,
and thus household incomes are likely to be higher.
♦ Of those who have left home, poverty rates also decline as age group increases,
in all countries but one. In most countries, this decline is much more dramatic
than the decline for those living with parents.
♦ In nearly all cases, young people are far more likely to be poor if they have left
home, than if they live at home. This effect is strongest for the youngest group,
and least so for the oldest group.
♦ The difference in poverty rates between those living at home and those who
have left home (ie, the difference in height between the black bars and the grey
bars) varies between countries. It is highest in the Scandinavian countries (where
poverty rates among the general population are low, and where poverty rates
among young people who have left home are extremely high). The differential is
lowest in the Southern European countries, where poverty rates among the
general population are high, and where poverty rates among young people who
have left home are rather low. Italy forms a partial exception to this, with very
high poverty rates among the young who have left home in the youngest group –
but even in the case of Italy, the differentials in poverty rates are not as high as
they are in the Scandinavian countries.
The reader will have observed that those countries where there are large differences in
poverty rates between young people living with their parents and those living away
from home, are precisely those countries where young people are more likely to move
away from home early. For young people aged 20-24, Figure 7.8 shows a scatterplot of
differences in poverty rates between those at home and those who have left home,
against the proportion of those still living at home. A strong relationship between the
two variables is apparent, and the correlation coefficient is 0.89 between the two

35
variables measured at a country level. This suggests that in those countries where early
home-leaving is the norm, this early home-leaving is at best only partially explained by
differences in economic sufficiency among young people, and other factors, such as
social and cultural norms, must also play a part.
Figure 7.8: Differences in poverty rates between those who have and have not left home, by the proportion of young people who have left home (those aged 20-24)
POR
SPA
GRE BEL
ITA
AUS
FRA
GER
IRE
UK
DEN
NETFIN
0
0.1
0.2
0.3
0.4
0.5
0.6
0.7
0 0.1 0.2 0.3 0.4 0.5
Difference between poverty rates of young people who have left home and those living at home
(20-24-year-olds)
% o
f th
ose
ag
ed 2
0-24
wh
o h
ave
left
th
ep
aren
tal h
om
e
Single-person households
Those countries where home-leaving is the earliest are also those countries where young
people are the most likely to live in single-person households (Iacovou 2002a). Poverty
rates in this paper are adjusted for household size using equivalence scales, but the
choice of equivalence scales is in some sense arbitrary, and it may be that the
differences in poverty rates between countries are driven by differences in household
composition. For example, it may be that the very high poverty rates observed among

36
young people in the social democratic countries in the early twenties are simply an
artefact of the fact that they are much more likely to live alone.
Table 7.9 shows poverty rates broken down by household type, for 20-24 year olds who
do not have children (across Europe, only 7% of young people in this age group have
children, and poverty rates among young people with children is dealt with in the next
section).
In all countries, young people living alone are most likely to be poor – in most cases, by
quite a large margin. In Finland and Denmark, those living as part of a couple are more
likely to be poor than those living with parents, but in many other countries the
difference is insignificant – and in the Southern countries plus Ireland, those living as
part of a couple are actually less likely to be poor than those living with parents. Thus,
in most countries, these figures suggest that for young people it is not living with
parents per se which is protective against poverty, but rather not living alone.
Returning to the question of high youth poverty rates in the social democratic countries,
the differentials between those living alone and others suggest that youth poverty in
these countries is to a degree attributable to the high proportions living alone. However,
this cannot be the whole story. Among those living alone, poverty rates are far higher in
the social democratic countries than elsewhere – only in the UK and France are they of
a similar magnitude. Thus, the very high poverty rates observed in the social democratic
countries are not simply a compositional effect driven by young people’s living
arrangements, but rather they relate both to high proportions of young people living
alone, and high poverty rates among those who do live alone.

37
Figure 7.9: Poverty rates of 20-24-year-olds, by household composition
0%
20%
40%
60%
80%
FIN DEN NETH UK IRE FRA GER AUS BEL POR SPA ITA GRE
Social Democratic Liberal Corporatist Southern
Single Couple Living with parents or in-laws

38
Children
The previous discussion focused on young people without children. We now turn our
attention to young people who have children of their own, comparing them to their
childless counterparts. Figure 7.10 presents poverty rates for two groups of young
people: those aged 20-24 (among whom only 7% live with children), and those aged 25-
29 (among whom 27% live with children).
♦ In nearly every country, couples with children are at higher risk of poverty than
couples without children. The exceptions are Finland and Denmark (for the
younger age group), where the opposite is true.
♦ The country with the most noticeably increased risk of poverty for couples with
children is Ireland, where for the younger age group, the risk of poverty is
almost twenty times higher for couples with children than for couples without.
The risk is also much increased in the UK, Belgium and Italy.
♦ In nearly every country, lone parents are at a higher risk of poverty than single
adults. The exceptions are the social democratic group of countries plus
Austria, where lone parents are at lower risk of poverty than single adults.
♦ Lone parents appear worst off relative to single adults in the Southern countries
(where there are very few lone parents), and also in Germany and (for the older
age group) the UK and France.
♦ In all countries – even the Scandinavian countries, which have the most highly
developed anti-poverty programmes for lone parents – lone parent families
with children are at higher risk of poverty than couples with children.

39
Figure 7.10: Poverty rates, by presence of children
0%
20%
40%
60%
80%
FIN DEN NETH UK IRE FRA GER AUS BEL POR SPA ITA GRE
0%
20%
40%
60%
80%
FIN DEN NETH UK IRE FRA GER AUS BEL POR SPA ITA GRE
Social Democratic Liberal Corporatist Southern
Single person Lone parent Couple, no children Couple, with children

40
Poverty rates by activity status
As well as living arrangements, a young person’s risk of poverty is liable to be affected
by his or her activity status. Students, the unemployed, and those looking after homes
and families or otherwise economically inactive, will be without earned incomes of their
own, and thus will be at higher risk of poverty than those in work. And, of course, as
Table 6.4 show, all these groups are highly represented among the young: students
mainly in the youngest age group, the unemployed mainly in the middle age group, and
other economically inactive predominantly among women in the oldest age group.
Figure 7.11: Poverty rates by activity status
Aged 16-19
0%
20%
40%
60%
FIN DEN NETH UK IRE FRA GER AUS BEL POR SPA ITA GRE
Student Working Unemployed Other
Aged 20-24
0%
20%
40%
60%
FIN DEN NETH UK IRE FRA GER AUS BEL POR SPA ITA GRE
Aged 25-29
0%
20%
40%
60%
FIN DEN NETH UK IRE FRA GER AUS BEL POR SPA ITA GRE

41
Figure 7.11 shows that the risk of poverty varies greatly by activity status. Not
unexpectedly, young people with jobs are in general the least likely to be poor. For the
older two age groups, this is true for all countries, with the effect particularly marked in
the oldest age group, for whom poverty levels among those in work are under 10% in all
countries, and well under 10% in most. However, for the youngest age group, poverty
levels for those in work are considerably higher. Only in Denmark are they under 10%,
and in Finland, Belgium, Spain and Greece they are over 20%. In several countries,
poverty rates are actually higher among those in work than among students. This partly
reflects the higher propensity of students to remain in the parental home compared to
those with a job, but it also raises questions about the sufficiency of young people’s
wages.
It is worth devoting particular attention to the social democratic countries, since as we
have previously remarked, they have particularly high rates of youth poverty, and as
Figure 7.10 shows, they demonstrate a rather different distribution of youth poverty
from the other countries. In particular, the higher level of student poverty among the
two older groups stands out in the social democratic countries. How far is this
responsible for high overall rates of poverty in these countries? In Denmark, the rate of
poverty among those in work, the unemployed and the economically inactive are
generally lower (and in some cases much lower) than cross-country averages – and thus,
the Danish peak in youth poverty rates may largely be attributed to the high level of
poverty among students. In the Netherlands, poverty rates among the other occupational
groups are higher than cross-country averages, but they are far from being the highest in
the sample. In the Netherlands, therefore, student poverty is not solely responsible for
high youth poverty rates, and some contribution is also made by relatively high poverty
rates among other groups. In Finland, poverty rates are low among the economically
inactive, but tend to be high among the unemployed and those with jobs. Since the
numbers economically inactive are small relative to the other groups, it appears that the
main driver behind youth poverty is student poverty, but that poverty among those with
jobs and the unemployed also contribute.

42
Changes in poverty rates over time
So far, all the analysis in this paper has used a pooled sample over all the waves of data
available for each country. For those countries which were present from the start of the
ECHP survey, this includes seven years from 1994-2000. For countries joining the
survey late, there are one (Austria) or two (Finland) years missing from the beginning.
For all countries, pooling the data in this way may mask changes in poverty rates over
time. In particular, for the UK, the incoming 1997 government made a priority of
reducing poverty, particularly for families with children, and there is a good case for
examining whether any changes are visible between the years pre- and post-1997.
Figure 7.12: Changes over time in UK poverty rates
0%
10%
20%
30%
40%
0 10 20 30 40 50 60 70
Age
% p
oor
(in
com
e u
nd
er 6
0% m
edia
n)
UK: waves 1 and 2 (1994-5)
UK: waves 7 and 8 (1999-2000)
In order to examine the extent of changes over time, we select two years from the
beginning of the time period studied – 1994 and 1995 – and two years from the end –
1999 and 2000. Figure 7.12 shows how age/poverty profiles differ between these two
sets of years. It appears that in the UK, poverty rates for families with young children

43
under five did indeed fall substantially, while poverty rates for families with older
children also fell, but much more modestly. However, there also appears to have been a
fall of around five percentage points in the poverty rates of young adults.
This exercise for the UK may be repeated for other countries. Figure 7.13 shows
changes in poverty rates between 1994-5 and 1999-2000 in all countries, for two groups
of children and the three groups of young people defined earlier in this paper. In this
comparative context, two things become clear. First, reductions in poverty rates among
children and young people form a general trend across most (though not all) the
countries in this sample. Second, although poverty rates in the UK have fallen over the
period studied, the fall has not been dramatic in comparison to the fall in other countries
– particularly in comparison to its fellow member of the liberal welfare regime group,
Ireland.
This should not be taken as evidence that the poverty reduction measures introduced by
the UK government are ineffective, since it may simply mean that over the period
considered they had not had ample time to work. Although the ECHP survey was
terminated after the year 2001 (and thus, because of the way we construct the household
poverty measure, no years of data are available for analysis after 2000) it is in theory
possible to use later waves of the the British Household Panel Survey (BHPS) from
which the UK’s ECHP data are derived, to examine trends in UK poverty rates post-
2000.

44
Figure 7.13: Changes in poverty rates between 1994-5 and 1999-2000
Children aged 0-9
0%
10%
20%
30%
40%
DEN NETH UK IRE FRA GER AUS BEL POR SPA ITA GRE
1994-5 1999-2000
Children aged 10-15
0%
10%
20%
30%
40%
DEN NETH UK IRE FRA GER AUS BEL POR SPA ITA GRE
Young people aged 16-19
0%
10%
20%
30%
40%
DEN NETH UK IRE FRA GER AUS BEL POR SPA ITA GRE
Young people aged 20-24
0%
10%
20%
30%
40%
DEN NETH UK IRE FRA GER AUS BEL POR SPA ITA GRE
Young people aged 25-29
0%
10%
20%
30%
40%
DEN NETH UK IRE FRA GER AUS BEL POR SPA ITA GRE

45
Although there is not space in this paper for a more detailed analysis of the changes in
poverty rates, one fact deserves attention, namely that the most marked reduction in
poverty rates across Europe is seen in the 20-24 age group. The first explanation which
comes to mind is that youth labour markets may have changed over this period, and in
fact this appears to be the case. Figure 7.14 plots changes in unemployment rates in the
20-24 age group across Europe, and finds that they have fallen everywhere over the
period in question.
Figure 7.14: Changes in unemployment rates for the 20-24 age group
0
5
10
15
DEN NETH UK IRE FRA GER AUS BEL POR SPA ITA GRE
1994-5 1999-2000
8) CONCLUSIONS
In many ways, this is a paper of questions. We began with a question in the title: “Youth
Poverty in Europe: what do we know?” to which a short answer might be “much more
than before, but still not nearly enough”. We have presented many new findings in the
paper, but each time we have answered one question, several more questions have
emerged.
We have measured the extent of youth poverty across 13 countries, by age group, by
family structure and by employment status, and compared levels of youth poverty to
levels of poverty among other age groups. We have shown that young people in many
European countries are at higher-than-average risk of poverty, and that in some
countries, young people are more likely than almost any other group to be poor. We
have found significant variations by country, and we have also identified situations
which put young people at particular risk of poverty.

46
The findings in this paper are too diverse to attempt to summarise fully here. A few key
findings are:
♦ Young people’s living arrangements and activity status varies widely between
countries, with these variations being reflected in the risk of poverty experienced
by young people in each country.
♦ Living in one’s family of origin, or living as a couple but without children, tend
to protect young people against poverty, whereas living alone, or as a lone
parent, tend to increase the risk.
♦ Not having a job, whether one is a student, unemployed, or out of the labour
force, increases the risk of poverty, while having a job tends to protect young
people against poverty
♦ Leaving aside those over 70, who in most countries suffer high rates of poverty,
we find that in Finland, Denmark and the Netherlands, young people are at a
higher risk of poverty than any other age group, with youth poverty rates among
the highest in Europe. In the UK, young people are less susceptible to poverty
than children, but more susceptible than any other age group. In France,
Germany, Austria and Belgium, poverty rates vary less with age, but in France
particularly, young people suffer disproportionately from poverty. In Greece,
Spain and Portugal, youth poverty rates are high in relation to most other
countries, but not particularly high compared to other age groups in their own
countries. In Italy, youth poverty rates are very high in comparison to other
countries, and also in comparison to other age groups in Italy.
♦ In almost all countries, the risk of poverty declines with age over the twenties,
and is lower in the thirties than in the twenties. This is partly driven by changes
in occupational status among young people (who are less likely to be studying or
unemployed at later ages), but also by a reduced risk of poverty within groups:
for example, those with a job are less likely to be poor in their late twenties than

47
in their teens or early twenties. However, this is offset by the fact that more
young people have left home at later ages, and more of them have had children.
♦ Between the years 1994-5 and 1999-2000, youth poverty rates in nearly all
countries fell. This is at least partly attributable to a drop in youth
unemployment rates over this period.
Given that the existing literature on youth poverty is so scant, perhaps one of the main
contributions of this paper has been to demonstrate that youth poverty is a major
problem in many parts of Europe, and thus to identify this area of investigation as one
wide open for further research. The list of potential questions for further research is
enormous, but some of the most important questions generated by our research are as
follows:
♦ This paper has touched only marginally on gender differences in poverty rates.
This is potentially an extremely important issue and one that deserves prompt
attention.
♦ We have found that the risk of poverty is associated with employment status, but
we have not examined the impact of insecure or other non-standard employment
on youth poverty. Nor have we looked at wage distributions and the impact on
low wages.
♦ Iacovou and Berthoud (2001) provide evidence that the very highest risk of
poverty arises at particular intersections of family and labour market situations.
We have not explored these interactions in this paper, but this is clearly a fruitful
avenue for further research.
♦ This paper has dealt only with cross-sectional statistics of a descriptive nature.
Clearly this is only a first step, and says little about the processes behind youth
poverty. As a panel data set, the ECHP lends itself to analysis of the longitudinal
aspects of youth poverty.

48
♦ One simple exercise which we have suggested, particularly in relation to youth
poverty in the social democratic countries, is to examine the length of spells in
poverty. If high youth poverty rates at a national level are caused by a majority
of young people experiencing a year or two in poverty, with a high probability
of exit thereafter, this denotes a far less serious problem than a smaller
“underclass” subject to persistent poverty, and a low probability of exiting
poverty.
♦ Additionally, it would be useful to look at the events which trigger entries to
and/or exits from poverty, rather than the situations with which poverty is
associated in a cross-sectional context: losing or gaining a job, finding or
splitting from a partner, childbirth, and so on.
♦ In this paper, we have focused on measures of relative poverty based on
percentages of national median household equivalent income. Although these
measures are widely used, they are subject to a number of criticisms outlined in
section 3 of the paper, and there is a case for repeating the analysis using
alternative measures of poverty. In the ECHP, subjective measures of economic
sufficiency, and measures of material deprivation, are available.
♦ There is some evidence that the high rates of poverty experienced by young
people living alone are the function of equivalence scales. This could be
addressed by looking at alternative measures of poverty, such as subjective
measures, or by experimenting with alternative equivalence scales.
Some of these issues we intend to research ourselves. But we hope other investigators
will join us – we have raised enough questions here to keep several teams of researchers
busy for years.

49
9) REFERENCES
Aassve, A., S. Mazzucco and L. Mencarini (2004), Childbearing and Wellbeing: a comparative analysis of the European community, Journal of European Social Policy (forthcoming).
Beaujot, R. and J. Liu (2002) Children, Social Assistance and Outcomes: Cross National Comparisons. LIS Working Paper no. 304, Luxembourg.
Berthoud, R. & K. Robson (2003) Early Motherhood and Disadvantage: A Comparison Between Ethnic Groups ISER working paper no. 2003-29, Colchester, Essex.
Berthoud, R. (2004) Patterns of Poverty Across Europe Policy Press.
Boys, A., J. Marsden and J. Strang (2001). Understanding reasons for drug use amongst young people: a functional perspective. Health Education Research, Vol. 16, No. 4, 457-469, August 2001.
Bradbury, B. and M. Jantti (1999), Child Poverty Across Industrialized Nations, Innocenti Occasional
Papers Economic and Social Policy Series no. 71, September 1999. UNICEF, Florence.
Bradshaw (2001) Methodologies To Measure Poverty: More Than One Is Best! Paper For International Symposium Poverty: Concepts And Methodologies Mexico City March 28/29 2001
Brewer, M. A. Goodman, J. Shaw and A. Shephard (2005) Living standards, inequality and poverty: 2005 election briefing note no. 9, IFS: London
Browning, M., F. Bourguignon, P.-A. Chiappori and V. Lechene. (1994), Income and Outcomes: a structural model of intra-household allocation. Journal of Political Economy 102:6 pp. 1067-1096.
Cantillon, B. and K. Van den Bosch (2003), Social Policy Strategies to Combat Income Poverty of Children and Families in Europe, Maxwell School of Citizenship and Public Affairs working paper no. 336 (January 2003), Syracuse University, New York.
Cantó-Sanchéz, O. and M. Mercader-Prats (1999), Poverty among children and youth in Spain: the role of parents and youth employment status. Document de Treball 99.07, Departament d’Economia Aplicada, Universitat Autònoma de Barcelona.
Catan, L. (2004), Becoming adult: changing youth transitions in the 21st century Trust for the Study of Adolescence. Brighton, UK.
Corijn, M. and Klijzing, E. (2001) Transitions to Adulthood in Europe European Association for Population Studies, Kluwer: Dordrecht-Boston-London.
de Vos, K. and M. A. Zaidi (2003), Equivalence Scale Sensitivity of Poverty Statistics for the Member States of the European Community Review of Income & Wealth Vol. 43 no. 3 pp. 319-33.
Esping-Andersen, G. (1990), Three Worlds of Welfare Capitalism, Cambridge: Polity Press.

50
Esping-Andersen, G. (1999), Social Foundations of Post Industrial Economies, Oxford: Oxford University Press.
European Commission (2001), European Commission White Paper: A New Impetus for European Youth. Commission of the European Communities, Brussels 2001.
EUROSTAT (2002), Income, Poverty and Social Exclusion: second report, European Social Statistics, Luxembourg, pp. 76 – 92.
Fahmy (2002) Youth, Poverty and Social Exclusion Working Paper 27, Townsend Centre for International Poverty Research, University of Bristol.
Ferrara, M. (1999), The “southern model” of welfare in social Europe, Journal of European Social
Policy, 6 (1) pp. 179-189.
Fouarge D. and R. Layte (2003), Duration of poverty spells in Europe EPAG working paper 47, Colchester, University of Essex.
Garfinkel, I. L. Rainwater and T. Smeeding (2004) Welfare State Expenditures and the Distribution of Child Opportunities. LIS Working Paper no. 379, Luxembourg.
Hammer, T. (2003) Youth Unemployment and Social Exclusion in Europe Policy Press, Bristol 2003.
Heuberger, R. (2003) “What household gets what income?” Conference paper, EPUNET conference 2003, Essex, UK.
Iacovou, M. (2002), Regional Differences in the Transition to Adulthood Annals of the American Association of Political and Social Science, no. 580, pp 40-69.
Iacovou, M. and R. Berthoud (2001) Young People’s Lives: A Map of Europe. Colchester: University of Essex, Institute for Social and Economic Research.
Jones, G. (2002), The youth divide: diverging paths to adulthood, Joseph Rowntree Foundation, York, UK.
Kangas, O. and J. Palme. 2000.‘Does Social Policy Matter? Poverty Cycles in the OECD Countries.’ International Journal of Health Services 30:335--52.
Layte R, and C. T. Whelan (2002), Moving in and out of poverty: the impact of welfare regimes on poverty dynamics in the EU, EPAG working paper no. 30, Colchester, University of Essex.
Layte R. and C. T. Whelan (2001), Cumulative disadvantage or individualisation? A comparative analysis of poverty risk incidence. EPAG working paper 22, Colchester, University of Essex.
Lundberg, S., Pollak, R. A. and T. J. Wales (1997) Do husbands and wives pool their resources? Evidence from the U.K. child benefit Journal of Human Resources vol. 32 no. 3 pp 463-480.

51
McElroy, M. B. and M. J. Horney (1981) Nash-bargained Decisions: Toward a Generalization of the Theory of Demand International Economic Review, June 1981, pp. 333-349.
Mejer, J. (2000) Social Exclusion in EU Member States. Luxembourg: EUROSTAT
Micklewright (2004) Child poverty in English-speaking countries LIS working paper no. 376, Syracuse University, New York.
OECD (2001) When Money Is Tight: Poverty Dynamics in OECD Countries OECD Employment Outlook 2001: Paris, France.
Office for National Statistics (2004), Social Trends HMSO, London.
Palmer, G., J. North, J. Carr and P. Kenway (2003) Monitoring Poverty and Social Exclusion 2003. Joseph Rowntree Foundation, York, UK.
Pavis, S., S. Platt and G. Hubbard (2000) Young People in Scotland: Pathways to Social Inclusion and
Exclusion Joseph Rowntree Foundation 2000.
Ravallion M. and B. Bidani (1994), How robust is a poverty profile? World Bank Economic Review, Vol. 8, No. 1: 75-102.
Rowntree, S. (1901) Poverty: the study of Town Life London: Macmillan.
Rugg, J. (1999), Young People, Housing and Social Policy Routledge, London, 1999.
Russell, H. and P. O’Connell (2001), Getting a Job in Europe: the transition from unemployment to work among young people in nine European countries. Work, Employment and Society Vol. 15,No. 1, pp. 1–24.
Schizzerotto, A. and M. Lucchini (2004), Transitions to Adulthood in Berthoud, R. and M. Iacovou (eds) Social Europe: Living Standards and Welfare States, Edward Elgar, Cheltenham, UK, 2004, pp. 46-68.
Shucksmith, J. and J. Spratt (2002), Young people’s self identified health needs HEBS Young People and Health Initiative Working Paper, University of Aberdeen, 2002.
Smeeding, T. and K. Ross Phillips (2002) “Cross-National Differences in Employment and Economic Sufficiency” Annals of the American Association of Political and Social Science, no. 580, pp 103-133.
dmeeding, T. K. Ross, P. England, K. Christopher and S. McLanahan (1999) Poverty and Parenthood across Modern Nations: Findings from the Luxembourg Income Study LIS Working Paper no. 194, Luxembourg.
Whelan C. T., R. Layte and B. Maitre (2003), Poverty, deprivation and time: a comparative analysis of the structure of disadvantage, EPAG working paper no. 48, Colchester, University of Essex.

52
Appendix Table 6.1 (relating to Figure 6.1): Proportion of young people who have left the parental home, by age group and country
Age 16-19 Age 20-24 Age 25-29
Finland 7.1 57.7 89.8
Denmark 6.9 59.1 94.3
Netherlands 4.2 53.4 90.3
UK 11.9 44.5 79.1
Ireland 1.2 13.9 49.9
France 5.3 30.2 73.8
Germany 2.9 28.9 68.5
Austria 3.2 28.2 61.7
Belgium 0.9 17.3 67.4
Portugal 2.8 12.2 40.0
Spain 1.0 6.8 34.0
Italy 1.2 7.2 32.2
Greece 3.2 19.0 42.8

53
Table 6.2A (relating to Table 6.2 in the text, with the addition of two extra age groups): Living arrangements, by country, age and sex.
Men, aged 16-19
With parents
Couple, no children
Couple, with
children
Single, living alone
Lone parent
Other
Finland 97.3 0.7 0.0 1.4 0.0 0.6
Denmark 96.8 0.8 0.0 2.0 0.0 0.4
Netherlands 98.1 0.2 0.1 1.5 0.0 0.3
UK 94.1 0.5 0.3 3.6 0.0 1.5
Ireland 99.6 0.0 0.0 0.1 0.0 0.3
France 98.2 0.1 0.0 1.4 0.0 0.3
Germany 99.0 0.1 0.0 0.7 0.0 0.2
Austria 98.5 0.0 0.0 0.5 0.0 1.1
Belgium 99.8 0.0 0.0 0.0 0.0 0.1
Portugal 99.5 0.1 0.1 0.0 0.0 0.4
Spain 99.7 0.1 0.0 0.0 0.0 0.2
Italy 99.3 0.0 0.0 0.3 0.0 0.5
Greece 99.0 0.1 0.0 0.5 0.0 0.4
Women, aged 16-19
With parents
Couple, no children
Couple, with
children
Single, living alone
Lone parent
Other
Finland 92.2 2.5 0.4 4.7 0.0 0.2
Denmark 93.2 3.8 0.5 1.8 0.1 0.7
Netherlands 97.3 0.9 0.0 1.7 0.0 0.1
UK 89.4 2.2 1.3 4.5 0.7 1.9
Ireland 98.9 0.1 0.1 0.1 0.1 0.8
France 95.3 1.2 0.3 1.8 0.1 1.4
Germany 97.8 0.7 0.3 0.8 0.2 0.3
Austria 95.9 0.7 0.9 1.4 0.2 0.9
Belgium 99.3 0.4 0.1 0.2 0.0 0.0
Portugal 97.8 0.7 0.9 0.1 0.0 0.5
Spain 98.9 0.2 0.2 0.2 0.0 0.6
Italy 99.3 0.3 0.1 0.2 0.0 0.2
Greece 97.9 0.4 0.4 0.6 0.0 0.7
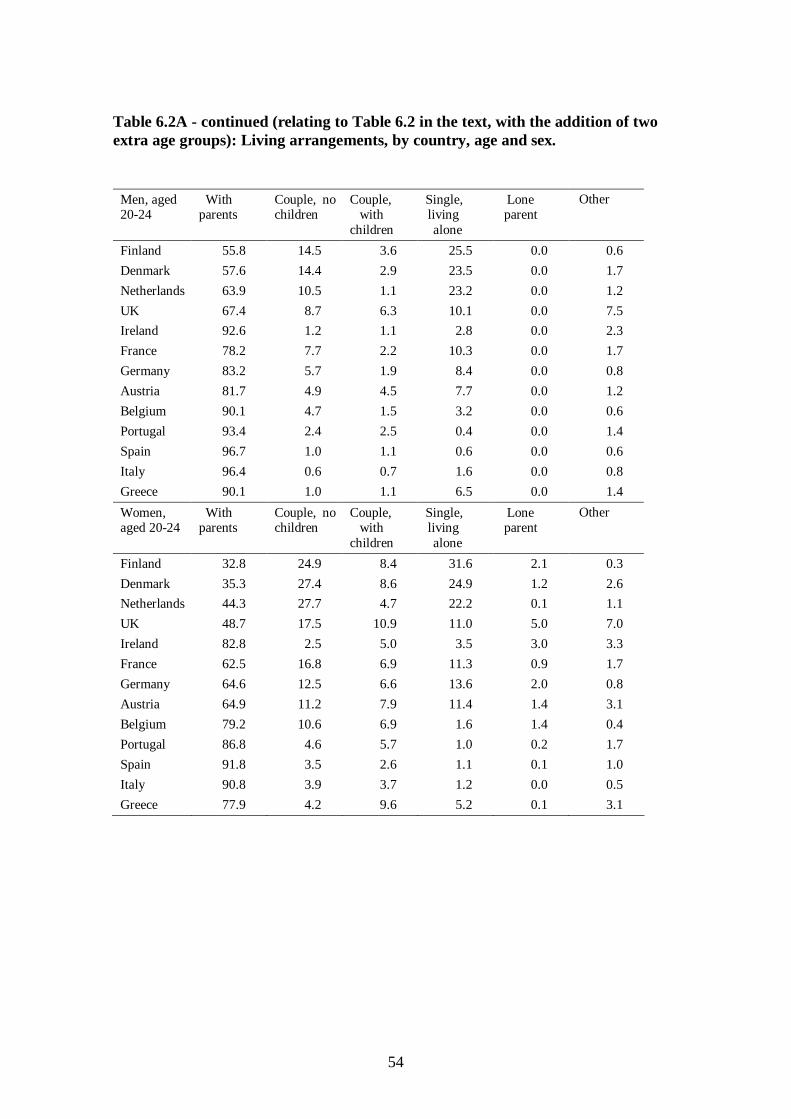
54
Table 6.2A - continued (relating to Table 6.2 in the text, with the addition of two extra age groups): Living arrangements, by country, age and sex.
Men, aged 20-24
With parents
Couple, no children
Couple, with
children
Single, living alone
Lone parent
Other
Finland 55.8 14.5 3.6 25.5 0.0 0.6
Denmark 57.6 14.4 2.9 23.5 0.0 1.7
Netherlands 63.9 10.5 1.1 23.2 0.0 1.2
UK 67.4 8.7 6.3 10.1 0.0 7.5
Ireland 92.6 1.2 1.1 2.8 0.0 2.3
France 78.2 7.7 2.2 10.3 0.0 1.7
Germany 83.2 5.7 1.9 8.4 0.0 0.8
Austria 81.7 4.9 4.5 7.7 0.0 1.2
Belgium 90.1 4.7 1.5 3.2 0.0 0.6
Portugal 93.4 2.4 2.5 0.4 0.0 1.4
Spain 96.7 1.0 1.1 0.6 0.0 0.6
Italy 96.4 0.6 0.7 1.6 0.0 0.8
Greece 90.1 1.0 1.1 6.5 0.0 1.4
Women, aged 20-24
With parents
Couple, no children
Couple, with
children
Single, living alone
Lone parent
Other
Finland 32.8 24.9 8.4 31.6 2.1 0.3
Denmark 35.3 27.4 8.6 24.9 1.2 2.6
Netherlands 44.3 27.7 4.7 22.2 0.1 1.1
UK 48.7 17.5 10.9 11.0 5.0 7.0
Ireland 82.8 2.5 5.0 3.5 3.0 3.3
France 62.5 16.8 6.9 11.3 0.9 1.7
Germany 64.6 12.5 6.6 13.6 2.0 0.8
Austria 64.9 11.2 7.9 11.4 1.4 3.1
Belgium 79.2 10.6 6.9 1.6 1.4 0.4
Portugal 86.8 4.6 5.7 1.0 0.2 1.7
Spain 91.8 3.5 2.6 1.1 0.1 1.0
Italy 90.8 3.9 3.7 1.2 0.0 0.5
Greece 77.9 4.2 9.6 5.2 0.1 3.1

55
Table 6.2A - continued (relating to Table 6.2 in the text, with the addition of two extra age groups): Living arrangements, by country, age and sex.
Men, aged 25-29
With parents
Couple, no children
Couple, with
children
Single, living alone
Lone parent
Other
Finland 14.5 27.5 27.0 29.7 0.1 1.3
Denmark 10.0 36.4 25.3 26.0 0.4 2.0
Netherlands 21.3 40.7 12.7 24.0 0.0 1.4
UK 31.3 26.9 23.1 12.0 0.1 6.5
Ireland 60.1 7.9 19.3 8.3 0.0 4.4
France 33.6 24.0 25.7 15.5 0.1 1.2
Germany 43.9 17.5 16.3 20.9 0.1 1.4
Austria 53.7 11.3 18.0 14.4 0.1 2.5
Belgium 49.7 22.3 18.6 9.1 0.0 0.3
Portugal 72.0 8.8 16.4 1.7 0.0 1.1
Spain 76.1 11.1 8.5 3.0 0.0 1.4
Italy 78.7 8.2 7.6 4.0 0.0 1.5
Greece 75.0 7.6 11.4 4.7 0.0 1.4
Women, aged 25-29
With parents
Couple, no children
Couple, with
children
Single, living alone
Lone parent
Other
Finland 4.9 26.2 39.6 22.1 6.3 1.0
Denmark 5.0 37.0 39.5 12.5 4.4 1.7
Netherlands 4.7 51.3 23.8 17.3 2.3 0.5
UK 15.3 29.1 32.4 8.0 10.6 4.7
Ireland 46.3 11.5 28.1 4.1 5.2 4.8
France 19.4 22.7 41.8 12.1 2.7 1.3
Germany 23.5 22.7 30.2 18.8 3.7 1.0
Austria 33.1 15.5 33.6 12.3 4.4 1.2
Belgium 24.2 27.3 37.5 8.0 2.5 0.5
Portugal 56.0 8.7 30.6 2.0 1.5 1.2
Spain 61.3 14.4 18.7 2.9 0.3 2.3
Italy 59.0 13.6 22.3 3.7 0.5 0.9
Greece 45.0 11.0 37.8 4.4 0.5 1.5

56
Table 6.3 (relating to Figure 6.3): Percentages of young people in non-standard living arrangements
As a percentage of all young people
As a percentage of those who have left home
Age
16-19
Age
20-24
Age
25-29
Age
16-19
Age
20-24
Age
25-29
Finland 0.42 0.39 1.07 5.99 0.68 1.19
Denmark 0.48 2.14 1.87 7.35 3.69 1.99
Netherlands 0.21 1.11 0.78 5.87 2.09 0.86
UK 2.07 7.68 5.70 18.80 17.86 7.27
Ireland 0.49 2.83 4.60 59.94 21.92 9.36
France 0.93 1.71 1.36 20.69 5.81 1.85
Germany 0.32 0.80 0.98 14.03 2.85 1.45
Austria 0.98 2.19 1.69 34.88 8.51 3.01
Belgium 0.19 0.41 0.57 27.30 2.47 0.85
Portugal 0.56 1.41 1.08 30.48 14.24 3.03
Spain 0.28 0.78 1.91 39.85 13.28 5.96
Italy 0.31 0.67 1.28 38.45 10.45 4.17
Greece 0.60 2.28 1.48 29.43 14.02 3.75
Table 7.1 (relating to Figures 7.1-7.3) Poverty rates (60% median) by country and age group
0-15 16-19 20-24 25-29 30-39 40-49 50-59 60-69 70+
Finland 6.2 12.5 29.4 12.8 5.3 8.6 8.1 10.9 19.8
Denmark 4.6 8.5 20.7 8.9 3.8 3.4 4.8 14.0 36.4
Netherl’s 13.4 17.7 27.2 12.1 8.0 7.4 6.8 6.4 5.3
UK 26.7 22.4 19.9 14.6 14.1 10.3 10.0 16.1 30.3
Ireland 27.0 24.4 11.8 14.4 17.7 19.5 14.8 25.0 39.1
France 16.6 21.1 21.0 11.3 11.1 11.2 12.6 14.9 20.8
Germany 13.2 13.1 13.3 10.9 8.6 8.8 10.8 11.9 13.4
Austria 12.4 9.3 8.4 8.5 8.9 8.0 8.4 15.1 23.5
Belgium 14.9 18.3 14.1 9.6 9.7 11.9 12.5 21.9 29.2
Portugal 19.0 14.7 9.5 8.9 12.9 12.3 13.2 22.0 31.3
Spain 24.5 24.6 17.6 13.7 16.6 17.7 16.6 15.8 16.1
Italy 22.9 27.3 24.7 19.3 15.2 17.1 17.1 14.8 15.8
Greece 17.1 20.8 18.7 13.2 12.8 15.6 18.2 26.1 33.9

57
Table 7.7 (relating to Figure 7.7): Percentages of young people living in poverty (defined as 60% median household equivalent income), by whether living in parental home
16-19 20-14 25-29
Left parental
home
Still in parental home
Left parental
home
Still in parental home
Left parental
home
Still in parental home
Finland 87.8 8.3 47.5 6.8 13.7 5.2
Denmark 44.6 6.2 32.4 4.6 9.2 3.2
Netherlands 71.2 16.0 42.3 10.3 12.8 5.7
UK 70.5 17.0 33.8 6.9 16.7 4.5
Ireland 19.8 24.5 27.7 9.2 21.9 6.6
France 63.9 19.4 32.7 15.8 11.6 10.7
Germany 53.7 12.2 27.7 7.7 13.9 4.1
Austria 26.9 8.8 18.5 4.2 11.2 4.0
Belgium 37.7 18.2 24.6 11.9 12.1 4.5
Portugal 22.5 14.5 14.2 8.9 10.0 8.2
Spain 34.5 24.5 24.5 17.1 17.6 11.6
Italy 61.6 27.0 37.4 23.7 20.4 18.8
Greece 28.2 20.6 24.7 17.3 14.3 12.3 Table 7.8 (relating to Figure 7.8): Differences in poverty rates between those who have and have not left home, by the proportion of young people who have left home (those aged 20-24)
% who have left home
% of those who have left home who are poor
Finland 57.7 40.7
Denmark 59.1 27.9
Netherlands 53.4 32.0
UK 44.5 26.9
Ireland 13.9 18.4
France 30.2 16.9
Germany 28.9 20.0
Austria 28.2 14.3
Belgium 17.3 12.7
Portugal 12.2 5.3
Spain 6.8 7.4
Italy 7.2 13.7
Greece 19.0 7.3

58
Table 7.9 (relating to Figure 7.9): Poverty rates among those aged 20-24 without children, by household composition
Single Couple Living with parents or in-laws
Finland 69.3 26.9 7.3
Denmark 57.9 11.8 4.7
Netherlands 71.6 10.5 12.1
UK 56.8 10.6 8.1
Ireland 37.4 2.4 10.9
France 55.6 17.4 16.8
Germany 43.4 10.1 8.0
Austria 33.5 9.8 4.6
Belgium 40.0 11.9 12.0
Portugal 22.6 5.6 9.2
Spain 19.9 14.5 18.1
Italy 44.3 21.6 24.6
Greece 36.4 9.4 17.4
Table 7.11 (relating to Figure 7.11): Percentage poor comparing those with and without children, ages 20-24 and 25-29
Age 20-24 Age 25-29
Single person
Lone parent
Couple, no
children
Couple with
children
Single person
Lone parent
Couple, no
children
Couple with
children
Finland 69.3 40.5 26.9 31.3 23.4 6.4 6.8 19.8
Denmark 57.9 23.2 11.8 23.1 15.1 4.8 5.1 5.2
Netherl’s 71.6 37.0 10.5 26.8 55.9 3.6 18.9 30.6
UK 56.8 57.7 10.6 16.8 66.3 3.0 29.4 38.6
Ireland 37.4 55.7 2.4 11.2 56.5 3.6 33.7 46.5
France 55.6 68.4 17.4 13.9 59.3 5.3 14.9 22.2
Germany 43.4 75.6 10.1 25.7 62.6 5.1 11.3 28.6
Austria 33.5 25.5 9.8 21.1 28.8 3.8 11.2 11.5
Belgium 40.0 47.8 11.9 20.9 48.2 3.6 15.2 38.7
Portugal 22.6 56.7 5.6 13.3 63.2 3.1 10.9 23.9
Spain 19.9 43.6 14.5 13.5 52.1 7.1 28.1 38.4
Italy 44.3 56.1 21.6 21.4 40.3 10.4 28.6 49.6
Greece 36.4 69.1 9.4 13.7 39.7 6.6 16.0 19.4

59
Table 7.13 (relating to Figure 7.13): Poverty rates in 1994-5 and 1999-2000 (percentages)
Age 0-9 Age 10-15 Age 16-19 Age 20-24 Age 25-59
1994-5 1999-2000
1994-5 1999-2000
1994-5 1999-2000
1994-5 1999-2000
1994-5 1999-2000
Denmark 3.9 4.2 7.8 5.2 9.5 8.1 18.0 26.7 6.2 14.0
Netherl’s 12.4 14.6 13.0 14.9 19.0 16.1 27.2 21.3 12.1 12.0
UK 28.6 26.1 25.0 24.1 25.1 23.4 22.3 17.7 14.4 14.5
Ireland 28.4 23.2 34.0 23.9 28.8 18.5 12.4 9.5 15.0 14.8
France 14.7 16.4 17.2 19.2 22.2 20.8 22.7 18.5 11.0 11.7
Germany 14.5 11.5 15.3 12.6 14.2 11.8 15.9 11.9 12.4 11.3
Austria 14.2 10.7 12.7 11.9 8.6 10.0 8.7 6.8 8.2 9.4
Belgium 16.3 11.8 18.3 12.0 20.3 14.8 16.4 10.3 11.5 8.2
Portugal 16.7 19.2 22.2 22.3 13.8 17.5 10.8 9.9 9.3 9.5
Spain 21.1 21.2 26.0 26.1 23.7 23.2 18.3 13.2 13.6 11.6
Italy 22.2 21.5 28.3 24.8 31.7 22.3 26.0 22.5 19.1 19.1
Greece 18.5 14.5 20.4 17.8 23.3 17.2 19.2 15.5 13.9 12.5
Table 7.14 (relating to Figure 7.14): Unemployment rates for the 20-24 age group
1994-5 1999-2000
Denmark 8.4 3.4
Netherl’s 7.6 4.9
UK 5.1 2.5
Ireland 9.9 5.5
France 8.2 6.4
Germany 6.2 5.6
Austria 3.3 2.6
Belgium 7.1 5.5
Portugal 6.0 4.5
Spain 10.5 7.8
Italy 9.1 7.9
Greece 7.9 5.6