Ximungo - Gates Open Research
123
Ximungo Consultores ZAMBIA 2010 PUBLIC EXPENDITURE REVIEW BACKGROUND PAPER AGRICULTURAL INNOVATION AND PUBLIC EXPENDITURE Dieter Orlowski Chris Coulter Mick Mwala Monika Orlowski 28 April 2010
-
Upload
khangminh22 -
Category
Documents
-
view
3 -
download
0
Transcript of Ximungo - Gates Open Research

Ximungo Consultores
ZAMBIA
2010 PUBLIC EXPENDITURE REVIEW
BACKGROUND PAPER
AGRICULTURAL INNOVATION AND PUBLIC
EXPENDITURE
Dieter Orlowski Chris Coulter Mick Mwala Monika Orlowski
28 April 2010

Ximungo Consultores
ii[agper-zambia_2010_final.doc – 7/05/10 16:20]
This report has been prepared for the Zambia 2010 Public Expenditure Review. It has been prepared with the financial support of the Norwegian Embassy for the general research and analysis, and the Swedish Embassy in Lusaka who provided finance for a gender specialist.
The views expressed in this report are those of the authors and may not necessarily reflect those of Sida, the Norwegian Government or the Ministry of Agriculture and Cooperatives.
The authors would like to express their appreciation of the assistance provided by the officials and representatives of non-governmental organisations with whom they met during their field visits that took place from in December 2009 and February 2010.

Ximungo Consultores
iii[agper-zambia_2010_final.doc – 7/05/10 16:20]
Contents
Executive Summary 1
Objective and Scope 1
Findings 1
Recommendations 7
1. Introduction 11
2. The Context: Recent Trends in the Agriculture Sector 15
2.1 Production Trends 15
2.2 Public Expenditure 26 2.2.1 Origin of Fiscal Data and Methodology 26 2.2.2 Overview of Expenditure on Agriculture 31 2.2.3 Spending on Technology-Enhancing Programmes 37 2.2.4. Budget Execution Rates 38
2.3 Donor Contributions 39
3. Public Expenditure and Technology and Innovation in Agriculture 42
3.1 Introduction 42
3.2 Agricultural Research 44 3.2.1 Overview of Actors and Types of Research 44 3.2.2 Public Research Institutions and Sources and Level of Funding 46 3.2.3 Semi-Private Research 50 3.2.4 UNZA and Research Coordination 53 3.2.5 Outputs and Outcomes from Research 54 3.2.6 Research Capacity 56 3.2.7 Conclusions and First Recommendations 60
3.3 Extension 61 3.3.1 Change of Public Agricultural Extension Services and How They
Are Organized Today 62 3.3.2 New Approaches, New Messages and the Changing Role of
Extension Officers 63

Ximungo Consultores
iv[agper-zambia_2010_final.doc – 7/05/10 16:20]
3.3.3 Extension Services Provided by Associations, Trusts and Commercial Companies 67
3.3.4 National Agricultural Information Service 68 3.3.5 Financial Situation of Public Extension 69 3.3.6 Personnel and Training Situation in Public Extension Services 73 3.3.7 The Role and Place of Public Extension in a Pluralistic Setting 74 3.3.8 Recommendations for the Public Extension Services 76
4. Gender and Expenditure on Agriculture in Zambia 80
4.1 Introduction 80
4.2 Gender and Agriculture in Zambia 81 4.2.1 Gender Analysis of the Agricultural Sector 81 4.2.2 Extension 84 4.2.3 Research and Higher Education 86 4.2.4 Technology 87 4.2.5 Markets 88 4.2.6 Cooperatives and associations 89
4.3 Gender in MACO’s organisational structures 90 4.3.1 Gender in MACO 90 4.3.2 Budget allocations 92 4.3.3 Monitoring and data collection 94
4.4 Challenges 95
4.5 Recommendations 96 4.1 General Recommendations 96 4.2 Specific Recommendations 97
5. Setting Priorities: The Processes of Financial Planning and Administration 99
5.1 The Budgeting Process 100
5.2 Budget Execution 100
6. Conclusions and Main Recommendations 103

Ximungo Consultores
v[agper-zambia_2010_final.doc – 7/05/10 16:20]
Annexes
Annex 1: Statistical Tables
Annex 2: List of Persons Met

Ximungo Consultores
vi[agper-zambia_2010_final.doc – 7/05/10 16:20]
List of Text Tables
Table 1: Share of “narrow agriculture” in “broad agriculture” in GDP statistics ........................ 17 Table 2: Yields and other characteristics of smallholder farm households ................................ 21 Table 3: Global government spending, 2004-2008 ................................................................... 33 Table 4: Weight and distribution of non-PE spending by groups of departments, actual
expenditure ..................................................................................................................... 37 Table 5: Budget execution rates for non-personnel expenditure.............................................. 39 Table 6: Comparison of internally and externally financed appropriations and
reported expenditure ...................................................................................................... 40 Table 7: Major contributors to externally funded expenditure in MACO according to
annual budget documents ............................................................................................... 41 Table 8: Actors and categories of agricultural research undertaken in Zambia ......................... 45 Table 9: Expenditure under the ZARI subhead ......................................................................... 48 Table 10: Financial sources of the Golden Valley Agricultural Research Trust (GART) ............... 52 Table 11: Currently registered crop varieties by public and private owner ............................... 55 Table 12: Staffing of ZARI (incl. agricultural research stations) ................................................. 57 Table 13: Researchers by degree level - regional comparison .................................................. 57 Table 14: Human resources of ZARI ......................................................................................... 59 Table 15: Spending by provincial and district agricultural offices ............................................. 71 Table 16: Planned and actual expenditure for Monze District .................................................. 72 Table 17: MACO staff disaggregated by sex, selection of professions....................................... 91 Table 18: Selected programmes, MACO, financial reports from the years 2006-2008.............. 93 Table 19: Gender Mainstreaming Programmes in the FNDP .................................................... 94
List of Figures
Figure 1: Real GDP Contribution of the Agriculture Sector ....................................................... 16 Figure 2: Percentage Contribution of Agriculture to GDP (Current Prices) ................................ 17 Figure 3: Area distribution by selected crops, average 2002-2009............................................ 20 Figure 4: Maize production trends ........................................................................................... 20 Figure 5: Cassava: Area planted............................................................................................... 22 Figure 6: Groundnuts: Area planted......................................................................................... 22 Figure 7: Groundnuts: Yield per hectare .................................................................................. 23

Ximungo Consultores
vii[agper-zambia_2010_final.doc – 7/05/10 16:20]
Figure 8: Cotton: Area planted and yield.................................................................................. 23 Figure 9: Wheat production..................................................................................................... 24 Figure 10: Soya area planted and production........................................................................... 24 Figure 11: Consumer price index, base 1994, and annual inflation ........................................... 28 Figure 12: Exchange rate of the Zambian Kwacha against the US-Dollar................................... 29 Figure 13: MACO spending by “core” and “FSP and FRA” in constant Kwacha .......................... 32 Figure 14: MACO spending by “core” and “FSP and FRA” in US-Dollar...................................... 32 Figure 15: Core MACO spending by broad groups of departments, in constant Kwacha ........... 34 Figure 16: Core MACO spending by broad groups of departments, in US-Dollar....................... 35 Figure 17: MACO Personal Emoluments by group of departments........................................... 35 Figure 18: Core MACO non-personnel expenditure by group of departments .......................... 36 Figure 19: Direct technology spending relative to MACO core spending .................................. 38 Figure 20: ZARI actual spending from budget sources.............................................................. 46 Figure 21: Spending by provincial and district agricultural offices ............................................ 70
Text Boxes
Box 1: Sources of statistics on agricultural production and their limitations ............................. 18 Box 2: "Special Years" .............................................................................................................. 36 Box 3: Impact of research technology on a farmer in Monze District........................................ 56 Box 4: The household approach............................................................................................... 65 Box 5: Conservation Farming ................................................................................................... 65 Box 6: CF in practice in Monze ................................................................................................. 66 Box 7: Definition of gender concepts ....................................................................................... 95

Ximungo Consultores
viii[agper-zambia_2010_final.doc – 7/05/10 16:20]
Acronyms and Abbreviations
ASIP Agricultural Sector Investment Programme
ASP Agricultural Support Programme
CA Conservation agriculture
CAADP Comprehensive African Agriculture Development Programme (NEPAD)
CASIPP “Conservation Agriculture Scaling up for Increased Productivity and Production” (Title of a project)
CEDAW Convention on the Elimination of All Forms of Discrimination against Women (UN Convention of 1979)
CEO Camp Extension Officer
CF Conservation farming
CFU Conservation Farming Unit
CIMMYT International Maize and Wheat Improvement Center
COMPACI Competitive African Cotton Initiative
CSO Central Statistical Office
DACO District Agricultural Coordination Office (or Officer)
FAO Food and Agriculture Organisation (of the UN system)
FNDP Fifth National Development Plan
FSRP Food Security Research Project
GART Golden Valley Agricultural Development Trust
GDP Gross Domestic Product
GDT Cotton Development Trust
GIDD Gender in Development Division
GRZ Government of the Republic of Zambia
IFPRI International Food Policy Research Institute
JICA Japanese development agency
M&E Monitoring and Evaluation
MACO Ministry of Agriculture and Cooperatives
MMD Movement for Multiparty Democracy (political party)
MoFNP Ministry of Finance and National Planning
NAI National Agriculture Information Services
NISIR National Institute for Scientifc and Industrial Research
NORAD Norwegian Agency for Development

Ximungo Consultores
ix[agper-zambia_2010_final.doc – 7/05/10 16:20]
PACO Provincial Agricultural Coordination Office (or Officer)
PE Personal Emoluments
PRSP Poverty Reduction Strategy Paper
Sida Swedish International Development Cooperation Agency
T&V Training and Visit (extension approach)
UNDP United Nations Development Programme
UNZA University of Zambia
USAID U.S. Agency for International Development
ZARI Zambia Agricultural Research Institute
ZNFU Zambia National Farmers Union

Ximungo Consultores
1[agper-zambia_2010_final.doc – 7/05/10 16:20]
Executive Summary
Objective and Scope
This report is a background study for the general Public Expenditure Review for Zambia, prepared for the Government of the Republic of Zambia (GRZ) in collaboration with Cooperating Partners and led by the World Bank. It looks into public spending in the agriculture sector in order to determine spending trends and patterns, examines what effects can be seen from this spending, and proposes how spending levels and patterns could be adjusted in order to better align expenditure with general and sector-specific policy objectives.
The analysis focuses on the contribution of agricultural research and extension for improving productivity and enhancing innovation in the sector. The analysis does not cover the two “big spenders”, i.e., the Food Reserve Agency (FRA) and the Fertilizer Support Programme (FSP), as these have been subject of recent and comprehensive studies. The scope of “agriculture” is confined to spending on items that appear under the budget head of the Ministry of Agriculture and Cooperatives (MACO) and thereby excludes some spending done by other ministries (e.g., spending on farm blocks, resettlement, forestry and social services). Due to the absence of data, spending by donors in the project modality is only touched upon occasionally. The coverage therefore is not suited for reporting on the expenditure target of the Maputo Declaration.
Findings
Production trends
In national strategic documents, such as the Fifth National Development Plan and the National Agricultural Policy, expectations with regard to agriculture are high. Although some targets are ill defined and therefore not achieved, it is also clear that growth in agriculture has been significantly less than was envisaged. Yet, there has been some significant growth in recent years. It is virtually impossible to determine the picture with any precision, though. Data on agriculture’s contribution to GDP are not credible. Pre-harvest estimates of production exist for the major crops, but do not cover vegetables and livestock. Post-harvest surveys are being done, but the data are not analysed in full and not public. Land productivity for smallholders does not seem to improve. Pre-harvest statistics do not distinguish the size class of farms, disguising productivity trends. In short, production has increased, maybe particularly in the areas where statistics are incomplete, and there are indications that agricultural holdings have diversified their production; but details are not available, and the statistics raise many questions with regard to quality and coverage.
Overall expenditure analysis
It is debatable whether the growing outlays for FSP and FRA have crowded out other agricultural services. Public Expenditure of MACO has grown considerably over the period 2000 to 2008 (actuals), and further increases are planned for 2009 and 2010 (budgets). A large portion of this growth is due to ever increasing spending on the two big programmes FRA and FSP, which absorb a growing share of the funds classified under the MACO budget head. However, the remaining

Ximungo Consultores
2[agper-zambia_2010_final.doc – 7/05/10 16:20]
expenditure (referred to as “core MACO expenditure” in the following) has also increased in real as well as US$ terms. FSP and FRA may have crowded out core MACO expenditure if one assumes that these funds would have been made available for core agricultural services otherwise. But it is questionable whether the agriculture budget would have grown at the same pace without FRA and FSP. Important to note, though, is that core agriculture expenditure still has continued to grow.
While expenditure on personnel has increased steadily, non-personnel expenditure has fluctuated wildly, with a particularly low level of expenditure in 2006, which quadrupled in 2007 and fell back in 2008 to the level of 2005. In 2008, the ratio between personnel costs to expenditure on recurrent departmental charges, grants and transfers, and capital expenditure was about 4:3. For the research institutions, non-personnel expenditure amounted to between 40 and 200 percent of personal emoluments.
Provinces and districts account for almost three quarters of total personal emoluments. Thus, personnel is quite decentralised. However, they account for only one third of non-PE expenditure—all without taking FSP and FRA into account, and, as throughout this study, without external project funds.
About 6 to 7 percent of core MACO expenditure is on ZARI and all research stations. This number does not capture fisheries and livestock research at headquarter level; actual expenditure on research therefore was higher. If one adds the expenditure on training institutes, the conclusion is that some 12 percent of the core MACO budget is spent on the creation and dissemination of knowledge and innovations.
Execution of planned activities is hampered by low predictability of releases. Budget execution rates for core MACO expenditure fluctuated, but agriculture is not a special case—all sectors are affected by the low relevance of budget estimates. Execution of non-personnel expenditure was always close to 100 percent, while non-PE execution rates varied between 59 and 82 percent. Execution rates at district level are typically lower than overall execution rates for non-PE expenditure.
Donor contributions via the project and sector programme modality appear only in the budget, while they are very rarely captured in financial reports. The degree of coverage of donor contributions even in budgets cannot be assessed for lack of national records of donor spending by sector. Budgeted donor financing in MACO fell from a peak of $89 million in 2007 to a mere $31 million in the 2009 budget. It is unclear whether the trend in the budgeted figure reflects reality. The African Development Bank, the World Bank and the European Union are the main donors, accounting for 78 percent of donor contributions in 2009.
Innovation, research and extension
Over the last years, the organisational setup for innovation, research and extension has diversified. Seed companies and large farms contribute to research and innovation without relying on public services. GART, a research trust, produces innovations related to smallholder livestock production and to conservation farming methods. The Conservation Farming Unit (CFU) has had an important role in the dissemination of conservation farming methods to smallholders. The Agricultural Support Project (ASP) has promoted “farming as a business” combined with a household (rather than group) approach, with large, albeit not nation-wide coverage.

Ximungo Consultores
3[agper-zambia_2010_final.doc – 7/05/10 16:20]
Research
At the same time, public research on crops, under the control of the Zambia Agricultural Research Institute (ZARI), has become less visible and probably less effective. In recent years, spending by ZARI and research stations still increased from $1.1 million in 2004 to $2.5 million in 2008 (excluding donor funds and excluding grants to research institutions like GART that are shown under the ZARI subhead). As mentioned before, the availability of funds for non-PE expenditure varied wildly. Most of the funds are spent on salaries, infrastructure and research management. Finance earmarked for research stations and research programmes was and remains not very significant ($520,000 in 2008).
GART is an interesting innovation, particularly with regard to the multi-stakeholder structure of its Board of Trustees. It is financed through the budget (small amounts) and funds from donors which, however, are earmarked to specific programmes. GART also runs a commercial farm, the surplus of which contributes towards the financing of research activities. GART takes up research related to conservation farming and takes up areas neglected by public research.
UNZA research is not well linked to other research institutions or extension services. Efforts are underway, though, to improve research coordination and mutual information, and UNZA is taking the initiative.
Staff numbers of ZARI have grown since 2001. The number of researchers has increased from 82 in 2001 to 130 in 2008, but particularly young staff with the lowest level of academic degree (BSc) was recruited. Therefore, the qualification structure has deteriorated. PhD’s and MSc’s now represent 42 percent of research staff, far below of averages of the region. A larger number of highly qualified staff is approaching retirement age.
Farming systems research has generally been abandoned at ZARI, also for the reason of lack of funds. Staff consists almost exclusively of agronomists. It should be complemented with agricultural sociologists and (agricultural) economists in order to improve the feedback link between farmers, extension and research and analyse in greater depth the constraints which farmers have with regard to the adoption of more productive varieties and farming methods. High-yielding varieties and methods are available, but in spite of their use, yields of smallholders remain low.
Extension
Today’s public extension system is the result of several remodelling exercises. Many staff were trained in the 1980’s for the Training and Visit (T&V) system, which was later abandoned because of its high cost and top-down approach. Subsequently, the system has moved towards a participatory extension approach. Extension work is under the responsibility of districts. Subject Matter Specialists at district level work with field officers in camps and blocks. Levels of actual staffing as compared to establishments differ widely across provinces.
During a visit to Monze District in Southern Province, the AgPER team encountered generally well qualified and motivated staff. But this may not be representative for the country. Many staff have received training many years ago, and exposure to new technologies is limited to those staff who were in close contact with donor-financed projects. The orientation of crop patterns and farming systems towards markets is lacking particularly in small-scale farming environments in the more remote areas; staff may not have sufficient knowledge for being able to help farmers to link to

Ximungo Consultores
4[agper-zambia_2010_final.doc – 7/05/10 16:20]
markets successfully. In Monze, staff were enthusiastic about conservation farming methods and about the household approach that the Agricultural Support Project (ASP) has introduced. The team had the opportunity to visit a few farmers were the success of the extension efforts, without handouts to farmers, was very visible. However, it seems that an external impetus was necessary to introduce these new technology and messages into the extension system which is reported to have been quite resistive in the beginning.
Frustration about the lack of operational funds was encountered in virtually all interviews. A closer look at budgets and financial reports confirms that there are, quite obviously, too many staff for a low operational budget, or a lack of operational funds for the number of staff in place. This is not confined to the grassroot structures but also a problem for the National Agricultural Information Service, for instance. On average, allocation of non-PE funds per each staff placed at provincial or district level was around K4.5 million (about $100 per month) over the period 2005 to 2008, with significant variations across the years. The budgets for 2009 and 2010 make provision for significant increases.
Donor-financed projects have been among the beneficiaries of the combination of the availability of suitable staff and lack of operational funds. They were often able to put government extension staff to work for the objectives of the particular projects by providing relatively low amounts of funds for per-diems, fuel and some repair of transport equipment. Although there is nothing wrong with this in principle, it implies that the public institutions have partially lost the prerogative of taking initiatives and determining programmes.
Overall, the tentative conclusion is that public extension services could make a noticeable impact if the level of funding for operational costs is adequate—which, at the moment, it is not. At the same time, focus, coordination between different players, training in new extension methods and production technologies, more focus on facilitating links between farmers and markets and an internal monitoring and reporting structure are required for additional funds to have full effect.
The on-going discussion about the role of the state in agricultural extension requires some clarification. Extension and research can be provided by the private sector without public funds only to the extent that the benefit can be appropriated by sellers of equipment, of seeds and inputs (like pesticides) or by monopsonic buyers. Outgrower schemes are a suitable solution where a central processing plant or marketing agent can reap the benefit of research and extension they provide. The scope for extension and dissemination of innovation being club goods is limited because the large number of small and medium-scale farmers cannot be forced to make a contribution to an association that provides the services. Cooperatives could be providers of extension as a club good, but the associated organisational challenges are great.
For most of the extension and all research where the results are not incorporated in proprietary brands, public funding of research and extension and other forms of dissemination of innovative technologies have to be funded from public sources. Public funding is required in particular for pest and disease control and for inventorisation and safe keeping of genetic material.
However, activities can still be outsourced to private providers as long as funding remains public. The scope for public-private partnerships, where public funds finance the general benefit while private funds meet the cost of benefits that can be appropriated by the provider, is confined to special situations. Cotton is one of them. Others may exist, and the option should remain under

Ximungo Consultores
5[agper-zambia_2010_final.doc – 7/05/10 16:20]
consideration on a case-by-case basis. Note that GART is not really a public-private partnership; it is essentially a construct where services are outsourced (with donor funding mainly).
Gender analysis
In Zambia, as inmost developing countries, the majority of agricultural work is performed by women. Yet, in traditional rural society, women have only limited access to land and to credit, a less forceful voice in the society, and where an adult man belongs to the household, women often have limited influence over decisions concerning the agricultural activities to which they hugely contribute. Female-headed households, quite widespread in Zambia, face particular constraints. Making sure that this discrimination is not exacerbated by discriminatory provision of public services in agriculture and reaching female farmers and put their potential to full use is an explicit strategy of all public strategic documents.
The objective goes beyond taking traditional gender roles into account in order to reach female farmers and avoiding to neglect women’s concerns with regard to innovation. Agricultural extension in particular can also be an effective channel for changing women’s role in rural society, allowing them to claim a stronger voice and status, and empowering women so that they take fully part in decision-making on issues which concern them and the families and households.
Despite very clear goals of the Government of the Republic of Zambia (GRZ), as articulated in the Fifth National Development Plan (FNDP), policies to promote gender equity and gender mainstreaming are not realized in the programmes, projects, or activities of the Ministry of Agriculture and Cooperatives (MACO). The poor integration of gender already in the structure of the organisation makes it sometimes overlook but at times also discriminate against certain categories of farmers in terms of needs and capacities. This lack of gender mainstreaming and gender analysis also means that MACO may miss much potential in identifying positive indicators for agricultural innovations.
The collection of sex-disaggregated data in the Ministry is irregular and of varying quality. Data are sometimes unreliable, and rarely if ever analysed or used for planning and programming purposes. Improved Monitoring and Evaluation is also seen as a pivotal question for improved gender responsiveness in programmes, projects, and activities on all levels of MACO.
The gender analysis undertaken in the context of this AgPER looked in particular at the extent to which gender equity, gender balancing and gender-specific activities are part of the agenda of public agricultural services. Awareness of the need for gender-differentiated approaches is widespread, but knowledge of gender-related concepts (for instance, the difference between gender balancing and gender mainstreaming, the meaning of gender-sensitive budgeting) and tools of gender analysis is weak. Budgets are not visibly being prepared with regard to the differentiated impact of planned activities on men and women—not really a surprise since already the quantification of results is rarely done in the context of planning and budget preparation.
Yet, some of the recent changes that public extension in cooperation with donor-driven and funded projects have brought to Zambian agriculture have promoted gender equity and women empowerment. Conservation Farming methods, which generally incorporate zero-tillage, eliminate the task of ploughing for which men are usually needed, which is particularly beneficial to households with shortage of male labour. The episodic evidence that smallholder farms have actually diversified and are now growing more vegetables and raise more small livestock suggests

Ximungo Consultores
6[agper-zambia_2010_final.doc – 7/05/10 16:20]
that the economic role of women is advancing and that more direct income contributes to a stronger voice of women in economic matters of the household.
Particularly the projects which implemented the “farming as a business” strategy through a household-focused approach have had a strong positive impact on women empowerment. The household approach starts with the family agreeing on a strategic vision and taking decisions about the way to implement it in a joint manner. This has paved the ground for household income being managed jointly and opened the way for re-thinking traditional gender roles. The economic success of the families reached by the project provides examples and incentives for other households to also redefine the way in which men and women interact with regard to farming activities.
In order to mainstream gender concerns into the public administration, the Government of Zambia has created the GIDD unit and adopted the policy that Gender Focal Points should be appointed at all levels of all institutions. In MACO, the chief is the Senior Sociologist of the Rural Sociology Unit in the Department for Policy and Planning. The system, however, does not appear to be working well. Lack of funds for training activities and meetings are one of the causes, low political profile another. Initial training of gender focal points does not take place, their role and terms of reference are unclear.
The weak integration of gender policies and concerns into the administrative structure has the effect that MACO cannot answer the question whether, where, to what extent and with which impact gender-specific aspects are incorporated into its work, and into its extension services in particular. In short: MACO is not suitably organised to push gender into its day-to-day work as a cross-cutting quality attribute, nor can it monitor its activities and detect if and where agricultural services do discriminate, exacerbate unfair traditional roles or leave out the potential of women as innovators and promoters of increased productivity and market orientation.
Setting priorities: the processes of financial planning and administration
Since 2004, Zambia has an activity-based budget classification which breaks the “Estimates”, i.e., the budget proposal that is presented to Parliament, down to very detailed activities. The hierarchical structure is: Head (Ministry) → Subhead (Department) → Unit → Programme → Activity. Because the new structure specifies the activities, the public budget documents do not show expenditure by economic classification for each spending unit any more; only Personal Emoluments are shown. The full details of the “Estimates” become the approved budget. Ministries are allowed to make adjustments across units, programmes and activities internally within defined limits.
The budget preparation cycle starts with the Green Paper, the Medium-Term Expenditure Framework, from which spending ceilings for the next annual budget are derived. The Green Paper specifies outlays for FSP and FRA, but does not disaggregate further, neither by department nor by central/provincial/district. Until 2009, detailed budget preparation has run well into the fiscal year to which the budget relates. The budget for the year 2008, for example, was brought to Parliament in Month 1 and approved in Month 3 or 4. After a constitutional change, the budget is now approved in December the next fiscal year which coincides with the calendar year.
All spending units, down to district level, participate in the process. However, as is typical for a very detailed budget, initial proposal tend to be wish lists with little resemblance with the approved budget. The AgPER team did not clarify whether hard budgeting limits are given to lower-level

Ximungo Consultores
7[agper-zambia_2010_final.doc – 7/05/10 16:20]
spending units so that the work involved in making and costing lists of needs beyond reasonable expectation of receiving funding can be avoided.
The main constraints, however, are in the area of budget execution. Political ad-hoc interventions and systematic underbudgeting of legal obligations of the state have, for many years, resulted in low execution rates for many budget lines because releases were below budget estimates and possibly came at the wrong time.
The Budget Department of MoFNP has quarterly meetings to decide upon cash releases in view of the actual revenues (the budget is operated as a cash budget). Releases are made by indicating numbers for each budget line (i.e., activity level). The process of cash allocations appears to ensure that the spending structure of the budget is respected. The downside of this is that if actual funding falls short of budget allocations, cuts tend to be made proportionally and across the board, albeit with some significant exceptions. The result, which tends to provide “a little to everything” does not seem to be efficient.
It remains unclear how the decision about which activities to sacrifice if cash falls short of projections or if other activities require additional funds are made and to what extent they are negotiated between the Ministry of Finance and the sector. Districts are definitely not involved in negotiations, neither is the Policy and Planning Department.
Over time, some technicalities have been modified in order to prevent higher-level entities from serving themselves first. In 2005, provinces and districts became separate budget subheads. This ensures that funds meant for the lower level cannot silently be withheld at the level of the technical departments in favour of their own needs. Also in 2005, research stations started to have their own subheads, while they were financed through the respective departments (ZARI, livestock and fisheries departments) before. Beginning in 2008, a programme designated “Camp and Block Operations” appears in budgets and financial reports for districts, which ensures that the ground-level operational cost of extension officers becomes relatively more protected.
Recommendations
The findings and conclusions of this AgPER lead to the following recommendations in order to improve the effectiveness of agricultural services and increase value for money of public spending in this sector:
Statistics and overall expenditure
(1) Substantial improvements in the area of agricultural and GDP statistics are required for informed decision-making. The base year and weights for GDP statistics needs to be updated, and estimates must be based on available and reliable sectoral production data. The data collected at post-harvest surveys should be analysed and published. The website of CSO requires enhanced quality control.
(2) A database for donor spending should be established and kept up-to-date. Without information of donor spending by ministry and important subsectors within the ministries, it is virtually impossible to identify funding gaps and engage in international comparisons of benchmarks and indicators.

Ximungo Consultores
8[agper-zambia_2010_final.doc – 7/05/10 16:20]
(3) The inter-year variability of funding of non-personnel expenditure in agriculture needs to be reduced. There are also strong indications that the general level of funding for non-PE expenditure is insufficient compared to the number of available staff; non-PE funding levels need to be raised in order to improve the effectiveness of existing staff, not only, but particularly in the areas of local agricultural services and research.
Research
(4) Public research should get more attention and priority, and squeezing out research in view of political demands for quick result must be avoided. Although there is growing diversification of providers of agricultural research, most of it needs to be funded from public resources, not only for pushing technology but also for maintaining past achievements.
(5) Research should focus more on issues related to farming systems and the integration of new technologies into the farmers’ reality. More adaptive and applied research is required, and adequate staff with socio-economic qualifications needs to be recruited.
(6) In order to strengthen the relevance of research for female farmers, research on vegetables and fruit trees should be revived and strengthened. The gender balance of the forums where the research agenda is defined is of particular importance for ensuring that research does not neglect agricultural products which are generally consumed by the household or only traded in the vicinity while being crucial for food security in rural areas.
(7) In spite of the scope for increasing public funding for agricultural research, mobilization of research funds from international sources is necessary. Research proposal writing skills should be improved.
(8) For contracted research undertaken by institutions like GART, donors may want to consider switching from earmarked funding for specific activities to a system where block grants are provided if and as the internal governance structure of the institution is sound and ensures adequate financial management and the setting of the research agenda in line with clients’ needs.
(9) Recruitment and training of researchers with post-graduate degrees needs to be intensified. The reason is that highly qualified staff in ZARI are already few in numbers, compared to other countries, and many are approaching retirement age.
Extension
(10) The “farming as a business” message, combined with the household approach to extension, and conservation farming have been quite successful. Extension played a major role in both areas, which bring technologies and systems that are new to traditional farmers. Extension services should build on this success and broaden its activities to areas that have not been reached yet.
(11) Local (provincial and district) structures of MACO need to play a stronger coordinating role with regard to donor-funded initiatives. The planning exercises must be done while taking a realistic financial envelope into account, and donor-funded activities should be fitted into an overall approach for the province and district in question.

Ximungo Consultores
9[agper-zambia_2010_final.doc – 7/05/10 16:20]
(12) Training and re-training of staff would appear to be required, since the recent successful approaches relate more to farming systems, market orientation and roles of the different members of the family in an agricultural enterprise than merely agronomic issues on which staff has generally been trained.
(13) Planning and execution of extension activities should take gender issues more formally and systematically into account. The gender-differentiated analysis of effects should be a routine activity in planning and monitoring. In order to achieve this, the following areas should receive attention:
a. Identify needs of different producer groups, divided into women and men, and develop service in accordance with needs.
b. Promote gender balancing among extension staff, in particular front line extension, to reflect client base and also to ensure gender parity among staff.
c. Ensure that staff at all levels of extension, in particular at district level, receive gender training, to ensure that information and extension services reach both genders.
d. Ensure that dissemination of agricultural innovations and market information by extension staff are not gender biased.
e. Strengthen the gender perspective in all reading materials for extension staff.
f. Ensure that education of future extension staff, at university, college and training institutes, includes gender methods and tools.
g. Consider some form of gender coaching for field work in order to verify that messages and message delivery are not inadvertedly gender-biased and leave out the potentials of women to participate fully in production and decision-making and also make use of extension to empower women.
Institutionalisation of the Gender objective
(14) The institutionalisation of gender concerns and gender mainstreaming and focus needs to be improved. Furthermore, gender mainstreaming should be an integral part of any proposed larger organizational restructuring of MACO.
(15) The Gender Focal Point system should be institutionalised and made operational by way of training funds, institutionalised monitoring and improved reporting and control. Knowledge about gender methods and tools should be a compulsory requirement for promotion. Efforts to gender-balance staffing should be enhanced.
(16) Gender Analyses should be undertaken as routine element in the planning and strategy formulation processes. It is also proposed to formulate gender-related objectives explicitly and follow up on their achievement.

Ximungo Consultores
10[agper-zambia_2010_final.doc – 7/05/10 16:20]
Priority setting
(17) There are indications which suggest that an early communication of budget ceilings within the MACO structure would be helpful in avoiding unproductive work invested in the preparation of budget proposals that exceed available finance by a great margin. In order to keep the budget responsive to changing needs and approaches, it would be useful to have an intermediate round of re-negotiating unit ceilings half way in the budget preparation period.
(18) Ideally, budgets should be significant and budgeted amounts should be made available. But as long as funding is regularly significantly below budgets, it is recommended to improve or introduce occasions for negotiating the allocation of releases to units and activities and re-define priorities in order to allow the concentration on selected activities rather than spreading scarce cash across all planned items in such a way that many efforts have to stop half way.

Ximungo Consultores
11[agper-zambia_2010_final.doc – 7/05/10 16:20]
1. Introduction
This report is a background study for the general Public Expenditure Review for Zambia, prepared for the Government of the Republic of Zambia (GRZ) in collaboration with Cooperating Partners and led by the World Bank. It looks into public spending in the agriculture sector under the aspect of how much was spent, what effects can be seen from this spending, and makes suggestions about how spending levels and patterns could be adjusted in order to get public expenditure in line with general and sector-specific policy objectives.
The analysis does not cover the two “big spenders” in the sector, namely the Fertilizer Subsidy Programme (FSP, now renamed to Farm Input Support Programme – FISP), and the grants to the Food Reserve Agency (FRA). These two programmes, which at present absorb about half of the spending shown under the Budget Head of the Ministry of Agriculture and Cooperatives (MACO), are not considered in detail because
• they have been covered in depth in two recent and comprehensive studies,1 and
• we would not even consider the grants to the FRA as spending on agriculture, because the objective of the public contribution is to subsidise prices of maize meal (referred to as mealie meal in Zambia) mainly for the benefit of urban consumers.
Although the NEPAD Secretariat, which follows up progress on the Comprehensive African Agriculture Development Programme (CAADP), includes crops, animal husbandry, fishing, and forestry and well as the administration of agricultural land in its analyses and targets, this report focuses mainly on crops. Fishing (lakes and ponds) and animal husbandry are covered in our expenditure analysis because they have been under the same ministry together with crops up to 2009, but the analysis focuses on crops because this is where the main policy focus at the moment is. Thus, it does not provide the data that are required for reporting to the NEPAD secretariat on the target of the Maputo Declaration.
No systematic reporting on donor expenditure on projects in agriculture is done, no overview or detailed tables exist. In addition, as is shown in the report, figures on agriculture’s contribution to GDP are very questionable. Therefore, this report can not present ratios (benchmarks) for international comparison.
Rather, this AgPER concentrates on spending trends on public services for enhancing technology, with particular emphasis on research and extension. The Agricultural Policy of 2004 and the Fifth National Development Plan (FNDP) 2006-10 target for an annual growth in agricultural production of 6 percent per annum, for reasons of food security as well as poverty reduction in rural areas where many of the poor live. Recent, albeit not totally reliable statistics and analyses show that this
1 On the Food Reserve Agency, see Jonas Govereh, T.S. Jayne and Antony Chapoto, Assessment of Alternative Maize Trade and Market Plicy Interventions in Zambia. FSRP Working Paper No. 33. Lusaka: FSRP. 2008.
On the Fertilizer Subsidy Programme, see World Bank, Zambia: “Impact Assessment of the Fertilizer Support Program, Analysis of Effectiveness and Efficiency.” Draft ESW Report. (mimeo.). 2009.

Ximungo Consultores
12[agper-zambia_2010_final.doc – 7/05/10 16:20]
target has been missed totally, and that agricultural production is, at best, expanding in line with population growth. It is often suspected that low levels of public expenditure in agriculture and possibly an inadequate pattern across the different functions of the public agriculture administration have contributed to these disappointing results and public expenditure, is key to reversing the situation and allowing private farmers to exploit opportunities and improve their productivity and income. Therefore, this report will attempt to answer two questions:
(a) How did spending on agriculture develop over the past years? Has the level of spending kept pace with inflation and economic growth, and has the intra-sectoral spending pattern been reasonably adequate? Since the policy environment and the understanding of the role of the state in relation to private sector activities has changed fundamentally over the last 15 years while still being controversial, this study will also examine to what extent functions that were formerly conceived to be in the public sphere have been taken up by the private sector.
(b) Under which conditions could a possible increase in public spending and adjustments in the spending pattern contribute towards growth of production and improvements in productivity and put agriculture back onto the growth path that is required in order to feed a growing population, bring income to rural areas, open up income opportunities for the younger generation and contribute substantially to poverty reduction? The controversial issues are not only related to “how much” and “in which area”, but also about the potential roles of the private sector and semi-public institutions like research trusts in relation to the public system under the Ministry of Agriculture and Cooperatives.
We leave it open where such additional funds for core and technology-enhancing functions in public agricultural services would come from. A reduction of the outlay for FRA and FSP as well as increased donor spending would be the obvious sources.
This study takes gender-related issues explicitly into account. With regard to the first point (a) above, special attention is paid to a possible gender bias in choosing activities and selecting and re-defining activities under severe resource constraints. As far as the forward-looking point (b) is concerned, we focus on options and recommendations that would ensure that gender roles in society are taken into account so that potentials for increasing productivity and income are not missed due to neglect of gender-specific factors.
Agriculture-related issues in Zambia have been studied and analysed extensively, and there are “loads” of literature available on specific issues as well as on sector policy. Many of these are of high quality, some of which are very recent. Particularly, the studies prepared by the Food Security Research Project (FSRP) and a recent study financed by the European Union provide a wealth of information and insight as well as good analyses and proposals. This Agriculture Expenditure Review builds on some of these and sometimes reconsiders the results in view of the genuine contributions which are
(a) a more detailed analysis of public expenditure patterns,
(b) a second look at agricultural statistics,
(c) more information about research and extension funded privately or through trust arrangements, and

Ximungo Consultores
13[agper-zambia_2010_final.doc – 7/05/10 16:20]
(d) the gender analysis which is included here and which was not made in greater depth in some of the other studies that we use.
An AgPER is interested in particular in results, their relation to funding, and impact. From this perspective, it generally passes over organisational and capacity issues very superficially. However, interesting gender aspects have been collected and analysed in the context of this AgPER, many of which point to desirable qualitities of services which may or may not be available to female farmers in particularthe institution cannot provide a gender-differentiated analysis of services and is not equiped for this type of analysis. In order to provide space for a broader gender analysis, a special chapter on gender issues in agricultural services is included.
The structure of the report is as follows: The following Chapter 2 deals with the core elements of a typical expenditure review, by presenting the structure of expenditure by functions or institutions that represent functions. This is preceded by a analysis of production data and trends, which is required in order to be able to relate spending to outcomes and determine whether there are signs that innovations generated by public expenditure have led to growth in production or income.
The generation and dissemination of technologies and innovations are the object of Chapter 3. The first section of Chapter 3 analyses research architecture and funding in a pluralistic setting. The other main section of Chapter 3 has a closer look at extension services, their operations and effectiveness in promoting agricultural production in general and innovation and growth in particular.
Chapter 4 presents the gender analysis, looking at the type and quality of services that would be required in order to satisfy the needs of the many women who earn their living from agriculture and to use agricultural services in order to promote gender equity in rural areas.
The relatively short Chapter 5 looks into the mechanisms in place for budgeting and particularly budget execution. Since the funding of non-personnel expenditure often falls very short of what was initially budgeted, the mechanisms in place for distributing the burden of adjustment is of particular interest.
The final Chapter 6 provides a summary of the main conclusions and recommendations.
A statistical annex presents the numbers that are underlying the graphes presented in the core text in table format.
This AgPER was undertaken in December 2009 and February 2010 over a period of slightly less than four weeks in Zambia. A visit to Monze was part of the second leg of field work in Zambia. The task was carried out under a contract financed by the Norwegian Embassy on behalf of the Cooperating Partners Group for Agriculture and as an explicit input into the overall Public Expenditure Review. The Gender Specialist was financed by the Swedish International Development Agency (Sida) and seconded to the AgPER Team. Contributors to the report are Chris Coulter, Gender Specialist; Monika Orlowski with a focus on extension content and methodology; Mick Mwala, Research Specialist; and Dieter Orlowski, Public Finance Specialist and Team leader. The work was guided by a Reference Group in which staff from MACO and representatives of the Cooperating Partners participated.
The Team who compiled this report would like to express its sincere gratitude to all those who have taken time to answer our questions and have provided us, with considerable enthusiasm, with

Ximungo Consultores
14[agper-zambia_2010_final.doc – 7/05/10 16:20]
additional insights and comments during the course of the field study phase. The names appear in the List of Persons Met as Annex 2.

Ximungo Consultores
15[agper-zambia_2010_final.doc – 7/05/10 16:20]
2. The Context: Recent Trends in the Agriculture Sector
Current strategies for growth and poverty reduction are expecting substantial contributions from the agriculture sector. According to the Fifth National Development Plan (FNDP) for the period 2006-2010, “overall” agriculture’s contribution to GDP is expected to grow from 18-20 percent to 25 percent, and the share of agricultural products in total exports is planned to increase from 3-5 percent in 2005 to 10-20 percent in 2010.
Zambia was not traditionally the bread basket of Southern Africa. In colonial times (until Zambia’s independence in 1964), Southern Rhodesia, today’s Zimbabwe, produced the agricultural surpluses, while Northern Rhodesia, today’s Zambia, was predominantly a mining area. Commercial farms along the Line of Rail (from Kitwe/Ndola to Lusaka and further South to Livingstone) were meant to feed the miners and urban population, while agricultural activities in the “tribal lands” were expected to feed the rural population.
After independence (1964) and particularly the drastic decline of copper prices after the end of the Vietnam War, more attention was paid to agriculture as a potential source of alternative exports. The attention to poverty reduction in the 90’s and the realisation that Zambia has abundant under-utilised or un-used land reserves and sufficient rains and water reserves led to a growing focus on agriculture in general and smallholder agriculture in particular. The surge of world market prices of major cereals in 2008, in the context of the “bubble” leading to the financial crisis and exacerbated by efforts to convert food crops to fuel, led to increased attention to the sector. Due to its land reserves and availability of water, Zambia became one of the countries of increased attention and expectation.
An often heard perception is that the performance of the agriculture sector did not live up to these expectations and that it has not achieved the targets of the FNDP. Part of the blame is often attributed to distortions in public expenditure and the overwhelming focus on market interventions and fertilizer subsidies, combined with low spending on research and extension and other ways to introduce advanced technologies in order to increase productivity.
This chapter will explore statistical information available about the actual performance against the targets and will look at actual spending on agriculture over the past decade. Although it is clear that the FNDP targets have been missed by a considerable margin, a number of statistical and interpretation issues make a more detailed analysis worth-while.
2.1 Production Trends
According to National Account Statistics of the Central Statistical Office (CSO), the real contribution of agriculture to GDP has not increased, and the relative contribution has fallen, contrary to the targets and expectations of the FNDP (Figure 1 and Figure 2). There was virtually no growth in

Ximungo Consultores
16[agper-zambia_2010_final.doc – 7/05/10 16:20]
Fishing.2 The real contribution of Agriculture increased slightly, but it depends on the year where one starts to look at the line, and the figure provided by CSO for 2009 may represent a special case (see below). Had agriculture grown, in real terms, by 6 per cent per annum (target of the African Union’s CAADP), from a base of 200 billion Kwacha (1994 prices), it should have reached some 320 billion constant Kwacha by 2009. The GDP contribution as reported by CSO is far below this figure.
Figure 1: Real GDP Contribution of the Agriculture Sector
Real GDP contributions
0
50
100
150
200
250
2001 2002 2003 2004 2005 2006 2007 2008 2009*
billi
on 1
994
ZMK
AgricultureFishingForestry
Source: Authors on the basis of CSO data.
The percentage contribution of agriculture (which includes crops, animal husbandry and fish bonds in this definition) and lake and river fishing to GDP has declined from 2000 to 2009, while that of forestry has grown substantially. In fact, and still according to CSO’s National Accounts statistics, three quarters of the contribution of broad agriculture3 is from Forestry, while narrow Agriculture and Fishing account for less than 5 percent of GDP with a declining trend. The growing weight of Forestry is, to a large extent, driven by prices, although the real contribution to GDP also increased steadily.
2 In National Accounts, fish production in ponds is accounted for under Agriculture; Fishing only includes lake and river fishing.
3 The NEPAD definition of agriculture includes forestry and fishing. In this study, the term “broad agriculture” refers to the wider NEPAD definition of the agricultural sector.

Ximungo Consultores
17[agper-zambia_2010_final.doc – 7/05/10 16:20]
Figure 2: Percentage Contribution of Agriculture to GDP (Current Prices)
GDP contribution of agriculture, current prices
0.0
5.0
10.0
15.0
20.0
25.0
2001 2002 2003 2004 2005 2006 2007 2008
% o
f GD
P Forestry
Fishing
Agriculture
Source: Authors on the basis of CSO data.
However, there seem to be very serious issues with regard to the series of detailed GDP data provided by CSO. The share of “narrow agriculture” (crops and vegetables, animal husbandry, pond fishing) in “broad agriculture” (which includes lake and river fishing and forestry) has increased from an initial 36 percent in 1994 to 47 percent in 2009 in constant prices, while it has declined from 36 perent to less than 18 percent in current prices. This is due to a strong increase in the price element of the projection with regard to the forestry sector.
Table 1: Share of “narrow agriculture” in “broad agriculture” in GDP statistics
1994 2001 2009Constant prices 36.1% 47.7% 46.8%Current prices 36.1% 24.3% 17.6%
Real growth 1994 > 2001 2001 > 2009 OverallNarrow agriculture 83.4% 18.3% 117.0%Forestry 32.0% 32.7% 75.1%
Source: Authors on the basis of data from CSO; see numerical annex.
Data compiled by CSO on agriculture’s contribution to GDP are plagued by the effects of outdated weights. In practice, the sector is subdivided into groups and products, each with its weight in the base year.4 Production indices are then applied, which are derived from surveys. Ideally, it should be post-harvest surveys, but since the data are erratic, forecast data are used. Some products are not covered (like soya), vegetables not at all. Livestock comes in as a sub-category of agricultural production (narrow sense), but data are often not available, while “production” is estimated on the basis of animal stocks rather than slaughters. Chicken are not taken into account at all.
4 The weight of agriculture in the base year may have been established without taking subsistence production correctly into account. The AgPER Team did not have the opportunity to check how the 1994 weights were arrived at.

Ximungo Consultores
18[agper-zambia_2010_final.doc – 7/05/10 16:20]
After the real growth rate has been applied to the previous year’s figure, the price element is added, derived from the best suitable sub-category of the consumer price index.
With this procedure (which is not different from other countries), errors keep accumulating. Without a periodic adjustment of weights, the underlying basket may no longer reflect the current structure of the sector.
Thus, we are left with a complete lack of data with regard to the contribution of agriculture to GDP. One unfortunate consequence is that it the usual spending ratios, like public expenditure on agriculture over agricultural GDP or research intensities, would be misleading. Since the risk of wrong conclusions from international comparisons would be too great, benchmarks are generally not calculated in this report.5
Was growth of agricultural production and GDP contribution as low as statistics suggest? Some of those whom the AgPER Team interviewed had a different perception and said that the agriculture sector has diversified, that wheat production has increased to a point where Zambia is now generally self-sufficient in wheat, that soya is being produced in large quantities, and that the livestock sector has witnessed substantial growth. Other studies point to the growing importance of livestock and vegetables for farm income generation.6
Although available statistics on production are partial and not fully reliable, they tend to support this view. Statistics on crops are collected for a pre-harvest forecast and a post-harvest survey. The forecast is produced by the statistics unit in MACO’s Policy and Planning Department, whereas the post-harvest survey is led by the Central Statistical Office. Post-harvest survey data have, however, not been cleaned and processed for a number of years, allegedly for lack of money. The following analysis is therefore based on MACO’s forecast data. In line with the purpose to produce early warning alerts when necessary, the forecast does not cover minor crops or vegetables, and does not report on livestock production. The data, in principle, include the commercial farms.
Box 1: Sources of statistics on agricultural production and their limitations
Finding longer series of agricultural production by crop was a a difficult task. The Early Warning Unit at MACO produces annual food balance sheets. These are based on surveys undertaken around March. Due to the nature of its work, the early warning data include only major staples in most years. We obtained a combined table with long series from the same source. In the more recent years, the numbers generally (but not always) matched those of the annual balance sheets. The combined table was apparently not sufficiently proof-read (the attentive reader can see with a “naked eye” that some numbers simply cannot be true); there were gaps in some series; and the table did not contain any explanatory notes (for instance about data being incomplete).
5 This particularly in view of the tendency to put indicators into databanks without adding the footnotes about quality and limitations of data that appear in the original publication.
6 Worth noting is that increases in agricultural production through higher use of inputs like chemical fertilizer and mechanisation do not necessarily lead to a proportional increase in the agricultural GDP. GDP relates to sectoral value-added, calculated (simplified) either by adding up the income of labour and capital in the agricultural sector, or by substacting inputs obtained from other sectors from the market value of production. Production increases through higher input use may therefore lead to higher value added in the sectors that produce these inputs, or imports.
Ximungo Consultores
19[agper-zambia_2010_final.doc – 7/05/10 16:20]
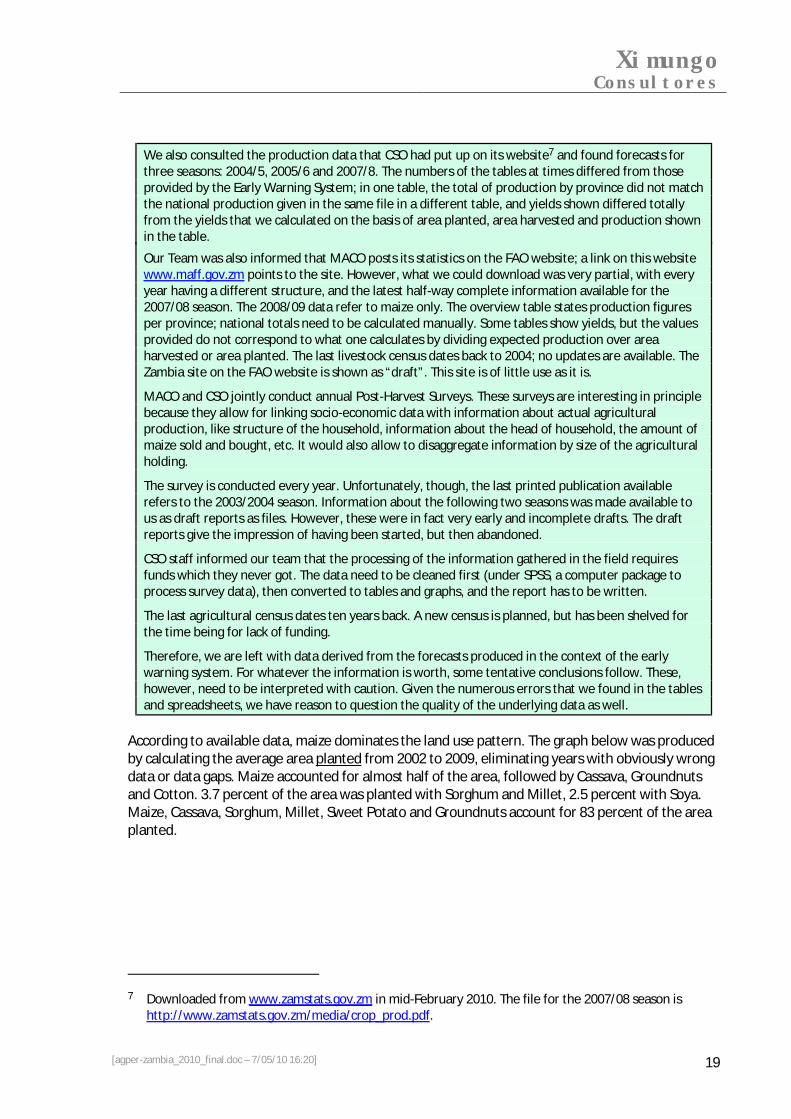
We also consulted the production data that CSO had put up on its website7 and found forecasts for three seasons: 2004/5, 2005/6 and 2007/8. The numbers of the tables at times differed from those provided by the Early Warning System; in one table, the total of production by province did not match the national production given in the same file in a different table, and yields shown differed totally from the yields that we calculated on the basis of area planted, area harvested and production shown in the table.
Our Team was also informed that MACO posts its statistics on the FAO website; a link on this website www.maff.gov.zm points to the site. However, what we could download was very partial, with every year having a different structure, and the latest half-way complete information available for the 2007/08 season. The 2008/09 data refer to maize only. The overview table states production figures per province; national totals need to be calculated manually. Some tables show yields, but the values provided do not correspond to what one calculates by dividing expected production over area harvested or area planted. The last livestock census dates back to 2004; no updates are available. The Zambia site on the FAO website is shown as “draft”. This site is of little use as it is.
MACO and CSO jointly conduct annual Post-Harvest Surveys. These surveys are interesting in principle because they allow for linking socio-economic data with information about actual agricultural production, like structure of the household, information about the head of household, the amount of maize sold and bought, etc. It would also allow to disaggregate information by size of the agricultural holding.
The survey is conducted every year. Unfortunately, though, the last printed publication available refers to the 2003/2004 season. Information about the following two seasons was made available to us as draft reports as files. However, these were in fact very early and incomplete drafts. The draft reports give the impression of having been started, but then abandoned.
CSO staff informed our team that the processing of the information gathered in the field requires funds which they never got. The data need to be cleaned first (under SPSS, a computer package to process survey data), then converted to tables and graphs, and the report has to be written.
The last agricultural census dates ten years back. A new census is planned, but has been shelved for the time being for lack of funding.
Therefore, we are left with data derived from the forecasts produced in the context of the early warning system. For whatever the information is worth, some tentative conclusions follow. These, however, need to be interpreted with caution. Given the numerous errors that we found in the tables and spreadsheets, we have reason to question the quality of the underlying data as well.
According to available data, maize dominates the land use pattern. The graph below was produced by calculating the average area planted from 2002 to 2009, eliminating years with obviously wrong data or data gaps. Maize accounted for almost half of the area, followed by Cassava, Groundnuts and Cotton. 3.7 percent of the area was planted with Sorghum and Millet, 2.5 percent with Soya. Maize, Cassava, Sorghum, Millet, Sweet Potato and Groundnuts account for 83 percent of the area planted.
7 Downloaded from www.zamstats.gov.zm in mid-February 2010. The file for the 2007/08 season is http://www.zamstats.gov.zm/media/crop_prod.pdf.

Ximungo Consultores
20[agper-zambia_2010_final.doc – 7/05/10 16:20]
Figure 3: Area distribution by selected crops, average 2002-2009
Planted Area by Crop
46.2%2.2%
3.5%
8.8%
2.5%
2.1%
3.1%
20.4%
6.8%
2.1%
1.3%
1.0%
Maize
Sorghum
Millet
Paddy
Wheat
Ground-nuts
Soya
Sunflow er
Mixed beans
Cassava
Sw eet potatoes
Seed cotton
Source: Authors based on statistics provided by the Early Warning forecasts provided by MACO.
Note: The graph shows the average of area planted over the past 5-6 years. We had to eliminate some years for which data was not available or obviously wrong (totally out of the series).
The legend shows slices clockwise.
Maize production has increased over the years from some 850.000 tons in 1998-2000 to almost 1.500.000 tons in 2007-2009 (Figure 4).8
Figure 4: Maize production trends
Maize production
0
200400
600
8001,000
1,200
1,400
1,6001,800
2,000
19981999
20002001
20022003
20042005
20062007
20082009
Thou
sand
MT
Maize Productivity (t/ha)
0.0
0.5
1.0
1.5
2.0
2.5
3.0
1987
1989
1991
1993
1995
1997
1999
2001
2003
2005
2007
2009
t/ha
Source: Authors on the basis of crop forecast data provided by MACO.
Note: The line indicates a three-year moving average of the year and the previous two years.
8 Note that in our report, the year shown in tables and graphs always refers to the harvest year. Thus, a number indicated for 2006, for instance, refers to the season 2005/06.

Ximungo Consultores
21[agper-zambia_2010_final.doc – 7/05/10 16:20]
Note that the methodology for extrapolating survey results to global data was modified. It had been discovered that a constant extrapolation factor had been used, while population growth has most probably resulted in a gradual increase of the total number of holdings. This error was corrected for the 2009 forecast. Therefore, the decline in 2006-08 and the steep increase in 2009 may be due to this change of methodology.
Although production increased, productivity as measured as yield per hectare planted has not improved.9 Land productivity stagnates at around 1.5 metric tons per hectare. Thus, the growth of maize production is due essentially to increases of area planted, which progressed from slightly above 500,000 ha in 2004 to well over 1 million Ha in the 2008/09 season.
A supplemental survey undertaken in conjunction with the post-harvest survey at irregular intervals presents more detailed information on maize yields. The survey relates to smallholders with areas of up to 20 ha. For the 2007/08 season, maize yield for small and medium-scale farmers stood at around 2.1 tons/ha. It is interesting to note that the smallest farmers have the highest yield, although not by a great margin. Compared to four years earlier, maize yields with fertilizer have increased slightly, but fallen without fertilizer. Only some 38 percent of the farmers that grow maize also sell maize. This number has increased from four years earlier. However, as transpires elsewhere from these data, many of those who sell maize also buy maize in other months of the year.
Table 2: Yields and other characteristics of smallholder farm households
Quintile by size of cultivated area for crops per capita (incl. fallow) Low 2 Mid 4 High Average
Increase of yield with fertilizer
2007/08 seasonPercentage of households that grow maize 77.2 81.6 84.2 85.5 89.9 83.7Percentage of households producing maize that sell maize 22.4 32.1 34.8 44.4 51.1 37.5
Percentage of households using fertilizer 34.5 33.6 34.1 37.8 45.8 37.3Yield without fertilizer (Ha/ton) 1.31 1.12 1.13 1.14 1.08 1.16Yield with fertilizer (Ha/ton) 2.46 2.17 2.03 2.13 2.00 2.14 84%
2003/04 seasonPercentage of households that grow maize 72.7 80.0 86.4 85.2 87.5 82.4Percentage of households producing maize that sell maize 13.5 21.2 31.6 37.4 40.9 28.4
Percentage of households using fertilizer 23.9 21.9 28.9 31.9 35.5 28.4Yield without fertilizer (Ha/ton) 1.48 1.28 1.35 1.19 1.25 1.31Yield with fertilizer (Ha/ton) 2.13 1.95 1.98 1.92 1.92 1.97 50%
Source: Characteristics of Small and Medium-Scale Crop-Growing Households in Zambia: Preliminary Comparison of Results From CSO/MACO/FSRP National-Level Supplemental Surveys in 2003/04 and 2007/08 Crop Marketing Season. Lusaka, Draft 2 for review, May 4, 2009.
The area under Cassava also increased steadily, although the apparent increase from 1998 to 2000 may have statistical reasons. Cassava production, generally shown in cassava meal equivalents in
9 In line with agreed practice in the SADC area, yields are calculated relative to area planted rather than harvested, so that “yield” shows result related to effort. The difference between area planted and harvested is often substantial. Drought and floods are the most frequently mentioned causes for the difference. The questionnaire contains a question relating to the cause of areas planted not being harvested.

Ximungo Consultores
22[agper-zambia_2010_final.doc – 7/05/10 16:20]
MACO statistics, is calculated by multiplying the area by a technical factor, provided by research institutions, about the yield that can be expected from a given area, and by a conversion factor that indicates the amount of cassava meal that can be derived from cassava roots. With this method, production follows exactly area planted.
Figure 5: Cassava: Area planted
Cassava: Area planted
0
50
100
150
200
250
300
350
400
450
2000 2001 2002 2003 2004 2005 2006 2007 2008
Thou
sand
Ha
Source: Authors on the basis of data provided by the Early Warning Unit, MACO.
Groundnuts are another important crop. Production appears to be on a steady increase since 1993. At first, this was due to increases of cultivated area, but recently, statistics show a significant increase of yields per hectare.
Figure 6: Groundnuts: Area planted
Groundnut: Area planted
0
50,000
100,000
150,000
200,000
250,000
1987
1989
1991
1993
1995
1997
1999
2001
2003
2005
2007
2009
hect
are
Source: Authors on the basis of data provided by the Early Warning Unit, MACO.

Ximungo Consultores
23[agper-zambia_2010_final.doc – 7/05/10 16:20]
Figure 7: Groundnuts: Yield per hectare
Groundnut: Yield per Hectare
0.00
0.10
0.20
0.30
0.40
0.50
0.60
0.70
1987
1989
1991
1993
1995
1997
1999
2001
2003
2005
2007
2009
Source: Authors on the basis of data provided by the Early Warning Unit, MACO.
For the policy analyst and in the context of this AgPER, Cotton is an interesting crop because it is often grown under contract farming / outgrower schemes with extension services and inputs being provided by the main processor (the ginning factory), and also because of its competition with maize. The decision of farmers to grow either maize or cotton depends, to a large extent, on relative prices. Available statistics show a very significant increase of area under cotton in recent years, starting in 2002.
Figure 8: Cotton: Area planted and yield
Cotton: Area planted
0
20
40
60
80
100
120
140
160
180
200
1990
1992
1994
1996
1998
2000
2002
2004
2006
2008
Thou
sand
Ha
Cotton: Yield per hectare
0.00
0.20
0.40
0.60
0.80
1.00
1.20
1.40
1.60
1.80
1990
1992
1994
1996
1998
2000
2002
2004
2006
2008
MT/
Ha
Source: Authors on the basis of data provided by the Early Warning Unit, MACO.
The yield (three-year moving average) has increased steeply in 1997, but has come down again to almost the level of the 1990’s in recent years. Thus, the growth of cotton production is due mainly to an increase of area planted, and not to productivity gains.
Wheat is produced almost exclusively under irrigated schemes by commercial farmers. Zambia now is virtually self-sufficient in Wheat. Production increased steeply since about 2002.

Ximungo Consultores
24[agper-zambia_2010_final.doc – 7/05/10 16:20]
Figure 9: Wheat production
Wheat production
0
20
40
60
80
100
120
140
160
180
200
1998 1999 2000 2001 2002 2003 2004 2005 2006 2007 2008 2009
Thou
sand
MT
Source: Authors on the basis of data provided by the Early Warning Unit, MACO.
With regard to Soya, the story is very similar. But in this case, productivity has clearly improved significantly.
Figure 10: Soya area planted and production
Soya: Area planted and production
0
20
40
60
80
100
120
140
1987
1989
1991
1993
1995
1997
1999
2001
2003
2005
2007
2009
Thou
sand
s
ha
tons
3 per.Mov.Avg.(tons)
Source: Authors on the basis of data provided by the Early Warning Unit, MACO.
Note: The numbers for 2000 and 2002 are suspected to be very incomplete, since the area planted is shown to be just about 20 percent of that of neighbouring years.
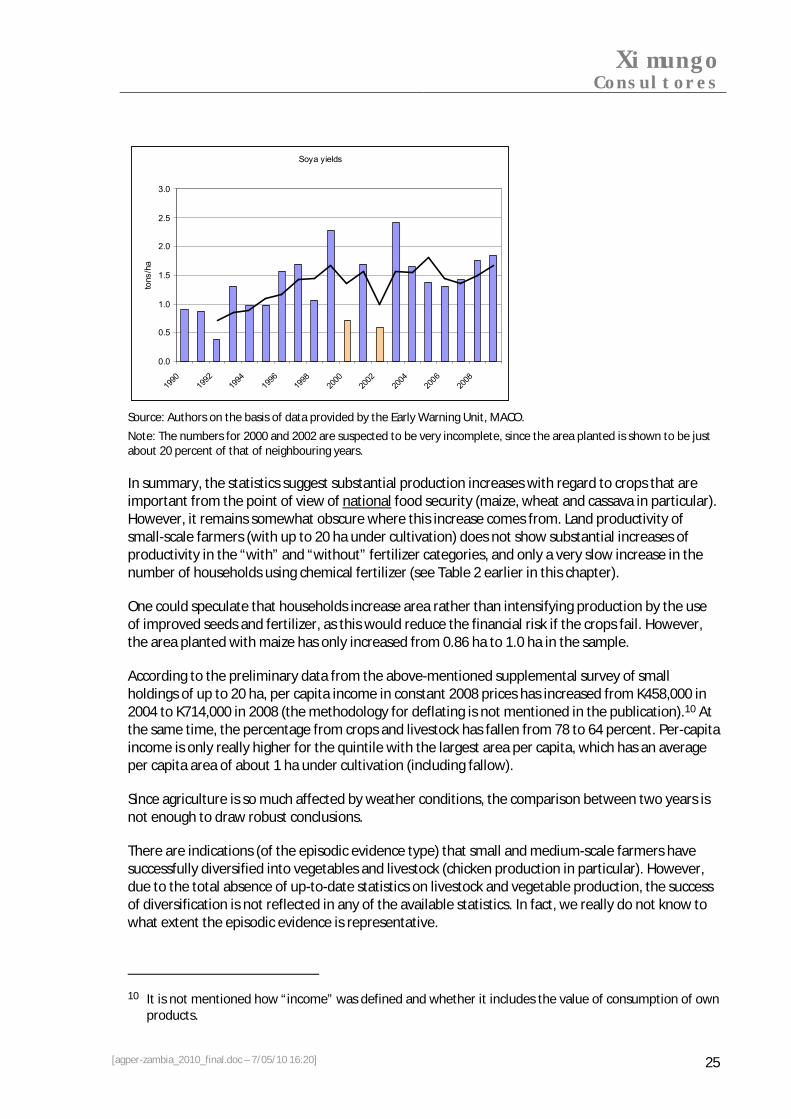
Ximungo Consultores
25[agper-zambia_2010_final.doc – 7/05/10 16:20]
Soya yields
0.0
0.5
1.0
1.5
2.0
2.5
3.0
1990
1992
1994
1996
1998
2000
2002
2004
2006
2008
tons
/ha
Source: Authors on the basis of data provided by the Early Warning Unit, MACO.
Note: The numbers for 2000 and 2002 are suspected to be very incomplete, since the area planted is shown to be just about 20 percent of that of neighbouring years.
In summary, the statistics suggest substantial production increases with regard to crops that are important from the point of view of national food security (maize, wheat and cassava in particular). However, it remains somewhat obscure where this increase comes from. Land productivity of small-scale farmers (with up to 20 ha under cultivation) does not show substantial increases of productivity in the “with” and “without” fertilizer categories, and only a very slow increase in the number of households using chemical fertilizer (see Table 2 earlier in this chapter).
One could speculate that households increase area rather than intensifying production by the use of improved seeds and fertilizer, as this would reduce the financial risk if the crops fail. However, the area planted with maize has only increased from 0.86 ha to 1.0 ha in the sample.
According to the preliminary data from the above-mentioned supplemental survey of small holdings of up to 20 ha, per capita income in constant 2008 prices has increased from K458,000 in 2004 to K714,000 in 2008 (the methodology for deflating is not mentioned in the publication).10 At the same time, the percentage from crops and livestock has fallen from 78 to 64 percent. Per-capita income is only really higher for the quintile with the largest area per capita, which has an average per capita area of about 1 ha under cultivation (including fallow).
Since agriculture is so much affected by weather conditions, the comparison between two years is not enough to draw robust conclusions.
There are indications (of the episodic evidence type) that small and medium-scale farmers have successfully diversified into vegetables and livestock (chicken production in particular). However, due to the total absence of up-to-date statistics on livestock and vegetable production, the success of diversification is not reflected in any of the available statistics. In fact, we really do not know to what extent the episodic evidence is representative.
10 It is not mentioned how “income” was defined and whether it includes the value of consumption of own products.

Ximungo Consultores
26[agper-zambia_2010_final.doc – 7/05/10 16:20]
The GDP statistics, which show no growth in agriculture’s contribution to GDP in real terms, are clearly not credible. This is the result of outdated weights and incomplete data.
It would be of great importance to improve the compilation of statistics about the structure of agricultural holdings, production and the development of yields over time to inform policy decisions. With the coverage and quality of statistics currently available, policy decisions cannot possibly be evidence-based.
2.2 Public Expenditure
The previous section has shown that production for many crops has been on the increase over the past years. Production and income may also have increased with regard to other agricultural products for which no useful statistics exist, such as tomatoes, onions, cabbage, or chicken. To what extent have public institutions in the agricultural sector facilitated and contributed to this development? This section provides the first step in this analysis, by presenting and interpreting data on public expenditure in the agriculture sector over the past decade.
Before presenting our tentative results, the methodology and limitations of the data will be explained. This is necessary because concepts and coverage of budgets and financial reports have changed over time.
2.2.1 Origin of Fiscal Data and Methodology
Our analysis is essentially based on the “Estimates” (often referred to as the “Yellow Book”), which corresponds to the budget as initially approved by the Parliament, and the “Financial Reports” (referred to as the “Blue Book”) which is the statement of the Accountant General about actual expenditure in the past year. These documents are public and available on paper in libraries; we were able to obtain electronic versions for budgets and financial reports from 2004 and after. Approved Estimates were available up to 2010, while the last available Financial Reports refers to 2008.
The same classification scheme applies to the Estimates and the Financial Report. Over the entire period of our analysis (2000 up to 2010), appropriations and actual expenditure is shown by Heads (ministries) and Subheads, which generally refer to a department. Up to 2003, spending below the subhead level was shown by line items (detailed economic classification). In 2004, Zambia switched to an activity-based budget. Each subhead is broken down into “units”, then “programmes” and finally “activities”. All salaries usually appear in one single unit for each subhead level; the other units, programmes and activities only show recurrent departmental charges, grants and transfers, and capital expenditure, without these being shown separately in public documents. There are Subheads with only recurrent departmental charges, investment and grants and transfers, but without salaries. In this case, the salaries are paid by another Subhead which refers to the controlling department.
It depends on the sector where provincial and district expenditure appears in the budget documents. Agriculture is a centralised sector, which means that all province and district-level expenditure appear under the MACO Head (Head 89). Up to and including 2004, provincial and district allocations did not appear in public documents; they received funds from the Ministry of
Ximungo Consultores
27[agper-zambia_2010_final.doc – 7/05/10 16:20]
Agriculture, and departments transferred parts of their respective budgets to provinces and districts. Since 2005, each province has two sub-heads, namely one for “Province – Provincial Agricultural Coordination Office” (PACO) and one for “Province – District Agricultural Coordination Offices” (DACO). All salaries are in the PACO budget. The district budgets, which are disaggregated by units, with each district being considered a unit, only contain funds for recurrent and capital expenditure.
The activity-based budget structure appears transparent because it shows what is planned and how much it is expected to cost, in great detail. However, the classification system does not allow to aggregate across districts what has been spend, for instance, on promotion of fisheries, since the codes are not uniform across districts. Furthermore, what is a department at central level typically becomes a unit at provincial level and a programme at district level.
Expenditure financed through donor funds that are earmarked to the sector or project / activity appeared in the Estimates under “Loans and Investments” until 2005. This budget head is subdivided by ministry, which makes it possible to add the externally funded expenditure inscribed in the Estimates to the broad sector. Since 2006, donor-funded expenditures in agriculture appear as a programme denominated “Bilateral, Multilateral and Regional Cooperation Unit” of the Policy and Planning Department, which is a budget subhead. Although this unit includes some treasury-funded expenditure, the bulk of what is inscribed in the Estimates refers to donor-funded expenditure; it does include, though, internal co-financing where it is required. Each activity carries a footnote which indicates the donor and the amount of the external contribution. There is no separate column for external funds, which makes aggregation over the entire budget almost impossible, and the projects are not attributed to subheads or programmes.
The Financial Report, on the other hand, does not generally capture earmarked external contributions. As a result, not even a global figure on actual disbursements of donor funds to public spending in and for agriculture is available. A donor databank is under development, but does not go back many years and is still incomplete.
Therefore, our analysis refers only to expenditure against Treasury Funds which, by definition, include unearmarked contributions by donors paid as general budget support.
In spite of the many details that are nowadays available in Estimates and Financial Reports, the picture is not complete even with regard to Treasury Funds. The Estimates regularly include contingencies: a general contingency and a provision for the cost of medium-term pay reform. Estimates for salaries are calculated on the basis of the pay scale that is in force at the time of budget preparation and approval. When the annual wage negotiation round is closed and pay scales increased, this contingency is not dissolved by way of transferring the amounts to the spending units. Rather, the salary increase is booked against this Pay Reform budget line. Therefore, personal emoluments shown in the Financial Report tend to be lower than the actual personal emoluments have actually been.
The general contingency may have been used to top up funding of agriculture, but this cannot be seen from the Financial Report because expenditure is booked against the contingency, and the breakdown is not shown. The transparent method would be to dissolve the contingency and

Ximungo Consultores
28[agper-zambia_2010_final.doc – 7/05/10 16:20]
attribute it to budget heads and subheads as required, even down to programme and activity level.11
Data for the period 2000 to 2003 also originate from approved Estimates and Financial Reports, were kindly provided by the Food Security Research Project (FSRP). More detailed analyses are confined to the years 2004 onwards because these budget data were readily available in electronic format, and the classification by units, programmes and activities provides more details which are often needed. However, the type-of-expenditure classifier no longer appears in public budget documents and financial reports. Therefore, non-salary expenditure cannot be classified by recurrent departmental charges, grants and transfers, and capital expenditure.
Taking inflation into account
Over the last 10 years, inflation in Zambia has been rather high (see Figure 11 below). For this reason, series need to be deflated in order to see and analyse trends. In this report, we used the Consumer Price Index (CPI) to deflate series. The index is based on a basket that dates from 1994, and is therefore somewhat outdated. For the use in tables and graphs, the index was rebased to the year 2008 so that values indicate what they would have been in 2008 prices. This facilitates getting a “grasp” of the size of expenditures. For 2010, an inflation rate of 10 percent was assumed.
Figure 11: Consumer price index, base 1994, and annual inflation
CPI Zambia: annual average of consumer price index, base 1994
0
200
400
600
800
1000
1200
1400
1600
1800
2000
2000 2001 2002 2003 2004 2005 2006 2007 2008 2009
Inflation Rate (CPI average against previous year's average)
0%
5%
10%
15%
20%
25%
30%
2000 2001 2002 2003 2004 2005 2006 2007 2008 2009
Source: Authors on the basis of data of CSO.
Another way of making series of a high-inflation country comparable over the years is to convert them into a more stable currency, with the US-Dollar being the obvious choice, in spite of its recent
11 A similar phenomenon occurs in the context of arrear settlement. Arrears in payments to suppliers in Zambia are significant. The clearance of arrears of previous years usually occurs in a budget line under the Ministry of Finance, not in the sector Head to which it belongs. The reason is understandable: the Ministry of Finance wants to make sure that the funds are in fact used to clear arrears rather than for new and additional expenditure.

Ximungo Consultores
29[agper-zambia_2010_final.doc – 7/05/10 16:20]
instability. However, the ZMK/USD-rate12 does not follow inflation differentials at all, as can be seen from Figure 12 below. In fact, as a consequence of the income of Zambia from mineral resources and high amounts of foreign investment, the Kwacha has appreciated considerably over the period 2000 to 2010.
In view of the strong influence of mineral prices and foreign investment on the exchange rate, analyses in this report are generally based on price-deflated series. Trends in US-Dollars are shown mainly in order to provide an easy reference for international comparison and for grasping the size of some spending data.
Figure 12: Exchange rate of the Zambian Kwacha against the US-Dollar
Exchange rate, annual average (IMF)
2000
2500
3000
3500
4000
4500
5000
5500
2000 2001 2002 2003 2004 2005 2006 2007 2008 2009 2010
ZMK
/ USD
Source of data: IMF, International Financial Statistics databank. 2010 = average of the rate for January and February 2010 according to the Bank of Zambia.
Coverage
In order to monitor the target of the Maputo Declaration, NEPAD has defined “agriculture” as forestry, animal husbandry, fishing and crop production. The Maputo Declaration, which is at the base of the CAADP programme for increasing agricultural production in Africa by a targeted minimum of six percent per annum, stipulates that governments shall spend at least 10 percent of their budgets on agriculture.
In spite of this, and since it is not the objective of this study to monitor the target, we restrict our analysis to those expenditure items that are under the Head 89 (Ministry of Agriculture) and, in 2010, Head 88 (Ministry of Animal Husbandry and Fishing). Thus, a number of budget lines are not taken into account in this analysis. The main ones are:
• Forestry under the Forestry Department, which is accounted for under provincial budgets (“Office of the President – Province”);
12 Exchange rates are taken from the IMF’s International Financial Statistics database. Note that the rates that result from consulting www.oanda.com, a popular site used by many international experts, shows exchange rates for the early years (2000 and 2001) that are entirely “off the mark”.

Ximungo Consultores
30[agper-zambia_2010_final.doc – 7/05/10 16:20]
• Investment in new farm blocks;
• Fertiliser subsidies under the “Programme Against Malnutrition” (PAM) which is inscribed under the Ministry of Community Development and Social Affairs;
• The construction of feeder roads under the roads programme.
There are more, but minor items that are omitted here but which enter into the calculation of the share of public expenditure going to agriculture in the NEPAD reporting and monitoring.
In most of our analysis, we look at public spending under the agriculture Head excluding the large outlays for two programmes, namely
• the Fertiliser Support Programme (FSP, renamed to Farm Input Supply Programme or FISP in 2010), which provides subsidised fertiliser and seeds for maize to selected farming enterprises, and
• the subsidies paid to the Food Reserve Agency (FRA).
Both programmes have been analysed in separate studies13 and have therefore been excluded from the Terms of Reference for this main section of the AgPER. The study on the FSP will be a separate background paper for the Public Expenditure Review. As far as the FRA subsidies are concerned, one can even question whether this is expenditure for increasing agricultural production in the sense of the NEPAD target, or a subsidy for urban consumers.
Since both programmes are shown under the Head 89, they will be mentioned occasionally in the following, but not analysed in greater detail.
Additional note
For this study, Financial Reports have only been available for up to 2008. The budget figures for 2009 and 2010 (initial budgets) have often been added to graphs and tables in in order to provide a perspective for the last and current year. Yet, this break in the series should be kept in mind in interpreting the tables and graphs. Budgeted expenditure for personal emoluments is often close to, and even underestimates actual expenditure. But actual expenditure for other items often falls considerably short of appropriations. Therefore, it is very unlikely that the non-personnel budget will actually be spent.
Most graphs and some tables show a bold red line between 2008 and 2009, meant as a reminder of the fact that the data source switches from actual expenditure (up to 2008) and budget (2009 and 2010).
13 On the Food Reserve Agency, see Jonas Govereh, T.S. Jayne and Antony Chapoto, Assessment of Alternative Maize Trade and Market Plicy Interventions in Zambia. FSRP Working Paper No. 33. Lusaka: FSRP. 2008.
On the Fertilizer Subsidy Programme, see World Bank, Zambia: “Impact Assessment of the Fertilizer Support Program, Analysis of Effectiveness and Efficiency.” Draft ESW Report. (mimeo.). 2009.

Ximungo Consultores
31[agper-zambia_2010_final.doc – 7/05/10 16:20]
2.2.2 Overview of Expenditure on Agriculture
In several analyses of public expenditure on agriculture in Zambia, it is suggested that the large sums spent on fertiliser subsidies (FSP) and the strategic food reserve (FRA), which is suspected to gradually become a main player in the maize market like NAMBOARD was in the 80’s, crowd out the core (normal) public spending on agriculture. The argument is supported by looking at the percentage share of FSP and FRA in total spending of the Ministry of Agriculture (Head 89). A closer look at the numbers, however, reveals a more complex picture. Real expenditure on core agriculture (without FSP and FRA), whether measured in constant Kwacha or in US-Dollar terms, has in fact increased, not decreased (Figure 13 and Figure 14).14
Spending on maize market interventions and fertilizer subsidies has skyrocketed, contrary to the financial projection shown in the Fifth National Development Plan which makes no financial provision for these from 2009 onwards.15 An assessment of whether the subsidies have crowded out core agriculture expenditure therefore depends on the counterfactual. Had subsidies actually been phased out, and had these funds been allocated to other agricultural public services, the crowding-out argument would be true. However, it is far from certain that these funds would in fact have been available for the sector. The increases in spending on subsidies and market interventions were so large that the required funds could not be raised by reducing the budget for normal activities alone. This implies that if spending on subsidies is reduced, agricultural services probably have to compete with other uses for the allocation of the savings.
Our conclusion is that the agriculture budget has grown in particular because of the additional outlay for these two programmes. They may have limited the growth of normal agriculture expenditure (referred to as “core MACO expenditure” in the graphs). Yet, MACO has received a higher budget because of these programmes.
The increase of core agriculture spending, however, has not been linear. Particularly in 2007, much fiscal space became available because of a substantial increase in own revenues and because the Multilateral Debt Relief Initiative and HIPC debt relief dividends started being reflected in the budget. Agriculture was one of the benefiting sectors. However, a significant portion of allocated funds could not be spent in 2007, resulting in a significant reduction of appropriations for agriculture in 2008. The reduction between 2007 and 2008 therefore is not primarily due to the large increase in the outlays for fertiliser subsidies and maize market interventions in 2008.
The implication of this observation is that if the Government of Zambia were to restrain its interventions in markets (FRA) and limit the level of subsidies to the fertiliser subsidy programme, which is generally thought of as very wasteful, distorting and insufficiently targeted, it is not evident that the savings would remain with the core activities of the ministries responsible for agriculture, livestock and fisheries.
14 Note that the figure for 2001 is entirely “off the mark”. One of the causes is high spending reported for ZARI in the Financial Report for 2001. Data provided there have been volatile in the period 2000 to 2002. In 2001, the allocation for both salaries and other expenditures was far higher than in 2002, and 100 percent spent. Something quite unusual must have been happening if the numbers are correct.
15 FNDP 2006-10, p. 53. It is noteworthy, though, that the end of subsidies that is subbested in the financial table is not mentioned anywhere in the text.

Ximungo Consultores
32[agper-zambia_2010_final.doc – 7/05/10 16:20]
Figure 13: MACO spending by “core” and “FSP and FRA” in constant Kwacha
MACO spending, constant 2008 ZMK
0
100
200
300
400
500
600
700
800
900
2000
2001
2002
2003
2004
2005
2006
2007
2008
2009
2010
Con
stan
t ZM
K bi
llion
FSP and FRA
Core MACO expenditure
Source: Authors on the basis of Estimates and Financial Reports.
Note: Deflated with the official CPI based on a basket of 1994; rebased to 2008=100.
Figure 14: MACO spending by “core” and “FSP and FRA” in US-Dollar
Core MACO spending in USD
0
10
20
30
40
50
60
70
80
90
2000
2001
2002
2003
2004
2005
2006
2007
2008
2009
2010
USD
mn
Districts
Provinces
Training and research
Central sections of MACO
Source: Authors on the basis of Estimates and Financial Reports.
Core MACO spending represented between 1.6 and 2.3 percent of overall government spending, as reported in the Financial Report (Table 3 below). Spending on the fertilizer programme (FSP) and maize market interventions (FRA) was higher, even considerably higher than core agriculture spending in all years. For comparison: Defence absorbs about four times of the amount going to core MACO expenditure, while government outlays for restructuring and supporting parastatals costs about the same amount as the entire agriculture administration without FRA and FSP. The table also shows clearly the enormous weight of debt service, particularly of internal debt service. External debt service dropped significantly in 2006 as a result of the Multilateral Debt Relief Initiative. In the 2007 budget, these savings and a steep increase in revenues resulted in significantly higher allocations for priority sectors.

Ximungo Consultores
33[agper-zambia_2010_final.doc – 7/05/10 16:20]
Table 3: Global government spending, 2004-2008
million K2004 2005 2006 2007 2008
Tax and non-tax revenue /1 4,535,704 5,425,980 6,291,261 8,198,276 9,666,888Total spending as per Financial Report 5,993,217 7,266,854 7,729,459 9,798,711 12,348,787Debt service internal 745,524 608,894 578,422 469,998 497,536Debt service external 597,989 470,184 227,019 239,180 222,135Defense 538,147 625,791 690,140 899,134 1,013,235Recapitalisation, Investments and Government Institutions under Loans and Investment
124,123 145,391 168,350 219,164 186,848
Agriculture (Head 89) 236,749 332,400 446,838 636,376 735,985Core-MACO 91,500 133,281 122,792 227,078 194,165FSP and FRA 145,248 199,118 324,046 409,298 541,820
in %Total spending as per Financial Report 100.0% 100.0% 100.0% 100.0% 100.0%Debt service internal 12.4% 8.4% 7.5% 4.8% 4.0%Debt service external 10.0% 6.5% 2.9% 2.4% 1.8%Defense 9.0% 8.6% 8.9% 9.2% 8.2%
Recapitalisation, Investments and Government Institutions under Loans and Investment
2.1% 2.0% 2.2% 2.2% 1.5%
Agriculture (Head 89) 4.0% 4.6% 5.8% 6.5% 6.0%Core-MACO 1.5% 1.8% 1.6% 2.3% 1.6%FSP and FRA 2.4% 2.7% 4.2% 4.2% 4.4%
Memo: total internal budgeted expenditure 6,189,281 6,947,082 7,904,334 9,678,320 11,295,249 Source: Financial Reports 2004-2008
Notes:
/1 Tax and non-tax revenue according to the narrative section of the Financial Reports.
Breaking down MACO expenditures while excluding outlays for FRA, FSP and donor-funded projects reveals interesting structural features, but also demonstrates the volatility of actual spending (Figure 15).
Spending by MACO at the various levels and departments, but excluding donor-funded projects, FRA and FSP, amounted to 194 billion ZMK in 2008, down from 227 billion in 2007 (all in current Kwacha), but still significantly more than the average of 128 billion in 2005-06. In constant Kwacha, there has been a slow increase from 2000 to 2008, but the volatility is high. In terms of US-Dollar, spending has increased significantly from about US$ 15 million in the period 2000-2002 to more than US$ 50 million in 2007-2008. However, this increase reflects more the increasing strength of the Kwacha than a real increase of available resources.
Slightly more than half of Core MACO expenditure is allocated to districts and provinces.16 According to reports on actual spending, these attracted an average of 54 percent of core MACO spending over the period 2005 to 2008. In 2009 and 2010, the share appears to increase,
16 Spending by provinces and districts is shown in separate subheads only from 2005 onwards. For this reason, it does not appear in the Figures below in earlier years.

Ximungo Consultores
34[agper-zambia_2010_final.doc – 7/05/10 16:20]
particularly that for districts. But this may be misleading because the data for 2009 and 2010 refer to budgeted rather than actual expenditure. In most institutions in Zambia, cash releases tend to amount to considerably less than appropriations for non-personnel expenditure, while actual expenditure on personnel is normally close to or even exceeds approved estimates.17 All personal emoluments of agricultural staff in provinces and districts is contained in the district budgets, while the district allocations contain only recurrent departmental charges and capital expenditure. Personnel costs represent some 80 percent of actual provincial spending. Therefore, one can expect that actual spending in districts in 2009 and 2010 will remain significantly below the level authorised through appropriations.
Figure 15: Core MACO spending by broad groups of departments, in constant Kwacha
Core MACO spending, constant 2008 ZMK
0
50
100
150
200
250
300
350
400
2000
2001
2002
2003
2004
2005
2006
2007
2008
2009
2010
Con
stan
t ZM
K bi
llion
Districts
Provinces
Training and research
Central sections of MACO
Source: Authors on the basis of Estimates and Financial Reports.
A comparison between spending by provincial and districts agriculture administrations, respectively, reveals that the relation between personnel and non-personnel costs cannot be adequate. Since personnel costs make up most of the provincial spending, while district spending does not contain any salaries, the relationship district/province shows how low non-personnel spending is.
17 As mentioned earlier, the cost of pay rises are booked against a contingency and do not appear under the respective institution.

Ximungo Consultores
35[agper-zambia_2010_final.doc – 7/05/10 16:20]
Figure 16: Core MACO spending by broad groups of departments, in US-Dollar
Core MACO expenditure in USD
0
10
20
30
40
50
60
70
80
90
2000
2001
2002
2003
2004
2005
2006
2007
2008
2009
2010
USD
mn
Districts
Provinces
Training and research
Central sections of MACO
Source: Authors on the basis of Estimates and Financial Reports.
It should be mentioned again that the data do not include donor funding. With regard to research, the available data underestimate spending because salaries for veterinary and fishery research is not separable from the general salary pool of the respective departments; only ZARI, responsible solely for crop research, is singled out as a separate subhead in the budget.
Although it might appear that MACO real spending (in constant prices) is increasing, a further look into the breakdown between personnel and other expenditure sheds a different light on recent developments. The following two graphs show actual spending for the period 2004-2008 separately for personal emoluments and other expenditure items, both in constant prices. While personal emoluments have increased slowly but regularly, other spending is erratic. Non-personnel spending has fallen from 2005 to 2006, almost tripled from 2006 to 2007, but again fallen back in 2008 to the level of 2005.
Figure 17: MACO Personal Emoluments by group of departments
Core MACO personal emoluments
0
200
400
600
800
1,000
1,200
2004 2005 2006 2007 2008
Con
stan
t ZM
K m
illion
Other HQ
Training Institutes
ZARI and research stations
Provinces
Source: Authors on the basis of Estimates and Financial Reports.

Ximungo Consultores
36[agper-zambia_2010_final.doc – 7/05/10 16:20]
Figure 18: Core MACO non-personnel expenditure by group of departments
Core MACO non-personnel expenditure
0
200
400
600
800
1,000
1,200
1,400
1,600
2004 2005 2006 2007 2008
Con
stan
t ZM
K m
illion Other HQ
Training Institutes
ZARI and research stations
Districts
Provinces
Source: Authors on the basis of Estimates and Financial Reports.
About two third of personnel costs are allocated to provincial subheads, which serve provinces and districts. The degree of decentralisation should therefore be considered as high. ZARI and training institutions absorb around 13 percent of all personnel costs in agriculture. Headquarters of MACO remain with a little less than 20 percent (all numbers referring to the average share for 2007/08) (Figure 17).
Provinces and districts did not fare as well with regard to non-personnel spending (lower part of Table 4 below). They absorbed some 37 to 40 percent in 2007/2008. The comparable percentage for training institutes and for ZARI and research stations fluctuates, with both standing at around 7 percent in 2008. Headquarters receive about half of the allocation for expenditure that is not salaries.
Box 2: "Special Years"
Allocations and releases of funds to the public agriculture administration does not escape broader macroeconomic factors. In particular, the years 2006 and 2007 are special. In 2006, actual revenue collection fell particularly short of estimates. In the same year, Government made a particular effort to bring down inflation and therefore reduced its internal borrowing. As a result, cash releases were particularly small with regard to appropriations.
During the course of 2006, Zambia attained substantial debt relief from the HIPC initiative and the MDRI. Public external debt, which stood at US$ 4.5 billion at the end of 2005 dropped to a mere $ 635 million by the end of 2006. The resulting reduction of external debt service opened up considerable fiscal space that became effective in the 2007 budget. Government allocated the additional fund to priority sectors. While the ministries for health, education and the roads programme also got their share, agriculture was one of the prime beneficiaries of the debt relief dividend. The budget allocation to Head 89 increased form K580 billion in 2006 to K1063 billion in 2007.
Thus, 2006 was a particularly bad year, 2007 a particularly good one.
Looking at the relation of non-salary to salary expenditure at each level (upper part of Table 4) can provide a first indication of the adequacy of non-salary funding so that staff can operate and go to the field. The percentages show the share of non-personnel costs as of total spending of each group. Noteworthy are, first, the variations in research and in provinces and districts. While ZARI and research stations had K197 available for materials and investments for every K100 spent on

Ximungo Consultores
37[agper-zambia_2010_final.doc – 7/05/10 16:20]
personnel in 2007, it had only K40 in 2006. There are similar fluctuations for departments at headquarter level. The availability of funds for non-salary expenditure was higher at central level, but this is normal to some extent (ministerial travel, contributions to international organisations etc.); yet, the variability surprises.
At the level of provinces and districts, where more than two third of MACO’s staff is located, availability of operational funds is the most restrained. For every K100 spent on salaries, between K23 and K77 were available for materials, investment and dislocation to the fields.
Table 4: Weight and distribution of non-PE spending by groups of departments, actual expenditure
2004 2005 2006 2007 2008
Ratio of non-PE expenditure to salaries in each group's spending 56.9% 80.1% 48.3% 131.0% 76.5%of which
Provinces and districts 44.0% 23.2% 77.4% 42.6%ZARI and research stations 51.6% 111.8% 39.5% 196.8% 104.2%Training Institutes 10.3% 55.7% 22.4% 59.5% 76.8%Other HQ 63.4% 193.9% 154.5% 343.3% 175.9%
% distribution of overall non-PE spending across groups
Provinces and districts 0.0% 36.2% 32.7% 40.3% 36.9%ZARI and research stations 7.3% 6.3% 5.0% 9.3% 7.0%Training Institutes 1.9% 5.6% 3.5% 3.5% 7.5%Other HQ 90.8% 51.8% 58.8% 47.0% 48.6%
Source: Authors on the basis of data from Financial Reports.
2.2.3 Spending on Technology-Enhancing Programmes
The focus of this AgPER is on public spending that leads to improvements of land or labour productivity and income from agriculture. This group of expenditure is, however, difficult to define in practice because the dividing line between spending for promoting growth and spending for maintaining levels of technology is blurred. Agricultural extension, for instance, has the function of detecting diseases and pests, linking farmers to markets and introducing new techniques and varieties. Agricultural research institutions combine laboratory services, pest and disease control and generation of new varieties and techniques. Existing varieties and techniques tend to expire over time because new diseases may require the introduction of resistant crops not for increasing productivity, but merely for maintaining existing production levels.
The graph below takes a minimum approach to the issue. It shows spending on agriculture-specific training (while excluding the University of Zambia and private higher education institutions), ZARI (which also provides laboratory services and ensues the maintenance of production by breeding varieties that are not necessarily more productive but resistant to new diseases), and the expenditure on research stations. By using this approach, we miss out on expenditure on extension and on veterinary and crop research.
But even with these limitations, the conclusions are interesting. Direct technology spending from public sources represents around 7-8 percent of core public expenditure on agriculture. Training institutions absorb another 6-7 percent, bringing the total to some 13-15 percent. Note that the graph does not include public extension services.

Ximungo Consultores
38[agper-zambia_2010_final.doc – 7/05/10 16:20]
Figure 19: Direct technology spending relative to MACO core spending
Direct technology spending relative to other MACO expenditure
0%
5%
10%
15%
20%
25%
2002 2003 2004 2005 2006 2007 2008 2009 2010
% o
f cor
e M
ACO
spe
ndin
g
Training Institutes
Research stations
ZARI
Source: Authors on the basis of Financial Reports
2.2.4. Budget Execution Rates
The existence of funds in appropriations is not a guarantee for actually being able to spend them in the course of the year. Despite all efforts to reform public expenditure planning and administration, the reduced amounts of releases relative to budgets is a phenomenon affecting many institutions in the public sectors in Zambia. Provisions for personal emoluments are normally paid out almost in full, and even above this if the effects of salary increases are taken into account, which are booked against the contingency rather than on the sector budget. The consequences of systematic underbudgeting in some sectors and the cash budget operated in Zambia therefore become noticeable particularly in the area of non-personnel expenditure.
Table 5 below shows the effects over the period 2004-2008. Execution rates for non-personnel expenditure varied over time. 2005 was a particularly good year, 2006 a particularly bad one. Normal execution rates stand around 60-70 percent of budget allocations, which is still far too low to make budgets relevant. It is also noteworthy that execution rates in research and in districts are typically much lower than they are for the remaining groups. In 2007 and 2008, districts were able to actually spend about 60 percent of the budget, research about 55 percent. Overall, about two thirds of the budgeted amounts were effectively spent.
The table also shows, though, that the underspending is a general phenomenon. Trying to find a response by way of giving preference to service providers (ZARI, research stations, districts) rather than overheads remains a second-best solution. Furthermore, the volatility of budget allocations get out of sight.

Ximungo Consultores
39[agper-zambia_2010_final.doc – 7/05/10 16:20]
Table 5: Budget execution rates for non-personnel expenditure
2004 2005 2006 2007 2008Non-personnel execution ratesTotal MACO core 61% 82% 59% 66% 67%
Provinces 87% 64% 70% 77%Districts 74% 40% 61% 61%Research incl. research stations 53% 72% 39% 58% 53%Training Institutes 27% 86% 38% 67% 82%Other Headquarter 64% 88% 77% 70% 69%
Non-personal emoluments actualTotal MACO core 33,193 59,259 40,002 128,784 84,130
Provinces 0 4,430 4,146 13,530 9,707Districts 0 17,051 8,915 38,401 21,332Research incl. research stations 2,424 3,730 2,017 11,918 5,860Training Institutes 621 3,326 1,387 4,454 6,309Other Headquarter 30,148 30,723 23,537 60,481 40,922
Non-personal emoluments budgetTotal MACO core 54,175 72,310 68,183 195,294 125,988
Provinces 0 5,086 6,491 19,238 12,648Districts 0 23,172 22,103 62,843 35,030Research incl. research stations 4,606 5,215 5,207 20,704 11,078Training Institutes 2,285 3,879 3,647 6,684 7,674Other Headquarter 47,284 34,958 30,735 85,824 59,558
Source: Authors on the basis of data contained in Financial Reports.
2.3 Donor Contributions
Donors are quite active in the agriculture sector. Projects tend to focus on extension and farming systems. In research, ZARI benefits from a number of projects of international cooperation. Where donor-funded projects operate in a particular area, they tend to promote agriculture in general, and include administration and extension in their range of activities.
Unfortunately, projects are poorly reflected in budgets and financial reports. In the previous sections, we largely excluded donor-financed projects from the analysis because of the mismatch between budgets (“approved Estimates”) and financial reporting. This section will shed some light on what actually was excluded.
As mentioned erlier in this Chapter, projects and activities funded by way of earmarked external funds appear under the Policy and Planning Department from 2006 onwards. Before, they were included under the Head of the Ministry of Finance, under “Loans and Investment”. Against this background, we looked at donor financed projects in the budgets only from 2006 onward.
Table 7 below shows the amounts that were budget and reported as external contributions under the Policy and Planning Department in MACO for the period 2006 to 2009.

Ximungo Consultores
40[agper-zambia_2010_final.doc – 7/05/10 16:20]
Table 6: Comparison of internally and externally financed appropriations and reported expenditure
K mn Exchange Rate
USD Thousand
2006 Budgeted 210,959 3,603 58,550Internal 10,651 2,956External 200,308 55,594
Reported 10,506 2,9162007 Budgeted 360,594 4,003 90,092
Internal 5,058 1,264External 355,537 88,828
Reported 34,050 8,5072008 Budgeted 277,311 3,746 74,035
Internal 16,223 4,331External 261,088 69,704
Reported 35,561 9,4942009 Budgeted 158,346 5,046 31,380
Internal 3,350 664External 154,996 30,716
Source: Authors on the basis of Estimates and Financial Reports.
Note: The table reports on planned and actual spending under the Unit for Bilateral, Multilateral and Regional Cooperation in MACO. Only those programmes in which footnotes for external funds appear were selected. The denomination varies over the years. The external contribution was calculated from the footnotes that appear in the Estimates.
Three conclusions can be drawn:
(1) Reported actual expenditure is generally (2006 and 2007) higher than the budgeted internal expenditure. A detailed analysis by projects also confirms that reporting does occur for some elements of donor-funded activities. Yet, the reported figures are so low that they cannot possibly include the bulk of actually disbursed and spent donor funds.
(2) The budgeted co-financing is generally below 5 percent (exception 2008), and erratic.
(3) Budgeted external funding has fallen from $89 million in 2007 to only $31 million in 2009. The figure in 2006 was only $56 million, but this may be due to the change of procedures for budgeting of donor funds that has occurred with the preparation of the 2006 budget.
Our Team did have neither the time nor a budget for verifying whether a decline of donor funding has actually occurred in this magnitude.
The African Development Bank, the World Bank (IDA) and the European Union (via the European Development Fund – EDF) are the major contributors shown in the budget. Sweden had a considerable weight in 2006, but has gradually reduced their support to MACO.

Ximungo Consultores
41[agper-zambia_2010_final.doc – 7/05/10 16:20]
Table 7: Major contributors to externally funded expenditure in MACO according to annual budget documents
2006 2007 2008 2009USD thousand 55,594 88,828 69,704 30,716of which
AfDB 33% 44% 36% 31%IDA 9% 12% 20% 30%SIDA 18% 11% 9% 0%EDF 6% 6% 16% 17%FINNIDA 7% 4% 6% 10%"Various donors" 0% 15% 4% 0%Others 26% 8% 9% 11%
Source: Authors on the basis of annual Estimates.

Ximungo Consultores
42[agper-zambia_2010_final.doc – 7/05/10 16:20]
3. Public Expenditure and Technology and Innovation in Agriculture
3.1 Introduction
In the last decade, perceptions about the mechanisms that lead to innovation in the agriculture sector have changed. Under the old paradigm, public research institutions were expected to generate innovations, and it was seen as the role of the extension services to bring these to farmers. Mechanisms that ensure that feedback from farmers goes back to research institutions and influences the research agenda was a frequently mentioned challenge.
Research Extension Farmer
Feedback
The new paradigm, referred to as the agricultural innovation system, takes a broader approach and involves a shift of attention from technologies to innovation. It recognises that
• innovations can come from national and international research institutions and networks, but also from the private sector that is actively engaged in generating new technologies in situations where a sufficient part of the benefits can be appropriated by the innovator;
• farmers also produce and adopt innovations, which creates the need for mechanisms that facilitate their dissimination among farmers and ensure that research institutions can complement these and provide missing elements;
• public extension services are only one of several channels through which innovation comes to farmers – radio and television, markets, agricultural shows and field days, communication among farmers, the print media and the internet are other mechanisms how farmers learn about innovations;
• markets for agricultural produce and branding, packaging and processing provide major incentives for generating innovations and adapting production technologies.
Zambia’s Agricultural Policy and the section about agriculture in the Fifth National Development Plan take this concept into account. Public-private partnership and the need to create and maintain an enabling environment for private input and produce traders and processing facilities are frequently mentioned.
Private companies have taken up large parts of the challenges and expectations that were underlying the liberalisation of markets in the 1990’s, although the debate continues whether the uptake is sufficiently broad. Before liberalisation, little space was given to private sector activities. Marketing was dominated by state monopolies (the Marketing Boards inherited from the colonial period), research was mainly public or undertaken by the universities, and extension services were provided by the state or by NGO’s on the basis of external finance. Private traders were often not
Ximungo Consultores
43[agper-zambia_2010_final.doc – 7/05/10 16:20]
outrightly banned, but could not develop because price regulations (like panterritorial pricing for maize) and high subsidies were distorting markets.
Some 15 years after the initial liberalisation, private traders serve substantial sections of the rural population. Private mills supply maize and wheat meal and have built considerable storage facilities. Outgrower schemes are frequent in crops that require central processing plants like cotton ginneries, tobacco processing, vegetable exporting to some extent, and sugar production. The seed market liberalisation was a particular success. Several companies, many of them with international links and/or ownership, compete for selling their products to farmers and do most of the research required to develop new varieties.
New ways of doing research and extension have come up through the creation of Trusts, with the Golden Valley Agricultural Research Trust (GART) and the Cotton Development Trust being the best known examples. These trusts still receive public funding from the budget or from donors, but they operate independently and have their own Boards of Trustees. They are often referred to as examples of public-private partnerships, but the true characteristic is more that of a function that was hived off from the public administration.
Under this perspective of an agricultural innovation system, this chapter will explore the role which is currently played by public research and public extension systems, how they function and perform as providers of the genuinely public goods in a setting where other non-state actors play in increasingly important role. Public research and extension are complemented by other providers of technology. The guiding issue is to ensure that the public services that cannot be taken up by non-public providers are sufficiently funded and efficiently delivered.
Particular attention will be paid to gender aspects and gender bias, especially in the section on extension services. The division of work and responsibilities between men and women in rural society has its roots in tradition, while the environment is changing. Eventually, traditions will be overcome, but change processes in society and roles takes considerable time. Therefore, extension in particular has to take different interests of men and women into account if it does not want to risk leaving out a large group of people, who may need and be ready to absorb and implement new technologies and approaches but may require different methods for being reached.
Yet, public services in agriculture can do more than build on traditional roles and take them into account. They can also contribute to changing them by way of enhancing the decision-making power of women in rural society and expand the range of choices that women have. The household approach, which will be presented later in this Chapter, is an example for an approach that has not merely built on existing roles, but supported rural families in adapting the division of work and responsibilities to a changing environment and market opportunities.
Having said this, it must be pointed out that gender equity is generally a cross-cutting issue, in other sectors just as well as in agriculture. Therefore, special “gender” budget lines are rare, and no more than the tip of the iceberg. In most cases, the way how innovations are produced and brought to farmers matters. Special budget lines would refer to additional activities only and will therefore remain the exception.
Innovation does, of course, not come alone from research and extension services. Public services with regard to marketing, seed control, mechanisation and irrigation are also essential ingredients for a dynamic and innovative agricultural sector. The private sector and the conditions under which

Ximungo Consultores
44[agper-zambia_2010_final.doc – 7/05/10 16:20]
it operates are of crucial importance. Because of time contraints, however, this chapter still concentrates on the two subsectors research and extension.
3.2 Agricultural Research
Agricultural research is a key element in bringing new technologies and innovations to farmers. This section presents an overview of the players, finance levels and structure, and achievements and constraints.
We will focus on crop research, for lack of time to adopt a wider approach to research as well as in view of the emphasis of the policy debates on crops and agricultural products. Also largely excluded from the analysis is the cotton sector. It has been extensively studied and presented, and in spite of its success stories may not provide many lessons for the remainder of the research scene because of the concentration of processing plants and export orientation in cotton and the special economic conditions that arise from this.
3.2.1 Overview of Actors and Types of Research
The role of agricultural research is as articulated in the National Agricultural and Cooperative Policy (2003), to generate and adapt technologies for increased and sustainable agricultural production and to provide high quality, appropriate, cost-effective and efficient service to farmers. This role fits well into the policy objective of the agriculture sector as stated in the Fifth National Development Plan (FNDP), 2005, “to promote increased and sustainable agriculture production, productivity and competitiveness in order to ensure food security, employment and reduction in poverty levels.”
A number of players from the public or private sectors, inside or outside of Zambia, are involved in technology generation. The technology may be embedded in products, or may come as process or information. Intensity and quality of research evidently depends on factors such as capacity of research system, level of development, but also focus on opportunities and applicability.
Public research in agriculture in Zambia is carried out mainly through the Zambia Agricultural Research Institute (ZARI), which is one of the departments in the Ministry of Agriculture and Cooperatives (MACO) and focuses on crop, soil and farming system research. Other players in public agricultural research are the Golden Valley Research Trust (GART), which focuses on conservation agriculture and smallholder livestock systems; the Cotton Development Trust (CDT), which focuses on cotton only; the School of Agricultural Sciences of the University of Zambia, which addresses a wide range of research areas in crops, livestock, food science, soils and policy and marketing, and some units of the National Institute of Scientific and Industrial Research (NISIR), which focuses on useful plants and trees.
Table 2 presents the type of research that the research agencies are involved in. Strategic research generates technologies that are inputs into the adaptive and/or applied research, such as chemical composition of fertilizers for specific production purposes, photosynthetic efficiency of crops, pasteurisation protocols for local beverages (Munkoyo), development of breeding populations and such others. The International Maize and Wheat Improvement Center (CIMMYT) along with other international research institutions carry out strategic research, along with UNZA and NISIR. The

Ximungo Consultores
45[agper-zambia_2010_final.doc – 7/05/10 16:20]
results of strategic research are mainly processes (protocols/methodologies) and information (scientific and technical information on underlining causes to performance). Strategic research was the basis for developing products such as downy mildew resistance maize populations or prototypes of an cultivation tool such as a ripper, but further adaptation tests of suitability for existing farming conditions are typically required.
Most of agricultural research in Zambia is in the area of adaptive and applied research, which generates technologies that are targeted at increasing productivity at farmers’ level through adapting new technologies to the farmers’ conditions. This type of research is the main focus of the public research in Zambia. The development of improved crop varieties (high yielding, resistant to diseases and pests, drought tolerant, nutritive), development of farming tools, development of appropriate agronomic practices for crop production, among many others, is the main focus of ZARI. GART and CDT also address similar themes. UNZA and NISIR carry out considerable applied research but limited adaptive research.
Results and products from the public research remain in the public domain (i.e., are not proprietary) and, as such, remain accessible to the whole farming community in Zambia.
The private sector carries out both adaptive and applied research. Most of the applied research, however, is outsourced to parent companies or others. Technologies, mainly input technologies, come in the form of seeds for improved crop varieties, irrigation equipment, irrigation regimes (production practices), or animal feed. Outputs of private research are mainly processes and products that directly support the respective companies’ production agenda. Such products are usually protected in some form (IPR, Patent or otherwise), which is the prerequisite for the private company being in a position to amortise the cost of research.
Table 8: Actors and categories of agricultural research undertaken in Zambia
Crop Technologies/outputs Livestock Technologies/outputs
Fisheries Technologies/outputs
Public
ZARI
GART
CDT
UNZA
NISIR
Strategic: Chemical composition of fertilizer; plant tissue analysis
Applied: Tillage tools; post-harvest storage
Adaptive: Production practices; Crop varieties
Applied: Feed formulation
Adaptive: Fodder crop varieties; smallholder livestock (goats, local chickens)
Applied: Fish feed formulation; fish breeding
Adaptive: Fish ponds
Outsourced
International Research Institutions
CIMMYT
ILRI
ICRAF
Strategic: Physiological basis of yield; genetic manipulation/GMO
Strategic: Semen storage Strategic: Fish breeding

Ximungo Consultores
46[agper-zambia_2010_final.doc – 7/05/10 16:20]
Crop Technologies/outputs Livestock Technologies/outputs
Fisheries Technologies/outputs
Private
Seed Companies
Plantation Farms (e.g. Zambia Sugar Company)
Applied: irrigation regimes;
Adaptive: Production practices, Crop varieties
Adaptive: Dairy and beef breeds; poultry breeds for eggs and meat
Adaptive: Fish production practices
3.2.2 Public Research Institutions and Sources and Level of Funding
ZARI, the public crop research institution, receives government funding for 100 percent of personal emoluments and some funds for operational and infrastructure spending. Development partners, which include USAID, JICA, CIDA, Sida, FAO and UNDP complement and support research expenditure.
Figure 1 shows the funding to ZARI from 2004 onward, on the basis of recorded expenditure published in the Financial Reports. Efforts to obtain monetary data on donors’ contributions failed – the numbers obtained were not plausible.
The amount of funds released to and spent by ZARI has been steadily increasing, going from K 5.2 billion in 2004 to K 9.2 billion in 2008. In US-Dollars, the increase is steeper due to the appreciation of the Kwacha, from US$ 1.1 million in 2004 to US $ 2.5 million in 2008. All data refer to spending under the ZARI subhead, but excluding the grants shown as “Support to Institutions”.
Figure 20: ZARI actual spending from budget sources
ZARI spending
0
2,000
4,000
6,000
8,000
10,000
12,000
2004 2005 2006 2007 2008
mill
ion
curr
ent K
wac
ha
Research stations
Other HQ excl. "supportto institutions"
PE, General Admin,research management,'Agricultural Research',infrastructure
Source: Authors on the basis of data from Financial Reports.
The execution rates vary enormously. They are above 80 percent for personnel and administration costs, very low for other Headquarter costs. For agricultural research stations, where the actual generation of technologies is done, execution rates are well below 50 percent, with the exception of 2005 when 76 percent of the allocated budget was actually spent.

Ximungo Consultores
47[agper-zambia_2010_final.doc – 7/05/10 16:20]
Information obtained from ZARI indicates that on top of that, the monthly releases are erratic and unpredictable, with negative consequences with regard to continuity of the work.
The programmes that received funding consistently were soil research, phytosanitary research, wheat research, oilseed research, maize research, sorghum research and, plant genetic resources research. Rice, millet, food legumes, root and tuber and vegetable research programmes received funding only in 2004 – if this is not an error in public accounts, they appear to have been discontinued.
ZARI's research agenda is set in a bottom-up fashion. The stations that are situated strategically in the agro-ecological regions (there are three agro-ecological regions) are the starting points. Planning meetings are held at the stations, all relevant stakeholders are invited to review past works and plan the future activities. During these meetings, stakeholders' views and suggestions are incorporated into future research agenda, responding to the needs of the respective agro-ecological region. The strategic players during the meeting include district and provincial extension staff, policy makers, farmers, agro-dealers, other researchers, and other relevant players. These meetings take place between July and August every year.
Plans drawn during these meetings are compiled and presented at a National Stakeholder Consultative Meeting at which harmonization of the plans is done. The National meeting comes about September/October every year.
However, of late and due to funding challenges, this mechanism is not working as well as it once did. The frequency of such meetings and indeed the participation of a wide range of partners has been limited.

Ximungo Consultores
48[agper-zambia_2010_final.doc – 7/05/10 16:20]
Table 9: Expenditure under the ZARI subhead
million Kwacha2004 2004 2005 2005 2006 2006 2007 2007 2008 2008
Budget Actual Budget Actual Budget Actual Budget Actual Budget ActualZARI Total 10,039 7,125 6,168 5,555 7,903 6,406 14,495 10,014 10,832 7,895
excl. Support to Institutions 7,915 5,186 5,252 4,766 6,987 5,882 13,567 9,225 10,832 7,895Personal emoluments 5,433 4,701 3,354 3,337 5,196 5,113 6,592 6,055 6,032 5,622General administration 831 662 289 224Support to institutions (a) 2,124 1,938 916 789 916 524 928 789Research management 300 293 396 318 355 130 2,083 957 1,065 415Public Functions and Ceremonies 150 8 54 47Record management 20 5 13 4Library 18 4Biometrics 35 35Agricultural Research Infrastructure Development 2,000 984Wheat research 15 2 20 5 17 0 243 134 54 39Rice research 17 1Pearl millet research 22 11Oil seeds research 27 10 32 8 26 2 188 38 52 27Vegetable research 21 4Tree and Plantation Crops Research 11 1 14 0 134 17 31 12Plant Genetic Resources Research 21 0 44 19 34 6 155 27 82 25Maize Research 40 2 44 23 42 2 240 37 36 14Sorghum Research 24 1 44 18 22 2 157 13 46 17Food legumes research 15 2Finger millet research 27 1Improvement and agronomy 22 0Root and tuber research 17 3Agricultural Research (b) 1,500 9 1,000 940 1,000 608 1,077 937Agroforestry Research 56 15 21 1Irrigation engineering 30 6Soils Research 101 58 120 53 68 3 484 111 311 134Phytosanitary and Quarantine Services 56 1 43 8 48 2 267 39 287 130Plant Protection Research 57 3 105 25 98 4 195 34 263 119Food Conservation and Storage 18 18 30 8 28 7 139 23 48 30Pathology 297 88On Farm Research and Verification 33 8 20 3 18 1 315 39 168 53

Ximungo Consultores
49[agper-zambia_2010_final.doc – 7/05/10 16:20]
(Table 9 continued)
million Kwacha2004 2004 2005 2005 2006 2006 2007 2007 2008 2008
Budget Actual Budget Actual Budget Actual Budget Actual Budget ActualZARI Total 10,039 7,125 6,168 5,555 7,903 6,406 14,495 10,014 10,832 7,895
excl. Support to Institutions 7,915 5,186 5,252 4,766 6,987 5,882 13,567 9,225 10,832 7,895
Agricultural research stations 1,002 759 939 342 3,103 1,385 2,700 1,310
Total research 10,039 7,125 7,170 6,314 8,842 6,748 17,599 11,400 13,532 9,205excl. Support to Institutions 7,915 5,186 6,254 5,525 7,926 6,224 16,671 10,611 13,532 9,205
xrate ZMK/USD, annual average (IFS) 4,779 4,779 4,464 4,464 3,603 3,603 4,003 4,003 3,746 3,746Million ZMK
PE, General Admin, research management, 'Agricultural Research', infrastructure 7,233 5,002 4,750 4,595 6,551 5,851 10,582 8,611 9,386 7,245Other HQ excl. "support to institutions" 682 184 503 171 436 31 2,985 614 1,446 650Research stations 1,002 759 939 342 3,103 1,385 2,700 1,310Total excl. Support to Institutions 7,915 5,186 6,254 5,525 7,926 6,224 16,671 10,611 13,532 9,205
Thousand US$PE, General Admin, research management, 'Agricultural Research', infrastructure 1,513 1,047 1,064 1,029 1,818 1,624 2,644 2,151 2,506 1,934Other HQ 143 39 113 38 121 9 746 153 386 174Research stations 224 170 261 95 775 346 721 350Total excl. Support to Institutions 1,656 1,085 1,401 1,238 2,200 1,727 4,165 2,651 3,613 2,457
Budget execution ratesPE, Admin, etc. 69.2% 96.7% 89.3% 81.4% 77.2%Other HQ 27.0% 34.1% 7.2% 20.6% 45.0%Research stations 75.8% 36.4% 44.6% 48.5%
Source: Financial reports 2008-2008
Notes:
(a) “Support to Institutions” contains transfers to GART, the Cotton Development Trust, the SADC Gene Bank and other international organisations.
(b) The category “Agricultural Research” includes infrastructure and general expenses. Large parts of its contents are shown under “Agricultural Research Infrastructure” in 2008.

Ximungo Consultores
50[agper-zambia_2010_final.doc – 7/05/10 16:20]
3.2.3 Semi-Private Research
The Golden Valley Research Trust (GART) plays a major role in the research architecture, and is sometimes cited as an example of how research can be undertaken efficiently and effectively if it is left to the private sector. However, GART, although outside the public administration, is not a private undertaken, and it does rely on public funds.
GART was established in 1993 by the Government of the Republic of Zambia as a Public Private Partnership initiative. As starting capital, it received the right to use the Golden Valley Estate, which was transferred from Government as endowment.
An independent Board of Trustees governs the Trust. The Board approves work plans and budgets, reviews progress and sets policy direction. The Board comprises of representatives of the Government of Zambia through the Ministry of Agriculture and Cooperatives and Ministry of Tourism, Environment and Natural Resources; the Zambia National Farmers’ Union and; the International Agricultural Research Centres. This setting ‘frees’ GART from the traditional public institutions’ controls and dependence on uncertain budgetary allocations. Its status allows it to function along the rules and practices of a commercial enterprise. An important aspect of this autonomy is the ability to pay higher salaries than the public sector, which is necessary in order to attract qualified research personnel.
The Trust operates as self-sustaining autonomous entity and is part of the National Agricultural Research and Extension System (NARES). Its main objective are to contribute to the optimisation of production, commerce and trade of crops and livestock, and to the income security of the farm households and enterprises through integrated research and development programmes. The Trust targets all categories of farmers embracing both female and male farmers, small, medium and large-scale farmers.
Research programmes focus on science and technology issues (applied and adaptive research) for generating technologies that are public good in nature and remain in the public domain. The research agenda is set by translation and operationalisation of the national agricultural policy. Currently, the main programmes are in Conservation Agriculture and Smallholder Livestock Systems. The activities go beyond the research stations and extend to the farmers’ level, thereby ensuring scientific validity and rigour and farmer suitability. The execution of the research activities are through strategic partnerships with other players within and outside Zambia, always observing the value chain concept to ensure sustained adoption of technologies.
At present, GART conducts research particularly in the area of smallholder livestock and, in cooperation with the Conservation Farming Unit (CFU), technologies related to conservation farming, such as the development of tools (Magoye Ripper) and legumes for crop rotation and intercropping. GART also produces seeds for so-called “orphan crops”, generally open-pollinated plants which are not profitable for commercial seed producers. The orphan crops include varieties that are suitable for and often found in home gardens, which are typically cultivated by women and serve to produce foodstuff for own consumption.
Funding of GART is diverse as shown in Table 3. Initially funding of GART was from Government as grants but by 1996 these funds ‘dried up’ and GART had to rely on its own sources of funding from sales. In 1998 other sources of funding along with ‘resumed’ government funding became

Ximungo Consultores
51[agper-zambia_2010_final.doc – 7/05/10 16:20]
available. GART’s own funding through sales increased steadily and stands at K 6.5 billion in 2008, and represents almost half of financial sources. Government funding has virtually dried up, standing at around US$ 25,000 in 2008 only. As GART grew and established a reputation, it received increasing amounts of funds from donors. Donors provided a peak of 71 percent of resources in 2005; in 2008, still 52 percent came from this source.
Accompanying this development in the funding of GART was the steady increasing of the donor share from about 30 percent in 1999 to 52 percent since 2008, having reached 70 percent in 2005.
However, the numbers are misleading. GART’s own revenues come largely from commercial farming activities that are undertaken only “for making money”. Assuming that around 80 percent of revenues from the commercial farm section are required to cover the direct cost of the commercial section, that is not related to research, the funding structure changes completely: in 2008, for instance, the farm surplus would have contributed around K 1.3 billion towards financing of research activities, while donors contributed K 49.3 billion. Own financing therefore represented only 18 percent of the donors’ contribution.

Ximungo Consultores
52[agper-zambia_2010_final.doc – 7/05/10 16:20]
Table 10: Financial sources of the Golden Valley Agricultural Research Trust (GART)
million Kwacha
Year
Ow
n Fu
ndin
g (C
rops
an
d liv
esto
ck a
nd
othe
rs)
GR
Z
Don
ors
Tota
l
NO
RA
D (i
rrig
atio
n fa
cilit
y)
Equi
pmen
t lea
se
Net
herla
nds
Gra
nt
UN
DP
UN
CFC
(Reg
iona
l Pr
ojec
t)
USA
ID
Net
herla
nds
PTC
R
efre
sher
Cou
rses
Sida
(Reg
iona
l Pr
ojec
ts)
ZNFU
/CFU
Con
trac
t
Tota
l Rev
enue
% o
f ow
n fu
ndin
g
% o
f GR
Z fu
ndin
g
% o
f don
or fu
ndin
g
1996 287.1 0.0 287.1 100%1997 924.1 0.0 924.1 100%1998 1,107.6 214.4 0.0 1,322.0 84% 16%1999 1,444.8 186.2 656.7 575.7 81.0 2,287.8 63% 8% 29%2000 1,583.0 50.5 388.2 324.6 63.6 2,021.8 78% 2% 19%2001 2,574.3 209.5 980.7 883.6 97.1 3,764.4 68% 6% 26%2002 3,624.1 168.6 3,886.1 3,886.1 7,678.8 47% 2% 51%2003 4,511.5 414.7 2,558.9 2,558.9 7,485.0 60% 6% 34%2004 4,547.7 297.7 8,009.8 7,841.1 28.5 140.3 12,855.3 35% 2% 62%2005 4,550.3 141.1 11,707.6 11,315.2 9.1 383.3 16,399.0 28% 1% 71%2006 5,309.1 24.2 8,087.0 5,264.2 2,822.8 13,420.2 40% 0% 60%2007 4,818.3 10.0 5,817.3 1,004.2 2,946.1 1,867.1 10,645.6 45% 0% 55%2008 6,478.7 111.5 7,255.9 1,626.0 2,464.6 3,165.3 13,846.2 47% 1% 52%Total 41,760.5 1,828.4 49,348.2 575.7 81.0 32,073.7 160.7 2,630.2 37.6 140.3 8,616.8 5,032.3 92,937.2 Source: GART

Ximungo Consultores
53[agper-zambia_2010_final.doc – 7/05/10 16:20]
In this light, it is obvious that GART’s contribution to research and promotion of innovative products and techniques will continue to require public funds. GART is not a financing model, but maybe a model about how successful outsourcing to a permanent and stable institution can be.
Revenues from the commercial farming section will continue to provide funds for research that produces public knowledge. The combination of research and production can also be quite appropriate, for instance when GART is selling heifers for small dairy farms or producing seeds which private seed growers find unattractive. Under this setting, it may be possible for some products to capture a part of the benefit that research produces for the ultimate user (farmer) that is sufficient to finance research and production of these inputs without having to worry too much and too immediately about profitability. But it would be an illusion to think that the surpluses from farming alone can finance the cost of research, the results of which are not proprietory.
At the moment, all donor contributions to GART are said to be earmarked grants to meet the cost of specific activities.18 In the future, the GART model may provide sufficient assurance to donors so that they can eventually switch from a model of financing of specific costs, that have to be justified and accounted for, to broader and more flexible models. The lighter version of flexible funding would consist of the donor paying a price for well specified services on the basis of a proposal of GART as a supplier of these. Control would shift from control of expenditure to control of delivery of services.
The broader approach would be to provide GART with block grants that are not linked to any specific service or activities. GART has an appropriate governance structure in place that would control accounts and – the most important – determine the activity plans and research agenda. In this model, donors would regularly assess GART’s corporate governance, maybe have representatives on the Board of Trustees, but otherwise leave financial management and agenda setting to the respective corporate bodies of GART.
A prerequisite for the block grant model, however, is that GART’s accounting system makes a clear distinction between public services and commercial farming. Equipment and manpower will and should move between these two sections of GART, which would require a system of transparent transfer prices for services that one section delivers to the other.19
3.2.4 UNZA and Research Coordination
The University of Zambia’s faculties are also engaged in research. Very limited amounts of UNZA funds are available for this area; most research projects are funded by international organisations or foundations (the Bill and Melinda Gates Foundation figures prominently on the list of on-going projects).
18 According to the GART Director.
19 A detailed cost accounting system is required in order to give assurance to funders of research that the contributions that are meant for research are not used for covering losses of the commercial farming section. Nota bene: The farm appears to be quite profitable at the moment, but the suspicion may arise, and the accounting system should be able to provide evidence of the real situation.

Ximungo Consultores
54[agper-zambia_2010_final.doc – 7/05/10 16:20]
University research plays a special role in the network because the main objective is to contribute to the qualifications of UNZA staff and add to their respective publications lists. There is some very strategic research, but the list also exhibits some topics that, judging by the title, appear to be potentially very useful for the extension system, but currently detached from the farmers’ needs.
According to the Research Coordinator (agricultural research) of UNZA, links to ZARI and to the extension system are virtually non-existent. However, he is in the process of establishing research directories and initiating a regular symposium on agricultural research taking place in Zambia. Both initiatives should receive specific attention and support. If, for instance, the symposium could take place within the programme of the annual Agricultural Show, it can potentially contribute significantly towards duplicating efforts and linking researchers and research institutions to farmers and their organisations. The symposium could regularly end with a session on “research challenges”, which would promote feedback from the farming enterprise level to research.
3.2.5 Outputs and Outcomes from Research
Most research is on commodities like maize, wheat, soyabean, groundnuts, sunflower, sorghum and millets, cassava and sweet potato and minor legumes. These crops constitute the mainstay of the food basket for most of the Zambian populace. The crops are also important in the supply of stock to the agricultural industry, production (seed production by companies depend on varieties developed) and processing (milling companies depend on grain produced from crop varieties). ZARI has since 1992 released crop varieties such as maize (16), sorghum (7), wheat (7), sunflower (3), pearl millet (5), finger millet (3), beans (6), groundnuts (3), cowpeas (2), cassava (7), pigeon peas (1), sweet potato (3) and vegetables (1).
Table 11 presents a sample of crop varieties released since 2000 and shows that private registration of varieties is highly concentrated on maize, wheat and soyabean. In total, 90 percent of varieties were registered by private companies. If these four crops are excluded, over two thirds of the varieties stem from public research organisations.

Ximungo Consultores
55[agper-zambia_2010_final.doc – 7/05/10 16:20]
Table 11: Currently registered crop varieties by public and private owner
Private Public TotalMaize 105 8 113Sorghum 1 3 4P/Millet 0 3 3F/Millet 0 1 1Wheat 13 4 17Rice 0 2 2Bean 6 4 10Cowpea 0 1 1S’bean 11 2 13Pigeon pea 0 1 1Castor 0 1 1Groundnut 3 1 4Cassava 0 4 4Sweet potato 0 5 5Total 139 40 179Maize, wheat, soya 129 14 143
Percent 90% 10% 100%Other crops 10 26 36
Percent 28% 72% 100%
Other innovations and technologies are not as easy to count because they are not registered publicly. In this area, public research has been quite productive. Other technologies from public research include improved agroforestry species and their production practices, soil inventory computer based database, diagnostic surveys and needs assessments, soil and herbage analyses data for making recommendations, botanical grain protectants for control of storage insects, information on fertilizer application, household level/cottage food processing protocols (farming system output), production practices for dambo utilisation, manual for farmer field schools training and an inventory of soil and agriculture.
The Golden Valley Research Trust has also produced a number of technologies over the period. These include, among others, Conservation Farming tools (Magoye Ripper, Weed Wiper, planter), small ruminant breeds (Boer goats from South Africa), local chicken production practices, and smallholder dairy technologies (cross bred cows, dairy production practices etc.).
What has been the impact of these technologies from research, and to what extent are they known “in the field”?
Extension staff whom our team interviewed confirmed the availability of these technologies as products, processes or information. Farmers and other users of technologies, on the other, could only confirm presence and knowledge of some of these technologies. Maize varieties released in the last five years have a potential yield of over 5 tons/ha, with some capable of yielding 7 tons/ha (SCCI, 2009). These productivity levels are higher than those reported at the farm level, where average yield for maize is given as between 1.2 and 2 tons/ha, depending on the source and the structure of the sample. Actual productivity remains so far below the potential. Fertilizer use alone does not appear to make the difference. Other known factors are declining soil fertility, low

Ximungo Consultores
56[agper-zambia_2010_final.doc – 7/05/10 16:20]
levels of use of lime, uncertain market prospects for the crops and, in particular, late planting, due to, among other things, late arrival of seeds and fertilizer and labour constraints.
The case of sorghum production in Sinazongwe in Southern Province, promoted under a donor-supported programme, revealed that appropriate technology can make a marked difference if supportive structures, especially the extension staff, are in place. Production of sorghum increased from 150 x 50 kg bags to 400 x 50 kg bags, over a period of 3 years. Unfortunately this intervention did not look at the whole sorghum value chain, hence the production was not linked to markets, resulting in a disincentive to the farmers. While household food security could have been adequately addressed in this case, the aspect of livelihood, which would include income generation, was not achieved.
The ASP-facilitated farmer in Monze district gave clear evidence of impact of improved technology from research (see Box 1) if combined with simple business support and a market orientation. This farmer couple was introduced to farming as a business, and from then on, their farming activities followed defined and purposeful plans (vision) linked to the market and using appropriate technology. The farmer received quality extension through the ASP.
Box 3: Impact of research technology on a farmer in Monze District
Mr and Mrs Malambo had been ordinary farmers in Monze district for a long time, following their own instincts in farming until 2003 when introduced to ASP programme that took farming as a business. Mr Malambo and his wife, including their children, were made to be stakeholders in the farming, each having a voice and a specific responsibility. Using improved technologies from research and facilitated by motivated extension staff the progress the family made is summarized as follows:
2003: Joined ASP: developed annualised visions to guide their farming
2004: Bought additional oxen to increase area of production
2005: Built a modern house
2007: Bought a tractor to increase area of production
2009: Bought a pick vehicle for transporting produce
Future: To buy a truck for marketing produce
The story presented in Box 3 points to the potential impact technologies from research can make when appropriate supportive structures are supported; simply put: a well facilitated extension staff will enhance the impact of research technology.
3.2.6 Research Capacity
The current staffing of public research, with specific reference to ZARI, is satisfactory at 73 percent of the establishment (Table 12). The ratio of technicians to researcher is at almost 1:1, which is about what is reported for the Sub-Saharan region.20 The availability of administration and supportive staff in relation to researchers and technical staff is acceptable.
20 Beintema, M. N. and G. Stads, 2006.

Ximungo Consultores
57[agper-zambia_2010_final.doc – 7/05/10 16:20]
Table 12: Staffing of ZARI (incl. agricultural research stations)
Establishment In Place %
Professional (PhD, MSc, BSc) 176 130 73
Technical (Diplomas, Certificates) 146 107 73
Administration (Human Resource Management, Registry, Stores, etc)
54 50 83
Support (General) 379 306 81
Totals 755 589 78
Source: ZARI, 2009. Staff Returns Reports,
The disaggregated numbers of staff over the last 10 years (Table 14) show that ZARI has been able to expand the number of research staff from 2001 to 2008. However, the largest increases have been in researchers with BSc degree. The number of staff with post-graduate degrees has also increased, but not as fast. As a result, the percentage of research staff with post-graduate degrees has fallen from 52 percent in 2001 to 42 percent in 2008.
International comparisons are problematic because we need to compare ZARI ratios, relating to crop research only, to data about the overall public research in other countries. Table 13 below shows the result. In sub-Saharan Africa average without South Africa and Nigeria, about half of the number of researchers have a Master’s degree, while PhD or BSc holders represent a quarter each. In ZARI, BSc holders represent 58 percent of research staff, while the percentage of PhD holders is much lower than in comparative countries.
Table 13: Researchers by degree level - regional comparison
PhD MSc BSc
ZARI 2008 8% 34% 58%
ZARI 2001 9% 43% 49%
Sub-Saharan Africaexcl. Nigeria and South Africa25 countries, year 2000
26% 49% 25%
West Africa, 14 countries, year 2000 32% 47% 21%
South Africa, year 2000 32% 43% 25%
Source: Table 12 combined with data from Beintema and Stads (2006).
The table does not show that most of the senior researchers are nearing retirement (>50 years old). This calls for aggressive recruitment and post-graduate training programmes. Sufficient operational funds are also required in order to be able to offer attractive positions to qualified staff.
The mix of disciplines in ZARI as presented in the re-structuring plan shows large proportion being natural scientists and very few in the socio-economic areas. Most of the latter are very young staff at BSc. level. The implications of this is that research in the farming systems would be limited; perhaps the ‘unlocking’ key to low productivity at farmer level lies in the issues in this area, hence a

Ximungo Consultores
58[agper-zambia_2010_final.doc – 7/05/10 16:20]
need to deliberately strengthen research capacity in the socio-economic disciplines through recruiting and enhanced training of adequate numbers.

Ximungo Consultores
59[agper-zambia_2010_final.doc – 7/05/10 16:20]
Table 14: Human resources of ZARI
(a) Research staff (including research managers) by highest education level, 2001-20082001 2002 2003 2004 2005 2006 2007 2008
PhD 7 8 9 9 9 10 10 10MSc 35 36 38 38 39 41 42 44BSc 40 41 42 43 43 51 61 76TOTAL 82 85 89 90 91 102 113 130in percentPhD 9% 9% 10% 10% 10% 10% 9% 8%MSc 43% 42% 43% 42% 43% 40% 37% 34%BSc 49% 48% 47% 48% 47% 50% 54% 58%
(b) Technicians by highest education level, 2001-20082001 2002 2003 2004 2005 2006 2007 2008
PhDMScBScOther diploma/degree65 65 65 65 71 84 95 105Without diploma/degree 4TOTAL 65 65 65 65 71 84 95 109
(c) Administrative and other support staff, 2001-20082001 2002 2003 2004 2005 2006 2007 2008
Admin 29 29 29 30 32 35 41 50Other 231 230 227 228 230 280 285 306TOTAL 260 259 256 258 262 315 326 356
Number of researchers (head count) (a)
Number of researchers (head count)
Number of administrative and other support staff (head count)
Source: IFPRI, 2009. Agricultural Science and Technology Indicators
(a) Full time equivalent researchers

Ximungo Consultores
60[agper-zambia_2010_final.doc – 7/05/10 16:20]
3.2.7 Conclusions and First Recommendations
The network for agricultural research is diversified and combines private, semi-private (Trusts) and public research actors. This is an asset that needs to be strengthened. In particular, the Trust modality carries some promises because the link to stakeholders’ and clients’ interest is high and institutionalised and because it can operate more flexibly than a state-run institution that depends on very variable and unpredictable funding from the government budget.
Private companies carry out research for crops and implements, but only to the extent that they can appropriate an adequate part of the users’ benefit by selling products which embed technological advances. The scope for this is limited, yet significant.
In spite of research that appears quite dynamic in many areas, the innovations and technologies are not having the expected effects in terms of productivity at farm level in the case of non-commercial farmers, except in selected cases and settings. This may be because technologies and innovations do not reach the farmer, but can also be due to research agendas not being aligned with the economic and social realities of the target group.
Finally, it was found that ZARI as the main public research institution has a deficit of researchers with post-graduate degrees. ZARI has a (at least in theory) adequate mechanism to define its research agenda, but is so short of operational funds that effectiveness of research cannot be guaranteed. In fact, a lot of the information obtained for this study point to the pointlessness to recruit additional staff without being able to provide the operational funds that would make them effective.
This leads to the following recommendations:
(1) Agricultural research for publicly available technology will result from a mix of activities of public and semi-public institutions. GART-type arrangements, however, cannot fully replace public research, and they do need public funding for doing research of which the results remain in the public domain. There is need to continue to exploit the growing pluralism of actors and institutional solutions. Furthermore, there may be reason to create other semi-public research trusts and introduce some form of a competitive process among these for donor and public research funds.
(2) Research for publicly available results requires public funding. The GART model is an institutional, but not a funding model, save for the contribution that its commercial farming section makes towards funding of research. Given the preponderance of donor funding for GART and the unproductively low funding levels for ZARI, public funding needs to increase.
(3) Research should focus on issues related to farming systems and the integration of new technologies into the farmers’ reality. From this perspective, adaptive and applied research are priority. The capacity of ZARI with regard to socio-economic research on the adaptability of technologies at real situations needs to be strengthened, also by recruiting adequate staff.
(4) There may also be need to strengthen research on vegetables and fruit trees. Many of these items are preferably and traditionally grown by women, and they are crucial for a balanced diet of families. Surveys undertaken by the FSRP also indicate the growing importance of

Ximungo Consultores
61[agper-zambia_2010_final.doc – 7/05/10 16:20]
these products as generators of income, complementing the income derived from traditional crops.21
(5) Women and underprivileged groups should be involved in setting the research agenda and monitoring effectiveness of results and benefits derived from it.
(6) In spite of the scope for increasing public funding of agricultural research, mobilization of research funds from international foundations and research institutions is necessary in order to complement funds available from the budget. Research proposal writing is a skill that may need to be enhanced in ZARI, and mechanisms that reward those who managed to acquire funding should be in place.
(7) Donors may want to consider switching from modalities that involve the restitution of defined cost elements to contracting research and related dissemination work on a output-based formula, or even consider funding of independent organisations by way of block grants provided these have an adequate internal governance structure.
(8) Strategic research should continue, but preferably in cooperation with international research institutions and networks.
(9) In all this excitement about new, improved technologies and innovation, it must not be forgotten that a key role of a public research institute like ZARI is also to offer facilities for advanced laboratory services, maintain varieties so that they do not “expire” when new diseases appear, safeguard genetic materials, and catalogue indigenous seeds and associated local knowledge. The low funding levels of research put this crucial function into danger of not being adequately fulfilled.
(10) ZARI needs to strengthen the number of staff with post-graduate degrees, particularly in order to replace those who will soon reach the age of retirement. Provision of adequate operational funds is required in order to make positions attractive for qualified staff who are generally looking for a creative environment where they can put their knowledge into productive use.
3.3 Extension
According to the FNDP and NAP, the agricultural sector shall be “one of the driving engines” of economic growth and development (FNDP, p. 46). Agricultural productivity in the small-scale sector, however, has stagnated over the last decade and, due to unsustainable farming methods, yields per hectare are even in decline in some areas. If the small-scale sector is to contribute substantially to economic growth, changes towards sustainable and more efficient farming practices are required. As shown in the previous chapter, research has resulted in technologies with potential to sustain farmer level productivity being available. Conservation farming (CF), for example, can result in increased yields and maintain soil fertility. Over the last years, ZARI has
21 In a study using survey data from 2003/04, FSRP noted that only few small and medium farmers are net sellers of maize, and that income from vegetables and fruits as well as small animals are becoming increasingly important for income and diet of many rural households. See FSRP ....

Ximungo Consultores
62[agper-zambia_2010_final.doc – 7/05/10 16:20]
released several crop varieties that are better adapted to specific agroecological regions or show a better resistance against certain diseases.
The dissemination of these technologies to farmers is the core function of extension. Extension forms an important link between research and farmers. It takes new technologies to farmers, but also needs to channel feedback from farmers back to research institutions so that it can feed into a responsive research agenda.
This is also evident when it comes to gender aspects, as female and male farmers may have different needs and capacities. The agricultural extension service is the link in this chain to ensure an information flow in both directions.
In this chapter, we will explore the following issues:
• how the public agricultural extension services have changed over the years and how they are organized today,
• new approaches, new messages and the changing role of extension officers,
• the role of associations, trusts and commercial companies in extension, and how public and non-public extension interact and complement each other,
• the financial situation of public extension,
• personnel, capacity and training,
• the role and place of public extension in a pluralistic setting; and finally
• recommendations for the future role and directions of public extension services.
The findings presented in this chapter are based on interviews with representatives from MACO headquarters, key people at district level whom we interviewed during our field trip to Monze, representatives of several institutions like CFU, GART and ZNFU, and an extensive literature study. We rely on numerous recent studies which take the MACO restructuring processes and its effects on extension staff into consideration, the most detailed being the joint GRZ World Bank Study “Extension at the Crossroads” (1999) and the very recent EU funded Participatory Review of MACO “Assessment of Current MACO Capacity, Capacity Development Needs and Challenges” by Agrisystems Consortium (2009), and several working papers from the Food Security Research Project (FSRP).
3.3.1 Change of Public Agricultural Extension Services and How They Are Organized Today
The Agricultural Extension Services in Zambia go back to the early 1950’s under the British Overseas Military Administration and have gone through a constant process of evolution and transformation since. We will only look into the more recent development.
In the 1980’s, Zambia adopted the Training and Visit Model (T&V) under the IDA supported National Agricultural Research and Extension Project, which resulted in an increase of extension staff so that a nationwide coverage could be achieved. The early success of the T&V approach was weaning off due to an unfavourable economic environment (price subsidies on maize and fertilizer) with extension focusing on an increase of maize production on a high input basis which was not suitable to many areas in Zambia. At the same time, the focus on crop variety, essential for food

Ximungo Consultores
63[agper-zambia_2010_final.doc – 7/05/10 16:20]
security of small-scale farmers, was neglected. Therefore, the approach was in many ways counterproductive, as it caused farmers to focus on maize and depend on an unsustainable policy of subsidies. Therefore, although the T&V model was received quite enthusiastically in the beginning, it was felt to be too “top down” and prescriptive in the 1990’s, since the teaching and training approach did not adequately take farmers’ needs and priorities into consideration. In the period of structural adjustment programmes, cuts in the agricultural budget were unavoidable – it was evident that the high public spending on input subsidies was not compatible with macroeconomic stability targets. Yet, the investment in staff training programmes for the T&V approach had created a valuable group of well-trained staff.
In an attempt to maintain the number of farmers serviced while adapting to the financial constraints, the extension system was remodelled during the 1990’s with a focus on groups of farmers rather than individuals. As a result of Farming Systems Research (FSR) carried out from the mid 1980’s onwards, the shift of research and extension towards a more participatory approach and the recognition that farmers’ skills and knowledge are also a valuable source of innovative methods, the idea of a participatory extension approach (PEA) gained ground in Zambia. In 1998, MAFF, as MACO was called then, with support from the World Bank, carried out a study with the aim to improve extension services delivery. In line with recommendations of this study, in view of examples from other countries and supported by donor-led projects in Zambia that operating successfully with PEA, the Participatory Extension Approach was proclaimed as the main vehicle for delivery of extension services by the Ministry in 2000. At the same time, attempts were made to decentralise the structure of public agricultural services.
The present structure of MACO extension consists of the DACO who is the overall coordinator for all government-led agricultural activities at the district. Under the DACO is the Senior Agricultural Officer (SAO) , who coordinates all technical projects at the district level and supervises subject matter specialists (SMS) representing the areas of Crops, Agribusiness and Marketing, Farm Power and Mechanization, Land Use, Irrigation, Food and Nutrition, Veterinary, Animal Husbandry, Cooperatives, Extension Methodology, Farm Management and National Agriculture Information Services (NAIS). Each district is further divided into blocks with a block extension officer who coordinates and supervises the camp extension officers (CEOs) of the different camps within his/her block. The responsibility for paying the salaries of all employees at province and district level was transferred from headquarters to the province level (PACOs).
The exact number of public extension staff could not be obtained from MACO, but from data of the Participatory Review it can be calculated that in early 2009 the established posts in all provinces amounted to 7346, the number of total staff in post was 5109 . According to information given in the district, about 60 – 70 percent of all district-level staff is related to extension service, including the subject matter specialists, while the rest is administration and other services like pest control, statistics, etc.
3.3.2 New Approaches, New Messages and the Changing Role of Extension Officers
Some important features of the Participatory Extension Approach adopted by the Ministry in 2000 include community involvement and participation, community leadership role, and encouragement to self help and self organization of farmers. Extension officers are facing new challenges. They have to go through a transition from technical advisors to community development facilitators. Farmers need access to new marketing opportunities and credit facilities, farming systems are

Ximungo Consultores
64[agper-zambia_2010_final.doc – 7/05/10 16:20]
becoming more relevant, and the intensive dialogue between farmers and extension officers replaces the former top down approach. As the majority of extension staff has been trained under T&V, substantial training was and is necessary to implement the new approach.
The implementation of PEA within MACO has been delayed and interrupted due to financial constraints and re-structuring of the ministry, which is still under way ten years after its official proclamation.
MACO has implemented a 30 percent quota to ensure female participation, but has not yet reached this target. Donor funded projects have apparently more successfully addressed the gender disparities in the Zambian agriculture and have shown that, by taking into consideration the gender balance of beneficiaries, linking female and male farmers to markets and seed companies, and ultimately in addressing the different needs of female and male farmers, it is possible to close the gender gap in Zambian agriculture.22
A number of donor-funded projects already started to work with participatory approaches in the mid 1990’s. These programmes often worked through MACO extension staff, and in the districts covered by the programmes, extension staff has been trained in participatory approaches. Therefore, some districts have PEA fully implemented, but others, due to lack of funds for training programmes in MACO, still have to catch up.
One of the most intensive training for CEOs has been done under the Agricultural Support Programme (ASP), mainly funded by SIDA with additional funds from NORAD. The programme, with MACO as the main implementing partner, operated from 2003 till 2008 in four provinces. The overall goal of ASP was to contribute towards poverty reduction by improving the livelihoods of small-scale farmer households in order to achieve (a) improved food and nutrition security and (b) increased income through the sale of agricultural and agricultural-related products and services. It encouraged and trained farm households to take up “farming as a business” and to participate actively in the market economy. ASP covered 21 districts, targeting 20,000 poor households in phase one and another 24,000 in phase two. The programme provided technical training, skills development for members of commodity-specific interest groups (e.g. land, seed, crop, livestock) and entrepreneurship development by offering workshops to generate business ideas and enhance farmers’ business skills. Specific workshops for women, family and youth entrepreneurship were also offered.
A special characteristic of ASP was the household approach where all adult household members (husband, wife and older children) were coached as a team by the CEO over a period of three years. This involved regular visits at household level to assist the family members to jointly develop a household vision and an action plan how to realize it. The CEO provided guidance to implement the technical and entrepreneurial skills which the different household members had been trained in. In several studies, evidence emerged that the programme generated a significant impact for targeted households, not only in terms of food security and increased income, but also in terms of gender empowerment.23 For example, female farmers have moved into formerly male domains, such as ploughing and beekeeping, and there have also been shifts in the decision-making over assets.
22 See Annex 1Chapter 4 for a more detailed discussion of this aspect.
23 See Bishop-Sambrook and Wonani 2009, Farnworth and Munachonga 2010.

Ximungo Consultores
65[agper-zambia_2010_final.doc – 7/05/10 16:20]
According to one study, the division between ‘male’ and ‘female’ crops is also starting to disappear as a direct consequence of the household approach.24
Box 4: The household approach
In Monze district, all subject matter specialists (SMSs) and the camp extension officers (CEOs) interviewed by our team agreed that the ASP had a positive impact on the households participating in the programme. Although work intensive, the household approach was regarded to be the best approach so far to equally involve all family members. As described in the previous chapter, the family visited who had benefited from a three year coaching by their CEO showed impressive progress and fully appreciated how ASP had changed their way of thinking. Husband and wife had participated in different workshops and technical trainings and are now both equally involved in activities to further enhance their productivity gains.
The wife admitted that they had never done any financial analysis about the relation between input cost and revenues before getting into contact with ASP. Now, she specializes in rearing local chicken, is successfully marketing their farm products and is a rural stockist for products of private seed companies. The SMSs and CEOs value ASP because they got intensive training as facilitators, were provided with financial means to do their job properly and could establish up closer contacts with their clients. Additionally, they gained several years of work experience in a participatory approach. PEA has been practised in the district for years. The ASP could build on previous work undertaken, for example, by a GTZ -financed gender sensitization programme. It was evident from the confidence of the female farmers interviewed that these programmes had a very positive impact on gender empowerment. It should, however, be mentioned that Monze district has been “showered” with projects and may not be representative.
Conservation Farming (CF) is another system approach, which in Zambia has been taken to the field by the Conservation Farming Unit (CFU). CFU operates mainly through their own extension network, but invites MACO extension staff to their field days and on-farm training sessions. They work through lead (or contact) farmers who are contracted, trained and supervised by CFU farm coordinators. Each lead farmer usually recruits about 30 further farmers who are interested in CF and would like to participate in the on-farm training. Lead farmers are paid for establishing the demonstration plot and providing training to other farmers.25 All training demonstrations are held on the field of the lead farmer. The majority of farmers use hand hoes, but CFU also provides training for the more advanced farmers who use oxen. By now, they have reached about 250,000 farmers. CFU has been very successful in addressing gender concerns, and a majority (60 percent) of the farmers trained are women. Many of their lead farmers are also women farmers. Along the main roads out of Lusaka, many signs indicating CF demonstration plots can be seen. It seems that CFU has started a success story in Zambia. They are now promoting conservation farming in neighbouring countries like Mozambique, Kenya, Malawi, Zimbabwe and Tanzania.
Box 5: Conservation Farming
Conservation Farming (CF) is a farming system which promotes rotation of crops with a minimum of 30 percent legumes, conservation tillage, early planting and timely and regular weeding (with hoe, cultivator or herbicides), use of manure and reduced, economic use of chemical fertilizer.
24 Farnworth and Munachonga 2010:4.
25 Lead farmers receive electronic vouchers to buy tillage tools, legume seeds and herbicides from registered traders.

Ximungo Consultores
66[agper-zambia_2010_final.doc – 7/05/10 16:20]
Conservation tillage means that crop residues remain on the field and are not burned; instead of ploughing, the soil is prepared by ripping of planting furrows (when oxen are used) or digging of seed basins with hand hoes well before the onset of the first rains.
The early soil preparation has the advantage that the farmer can plant immediately after the first good rains. Research has shown that every day that is lost against the ideal planting time costs about 1.5 percent to 2 percent of yield – with early planting, the germinating seeds will benefit from the nitrogen flush when nitrogen released by soil microbes with the first rains. Ripping or digging of seed beds is less labour-intensive compared to ploughing and can be spread over a longer period of time, as it is done already in the dry season. This makes CF especially suitable for female-headed households and those affected by HIV/AIDS, which do not have the labour resources for intensive preparation concentrated in the period immediately after the first rains.
But weeding still remains a labour intensive issue. The use of herbicides is often recommended to economize the labour for weeding. Planting legumes as cover crops on fallows and intercropping with legumes also help to suppress weeds. The preservation of crop residues, conservation tillage, planting of nitrogen-fixing legumes and crop rotation helps to maintain soil fertility, or enhance soil fertility in areas where the soils are already depleted. CF is a sustainable way of farming which will enable the small-scale family to farm on the same area for generations.
Many variations, such as intercropping or fallow cropping with legumes, are possible in CF, depending on the priorities of the farmers. Conservation Agriculture is a step further from CF, where the whole farm area is regarded as one interconnected system which is cultivated with CF methods in order to enhance soil fertility, to reduce the input of chemical fertilizers and to provide the household with a variety of crops both for home consumption and marketing. Agroforestry components like interspacing with Nitrogen fixing trees, planting of nitrogen fixing hedges as fodder crops, legume cover crops as fodder, livestock intensification and use of manure on the fields are all components which help to create a sustainable agricultural farming system. The planting of a wider variety of crops and fruit trees (like Guava, Avocado, Moringa) will provide a small-scale household with necessary vitamins and extra nourishment and reduce the risks in times of draught or crop-specific pests.
CF has become so successful in the areas where it had been first implemented that MACO is taking up the message on a bigger scale under the NORAD funded programme “Conservation Agriculture Scaling up for Increased Productivity and Production” for small-scale farmers (CASIPP). Under this programme, which is scheduled to run from 2008 until 2010, MACO camp extension officers are trained as CF facilitators and work with the same system of lead farmers and on-farm training than CFU.
Box 6: CF in practice in Monze
MACO extension officers in Monze District have been trained in CF. Each CEO works with about 15 On-Farm Facilitators (OFF) on their demonstration plots. The CF farmer whom we visited gave a very positive feedback, and his crops of maize, cotton and cowpeas looked very promising. Additionally to being a lead farmer for CF, he is growing cotton in the Dunavant outgrower scheme. His first training in CF, provided by the (female) CEO, took place in May 2009. The current season is his first for cultivating with CF methods. He is very enthusiastic. Previously he needed two pair of oxen for ploughing, this year he only used one span with the Magoye ripper for soil preparation. He was well aware of the fact that his former low productivity was related to soil degradation that had resulted from continuous planting of maize. He hopes to improve soil fertility and consequently yields with conservation agriculture. He is building up a dairy herd, and the manure of his animals will help him to reduce chemical fertilizers. The inputs to set up his demonstration plots, the training and the technical support of the CEO have been financed by CASIPP.

Ximungo Consultores
67[agper-zambia_2010_final.doc – 7/05/10 16:20]
The above examples show that extension staff nowadays has to be able to deal with a more holistic approach. Both under ASP and conservation agriculture, a farming system approach and the links to markets are the centre of extension messages. Farmers and their specific needs have become the focus point, providing technical assistance for specific crops or animal husbandry are no longer sufficient. On-farm training with lead farmers has become a successful tool in the farm system approach, as the lead farmers can experience the results of new farming methods directly on their own fields and will disseminate their knowledge by inviting interested farmers for the demonstration and training sessions.
MACO is only reluctantly implementing PEA, and for years, funding for training of extension officers was insufficient or absent. Training in PEA or conservation farming is done when donor-funded programmes make funds available and remains therefore restricted to certain areas.
3.3.3 Extension Services Provided by Associations, Trusts and Commercial Companies
While some associations work through the public extension system, others set up parallel and complementary structures.
As mentioned above, the Conservation Farming Unit (CFU), which was founded by ZNFU, promotes Conservation Farming and Conservation Agriculture . Since 1995, they are working in 12 districts (spread over four provinces). CFU has been founded by the Zambian National Farmers Union (ZNFU) and is funded by donors (mainly NORAD through ZNFU). CFU is working with lead farmers using their own facilitators for training. The handbooks published by CFU for distribution to farmers, explaining different methods of CF, are very suitable, easy to understand, with many photos and practical explanations.
CFU has a strong partner in the Golden Valley Agricultural Research Trust (GART), which has been described in the previous chapter on research. Most of the research trials for CF are done at research fields of GART. The tools promoted by CFU like the Magoye ripper, special cultivators and a zero tillage planter are tested and modified there. GART is also multiplying legume seeds like cow pea or velvet beans for sale to small-scale farmers. Legume seeds are not readily available on the seed market, but in demand with CF farmers for crop rotation. Besides research for Conservation Agriculture (CA), like intercropping trials, agroforestry components, testing of different legumes for their suitability for CF practices, trials for commercial seed growers are also carried out. Additionally GART has research programmes for improvement of dairy animals and local chicken. Their programmes are linked with ZARI and with regional (Botswana, Lesotho, Namibia) and international (India) research partners.
In areas where CFU is operating, the results of GART’s research is disseminated through CFU extension staff. In other areas, like parts of Western Province or Luangwa Valley, GART is using MACO extension staff, whom they train and support with daily allowances and petrol for their extra work.
Some private agricultural companies contract small-scale farmers in so-called outgrower schemes to grow a specific cash crop. The farmers normally receive loans to buy the required inputs like seeds, fertilizer, herbicides and pesticides from the company, which buys the crop at an agreed price. The typical crops for outgrower schemes in Zambia are cotton, tobacco and to a lesser extent soya, sugarcane and paprika. Paprika and tobacco outgrower schemes seem to be on decline.
Ximungo Consultores
68[agper-zambia_2010_final.doc – 7/05/10 16:20]
The cotton outgrower schemes are a remarkable success story. After market liberalisation, the former state-owned LINTCO was sold in 1995 to two private companies, Lonrho Cotton (taken over by Dunavant in 1999) and Clark Cotton (now Cargill) who both implemented outgrower schemes for small-scale farmers. Within three years the cotton production rose from 20,000 to over 100,000 tons. Although there have been some drastic fluctuations due to market turbulences (caused by fierce competition of new ginneries, credit defaults, and low world marked prices for cotton), the production was close to 200,000 tons in 2005/6 season, with cotton lint becoming the most valuable agricultural export product between 2002 – 2005. As cotton is nearly exclusively grown by smallholders, it is the most important cash crop next to maize. The boom of the cotton sector has been driven mainly by the private sector. The cotton companies use their own extension staff for delivering inputs and technical advice to farmers. After massive problems with defaults on input loans, which caused Lonrho to leave the Zambian market in 1999, Dunavant introduced the Distributor System. Distributors identify farmers, provide inputs and technical advice, and collect the harvest on behalf of Dunavant. Their remuneration is linked to the amount of credit recovered. With this system, repayment rates of loans improved from 65 to over 90 percent. In 2005, the Cotton Association of Zambia was formed under ZNFU, which represents more than 300,000 farmers involved in the production of cotton. Since 2006 the market is again under pressure due to rapid appreciation of the Kwacha and some government policy initiatives which had not only positive effects on the sector. It remains to be seen if the balance between the interests of the private, highly concentrated cotton industry and of small-scale farmers can be found and maintained.
The Competitive African Cotton Initiative (COMPACI) is a technical cooperation programme, which collaborates closely with the private sector (cotton processors) in a Private Public Partnership. COMPACI operates in six African countries and is designed to increase the agricultural income of smallholders by increasing productivity and cotton quality, cultivating a variety of other agricultural products, facilitating access to small loans and developing sustainable commercial relations within the cotton sector. In Zambia COMPACI cooperates mainly with Dunavant and Cargill, the main buyers of cotton produced through outgrower schemes in the country. There is also cooperation between Dunavant, COMPACI and CFU promoting cotton as cash crop in the CF system. Dunavant also cooperates with GART testing their cotton seed in CF field trials.
3.3.4 National Agricultural Information Service
Special radio and TV programmes are very important sources for farmers to get up-to-date information about agricultural markets, trends and new technologies. MACO's National Agricultural Information Service (NAIS) has a long history of transmitting radio programmes for farmers. They have two weekly programmes which are transmitted in the seven main local languages: the Radio Farm Forum, which lasts for 30 minutes, and the Farmer’s Notebook which is a 15 minute information programme with focus on agriculture related issues.
The Radio Farm Forum is organized in a very participatory way: the districts usually have one SMS of NAIS who encourages farmers to organize themselves in radio forums. Each forum is provided with a radio, and its members usually meet for the transmission time of the farm forum programme. This meeting is meant to bring the farmers together, exchange ideas, listen to the programme, discuss the topic of that day and rise questions. The thirty minute programme is divided into two equal parts, the first covering a specific topic like, for example, how to make compost, crop related topics, animal husbandry, diseases, etc. The second part will answer

Ximungo Consultores
69[agper-zambia_2010_final.doc – 7/05/10 16:20]
questions of farmers relating to earlier transmissions. The bottom-up part of the programme consists in farmers collecting questions about the specific topic and making suggestions for new topics that they want to learn about. The questions are collected by the SMS and sent to headquarters, where they are grouped and answered during one of the next radio forum sessions. The farmers are also encouraged to make their own 15 minute programme, where they can invite a SMS to lecture about a specific topic, which is then discussed among the farmers and questions answered. The session is recorded by the district SMS of NAIS and sent to headquarters to be transmitted as the first part of one of the next radio farm forum transmissions. For topics with high amounts of feedback, NAIS collects questions and answers and publishes them for distribution to the districts.
NAIS also produces TV spots and calendars with monthly messages. They used to produce films which were shown in the districts. These films used to be very popular in the rural areas where TV is still an attraction, and there is high demand from farmers to reintroduce these film shows. Last year, the department has finally got a budget release to buy ten audio-video vehicles (the last vehicles have been received in 1979). Film shows tend to attract many people in rural areas and iare an easy and, like radio, economic way of dissemination of messages.
Low levels of funding are serious constraint for NAIS. The rates for transmission time have gone up drastically with the liberalisation of radio transmissions. The department has accumulated a debt of K1.7 billion and rely on the good will of operators to continue broadcasting their programmes. As TV spots are more expensive to produce and broadcasting time is even more expensive, the department has practically given up TV spots. The agricultural information service is not regarded as core section in the ministry and therefore suffer more from budget cuts than other sections.
Farmers, CEOs and SMSs whom we interviewed in the district, all confirmed how popular the NAIS radio programmes are. In earlier years, women were encouraged to form their separate radio forums. This approach was given up after observing that women did not have problems to integrate into mixed groups and were not constrained in making their comments and participating in discussions. Only in Eastern Province, some women radio forums still exist.
As radio, TV and films are media which can reach a very wide audience very effectively, this important instrument to communicate with farmers should be given high priority. If it is designed in an interactive way, like in the case of the radio farm forums, it is a very economic way to disseminate messages and to get inputs and feedback from the farmers.
3.3.5 Financial Situation of Public Extension
Essentially all persons interviewed and all literature consulted state or conclude that public extension service has become virtually inoperational because of insufficient budget allocations. Since funding is known to vary significantly across years, budget data were consulted.
Extension services are not shown specifically in budgets and financial reports. Financial resources are subsumed under the Agriculture Department and the Department for the National Agricultural Information System at central level, the respective units at provincial level, and spread over various programmes at district level. The heaviest expenditure items at the central-level Agriculture Department relate to irrigation. In view of these constraints, we shall concentrate on sub-national expenditure.

Ximungo Consultores
70[agper-zambia_2010_final.doc – 7/05/10 16:20]
Figure 21 below reveals that spending over period 2005-2008 on non-personnel costs has indeed been erratic. Except for 2007, the relation of non-personnel (including capital expenditure) to personnel cost appears inadequate, with a possible exception in 2007. Much higher levels of funding are indic0ated in the budgets for 2009 and 2010.
Figure 21: Spending by provincial and district agricultural offices
Spending at provincial and district level
0
20
40
60
80
100
120
140
160
180
200
2005 2006 2007 2008 2009 2010
cons
tant
K b
illio
n
Districtsnon-PE ProvincePersonnel
Source: Authors on the basis of Financial Reports 2005-2008) and Approved Estimates (2009 and 2010).
Note: Data shown in the graph refer to spending at provincial and district-level of coordination offices under the MACO Head. Personnel costs inscribed in provincial budgets also include salaries for staff affected to district offices.
Location: w:\.projects\Zambia-AgPER\data_analysis\finance\extension-finance.xls
Although it is known from experience that actual releases and expenditure often stays much below what was planned in the budget, a closer look reveals that substantial increases are planned. If we assume that actual spending will amount to around 60 percent of the budget allocation for non-personnel expenditure, the amounts are still well above average spending in the period 2005-2008 (Table 15).

Ximungo Consultores
71[agper-zambia_2010_final.doc – 7/05/10 16:20]
Table 15: Spending by provincial and district agricultural offices
constant million Kwacha2005 2006 2007 2008 2009 2010
Actual Actual Actual Actual Budget BudgetTotal spending Province and District level 95,431 86,233 133,885 103,981 194,648 162,601
Provinces 72,301 75,140 90,705 82,649 108,125 99,974Personnel 66,292 69,981 75,491 72,941 75,830 79,159non-PE Province 6,009 5,159 15,214 9,707 32,295 20,815
Districts 23,130 11,093 43,180 21,332 86,524 62,627Non-PE total 29,139 16,252 58,394 31,040 118,819 83,441
Non-PE as % of total province and district spending 30.5% 18.8% 43.6% 29.9% 61.0% 51.3%
Non-PE total assuming 60% execution for 2009 and 2010 29,139 16,252 58,394 31,040 71,291 50,065
No of provincial and district-level staff Nov 2008 5,109District spending per staff 4.5 2.2 8.5 4.2 16.9 12.3CPI, 2008=100 73.7 80.4 88.9 100.0 113.4 124.7
Source: Financial Reports and Budget figures. Staff level in 2008 from Cardno Agrisystems Ltd 2009 (Participatory Review).
Non-personnel spending as percentage of total spending fluctuates around 30 percent, with significant variations across the years. Non-personnel spending at provincial and district level stand at about K5 million per employee per year, or some $1000. This amount includes consumables and investment expenditure. Staff receives K285,000 per night for overnight trips, or K50,000 per day as lunch allowance if the absence from the office is longer than 8 hours and the distance of the place visited more than 10 km away from the normal working place. It is evident from this that K5 million per employee per year, or some K420,000 per months (about $92) does not allow many field visits.
Another way of looking at the above table is to ask what the operational funds per farm households are. On the basis of the number of 1,460,000 rural agricultural households, the 2008 expenditure by provinces and districts amounts to K71,000 (around $19) per holding.26
Looking at the budget of Monze, the district visited during the field research for this study, it seems that Monze is somewhat better off than the other districts (Table 16). In 2007 and 2008, it received some $1300 per staff, in spite of quite different initial budget allocations. The extreme variability of allocations by programme between years catches the eye, but generally has no particular explanation.
26 The number of rural agricultural households is estimated for the purpose of extrapolation of smallholder survey data. The Food Security Research Project provided a table which shows that the number of rural agricultural households almost doubled from 1991 (779,000 households) to 2009 (1,510,000 households).

Ximungo Consultores
72[agper-zambia_2010_final.doc – 7/05/10 16:20]
Table 16: Planned and actual expenditure for Monze District
K million2009 2010
Budget Actual Budget Actual Budget BudgetGeneral Admin 63.0 38.4 41.2 27.5 7.0 17.0
District Agric Coordination 60.4 32.2 41.1 22.0 259.0 36.1
Nat'l Agric Information Services 46.3 11.5 25.0 13.9 54.4 19.0
Agri-Business and Marketing 92.3 51.4 23.4 13.3 74.2 54.8
Crop production, Extension and Land Management 414.8 123.2 71.0 46.7 46.8 188.0
Support to Camp and Block Operations 125.7 111.2 728.8 73.9
Cooperatives Development 53.3 18.1 24.9 11.0 57.2 25.7Livestock Production and Veterinary Services 153.6 78.5 39.8 23.2 783.4 see below
Fisheries Development 265.0 190.5 239.7 188.2 14.0 87.9
Utilites (Livestock and Fisheries) 4.0
Livestock Development 205.7
Veterinary and Tsetse Control 143.6District Livestock and Fisheries Management 32.4
Total 1,148.7 543.8 631.8 457.0 2,024.8 888.1of which: Livestock and Fisheries 418.6 269 279.5 211.4 797.4 473.6
Agriculture 730.1 274.8 352.3 245.6 1227.4 414.5
xrate 4,003 4,003 3,746 3,746 5,046 4,650Total in USD 286,994 135,864 168,675 122,008 401,260 190,991
Per staff per year (USD) at 100 staff 2,870 1,359 1,687 1,220 4,013 1,910
2007 2008Programme
Source: Financial Reports (up to 2008) and approved Estimates (2009-10).
Note: The allocation for “Support to Camp and Block Operations” in 2009 includes construction work and motorcycles.
These numbers in general confirm the conclusion of many persons interviewed and many studies: provision with operational funds through the budget is far too little for extension services to be effective. Of course, donor-funded projects and semi-public institutions provide complementary operational funds. But many people who were interviewed expressed doubts and reservations about the adequacy of this approach. It boils down to a situation where treasury funds provide for personnel costs, which projects and possibly private interests can then use at the cost of providing the missing operational funds. Doubts are in order as to whether DACOs and PACOs are in a position to set priorities in such situations. Furthermore, extension staff that our team spoke to hinted at their frustration about the fact that they as government employees do the work while projects “get the glory”, for a low rate of participation of the overall cost.
One could, of course, argue that there are too many staff at provincial and district level in view of the little available operational funds. The crucial question, though, is whether the existing staff, with adequate additional training and sufficient operational funds, would be able to “make the difference” and contribute to production growth and farmer income to an extent that exceeds their salary and operational costs.

Ximungo Consultores
73[agper-zambia_2010_final.doc – 7/05/10 16:20]
Field staff of MACO is also very involved in the exercise of allocating the fertilizer subsidy and distribution of inputs. According to interviewed staff, considerable time is allocated to activities surrounding the subsidy. The travel and other operational costs, however, are covered by auxiliary budget lines of the Fertilizer Support Programme at headquarter level; they do not have to be financed out of district allocations.
3.3.6 Personnel and Training Situation in Public Extension Services
The slow implementation of the re-structuring process the Ministry went through, starting under ASIP in 1997, with a further round in 2003, added a further constraint to the effectiveness of extension staff. A freeze on public sector recruitment over several years went along with this process and was only lifted in 2007. During this period, all positions in the Ministry were reviewed and staff had to reapply to the newly established posts. The process took much longer than anticipated and naturally created a lot of unrest amongst staff members. More than ten years later, it is far from being completed and about 30 percent of the established posts at provincial and district level are still vacant, with high variations across provinces. In Southern Province, only 10 percent of established posts are vacant, but in North-Western Province 49 percent and in Luapula Province 43 percent. Additionally, part of the staff in post still has to be transferred from earlier ministry structures to their present positions, with the result that three different payrolls exist. The recent separation of Livestock and Fisheries, which are a separate ministry since 2010, will create a further need for re-structuring.
The recruitment of new personnel can not be done by MACO directly and it seems to be a time consuming process involving government agencies outside the Ministry like the Public Services Management Division and Public Service Commission. We were told that up to 1000 new staff have been recruited in 2009 but cannot yet work as they are still waiting to be included into the payroll system.
Training and access to information for public extension staff are other areas that have been neglected over the last decade. The transition from technical advisor to community development facilitator can only be achieved with updated training courses and good access to information about latest research releases, market developments and new technologies suited to small-scale farmers. With constantly changing markets and price fluctuations for cash crops, extension staff need detailed knowledge about arising market opportunities that farmers could exploit. Information can easily be made accessible via Internet, and it should be an aim that extension officers have regular access to modern information systems.
MACO compiles an annual training plan which is based on applications submitted by headquarter, province and district offices and by individuals. The plan is submitted to MOFNP and when funds are released MACO decides about priorities. How much of the funds earmarked for training is trickling down to extension could not be traced. In the report of the Participatory Review (2009) it was criticized that field-level extension staff receive no technical up-dating and poor facilitation/extension methodology training.
Continuous underfunding, the slow implementation of re-structuring of MACO, irregular training and insufficient access to modern information systems create a climate of unrest and dissatisfaction among the extension staff and impacts negatively on motivation and performance.

Ximungo Consultores
74[agper-zambia_2010_final.doc – 7/05/10 16:20]
3.3.7 The Role and Place of Public Extension in a Pluralistic Setting
The analysis of extension service and its restrained financial resources raises several question:
• When and where can private producer organisations take over the extension functions?
• How can the coordination between donor-funded initiatives and public extension services be improved?
• What are the functions of public extension services which exhibit characteristics of a genuinely public good that need to be financed by public funds?
• If financial allocations to public extension were to be increased, is it plausible to expect commensurate results?
In order to provide answers to, or guidance to answer these questions, a brief discussion of the public good character of agricultural extension in poor countries may be in order. In public finance, one considers a good (physical good or a service) as a public goods if there are strong elements of external effects. External effects are situations where those who pay for a good are not the main or exclusive beneficiaries. Since the willingness to pay is guided by the own benefit, demand for such goods would not correspond to the social (societal) benefit. In practice, pure public goods, like the lighthouse that is often cited in economic literature, which all ships need but no-one can be made to pay for, are rare. More typical are mixed goods which provide some private but also some public benefit, like vaccinations: those who get vaccinated to not catch the disease, but if a sufficient number of people (or animals) are vaccinated, the disease won’t spread, even to those who are not vaccinated. Vaccinations are a typical mixed good with a strong public good characteristic, or a strong external effect on those who do not get the vaccination.
However, non-exclusiveness often relates only to specific groups or regions rather than the entire population. For situations where beneficiaries who are unwilling to pay beneficiaries cannot be excluded but are living in a small area, local taxes and local authorities are the adequate response. Similar mechanisms can be and are being used for services that are industry-specific or group-specific. Literature refers to these as “Club Goods”. It would be unfair to make everybody pay for the control of a disease that affects cotton and spreads from field to field. But it is equally unreasonable to expect individual farmers to pay for spraying because those who opt out will also benefit as long as the neighbours spray their fields and thereby prevent the disease from spreading in the first place.
Extension can potentially be as a club good. The benefits of advice and training provided to one farming household will often benefit other farmers (often in the neighbourhood) as well. News about new technologies spread through hear-say and observation and imitation. But all beneficiaries are farmers. Therefore, general extension services would ideally be financed by farming groups in the same area, like cooperatives. It would be necessary to ensure that all members of the “club” contribute to the financing of extension services. Without legal provisions, however, this is difficult to organise.
Other partially external benefits can be internalised if they are embedded in a certain product that cannot easily be produced and multiplied. Producers of hybrid maize, for instance, that cannot be multiplied by normal farmers, can incorporate the cost of research and adaptation in the selling price of seeds. Producers of farm implements can be expected to invest in generating knowledge

Ximungo Consultores
75[agper-zambia_2010_final.doc – 7/05/10 16:20]
and production technologies for improving their product if and when it cannot be copied easily by competitors.
Suppliers of pesticides, herbicides and fertilizer have an interest in demonstrating the benefits of the use of their products to farmers, which will boost their sales and profits. However, if there are competitors selling similar products, and if the production technology is simple, they would hesitate to create interest in a certain product which the farmer may then buy from a competitor who can offer it at a lower price because he does not need to assume the cost of the information and training activities.
Extension services to poor farmers can also be considered as a public good because of its contribution to poverty reduction and food security, which are general objectives. Assuming that the poor are unwilling or unable to pay for extension services, a case for public provision can be made, similar to the arguments that advocate public provision of education and health services.
Finally, a note for clarification: public goods require public finance, but can be outsourced. It does not necessarily have to be a public extension system that provides extension services.
Applying this theoretical background to the role of public extension services, the following conclusions are to be drawn:
(a) In situations where a monopolistic buyer exists for technical reasons, he/she can reasonably be expected to assume the cost of extension services, but only with regard to the product that he/she is interested in. Examples for this situation are cotton ginneries, sugar mills, tobacco processing plants, coffee and tea processing units and those cases where special marketing knowledge is required in order to access profitable markets (paprika, for instance).
Complications arise because of two factors. First, it may be advisable to combine product-specific extension with general extension in order to realise economies of scale. Cotton and maize are competing products from the farmers’ perspective. Therefore, guidance has to be provided to farmers to make the right choices in view of sustainability and market conditions. The second complication arises from the fact that there may be competition between processing plants. One specific buyer wants, of course, to avoid a situation where he provides inputs and advice which ultimately benefits his competitor. An agreement between competitors about financing services that benefit the industry without necessarily one individual company in order to pool the expense are required.
The state can facilitate the agreement, for instance by way of creating the necessary conditions for companies to be in a position to enforce contracts with farmers. The state can also provide additional finance for extension and training efforts driven by the industry so that food security and sustainability concerns are duly incorporated in extension messages.
The Cotton Development Trust and the activities of COMPACI can be seen as a successful example for how this can be done in practice. These situations would merit the name of a public-private partnership. But the model of the Cotton Development Trust can only be applied to situations where the number of buyers is small enough for them to get together and organise themselves into an interest group strong enough to demand compliance to rules and financial contributions to a cause of common interest.

Ximungo Consultores
76[agper-zambia_2010_final.doc – 7/05/10 16:20]
(b) Producers and sellers of seeds, chemicals and implements, ranging from hoes to irrigation equipment, are another group that can be expected to bring new technologies to farmers because these are incorporated in their respective products. The state would be called upon to establish rules for fair and constructive competition and to provide space for buyers and sellers to meet. In this sense, agricultural shows are important, but they can (and should) be self-financing. Local committees of the Zambia National Farmers Union would be ideally placed to assume the responsibility for organising these shows; little public funding is required except for the cost of stands that are meant to disseminate messages that private suppliers cannot be expected to pay for.
(c) Maize will remain a special crop, for which outgrower schemes or industry-specific arrangements are not readily applicable. The difficulties arise because there are many maize mills and because maize is also a food crop and traded on local markets. Therefore, maize will probably remain in the “public domain”.
(d) The recent rather successful donor-funded activities in the areas of conservation farming and the household approach are cases of donors funding specific approaches in lieu of public budget allocations. These need to be evaluated with regard to their success and cost-benefit ratios. If the benefit is worth the effort, this is a case for increasing public spending on the messages and approaches.
CFU will not survive without public or donor funding because the benefits cannot be appropriated by a limited number of private players. The Zambia National Farmers Union (ZNFU) cannot raise sufficient funds from its members to finance these services, which clearly shows the limits of the “Club good” approach in practice. On the other hand, CFU was never meant to be a permanent activity. Rather, the approach was chosen in order to overcome the inertia of public extension structures which were not convinced a priori of the benefits and applicability of the approach.
(e) The efforts undertaken by GART and CFU to develop and also disseminate new technologies provide a good illustration of the potentially beneficial effects of outsourcing some elements of technology-oriented extension work. However, these should not be taken as evidence that extension can be left to the private sector. Both GART and CFU rely on donor funding and continue to provide public goods for which they cannot charge the beneficiary.
3.3.8 Recommendations for the Public Extension Services
Although extension services are not the only way to bring new technologies to farming households and although private financing of extension services is possible in specific cases, the role of public services for agriculture and extension at the local level remains important. On the basis of our literature review and interviews, it is quite reasonable to expect that, in general, the public extension services are endowed with adequately trained personnel and with extension messages that would be beneficial to small-scale farmers.
The more successful activities of recent times have been conservation farming and the “farming as a business” approach. Both also contain strong elements of addressing the particular concerns of women in rural areas and agricultural households. These are innovations which are not oriented towards a single crop, but to farming systems. The systemic changes introduced by these
Ximungo Consultores
77[agper-zambia_2010_final.doc – 7/05/10 16:20]
approaches benefit not only the farmers who are directly contacted, but also their neighbours. As such, they are not really suitable for privatisation.
These new approaches require extensive technical knowledge about the techniques and requirements of specific crops. Some of these are new to farmers. They have to acquire knowledge about those plants’ markets, physical conditions for their growth and techniques to improve yield and quality. This setting, where change of production patterns is the likely and expected result, is a typical setting where extension services are required. But it is also a setting where the role of extensionists would be required to shift from that of teachers to one where they are facilitators for mutual learning and exchange of information about markets, techniques and also diseases.
Thus, it would be timely and logical to enhance the effectiveness of public extension in the area of farming systems and changing cropping patterns. The following aspects need to be improved and strengthened.
(1) Public extension requires more operational funds. From the analysis presented above, it is very clear that the current level of funding for operational funds is totally insufficient and that effectiveness cannot be expected under these circumstances.
(2) The local (provincial and district) structures of MACO need to play a stronger role with regard to donor-driven initiatives. It may be acceptable that donor funds are used to improve mobility and operations for extension staff in a situation where public funding is not sufficient. However, MACO and the PACO need to remain the main coordinating bodies. Therefore, it is recommended to intensify the PACO's coordination role in annual and medium-term activity planning. The planning exercises must be done while taking a realistic financial envelope into account, the question to asked being “what shall we do with the little funding available” rather than “what could we propose in order to acquire more funds”. The exercise must involve all project units that operate in the area, and they should involve farmers and farmers’ organisations in the process of setting priorities that are in line with the needs of the “clients”.
(3) Training and re-training of staff would appear to be required. Some of the approaches are new for staff who has generally been trained as agricultural technicians rather than farm entrepreneurs. Staff has to acquire knowledge about new techniques required in the context of conservation agriculture, livestock intensification by using integrated conservation farming-livestock production systems (knowledge about legumes as cover crops, incorporation of nitrogen fixing trees in the production system, sustainable soil management, etc.). Shifting from a one-issue technical advice to complex farm system management approach requires a complex extension service. Extension staff needs regular access to modern information systems to keep up with broad knowledge needed to work as facilitators. Refresher training courses should be offered on a regular basis.
(4) The overwhelming role of women in small-scale agriculture and the traditional power structure in families and rural society makes it necessary to take gender roles into account with regard to the selection of innovations and also approaches. But more than this is required because new farming systems will require a redefinition of gender roles in rural society, starting with the family and the village. A continuous process of verifying that women and men have equal access to agricultural services and explicit planning of measures to facilitate the adoption of gender roles to new farming systems is required. Therefore, it is

Ximungo Consultores
78[agper-zambia_2010_final.doc – 7/05/10 16:20]
recommended to provide gender sensitization training to extension staff and also to introduce and enforce the target that a certain percentage of extension staff and subject matter specialists are women. A target of 50 percent appears adequate, although 30 percent may be a more realistic and good initial target.
(5) There needs to be guidance and orientation in the extension system. Our team did not look in detail into the internal planning, monitoring and reporting structures that are in use in extension services, nor did we encounter detailed analyses of this aspect in the literature. But we heard comments hinting at the perception that additional funding for extension would result in improved services only if supervision and monitoring mechanisms are streamlined and strengthened.
(6) In view of the successes of the “farming as a business” approach and the new paradigm of an agricultural innovation system, the role of the extension system in linking up farmers and markets may need to be enhanced and strengthened. Ideally, extensionists would play an important role in assisting farmers to find markets for products which grow in the area and establish contractual links with a secure market outlet.
Having said this, three important aspects remain. Although the local agricultural services are expected to facilitate access of farmers to new technologies, the role with regard to pest and disease control, general monitoring of agricultural activities and statistics must not be neglected. In fact, these are essential core functions of public services that should not be marginalized and should not get out of focus.
Second, it may be appropriate to re-think and re-validate the extension approach in use, taking costs and potential economic benefits into account. The household approach is highly praised, our team could see some of the benefits on the ground. But it has also been criticised for being too expensive and therefore unsuitable for nation-wide expansion. The AgPER team has not run across a systematic analysis of extension methods and costs and consideration of alternatives. Such analysis, however, appears to be crucial for (i) showing the benefits of additional spending in extension and (ii) adapting the system to a resource envelope that can reasonably be expected in the medium term.
The third aspect is the selection of the target group. In discussions in Zambia, our team repeatedly heard references to that about two third of the around 800,000 farming households27 are merely rural dwellers, whereas only some 300,000 farming households have the capacity to eventually becoming market-oriented agricultural enterprises. Which group should be the principal target group for extension work that aims for improving production and income through new technologies (which includes, in this broad definition, seeds, implements, farming methods and markets)?
The choice should be guided by considerations of the cost and potential benefit of extension. Where would it make the most difference? It is not evident that the impact of work with emerging farmers is more beneficial because these might prosper even in the absence of extension services,
27 The number of between 800,000 and 900,000 farming households has been “floating around”. Note, though, that this is far smaller than the 1,500,000 households that are underlying the formulas used for extrapolating survey results.

Ximungo Consultores
79[agper-zambia_2010_final.doc – 7/05/10 16:20]
or may be totally satisfied with a “light” approach. The rural poor, the “rural dwellers” referred to in conversations, on the other hand, may not have the means to get information from other sources. Often, these households are labour-scarce and still complement income from own agricultural production by piece work on their neighbours’ land. Here, appropriate extension messages and support may make more of a difference than in the case of emerging farmers. The choice needs to be made at the local level, because it depends very much on specific local conditions.
Messages suitable for farmers that could become emerging farmers are likely to be different from those which subsistence farmers can accommodate. The search of innovations appropriate for those who will not produce for markets on a significant scale but still require the agricultural produce to sustain their livelihood should not be neglected.

Ximungo Consultores
80[agper-zambia_2010_final.doc – 7/05/10 16:20]
4. Gender and Expenditure on Agriculture in Zambia
4.1 Introduction
The focus of this PER is by and large on innovations, and considering that gender biases and sometimes gender discrimination are major facts that may prevent new technologies from being adopted, this chapter will extensively discuss the importance of gender in the Zambian agricultural sector. Including a gender analysis in this PER will provide a forum for dialogue on how gender inequalities, and in particular women’s lack of economic empowerment, hinders general economic development and poverty eradication. The PER review can assess to what extent the budget supports implementation of signed conventions such as the Convention for the Elimination of All Forms of Discrimination Against Women (CEDAW), and how this is part of effective budget implementation and efficient service delivery. Such an analysis will also show to what extent the GRZ’s goals on gender in the agricultural sector, as formulated in the Strategic Plan for Gender in Agriculture draft, and the FNDP have been realized. This study will also look at the Gender Focal Point system, which is the institutional setup for mainstreaming gender issues into MACO, centrally and regionally, in terms of implementation and strategies.
Governments are expected to formulate policies and implement programmes that effectively contribute to the achievement of social and economic development goals in their countries. The goals and the tools used to achieve them must also be consistent with governments’ commitments to achieve equality for women. Budgets are key policy statements that reflect a government’s socio-political and economic priorities. CEDAW makes explicit reference to how governments can work with their budgets to achieve these priorities. Article 3, for instance, requires that women have both formal and substantive equality, which means that budgetary measures must actually improve women’s situation, in relation to that of men, in real terms.
However, the requirement for equality does not mean that men and women must always be treated identically. CEDAW recognizes that there will be times when non-identical treatment is needed to achieve substantive equality. A key challenge is to make sure that in determining what is adequate funding, proper account is taken of the role of women’s unpaid work. The failure to take proper account often implies that the costs and benefits of public interventions are not thoroughly assessed, and wrong decisions could be taken.28 Women’s work in the care/household economy,
28 Because women's unpaid work has no money value attached to it, women's activities have not been taken into account in the development of laws and policies which have exacerbated existing inequalities. The lack of remuneration for much of women's work has a direct relationship to women's economic security. When women are spending their time on unpaid work, they are not doing paid work, and because only the latter is remunerated, women's earning potential decreases dramatically. The lack of recognition of unpaid work is a chief contributor to women's higher rates of poverty. Measuring unpaid work was one of the major challenges to governments that came out of the UN Third World Conference on Women in Nairobi in 1985 as well as the UN Fourth World Conference on Women in Beijing in 1995. The Platform for Action that developed out of Beijing calls for national and international statistical organizations to measure unpaid work and reflect its value in satellite accounts to the GDP.

Ximungo Consultores
81[agper-zambia_2010_final.doc – 7/05/10 16:20]
though in support of the market economy, is not included in national statistics. There is need to put value to the household/care work and, therefore, economy.29 In allocating adequate funds, governments fulfil what is called their “obligation of conduct”. The obligation to advance gender equality in Article 3 of CEDAW also includes an “obligation of result”, by which spending must have an actual impact on transforming women’s status. It is important to emphasize this because a big gap often exists between what is meant to happen and what actually happens in budgeting.30
To integrate a gender perspective into the state budget is a lengthy process which, first of all, needs awareness and insight into what a gender perceptive budget will contribute to, awareness of the fact that the gender equality perspective helps to improve economic governance and results-based management by making gender equality priorities and resource allocations visible in the budget.
This chapter is based on interviews with staff at MACO, MoLF, MoFNP, and GIDD, as well as with UNZA, ZNFU, CFU, Ramboll/ASP, Sida, conversations with members of the UNDP Gender Audit team now reviewing MACO, as well as on a comprehensive literature review. In this chapter we give a more detailed and nuanced view of how the gender equality goals of the FNDP agricultural chapter are implemented in the activities of MACO, to what extent they are integrated in MACO as an organization and lastly to identify what gender concerns there are among the Zambian agricultural producers, the farmers.
4.2 Gender and Agriculture in Zambia
4.2.1 Gender Analysis of the Agricultural Sector
In the Zambian agricultural sector, women make up the majority of farmers. According to the World Bank’s Strategic Country Gender Assessment of Zambia, women provide up to 70 percent of agricultural labour. Women farmers are in fact major contributors to the Zambian economy, which also makes them important agents of economic development. Still they are often excluded from access to resources, decision making processes, and are also less privileged beneficiaries of public services, such as extension. This in turn inhibits them from increasing their contribution to agricultural productivity and the overall economy. There is growing empirical evidence that gender inequalities can slow down economic growth and poverty reduction.31 To focus on the economic empowerment of women farmers should therefore be a logic priority of agricultural programmes and policies.
Given the extensive participation of women in all aspects of agricultural production in Zambia, the mainstreaming of gender into the agriculture sector is a key strategy not only for the promotion of equality between men and women, but also for sustainable agricultural and rural development and economic growth.
29 World Bank (2004), Zambia: Strategic Country Gender Assessment.
30 Budgeting for Women’s Rights: Monitoring Government Budgets for Compliance with CEDAW, UNIFEM 2006.
31 GTZ (2008), Study on Gender-disaggregated data for the Zambian Ministry of Finance and National Planning (MoFNP).

Ximungo Consultores
82[agper-zambia_2010_final.doc – 7/05/10 16:20]
The Poverty Reduction Strategy Paper (PRSP) 2002-2004, the Fifth National Development Plan (FNDP) 2006-2010, and the National Agricultural Policy (NAP) 2003-2015 are the three main policy documents that are intended to guide government spending in the agricultural sector. In terms of more gender-specific concerns of economic growth and development programmes, the government has also approved a National Gender Policy. Zambia is also signatory to the SADC Declaration on Gender and Development, the Convention on the Elimination on All Forms of Discrimination against Women (CEDAW), and The African Charter on Human and People’s Rights, but many of these have not yet been translated into laws.
One of the challenges highlighted in the FNDP as compromising the ability of the agricultural sector to benefit from its full potential is the limited mainstreaming of gender in the sector. The main gender-specific objectives of the agricultural chapter of the FNDP include ensuring women’s increased control over land and agricultural services, with more specific objectives broken down by programmes. In short, it is stipulated that the agricultural sector should focus on gender balancing, gender equity and the mainstreaming of gender throughout all programmes, projects and activities. Gender is one of the cross-cutting issues in the NAP as well as in the FNDP, and promoting gender equality in the provision of agricultural services is highlighted as a key feature. Seven out of nine programmes of the agricultural sector have at least one strategy with a clear gender element.
To mainstream gender issues, the Government of Zambia has also established several mechanisms, including the Gender in Development Division (GIDD) under Cabinet Office, which is mandated to coordinate, monitor, and evaluate the implementation of the National Gender Policy in order to achieve gender responsive development. Gender Focal Points are appointed and Gender Subcommittees have been established in each line ministry and at the provincial and district levels to function as a link between the GIDD and the various ministries.
Women in Zambia play a crucial role in food security and food production. They perform around 70 percent of all agricultural tasks in Zambia. Traditional agricultural work has been characterised by a sexual division of labour where female agricultural tasks include weeding, harvesting, stocking, marketing and processing. Men are responsible for soil preparation and ridging and usually make all decisions on how to spend the household income. Men and women also tend to engage in different crops and forms of animal production. Although it is difficult to talk about any general so-called ‘women’s crops’ in Zambia as a whole (due to wide regional variations), women are often involved in farming for household consumption, in products such as groundnuts, sweet potatoes, legumes and vegetables. Women are also likely to keep smaller livestock, such as chickens and goats, but the volumes are often small. Female chores are also performed over a longer period of the year and are more time consuming. Given that female farmers supply labour to the household/caring activities as well as to agricultural activities, at no cost, this affects the allocation of resources by imposing a constraint on the participation of women in other activities, thus creating an indirect gender bias.
Although gender roles are seen to have changed towards greater gender equity during the last twenty years in Zambia, women, especially in rural areas, are still constrained by a lack of access to inputs, productive resources, and services. Married or adult women have generally little decision-making power and control over financial resources in the home, even when the money comes from their own agricultural activities. Rural society in Zambia is still very traditional, especially for small-scale farmers, and this has been perceived as an obstacle to both development and gender equality. In spite of the major contribution of women to agricultural production, their role in

Ximungo Consultores
83[agper-zambia_2010_final.doc – 7/05/10 16:20]
ensuring agricultural growth is hindered by unequal resource allocation, i.e. access to land, water, input, credit, fertilizer, capital/equipment, animal drought power, labour, agricultural education and training, decision-making, extension services, and improved technologies.32 It has been indicated that women farmers to a greater extent than male find it harder to access hired labour due to cultural constraints and lack of resources. Women farmers also have little access to labour saving technologies, which has important implications for achievement of both household food security and national economic growth and development. Women farmers have had less contact with extension services than men and generally use lower levels of technology33 and play a very limited role in planning and the formulation of policy in the agricultural sector.
In the 2006 Annual FNDP Progress Report, it was noted that little progress had been made in the area of economic empowerment of women, referring to the access and control of the means of production, such as land and agricultural services. According to the report, focus in the agricultural sector should be on increasing the participation of women in decision making and increasing their access to agricultural services.34 Again, in the 2007 Annual FNDP Progress Report little progress is recorded in the area of economic empowerment of women in the agriculture sector.35
It has often been stated that if empowered, female farmers are more likely to access and control resources, which in turn increases the likelihood of them becoming entrepreneurs or acquiring leadership positions. Evidence from the “gender empowered households”36 in the ASP project shows that such women, to a larger extent than women in more traditional households, participate in new areas and obtain new skills.37 These include the formation of business enterprises, food processing, and some also become lead farmers or outgrower managers. There are also some indications that women outgrower managers often engage more successfully with women farmers. Women in empowered households also seem to take up skills previously dominated by men, such as land preparation, spraying crops, tending to cattle and participation in the production and
32 World Bank (2004), Zambia: Strategic Country Gender Assessment.
33 FAO (1998), The potential for improving production tools and implements used by women farmers in Africa, Agricultural and Consumer Protection Department.
34 2006 Annual Fifth National Development Plan Progress Report, Ministry of Finance and Planning, April 2008.
35 2007 Annual Fifth National Development Plan Progress Report, Ministry of Finance and Planning, no date
36 In gender empowered households women who have traditionally been disadvantaged in comparison to men, have (i) improved basic capacity and exposure to the wider world, (ii) increased control over resources, (iii) increased access to finance, (iv) improved farming knowledge and skills, (v) improved entrepreneurship skills, (vi) demonstrate advanced farming skills or entreprenuership skills, (vii) increased control over household income, (viii) increased participation in community leadership, and (ix) reduced household workloads. See Bishop-Sambrook and Wonani 2009.
37 ASP, (2008), The Household Approach as an effective tool for gender empowerment: A review of the policy, process and impact of gender mainstreaming in the Agricultural Support Programme in Zambia (March 2008), by Clare Bishop-Sambrook and Charlotte Wonani.

Ximungo Consultores
84[agper-zambia_2010_final.doc – 7/05/10 16:20]
marketing of cash crops.38 In fact, there is no evidence that gender empowered households would be less productive than more traditional households. According to a World Bank report, the missed potential of not taking gender issues into account is considerable, for example, it was noted that in Kenya, by giving women farmers the same inputs and education as men, yields could increase by more than 20 percent. According to the same report, if women enjoyed the same overall degree of capital investment in agricultural inputs, including land, output in Zambia could increase up to 15 percent.39
4.2.2 Extension
Extension is identified as the key link between farmers and the public agriculture administration, between farmers and the market, and also ultimately between theory and practice, that is, between research and implementation. As with many core areas within MACO, extension has suffered serious underfunding due to a wide range of factors (see extension chapter). The problems identified with extension services, by both state and non-state actors, is foremost the lack of funding for extension activities, training and logistics. Some have also mentioned the old and outdated knowledge base, and the more technological approach of some extension workers, which have inhibited the dissemination of agricultural innovations, both in terms of the changing market systems and new farming techniques. For example, since conservation farming has only been promoted by non-state actors until recently, those techniques have not been known to those who have not worked in an area where donor funded conservation farming projects have been implemented. Extension services today have also moved from more traditional methods of agricultural extension centred on individual farm visits to farmer-to-farmer extension, farmer field schools, and farmers’ organisations.40
Due to the sexual division of labour within the agricultural sector in Zambia, it is evident that female and male farmers have different needs in terms of extension. Traditionally, in most extension services, farmers have either been treated as a homogenous group or have been seen as male, often putting female farmers at a disadvantage, with their lower levels of access to assets, resources, and knowledge. In recent years, however, also as part of the shift from the more technology-oriented Training and Visit Model to the Participatory Extension Approach, in Zambia there has since the early 1990s been more focus on crop diversification away from hybrid maize to traditional crops such as roots, tubers, and legumes, which are to a larger extent grown by female farmers, which in turn has improved their involvement in agricultural development programmes and farmers organizations.41
38 Farnworth, Cathy R. and Monica Munachonga, (2010), Zambia Country Report. A Contribution to the Study: Gender aware approaches in agricultural programmes: a comparative study of Sida supported agricultural programmes. A special study of the Agricultural Support Programme (ASP) in Zambia.
39 World Bank, (2005), Agricultural Growth for the Poor: An Agenda for Development. Directions in Development Series. Washington, DC: World Bank, italics added.
40 Commonwealth Secretariat (2001), Gender Mainstreaming in Agriculture and Rural Development: a reference manual for Governments and other Stakeholders.
41 Charman, A.J. ( 2008) Empowering Women Through Livelihoods Orientated Agricultural Service Provision: A Consideration of Evidence from Southern Africa, UNU-WIDER.

Ximungo Consultores
85[agper-zambia_2010_final.doc – 7/05/10 16:20]
According to interviews, the number of female extension workers is still comparatively low. There is an official quota of 30 percent reserved for female extension officers, but it is difficult to follow up if this is in fact implemented. According to a recent study, the “posting of female staff to remote rural areas remains a challenge for MACO as women prefer to work closer to urban areas where better social services are accessible, particularly for their children”, and notes that there are only a limited number of such postings available.
Available data from 2009 do not distinguish the category extension staff, but the number of agricultural assistants is 1524, of which 23 percent are female, the number of agricultural officers are 148 of which 11,5 percent are female and the number of agricultural specialists are 41 of which 14,5 percent are female (see Table 17). Female extension staff are important as it was mentioned that they are able to interact more freely with female farmers whereas male staff often feel that it is socially difficult to engage with female farmers. This implies that men are benefiting disproportionally from the government’s agricultural subsidies and services. However, based on the field trip to Monze, one member of our team with previous work experience in rural Zambia many years ago noticed a clear difference in the way female farmers expressed themselves, how they were speaking out frankly and not holding back their opinions. In Monze, this new confidence was attributed to the ASP household approach and the earlier GTZ gender sensitization programme (see extension chapter), which had found a good reception within the farmer community. However, some hesitance was expressed by several MACO headquarter staff towards the ASP household approach, and the cost effectiveness of such a program was questioned, especially if run by MACO. However, they were also aware of the benefits of the household approach, in particular monitoring progress and in directing extension messages.
The project operated by the Conservation Farming Unit (CFU) under the Zambia National Farmers Union (ZNFU) was also perceived as having a very positive impact on gender relations. There is evidence that the application of Conservation Farming (CF) practices such as early planting and timely weeding increases yields by up to 40 percent. CF is also considered ideally suited for families affected by HIV/Aids, Female and Child Headed Households and female farmers in general as it eliminates the need for power-intensive soil tillage and reduces crop production labour requirements. Although the objectives of the ASP and the CFU projects were not gender empowerment, by taking into consideration the gender balance of beneficiaries, identifying which farmer does what work, and also by linking the farmers to markets and seed companies, projects such as these have shown a great potential in addressing the different needs of female and male farmers and altering the earlier disproportionate favouring of male farmers, and have thereby shown that it is possible to close the gender gap in Zambian agriculture.
Within two of the core areas of MACO, extension and research, there is little focus on the activities of female farmers, both in terms of crops and livestock, even though men and women may specialize in different areas. Extension suffers from a general funding shortage in all areas not only gender, and Camp Extension Officers often have to rely on donor funded projects to get access to farmers. Donor funded projects have invested in training and capacity building in MACO front line extension staff. A number of these donor-funded projects show success in addressing gender related issues which in the long run is believed to benefit all farmers in the area.

Ximungo Consultores
86[agper-zambia_2010_final.doc – 7/05/10 16:20]
4.2.3 Research and Higher Education
As with extension, agricultural research has suffered from funding shortages during the past decade. At present, women farmers and their views are poorly represented in agricultural research, even though they possess first-hand knowledge and insights into such things as local weather patterns, crop varieties and planting methods. We were told that there has also been less interest in doing research on crops and livestock dominated by women. The main challenge is to have women farmers participate in assessing what is important to them, setting the priorities for research and influencing whatever form of extension service is available.
Legumes are often mentioned as a female crop, but this is not exactly accurate. As was mentioned before, in Zambia as a whole one cannot really distinguish particular “female crops”, although at farmer level we see that there are crops, such as beans, that are or have been predominantly cultivated by female farmers, but these may vary from region to region. In general, however, one can see that crops that have high commercial/industrial potential seem to receive more research attention (for example, at ZARI there is a Research Team on legumes). This is because of the way economic development and contributions to it are measured. If a crop has no seed production potential or industrial use or cannot support any agro-industry, it simply falls off the list as nobody will promote/support its production. GART has deliberately embarked on working on these ‘orphan crops’. The crops that sustain households at farmer level are those that are in Home Gardens and such crops are cultivated by female farmers.
When it comes to the working force, there is a growing number of professional women employed in agriculture and also female students in agricultural sciences at the level of higher education. According to a survey, the number of female professional staff more than doubled between 2000 and 2008, but unfortunately there was no information of what this means in absolute numbers of total staff.42 This is an indicator that over time the gender gap may be narrowing. However, female staff is generally younger and less qualified than male staff, and the proportion of women disproportionally declines with career advancement leaving many management positions male dominated. According to data provided, there are 62 agricultural research officers, of which 19 percent are women, 23 senior agricultural research officers, of which 22 percent are women, and 10 research scientist of which 1 is a woman (see Table 17). The main research institution, ZARI, has no gender focal point. In an attempt to address the gender gap, ZARI aims at a 50 percent participation rate of women in all projects and activities.
As of late, the University of Zambia (UNZA) has tried to address the gender imbalance among their students and has a 30 percent quota reserved for female students, although it was not clear if they have reached this target. In an interview with a senior staff of the Agriculture department at UNZA, it was mentioned that they work actively to gender mainstream the curricula and encourage female students to register in the more technical agricultural disciplines. It was mentioned that in general the link between research and dissemination is weak, that most farmers actually have no agricultural training, which in turn has consequences for adaption levels of new technology, and that agricultural productivity among small-scale farmers is low because they have so little capacity.
42 ASTI (2009) Women’s Participation in Agricultural Research and Higher Education: key trends in Sub-Saharan Africa, Nienke M. Beintema and Federica Di Marcantonio. Agricultural and Science Technology Indicators, http://www.asti.cgiar.org/pdf/ASTI-AWARD-brief.pdf

Ximungo Consultores
87[agper-zambia_2010_final.doc – 7/05/10 16:20]
Keeping in mind that women constitute a majority of farmers, it is feasible that targeted capacity building of this category could improve the situation.
4.2.4 Technology
Adoption of new agricultural technologies is a direct result of the effects of agricultural research, and as such constitutes a link between research and the farmer. Gender roles are not unimportant when it comes to adoption levels. Despite gender mainstreaming and gender equity concerns, most technology is still either gender neutral or targets men. Discussions on the availability of technology appropriate for women have been many, and there have been some advances in this area. However, women generally use lower levels of technology because of problems of access to information and resources or cultural restrictions on use. For example, little if anything had been done in respect of tools and implements used by women for agricultural production.43
Much still points to the fact that women farmers have different needs, capacities, and skills than men, and therefore the appropriateness of innovations and technologies is of crucial concern. Cash crop production, in which modern technology has been applied, is still largely monopolized by male farmers, while women continue to rely on simple technology (the hoe) and their traditional knowledge, which in turn contributes to low productivity.44 This can be due to problems of access to information or capital or even cultural restrictions on use, but can also be a result of a lesser interest in doing research on crops, livestock, and the use of farm implements that are dominated by women.
According to a report by FAO, importers and manufacturers of tools, for example, pay little attention to the fact that women are by far the main users of their products, and there is little research into women’s needs, or information provided about different models. Women use animal draught power and tractors to a much lesser degree than men. Many of the implements for animal drought power are also too heavy for women to operate. A Zambian man interviewed for the report commented that “Manufacturers should differentiate their implements in the same way the differentiate bicycles for men and women”.45
Storage, processing facilities, and transport are also issues of gender concerns; which crops are prioritized for storage development, are the processing facilities in close proximity to the farm, what is the availability and cost of transport? For instance, in Zambia, there has been some evidence that rising transport costs have led to an increase in headloading, which is women’s work. Improved crop varieties are seen as an important factor in raising productivity, but, as has been noted by the World Bank, productivity is not the only criterion for producers when deciding on what varieties to adopt, there are other factors too, sometimes cultural, that play a part.
In general, it has been said that commercial and emergent farmers are in a better position than small-scale producers to respond to new innovations. According to a GTZ report, untargeted
43 FAO (1998), The potential for improving production tools and implements used by women farmers in Africa, Agricultural and Consumer Protection Department.
44 World Bank (2004), Zambia: Strategic Country Gender Assessment.
45 FAO (1998), page 14.

Ximungo Consultores
88[agper-zambia_2010_final.doc – 7/05/10 16:20]
technology dissemination is more likely to benefit men and better-off households.46 So-called early adopters are also often well educated, and it is much more difficult to reach poorer households, in particular female and child headed households. However, according to an IFPRI report, targeting women in agricultural technology dissemination can actually have a greater impact on poverty than targeting men.47 This was also confirmed in an interview with CFU where it was indicated that adaption levels were actually higher among female farmers, even female headed households: “When you work with innovations in technology it is much easier to work with women. In female headed households the adoption levels are the highest. Male headed households with no women have the lowest.”
It was perceived by most interviewed MACO staff that the link between research and extension was very weak and that there was little transfer of new technologies. The previous position of Research Liaison Officers does not exist anymore. Currently, information about technological innovations is disseminated through informal rather than formal links. The point was raised that agricultural innovations on processing equipment had been geared towards women whereas technology for production was geared towards men.
According to a World Bank report, in general, innovations in agricultural technology have failed to benefit men and women proportionately, but that, should they be capitalized upon, these opportunities might well constitute new entry points through which it would be possible both to address gender disparities and to be able to better produce for an increasingly complex market.48
4.2.5 Markets
Linking farming activities to market opportunities has been especially difficult for small-scale farmers, women as well as men. According to a World Bank report, crops cultivated by women are often restricted to small local markets characterized by low returns, because agricultural marketing policy and interventions have generally not supported women farmers in terms of marketing their crops.49 The distribution of benefits from agricultural market liberalisation since the 1990s has mainly favoured medium and large-scale commercial farmers, where fewer women are to be found. Women and men are also often located at very different points in the marketing chains, and they may deal with different crops.50 It was also mentioned that due to cultural constraints on women’s mobility, but also the lack and cost of transport, it is generally more difficult for women to access markets. What MACO’s role should be in strengthening the link between farmers and markets is not clear, but some staff mentioned that at the very least, market development officers should work more closely with extension officers, and MACO could assist in creating a more
46 GTZ (2008), Study on Gender-disaggregated data for the Zambian Ministry of Finance and National Planning (MoFNP).
47 IFPRI (2005), Women: Still Key to Food and Nutrition Security.
48 World Bank (2009), Gender in Agriculture Sourcebook.
49 World Bank (2004), Zambia: Strategic Country Gender Assessment.
50 Gender issues in agricultural liberalisation, Topic Paper prepared for Directorate General for Development of the European Commission, Sally Baden, BRIDGE, report no 41, 1998.

Ximungo Consultores
89[agper-zambia_2010_final.doc – 7/05/10 16:20]
enabling environment in terms of policies and regulations, although informants did not further elaborate on what this would mean in specific terms.
According to the data provided, there are 57 total Assistant District Marketing and Co-opers, of which 2 (3,5 percent) are women. In terms of gender mainstreaming market information systems, certain issues need to be raised, such as, what is the range of products covered, are there any biases against what women grow? Where are price data collected and how are they publicised and disseminated? Are female farmers fairly represented and are they targeted for dissemination in a non-discriminatory way?
4.2.6 Cooperatives and associations
Agricultural extension today relies to a larger extent on working with farmer groups. We were informed that the number of women organising themselves in interest groups or farming associations has increased. These often centre on a particular crop, such as cotton, or a particular livestock, such as goats or chickens. Agricultural cooperatives and associations may provide production inputs and commercial opportunities, and farmer groups may also be utilised as platforms for training and capacity building. However, sometimes ownership of land or other assets is a criterion for membership of co-operatives and associations, and if women have limited access to income and land, they may be hindered from joining. Men, in particular young men, may of course also suffer the same disadvantage.
The liberalisation of the agricultural sector in the 1990s also entailed a withdrawal of agricultural credit to small-scale farmers, and according to one report, the lack of access to agricultural credit was taken to be the single most disabling factor for women farmers, whose productivity, already low, has diminished enormously.51 Anecdotal information indicates that women small-scale farmers still have more difficulties accessing formal credit, savings, and banking services, and have to rely on informal savings, loans, and credit organizations. There are some indications that women often get support from informal networks of other women. It was also suggested that women and men farmers differ in their patterns of credit, such as type and number of loans, the interest rates they have to pay, the amounts borrowed, effective use of loans, and arrears. In one of the evaluations of the ASP project, it was mentioned that the Micro-Bankers Trust (MBT) preferred to work with ASP trained farmers, since they had a firm business orientation, it was also indicated that women tend to be more reliable borrowers.52 However, business training may not be enough to help women access credit, without collateral they may not be able to access funds and without funds they cannot access a productive asset. It is clear that the linkages between female small-scale farmers and micro-finance services needs to be strengthened in Zambia.
51 World Bank (2004), Zambia: Strategic Country Gender Assessment.
52 The Household Approach as an effective tool for gender empowerment: A review of the policy, process and impact of gender mainstreaming in the Agricultural Support Programme in Zambia (March 2008), Clare Bishop-Sambrook and Charlotte Wonani.

Ximungo Consultores
90[agper-zambia_2010_final.doc – 7/05/10 16:20]
4.3 Gender in MACO’s organisational structures
4.3.1 Gender in MACO
In order to ensure the implementation of the governments’ policies on gender, a system of Gender Focal Points (GFP) have been put in place. The current system is based on a process where officers are nominated to this assignment, it is not a position as such. According to the guidelines by Cabinet Office, there shall be a Gender Focal Point at every level starting with the Permanent Secretary (PS), the departments, and down to province and district levels. However, in no line ministries have the PS assumed this assignment; it was delegated to lower level staff. In MACO the most senior GFP is also the senior sociologist under the Rural Sociology Unit under the Department of Policy and Planning. All departments have Gender Focal Points, but the new Ministry of Fisheries and Livestock does not as yet have its own GFP. These should attend a national committee that is supposed to meet twice annually, with representatives from all departments and which is chaired by the national GFP at each ministry. At province level the Provincial Agricultural Officer should assume the GFP assignment and at District level it is often taken up by Block Camp Officers.
According to GIDD, Terms of Reference for the GFPs exist. In interviews with MACO senior staff, however, it was evident that few, if any, actually knew what these were. Instead, they stated that an inherent problem with the current structure is that the work of a focal point is rarely if ever assessed, monitored, or evaluated. They also pointed to the lack of induction training and capacity building for the focal points, and there is no specialists back up. The staff turnover, especially at district level, is also very high, making it very difficult to sustain gender competence without continuous training. In one recent follow-up study done by the MACO Gender Focal Point, it turned out that only 20 percent of the gender focal points who had received training in 2005 were still in office, whereas the others had been transferred, retired, or left. According to interviewed MACO staff, the structures are in place, but there is little enforcement of policy, mainly due to lack of funding.
It became apparent in interviews with MACO staff that many felt that the existing structures were not very effective. Other departments and units do not often consult or ask advice from the senior Gender Focal Point on policy matters or when writing proposals. The Gender Focal Points expressed a wish that the department would be in a position to backstop other departments, sectors and units. Among the challenges mentioned were that the Gender Focal Points received no or little gender training, there were inadequate finances, staff did not have any gender skills, the reporting system has not functioned well, collaboration with GIDD has not worked well, there have been no intraministerial Gender Focal Point meetings, and there are conflicting responsibilities for the focal points. For example, the senior MACO Gender Focal Point is supposed to report twice a year to GIDD, but as GIDD has had no Monitoring and Evaluation Officer until recently, and also as it is GIDD which should demand the report, nothing has been done for many years.
In 2008, GIDD had an approved budget for gender training of Gender Focal Points and members of the Gender Sub-committees of almost K122 million but actual disbursement was only K300 000, although the reasons for this remain unclear. According to the senior Gender Focal Point, the greatest challenge to gender equity and gender mainstreaming is lack of managerial support, for instance, in 2001 all directors were invited for a workshop on gender but not a single one turned up. There was a training of all Gender Focal Points at MACO in 2001 funded by government, and for the years 2001-2003 there was funding from Sida enabling the MACO Gender Focal Point Person to

Ximungo Consultores
91[agper-zambia_2010_final.doc – 7/05/10 16:20]
invite all the GFPs for training and capacity building. Since then there have been very few training or capacity building opportunities. According to the GIDD work plan of 2010, a sub-committee on gender to train staff from province and district levels is included.
In MACO there are 5679 total staff of which 21 percent are women, but this includes all staff, from directors to drivers and typists. Broken down by profession, we can see that of 8 directors 1 is a woman, out of 1524 agricultural assistants 23 percent are women, and out of 148 agricultural officers 11,5 percent are women (see Table 17).
Overall, evidence points to the fact that in practical terms not much has been done to mainstream gender in MACO activities.53 Traditional methods have failed, mainly due to lack of funding it was said, although this also indicates low priority, so new methods and innovations must come forth. Directors and deputy directors have not assumed responsibility for correcting gender imbalances or discrimination, and are said to be more administrative than technical. There is a wish for a Ministerial Gender Committee or Unit with senior staff from all departments of MACO, and that this committee should receive capacity building in terms of gender. Another wish from interviewed MACO staff was for GIDD or donors to second specialists in gender mainstreaming and gender responsive budgeting during a transitional period to strengthen MACO’s own capacity. It was mentioned that the role of the Gender Focal Point should be to co-ordinate, not to run operations.
Table 17: MACO staff disaggregated by sex, selection of professions
Female Male Total % Female % MaleAgricultural Assistant 353 1,171 1,524 23% 77%Agricultural Officer 17 131 148 11% 89%Agricultural Research Officer 12 50 62 19% 81%Agricultural Specialist 6 35 41 15% 85%Agricultural Supervisor 41 137 178 23% 77%Assistant District Marketing And Co-Oper 2 55 57 4% 96%Assistant Farm Manager 1 7 8 13% 88%Chief Agricultural Research Officer 2 3 5 40% 60%Chief Agricultural Supervisor 6 9 15 40% 60%Director 1 7 8 13% 88%District Agricultural Co-Ordinator 2 38 40 5% 95%Senior Agricultural Officer 5 27 32 16% 84%Senior Agricultural Research Officer 5 18 23 22% 78%Senior Agricultural Supervisor 13 42 55 24% 76%Technical Research Assistant 20 72 92 22% 78%Training Officer 5 35 40 13% 88%Veterinary Assistant 65 314 379 17% 83%Veterinary Officer 6 62 68 9% 91%Total Selection 562 2,213 2,775 20% 80%Total Staff Maco 1,212 4,467 5,679 21% 79%
53 GTZ (2008), Study on Gender-disaggregated data for the Zambian Ministry of Finance and National Planning (MoFNP).
Ximungo Consultores
92[agper-zambia_2010_final.doc – 7/05/10 16:20]
The dual role of the political goal of gender mainstreaming was highlighted in many interviews. On the one hand MACOs mandate is to pay attention to the needs of female and male farmers and make sure there are no programmatic reasons for gender discrimination; on the other hand they are also to gender-mainstream the organisation itself, which is quite another task and which requires a different approach. When it comes to the beneficiaries, the farmers, the MACO Gender Focal Points felt that camp extension staff should be targeted for gender training, not directors, but to increase gender awareness within MACO itself, directors had to be on board. It was mentioned in one interview that the difference between the two goals was that Camp Extension Officers needed tools to be able to implement gender responsive projects, whereas directors needed evidence that gender mainstreaming and gender budgeting actually either pays or saves money.
The gender policies of MACO remain ill-defined in terms of activities and strategies, and staff interviewed seemed unaware of their contents. Most gender-related work in MACO seems to deal with gender balancing. We found that programmes, projects, and activities were rarely gender-mainstreamed, although there is an aim to gender-balance in terms of participation. This is due to the low level of knowledge at the ministry, on all levels, of gender concepts, tools, and methods. We found some very dedicated staff at MACO who if given the training and the mandate could act as change agents.
4.3.2 Budget allocations
Many mentioned that the 2007 decision by the Ministry of Finance and Planning to eliminate the budget line for gender related programmes and activities and instead gender-mainstream all activities was premature, especially considering the low level of knowledge at all levels of the organisation. According to an interview with a Gender Focal Point at MACO, this decision was based on the fact that gender is a cross-cutting issue and that MoFNP does not want so-called independent budgets. However, in 2008, for the Rural Sociology Unit under the Department of Policy and Planning, there was an approved budget of K20 million for Gender Strategic Plan preparations although none of that was ever released. For Human Resources and Administration, under the unit Administration, there is a line under Public Functions and Ceremonies for Women’s Entrepreneurship Day where K1,2 million had been allocated; actual disbursement was zero.54 According to the same financial report for the year 2008, there is a line on HIV/AIDS and Gender Mainstreaming where roughly K2 million was approved, although only K590 000 was released (see Table 18). The Food and Nutrition Unit, previously Women and Youth, got zero funding.55 However, in late January of 2010, MACO’s Department of Policy and Planning received 25 million kwacha for the mainstreaming of gender and the environment, but the Department of Extension has not received any funding for gender activities. In view of the general budget cuts in the ministry, there is anecdotal evidence that gender resource allocations are the first to be cut, but this remains to be further examined.
According to some interviewed MACO staff, the National Gender Budgeting Process, of which MACO are part, is not performed by staff with training in gender responsive budgeting. It was perceived that those in charge of planning do not take gender seriously, but that this function is
54 Note that the values are very low, as ZMK 1 million in 2008 was only about USD 267.
55 Financial Report (2008), Comparative Statement of Authorized Provision and Actual Expenditure for the year ended 31 December 2008.

Ximungo Consultores
93[agper-zambia_2010_final.doc – 7/05/10 16:20]
instead well monitored among actors in civil society. In most interviews the budget constraints of MACO were mentioned, and that in this general condition field activities were least prioritized, which was interpreted as having implications for gender awareness. Through collaboration with donors, such as the ILO/Irish Aid project, Women Entrepreneurship Development and Gender Equality (WEDGE), which aims to link vulnerable women to business development service providers, there have been some activities but these have not been government funded.
Table 18: Selected programmes, MACO, financial reports from the years 2006-2008
million ZMK
Approved Actual Approved Actual Approved ActualDept of Policy and Planning
Policy Analysis and Formulation UnitSector Performance Analysis
Gender Strategic Plan Preparations - - - - 0.0 0.0Rural Sociology Unit
HIV/AIDS awareness programmeGender Strategic Plan Preparations/Gender Mainstreaming 43.8 31.2 87.0 57.2 20.5 0.0
Agricultural DepartmentFood and Nutrition
Gender Mainstreaming - - 36.9 18.2 - -Agricultural Training Institutions
Zambia College of Agriculture MonzeGeneral Administration
HIV/AIDS Gender Mainstreaming - - - - 2.0 0.6Cooperative College
HIV/AIDS Gender MainstreamingSensitizationWorkshops and Seminars - - - - 4.4 0.0
Zambia Centre for Horticultural Training UnitHIV/AIDS Gender Mainstreaming - - - - 13.6 9.6
Southern Province Provincial Agriculture Co-ordinating OfficeHuman Resource and Administration
General AdministrationHIV/AIDS Gender Mainstreaming - - - - 1.4 1.3
Total of sample, ZMK million 43.8 31.2 124.0 75.4 41.9 11.4Exchange rate ZMK/USD 3603 3603 4003 4003 3746 3746Total of sample, USD 12,156 8,669 30,974 18,827 11,199 3,055
2006 2007 2008Subhead, unit, programme and activity
Source: Financial Reports
In the Mid-term Review of the FNDP (2006-2010) published in 2009, it is noted that in terms of budgetary allocation to the Gender sector, K4.5 billion was projected for expenditure under FNDP. Of this amount, 98.8 percent (K4,45 million) was budgeted for. However, only 57.2 percent was actually spent for the period under review. Whereas the educational sector has taken important steps towards gender mainstreaming and gender parity, most sex-disaggregated data can also be found in this sector, agriculture lags far behind. The report also mentions the need to extend concerted efforts to implement Zambia’s National Gender Policy, taking care of capacity, institutional, regulatory and legislative constraints to the Policy’s operationalisation.

Ximungo Consultores
94[agper-zambia_2010_final.doc – 7/05/10 16:20]
Table 19: Gender Mainstreaming Programmes in the FNDP
million Kwacha2006 2007 2008 Total
FNDP Allocation 0 2000 2500 4500Approved Budget 1380 1187 1879 4447Releases 658 1034 880 2573Actual Expenditure 658 1034 880 2573
Source: Mid-term Review Fifth National Development Plan 2006-2010, Ministry of Finance and National Planning, October 2009, page 101.
Although MACO is responsible for budgeting for the training of its own staff, GIDD has the ultimate responsibility for the training of Gender Focal Points. The FNDP Mid-term Review notes that GIDD should “immediately develop and implement comprehensive gender training programmes in all government ministries and institutions. This should include capacity enhancement for all Gender Focal Points (GFP), focusing on the conveying of gender mainstreaming skills.”56
4.3.3 Monitoring and data collection
Sex-disaggregated data should be available but are irregular and unevenly distributed over districts. It transpired from interviews that few actually knew that they were supposed to have sex-disaggregated data. Salaries and emoluments are not sex-disaggregated in the budget and we could not obtain this data from MoFNP, MACO or CSO. In cases where data is available, it is rarely analysed, and if analysed, it is almost never used to inform programme design, implementation, management, or resource allocation. In 2008, MoFNP had an approved budget of over K35 million for the collection of gender statistics but the actual expenditure was only K1,8 million.
The Mid-term Review of the FNDP notes that there is a need to establish an effective M&E mechanism within GIDD, and that this should be coordinated with, and aligned to, the different sectoral/national M&E systems. In interviews with both senior staff and Gender Focal Points in MACO this issue was also raised as it was seen as something that would benefit MACO’s own capacity for M&E. The lack of the collection and analysis of sex-disaggregated data however was seen as an impediment to any successful M&E. This was also addressed in the Mid-term Review where it is noted that to “effectively assess performance at the sector level, there is a need to improve on data collection. This should be addressed through the development of sector information systems. The importance of ensuring gender disaggregated data in these systems is cardinal”.57
When it comes to definition of gender concepts, there seems to be no uncertainty at the policy level as to what they mean and refer to, but in interviews with senior MACO staff it was obvious that there are many misunderstandings as to what different concepts actually mean. First of all, almost everyone took the term gender to equal women, and although most staff were aware of the idea and importance of gender mainstreaming, only a few understood how to actually gender-
56 Mid-term Review Fifth National Development Plan 2006-2010, Ministry of Finance and National Planning, October 2009.
57 Mid-term Review Fifth National Development Plan 2006-2010, Ministry of Finance and National Planning, October 2009.

Ximungo Consultores
95[agper-zambia_2010_final.doc – 7/05/10 16:20]
mainstream MACO programmes, projects, and activities. Some also thought that gender mainstreaming was equal to gender balancing. Gender budgeting was often misinterpreted as a budget line on gender. These facts points to a real need for gender training among the staff.
Box 7: Definition of gender concepts
Gender refers to the socially constructed differences between men and women and the unequal power relationships that result. Gender indicates that the differences between men and women are not essential or inevitable products of biological sex differences.
Gender mainstreaming is an organizational strategy that aims to bring gender into all aspects of an institution’s policy and activities, through building gender capacity and accountability. Gender mainstreaming means that gender equality is analyzed and understood before any decisions are made and before any plans are outlined in order to influence and affect interventions. Gender mainstreaming ensures that the perspectives of women and men, girls and boys as well as the relationship among them is considered and acted upon. It is not an issue only for women.
Gender equality means that women and men enjoy the same status, that women and men have equal conditions for realizing their full human rights and potential to contribute to national, political, economic, social and cultural development, and to benefit from the results.
Gender equity means the equivalence in life outcomes for men and women. Gender equity recognizes that a redistribution of power and resources, as well as recognition of women’s and men’s different needs and interests are required. It is the process of being fair to women and men. To ensure fairness, measures must often be available to compensate for historical and social disadvantages that prevent women and men from otherwise operating on a level playing field. Equity leads to equality.
Gender balancing is not quotas. Rather, it refers to a balanced composition of women and men in order to bring equality to the current male-dominated international institutions. The Beijing Platform for Action calls for equality in decision-making and gender balance on international institutions.
Gender-sensitive budgets or gender budgets refer to a variety of processes and tools aimed at assessing the impacts of government budgets in a gender-differentiated manner. It is important to recognize that ‘gender-sensitive budgets’ are not separate budgets for women, or for men. They are attempts to break down, or disaggregate, the government’s mainstream budget according to its impact on women and men, and different groups of women and men. Gender-responsive budgeting allows for better targeting and therefore makes for more efficient allocation of public expenditure.
Gender analysis highlights the differences between women, men, girls and boys in terms of their relative distribution of resources, opportunities, constraints and power in a given context.
4.4 Challenges
One of the outstanding challenges is the lack of implementation of gender mainstreaming in the national development process; consequently, the attainment of a gender-responsive development has remained elusive. There is a real and tangible lack of knowledge on all aspects of gender at MACO. The system of Gender Focal Points, which has been in existence for more than 10 years, has not managed to address this. There are individuals with both the expertise and the drive to act as change agents but they have little institutional support and no mandate. According to some MACO staff, harnessing and disseminating gender-specific knowledge is seen as one of their main concerns.

Ximungo Consultores
96[agper-zambia_2010_final.doc – 7/05/10 16:20]
As with many other areas in MACO, programmes aiming at gender equality seem to be underfunded. The effects of this are visible at all levels: there is no or little gender training of MACO staff, and there is little knowledge of concepts, tools, and methods of analysis. One of the key challenges in terms of gender is therefore how to successfully mainstream from the highest echelons of the institution, from the organisation of the institution, to research, and down to all extension activities at farm level. This will take a measure of knowledge and competence which as yet does not exist within the ministry. This of course is an issue that goes beyond the responsibilities of MACO, but involves all levels of education, from primary to tertiary. It is assumed that education will improve female farmers’ ability to communicate more directly their needs, and influence the new generation of decision-makers and civil servants.
Education is important but changes are less likely without the political will of the government. One specific challenge for example, is how to domesticate international conventions, such as CEDAW, and how to translate specific recommendations into practice. Laws and reforms affect the way budgets are formulated for many years to come. Gender equality, therefore, should be mainstreamed into the drafting process at an early stage.
4.5 Recommendations
4.1 General Recommendations
To integrate a gender perspective into the state budget is a lengthy process which, first of all, needs awareness and insight into what the gender perspective will contribute, awareness of the fact that the gender equality perspective helps to improve economic governance and results-based management by making gender equality priorities and resource allocations visible in the budget. One of the main conclusions is that the most effective approach is to improve and mainstream a gender equality perspective into existing processes and working methods at government offices and agencies, and to avoid creating parallel procedures as far as possible. Below is a general description of the main steps of integrating a gender perspective into the state budget.
• Undertake Gender Analyses as part of the planning and strategy formulation process
In the process of budget preparations, new facts, statistics, and analyses can be mainstreamed. The first step is to carry out analyses in policy areas in order to show how gender equality may be improved in the operation. There are a number of different methods that may be used in conducting such analyses. The purpose of the analyses is to improve decision-making documents so that they clearly bring out gender patterns and gender equality perspectives in the sector/operation. Once the analysis has been performed and gender patterns have become clear, along with their implications for the achievement of the overall goals and specific gender equality objectives, this knowledge is to be applied in seeking to shape the activities in the operation. As these analyses are performed early in the process, they can be used as a basis for achieving the overall objectives. To support this endeavour, the government should make a point of including the analysis requirement in the finance ministry’s guidelines for the budgetary process.
• Formulate gender equality objectives
Based on gender impact assessments, gender equality objectives are formulated for the relevant policy areas. At national level, the objectives can reflect the kind of situation in society that
Ximungo Consultores
97[agper-zambia_2010_final.doc – 7/05/10 16:20]
governments and parliaments would like to achieve. At the operational level, the objectives are more detailed. Effective objectives at this level are specific, quantifiable, generally accepted, realistic and timetabled.
• Follow-up
The gender equality objectives (or lack of them) should be followed up as part of the regular evaluation process. Annual reporting should include statistics disaggregated by sex, progress assessments and analyses that clearly reflect the gender equality dimension. This requirement should be made clear in ministerial and agency reporting guidelines. These should also include a requirement concerning individually (women/men) based tables and diagrams, and the ministries and agencies should further be required to discuss and analyse these on the basis of a gender equality perspective. Guidelines for both auditing authorities and internal auditing should also encompass the follow-up of undertakings given in the shape of national objectives for gender equality, gender equality objectives at operational level, and the follow-up of indicators and key ratios.
The role of the finance ministry as the body primarily responsible for the budgetary process is an important one in a gender mainstreaming process. The ministry can both make demands on how sectoral budget proposals are formulated and monitor compliance with the requirements included in the guidelines for budget work. Responsibility for analyses and the formulation of objectives, however, will lie with the line ministries and agencies in their capacity as the bodies responsible for activities.
4.2 Specific Recommendations
MACO
I. Development of a sustainable mainstreaming system in MACO by making knowledge about gender methods and tools a compulsory requirement for promotion.
II. Gender mainstreaming should be an integral part of any proposed larger organizational restructuring of MACO.
III. Create opportunities to promote the advancement of women within the sector and promotion of agriculture as a career for women.
IV. Strengthen the Gender Focal Point system.
a) Ensure that all Gender Focal Points receive training on concepts, tools and methods on gender, gender analysis, gender responsive budgeting, and gender mainstreaming.
b) Ensure that Terms of References for Gender Focal Points are properly disseminated, monitored and evaluated, and that there is a functioning system that incorporates feed-back.
c) Provide specialists in gender and development and on gender responsive budgeting to build capacity of MACO staff.
d) Incorporate gender responsive budgeting at departmental level, as departments are responsible for their own budgets.

Ximungo Consultores
98[agper-zambia_2010_final.doc – 7/05/10 16:20]
e) Increase and intensify collaboration with GIDD.
f) Produce a gender and agriculture manual or checklist.
g) Ensure that sex disaggregated data is collected, compiled, analyzed and integrated into all programming efforts.
h) Provide trainings on statistical reasoning, thinking and reporting for the relevant staff.
i) Ensure that all review and planning meetings also build capacity towards gender equality.
j) Use the 30 percent women's participation as a minimum target, both among the membership and leadership.
k) Ensure that communication strategies integrate messages of gender empowerment.
l) Involve male decision-makers in the empowerment process.
Extension
I. Identify needs of different producer groups, divided into women and men, and develop service in accordance with needs.
II. Promote gender balancing among extension staff, in particular front line extension, to reflect client base and also to ensure gender parity among staff.
III. Ensure that staff at all levels of extension, in particular at district level, receive gender training, to ensure that information and extension services reach both genders.
IV. Ensure that dissemination of agricultural innovations and market information by extension staff are not gender biased.
V. Strengthen the gender perspective in all reading materials for extension staff.
VI. Gender mainstream agricultural programmes with the objective of reaching both women and men with all types of agricultural services and resources.
VII. Involve both female and male farmers in the empowerment process.
VIII. Ensure that education of future extension staff, at university, college and training institutes, includes gender methods and tools.
Research
I. Set the research agenda by taking into account the different research needs, the economic growth, and efficient farming systems with identifying interests and needs of women and men, especially the former’s different crops, methods of cultivation and use of produce.
II. Diversify research to include or put more emphasis on crops, animals, and tools used by female farmers.
III. Promote gender balancing among research staff.

Ximungo Consultores
99[agper-zambia_2010_final.doc – 7/05/10 16:20]
5. Setting Priorities: The Processes of Financial Planning and Administration
The analyses presented in the previous chapters make frequent allusions to insufficient funding being available for core and promotional activities that the public sector in general and research and extension in particular are expected to provide in support of agricultural production and growth. High volatility over the years and severe shortfalls of actual expenditure in relation to the appropriations approved by Parliament are a particularly striking feature whenever one looks at time series of detailed allocations and actual expenditure. Against this background, this chapter presents a closer look at the procedures in place for preparing budgets and administering cash shortfalls.
In this context, important issues and questions are:
(a) Budgeting is about making choices in the light of constrained availability of funds. Are procedures in place to conduct the choice making exercise in an appropriate setting so as to ensure that (i) core activities can be carried on and (ii) adequate choices can be made with regard to the more promotional activities, activities that can be carried out if funds are available but are not essential for maintaining the minimum level of services required for private production of agricultural goods to continue?
(b) If cash releases were close to appropriations, the initial choices, made in the budget preparation process, would normally not need to be revised in the course of the year. But where cash releases fall short of appropriations, choice making continues during the fiscal year. Which mechanisms are used so that priorities can be maintained while ensuring adequate funding for core activities?
(c) Institutional self-interest is always an issue in public expenditure management. Where civil servants are assessed by their loyalty and punctuality rather than the quality and quantity of services provided to an institution’s clients, the temptation to give priority to working conditions rather than focussing on service delivery is ever-present. Central departments, which have better access to those who allocate funds, are evidently at an advantage with regard to their ability to press for being the first to be considered when scarce cash resources are allocated.
When cash allocations fall systematically short of budgets, the prerogative of Parliament may become undermined if the shortfalls leave too many options open with regard to the selection of priorities among priorities. Although it is generally correct to assume that a line ministry is in a better position to determine priorities and translate these into spending plans, the financial management procedures and the Ministry of Finance need to ensure that the balance between service delivery and impact on one hand and working conditions on the other hand does not become skewed in the process.

Ximungo Consultores
100[agper-zambia_2010_final.doc – 7/05/10 16:20]
5.1 The Budgeting Process
On the basis of a macroeconomic framework, a revenue projection is prepared which provides an overall ceiling for expenditure. Priorities are then set according to national visions and plans (the FNDP in particular), while also prioritising:
• Salaries,
• Debt service,
• The requirements of sovereign functions of the State (Parliament, Presidency, embassies and the like, down to the military),
• Expenditure that is politically sensitive and highly visible – budget provisions for the Food Reserve Agency and the Fertilizer Subsidy Programme would fall under this category,
• Programmes that are important to the donors who provide general budget support (health and education in particular, but also roads and possibly justice), and
• Clearance of arrears.
Allocations to line ministries are shown in broad categories in the Medium-Term Expenditure Framework, the so-called “Green Paper”, which is approved by Parliament and establishes broad expenditure ceilings for the following detailed preparation of the budget. The process and period of its preparation are the primary occasion for sectors to bring in their requests and argue for funding. Sectors making a good and well-argued submission of their respective budget proposals have a better chance of receiving funds, although the room of manoeuvre is limited.
As far as agriculture spending is concerned, the “Green Paper” indicates a global number for “Agriculture”, and states how much of this is for the Fertilizer Subsidy Programme. The 2010-12 Green Paper also indicates a number for FRA. No further details are provided: no disaggreation by departments, no special line to specify expenditure for research, no indication of the amount that is expected to be available for provinces and districts.
The annual budget proposals are then prepared by the line ministries, on the basis of submissions and suggestions of the individual spending units, then adjusted by the Budget Department of the Ministry of Finance in the process of consolidation and preparation of the Estimates and the Budget Bill. The Budget is presented to and approved by Parliament. The approval used to take place in March, three months into the budget year to which the budget refers. The approval process was taken forward for the 2010, which is the first budget approved ahead of the start of the fiscal year.
5.2 Budget Execution
On the basis of the approved budgets, warrant holders of ministries (the Permanent Secretary) present spending profiles (a type of cashflow plan), which break the budget down by quarter and month. The spending profiles are as detailed as the budget is, i.e., they go down to the activity level.
Budget execution rules forbid spending units as well as the Ministry of Finance to reallocate funds from recurrent departmental charges to salaries and vice versa, and they cannot use funds for capital expenditure for other purposes.

Ximungo Consultores
101[agper-zambia_2010_final.doc – 7/05/10 16:20]
Cash releases, which fall regularly short of approved Estimates, made by the Ministry of Finance to the spending unit. In the case of central institutions, this is usually the department. In the case of Monze District, we were informed that they in fact do receive releases directly onto their bank account from the Ministry of Finance.
The Budget Department has quarterly meetings to decide upon cash releases in view of the actual revenues. The budget is operated as a cash budget. Apart from authorised internal borrowing, the Government can not rely on overdrafts from the Central Bank.
The process of cash allocations appears to ensure that the spending structure of the budget is respected. The downside of this is that if actual funding falls short of budget allocations, cuts tend to be made proportionally and across the board, albeit with some significant exceptions. The result, which tends to provide “a little to everything” does not seem to be efficient.
Until the end of the research period in Zambia, our Team was not able to clarify exactly how cash releases to spending units are decided upon. The Ministry of Finance informed that there is interaction between them and Warrant Holders (the Permanent Secretaries) on a quarterly basis so that the main priorities can be maintained even though revenues may not allow to serve appropriations in full. However, the Policy and Planning Department of MACO and the PACO in Monze said that they are not involved in and do not prepare any documentation for any interaction of their ministry with the Ministry of Finance in the process of negotiating the details of the cash allocation. Some budget lines (at programme level) are earmarked as poverty reduction priority expenditure. The Ministry of Finance claims to make efforts to consider these expenditures as ring-fenced in the sense that cash releases should be allocated in full to these items.
The Ministry of Finance issues quarterly tables which show the units and programmes for which the cash releases are meant. The table is as detailed as the budget estimates are, i.e., going down to the activity level. According to information received, spending units can deviate from this structure by reallocating funds across activities, but only within the same programme.
Over time, some technicalities have been modified in order to prevent higher-level entities from serving themselves first. In 2005, provinces and districts became separate budget subheads. This ensures that funds meant for the lower level cannot silently be withheld at the level of the technical departments in favour of their own needs. Also in 2005, research stations started to have their own subheads, while they were financed through the respective departments (ZARI, livestock and fisheries departments) before. Beginning in 2008, a programme designated “Camp and Block Operations” appears in budgets and financial reports for districts, which ensures that the ground-level operational cost of extension officers becomes relatively more protected.
Given this admittedly somewhat scanty information, it appears that there is not really a process to rethink priorities when cash releases fall short of the amounts initially approved by Parliament. Cuts appear to be made essentially across the board, with the Ministry of Finance setting priorities according to informal contacts and pressure, while being restrained by the principle that poverty reduction programmes should be the first to serve.
Core functions and promotional activities typically appear in separate programmes at central level, but not at district level. At central level therefore, there is no opportunity to rethink priorities in the sense of giving priority to core functions. At district level, the choice is operational and therefore possible. However, given the low allocations to field operations in general, there is not really much of a choice to be made.

Ximungo Consultores
102[agper-zambia_2010_final.doc – 7/05/10 16:20]
An initial hypothesis for this study was that activities with a special gender focus with regard to the client group “women” would be among the first activities to scale down when funds fall short of initial appropriations. But our team found no evidence that this actually happens. In the end, it is usually the activities which receive special funding that are being carried out. Priorities are determined by the availability of operational funds originating from donor projects rather than the regular budget.
A deeper analysis of the political economy factors underlying the growth dynamic of the large, inefficient and corruption-prone subsidy programmes is required. One key element is that most farmers are said to protest strongly when promised fertilizer subsidies fail to materialize, while they are much more tolerant and quiet if they are not supported by the extension system. Under these circumstances, it is evident that political factors must result in prioritising subsidies. In order to counteract this tendency, the successes and effectiveness of extension services and the technologies that they transmit must become very visible to the electorate. Public relations efforts, supported by an adequate monitoring and evaluation system, are called for.

Ximungo Consultores
103[agper-zambia_2010_final.doc – 7/05/10 16:20]
6. Conclusions and Main Recommendations
The task for this assignment was to look at the effectiveness and efficiency of public expenditure in those areas that can be expected to have a positive influence on technology and productivity, while not studying the Fertilizer Support Programme (fertilizer subsidies especially for maize) and the operations of the Food Reserve Agency (strategic maize reserve) in greater detail.
The key question at this time is why, despite a significant amount of knowledge, implementation of innovative practices has lagged and agricultural production has not been growing anywhere near the rate that was planned for in the FNDP.
The short answer is, first, that the assessment may not be entirely correct—production appears to have grown to some extent, e significantly in certain areas, but statistics are so poor that one cannot state with reasonable certainty how production has developed. Second, many elements point to the general conclusion that core functions of public agricultural services, especially research and extension, have not received the required operational funds in recent years. Third, promoted technologies may often not have been suitable for smallholder conditions.
The large and growing expenditure on fertilizer and seeds and the cost of maize market interventions has not lead to a reduction of spending on core agriculture activities, but are probably (depending on one’s assessment of the political-economy processes) consuming funds that might otherwise have been available for core activities. In view of the well documented wastages and widespread ineffectiveness of these two schemes (FRA and FSP) and looking at the potentials and constraints of branches and activity lines that promote innovation, it could be concluded that agricultural growth could be promoted when funds from FRA and FSP are reallocated to research, extension and other programmes which push innovation, technical as well as market-related.
The conclusions and recommendations of this analysis, at times already mentioned in the previous chapters, can be summarised as follows. A comprehensive list of recommendations is included at the end of the Executive Summary and, for this reason, not repeated here.
Agricultural production and income derived from agriculture appears to have been on the increase in recent years. However, statistics are contradicting, difficult to obtain as time series with consistent definition, and incomplete with regard to coverage of some important agricultural goods. This growth is not reflected in National Accounts statistics, though, for methodological reasons. Yet, reliable statistics on agricultural production and income of rural households are a crucial prerequisite for evidence-based decision-making.
It is strongly recommended to invest in improving data collection and particularly processing and publication efforts. Attention needs to be paid to adequate provision of methodological notes and proof-reading of tables and information that is posted on the internet.
Research in public domain is undertaken by the Zambia Agricultural Research Institute and research trusts which, however, will continue to rely on public or donor funding. Other research is by private companies (mainly suppliers of seeds). The effectiveness of publicly funded research is difficult to assess over a short period of time because of the generally long gestation period of research work. But the absence of evidence of effectiveness of public research is also a direct

Ximungo Consultores
104[agper-zambia_2010_final.doc – 7/05/10 16:20]
consequence of the ‘relegation’ of the farming system research component of public research system. Economic studies (impact studies, adoption studies, IRR and the like) in agricultural research are almost absent. This situation logically leads to the recommendation to revive farming systems research. There are indications that useful results are being produced, albeit under very restrained funding levels. However, land productivity for maize and some other crops remains, in practice, significantly below the yields obtained on trial fields. Furthermore, public research (ZARI) appears to have lost the focus on farming systems research, compared to the 1980s when this was a fully fledged vibrant component of public research system.
Recommendations with regard to publicly funded research are:
• Concentrate on crops that are becoming increasingly important in crop rotation systems.
• Revive farming systems research in view of adaptation to climatic changes and the growing importance of diversified cropping patterns and soil conservation techniques, besides providing empirical evidence for value of research.
• Maintenance of crops, preservation of genetic material, but also laboratory and diagnostic services must be maintained even in situations where funding levels are very constrained.
• Strategic research, that does not directly lead to innovations that can be applied by farmers, should continue, but be embedded in internationally coordinated research efforts in appropriate networking arrangements. This requires enhanced quality staff to effectively link with the international research system.
Laudable efforts are being made to enhance interaction of agricultural research institutions and researchers, with annual research meetings and an updated directory about who is engaged in what research. These efforts should continue.
GART has taken on some of the gaps left by ZARI and the university research, with appreciable success. GART, however, will remain dependent on public and donor funds. Funds from private producers and contributions by the Zambia National Farmers Union will complement, but not fully cover the cost of research. Donors may want to consider the option of turning funding to GART into block grants rather than earmarked research funds, while monitoring internal governance and decision-making processes that determine the research agenda and dissemination mechanisms.
A multiplication of the Research Trust model may be considered, aiming for a situation where public funds are attributed to a variety of research institutions, private or semi-public, on a research grant basis.
Extension services are not the only transmission belt of technologies between research and farmers, but remain an important one. Extension services are particularly called upon when new challenges to farmers arise so that new knowledge and expertise are required. Extension services and donor financed initiatives have taken up this challenge in three key areas: connect farmers to markets and ensure that they are producing for rather than merely delivering to markets; promote farming as a business, combined with a household approach that generally gives women farmers a much more decisive voice in rural households; and promoting conservation farming techniques as a response to depleted soils and problematic access of most farmers to chemical fertilizers.
Public extension services have substantial numbers of trained personnel, and they have messages or access to messages that contribute to food security and rural income. The shift from the top-

Ximungo Consultores
105[agper-zambia_2010_final.doc – 7/05/10 16:20]
down Training and Visit approach towards participatory extension methods has been made, often facilitated by donor-driven projects. But further staff training is needed.
However, funding of operational expenses is so low and so variable (across years) and erratic (in-year) that the mobility and effectiveness of the work of extension services has become very reduced. The number of female extension staff is still low, but growing noticeably. Regional imbalances exist with regard to the percentage of positions filled.
Against this background, a renewed focus on extension services is strongly recommended. The strong presence of the agricultural administration in provinces and in particular at district level needs to be reinforced by funding levels that permit extension staff to move around and reach farmers, by more emphasis on permanent updating the knowledge of staff. This should be complemented by improved coordination of agricultural support and extension between stand-alone donor projects, NGO activities and activities that promote new technologies in the district, a task for which the public extension system should take the initiative. Coordination is crucial in order to avoid duplication of efforts, conflicting messages and also for ensuring that one-issue projects do not lead to crucial gaps in areas that are important but not covered by any of the projects. Projects should preferably become a source of new technologies rather than parallel implementing organisations that take upon responsibilities while they exist and then leave gaps when they disappear.
Gender in extension is a true cross-cutting issue which has to be taken into account in selecting topics and messages and also in selecting the ways in which farmers are approached and assisted. As the number of female extension workers increases, gender balance and equity is likely to be taken into consideration quasi intuitively.58 Yet, for a transitional period, it is recommended to provide some training on gender sensitivity to staff that is in permanent contact with farmers. The introduction of the function of “Gender Coaches” at provincial level, who can organise reflection sessions and transfer gender-relevant methods and approaches, would also be on the list of recommendations of this study.
Despite very clear goals of the Government of the Republic of Zambia (GRZ), as articulated in the Fifth National Development Plan (FNDP), policies to promote gender equity and gender mainstreaming are not implemented in the programmes, projects, or activities of the Ministry of Agriculture and Cooperatives (MACO). The ministry experiences a severe lack of funding for many of its core areas, and among them is the cross-cutting issue of gender. However, this study shows that increased funding alone will do little to alter the situation as it relates more to lack of knowledge and competence about the fundamentals of gender concepts, tools, and methods. This in turn makes it difficult to access reliable gender disaggregated data, making a full-scale analysis or tracking of funds in terms of gender very difficult. The poor integration of gender already in the structure of the organisation makes it sometimes overlook but at times also discriminate against certain categories of farmers in terms of needs and capacities. This same lack of gender mainstreaming and gender analysis also means that MACO may miss much potential for agricultural innovations.
58 Having said this, it should be added that training and coaching for detecting and avoiding gender bias is still required. Just because a CEO is a woman may not automatically mean that she will have a gender perspective. Most research shows that it is a matter of training and competence.

Ximungo Consultores
106[agper-zambia_2010_final.doc – 7/05/10 16:20]
The implementation of changes in agricultural policies and programmes to achieve the goal of gender equity and mainstreaming in the agricultural sector might not always require particularly high levels of funding, since it is largely a question of bringing gender awareness to activities that are already taking place. However, funding will be required for training to increase gender awareness and increase the capacities of staff of all levels of the organisation and extension workers to carry out gender analyses. The establishment of strong and effective institutional arrangements for gender mainstreaming will also require funding.
A 30 percent quota for female participation in all activities is the aim, which has the potential to lead to changes in both gender relations and programmes. The numbers of female staff among frontline extension workers is still low however, and no concerted efforts are being made to increase the number of female staff. Still, the number of women employed in the agricultural sector, not specific to extension, has more than doubled in eight years. The number of female students enrolled at the University of Zambia in agriculture-related disciplines has also increased during the last decades due largely to affirmative action.
There is little evidence of government-funded initiatives to gender mainstream research on, and the dissemination of, results on new agricultural technologies which can be seen as either gender neutral or as targeting male farmers. This, despite some evidence that agricultural technology dissemination can actually have a greater impact when targeting women farmers. The weak link between research and extension of course affects all aspects of agriculture, including gender concerns.
The agricultural market liberalisation in the 1990s favoured medium and large-scale commercial farmers, where fewer women are to be found. Due to their location at different points in the marketing chains, access to markets, market initiatives and market information systems, is seen as biased towards men.
Despite being a clear political objective, MACO has not been successful in integrating gender awareness into the institution. The system of Gender Focal Points is regarded as toothless. There are individual Gender Focal Points with both competence and drive but they are often placed in positions with no mandate to enforce change. Throughout the ministry at headquarter level, there are many misunderstandings regarding the meanings and definitions of various gender concepts. The most common of these are that gender is equated with women, gender mainstreaming is taken as gender balancing, and gender budgeting is assumed to imply separate budget lines referring to women.
The Gender Focal Points have never been assessed, monitored or evaluated, which is identified as a critical issue. The collection of sex-disaggregated data is irregular. Data are sometimes unreliable, and rarely if ever analyzed or used for planning and programming purposes. Improved Monitoring and Evaluation is also seen as a pivotal question for improved gender responsiveness in programmes, projects, and activities at all levels of MACO. The current system of the GFPs has not been conducive to this aim. Throughout, the consistency between gender-related poverty analyses, policy recommendations and the M&E framework is deficient. The irregular collection and poor quality of data is also seen as an impediment to the performance of M&E. Overall, effective reporting on performance in the sector has been affected by a lack of gender disaggregated data and information systems. Another related issue is that of how to integrate the results of M&E in future activities. A Gender Unit or similar institution may address this issue better and incorporate results in a comprehensive and responsive manner.

Ximungo Consultores
107[agper-zambia_2010_final.doc – 7/05/10 16:20]
For some of the MACO staff interviewed, the previous system with allocations for gender-specific activities in the budget is preferable to the current system which purports to gender-mainstream all activities, but which has little capacity to do so. To reach the political goals of gender equality, some staff recommended some kind of affirmative action and targeting over a transitional period. However, more critical voices claim that gender mainstreaming only has limited impact for change and does not challenge gender power structures. Collaboration with GIDD has been slow and there are requests from MACO Gender Focal Points for GIDD to strengthen training and capacity building and to supply gender specialists. Training opportunities, the availability and use of gender tools and methodologies including measurement indicators are seen as pivotal to successfully gender mainstream both the institution and the activities targeting Zambian farmers.
Given the extensive participation of women in all aspects of agricultural production in Zambia, the mainstreaming of gender into the agriculture sector is a key strategy not only for the promotion of equality between men and women, but also for sustainable agricultural and rural development and economic growth.
The analysis of public spending over the last decade reveals that public spending on agricultural services, excluding the Fertilizer Support Programme and the subsidies to the Food Reserve Agency, has in fact increased slightly, not fallen as it is sometimes thought. The outlays for FSP operations and FRA subsidies are so enormous that they could not possibly be taken from the core agricultural budget. Thus, growing amounts for FSP and FRA came on top of a rather stagnant spending on core agricultural services. At the same time, spending on core agriculture only represented less than 2 percent of all public spending over the period 2004 to 2008, with an exception in 2007. This is very low by all international and also regional standards. Non-personnel spending fluctuates wildly from year to year, and cash releases are significantly lower than appropriations. In districts, cash releases for non-personnel spending over the period 2005 to 2008 represent between 74 and 40 percent of appropriations. On the positive side, one notes that districts and provinces absorb more than half of all spending by core agriculture (“core” meaning: excluding FRA and FSP costs).
The above figures do not take donor spending earmarked to programmes and projects into account. A part of donor spending is included in the budget, but reporting on these items is so erratic and generally low that no firm conclusions can be drawn.
In view of the Maputo Declaration of the African Heads of State, which stipulates that ten percent of overall public spending should be for agriculture, the high outlays for FSP and FRA and the very low weight of core agricultural spending in overall public expenditure in the past, there should be scope for increasing funding levels for agricultural advisory services. According to available studies, FSP and FRA are poorly targeted, perceived as wasteful and prone to corruption. While not refuting the rationale of subsidies that are meant to develop markets for agricultural inputs and also while understanding the need for strategic food reserves for the main staple in Zambia, there is considerable scope for streamlining these operations and reducing the cost to the public budget.
These savings could be used to increase spending on core agricultural services. The analyses undertaken in this study with regard to the capacity and potential effectiveness of research and extension services suggest that there is a good chance that additional funds for core and advisory services could have a substantial and especially sustainable impact.

Ximungo Consultores
108[agper-zambia_2010_final.doc – 7/05/10 16:20]
The information about how scarce funds for operational expenditure is allocated to the different units in agriculture remained patchy. A systematic consultation mechanism that would permit to re-prioritise expenditure within the agriculture sector in view of cash shortfalls against approved estimates does not seem to exist. Evidently, the compliance of cash releases with estimates is the preferred solution. Efforts by the Ministry of Finance and National Development to improve the predictability of releases must continue. However, as long as serious shortfalls continue, it is advisable to design rules and consultation mechanisms that allow the sector to react to these in a more efficient way that involves exercises of rearranging priorities and then doing some activities in full while postponing others for later, rather than being forced to “muddle through” and be unable to do anything right.
A deeper analysis of the political-economy factors underlying the growth dynamic of the large, inefficient and corruption-prone subsidy programmes is required. One key element is that most farmers are said to protest strongly if promised fertilizer subsidies fail to materialize, while they are much more tolerant if they are not supported by the extension system. Under these circumstances, it is evident that political factors must result in prioritising subsidies. In order to counteract this tendency, the successes and effectiveness of extension services and the technologies that they transmit must become very visible to the electorate. Public relations efforts, supported by an adequate monitoring and evaluation system, are called for.

Ximungo Consultores
109[agper-zambia_2010_final.doc – 7/05/10 16:20]
Bibliography
Agricultural Consultative Forum. 2010. “What is in the 2010 National Budget for Zambian Agriculture?” Powerpoint Presentation.
Akroyd, Stephen and Lawrence Smith. 2007. Review of Public Spending to Agriculture. A joint DFID / World Bank study. Oxford: Oxford Policy Management.
Ashworth, Vincent A. 1999a. “Extension at the Crossroads. A review of Agricultural Extension in Zambia: Current Practices, Lessons Learned, The Way Forward.” A joint GRZ World Bank Study.
Ashworth, Vincent A. 1999b. “Extension and the Private Sector. Expanding the Private Sector role as Extension Providers. Principles, Issues, Options and Actions.” A Joint GRZ World Bank Study.
ASTI. 2009. Women’s Participation in Agricultural Research and Higher Education: key trends in Sub-Saharan Africa, Nienke M. Beintema and Federica Di Marcantonio. Agricultural and Science Technology Indicators, http://www.asti.cgiar.org/pdf/ASTI-AWARD-brief.pdf
Bird, Andrew. 2009. Analysis of the Planning and Budget Process. Background Paper for the 2010 Zambia Public Expenditure Review. Final Draft.
Bishop-Sambrook, Clare and Charlotte Wonani. 2008. “The Household Approach as an Effective Tool for Gender Empowerment: A Review of the Policy, Process and Impact of Gender mainstreaming in the Agricultural Support Programme in Zambia”. Final Document.
BRIDGE. 1998. Gender issues in agricultural liberalisation, Topic Paper prepared for Directorate General for Development of the European Commission, by Sally Baden, BRIDGE, report no 41.
Cardno Agrisystems Limited. 2009.” Participatory Review of the Ministry of Agriculture and Co-operatives (MACO): Performance in assuming its Leadership role in promoting Agriclture as the engine of Growth and Poverty Alleviation in Zambia.” Final Consolidated Report. Funded by the European Union.
CFU (Conservation Farming Unit). 2009a. “Conservation Farming & Conservation Agriculture: Handbook for Ox Farmers in Agro-Ecological Regions I & IIa.” 2009 Edition.
CFU (Conservation Farming Unit). 2009b. “Conservation Farming & Conservation Agriculture: Handbook for HOE farmers in in Agro-Ecological Regions I & IIa – Flat Culture.” 2009 Edition.
Charman, A.J.. 2008. Empowering Women Through Livelihoods Orientated Agricultural Service Provision: A Consideration of Evidence from Southern Africa, UNU-WIDER.
Commonwealth Secretariat. 2001. Gender Mainstreaming in Agriculture and Rural Development: a reference manual for Governments and other Stakeholders.
FAO. 1998. The potential for improving production tools and implements used by women farmers in Africa, Agricultural and Consumer Protection Department.
Farnworth, Cathy R. and Monica Munachonga. 2010. Zambia Country Report. A Contribution to the Study: Gender aware approaches in agricultural programmes: a comparative study of Sida supported agricultural programmes. A special study of the Agricultural Support Programme (ASP) in Zambia.
Govereh, J.; J.J. Shawa; Emma Malawo; T.S. Jayne. 2006. Raising the Productivity of Public Investment in Zambia’s Agriclutural Sector. FSRP Working Paper No. 20. Lusaka: FSRP
Govereh, Jonas and Emma Malawo, Tadeyo Lungu, Thom Jayne, Kasweka Chinyama, Pius Chilonda. 2009. “Trends and Spacial Distribution of Public Agicultural Spending in Zambia: Implications for Agricultural Productivity Growth.” FSRP Working Paper No. 36. Lusaka: FSRP

Ximungo Consultores
110[agper-zambia_2010_final.doc – 7/05/10 16:20]
Govereh, Jonas; T.S. Jayne; Antony Chapoto. 2008. Assessment of Alternative Maize Trade and Market Plicy Interventions in Zambia. FSRP Working Paper No. 33. Lusaka: FSRP
GTZ. 2008. Study on Gender-disaggregated data for the Zambian Ministry of Finance and National Planning (MoFNP).
IFPRI. 2005. Women: Still Key to Food and Nutrition Security.
Lungu, Tadeyo; Antony Chapoto; Margaret Beaver; Michael Weber. 2009. “Characteristics of Small and Medium-Scale Crop-Growing Households in Zambia: Preliminary Comparison of Results From CSO/MACO/FSRP National-Level Supplemental Surveys in 2003/04 and 2007/08 Crop Marketing Seasons.” Draft 2 for review, May 4, 2009.
Tembo, Gelson, and Antony Chapoto, Thomas Jane, Michael Weber. 2009. “Fostering Agricultural Market Development in Zambia.” FSRP Working Paper No. 40. Lusaka: FSRP
Tschirley, David and Stephen Kabwe. 2007. “Cotton in Zambia: 2007 Assessment of its Organization, Performance, Current Policy Initiatives, and Challenges for the Future.” FSRP Working Paper No. 26. Lusaka: FSRP
UNIFEM. 2006. Budgeting for Women’s Rights: Monitoring Government Budgets for Compliance with CEDAW.
World Bank. 2004. Zambia: Strategic Country Gender Assessment.
World Bank. 2005. Agricultural Growth for the Poor: An Agenda for Development. Directions in Development Series. Washington, DC: World Bank.
World Bank. 2007. World Development Report 2008: Agriculture for Development. Washington, D.C.: The World Bank.
World Bank. 2009. Gender in Agriculture Sourcebook.
World Bank. 2009. Zambia: “Impact Assessment of the Fertilizer Support Program, Analysis of Effectiveness and Efficiency.” Draft ESW Report. (mimeo.)
Zambia / Central Statistical Office. 2006. Agriculture Production For Small and Medium Scale Farmers – Post Harvest Data 2003/2004. Lusaka: CSO
Zambia / MACO. 2003. National Agricultural and Cooperatives Policy 2003-2015. Lusaka.
Zambia / MoFNP, Office of the Accountant General. Secretary to the Treasury’s Report on the Accounts and Finances of the Government of th Republic of Zambia for the Year Ended ... Financial report. Various years from 2002 to 2008.
Zambia / MoFNP. 2006. Fifth National Development Plan 2006-2010. Broad based wealth and job ceation through citizenry participation and technological advancement. Lusaka.
Zambia / MoFNP. 2008 (April). 2006 Annual Fifth National Development Plan Progress Report, Ministry of Finance and Planning.
Zambia / MoFNP. 2009 (October). Mid-term Review Fifth National Development Plan 2006-2010.
Zambia / MoFNP. Budget addresses. Various years.
Zambia / MoFNP. Medium Term Expenditure Framework and the Budget. Green Paper. Various Years.
Zambia / MoFNP. No date. 2007 Annual Fifth National Development Plan Progress Report, Ministry of Finance and Planning.

Ximungo Consultores
111[agper-zambia_2010_final.doc – 7/05/10 16:20]
Websites
Ministry of Finance and National Planning: www.mofnp.gov.zm
Ministry of Agriculture and Cooperatives: www.maff.gov.zm
Central Statistical Office: www.zamstats.gov.zm
Bank of Zambia: www.boz.zm
CFU: www.conservationagriculture.org

Ximungo Consultores
112[agper-zambia_2010_final.doc – 7/05/10 16:20]
Annex 1: Statistical Annex

Ximungo Consultores
113[agper-zambia_2010_final.doc – 7/05/10 16:20]
Annex 2: Persons Met Organisation Name Designation
ASP Olle Otteby (Mr) Former Team Leader
AVEDIS Social Development Consultants Cathy Farnsworth (Ms) Consultant
CFU Collins Nkatiko (Mr) Deputy Programme Manager- Field Operations
COMPACI Rudy van Gend (Mr) Principal Advisor (GTZ)
CSO, Agricultural Statistics Branch Masiliso Sooka (Mr) Branch Head
CSO, National Accounts Branch Codwin Sichone (Mr) Statistician
CSO, National Accounts Branch Litia Simbangala (Mr) Statistician
DACO, Monze Beatrice Tatila (Ms) Camp Extension Officer in Manungu B
DACO, Monze Brian Chavwanga (Mr) Junior Technical Officer (T&B)
DACO, Monze Justine Ngosa (Mr) District Agricultural Coordination Officer
DACO, Monze Paul Nyambe (Mr) Senior Agricultural Officer
DACO, Monze Sara Goma Sikota (Ms) Agricultural Extension Methodologist
DACO, Monze Tembo A. Arnes (?) (Mr) Assistant Accountant
Farmer (Monze) Ms Dainess Mweene
Farmer (Monze) Mr and Mrs Malambo
Farmer (Monze) Vincent Lumamba (Mr)
FSRP Antony Chapoto (Mr) Research Coordinator
FSRP Stephen Kabwe (Mr) Research Associate
GART Doublas S. Moono (Mr) Head, Research and Development
GART Stephen W. Muliokela (Mr) Director
GIDD Ernest B. Lungo (Mr) Finance and Economics Supervisor
GIDD Gabriel Kaunda (Mr) Permanent Secretary
GIDD Joe Kapwemba (Mr) Director
MACO Gender Audit Imelda Molokomme (Ms) Consultant
MACO, Agricultural Advisory Services Branch
Lackson Kaluba (Mr) Chief Agricultural Extension Officer
MACO, Agricultural Statistcs / Early Warning Section
Michael N. Isimwaa (Mr) Chief Agricultural Statistics & Data Analyst
MACO, Agro-Business and Marketing Kezia M. Katyamba (Ms) Deputy Director
MACO, Dept. of Agriculture Richard Kamona (Mr) Deputy Director
MACO, Dept. of Agriculture, Food and Nutrition
Alex Simwanza (Mr) Principal Food and Nutrition Officer
MACO, Dept. of Agriculture, Food and Nutrition
Karen Chenda Mukuka (Ms) Chief Food and Nutrition Officer

Ximungo Consultores
114[agper-zambia_2010_final.doc – 7/05/10 16:20]
Organisation Name Designation
MACO, Dept. of Cooperatives Dora Mutakwa Phiri (Ms) Chief Cooperatives Officer
MACO, Dept. of Cooperatives Justin Mwansa (Mr) Registrar
MACO, Dept. of Cooperatives Mutemwa Sitwala (Ms) Director
MACO, Dept. of Policy and Planning Emma M. Malawo (Ms) Deputy Director
MACO, Dept. of Policy and Planning J. J. Shawa (Mr) Director
MACO, Dept. of Policy and Planning Martin Kunda (Mr) Senior Sociologist, GFP
MACO, Human Resources and Administration
Jane S. Phiri (Ms) Assistant Director HRDT
MACO, National Agricultural Information Services
Mr. Mukeleba (Mr) Deputy Director
MACO, Policy and Planning Department Martin Mmembe (Mr)
Michigan State University Michael T. Weber (Mr) Professor, Department of Agriculture Economics
MoFL Martin Chilala (Mr) Chief Fish Culturist
MoFNP Chris Pain (Mr) Macroeconomic Advisor (GTZ)
MoFNP, Budget Department Pamela Chibonga (Ms) Senior Budget Analyst
MoFNP, Accountant General's Office Rachel Zyambo (Ms) Deputy Director
Norwegian Embassy Odd Eirik Arnesen (Mr) Councellor, Natural resource Management
Norwegian Embassy Olav Lundstol (Mr) Country Economist
Ramboll Natura Bjorn Hansson (Mr) Head of Unit
SCCI, CSO Mable M. Simwanza (Ms) Head of Seed Testing
Sida Eva Ohlsson (Ms) Agricultural Counsellor
Sida Karin Sverkén (Ms) Economist, Deputy Country Director
UNDP Dellia Yerekun (Ms) Senior Gender Analyst
UNZA Dr Kavwanga Yambayamba (Mr) Research Coordinator
UNZA KJavwanga Yambayamba (Mr) Senior Lecurer
World Bank Alex Mwanakasale (Mr) Agricultural Specialist
World Bank Indira Janaki Ekanayake (Ms) Senior Agriculturist
World Bank Julio E. Revilla (Mr) Senior Country Economist
ZAMBEEF Jacob Mwanza (Mr) Board Chairman
ZARI Moses Mwale (Mr) Deputy Director
ZARI W. Mwale (Mr) Director
ZNFU Ellah Chembe (Ms) Deputy Executive Director