
Wrapper ANFIS-ICA method to do stock market timing and feature selection
15
Expert Systems With Applications 42 (2015) 9221–9235 Contents lists available at ScienceDirect Expert Systems With Applications journal homepage: www.elsevier.com/locate/eswa Wrapper ANFIS-ICA method to do stock market timing and feature selection on the basis of Japanese Candlestick Sasan Barak a,∗ , Jalil Heidary Dahooie b , Tomáš Tichý a a Faculty of Economics, Technical University of Ostrava, Ostrava, Czech Republic b Faculty of Management, University of Tehran, Tehran, Iran article info Keywords: Finance Stock market forecasting Technical analysis Feature selection Wrapper ANFIS-ICA abstract Predicting stock prices is an important objective in the financial world. This paper presents a novel forecast- ing model for stock markets on the basis of the wrapper ANFIS (Adaptive Neural Fuzzy Inference System)- ICA (Imperialist Competitive Algorithm) and technical analysis of Japanese Candlestick. Two approaches of Raw-based and Signal-based are devised to extract the model’s input variables with 15 and 24 features, re- spectively. The correct predictions percentages for periods of 1–6 days with the total number of buy and sell signals are considered as output variables. In proposed model, the ANFIS prediction results are used as a cost function of wrapper model and ICA is used to select the most appropriate features. This novel combination of feature selection not only takes advantage of ICA optimization swiftness, but also the ANFIS prediction accuracy. The emitted buy and sell signals of the model revealed that Signal databases approach gets better results with 87% prediction accuracy and the wrapper features selection obtains 12% improvement in predic- tive performance regarding to the base study. In addition, since the wrapper-based feature selection models are considerably more time-consuming, our presented wrapper ANFIS-ICA algorithm’s results have superi- ority in time decreasing as well as increasing prediction accuracy as compared to other algorithms such as wrapper Genetic algorithm (GA). © 2015 Elsevier Ltd. All rights reserved. 1. Introduction A good prediction contributes to better decision-making and plan- ning for the future while it allows the current variables to create a considerable value. Predictions accuracy affects the organizations financial stability (Asadi, Hadavandi, Mehmanpazir, & Nakhostin, 2012). In the industry of information processing, data mining is an ever growing technology and has been applied in engineering, busi- ness and management. Prediction of stock prices, credit scores, and even bankruptcy potentials are examples of significant applicability of data mining in the field of finance. Since financial markets are complex and non-linear dynamic systems, their predictions are re- ally challenging (Huang & Tsai, 2009). There are different forecast- ing approaches such as statistical models, technical analysis (TA), and econometric methods (Atsalakis, Dimitrakakis, & Zopounidis, 2011; Kar, Das, & Ghosh, 2014) while in this study the focus is on wrapper approach based on TA. The most crucial points for trading are peaks and bottoms of the price trend in the way that a professional and lucky practitioner sells ∗ Corresponding author. Tel.: +420 702959246; fax: +420 597 322 008. E-mail addresses: [email protected], [email protected] (S. Barak), [email protected] (J.H. Dahooie), [email protected] (T. Tichý). at peaks and buys at bottoms. In real world, TA gives a consider- able assistance in such decisions (Lin, Yang, & Song, 2011) and its application has been well conceived by the financial market experts (Menkhoff, 2010). It should be noted that for short term period pre- diction, TA is the best tool although lately it has gone beyond the in- tention of short-term trading (Cervelló-Royo, Guijarro, & Michniuk, 2015; Zhu & Zhou, 2009). Due to the discussed importance, over the last two decades a lot of researches have focused on development of intelligent soft comput- ing models (Bisoi & Dash, 2014; Hafezi, Shahrabi, & Hadavandi, 2015; Majhi, Panda, & Sahoo, 2009). Most of them combine soft computing techniques and TA with stock analysis such as (Chen, Mabu, Shimada, & Hirasawa, 2009; Patel, Shah, Thakkar, & Kotecha, 2015; Wen, Yang, Song, & Jia, 2010). Since the end of the 1980s, some financial scholars applied arti- ficial neural networks (ANNs) to predict the stock market (Lee & Jo, 1999). However, the ANNs have some shortcomings in patterns learn- ing because stock market data are noisy and with complex dimen- sions (Huang, Yang, & Chuang, 2008). Therefore, to deal with these challenges, scholars proposed combination of fuzzy theory and ANNs. A Takagi–Sugeno–Kang-type Neuro-fuzzy rule-based system to forecast Taiwan Stock Exchange price deviation is developed by Chang and Liu (2008) with accuracies of 97.6% and 98.08% in http://dx.doi.org/10.1016/j.eswa.2015.08.010 0957-4174/© 2015 Elsevier Ltd. All rights reserved.
Transcript of Wrapper ANFIS-ICA method to do stock market timing and feature selection

Expert Systems With Applications 42 (2015) 9221–9235
Contents lists available at ScienceDirect
Expert Systems With Applications
journal homepage: www.elsevier.com/locate/eswa
Wrapper ANFIS-ICA method to do stock market timing and feature
selection on the basis of Japanese Candlestick
Sasan Barak a,∗, Jalil Heidary Dahooie b, Tomáš Tichý a
a Faculty of Economics, Technical University of Ostrava, Ostrava, Czech Republicb Faculty of Management, University of Tehran, Tehran, Iran
a r t i c l e i n f o
Keywords:
Finance
Stock market forecasting
Technical analysis
Feature selection
Wrapper ANFIS-ICA
a b s t r a c t
Predicting stock prices is an important objective in the financial world. This paper presents a novel forecast-
ing model for stock markets on the basis of the wrapper ANFIS (Adaptive Neural Fuzzy Inference System)-
ICA (Imperialist Competitive Algorithm) and technical analysis of Japanese Candlestick. Two approaches of
Raw-based and Signal-based are devised to extract the model’s input variables with 15 and 24 features, re-
spectively. The correct predictions percentages for periods of 1–6 days with the total number of buy and sell
signals are considered as output variables. In proposed model, the ANFIS prediction results are used as a cost
function of wrapper model and ICA is used to select the most appropriate features. This novel combination
of feature selection not only takes advantage of ICA optimization swiftness, but also the ANFIS prediction
accuracy. The emitted buy and sell signals of the model revealed that Signal databases approach gets better
results with 87% prediction accuracy and the wrapper features selection obtains 12% improvement in predic-
tive performance regarding to the base study. In addition, since the wrapper-based feature selection models
are considerably more time-consuming, our presented wrapper ANFIS-ICA algorithm’s results have superi-
ority in time decreasing as well as increasing prediction accuracy as compared to other algorithms such as
wrapper Genetic algorithm (GA).
© 2015 Elsevier Ltd. All rights reserved.
1
n
a
fi
2
e
n
e
o
c
a
i
e
K
a
p
H
a
a
a
(
d
t
2
r
i
M
t
&
S
fi
1
i
h
0
. Introduction
A good prediction contributes to better decision-making and plan-
ing for the future while it allows the current variables to create
considerable value. Predictions accuracy affects the organizations
nancial stability (Asadi, Hadavandi, Mehmanpazir, & Nakhostin,
012). In the industry of information processing, data mining is an
ver growing technology and has been applied in engineering, busi-
ess and management. Prediction of stock prices, credit scores, and
ven bankruptcy potentials are examples of significant applicability
f data mining in the field of finance. Since financial markets are
omplex and non-linear dynamic systems, their predictions are re-
lly challenging (Huang & Tsai, 2009). There are different forecast-
ng approaches such as statistical models, technical analysis (TA), and
conometric methods (Atsalakis, Dimitrakakis, & Zopounidis, 2011;
ar, Das, & Ghosh, 2014) while in this study the focus is on wrapper
pproach based on TA.
The most crucial points for trading are peaks and bottoms of the
rice trend in the way that a professional and lucky practitioner sells
∗ Corresponding author. Tel.: +420 702959246; fax: +420 597 322 008.
E-mail addresses: [email protected], [email protected] (S. Barak),
[email protected] (J.H. Dahooie), [email protected] (T. Tichý).
s
c
f
C
ttp://dx.doi.org/10.1016/j.eswa.2015.08.010
957-4174/© 2015 Elsevier Ltd. All rights reserved.
t peaks and buys at bottoms. In real world, TA gives a consider-
ble assistance in such decisions (Lin, Yang, & Song, 2011) and its
pplication has been well conceived by the financial market experts
Menkhoff, 2010). It should be noted that for short term period pre-
iction, TA is the best tool although lately it has gone beyond the in-
ention of short-term trading (Cervelló-Royo, Guijarro, & Michniuk,
015; Zhu & Zhou, 2009).
Due to the discussed importance, over the last two decades a lot of
esearches have focused on development of intelligent soft comput-
ng models (Bisoi & Dash, 2014; Hafezi, Shahrabi, & Hadavandi, 2015;
ajhi, Panda, & Sahoo, 2009). Most of them combine soft computing
echniques and TA with stock analysis such as (Chen, Mabu, Shimada,
Hirasawa, 2009; Patel, Shah, Thakkar, & Kotecha, 2015; Wen, Yang,
ong, & Jia, 2010).
Since the end of the 1980s, some financial scholars applied arti-
cial neural networks (ANNs) to predict the stock market (Lee & Jo,
999). However, the ANNs have some shortcomings in patterns learn-
ng because stock market data are noisy and with complex dimen-
ions (Huang, Yang, & Chuang, 2008). Therefore, to deal with these
hallenges, scholars proposed combination of fuzzy theory and ANNs.
A Takagi–Sugeno–Kang-type Neuro-fuzzy rule-based system to
orecast Taiwan Stock Exchange price deviation is developed by
hang and Liu (2008) with accuracies of 97.6% and 98.08% in

9222 S. Barak et al. / Expert Systems With Applications 42 (2015) 9221–9235
Training set
Test set
Try different feature set combination
Feature evaluation by classifier
Performance evaluation
Feature set
Estimated accuracyFinal evaluation by classifier
Best feature set
Fig. 1. The approach of wrapper.
f
J
i
t
s
p
b
c
i
b
l
S
c
2
2
f
(
a
w
f
l
p
t
X
s
l
I
TSE index and MediaTek, respectively. A hybrid Neuro-fuzzy with
ANFIS (Adaptive Neural Fuzzy Inference System) is developed by
Yunos, Shamsuddin, and Sallehuddin (2008) to predict daily move-
ments of the Kuala Lumpur Composite Index (KLCI) and the results
show superiority of the ANFIS to ANN. In comparison with the oth-
ers, ANFIS has high speed of training, the most effective learning al-
gorithm, and is simple in terms of the structure (Sarkheyli, Zain, &
Sharif, 2015). ANFIS provides better results when applied without
any pre-training (Vairappan, Tamura, Gao, & Tang, 2009). Bagheri,
Mohammadi Peyhani, and Akbari, (2014) used an ANFIS with QPSO
(Quantum-behaved Particle Swarm Optimization) hybrid method for
financial forecasting. For the scholars from this field the review paper
sof Atsalakis and Valavanis (2009) and Kar et al. (2014) can be useful.
Technical knowledge usually is elicited by TAs and in this study
a Japanese Candlestick chart analysis is used in order to elicit tech-
nical knowledge. Although the supporting literature on the Japanese
Candlestick charting and its antiquity are important reasons for ap-
plication of them in decision making but the two following points are
the main points for its application in our new model:
1. Consideration of open, high, low and close prices unlike the other
works that use only close prices.
2. Being more robust than the other technical trading rules from
the perspective of data snooping (Jasemi, Kimiagari, & Memariani,
2011).
Since there are many indices in stock exchange and more specifi-
cally in TA problems, feature selection becomes much more impor-
tant. A number of studies have claimed and verified that feature
selection (FS) is the key process in stock prediction (Barak & Modar-
res, 2015; Tsai & Hsiao, 2010). Feature selection decreases the cal-
culation cost by decreasing the corresponding dimensionality, or
improves the forecasting performance by elimination of extra and
unrelated features (Crone & Kourentzes, 2010). Generally there are
2 types of feature selection methods which are: (i) wrapper methods,
and (ii) filter methods (Barak & Modarres, 2015; Chen & Cheng, 2012)
while wrapper algorithms are more successful in most cases (Chiang,
Urban, & Baldridge, 1996; Kohavi & John, 1997; Lawrence, Giles, &
Tsoi, 1997; Maldonado & Weber, 2009; Min & Lee, 2005; Wang, An,
Chen, Li, & Alterovitz, 2015).
To sum up, in this research, a novel hybrid feature selection algo-
rithm on the basis of wrapper ICA-ANFIS method is applied to select
the important features. What makes our proposed approach different
rom the previous ones are that we proposed a new combination of
apanese Candlestick charts and wrapper ANFIS-ICA for forecasting.
Application of Japanese Candlestick charts as a technical analysis
s a key advantage of this study and effectiveness of the selected fea-
ures of this pattern is proved. Moreover the applied wrapper of this
tudy is a new combination in the way that ANFIS is an analyzer to
redict future of the stock market trend, and feature selection is done
y ICA (Imperialist Competitive Algorithm). The model not only in-
reases the prediction accuracy but also the process pace and finally
t should be noted that the patterns of Japanese Candlestick is on the
asis of Jasemi et al. (2011).
The contribution of the paper is summarized as follows:
• Gathering a comprehensive Japanese Candlestick database re-
garding to new adaptive technical analysis.• Developing a hybrid feature selection algorithm on the basis of
wrapper ICA-ANFIS model.• Exploring how much efficient an ANFIS would be to infer the TA
clues if it is provided with important indices of the TA (based on
wrapper feature selection) and actual trends.
The rest of the paper is organized as follows: Section 2 reviews the
iterature of wrapper, ANFIS, and ICA; Section 3 introduces the model;
ection 4 presents the experimental results and finally Section 5 fo-
uses on the conclusions.
. The background
.1. Wrapper feature selection method
In the wrapper method the goal is to find a subset of size r
rom n variables (r < n) that maximizes the predictor performance
Maldonado & Weber, 2009). The method utilizes the learning mech-
nism as the fitness function and seeks the best subset of the features
hile standard optimization techniques with learning mechanisms
or ranking of the subsets are possible. Kohavi and John (1997) have a
eading role in popularization of the wrapper approach that is really
owerful in feature selection, but it has its computational complexi-
ies and it is more time consuming than Filter method (Huang, Cai, &
u, 2007). Fig. 1 shows the approach concept.
For a given dataset of G with N features, the wrapper approach
tarts from a subset of F0 (an empty set, a full set, or any randomly se-
ected set) and with a particular strategy searches the features space.
t evaluates each generated subset of F by applying a learning model
i
S. Barak et al. / Expert Systems With Applications 42 (2015) 9221–9235 9223
Start Is there an empire with no colonies
Eliminate this empire
Stop condition satisfied
END
Assimilate colonies
Exchange the positions of that imperialist and the colony
Is there a colony in an empire which has lower cost than that of the imperialist
Compute the total cost of all empires
Imperialistic Competition
Yes
Yes
Yes
NoNo
No
Initialize the empires
Revolve some colonies
Unite Similar Empires
Fig. 2. Flowchart of the Imperialist Competitive Algorithm.
t
i
t
f
(
l
a
f
b
n
2
2
s
e
e
l
e
t
e
p
o
t
f
W
w
{
w
i
s
t
s
d
a
s
a
m
p
o
m
w
C
p
s
e
t
m
U
w
w
o
2
t
t
t
a
2
G
2
L
b
I
w
a
c
a
i
o
v
a
e
t
hat considers Fi as an input and if the learning model performance
mproves with Fi; Fi is regarded as the best current subset. Then
he wrapper modifies Fi by adding or eliminating features and per-
orming the search until coming to the predefined stopping criterion
Kabir & Islam, 2010). The above mentioned feature searching prob-
em is NP-hard and the number of local minima can be quite large
nd naturally a wide range of heuristic search strategies including
orward selection, backward elimination, hill-climbing, branch and
ound algorithms, and metaheuristics algorithms like simulated an-
ealing and genetic algorithms (GAs) have been used (Huang et al.,
007).
.2. Adaptive Neural Fuzzy Inference System (ANFIS)
ANFIS is a multi-layer adaptive network-based fuzzy inference
ystem proposed by Jang (1993). An ANFIS consists of total five lay-
rs to implement different node functions to learn and tune param-
ters in a Takagi–Sugeno fuzzy inference system (FIS) using a hybrid
earning mode.
The first layer executes a fuzzification process, the second layer
xecutes the fuzzy AND of the antecedent part of the fuzzy rules, the
hird layer normalizes the membership functions, the fourth layer ex-
cutes the conclusion part of the fuzzy rules, and the last layer com-
utes the output of the fuzzy system by summing up the outputs
f the four layers. The feed forward equations of the ANFIS struc-
ure with two inputs and two labels for each input are presented as
ollows:
i = μAi(x) × μBi
(x) i = 1, 2 (1)
¯ i = wi
w1 + w2
, i = 1, 2 (2)
f1 = p1x + q1y + r1zf2 = p2x + q2y + r2z
⇒ f = w1 f1 + w2 f2
w1 + w2
= w̄1 f1 + w̄2 f2 (3)
here x and y are inputs to node i, Ai and Bi are linguistic labels for
nputs, wi is the output of layer 3, and {pi, qi, ri} are the parameters
etting.
ANFIS model design consists of two sections: constructing and
raining. In the construction section, the number and type of FIS
tructure are defined. Construction of the ANFIS model requires the
ivision of the input/output data into rule patches. This can be
chieved by using a number of methods such as grid partitioning,
ubtractive clustering method and fuzzy c-means (FCM).
When there is only one output, FCM can be applied for making
primary FIS to train the ANFIS (Bezdek, 1981). FCM is done with
inimizing a goal function that represents the distance of each data
oint to data center that has been weighted by membership degree
f the data point (Eq. (4)).
in Jm =N∑
i=1
C∑j=1
Umi j
∥∥Xi − Cj
∥∥2, 1 ≤ m ≤ ∞ (4)
here m is a real number greater than 1 and each of Uij, Xi and
j shows the degree of membership of Xi in the jth cluster, the ith
-dimensional data and the p-dimensional center of the cluster, re-
pectively, and ||∗|| is any norm that shows the similarity between
ach measured data and the center. With iterative optimization of
he above objective function, fuzzy partitioning is done, by updating
embership Uij and cluster centers Cj, as follows:
i j = 1
∑Ck=1
(‖Xi−Xj‖‖Xi−Cj‖
) 2m−1
, Cj =∑N
i=1 Umi j
Xi∑Ni=1 Um
i j
(5)
hen maxi, j {|U(K+1)i j
− U(K)i j
|} ≺ ε is satisfied, iteration will stop,
here ɛ is a number between 0 and 1, and k is the step’s number
f iteration (Esfahanipour & Aghamiri, 2010; Sarkheyli et al., 2015).
.3. Imperialist Competitive Algorithm (ICA)
ICA is a new socio-politically motivated global search strategy
hat has been introduced for dealing with different optimization
asks (Atashpaz-Gargari & Lucas, 2007). This evolutionary optimiza-
ion strategy has shown great performance in both convergence rate
nd better global optima achievement (Atashpaz-Gargari & Lucas,
007; Biabangard-Oskouyi, Atashpaz-Gargari, Soltani, & Lucas, 2009;
argari, Hashemzadeh, Rajabioun, & Lucas, 2008; Khoshnevisan et al.,
015; Rajabioun, Atashpaz-Gargari, & Lucas, 2008; Sepehri Rad &
ucas, 2008). Nevertheless, its effectiveness, limitations and applica-
ility in various domains are currently being extensively investigated.
Fig. 2 (Atashpaz-Gargari & Lucas, 2007) shows the flowchart of the
CA. Similar to other evolutionary algorithms, this algorithm starts
ith an initial population. Each individual of the population is called
country. Some of the best countries (in optimization terminology,
ountries with the least cost) are selected to be the imperialist states
nd the rest form the colonies of these imperialists. All the colonies of
nitial countries are divided among the mentioned imperialists based
n their power. The power of each country, the counterpart of fitness
alue in the GA, is inversely proportional to its cost. Then an imperi-
list with its colonies can found an empire. Fig. 3 shows the primary
mpires while the most powerful imperialist 1 has more countries
han the others.

9224 S. Barak et al. / Expert Systems With Applications 42 (2015) 9221–9235
Fig. 3. Making the primary empires.
t
T
c
a
l
p
o
o
3
3
u
o
W
c
g
t
o
c
o
i
t
t
d
I
After forming initial empires, the colonies in each of them start
moving toward their relevant imperialist country. This movement is
a simple model of assimilation policy which was pursued by some
of the imperialist states. The Assimilation makes the colonies of each
empire in searching space, closer to the imperialist position while the
revolution covers random changes in position of some of the coun-
tries. During Assimilation and revolution a colony may advance to a
better position and has the probability of controlling the entire em-
pire and replace the imperialist.
If after this move, one of the colonies has more power than the
imperialist, they will be replaced. To initiate the competition among
Bearish Engulfing Bullish Engulfing Harami – Be
Morning Star Abandoned AbandoBaby - Bearish Baby – B
Shooting Star Inverted Hammer Dark Cloud
One White S
Fig. 4. Traditional 2-
he empires, the objective function of each empire is calculated.
his function depends on the imperialist objective function and its
olonies. Then the competition starts and the weakest empire lose its
ssets and the powerful empire tries to achieve them. The empire that
oses all of its colonies will vanish. Finally the most powerful empire
ossesses the other empires assets and wins the competition. From
ptimization point of view this leads to finding the optimal solution
f the problem, i.e. solution with least cost value.
. The proposed model
.1. Adaptive TAs and ANFIS
Technical analysis normally has two general approaches to eval-
ate the stock prices while the first uses technical indicators and
scillators, and the second uses charts (Chavarnakul & Enke, 2008).
hether mathematical or pattern charts, the mechanism of a typi-
al TA is based on signs and (their associated) signals, while signs are
enerated by the stock price alteration and signals are restricted to
hree states of ascending, descending and neutral (Lu, 2014).
The concept of adaptive TAs is not much different from the old
ne. The new generation of TA models is again categorized into two
ategories of mathematical and pattern charts and it is again a system
f signs and signals but unlike the static old one, it is dynamic.
In traditional combination, target data are results of applying the
nput data to some pre-determined rules of the selected TA. That is
he rules are constant and the concern of model developer is to bet-
er educate the network. In traditional combination the target data is
etermined according to the input data and the predetermined rules.
n statistic words the independent and dependent variables are input
arish Harami – Bullish Evening Star
ned Hanging Man Hammerullish
Cover Piercing Pattern One Black Crow
oldier
days patterns.

S. Barak et al. / Expert Systems With Applications 42 (2015) 9221–9235 9225
Input Data
Target Data
New Technical Rules
The Analyzer
Fig. 5. The new relation of input data and technical analysis rules.
a
o
&
p
P
r
d
c
t
i
s
n
t
g
a
t
n
t
s
e
i
a
f
m
t
3
f
c
a
I
w
nd target data, respectively. The following rules (Rules 1–6) are some
f predetermined rules in TA which are illustrated in Fig. 4 (Lu, Shiu,
Liu, 2012). The focus is on open (Oi), high (Hi), low (Li) and close (Ci)
rices of the stock on the ith day due to the Japanese Candlestick (do
rado, Ferneda, Morais, Luiz, & Matsura, 2013).
1. The Piercing: O1 > C1, O2 < C2, O2 ≤ C1, C2 < O1, and
C2 > C1 + 0.5(O1 − C1).
2. The Bullish Engulfing: O1 > C1, O2 < C2, O2 ≤ C1, and C2 ≥ O1.
3. The Bullish Harami: O1 > C1, O2 < C2, O2 > C1, and C2 < O1.
4. The Dark-cloud Cover: O1 < C1, O2 > C2, O2 ≥ C1, and
C2 < C1 − 0.5(C1 − O1).
5. The Bearish Engulfing: O1 < C1, O2 > C2, O2 ≥ C1, and C2 ≤ O1.
6. The Bearish Harami: O1 < C1, O2 > C2, O2 < C1, and C2 > O1.
As we can see in the upper rules, they are some predetermined
ules; however in this present paper, our approach is completely
ependent on input and target data in the way that they may be
ompletely different for two distinct periods of time. In other words
here is no pre-determined rule in the proposed synthetic model but
Fig. 6. The general structure o
nclude only some inputs and their associated target data on the ba-
is of which new rules are extracted. The most important task in the
ew model is with the analyzer that confirms the old rules or extracts
he new ones. Fig. 5 shows how the analyzer relates input data, tar-
et data and the new technical rules together. In addition the new
pproach inserts some kind of continuity to the selected rules.
In this study an ANFIS like in many similar works in the litera-
ure plays the analyzer role. But unlike the previous works, in the
ew model the ANFIS knowledge changes over time according to new
raining data.
Therefore in this study a modern combination of Japanese Candle-
tick charting and ANFIS is presented. In fact it is explored how much
fficient an ANFIS would be to infer the TA clues if it is provided with
mportant indices of the TA (based on wrapper feature selection) and
ctual trends. This model created for presented research, if success-
ul, could be beneficial for stock traders, much in allowing them to
ake better decision making using the most up-to-date investment
echniques.
.2. Model
The model proposes an adaptive TA based novel methodology
or signal prediction and feature selection with a wrapper approach
alled ANFIS-ICA, which results from the combination of ANFIS as
signal analyzer and ICA, as feature finder and subset evaluator.
n the other words, this model uses ANFIS as a signal analyzer tool
hile a novel wrapper feature selection algorithm selects important
f the presented model.
9226 S. Barak et al. / Expert Systems With Applications 42 (2015) 9221–9235
1 Nattrib
1 2 7 5 9… 14
3 13 2 10… 5
11 6 2 1… 8
8 6 1 13… 15
Npop 7 14 9 2… 6
Country
Fig. 7. Making the primary population.
Colony
Imperialist
13157342
Child
131912342
41912368
C1 to C2 (C2+1) to n1 to (C1-1)
Fig. 8. Assimilation policy.
41912368Before
41312968After
Fig. 9. Revolution.
i
R
t
3
d
i
k
a
a
s
3
p
3
c
I
w
3
a
U
A
f
P
T
s
w
s
a
o
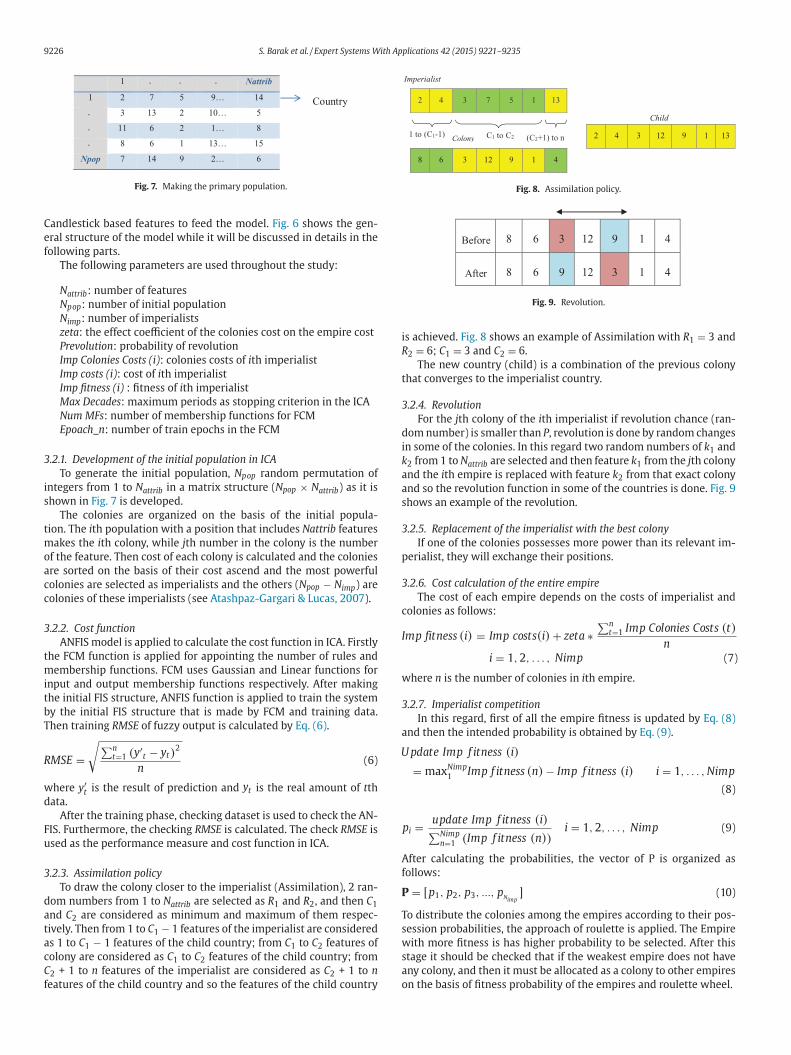
Candlestick based features to feed the model. Fig. 6 shows the gen-
eral structure of the model while it will be discussed in details in the
following parts.
The following parameters are used throughout the study:
Nattrib: number of features
Npop: number of initial population
Nimp: number of imperialists
zeta: the effect coefficient of the colonies cost on the empire cost
Prevolution: probability of revolution
Imp Colonies Costs (i): colonies costs of ith imperialist
Imp costs (i): cost of ith imperialist
Imp fitness (i) : fitness of ith imperialist
Max Decades: maximum periods as stopping criterion in the ICA
Num MFs: number of membership functions for FCM
Epoach_n: number of train epochs in the FCM
3.2.1. Development of the initial population in ICA
To generate the initial population, Npop random permutation of
integers from 1 to Nattrib in a matrix structure (Npop × Nattrib) as it is
shown in Fig. 7 is developed.
The colonies are organized on the basis of the initial popula-
tion. The ith population with a position that includes Nattrib features
makes the ith colony, while jth number in the colony is the number
of the feature. Then cost of each colony is calculated and the colonies
are sorted on the basis of their cost ascend and the most powerful
colonies are selected as imperialists and the others (Npop − Nimp) are
colonies of these imperialists (see Atashpaz-Gargari & Lucas, 2007).
3.2.2. Cost function
ANFIS model is applied to calculate the cost function in ICA. Firstly
the FCM function is applied for appointing the number of rules and
membership functions. FCM uses Gaussian and Linear functions for
input and output membership functions respectively. After making
the initial FIS structure, ANFIS function is applied to train the system
by the initial FIS structure that is made by FCM and training data.
Then training RMSE of fuzzy output is calculated by Eq. (6).
RMSE =√∑n
t=1 (y′t − yt)
2
n(6)
where y′t is the result of prediction and yt is the real amount of tth
data.
After the training phase, checking dataset is used to check the AN-
FIS. Furthermore, the checking RMSE is calculated. The check RMSE is
used as the performance measure and cost function in ICA.
3.2.3. Assimilation policy
To draw the colony closer to the imperialist (Assimilation), 2 ran-
dom numbers from 1 to Nattrib are selected as R1 and R2, and then C1
and C2 are considered as minimum and maximum of them respec-
tively. Then from 1 to C1 − 1 features of the imperialist are considered
as 1 to C1 − 1 features of the child country; from C1 to C2 features of
colony are considered as C1 to C2 features of the child country; from
C2 + 1 to n features of the imperialist are considered as C2 + 1 to n
features of the child country and so the features of the child country
s achieved. Fig. 8 shows an example of Assimilation with R1 = 3 and
2 = 6; C1 = 3 and C2 = 6.
The new country (child) is a combination of the previous colony
hat converges to the imperialist country.
.2.4. Revolution
For the jth colony of the ith imperialist if revolution chance (ran-
om number) is smaller than P, revolution is done by random changes
n some of the colonies. In this regard two random numbers of k1 and
2 from 1 to Nattrib are selected and then feature k1 from the jth colony
nd the ith empire is replaced with feature k2 from that exact colony
nd so the revolution function in some of the countries is done. Fig. 9
hows an example of the revolution.
.2.5. Replacement of the imperialist with the best colony
If one of the colonies possesses more power than its relevant im-
erialist, they will exchange their positions.
.2.6. Cost calculation of the entire empire
The cost of each empire depends on the costs of imperialist and
olonies as follows:
mp fitness (i) = Imp costs(i) + zeta ∗∑n
t=1 Imp Colonies Costs (t)
n
i = 1, 2, . . . , Nimp (7)
here n is the number of colonies in ith empire.
.2.7. Imperialist competition
In this regard, first of all the empire fitness is updated by Eq. (8)
nd then the intended probability is obtained by Eq. (9).
pdate Imp f itness (i)
= maxNimp1
Imp f itness (n) − Imp f itness (i) i = 1, . . . , Nimp
(8)
pi = update Imp f itness (i)∑Nimpn=1 (Imp f itness (n))
i = 1, 2, . . . , Nimp (9)
fter calculating the probabilities, the vector of P is organized as
ollows:
= [p1, p2, p3, ..., pNimp
] (10)
o distribute the colonies among the empires according to their pos-
ession probabilities, the approach of roulette is applied. The Empire
ith more fitness is has higher probability to be selected. After this
tage it should be checked that if the weakest empire does not have
ny colony, and then it must be allocated as a colony to other empires
n the basis of fitness probability of the empires and roulette wheel.
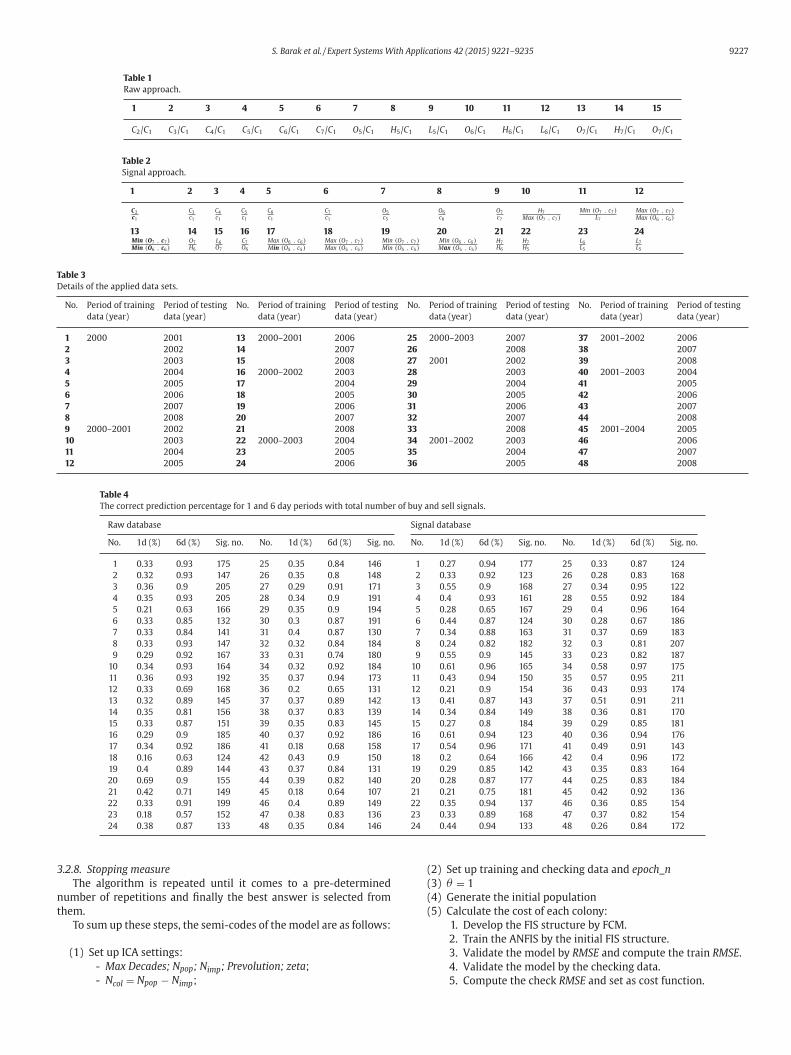
S. Barak et al. / Expert Systems With Applications 42 (2015) 9221–9235 9227
Table 1
Raw approach.
1 2 3 4 5 6 7 8 9 10 11 12 13 14 15
C2/C1 C3/C1 C4/C1 C5/C1 C6/C1 C7/C1 O5/C1 H5/C1 L5/C1 O6/C1 H6/C1 L6/C1 O7/C1 H7/C1 O7/C1
Table 2
Signal approach.
1 2 3 4 5 6 7 8 9 10 11 12
C2
c1
C3
c1
C4
c1
C5
c1
C6
c1
C7
c1
O5
c5
O6
c6
O7
c7
H7
Max (O7 , c7)Min (O7 , c7)
L7
Max (O7 , c7)Max (O6 , c6)
13 14 15 16 17 18 19 20 21 22 23 24Min (O7 , c7)Min (O6 , c6)
O7
H6
L6
O7
C7
O6
Max (O6 , c6)Min (O5 , c5)
Max (O7 , c7)Max (O5 , c5)
Min (O7 , c7)Min (O5 , c5)
Min (O6 , c6)Max (O5 , c5)
H7
H6
H7
H5
L6
L5
L7
L5
Table 3
Details of the applied data sets.
No. Period of training Period of testing No. Period of training Period of testing No. Period of training Period of testing No. Period of training Period of testing
data (year) data (year) data (year) data (year) data (year) data (year) data (year) data (year)
1 2000 2001 13 2000–2001 2006 25 2000–2003 2007 37 2001–2002 2006
2 2002 14 2007 26 2008 38 2007
3 2003 15 2008 27 2001 2002 39 2008
4 2004 16 2000–2002 2003 28 2003 40 2001–2003 2004
5 2005 17 2004 29 2004 41 2005
6 2006 18 2005 30 2005 42 2006
7 2007 19 2006 31 2006 43 2007
8 2008 20 2007 32 2007 44 2008
9 2000–2001 2002 21 2008 33 2008 45 2001–2004 2005
10 2003 22 2000–2003 2004 34 2001–2002 2003 46 2006
11 2004 23 2005 35 2004 47 2007
12 2005 24 2006 36 2005 48 2008
Table 4
The correct prediction percentage for 1 and 6 day periods with total number of buy and sell signals.
Raw database Signal database
No. 1d (%) 6d (%) Sig. no. No. 1d (%) 6d (%) Sig. no. No. 1d (%) 6d (%) Sig. no. No. 1d (%) 6d (%) Sig. no.
1 0.33 0.93 175 25 0.35 0.84 146 1 0.27 0.94 177 25 0.33 0.87 124
2 0.32 0.93 147 26 0.35 0.8 148 2 0.33 0.92 123 26 0.28 0.83 168
3 0.36 0.9 205 27 0.29 0.91 171 3 0.55 0.9 168 27 0.34 0.95 122
4 0.35 0.93 205 28 0.34 0.9 191 4 0.4 0.93 161 28 0.55 0.92 184
5 0.21 0.63 166 29 0.35 0.9 194 5 0.28 0.65 167 29 0.4 0.96 164
6 0.33 0.85 132 30 0.3 0.87 191 6 0.44 0.87 124 30 0.28 0.67 186
7 0.33 0.84 141 31 0.4 0.87 130 7 0.34 0.88 163 31 0.37 0.69 183
8 0.33 0.93 147 32 0.32 0.84 184 8 0.24 0.82 182 32 0.3 0.81 207
9 0.29 0.92 167 33 0.31 0.74 180 9 0.55 0.9 145 33 0.23 0.82 187
10 0.34 0.93 164 34 0.32 0.92 184 10 0.61 0.96 165 34 0.58 0.97 175
11 0.36 0.93 192 35 0.37 0.94 173 11 0.43 0.94 150 35 0.57 0.95 211
12 0.33 0.69 168 36 0.2 0.65 131 12 0.21 0.9 154 36 0.43 0.93 174
13 0.32 0.89 145 37 0.37 0.89 142 13 0.41 0.87 143 37 0.51 0.91 211
14 0.35 0.81 156 38 0.37 0.83 139 14 0.34 0.84 149 38 0.36 0.81 170
15 0.33 0.87 151 39 0.35 0.83 145 15 0.27 0.8 184 39 0.29 0.85 181
16 0.29 0.9 185 40 0.37 0.92 186 16 0.61 0.94 123 40 0.36 0.94 176
17 0.34 0.92 186 41 0.18 0.68 158 17 0.54 0.96 171 41 0.49 0.91 143
18 0.16 0.63 124 42 0.43 0.9 150 18 0.2 0.64 166 42 0.4 0.96 172
19 0.4 0.89 144 43 0.37 0.84 131 19 0.29 0.85 142 43 0.35 0.83 164
20 0.69 0.9 155 44 0.39 0.82 140 20 0.28 0.87 177 44 0.25 0.83 184
21 0.42 0.71 149 45 0.18 0.64 107 21 0.21 0.75 181 45 0.42 0.92 136
22 0.33 0.91 199 46 0.4 0.89 149 22 0.35 0.94 137 46 0.36 0.85 154
23 0.18 0.57 152 47 0.38 0.83 136 23 0.33 0.89 168 47 0.37 0.82 154
24 0.38 0.87 133 48 0.35 0.84 146 24 0.44 0.94 133 48 0.26 0.84 172
3
n
t
.2.8. Stopping measure
The algorithm is repeated until it comes to a pre-determined
umber of repetitions and finally the best answer is selected from
hem.
To sum up these steps, the semi-codes of the model are as follows:
(1) Set up ICA settings:
- Max Decades; Npop; Nimp; Prevolution; zeta;
- Ncol = Npop − Nimp;
(2) Set up training and checking data and epoch_n
(3) θ = 1
(4) Generate the initial population
(5) Calculate the cost of each colony:
1. Develop the FIS structure by FCM.
2. Train the ANFIS by the initial FIS structure.
3. Validate the model by RMSE and compute the train RMSE.
4. Validate the model by the checking data.
5. Compute the check RMSE and set as cost function.
9228 S. Barak et al. / Expert Systems With Applications 42 (2015) 9221–9235
a: Trend of the input data of the system b: Imperialist competition
: The real and fuzzy output d: The costs trend in the algorithm stagesc
0 500 1000 1500 2000 2500-0.5
0
0.5
1
1.5
2
2.5
Sample
Atti
tude
Normalized Data
0 1 2 3 4 50
0.5
1
1.5
2
2.5
3x 10
-3
Position
Co
st
Imp 1Imp 2Imp 3Imp 4Imp 5
0 5 10 15 20 25 30
1.4
1.5
1.6
1.7
1.8
1.9
2x 10
-3
Decade
Cos
t
Best Cost
Mean Cost
0 50 100 150 200 250 300-0.06
-0.04
-0.02
0
0.02
0.04
0.06
0.08 Root-mean-square error For Best Position Is 0.0013284
Checking Data
ANFIS Output
Fig. 10. (a) Trend of the input data of the system. (b) Imperialist competition. (c) The costs trend in the algorithm stages. (d) The real and fuzzy output.
4
4
p
b
(6) Select the most powerful colonies as imperialists.
(7) Allocate rest of the colonies to the imperialist on the basis of
the imperialist power.
(8) Generate empires by imperialists and their colonies.
(9) Move the colonies toward the relevant imperialist.
(10) Revolve in some of the colonies.
(11) Exchange the position of a colony and the imperialist if its cost
is lower.
(12) Compute the objective function (the total cost) of all empires.
(13) Pick the weakest colony and give it to the best empire.
(14) Eliminate the powerless empires.
(15) If the stop condition is satisfied stop, and if not go to step 10.
(16) Select the optimum subset of the features with the minimum
check error (Check RMSE).
(17) If θ = Max Decades then stop, and if not θ = θ + 1 and go to
step 5.
. Empirical results
.1. Input data
In this study the training data are based on the two applied ap-
roaches of Jasemi et al. (2011). The first approach (Raw database) is
ased on Raw input features including 15 items and 1 output. In this
S. Barak et al. / Expert Systems With Applications 42 (2015) 9221–9235 9229
2 4 6 8 10 12 14 160
0.002
0.004
0.006
0.008
0.01
0.012
0.014
Nattrib
RM
SE
database1
2 4 6 8 10 12 14 160
0.002
0.004
0.006
0.008
0.01
0.012
0.014
Nattrib
RM
SE
database2
2 4 6 8 10 12 14 160
0.002
0.004
0.006
0.008
0.01
0.012
Nattrib
RM
SE
database3
2 4 6 8 10 12 14 160
0.005
0.01
0.015
Nattrib
RM
SE
database4
Fig. 11. RMSE changing for the first approach in the first four datasets.
a
p
i
o
p
n
a
m
s
H
t
T
p
g
t
t
t
4
G
2
c
e
q
p
t
m
e
n
n
(
m
0
m
c
T
t
e
w
m
a
m
F
t
pproach the focus is on open (Oi), high (Hi), low (Li) and close (Ci)
rices of the stock in the ith day due to the Japanese Candlestick dur-
ng last 3 days while to cover the stock price trend the close prices
f the stock during the last 7 days are also included. Totally this ap-
roach comes to 15 normalized indices ofCiC1
i = 2, 3, 4;OiC1
,HiC1
,LiC1
and
CiC1
i = 5, 6, 7.
The 15 indices of this approach are shown in Table 1.
The second approach (Signal database) is based on the reverse sig-
als of Japanese Candlestick technique including 24 input features
nd 1 output. This package covers the important factors of decision
aking in the technique. In this approach the focus is on the reversal
ignals of Japanese Candlestick like Morning star, Inverted hammer,
arami and many others. In fact this set of inputs is more advanced
han the previous and covers important pattern charts’ clues of the
A which are defined as shown by Table 2.
These approaches in 48 data sets, according to Table 3, are ap-
lied to train and test the introduced ANFIS model. This structure
ains the advantage of adaptive TA in which the input data and the
arget data are dependent and change over the time. Also, this struc-
ure is enjoyed from sliding window function in time series predic-
ion (Mozaffari, Mozaffari, & Azad, 2015).
.2. Results
The input data of our experiment belong to daily stock prices of
eneral Motors Company at New York Stock Exchange from 2000 to
009. 48 data sets according to Table 3 are applied for learning and
hecking.
After the experiments is it examined that the proposed model is
fficient? And which approach has a better performance? Does the
uality of forecasting increase when the training data covers a longer
eriod? Does the quality of forecasting decline when the distance be-
ween the training and testing data increases?
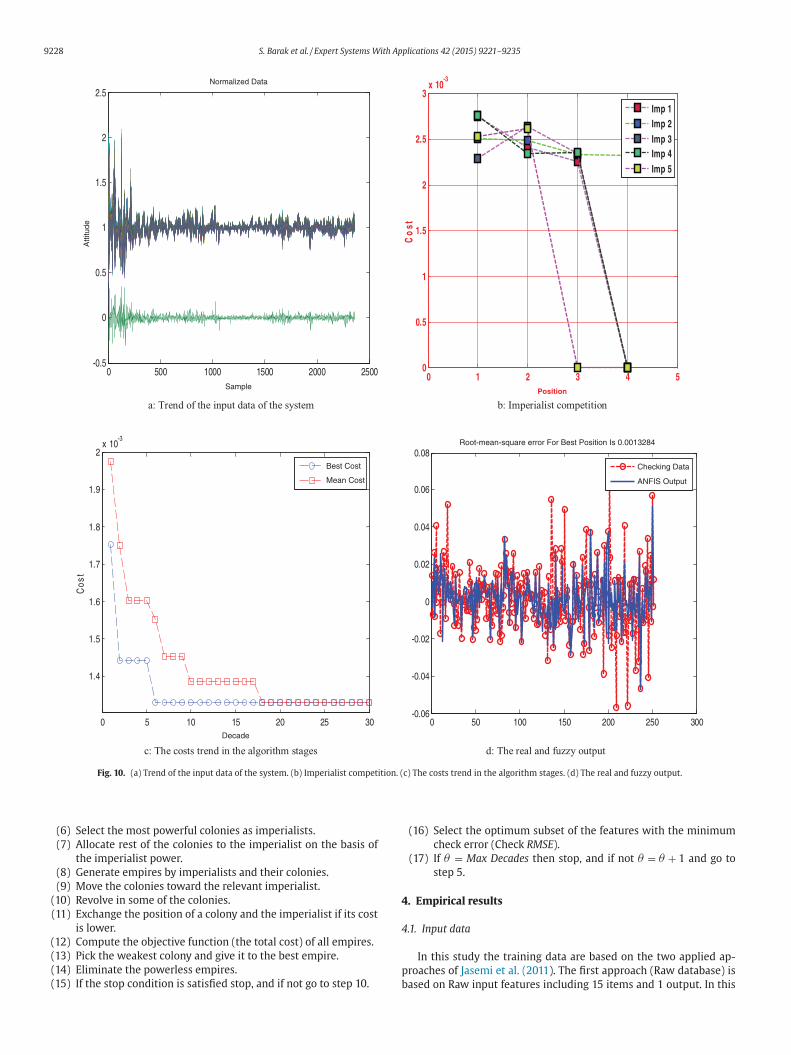
To optimize the ANFIS parameters, the pre-assumed hybrid
ethod of pre-propagation and least squares is applied. After differ-
nt evaluation, 20 membership functions were selected as optimal
umber of FCM rules. In ICA on the basis of different runs, the total
umber of colonies, number of empires, rate of colonies revolution
P), effect coefficient of colonies power on empire power (zeta) and
aximum number of repetition as the stop condition are 20, 5, 0.5,
.1 and 30, respectively.
The following figures show the outputs of the wrapper ANFIS-ICA
odel with the Raw input data of 2000–2001 for train and 2003 for
hecking. Fig. 10a shows the features attitudes of the data approach.
he upper trend shows the features trend and the bottom represents
he outputs for one sample of normalized data. Fig. 10b shows the
mpires costs and the stages of imperials elimination in ICA in the
ay that the weak imperials are eliminated and the strong ones re-
ain. Fig. 10c shows the decrease of RMSE (cost) in repetition of the
lgorithm and represents two charts of the costs mean and the mini-
um cost in each repetition. Fig. 10d shows checking output and AN-
IS output with root of mean square error for best position on top of
he figure.
9230 S. Barak et al. / Expert Systems With Applications 42 (2015) 9221–9235
2 4 6 8 10 12 14 160
0.005
0.01
0.015
Nattrib
RM
SE
Fig. 12. RMSE changing for the first approach in the 48 datasets.
2
i
c
o
a
a
t
t
i
o
o
s
l
s
w
c
a
n
d
m
s
f
w
Lee and Jo (1999) believe that if the hit ratio defined byNumber of successes
Total number of signalsis above 51%, the model is regarded useful. The hit
ratios of the new model for the first and second approaches are 85%
and 87%, respectively while the second approach gives more number
of buy and sell signals.
In the base study of Jasemi et al. (2011) the hit ratios for the first
and second approaches are 75% and 74%, respectively. Unlike the base
study our results show the superiority of the second approach.
The percentages of correct signals for 1-day period are 40% and
43% for the first and second approaches, respectively. It is to be noted
that increasing the learning period’s length does not have a sensible
effect on the results.
Table 4 shows the prediction results for 1-day and 6-day periods
and also the total number of buy and sell signals. The correct signals
are achieved from comparing the predictions with real happenings
of the stock market. The complete list of the results is presented in
Appendix A.
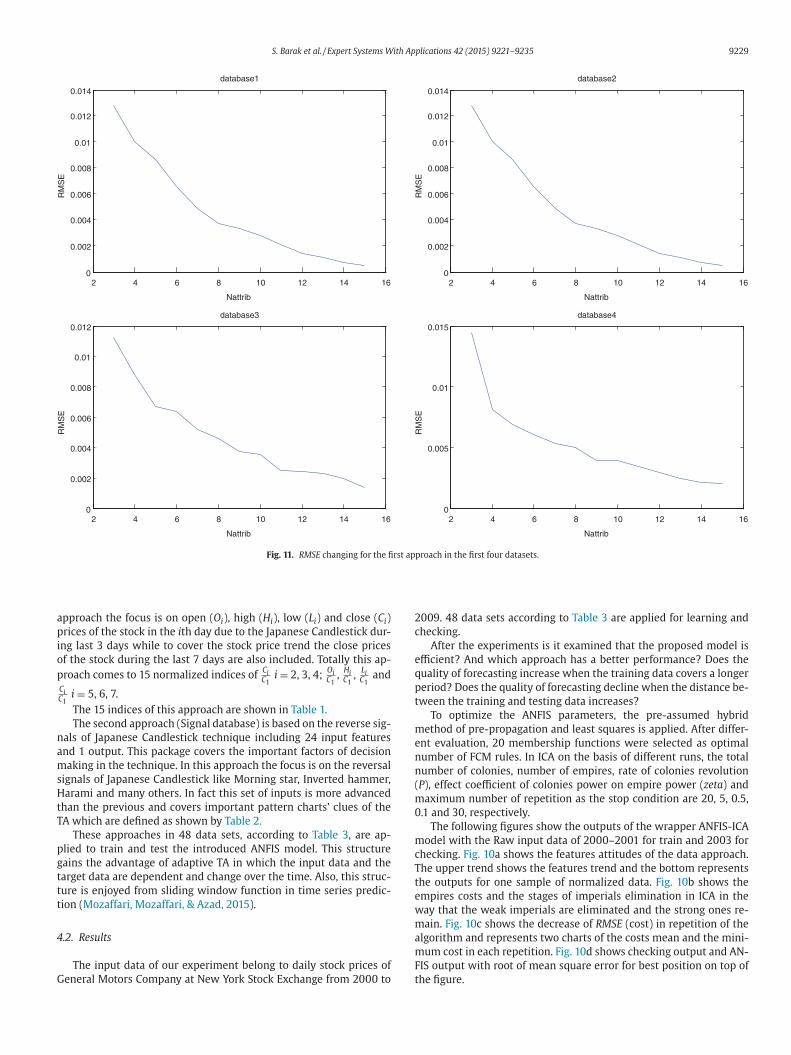
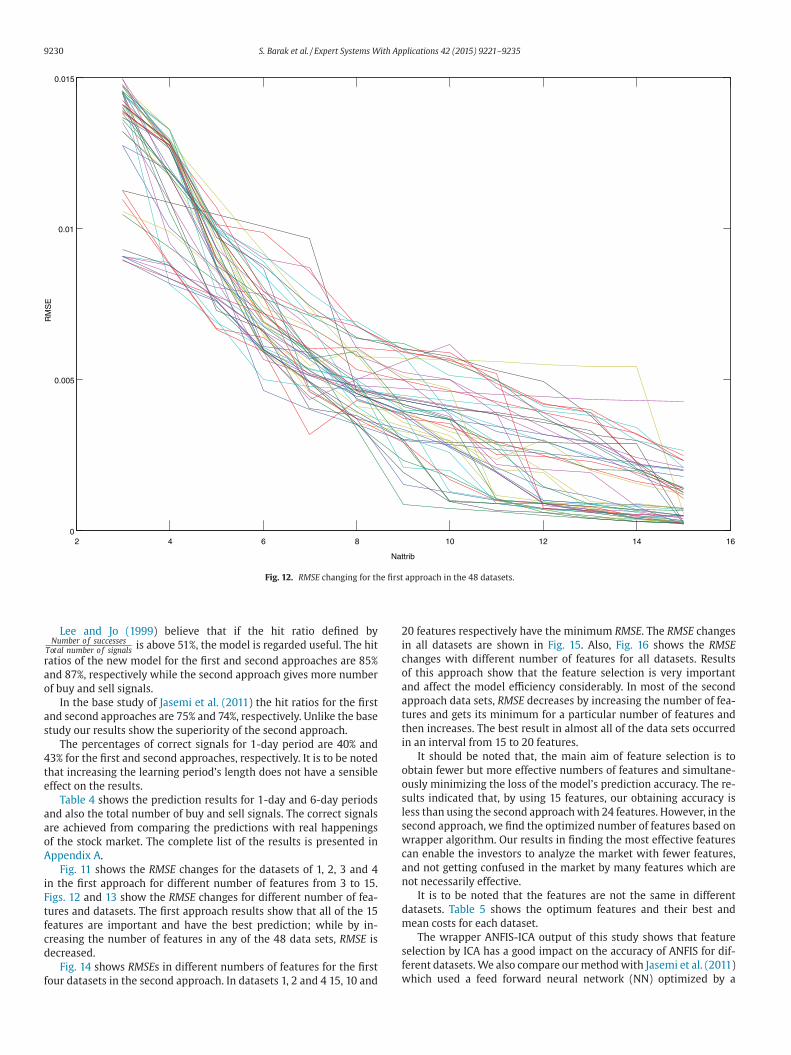
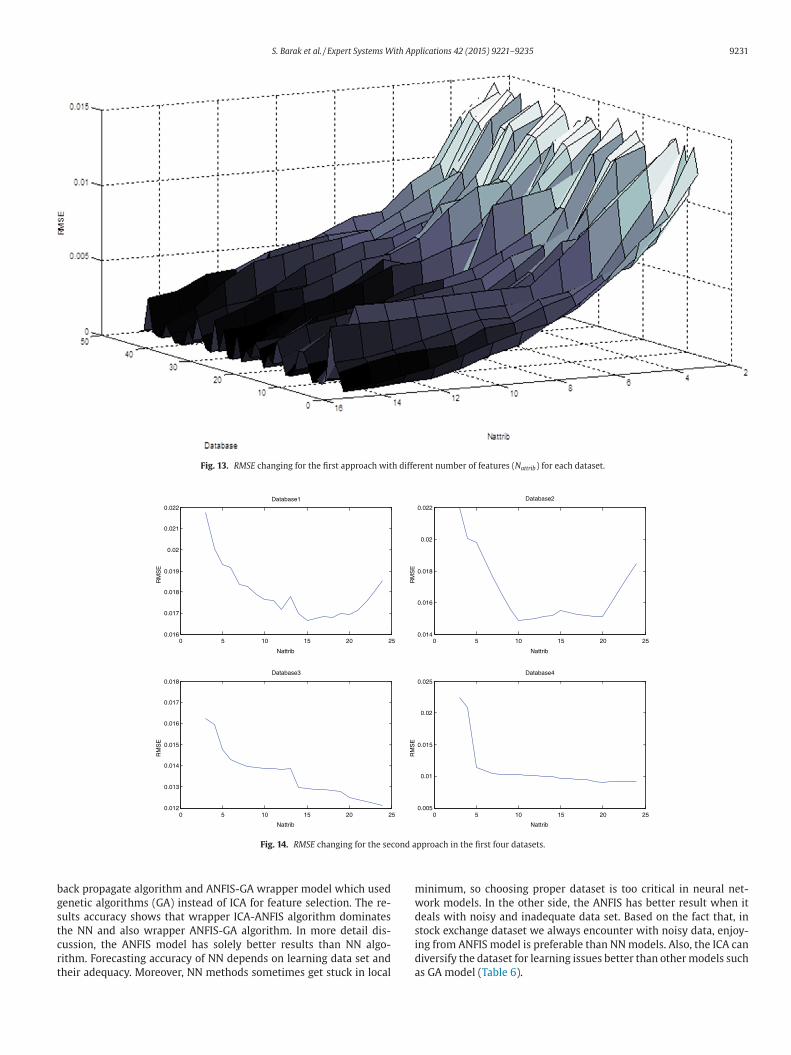
Fig. 11 shows the RMSE changes for the datasets of 1, 2, 3 and 4
in the first approach for different number of features from 3 to 15.
Figs. 12 and 13 show the RMSE changes for different number of fea-
tures and datasets. The first approach results show that all of the 15
features are important and have the best prediction; while by in-
creasing the number of features in any of the 48 data sets, RMSE is
decreased.
Fig. 14 shows RMSEs in different numbers of features for the first
four datasets in the second approach. In datasets 1, 2 and 4 15, 10 and
0 features respectively have the minimum RMSE. The RMSE changes
n all datasets are shown in Fig. 15. Also, Fig. 16 shows the RMSE
hanges with different number of features for all datasets. Results
f this approach show that the feature selection is very important
nd affect the model efficiency considerably. In most of the second
pproach data sets, RMSE decreases by increasing the number of fea-
ures and gets its minimum for a particular number of features and
hen increases. The best result in almost all of the data sets occurred
n an interval from 15 to 20 features.
It should be noted that, the main aim of feature selection is to
btain fewer but more effective numbers of features and simultane-
usly minimizing the loss of the model’s prediction accuracy. The re-
ults indicated that, by using 15 features, our obtaining accuracy is
ess than using the second approach with 24 features. However, in the
econd approach, we find the optimized number of features based on
rapper algorithm. Our results in finding the most effective features
an enable the investors to analyze the market with fewer features,
nd not getting confused in the market by many features which are
ot necessarily effective.
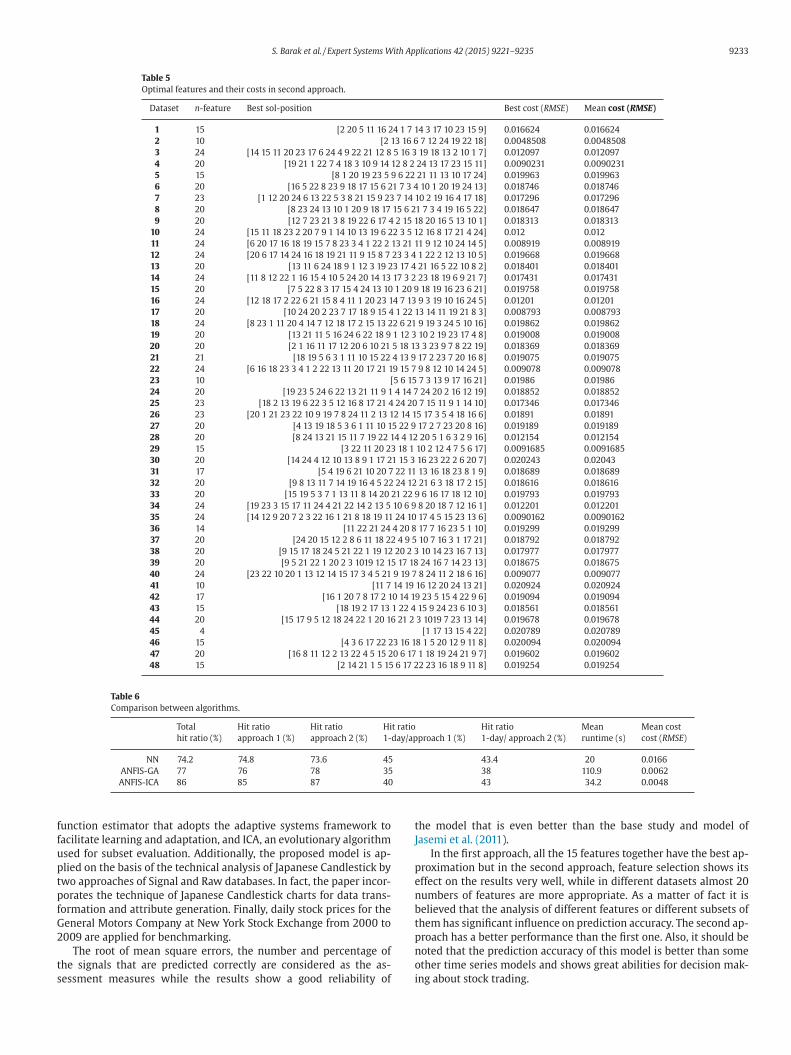
It is to be noted that the features are not the same in different
atasets. Table 5 shows the optimum features and their best and
ean costs for each dataset.
The wrapper ANFIS-ICA output of this study shows that feature
election by ICA has a good impact on the accuracy of ANFIS for dif-
erent datasets. We also compare our method with Jasemi et al. (2011)
hich used a feed forward neural network (NN) optimized by a
S. Barak et al. / Expert Systems With Applications 42 (2015) 9221–9235 9231
Fig. 13. RMSE changing for the first approach with different number of features (Nattrib) for each dataset.
0 5 10 15 20 250.014
0.016
0.018
0.02
0.022
Nattrib
RM
SE
Database2
0 5 10 15 20 250.012
0.013
0.014
0.015
0.016
0.017
0.018
Nattrib
RM
SE
Database3
0 5 10 15 20 250.005
0.01
0.015
0.02
0.025
Nattrib
RM
SE
Database4
0 5 10 15 20 250.016
0.017
0.018
0.019
0.02
0.021
0.022
Nattrib
RM
SE
Database1
Fig. 14. RMSE changing for the second approach in the first four datasets.
b
g
s
t
c
r
t
m
w
d
s
i
d
a
ack propagate algorithm and ANFIS-GA wrapper model which used
enetic algorithms (GA) instead of ICA for feature selection. The re-
ults accuracy shows that wrapper ICA-ANFIS algorithm dominates
he NN and also wrapper ANFIS-GA algorithm. In more detail dis-
ussion, the ANFIS model has solely better results than NN algo-
ithm. Forecasting accuracy of NN depends on learning data set and
heir adequacy. Moreover, NN methods sometimes get stuck in local
inimum, so choosing proper dataset is too critical in neural net-
ork models. In the other side, the ANFIS has better result when it
eals with noisy and inadequate data set. Based on the fact that, in
tock exchange dataset we always encounter with noisy data, enjoy-
ng from ANFIS model is preferable than NN models. Also, the ICA can
iversify the dataset for learning issues better than other models such
s GA model (Table 6).

9232 S. Barak et al. / Expert Systems With Applications 42 (2015) 9221–9235
0 5 10 15 20 250.008
0.01
0.012
0.014
0.016
0.018
0.02
0.022
0.024
Nattrib
RM
SE
Fig. 15. RMSE changing for the second approach in the 48 datasets.
0 5 10 15 20 25 30 35 40 45 50
0
5
10
15
20
250.005
0.01
0.015
0.02
0.025
DatabaseNattrib
RM
SE
Fig. 16. RMSE changing for the second approach with different number of features for each dataset.
5
t
I
It is considerable to mention that ICA algorithm gets the final
response more quickly than GA and because of the fact that wrap-
per models are time-consuming and need a large amount of time
to convergence, this algorithm proves its ability in other point of
view.
. Conclusion
The paper proposes a novel methodology for feature selection and
ime series estimation based on a wrapper approach called ANFIS-
CA, which results from the combination of ANFIS, a fuzzy logic based
S. Barak et al. / Expert Systems With Applications 42 (2015) 9221–9235 9233
Table 5
Optimal features and their costs in second approach.
Dataset n-feature Best sol-position Best cost (RMSE) Mean cost (RMSE)
1 15 [2 20 5 11 16 24 1 7 14 3 17 10 23 15 9] 0.016624 0.016624
2 10 [2 13 16 6 7 12 24 19 22 18] 0.0048508 0.0048508
3 24 [14 15 11 20 23 17 6 24 4 9 22 21 12 8 5 16 3 19 18 13 2 10 1 7] 0.012097 0.012097
4 20 [19 21 1 22 7 4 18 3 10 9 14 12 8 2 24 13 17 23 15 11] 0.0090231 0.0090231
5 15 [8 1 20 19 23 5 9 6 22 21 11 13 10 17 24] 0.019963 0.019963
6 20 [16 5 22 8 23 9 18 17 15 6 21 7 3 4 10 1 20 19 24 13] 0.018746 0.018746
7 23 [1 12 20 24 6 13 22 5 3 8 21 15 9 23 7 14 10 2 19 16 4 17 18] 0.017296 0.017296
8 20 [8 23 24 13 10 1 20 9 18 17 15 6 21 7 3 4 19 16 5 22] 0.018647 0.018647
9 20 [12 7 23 21 3 8 19 22 6 17 4 2 15 18 20 16 5 13 10 1] 0.018313 0.018313
10 24 [15 11 18 23 2 20 7 9 1 14 10 13 19 6 22 3 5 12 16 8 17 21 4 24] 0.012 0.012
11 24 [6 20 17 16 18 19 15 7 8 23 3 4 1 22 2 13 21 11 9 12 10 24 14 5] 0.008919 0.008919
12 24 [20 6 17 14 24 16 18 19 21 11 9 15 8 7 23 3 4 1 22 2 12 13 10 5] 0.019668 0.019668
13 20 [13 11 6 24 18 9 1 12 3 19 23 17 4 21 16 5 22 10 8 2] 0.018401 0.018401
14 24 [11 8 12 22 1 16 15 4 10 5 24 20 14 13 17 3 2 23 18 19 6 9 21 7] 0.017431 0.017431
15 20 [7 5 22 8 3 17 15 4 24 13 10 1 20 9 18 19 16 23 6 21] 0.019758 0.019758
16 24 [12 18 17 2 22 6 21 15 8 4 11 1 20 23 14 7 13 9 3 19 10 16 24 5] 0.01201 0.01201
17 20 [10 24 20 2 23 7 17 18 9 15 4 1 22 13 14 11 19 21 8 3] 0.008793 0.008793
18 24 [8 23 1 11 20 4 14 7 12 18 17 2 15 13 22 6 21 9 19 3 24 5 10 16] 0.019862 0.019862
19 20 [13 21 11 5 16 24 6 22 18 9 1 12 3 10 2 19 23 17 4 8] 0.019008 0.019008
20 20 [2 1 16 11 17 12 20 6 10 21 5 18 13 3 23 9 7 8 22 19] 0.018369 0.018369
21 21 [18 19 5 6 3 1 11 10 15 22 4 13 9 17 2 23 7 20 16 8] 0.019075 0.019075
22 24 [6 16 18 23 3 4 1 2 22 13 11 20 17 21 19 15 7 9 8 12 10 14 24 5] 0.009078 0.009078
23 10 [5 6 15 7 3 13 9 17 16 21] 0.01986 0.01986
24 20 [19 23 5 24 6 22 13 21 11 9 1 4 14 7 24 20 2 16 12 19] 0.018852 0.018852
25 23 [18 2 13 19 6 22 3 5 12 16 8 17 21 4 24 20 7 15 11 9 1 14 10] 0.017346 0.017346
26 23 [20 1 21 23 22 10 9 19 7 8 24 11 2 13 12 14 15 17 3 5 4 18 16 6] 0.01891 0.01891
27 20 [4 13 19 18 5 3 6 1 11 10 15 22 9 17 2 7 23 20 8 16] 0.019189 0.019189
28 20 [8 24 13 21 15 11 7 19 22 14 4 12 20 5 1 6 3 2 9 16] 0.012154 0.012154
29 15 [3 22 11 20 23 18 1 10 2 12 4 7 5 6 17] 0.0091685 0.0091685
30 20 [14 24 4 12 10 13 8 9 1 17 21 15 3 16 23 22 2 6 20 7] 0.020243 0.02043
31 17 [5 4 19 6 21 10 20 7 22 11 13 16 18 23 8 1 9] 0.018689 0.018689
32 20 [9 8 13 11 7 14 19 16 4 5 22 24 12 21 6 3 18 17 2 15] 0.018616 0.018616
33 20 [15 19 5 3 7 1 13 11 8 14 20 21 22 9 6 16 17 18 12 10] 0.019793 0.019793
34 24 [19 23 3 15 17 11 24 4 21 22 14 2 13 5 10 6 9 8 20 18 7 12 16 1] 0.012201 0.012201
35 24 [14 12 9 20 7 2 3 22 16 1 21 8 18 19 11 24 10 17 4 5 15 23 13 6] 0.0090162 0.0090162
36 14 [11 22 21 24 4 20 8 17 7 16 23 5 1 10] 0.019299 0.019299
37 20 [24 20 15 12 2 8 6 11 18 22 4 9 5 10 7 16 3 1 17 21] 0.018792 0.018792
38 20 [9 15 17 18 24 5 21 22 1 19 12 20 2 3 10 14 23 16 7 13] 0.017977 0.017977
39 20 [9 5 21 22 1 20 2 3 1019 12 15 17 18 24 16 7 14 23 13] 0.018675 0.018675
40 24 [23 22 10 20 1 13 12 14 15 17 3 4 5 21 9 19 7 8 24 11 2 18 6 16] 0.009077 0.009077
41 10 [11 7 14 19 16 12 20 24 13 21] 0.020924 0.020924
42 17 [16 1 20 7 8 17 2 10 14 19 23 5 15 4 22 9 6] 0.019094 0.019094
43 15 [18 19 2 17 13 1 22 4 15 9 24 23 6 10 3] 0.018561 0.018561
44 20 [15 17 9 5 12 18 24 22 1 20 16 21 2 3 1019 7 23 13 14] 0.019678 0.019678
45 4 [1 17 13 15 4 22] 0.020789 0.020789
46 15 [4 3 6 17 22 23 16 18 1 5 20 12 9 11 8] 0.020094 0.020094
47 20 [16 8 11 12 2 13 22 4 5 15 20 6 17 1 18 19 24 21 9 7] 0.019602 0.019602
48 15 [2 14 21 1 5 15 6 17 22 23 16 18 9 11 8] 0.019254 0.019254
Table 6
Comparison between algorithms.
Total Hit ratio Hit ratio Hit ratio Hit ratio Mean Mean cost
hit ratio (%) approach 1 (%) approach 2 (%) 1-day/approach 1 (%) 1-day/ approach 2 (%) runtime (s) cost (RMSE)
NN 74.2 74.8 73.6 45 43.4 20 0.0166
ANFIS-GA 77 76 78 35 38 110.9 0.0062
ANFIS-ICA 86 85 87 40 43 34.2 0.0048
f
f
u
p
t
p
f
G
2
t
s
t
J
p
e
n
b
t
p
n
o
i
unction estimator that adopts the adaptive systems framework to
acilitate learning and adaptation, and ICA, an evolutionary algorithm
sed for subset evaluation. Additionally, the proposed model is ap-
lied on the basis of the technical analysis of Japanese Candlestick by
wo approaches of Signal and Raw databases. In fact, the paper incor-
orates the technique of Japanese Candlestick charts for data trans-
ormation and attribute generation. Finally, daily stock prices for the
eneral Motors Company at New York Stock Exchange from 2000 to
009 are applied for benchmarking.
The root of mean square errors, the number and percentage of
he signals that are predicted correctly are considered as the as-
essment measures while the results show a good reliability of
he model that is even better than the base study and model of
asemi et al. (2011).
In the first approach, all the 15 features together have the best ap-
roximation but in the second approach, feature selection shows its
ffect on the results very well, while in different datasets almost 20
umbers of features are more appropriate. As a matter of fact it is
elieved that the analysis of different features or different subsets of
hem has significant influence on prediction accuracy. The second ap-
roach has a better performance than the first one. Also, it should be
oted that the prediction accuracy of this model is better than some
ther time series models and shows great abilities for decision mak-
ng about stock trading.

9234 S. Barak et al. / Expert Systems With Applications 42 (2015) 9221–9235
Table A1
The complete list of the results.
Raw database Signal database
No. 1 2 3 4 5 6 7 8 No. 1 2 3 4 5 6 7 8
1 58 43 24 22 11 4 162 175 1 47 50 30 22 13 5 167 177
2 47 43 20 13 5 9 137 147 2 40 36 12 7 12 6 113 123
3 73 47 29 19 11 6 185 205 3 92 27 19 8 4 2 152 168
4 71 44 35 19 11 10 190 205 4 64 39 19 12 7 9 150 161
5 35 17 25 13 11 4 105 166 5 47 18 15 11 10 7 108 167
6 44 25 16 11 10 6 112 132 6 54 17 13 10 9 5 108 124
7 46 25 12 14 11 10 118 141 7 56 36 16 17 15 4 144 163
8 46 44 19 12 8 9 138 147 8 43 27 32 20 18 10 150 182
9 49 46 21 21 7 10 154 167 9 80 18 13 7 9 4 131 145
10 55 40 31 10 9 8 153 164 10 101 32 12 9 2 2 158 165
11 69 38 29 20 11 11 178 192 11 65 25 24 14 9 4 141 150
12 56 21 15 10 5 9 116 168 12 33 48 30 15 5 8 139 154
13 46 34 13 23 5 8 129 145 13 59 24 15 13 7 6 124 143
14 54 19 20 15 9 10 127 156 14 51 26 17 14 12 5 125 149
15 50 26 16 19 7 14 132 151 15 49 27 28 20 9 14 147 184
16 53 43 35 16 10 9 166 185 16 75 17 11 8 3 2 116 123
17 64 41 30 13 8 15 171 186 17 93 31 16 12 5 7 164 171
18 20 18 16 11 8 5 78 124 18 33 18 18 17 11 9 106 166
19 57 27 17 15 8 4 128 144 19 41 26 17 20 8 9 121 142
20 107 10 10 4 5 4 140 155 20 50 38 26 15 16 9 154 177
21 62 12 14 9 6 3 106 149 21 38 27 24 14 15 18 136 181
22 65 48 30 14 10 15 182 199 22 48 29 26 11 6 9 129 137
23 28 21 14 9 11 4 87 152 23 56 38 29 9 8 9 149 168
24 50 28 20 8 5 5 116 133 24 59 26 14 12 8 6 125 133
25 51 30 14 12 13 3 123 146 25 41 26 12 13 12 4 108 124
26 52 29 15 10 8 4 118 148 26 47 26 27 14 11 14 139 168
27 50 46 20 20 10 9 155 171 27 42 31 20 14 6 3 116 122
28 65 47 26 16 9 9 172 191 28 102 31 19 11 3 3 169 184
29 68 44 29 18 6 9 174 194 29 65 39 27 12 6 8 157 164
30 61 45 28 17 8 9 168 192 30 53 21 13 15 11 12 125 186
31 52 28 15 7 6 5 113 130 31 67 30 23 23 11 9 163 183
32 58 44 13 16 16 8 155 184 32 62 38 26 17 16 9 168 207
33 55 40 12 15 8 4 134 180 33 43 34 24 25 16 11 153 187
34 59 43 32 13 13 9 169 184 34 101 30 19 16 3 0 169 175
35 64 37 31 17 7 6 162 173 35 121 26 26 11 7 9 200 211
36 26 17 16 13 8 5 85 131 36 75 38 17 16 9 6 161 174
37 53 29 22 14 4 4 126 142 37 107 28 20 14 11 11 191 211
38 51 27 12 13 11 2 116 139 38 61 24 14 17 16 6 138 170
39 54 25 13 13 10 5 120 145 39 53 25 31 22 10 12 153 181
40 69 38 30 10 12 12 171 186 40 63 40 27 20 9 7 166 176
41 29 22 21 15 13 8 108 158 41 70 22 17 9 4 8 130 143
42 64 22 20 15 7 7 135 150 42 68 35 31 17 6 8 165 172
43 49 27 9 11 11 3 110 131 43 57 24 21 13 15 7 137 164
44 55 25 14 12 10 5 115 140 44 46 32 31 23 13 8 153 184
45 19 12 13 10 9 5 68 107 45 57 25 17 13 7 6 125 136
46 60 27 18 14 6 8 133 149 46 55 30 16 19 5 6 131 154
47 52 27 11 12 8 3 113 136 47 56 24 15 4 9 8 126 154
48 49 25 15 17 10 6 122 146 48 45 38 25 15 15 7 145 172
a
1
A
c
3
t
R
A
A
A
Future research directions of the paper include but are not limited
to
1. Combining prediction methods in the framework of fusion models
or optimize the classification algorithms by applying some meta-
heuristics algorithms to improve the prediction results.
2. Predicting the other important variable (in addition to return)
such as liquidity (Barak, Abessi, & Modarres, 2013).
3. Using fundamental features and textual information, in addition
to technical features, in order to have a more comprehensive fea-
tures and to be able to predict long term situation of stocks.
4. Prediction of stocks in other popular stock markets such as DAX
or NASDAQ.
5. Applying statistical feature selection models such as Filter meth-
ods (Huang & Tsai, 2009) and CFS (Zhang et al., 2014), or using
other wrapper models to compare the results.
Acknowledgments
The research was supported by the Operational Programme Edu-
cation for Competitiveness – Project no. CZ.1.07/2.3.00/20.0296 and
lso within the Czech Science Foundation (GACR) project No. 13-
3142S and SP2015/15, and SGS research project of VSB-TU Ostrava.
ppendix A
Table A1: The complete list of the results is presented here. The
olumns 1–6, column 7 and column 8 show the correct signals in 1, 2,
, 4, 5, and 6 day periods, the total number of correct signals and the
otal number of the emitted signals by the system, respectively.
eferences
sadi, S., Hadavandi, E., Mehmanpazir, F., & Nakhostin, M. M. (2012). Hybridization of
evolutionary Levenberg–Marquardt neural networks and data pre-processing forstock market prediction. Knowledge-Based Systems, 35, 245–258.
tashpaz-Gargari, E., & Lucas, C. (2007). Imperialist competitive algorithm: an algo-
rithm for optimization inspired by imperialistic competition. In Proceedings of IEEEcongress on evolutionary computation, CEC 2007 (pp. 4661–4667). IEEE.
tsalakis, G. S., Dimitrakakis, E. M., & Zopounidis, C. D. (2011). Elliott wave theory andneuro-fuzzy systems, in stock market prediction: the WASP system. Expert Systems
with Applications, 38, 9196–9206.

S. Barak et al. / Expert Systems With Applications 42 (2015) 9221–9235 9235
A
B
B
B
B
B
B
C
C
C
C
C
C
C
d
E
G
H
H
H
H
J
J
K
K
K
K
L
L
L
L
L
M
M
M
M
M
P
R
S
S
T
V
W
W
Y
Z
Z
tsalakis, G. S., & Valavanis, K. P. (2009). Surveying stock market forecasting tech-niques – Part II: soft computing methods. Expert Systems with Applications, 36,
5932–5941.agheri, A., Mohammadi Peyhani, H., & Akbari, M. (2014). Financial forecasting using
ANFIS networks with quantum-behaved particle swarm optimization. Expert Sys-tems with Applications, 41, 6235–6250.
arak, S., Abessi, M., & Modarres, M. (2013). Fuzzy turnover rate chance constraintsportfolio model. European Journal of Operational Research, 228, 141–147.
arak, S., & Modarres, M. (2015). Developing an approach to evaluate stocks by forecast-
ing effective features with data mining methods. Expert Systems with Applications,42, 1325–1339.
ezdek, J. C. (1981). Pattern recognition with fuzzy objective function algorithms. KluwerAcademic Publishers.
iabangard-Oskouyi, A., Atashpaz-Gargari, E., Soltani, N., & Lucas, C. (2009). Applica-tion of imperialist competitive algorithm for materials property characterization
from sharp indentation test. International Journal of Engineering Simulation, 10, 11–
12.isoi, R., & Dash, P. K. (2014). A hybrid evolutionary dynamic neural network for stock
market trend analysis and prediction using unscented Kalman filter. Applied SoftComputing, 19, 41–56.
ervelló-Royo, R., Guijarro, F., & Michniuk, K. (2015). Stock market trading rule basedon pattern recognition and technical analysis: forecasting the DJIA index with in-
traday data. Expert Systems with Applications, 42, 5963–5975.
hang, P.-C., & Liu, C.-H. (2008). A TSK type fuzzy rule based system for stock priceprediction. Expert Systems with Applications, 34, 135–144.
havarnakul, T., & Enke, D. (2008). Intelligent technical analysis based equivolumecharting for stock trading using neural networks. Expert Systems with Applications,
34, 1004–1017.hen, Y.-S., & Cheng, C.-H. (2012). A soft-computing based rough sets classifier for clas-
sifying IPO returns in the financial markets. Applied Soft Computing, 12, 462–475.
hen, Y., Mabu, S., Shimada, K., & Hirasawa, K. (2009). A genetic network programmingwith learning approach for enhanced stock trading model. Expert Systems with Ap-
plications, 36, 12537–12546.hiang, W.-C., Urban, T. L., & Baldridge, G. W. (1996). A neural network approach to
mutual fund net asset value forecasting. Omega, 24, 205–215.rone, S. F., & Kourentzes, N. (2010). Feature selection for time series prediction – a
combined filter and wrapper approach for neural networks. Neurocomputing, 73,
1923–1936.o Prado, H. A., Ferneda, E., Morais, L. C., Luiz, A. J., & Matsura, E. (2013). On the ef-
fectiveness of Candlestick Chart Analysis for the Brazilian Stock Market. ProcediaComputer Science, 22, 1136–1145.
sfahanipour, A., & Aghamiri, W. (2010). Adapted neuro-fuzzy inference system on in-direct approach TSK fuzzy rule base for stock market analysis. Expert Systems with
Applications, 37, 4742–4748.
argari, E. A., Hashemzadeh, F., Rajabioun, R., & Lucas, C. (2008). Colonial competitivealgorithm: a novel approach for PID controller design in MIMO distillation column
process. International Journal of Intelligent Computing and Cybernetics, 1, 337–355.afezi, R., Shahrabi, J., & Hadavandi, E. (2015). A bat-neural network multi-agent sys-
tem (BNNMAS) for stock price prediction: case study of DAX stock price. AppliedSoft Computing, 29, 196–210.
uang, C.-J., Yang, D.-X., & Chuang, Y.-T. (2008). Application of wrapper approach andcomposite classifier to the stock trend prediction. Expert Systems with Applications,
34, 2870–2878.
uang, C.-L., & Tsai, C.-Y. (2009). A hybrid SOFM-SVR with a filter-based feature selec-tion for stock market forecasting. Expert Systems with Applications, 36, 1529–1539.
uang, J., Cai, Y., & Xu, X. (2007). A hybrid genetic algorithm for feature selection wrap-per based on mutual information. Pattern Recognition Letters, 28, 1825–1844.
ang, J.-S. (1993). ANFIS: adaptive-network-based fuzzy inference system. IEEE Transac-tions on Systems, Man and Cybernetics, 23, 665–685.
asemi, M., Kimiagari, A. M., & Memariani, A. (2011). A modern neural network model
to do stock market timing on the basis of the ancient investment technique ofJapanese Candlestick. Expert Systems with Applications, 38, 3884–3890.
abir, M., & Islam, M. (2010). A new wrapper feature selection approach using neuralnetwork. Neurocomputing, 73, 3273–3283.
ar, S., Das, S., & Ghosh, P. K. (2014). Applications of neuro fuzzy systems: a brief reviewand future outline. Applied Soft Computing, 15, 243–259.
hoshnevisan, B., Bolandnazar, E., Barak, S., Shamshirband, S., Maghsoudlou, H.,Altameem, T.A., & Gani, A. (2015). A clustering model based on an evolutionary
algorithm for better energy use in crop production. Stochastic EnvironmentalResearch and Risk Assessment.
ohavi, R., & John, G. H. (1997). Wrappers for feature subset selection. Artificial Intelli-gence, 97, 273–324.
awrence, S., Giles, C. L., & Tsoi, A. C. (1997). Lessons in neural network training: over-
fitting may be harder than expected. In Proceedings of AAAI/IAAI (pp. 540–545).CiteSeer.
ee, K., & Jo, G. (1999). Expert system for predicting stock market timing using a can-dlestick chart. Expert Systems with Applications, 16, 357–364.
in, X., Yang, Z., & Song, Y. (2011). Intelligent stock trading system based on improvedtechnical analysis and Echo State Network. Expert Systems with Applications, 38,
11347–11354.
u, T.-H. (2014). The profitability of candlestick charting in the Taiwan stock market.Pacific-Basin Finance Journal, 26, 65–78.
u, T.-H., Shiu, Y.-M., & Liu, T.-C. (2012). Profitable candlestick trading strategies—theevidence from a new perspective. Review of Financial Economics, 21, 63–68.
ajhi, R., Panda, G., & Sahoo, G. (2009). Development and performance evaluation ofFLANN based model for forecasting of stock markets. Expert Systems with Applica-
tions, 36, 6800–6808.
aldonado, S., & Weber, R. (2009). A wrapper method for feature selection using sup-port vector machines. Information Sciences, 179, 2208–2217.
enkhoff, L. (2010). The use of technical analysis by fund managers: international evi-dence. Journal of Banking & Finance, 34, 2573–2586.
in, J. H., & Lee, Y.-C. (2005). Bankruptcy prediction using support vector machine withoptimal choice of kernel function parameters. Expert Systems with Applications, 28,
603–614.
ozaffari, L., Mozaffari, A., & Azad, N. L. (2015). Vehicle speed prediction via a sliding-window time series analysis and an evolutionary least learning machine: a case
study on San Francisco urban roads. Engineering Science and Technology, 18, 150–162.
atel, J., Shah, S., Thakkar, P., & Kotecha, K. (2015). Predicting stock market index usingfusion of machine learning techniques. Expert Systems with Applications, 42, 2162–
2172.
ajabioun, R., Atashpaz-Gargari, E., & Lucas, C. (2008). Colonial competitive algorithmas a tool for Nash equilibrium point achievement. In Proceedings of the computa-
tional science and its applications, ICCSA 2008 (pp. 680–695). Springer.arkheyli, A., Zain, A. M., & Sharif, S. (2015). Robust optimization of ANFIS based on a
new modified GA. Neurocomputing, 166, 357–366.epehri Rad, H., & Lucas, C. (2008). Application of imperialistic competition algorithm
in recommender systems. In Proceedings of the 13th international CSI computer con-
ference (CSICC’08). Kish Island, Iran.sai, C.-F., & Hsiao, Y.-C. (2010). Combining multiple feature selection methods for stock
prediction: union, intersection, and multi-intersection approaches. Decision Sup-port Systems, 50, 258–269.
airappan, C., Tamura, H., Gao, S., & Tang, Z. (2009). Batch type local search-based adap-tive neuro-fuzzy inference system (ANFIS) with self-feedbacks for time-series pre-
diction. Neurocomputing, 72, 1870–1877.ang, A., An, N., Chen, G., Li, L., & Alterovitz, G. (2015). Accelerating wrapper-based
feature selection with K-nearest-neighbor. Knowledge-Based Systems, 83, 81–91.
en, Q., Yang, Z., Song, Y., & Jia, P. (2010). Automatic stock decision support systembased on box theory and SVM algorithm. Expert Systems with Applications, 37, 1015–
1022.unos, Z. M., Shamsuddin, S. M., & Sallehuddin, R. (2008). Data modeling for Kuala
Lumpur Composite Index with ANFIS. In Proceedings of the second Asia internationalconference on modeling & simulation, AICMS’08 (pp. 609–614). IEEE.
hang, X., Hu, Y., Xie, K., Wang, S., Ngai, E., & Liu, M. (2014). A causal feature selection
algorithm for stock prediction modeling. Neurocomputing, 142, 48–59.hu, Y., & Zhou, G. (2009). Technical analysis: an asset allocation perspective on the use
of moving averages. Journal of Financial Economics, 92, 519–544.