
Windows based graphical tool for symmetrical components analysis
6
National Power & Energy Conference (PECon) 2004 Proceedings, Kuala Lumpur, Malaysia ‘25 Windows Based Graphical Tool For Symmetrical Components Analysis Zainuddin Mat Isa and Marizan Sulaiman ALsirucr-A new windows based graphical tool to facilitate the teaching and learning the symmetrical components analysis is described in this paper. This software provides a user-friendly environment to aid the studies of symmetrical components. The software calculates and disptays graphically the ABC sequence and the corresponding phasors of symmetrical components. Taking the advantages of the Graphical User Interface (CUI), it provides the student with Interactive visual communication to analyze and better understand the relationship between the ABC sequence and symmetrical components. Students can manipdate the graphical displays either using keyboard input or mouse operation. Besides, students can ’ use this tool to analyze the unsymmetrical short circuit fault currents. It is hoped that this tool will make the learning process mote interactive, interesting and user’friendly. Keywords: Graphical User Interface (GUI), Teaching and Learning, Symmetrical Components, Fault Analysis, Phasor Representation. I, INTRODUCTION A Graphical User Interface (CUI) would better enable the students to visualize the effect of parameter changes on the power system being studied. The GUI environment keeps most of the tedious and repetitive calculations in the background, allowing the students to spend more time to analyze the results obtained. Therefore, many power system analysis software have been developed [ 1:2] by taking the advantages of GUI. The objective of this- project is to develop an educational tool for the analysis of symmetrical components. This software provides an interactive and user-friendly environment. In this package, the phasors can be graphically manipulated either using a mouse or manually edited by entering numerical values through the keyboard, Using this software, sfudents will be able to see the relationship between phase sequences and sequence components and the different between line-to- neural and line-to-line types of phasors. This interactive and compreliensive software. supplements and enhances Zainuddin Mat Isa is with Faculty of Electrical Engineering, Kolej Universiti Teknikal Kebangsaan Malaysia (email: zainuddin~kulktii.cdu.mv). Marizan Sulaiman is Profesor with Faculty of Electrical Engineering,Kolej Universiti Teknikal Kebangsaan Malaysia (email: mariznn~kutkm.edu.n~v~. the leaming process in the classroom, as well as in the students’ self-study. 11. SYMMETRICAL COMPONENTS A set of unbalanced phasors can be represented by three sets of batanced phasor components called positive-sequence, negative-sequence, and zero- sequence. The two of the com onent sets (positive and is in phase (according to Fortescue’s theorem) [ 1-51, Figure f illustrates the thee sets of balanced phasors. IdeaIly, the positive-sequence set is the onIy one present during balanced operation. The presence of negative-sequence and zero-sequence components indicates unbalanced operation of the power system during faults. All three-phase quantities in a power system can be represented by the sum of the symmetricai components. For example, the phase volteges can be expressed in terms of their symmetrical components, as given by Equations (I), (2), and (3). negative) are displaced by 120 ! and the other set (zero) v, = Val3 + v,, + v,, (1) vb=vbO+vbl +Vb2 (2) v, = v, + v,, -k Vcl (3) Using the “a” operator (a = 1L120°), the phase quantities can be express in terms of the A-phase components, given in-ihe matrix form in Equations (4). Fig. I. Positive-Sequence, Negative-Sequence, and Zcro- Sequence Components 0-7803-8724-4/04/$20.00 02004 IEEE,
Transcript of Windows based graphical tool for symmetrical components analysis
National Power & Energy Conference (PECon) 2004 Proceedings, Kuala Lumpur, Malaysia ‘25
Windows Based Graphical Tool For Symmetrical Components Analysis
Zainuddin Mat Isa and Marizan Sulaiman
ALsirucr-A new windows based graphical tool to facilitate the teaching and learning the symmetrical components analysis is described in this paper. This software provides a user-friendly environment to aid the studies of symmetrical components. The software calculates and disptays graphically the ABC sequence and the corresponding phasors of symmetrical components. Taking the advantages o f the Graphical User Interface (CUI), it provides the student with Interactive visual communication to analyze and better understand the relationship between the ABC sequence and symmetrical components. Students can manipdate the graphical displays either using keyboard input or mouse operation. Besides, students can ’ use this tool to analyze the unsymmetrical short circuit fault currents. It is hoped that this tool will make the learning process mote interactive, interesting and user’friendly.
Keywords: Graphical User Interface (GUI), Teaching and Learning, Symmetrical Components, Fault Analysis, Phasor Representation.
I, INTRODUCTION
A Graphical User Interface (CUI) would better enable the students to visualize the effect of parameter changes on the power system being studied. The GUI environment keeps most of the tedious and repetitive calculations in the background, allowing the students to spend more time to analyze the results obtained. Therefore, many power system analysis software have been developed [ 1:2] by taking the advantages o f GUI.
The objective o f this- project is to develop an educational tool for the analysis of symmetrical components. This software provides an interactive and user-friendly environment. In this package, the phasors can be graphically manipulated either using a mouse or manually edited by entering numerical values through the keyboard, Using this software, sfudents will be able to see the relationship between phase sequences and sequence components and the different between line-to- neural and line-to-line types of phasors. This interactive and compreliensive software. supplements and enhances
Zainuddin Mat Isa i s with Faculty of Electrical Engineering, Kolej Universiti Teknikal Kebangsaan Malaysia (email: zainuddin~kulktii.cdu.mv). Marizan Sulaiman is Profesor with Faculty of Electrical Engineering,Kolej Universiti Teknikal Kebangsaan Malaysia (email: mariznn~kutkm.edu.n~v~.
the leaming process in the classroom, as well as in the students’ self-study.
11. SYMMETRICAL COMPONENTS
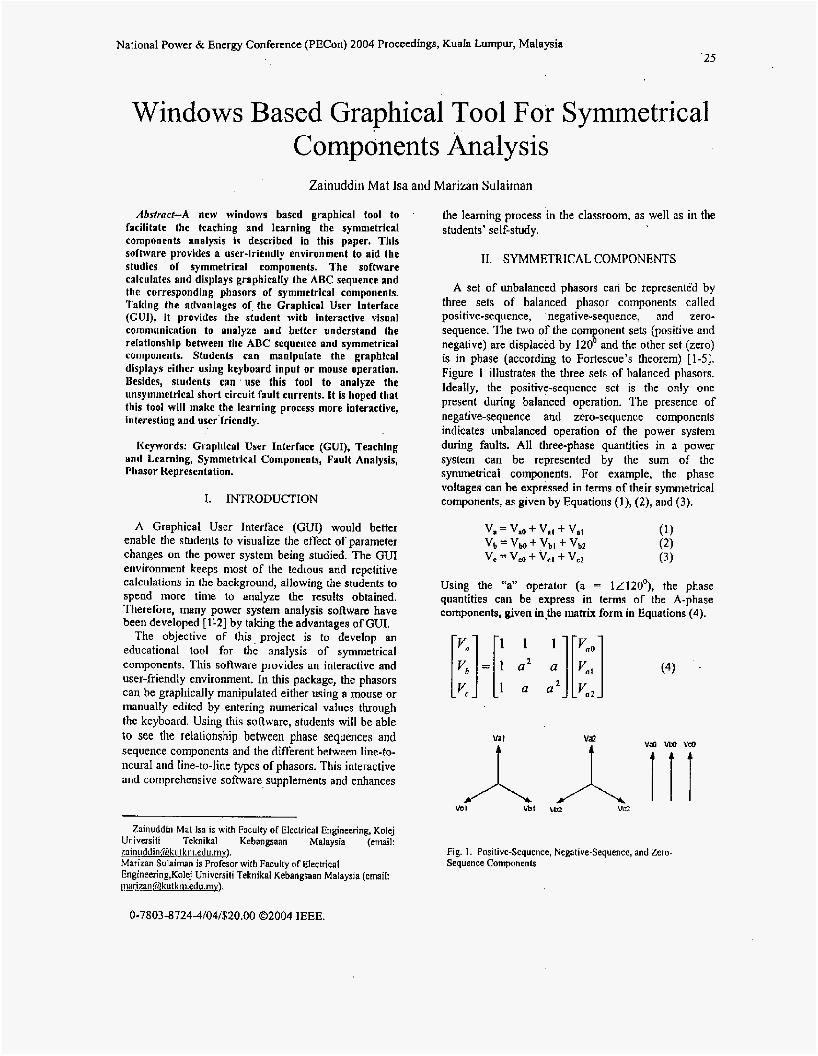
A set of unbalanced phasors can be represented by three sets of batanced phasor components called positive-sequence, negative-sequence, and zero- sequence. The two of the com onent sets (positive and
is in phase (according to Fortescue’s theorem) [ 1-51, Figure f illustrates the thee sets of balanced phasors. IdeaIly, the positive-sequence set i s the onIy one present during balanced operation. The presence of negative-sequence and zero-sequence components indicates unbalanced operation of the power system during faults. All three-phase quantities in a power system can be represented by the sum of the symmetricai components. For example, the phase volteges can be expressed in terms o f their symmetrical components, as given by Equations (I) , (2), and (3).
negative) are displaced by 120 ! and the other set (zero)
v, = Val3 + v,, + v,, (1) vb=vbO+vbl + V b 2 (2) v, = v, + v,, -k Vcl (3)
Using the “a” operator (a = 1L120°), the phase quantities can be express in terms of the A-phase components, given in-ihe matrix form in Equations (4).
Fig. I . Positive-Sequence, Negative-Sequence, and Zcro- Sequence Components
0-7803-8724-4/04/$20.00 02004 IEEE,
Solving for the inverse of the matrix in Equations (4), the sequences voltages can be expressed as follows:
V, = 113 (V, + V, +VJ
Val = 1/3 (V, + a Vb + a2 V,)
vn = 113 (v, + a‘ vb + a v,)
( 5 )
(6)
(7) r
or in matrix form:
These equations show how to resolve the three unsymmetrical phasor into their symmetrical components. The proceeding equations could have been written for any set of related phasor such a5 for currents instead of for voltages. Phase and sequence currents in the matrix form can be expressed as:
111. DESCRIPTION OF THE SOFTWARE
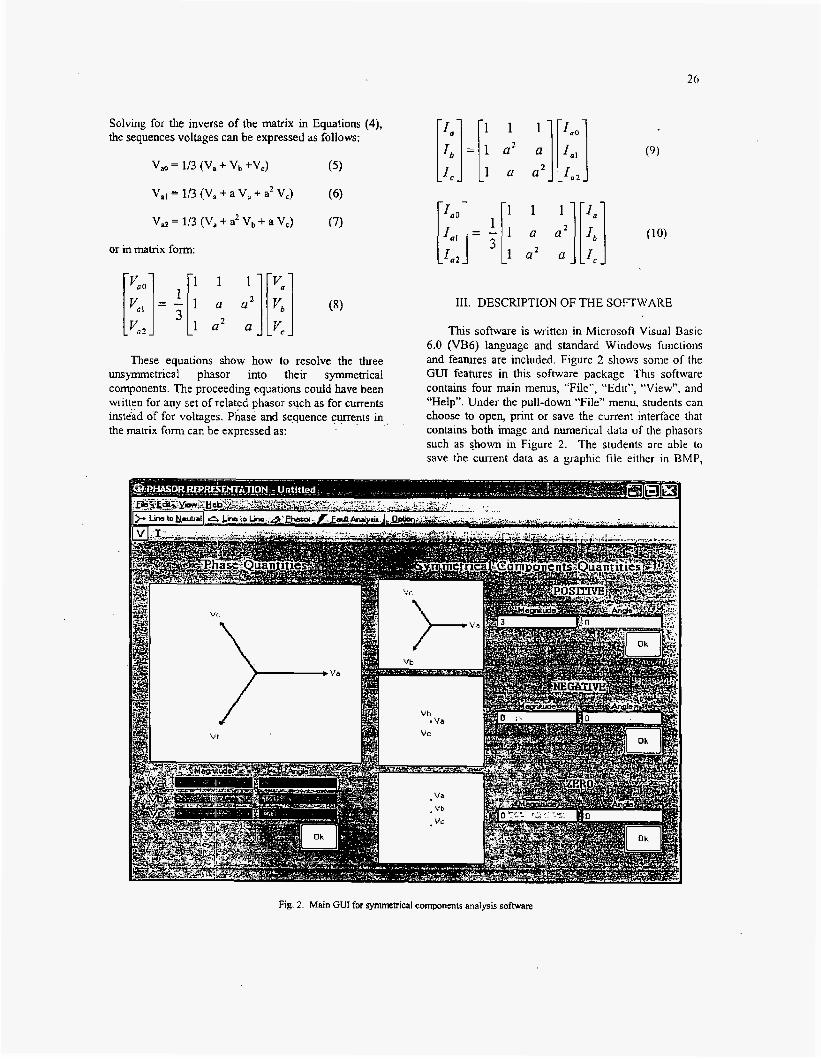
Tlus software is written in Microsoft Visual Basic 6.0 (VB6) language and standard Windows functions and features are included, Figure 2 shows some of the GUI features in this software package. This software contains four main menus, “File”, “Edit”, “View”, and “Help”. Under the pull-down “File” menu, students can choose to open, print or save the current interface that contains both image and numerical data of the phasors such as shown in Figure 2. The students are able to save the current data as a graphic file either in BMP,
fig. 2. Main GUI for symmetrical components analysis software
27
JPG or .CIF format or keep it as a data file (DAT) for future reference. In addition, the particular interface or data can be copied into other programs such as Microsoft Words and Paint using standard cut,*copy and paste functions under the “Edit” menu. This will help students to document the exercises done.
Under the “View” menu, students can select line- to-neutral, line-to-line, or phasor addition of the symmetrical component options. Under these three options, students can also select the subs-menu ‘V’ or ‘I’ to view the relationship between voltages or currents for the corresponding symmetrical components. AH these options allow them to graphicalIy examine the characteristics of the symmetrical components in the line-to-neutral or the respective line-to-line format for
Fig. 4. The effect of varying the value of negative-sequence componcnt
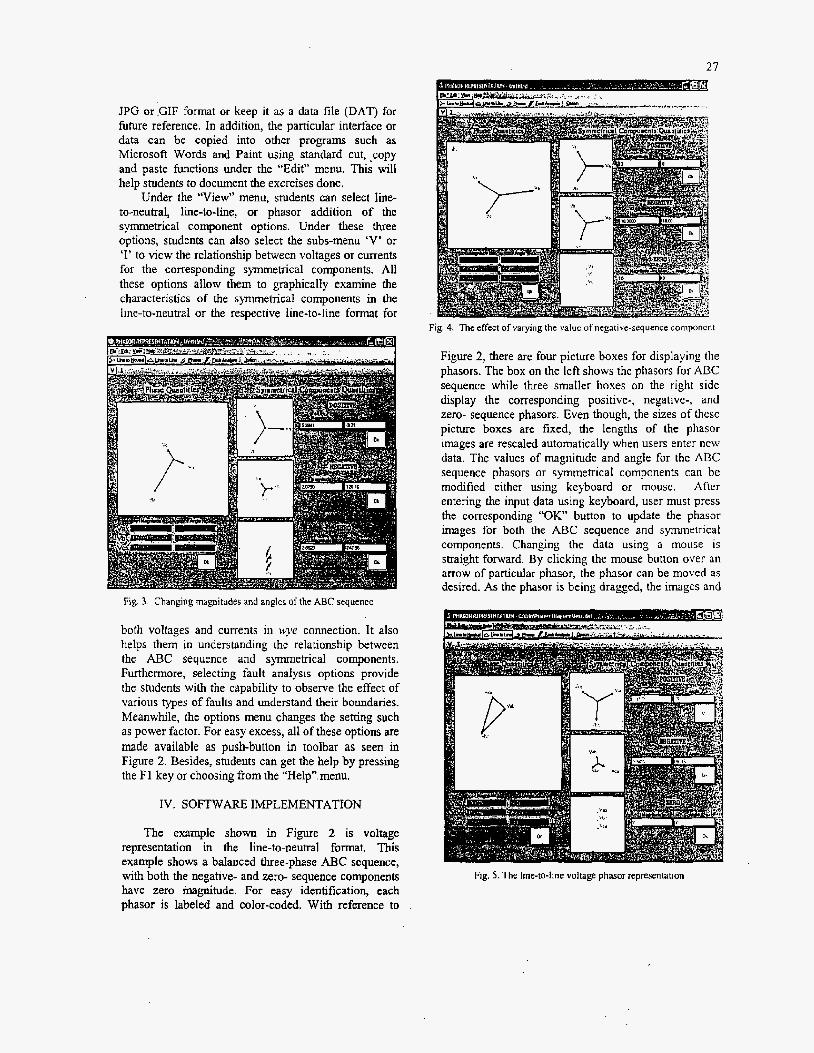
Fig. 3. Changing magnitudes and angles of the ABC sequence
both voltages and currents in y e connection. It also helps them in understanding the relationship between the ABC sequence and symmetrical components. Furthermore, selecting fault analysis options provide the students with the capability to observe the effect of various types of faults and understand their boundaries. Meanwhile, the options menu changes the setting such as power factor. For easy excess, all of these options are made available as push-button in toalbar as seen in Figure 2. Besides, students can get the help by pressing the F1 key or choosing from the “Help”.menu.
IV. SOFTWARE IMPLEMENTATION
The example shown in Figure 2 is voltage representation in the line-to-neuiral format. This example shows a balanced three-phase AJ3C sequence, with both the negative- and zero- sequence components have zero inagnitude. For easy identification, each phasor is labeled and color-coded. With reference to
Figure 2, there are four picture boxes for displaying the phasors. The box on the left shows the phasors for ABC sequence while three smaller boxes on the right side display the corresponding positive-, negative-, and zero- sequence phasors. Even though, the sizes of these picture boxes are fixed, the lengths of the phasor images are rescaled automatically when users enter new data. The values of magnitude and angle for the ABC sequence phasors or symmetrical components can be modified either using keyboard or mouse. After entering the input data using keyboard, user must press the corresponding “OK” button to update the phasor images for both the ABC sequence and symmetrical components. Changing the data using a mouse is straight forward. By clicking the mouse button over an arrow of particular phasor, the phasor can be moved as desired. As the phasor is being dragged, the images and
Fig. 5. The line-to-line voltage phasor representation
28
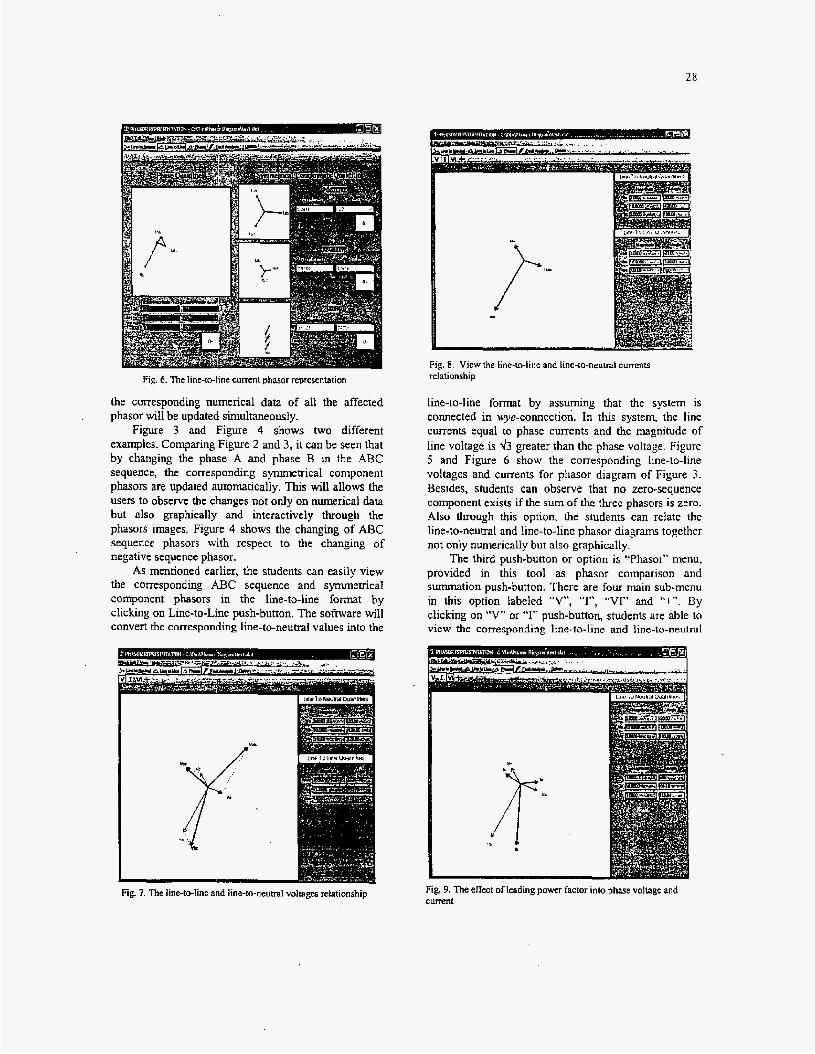
Fig. 6. The line-to-line current phasor representation
the corresponding numerical data of all the affected phasor will be updated simultaneously.
Figure 3 and Figure 4 shows two different examples. Comparing Figure 2 and 3, it can be seen that by changing the phase A and phase B in the ABC sequence, the corresponding symmetrical component phasors are updated automatically. This will allows the users to observe the changes not only on numerical data but also graphically and interactively through the phasors images. Figure 4 shows the changing o f ABC sequence phasors with respect to the changing of negative sequence phasor.
As mentioned earlier, the students can easily view the corresponding ABC sequence and symmetrical component phasors in the line-to-line format by clicking on Line-to-Line push-button. The sofhKare will convert the corresponding line-to-neutral values into the
Fig. 7. The line-to-line and line-to-neutral voltages relationship
Fig. 8. View the line-lo-line and he-to-neutral currents relationship
line-to-line format by assuming that the system is connected in ye-connection. In this system, the line currents equal to phase currents and the magnitude of line voltage is 43 greater than the phase voltage. Figure 5 and Figure 6 show the corresponding line-to-line voltages and currents for phasor diagram of Figure 3. Besides, students can observe that no zero-sequence component exists if the sum of the three phasors is zero. Also through this option, the students can relate the line-to-neutral and line-to-line phasor diagrams together not only numerically but also graphically.
The third push-button or option is “Phasor” menu, provided in this tool as phasor comparison and summation push-button. There are four main sub-menu
clicking on “V” or “I” push-button, students are able to view the corresponding line-to-line and line-to-neutral
in this option labeled “V”, “I”, “VI” and “+”. BY
Fig. 9. The effect of leading p o w factor into phase voltage and current
29
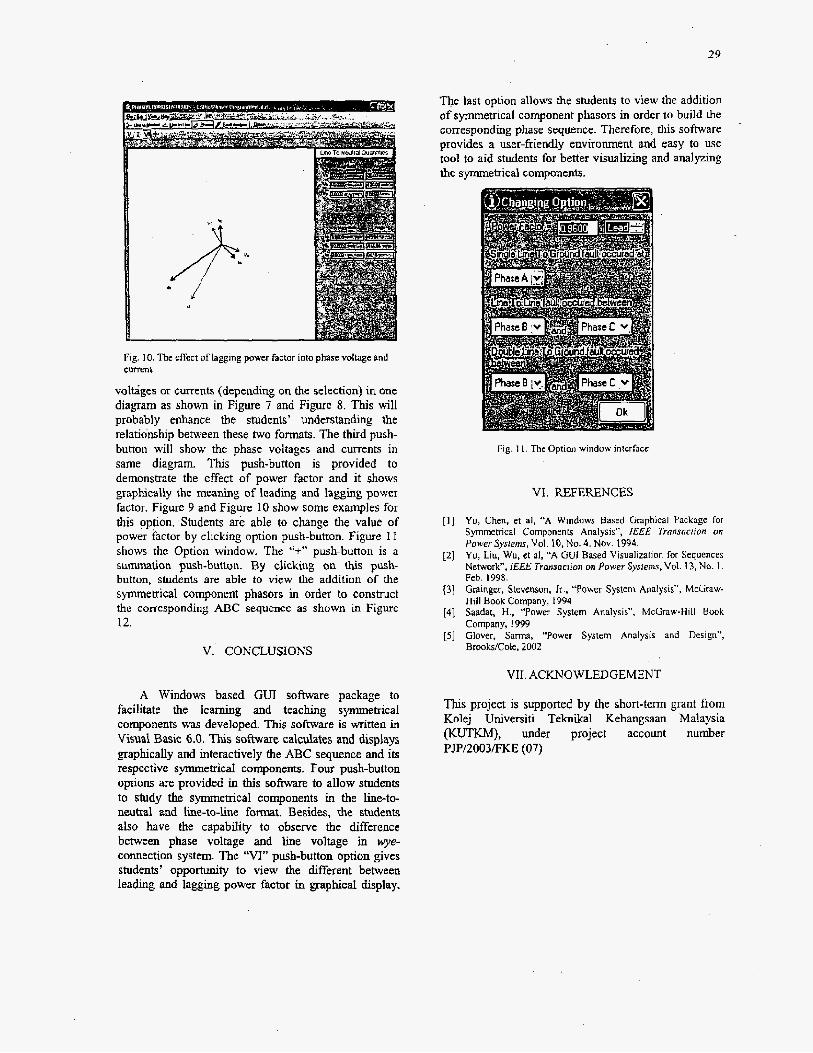
Fig. 10. The effect of lagging power factor into phase voltage and
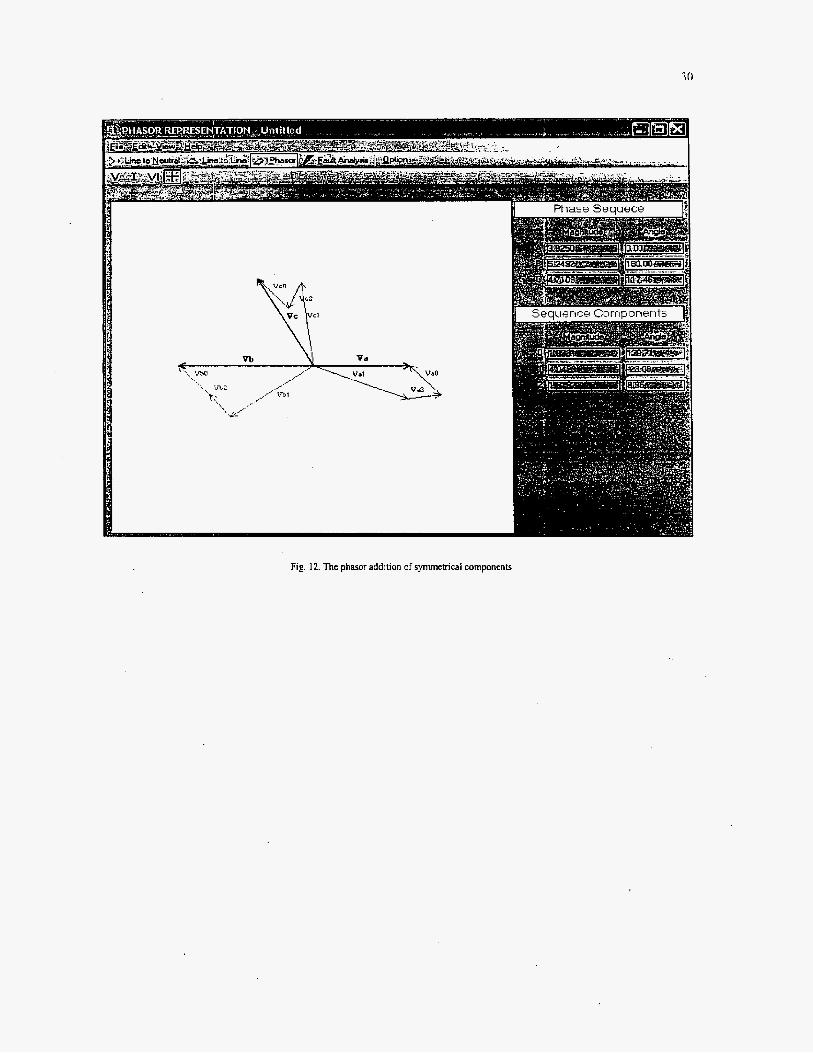
valGges or currents (depending on the selection) in one diagram as shown in Figure 7 and Figure 8. This will probably enhance the students’ understanding the relationship between these iwo formats. The third push- button will show the phase voltages and currents in same diagram. This push-button is provided to demonstrate the effect of power factor and it shows graphically the meaning of leading and lagging power factor. Figure 9 and Figure 10 show some examples for this option. ‘Students are able to change the value of power factor by clicking option push-button. Figure 1 I shows the Option window, The “+” push-button is a summation push-button. By clicking on this push- button, students are able to view the addition of the symmetrical component phasors in order to construct the corresponding ABC sequence as shown in Figure 12.
current
V. CONCLUSIONS
A Windows based GUI software package to facilitate the learning and teaching symmetrical components was developed. This software i s written in Visual Basic 6.0. This software calculates and displays graphically and interactively the ABC sequence and its respective sy”etrica1 components. Four push-button options are provided in ibis sohare to allow students to study the symmetrical components in the line-to- neutral and line-to-line format. Besides, the students also have the capability to observe the difference between phase voltage and line voltage in wye- connection system The “VI” push-button option gives students’ opportunity to view the different between leading and lagging power factot in graphical display.
The last option allows the students to view the addition of symmetrical component phasors in order to build the corresponding phase sequence. Therefore, this software provides a user-friendly environment and easy to use tool to aid students for better visualizing and analyzing the symmetrical components.
Fig. 1 I . The Option window inlerface
VI. REFERENCES
Yu, Chen, et al, “A Windows Based Graphical Packagc lor Symmetrical Components Analysis”, lEEE Trnnvnclian on PowerSyr~ems, Vol. 10, No. 4. Nov. 1994. Yu, Liu. Wu, et al, “A GUI Based Visualizalion for Sequences Network”. IEEE Tmnsaclion on Power Syrlemr. Vol. 13, No. I . Feb. 1998. Grainger, Stevenson, It., “Power System Analysis”, McGraw- Hill Book Company, 1994 Saadat, H. , “Power System Analysis”. McGraw-Hill Book Company, 1999 Glover, Sarma, “Power System Analysis and Design”, BrooksiCote, 2002
VIL ACKNOWLEDGEMENT
This project is supported by the short-term grant from Kolej Universiti Teknikal Kebangsaan Malaysia (KUTKM), under project account number PJP/2003/FKE (07)
30
Fig. 12. The phasor addition of symmetrical components


![[GSW] Windows - Stata](https://static.fdokumen.com/doc/165x107/63274b65051fac18490e2cc7/gsw-windows-stata.jpg)

