Food consumption patterns of adolescents aged 14–16 years ...

White Matter in Aging and Cognition: A Cross-sectional Study ofMicrostructure in Adults Aged Eighteen to Eighty-Three
Barbara B. Bendlin1,2, Michele E. Fitzgerald1,2, Michele L. Ries1,2, Guofan Xu1,2, Erik K.Kastman1,2, Brent W. Thiel1,2, Howard A. Rowley3, Mariana Lazar4, Andrew L.Alexander5,6,7, and Sterling C. Johnson1,21Geriatric Research Educational and Clinical Center, William S. Middleton Memorial VeteransHospital, Madison, WI, USA2University of Wisconsin School of Medicine and Public Health, Department of Medicine, Madison,WI, USA3University of Wisconsin School of Medicine and Public Health, Department of Radiology, Madison,WI, USA4New York University School of Medicine, Department of Radiology, New York, NY, USA5University of Wisconsin School of Medicine and Public Health, Department of Medical Physics,Madison, WI, USA6University of Wisconsin School of Medicine and Public Health, Department of Psychiatry, Madison,WI, USA7Waisman Laboratory for Brain Imaging and Behavior, Madison, WI, USA
AbstractStructural brain change and concomitant cognitive decline are the seemingly unavoidable escorts ofaging. Despite accumulating studies detailing the effects of age on the brain and cognition, therelationship between white matter features and cognitive function in aging have only recentlyreceived attention and remain incompletely understood. White matter microstructure can bemeasured with diffusion tensor imaging (DTI), but whether DTI can provide unique information onbrain aging that is not explained by white matter volume is not known. In the current study, therelationship between white matter microstructure, age and neuropsychological function was assessedusing DTI in a statistical framework that employed white matter volume as a voxel-wise covariatein a sample of 120 healthy adults across a broad age range (18–83). Memory function and executivefunction were modestly correlated with the DTI measures while processing speed showed the greatestextent of correlation. The results suggest that age-related white matter alterations underlie age-relateddeclines in cognitive function. Mean diffusivity and fractional anisotropy in several white matterbrain regions exhibited a non-linear relationship with age, while white matter volume showed aprimarily linear relationship with age. The complex relationships between cognition, white mattermicrostructure, and white matter volume still require further investigation.
IntroductionThe structural brain changes and accompanying cognitive changes that occur with aging areincompletely understood. Though early cell count studies in neocortex suggested that normal
Corresponding author: Sterling C. Johnson, Ph.D., William S. Middleton Memorial VA Hospital, 2500 Overlook Terrace (11G), GRECC,Madison, WI, 53705, USA. Phone: 608-256-1901 x 11946; Fax: 608-280-7165, [email protected].
NIH Public AccessAuthor ManuscriptDev Neuropsychol. Author manuscript; available in PMC 2011 May 1.
Published in final edited form as:Dev Neuropsychol. 2010 May ; 35(3): 257–277. doi:10.1080/87565641003696775.
NIH
-PA Author Manuscript
NIH
-PA Author Manuscript
NIH
-PA Author Manuscript

aging was accompanied by extensive neuronal loss (H. Brody, 1955; H. Brody, 1970; Devaney& Johnson, 1980; Henderson, Tomlinson, & Gibson, 1980), recent evidence suggests the lossis significantly less dramatic than previously thought (Pakkenberg & Gundersen, 1997; Terry,DeTeresa, & Hansen, 1987). Age related volume decline appears to be a consequence ofadditional factors that include changes in synaptic density (Masliah, Mallory, Hansen,DeTeresa, & Terry, 1993), shrinkage of neurons (Terry et al., 1987), and white matter decline(Tang, Nyengaard, Pakkenberg, & Gundersen, 1997). Several recent studies using magneticresonance imaging support the notion that age-related white matter change is especially relatedto age-associated cognitive change — including volumetric studies (Brickman et al., 2006;Paul et al., 2007), studies of white matter hyperintensities, evident as signal change on T2weighted imaging (Au et al., 2006; Baum, Schulte, Girke, Reischies, & Felix, 1996; de Grootet al., 2000; Gunning-Dixon & Raz, 2003; Raz, Rodrigue, Kennedy, & Acker, 2007), andstudies employing diffusion tensor imaging (DTI) to assess age-related microstructuralchanges in white matter function (Charlton et al., 2006; Deary et al., 2006; Grieve, Williams,Paul, Clark, & Gordon, 2007; O'Sullivan et al., 2001; Persson et al., 2006; Shenkin et al.,2005).
Diffusion tensor imaging (DTI) is sensitive to the random, diffusion-driven displacements ofmolecules, providing the capability to investigate tissue structure at a microscopic scale(Basser, 1995; Basser & Pierpaoli, 1996). Two typically reported indices derived fromdiffusion weighted imaging are mean diffusivity (MD), a measure of the overall displacementof water molecules during a specific time interval, and fractional anisotropy (FA), a measureof the directionality of diffusion. With aging, white matter MD tends to increase, and FA tendsto decrease (Abe et al., 2002; Engelter, Provenzale, Petrella, DeLong, & MacFall, 2000;Pfefferbaum et al., 2000; Salat et al., 2005). This pattern has been reported in multiple brainareas, with several studies supporting an anterior to posterior gradient of change in aging (Headet al., 2004; Pfefferbaum, Adalsteinsson, & Sullivan, 2005; Sullivan, Adalsteinsson, &Pfefferbaum, 2006; Yoon, Shim, Lee, Shon, & Yang, 2007).
A typical method of DTI analysis uses a region of interest (ROI) approach where specific brainstructures are traced and diffusion values are extracted. While ROI methods have the advantageof data sampling from white matter tracts in the native space of the individual, the effects ofage are diffuse and it may be beneficial to evaluate all white matter tracts simultaneously.Voxel-wise analyses of brains in a common stereotactic space provide the opportunity to assessthe relationship between cognition and white matter microstructure over the entire brain,without restricting analyses to predefined ROIs. This is particularly appealing in studies ofwhite matter because there are fewer discrete boundaries or landmarks, and thus some (thoughcertainly not all) white matter ROIs can be somewhat arbitrary. For example, using voxel-wiseanalysis of fractional anisotropy maps as opposed to ROI based methods, Grieve et al. (Grieveet al., 2007) found a relationship between executive function and FA in frontal white matter,but also found unexpected relationships with parietal white matter and fibers projecting to thethalamus.
Although DTI measures are purported to reflect the microstructural properties of tissue, brainvolume may confound DTI results and make it difficult to interpret diffusion changes asrepresenting a measure above and beyond the effects of atrophy. One solution to this problemis to employ an integrated approach that statistically accounts for multiple imaging modalitiesin addition to cognitive and demographic variables (Casanova et al., 2007; Oakes et al.,2007). An integrated approach allows testing of more sophisticated models of brain aging, andbetter characterization of the relative contribution of differing imaging modalities to brain andcognitive aging.
Bendlin et al. Page 2
Dev Neuropsychol. Author manuscript; available in PMC 2011 May 1.
NIH
-PA Author Manuscript
NIH
-PA Author Manuscript
NIH
-PA Author Manuscript

In the current study, the relationship between white matter microstructure and function in agingwas evaluated using a cross-sectional design in a large group of adults spanning in age fromearly to late adulthood. We employed an integrated approach that allowed us to examinemicrostructural white matter alterations that were independent of white matter volume loss ona voxel by voxel basis using the Biological Parametric (BPM) toolbox (Casanova et al.,2007). We hypothesized that tests that are typically considered measures of executive functionwould be related to the integrity of frontal white matter tracts. Tests of memory, wehypothesized, would be related to temporal white matter microstructure. However, because theeffects of age are diffuse, a voxel-wise approach was adopted to examine the relationshipbetween age, cognition, and white matter microstructure over the entire brain.
MethodsParticipants
Three hundred and nine healthy non-patient participants were recruited and receivedneuropsychological testing and MRI brain scanning as part of ongoing studies of aging,traumatic brain injury, and Alzheimer’s disease (AD). In order to limit our analyses tocognitively normal participants, 32 individuals were excluded based on one or more scoresthat fell one standard deviation below the mean or more on a test of memory and/or executivefunction, reducing our sample to 277 participants. Our lab recruits and attracts a high numberof participants between the ages of 40 and 65 with parental family history of Alzheimer’sdisease (a risk factor for AD). In order to ensure that our sample reflected a normally agingpopulation, we attempted to match the prevalence of family history and presence of ApoE ε4in these participants to the prevalence of these risk factors in the general population. Currently,there are no published prevalence estimates for parental family history of AD; so family historyprevalence in our sample was matched to reported prevalence rates of AD in individuals 65years of age and older (Evans et al., 1989), approximately 10% of the population. Participantswith reported and or confirmed family history of AD were removed from the sample using theRAND function in Microsoft Excel until only 10% of the participants had a confirmed orreported positive family history. The allele frequency of ApoE ε4 differs drastically dependingon the population studied (Corbo & Scacchi, 1999); based on those participants for whomgenetic data was available, our sample contained a 17% allelic frequency of ApoE ε4 followingadjustment for family history of AD. This prevalence of ε4 is similar to that found in Northerncountries of Western Europe (Lucotte, Loirat, & Hazout, 1997).
Removing people with a positive family history reduced our sample from 277 to 223participants. These two-hundred and twenty-three participants [89 males/134 females, (206Caucasian, 8 African American, 5 Asian, 2 Hispanic, 2 Other), mean age = 49.62 years, (SD= 15.12); age by decade distribution: under 20 yrs = 6, 20–29 yrs = 36, 30–39 yrs = 7, 40–49yrs = 30, 50–59 yrs = 85, 60–69 yrs = 54, 70–79 yrs = 4, over 80 yrs = 1] all had useable T1-weighted images and were included in analyses of brain volume. Of this larger group ofparticipants, a subset of one-hundred and twenty people [49 males, 71 females, (107 Caucasian,7 African American, 2 Asian, 1 Hispanic, 1 Other), mean age 52.35 (SD = 14.68), age bydecade distribution: under 20 yrs = 5, 20–29 yrs = 12, 30–39 yrs = 6, 40–49 yrs = 10, 50–59yrs = 49, 60–69 yrs = 33, 70–79 yrs = 4, over 80 yrs = 1] possessed both useable T1-weightedimages and diffusion tensor images and were used for the behavioral and voxel-wise analysisof cognitive function. A summary of the demographics for the larger group with T1-weightedimages and the subset of people with both T1-weighted images and diffusion tensor imagesare presented in Table 1.
Bendlin et al. Page 3
Dev Neuropsychol. Author manuscript; available in PMC 2011 May 1.
NIH
-PA Author Manuscript
NIH
-PA Author Manuscript
NIH
-PA Author Manuscript

Neuropsychological TestingOn the day of the scan, participants received comprehensive neuropsychological testing. Wereport the results of analyses on nine of the neuropsychological test scores here, including:BVMT (Brief Visuospatial Memory Test, Revised), total raw score, and delayed recall(Benedict, 1997) to assess visuospatial learning and memory; COWAT (Controlled Oral WordAssociation Test; Benton, Hamsher, & Sivan, 1983), raw score to assess verbal fluency; TrailMaking Test A & B, seconds to complete, (Reitan & Wolfson, 1993) to assess motor speed,sequencing, and vigilance and in the case of Trails B, the additional functions of rapid setshifting, serial retention and integration, verbal problem solving, and planning; Digit Span,raw score (Wechsler, 1997) to assess the ability to hold information in working memory;RAVLT (Rey Auditory Verbal Learning test) total over the five learning trials and 20 minutedelayed recall raw scores (Rey, 1964) to assess immediate and delayed verbal memory; andWRAT-III (Wide Range Achievement Test, (Jastak Associates, 1993) reading subtest (WRAT-IIIR) to assess verbal intellectual ability. Due to unforeseen time constraints in theneuropsychological testing session, RAVLT and BVMT scores were unavailable for someparticipants included in the study. Solutions for dealing with missing test scores are limited,particularly in brain analyses, so participants were only included in an analysis if a score wasavailable; the total number of participants included in the analysis of each specific test areshown in Table 2.
Subsets of participants also received additional neuropsychological testing, including CVLT(California Verbal Learning Test, 2nd Edition) Digit Symbol (from WAIS-III), CPT(Continuous Performance Task); and WCST (Wisconsin Card Sorting Test). Scores on thesetests were only available for small subsets of the participants and because of the small Ns werenot used in the regression analyses of the DTI measures.
Magnetic Resonance ImagingAll participants underwent magnetic resonance on a General Electric 3.0 Tesla SIGNA(Waukesha, WI) MRI system with a quadrature birdcage head coil. Sequences includeddiffusion-weighted imaging, and high resolution T1-weighted imaging. Many participants alsoreceived various fMRI tasks as part of other studies; the fMRI results are reported elsewhere(Johnson et al., 2004; Johnson et al., 2006; Ries et al., 2006; Schmitz, Kawahara, & Johnson,2004; Trivedi et al., 2007).
Diffusion Tensor ImagingThe diffusion tensor imaging parameters have been published previously (Bendlin et al.,2008). Briefly, DTI was performed using a cardiac-gated, diffusion-weighted, spin-echo,single-shot, EPI pulse sequence, in twelve encoding directions, with 3 averages. The cerebrumwas covered using 39 contiguous 3-mm thick axial slices. The acquired voxel size of 2 × 2 ×3 mm was interpolated to 0.9375 mm isotropic dimensions (256 × 256 in plane image matrix).High order shimming was performed prior to the DTI acquisition to optimize the homogeneityof the magnetic field across the brain and to minimize EPI distortions. Residual spatialdistortions from B0 inhomogeneities were corrected using a B0 field map, which was obtainedusing a pair of non-EPI gradient echo images at two echo times.
T1-weighted ImagingA 3D T1-weighted image was obtained using an inversion recovery prepared fast gradient echopulse sequence. The whole brain was imaged in the axial plane with the following parameters:TI = 600 ms; TR = 9 ms; TE = 1.8 ms; flip angle = 20°; acquisition matrix = 256 × 192× 124,interpolated to 256 × 256 × 124; FOV = 240 mm; slice thickness = 1.2 mm (124 slices); receiverbandwidth = ± 16 kHz; acquisition time ~7.5 min.
Bendlin et al. Page 4
Dev Neuropsychol. Author manuscript; available in PMC 2011 May 1.
NIH
-PA Author Manuscript
NIH
-PA Author Manuscript
NIH
-PA Author Manuscript

Diffusion tensor image processingImage distortions in the DTI data caused by eddy currents were corrected using a 2D affinecoregistration function, align linear, in the Automated Image Registration (AIR) softwarepackage (http://www.bishopw.loni.ucla.edu/AIR5/). Non-linear image distortion from staticfield (B0) inhomogeneities was corrected using the acquired field map and the methods ofJezzard and Balaban (Jezzard & Balaban, 1995) implemented in the Prelude (Phase RegionExpanding Labeler for Unwrapping Discrete Estimates) and Fugue (FMRIB's Utility forGeometrically Unwarping EPIs) tools from the FSL software suite (S. M. Smith et al., 2004).After distortion corrections, three-dimensional maps of the diffusion tensor and derivedmeasures, mean diffusivity (MD) and fractional anisotropy (FA), were calculated. Participant’sFA maps were normalized to a custom FA template comprised of an average of 121 FA mapsacquired from non-patient participants who overlapped with (and matched the demographiccomposition of) the current study sample. Normalization parameters were derived from thenormalization of each individual’s FA image to the FA template (via 12-parameter affinetransformation and nonlinear deformation with a 25 mm cut-off and 16 iterations), and thenapplied to both their FA and MD maps. The normalized images were smoothed using an 8-mm isotropic Gaussian kernel. The white matter mask generated during the cross-sectionalanalysis of the T1-weighted images was used to restrict the DTI analysis to white matter only.
Voxel-based morphometry (VBM)Processing of the T1-weighted images for the cross-sectional analysis was performed usingStatistical Parametric Mapping software http://www.fil.ion.ucl.ac.uk/spm (SPM5).Segmentation in SPM5 employs a unified approach, combining: segmentation of the originalanatomical images into gray matter (GM), white matter (WM), and cerebrospinal fluid (CSF)images; normalization of the segmented images to the Montreal Neurological Institute template(specifically, a 12-parameter affine transformation and non-linear deformation with a warpfrequency cutoff of 25); and bias correction, in one iterative process. A modulation step wasalso employed, which scales the final WM and GM images by the amount of contractionrequired to warp the images to the template. The resulting images were GM and WM volumemaps for each participant, where original (native space) GM and WM volume is preservedeven after warping. The normalized maps were smoothed using an 8-mm isotropic Gaussiankernel to optimize signal to noise, facilitate comparison across participants, and match thesmoothing of the DTI maps. Analysis of white matter in the cross-sectional analysis of ageemployed an absolute threshold masking of 0.1 to minimize the inclusion of gray matter voxelsin the white matter analysis. The final results were displayed using a cluster size threshold of20 voxels.
Hypotheses and Statistical AnalysisIn order to investigate the relationship between white matter microstructure and age, andmicrostructure and cognitive function, we performed multiple regression analyses where theDTI measure (either FA or MD) was the dependent variable and either age or cognitive function(as reflected by one of the nine test scores) was the independent variable. In order to examinewhite matter microstructure independently of white matter volume, we statistically controlledfor volume on a voxel by voxel basis using the Biological Parametric Mapping (BPM) Toolboximplemented in SPM5. The BPM tool allows secondary imaging modalities to be used asregressors in the analysis of a primary imaging modality of interest (in this case, either FA orMD) in a massively univariate fashion. This is accomplished by solving a general linear modelwith a different design matrix in each voxel—in this case, for every brain voxel of FA dataderived from the DTI scan, there was a matching voxel of volumetric white matter data derivedfrom the T1 weighted scan. Education, gender, and total intracranial volume (TIV) wereincluded as covariates for all of the analyses; age was included as an additional covariate for
Bendlin et al. Page 5
Dev Neuropsychol. Author manuscript; available in PMC 2011 May 1.
NIH
-PA Author Manuscript
NIH
-PA Author Manuscript
NIH
-PA Author Manuscript

the analyses of cognitive data. Although TIV is not typically used as a covariate for DTI data,it is commonly used to control for the confounding effect of head size in volume studies. Sincewhite matter volume was included in our model, TIV was employed as a covariate as well.Based on the results of previous studies, we hypothesized that older age would be associatedwith higher MD and lower FA, particularly in frontal tracts and tracts that serve as relaysbetween frontal and temporal brain areas such as the uncinate fasciculus and superiorlongitudinal fasciculus. Furthermore, we hypothesized that cognitive function would be relatedto the DTI measures, where better performance was associated with higher FA and lower MD.Specifically, we expected that tests of frontal function would be related to frontal white matter,while tests of memory function would be related to temporal white matter. With regard to testsof memory, we further hypothesized that verbal memory tests would be related to left frontalwhite matter, while visual memory tests would be related to white matter in visual processingareas such as the inferior longitudinal fasciculus connecting the occipital and temporal lobes.
In order to examine the relationship between regional white matter volume and age, we usedlinear and non-linear regression in a voxel-wise fashion. The relationship between total whitematter volume and age was assessed by performing linear and non-linear correlation andemploying the volume estimates derived from the results of the SPM5 segmentation (i.e. thewhite matter probability maps), where white matter volume (in mm3) was determined bysumming the voxels in the modulated, spatially normalized images and multiplying by thevoxel volume. In addition to the imaging analyses, the relationship between theneuropsychological test scores and age were analyzed using SPSS version 15.0 (SPSS, Inc.,Chicago IL).
ResultsDemographic and Behavioral Relationships
In this sample, age was positively correlated with education, r = .34 (118), p < .001. Age wasalso positively correlated with performance on Trails A, r = .22 (120), p < .05, and Trails B, r= .18 (120), p <.05), with older adults performing more slowly. Scores on tests of memorywere negatively correlated with age, including RAVLT total, r = −.28 (94), p <.01, RAVLTDR, r = −.27(94), p<.01, BVMT total, r = −.32 (118), p < .001, and BVMT DR, r = −.32 (118),p < .001. The WRAT-III Reading score (a measure of crystallized intelligence that is notexpected to decline with age) was positively correlated with age, r = .23 (120), p < .01. Due tothe strong correlation between age and education, the relationships between theneuropsychological test scores and age were also examined using partial correlation,controlling for education. When controlling for education, age was still positively correlatedwith Trails A, r = .35 (120), p < .001, but not Trails B (p =.09). RAVLT total remainednegatively correlated with age r = −.22 (94), p <.01, RAVLT delayed recall only had amarginally significant correlation with age, r = −.20 (94), p<.06, and BVMT total remainedsignificantly correlated with age, r = −.29 (87), p < .01, as did BVMT delayed recall, r = −.27(112), p < .01. Digit span, which initially only showed a small negative correlation with age,became significant after controlling for education, r = −28 (120), p < .01. When education wascontrolled, WRAT was no longer correlated with age. Table 2 provides a summary of thecorrelation between test scores and age, both prior to, and when, controlling for education.
Total white matter volume; Age, Education and GenderWe predicted that white matter volume would show an age related decline. Using a partialcorrelation that controlled for gender, education and TIV, we found a significant negativecorrelation between age and white matter volume, r = −.18 (218), p < .01. We also tested anon-linear relationship, Figure 1 shows a plot of the data, where the quadratic fit, r = −.24,appears to account for more variability that the linear fit, though formal testing between the
Bendlin et al. Page 6
Dev Neuropsychol. Author manuscript; available in PMC 2011 May 1.
NIH
-PA Author Manuscript
NIH
-PA Author Manuscript
NIH
-PA Author Manuscript

two correlations indicated that they were not statistically different. Previous research indicatesthat men and women differ significantly in total white matter volume and patterns of age-relateddecline (Allen, Damasio, Grabowski, Bruss, & Zhang, 2003;Good et al., 2001). We replicatedthese findings in our sample, with men showing significantly greater white matter volume (M=.49L, SD = .05) compared to women (M = .44L, SD = .04), p < .001. Women also showed asignificant non-linear (quadratic) relationship between white matter volume and age, rs = −.24(132), p < .01; men did not show a significant non-linear relationship, rs = −.16 (87), p = .13.
Voxel-based morphometry: Regional relationship between age and white matterBased on previous studies, we expected that white matter volume would decline with age, withfrontal areas demonstrating steeper declines, and posterior regions such as occipital areasshowing less decline. As can be seen in Figure 2, we found extensive white matter decline, infrontal, temporal and parietal white matter. White matter volume was also negatively correlatedwith age in posterior occipital regions, brain stem, corpus callosum, and the cerebellum, p < .05, FDR, corrected. Because the analysis of total white matter volume suggested that whitematter decline may be explained by a non-linear function, we performed a quadratic voxel-wise analysis where age-squared was entered as a variable in the regression analysis. Non-linear white matter decline was found in all of the same major regions as were found in thelinear regression, with a slightly increased extent of change compared to the linear regression.In order to determine whether the quadratic function was significantly different from the linearfunction, we performed a voxel-wise test between the two slopes. Brain regions where thequadratic function explained significantly greater variance than the linear function included asmall portion of anterior corpus callosum, white matter adjacent to right anterior limb of theinternal capsule, a small portion of superior longitudinal fasciculus, bilateral superior coronaradiata, left posterior limb of the internal capsule, and bilateral posterior corona radiata (p<.001 unc). Having determined that volume was highly related to age both linearly and non-linearly, our next question was: do the DTI measures show relationships with age that are aboveand beyond the effect of volume?
Diffusion Tensor Imaging: Relationship Between Age and White Matter MicrostructureFractional Anisotropy and Age—We predicted that FA would be negatively correlatedwith age, even when controlling for volume. As shown in Figure 3, FA in several major whitematter tracts did show a negative correlation with age. Although the majority of affected regionswere frontal, age effects extended to parietal, temporal and occipital white matter. Specificbrain regions and tracts affected included the genu and body of the corpus callosum, sagittalstratum (inferior fronto-occipital fasciculus, inferior longitudinal fasciculus, and posteriorthalamic radiations), superior longitudinal fasciculus, internal capsule, anterior, superior, andposterior corona radiata, and portions of the cingulum, p < .05, FDR corrected. In order toevaluate whether the relationship between white matter microstructure and age was strongerin frontal regions compared to posterior regions, we extracted the correlation coefficients inareas where FA was significantly related to age. Values from peak voxels in medial frontalwhite matter (16, 50, 12), anterior corpus callosum (−2, 18, 0), anterior temporal white matter(−34, −1, −26), posterior temporal white matter (−34, −33, 6) and occipital white matter (−69,19, −71) were extracted and compared. In addition, since FA may differ intrinsically in differentwhite matter tracts independently from age, we also assessed multiple points along one tract—the corpus callosum—specifically genu (8, 33, 0), body (8, 2, 28), and splenium (8, −34,15). Negative correlations between age and FA were strongest in anterior temporal whitematter, r = −.47 (120), p< .001, posterior temporal white matter, r = −.47 (120), p< .001, andfrontal white matter, r = −.45 (12), p <.001, with a slightly smaller though still significantcorrelation between age and FA in occipital white matter, r = −.25 (120), p < .01. Mean FAwas lowest in occipital white matter (m = 2.73), anterior temporal white matter (m = 2.77),and frontal white matter (2.90), and highest in posterior temporal white matter (m = 4.15).
Bendlin et al. Page 7
Dev Neuropsychol. Author manuscript; available in PMC 2011 May 1.
NIH
-PA Author Manuscript
NIH
-PA Author Manuscript
NIH
-PA Author Manuscript

Along the corpus callosum, the genu showed the strongest negative correlation with age r = −.40 (120), p < .001, followed by the body of the corpus callosum, r = −22 (120), p < .05, andfinally the splenium, which did not show a significant correlation between age and FA, r = −.08 (120), p = .39. Mean FA was lowest in the body of the corpus callosum (m = 4.77), followedby the genu (m = 4.99), and splenium (m = 5.86).
Owing to the non-linear changes found in the white matter analyses, a non-linear analysis wasperformed on the DTI data. Entering age-squared into the regression analysis resulted invirtually the same white matter tracts showing an effect of age. A difference map of the twoimages indicated that the non-linear fit extended slightly beyond the linear fit map, includingmore white matter. A voxel-wise statistical comparison of the two slopes revealed that the non-linear fit accounted for significantly more variability in FA than the linear fit in primarilyposterior brain regions (p<.001 unc). As seen in Figure 4, these regions included the spleniumof the corpus callosum, large bilateral regions of occipital white matter, bilateral cerebellarwhite matter, right inferior fronto-occipital fasciculus, right posterior corona radiata, leftanterior thalamic radiation, left superior corona radiata, and right anterior limb of the internalcapsule.
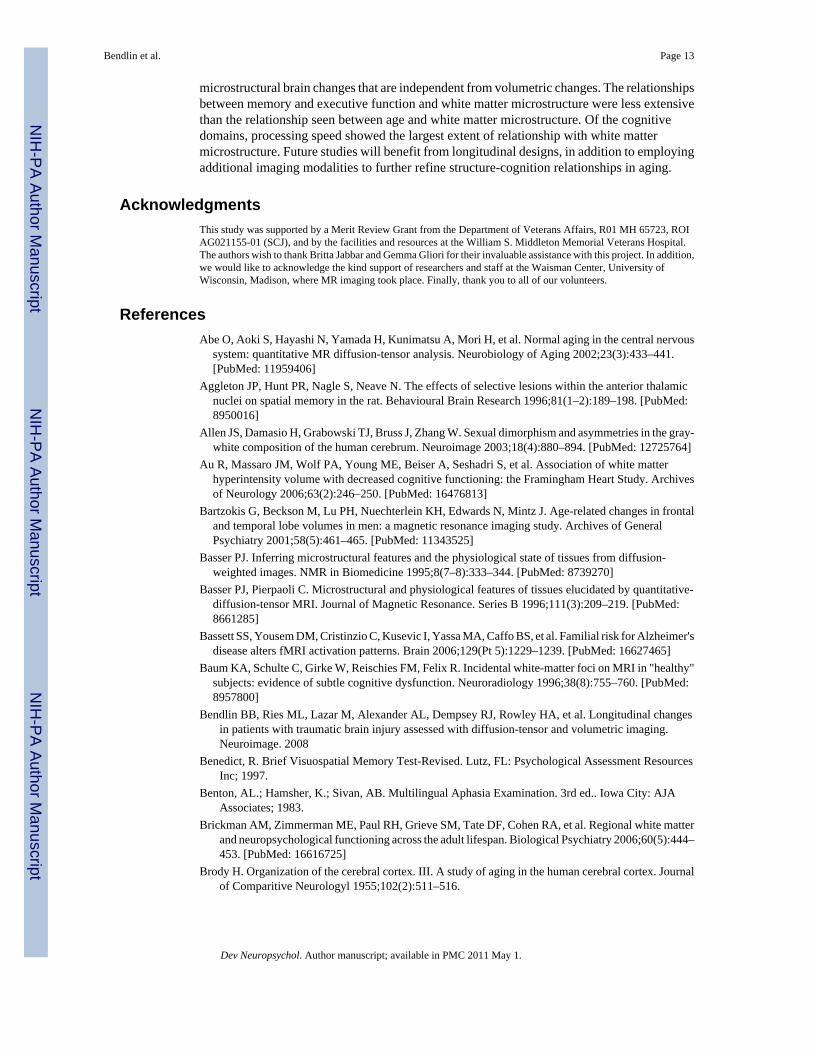
Mean Diffusivity and Age—In contrast to FA, where higher values typically reflect moreintact white matter tissue, higher MD values tend to reflect a downturn in the health or integrityof the tissue in which it is measured. Similar to previously published studies of aging, whitematter MD in the current sample was positively correlated with age. The extent of white matteraffected was less than that found in the FA analysis. Regions showing a significant positiverelationship with age were clustered anteriorly, including areas of prefrontal association fibers,superior fronto-occipital fasciculus, fibers of the cingulum and fornix, and the genu of thecorpus callosum. In addition, MD in the cerebral peduncles and the thalamus was positivelycorrelated with age, p < .05, FDR corrected. A non-linear relationship between MD and agewas tested by entering age-squared into the regression analysis. MD showed a positive non-linear relationship with age in the same tracts that showed a linear age effect. In addition,several regions that did not show a linear effect did in fact show a non-linear effect. In particular,additional portions of the cingulum bundle ventral to the thalamus, fornix, stria terminalis, andfibers of the anterior thalamic radiation. A greater extent of involvement in the non-linearanalysis was also observed in the anterior corona radiata, the genu of the corpus callosum, theretrolenticular and anterior limb of the internal capsule, and the uncinate fasciculus. In orderto determine where the non-linear fit explained more variance than a linear fit, we performeda voxel-wise comparison of the linear and quadratic slopes. Interestingly, the non-linear fit wasstronger than the linear fit in several major white matter fiber tracts including corpus callosum,cingulum, uncinate, superior and inferior longitudinal fasciculi, superior and inferior fronto-occipital fasciculi, internal and external capsule, anterior and posterior thalamic radiations, andshort association fibers in frontal, temporal, parietal, and occipital white matter. Shown inFigure 5 is a plot of mean diffusivity against age in the external capsule, as well as brain imagesthat demonstrate the widespread nature of the non-linear pattern. This differs from the FAresults, where the non-linear fit accounted for more variance in primarily posterior regions.Having determined that white matter microstructure was related to age, we next examinedwhether white matter integrity was related to cognitive function.
Diffusion Tensor Imaging : Relationship between Cognition and White Matter MicrostructureWe hypothesized that white matter microstructure would be related to cognitive function. Wereasoned that using white matter volume as a covariate on a voxel by voxel basis would allowus to measure the relationships with cognition not attributable to volume differences alone.Indeed, we found that Trails A, Trials B, BVMT, Digit Span and WRAT all showed a
Bendlin et al. Page 8
Dev Neuropsychol. Author manuscript; available in PMC 2011 May 1.
NIH
-PA Author Manuscript
NIH
-PA Author Manuscript
NIH
-PA Author Manuscript

relationship with at least one of the DTI measures. Age was included as a covariate in all ofthe analyses. All results were thresholded at p < .001 unc.
Processing Speed—General processing (and/or motor) speed measured by Trails A wasrelated to both FA and MD. Mean diffusivity was extensively related to Trails A. As shownin Figure 6, MD was positively correlated with Trails A in bilateral anterior corona radiata,bilateral superior fronto-occipital fasciculus, bilateral superior longitudinal fasciculus, bilateralinternal capsule, posterior cingulum, right inferior fronto-occipital fasciculus, and smallportions of bilateral posterior corona radiata. A plot of the positive relationship between scoreson Trials A (measured in seconds) and MD in the cingulum is also shown in Figure 6. FA wasnegatively correlated with Trails A in a small region of right sagittal stratum, a small regionin the left frontal short association fibers, and a small portion of stria terminalis adjacent to theright lateral ventricle.
Working memory and episodic memory—Simple working memory, as measured bydigit span, was positively correlated with FA in regions that were clustered in fronto-parieto-temporal white matter—portions of the superior corona radiata and short association fibersadjacent to left corpus callosum. Visual memory as measured by BVMT showed a relationshipwith both FA and MD. The BVMT delayed recall score was positively correlated with FA inbilateral posterior corona radiata, bilateral anterior thalamus, a small region in left middlefrontal white matter, and a small region in left rostral mid-brain. Delayed recall was negativelycorrelated with MD in bilateral anterior thalamus, and three regions of right sided white matter:superior frontal, middle frontal, and a frontoparietal–temporal region. The BVMT total scorewas positively correlated with white matter FA in bilateral anterior thalamus, right internalcapsule, left anterior corona radiata, bilateral posterior corona radiata, right superior coronaradiata, and right external capsule. BVMT total score was not related to MD. Verbal learningand memory as measured by the RAVLT total and delayed scores was not related to the DTImeasures.
Scores on tests of executive function—Complex attention and rapid set shifting asmeasured by Trails B was related to FA, but not MD. Higher Trails B scores (which reflectpoorer performance) were negatively correlated with FA in bilateral superior corona radiata,and right superior longitudinal fasciculus. The Controlled Oral Word Association Test, thoughtto represent frontal function, did not show a significant relationship with FA or MD in frontalwhite matter or any other brain regions.
General Verbal Achievement—Verbal achievement as measured by WRAT-IIIR waspositively correlated with FA in right fornix. WRAT-IIIR also showed a negative relationshipwith FA, where higher WRAT-IIIR scores were associated with lower FA scores in right frontaluncinate fasciculus, two small areas of bilateral frontal association fibers and a small clusterin left fronto-parietal white matter. There was no significant relationship between WRAT-IIIRand MD.
DiscussionThe current study assessed the relationship between cognitive function as measured by specificneuropsychological test scores and white matter microstructure as measured by DTI. In orderto assess the relationship between microstructure and cognition independently of gross volumeloss, we controlled for white matter volume on a voxel by voxel basis using the BiologicalParametric Mapping toolbox. With the exception of one recent study (Hugenschmidt et al.,2008), previous DTI studies have not controlled for the effect of volume on the DTI indices ina voxel-wise fashion.
Bendlin et al. Page 9
Dev Neuropsychol. Author manuscript; available in PMC 2011 May 1.
NIH
-PA Author Manuscript
NIH
-PA Author Manuscript
NIH
-PA Author Manuscript

As predicted, several of the neuropsychological tests were related to white mattermicrostructure as measured with DTI. In terms of extent, Trails A showed the greatestrelationship with white matter microstructure in its positive relationship with MD. White matterplays a critical role in processing speed, so it is not surprising that performance on this test wasrelated to white matter integrity. Trails B was also related to white matter microstructure,specifically with FA, in bilateral superior corona radiata, and right superior longitudinalfasciculus. Trails B is typically considered a test of frontal function, and has been associatedwith functional activation in dorsolateral, and medial frontal regions, but also left middle andsuperior temporal gyrus (Zakzanis, Mraz, & Graham, 2005). Since the superior longitudinalfasciculus forms an anatomical connection between frontal and temporal regions, it is possiblethat microstructural changes in this fiber tract account for variability in the performance of thistask. O’Sullivan et al. (2001) also found a relationship between Trails Making Test anddiffusion, specifically a positive correlation between anterior white matter diffusivity andTrails B minus Trails A.
Both working and visual memory were related to age. This is not surprising, as memory changeis a chief complaint of older age. The relationship between white matter microstructure andworking memory as measured by digit span was lateralized to the left hemisphere. Performanceon the digit span task likely involves multiple strategies, including verbal rehearsal that invokesleft cerebral structures (especially in the case of digit span forward) and visual imagery(especially in the case of digit span backward), which has been shown to involve both left andright cerebral structures. Damage to the regions where we found a relationship with digit span,is associated with disruptions to visual processing (Regan, Giaschi, Sharpe, & Hong, 1992).Parietal gray matter near the tracts we observed are typically active during working memorytasks (Jonides et al., 1998).
Visuospatial memory as measured by BVMT was associated with both FA and MD measuresin the anterior thalamus. Isolated lesions to the thalamus in humans are rare; however, animalstudies suggest that anterior thalamic lesions produce impairments in spatial memory tasks(Aggleton, Hunt, Nagle, & Neave, 1996; Sziklas & Petrides, 1999). The BVMT was alsorelated to FA in the left anterior frontal lobe, a region implicated in several studies of non-verbal memory (Courtney, Petit, Maisog, Ungerleider, & Haxby, 1998; Klingberg, O'Sullivan,& Roland, 1997; Moritz, Johnson, McMillan, Haughton, & Meyerand, 2004; Ranganath,Johnson, & D'Esposito, 2000).
When controlling for age and education, verbal memory as measured by RAVLT did not showa significant relationship with age, and did not show a relationship with the DTI measures.Rose et al. (S E Rose et al., 2006) have found a relationship between RAVLT and diffusionindices, although they included participants with MCI in their sample. Our sample was limitedto cognitively normal participants, which may explain why we did not find a relationship.
Verbal fluency, as measured with COWAT, was not related to age or the DTI measures. Wehave previously found COWAT to be related to left lateral inferior and middle frontal gyri(Newman, 2007); however, that study employed a larger sample and investigated gray matteronly. O’Sullivan et al. (2001) have previously found a relationship between verbal fluency andFA, though they employed an ROI approach which may account for this discrepancy.
The results of the DTI and age analyses replicate previous findings indicating that FA isnegatively correlated with age and MD is positively correlated with age. Wide-spread ageeffects were observed in frontal white matter, though temporal and parietal, and occipital fibersalso showed a pattern of lower FA with higher age. The results are complementary to thefindings of Hugenschmidt et al., who also examined FA and age while controlling for whitematter volume (Hugenschmidt et al., 2008)—though the extent of the relationship with age
Bendlin et al. Page 10
Dev Neuropsychol. Author manuscript; available in PMC 2011 May 1.
NIH
-PA Author Manuscript
NIH
-PA Author Manuscript
NIH
-PA Author Manuscript

found in the current study were somewhat greater than the extent reported by Hugenschmidtet al. (2008). This may be due a variety of methodological differences including higher MRIfield strength and approximately double the number of subjects in the present report.
Previous research indicates that the effect of age on white matter microstructure appears tofollow an anterior to posterior gradient (Head et al., 2004; Salat et al., 2005; Sullivan et al.,2001; Sullivan et al., 2006). In general, our results replicate previous findings. Extracting thecorrelation coefficient from peak voxels in the corpus callosum indicated that the correlationbetween age and fractional anisotropy was greatest in the genu, followed by the body of thecorpus callosum, and not significant in the splenium. Similarly, values extracted from medialfrontal white matter showed a stronger correlation between age and FA than values extractedfrom the corpus callosum or occipital white matter. The exception to an anterior to posteriorgradient was the correlation between age and fractional anisotropy in temporal white matter,with both anterior and posterior temporal white matter demonstrating a comparable correlationto frontal white matter. Alterations to the medial temporal lobe have been attributed topreclinical Alzheimer’s pathology in high risk populations such as MCI (Fellgiebel et al.,2004; Huang, Friedland, & Auchus, 2007; S. E. Rose et al., 2006). It is unlikely thatAlzheimer’s disease risk was a strong determinant of the pattern found in this study, as we tookcare to ensure that our sample was cognitively normal and not heavy on participants withincreased risk for Alzheimer’s disease by way of family history or presence of ApoE ε4,suggesting that medial temporal lobe alterations are indeed a component of normal aging.
The relationship between mean diffusivity and age was not as widespread as the relationshipfound with FA, but still present even when controlling for white matter volume. Whereas FAaffected large fiber bundles such as the corpus callosum and superior longitudinal fasciculus,age effects on MD were noted in relatively smaller regions such as clusters in prefrontal shortassociation fibers, the fornix, and thalamic white matter, and cerebral peduncles. Interestingly,the relationship between age and mean diffusivity appears to be more non-linear than linear:a voxel-wise comparison between the two fits revealed that a non-linear slope was strongerthan a liner slope across a wide expanse of brain white matter. These results complementprevious findings suggesting that white matter decline follows a non-linear course over thelifespan (Bartzokis et al., 2001; Courchesne et al., 2000; Jernigan et al., 2001; Raz et al.,2005). It is interesting to note, however, that in the case of white matter volume—a significantlybetter non-linear fit was only found in small portions of the major white matter tracts. Incomparison, the non-linear diffusivity pattern covered a much greater extent of the brain thanthe non-linear volume pattern.
Significance testing between the linear and non-linear fits describing fractional anisotropy andage indicated that a non-linear fit was superior primarily in posterior brain regions. These datasuggest that posterior brain regions, like frontal brain regions, undergo significantmicrostructural changes across the life span but may follow a different pattern than do frontalregions. That the FA results differed from the MD results suggest that different age-relatedprocesses underlie the two measures.
Until recently, white matter integrity has been relatively understudied in relation to cognitionand aging in normal populations. Although volume loss has been well documented in aging,it is possible that more subtle brain changes underlie age-related cognitive change, even beforeloss of volume. Diffusion tensor imaging has the distinct advantage of measuring structuralalterations on a microscopic scale, allowing it to capture more information than grossmeasurements of volume. Much of what is known about age-related structural white matterchange comes from studies of non-human primates (Peters, 2002); changes include splittingof the myelin sheath, the formation of enclosures of dense cytoplasm, and ballooning of themyelin in the form of round cavities that can include fluid filled spheres (Feldman & Peters,
Bendlin et al. Page 11
Dev Neuropsychol. Author manuscript; available in PMC 2011 May 1.
NIH
-PA Author Manuscript
NIH
-PA Author Manuscript
NIH
-PA Author Manuscript

1998). It is possible that changes to myelin integrity could result in disturbances to rapid nerveconduction, suggested by the relationship between mean diffusivity and processing speed inthe present study.
Although this study controlled for volume within a statistical framework, we can not rule outthe possibility that changes in MD and FA resulted in part from volumetric effects. Studies ofhuman brain tissue have indicated that there is a loss of white matter with increasing age (Tanget al., 1997). In older brains, the total volume of white matter is lower by 15%, and there is anage-related decline in small diameter myelinated fibers. In turn, evidence from diseases suchas multiple sclerosis suggests that the loss of white matter fibers can be accompanied bydecreased FA, (Ciccarelli et al., 2003; Kealey, Kim, & Provenzale, 2004; Schmierer et al.,2007). Some of the age effects (though not all) were found in proximity to the ventricles. It ispossible that older subjects with atrophy did not normalize as well as younger subjects into thecommon stereological space, a common problem with studies of aging. All of the normalizedmaps were inspected for accuracy, but subtle variation in normalization across the life-spancan not be ruled out.
A few additional limitations should be noted. First, although this study adds to the growingnumber of studies that combine imaging techniques, it is still limited by the inclusion of only2 imaging modalities. Inclusion of T2 weighted images in the analyses would have greatlyassisted in controlling for the possibility of white matter hyperintensities in older adults,particularly since diffusion measures are likely to be correlated with white matterhyperintensities as identified on T2 weighted images (Kochunov et al., 2007). Anotherlimitation of the present study is its cross sectional nature. Total intracranial volume andeducation were controlled, which can mitigate some of the concerns regarding cross-sectionaldesigns, since these factors have been shown to vary between younger and older adults andcan contribute to a cohort effect (Reynolds, Johnston, Dodge, DeKosky, & Ganguli, 1999; T.W. Smith, 1993). Still, in order to assess true age-related change, longitudinal studies arerequired. In our sample, education was positively correlated with age. This suggests that theolder adults in the current study represent a cohort that is experiencing optimal aging, makingthe results somewhat less generalizable to a wider population. Furthermore, our sample waslargely Caucasian (91%), which may also limit the conclusions that can be made in regard tonormal aging in the general population. Finally, in order to ensure a clean sample, a numberof participants were excluded due to poor or missing cognitive scores or risk for Alzheimer’sdisease. These restrictions limited the number of participants, particularly in the 30–50 yearage range, which in turn may have limited the generalizability of the correlational analyses, orpossibly affected the slope of the correlations. Restricting the sample to cognitively normalparticipants may also have limited the range and variability of our cognitive scores andundoubtedly impacted our power to detect relationships with the DTI measures.
Despite the loss of participants, avoiding an over-representation of AD risk factors is important.Though many studies control for ApoE ε4 genotype, few if any imaging studies of normalaging control for parental family history of AD. This clearly needs to be addressed in futurestudies of aging, since family history can modulate brain measures even in cognitively normal,healthy participants (Bassett et al., 2006; Johnson et al., 2007; Johnson et al., 2006; Mosconiet al., 2007).
ConclusionThe present study found a relationship between cognitive function and white mattermicrostructure while controlling for white matter brain volume on a voxel by voxel basis. Theresults lend further support to accumulating evidence that cognitive changes in aging are relatedto the integrity of white matter microstructure. The results also suggest that DTI is sensitive to
Bendlin et al. Page 12
Dev Neuropsychol. Author manuscript; available in PMC 2011 May 1.
NIH
-PA Author Manuscript
NIH
-PA Author Manuscript
NIH
-PA Author Manuscript
microstructural brain changes that are independent from volumetric changes. The relationshipsbetween memory and executive function and white matter microstructure were less extensivethan the relationship seen between age and white matter microstructure. Of the cognitivedomains, processing speed showed the largest extent of relationship with white mattermicrostructure. Future studies will benefit from longitudinal designs, in addition to employingadditional imaging modalities to further refine structure-cognition relationships in aging.
AcknowledgmentsThis study was supported by a Merit Review Grant from the Department of Veterans Affairs, R01 MH 65723, ROIAG021155-01 (SCJ), and by the facilities and resources at the William S. Middleton Memorial Veterans Hospital.The authors wish to thank Britta Jabbar and Gemma Gliori for their invaluable assistance with this project. In addition,we would like to acknowledge the kind support of researchers and staff at the Waisman Center, University ofWisconsin, Madison, where MR imaging took place. Finally, thank you to all of our volunteers.
ReferencesAbe O, Aoki S, Hayashi N, Yamada H, Kunimatsu A, Mori H, et al. Normal aging in the central nervous
system: quantitative MR diffusion-tensor analysis. Neurobiology of Aging 2002;23(3):433–441.[PubMed: 11959406]
Aggleton JP, Hunt PR, Nagle S, Neave N. The effects of selective lesions within the anterior thalamicnuclei on spatial memory in the rat. Behavioural Brain Research 1996;81(1–2):189–198. [PubMed:8950016]
Allen JS, Damasio H, Grabowski TJ, Bruss J, Zhang W. Sexual dimorphism and asymmetries in the gray-white composition of the human cerebrum. Neuroimage 2003;18(4):880–894. [PubMed: 12725764]
Au R, Massaro JM, Wolf PA, Young ME, Beiser A, Seshadri S, et al. Association of white matterhyperintensity volume with decreased cognitive functioning: the Framingham Heart Study. Archivesof Neurology 2006;63(2):246–250. [PubMed: 16476813]
Bartzokis G, Beckson M, Lu PH, Nuechterlein KH, Edwards N, Mintz J. Age-related changes in frontaland temporal lobe volumes in men: a magnetic resonance imaging study. Archives of GeneralPsychiatry 2001;58(5):461–465. [PubMed: 11343525]
Basser PJ. Inferring microstructural features and the physiological state of tissues from diffusion-weighted images. NMR in Biomedicine 1995;8(7–8):333–344. [PubMed: 8739270]
Basser PJ, Pierpaoli C. Microstructural and physiological features of tissues elucidated by quantitative-diffusion-tensor MRI. Journal of Magnetic Resonance. Series B 1996;111(3):209–219. [PubMed:8661285]
Bassett SS, Yousem DM, Cristinzio C, Kusevic I, Yassa MA, Caffo BS, et al. Familial risk for Alzheimer'sdisease alters fMRI activation patterns. Brain 2006;129(Pt 5):1229–1239. [PubMed: 16627465]
Baum KA, Schulte C, Girke W, Reischies FM, Felix R. Incidental white-matter foci on MRI in "healthy"subjects: evidence of subtle cognitive dysfunction. Neuroradiology 1996;38(8):755–760. [PubMed:8957800]
Bendlin BB, Ries ML, Lazar M, Alexander AL, Dempsey RJ, Rowley HA, et al. Longitudinal changesin patients with traumatic brain injury assessed with diffusion-tensor and volumetric imaging.Neuroimage. 2008
Benedict, R. Brief Visuospatial Memory Test-Revised. Lutz, FL: Psychological Assessment ResourcesInc; 1997.
Benton, AL.; Hamsher, K.; Sivan, AB. Multilingual Aphasia Examination. 3rd ed.. Iowa City: AJAAssociates; 1983.
Brickman AM, Zimmerman ME, Paul RH, Grieve SM, Tate DF, Cohen RA, et al. Regional white matterand neuropsychological functioning across the adult lifespan. Biological Psychiatry 2006;60(5):444–453. [PubMed: 16616725]
Brody H. Organization of the cerebral cortex. III. A study of aging in the human cerebral cortex. Journalof Comparitive Neurologyl 1955;102(2):511–516.
Bendlin et al. Page 13
Dev Neuropsychol. Author manuscript; available in PMC 2011 May 1.
NIH
-PA Author Manuscript
NIH
-PA Author Manuscript
NIH
-PA Author Manuscript

Brody, H. Structural changes in the aging nervous system. In: Blumenthal, HT., editor. The RegulatoryRole of the Nervous System in Aging, Interdisciplinary Topics in Gerontology. Vol. Vol. 7. Basel:Karger Press; 1970. p. 9-21.
Casanova R, Srikanth R, Baer A, Laurienti PJ, Burdette JH, Hayasaka S, et al. Biological parametricmapping: A statistical toolbox for multimodality brain image analysis. Neuroimage 2007;34(1):137–143. [PubMed: 17070709]
Charlton RA, Barrick TR, McIntyre DJ, Shen Y, O'Sullivan M, Howe FA, et al. White matter damageon diffusion tensor imaging correlates with age-related cognitive decline. Neurology 2006;66(2):217–222. [PubMed: 16434657]
Ciccarelli O, Werring DJ, Barker GJ, Griffin CM, Wheeler-Kingshott CA, Miller DH, et al. A study ofthe mechanisms of normal-appearing white matter damage in multiple sclerosis using diffusion tensorimaging--evidence of Wallerian degeneration. Journal of Neurology 2003;250(3):287–292.[PubMed: 12638018]
Corbo RM, Scacchi R. Apolipoprotein E (APOE) allele distribution in the world. Is APOE*4 a 'thrifty'allele? Annals of Human Genetics 1999;63(Pt 4):301–310. [PubMed: 10738542]
Courchesne E, Chisum HJ, Townsend J, Cowles A, Covington J, Egaas B, et al. Normal braindevelopment and aging: quantitative analysis at in vivo MR imaging in healthy volunteers. Radiology2000;216(3):672–682. [PubMed: 10966694]
Courtney SM, Petit L, Maisog JM, Ungerleider LG, Haxby JV. An area specialized for spatial workingmemory in human frontal cortex. Science 1998;279(5355):1347–1351. [PubMed: 9478894]
de Groot JC, de Leeuw FE, Oudkerk M, van Gijn J, Hofman A, Jolles J, et al. Cerebral white matterlesions and cognitive function: the Rotterdam Scan Study. Annals of Neurology 2000;47(2):145–151. [PubMed: 10665484]
Deary IJ, Bastin ME, Pattie A, Clayden JD, Whalley LJ, Starr JM, et al. White matter integrity andcognition in childhood and old age. Neurology 2006;66(4):505–512. [PubMed: 16505302]
Devaney KO, Johnson HA. Neuron loss in the aging visual cortex of man. Journals of Gerontology1980;35(6):836–841. [PubMed: 7440924]
Engelter ST, Provenzale JM, Petrella JR, DeLong DM, MacFall JR. The effect of aging on the apparentdiffusion coefficient of normal-appearing white matter. American Journal of Roentgenology2000;175(2):425–430. [PubMed: 10915688]
Evans DA, Funkenstein HH, Albert MS, Scherr PA, Cook NR, Chown MJ, et al. Prevalence ofAlzheimer's disease in a community population of older persons. Higher than previously reported.Journal of the American Medical Association 1989;262(18):2551–2556. [PubMed: 2810583]
Feldman ML, Peters A. Ballooning of myelin sheaths in normally aged macaques. Journal ofNeurocytology 1998;27(8):605–614. [PubMed: 10405027]
Fellgiebel A, Wille P, Muller MJ, Winterer G, Scheurich A, Vucurevic G, et al. Ultrastructuralhippocampal and white matter alterations in mild cognitive impairment: a diffusion tensor imagingstudy. Dementia and Geriatric Cognitive Disorders 2004;18(1):101–108. [PubMed: 15087585]
Good CD, Johnsrude IS, Ashburner J, Henson RN, Friston KJ, Frackowiak RS. A voxel-basedmorphometric study of ageing in 465 normal adult human brains. Neuroimage 2001;14(1 Pt 1):21–36. [PubMed: 11525331]
Grieve SM, Williams LM, Paul RH, Clark CR, Gordon E. Cognitive aging, executive function, andfractional anisotropy: a diffusion tensor MR imaging study. American Journal of Neuroradiology2007;28(2):226–235. [PubMed: 17296985]
Gunning-Dixon FM, Raz N. Neuroanatomical correlates of selected executive functions in middle-agedand older adults: a prospective MRI study. Neuropsychologia 2003;41(14):1929–1941. [PubMed:14572526]
Head D, Buckner RL, Shimony JS, Williams LE, Akbudak E, Conturo TE, et al. Differential vulnerabilityof anterior white matter in nondemented aging with minimal acceleration in dementia of theAlzheimer type: evidence from diffusion tensor imaging. Cerebral Cortex 2004;14(4):410–423.[PubMed: 15028645]
Henderson G, Tomlinson BE, Gibson PH. Cell counts in human cerebral cortex in normal adultsthroughout life using an image analysing computer. Journal of the Neurological Sciences 1980;46(1):113–136. [PubMed: 7373341]
Bendlin et al. Page 14
Dev Neuropsychol. Author manuscript; available in PMC 2011 May 1.
NIH
-PA Author Manuscript
NIH
-PA Author Manuscript
NIH
-PA Author Manuscript

Huang J, Friedland RP, Auchus AP. Diffusion tensor imaging of normal-appearing white matter in mildcognitive impairment and early Alzheimer disease: preliminary evidence of axonal degeneration inthe temporal lobe. American Journal of Neuroradiology 2007;28(10):1943–1948. [PubMed:17905894]
Hugenschmidt CE, Peiffer AM, Kraft RA, Casanova R, Deibler AR, Burdette JH, et al. Relating imagingindices of white matter integrity and volume in healthy older adults. Cerebral Cortex 2008;18(2):433–442. [PubMed: 17575289]
Wide Range Achievement Test-Third Edition. Wilmington: Wide Range Inc; 1993. Jastak Associates.Jernigan TL, Archibald SL, Fennema-Notestine C, Gamst AC, Stout JC, Bonner J, et al. Effects of age
on tissues and regions of the cerebrum and cerebellum. Neurobiology of Aging 2001;22(4):581–594.[PubMed: 11445259]
Jezzard P, Balaban RS. Correction for geometric distortion in echo planar images from B0 field variations.Magnetic Resonance in Medicine 1995;34(1):65–73. [PubMed: 7674900]
Johnson SC, Baxter LC, Susskind-Wilder L, Connor DJ, Sabbagh MN, Caselli RJ. Hippocampaladaptation to face repetition in healthy elderly and mild cognitive impairment. Neuropsychologia2004;42(7):980–989. [PubMed: 14998712]
Johnson SC, Ries ML, Hess TM, Carlsson CM, Gleason CE, Alexander AL, et al. Effect of Alzheimerdisease risk on brain function during self-appraisal in healthy middle-aged adults. Archives ofGeneral Psychiatry 2007;64(10):1163–1171. [PubMed: 17909128]
Johnson SC, Schmitz TW, Trivedi MA, Ries ML, Torgerson BM, Carlsson CM, et al. The influence ofAlzheimer disease family history and apolipoprotein E epsilon4 on mesial temporal lobe activation.Journal of Neuroscience 2006;26(22):6069–6076. [PubMed: 16738250]
Jonides J, Schumacher EH, Smith EE, Koeppe RA, Awh E, Reuter-Lorenz PA, et al. The role of parietalcortex in verbal working memory. Journal of Neuroscience 1998;18(13):5026–5034. [PubMed:9634568]
Kealey SM, Kim Y, Provenzale JM. Redefinition of multiple sclerosis plaque size using diffusion tensorMRI. American Journal of Roentgenology 2004;183(2):497–503. [PubMed: 15269047]
Klingberg T, O'Sullivan BT, Roland PE. Bilateral activation of fronto-parietal networks by incrementingdemand in a working memory task. Cerebral Cortex 1997;7(5):465–471. [PubMed: 9261575]
Kochunov P, Thompson PM, Lancaster JL, Bartzokis G, Smith S, Coyle T, et al. Relationship betweenwhite matter fractional anisotropy and other indices of cerebral health in normal aging: tract-basedspatial statistics study of aging. Neuroimage 2007;35(2):478–487. [PubMed: 17292629]
Lucotte G, Loirat F, Hazout S. Pattern of gradient of apolipoprotein E allele *4 frequencies in westernEurope. Human Biology 1997;69(2):253–262.
Masliah E, Mallory M, Hansen L, DeTeresa R, Terry RD. Quantitative synaptic alterations in the humanneocortex during normal aging. Neurology 1993;43(1):192–197. [PubMed: 8423884]
Moritz CH, Johnson SC, McMillan KM, Haughton VM, Meyerand ME. Functional MRI neuroanatomiccorrelates of the Hooper Visual Organization Test. Journal of the International NeuropsychologicalSociety 2004;10(7):939–947. [PubMed: 15803557]
Mosconi L, Brys M, Switalski R, Mistur R, Glodzik L, Pirraglia E, et al. Maternal family history ofAlzheimer's disease predisposes to reduced brain glucose metabolism. Proceedings of the NationalAcademy of Sciences of the United States of America 2007;104(48):19067–19072. [PubMed:18003925]
Newman L, Trivedi M, Bendlin B, Ries M, Johnson SC. The Relationship Between Gray MatterMorphometry and Neuropsychological Performance. Brain Imaging and Behavior 2007;1(1–2):3–10. [PubMed: 18836573]
O'Sullivan M, Jones DK, Summers PE, Morris RG, Williams SC, Markus HS. Evidence for cortical"disconnection" as a mechanism of age-related cognitive decline. Neurology 2001;57(4):632–638.[PubMed: 11524471]
Oakes TR, Fox AS, Johnstone T, Chung MK, Kalin N, Davidson RJ. Integrating VBM into the GeneralLinear Model with voxelwise anatomical covariates. Neuroimage 2007;34(2):500–508. [PubMed:17113790]
Pakkenberg B, Gundersen HJ. Neocortical neuron number in humans: effect of sex and age. Journal ofComparative Neurology 1997;384(2):312–320. [PubMed: 9215725]
Bendlin et al. Page 15
Dev Neuropsychol. Author manuscript; available in PMC 2011 May 1.
NIH
-PA Author Manuscript
NIH
-PA Author Manuscript
NIH
-PA Author Manuscript

Paul R, Grieve SM, Chaudary B, Gordon N, Lawrence J, Cooper N, et al. Relative contributions of thecerebellar vermis and prefrontal lobe volumes on cognitive function across the adult lifespan.Neurobiology of Aging. 2007
Persson J, Nyberg L, Lind J, Larsson A, Nilsson LG, Ingvar M, et al. Structure-function correlates ofcognitive decline in aging. Cerebral Cortex 2006;16(7):907–915. [PubMed: 16162855]
Peters A. The effects of normal aging on myelin and nerve fibers: a review. Journal of Neurocytology2002;31(8–9):581–593. [PubMed: 14501200]
Pfefferbaum A, Adalsteinsson E, Sullivan EV. Frontal circuitry degradation marks healthy adult aging:Evidence from diffusion tensor imaging. Neuroimage 2005;26(3):891–899. [PubMed: 15955499]
Pfefferbaum A, Sullivan EV, Hedehus M, Lim KO, Adalsteinsson E, Moseley M. Age-related decline inbrain white matter anisotropy measured with spatially corrected echo-planar diffusion tensorimaging. Magnetic Resonance in Medicine 2000;44(2):259–268. [PubMed: 10918325]
Ranganath C, Johnson MK, D'Esposito M. Left anterior prefrontal activation increases with demands torecall specific perceptual information. Journal of Neuroscience 2000;20(22):RC108. [PubMed:11069977]
Raz N, Lindenberger U, Rodrigue KM, Kennedy KM, Head D, Williamson A, et al. Regional brainchanges in aging healthy adults: general trends, individual differences and modifiers. Cerebral Cortex2005;15(11):1676–1689. [PubMed: 15703252]
Raz N, Rodrigue KM, Kennedy KM, Acker JD. Vascular health and longitudinal changes in brain andcognition in middle-aged and older adults. Neuropsychology 2007;21(2):149–157. [PubMed:17402815]
Regan D, Giaschi D, Sharpe JA, Hong XH. Visual processing of motion-defined form: selective failurein patients with parietotemporal lesions. Journal of Neuroscience 1992;12(6):2198–2210. [PubMed:1607936]
Reitan, RM.; Wolfson, D. The Halstead-Reitan Neuropsychological Test Battery: Theory and clinicalinterpretation. 2 ed.. Tucson: Neuropsychology Press; 1993.
Rey, A. L'examen clinique en psychologie. Paris: Presses Universitaires de France; 1964.Reynolds MD, Johnston JM, Dodge HH, DeKosky ST, Ganguli M. Small head size is related to low
Mini-Mental State Examination scores in a community sample of nondemented older adults.Neurology 1999;53(1):228–229. [PubMed: 10408569]
Ries ML, Schmitz TW, Kawahara TN, Torgerson BM, Trivedi MA, Johnson SC. Task-dependentposterior cingulate activation in mild cognitive impairment. Neuroimage 2006;29:485–492.[PubMed: 16102979]
Rose SE, McMahon KL, Janke AL, O'Dowd B, de Zubicaray G, Strudwick MW, et al. Diffusion indiceson magnetic resonance imaging and neuropsychological performance in amnestic mild cognitiveimpairment. Journal of Neurology, Neurosurgery and Psychiatry 2006;77(10):1122–1128.
Rose SE, McMahon KL, Janke AL, O'Dowd B, de Zubicaray G, Strudwick MW, et al. Diffusion indiceson magnetic resonance imaging and neuropsychological performance in amnestic mild cognitiveimpairment 10.1136/jnnp.2005.074336. Journal of Neurology, Neurosurgery and Psychiatry 2006;77(10):1122–1128.
Salat DH, Tuch DS, Greve DN, van der Kouwe AJ, Hevelone ND, Zaleta AK, et al. Age-related alterationsin white matter microstructure measured by diffusion tensor imaging. Neurobiology of Aging2005;26(8):1215–1227. [PubMed: 15917106]
Schmierer K, Wheeler-Kingshott CA, Boulby PA, Scaravilli F, Altmann DR, Barker GJ, et al. Diffusiontensor imaging of post mortem multiple sclerosis brain. Neuroimage 2007;35(2):467–477. [PubMed:17258908]
Schmitz TW, Kawahara TN, Johnson SC. Metacognitive evaluation, self-relevance, and the rightprefrontal cortex. Neuroimage 2004;22(2):941–947. [PubMed: 15193625]
Shenkin SD, Bastin ME, Macgillivray TJ, Deary IJ, Starr JM, Rivers CS, et al. Cognitive correlates ofcerebral white matter lesions and water diffusion tensor parameters in community-dwelling olderpeople. Cerebrovascular Diseases 2005;20(5):310–318. [PubMed: 16141715]
Smith SM, Jenkinson M, Woolrich MW, Beckmann CF, Behrens TE, Johansen-Berg H, et al. Advancesin functional and structural MR image analysis and implementation as FSL. Neuroimage 2004;23Suppl 1:S208–S219. [PubMed: 15501092]
Bendlin et al. Page 16
Dev Neuropsychol. Author manuscript; available in PMC 2011 May 1.
NIH
-PA Author Manuscript
NIH
-PA Author Manuscript
NIH
-PA Author Manuscript

Smith TW. The relationship of age to education across time. Social Science Research 1993;22:300–311.Sullivan EV, Adalsteinsson E, Hedehus M, Ju C, Moseley M, Lim KO, et al. Equivalent disruption of
regional white matter microstructure in ageing healthy men and women. Neuroreport 2001;12(1):99–104. [PubMed: 11201100]
Sullivan EV, Adalsteinsson E, Pfefferbaum A. Selective age-related degradation of anterior callosal fiberbundles quantified in vivo with fiber tracking. Cerebral Cortex 2006;16(7):1030–1039. [PubMed:16207932]
Sziklas V, Petrides M. The effects of lesions to the anterior thalamic nuclei on object-place associationsin rats. European Journal of Neuroscience 1999;11(2):559–566. [PubMed: 10051755]
Tang Y, Nyengaard JR, Pakkenberg B, Gundersen HJ. Age-induced white matter changes in the humanbrain: a stereological investigation. Neurobiology of Aging 1997;18(6):609–615. [PubMed:9461058]
Terry RD, DeTeresa R, Hansen LA. Neocortical cell counts in normal human adult aging. Annals ofNeurology 1987;21(6):530–539. [PubMed: 3606042]
Trivedi MA, Schmitz TW, Ries ML, Hess TM, Fitzgerald ME, Atwood CS, et al. fMRI activation duringepisodic encoding and metacognitive appraisal across the lifespan: Risk factors for Alzheimer'sdisease. Neuropsychologia. 2007
Wechsler, D. Wechsler Adult Intelligence Scale-Third Edition. New York: Psych Corp; 1997.Yoon B, Shim YS, Lee KS, Shon YM, Yang DW. Region-specific changes of cerebral white matter
during normal aging: A diffusion-tensor analysis. Archives of Gerontology and Geriatrics. 2007Zakzanis KK, Mraz R, Graham SJ. An fMRI study of the Trail Making Test. Neuropsychologia 2005;43
(13):1878–1886. [PubMed: 16168730]
Bendlin et al. Page 17
Dev Neuropsychol. Author manuscript; available in PMC 2011 May 1.
NIH
-PA Author Manuscript
NIH
-PA Author Manuscript
NIH
-PA Author Manuscript

Figure 1.Relationship between total white matter volume (adjusted for total intracranial volume, gender,and education) and age. The cross-sectional pattern of white matter volume across the age spanfrom eighteen years of age to eighty-three appears to follow a non-linear course. The linear fitis shown with a solid line and the quadratic fit is shown with a hatched line.
Bendlin et al. Page 18
Dev Neuropsychol. Author manuscript; available in PMC 2011 May 1.
NIH
-PA Author Manuscript
NIH
-PA Author Manuscript
NIH
-PA Author Manuscript

Figure 2.Relationship between regional white matter volume and age, as assessed using voxel-wiseanalysis. Linear regression was used in a cross-sectional sample to examine the relationshipbetween white matter volume and age. Total intracranial volume, gender, and education, wereincluded as covariates of no interest in the regression analysis. As can be seen on the glassbrain on the left, frontal, parietal, temporal, and occipital white matter volume showed anegative relationship with age. In addition, brain stem, corpus callosum, and cerebellar whitematter volume showed a negative relationship with age. Colors are representative of a T-score,shown by the color bar on the bottom right.
Bendlin et al. Page 19
Dev Neuropsychol. Author manuscript; available in PMC 2011 May 1.
NIH
-PA Author Manuscript
NIH
-PA Author Manuscript
NIH
-PA Author Manuscript

Figure 3.Relationship between regional fractional anisotropy (FA) and age, assessed using voxel-wiseanalysis, controlling for white matter volume. There was a negative relationship between FAand age in several brain white matter tracts. As can be seen in the glass brain on the left, frontalwhite matter was particularly affected, but age effects on FA could be seen throughout thebrain, including extensive portions of the corpus callosum, inferior fronto-occipital fasciculus,superior and inferior longitudinal fasciculus, internal capsule, anterior, superior, and posteriorcorona radiata, portions of the cingulum and posterior thalamic radiations.
Bendlin et al. Page 20
Dev Neuropsychol. Author manuscript; available in PMC 2011 May 1.
NIH
-PA Author Manuscript
NIH
-PA Author Manuscript
NIH
-PA Author Manuscript

Figure 4.Voxel-wise comparison: linear and non-linear relationship between FA and age. Fractionalanisotropy demonstrated a significantly greater non-linear relationship with age compared toa linear relationship, primarily in posterior brain regions such as the splenium of the corpuscallosum, large bilateral regions of occipital white matter, bilateral cerebellar white matter,right inferior fronto-occipital fasciculus, and right posterior corona radiata. Small anteriorregions also showed a significant difference between the two slopes, including left anteriorthalamic radiation, left superior corona radiata, and the right anterior limb of the internalcapsule. Colors are representative of a T-score, shown by the color bar in the top left
Bendlin et al. Page 21
Dev Neuropsychol. Author manuscript; available in PMC 2011 May 1.
NIH
-PA Author Manuscript
NIH
-PA Author Manuscript
NIH
-PA Author Manuscript
Figure 5.Voxel-wise comparison: linear and non-linear relationship between MD and age. Shown onthe left are the white matter regions where mean diffusivity demonstrated a significantly greaternon-linear relationship with age compared to a linear relationship, including the corpuscallosum, cingulum, uncinate, superior and inferior longitudinal fasciculi, superior and inferiorfronto-occipital fasciculi, internal and external capsule, anterior and posterior thalamicradiations, and short association fibers in frontal, temporal, parietal, and occipital white matter.Colors represent T-scores indicated in the color bar. On the right is a plot of mean diffusivityagainst age in the external capsule. The linear fit is shown with a solid line and the quadraticfit is shown with a hatched line.
Bendlin et al. Page 22
Dev Neuropsychol. Author manuscript; available in PMC 2011 May 1.
NIH
-PA Author Manuscript
NIH
-PA Author Manuscript
NIH
-PA Author Manuscript

Figure 6.Relationship between white matter microstructure and processing speed. Of the cognitivedomains, processing speed showed the greatest extent of relationship to the diffusion tensorimaging measures; the extent can be seen in the glass brain on the top. Regions where meandiffusivity was positively correlated with performance on Trails A included bilateral anteriorcorona radiata, bilateral superior fronto-occipital fasciculus, bilateral superior longitudinalfasciculus, bilateral internal capsule, posterior cingulum, right inferior fronto-occipitalfasciculus, and small portions of bilateral posterior corona radiata. The colors in the sagittalsection on the left represent T-scores, indicated by the color bar on the top left.
Bendlin et al. Page 23
Dev Neuropsychol. Author manuscript; available in PMC 2011 May 1.
NIH
-PA Author Manuscript
NIH
-PA Author Manuscript
NIH
-PA Author Manuscript

NIH
-PA Author Manuscript
NIH
-PA Author Manuscript
NIH
-PA Author Manuscript
Bendlin et al. Page 24
Table 1
Demographics
Group N Data Analyzed AgeMean (SD) Range
SexMale/Female
EducationMean (SD) Range
Large Sample 223 T1 49.62 (15.12), 18–83 yrs 89/134 16.15 (2.4), 12–20 yrs
Subset of Large Sample 120 T-1, DTI, and Behavioral 52.35 (14.68), 18–83 yrs. 49/71 16.08 (2.39), 12–20 yrs.
Dev Neuropsychol. Author manuscript; available in PMC 2011 May 1.

NIH
-PA Author Manuscript
NIH
-PA Author Manuscript
NIH
-PA Author Manuscript
Bendlin et al. Page 25
Table 2
Neuropsychological Test Performance: Correlations with Age
N AGE AGE (Controlling for Education)
WRATIII-R 120 r = .23 (p =.010)** r = −.18 (p = .099)
Digit Span 120 r = −.15 (p =.096) r = −.28 (p = .008)**
Trails A 120 r = .22 (p =.016)* r = .35 (p = .001)**
Trails B 120 r = .18 (p = .053)* r = .18 (p = .087)
COWAT 120 r = .08 (p = .411) r = −.02 (p =.843)
RAVLT total 93 r = −.28 (p = .006)** r = −.22 (p = .042)*
RAVLT delayed 93 r = −.27 (p = .009)** r = −.20 (p = .06)
BVMT total 118 r = −.37 (p < .001)** r = −.29 (p = .007)**
BVMT delayed 118 r = −.32 (p < .001)** r = −.27 (p = .010)**
Significant at the .05 level (2-tailed)Significant at the .01 level (2-tailed)
Dev Neuropsychol. Author manuscript; available in PMC 2011 May 1.
Copyright © 2022 FDOKUMEN