What the Voice Reveals: Within and Between-Category Stereotyping on the Basis of Voice
22
13 Chapter 2 What The Voice Reveals: Within And Between Category Stereotyping on the Basis of Voice 1 Voice and Stereotyping People have a fundamental need to make sense of the world quickly and efficiently (Fiske, 2004). As a consequence, one of the first things people do upon encountering a stranger is to use salient cues as a basis for making stereotypic inferences about that person (e.g., Bodenhausen & Macrae, 1998; Brewer, 1988; Fiske & Neuberg, 1990). Although social psychology has predominantly focused on salient visual cues associated with race, gender, and age, as a basis for categorization, the cues afforded by the voice may be equally salient in social settings, as these are some of the first cues that are encountered when meeting another person. Some of the most important of these may be those that signal the gender of the speaker because of inherent biological differences between men and women (Fitch & Giedd, 1999). Although we know of no study that examines the relationship between voice and stereotyping, it stands to reason that when people hear a voice, vocal cues signaling gender would be used to categorize the speaker’s gender and then this category information would lead to gender-stereotypic inferences. Furthermore, because these same cues also vary within gender, a more interesting possibility is that these cues may also affect gender stereotypic inferences among individuals of the same gender. In other words, stereotypic inferences may be associated with speakers depending on the variance in vocal cues, over and above any stereotyping based on gender alone. The present research was conducted to examine this possibility. Defining Vocal Cues We will refer to the set of vocal cues that define gender as the femininity/masculinity of the voice. The physical distinction between men and women (Fitch & Giedd, 1999)
-
Upload
independent -
Category
Documents
-
view
4 -
download
0
Transcript of What the Voice Reveals: Within and Between-Category Stereotyping on the Basis of Voice
13
Chapter 2
What The Voice Reveals:
Within And Between Category Stereotyping on the Basis of Voice1
Voice and Stereotyping
People have a fundamental need to make sense of the world quickly and efficiently
(Fiske, 2004). As a consequence, one of the first things people do upon encountering a
stranger is to use salient cues as a basis for making stereotypic inferences about that person
(e.g., Bodenhausen & Macrae, 1998; Brewer, 1988; Fiske & Neuberg, 1990). Although social
psychology has predominantly focused on salient visual cues associated with race, gender,
and age, as a basis for categorization, the cues afforded by the voice may be equally salient in
social settings, as these are some of the first cues that are encountered when meeting another
person. Some of the most important of these may be those that signal the gender of the
speaker because of inherent biological differences between men and women (Fitch & Giedd,
1999). Although we know of no study that examines the relationship between voice and
stereotyping, it stands to reason that when people hear a voice, vocal cues signaling gender
would be used to categorize the speaker’s gender and then this category information would
lead to gender-stereotypic inferences. Furthermore, because these same cues also vary within
gender, a more interesting possibility is that these cues may also affect gender stereotypic
inferences among individuals of the same gender. In other words, stereotypic inferences may
be associated with speakers depending on the variance in vocal cues, over and above any
stereotyping based on gender alone. The present research was conducted to examine this
possibility.
Defining Vocal Cues
We will refer to the set of vocal cues that define gender as the femininity/masculinity
of the voice. The physical distinction between men and women (Fitch & Giedd, 1999)
14
dictates that men, on average, would have more masculine voices than women, and hence a
speaker’s gender can be easily determined on the basis of voice (Coleman, 1976; P. Smith,
1979). There seems to be both biological and cultural bases for this gender difference. For
instance, differences in body size and vocal tract morphology dictate that men’s voices on
average will be more resonant (Fant, 1966; Fitch & Giedd, 1999) and lower pitched than that
of women’s (Graddol & Swann, 1983; Rendall, Kollias, Ney, & Lloyd, 2005). Whereas
factors such as men’s (as compared to women’s) restricted pitch variability and tendency to
use the lowest part of their pitch register, has been suggested to be culturally based
(Aronovitch, 1976; Graddol & Swann, 1983). Whatever the bases, it is clear that many
aspects of men and women’s vocal characteristics differ. So when the credit card clerk Chris’
telephone greeting sounds masculine, one would categorize Chris as a man but if Chris’s
voice sounds feminine then one is likely to instead categorize Chris as a woman. Even if we
know of no such empirical work to date, it stands to reason that gender-consistent stereotypic
inferences would ensue on the basis of gender-categorizing Chris—a male Chris might be
seen as assertive, analytical, and cold, whereas a female Chris might be seen as sensitive,
kind, and gossipy. From our vantage point, a more interesting possibility is that this same
gender-signaling set of cues may also be used to stereotype people within each gender
category. That is, voices within each gender naturally vary in the degree to which they
contain feminine (vs. masculine) cues (e.g., high pitch)2—just as a male Chris’ vocal
femininity differs from another male clerk’s, a female Chris’ vocal femininity would also
differ from another female clerk’s. Consequentially, listeners’ stereotypic inferences may not
only be confined to those ensuing on the basis of between-gender categorization but also on
the basis of this variance in vocal femininity within gender. Putting this in the context of
Chris, our credit-card clerk—perhaps a more feminine-sounding Chris would lead us to
associate more female stereotypic qualities with him/her (e.g., sensitive, kind, gossipy), and a
15
more masculine-sounding Chris would lead us to associate more male-stereotypic qualities
with him/her (e.g., assertive, analytical, cold), regardless of whether Chris is a man or a
woman.
Work by Blair and colleagues, focusing on the association between racial stereotypes
and facial features (e.g., Blair, Judd, Sadler, & Jenkins, 2002; Blair, Judd, & Chapleau, 2004;
Blair, Judd, & Fallman, 2004) provides support for this distinction between category-based
and (within-category) feature-based stereotyping. Even though these findings are confined to
the visual rather than the auditory domain, they, nonetheless support our general theoretical
framework.
Overview of Current Research
We designed a series of studies to examine the role of vocal cues in gender
stereotyping. In the first study, we collected vocal samples from male and female speakers to
verify that voices can be reliably scaled (within each gender) on femininity. We also
conducted a preliminary examination of the specific acoustic characteristics (e.g., pitch,
resonance) associated with femininity. Two additional studies were then conducted to
determine whether vocal femininity would lead to gender stereotypic inferences, over and
above the influence of gender category. In Study 2.2, we examined this question by holding
the gender category of the voices constant: For some participants, all stimulus voices were
clearly male, for others, they were all clearly female. In Study 2.3 participants judged voices
of both genders. Here our goal was to determine whether both gender category and (within
category) feature-based stereotyping could be observed simultaneously.
Study 2.1
The goal of this study was to determine if, within each category, male and female
voices could be reliably scaled on the degree to which they sounded feminine. A secondary
goal of this study was to examine some of the acoustic characteristics that might be

16
associated with speakers’ gender category and vocal femininity. To do this, we recruited two
sets of participants for the study, one set whose voices were recorded and another who judged
those recorded voices on femininity. We then analyzed several acoustic characteristics of the
voices and examined their relation with gender category and vocal femininity.
Method
Recording Participants and Procedure
One hundred and twelve undergraduate students (54 male and 58 female) at the
University of Colorado were recorded in exchange for partial fulfillment of course credit or
monetary compensation. All were native English speakers with an average age of 19 years
(SD = 2.33 years).
We recorded the participants in a quiet room using a head-worn microphone and the
software Sound Studio installed on IMAC computers. During the recording session the
participants read several passages, one of which was the “Rainbow Passage” (Fairbanks,
1940 p.127), which is the only passage that was used as stimuli in the research reported in
this article. This passage is commonly used in voice research for a number of reasons, the
most relevant for our purpose being its unvalenced content and neutrality with regard to
gender stereotypes (e.g., Addington, 1968; Batstone & Tuomi, 1981; Ray, 1986). From these
recordings, 47 female voices and 47 male voices, saying the first two sentences of the
“Rainbow Passage”, were used as the final stimuli. We had to discard 11 of the female and 7
of the male recordings because they contained too many reading errors.
Judgment Participants and Procedure
Fifty-four undergraduate students (24 male and 30 female) at the University of
Colorado provided judgments of the recorded voices, in exchange for partial fulfillment of
course credit or monetary compensation. These participants were assigned to judge either the
male or the female voices. Each participant listened to the 47 voices in the assigned set,
17
played in one of three random orders, and rated each voice on femininity, using a 1 (not at
all) to 7 (very) scale.3
Analysis of Acoustic Characteristics
Our choice of acoustic characteristics was guided by results from established
acoustical research (e.g., Byrd, 1994; Coleman, 1976; Graddol & Swann, 1983; Kramer,
1977; Peterson & Barney, 1952; Ray, 1986; Tusing & Dillard, 2000; Whiteside, 2001).
Specifically, we chose cues that have been associated with gender. Although the list of
acoustic cues that we selected is far from exhaustive, our chosen cues of pitch (Coleman,
1976; Graddol & Swann, 1983), variability in pitch (Graddol & Swann, 1983; Aronovitch,
1976), formant frequency (Coleman, 1976; Fitch & Giedd, 1999; Peterson & Barney, 1952;
Whiteside, 2001), and speech rate/duration (Byrd, 1994; Aronovitch, 1976) were some of the
cues shown to differ most consistently between gender. Our primary goal was to examine
whether these cues, that are distinct between genders, are also related to perceptions of vocal
femininity within each gender.
In our measurement of these cues, we combined the controlled methods commonly
used in acoustical research (see Peterson & Barney, 1952) with a more real-world method.
Namely, the “Rainbow Passage”, upon which we base our acoustic measurements, is
controlled in that the same passage is spoken by all voices but concurrently more “real-
world” in that it is in complete sentences which seems more akin to what listeners hear
everyday than single syllables that are frequently used in acoustic analyses (for an exception
see Graddol & Swann, 1983).
Pitch. The pitch of a voice is measured by its fundamental frequency (F0) in Hertz
(Hz), an index of the number of vibrations per second of the vocal folds to produce phonation
(Fitch, 1994; Tusing & Dillard, 2000). Higher pitched voices are expected to be judged as
more feminine.
18
Resonance. The resonance of the voice is akin to the timbre of an instrument and, as
such, is orthogonal to the pitch (Fitch, 2002): A violin and a cello may be playing the same
middle C but the two instruments will have quite different resonant qualities which provide a
direct auditory cue to the instruments’ different sizes. Only relatively recently did Fitch
(1997) introduce a reliable way to measure the resonance of the voice through what he
termed the “formant dispersion” (Df). Df is derived by averaging the distance between
adjacent pairs of formant frequencies (also measured in Hz). When formant frequencies are
closer together, the Df will be lower, which translates to a more resonant voice, one which
may be perceived to be less feminine.
Pitch variability. Momentary variability in pitch during speech was assessed by
calculating the standard deviations of pitch (SD of pitch) across the vocal sample for each
voice. More variability in pitch is akin to a less monotone (more “sing-song”) voice, which
may be perceived as more feminine.
Speech duration. This was defined as the time taken to say the first two sentences
from the “Rainbow Passage,” including both the spoken and silent parts of each voice clip, in
seconds.
The vocal analysis software Wavesurfer (Sjölander & Beskow 2002) outputted the F0
and the first four formant frequencies for each of the 47 male and 47 female voice clips. To
assess the four vocal characteristics, for each voice we averaged the F0, computed and
averaged the Df from the four formant frequencies (as detailed in Fitch, 1997), and computed
the SD of F0. The software Sound Studio outputted, for each voice, the time taken to read the
first two sentences of the passage.
19
Results and Discussion
Judgments of Femininity
To examine the reliabilities of the mean femininity scores for each voice, the
individual feminity ratings (for each voice by each participant) were analyzed with a two-way
analyses of variance within the male and female voice sets, treating judges/participants as one
factor and voice as another. From these analyses, variance components were estimated and
intraclass correlations (due to voice, treating participants as a random factor; ICC 2.1 from
Shrout & Fleiss, 1979) were calculated in order to estimate the reliabilities of the resulting
vocal femininity values (following procedures outlined in Judd & McClelland, 1998). For the
female voices, the mean femininity score was 4.44 (SD = 1.60) and the reliability of the voice
means was .96. For the male voices, the mean femininity score was 3.58 (SD = 1.62) and
their reliability was .95. Not surprisingly, the female voices were rated to be significantly
more feminine than the male voices, F(1, 92) = 12.18, p < .001.
These data clearly demonstrate that voices can be reliably scaled on femininity. There
was high consensus among the participants on the voices’ femininity, even though they were
not told which vocal cues they should attend to in making their judgments. As a consequence,
the mean femininity score for each voice will be used throughout the research reported in this
paper to define that voice’s standing on perceived femininity.
Acoustic Characteristics, Gender Category and Judged Femininity
Having established the reliability of the femininity ratings, we now turn to the
question of the extent to which the acoustic characteristics we measured are related to the
speakers’ gender category and the perceived femininity of the voices within each gender.
Means (and standard deviations) for the four acoustic cues are given in the top half of Table
2.1, broken down by the gender of the voices. Presented in the bottom half of Table 2.1 are
the bivariate and partial correlations (partialling out the other three acoustic cues) between
20
speakers’ gender category (0=male; 1=female) and each acoustic cue. The pitch, resonance,
and variability of pitch were strongly, positively correlated with category, which is consistent
with past acoustical research showing gender differences in voice (e.g., Coleman, 1979;
Graddol & Swann, 1983). However, contrary to research suggesting gender differences in
speech duration (Byrd, 1994), we did not find such a relationship. A plausible cause may be
the short length and uniformity of the text (i.e., the “Rainbow Passage”) that did not allow for
speakers to show much variability on this dimension. In the partial correlations, pitch and
resonance remained significantly related to category.
Table 2.2 presents both simple correlations of each of the four acoustic characteristics
with judged vocal femininity and partial correlation coefficients for each characteristic
controlling for the others. For the female voices, the bivariate correlations suggest that those
voices that were judged as more feminine had higher pitch, were less resonant, and were
more variable in their pitch, with the latter two correlations only marginally significant. In the
partial correlations, both pitch and resonance showed significant partial relations with
femininity. In the case of the male voices, the bivariate correlations suggest that higher voices
and those with more variable pitch were judged as higher in femininity. In the partial
correlations, only pitch manifested a significant partial relation with femininity.
Comparisons between the results of Tables 2.2 and 2.3 showed that the acoustic cue
of pitch, which yielded the largest correlation with gender category, was also the cue that was
most highly correlated with perceptions of vocal femininity, both within male and female
voices. Resonance and pitch variability showed correlations both with category and with
female vocal femininity, albeit weaker with the latter, but only variability was related to male
vocal femininity. The partial relations between acoustic cues and category were also apparent
between acoustic cues and femininity, though within male voices, only pitch yielded a
significant effect over and above the other cues.
21
Obviously, these results are preliminary and the measured acoustic cues are far from
exhaustive in that other potentially important acoustic characteristics, such as vocal energy or
volume, were not assessed. Nonetheless, these acoustic cues yielded some interesting
patterns. Specifically, cues of pitch, resonance, and variability in pitch that distinguished
between speakers’ gender category were also the same cues that were important determinants
of the degree to which voices within gender were perceived to be feminine.
Study 2.2
Having shown in Study 2.1 that there is variance in the femininity of both male and
female voices, and that listeners can detect this variance with high consensus, the purpose of
our second study was to demonstrate that listeners spontaneously make gender-stereotypic
inferences on this basis. Thus, the participants in this study either made judgments about a set
of voices that were clearly identifiable as female or about a set of voices that were clearly
identifiable as male. In other words, the gender of the voices was kept constant for each
participant and the question of interest was whether within-gender variation in vocal
femininity (as judged in Study 2.1) would predict participants’ judgments.
To assess more spontaneous inferences that participants might make on the basis of
vocal cues, without explicit instructions to make impression ratings, we adapted the
experimental procedure used by Blair et al. (2002). Specifically, the participants were lead to
believe that the study was about accuracy in interpersonal judgments and, accordingly, they
were asked to read several short self-descriptions and, following each description, to judge a
series of voice clips on the probability that each speaker was the person who wrote the
description. The self-descriptions varied in the degree to which they depicted someone who
was stereotypically female or male and in the person’s likeability (valence). Our purpose was
to assess, for each of the self-descriptions, the extent to which participants’ probability
ratings of the male or female voices were associated with the voices’ femininity. We

22
predicted that, within each gender, more feminine voices would be seen as more probable for
the female-stereotypic self-descriptions and as less probable for the male-stereotypic self-
descriptions. We included valence as a factor in the study since this is an inherent aspect of
stereotypes and of social judgment, more generally. However, we did not make a clear
prediction of how the valence of the self-descriptions might influence the judgments of more
or less feminine sounding voices. Over the years, researchers have suggested that women are
viewed more negatively than men (Broverman, Broverman, Clarkson, Rosenkrantz, & Vogel,
1970; Rosenkrantz, Vogel, Bee, Broverman, & Broverman, 1968), that women are viewed
more positively than men (Eagly & Mladinic, 1989; Eagly, Mladnic, & Otto, 1991), and most
recently, that feelings toward women are often ambivalent and depend on the context and
salience of particular attributes (Fiske, Xu, Cuddy, & Glick, 1999; Glick & Fiske, 1996;
Glick, Diebold, Bailey-Werner, & Zhu, 1997). In sum, the valence findings to date are mixed.
Thus, we were most interested in judgment variance due to the confluence of voice
femininity and the stereotypicality of the self-descriptions, leaving open the question of
whether judgments might also be influenced by the valence of the descriptions.
Method
Participants
Seventy-four undergraduate students at the University of Colorado participated for
partial fulfillment of course credit or monetary compensation. Equal numbers of these
students were male and female.
Stimuli
Written self-descriptions. We developed eight different “self-descriptions” of three to
four sentences each. Two of the descriptions were stereotypically-female and positively
valenced (e.g., “As an elementary school teacher, I like to create an environment where
students learn to cooperate and build self-confidence…”), two were stereotypically-female
23
and negative valenced (e.g., “Most of the time I stay home and watch soap operas …”), two
were stereotypically-male and positively valenced (e.g., “As an engineer, I thrive on solving
challenging problems…”), and two were stereotypically-male and negatively valenced (e.g.,
“I have always been so immersed in my work that I never had the time to make any
friends…”). Thus, there were 4 types of self-descriptions, varying in stereotypicality and
valence.4
Voices. We selected a set of 20 female and a set of 20 male voices reading the
“Rainbow Passage” from the voices scaled in Study 2.1. The mean femininity ratings for
these voices (and standard deviations) were very similar to those obtained for the full set of
voices in Study 2.1. To ensure that the gender of these voices was unambiguous, these female
and male voices were intermixed and a new group of 30 participants was asked to categorize
each voice as quickly as possible. The results showed that the 20 female voices were
categorized as female 99% of the time and the 20 male voices were categorized as male
100% of the time.
Procedure
Upon arrival, participants were seated at individual computers with headphones and
told that they would be involved in a probability judgment task with the aim of matching the
speakers with the appropriate self-descriptions. They were further told that past research in
visual perception showed people to be very accurate in their interpersonal judgments, and
that through the present study, we were examining if this held true for judgments based on
the voice. Participants then received one of the eight self-descriptions. They were asked to
read the self-description carefully and to imagine what the person who wrote the self-
description might sound like so that they could identify that person from among the set of 20
voices that would follow. After the participants had read the description, they either heard the
set of 20 female voice clips or the set of 20 male voice clips.5 For each of the voice clips, they
24
were asked to estimate the probability, on a 0 to 100 scale, that the person speaking was the
one who wrote the self-description. After completing the probability ratings for all 20 male or
20 female voice clips, the participants repeated the procedure with the other seven self-
descriptions. Participants were asked to rate the set of 20 voice clips each time without letting
previous ratings influence their judgments. The order of the voice clips and self-descriptions
was randomized for each participant. After completing the ratings, participants were
debriefed and dismissed.
Analysis
Each participant made probability ratings of the 20 male or female voices for each of
the 8 self-descriptions that varied according to a 2 (Stereotypicality: female vs. male) by 2
(Valence: positive vs. negative) design. Of interest was the degree to which higher
probabilities would be assigned to more feminine-sounding voices (within each gender) in
the stereotypically female descriptions. Thus, our analytic approach involved a multilevel
estimation procedure, estimating regression models within each participant and within each
self-description (following Blair et al., 2002). In these regressions, each participant’s
probability ratings for the 20 voices for a particular self-description served as the criterion.
These were regressed on one predictor variable (across the 20 voices): the femininity mean
scale values of the voices from the pretest.
For each participant and for each self-description, these regressions yielded a slope
for femininity that became the data for higher-level analyses. A positive slope means that
probability ratings for a given self-description provided by a given participant increase as
vocal femininity increases. A negative slope means they decrease. To determine if the effect
of vocal femininity on probability judgments varied as a function of the valence and
stereotypicality of the self-descriptions, we averaged the slopes for each participant across the
two self-descriptions that had the same valence and the same stereotypicality values. These
25
average slopes (four for each participant) then became the data on which we subsequently
performed analyses of variance with valence and stereotypicality of the self-descriptions as
within-subjects factors.
Results
Table 2.3 presents the mean within-participant slopes for femininity, for each type of
self-description and for both the female and male voices.6 All of these mean slopes are
significantly different from zero, indicating that femininity of voice was used in making the
probability ratings for each type of self-description: for the female-stereotypic self-
descriptions, the higher the femininity of the voice, the higher the probability ratings; for the
male-stereotypic self-descriptions, the higher the femininity, the lower the probability
ratings.7
Female Voices
Unsurprisingly, given the fact that all slopes were significant and in the predicted
directions, the slopes for the female voices showed a large difference as a function of the
stereotypicality of the self-descriptions, F(1, 38) = 193.75, p < .001. The slopes also
manifested a valence difference, F(1, 38) = 9.13, p < .005, such that more feminine voices
were seen as more probable for the negatively-valenced self-descriptions than the positively-
valenced self-descriptions. These differences were qualified by a stereotypicality by valence
interaction, F(1, 38) = 4.22, p < .05. Simple effects tests revealed that the predicted
stereotypicality difference was significant for both positive and negative self-descriptions, but
it was somewhat larger in the latter case, F(1, 38) = 108.65, p < .0001, and F(1, 38)=135.55,
p < .0001, respectively.
Male Voices
In the case of the male voices, there was a large difference between the slopes for the
male-stereotypic and female-stereotypic self descriptions, F(1, 34) = 157.92, p < .0001, again
26
with more feminine-sounding male voices rated as more probable for the female-stereotypic
descriptions and more improbable for the male-stereotypic descriptions. There was neither a
valence difference in these slopes, nor a valence by stereotypicality interaction.
Discussion
The data from this study strongly suggest that participants use differences in vocal
femininity within voices of the same gender to make inferences about what speakers are like,
with more feminine-sounding voices deemed more probable for female-stereotypic
descriptions and less probable for male-stereotypic descriptions.
Although this basic effect strongly held for voices of both genders, there were some
interesting (and unpredicted) gender differences. For the female voices, although more
feminine voices were judged more probable for the female-stereotypic self-descriptions and
less probable for the male-stereotypic ones, this difference was larger for the negatively-
valenced descriptions than for the positively-valenced ones. No such interaction emerged for
the male voices. Since this difference was not predicted, we hesitate to attach theoretical
importance to it, pending its replication.
The bottom line from this study is that vocal femininity is used to make inferences
about gender stereotypic attributes of speakers, even when gender does not vary and thus its
salience is minimized. An obvious objection, however, to these results is that when decisions
could not be made on the basis of gender category, the participants had no choice but to rely
on differences in vocal femininity within a category to make their judgments. Indeed, in the
categorization literature, there is evidence that when stimuli can be categorized, between-
category differences are accentuated while within-category differences are minimized
(Corneille, Klein, Lambert, & Judd, 2002; Ford & Stangor, 1992; Tajfel & Wilkes, 1963). In
the context of the stereotyping literature, many dominant models of the link between
categorization and stereotyping also suggest that category effects may be potent enough to
27
leave little room for within-gender variations to play a role in stereotyping (e.g.,
Bodenhausen & Macrae, 1998; Brewer, 1988; Brewer, 1996; Fiske & Neuberg, 1990).
Consider, for instance, a quotation from an authoritative source (Fiske & Taylor, 1991):
"Once a person is categorized as Black or White, male or female, young or old, the
stereotypic content of the schema is likely to apply regardless of how much or how little the
person looks like the typical category member" (p. 121). If we substitute "sounds like" for
"looks like," this seems to leave little role for within gender differences when gender
category also varies. So, if we want to show that vocal femininity is used even in a context
when there are other useful cues that might be exclusively relied upon (such as the speaker’s
gender), then it is important to demonstrate the effects of (within-gender) vocal femininity on
stereotypic inferences in a context in which judgments are asked of a mixed set of male and
female voices. Our third study therefore examined whether stereotypic inferences would be
made on the basis of within-gender vocal femininity even when the voices obviously differed
in gender.
Study 2.3
Method
Participants
Thirty-eight undergraduate students at the University of Colorado participated for
partial fulfillment of course credit. Of these students, 28 were female and 10 were male.
Materials and Procedure
The materials and procedure were the same as those used in Study 2.2 with two
exceptions:
1) Each participant judged 30 voices in this study, 15 female and 15 male, for each
self-description. These voices were selected from among those used in Study 2.2. As before,
28
each voice was easily identifiable as female or male, and within each gender, the voices
varied in judged femininity.
2) Because the participants were asked to rate more voices in this study, only four
self-descriptions were used rather than eight. Thus, there was only one self-description in
each of the cells resulting from the crossing of gender stereotypicality with valence.
Analysis
Our questions that guided this study were slightly different from those of the previous
study. First, we wanted to estimate the effects of gender categorization on stereotyping. For
this purpose, we coded the gender of each voice using a contrast code, +1 if female, -1 if
male. And then, in the within-participant regression models, we regressed the probability
ratings of the 30 mixed gender voices on this contrast-coded predictor.
Second and more importantly, we wanted to see if even over and above gender
category the judged femininity of the voice would affect stereotypic inferences. Accordingly,
in the second set of within-participant regression models, the contrast-coded category
variable and the mean scale values of femininity were simultaneously used as predictors.
Results
Presented in the top half of Table 2.4 are the mean within-participant slopes for
gender category from the first model, where it alone was used to predict probability ratings.
All category slopes were significantly different from zero and in the expected direction:
Female voices were rated to be more probable for female-stereotypic self-descriptions and
male voices more probable for male-stereotypic self-descriptions. Unsurprisingly these slopes
showed a highly significant stereotypicality difference, F(1, 37) = 198.92, p < .0001. In
addition, they manifested a difference due to valence, F(1, 37) = 4.81, p < .05, and a
stereotypicality by valence interaction, F(1, 37) = 37.30, p < .0001. As shown in Table 2.4,
gender category resulted in stereotypic inferences for both positive and negative self-
29
descriptions, but the influence was stronger in the latter, F(1, 37) = 196.10, p < .0001 than in
the former, F(1, 37) = 48.01, p < .0001.
Mean partial slopes when both gender category and femininity were used to predict
probability ratings for the self-descriptions are presented in the lower half of Table 2.4. The
mean partial slopes for gender category remained very similar to what they were in the model
that did not control for femininity. Specifically, they varied as a function of stereotypicality,
F(1, 37) = 116.67, p < .0001, valence, F(1, 37) = 4.94, p < .05, and the interaction of
stereotypicality and valence, F(1, 37) = 57.70, p < .0001.
In the case of femininity, over and above gender category, all slopes (with the
exception of the slope for the negative male-stereotypic description) were significantly
different from zero. These significant slopes indicate that vocal femininity continued to be
used to make inferences within-gender, even when gender category was an available and
influential cue for judgment. As expected, the femininity slopes varied significantly as a
function of the descriptions’ stereotypicality, F(1, 37) = 75.48, p < .0001, with more feminine
sounding voices given higher probability ratings for the female-stereotypic self-descriptions,
whereas the opposite was the case for the male-stereotypic ones, controlling for gender
category. The significant interaction of stereotypicality and valence, F(1, 37) = 67.08, p <
.0001, suggested that the stereotypic inferences were stronger in the case of the positively
valenced self-descriptions than in the case of the negatively valenced ones, F(1, 37) = 134.05,
p < .0001, and F(1, 37) = 13.71, p < .001.8
Discussion
In this study, where voices differed in gender, one might have supposed, following
the prevailing models of stereotyping discussed earlier, that categorization by gender would
be the only factor that affected stereotypic inferences. This was definitely not the case: While
male and female voices were clearly judged differently, the effect of vocal femininity within
30
gender remained very potent. Within gender, those voices with higher femininity were given
higher probability ratings in the female-stereotypic self-descriptions (and lower probabilities
in the male-stereotypic ones), and this was true even while the gender of the voice exerted a
large and significant effect on stereotypic inferences. Clearly gender stereotyping by voice is
not based exclusively on the gender category of the target individual: Vocal femininity within
gender continues to have a large impact on the types of trait inferences that are made.
We did not make predictions about differences in the role of either gender or vocal
femininity as a function of the valence of the self-descriptions. Researchers have suggested
that women may be viewed both positively and negatively, depending on the context and
specific attributes (Fiske et al., 1999; Glick & Fiske, 1996; Glick et al., 1997). The
inconsistent results with regard to evaluation across the studies may reflect such ambivalence.
In Study 2.2, women’s vocal femininity resulted in stronger stereotypic inferences for
negatively than positively valenced self-descriptions; men’s vocal femininity did not show
such valence effects. In Study 2.3, stereotypic inferences based on gender category were
stronger for negatively than positively valenced self-descriptions, but stereotypic inferences
based on femininity, controlling for category, were stronger for positively than negatively
valenced self-descriptions. Since the voices and self-descriptions varied across the studies,
systematic research is needed to establish which effects are replicable and theoretically
important. At present, it is difficult to draw any conclusions on the valence findings except to
say that stereotyping based on vocal cues may be influenced by the valence of the attributes.
More importantly, despite these variations, both studies showed that vocal femininity was a
strong predictor of stereotypic inferences, and in both studies this was true for both positive
and negative attributes.
31
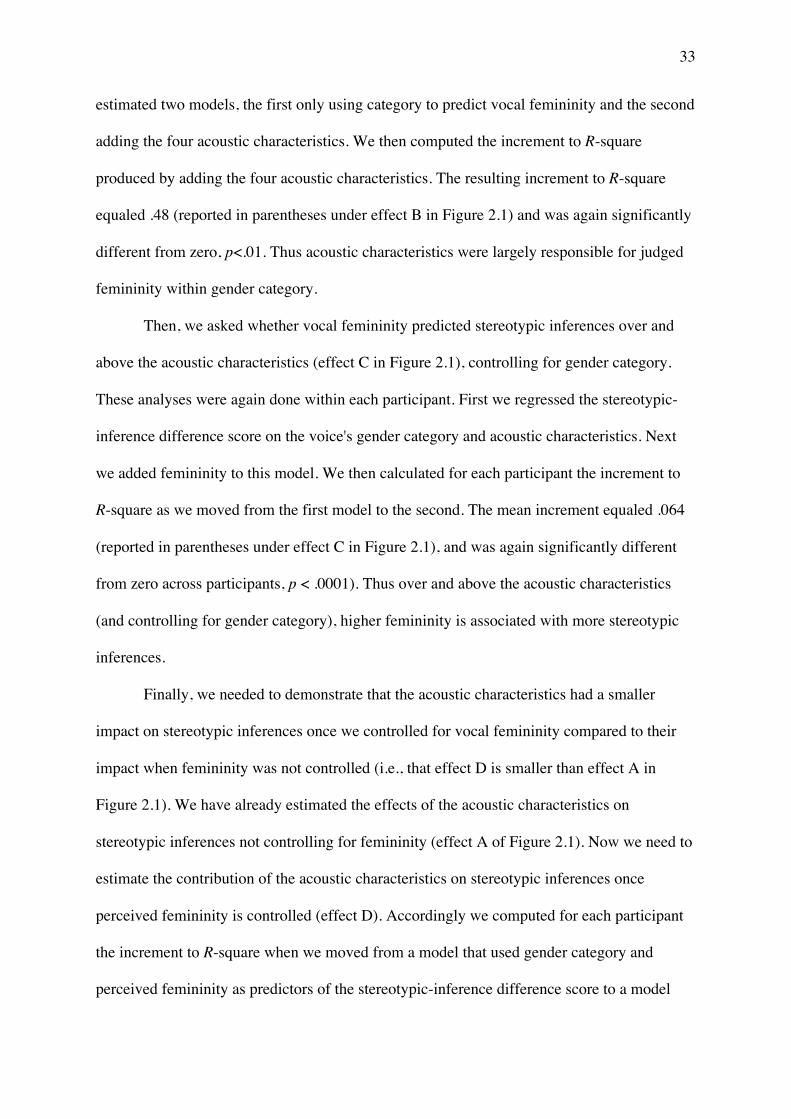
Acoustic Characteristics, Perceived Femininity, and Stereotypic Inferences
Our findings as a whole led us to posit a theoretical model about the joint
relationships among the acoustic characteristics (measured in Study 2.1), perceived
femininity, and stereotypic inferences made on the basis of the voices. In Study 2.3 we
showed that over and above gender category, stereotypic inferences were made on the basis
of vocal femininity. Ultimately we would argue that it is the acoustic characteristics of the
voices that give rise to perceived femininity, which in turn gives rise to the stereotypic
inferences we have documented. Accordingly, it seemed to us that an appropriate mediational
model was one in which, controlling for gender category, acoustic characteristics affect
stereotypic inferences through perceived femininity. The model that we would suggest is
diagrammed in Figure 2.1. In the top half of the figure, we represent the total effect of the
acoustic characteristics on stereotypic inferences. Then in the bottom, we present the
mediated model, with part of the total effect of the acoustic characteristics on stereotypic
inferences mediated via perceived femininity.
To demonstrate support for the proposed mediational model, a series of conditions
must be met (Baron & Kenny, 1986; Judd & Kenny, 1981). First we must show that the
acoustic characteristics have an effect on stereotypic inferences, over and above gender
category (effect A in the model at the top of Figure 2.1). Second, it is important to show that
these characteristics also affect perceived femininity, again controlling for gender category
(effect B in the mediational model at the bottom of the Figure). Third, controlling for both
category and acoustic characteristics, it should be the case that perceived femininity affects
stereotypic inferences (effect C in the mediational model). And finally, the direct effect of the
acoustic characteristics on stereotypic inferences should be reduced once we control for
perceived femininity (i.e., the residual effect D in the mediational model should be smaller
that the total effect A). Using the data from Study 2.3, in which probability judgments were
32
made about 15 female and 15 male voices in the four kinds of self-descriptions, we examined
these four conditions, thus testing the mediation model of Figure 2.1.
The assessment of mediation in the present case is somewhat complicated by the
multilevel nature of the data, requiring some models to be estimated within-participants and
some not. Accordingly, to simplify things as much as possible, we computed for each
participant and for each of the 30 voices a stereotypic inference score: the degree to which a
voice was given a higher probability by that participant in the two female-stereotypic self-
descriptions than in the two male-stereotypic self-descriptions. Thus, rather than presenting
four different mediational models, one for the probabilities given for each of the four self-
descriptions in Study 2.3, we present only one model, with the stereotypic-inference
dependent variable representing the extent to which a given voice is judged more probable in
the female than the male self-descriptions.
To assess the total effects of acoustic characteristics on stereotypic inferences (effect
A), we estimated two models for each participant, one regressing the stereotypic-inference
score only on the gender category of each voice and the second including both gender
category and the four acoustic characteristics as predictors. We then computed the difference
in the R-squares between these two models (for each participant)9 and then tested (across
participants) whether the mean increment to R-square, as a function of adding the acoustic
characteristics, was significant. The resulting mean increment to R-square was .131 (reported
in parentheses under effect A in Figure 2.1), a value that differed significantly from zero,
p<.0001. Thus, the acoustic characteristics show an overall effect on stereotypic inferences
over and above gender category.
Next, we wanted to demonstrate that for the voices used in Study 2.3, the acoustic
characteristics predicted vocal femininity (as determined in the pretest), again over and above
category membership (effect B in Figure 2.1). Across the 30 voices used in Study 2.3, we
33
estimated two models, the first only using category to predict vocal femininity and the second
adding the four acoustic characteristics. We then computed the increment to R-square
produced by adding the four acoustic characteristics. The resulting increment to R-square
equaled .48 (reported in parentheses under effect B in Figure 2.1) and was again significantly
different from zero, p<.01. Thus acoustic characteristics were largely responsible for judged
femininity within gender category.
Then, we asked whether vocal femininity predicted stereotypic inferences over and
above the acoustic characteristics (effect C in Figure 2.1), controlling for gender category.
These analyses were again done within each participant. First we regressed the stereotypic-
inference difference score on the voice's gender category and acoustic characteristics. Next
we added femininity to this model. We then calculated for each participant the increment to
R-square as we moved from the first model to the second. The mean increment equaled .064
(reported in parentheses under effect C in Figure 2.1), and was again significantly different
from zero across participants, p < .0001). Thus over and above the acoustic characteristics
(and controlling for gender category), higher femininity is associated with more stereotypic
inferences.
Finally, we needed to demonstrate that the acoustic characteristics had a smaller
impact on stereotypic inferences once we controlled for vocal femininity compared to their
impact when femininity was not controlled (i.e., that effect D is smaller than effect A in
Figure 2.1). We have already estimated the effects of the acoustic characteristics on
stereotypic inferences not controlling for femininity (effect A of Figure 2.1). Now we need to
estimate the contribution of the acoustic characteristics on stereotypic inferences once
perceived femininity is controlled (effect D). Accordingly we computed for each participant
the increment to R-square when we moved from a model that used gender category and
perceived femininity as predictors of the stereotypic-inference difference score to a model
34
that included these two plus the acoustic characteristics. Across participants, the resulting
mean increment to R-square was .104 (reported in parentheses below effect D in Figure 2.1),
again significantly different from zero, p < .0001.
For each participant we could then compute the difference between the two
increments to R-square due to the acoustic characteristics, comparing the model where
femininity was not controlled (effect A in Figure 2.1) with the model where femininity was
controlled (effect D in Figure 2.1). On average, the increment to R-square due to the acoustic
characteristics was .027 less when femininity was controlled compared to when femininity
was not controlled (i.e., effect A minus effect D: .131 - .104) and, again across participants,
this mean difference was significantly different from zero, p < .05). Accordingly, we can
conclude that the residual direct effects of the acoustic characteristics on stereotypic
inferences once femininity is controlled (effect D) are smaller than the total effects of those
characteristics when femininity is not controlled (effect A).
In sum, these analyses provide consistent support for the mediational model we have
suggested. The acoustic characteristics as a set affect stereotypic inferences about the voices
in part because they affect judgments of vocal femininity, which in turn leads to stereotypic
inferences. That said, however, it is important to recognize that the mediation we have
examined is only partial. There remain substantial effects of the acoustic characteristics on
stereotypic inferences even controlling for judged femininity (effect D is highly significant).