WGU Indiana Alumni: Great Jobs and Great Lives - IN.gov
39
-
Upload
khangminh22 -
Category
Documents
-
view
4 -
download
0
Transcript of WGU Indiana Alumni: Great Jobs and Great Lives - IN.gov


WGU Indiana Alumni: Great Jobs and Great Lives
2 0 2 0 U N D E R G R AD U ATE A L U MN I S C O R E C A RD

<1% 93%WGU Indiana alumni who say
someone at WGU Indiana helped
them find a job after graduation
WGU Indiana alumni who are satisfied
or extremely satisfied with the
education they received
V A L U E A N D P R E P A R A T I O N
%4 + %5
WGU Indiana prepared me well for
life outside of college.67%
My education from WGU Indiana was worth
the cost (among 59% of WGU Indiana alumni
with loans*).
91%
My education from WGU Indiana was
worth the cost (overall).91%
WGU Indiana College Value Index
3
2 0 2 0 W G U I N D I A N A R E S U L T S S U M M A R Y
22%
23%
31%
69%
68%
36%
33% WGU Indiana alumni who strongly agree
to all three work fulfillment questions
Agree (%4) Strongly agree (%5)
W O R K F U L F I L L M E N T * *
%4 + %5
I am deeply interested in the work that I do. 85%
My job gives me the opportunity to
do work that interests me.82%
I have the ideal job for me. 71%
Agree (%4) Strongly agree (%5)
33%
31%
30%
38%
51%
55%
*Among alumni who took out undergraduate loans to attend WGU Indiana
**Work fulfillment questions were only asked of alumni who indicated they are employed full time by an employer
Copyright © 2020 Gallup, Inc. All rights reserved.

Methodology Summary
4
482WGU Indiana
Undergraduate Alumni
Survey Completes
WGU Indiana alumni who received
their bachelor’s degree between
2010 and 2019 and had a valid
email address on file were invited to
participate.
Gallup Alumni Survey
(GAS) Core Survey
Includes custom items developed
by Gallup and the Indiana
Commission for Higher Education
Survey Fielded:
Jan. 20-Feb. 18, 2020
Nonresponders received up to five
email reminders.
Comparison Groups Are Derived From the Gallup
Alumni Survey National Database (2010-2019)
College graduates nationally: n=5,387
Non-traditionally aged graduates (graduated at age 25+): n=2,005
Copyright © 2020 Gallup, Inc. All rights reserved.

Profile of Respondents
5
11%
14%
34%
51%
43%
26%
4%
5%
4%
<$12,000 $12,000-$35,999 $36,000-$59,999 $60,000-$119,999
$120,000-$239,999 $240,000+ Don't know
Total Annual Household Income
Total Annual Personal Income
Undergraduate Alumni Who Graduated From 2010-2019
n=482 | Mean age=43
Note: Due to rounding, percentages may sum to 100% +/-1%. Numerical values are shown when 4% or higher.
69% 31%
First-Generation Student
Yes No
94%
4%
Race
White Black Asian Hispanic Other
98%
Retired
Yes No Don't know
29%
68%
Gender
Male Female Prefer not to answer
Copyright © 2020 Gallup, Inc. All rights reserved.

Great Jobs: Workplace Engagement
6
7 Employment Outcomes
11 Gallup’s Employee Engagement Measures
12 Engagement Index
13 Workplace Fulfillment
14 Career Services and Internships
Copyright © 2020 Gallup, Inc. All rights reserved.

Employment Outcomes
7
67%*
68%
73%
*
6%
6%
6%
8%*
6%
4%
8%*
10%*
8%*
9%*
13%
Non-traditionally aged graduates
College graduates nationally
WGU Indiana alumni
Employment Status
Employed full time (employer) Employed full time (self)
Employed part time, do not want full time Unemployed
Employed part time, want full time Not in workforce
42%*
39%*
68%
33%*
35%*
27%
24%*
26%*
5%
Non-traditionally aged graduates
College graduates nationally
WGU Indiana alumni
How closely related is your current workto your undergraduate major(s)?
Among employed alumni
Completely related Somewhat related Not at all related Don't know
*A comparison group's outcome is statistically different from WGU Indiana’s outcome at the 95% confidence level.Note: Due to rounding, percentages may sum to 100% +/-1%. Numerical values are shown when 4% or higher.
Copyright © 2020 Gallup, Inc. All rights reserved.

Employment Outcomes
*A comparison group's outcome is statistically different from WGU Indiana’s outcome at the 95% confidence level. ^A custom item developed for the Indiana Commission for Higher Education; national comparisons not available ┴Among alumni who said they obtained a good job after graduation
8
<1% 74% 93%WGU Indiana alumni who
said someone at WGU
Indiana helped them find a
job after graduation^
WGU Indiana alumni who
had a job with a company
they worked for or interned
for while in college^┴
WGU Indiana alumni who
currently work in Indiana^
5%*
34%*
18%*
7%*
8%*
5%
23%*
4%
23%*
17%*
7%*
14%*
10%*
26%*
2%
43%
4%
1%
4%
7%
39%
Don't know
Not applicable because I was not seekingemployment upon graduation
More than a year
Seven months to a year
Three to six months
Two months or less
I had a job waiting for mewhen I graduated
About how long did it take for you to obtain agood job after you completed your undergraduate
education at WGU Indiana?
WGU Indiana alumni College graduates nationally Non-traditionally aged graduates
Copyright © 2020 Gallup, Inc. All rights reserved.

Sources of Employment
9
63%
30%
3%
1%
1%
2%
3%
2%
Did not receive any helpfinding a job after college
A current or previousemployer
Other family members
Parents
Classmates or friendsat WGU Indiana
Other staff memberat WGU Indiana
Career services office staffmember
Professor
Sources of Assistance in Finding a Job After Graduation From WGU Indiana^
^Among alumni who said they obtained a good job after graduation
Copyright © 2020 Gallup, Inc. All rights reserved.

Location of Employment
10
Which of the following describes why you
are working in [STATE OF
EMPLOYMENT]?
17% Specific job offer
4%More career opportunities
in my field
87%Personal reasons (family, friends,
relationship, medical, etc.)
28%Financial reasons (cost of living,
taxes, etc.)
12%Lifestyle (weather, recreational
activities, cultural activities, etc.)
3%Pursuing further education in
[STATE OF EMPLOYMENT]
4% None of these reasons
<1%WGU Indiana alumni who
said someone at WGU
helped them find a job after
graduation^
74%WGU Indiana alumni who
had a job with a company
they worked for or interned
for while in college^┴
93% WGU Indiana alumni who
currently work in Indiana^
Top 10 Current Locations of Employment
1 Indiana (94%) 6 Arizona (1%)
2 Kentucky (1%) 7 California (1%)
3 Colorado (1%) 8 Illinois (1%)
4 Florida (1%) 9 Georgia (<.5%)
5 Ohio (1%) 10 Michigan (<.5%)
^A custom item developed for the Indiana Commission for Higher Education; national comparisons not available ┴Among alumni who said they obtained a good job after graduation
Copyright © 2020 Gallup, Inc. All rights reserved.

Gallup’s Employee Engagement Measures
11
M A X I M I Z I N G E M P L O Y E E S ’ P E R F O R M A N C E
Gallup has measured the engagement of more
than 6.4 million employees globally from hundreds
of organizations and companies.
Workplace engagement is an important driver of
overall wellbeing and is the leading indicator of
organizational performance such as higher
profitability and better financial outcomes.
Gallup’s Q12 instrument measures an individual’s
emotional connection to and investment in their
job. The 12 engagement elements function like
Maslow's hierarchy of needs, with basic needs that
must be fulfilled before employees can progress.
To reduce response burden for WGU
Indiana’s survey, the 12 elements
were reduced to three elements that
correlate highly with the full Q12 index:
Q03. Do what I do best
every day
Q06. Someone at work
encourages my
development
Q07. At work, my opinions
seem to count
Copyright © 1993-1998, 2020 Gallup, Inc. All rights reserved.
The Gallup Q12 items are Gallup proprietary information and are protected by law.
You may not administer a survey with the Q12 items or reproduce them without written consent from Gallup.
Engagement Index
12
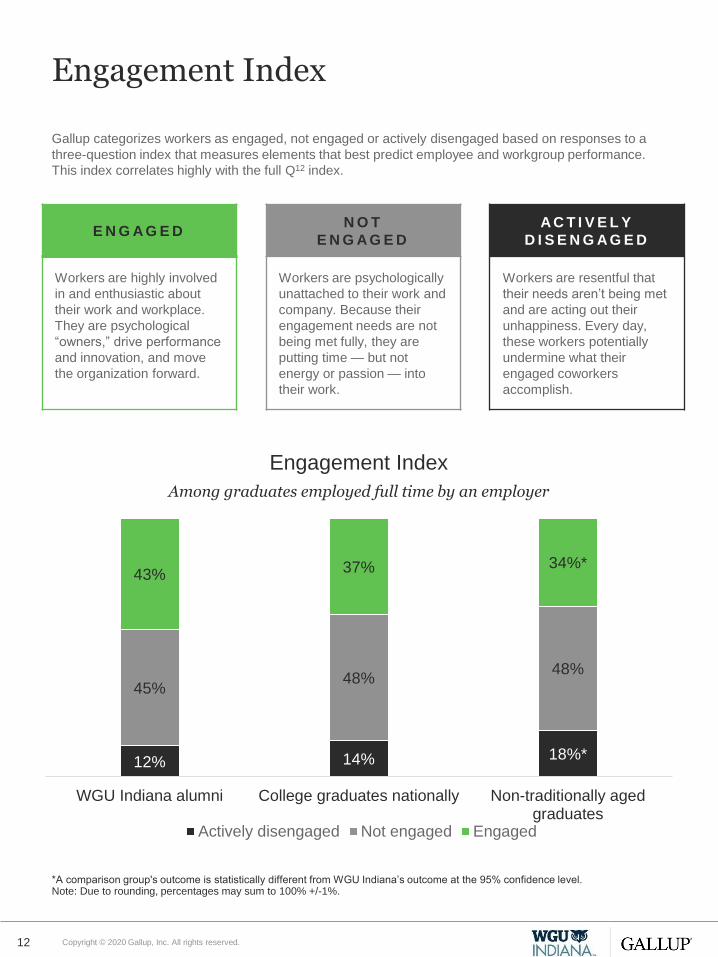
Gallup categorizes workers as engaged, not engaged or actively disengaged based on responses to a
three-question index that measures elements that best predict employee and workgroup performance.
This index correlates highly with the full Q12 index.
E N G A G E DN O T
E N G A G E D
A C T I V E L Y
D I S E N G A G E D
Workers are highly involved
in and enthusiastic about
their work and workplace.
They are psychological
“owners,” drive performance
and innovation, and move
the organization forward.
Workers are psychologically
unattached to their work and
company. Because their
engagement needs are not
being met fully, they are
putting time — but not
energy or passion — into
their work.
Workers are resentful that
their needs aren’t being met
and are acting out their
unhappiness. Every day,
these workers potentially
undermine what their
engaged coworkers
accomplish.
12% 14% 18%*
45%48%
48%
43% 37% 34%*
WGU Indiana alumni College graduates nationally Non-traditionally agedgraduates
Engagement Index
Among graduates employed full time by an employer
Actively disengaged Not engaged Engaged
*A comparison group's outcome is statistically different from WGU Indiana’s outcome at the 95% confidence level. Note: Due to rounding, percentages may sum to 100% +/-1%.
Copyright © 2020 Gallup, Inc. All rights reserved.

Workplace Fulfillment
13
21%*
24%*
38%*
40%*
17%*
19%*
34%*
35%*
33%
38%
51%
55%
Strongly agree on all three workfulfillment questions.
I have the ideal job for me.
My job gives me the opportunityto do work that interests me.
I am deeply interestedin the work that I do.
Workplace Fulfillment
% Strongly agree, among employed graduates
WGU Indiana alumni College graduates nationally Non-traditionally aged graduates
*A comparison group's outcome is statistically different from WGU Indiana’s outcome at the 95% confidence level.
Copyright © 2020 Gallup, Inc. All rights reserved.

Career Services and Internships
14
70% 78%* 71%WGU Indiana alumni College graduates nationally Non-traditionally aged
graduates
While attending WGU Indiana, how often did you visit, or access
resources provided by, the career services office?
% Very often, often or rarely
13%
11%*
17%
19%
21%
27%
40%*
38%*
24%
12%*
13%*
5%
17%*
17%*
28%
GAS IN collegegraduates
College graduatesnationally
WGU Indiana alumni
How helpful was the career services office to you?
Among graduates who visited career services at least once
Very helpful Helpful Somewhat helpful Not at all helpful Don't know/cannot recall
*A comparison group's outcome is statistically different from WGU Indiana’s outcome at the 95% confidence level.
Copyright © 2020 Gallup, Inc. All rights reserved.

Career Services and Internships
15
56% 83%* 71%*WGU Indiana alumni College graduates nationally Non-traditionally aged
graduates
How often did you receive career advice from other faculty or staff
members at WGU Indiana who were not career service employees?
% Very often, often or rarely
20%
19%
21%
35%
37%
33%
30%
29%
25%
8%
5%
8%*
10%*
17%
GAS IN college graduates
College graduates nationally
WGU Indiana alumni
How helpful was the career-related information you received from faculty or staff members?
Among graduates who received advice at least once
Very helpful Helpful Somewhat helpful Not at all helpful Don't know/cannot recall
*A comparison group's outcome is statistically different from WGU Indiana’s outcome at the 95% confidence level.Numerical values are shown when 4% or higher.
Copyright © 2020 Gallup, Inc. All rights reserved.

Skills Training Programs
16
60% 34% 6%
Does your employer offer tuition assistance for additional education or training?*
Yes No Don't know
4%
50%
13%
16%
40%
21%
43%
13%
In-Person
Online
How likely are you to enroll in each of the following types of additional education or training programs in
the next five years?
Very likely Likely Unlikely Very unlikely
21%
19%
10%
29%
27%
20%
26%
30%
38%
24%
24%
32%
Through a current employer
Through a nonprofitinstitution
Through a private company
How likely are you to enroll in each of the following types of additional education or training programs in
the next five years?
Very likely Likely Unlikely Very unlikely
36% 24% 26% 14%
How likely are you to enroll in an additional education or training program in the next five years?
Very likely Likely Unlikely Very unlikely
*Among respondents who are employed full time by an employer
Copyright © 2020 Gallup, Inc. All rights reserved.

Great Lives: Wellbeing
17
18 Defining a “Good Life”
19 Wellbeing Elements
20 Number of Thriving Elements
Copyright © 2020 Gallup, Inc. All rights reserved.

Defining a “Good Life”
18
G A L L U P ’ S G L O B A L W E L L B E I N G R E S E A R C H
Wellbeing is associated with numerous positive health and employment outcomes: lower
medical and health expenditures, fewer ER visits, lower absenteeism, etc.
Gallup has conducted decades of global research surveying a
representative sample of 98% of the world’s population from 150 countries.
P U R P O S E
Liking what you do each day and being
motivated to achieve goals
S O C I A L
Having supportive relationships
and love in your life
F I NA NCIAL
Managing your economic life to
reduce stress and increase security
CO MMUNI T Y
Liking where you live, feeling safe
and having pride in your community
P H YS I C A L
Having good health and enough
energy to get things done daily
Factor analysis identified five interrelated and interdependent elements of wellbeing:
Copyright © 2008, 2020 Gallup, Inc. All rights reserved.
The Gallup National Health and Well-Being Index items are Gallup proprietary information and are protected by law.
You may not administer a survey with the Gallup National Health and Well-Being Index items or reproduce them
without written consent from Gallup, Inc.

Wellbeing Elements
19
23%*
33%*
26%*
41%*
40%*
25%
34%
28%*
45%
39%*
28%
40%
42%
49%
60%
Physical wellbeing
Community wellbeing
Financial wellbeing
Social wellbeing
Purpose wellbeing
Wellbeing, by Element
% Thriving
WGU Indiana alumni College graduates nationally Non-traditionally aged graduates
*A comparison group's outcome is statistically different from WGU Indiana’s outcome at the 95% confidence level.
Copyright © 2008, 2020 Gallup, Inc. All rights reserved.
The Gallup National Health and Well-Being Index items are Gallup proprietary information and are protected by law.
You may not administer a survey with the Gallup National Health and Well-Being Index items or reproduce them
without written consent from Gallup, Inc.

Number of Thriving Elements
*A comparison group's outcome is statistically different from WGU Indiana’s outcome at the 95% confidence level.
20
Gallup examines not only the individual levels of wellbeing, but also the difficult-to-reach pinnacle
of thriving in all five wellbeing elements: purpose, social, financial, community and physical.
30%*
26%*
17%
15%
7%*
6%
28%*
25%
18%
15%
9%*
5%*
19%
20%
19%
18%
16%
8%
Zero
One
Two
Three
Four
Five
Wellbeing, by Number of Thriving Elements
WGU Indiana alumni College graduates nationally Non-traditionally aged graduates
Copyright © 2008, 2020 Gallup, Inc. All rights reserved.
The Gallup National Health and Well-Being Index items are Gallup proprietary information and are protected by law.
You may not administer a survey with the Gallup National Health and Well-Being Index items or reproduce them
without written consent from Gallup, Inc.

Great Experiences: Support and Experiential Learning
21
22 The Gallup Alumni Survey
23 Six Critical College Experiences
24 Three Support Experiences
25 Three Experiential Learning Experiences
26 Sources of Experiences
Copyright © 2020 Gallup, Inc. All rights reserved.
The Gallup Alumni Survey
22
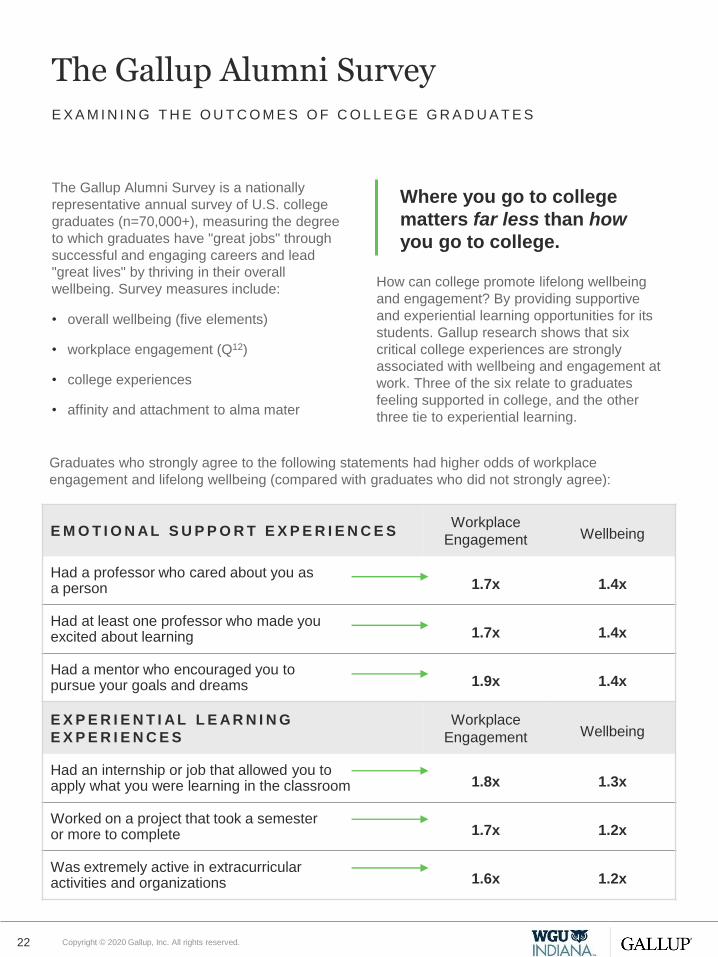
E X A M I N I N G T H E O U T C O M E S O F C O L L E G E G R A D U A T E S
The Gallup Alumni Survey is a nationally
representative annual survey of U.S. college
graduates (n=70,000+), measuring the degree
to which graduates have "great jobs" through
successful and engaging careers and lead
"great lives" by thriving in their overall
wellbeing. Survey measures include:
• overall wellbeing (five elements)
• workplace engagement (Q12)
• college experiences
• affinity and attachment to alma mater
How can college promote lifelong wellbeing
and engagement? By providing supportive
and experiential learning opportunities for its
students. Gallup research shows that six
critical college experiences are strongly
associated with wellbeing and engagement at
work. Three of the six relate to graduates
feeling supported in college, and the other
three tie to experiential learning.
Where you go to college
matters far less than how
you go to college.
Graduates who strongly agree to the following statements had higher odds of workplace
engagement and lifelong wellbeing (compared with graduates who did not strongly agree):
E M O T I O N A L S U P P O R T E X P E R I E N C E SWorkplace
Engagement Wellbeing
Had a professor who cared about you as a person 1.7x 1.4x
Had at least one professor who made you excited about learning 1.7x 1.4x
Had a mentor who encouraged you topursue your goals and dreams 1.9x 1.4x
E X P E R I E N T I A L L E A R N I N G
E X P E R I E N C E S
Workplace
Engagement Wellbeing
Had an internship or job that allowed you to apply what you were learning in the classroom 1.8x 1.3x
Worked on a project that took a semesteror more to complete 1.7x 1.2x
Was extremely active in extracurricular activities and organizations 1.6x 1.2x
Copyright © 2020 Gallup, Inc. All rights reserved.

Six Critical College Experiences
23
P R E P A R I N G S T U D E N T S F O R L I F E A F T E R C O L L E G E
Graduates nationally were also asked to rate the
extent to which they agree or disagree that their
institution prepared them well for life outside of
college. While only 5% of those who had zero of
the six experiences strongly agreed their
institution prepared them well for life outside of
college, 80% of those who had all six experiences
did so.
A similar pattern is also in WGU Indiana’s data.
Alumni with more positive experiences are more
likely to strongly agree they were prepared well
for life outside of college.
Almost half (45%) of
graduates nationally had none
or only one of the six
important college experiences
during their time in college.
Only 3% of graduates
nationally have experienced
all six of these experiences
while in college.
6%
26% 26%
16%20%
6%
0%4% 5%
25%
41%
82%
93%
0%
Zero One Two Three Four Five Six^
Positive Experiences and Preparedness
% Strongly agree, among WGU Indiana alumni
Number of positive experiences Prepared me well for life outside of college*
*Respondents who strongly agree that their university prepared them well for life outside of college^WGU Indiana students were not asked whether they were involved in extracurricular activities; as a result, five critical experiences is the most a WGU Indiana student could report having.
Copyright © 2020 Gallup, Inc. All rights reserved.

Three Support Experiences
24
Gallup research shows that the odds that a given college graduate is engaged at work are higher
if they strongly agree to having had each of six critical college experiences. The three “support
experience” items below comprise half of the six critical college experiences that prepare students
for life outside of college.
17%*
24%*
67%*
32%*
20%*
31%*
75%*
36%
26%
65%
38%
33%
All three support experiences
While attending WGU Indiana, I had amentor who encouraged me to pursue
my goals and dreams.
I had at least one professor at WGUIndiana who made me excited about
learning.
My professors at WGU Indiana caredabout me as a person.
Support Experiences % Strongly agree
WGU Indiana alumni College graduates nationally Non-traditionally aged graduates
*A comparison group's outcome is statistically different from WGU Indiana’s outcome at the 95% confidence level.
Copyright © 2020 Gallup, Inc. All rights reserved.

Three Experiential Learning Experiences
25
The “experiential learning” items below comprise the other part of the six critical college
experiences that prepare students for life outside of college.^
*A comparison group's outcome is statistically different from WGU Indiana’s outcome at the 95% confidence level.^WGU Indiana students were not asked whether they were involved in extracurricular activities; as a result, two experiential learning experiences is the most a WGU Indiana student could report having.
18%
35%*
39%*
26%*
46%*
43%*
19%
23%
79%
Both experiential learning experiences^(% Strongly agree/% Yes)
While attending WGU Indiana, I workedon a project that took a semester or more
to complete. (% Strongly agree)
While attending WGU Indiana, did youhave a job or internship that allowed you
to apply what you were learning in theclassroom? (% Yes)
Experiential Learning
WGU Indiana alumni College graduates nationally Non-traditionally aged graduates
Copyright © 2020 Gallup, Inc. All rights reserved.

Sources of Experiences
^A custom item developed for the Indiana Commission for Higher Education; national comparisons not available ┴Among alumni who said they had an applied job or internship
26
65% 79%WGU Indiana alumni who had an
encouraging mentor
WGU Indiana alumni who had an applied
job or internship
25%
43%
0%
1%
8%
8%
17%
3%
6%
14%
0%
0%
25%
43%
8%
5%
Don't know/cannot recall
Other
Sports coach
Extracurricular activity adviser
Family member
College or universitystaff member
Friend
Professor
Sources of Mentors and Jobs/Internships at WGU Indiana^
Source of mentor Source of help to obtain job or internship
Copyright © 2020 Gallup, Inc. All rights reserved.

Great Advocates: Alumni Attachment
27
28 Alumni Attachment
29 Reflections on Educational Decisions
30 Reflections on Academic Experience
Copyright © 2020 Gallup, Inc. All rights reserved.

Alumni Attachment
28
Gallup explores the connection between graduates and their alma mater by looking at their level
of agreement with two questions: “My university was the perfect school for people like me” and “I
can’t imagine a world without my university.” Graduates who strongly agree with both items are
considered “emotionally attached” to their alma mater.
16%*
20%*
35%*
20%*
25%*
34%*
38%
41%
70%
Both statements
I can't imagine a worldwithout WGU Indiana.
WGU Indiana was the perfectschool for people like me.
Alumni Attachment
% Strongly agree
WGU Indiana alumni College graduates nationally Non-traditionally aged graduates
71% 40%* 42%*WGU Indiana alumni who
are extremely likely to
recommend their university
to family, friends or
colleagues
College graduates nationally
who are extremely likely to
recommend their university
to family, friends or
colleagues
Indiana graduates who are
extremely likely to
recommend their university
to family, friends or
colleagues
*A comparison group's outcome is statistically different from WGU Indiana’s outcome at the 95% confidence level.
Copyright © 2020 Gallup, Inc. All rights reserved.

Reflections on Educational Decisions
29
98% 89% 96%Obtain a bachelor’s degree Study the same major that
you studied in your
bachelor’s degree program
Attend WGU Indiana to
obtain your bachelor’s
degree
If you had to do it all over again, would you still ____?^
% Yes, you would
92%
7%1% 0%
None One time Two times Three or more times
How many times did you change your major whileattending WGU Indiana to complete your
undergraduate degree?^┴
67% 26% 5%
How satisfied are you with the education youreceived from WGU Indiana?^
Extremely satisfied 4 3 2 Extremely dissatisfied Don't know
^A custom item developed for the Indiana Commission for Higher Education; national comparisons not available ┴Excludes times they switched from undecided or undeclared to declared in a major field of studyNumerical values are shown when 4% or higher.
Copyright © 2020 Gallup, Inc. All rights reserved.
Reflections on Academic Experience
30
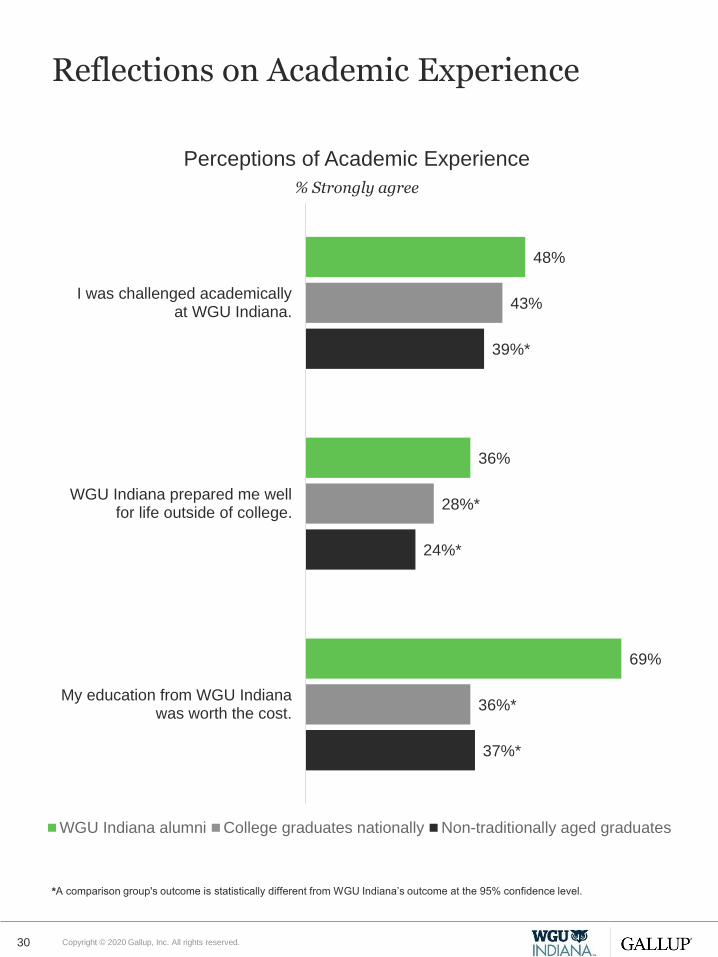
37%*
24%*
39%*
36%*
28%*
43%
69%
36%
48%
My education from WGU Indianawas worth the cost.
WGU Indiana prepared me wellfor life outside of college.
I was challenged academicallyat WGU Indiana.
Perceptions of Academic Experience
% Strongly agree
WGU Indiana alumni College graduates nationally Non-traditionally aged graduates
*A comparison group's outcome is statistically different from WGU Indiana’s outcome at the 95% confidence level.
Copyright © 2020 Gallup, Inc. All rights reserved.

Methodology
31 Copyright © 2020 Gallup, Inc. All rights reserved.

Methodology
32
N A T I O N A L C O M P A R I S O N
For the purposes of this report, data from
WGU Indiana are compared with data
collected from the national Gallup Alumni
Survey study of college graduates. Some
differences may exist between the national
comparison points included in this report and
national estimates that Gallup has previously
released because this report focuses on
graduates who received their undergraduate
degrees from 2010-2019. Comparison groups
included in this scorecard are:
College graduates nationally: Bachelor’s
degree holders surveyed via the national
Gallup Alumni Survey which includes those
who participated in the national study and
reported they have a bachelor’s degree only
from a Title IV degree-granting four-year
public, private, for-profit or nonprofit institution
in the U.S. as defined by the U.S. Department
of Education.
Non-traditionally aged graduates:
Bachelor’s degree holders surveyed via the
national Gallup-Purdue Index who indicated
that they obtained a bachelor’s degree when
they were 25 years of age or older.
M E T H O D O L O G Y
Results for the WGU Indiana alumni study are
based on web surveys conducted Jan. 20-
Feb. 18, 2020, with a sample of 482 WGU
Indiana University undergraduate alumni.
Alumni were included in the study if WGU
Indiana had an email address on file and they
graduated between 2010 and 2019. WGU
Indiana University provided a total of 5,492
email addresses.
Results for the Gallup Alumni Survey, the
study used for comparison purposes, are
based on web surveys conducted Feb. 4-Mar.
7, 2014, Dec. 16, 2014-Jun. 29, 2015, Aug.
22-Oct. 11, 2016, and Apr. 25-Jun. 3, 2018
with a random sample of 29,560 respondents,
30,151 respondents, 11,483 respondents, and
5,107 respondents respectively, with a
bachelor's degree or higher, aged 18 and
older, with internet access, living in all 50 U.S.
states and the District of Columbia.
Copyright © 2020 Gallup, Inc. All rights reserved.

Methodology
33
The 2014 Gallup Alumni Survey sample was compiled from two sources: the Gallup PanelTM and
the Gallup Daily tracking survey. The 2015 and 2016 Gallup Alumni Survey samples were
recruited via the Gallup Daily tracking survey. The 2018 Gallup Alumni Survey sample was
recruited via the Strada-Gallup Education Consumer Survey. The Gallup Panel is a proprietary,
probability-based longitudinal panel of U.S. adults who are selected using random-digit-dial (RDD)
and address-based sampling methods. The Gallup Panel is not an opt-in panel. The Gallup Panel
includes 60,000 individuals, and Panel members can be surveyed by phone, mail or web. Gallup
Panel members with a college degree and access to the internet were invited to take the Gallup
Alumni Survey online.
The Gallup Daily tracking survey sample includes national adults with a minimum quota of 70%
cellphone respondents and 30% landline respondents, with additional minimum quotas by time
zone within region. Landline and cellular telephone numbers are selected using RDD methods.
Landline respondents are chosen at random within each household on the basis of which member
had the most recent birthday. Gallup Daily tracking respondents with a college degree, who
agreed to future contact, were invited to take the Gallup Alumni Survey online.
Gallup Alumni Survey interviews are conducted via the web, in English only. Samples are
weighted to correct for unequal selection probability and nonresponse. The data are weighted to
match national demographics of gender, age, race, Hispanic ethnicity, education and region.
Demographic weighting targets are based on the most recent Current Population Survey figures
for the aged 18 and older U.S. bachelor's degree or higher population.
All reported margins of sampling error for the Gallup Alumni Survey of all college graduates
include the computed design effects for weighting.
For results based on the total sample of those with a bachelor’s degree, the margin of
sampling error is ±0.5 percentage points at the 95% confidence level.
For results based on employee engagement of those with a bachelor’s degree, the margin
of sampling error is ±0.8 percentage points at the 95% confidence level.
For results based on those with a bachelor’s degree from an Indiana institution, the margin
of sampling error is ±3.1 percentage points at the 95% confidence level.
For results based on employee engagement of those with a bachelor’s degree from an
Indiana institution, the margin of sampling error is ±4.5 percentage points at the 95%
confidence level.
In addition to sampling error, question wording and practical difficulties in conducting surveys can
introduce error or bias into the findings of public opinion polls.
Copyright © 2020 Gallup, Inc. All rights reserved.

Appendix
34 Copyright © 2020 Gallup, Inc. All rights reserved.

Appendix
35
What is your highest completed level of education?
Bachelor’s degree 78%
Postgraduate work or degree 22%
What type of postgraduate work or degree did you complete?^
Postgraduate work only, no degree 9%
Master of Arts (M.A.) 6%
Master of Science (M.S.) 60%
Master of Business Administration (MBA) 22%
Juris Doctor (J.D.) 0%
Other master’s degree 6%
Doctor of Medicine (M.D.) 0%
Ph.D. 2%
Other professional degree (e.g., LLB, DDS, DVM) 1%
Other 4%
Don't know 0%
While attending WGU Indiana … (% Yes)
Did you participate in a student club or organization? 4%
Did you have a paid job or internship? 78%
Did you participate in a research project with a professor or faculty member?** 17%
^Among WGU Indiana alumni who indicated their highest level of education is postgraduate work or degree
**This may include a project you participated in as part of a class you took, a thesis project or paper, a research project submitted to
a professional conference, or a paper submitted to a journal for publication.
Copyright © 2020 Gallup, Inc. All rights reserved.

Appendix
36
Throughout your college experience at WGU Indiana, did you receive any
merit-based scholarships?
Yes 22%
No 71%
Don’t know 7%
Throughout your college experience at WGU Indiana, did you receive any need-based
federal financial aid?
Yes 55%
No 42%
Don’t know 4%
Approximately how much money did you borrow in student loans to obtain your
undergraduate degree at WGU Indiana?^
Mean $15,839
Median $12,480
Approximately how much money did you borrow in student loans to obtain your
postgraduate work or degree?^
Mean $18,515
Median $12,960
Have you delayed any of the following because of your student loans?
Getting married 4%
Having children 9%
Going back to school for more training or another degree 42%
Starting your own business 18%
Buying a car 22%
Buying a home 16%
Moving out of your parent’s/parents’ home 5%
^Of alumni who indicated they took out a loan; adjusted to reflect inflated amounts for 2019
Copyright © 2020 Gallup, Inc. All rights reserved.

Appendix
37
Was WGU Indiana University a good place or not a good place for students who are
members of racial and ethnic minorities?^
Good place 57%
Not a good place <1%
Don’t know 43%
Was WGU Indiana University a good place or not a good place for lesbian, gay, bisexual
or transgender students?^
Good place 50%
Not a good place 0%
Don’t know 50%
While attending WGU Indiana University, I interacted with people from different
backgrounds on a regular basis.^^
%5 — Strongly agree 20%
%4 17%
%3 22%
%2 17%
%1 — Strongly disagree 20%
Don’t know 4%
In what state was the high school where you obtained your high school diploma?
Indiana 71%
Outside of Indiana 29%
^Asked of alumni who graduated between 1990 and 2019
^^Asked of alumni who graduated between 2011 and 2019
Copyright © 2020 Gallup, Inc. All rights reserved.

About Us
38
G A L L U P
Gallup delivers analytics and advice to help leaders and organizations solve their most pressing
problems. Combining more than 80 years of experience with its global reach, Gallup knows more
about the attitudes and behaviors of employees, customers, students and citizens than any other
organization in the world. For more information, visit www.gallup.com or education.gallup.com.
W G U I N D I A N A
WGU Indiana is a nonprofit, online university established by the State of Indiana to provide its
citizens with flexible, affordable access to high-quality higher education. Created through a
partnership with nationally and regionally accredited Western Governors University (WGU), WGU
Indiana is ideal for busy working adults who want to advance their careers by finishing a college
degree or earning an advanced degree.
Copyright © 2020 Gallup, Inc. All rights reserved.

Copyright Standards
39
This document contains proprietary research, copyrighted materials and literary property of
Gallup, Inc. It is for the guidance of your organization only and is not to be copied, quoted,
published or divulged to others outside your organization. All of Gallup, Inc.’s content is protected
by copyright. Neither the client nor the participants shall copy, modify, resell, reuse or distribute
the program materials beyond the scope of what is agreed upon in writing by Gallup, Inc. Any
violation of this Agreement shall be considered a breach of contract and misuse of Gallup, Inc.’s
intellectual property.
This document is of great value to Gallup, Inc. Accordingly, international and domestic laws and
penalties guaranteeing patent, copyright, trademark and trade secret protection safeguard the
ideas, concepts and recommendations related within this document.
No changes may be made to this document without the express written permission of Gallup, Inc.
Gallup®, Q12®
and The Gallup National Health and Well-Being Index items® are trademarks of
Gallup, Inc. All rights reserved. All other trademarks and copyrights are property of their
respective owners.
Copyright © 2020 Gallup, Inc. All rights reserved.