WARZYN INC - REVISED RI/FS QUALITY ASSURANCE ...
351
WARZYN Revised Quality Assurance Remedial Investigation Project Plan And Feasibility Study Volume 2 Wheeler Pit Site 13256 Janesville, Wisconsin Prepared for: Respondents Steering Committee Prepared by: Warzyn Engineering Inc. Madison, Wisconsin \June 1988
-
Upload
khangminh22 -
Category
Documents
-
view
0 -
download
0
Transcript of WARZYN INC - REVISED RI/FS QUALITY ASSURANCE ...
WARZYN
RevisedQuality Assurance Remedial InvestigationProject Plan And Feasibility StudyVolume 2 Wheeler Pit Site13256 Janesville, Wisconsin
Prepared for:Respondents Steering Committee
Prepared by:Warzyn Engineering Inc.
Madison, Wisconsin
\June 1988

WARZYN
Engineers & ScientistsEnvironmental Services
Waste ManagementWater Resources
Site DevelopmentSpecial Structures
Geotecnnical Analysis
June 10, 198813256.00
Mr. Michael Valentine, RPMU.S. Environmental Protection AgencyRegion V - 5HR-11230 South Dearborn StreetChicago, IL 60604
Re: Revised Work Plan DocumentsWheeler Pit SiteEPA Docket No. V-W-87-C-027
Dear Mr. Valentine:
In accordance with Section VTTr.C.7. of the Administrative Order by Consent(AOC) dated December 1, 1987, enclosed are three (3) copies of the revisedRI/FS Work Plan documents for the Wheeler Pit Site. These revisions are beingsubmitted in two volumes.
Volume 1 contains the revised Work Plan text; Drawing 13256-A5 showing watertable well and piezometer schematics; and a complete set of finalized WorkPlan drawings. Tables 1 through 6, and Appendices B through I from theoriginal March 25, 1988 Work Plan submittal are not being re-submitted at thistime because no changes to these portions of the plan were required. Volume 1addresses U.S. EPA's comments as provided in your letter dated May 13, 1988,and as subsequently discussed with you on May 25 and May 31, 1988.
A revised RI/FS Implementation Schedule (Appendix A) will be submittedseparately following further discussion between the Respondents and theU.S. EPA. The Respondents are currently reviewing your letter and proposedschedule revisions received on June 9, 1988.
Volume 2 contains the revised Quality Assurance Project Plan (QAPP) andSampling Plan. It addresses U.S. EPA's comments as provided in your letterdated March 22, 1988, and as subsequently discussed with you and Dr. Tsai onMay 25 and June 8, 1988.
Copies of both volumes of the revised work plan documents are being submittedto each of the individuals listed at the end of this letter. Please let me or
Warzyn Engineering IncOne Science Court
University Research P.irkPO Box 5385
Madison. Wisconsin 53705{608)273 0440

Mr. Michael Valentino -2- June 10, 1988Chicago, Illinois 13256.00
Curt Buetow know if you have any questions concerning these matters. We lookforward to receiving U.S. EPA's approval of the RI/FS Work Plan in the nearfuture.
Sincerely,
WAfiZYN ENGINEERING INC.
Daniel F. Kolberg, P.E.Project Director
DFK/mml/RWM[mml-106-87]
Enclosures: Revised Work Plan - Volume 1Revised QAPP - Volume 2
cc: Mike Valentino - U.S. EPA (3)Mark Giesfeldt - WDNR (3)Paul Bitter - U.S. EPA - WMD (1)Curtis Buetow - GM Janesville (1)Bill Me Farland - GM Warren, MI (1)Gary Boszak - GM Warren, MI (1)Geoff Nokes - CMC (1)Lawrence Adelson - CMC (1)Rebecca Raftery - Jenner & Block (1)James Adams - U.S. EPA - QAS (1)Cheng-Wen Tsai - U.S. EPA - ESD/QAS (1)
WARZYN

i-'??.v;
1
WARZYN
Remedial InvestigationAnd Feasibility Study
Wheeler Pit SiteLaPrairie Township,
Rock County, Wisconsin
June 1988

QUALITY ASSURANCE PROJECT PLANREMEDIAL INVESTIGATION/FEASIBILITY STUDYWHEELER PITJANESVILLE, WISCONSIN
1,0 IntroductionThis Quality Assurance Project Plan (QAPP) presents the organization,functional activities, and specific quality assurance (QA) and quality control(QC) activities associated with the Remedial Investigation/Feasibility Study(RI/FS) at the Wheeler Pit Site, Janesvllle, Wisconsin. The Wheeler Pit Site(Site), as defined In the Administrative Order by Consent (AOC), effectiveDecember 1, 1987, encompasses 3.82 acres of land In a physical depression ofapproximately 15 acres which previously operated as a gravel pit. The purposeof the RI Is to determine the nature and extent of contamination at the Site1n order to support activities of the FS. The purpose of the FS 1s to developand evaluate appropriate remedial action alternatives based on the RI data andreport. This QAPP Is designed to achieve the specific data quality goals ofthe RI/FS.
The United States Environmental Protection Agency (UvS. EPA) requires thatPRP-lead Investigations under SARA have an approved Quality Assurance ProjectPlan (QAPP) covering environmental measurements. It Is the responsibility ofthe Respondents or their representatives to Implement minimum procedures toassure that the accuracy, precision, completeness and representativeness ofdata collected are known and documented.
This QAPP has been prepared using the following guidance documents:
• U.S. EPA, Region V, December 1985, Preparation of Federal-lead RemedialInvestigation Quality Assurance Project Plans for Region V.• U..S EPA, December 1980, Interim Guidelines and Specifications forPreparing Quality Assurance Project Plans, QAMS-005/80.• U.S. EPA, June 1986, Data Quality Objectives for the RI/FS Process,Doc. NO. 9355.0-7A.
WARZYN
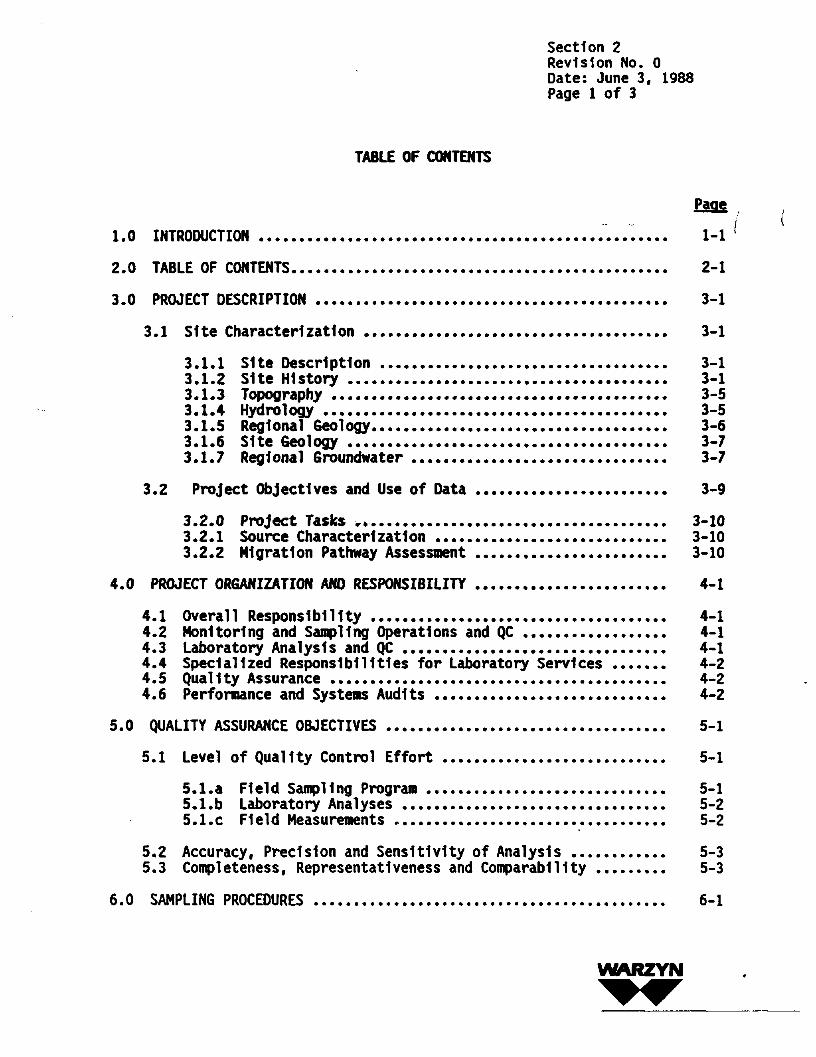
Section 2Revision No. 0Date: June 3, 1988Page 1 of 3
TABLE OF CONTENTS
Page1.0 INTRODUCTION ................................................... 1-1
2.0 TABLE OF CONTENTS............................................... 2-1
3.0 PROJECT DESCRIPTION ............................................ 3-1
3.1 SIte Characterlzatlon ...................................... 3-13.1.1 Site Description .................................... 3-13.1.2 Site History ........................................ 3-13.1.3 Topography .......................................... 3-53.1.4 Hydrology ........................................... 3-53.1.5 Regional Geology..................................... 3-63.1.6 Site Geology ........................................ 3-73.1.7 Regional Groundwater ................................ 3-7
3.2 Project Objectives and Use of Data ........................ 3-93.2.0 Project Tasks t*..................................... 3-103.2.1 Source Characterization ............................. 3-103.2.2 Migration Pathway Assessment ........................ 3-10
4.0 PROJECT ORGANIZATION AND RESPONSIBILITY ........................ 4-1
4.1 Overall Responsibility ..................................... 4-14.2 Monitoring and Sampling Operations and QC .................. 4-14.3 Laboratory Analysis and QC ................................. 4-14.4 Specialized Responsibilities for Laboratory Services ....... 4-24.5 Quality Assurance .......................................... 4-24.6 Performance and Systems Audits ............................. 4-2
5.0 QUALITY ASSURANCE OBJECTIVES ................................... 5-1
5.1 Level of Quality Control Effort ............................ 5-15.1.a Field Sampling Program .............................. 5-1S.l.b Laboratory Analyses ................................. 5-2S.l.c Field Measurements .................................. 5-2
5.2 Accuracy, Precision and Sensitivity of Analysis ............ 5-35.3 Completeness, Representativeness and Comparability ......... 5-3
6.0 SAMPLING PROCEDURES ............................................ 6-1
WARZYN
Section 2Revision No. 0Date: June 3, 1988Page 2 of 3
7.0 SAHPLE CUSTODY AND DOCUMENTATION ............................... 7-1
8.0 CALIBRATION PROCEDURES, FREQUENCY AND PREVENTATIVEMAINTENANCE FOR FIELD INSTRUMENTS ............................. 8-1
9.0 ANALYTICAL SERVICES ............................................ 9-1
9.1 Hazleton ................................................... 9-1
9.2 Warzyn ..................................................... 9-2
10.0 Data Reduction Validation and Reporting ....................... 10-5
11.0 Internal Quality Control Checks................................ 11-112.0 Performance and System Audits.................................. 12-1
13.0 Preventive Maintenance......................................... 13-014.0 Accuracy/Precision Definitions................................. 14-115.0 Corrective Action.............................................. 15-116.0 Quality Assurance Reports...................................... 16-1
•i-, --,..
TABLES
TABLE 1 - SITE CHRONOLOGYTABLE 2 - SUMMARY OF DATA GENERATING ACTIVITIES AND ASSOCIATED DATA QUALITY
OBJECTIVESTABLE 3 - SUMMARY OF DATA GENERATING ACTIVITIES AND ASSOCIATED DATA USETABLE 4 - SAMPLE TYPE AND ESTIMATED SAMPLE NUMBERSTABLE 5 - SAMPLE QUANTITIES. BOTTLES, PRESERVATIVES AND PACKAGING FOR SOIL,
LEACHATE, AND WASTE SAMPLES
WARZYN
Section 2Revision Ho. 0Date: June 3V 1988Page 3 of 3
FIGURES
Figure 1 - Sample Location Map
DRAWINGS
13256-1 Project Organizational Chart
APPENDICES
APPENDIX A - SAMPLING PLANAPPENDIX B - EPA TARGET COMPOUND LIST AND DETECTION LIMITSAPPENDIX C-l - FIELD MEASUREMENT OF PHAPPENDIX C-2 - FIELD MEASUREMENTS OF SPECIFIC CONDUCTANCE AND TEMPERATUREAPPENDIX C-3 - CALIBRATION AND MAINTENANCE OF THE HNU PHOTOIONIZERAPPENDIX C-4 - CALIBRATION AND MAINTENANCE OF THE MONITOX HCNAPPENDIX D - ANALYSIS METHODSAPPENDIX E - INTERNAL CHAIN OF CUSTODY AND DATA REDUCTION. VALIDATION
AND REPORTING FOR KAZLETONAPPENDIX F - DOCUMENT CONTROL AND THE EVIDENTIARY FILE SYSTEM FOR
WHEELER PIT RI/FS
WARZYN

Section 3Revision No. 0Date: June 3, 1988Page 1 of 10
3.0 PROJECT DESCRIPTION3.1 Site CharacterizationThe purpose of the RI 1s to determine the nature and extent of contaminationat the Wheeler Pit Site, as defined by the AOC, 1n order to support theactivities of the FS. The purpose of the FS 1s to develop and evaluateappropriate remedial action alternatives based on the RI data and report.Personnel, materials and services required to perform the RI/FS will beprovided by the Respondents to the AOC. The Wheeler Pit Site RI/FS 1s a PRPlead Investigation.
3.1.1 Site DescriptionThe Wheeler Pit Disposal Site 1s located east of Janesvllle, Wisconsin,directly northwest of the Intersection of County Highway 0 (Old Delavan Road)and County Highway J and occupies the southeast quarter of the northeastquarter of Section 5, T2Nt R13E (Rock County). The Site, as defined 1nSection V of the AOC, encompasses a 3.82 acre parcel of land 1n a physicaldepression of approximately 15 acres which previously operated as a gravelpit. The 15-acre former gravel pit Is In a rural area located approximately3 miles east of the City of Janesvllle and Includes a fertilizer/farm supplyfacility, a former paint sludge disposal lagoon, refuse disposal area, anasphalt company and a Rock County Highway salt storage facility. The disposalarea of concern (the Site) 1s a former, unlined lagoon that received paintsludges and fly ash from General Motors' Janesvllle Automobile Assembly plant.The Site was owned by the Chicago, Milwaukee, St. Paul and Pacific RailroadCompany (C.M.St.P. & P.R.R. Co.), predecessor 1n Interest to CMC Real EstateCorporation, and was leased for disposal purposes by General Motors from 1956to 1974.
3.1.2 Site HistoryThe Wheeler Pit property was purchased 1n 3 separate transactions. The firstwas a purchase of a 9.87 acre parcel by the Janesvllle & Southeastern RailwayCompany (predecessor to the Chicago Milwaukee St. Paul & Pacific Railroad Co.)on December 11, 1900 from Guy Wheeler and wife. The second parcel was apurchase of 19.883 acres by the receivers of the Chicago Milwaukee & St. Paul
WARZYN

Section 3Revision No. 0Date: June 3, 1988Page 2 of 10
Railway Company (predecessor to the Chicago Milwaukee St. Paul & PacificRailroad Co.) on July 22, 1927 from Charles E. Culver and wife. The thirdparcel was a purchase of 11.20 acres by the receivers of the Chicago Milwaukee& St. Paul Railway Company (predecessor to the Chicago Milwaukee St. Paul &Pacific Railroad Co.) on September 24f 1927 from Harvey H. Bull is and wife.The total area of the Wheeler Pit property from 1927 til 1956 was 40.953acres.
On December 19, 1956 the Chicago Milwaukee St. Paul ft Pacific Railroad Co.sold 19.93 acres of the 40.953 total acres to Frank Brothers; this was thenortherly 500 feet of the railroad's Wheeler Pit property. On September 16,1958 the Chicago Milwaukee St. Paul ft Pacific Railroad Co. sold 4.92 acres toRock County for Delevan Drive (County Trunk Highway "0"). The area of thepresent Wheeler Pit property 1s 16.103 acres. The Railroad later used WheelerPit for refuse disposal and, 1n 1956, GM leased a 3.82 acre portion of the pitas a general plant waste disposal site. In 1961, the Rock County HighwayDepartment constructed a salt storage facility directly east of the Site alongCounty Highway J. An asphalt plant was later placed on the 19.93 acre parcelsold to Frank Brothers. In 1981, a survey revealed that tanks and pipingassociated with the asphalt plant encroached on the Railroads1 property nearthe Site. A fertilizer/farm supply service (Dairyland Fertilizers, Inc.,Green-Rock FS Cooperative) 1s also located in the western portion of WheelerPit on a parcel originally leased from the Railroad 1n 1962.
In 1953, a ditch was dug to divert water Into Wheeler Pit. Periodic floodingresulted when spring rains and meltwater entered the pit while the ground wasstill frozen. During the spring of 1966, water ponding as deep as 4 1/2 feetoccurred at the fertilizer plant.
The portion of Wheeler Pit designated as the Site In the AOC 1s the 3.82 acreparcel leased by GM from the Railroad. From 1960 through 1974, GM disposed ofpaint spray booth sludges, clarlffer sludges and powerhouse ashes from theirautomobile assembly plant In Janesvllle In a lagoon located on this 3.82 acreparcel. The lagoon was approximately 400 feet long, 250 feet wide and 8 feet
WARZYN

Section 3Revision No. 0Date: June 3, 1988Page 3 of 10
deep. The sludge and ash were contained by a dike on the north and west sidesof the lagoon. In August 1971, a liquid slurry was noticed seeping to thesurface outside of the lagoon along the bera. Chemical analyses of theseepage material, paint and paint booth sludge are similar, except for a highnitrogen content 1n the seepage material. At the request of La PrairieTownship, disposal 1n the lagoons was discontinued In 1974. The lagoon wascovered and closed during the fall of 1974 and the sumner of 1975 according toabandonment plans approved by the Wisconsin Department of Natural Resources(DNR). GH continues to lease the property for monitoring purposes.
Observed conditions at the Site have resulted In several investigations,reports and response actions. Table 1 summarizes enforcement andremedial/response actions taken at the site. The following section describesseveral Investigations and reports prepared for the Site. A summary ofanalytical results Is contained 1n Appendix E of the Work Plan.
1. 1971 - Surface InvestigationOn August 18, 1971, liquid slurry was noticed to be seeping to the surfaceoutside of the Wheeler Pit Sludge Lagoon along the berm. The analyticalresults of the seepage material, paint and paint sludge samples were similar,except for a high nitrogen content 1n the seepage material. A subsurfaceInvestigation was performed by Soil Testing Services, Inc. 1n the fall of 1971to evaluate existing soil conditions near the lagoon and to determine thesource of the seepage materials. Fifteen soil borings and 5 hand augeredprobes were performed during this Investigation. Four of these borings wereconverted Into groundwater monitoring wells. Soil samples, groundwatersamples, sludge samples and samples of the seepage material were also analyzedas part of this Investigation.
This Investigation concluded that disposal practices at the lagoon wereaffecting groundwater quality based on the elevated levels of lead, zinc. CODand the unusually low electrical resistivity values measured at wellsInstalled for this Investigation. Previous disposal activities were alsoevident from paper and scrap metal objects encountered 1n probes 1n theseepage areas and 1n the lagoons.
WARZYN

Section 3Revision No. 0Date: June 3, 1988Page 4 of 10
2. 1974-Saffollno Well InstallationThe DNR required proper abandonment of the Site 1n 1974t and to satisfy themonitoring requirements of the closure plan, ten soil borings and ninegroundwater monitoring wells were Installed by Warzyn Engineering Inc.Borings P-5, P-6 and P-7 were performed through the waste disposal area andrevealed an eight-foot thickness of cinder ash and paint sludge. The locationof borings and wells performed for this Investigation are Illustrated onFigure 1.
3. 1981-Soedal Groundwater SanollnaSite groundwater monitoring wells and selected private water supply wells weresampled on April 21, 1981. The sampling was done In response to ccmplalnts tothe DNR and the Wisconsin Public Intervenors Office (State Department ofJustice) concerning groundwater quality Impacts related to waste disposalpractices at the Site. The samples were collected by the DNR and were splitwith GM. Levels of trlchloroethylene (0.5 ug/L). chromtu* (0.025'*g/L)T2lnc(2.45 mg/L) and barium (0.17 mg/L) noted during this sampling round were usedby the U.S. EPA 1n the Hazard Ranking System (HRS) evaluation of the Site.
4. 1982-Monitoring Well Inspection and RehabilitationOn-slte monitoring wells were Inspected and repaired by Warzyn EngineeringInc. during the summer of 1982. Wells P-5 and P-10 could not be located andbroken pieces of PVC well pipe and well caps found near their locationssuggest that they were broken off near the ground surface. Well P-9 wasdamaged during Installation 1n 1974 and was never functional. Wells P-l, P-2,P-4, P-6 and P-7 were repaired and all wells were cleaned (Jetted) out.In-field balldown permeability tests were performed on existing wells.
5. !983-l984-Add1t1ona1 Groundwater Sampling and Hydrooeolodlc InvestigationTwo additional groundwater monitoring wells (A and B) were Installed 1n 1983by Warzyn Engineering to replace damaged wells P-5 and P-10. The locations ofthese wells are shown on Figure 1. In-field permeability tests were performedon these wells and the results were presented 1n a report titled Wheeler Pit
VWVRZYN
Section 3Revision No. 0Date: June 3, 1988Page 5 of 10
Hydroaeoloalc Investigation, dated March 12, 1984. Wells P-lf P-2, P-3, P-4,P-6, P-7, P-8, A and B were then sampled on four occasions (quarterly) betweenDecember 1983 and September 1984 for a list of parameters approved by the DNRon Hay 17, 1983. Additional organic analyses were also performed on samplescollected from wells P-l, P-7 and well B during the September 6, 1984 samplinground. The samples were analyzed for what was at that time EPA's prioritypollutants Including volatile*, adds/base/neutral extractables andpest1c1de/PCB's. The results of these analyses Indicated that some chemicalson the priority pollutant 11st were Impacting groundwater quality. Well Bcontained fluoranthene, a polyaromatic hydrocarbon (PAH) and b1s-(2-ethylhexyl) phthalate and dl-n-octyl phthalate, which are conraon plastldzers.Also, well B contained compounds that were tentatively Identified asstraight-chain hydrocarbon compounds. The only priority pollutant compoundIdentified 1n wells P-l and P-7 was d1-n-octyl phthalate.
6. 1986-Soeclal Sampling of Well BWell B was sampled on July 15, 1986 and analyzed for volatile organIcs andadd/base/neiitraT "attractable portions of the priority pollutant scan. Theanalytical results wet*e similar to the September 6, 1984 analysis; no volatileor acld-fractlon-extractable organ1cs were detected. B1s(2-ethyl hexyl)phthalate and 1,4-dlchlorobenzene were tentatively Identified atconcentrations below detection limits and were also found 1n the sample blank.The total straight-chained hydrocarbon concentration was similar to the 1984sampling.
3.1.3 TopographyThe Rock River 1s the predominant geomorphlc feature 1n the vicinity of thesite and 1s located approximately 2 miles west of the site. The Rock Riverhas a relatively narrow flood-plain 1n the vicinity of Janesv1lie as a steeptopographic rise occurs generally within 500 feet of the River. The elevationtypically Increases 60 to 70 feet from the flood plain of the River to thesurrounding upland areas. The upland areas are topographically mature with aslope of less than l percent and are occasionally dissected by small creeksand Intermittent dralnageways,
WARZYN
Section 3Revision No. 0Date: June 3r 1988Page 6 of 10
The extensive sand and gravel mining operations conducted at the Site andneighboring areas have produced large localized depressions. The maximumrelief between the base of the gravel excavation at the Site and thesurrounding flat land 1s approximately 50 feet. The base of the gravel pit Isfairly flat, whereas the sides slope steeply upwards, particularly to thenorth and east. The ground surface 1s sloped for an access roadway fromCounty Highway J to the floor of the gravel pit.
3*1.4. HydrologyThe Rock River flows from north to south 1n the vicinity of the City ofJanesv1lie and has a gradient of approximately 1.2 feet per mile and anaverage discharge of 1,750 cfs (cubic feet per second). A United StatesGeological Survey (USGS) Gauging Station at Afton, Wisconsin, 4 milesdownstream from Jancsv1ller has been In operation since 1914. The maximumpeak discharge recorded at this station Is 13,000 cfs at a river elevation of753.17 feet (USGS datum). The Rock River 1s considered an effluent streamwith groundwater discharge supplying base flow conditions. The riverelevation generally has not shown large fluctuations because It Is controlledby a spillway In the downtown Janesvllle area.
Other water bodies located near the Site are the excavations created by thesand and gravel mining. Runoff Into the quarries 1s very localized. Aculvert beneath County Highway 0 allows surface water to enter Wheeler Pitfrom the southeast. Periodic flooding of the pit has occurred 1n the spring,when the ground 1s frozen.
3.1.5 Regional GeologyThe geological setting of the site consists of relatively permeable sand andgravel 1n a bedrock valley eroded by the Rock River during glacial times.
The site Is located on the margin of a tributary of the ancestral Rock River(bedrock) Valley. The pre-glaclal Rock River Valley was brought to presentgrades 1n the upland areas by the deposition upwards of 350 feet of stratifiedsand and gravel.
W*RZYN
Section 3Revision No. 0Date: June 3, 1988Page 7 of 10
On the west side of the Rock River, the PIattevllie-Galena Dolonlte 1s presentat ground surface and appears 1n an areal pattern similar to that expected 1nhighland areas adjacent to a large river valley. The Plattevllle and theoverlying Galena Dolomite are considered as one bedrock unit 1n the RockCounty area. They can be described as light gray to yellowish-gray dolomitehaving an Increasing sand content with depth.
The Ordovlclan Age St. Peter Sandstone 1s directly 1n contact with the outwash1n narrow bands along the margins of the pre-glacial Rock River Valley andbeneath the Site. The St. Peter Sandstone has an eroded surface which slopesto the east, towards the center of the pre-glac1al Rock River Valley and 1sgenerally present between Elevations 600 feet and 750 feet (USGS datum). Thesandstone 1s characterized by chert or chert conglomerate. The thickness ofthe St. Peter Is variable as 1t was deposited unconfonnably over the earlyOrdovlcan Age Prairie du Chlen group and the earlier Cambrian sandstones.
The Prairie du Chlen group and the upper Cambrian sandstones are present atelevations below 600 feet (USGS datum). The thickness of the Prairie du Chlengroup 1s elevated to be only approximately 10 feet 1n the vicinity of the Cityof Janesvllle.
The Trempealeau formation 1s characterized as a sandy, sllty, gray to browndolomite with Interbedded slltstones and fine to medium sandstone. TheTrenpealeau formation has a maximum thickness of 90 feet 1n Rock County.
The Franconla Sandstone 1s a fine to medium grainedr dolomltlc sandstoneInterbedded with reddish brown slltstones, shales and dolomites. TheFranconla sandstone has an average thickness of approximately 70 feet atJanesvllle. Underlying the Franconla Sandstone are the sandstones of theDresbach group. The Dresbach group consists of the Galesvllle, Eau Claire,and Mount Simon Sandstones. These sandstones have a combined thickness ofover 800 feet 1n the Janesvllle area.
WARZYN
Section 3Revision No. 0Date: June 3, 1988Page 8 of 10
3.1.6 Site GeologyThe Site 1s located In an abandoned gravel pit that Is approximately 20 to40 feet deep with the bottom about 60 feet above mean river level.Unconsolldated sediments In this general area are glacial outwash sand andgravel associated with an outwash plain situated In front of the Johnstown andMilton Moraines. Boring logs for private wells Installed In La PrairieTownship Indicate that there Is normally 0-10 feet of clay, or clay and graveloverlying sand and gravel deposits. Borings performed on the site encounteredfine to medium sand containing a trace of silt and occasional fine to largegravel and small cobbles. These materials exist to the maximum depthexplored. Bedrock 1s estimated to be 250 feet beneath the Site.
3.1.7 Regional GroundwaterThe outwash sand and gravel deposits are the surfldal aquifer In the City ofJanesvllle and vicinity. This aquifer 1s composed of sorted and stratifiedmedium to very coarse sand and gravel and 1s the most productive source ofgroundwater In Rock County (Zaporozec, 1982). The aquifer thickness 1sgreatest (over 300 feet) In the pregladal bedrock valley occupied by the RockRiver. The thickness of the sand and gravel deposits varies and probablyreaches a thickness of approximately 300 feet 1n the tributary bedrock valleynorth of the Site. The depth to groundwater varies with elevation andgenerally occurs within 15 feet of the base of the sand and gravel excavationnear the Site. Groundwater flow 1n the Site vicinity Is generally from thenorth-northeast to south-southwest toward County Highway 0. The horizontalgradient beneath the Site (based on available data) Is approximately0-0.07 ft/ft. Vertical groundwater gradients are slightly upward at WellNests P-l/P-2 (0.002) and P-6/P-7 (0.003) and more strongly upward at P-3/P-4 (0.1).
The Rock River 1s an effluent river, and Is the major groundwater dischargearea 1n the vicinity (LeRoux, 1963). The USGS (1963) estimated 123 MGD ofgroundwater Is discharged Into the Rock River In Rock County. Flowing wells,on the west side of the Rock River, Immediately northwest of the City ofJanesvllle, and further upstream Indicate a strong upward gradient 1s
WARZYN
Section 3Revision No. 0Date: June 3, 1988Page 9 of 10
associated with groundwater discharge Into the Rock River. On the westernside of the Rock River, the groundwater flow Is probably from the highlandareas toward the southeast and the river, based on published regionalInformation (LeRoux, 1963). The underlying bedrock units discharge Into thesand and gravel aquifer 1n the vicinity of the pregladal Rock River Valley.Bedrock units 1n the vicinity of the Site, with the possible exception of thePIattevllie-Galena fomatIon, are under saturated conditions. Generally, 1nthe Janesv1lie area the PIattevllie-Galena 1s saturated, however, Itsviability as an aquifer 1s limited.
According to Zaporozec (1982), the groundwater 1n the sand and gravel aquiferIn Rock County 1s predominantly a calcium-magnesium bicarbonate type water.Hardness generally ranges between 240 and 423 mg/1 (CaCOs) and requiressoftening for most purposes. The water Is also slightly alkaline, having a pHbetween 7.2 and 8.2. The amount of total dissolved solIds (IDS) generallyranges between 300 and 450 mg/1 and 1s suitable for most domestic purposes.Iron and nitrate are two common constituents of groundwater In Rock Countythat occasionally reach concentrations above the recommended limits fordrinking water. Iron occurs naturally In the groundwater with localized areasof high concentrations, while nitrate comes from organic sources such asdecaying vegetation, animal wastes, discharge of sewage wastes, Industrialchemicals and nitrogen-based fertilizers. Like Iron, high nitrateconcentrations occur In localized areas throughout Rock County.
3.2 Pro.lect Objectives and Use of DataThe objectives of this Initial remedial Investigation (RI) are to:
• Characterize the source(s) of potential contamination;
• Characterize the hydrogeologic setting to determine probablecontaminant migration pathways and physical features that could affectpotential remedial actions;
• Determine the migration rates, extent and characteristics ofcontamination that may be present at the site; and
• Data use objectives for the Initial RI are summarized on Table 2. Datagenerating activities and data use are summarized on Table 3.
VN0VRZYN
Section 3Revision No. 0Date: June 3, 1988Page 10 of 10
The RI/FS will be conducted using a phased approach. The data collectedduring the Initial phase of the Investigation will be used for sourcecharacterization and the evaluation of potential pathways. Such data willthen be used for defining the future phases of work. Data collected duringthe Initial RI will be used as part of a continuing risk assessment andalternative evaluation process. However, Phase I data Is not fully sufficientto quantify these risks or alternatives without further study.
A Migration Pathway Assessment will be performed using borings, wellInstallations and groundwater samples. The Phase I groundwater sampling willbe used to determine the chemical characterization of the groundwater andassist 1n establishing the parameter list for subsequent phases of the RI.
Some data collected as part of the RI will be obtained using direct readingportable Instruments, such as HNu and Monltox. These data will be usedprimarily for health and safety purposes.
3.2.0 Pro.lect Tasks3.2.1 Source CharacterizationTest PitsFour test pits will be performed In the former disposal lagoon. The primaryobjective 1s to determine the thickness and type of material present at thesite. A minimum of 5 waste samples (one from each test pit and a duplicate)will be collected and analyzed. During excavation. 1f leachate collects 1ntest pits, a single leachate sample from each pit will be collected andanalyzed for the full Target Compound List (TCL) parameter 11st.
3.2.2 Migration Pathway AssessmentSoilsSot! sampling will be conducted at the deepest borehole performed at each ofthe locations shown on Figure 1 (see Drawing Section). Soil samples will becollected with a split spoon sampler, screened with an HNu and visuallyclassified to summarize physical properties. Selected soil samples will beanalyzed for grain size to support visual classifications.
VWKRZYN

Section 3Revision No. 0Date: June 3, 1988Page 11 of 10
GroundwaterThe groundwater Investigation will Include the Installation of 6 new wells,which will supplement existing wells A and B (see Figure 1).
Groundwater level measurements will be obtained at existing and proposed wellsduring the Migration Pathway Assessment. In-s1tu hydraulic conductivity testswill be performed at newly Installed wells to assess groundwater flow rates.
Specific procedures to be used In sample collection are outlined In theSampling Plan (Appendix A). A suomuury of sample numbers and matrices Is givenIn Table 4. A summary of sample containers, sample volumes, preservatives andshipping methods 1s given 1n Table 5.
WARZYN
Section 4Revision No. 0Date: June 3, 1988Page 1 of 2
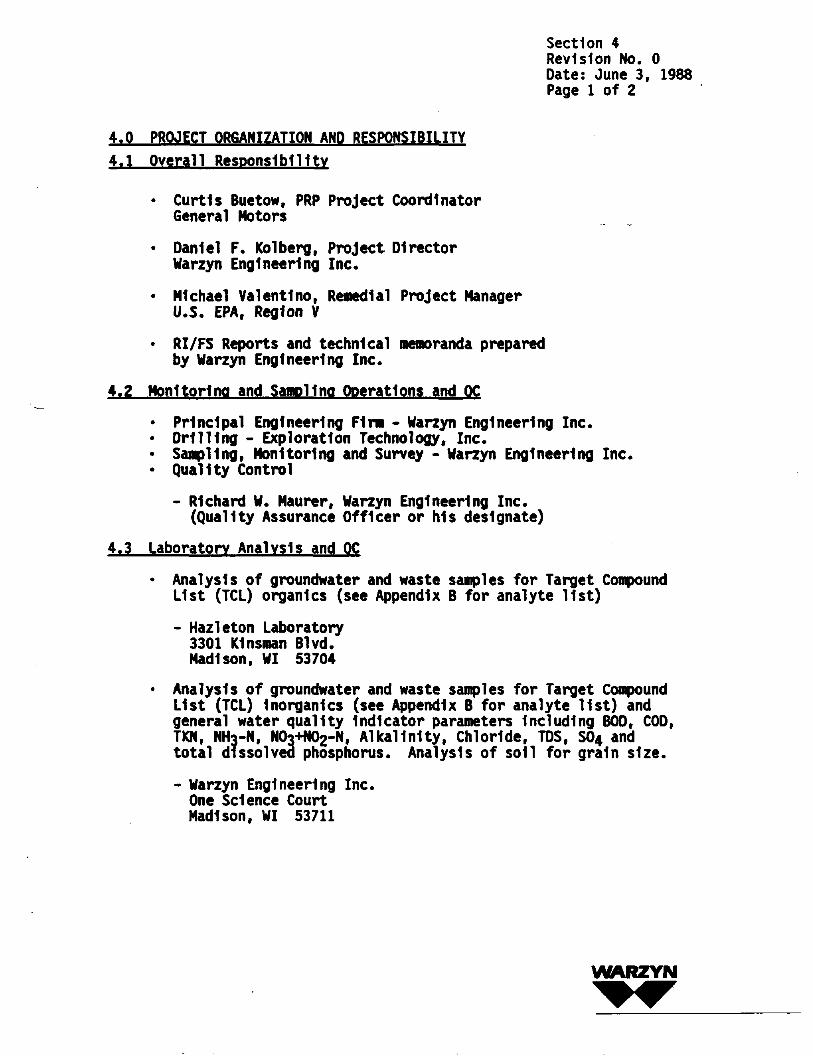
4.0 PROJECT ORGANIZATION AND RESPONSIBILITY4.1 Overall Responsibility
• Curt1s Buetow, PRP Project CoordinatorGeneral Motors
• Daniel F. Kolberg, Project DirectorWarzyn Engineering Inc.
• Michael Valent1nor Remedial Project ManagerU.S. EPA, Region V
• RI/FS Reports and technical memoranda preparedby Warzyn Engineering Inc.
4.2 Monitoring and Sampling Operations and QC• Principal Engineering Firm - Warzyn Engineering Inc.• Drilling - Exploration Technology, Inc.• Sanpl1ngf Monitoring and Survey - Warzyn Engineering Inc.• Quality Control
- Richard W. Maurer, Warzyn Engineering Inc.(Quality Assurance Officer or his designate)
4.3 Laboratory Analysis and QC
• Analysis of groundwater and waste samples for Target CompoundList (TCL) organ1cs (see Appendix B for analyte 11st)- Hazleton Laboratory3301 Kinsman Blvd.Madison, WI 53704
• Analysis of groundwater and waste samples for Target CompoundList (TCL) Inorganics (see Appendix B for analyte 11st) andgeneral water quality Indicator parameters Including BOD, COD,TKN, NH?-N, NOrHKfe-N, Alkalinity, Chloride, IDS, S04 andtotal dissolved phosphorus. Analysis of soil for grain size.- Warzyn Engineering Inc.One Science CourtMadison, WI 53711
VWKRZYN

Section 4Revision No. 0Date: June 3, 1988Page 2 of 2
4.4 Specialized Responsibilities for Laboratory Services
• Hazleton Laboratory Data
- analytical protocol specified - Warzyn Engineering Inc.- review of analytical protocol - Hazleton- review of analytical protocol - U.S. EPA Region V Quality
Assurance Section (QAS) and Central Regional Laboratory(CRL), Contract Program Management Section (CPMS).
- review and approval of performing laboratory - U.S. EPARegion V, CRL, CPMS
- Internal QA/QC - Hazleton staff- final data review and validation - Warzyn Engineering Inc.- review of tentatively Identified compounds and assessment
of need for confirmation - Warzyn Engineering Inc.
• Warzyn Data
- review of analytical specifications - U.S. EPARegion V QAS and CRL. CPMS
- review and approval of performing laboratory - U.S. EPARegion V CRLr CPMS
- Internal QA/QC - Warzyn Engineering Inc.- final data review and validation * Warzyn Engineering Inc.
4.5 Quality Assurance
• Overall QA Responsibility- Warzyn Quality Assurance Officer
• Warzyn Subcontracted Activities- Warzyn Engineering Inc.
• Review of QAPP- U.S. EPA Region V QAS
• Field Analyses- Warzyn Engineering Inc.
4.6 Performance and Systems Audits
• Field Operations- QAO, Warzyn Engineering Inc.- U.S. EPA OversIte Contractor
• Analytical Laboratories- U.S. EPA CPMS, CRL
• Final Evidence File Audits- QAO, Warzyn Engineering Inc.
An organizational chart 1s shown 1n Drawing 13256-1.WARZYN
Section 5Revision No. 0Date: June 9, 1988Page 1 of 4
5.0 QUALITY ASSURANCE OBJECTIVESThe overall quality assurance objectives are to Implement field sampling,chain of custody, laboratory analysis and quality control reporting proceduresthat will provide legally defensible data 1n a court of law. Quality controlobjectives for these data, as well as those collected for health and safetypurposes, are to obtain reproducible data consistent with limitations Imposedby measurement methods used.
Specific procedures to be used for sampling, chain of custody, calibration,laboratory analyses, data reporting, Internal quality control, audits,preventatlve maintenance, and corrective actions are described 1n othersections of this QAPP. This section (5.0) defines goals for the QC effort(accuracy, precision, and sensitivity of analyses and completeness,representativeness and comparability) for data from analytical laboratoriesand presents quality control objectives for field measurements. A summary ofdata collection activities and data quality objectives by subtask 1s given 1nTable 4.
5.1 Level of Quality Control Effort5.1.a Field Sane 11no ProgramThe quality of data from the field sampling program for laboratory analyseswill be evaluated through the collection of field duplicates, matrixspike/matrix spike duplicates and field and trip blanks. Duplicates will beused to assess the combined effects of sample collection, handling andanalysis on data precision. The general level of effort for matrices will beone field duplicate per 10 Investigative samples. For groundwater andleachate samples, field blanks will be collected at a frequency of one percollection method per sampling event or day. Blank samples will be used tocheck for procedural contamination or uncontrollable conditions at the sitethat may result In apparent contamination of samples. Field blanks will becollected at a frequency of one per collection method per sampling event orday. Blanks for groundwater samples requiring filtration (TCL Inorganics)will consist of deIonized water passed through a decontaminated filteringapparatus.
WARZYN

Section 5Revision No. 0Date: June 9, 1988Page 2 of 4
For organ1cs analyses, triple the normal sample volume will be collected formatrix sp1ke/aatr1x spike duplicate analyses at a frequency of one per twentyInvestigative samples. A trip blank will be Included with each shipment ofsamples for purgeables analysis.
S.l.b Laboratory AnalysesAnalyses of waste and groundwater for EPA Target Compound List (TCL) organ1csand Inorganics (see Appendix B for analyte 11st) will be performed based onContract Laboratory Program (CLP) protocols. Levels of QA effort for theseprotocols are described 1n CLP Statement of Work SW-787 for organ1cs and aredescribed In Appendix D for Inorganics and water quality Indicators.
Levels of QA effort for soil analyses for grain size are given with methoddescriptions 1n Appendix D.
S.l.c Field MeasurementsQHLevel of QA effort for field measurement' of pH- will consist of precall brat Ionusing two buffer solutions and calibration verification at regular Intervals(at least every ten samples).
Specific ConductanceLevel of QA effort for specific conductance measurements will consist ofInitial and continuing calibration verification (at least every ten samples)using a standard solution of known conductivity.
A1r Monitoring (Health and Safety)Level of QA effort for air monitoring for health and safety purposes using HNUwill be limited to dally calibration verification. The Monltox unit used forhealth and safety purposes will similarly be calibrated dally. Method ofcalibration 1s specified In appendices C-3 and C-4.
WARZYN

Section 5Revision No. 0Date: June 9f 1988Page 3 of 4
5.2 Accuracy. Precision and Sensitivity of AnalysisThe QA objectives of analyses with respect to accuracy, precision andsensitivity are to achieve acceptable data based on specified performancecriteria. Accuracy and precision requirements and Method detection Units forlow/medium CLP based analyses to be performed on waste and groundwater samplesare described 1n CLP Statement of Work SW-787 for organ 1cs and are described1n Appendix D for Inorganics and water quality Indicator data. Accuracy andprecision criteria for analyses to be performed on soil (particle size), arelisted with the method description 1n Appendix D.
Accuracy of field measured pH will be Judged from agreement of Instrumentreadings with standard buffer solutions. Agreement with standards will bewithin ±0.05 pH units and field measurements will be made to 0.01 unit.Measurement precision will be estimated by periodically (1 per 10 samples)making duplicate readings of sanples. If the unit falls to calibrate, 1t willbe replaced*
Accuracy of field Instruments (HNU, Monltox) used for health and safetypurposes will be determined by dally calibration. If units fall to calibrate,they will be replaced.
5.3 Completeness. Representativeness and ComparabilityIt 1s anticipated that sanples collected for laboratory analyses will meetdata quality objectives for >95X of sanples. If required performance criteriaare not met by performing laboratories, they will re-analyze samples, 1fholding times permit. If holding tines are exceeded, the performinglaboratory will Inform the Warzyn project manager as soon as possible, so thata decision whether to resample or to accept data with limitations noted, canbe made.
WARZYN

Section 5Revision No. 0Date: June 9, 1988Page 4 of 4
Sampling Methods and locations are designed to provide results representativeof the matrix at the sampling point. Procedures are standardized and will beanalyzed according to standard protocols to be comparable with data collectedand analyzed 1n future sampling efforts.
WARZYN
Section 6Revision No. 0Date: June 3, 1988Page 1 of 1
6.0 SAMPLING PROCEDURESSpecific sampling procedures are documented 1n the Sampling Plan (Appendix A).Table 5 of this QAPP summarizes sample containers, preservativesf holdingtimes, packing and transport methods.
Documentation of use of specific procedures outlined 1n the Sampling Plan willbe made by Initialed entries 1n the field log book by the Sampling TeamLeader. Further details are 1n the Sampling Plan (Appendix A).
WARZYN
Section 7Revision No. 0Date: June 3, 1988Page 1 of 1
7,0 SAMPLE CUSTODY AND DOCUMENTATIONSample custody Indicates physical possession and responsibility for a givenset of samples. Sample custody procedures require that samples are always 1nthe custody of a responsible person and written documentation Is maintained.Sample documentation will Include dialn-of-custody forms, sampleIdentification records, container labels, custody seals, sample tags and fieldnotebooks. Saiqple documentation and custody procedures for this project aredescribed 1n detail 1n Appendix E. Original field notes and field documentswill be maintained by Warzyn Engineering Inc. 1n a Final Evidence File.Format and maintenance of the Final Evidence File Is given In Appendix F.
WARZYN

Section 8Revision No. 0Date: June 3, 1988Page 1 of 1
8.0 CALIBRATION PROCEDURES. FREQUENCY AND PREVENTATIVE MAINTENANCE FORFIELD INSTRUMENTS
Calibration and maintenance of pH and specific conductance meters are detailed1n Appendices C-l and C-2, respectively.
Calibration of the HNu, which will be used for health and safety purposes,will follow procedures recommended by the manufacturer (see Appendix C-3).The HNU will be calibrated at the beginning of each working day usingcalibration gas (benzene) supplied by HNu.
Honltox detectors will be checked for accuracy each working day prior to useusing a gas generation unit (Appendix C-4). If the detector falls tocalibrate, 1t will be replaced.
LaboratoryInorganicsCalibration of the A.A. and Lachat autoanalyzer are detailed 1n Appendix D.If the Instruments fall to calibrate or remain calibrated, analysis will ceaseand Instrument will be troubleshooted.
OroanlcsCalibration procedures will follow the CLP SOW for organ1cs.
WARZYN
Section 9Revision No. 0Date: June 3, 1988Page 1 of 3
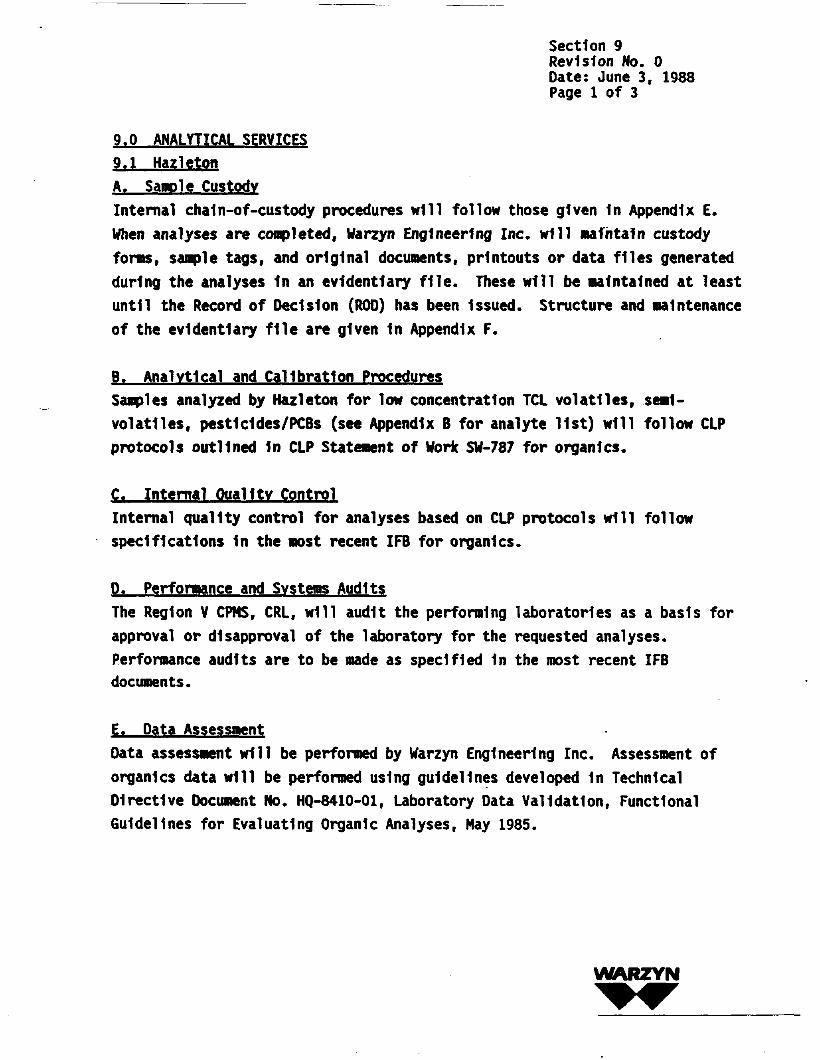
9.0 ANALYTICAL SERVICES9.1 HazletonA. Sample CustodyInternal cha1n-of-custody procedures will follow those given In Appendix E.When analyses are completed, Warzyn Engineering Inc. will maintain custodyforms, sample tags, and original documents, printouts or data files generatedduring the analyses 1n an evidentiary file. These will be maintained at leastuntil the Record of Decision (ROD) has been Issued. Structure and maintenanceof the evidentiary file are given In Appendix F.
B. Analytical and Calibration ProceduresSamples analyzed by Hazleton for low concentration TCL volatile*, seml-volatlles, pest1c1des/PCBs (see Appendix B for analyte 11st) will follow CLPprotocols outlined 1n CLP Statement of Work SW-787 for organ1cs.
C. Internal Quality ControlInternal quality control for analyses based on CLP protocols will followspecifications 1n the most recent IFB for organlcs.
D. Performance and Systems AuditsThe Region V CPHS, CRL, will audit the performing laboratories as a basis forapproval or disapproval of the laboratory for the requested analyses.Performance audits are to be made as specified 1n the most recent IFBdocuments.
E. Data AssessmentData assessment will be performed by Warzyn Engineering Inc. Assessment oforganlcs data will be performed using guidelines developed 1n TechnicalDirective Document No. HQ-8410-01, Laboratory Data Validation, FunctionalGuidelines for Evaluating Organic Analyses, Hay 1985.
WARZYN

Section 9Revision No. 0Date: June 3, 1988Page 2 of 3
9.2 WarzvnA, Sample CustodySamples are delivered to Warzyn's laboratory under chaln-of-custody. Adesignated sample custodian accepts custody of the shipped sanples andverifies that the cha1n-of-custody seals have not been broken. The samplecustodian reviews the Information on the sample tags/labels with that on thechain of custody records. Pertinent Information as to shipment, pickup,courier, etc., Is entered In the remarks section. The custodian then entersthat sample tag/label data Into a bound logbook which Is arranged by projectcode and station number. The sample custodian must acknowledge receipt on thecha1n-of-custody form. Any comments pertaining to the shipment should be madeunder "Remarks".
The sample custodian will use the sample tag/label as IdentificationInformation to assign a unique sequential laboratory number to each sample.This laboratory number Is entered on the chaln-of-custody form. The *Information Is logged on to the laboratory logbook. The sample custodian willtransfer samples to the proper analyst or store the sample 1n the appropriaterefrigerator. The dialn-of-custody and testing request forms are forwarded tothe laboratory supervisor.
The laboratory 1s a secured area with strict limited access. Data files anddoors are locked dally. Laboratory personnel are responsible for the care andcustody of samples from the time they are received until the sample 1sreturned to the custodian or refrigerated.
When sample analyses and necessary quality assurance checks have beencompleted by the laboratory or after a 3-month time period, whichever Islonger, the unused portion of the sample will be disposed of properly.Identifying tags, data sheets, and laboratory records shall be retained aspart of the permanent documentation of the project and forwarded to the WarzynEngineering Inc. Project Manager for Inclusion In the evidentiary file.
WARZYN

Section 9Revision No. 0Date: June 3f 1988Page 3 of 3
B. Analytical and Calibration ProceduresAnalytical and calibration procedures are documented with Individual methoddescriptions In Appendix D.
C« Internal Quality ControlRequired Internal quality control audits and their frequency are specifiedwith analyses procedures 1n Appendix D.
D. Performance and Systems AuditsThe Region V and CPMS, CRL, will audit the laboratory as a basis for approvalor disapproval for the requested analyses. Performance audits withIndependent QC samples are to be performed as specified In method descriptions1n Appendix 0*
E. Data AssessmentData assessment will be performed by Warzyn Engineering Inc. Criteria to beused for assessment are performance criteria for quality control audits listedwith method descriptions In Appendix D and results of field QC samples.
WARZYN

Section 10Revision No. 0Date: June 3, 1988Page 1 of 1
10.0 DATA REDUCTION. VALIDATION AND REPORTINGData reduction, validation and reporting 1s the responsibility of WarzynEngineering Inc. The fraction of analysis results meeting specified Qc-crlterla (data completeness) will be checked by Warzyn. Where test data havebeen reduced, the method of reduction will be described.
Validation of organIcs data will be performed using guidelines developed 1nTechnical Directive Document No. HQ-8410-01, Laboratory Data Validation,Functional Guidelines for Evaluating Organic Analyses, Hay 1985. Inorganicsdata validation will be performed based on guidelines 1n Laboratory DataValidation, Functional Guidelines for Evaluating Inorganics analyses, November1985. Criteria to be used for validation of water quality parameters andcyanide are listed with methods descriptions 1n Appendix D. The datareporting format will be consistent with CLP deliverable*.
WARZYN

Section 11Revision No. 0Date: June 3, 1988Page 1 of 1
11.0 INTERNAL QUALITY CONTROL CHECKSInternal quality control for Hazleton based analyses will followspecifications In the most recent IFB documents.
Internal quality control analyses and their frequencies for analyses performedby Warzyn are specified 1n the procedures found In Appendix D.
WARZYN

Section 12Revision No. 0Date: June 3, 1988Page 1 of 1
12.0 PERFORMANCE AND SYSTEMS AUDITSUSEPA Region V, CRL, CPMS duties perforning laboratories as a basis forapproval or disapproval for the requested analyses. Performance audits are tobe performed as specified 1n the appropriate IFB documents for analyses by CLPprotocols.
WARZYN

Section 13Revision No. 0Date: June 3r 1988Page 1 of 1
13.0 PREVENTIVE MAINTENANCEPreventive maintenance of field Instrumentation will be performed stated InAppendices C1-C4. Laboratory Instrumentation maintenance will follow the mostcurrent SOW for organic* and Inorganics.
WARZYN
Section 14Revision No. 0Date: June 3, 1988Page 1 of 1
14.0 ACCURACY/PRECISION DEFINITIONSAccuracy and precision definitions are described 1n the above CLP documentsfor organic analyses performed using CLP protocols and with the methoddescription In Appendix D for Inorganics and other general water qualityparameters.
WARZYN

Section 15Revision No. 0Date: June 3, 1988Page 1 of 1
15,0 Corrective ActionIf quality control audits result In detection of unacceptable conditions ordata, the Warzyn Engineering Inc. QAO will be responsible for developing andInitiating corrective action. Corrective action may Include:
• Re-analysis of the samples, 1f holding time criteria permit;• Resampling and re-analysis;• Evaluating and amending sampling and analytical procedures;
and• Accepting data, acknowledging level of uncertainty.
If quality control audits of field data results In unacceptable conditions ordata, the Warzyn Engineering Inc. field team leader will be responsible fordeveloping and Initiating corrective action.
WARZYN
Section 16Revision No. 0Date: June 3, 1988Page 1 of 1
16.0 Quality Assurance ReportsNo separate QA report for this project 1s planned. The final RI report and FSreport will contain separate QA sections that summarize quality of datacollected during the project.
13115.03KDF/Jpl/DWH[Jpl-601-54]
WARZYN


TABLE 1
12/11/1900
1953
1956
1956-1960
1957
1960-1974
12/24/1959
1961
Fall, 1961
10/17/61
04/1/62
Spring, 1966
05/70
05/8/71
SITE CHRONOLOGYWHEELER PIT SITE
Wheeler Pit property purchased by Janesvllle and SoutheasternRailway Company. The site was used to provide gravel for theRailroad and for refuse disposal.
"J- Line Bridge A-520 filled and a ditch dug to direct waterInto Wheeler Pit.
General Motors leased 3.82 acre disposal site.Wheeler Pit used for general refuse disposal by GM.
20 acres of the northern portion of Wheeler Pit was sold toFrank Brothers.
GM leased the site to dispose of paint and clarlffer sludges,and coal combustion by-products fron Its Janesvllle autoassembly plant.Rock County Highway Department leases eastern portion ofWheeler Pit property for a salt storage facility.
Rock County Highway Dept. builds salt storage facilitydirectly east of the site.Access to site via Frank Brothers driveway blocked with achain and lock to end use of pit area as public dump.
Operators of Frank Brothers Asphalt Emulsion Plant complainthat GM disposal operations are contaminating their site.
Dairyland Fertilizer Inc., leases the portion of Wheeler Pitwest of the site from the Railroad.
Frozen ground and spring meltwater runoff results 1n apartial flooding of Wheeler Pit.Wisconsin DNR requires that the site be licensed.
Two well points Installed by Bob Showers Well DrillingCorporation (24 and 26 ft depths); locations unknown.
06/1/71 License application for Wheeler Pit submitted to DNR by GM.
-2-
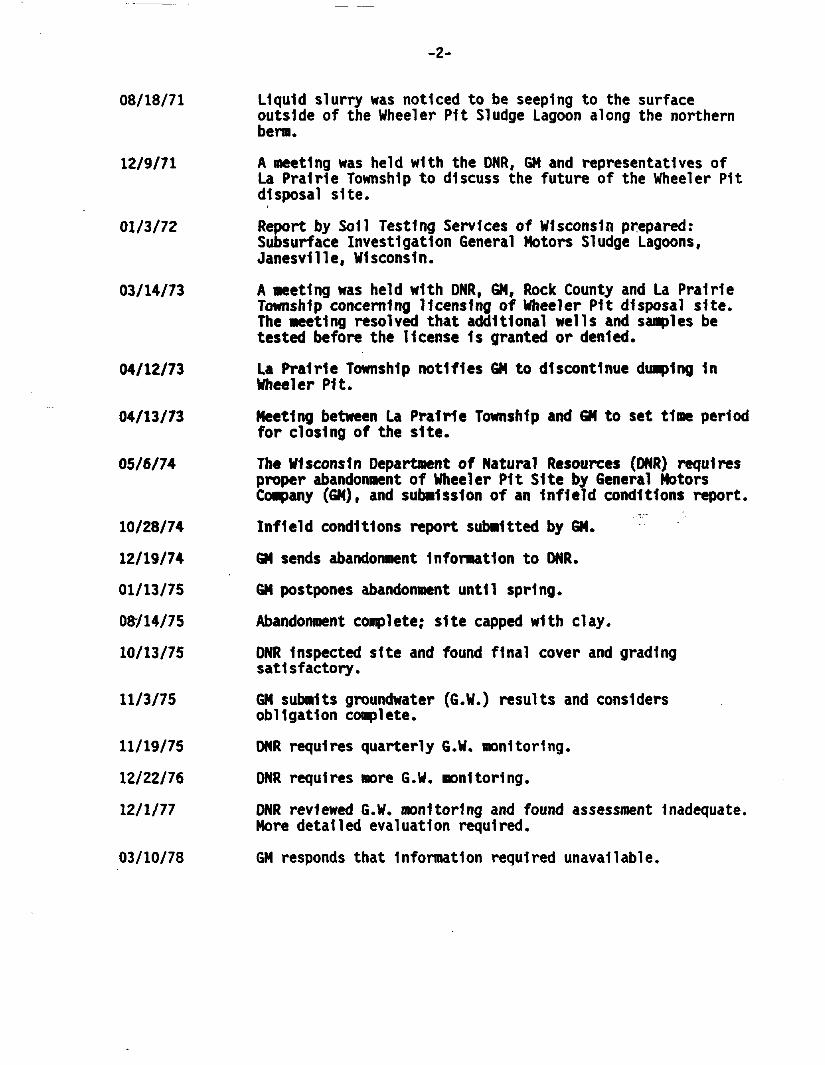
08/18/71
12/9/71
01/3/72
03/14/73
04/12/73
04/13/73
05/6/74
10/28/74
12/19/74
01/13/75
08/14/75
10/13/75
11/3/75
11/19/75
12/22/76
12/1/77
Liquid slurry was noticed to be seeping to the surfaceoutside of the Wheeler Pit Sludge Lagoon along the northernberm.
A meeting was held with the DNR, GM and representatives ofLa Prairie Township to discuss the future of the Wheeler Pitdisposal site.Report by Soil Testing Services of Wisconsin prepared:Subsurface Investigation General Motors Sludge Lagoons,Janesvllle, Wisconsin.A meeting was held with DNR, GM, Rock County and La PrairieTownship concerning licensing of Wheeler Pit disposal site.The meeting resolved that additional wells and samples betested before the license 1s granted or denied.La Prairie Township notifies GM to discontinue dumping 1nWheeler Pit.Meeting between La Prairie Township and GM to set time periodfor closing of the site.
Infield conditions report submitted by GM.GM sends abandonment Information to DNR.GM postpones abandonment until spring.
Abandonment complete; site capped with clay.DNR Inspected site and found final cover and gradingsatisfactory.
GM submits groundwater (G.W.) results and considersobligation complete.DNR requires quarterly G.W. monitoring.
DNR requires more G.W. monitoring.
DNR reviewed G.W* monitoring and found assessment Inadequate.More detailed evaluation required.
03/10/78 GM responds that Information required unavailable.
-3-
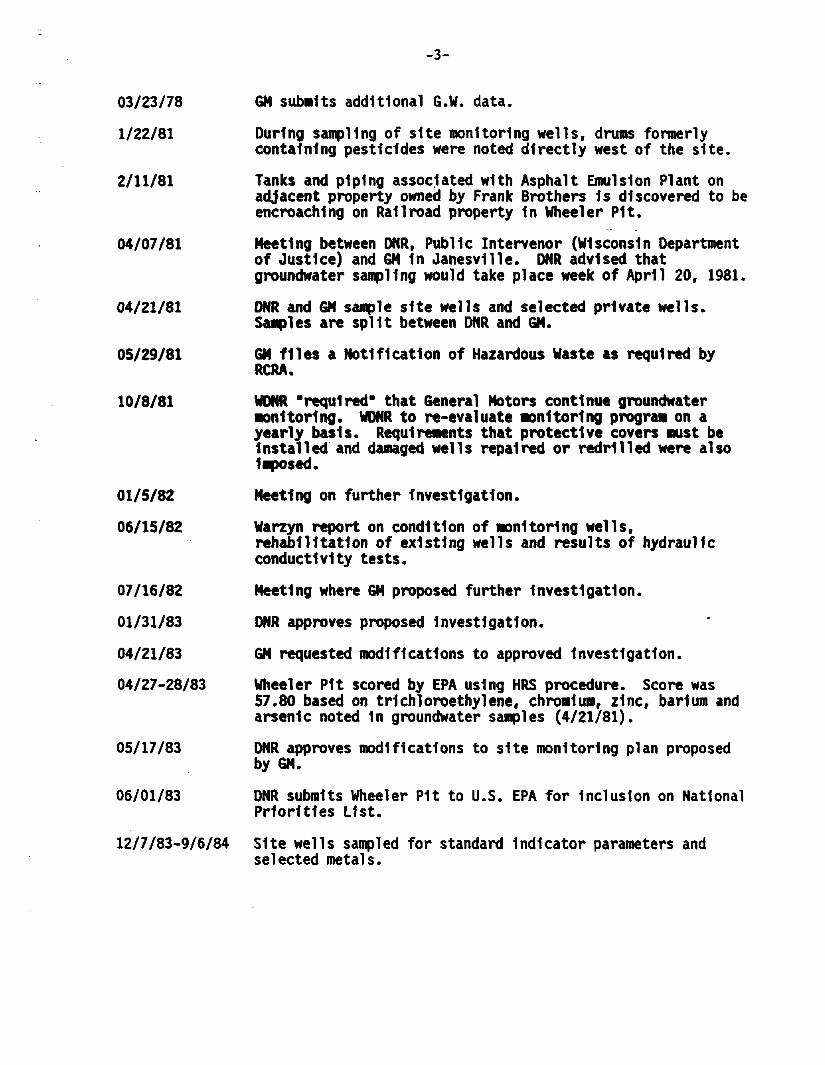
03/23/78
1/22/81
2/11/81
04/07/81
04/21/81
05/29/81
10/8/81
01/5/82
06/15/82
07/16/82
01/31/83
04/21/83
04/27-28/83
05/17/83
06/01/83
12/7/83*9/6/84
GM submits additional G.W. data.
During sampling of site monitoring wells, drums formerlycontaining pesticides were noted directly west of the site.
Tanks and piping associated with Asphalt Emulsion Plant onadjacent property owned by Frank Brothers Is discovered to beencroaching on Railroad property 1n Wheeler Pit.
Meeting between DNR, Public Intervenor (Wisconsin Departmentof Justice) and GM In Janesvllle. DNR advised thatgroundwater sampling would take place week of April 20, 1981,DNR and GM sample site wells and selected private wells.Samples are split between DNR and GM.
GM files a Notification of Hazardous Waste as required byRCRA.
WDNR "required* that General Motors continue groundwatermonitoring. WDNR to re-evaluate monitoring program on ayearly basis. Requirements that protective covers must beInstalled and damaged wells repaired or redrllled were alsoImposed.
Meeting on further Investigation.Warzyn report on condition of monitoring wells,rehabilitation of existing wells and results of hydraulicconductivity tests.Meeting where GM proposed further Investigation.
DNR approves proposed Investigation.
GM requested modifications to approved Investigation.Wheeler Pit scored by EPA using HRS procedure. Score was57.80 based on trlchloroethylene, chromium, zinc, barium andarsenic noted In groundwater samples (4/21/81).
DNR approves modifications to site monitoring plan proposedby GM.
DNR submits Wheeler Pit to U.S. EPA for Inclusion on NationalPriorities List.
Site wells sampled for standard Indicator parameters andselected metals.

-4-
03/12/84
03/29/85
08/20/86
12/1/87
01/26/88
Warzyn Report - Wheeler Pit Hydrogeologic Investigation.Monitoring Wells A and B Installed.Warzyn report on sampling of wells PI, P7 and B for specialorganic parameters on 9/6/84.
Warzyn report on sampling of Well B for selected prioritypollutants on 7/15/86.
Administrative Order by Consent signed by GN and CMC.
Pre-QAPP meeting between GMt CMC, Warzyn Engineering and U.S.ERA.
LJW/kam/DWH[jpl-401-42]

TABLE 2SUMMARY OF DATA GENERATING ACTIVITIES
AND ASSOCIATED QUALITY OBJECTIVESWHEELER PIT SITE
Activity Use of DataSource Characterization
• Test Pits
Migration PathwayAssessment
• Soil borings
Groundwater
To determine thickness and type ofnaterlal present at the Site.performance criteria for
Characterize unconso11datedmaterials and evaluate theirhorizontal and vertical extent.
Map distribution of groundwaterheads, evaluate flow directionsand estimate flow velocities.Evaluate type and amount ofcontaminants present at site.Evaluate general water qualityIndicators to be used 1nscreening remedial alternatives.
Data Quality Objective
Meet perfomance criteria forTCL organ1cs by appropriateCLP protocols. Meet
Inorganics and general waterquality parameters with methodsdescribed In Appendix D.
Accurately and consistentlydescribe the distribution ofof unconsondated materialthrough field observations.Meet performance criteria(Appendix D),Water elevations will bedetermined to ±0.01 ft. Meetperformance criteria for TCLorganic* by appropriate CLPprotocol. Meet performancecriteria for Inorganics andgeneral water qualityparameters with methodsdescribed 1n Appendix D.
KDF/ndj/DWHf.lpl-401-411
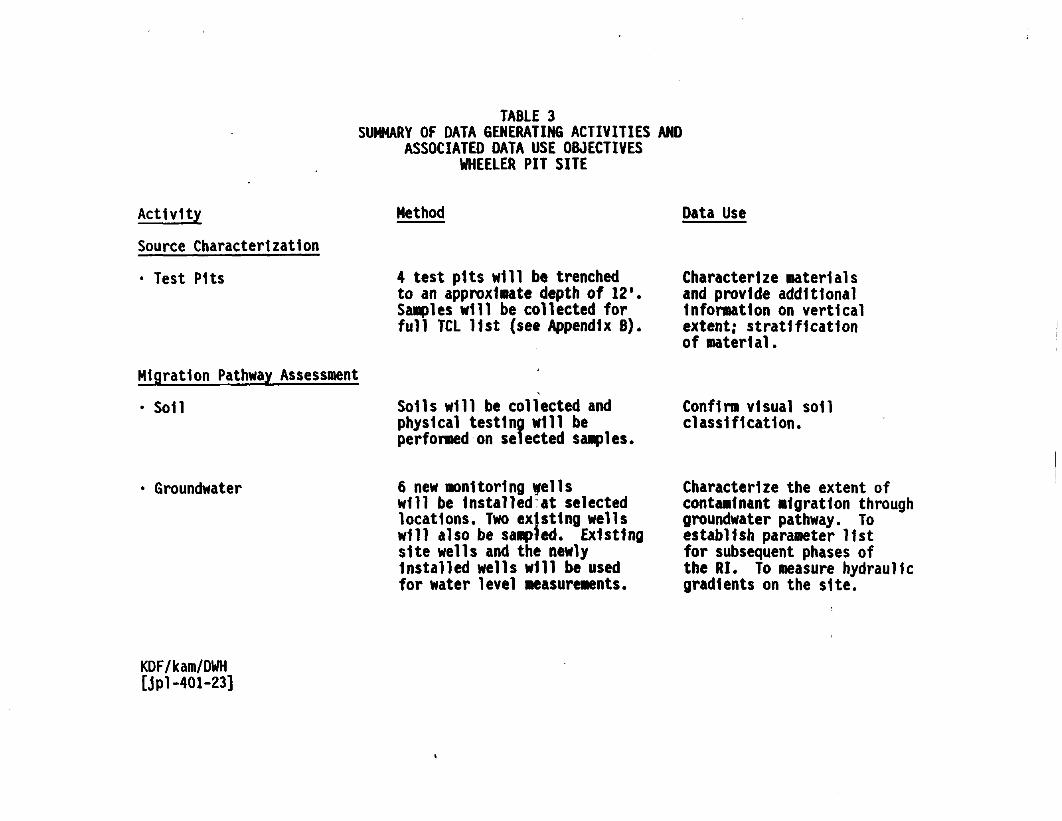
TABLE 3SUMMARY OF DATA GENERATING ACTIVITIES AND
ASSOCIATED DATA USE OBJECTIVESWHEELER PIT SITE
Activity
Source Characterization• Test Pits
Migration Pathway Assessment• Soil
Method
4 test pits will be trenchedto an approximate depth of 12'Samples will be collected forfull TCL list (see Appendix B)
Soils will be collected andphysical testing will beperformed on selected samples.
Data Use
Characterize materialsand provide additionalInformation on verticalextent; stratificationof material.
Confirm visual soilclassification.
Groundwater 6 new monitoring wellswill be Installed at selectedlocations. Two existing wellswill also be sampled. Existingsite wells and the newlyInstalled wells will be usedfor water level measurements.
Characterize the extent ofcontaminant migration throughgroundwater pathway. Toestablish parameter 11stfor subsequent phases ofthe RI. To measure hydraulicgradients on the site.
KDF/kam/DWH[Jpl-401-23]

TABLE 4SAMPLE TYPE AND ESTIMATED SAMPLE NUMBERS
WHEELER PIT SITE
Sample^)Matrix
FieldParameters Lab(2)
WasteCharacterization
Test Pits(waste) HNu
(Leachate)possibly sampled
Groundwater QualityBackground
Migration Pathway
No. ofSamples
UarzynWarzynUarzynHazletonHazletonHazletonUarzynUarzynHazletonHazletonHazleton
44444444444
ConductivityPH
UarzynUarzynUarzynUarzynUarzynUarzynUarzynHazletonHazletonHazleton
2Z22222222
GroundwaterConductivitypH
*
UarzynUarzynUarzynUarzynUarzynUarzynUarzynHazletonHazletonHazleton
6666662666
Field<3)Blanks
MatrixWSRK/DUP
Total No. Test ...Samples Parapet ers^J
5 Grain Size5 TCL Metals-Total5 Cyanide5 TCL-Velatiles5 TCL-BNA's5 TCL-Pest/PCB's6 TCL-Hetals Total6 Cyanide7 TCL-Volatile7 TCL BNAs7 TCL-Pest/PCBs
Soils HNu Uarzyn
TCL-ftetals DissolvedCyanideBOD,COO, TKN, NOrHKb-NMH3-II J
ALT, Cl, S04TDS,Total Dissolved PhosphorusTCL-volat11tfTCL-BNA extractablesTCL-P«st/PCB$
8 TCL-Metals dissolved8 Cyanide8 BOD8 COD, TKN. NOrHUfe-N,
NH3-N8 Alt Cl. S048 Total Dissolved Phosphorus4 TDS9 TCL-volatiles9 TCL-BNA9 TCL-Pest/PCBs
12 Grain size
1) Samples will2) Hazleton:
Uarzyn:
be considered low concentration.Hazleton Laboratory3301 Kinsman Blvd.Madison, UI 53704Uarzyn Engineering Inc.One Science CourtUniversity Research ParkMadison, Wisconsin 53706
(3) A trip blank for purgeables will be included with eachshipment for leacnate and groundwater samples.
(4) "Matrix Spike and Matrix Spike Duplicate are not included in the totalnumber samples. Uaste matrix VOCs require triple the normal volume fora MS/MSD sample and water matrix extractables (BNAs, Pesticides/PCBs)require double the normal volume at a frequency of one per 20 or fewersamples per concentration level."
(5) See Appendix B for EPA TCL analyte list.KDF/jpl/MJL[jpl-601-87d]

TABLE 5SAMPLE QUANTITIES, CONTAINERS. PRESERVATIVES AND PACKAGING FOR UASTE.
AND GROUNDWATER SANPlES FROH THE UHEEUR PIT SITE
AnalysisWATER AND LIQUIDS
Low Concentration (Organtes)Acid Extractables. base/neutralextractables, pestlcldes/PCBs
Volatile*
Low Concentration (Inorganics)Metals
Bottles and Oars
4 1 Liter aaber1
Preservation Holding Tiae Voluae of Samples Shipping Nona] Packaging
Iced to 4'C
Three 40-al volatile1 Iced to 4*Corganic analysis(VOA) vials
5 days untilextractionanalyzed 40days afterextraction7 days
Cyanide
General Water Quality ParametersBOD5
COD, TKN. Nitrate +Nltrlte-N, Ajwonia,
Alkalinity, chloride, sulfate
TDS
One 500 al highdensity polyethylenebottle
One 1 liter highdensity polyethylenebottle
Field filter through0.45 ua filterHN03 to pH<2Ice* to 4'C(Leachate Millbe collectedunflltered)NaOH to pH>12Iced to 4'C
6 months(28 days Hg)
One 500 al high Iced to 4'Cdensity polyethylene
One 16-oz glass jar HoSOj to pH<2IJed'to 45C
One 500 •! polyethylene Iced to 4'Cbottle
One 500 •! polyethylene Field filterbottle through 0*45
filter.Iced to 4'C
14 days
48 hours
28 days
Fill bottle toneck
Fill completelyno headspace
Dally delivery to No. 1 foaa linerthe appropriate or veraiculitelaboratory
Daily delivery to No. 1 foaa linerthe appropriate or veralculUelaboratory
Fill to shoulderof bottle
Fill to shoulderof bottle
Fill to shoulderof bottle
Fill to shoulderof bottle
Dally delivery to No. 2 foaa linerappropriate or veralculitelaboratory
Daily delivery to No. 2 foaa linerappropriate or veralculitelaboratory
Dally delivery to VeralculUethe appropriatelaboratory
28 days chloride; Fill to shoulder14 days alkalinity of bottle
7 days Fill to shoulderof bottle
Dally delivery to VeraiculiteappropriatelaboratoryDaily delivery to VeralculiteappropriatelaboratoryDaily delivery to Veralcullteappropriatelaboratory
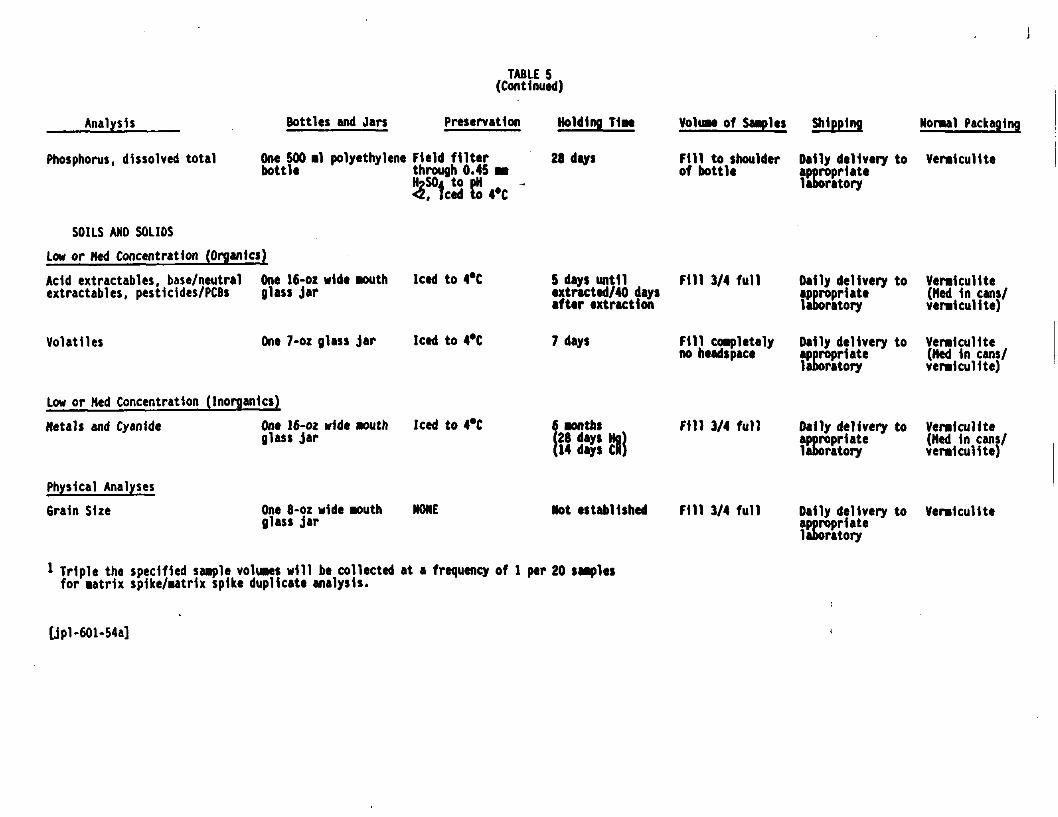
TABLE 5(Continued)
Analysis Bottles and Jars Preservation
Phosphorus, dissolved total One 500 •! polyethylene Field filterbottle through 0.45H2S04"to pH<2, Iced to 4*C
Holding Time
28 days
Volume of Samples Shipping Normal Packaging
Fill to shoulder Dally delivery to Veralcullteof bottle appropriate
laboratory
SOILS AND SOLIDSLow or Hed Concentration (Organlcs)Acid extractables, base/neutral One 16-oz wide mouthextractables, pestlcldes/PCBs glass jar
Volatlles
Iced to 4*C
One 7-oz glass jar Iced to 4*C
5 days until Fill 3/4 fullextracted/40 daysafter extraction
7 days Fill completelyno headspace
Dally delivery to Veralcullteappropriate (Hed In cans/1aboratory veralcul1te)
Dally delivery to Veralcullteappropriate (Hed In cans/laboratory veraicullte)
Low or Hed Concentration (Inorganics)Metals and Cyanide One 16-oz wide mouth Iced to 4'C
glass jar6 months(28 days(14 days C
Fill 3/4 full Dally delivery to Veralcullteappropriate (Hed In cans/laboratory veraicullte)
Physical AnalysesGrain Size One 8-02 wide mouth NONE
glass jar Not established Fill 3/4 full Dally delivery to Veralcullteappropriatelaboratory
Triple the specified sample volumes will be collected at a frequency of 1 per 20 samplesfor matrix spike/matrix spike duplicate analysis.
[jpl-601-54a]

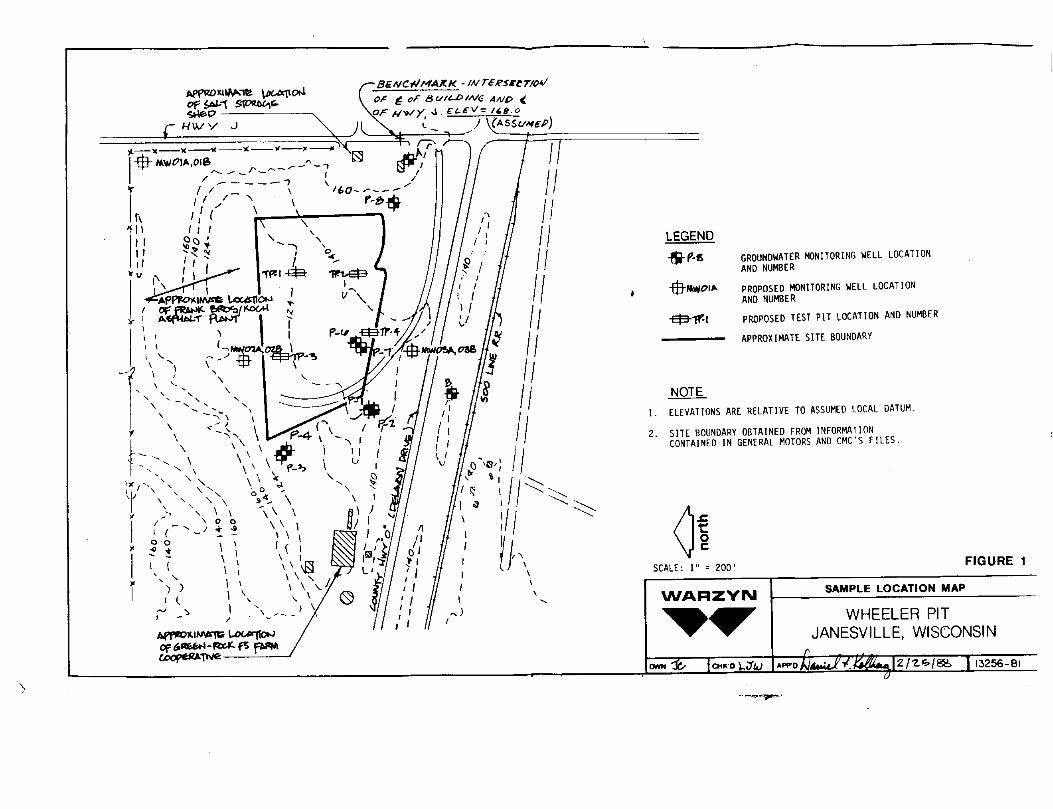
GROUNDWATER MONITORING WELL LOCATIONAND NUMBER
PROPOSED MONITORING WELL LOCATIONAND NUMBER
PROPOSED TEST PIT LOCATION AND NUMBER
APPROXIMATE SITE BOUNDARY
NOTE1. ELEVATIONS ARE RELATIVE TO ASSUMED LOCAL DATUM.
2. SITE BOUNDARY OBTAINED FROM INFORMATIONCONTAINED IN GENERAL MOTORS AND CMC'S FILES.
FIGURE 1
SAMPLE LOCATION MAP
WHEELER PITJANESVILLE, WISCONSIN
13256-Bl

f£ft

APPENDIX A
SAMPLING PLAN

TABLE OF CONTENTS
PAGE
1.0 OBJECTIVES ................................................. 1
2.0 SCOPE ...................................................... 1
3.0 SAMPLING LOCATIONS AND NUMBERS OF SAMPLES .................. 2
3.1 Source Characterization ................................ 23.2 Migration Pathway Assessment............................ 2
4.0 SAMPLE DESIGNATION.......................................... 4
4.1 Project Identifier Code................................. 44.2 Sample Type Code........................................ 44.3 Sampling Event Code..................................... 44.4 Examples of Sample Numbers.............................. 5
5.0 GENERAL SAMPLING EQUIPMENT AND PROCEDURES................... 5
5.1 Soils .................................................. 55.2 Groundwater ............................................ 65.3 Waste and Leachate ..................................... 8
6.0 DECONTAMINATION PROCEDURES ................................. 10
7.0 SAMPLE HANDLING AND ANALYSIS................................ 11
8.0 SAMPLE DOCUMENTATION ....................................... 12

SAMPLING PLANWHEELER PIT
1.0 OBJECTIVESThe primary objective of the sampling activities described below Is to obtainrepresentative data to be used for the RI/FS analysis. Sampling activitiesdescribed 1n this plan will be performed to complete the SourceCharacterization and Migration Pathway Assessment subtasks of the Initial(Phase I) Remedial Investigation (RI).
Data use objectives of the Source Characterization subtask Include:
• To Identify the location and extent of source areas; and• To Investigate the chemical and physical characteristics of the waste
materials.Data use objectives of the Migration Pathway Assessment subtask Include:
• To evaluate of possible routes for contaminant movement off-site;• To describe of the site hydrogeologlcal and geologic settings;• To describe of the soil characteristics of the site area.
2.0 SCOPEThis Sampling Plan describes the procedures and practices to be used 1nobtaining Source Characterization and Migration Pathway Assessment data foruse 1n the RI/FS. These procedures Include a description of the sampledesignation system, personnel and their responsibilities, and the samplingmethods to be employed. These methods Include:
Test pits 1n the former lagoonCollection of waste (and leachate 1f present) samplesSoil borings and samplingMonitoring well InstallationGroundwater samplingWater level monitoringAquifer permeability tests

-2- 13256.60
3.0 SAMPLING LOCATIONS AND NUMBERS OF SAMPLES3.1 Source CharacterizationSource characterization win Include field classification of the landfillcover materials, waste materials, base soils and fill materials, 1fencountered. Four test pits will be dug 1n the former disposal lagoon todetermine the thicknesses and types of materials present at the Site. Testpit locations are shown on Figure 1. A minimum of five waste samples (onefrom each pit and one duplicate) will be collected. If leachate collects 1nthe bottom of a test pit during excavation, a leachate sample will be taken.A maximum of 5 leachate samples (one from each test pit and one duplicate)will be collected and analyzed (If necessary). Waste samples will be analyzedfor U.S. EPA Target Compound List (TCL) parameters. Leachate samples (1fcollected) will be analyzed for the parameters specified for groundwatersamples (Section 7.0).
3.2 Migration Pathway AssessmentMigration Pathway Assessment samples will Include soil samples collected frommonitoring well borings and groundwater samples. Two wells, with a wellscreen separation of 25 feet, will be Installed at each of the 3 locationsshown on Figure 1. The shallow well at each nest will be a water table well,and the deep well will be a piezometer. Soil samples will be collected fromthe deeper of the two borings at each location at 2 1/2-foot Intervals between0 and 10 feet, and then at 5-foot Intervals to the bottom of the boring, usinga split spoon sampler. Soil samples will be collected for laboratory analysisof particle size distribution to confirm the site geologist's visualclassifications made during drilling. Only a portion of the soil samplescollected will be submitted for analysis. It 1s expected that the 3 deeppiezometers (new) will generate approximately 46 soil samples. Soil samplesfrom each major soil unit encountered at each location will be analyzed forparticle size. An average of four samples per boring will be submitted foranalysis, for a total of approximately 12 Investigative soil samples. Noduplicate samples will be collected. Soil samples collected for thisInvestigation will be retained by Warzyn until the termination of the RI/FSInvestigation, and until a release 1s provided by the PRP's to properlydispose of the samples.

-4- 13256.60
4.0 SAMPLE DESIGNATIONA sample numbering system will be used to Identify each Investigative andquality control sample. Each sample Identifier will Include the projectIdentifier code, sample type and location code, and a sampling event code.The sampler will maintain a log book containing the sample Identificationlistings.
4.1 Pro.lect Identifier CodeA 2-letter designation will be Implemented to Identify the sampling site. Theproject Identifier will be "WP" to signify this site Investigation.
4.2 Sample Type and Location CodeEach sample collected will be Identified by a 2-letter code to Identify thesample type. Sample type codes to be utilized for the subtasks covered 1nthis Sampling Plan Include:
GW - groundwater from monitoring wellLL - leachate from test pit (1f present)SS - split spoon soil sampleTB - trip blankTP - waste sample from test pitFB - field blank
Other letter designators may be added for sample activities of later subtasks.
The location code will follow the sample type code. The location codeconsists of a two-to five-digit numeric or alpha-numeric code that Indicatesthe sample location. Samples, except soils, will use a consecutive numberingsystem, starting at 01. Soil sample location codes will be Identical to themonitoring well labels presented In Figure 1.
4.3 Sampling Event CodeA two-digit numerical code will be used to designate additional locationInformation. For soil samples, the event code will represent the depth of thesample In feet below the surface. The event code will also be used foradditional rounds of samples or for duplicate samples.
-5- 13256.60
4.4 Examples of Sample NumbersExamples of sample number codes are as follows:
* WP-SS MW03A-25 - Wheeler Pit, soil sample from monitoring well MW03A ata depth of 25 feet
* WP-GWMW03A-01 * Wheeler Pit, groundwater sample from monitoring wellMW03A, first sampling event
* WP-GWMW03A-91 » Wheeler Pit, duplicate groundwater sample frommonitoring Well MW03A, first sampling event
5.0 GENERAL SAMPLING EQUIPMENT AND PROCEDURES5.1 SoilsObjectiveThe objective of this activity 1s to characterize the site soils forassessment of contanlnant migration potential.
Personnel and ResponsibilitiesA drill crew of two Individuals will perform the borings for soil samples. Ageologist will supervise the drill crew, collect soil samples, prepare boringlogs and well details, document the methods used for well construction anddevelopment, and function as the activity Safety Coordinator.
MethodsSoil borings will be advanced by the drill rig using 4 l/4-1n. I.D. hollow-stem augers. Soil samples will be collected wltlT split spoon samplers usingASTM Method D1586, and visually classified In the field by the geologist, andthen placed Into glass sampling Jars. Soil samples will be collected at2.5-foot Intervals down to 10 feet and at 5-foot Intervals at greater depths.Selected samples will be analyzed 1n the laboratory for particle sizedistribution (see QAPP Appendix D for particle size distribution methods).Boring locations are shown on Figure 1 and are listed 1n Table 1. If fieldconditions warrant 1t, the use of alternate drilling methods, such as rotarywash boring, may be required.
Previous groundwater sampling analysis has Indicated only a slight risk ofencountering hazardous conditions during drilling activities. Cuttings

-6- 13256.60
generated during drilling will be wasted on site. As a safety precaution,soil samples will be screened with an HNu photo1on1zat1on meter.
5.2. GroundwaterObjectiveThe objective of this activity 1s to determine groundwater quality,groundwater flow direction and saturated hydraulic conductivity of geologicmedia 1n the Site area.
Personnel and ResponsibilitiesGroundwater monitoring wells will be Installed by a drill crew of twoIndividuals under the supervision of a geologist, as described In Section 5.1.Water level monitoring will be performed by a geologist or field technicianexperienced 1n water level monitoring. Hydraulic conductivity testing will beperformed by a hydrogeologlst. Groundwater quality sampling will be performedby a two member team composed of a geologist/chemist and a samplingtechnician.
MethodsA. Well InstallationMonitoring wells will be Installed 1n borings described 1n Section 5.1. Theywill be constructed of 2-1n. diameter stainless steel pipe with 5-foot or10-foot stainless steel screens with a slot size of 0.01 In. A No. 2 flintsand pack will be placed around each screen to a level 2 feet above the top ofthe screen. A 3-foot bentonlte plug will be placed above the sand pack, andthe borehole will be grouted to the surface with bentonlte cement. Eachmonitoring well will be equipped with a locking steel protective casing. Newmonitoring well locations are shown on Figure 1 and are listed 1n Table 1.
The new monitoring wells will be developed using a Bralnard-Kllman pump.Development water will be wasted on site. Drilling equipment and tools willbe decontaminated at the "Equipment and Vehicle Area" by steam cleaning thedrilling rods, augers, bits and tools between boreholes. Well pipes andscreens will be steam cleaned and covered with plastic until Installed In theboreholes.

-7- 13256.60
B. Water LevelsWater levels In existing and new wells will be measured prior to groundwatersampling. An electronic water level Indicator or a measured tape with anattached sounding device will be lowered Into the well until the water level1s reached. Depths will be recorded to the nearest 0.01 ft. The point ofreference will be the top of the well casing. Water elevations will bereferenced to the U.S.G.S. datum.
C. Groundwater SamplingGroundwater sampling will proceed from wells expected to have the lowestcontainment concentrations (based upon observations during drilling andexisting groundwater quality data), to the wells suspected of having thehighest containment concentrations. Each well to be sampled will be purgedImmediately prior to sampling using a stainless steel bailer attached tostainless steel cable. The water removed from the well will be collected andthe volume measured so that a minimum of three well volumes are removed. ThepH and conductivity will be measured to assure that these parameters havestabilized prior to sample collection. After well purging has been completed,the samples will be collected using a stainless steel bailer. Purged waterwill be wasted on site*
The bailer, cable and water level measurement tape or Indicator will becleaned between wells with a I1qu1nox/or non-phosphate detergent solution and,finally, rinsed with delonlzed water. The bailer will be triple rinsed withdelonlzed water poured directly from containers 1n order to remove residualdetergent.
Groundwater sample blanks will be collected by pouring delonlzed water fromthe sampling bailer Into the sample bottles. Matrix spike/matrix spikeduplicate samples will be collected using the same bailer. The portion of theprinciple sample and duplicate sample for volatile organlcs analysis will beobtained from the bailer Immediately after sampling. The remainder of thesample will be composited 1n a stainless steel container and split between theprinciple sample and the duplicate sample.

-8- 13256.60
P. Hydraulic ConductivityHydraulic conductivity will be measured by drawdown testing 1n newly Installedwater table wells and by air pressure 1n deeper piezometers. The methods tobe used are as follows:
• Measure water level with an electronic water level Indicator or a tapeand sounding device.
• Place the pressure transducer Into the well and allow approximatelythree minutes for the probe to equilibrate to the water temperature andpressure.
• Install the well head device to seal the well head(for piezometers only).
• Enter the reference water level Into the data logger and check the waterlevel using the pressure transducer until water level reading 1s stable.
• After a stabilized water level reading 1s obtained from the pressuretransducer, the well 1s pressurized with sufficient air pressure todisplace 10 ft of water (0.4 PSI/ft of water) (for piezometers only).
• Air pressure 1s maintained until the water level reading from thetransducer 1s constant (for piezometers only).
• The air pressure 1s then Instantaneously released while running thepressure transducer recorder 1n the log sampling mode (for piezometersonly).
• At water table wells, a single bailer full 1s removed and wasted on siteto reduce the water level, while running the pressure transducerrecorder 1n the log sampling mode.
• The test results are Immediately printed out to obtain a hard copy.
• Data are transferred at the end of the day to a micro-computer.
5.3 Waste and LeachateOb.1ect1veThe objective of this activity 1s to determine the extent of the source area,characterize the waste and leachate (1f present) for assessment of theirpotential to Impact groundwater quality.
Personnel and ResponsibilitiesTest pit excavations will be performed by a health and safety trained,earthmovlng subcontractor, under the supervision of the site geologist. The

-9- 13256.60
site geologist will be responsible for logging the test pit and determiningthe depth of the excavation. An activity Safety Officer will perform airmonitoring during the excavation and oversee the use of respiratoryprotection, 1f needed. Waste and leachate samples (If present) will beobtained by two Individuals. The sampler will be assisted by a technician forsample handling and paperwork. A backhoe/front end loader operator will beresponsible for opening the excavation and for filling the excavation aftersampling, or 1n the event that hazardous gases are detected. All on-s1tepersonnel (Including subcontractors) will have completed 40 hours of healthand safety training for hazardous waste site work and will be on a medicalmonitoring program. Anticipated levels of protection are specified In theHealth and Safety Plan.
MethodsWaste Excavations (Test Pits)Excavations by trenching will be performed with a backhoe/front end loader toapproximate depths of 12 feet. The backhoe/front end loader will operate froma plywood platform to avoid rupturing the lagoon cover material. Covermaterial will be stockpiled and used to recover the excavation at the end ofsampling. Waste material removed from the test pits will be placed back 1nthe pit at the end of sampling.
Samples of waste and leachate (1f present) will be collected from thetrenches. Samples will be collected out of the backhoe bucket with stainlesssteel spatulas or trowels, and composited to obtain a more representativesample In stainless steel buckets or stainless steel beakers, before beingplaced 1n sample Jars. Compositing will occur with a minimum stirring of thesample. The portion used for volatlles analysis will not be composited andwill be placed In the sample bottle first, to minimize time forvolatilization.
If leachate accumulates In the bottom of the test pit, It will be sampledusing a stainless steel beaker attached to an extendable arm. The portion ofthe sample used for volatlles analysis will be placed 1n the sample bottlefirst to minimize time for volatilization.
-10- 13256.60
6.0 DECONTAMINATION PROCEDURESProcedures to be followed to decontaminate equipment and personnel aredescribed 1n the Site Health and Safety Plan. The procedures are summarizedbelow.
Site personnel decontamination procedure;
Dispose of outer latex bootiesWash boots 1n Alconox bootwashClean outer gloves In Alconox wash solution (discard If too soiled toclean thoroughly)Dispose of polycoated tyvek suitsDispose of surgical glovesWash hands 1n hand washWash face and neck 1n face washClean and sanitize face mask
Site personnel will perform the above mentioned decontamination procedureprior to leaving the site. Additionally, complete and thorough taking ofshowers 1s required of personnel upon reaching their residence.
Discarded clothing and other articles will be collected 1n double-lined, heavyduty garbage bags.
Equipment and vehicle decontamination procedure:
• Decontamination will be performed on-s1te• Gross contamination will be removed with a brush and Alconox solution• Steam cleaning will follow
The drilling equipment and the backhoe/front end loader will be steam cleanedprior to exiting the site. This will be conducted at the "Equipment andVehicle Area". Another area located away from this area will be designated asthe "Site Personnel Decon Area".
Decontamination will Include steam-cleaning the drilling equipment,backhoe/front end loader and tools between boreholes and test pits and

-11- 13256.60
detergent washing and water rinsing the split spoon samplers after eachcollected sample. Well materials will also be steam-cleaned and wrapped Inplastic until Installed. The bailer cable, air pressure transducer, trowels,spatulas, stainless steel bucket and water level measurement tape or Indicatorwill be cleaned with a I1qu1nox/or nonphosphate detergent solution and rinsedwith deIonized water.
Previous groundwater sampling analysis has Indicated only a slight risk ofencountering hazardous conditions during drilling activities. Because ofthis, contaminants removed during brush-down and steam cleaning are considerednon-hazardous and will be left on the decon area.
Equipment remaining at the site may not be decontaminated, but will be storedon the contaminated side of the equipment and vehicle decon area at the end ofeach work day.
7.0 SAMPLE HANDLING AND ANALYSISA. ParametersLeachate and groundwater samples collected for chemical analysis will beanalyzed by a laboratory approved by the U.S. EPA Region V CPMS, CRL.Chemical parameters for which groundwater and leachate are to be analyzed aresummarized below:
PHSpecific Conductance (Temperature Corrected)U.S. EPA Target Compound List ParametersDissolved Total PhosphorusNitrate NitrogenSulfateAmmonia NitrogenTotal KJeldahl NitrogenChemical Oxygen DemandTotal Organic CarbonAlkalinityChloride
Measurement of pH, specific conductivity and temperature will be performed 1nthe field. Waste samples from the test pits will be analyzed for parameters

-12- 13256.60
on the U.S. ERA Target Compound List. Soil samples from borings will beanalyzed for grain size.
B. Sample PreservationSamples will be collected and preserved 1n a manner appropriate for theanalyses they receive (see Table 5 of the QAPP). The portion of groundwatersamples requiring field filtering (see Table 5 of the QAPP) analyses will befiltered In the field through 0.45 micron filter as soon as possible aftercollection using a pressure filtration device. Filtered portions of thesamples will be preserved as appropriate Immediately after filtration.Sample fractions will be preserved before shipment according to the proceduresshown 1n Table 5 of the QAPP. Preservatives added will be prepared usingreagent grade chemicals.
8.0 SAMPLE DOCUMENTATIONSamples will be collected under cha1n-of -custody procedures. Standard formsIncluding sample labels, sample tags, chal n-of -custody forws, and custodyseals used for sample tracking will be maintained (see attachments). A briefdescription of sample documents follows.
2. Carrier service does not need to sign form, 1f custody seals remainIntact.
3. Use for all samples
B. Chain of Custody Seals
1. Two seals per shipping container to secure the I1d and provide evidencethat samples have not been tampered with.
2. Cover seals with clear tape.
3. Record seal numbers of Chain of Custody Form.
4. Use for all samples.

-13- 13256.60
C. Sample Tags1. Each sample container must have a sample tag affixed to 1t.
2. Sample tag numbers are recorded on the Chain of Custody Forms.3. Use for all samples.
D. Sample Identification Record Form will:
1. provide means of recording crucial sample shipping and trackingInformation.
2. contain Information such as:
Sample numberSample matrixSample location codeSample roundChain of custody numberLab codeDate sampledDate shippedAirbill numberSampling tag number
Paperwork accompanying the samples being shipped to the laboratory will besealed 1n a plastic bag that 1s taped to the Inside of the cooler I1d. Copiesof the cha1n-of-custody forms, and other paperwork (1f possible), will beretained for the field files.
Two sample seals will be placed on opposite sides of the I1d and extendingdown the sides of the cooler. The I1d will be securely taped shut prior toshipment. Examples of the required sample documentation form are contained InAttachment 1*
LJW/kam/DWH[Jpl-601-50]

TABLE 1SAMPLING LOCATIONS
LocationSample
TP1TP2TP3TP4MW01AMW01BMW02AMW02BMW03AMW03B
SamplingActivity
Test PitTest PitTest PitTest PitWater Table WellPiezometerWater Table WellPiezometerWater Table WellPiezometer
ApproximateDepth
12 ft12 ft12 ft12 ft60 ft85 ft25 ft50 ft40 ft65 ft
Approximate Number ofInvestigative Samples
Leachate Waste Soil Water
19
12
15
Indicated number of samples does not Include duplicates, matrix spikes andmatrix spike duplicates. See Table 4 of the QAPP for estimated sample numbers.
LJW/kam/RCW[jpl-401-43]13256.60
ATTACHMENT 1
EXAMPLES OF SAMPLE DOCUMENTATION FORMS
1. Field recording sheet
2. Field Testing/Sample Preparation sheet
3. Sample Identification Record (for all samples)
4. Chain of Custody Sheet (for all samples)5. Sample Tags (for all samples)
Sample Labels (for all samples)
6. Chain of Custody Seals (for all samples)
[Jpl-601-50]

JOB NAME:,LOCATION:
ClSAMPLING DATE;
PAGE
DY:
OF
PROJECT MANAGER
PARAMETERS:»
OTHER:
NAMEOF
SAMPLER SAM1.* TOT.O.ELEV
pHConductivityTotal Alkalin tty
c. DEPTH TOWATER
CUELEV.
ChlorideTotal HardnessDissolved Iron
*
ODOR
CCHKEHTS:WA«Z Y fvj
F Tfw /JFipf —————————— — —
COLOR TURD.
NitriteSodiumSulfate
FIMEPURGED
VOLUMEPURGED
WELLCAPACITY
(11
:ool i t r J t eFDS
TIMESAMPLED COMMENTS
Sampling Device:
Purging Method:\J:\f \FtJr —————————— ————— ^ ————————————————————————————— • —————— • ——————
Cleaning Method: FORM I

Date
FIELD TESTING/SAMPLE PREPARATION
Lab 1
-U
-D
Sample 1Time Filtered/
Analyzed PHSpec.Cond. Temp.
Spec.Cond.0 25"
-
-
Analyst Comments
pH M e t e r ;
C o n d u c t » v i ty Meter:
Bottle Types/Preservation;
C o n d u c t i v i t y of Standard:
P V C / c w l / m l f[mlf-160-31]

SAMPLE IDENTIFICATION RECORDWheeler Pit Site
CASE/JOBNUMBER MATRIX
SAMPLENUMBER LAB
LABNUMBER
CHAIN OFCUSTODY
DATESAMPLED
DATESHIPPED
AIRBILLNUMBER
1
SAMPLE TAGNUMBER
ii
1
i——————————————— i
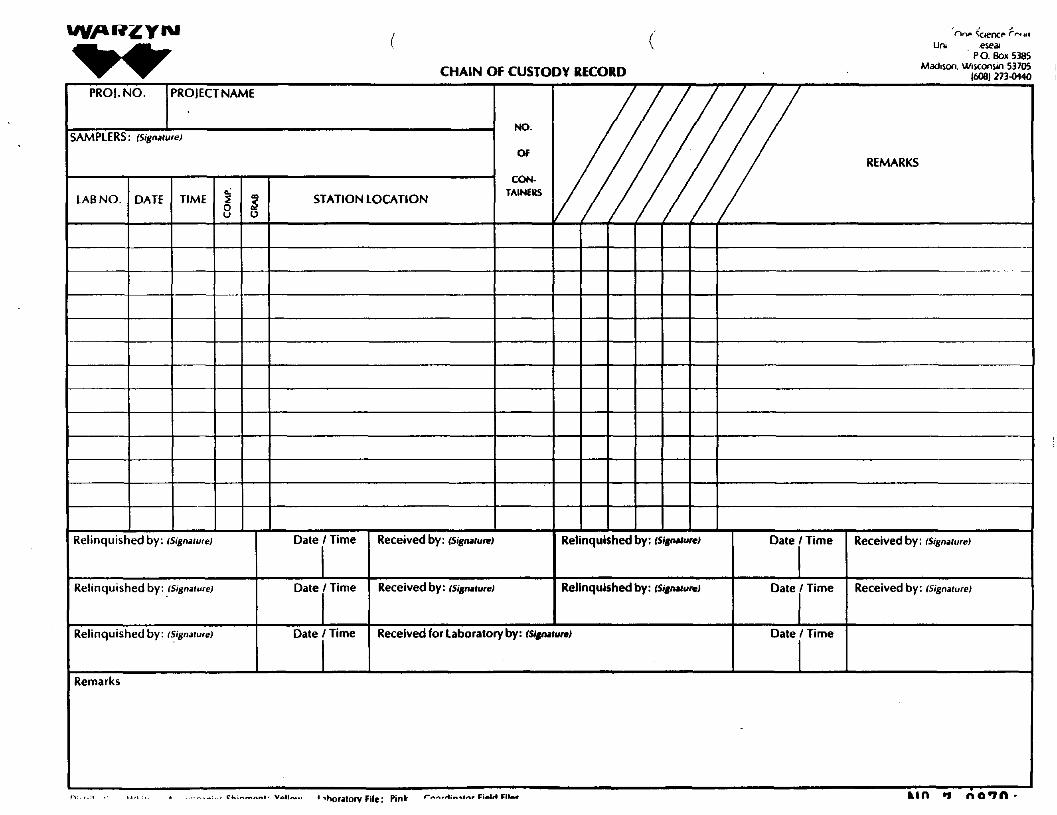
Uni eseaiP.O. Box 5385
Madison. Wisconsin 53705(608) 273-0440
PRO). NO. PROJECTNAME
SAMPLERS: (Signature)
LAB NO. DATE TIME STATION LOCATION
NO.
OF
CON-TAINEKS
REMARKS
Relinquished by: (Signature) Date / Time Received by: (Signature) Relinquished by: (Signature) Date /Time Received by: (Signature)
Relinquished by: (Signature) Date / Time Received by: (Signature) Relinquished by: (Signature) Date / Time Received by: (Signature)
Relinquished by: (Signature) Date / Time Received for Laboratory by: (Signature) Date / Time
Remarks
v*n™.. •-.Horaiorv File; Pint /•—*-*t«r FUW nu. tin i n0*7ft
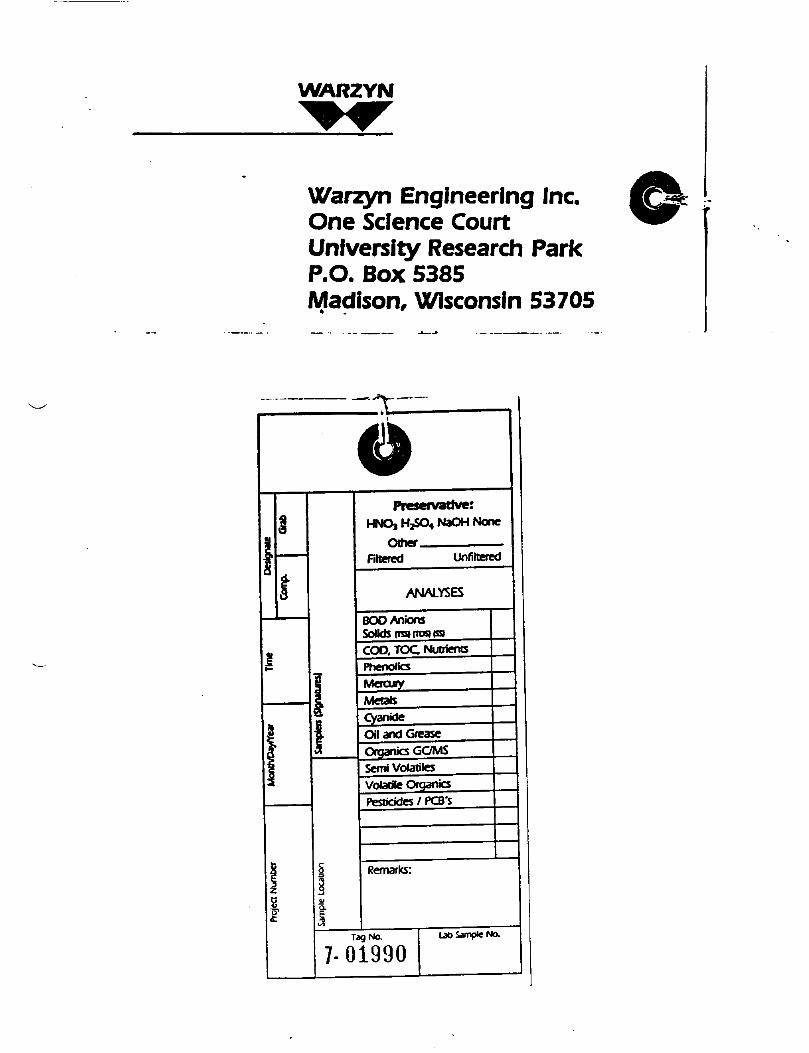
WARZYN
Warzyn Engineering Inc.One Science CourtUniversity Research ParkP.O. Box 5385Madison, Wisconsin 53705
"T"
3
I
,
S
Proje
ct Nu
mbe
r
I
Sam
ple L
ocat
ion
PresHNC^H^S
OtherFiltered
etvattve:O4NaOHNone
Unfiltered
ANALYSES
BOOAnionsSofids rns» riDSj tsgCOD, TOC NutrientsPhenolicsMercuryMetalsCyanideOff and GreaseOrganic; GOMSSemi VolatilesVolatile OrganicsPesticides / PCB's
Remarks:
Tag No.
7-01990Lao Sample No.

WARZYNCHAIN OF CUSTODY SEAL
WARZYN ENGINEERING INC.ONE SCIENCE COURT
UNIVERSITY RESEARCH PARKP-O. BOX 5385
MADISON, Wl 53705(608) 273-0440

CD

APPENDIX •TCL PARAMETERS AND DETECTIOH LIMITS

CLP TARGET COMPOUND LISTAND DETECTION LIMITS
Volatlles CAS Number
u2.3.4.5.6,7.8.9.
10.11.12.13.14.15.16.17.18.19.20.21.22.23.24.25.26.27.28.29.30.31.32.33.34.
ChloromethaneBromomethaneVinyl ChlorideChloroethaneMethyl ene ChlorideAcetoneCarbon 01sulf1de1 ,1-01 chl oroethene1,1-01 Chloroethane1,2-01 chl oroethene (c1s andChloroform1,2-01 Chloroethane2-Butanone1,1,1-Trl ChloroethaneCarbon TetrachlorfdeVinyl AcetateBromodl Chloromethane1 ,1 »2 ,2-Tet rachl oroethane1 ,2*D1chl oropropanetrans-1 ,3-01 chl oropropeneTrlchloroethene01 bromocl oromethane1,1,2-TMchloroethaneBenzenec1s-l,3-D1ch1oropropeneBromoform2-Hexanone4-Methyl -2-pentanoneTetrachl oroetheneTol ueneChlorobenzeneEthyl BenzeneStyreneTotal Xylenes
74-87-374-83-975-01-475-00-375-09-267-64-175-15-075*35-475-35-3
trans) 156-60-567-66-3
107-06-278-93-371-55-656-23-5
108-05-475-27-479-34-578-87-5
10061-02-679-01-6
124-48-179-00-571-43-2
10061-01-575-25-2
591-78-6108-10-1127-18-4108-88-3108-90-7100-41-4100-42-5
DetectionLow
ug/1
101010105
10555555
1055
105555555555
1010555555
Limits*1'Low Soil,,
Sediment < 3>ug/kg
101010105
10555555
1055
1055555555
55
1010
555555

Detection Limits*1*
Sem1-Vo1at11es CAS Number
35. Phenol 108-95-236. b1s(2-ChloroethylJether 111-44-437. 2-Chlorophenol 95-57-838. l,3-01chlorobenzene 541-73-139. 1,4-01chlorobenzene 106-46-740. Benzyl Alcohol 100-51-641. l,2-D1ch1orobenzene 95-50-142. 2-Methylphenol 95-48-743. b1s(2-Chloro1 sopropyl) ether 39638-32-944. 4-Methylphenol 106-44-545. N-N1troso-01propylam1ne 621-64-746. Hexachloroethane 67-72-147. Nitrobenzene - 98-95-348. Isophorone 78-59-149. 2-N1trophenol 88-75-550. 2,4-01methylphenol 105-67-951. Benzole Add 65-85-052. b1s(2-Chloroethoxy)methane 111-91-153. 2,4-D1chlorophenol 120-83-254. 1,2,4-TM chl orobenzene 120-82-155. Naphthalene 91-20-356. 4-Chloroan111ne 106-47-857. Hexach1o robut ad1ene 87-68-358. 4-Chloro-3-methylphenol 59-50-7
(para-chloro-raeta-cresol)59. 2-Methylnaphthalene 91-57-660. Hexachlorocyclopentadlene 77-47-461. 2,4,6-TMchlorophenol 88-06-262. 2,4,5-TM chl orophenol 95-95-463. 2-Chloronaphthalene 91-58-764. 2-N1troan1l1ne 88-74-465. Dimethyl Phthalate 131-11-366. Acenaphthylene 208-96-867. 3-N1troanll1ne 99-09-268. Acenaphthene 83-32-969. 2,4-D1n1trophenol 51-28-570. 4-N1trophenol 100-02-771. Dlbenzofuran 132-64-972. 2,4-D1n1trotoluene 121-14-273. 2,6-D1ni trotoluene 606-20-274. 01 ethylphthalate 84-66-2
Low^\Water*4)ug/1
10101010 '1010101010101010101010105010101010101010
10101050105010105010505010101010
Low Soil..Sediment15'
ug/kg
330300330330330330330330330330330330330330330330
1600330330330330330330330
330330330
1600330
1600330330
1600330
16001600330330330330

Semi-Volatile* CAS Number
75. 4-Chlorophenyl Phenyl ether 7005-72-376. Fluorene 86-73-777. 4-N1troan111ne 100-01-678. 4,6-01n1tro-2-methylphenol 534-52-179. N-n1trosod1phenylam1ne 86-30-680. 4-Bromophenyl Phenyl ether 101-55-381. Hexachlorobenzene 118-74-182. Pentachlorophenol 87-86-583. Phenanthrene 85-01-884. Anthracene 120-12-785. 01-n-Butylphthalate 84-74-286. F1uoranthene 206-44-087. Pyrene 129-00-088. Butyl Benzyl Phthalate 85-68-789. 3f3'-D1chlorobenz1d1ne 91-94-190. Benzo(a)anthracene 56-55-391. b1s(2-ethylhexyl)phthalate 117-81-792. Chrysene 218-01-993. D1-n-octyl Phthalate 117-84-094. Benzo(b)fl uoranthem 205-99-295. Benzo(k) fl uoranthene 207-08-996. Benzo(a)pyrene 50-32-897. Indeno(l,2,3-cd)pyrehe " 193-39-598. D1benz(a,h)anthracene 53-70-399. Benzo(gth,1)perylene 191-24-2
Detection
Water <4>ug/1101050 .50101010501010101010102010101010101010101010
Limits*1^Low Soil..
Sediment^5'ug/kg
330330
16001600330330330
1600330330330330330330660330330330330330330330330330330
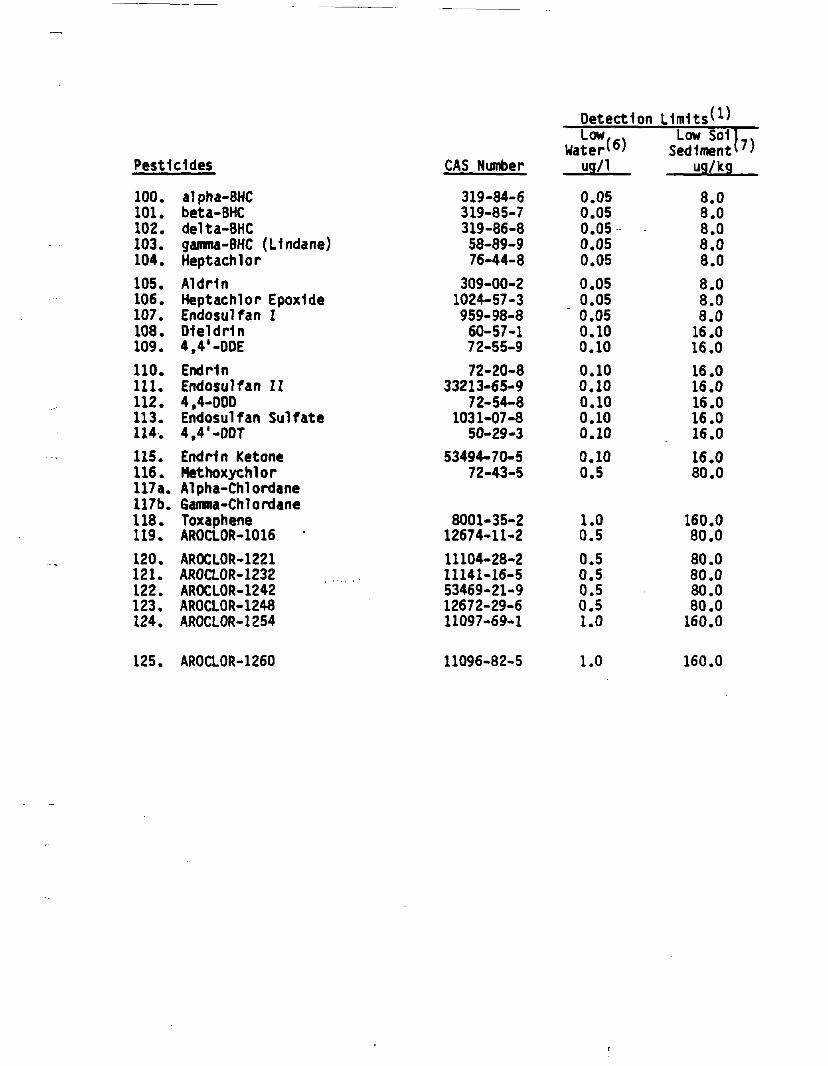
Pesticides
100.101.102.103.104.105.106.107.108.109.110.111.112.113.114.115.116.117a.117b.118.119.120.121.122.123,124.
alpha-BHCbeta-BHCdelta-BHCgamma-BHC (Llndane)HeptachlorAldMnHeptachlor EpoxldeEndosulfan IDleldrln4 ,4' -ODEEndrlnEndosulfan II4,4-DODEndosulfan Sulfate4 ,4 '-DOTEndHn KetoneMethoxychlorAlpha-ChlordaneGamma-ChlordaneToxapheneAROCLOR-1016 *AROCLOR-1221AROCLOR-1232AROCLOR-1242AROCLOR-1248AROCLOR-1254
CAS Number
319-84-6319-85-7319-86-858-89-976-44-8
309-00-21024-57-3959-98-860-57-172-55-972-20-8
33213-65-972-54-8
1031-07-850-29-3
53494-70-572-43-5
8001-35-212674-11-211104-28-211141-16-553469-21-912672-29-611097-69-1
DetectionLow,
ug/1
0.050.050.05 -0.050.050.050.050.050.100.100.100.100.100.100.100.100.5
1.00.50.50.50.50.51.0
Limits*15
Low So1)_.Sediment*7'
ug/kg
8.08.08.08.08.08.08.08.0
16.016.016.016.016.016.016.016.080.0
160.080.080.080.030.080.0
160.0
125. AROCLOR-1260 11096-82-5 1.0 160.0
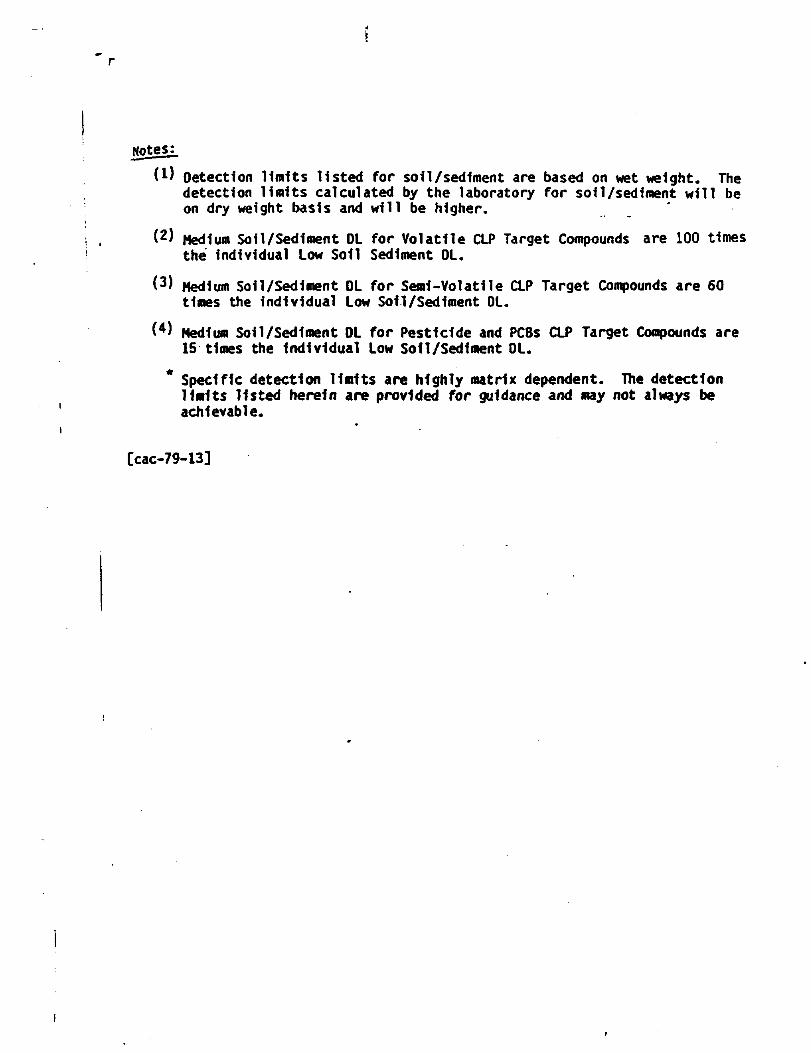
(1) Detection limits listed for soil/sediment are based on wet weight. Thedetection limits calculated by the laboratory for soil/sediment will beon dry weight basis and will be higher.
Medium Soil/Sediment OL for Volatile CLP Target Compounds are 100 timesthe individual Low Soil Sediment OL.
Medium Soil/Sediment OL for Semi-Volatile CLP Target Compounds are 60times the individual Low Soil /Sediment OL.
Medium Soil/Sediment OL for Pesticide and PCBs CLP Target Compounds are15 times the Individual Low Soil/Sediment OL.
* Specific detection Units are highly matrix dependent. The detectionUnits listed herein are provided for guidance and may not always beachievable.
[cac-79-13]

ELEMENTS DETERMINED BY INDUCTIVELY COUPLED PLASMA EMISSIONOR ATOMIC ABSORPTION (AA) SPECTROSCOPY
RequlredDetection Level
Metal:
Alumlum 200Antimony 60Arsenic 10Barium 200Beryllium 5Cadmium 5Calcium 5000Chronrfun 10Cobalt 50Copper 25Iron 100Lead 5Magnesium 5000Manganese 15Mercury 0.2Nickel 40Potassium 5000Selenium 5Silver 10Sodium 5000Thallium ^ 10Vanadium 50Z1nc 20
10
[cac-79-14]


APPENDIX C-l
FIELD HEASUREMENT OF PH
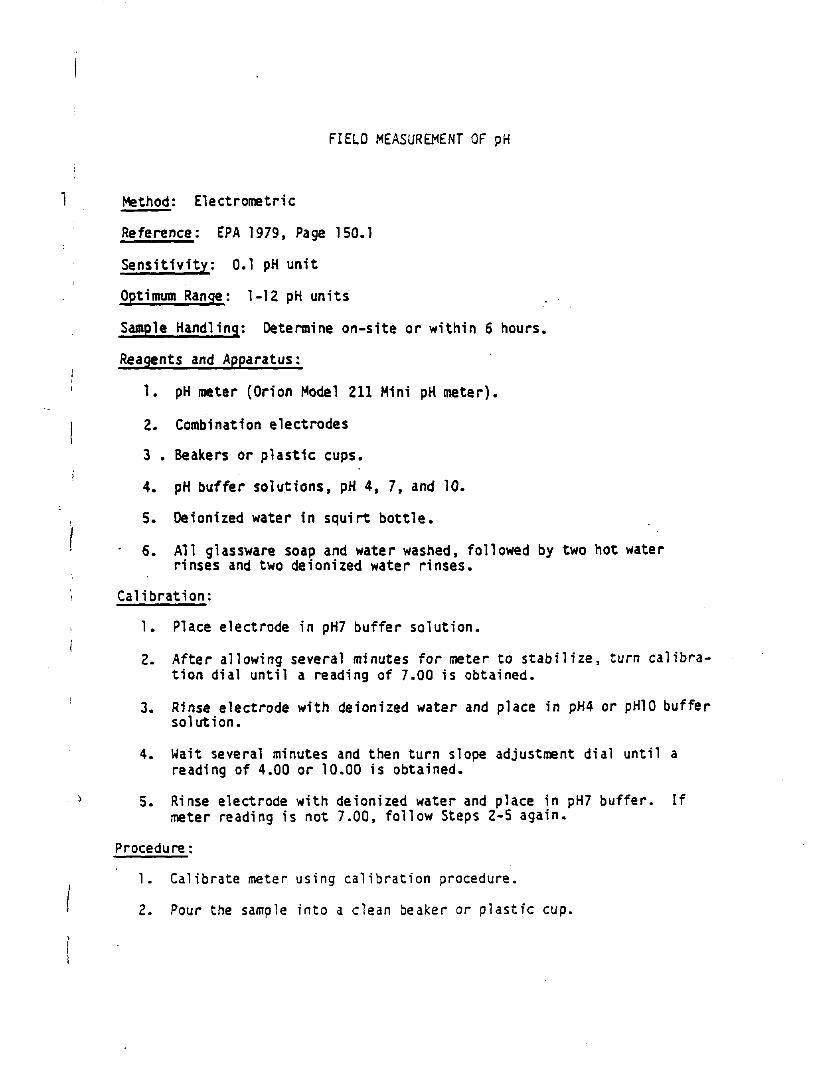
FIELD MEASUREMENT OF pH
Method: Electrometric
Reference: EPA 1979, Page 150.1
Sensitivity: 0.1 pH unit
Optimum Range: 1-12 pH units
Sample Handling: Determine on-site or within 6 hours.
Reagents and Apparatus:
1. pH meter (Orion Model 211 Mini pH meter).
2. Combination electrodes
3 . Beakers or plastic cups.
4. pH buffer solutions, pH 4, 7, and 10.
5. Oeionized water in squirt bottle.
6. All glassware soap and water washed, followed by two hot waterrinses and two deionized water rinses.
Calibration:
1. Place electrode in pH7 buffer solution.
2. After allowing several minutes for meter to stabilize, turn calibra-tion dial until a reading of 7.00 is obtained.
3. Rinse electrode with deionized water and place in pH4 or pHIO buffersolution.
4. Wait several minutes and then turn slope adjustment dial until areading of 4.00 or 10.00 is obtained.
5. Rinse electrode with deionized water and place in pH7 buffer. Ifmeter reading is not 7.00, follow Steps 2-5 again.
Procedure:
1. Calibrate meter using calibration procedure.
2. Pour the sample into a clean beaker or plastic cup.
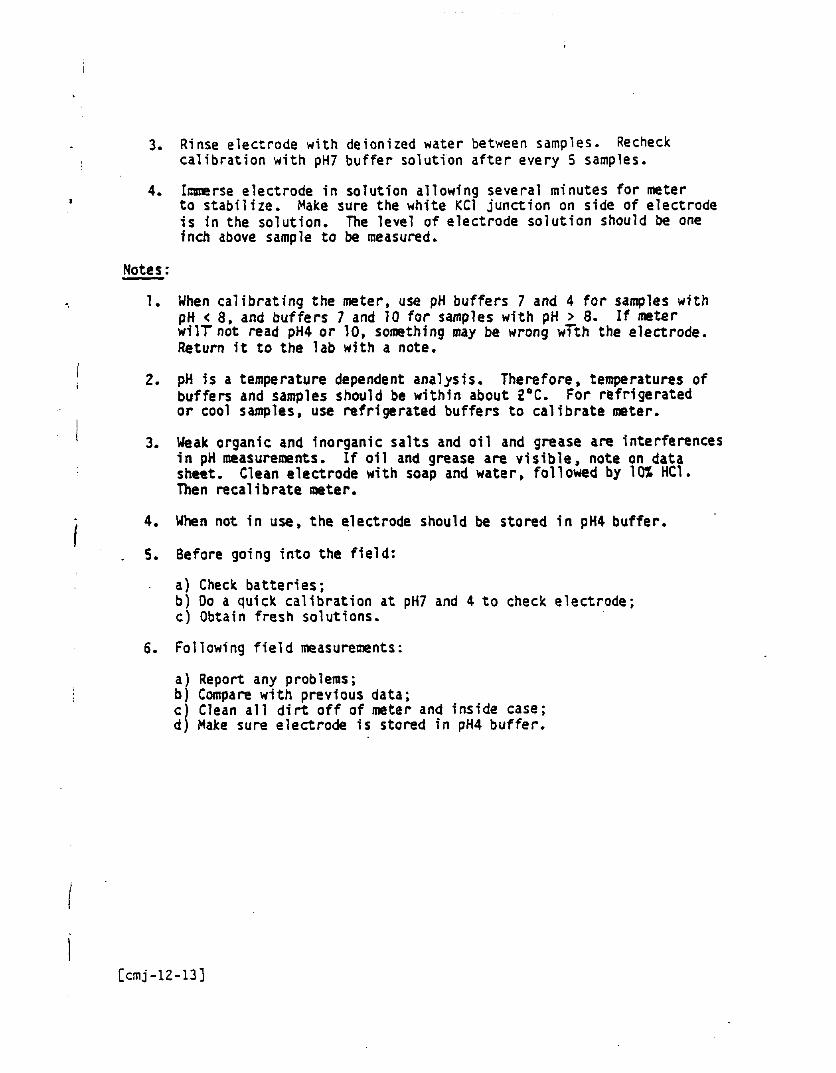
3. Rinse electrode with deionized water between samples. Recheclccalibration with pH7 buffer solution after every 5 samples.
4. Immerse electrode in solution allowing several minutes for meterto stabilize. Make sure the white KC1 junction on side of electrodeis in the solution. The level of electrode solution should be oneinch above sample to be measured*
Notes:
1. When calibrating the meter, use pH buffers 7 and 4 for samples withpH < 8, and buffers 7 and 10 for samples with pH £ 8. If meterwilT not read pH4 or 10, something may be wrong with the electrode.Return it to the lab with a note.
2. pH is a temperature dependent analysis. Therefore, temperatures ofbuffers and samples should be within about 2°C. For refrigeratedor cool samples* use refrigerated buffers to calibrate meter.
3. Weak organic and inorganic salts and oil and grease are interferencesin pH measurements. If oil and grease are visible, note on datasheet. Clean electrode with soap and water, followed by 10% HC1.Then recalibrate meter.
4. When not in use, the electrode should be stored in pK4 buffer.
5. Before going into the field:
a) Check batteries;b) Do a quick calibration at pH7 and 4 to check electrode;c) Obtain fresh solutions.
6. Following field measurements:
a) Report any problems;b) Compare with previous data;c) Clean all dirt off of meter and inside case;d) Make sure electrode is stored in pH4 buffer.
[cmj-12-13]

INSTRUCTION MANUALmodel 211
digital'pH meter1 i
< i• i >
1
ORION RESEARCH
contentsIntroductionInstrument description .Instrument sal*up
•uppoii lodpowai aouicamalar ch«ck-oulcoiiAacilAQ alacliodas
moasuromanl procaduraa0«nai l maatuiamaAl lacfuilqu*pHmoasuiamanl .
»lnQl« bulloi alandaidliallonIwo-bulUi slandaidlialloA
balloryrapUcamanlracordaroulputropalrandiervlcaaccasiorlasspaclllcallonsnollca ol complUnca
repair/service
aaa9
1011
Pot Inloimailon on upali or laplacamanl ol mu Insifumeni. conuci Oiionloll-lioa. Ask lot Cuslomai Saivlca.
ORION RESEARCH INCORPORATEDCuilomar Sarvlca640 Memorial DilvaCambtldoo, Matsachusalls 02139 U.S.A.600.225-1460 (ConllnenUl U.S.)617-664-5400 JMascachuialU. AUska. Hayvall, Canada)TaUx; 921466

llgui* i @
J)(IIc• Al.IOW
ORION RESEARCH modal 2iUdlglUI pH milai
ON
Off
TEMP «C CALia
O
t cttnl locoidci bmUlny (toitjJ U^l LOWi LCuUpUy4. tuppon (OdClIpfr. lKnp4(»luit Indlcttoi conliol
6 AC line ailapiui iiijiiil7 lunciioa cuniioiA cahbiallon conliolft clcciioile connecioi
10 slope conliol
introduction . ...Th« Modal 211 Is a balloiy. 01 llna-opaialad (110/220 V AC auapiei) a.Q.iai iu.nwloiloi|l«doi|aboiaioiyus«.Th«maUilscompiaiowlihsiiipcn*incco,ut,binding post* and Is tupplUd wlih an unbuakabla. Oai iliitd comoinaiio.i.,,.•Uchodalonapackolo|pH7bullAipowdai.onoUoiilcloipi«?buliei iloidUlllUdwaUf.suppofifod.tUcliodaholdei.ACadapiei sU I i '•'•" "-1 p|uo. and caiiylno casa.
instrument description
3.4.&.
Sea
1. tlilpchaitfacofdafblndln0poiis;blackposils1aw(Qiound|aniJicd|>Giii»ItlQll Input sld« ol fftcofdtf. S«o paga i.
2. BAT LOW; an aiiow polnlino lowaids OAT LOW appemt on iho displaywlion ballaiy fequlrcs lapUcemeni.LC display: pH display ovpflh«iano«o|0- Hwllh i Olplluniine&ult.i.,.,!suppoit lod clip; holds slaol lod usad to mount tlcciioaa nouiei.lampaialuia Indlcaloi conliol (TEMP *Ct: compensates loi vaiunuu MIalficlioda slope 01 lampoialou changes. Usad In two Uullci c^i.iH.i.pnAC Una adaplei Input; |ack usod to Instil AC Una atupiei With AC imoadnploi opciaiionai. |ho Inleinal balUiy Is bypassedluncllan conliol: lockoi swllch with ihiea posllions • Ou, Off *mJOd|Mttss (ON) loi n momoniaiy loadino Ino swiicli will uiuoi 10 OH' *viloloasoJ.
bulluti
0.10.
callbiallon conliol (CALIPJ: uiucl lo cjliuulo ilio inoiuiknown (ill.attclioda connacloi: accopls ONC connocloi liom ptl aiocuoao.slopa conliol; sciowdilvai adjusimanl usad lo sal sacond budei In Iwbullui cailbiallnn.

inslrument set-upsupportrodI. Inicil ilccl iupporl iocJ Inio Iho holt In Iho iuppoil iod clip on ildo ol Iho
mcloi.2 Mount ciochodo holdei on Iho iod by pinching lo compiots Iho spring,
lu holu In plica.
power soiucaTho Motkl 211 opculc* on tU noniechaigeable 1.5 voll balloilot 01 on llOoi??0 j 2UV. V wilh an appiovoU AC adaploi (tpoclly votlago when oidoilng). Lowbaliciy ii Indicated by the BAT COW Intllcaloi on Iho dUplay.IIO1E; DAiicuei aio nol lechaigoable - uto ol lino adaploi whonovoi possiblewill iiibvcni me unii'i ualiciioi liom belna dltchaiged. II baltoiy opoiailon Itiici.ic.i. loiiow iu*i*ilaiion intliuciiont undoi ballaiy
melar chock-oulid AA balleiict In Ilia mcloi, Oilont Ilia ( * ) and | J halUiy loinii-
nail lo mttch the oilcntitlon ihown In Iho balloiy compaitmcnl.Oopicu Oil button on the liont panel. II Iho OAT. LOW Inilicatoi on theliom Uliplay llQhlt up. Ihe ballciiot muM ho tcplaced.II balloiy mode U nol lobo uiud.<llti«oaid tlcpt I anU 2 lujcil pin ond olappiopiUia AC line adaplci Into Iho ntctci, anil Iho oihci ond Into I ho .ip-piopdil* gtoundcd AC lino icceplaclo.Aiuch ONC iltoiiInQ plug to ONC Input on Iho bollom &lda ol Iho inolci.
OH button on Iht honl panel, lum CALIO knob todltplay uailt7.00. II thli cannot bo done contutl ORION Tochnlcal Soivlco.
f\*moY» th* ihodlno plug. Succettlul completion ol slept 1-4 thow Iho• '-It U (tidy lot ute.
. '-)fi, - »• • • '••^•A'iti.1,-
connecting elecUodo1. Insof I Iho ONC connocloi Inio Iht tlecuodo jack on Ihd bottom panel ol ihomolei. Turn connocioi clockwlto until U teatt Ilimly.2. Mount tlocliodo In Iho olocliodo holdoi by spioaUIng Iho olccliode clip
opon and timing Iho alocliodo Inio Iho holdoi to thai the clip cloici onolecltodo cap. Soo llguft Ji - '
3. Follow moatuiomonl pioctduret lo uto Iho melei lo moaturo pM4. OUconnnoci oleclioUo by turning connocioi counloiclockwlto uniii mie a i
od liom pin.
llguio 2
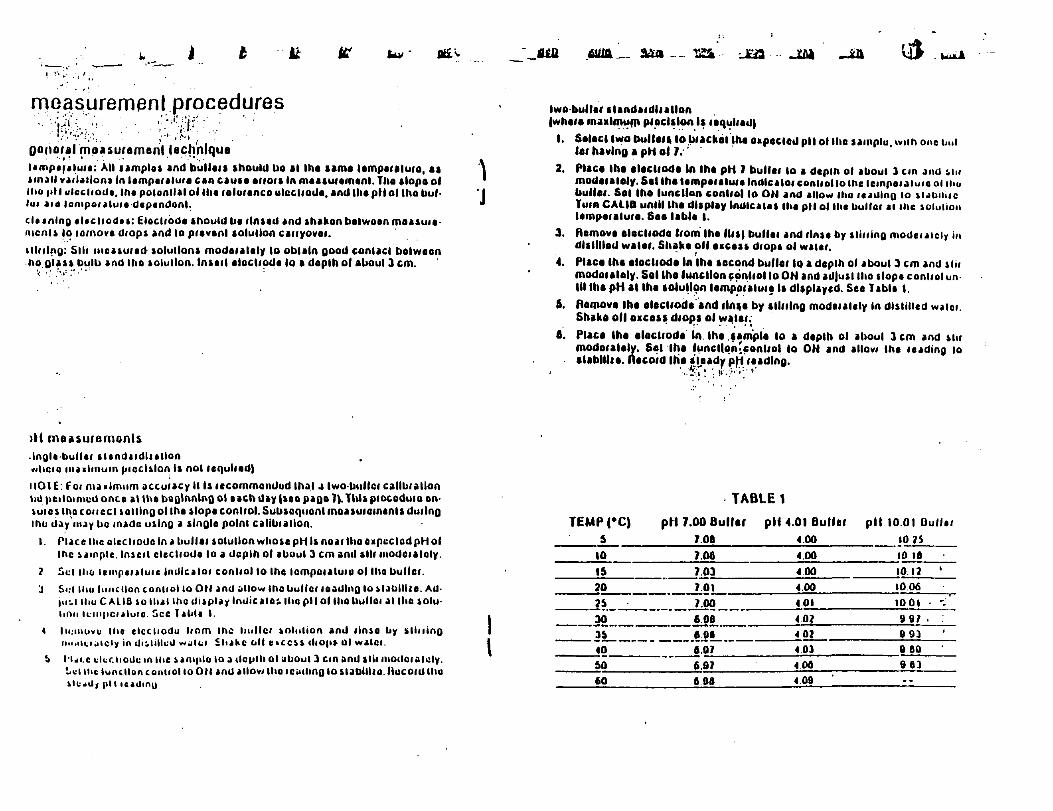
fev
measurement procedures
Donor*) moasuremenl technique• ' - I T " ' - . ' . . • • • • ' - " * . . . *
Itflipifiiuta: All samples and bullois should bo al Iho tamo lempereluro, assmall variations In lempeialuie can cause error* In measurement. Tho slope olMm pi I ulcciiod*, me poionlUI ol Iho lolmonco ulocuodo. and Iho pll ol Iho bul-fm aia temperature dependent.cU«nlng«l«c|iod*s: Eloclrode should bo ilnsod and shaken bolwoanmoasuie-nicnis lo (amove drops and lo proven! solution carryover.
: Slii nicasuiod solutions modaialely lo oblaln good contact bolwoon.ho glass bulb and Iho solution. Insail alocliodo lo a doplhol about 3cm.
)M measuramonls• Ingl* bull«i sl*nd<idli»llon^hcio mailmuin pieclslon Is not icquliod)nOlt Foi maximum dccuiacy It Is iccommondud thai a Iwo-bulloi callbiallontJil pcilomicu once al the boQlnnlng ol each day (seo pago 7). This piocoduio on-luies Iho couccl selling ol the slope conliol. Subsequent moasuiomenls duilngthu day may be made using a single point calibration,
1. Place Ihc olecliode In a bullei solution whose pH Is noai Iho expuclodpHolthe sample. Insert electrode lo a dcplh ol aboul 3 cm and sill modoialoly.
2 Svi Hm itmpiiiiuic inUlcilor conliol to the lompoialuiu ol Iho buller.J Si:l lliu liuicllon conliol lo ON and Allow Iho buller loading lo Maulllie. Ad-
ion II.u CALIO so thai ihc display Indicator Iho pi I ol Iho hulloi al Iho ioluhrm iL-mpcijluic Sec Tiblc *
4 lii:iituvu ihe clccliodu liom Ihc htillcr solution and linso by slhiingii.i.iici jicly in diihllcU wulci Shake oil t t«ccss diO|i» ol waloi.
& n-i c clcr.tioUu miiic santjtlo loadculhol uboul 3 cm and slii inodoralcly.'-el ihc tune lion conliol loON and allovj tltoiciiihnglo sublltio.liucoidlhuitkrfiiy pll iciUiny
two buller alandaidliallon(whole maximum pioclslon Is required)
1. Selaci Iwo bul I oil lo bracket the expected pll ol tho sampiu. wiih one Imllei having a pH ol 7.'
2. Place Iho elecliodo lo Iho pH 7 bulloi lo a dopih ol about 1 cm and &mmodeialoly. Sol Iho tempoialui a Indlcaloi conliol to the tcmpoi aiuio ol Hmbulloi. Sol Iho function conliol lo ON and allow ilia feeding 10 juuu.icTurn CALIB until Iho display Indicates the pll ol the bulloi al ihc solutionlompoialuio. Soo lablo I.
3. Remove olocliodo Uom Iho llis| bullet and ilnse by stilling moderately indlsllllod water. Shako oil excess diop* ol waiei.
4. PUco Iho olocliodo In Iho second bullof IQ a depth ol aboul 3 cm and sliimodelaloly. Sol the Junction conliol lo ON and adjust Iho slope conliot unIII Iho pH al Iho solution lempoialuie Is displayed. Seo Table I.
5. flomovo Iho elecliode and ilnso by silfilng modeiaicly In distilled w»ici.Shako oil oxcess diops ol wa.Ut;
A. Place Iho elocliodo In (he sample lo a depth ol ahoul 3cm and stumodoialaly. Sol Iho luncllpn-contiol lo ON and allovi the leading loslablllie. flecoid Iho sleady p|i loading.
' - ' ' •••'•• " > '
TABLE 1TEMPCCJ
510IS202S303S40&a60
pH 7.00 Buller7.0ft7.067.037017.006.00«0fl6076.97fioa
plH.OI Buller4.004.0040040010140?402401400
409 '
pll 10.01 OulUi10 ?510 Ifl1012 '100610 Ol • ".9 97 . .903ft 60dai--

ri icpUiii; iho baiitilcs. lamove Hi* panel on Iho lack ol lha inuloi. Do suio |o>icivc (lie poUilly milking when Inseillng now balloiles.
icorder oulput9 tt-iJ jnU hljch. binding posls at Hit side ol iho melai piovldo an output loiip elicit iticoiding ol absolulo mV Independent ol luncllon modo, foroidui* wiih Input Impedance ol 100Kllohms01 gieatoi.IhoOulpulIs lUcdloout iUQmVJpM.plI 14 00oulpul Is 1.40 V.Lowoi Impedance lecoidoismay becd but lull scale output It teduced.*
Conned Hie leid liomihe high (Inpul ildeohha iocoidci|lo the icdbindingpoii *nd ihe lead horn iha low (Qiound) side lo iho black binding post.
accoidino lo dliccilons In Iho iliip cluil iccoidor Insliuciion
;pair and serviceled hiiin iliu dale ol puichiie Uy llu uioi, Utai should loluin Ihonl )u OniOH jndul*inpiool o| puichi jo.Wiinnly U voldllpioduclhii boon••iitti. iiuiiiiciJ. 01 icpalis illcmplud by unaulhoilioil poisons.jiijiil.ci hcicm jie loi pioducls soldlinsUllodloi usaonlylnlhoUnlladSlalosid Cjn^iU l:oi OfUOl I pioducU puiclusod loi use In all oihei counliloi consullcat in cnuniiy. aulhofifed OBlON sales »Q6nl/dlslfihuloi lot pioducl waiunlyloiinjiionllciuni Auiitoii/iilon Numbcf mu&l be obtained liomOniON Laboiaioiy Pio-idi Cuilomei Service beloia faluining any piuduCI lot in waiianly
01 ciedil
la Lemon" Iniliumcnl W*u»nly' ,uu lu'.iiuintni ik covciud by Ilia OIUOU "No Lomon" wiiiunly II Iliu iniliumoniuli w.itiun ivntvu mo^ihj liqin';dala'ol pmchaso loi any faaion otlioi Ilianlinn,-. tin- [.uir.it dtci may clacl IphavftiiiepaiiadoiiepUceilAlnocliuioa.This«»i iAt i iy t o « c t t ihc oilglnalorie'pucoinanifiopuiittdinolei liomaaloolodQlnaln»ici i-u'clKit. iho «'ii(jnly U no| ailendad boyond Iho biiyoi's oilQlnal wjiinly
accessories
015600 flos*11* epoiy body, bulb guaid combination pH eleciiode9I04BN Uboialoiy giada combination pH oleciiodo (BNC connecioi)910600 GX-sofles epoiy body, got filled combination elecliode (DUG
connecloi).912600 GX-aoilos opony body, gel tilled Mask combination cleciiouo
(QNC connecloi)913600 GX sciles epoxy body, gel tilled Hal suilace combination pit
elocliode (ONC connecloi|915600 nx-scile* lellllablo. epony body combination pit iitcciiodo (HnC
connocloi|9I62BN Combination ph olocliodo with lugged bulb (OHC connecioi)9I63BN Combination pH elocliode with needle shape (OnC conncciui)910004 pH 4 bulloi packets, box ol 2& packets, each p-irkci nui.iitQ
200mlol bulloi910007 pH 7 bullei packets, box ol 25 packets, uach packet
200 ml ol bulloi910009 pH 9 bullei packets, box ol 25 packeis. each
200 ml p| bullei010104 pH 4.01 bullei. 475 ml bottle910107 pH 7.00b,ul|o,(. 4/5 ntl Oolite910110 pH 10.01 bullei. 4)5 ml bolile970690 Dissolved oxygen elccliodo910002 EloctioUo holder020050 Shoning plug020120 110V AC line adaploi020121 220V AC line adaploi

specifications
conltnli
rtng*
tomptntillon
model 2l| digital pH metor. wilh modal ftlOGOO geMllladunbiaakable combination pll eleciiode. support rod. olocuodo holUei. Uoiiies loi pH I bullcr and distilled waloi. onopacket ph f bullet powdci. AC adapter. sU 1.5 V battalias,and cariying caseOto M phx Ol pll
[0 lo lOO'C)
point ptl 7 (lUcfl)
il.
dinicniloni
Vballailcs;llle:3000 Itn sacond inteimlllenl maasuiamanls
when lino adaplei Is nol used.tin* *<J»pl«r: 1 10 or 220V i 20%. MJ/GOIU14 cm high x 9 cm wide • 4.5 cm deep
w«lghl 04 kg
notice ol compliance
The Modol 211 may generate radio frequency energy and U not Installed andusud properly, Dial U. In strict accordance wllh in* manulaciuicr's Instruc-tions. may cause Inlerlerence lo tadlo and television laceptlon. H has beentype lasiad and found lo comply wllh Ilia limits lor a Class 0 computing doviceIn accordance wllh specifications In Subparl J ol Par! IS ol f CC Rules, whichare designed lo provide reasonabla proiacllon against such Interference In alosldonllel Inslallallon. However, ihere U no guarantee Ihal Inlerlcience willnol occur In a particular lnslallailon.il in* Model 21 1 does cause Inieifeiencc10 radio or television ucepllon. which can be determined by turning Hie unil011 and on. Iht user U encouraged lo Iry lo conccl Ihe Interference by one 01more ol Ihe following measures;- reorient Iho receiving antenna- relocate Ihe Model 211 wllh tespeci lo Ihe receiver- move the Modal 211 away Irom the receiver- plug the Modal 211 Into a dlllerenl outlet so Ihal Ihe meter and reccivci aie
on dlllarenl branch circuitsII necessary, lha user should consult the dealer or an experienced lslon technician loi additional suggestions. The user may hnu me followingbooklet piepaiod by Ihe Federal Communications Commission helpful:"How lo Identity and Ae solve Radio-TV Inlerlerence Problems*'This booklet U available liom Ihe U.S. Government Printing Oflice. Wa&hmgion.DC 20402. Stock No. 004 000 003 4 i 4.
i.JT
u
APPENDIX C-2
FIELD MEASUREHENTSOF SPECIFIC CONDUCTANCE AND TEMPERATURE
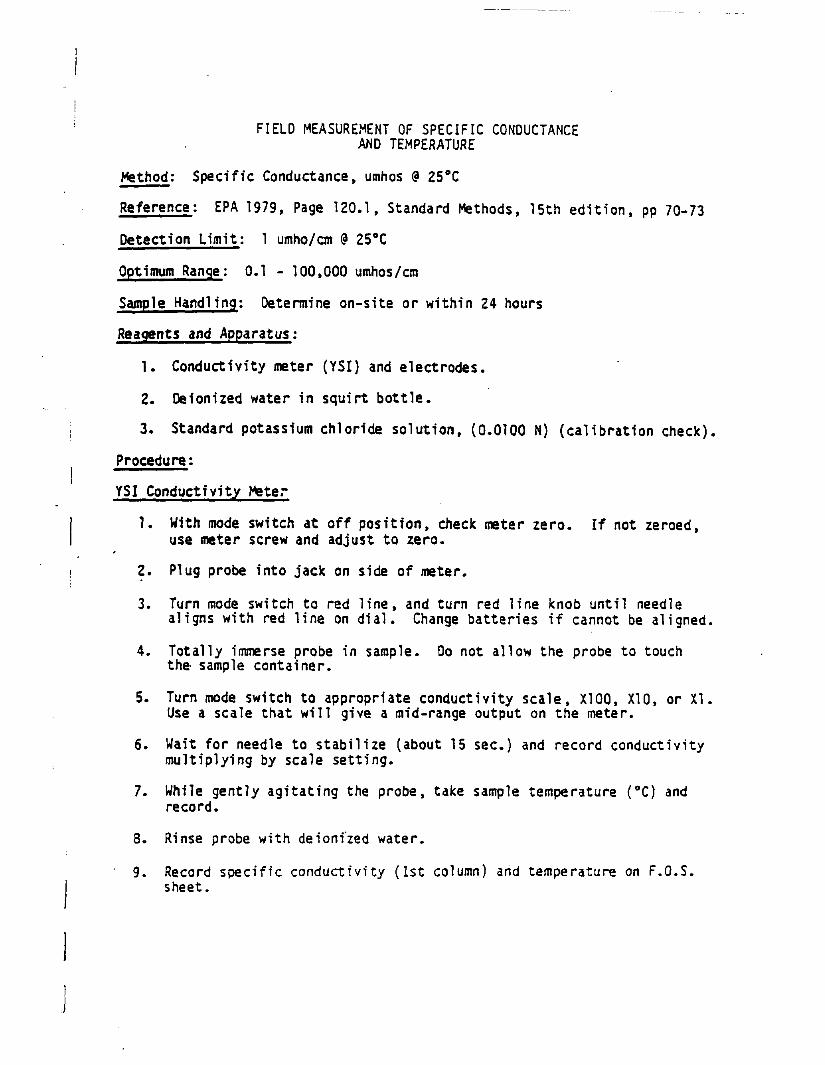
FIELD MEASUREMENT OF SPECIFIC CONDUCTANCEAND TEMPERATURE
Method: Specific Conductance, umhos @ 25°C
Reference: EPA 1979, Page 120.1, Standard Methods, 15th edition, pp 70-73
Detection Limit: 1 umho/cm (? 25°C
Optimum Range: 0.1 - 100,000 umhos/cm
Sample Handling: Determine on-site or within 24 hours
Reagents and Apparatus:
1. Conductivity meter (YSI) and electrodes.
2. Deionized water in squirt bottle.
3. Standard potassium chloride solution, (0.0100 N) (calibration check).
Procedure:
YSI Conductivity Meter
1. With mode switch at off position, check meter zero. If not zeroed,use meter screw and adjust to zero.
2. Plug probe into jack on side of meter.
3. Turn mode switch to red line, and turn red line knob until needlealigns with red line on dial. Change batteries if cannot be aligned.
4. Totally immerse probe in sample. Do not allow the probe to touchthe sample container.
5. Turn mode switch to appropriate conductivity scale, X100, X10, or XI.Use a scale that will give a mid-range output on the meter.
6. Wait for needle to stabilize (about 15 sec.) and record conductivitymultiplying by scale setting.
7. While gently agitating the probe, take sample temperature (°C) andrecord.
8. Rinse probe with deioni'zed water.
' 9. Record specific conductivity (1st column) and temperature on F.O.S.sheet.

Notes:
1. Calculate conductivity using fo l lowing fo rmula :
* T[i -f u.u* u-<^j]
625 * Conductivity at 25°C, umhos/cm
T » Temperature of sample, °C
GT * Conductivity of sample at temperature T, umhos/cra
2. Report results for the standard solution with each data set.
3. Record on field sheet which meter and probe were used. Meter shouldbe wiped clean as necessary.
4. After returning to lab, compare results with previous data. Reportproblems to lab personnel.
Reagent Preparation:
1. Stock Potassium Chloride Solution, 1.00 N: Dissolve 74.555 g. K Clin Mil l i -Q water and dilute to 1,000 ml. in a volumetric flask.
* 2. Standard Potassium Chloride Solution, O.giOON: Dilute to 10.0 mis.of stock solution to 1,000 mis. with Mil li-q water using a volumetricpipet and flask,
[onj-12-14]
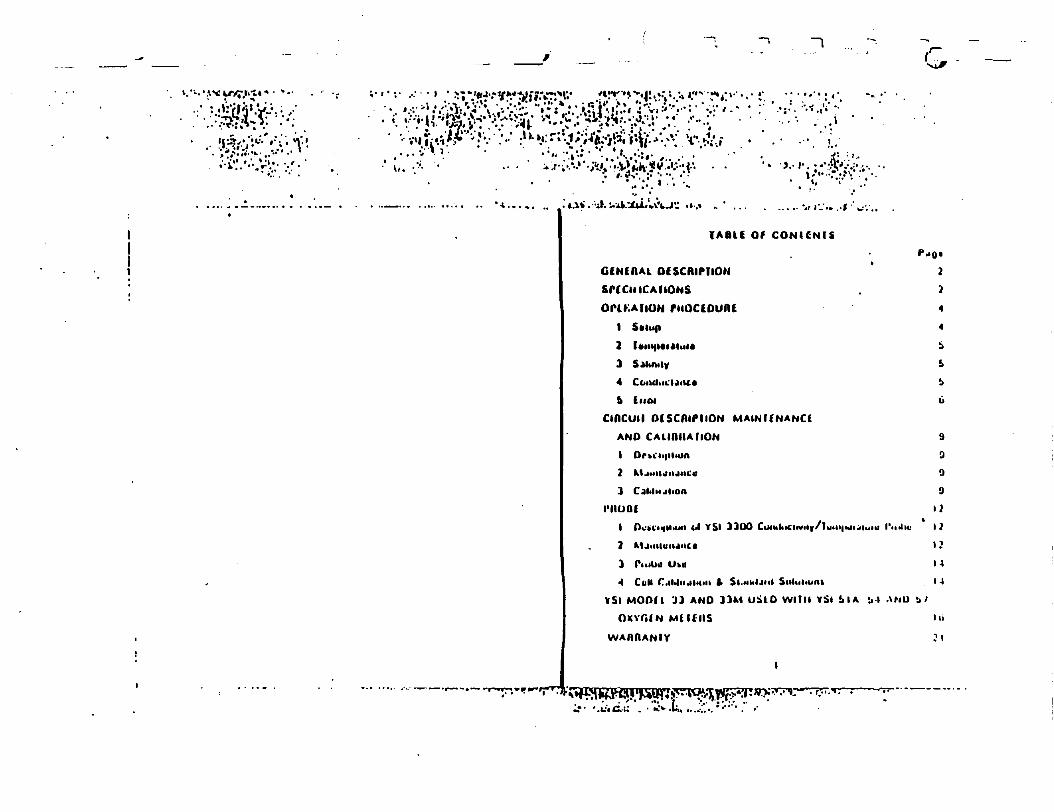
TABU Of CONICNIS
Ot SCRIP IlON
SPCClilCAllONS
nioctounc
23
4
6 fiiw
CinCUH OCSCAIPIION MAlNlfNANCI
AND CAUDIIAllON
1 Orki;i>|tiH>n23
moot1 Ockii^iiMMi cd YSI 3300 Coiiili*ci*w*iy/lui«*|Kii>iMiu I'nJtu
2 MjtiiiuiiJnct
3 P.ilUO UkU
4 CttU C.lMl' JlH'll i Sl.flhlJMl SlllulHJflt
VSl MODI I 33 AND 33M USIO Wllll YSl &IA *j.| AMU
OXYft lN MUCUS
9
00
9i ?I?
13
I 4
I 4
»>

G C N C A A L OC&CAIPIIONlh« YSl M«"lcI 31 and 3.1M SCI Muimt aia poiiklilapOwttlCd. IfAH»*tlOMI«il *AIUMMlll*tU rttlkiynail Ift atCUialaly HttiatUiat«l*iu|y. conductivity and ttfmpaiatuia Iliay uti a juotia cniuivluif) ola ("UUuJ. plaitic conductivity caH and a |necu.on YSl Hiuinutioilumpui'iui* tcnioi cunilHntd in a i*nyl« unitCoiidukhviiy wiili Ilia MoiUI 33 U ••piaiiail it nticianUtot/ctnii-ntoui l^niliuk/cml: with ilia 33M. il'» nulUiohitint/mdUi |mS/m|.Itioic *tt m*i*»ut«nianii ol ilia aUciiical conducianc* ilia samplawould iliow tt maaiuiitd Ualwaan oiqwtiU laca* ol a Urn cuLa.(Coiwoiiion Hiloimaiion I |imho/cm « 0 I niS/ml Salmily a Ilia
ol u'*»»* ul i*U'liloyi»m ol tampla |1i * pam palTim m«a»uiamuni a«iunia> lli« tanipla coiuauu a "il*n-
ilj<d" io« waioi ijll niuiuia. Ilia »*m^« uni|iaialuia is muaiuiad inJcyicot CaUiiaS4l»n«iy miiJvuiainciiu aia manually lmii|ieiaiiHa comjiamaiad bydticci d«al COIII|«HMviiy ntebiuianiunii aia nui ieni|iuiaiuia compun-kjiod. however a luntpai Jiuit luncnon it piovideil on Ilia miiiumanl10 aid w*ih calcuUl*on ol toimcuont Alto, wlton juii lamntiaiuiaand coiuluciiviiy iia known ii it potttlila lo calculaiu ladniiy-anilwhen only lunt|uiaiui« and iJlmiiy aia known il it pokk>Ui« 10CilCulJI* COlidnClivily
SPtClHCAIIONSMotUI 33 Cutuliicli
0 iOO 0 6 000. 0-60.000f<nihut/cni wiih YSl 3300 S«natPiubot INoia Ilia "jimlio" ilottQ'iiaiiont on ilia niaiai aia athniihaiid loun lot "jiniho/cm" |t i 6V mat IHOI a| 600 6.000jiul 60000 plut piubw130% n»j. iiioi at 260. 2.600and 26000 piufcS«ta (iioi Sukiiun
L
Accuiacy
fluadabilily
lampeiaiuie Compantaiioii
SalinityflJiiya
Accuiacy
2 & jin»iiO&/tm u*ilaiiyu26 iiinliui/ciii nn 6 OOO ,.tiiii*iA.i»lanya26O Hinliut/cm on &O OOO
|yni|iitiaiuia Coinpantaitun Nana
Modal 33M CoinluclJvUy0 60 0 600 0 6 000 mS/m *-/YSl 3300 S«M«h Piwhati 2 6X MU* BIIOI <H 6O 6OO J& OOO |dut piolitf1 3 OX ina« anoi at 76 260 .2 600 | tit n |itolidSou Cnoi SUCIMJII026 inS/m on 60 mSAn lanj2 6 mSAn on 600 mS/m u»yt26 0 ntS/nt on 6 000 mS An i«uNon«
0 40* • Ml lflH|ll!ltllltlh' IJ'-U'' **' ?
lo I 4S'CA»Kiv« 4^C 109 ' ' - . j , 40 aiKli 0 ) ".»» ai 20 *.». pint i ot.d,..i.v.iv
flulow 4"C. | I I ••-.. ai -40*I 0 9 *'•— ai 20* '. |tl*i* iuni|ll Oil*Sua IMW Suiitutt
nui.Ub4.lylumiiuiaiiua CumpuntaiiuA MJHWO! by 4lnuL| dial liont 2 10
M6-C

H-*« (ft
* » • » < ; • » •. .,j.vw:hiv- -,.;-
•2 lo I fiO*C40 I *C 41 2*C. 406-Cplut p«ob«Siit CMOI SuctioniOli-C it -2*C 10 iO
fowst Supply
Piub*
Iwo O nit AMt*l*nt bMlitiMt Cvti*cidy C9& cii iii|inwiltni iiiuvult *|i-IHOiuiuiuly 300 ha ol u|>ti*iiOAYSI 3300 Stntt CtmUuci.vily/luin-
Coniuiu K * 6/cinlui coitilticiiviiy and
{MOI ol 10 |*C 41 O*C tnil103 C ni 4Q'C
AtnbiL-nl & 10 I 4b*CiH uiioi ul iO |1V ul Hit
C ihaiiyu MI Mikiiiiinuiilm can uccui 1h>v unoi ail Itiu iiivliii.iiiMti ik iu4il-
10 tyillinu lot ujtli martini)
OrfHAI lON PMOCfOUAEI Saiup
1.11 Ailjukl niulltl /fill |il i|ui'L'%Wfvl III liiili'iiil 11 ic lijicltlu»LtCW OH llttt MIUlvl IjCC SO Mt-l Illf IHi'lUI IM.'lItMi' flliMlillOltvilli Iliu IclO Uil Iliu i*Miultiili«-||y klJlu
|l>l r.jl.l.ulo Iliu mrlit* liy liMHMiy Hie MOIU it.Ml Mil |uIII 1)1 UU JMI| .n|,,,k|iMU Ilt4 MC ULlNl. II.MMM! ku llui inrnri
4
iittdlt lint ft up with Iht itdlntt un Hit mom l*cu II HtaC4niH>| bt tccoifvjikkhud. ir|ilJCt iha bjiiei*tt
|c| f|iit|.lht |iiubt MHO Ihu piobu |4ck un itt« k>da ul iliu »iHiuintAl
Id) ful Iht |UOl>t M Iht »OluliOA |O bt Iilu4lm«d iSdt PlUbuUitt
2. Itlll|ltf*llMt
Sti Hit MODE cuiiiiol 10 IfMrfc'RAlUlltlttiii|ioi»lint OA Iht liuiioni »C4lt ol Iht 1*1*101CuUiui Allow hmtj luJ Iht niabt itiU|»ti*iiiit lo coinv 10ui|u*l4iiiutil willi Ili4l ul MM walvi Utloit luAdmu
3. StllnilyUl lidiufui Iht ltni|idiaiuit maU.im IIUMI Stun 2 lo Hit ' £
»c4lri uti Iht miiiuinuni|b| SwiUh iht MODI cunnol lo iht SAtlNIIY »ioi.i,on «nd
*uad lAhiiiiy OA Iht ltd 0 40 "*• HIWUI i4iiy«Ul DajH«$i iht CiLL,'HSf liuiiun flit mu 1*1
Hun . lit* piuft* a loulvii JM*(nt moJki
4. Conducllvlly an Modal 33 JModtl 33M
Ul Swiuliiltt MODI coiinol 10 |h« XIOO tcalii II tl.u i ».•... L.uj*k birlow 60 on iht 0-&OO Kitun 1^ 0 on iliu O-liO »JM,JC|twtich 10 iht XIO »cdit II iht ittJdmo. it n.ir Iteti^v bO
Ol iich lo Iht XI|hO iu4il«nu im |iiuliui/cin
ML-ICI
Sci.lt
the nitioi it.tl*.1ilv '**** Jiit*\ci ikKtt:Jtuiuint.*Mii ;MV
1 ) 2 4 7|XIO
24lOi.iuluikA<|>4lOniS/nil
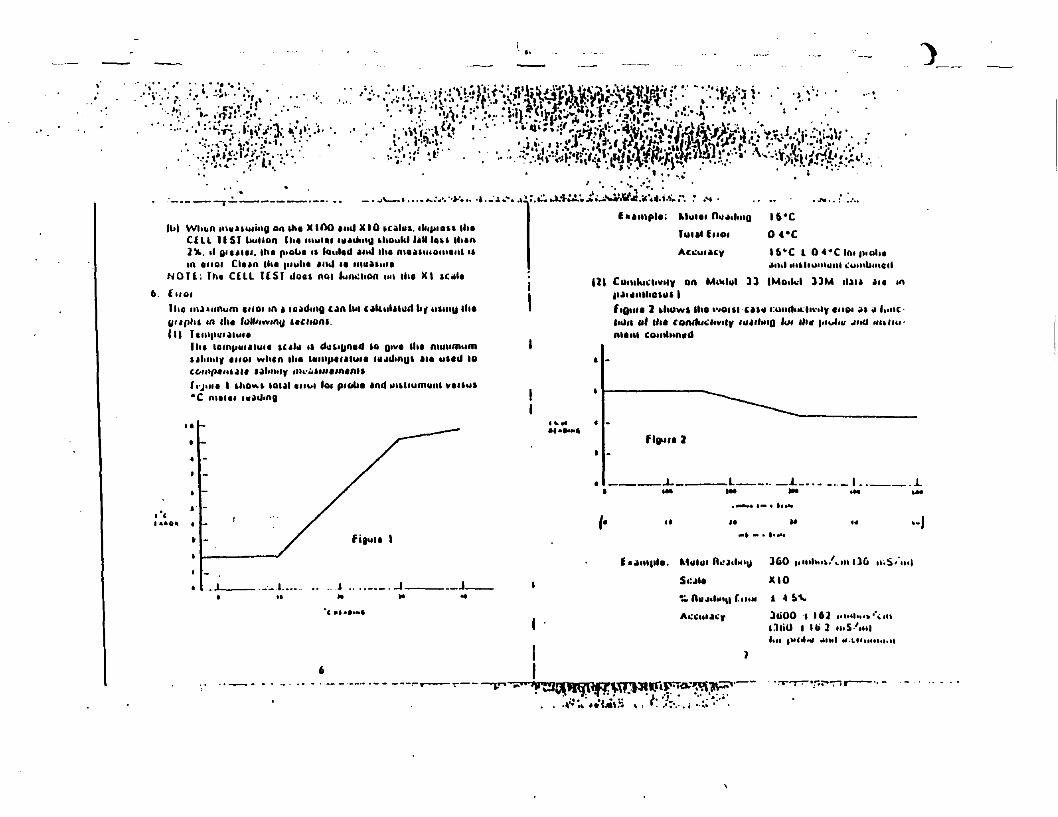
|b| Wlmn mwituiing on ih« XIOO *nU XIO tcalm. ibipioit iliaC(LL USF bull on ll*« uiuui luitlmg bliouliJ hlllokt Hitn2V il y«*m. |hi piobt it louUd and ilto moaiiiiouioiil i*in onoi CU*n ilia piuli* »itJ *• iimainii
NOTl: Iht CELL USF doat nai luiu:iion IMI Ilto XI itaU6. tttoi
Iho nu*iinum CHOI in i loading can IMI cdkiiUiurt by iituiy Hi*yuplti m lit* loMnwiny ttciioni.Ml Icnipmaiui*
Hit iom|iui«iuii icilii is doi«uo«fl la QIV« ill* nmiimumtiliiuly iiioi wlitn ilia UiiipflUlui* lujtJinui iu uttd lo
I ow.fr loul lot pic4i« »nd imlfumuiil vtiius
: Mulii nulling I5*CluulCiioi 0 4*CAccuiacy I6"C 1 0 4*C lo* juoli*
«:uiiibiiic<l|)| Comluciiviiy on MiwM 3) (Ma.kl 33M iliu aic in
f iQtiu 2 kliOwt Ihd ivoiti caiti i:om1**iliviiy enoi Jt j luiicliOll ul III* COfWluClivily ItKllHIQ lot lit* |«iU>c Jinit m coiitliin«d
Miilm fli'JilHiu 3CO iiinlttiv.I.IM (16 n.S'
Si;jl« XIO^it flllJ*lMt|| f.lltM 1 4 &V
Ai;ciHACy 360O -| 162 j'M»l«n»'*i.(nIliiO | tb 2 ti'S'.t.llot |tu4rti
)M.l l l t lMlt l . i l

|1IOM
D.OI •» '00/001
Astmiiy
:t|Huit»j
tini? itihimi|0 IfflOl tt|| IIoi.uttq•Mio<l
rout «|i!M Aiiutiti n|i pur t|t)iAiiAtnitptio) put tmitmlutrti t<|i
tinHtJ tH UMOt|t lOflfl till 'tout A|iut|vi ft*11milt tm|ffM*ttuin| 9\\\ miuifmul 01 poofli$»p
put t|fji tmiti«dinei ai||t tl
put tinifimlmtl |o uoi|Min| t tit tOuipffti A|*U'|M
7 :
IC1

* •.• * "• •
;&£ i ^
3 UCCO 9 WCC dNV CC 19OOW ISA
•'•I '^— *--^Mt *•- A - ••"•t I
ll«
-i'
•Itl.)13"1^
.::'.? J
"" i1.*1
'i1 1 t
"oo" no-IIfc
V»
1
^
1
II1)
1
*
"
I/'.
1!
<..
J
•t
.. . .
fe9*
)
'
.L1
r
1
r7
'-.
'
1
,
•
• ' - ;-—. — !'•00*
UltHf
\+
-,
•
»
5.(
Jbtn
«»«••
.... .
i
W|i
>»— — *
?'
\ .9
M• |
1
II tf
Mfi
"i?P*«
ii
•
. -
j I
lc=«•
i'
V
7s
t
Vr1)1/j-
/v
1 "~^
s !' S*
I
_ .«
«
x
> 1
1
j
« tl
• 00'
.— .
I *"'
,.,.OMH9-X "V^/
x. .....T ' |IOM *** '" ..» 7
- I
,., .4 :
; ; ; : (5ytlfw"' l/l'< ^I ' ' *"l.l'a"il5
7 < «.'«!• '- W-tr """"^"'l>s ^pjr" j pi•••iiawsr*-!"-"- ' -?
1 ofi\ '"
4.... Ml O« o-vW/VTr 1 »i«^ *<*»' •••• 1 . ' «t^_
1 • ••_..... — .. ... ,!._.. —— !!*/*IT-o f> o-O-O-O

CIACUIT DCSCflirilON, MAINTENANCE AND CALIBBAIIONt. Oaicilpllonlha cucuii it cojnpotad ol Iwo pant, a mulnviliiaioi and tw»iliantitloit lha muhivthiaioi pioducat a t<|uaia wawfoini vuilha tquaia wava it appliad lo Iwo twitching liantitloit Ibeynaialy apply Iwo bailfliitft ol opputiia polaniy 10 iha piulic Hintpiovidmg AC pawai which mwumuat poUmiiium ullucit tl>a muimIt MI taiiai wMh ana biuaiy and iitaatmat iha cuiiaui bum n lha
l bum lha baiiaiy it piopoiliooal 10 lha comlucuiHia ol ihu c«Uit maatuiad m a tpacial ian0a comlnciiviiy CMCUU winch »n-
cludat a utai'ad«itlad lampaiaiuia campantaioi. In the ivHipuiaima.lodtfia and XI potiiioiit lha inulnvibiaioi opoiaiafai IOO IU bi ih<talwwiy, XlOOandXIOpotiliont iha muliivibiaioi <*|iuiiii«t ai 6001 uanduiihattf lanQatpuihmgiha.CElt lESIbiiiiuniboiit iliu bminuii-cy to IOO Hi ,)Nowmfl ilia opmaioi 10 (urtpu iltu duuic* uf i*iuli«polaiuaiion2. Mabilanancalha only numitinanca mqmiad i& baflaiy iupl«icumani l\vo "D" vn«alfcdluia Hatliliubi callt. tuch at Cwviaady 196 o< aQmwjl«ni. willpiov*da IOO Hit olopaiaiion Accuiacy witfnui ba nuutuitiud if imc-caibon "0" c«Nt iia utad Oaiiaiy luplacttinam it HMIKAIHJ wlimi thu
ad|iitnnai»l cannoi ba at'contplahadi luiiunat avaiy tu inoniht 10 tailuca Uiu lUnuai of uomition
du« 10 luaky baiimiat lo taplaca bauanat. lamova lha m uiawtbum llm iitai |dJia Tha baiiaiy huldyit aia culoi cod«d lha Punnva11- biiliunl aiul miiti B° en ud •3. CttUbiHllon ol Modal 33 (Modal 33M dau aia In paianihatat IU it pottibla hw iha lampaiaiuia knob lo baconia lonta 01 tl»p buntlit noimal pu»*lum bi an *inuiuancy lha dal c*n ba la |K*iiiiuned hmtitl ba aiH|UiutM*d thai Hut it an amutQincv pio<adiii« i*nly. andIhai Ilia wikiiiinitiiii thoidd ba luluinad lo ih« Ijciuty lui |Mu|«*i
I HIM aaihaki
»—r-f •
• *.v •

Ill (U-J.I llM) I4n>p0l»lu*t 4 ltd Conductivity el lilt SOhilMIM OtIOlnmia Htu Siliiiily (il Hit solution by IWWIMIO t Unt vtilic*lly onIho goph liuni tins coiwlucuiici vtlut until il M t limit CIS Hit.l|i|tiO|lli«l4 *C I*At |MtlUI|loUlt IS l«t|U*!4llJ lui ItilllpUljilMIII(•uiwficu UK giv4n *C lines) ftotn tins uiiuifcttliun u»tuitd A
. • r
IIJ iJj III UlJl ll IJJ llJlJ-lll-U lu.1 kill lj|LJi.tlt»04
!•*••.ft *«.
lint honionUNy lo Iht *d(|« ol Ibt u' pn lint U*n«immot ili«ftkmiy lui OMS itin|iltf «ani|Mt 26.0OO|inilipi/cin tntl 30*C U'^us * saltiuiy ol I >|C«Aiii|ilt 2.&00 mS/in And 20*C Q.VCI « salmuy ol I M
H«t ntitidva Iht *C knob, swilch lo SALINIIY, tiul luin llm Luiiunltliiill unlrf Ibt Aiulti naciHt MirtiCAlti iliu & ability v*lut iluiwi-iiwntiJ m Sltp U). In ilui tktmplt giw«i\. iiw v»lu« a 17
|C| Swilch lo ICMfCRAlUAC INoit Ilus ltni|tti«luit IUJ.I.HQmull bt Hit Hint it Sltp i«|. il not. btym »yM\ Jl Siu|i Ul If ktct Ihu knob on lit* coniiol tli lt Iwiihoui IUIIUHU ihu conuols hi 111 vviih llit knob uoniiai «| iht Sim* iant|i«uii*i« Jt HtblUttlui it Utnu <nd i*Ulilun boih stt setups sucmuly
A| dAibtftl ojHMiiuniiy itCtdlM lt uSiAg llit Iblluwmu l*<ui:t-iluiii atIht intliuniiini lo Ucioiy lot stivict
1*1 Sul Iht uiBlnmitnl loi t sibmiy iiitiisuicinuMi is nunn«i|b| Siib»|iiul« t 1000|il capaciioi «iid 112 1 uhmO
lui Iht piubtlh« itsisioi jnd capaciioi btlwvtcn llm uibun wiit
wut on Ibt |4Ck conntciioiu uisidt llit msiiuinant
o-I I M i )
.IK1000 ft
niowmcO—
IO
. T

t ,-\ . ;.•Y/'i-jiV''Co . / - * 1..•4-..I/.-' . • i - .-
Ul I nut il>« iuiiipui»itua:(lial wnlil Hit IMIUI injili'luUtui* '•Nuw intuit Mm UiiijiuiJiuia ktiub with Ilia AIIOW *| 26"C Hut u fth;iu|titi.jiy c.tMiulatn only' n«lum'lh« Hiihumvni lo iliu Uuuiy lor
PflOBt . . - . . - : • • • • • < : - ' • •I Otunpliop ul Y$l.'3300, Sailtt CimUucllviiy/I«itiu»iMuifc
fiubt . - , . , * ! . ' . t»-^,--;|:- ti!". ; . - ••. v * : • ! ' • •Ihti VSI 3300 Stiiti'v CuiuluClivily Pioltal «it ilut>U'<uil lui I. oil I utt.i*ii.iMKl>mg ciiiitiiiiiliuii Jiul ilukiuu loi lutiUtU JCvuiiilt tuiviCt •' 'C.ich |HUh» lc«luifl» A built tnc»llcoiuuiii ol 6 01600 0/MI i 2%. •li'ucibiuii YSI iticiiuuioi loni|iuiilui* kanioi ol 10 |*C accniACy »|O-C JM.I iO 3*C »i 40*C iftJ «low c«p<i:iUnct c«Mt aktuinlily l«i-nitiuiiity ut « line* ili«iiiuhftl O 1&" ilu pliont lypt coimtcioili.,: J HO hiv A IO h C*Uu aiHl ih< 3311 * » &O || vuit.on Oilicili-i*.|ll» JiC Jijiljlllb OH f|lCHJl 4>Mlit«
III.- (....In- ItJV « liU'1 f* V C iMHly |lU|iif4L*ll pint Mtifcul UluCHOllUk..nut j ti..*.iiiid ttihic |Mnv.iliiiu iL*»kiuii«:e 10 * tM*lii iJi»ue ui w.ti*i-
I.I I rii-.iii.i«ij
\Vl.i.t. II. .: ttU luvl mil.* .ili:i ilt*. iL-^iltiiuk Ilifl |(ii>ltJMti LM«i>«- H lltlly1 1,-. ln..l.-k lljitl W4IHI il«t|iu>>U C«l'. Jitil otyjiM. flUllu* At*.' Ihu UtOill-l flj t t.i.lJIH.iiJitlt
fin i .MI. i "'I'til MOiMirfl lli:JiUM{J kiuk Illtl iilvflMHluk KM i» lUtlluluVw.tl. .1 fc.i .illy .iwjil.lllk' l.JllMUOlO Illtt tlCitHMtU plV|MUI>l*ll Slltll Afc
li.it>. (.|..;.M., j| nuilnuuin ClcJiiui lldiuun ImluVMnii fljlly lilul'nui:U»< jnil Cliiuniu Clu itui Jitliiihiiii Wilt tut y t*l>IJ'llt t. jtu i 111 I ,*ui nuMil 04k>n lull lil
. i . . » . . , ' • • • * • » • ; •«..•fo« tliwium cltAituiQ A 6 ntinult toak m a tokmon ni.nlu ol 10 p«uidititlltd wAlti. 10 pAiitliopiopyl alcohol And I pAU IfClcanbuAlwayt HAtt ||it piitlia tllfi cltAiWA(| And _ _ _CAUflON Do not I ouch Hit tlaciiodtt mtiUt iht
fUiiAum lilack it lull And'c^A bt icuputl oilII CIOAIIIA|| ilOUt AOI lUtlblt lilt plllllt |ltllOli|lAllCt, lt.|lljl*ni|illUitquuttl. \ ' 't
ibi n« -,
III VSI f)!40 fUUiiiHiu Solulfiw. 2 II ui |3% |»Uiim.mclOomlt *httolvtil m 00) 6X luad. actuitU| VSI Mwl.l 33 oi 33M S C-IU| 6O nil u' x bitt^ti 01
fiucailuit —III ClujA Iht |uoba At m Sachoii Ul u»iliui uimhoil
iha ctH *t\ ilit bejkt* anil ailit luMiCiuin YSI,on 10 cuvti Hit aluciioiltit Oo noi tovei ihu iiip ol
|h« piuut13) Pkig ihu pi(4it «no iha MuiM 33 01 33M, kwiuh in ilta
XIOO tc^lu la pldlHtiit. Iht tlucnuilt Mov« ihu (.M^MIkl*Ulilly lu ulilAiA lilt |i«uhii)»rHli;liii i*iail>ny tinU t;iH(iiiiu«pljimiiiii|| lui Iha ApiiiOkiiiitfiu linit khtAvii below
Muitiiitltat/cnt300002600020OOO16000lOtlOO
HI S An300O26002.0001 6001000
I.iii.i..66flII16
17 13
.
*» t -'• •• ••' ' •* "' **

1U1
Ml Ahui ilia « Up ttd \itnt lumovo ill* piob* and lim* inliuihwai*f.
ll>| datum ili* totuiion lo in contain**. 2 01. ol tuluiionthould b* tulJitiant loi 60 liaalmanit.Ui.
Obtiiuciiont ncai id* pioh* can duiuib i*ad*itu». Allodvi twoincliuk ol cltaianc* moil b* allowad liom iian-inaiaU*c un<<lciw.jm oUj« cu Malalbc bbj«cu ftuch •• pUii oi'woiuhU 'should b* t*pi ai Uau A mcliui liom the p*ob*WuiulHi ai* aiucliadlo id* cjbU ol ili« YSI 33 10 and 33 1 1Piuboi Hi* YSI 332) Wciylili at* iu|i|iliud ui |iaut wuh *tout mtiglii ol 4 oun*:ti p*f pail. Should it b*co*n* nac*t*a<yiu add moi« wciulii lo ovaicom* waiai cuiioiilft. w* »uuo>*lIniiitinu lit* lolal wtiulil lo Iwo pounds (8 pautt Foi w«iuliuMI <«cek» ul iwo poundt ui* an uidap*mliini iiiipiuuioncalil* In *ultti cat*, wcitjhlt muki b* kupi al laail 6 HK!I*»away liom ill* piob*Gciulc au>iaiion by laumQ and loweimg iba piwliu kovutalinn ct duiiiig a mcasuium*"! mtuf*» How ol tpucuhun iolu-huii ihiouyli lit* piU»« and i*t>|tiov«k lit* lint* tukpuAlu u| lit*
4 Call C«libiaiiun & Siandaid Su|uilon»Dm ISl |33OO S«n*k Culll ai« calibuiud to abkolula accuiacy oli I SX hivbd on a (lauiljid ioluiion Sine* III* lilaiaiui* unhviiy iMci not indicai* a coniaiuAily acc*piedinilllilO wa lldvC C 1 10 HIM Ilif 001 duilUl KCI lOltiliUll HtulllOd A«ikiuiiiunoU by Janet and fiudkliavv m IU37 at om iiiiiidaul Ouceitlu-tibuukt. 41 well at ilit ASIM tundault. COMCUI wiili ilm clioit*I he tuluiiun a |nr|UitJ by diluting 0 )4i u'*ni* ol puiu iliy KCI wiilid.iiilkd wild until ilia ioluiion a I kilouum llm uMu Imlow vliuwsHiC v.llt.tt ol CbillluClivily ||li| toluhuil would Itjv* ll lIlQ llulillddw*lc* wci« non Lomludiva llbwrfvui. in ten «vo» limli jNiniy (hihlluil
.waut it Iltylilly comlucliv*. Ill* M\oatuiiftby an antouni nqual tu Hi* wkui't
* ' ' "
w.H bu li.gliui
UUulais20212223242&2621262930
U036
12464127301209 J.13266I3&36136061408 I1436 &I 4 G 3 214009uia j1646 ?
ConductivityniS/m1142116811041220134612131300132 >I3&4t38 I1408143 )1461
l&l 911*4 )
Iliti Ofiuaioi may «*&• Hi* tiamlaid iolm*un and Ucuucy ol ft c*U'» coniiani 01 lo duiuimmo anluniiuU i» tliowii liolow
ul.iu iu . I...-, A .i CUH-.UMI l
ft 1C* + C,lK " "o^—— u< fltS. + S
K •n »c. -c. •
CaU contiamtiinca MI tl
ui |iiniiot/cmCoiuluciiviiy MI iiinliok/iiit idtiled 10 it-.Ac solution
14-•^ «• * -^•«•—*/»(•
''' ^J^ ' ^^ ' ^^^ '
• . ' I':' '•*,.-. * '
• j .' " ••"*•• '' .-I*
S- - CoiulMClivily MI niS/inSi - Coitilucliviiy ui niS/m ol lliu duiillud waui tiiud
to iiiak* ihi tutu I ion
• fl.'C. Kid Ci. 01 Si and Si. mull auhai lit iluiumtimiil ai lit* i*m«10 ihi tamo ifinpuiaiuio la A«ak« iho «qu»-
Not*, foi luiihoi inloiiiunon on conductivity and llw abovo ilan-iJjiil iiilonnai.on. lolui 'to ASIM SundiitU fail 23 — SlamUidMcihu.lv ol foil lot Elactncal CoiuJuctmly. 01 Wanti and lAdutlual
Wjiei — ASIM OiuiuiuliOA 01 tH 64
MOOtL 33'AND 33M UStp W|TH YSI 6lA. &V»ntl 61. . . . 1
11 iho kalimiy mca»ui«iuanl ii |o ha ti^cd lui tilmily coiiaciiOn OA IhiMA UK iciUtny lliuuld It* convuiied 10 Chloiotily HIM loimula it .'
10
t'I'M Chlo.oniy * ————
nvKuinuikU ll>« O03 can I
SS *v. k 10*
-001I o * l0'
PPM Cl I fl
II 2)
ft 000 10.000 }0.bOO ITM C^
foi laluuiy coiiKliOA whan UIUIQ ih« MiuJal fr) M»«I ih«d»*acl tium. ilia Modaj. 33 ,on 33M No convaiiioa a
' ' '• Modal 33 ami 33M talimly laadiAQt |ataa m coniuiiciiOA wiili Mo«lol64di:u0ivado«y||«niaadiito«canb«iiiBd}ocoii«ci ihti M.itl l &4 loi
and \a ntaka poi>l*iitaa»ui«m«A| t thinly COH*IC|H)II» 10 ila-okyo«A dau CoiittclioA UbUt au availab|a hum tha laciuiy
'unComl.i.onJlWAnBANTYAll'YSI piortucls cany • ona yaaiwoikntait&lup a*ul paiu. a«chitiv«doni. iiutufta. pi uni|taiMiQ will l a lapauuil ai a Aoinni.il tII you au a»peiititcin0 dddciilly will) any YSI ptoilnci. itlaiuiAad 10 an amhouiad YSI doalti loi lapaw. «w«n il ilio <lui uipimd II you nead latioiy Aitniaucu loi any IHUIIMI •
Yellow Spiinut bikliunuAl Co. IncPO Bo> 278YuNuw S|ilutQt. Ohio USAPlum* |&|3| 76) )24I
Uo

APPENDIX C-3
CALIBRATION AND HAINTENANCE OFHNU PHOTOIONIZER
systems inc.
INSTRUCTION MANUAL
FOR
MODEL PI 101
PHOTOIONIZATION ANALYZER
© Copyright 1975
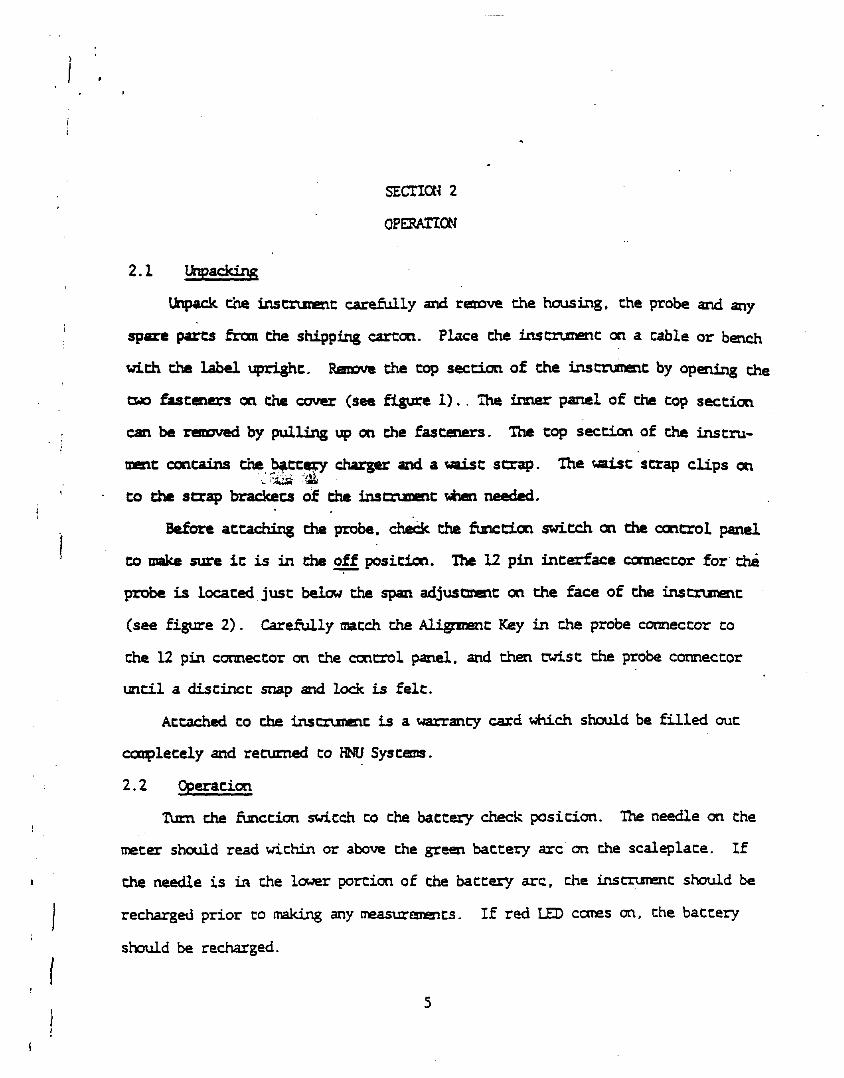
SECTION 2
OPERATION
2.1 Unpacking
Unpack the instninent carefully and remove the housing, che probe and any
spare pares from che shipping carton. Place the instrument on a table or bench
with the label upright. Remove the top section of the instrument by opening the
two fasteners on the cover (see figure 1). . The inner panel of the top section
can be removed by pulling up on the fasteners. The top section of the instru-
ment contains the battery charger and a waist scrap. The waist strap clips onv'*ia3r ; »i
to the strap brackets of the instrument when needed.
Before attaching the probe, check the function switch on die control panel
to make sure it is in the off position. The 12 pin interface connector for the
probe is located just below the span adjustment on the face of the instrument
(see figure 2). Carefully match the Alignment Key in the probe connector to
the 12 pin connector on the control panel, and then twist the probe connector
until a distinct snap and lock is felt.
Attached to che instrunent is a warranty card which should be filled out
coopletely and returned to HNU Systems.
2.2 Operation
Turn the function switch to the battery check position. The needle on the
meter should read within or above the green battery arc on the scaleplate. If
the needle is in che Icwer portion of the battery arc, the instrument should be
recharged prior co making any measurements. If red LED cones on, the battery
should be recharged.

Figure 1 (Continued)
i
i
I
3
i
iInner Panel
Fasteners
Instrument Cover(for storage of probeand charger)
Top View
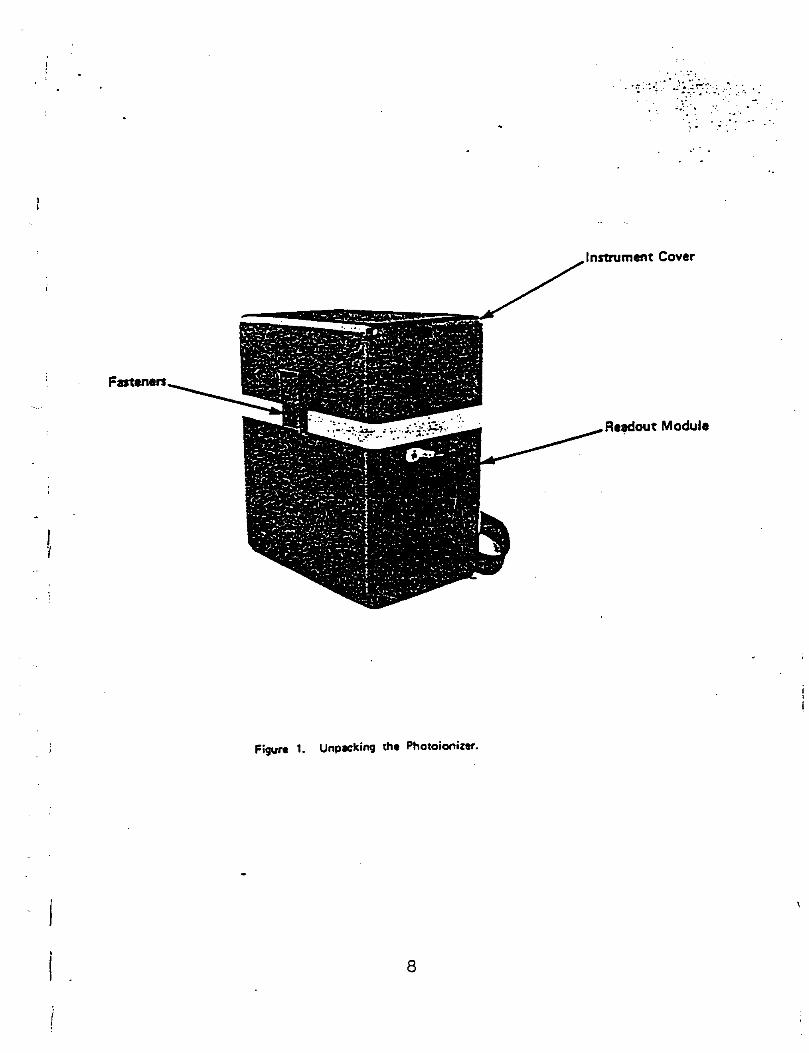
Fasteners
Instrument Cover
Readout Module
Figurt 1. Unpacking tht Photoionizer.
8
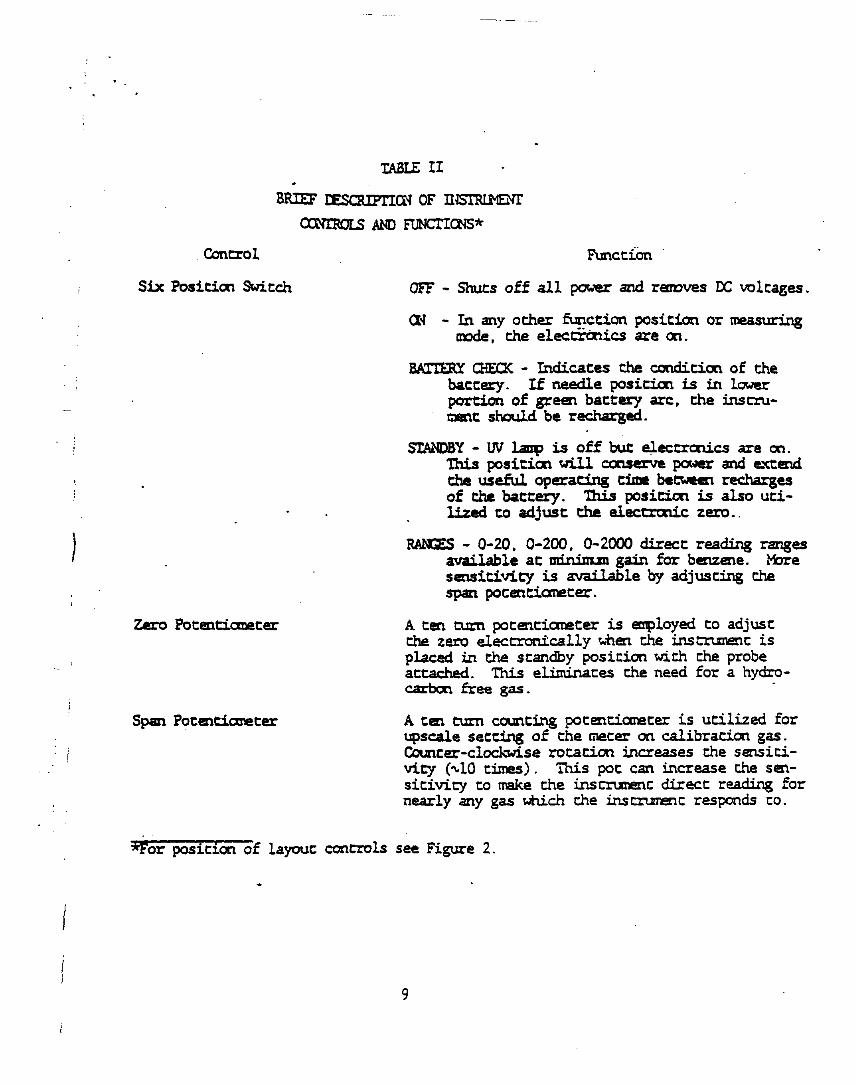
TABLE II
BRIEF DESCRIPTION OF HEIBIHEOTOCNIB0LS AND HJNCTICNS*
Control Function
Six Position Switch
Zero Potentiometer
Span Potentiometer
OFF - Shuts off all power and removes DC voltages.
CM - In any other function position or measuringmode, the electrcmcs are on.
BATTERY CHECK - Indicates the condition of thebattery. If needle posicion is in lowerportion of green battery arc, the instru-ment should be recharged.
STANDBY - UV lamp is off but electronics are on.This position will conserve power and extendthe useful operating time between rechargesof the battery. This position is also uti-lized to adjust the electronic zero..
RANGES - 0-20. 0*200, 0-2000 direct reading rangesavailable at noxn'mm gain for benzene. Moresensitivity is available by adjusting thespan potentiometer.
A ten turn potentiometer is employed to adjustthe zero electronically when the instrument isplaced in the standby position with the probeattached. This eliminates the need for a hydro-carbcn free gas.
A ten turn counting potentiometer is utilized forupscale setting of the meter on calibration gas.Counter-clockwise rotation increases the sensiti-vity (10 times). This pot can increase the sen-sitivity to make the instrument direct reading fornearly any gas which che instrument responds co.
*For position of layout controls see Figure 2.

Figure 2 Control Panel Functions
i
Low Battery IndicatorLightlLEO)
Power Off
SensitivityAdjustment
Hi-WageInterlock
Battery CheckPosition
Ranges [pom]
FunctionSwitch
12 Pin interlace Connectorbetween readout unit andseosor
Zero Adjustment
Recorder Output1-5VOC)

' To zero the instrument, turn the function switch to the standby positioniand rotate the zero potentiometer until the meter reads zero. Clockwise rota-
i tion of the zero potentiometer produces an upscale deflection while counterclock-
I wise rotation yields a downscale deflection. Note: no zero gas is needed, since• | i •
this is an electronic zero adjustment (see below). If the span adjustment setting
) ! is changed after the zero is set, the zero should be rechecked and adjusted, if' !
necessary. Wait 15 or 20 seconds to ensure that the zero reading is stable. Ifi , . 'necessary, readjust the zero.
i The instruwnt is now ready for calibration or measurement by switching
the function switch to the proper measurement range. The instrunent is supplied
' calibrated to read directly in ppm (v/v) 0-20, 0-200, 0-2000 of benzene with
the span position set at 9'.8. For aririltrfnnal sensitivity, the span potentiometer
II is turned counterclockwise (smaller nunbers) to increase the gain. By changing
the span setting fron 10.0 to 1.0 the sensitivity is increased approximately ten
. ' fold. Then, the 0-20, 0-200, and 0-2000 ppm scales become 0-2, 0-20, and 0-200
ppm full scale, respectively. This span control is also utilized to make the
instrument scale read directly in ppm of the compound being measured. E.g., iti I
ill is adjusted to match the value of a calibration gas to that same reading on the
j | instrument scale. The span control can be utilized to calibrate nearly any com--; !
| pound, measured by photoionization, to be direct reading on the 0-20 ppm range.
'r | For example, gain settings of 4.5 or 8.9, respectively, will provide direct reading
' capability (0-20, 0-200 ppm) for vinyl chloride and trichloroethylene, respectively,
» For a listing of approximate gain setting values see Table IV.
11

iI
A snail DC operated fan is used to pull air-through the photoionization i
sensor at a flew rate of three to seven hundred centimeters per minute (ca. 0.5
1pm). The fan provides nearly instantaneous response times (Figure 3) while j
consuming little power. The characteristics of a fan are such that it cannot
tolerate a significant pressure drop without affecting the flow rate and there-
fore either the instrument reading or response time. Since photoionization is .
essentially a nondestructive technique, changes in flew rate do not affect the
signal but if a large pressure drop is imposed ac the inlec of the probe, the I
sample nay not reach the sensor.
12

,.TABLE II I
VERIFICATION OF ELECTRONIC ZERO FORPHOTOIONIZATION ANALYZER*
InstrumentSample *««"• (PPm) % °
07 35Room Air
01 5Room Air Passed Through u-6" x 3/4" 00 CharcoalScrubber
Zero Air °-25
Zero Air Passed Through O-04
6^* x 3/4" OD CharcoalScrubber
'Maximum Gain * 2 ppm full scale.
13
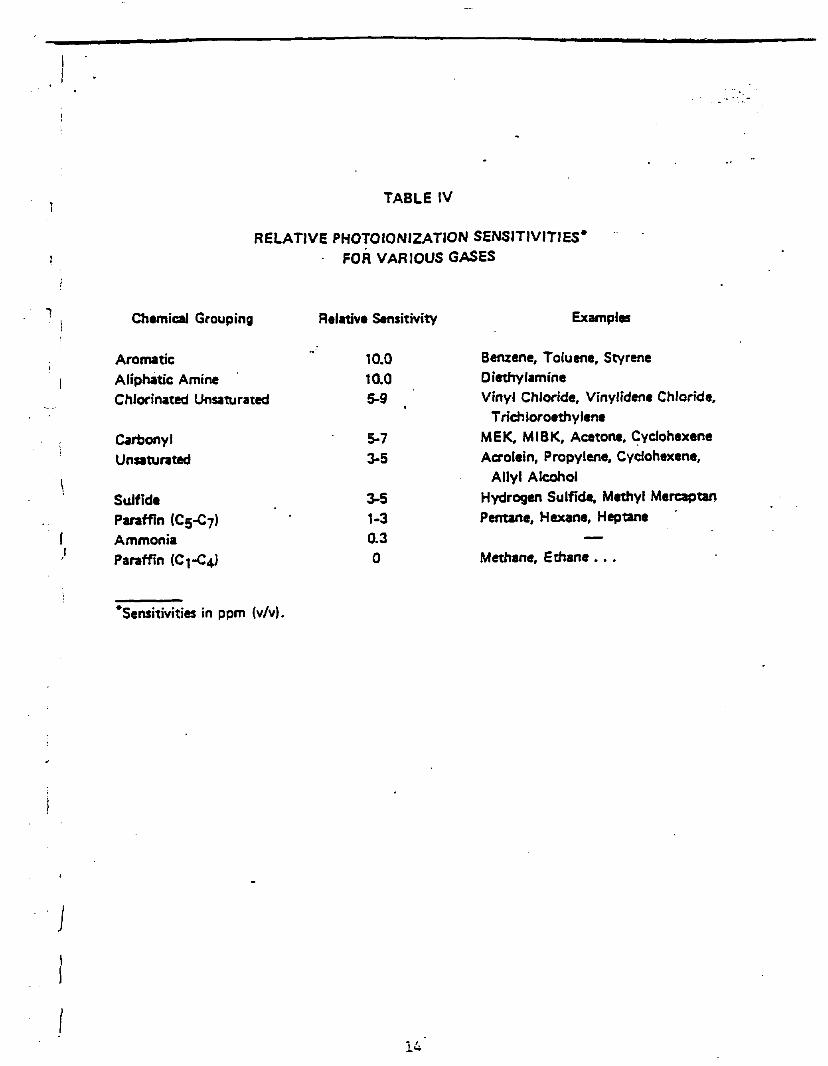
TABLE IV
RELATIVE PHOTOIONIZATION SENSITIVITIES4
FOR VARIOUS GASES
Chemical Grouping
AromaticAliphatic AmineChlorinated Uosaturated
CarbonylUnsaturated
SulffdeParaffinAmmoniaParaffin
Relative Sensitivity
10.010.05-9
5-73-5
3-51-30.30
Examples
Benzene, Toluene, StyreneDiethylamineVinyl Chloride, Vinylidene Chloride,Trich loroethy lene
MEK, MIBK, Acetone, CyciohexeneAcrolein, Propylene, Cyclohexene,
Allyl AlcoholHydrogen Sulftde, Methyl MercaptanPentane, Hexane, Heptane
Methane, Ethane ...
*Sensitivities in ppm (v/v).
14

Figurt 3. Timt Rtspons* for tht Photoionization Analyztr.
100H
co
E
20 H
Time (seconds)
15
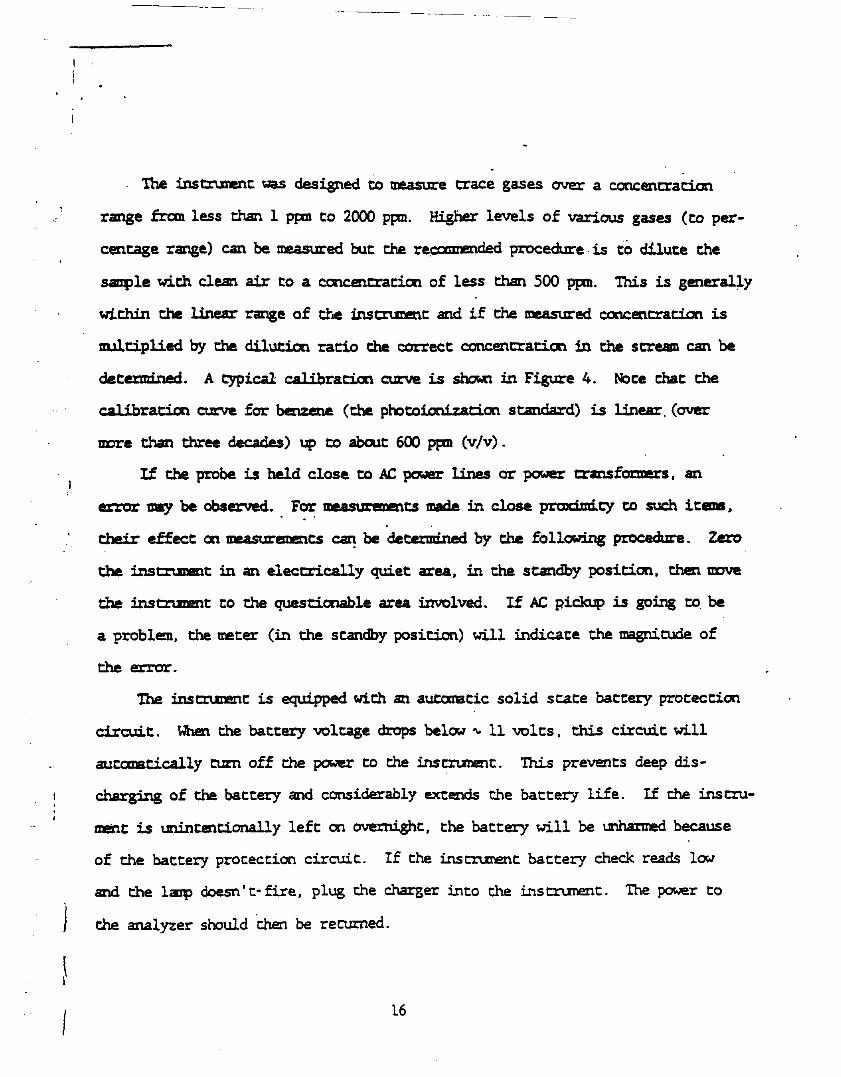
The instrunent was designed to measure crace gases over a concentration
range frcm less than L ppm to 2000 ppm. Higher levels of various gases (to per-
centage range) can be measured but the recccmended procedure is to dilute the
sample with clean air to a concentration of less than 500 ppm. This is generally
within the linear range of the instrunent and if the measured concentration is
nultiplied by the dilution ratio the correct concentration in the stream can be
determined. A typical calibration curve is shown in Figure 4. Note that the
calibration curve for benzene (the photoionization standard) is linear, (over
more than three decades) up to about 600 ppm (v/v).
If the probe is held close to AC power lines or power transformers, an
error may be observed. For measuremaits made in close proximity to such items,
their effect on measurements can be determined by the following procedure. Zero
the instrunent in an electrically quiet area, in the standby position, then move
the instrument to the questionable area involved. If AC pickup is going to be
a problem, the meter (in the standby position) will indicate the magnitude of
the error.
The instrunent is equipped with an automatic solid state battery protection
circuit. When the battery voltage drops below ^ 11 volts, this circuit will
automatically turn off the pcwer to the instrunent. This prevents deep dis-
charging of the battery and considerably extends the battery life. If the instru-
ment is unintentionally left on overnight, the battery will be unharmed because
of the battery protection circuit. If the inscrunent battery check reads low
and the laip doesn't-fire, plug the charger into the instrunent. The power to
the analyzer should chen be returned.
16

To charge the battery, place the mini phone plug into the jack on left
side of the bezel prior to plugging charger into 120 VAC. When disconnecting
charger, remove from 120 VAC before removing mini phone plug. The battery is
ccopletely recharged overnight (ca. 14 hours). To ensure that the charger is
functioning, turn the function switch to the battery check position, place phone
plug into jack and plug charger into AC outlet. The meter should go upscale if
charger is working and is correctly inserted into the jack.
The instrument can be operated during the recharge cycle. This will
lengthen the tine required to completely recharge the instrument battery.
17
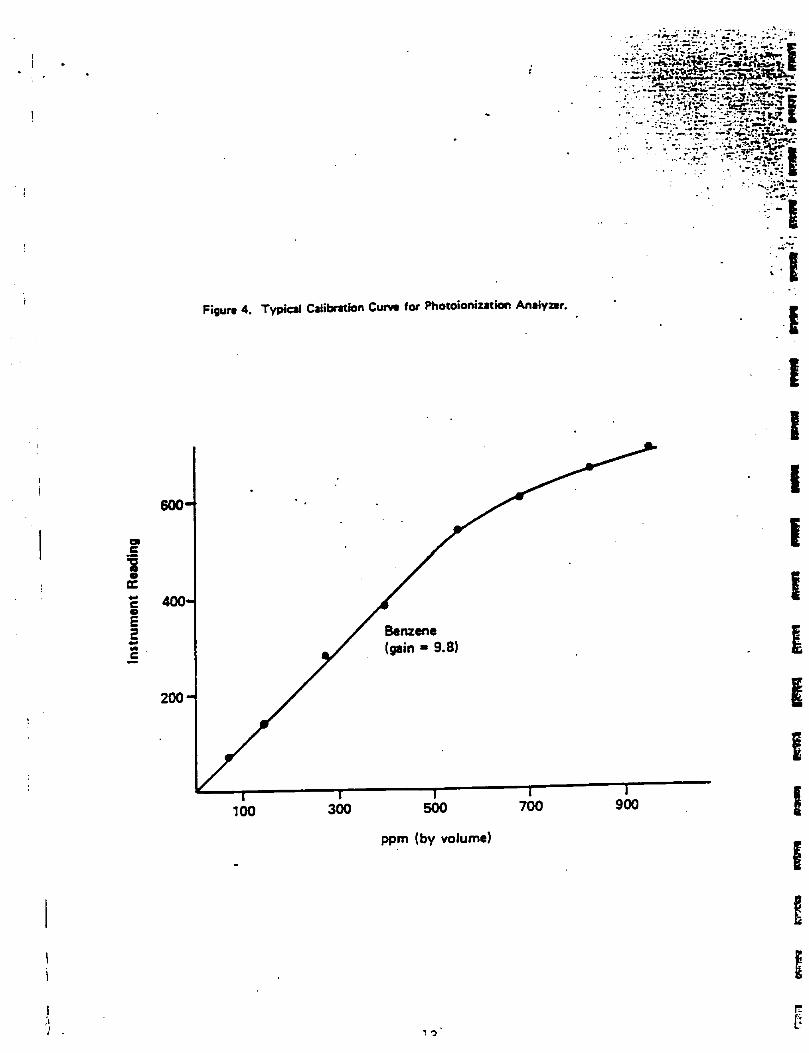
''-'- .:rs&v3ri'^"V*:??s:-'r-----B
-n-r. -iiiT- .-%.';^rrvr-'^..- — •'. —... .*».-. - i-» . *- iC .r**-* *V
Figurt 4. Typical Calibration Curv« for Photoionization Analyzer. I
600H
400H
E
200 H
ii
100 300 500 700
ppm (by volume)
900

i !
SECTION 3
CALIBRATION
Static or dynamic gas generation systems can be utilized for calibration
of the instrunent. A number of such systems for generating, test atmospheres
for various gases have been described by G. 0. Nelson in "Controlled Test
Atmospheres," Ann Arbor Science Publishers, Ann Arbor, Michigan (1971).
The most convenient packages for calibration are the nan-toxic analyzed
gas mixtures available from HNU Systems in pressurized containers (Catalogue
#101-350 ).
A rapid procedure for calibration involves bringing the probe and readout
in close proximity to the calibration gas, cracking the valve on the tank and
checking the instrunent reading. This provides a useful spot check for the
instrument.
The recccmended and most accurate procedure for calibration of the instru-
ment fron a pressurized container is to connect one side of a "T" to the pressurized
container of calibration, gas, another side of the "T" to a rotameter and the third
side of the "T" directly to the 8" extension to the photoionization probe (see
Figure 5). Crack the valve of the pressurized container until a slight flow is
indicated on the rotameter. The instrunent draws in the volune of sample required
for detection, and the flow in the rotaneter indicates an excess of sample. Now
adjust the span pot so that the instrunent is reading the exact value of the cali-
bration gas. (If the instrunent span setting is changed, the instrument should
be turned back to the standby {Position and the electronic zero should be readjusted,
if necessary.)
19
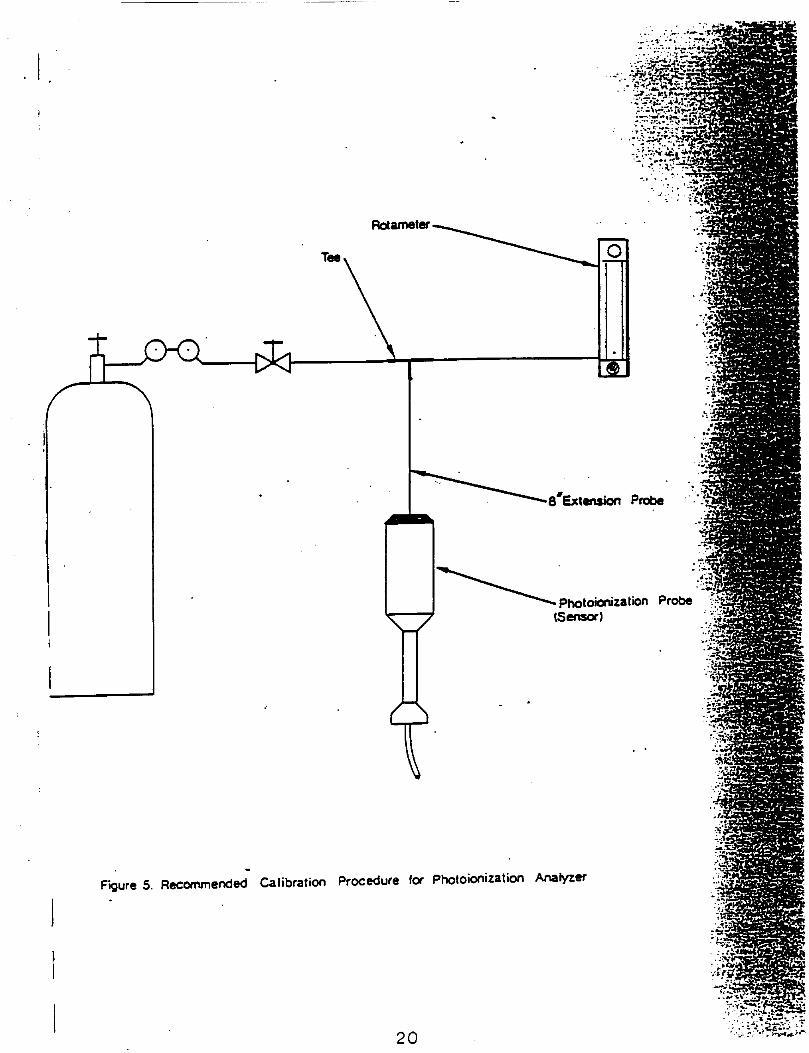
Rotameter-
Tee.
•8*Extension Probe
• Pholoionization Probe(Sensor)
Figure 5. Recommended Calibration Procedure for Photoionization Anaryzef
20

The calibration gas should be prepared in the same matrix (air, nitrogen,
hydrogen, etc.) in which it is to be measured, otherwise an inaccurate reading
may be obtained. The increased response which is seen in oxygen free gases can
be attributed to a reduction in the quenching of ions by oxygen (actually Ck") •
and is typical of any ionization detector. The quenching effect of oxygen is
constant from about ten percent (L to very high levels.
If a gas standard prepared in nitrogen is to be used for measurements in
air, fill a 0.5 or 1 liter bag with the standard then add 50 or 100 cc of pure
oxygen to bring the level to 10-127..
Any error between this value and 201 oxygen is quite small.
If the sample to be measured is in nitrogen, standards should be prepared
in nitrogen. This will result in an increase in sensitivity of approximately•4.
* Calibration with toxic gases should be performed in a hood since the101 is a non-destructive analyzer.
21

APPENDIX C-4
APPENDIX C-4
CALIBRATION AND MAINTENANCE OFTHE NONITOX HCN

MDA Scientific, Inc.405 Barclay Blvd.Lincolnshire. Illinois 60069Phr.no: BOO 323 2000 (in IL 312/634-2800)Iclei: 72 6399 MDA USA • Fix: 312 634 1371
BedienungsanleitungOperating Instructions
COMPUR 4100 SDMonitox HCN
Compur-Electronic GmbH
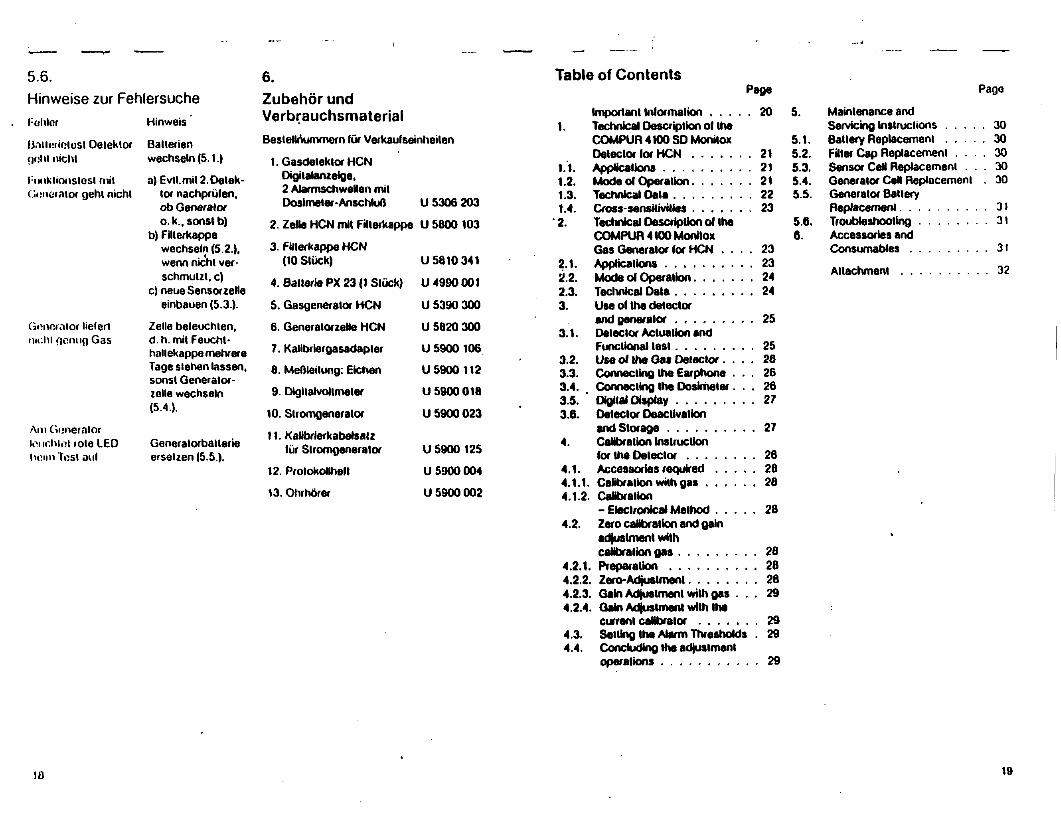
5.6.Hinweise zur FehlersucheFehler
I3.iilcrif)lusl Deleklorflohl nichl
t milt irncMloi gehl nichl
Gonorntor Helenuichl oo
Am GeneratorlonchioifoleLEDlu'iin To si aul
Hinweis
Balierienwechseln (5.1.)a) Evtl.mil 2.Delek-
tor nachprulen.ob Generatoro.k.,sonstb)
b) Flllerkappewechseln (5.2.),wenn nichl ver-schmutzl, c)
c) neue Sensor zelleeinbauen(5.3.).
Zelle beleuchlen,d h mil Feuchl-hallekappe mehrereTage slehen Inssen,sonsl Generator -zelle wechseln(5.4.).
Generalorbailerieerselzen(5.5.).
6.Zubehor undVerbrauchsmaterialBeslellnummern fur Verkaufseinheilen
1.GasdelektorHCNDigitalanzelge,2 AlarmschweNen milDosimeler-AnschluQ U 5306 203
2. Zelto HCN mil Fttlerkappe U 5800 103
3. Fillerkappe HCN(10 Stuck) U 5810 341
4. Ballerie PX 23 (1 Stuck) U 4990 001
5. Gasgeneralor HCN U 5390 300
6. GeneralorzeHe HCN U 5B20 3007. Kalibriergasadapler U 5900 106
6. Meflleilung: Etohen U 5900 112
9. Digilatvoltmeler U 5900 018
10. Siromgenerator U 5900 02311. Kalibrierkabetsatz
fur Slromgeneralor U 5900 125
12. Prolokollhell U 5900 004
13.Ohrhorer U 5900 002
10
Table of Contents
1.
1.1.1.2.1.3.1.4.2.
2.1.2.2.2.3.3.
3.1.
3.2.3.3.3.4.3.5.3.6.
4.
4.1.4.1.1.4.1.2.
4.2.
4.2.1.4.2.2.4.2.3.4.2.4.
4.3.4.4.
Pa
Important Information . . . . .Technical Description ol theCOMPUR 4 100 SO MoniloxDetector lor HCN . . . . . . .Applications . . . . . . . . . .Mode ol Operation . . . . . . .Technical Oala . . . . . . . . .Cross-sensitivities . . . . . . .Technical Description ol IheCOMPUR 4 100 MoniloxGas Generator lor HCN . . . .Applications . . . . . . . . . .Mode of Operation . . . . . . .Technical Data . . . . . . . . .Use ol the detectorand generator . . . . . . . . .Detector Actuation andFunctional lest . . . . . . . . .Usa ol the Gas Detector . . . .Connecting Ihe Earphone . . .Connecting Ihe Dosimeter . . .Digital Display . . . . . . . . .Detector Deactlvatlonand Storage . . . . . . . . . .Calibration Instructionfor the Detector . . . . . . . .Accessories required . . . . .Calibration with gas . . . . . .Calibration- Electronical MethodZero calibration and gainadjustment withcalibration gas . . . . . . . . .Preparation . . . . . . . . . .Zero-Adjustment . . . . . . . .Gain Adjustment with gas . . .Gain Adjustment with Ihecurrent calibrator . . . . . . .Setting tha Alarm Thresholds .Concluding the adjustmentoperations . . . . . . . . . . .
ge
20 5.
5.1.21 5.2.21 5.3.21 5.4.22 5.5.23
5.6.6.
23232424
25
2526262627
27
282828
28
28282829
2929
29
Page
Maintenance andServicing instructions . . . . . 30Battery Replacement . . . . . 30Filler Cap Replacement . . . . 30Sensor CeH Replacement ... 30Generator CeH Replacement . 30Generator BatteryR e p l a c e m e n t . . . . . . . . . . 31Troubleshooting . . . . . . . . 3 1Accessories andConsumables . . . . . . . . . 3 1
. . . . . . . . . . 3 2
19

Gas Detection and Warning SystemCOMPUR 4100 SO Monitox HCN
flu: COMPUR 4100 SD Monilox GasOolooiion and Warning System comprisesI rins detector (alarm unit with digital
display);i i|.is gonoialor (lost unit);) coo sole (recommended accessory)•I riolcclolog (recommended accessory)
Iho system is especially designed lomonitor the TLV of HCN. (
CAUTIONIAlthough (ho 4100 SD Monilox for HCN hashnoii highly simplified lor ease of operationIty ihc usor, it is nevertheless a complexmi'.ir.iiiinq instrument which will operateH'h.iUy only if these operating ins I rue I ions.in: c, u i! fully observed and if Ihe instrumentit; rl u:cked regularly by the safely officer.
This applies in particular to Ihe regularreplacement of the cells and daily functionaltests. The responsibility for any changesmade In Ihe alarm threshold sellings mustbe borne entirely by the operator; COMPURrecommends the strict observance of IheTLV. Since Ihe unit Is designed lo beIntrinsically safe, all repairs must be madeby Ihe manufacturer or other approvedpersonnel.
COMPUR offers Ihe Instrument with thefollowing factory settings:lirsl alarm threshold - at TLV = 10 ppmsecond alarm threshold » at 2 TLV - 20 ppm
The detector ceN will be destroyed If Ihedetector is permanently exposed lo a HCN-concenlrallon exceeding 1000 ppm. In IN*case Ihe ceN has lo be replaced.
1.Technical Description of theCOMPUR 4100 SD MonitoxDetector for HCN
1.1.ApplicationsThe COMPUR 4100 SO Monilox Is apersonal monitor lor HCN,
II Is designed lo be worn attached to theclothing near the breathing zone of theperson lo be protected. The detectorproduces an audible first alarm when theHCN-concentralkm exceeds the TLV(factory setting: 10 pom) and a secondalarm, when it exceeds 2 x TLV.Independent of the alarm setting, the digitaldisplay shows the actual HCN-concentration in ppm (parts per minion)In the nominal range ol 0 - 100 ppm HCN.
In conjunction with the COMPUR 4102Dosimeter, the unit can be employed loregister HCN-concenlrations at canfinedspaces ranging from 0 lo 10 x TLV.
The COMPUR 4100 SO Monilox cannot beused lo measure process gas streams or inpresence of continuous high HCN-concentrations.
1.2.Mode of OperationAmbient air diffuses through the filter insert(a dust filter) (5) to the measuring cell. Themeasuring eel. a dual-electrodeelectrochemical ceH with an organicelectrolyte gel. generates an output currentproportional lo the partial pressure ol HCNIn the air.
A series of electronic amplifiers supply avoltage signal which is fed lo Ihecomparator for Ihe alarm threshold. If thefirst alarm threshold Is exceeded, anintermittent tone Is produced; if the secondalarm threshold has been exceeded a dual-tone signal Is produced by Ihe tonegenerator and loudspeaker (or earphone invery loud areas). The standardised analogsignal corresponding lo Iho actual HCN-concentrations (the TLV corresponds lo60 mV) can be led lo the Dosimeter.
The same signal is fed lo the AD-convenerdriving Ihe digital display. The display isadjusted lo give a reading of 10 ppm ai80 mV Input.
The 4100 SD Monilox consists ol I woseparate power circuits (via two miniaturebatteries); Ihe circuit (or the analogue partis separated from that lor-the alarm-generation.When Ihe Hon-off" switch is moved to theNBatl." position, the batteries will be testedbefore the instrument Is turned on. In thisswitch position. Ihe batteries areelectronically tested under Ihe high load ofIhe final lone stages. If one of the batteriesfails lo reach Ihe predetermined lowertheoretical limit, no alarm will be heard.
21

1.3.Technical Data for the COMPUR 4100 SD Monitox for HCN
1.4.Cross-sensitivities
2.Technical Description of the
C on I or mi I y certificate
Safely class
Dimensions
Weight (with batteries)
I'owor supply
nnltery service life
Display range
Alarm volume
Alnnn levels
(Response lime
lime to alarm 20 ppm50 ppm
Connection possibilities
r.jniperaluic range
Relative humidity
Zero point drift
Sensitivity drift
life ol ihe cell
BVS 82.013
EExib|ICT6
104.4x62x24 mm
approx. ISO g
2xPX23(5.6V)
approx. 1000 h.
,0-100 ppm
min.60dBA/30cm
2 alarms, adjustable
Tw < 10 5TM < 3 min.
< 15s< 3s
earphone, dosimeter
0-50 »C
10% - 95%
< 1 ppm / 6 months
< 15% / 6 months
min. 6 months (dependant on dose)
Test com- Testportents concentrationSO} 5000 ppm/ 40% rHNO| 10 ppmNHj 1000 ppmCO 1000 ppmCO, 1000 ppmH, 1000 ppmCH,:CHCN 10 ppmCHiCN 200 ppm(CHj)N 500 ppmCHjOH 200 ppmCOCli 5 ppmDa 10 ppmHQ 10 ppmHtS ' 2 ppmHydro-carbons.saturated 2% vol.Hydro-carbons,unuturaled l%vol.Aromaticcompounds(alsoateytated) 200 ppm
IndicationIn ppm HCN
10- 6
10____
_
17
1057
10
—
__
—
v/vivirun t iisu our muimuxGas Generator for HCN
2.1.ApplicationsThe HCN gas generator serves to enhanceIhe reliability ol the Monitox gas detectionand warning system. The Monilox doiectomust undergo a functional test by placing ton the generator before each use. Thegeneration ol a gas concentrationexceeding the TLV ensures that the del ecuwiN respond reliably during use (picture 2).
The gas generator, however, is not designuto generate a calibration gas of knownconcentration. Dally testing of the Monito>detector does not mean that the user is norecommended to change cell sequentially
The COMPUR 4100 Gas Generator mustnot be exposed to or used In explosiveatmospheres.N.B.: The generator cell may dry out at
very low relative humidity in the air. lithis case, i( is necessary to put themoisture cap delivered with thegenerator on top of the generatoralways when it is not in use.
This ensures a correct gasconcentration for the deteclor test.
22 23

2.2.Mode of Operation1 ho switch on the generator is activated byplacing the detector in the matching recesson the generator head.
A small Inn feeds a Mow ol air past ihe(| on era I w cell directly to the detector cell.A) the same lime, gas is generatedetoctrolylically in the generator ceN in suchfin amount that Ihe gas concentration Ishigh enough lo cause Ihe detector torespond within 10 seconds (alarm thresholdto ppm). The period ol gas generation Isindicated by the green LED.
The red LEO indicates when Ihe batterymust be replaced.
Alter a 10 seconds interval, gas productionis terminated and Ihe (an conveys pure airuntil the detector Is removed.This functional lest ol the del eel or checksany ol the following defects:
clogging ol Ihe dust fillera malfunctioning calla malfunctioning electronics systema malfunctioning generator.
2.3.Technical Data of the COMPUR 4100 SD MonitoxGas Generator for HCNDimensions
Weight (incl. batteries)
Temperature range
Power supply
Generator cell service life
I In l lory service life
133 x 65 x 40 mm
approx. 250 g
0*C-50*C
9 volt alkali battery, leakprool, e.g. Mallory 1604
approx. 3000 lests or lor 1 year
approx. 3000 tests
3.Use of the detectorand generator
3.1.Detector actuation andfunctional testBattery Test
Turn Ihe switch on the COMPUR 4100 SDMonitox to "Ball". II the battery hassufficient power lo operate the detector for
. eight hours, an audible (intermittent) lonewW be heard. The LCD-display Is switchedoff at Ihe "Bait." lest position. II no lone Isemitted, this Indicates that et least one olIhe batteries is exhausted. For safelyreasons both batteries should be replaced(relerlo section 5.1.).When the audible lone has been heard (lopreserve batteries. Ihe lest should be asshort as possible), the switch to moved to"ON". The lone wW cease. The LCD-displayto operating now. II must show M0M ppmalter some seconds.Functional Test (picture 2)Place Ihe detector on lop ol Ihe generatorasWuslrated.As soon as Ihe detector sounds Its alarm, itmust be removed from the generator. Thedetector to ready lor operation once Ihealarm has ceased.
II the detector alarm does not sound withinten seconds Ihe detector has to be checkedand serviced. II necessary, the filter cap hasto be replaced (see point 5.2.).
It to advisable to record the lest andassignment ol Ihe gas detector in Ihedetectotog.The battery lest and functional test must beperformed prior lo each use lo Ihus ensuremaximum safely.
During Ihe gas lest Ihe LCD-display mustshow the response of the ced to HCN-concentration as well. As the alarmthreshold to facloryset at 10 ppm Ihe alarmshould sound at 10 ppm. As the displayreads a new value every second, the limefor alarm and display of 10 ppm may bedifferent.

1.2.Jse of the Gas Detectoric gas detector must be worn in Ihenalhing zone of Ihe person to be protected«J Ihe filter cap (5) should not be coveredany way.
to lubber lip on Ihe carrying clip makes Itissihio to securely attach the Monilox toliclcs ol clothing (e.g. the breasl pocket).
II us is not deemed adequately secure, Ihetain supplied with the Monilox can beicured in the holes of the carrying c*Hp.us enables Ihe Monilox to be worn aroundR nock.
at nil possible, Ihe filler cap should beotecied from water, dust-laden air or dirt.>lh. the battery and functional tests (relerpoint 3.1.) should be performed before
R do ice I or is pul Inio operation.
HCN gas concentration in Ihe vicinity ofo sensor exceeds the set alarm value, Iheurn will sound after a delay dependent ono gas concentration (The higher theiiicenlralion. Ihe more quickly theDMPUR 4100 SD Monilox will respond).
ic alarm sounds al a level of at least 60 dB,i distance ol about 30 centimeters; inches).
3.3.Connecting the EarphoneWhen the detector is being utilised in anarea with high background noise, theoptional earphone should be used to besure that the alarm wW not go unnoticed.The earphone is connected to the earphonesocket (9) on the detector. This socketdisconnects the internal loudspeaker. II theearphone Is being used, it is important thatthe tests also be conducted with theearphone plugged Into the detector (refer topoint 3.1.). When the earphone is not beingused, the socket should be closed with theplastic plug.
3.4.Connecting the DosimeterThe COMPUR 4102 Mini-Dosimeter can beconnected to the 4100 SO (reler tooperating instructions lor the 4102).
The generator lest can also be carried outwith the Dosimeter connected to theCOMPUR 4100 SD if the detector Is turned160* about its longitudinal axis relative tothe position shown in point 3,1. and thenplaced on the generator in that way. that thecett (its into the recess on the generator.The functional lest Is then started bypushing the generator button with one'sfinger.
The plug should be replaced in theDosimeter socket whenever the DosimeterIs not being used.
3.5.Digital DisplayAdditional to the warning-function ol theCOMPUR 4100 SD Monitox Hs digitaldisplay (6) gives a direct reading of theactual HCN concentration.Thus II is possible lo determine HCN-concentraUons below and above Ihe TLV-level, giving Ihe skilled worker and Industrialhygienist the means lo detect unusualconditions of HCN-concentrations withhigh accuracy and resolution.
The COMPUR 4100 SD Monitox is. however,even with its digital display, primary ameasuring and warning device lor personalprotection.II has not bean designed for measurementIn process-control; moreover exposures tohigh HCN-concenlrations lor any length oftime must be avoided, as the accuracy olIhe reading win sutler.
3.6.Detector Deactivalionand Storagea) brief period of inactivity (up to a month)
Ihe detector Is deactivated(switch to "OFF")
b) Prolonged Inactivity and storageII Is advisable lo open the Monilox andremove both the eel and batteries, toprovide Ihem from leaking and corrodingthe Interior of the Monilox (refer to thesections on eel and battery replacementS.3.).Before reulHlzing the Monitox a new cellhas to be installed.
27

4.Calibration Instruction for thedetector COMPUR 4100 SDMonitoxTo enhance the Intrinsic accuracy of Ihe• Inloclor lor HCN il is necessary to calibrateI he deloclor either with a HCN nitrogenmix it im with definite concentration of HCNi ii make an electronic adjustment by meansol Ihe COMPUR current generatorU 5000 023.
4.1.Accessories required1.1.1.Calibration with gas.1) calibration cap 10 place onto Monitox;ij How meter:) millivollmeter 0 - 2000 mV;
input resistance S* 1 M 0.!) lulling, set ol test cables, screw-driver0 calibration gas, known concentration,
alxnil 10 ppm HCN In pure N,
Mnmarh: The generation and above all Ihestability lime of HCN calibrationgas is not without problems. Soif only a small number ofdeieciors are to be calibrated,the electronic method should beprefer ed.
1.1.2.Calibration - Electronical Method.picture 6 and 7)i) calibration unit (current generator)->) miltivoltmelor 0 - 2000 mV,
input resistance > 1 M 0;) set of test cables, screw-driver
4.2.Zero calibration and gainadjustment with calibration gas4.2.1.Preparation
The Mooilox is opened and positioned withthe electronic components upward on anon-slip surface. The cover with the digitaldisplay Is carefully put aside with thedisplay upward.
Then the unit Is switched on via "Bait."position to "ON'*. The LCD-display shouldread 00 ppm alter several seconds.The excettenl zero-point stability of the cellswiN normally make unnecessary to adjustthe zero-point. Deviations from zero arecaused mostly by lautl sensor cells.For zero-checking remove sensor cell.4.2.2.Zero-Adjustment
Connect MWivollmeler to lie down point,(MP 2) and GND (MP 1) (picture 6). If In* 'reading is not zero In clean air, and also d .not zero without sensor ceN, potentiometer(R 9) (offset voltage) has to be varied unitythe reading is zero.
Note: II reading is zero without cell and not'-zero with the cell, it may need up toone hour to stabilize the ceN. If a eelhas been removed lor a longerperiod without short-circuiting thetwo connectors, the lime to slabttzemay be up to one day. A new celltherefore has short-circuit on thesmall pcb, that must be broken awaybefore Inserting the eel.
.
4.2.3.Gain Adjustment with gas
The special calibration adapter Is lightly putonto the dust filler on top of the detector ceN.Adjust a calibration-gas flow through thecalibration cap; flow rate should be approx.100 ccm per minute and the Inlet must bethe smaBer pipe; to avoid pressurevariations the outlet should be free ofobstacles. After S minutes Ihe display of theMonilox has reached its final value.
Connect miHivollmeler to lie down point(MP 2) and GND (MP 1). Depending on Ihe
• concentration of the calibration gas Ihefollowing voltage should be displayed:(adjust by means of pot R 7)
U-|c)lnppm
10 ppmxSOmV
The display of Ihe Monilox must show thegas concentration. In Ihe opposite, adjustpot (R IS) until correct reading Is shown.
4.2.4.Gain-Adjustment with the currentcalibrator
Each deloclor coN produced by COMPURIs supplied with an indication of Ihe outputcurrent at 10 ppm HCN. (Never throw awaypackings of replacement eels beforehaving noted this indication!!!)
Remove detector ceN. Insert calibrationcable with Ihe plug board Into plugconnector for detector ceN. The goldcontacts must touch the spring contacts.Connect other side of the cable to Ihecurrent generator.
Make sure of correct polarity of plugs.Switch on generator, turn button I1Ngenerator display shows output current ofdetector ceN.
>0
Remark: Display always shows actualvalue of current. If 1| is zero,check the contacts!
Connect voltmeter to lie down point (MP 2)and GND. Adjust sensibility by means ofpot (R 7) until 60 mV Is displayed. Moniloxmust now display 10 ppm. In opposite,adjust pot (R IS).
4.3.Setting the Alarm thresholdsThe alarms of the standard version are to beset on 10 ppm (first alarm 1TLV) and 20 ppm(second alarm 2 x TLV).To set Ihe alarm levels, push the 2 mini-switches (31) to Ihe right. The display ol theMonilox shows now the level of Ihe 1stalarm threshold. This can be adjusted bymeans of Ihe potentiometer (R 30).
To adjust Ihe 2nd alarm level, push theupper switch to Ihe left. The display showsnow Ihe 2nd alarm threshold. This can boadjusted by means of the potentiometer(R 29).
After having adjusted Ihe alarm levels, pus! \both mini switches to the tell. The Moniloxdisplay shows now Ihe actual concentratorof HCN.
4.4.Concluding the adjustmentoperationsAfter the settings have been made, turn theswitch on the pcb to "OFF"-posillon. Makesure that Ihe switch-handle on Ihe cover isalso In Ihe NOFF"-position..Then carefuHyreplace the cover and fold Ihe connectingcable between pcb and display so that ii isneither squeezed In nor cracked. Tightenthe screws. The Monilox is now ready foroperation.
2£

5.
Maintenance and ServicingInstructions
5.1.Battery Replacement1 Turn switch (7) to "OFF".2 Remove three screws (12).3 Turn deleclor over and remove front
cover.Attention: Do not attempt to remove thecable between front panel and pbcl
I Lill out battery housing, disconnect plug.5. Unscrew and remove battery lids.
Replace batteries wilh + pole towards ttd.Replace lids.
(V Plug-in battery plug. Ensure cable, andcoble socket in right position.
7 Replace battery housing and front cover,carefully adjust the cable of the frontpanel, so that it is not damaged by fixingthe Iron) panel; then tighten the screws.
0. Repeat battery lest.
5.2.Filter Cap Replacement1. Remove screws (7) (picture 4) and open
detector.2. Carefully remove sensor ceH together
with filler cap (5). Pull cap off cell (4).3. Aiiach new filler cap (with identical gas
label HCN) and return sensor cell tooriginal position.Tiller cap order number appears on plateiillnched to inside of front panel and islisted in section 6.
I Hnplncc Iron! cover and lighten screwsf>. Repeat performance test.
5.3.Sensor Cell Replacement1. Open detector (see 5.1.).2. Remove cell together wilh lilter cap.3. Remove new ceH and filler cap from
storage container, puM transparent capoil the cell and replace this by the newfiller cap. Correct position of filler cap Isshown in iNuslralion.Remove short-circuit protectionattached to pcb by breaking it away.
4. Proceed current calibration (4.2.4.).5. Replace sensor ceH with filter cap in
proper position.6. Close Monltox.
5.4.Generator Cell Replacement(picture 5)
1. Open housing(as when replacing battery)
2. Unsolder fan leads (10).3. Loosen four screws (11) and three
screws (12).4. Remove outlet, gas ceH and fan through
the front.5. CarefuHy Insert replacement unll
U 5620 300 consisting of outlet. ceH andfan and tighten screws (12).
6. Tighten screws (11). Align circuit boardso that pin (13) reliably actuates switch(14) when gas deleclor attached.
7. ResoWer lan leads (10).8. Reassemble generator and tighten
screws.9. Testing: Use properly functioning gas
deleclor for same gas. Switch to "ON",attach. Alarm must sound after abouteight seconds.
30
5.5.Generator Battery ReplacementLoosen four screws on rear housing panel.Carefully remove Ironl cover. For correctpositioning of battery, refer to lustration 5.
5.6.TroubleshootingMalfunction RemedyBattery lest: Replace batteries
.no response (5.1.)Generator lest: a) Repeat test usingno response 2nd detector, if
no response, b)b) Replace filler cap
(5.2.), Knotdirty, c)
c) Insert new sensoreel (5,3.)
Generator does not Use moisturizingsupply enough gas cap for several days,
otherwise replacegenerator cell (5.4.).
Red LED Hghts up Replace generatorduring test batteries (5.5.).
6.
1. Gas detector digitaldisplay. 2 alarmthresholds withDosimeter output U 5306 203
2. HCN ceH wilh filler cap U SBOO 103
3. HCN filler cap (10 pcs.) U 5610 341
4. Battery PX 23 (1 pc.) U 4990 001
5. HCN gas generator U 5390 3006. HCN generator cell U 5820 300
7. Calibration gas adapter U 5900 1068. Measuring cable:
calibration
9. Digital Voltmeter
10. Current calibrator
11. Calibration cable usedIn connection withcurrent calibrator
12. Deieclotog13. Earphone
U 5900 112U 5900 018U 5900 023
U5900 125U 5900 004
U 5900 002
31
E*»WtMBE!»a ^


APPENDIX 0
ANALYSIS METHODS

WARZYN PROCEDURES

ANALYTICAL METHODS USED BY WARZYNFOR THE WHEELER PIT SITE RI/FS
The following are standard operating procedures for analyses to be performedby Warzyn on samples from Wheeler Pit Site. Methods list detection limits andnumbers of QC samples to be performedr but do not specify performancestandards. The following table lists performance standards for qualitycontrol samples. If QC samples do not meet performance standards, the samplesare to be reanalyzed. If a QC sample 1s out-of-controlf Warzyn will followthe attached flow scheme. Out-of-control samples will be re-analyzedImmediately. If the re-analysis of the sample remains out-of-control, thedata will be flagged and the Project Manager notified. When an analyteconcentration exceeds the calibrated or linear range, re-analysis of theprepared sample after appropriate dilution 1s required. If standards stillare not met, the laboratory QA officer 1s to be notified. Methods for metalsInclude flame and furnace SOPs for certain parameters. The approximate methodwill be used according to the sample matrix. Arsenic and selenium will beperformed by furnace techniques. Aqueous samples will be performed by AA-flame, furnace and cold vapor methodologies. Non-aqueous samples will employAA-flame and cold vapor techniques.
[Jpl-601-54d]
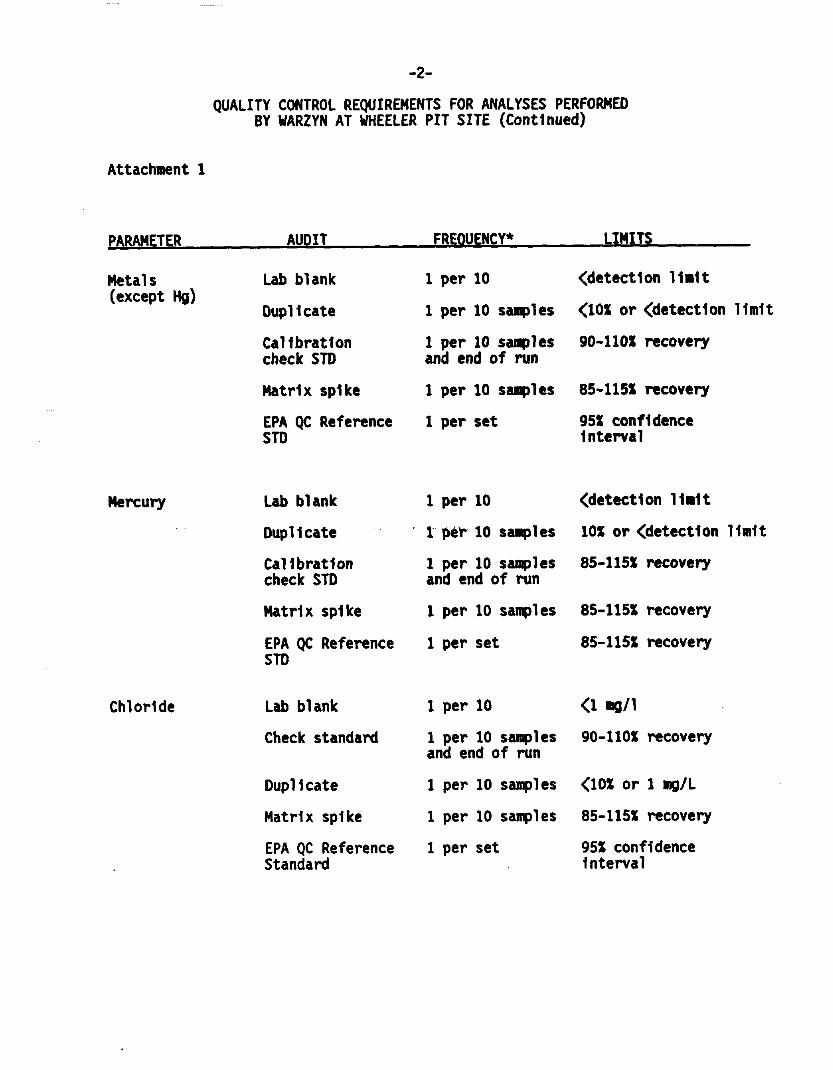
-2-
QUALITY CONTROL REQUIREMENTS FOR ANALYSES PERFORMEDBY WARZYN AT WHEELER PIT SITE (Continued)
Attachment 1
PARAMETER AUDIT FREQUENCY*
Metals(except Hg)
Lab blankDuplicate
Calibrationcheck STD
Matrix spikeEPA QC ReferenceSTD
1 per 10
1 per 10 samples1 per 10 sanplesand end of run1 per 10 sanples
1 per set
<detect1on limit
<10% or <detect1on limit
90-110% recovery
85-115% recovery
95t confidenceInterval
Mercury
Chloride
Lab blankDuplicate
Calibrationcheck STDMatrix spike
EPA QC ReferenceSTD
Lab blankCheck standard
Duplicate
Matrix spikeEPA QC ReferenceStandard
1 per 1010 samples
1 per 10 samplesand end of run1 per 10 samples1 per set
1 per 101 per 10 samplesand end of run
1 per 10 samples
1 per 10 samples
1 per set
<detect1on limit
10% or <detect1on limit
85-115% recovery
85-115% recovery
85-115% recovery
90-110% recovery
<10% or 1 mg/L85-115% recovery
95% confidenceInterval

-3-
QUALITY CONTROL REQUIREMENTS FOR ANALYSES PERFORMEDBY WARZYN AT WHEELER PIT SITE (Continued)
Total Alkalinity Lab Blank 1 per 10
Check standard
Duplicate
Matrix spikeEPA QC Reference 1 per setSTD
<5 »g/L
1 per 10 samples 90-110* recoveryand end of run1 per 10 samples <10X or <10 mg/L1 per 10 samples 85-115% recovery
95X confidenceInterval
CODLab blankDuplicate
Calibrationcheck STD
Matrix spike,EPA QC ReferenceSTD
1 per 10 <20
1 per 10 samples <10X <20 og/L
1 per 10 samples 90*110% recoveryand end of run1 per 10 samples 85*115% recovery1 per set 95X confidence
Interval
BOD
TKN
Lab blank
Check standard
DuplicateMatrix spike
EPA QC ReferenceStandard
Lab Blank
Check standard
Duplicate
Matrix spike
EPA QC ReferenceSTD
1 per 10 <11 per 10 samples 90-110X recoveryand end of run1 per 10 samples <20X or 10 mg/L
1 per 10 samples 85-115X recovery
1 set fo 2 per set 95X confidenceInterval
1 per 10
1 per 10 samplesand end of run1 per 10 samples
1 per 10 samples1 per set
0.10 mg/L
90-110X recovery
<10X or <10 mg/L
85-115X recovery
95X confidenceInterval

-4-
QUALITY CONTROL REQUIREMENTS FOR ANALYSES PERFORMEDBY WARZYN AT WHEELER PIT SITE (Continued)
NH3-N Lab blankDuplicateCalibrationcheck STD
Matrix spikeEPA QC ReferenceSTD
1 per 101 per 10 samples
1 per 10 samplesand end of run
1 per 10 samples
1 per set
0.10 mg/L
<10I <0.10 mg/L
90-110% recovery
85-115% recovery
95X confidenceInterval
N03+N02-N
S04
Lab blankCheck standard
Duplicate
Matrix spikeEPA QC ReferenceStandard
Lab Blank
Check standard
Duplicate
Matrix spikeEPA QC ReferenceSTD
1 per 10
1 per 10 samplesand end of run1 per 10 samples1 per 10 samples
1 per 10
<0.02 mg/1
90-1101 recovery
<10% or 1 mg/L
85-1151 recovery95% confidenceInterval
<5 mg/L
1 per 10 samples 90-110% recoveryand end of run1 per 10 samples <10% or <10 mg/L
1 per 10 samples 85-115% recovery
1 per set 95% confidenceInterval
Total DissolvedPhosphorus Lab blank
Duplicate
Calibrationcheck STD
Matrix spike
EPA QC ReferenceSTD
1 per 10
1 per 10 samples
1 per 10 samplesand end of run1 per 10 samples
1 per set
<0.01 mg/L
<10% or <0.10 mg/L
90-110% recovery
85-115% recovery
95% confidenceInterval

TDS
-5-
QUALITY CONTROL REQUIREMENTS FOR ANALYSES PERFORMEDBY WARZYN AT WHEELER PIT SITE (Continued)
Total Cyanide
Lab blankDuplicate
Calibrationcheck STOMatrix spikeEPA QC ReferenceSTD
Lab blankDuplicateCalibrationcheck STDMatrix spikeEPA QC Reference
STD
1 per 10
1 per 10 samples1 per 10 samplesand end of run
1 per 101 per set
1 per 10
1 per 10
1 per 10 andend of set
1 per 101 per set
<20 ng/L10X or 2085-115X recovery
85-115X recovery
95X confidenceInterval
< 0.005 ng/L
10* or <0.005 ng/L85-115X recovery
85-115X recovery
95X confidenceInterval
*Frequenc1es apply to each matrix Individually.
[Jpl-601-54d]

ACID DIGESTION FOR WASTEWATER. GROUNDWATER AND EP TOXICITY SAMPLES -
Scope and Application: This add digestion 1s applicable to all aqueoussample matrices. A nitric/hydrochloric acid digestion1s used for all metals which are to be analyzed bythe AA-flame technique and for the furnace analysisof antimony. Metals which are to be analyzed by theAA-furnace technique will follow the nitric add/hydrogen peroxide digestion.
Method; Nitric and n1 trie/hydrochloric add digestions.
Reference: EPA SW-846, "Test Methods for Evaluating Solid Hastes". July,1982. Methods 3010 and 3020.
Contract Laboratory Program, "Statement of Work", July, 1985.
Sample Handling: Aqueous samples must be acidified with concentrated nitricadd to pH < 2. Set up digestion as soon as possible;digested sample must be analyzed within 6 months.
Reagents and Apparatus:
1. Hot Plate2. 250 ml beakers3. 100 mL graduated cylinders4. Class A volumetric glassware5. M1111-Q water6. Instra-analyzed nitric acid7. Instra-analyzed HCL add8. Stock and standard metal solutions9. Whatman 142 filter paper
10. Glass funnels11. Watch glasses12. 30Z hydrogen peroxide
Reagent Preparation:
1. Intermediate and Working Metal Solutions: Refer to the specificmetal SOP for Instructions on preparation.
Notes:
1. All blanks, duplicates, and spikes, as well as a digested checkstandard must be carried through this digestion procedure.
AquOigC-1

Procedure:
A. Digestion For AA-Flame and Antimony by Furnace:
1. All glassware must be acid-washed with 1:1 nitric add and thoroughlyrinsed with M1111-Q water prior to use.
2. Measure out 100 ml allquots of samples* blanks, and standards Into250 nt beakers using a graduated cylinder.
3. Add 2 ml of 1:1 HN03 and 10 nt of 1:1 HCL.
4. Cover with a watch glass and heat on the hot plate until the volumehas been reduced to between 25 and 50 ml. Make certain that thesample does not boll.
5. Quantitatively transfer digested samples, blanks, and standards Into100 nt volumetric flasks. Filter samples through Whatman #42 filters,rinse beakers and filters with M1111-Q water and dilute to 100 mL.Alternatively, samples can be transfered to 100 ml volumetric flasks,without filtering* Dilute to volume and let any Insoluble materialsettle overnight.
6. Samples are now ready for analysis using the AA-flame procedure.
B. Digestion For AA-Fumace (except Antimony);
1. All glassware must be acid-washed with 1:1 nitric add and thoroughlyrinsed with M1H1-Q water prior to use.
2. Measure 100 ml allquots of samples, blanks, and standards Into250 ni beakers using a graduated cylinder.
3. Add 1.0 ml of 1:1 HN03 and 2 ml of 30* H202.
4. Cover with a watch glass and heat on the hot plate at 95*C for 2hours or until the volume Is reduced to between 25 and 50 nt.Make certain that the sample does not boll.
5. Quantitatively transfer digested samples, blanks, and standardsInto 100 ml volumetric flasks. Filter samples through Whatman #42filters, rinse beakers and filters with M1111-Q water and diluteto 100 nt. Alternatively, samples can be transfered to 100 ntvolumetric flask without filtering. Dilute to volume and letany Insoluble material settle overnight.
6. Samples are now ready for analysis using the AA furnace procedures.
AquDigC-2
Quality Control
1. Refer to each specific metal SOP for quality control requirements,
2. If a digested spike 1s diluted out of the working concentrationrange (too low to detect) run a manual spike. The data 1sacceptable 1f the manual spike 1s within acceptable ranges. Ifthe manual spike 1s outside the QC ranges* the sample and spikemust be re-digested at a dilution.
Revision Date
Michael J. UnskensLaboratory Manager
n LOTAKirn D. FlnnerAnalytical Laboratory QA/QC Officer
Lawrence D. AndersenVice President, Technical Services
[ALM-10-19] AquD1gC-3

ACID DIGESTIONS FOR SEDIMENTS, SLUDGES AND SOILS -
Scope and Application: This method is an add digestion procedure usedto prepare sediments, sludges, and soil samplesfor analysis by flame or furnace atomic absorptionspectropscopy (AAS) or by inductively coupled argonplasma spectroscopy (ICP). Samples prepared bythis method may be analyzed by AAS or ICP for thefollowing metals:
Aluminum Chromium NickelAntimony Cobalt PotassiumArsenic Copper SilverBarium Iron SeleniumBeryllium Lead ThalliumCadmium Magnesium VanadiumCalcium Manganese Zinc
Method: Nitric add, hydrogen peroxide and hydrochloric acid digestionfor flame work and antimony by furnace; nitric acid/hydrogenperoxide digestion for furnace work.
Reference: EPA SW-846, "Test Methods for Evaluating Solid Waste", July,1982. Methods 3020 and 3050.
Contract Laboratory Program - "Statement of Work", July,1985.
Sample Handling; Set up digestion as soon as possible; digested sample mustbe analyzed within 6 months.
Reagents and Apparatus:
1. Hot plate2. Mortar and Pestle3. 250 mL beakers4. Class A volumetric glassware5. M1111-Q water6. 302 hydrogen peroxide7. Instra-analyzed nitric acid8. Instra-analyzed HCL acid9. Stock and standard metal solutions
10. Whatman #42 filter paper11. Glass or plastic funnels12. Watch glasses
Reagent Preparation:
1. Intermediate and Working Metal Solutions: Refer to the specificmetal SOP for Instructions on preparation.
SOILDIGC-1

2. 1:1 Nitric Add; Using a 250 ml volumetric cylinder, add 250 mlM1111-Q water. Cautiously add 250 mL concentrated nitric add. Mix,
3. 1:1 HCL: Using a 250 ml volumetric cylinder, add 250 ml M1111-Qwater. Cautiously add, 250 ml concentrated hydrochloric add.Mix.
Notes:
1. Arsenic and selenium by the AA-furnace techniques follow thisdigestion procedure and nickel nitrate Is added prior to analysis.
2. Mercury by the AA-Cold Vapor technique has a separate digestionprocedure.
3. All blanks, duplicates and spikes must be carried through thedigestion procedure along with a digestion check standard.
4. If elevated levels are expected, Increase the spike concentrationaccordingly.
Procedure:
A. Digestion for Flame Work and Furnace Analysis of Antimony:
1. All glassware used must be add rinsed with 1:1 nitric priorto use.
2. Pulverize and thoroughly mix the sample.
3. Weigh out approximately 1.000 g - 1.500 g of the sample Intoa 250 ml beaker on analytical balance. Record the weightof the sample used on the digestion sheet.
4. Add 10 ml of 1:1 HN03* Mix and cover with a watchglass.Place samples on the hot plate and heat at medium heat (95* C).Reflux for 10 minutes.
5. Take sample off hot plate and allow to cool. Add 5 mlconcentrated HN03. Return to hot plate and reflux for 30minutes*
6. Cool. Add 2 ml M1111-Q water and 3 ml 30$ H202.
7. Heat until effervesence subsides. Cool.
8. Continue the addition of 302 H202 in 1 ml aliquots withwarming until the effervesence 1s minimal or appearanceof sample Is unchanged. DO NOT add more than a total of10 ml 30% H202.
SOILDIGC-2

9. Cool. Add 5 ml 1:1 HCL and 10 mL M1111-Q water.
10. Cover and heat for 10 minutes.
11. Cool. Quantitatively transfer to 100 mL volumetric flaskswhile filtering through a Whatman #42 filter to removesediment. Rinse beaker and filter paper 3 times and diluteto 100 ml with M1111-Q water. The final add concentration1s approximately 2.51 HCL and 5.OX HN03. Dilute the dlgestate1:1 with deIonized water. (200 ml final volume.)
B. Digestion for Furnace Work, except for Antimony:
1. Follow the digestion procedure above for flame work throughStep 8.
2. Continue to heat until the volume 1s reduced to approximately2 nL. (Watch closely; bumping and spattering may occur.)t
3. Cool. Add 10 ml M1111-Q water and warm on hot plate.
4. Cool. Quantitatively transfer to 100 nL volumetric flaskswhile filtering through a Whatman f42 filter to removesediment. Rinse the beakers and filter paper 3 times anddilute to 100 ml with M1111-Q water. The final acidconcentration 1s approximately 2.OS HN03. Dilute thedlgestate 1:1 with de Ionized water (200 mL final volume).
Quality Control;
1. Refer to each specific metal SOP for quality control requirements.
2. If a digested spike 1s diluted out of the working concentration(too low to detect) run a manual spike. The data Is acceptable 1fthe manual spike 1s within acceptable ranges. If the manual spikeIs outside the QC ranges, the sample and spike must be re-digested.
Revision Date
y~«^xju'r\AMichael J. LinskensLaboratory Manager
Kirn D. FlnnerAnalytical Laboratory QA/QC Officer
Lawrence D. AndersenVice President, Technical Services
[AL-1-26] SOILDIGC-3

TOTAL MERCURYLiquid Samples
Scope and Application; This method 1s applicable to drinking, surface,groundwater, domestic, and Industrial wastewaters.
Method: Manual Cold Vapor
Reference: ERA 1983. Method 245.1
Detection Limits: 0.0002 mg/L (1n 100 mL sample)
Optimum Range; 0.0002-0.010 mg/L
Sample Handling: Preserve with concentrated HN03 to pH <2. Analyze within28 days of sampling.
Reagents and Apparatus:
1. Mercury cold-vapor Analyzer System2. Water bath set 9 95*C3. BOD bottles; 300 mL4. Class A volumetric glassware5. Instra-Analyzed sulfurfc add6. I nstra-Analyzed nitric add7. Potassium persulfate8. Potassium permanganate9. Sodium chloride
10 Hydroxylanrfne hydrochlorlde solution11. Stannous chloride12. Various Class A volumetric pipettes13. Mercury lamp14. Mercury stock and standard solutions15. DrfeHte16. Activated charcoal17. Glass wool18. Tygon tubing
Reagent Preparation; (Prepare fresh every 6 months, unless otherwise noted.)
1. Sulfurlc add (0.5 N): P1pet 14.0 mL of cone. H2S04 to 500 mLM1111-Q water In a 1 liter volumetric flask, dilute to the mark.PREPARE IN THE HOODi
2. Stannous chloride (10* w/v); Add 100.0 g stannous chloride to 1 literof 0.5N sulfurfc acid.
3. Sodium chloHde-hydrpxylamlne hydrochlortde solution: Dissolve120.0 g of sodium chloride and 120.0 g of hydroxylamine hydrochlorlde1n M1111-Q water, dilute to 1 liter.
HG2-1

4. Potassium permanganate (5% solution, w/v) : Dissolve 50.0 g of potassiumpermanganate 1n M1111-Q water, dilute to 1 liter.
5. Potassium per sul fate (51 solution, w/v): Dissolve 50.0 g of potassiumpersulfate In M1111-Q water, dilute to 1 liter.
6. Intermediate mercury standard (10.0 mq/L); Transfer 1.0 mL stock mercury(1000 mg/L) solution, plus 1/2 ml nitric acid. Into a 100 ml volumetricflask and dilute to the mark with M1111-Q water. Prepare fresh dally!
7. Working mercury standard (0.100 mq/L): Transfer 1.0 mL of the 10.0 mg/LIntermediate standard, plus 1/2 mL nitric add, Into a 100 ml volumetricflask and dilute to the mark with M1111-Q water. Prepare fresh dally!
The mercury standards are volatile and unstable. Standards must beprepared dally.
2. Because of the toxic nature of mercury vapor, precaution must betaken to avoid Inhalation. Vent the mercury vapor Into anexhaust hood or pass the vapor through an absorbing media.
3. A lOt solution of stannous sulfate may be substltued for s tan nouschloride
4. Hydroxylamlne sulfate may be used rather than hydroxylamlnehydrochlorlde
5. Standard additions must be used for all EP extracts and dellstlngpetitions.
6. The calibration check standard 1s a 0.005 mg/L standard.
7. Interferences:
a. Potassium permanganate 1s added to eliminate Interferences fromsulfide. Concentrations as high as 20 mg/L sulfide as sodiumsulflde do not Interfere.
b. Copper has also been reported to interfere; however, copperconcentrations as high as 10 mg/L have no effect on recovery ofmercury from spiked samples.
c. Seawaters, brines, and industrial effluents, high in chlorides,will require additional potassium permanganate. During theoxidation step, chlorides are converted to free chlorinewhich also absorbs at the same wavelength as mercury. Caremust be taken to ensure that free chlorine is absent beforethe mercury 1s reduced and swept into the cell. This may beaccomplished by using an excess of hydroxylamine chloridereagent. In addition, the dead air space in the BOD bottlemust be purged before adding the stannous sulfate.
HG2-2
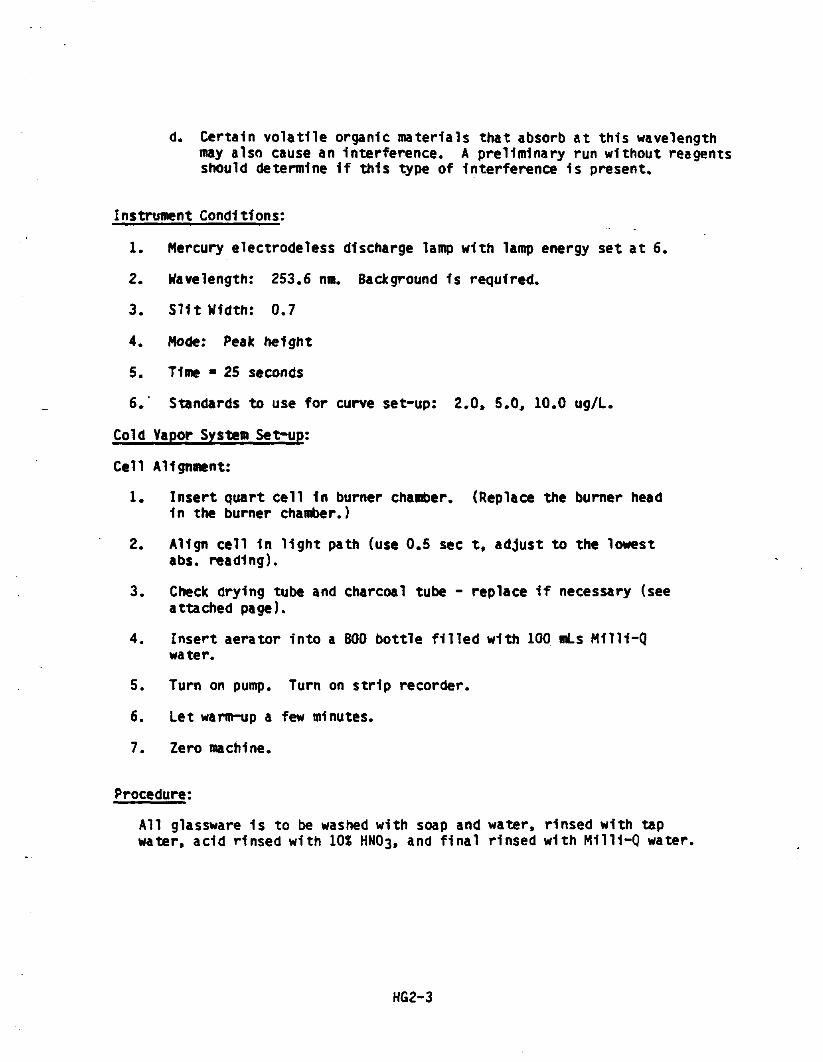
d. Certain volatile organic materials that absorb at this wavelengthmay also cause an interference* A preliminary run without reagentsshould determine If this type of Interference is present,
Instrument Conditions:
1. Mercury electrodeless discharge lamp with lamp energy set at 6.
2. Wavelength: 253.6 nm. Background 1s required.
3. SUt Width: 0.7
4. Mode: Peak height
5. Time « 25 seconds
6.' Standards to use for curve set-up: 2.0, 5.0, 10.0 ug/L.
Cold Vapor System Set-up:
Cell Alignment:
1. Insert quart cell In burner chamber. (Replace the burner head1n the burner chamber.)
2. Align cell 1n light path (use 0.5 sec tt adjust to the lowestabs. reading).
3. Check drying tube and charcoal tube - replace 1f necessary (seeattached page)*
4. Insert aerator into a BOD bottle filled with 100 mis M1111-Qwater.
5. Turn on pump. Turn on strip recorder.
6. Let warm-up a few minutes.
7. Zero machine.
Procedure:
All glassware is to be washed with soap and water, rinsed with tapwater, add rinsed with 10Z HM03, and final rinsed with M1111-Q water.
HG2-3

A, Standard Preparation
1. The standard curve 1s to consist of the following standards:
StandardConcentration
0.00 ug/L2.00 ug/L5.00 ug/L10.0 ug/L
The standards do not have to be carried through the digestionprocedure.
2. P1pet 0, 2.0, 5.0, and 10.0 ml a11quots of 0.10 ug/raL workingstock mercury solution to 300 mL BOD bottles.
3. Add M1111-Q water to bring volume to 100 mL.
4. Add 5 mL cone, sulfurlc acid and 2.5 mL cone, nitric add toeach bottle. Mix by swirling.
5. Add 15 mL potassium permanganate solution to each bottle, mixby swirling. Allow to stand for at least 15 minutes. If thebottle does not remain purple 1n color, additional potassiumpermanganate Is required.
6. Add 8 mL of potassium persulfate solution to each bottle andlet stand for 2 hours. Check the bottles periodically throughoutthe 2 hours to Insure the standards remain purple. Add potassiumpermanganate 1f needed.
7. Add 6 mL of sodium chlor1de-hydroxylam1ne hydrochlorlde solutionto reduce the excess permanganate. If necessary, additionalamounts of sodium chloride hydroxylamlne hydrochlorlde may berequired to discharge the purple color.
8. Proceed to sample analysis Step C.
B. Sample Preparation;
1. Transfer 100 mL, or an aliquot diluted to 100 mL, to a 300 mLBOD bottle.
To Spike: Pipette 5.0 mL of 0.10 mg/L standard into the samplebottle. Proceed as written.
2. Add 5 mL cone, sulfuric add and 2.5 mL cone, nitric acid toeach bottle. Mix by swirling.
HG2-4

3. Add 15 ml potassium permanganate solution to each bottle, mixby swirling. Allow to stand for at least 15 minutes. If thebottle does not remain purple 1n color, additional potassiumpermanganate is required.
4. Add 8 ml of potassium persulfate solution to each bottle andheat for 2 hours in a water bath maintained at 95*0. Checkthe bottles periodically throughout the 2 hours to Insure thesamples remain purple. Add potassium permanganate 1f needed.
5. Cool to room temperature.
C» Sample Analysis:
1. Add 6 ml of sodium chloride-hydroxylamine hydrochlorldesolution to reduce excess permanganate. If necessary,additional amounts of sodium chloride hydroxylamine hydrochlorldemay be required to discharge the purple color. Swirl.
2. Add 5 ml of stannous chloride solution and Immediately insertthe aerator, making sure that the stopper provides a goodseal.
3. Press the read button.
4. Record the absorbance value on the bench sheet.
5. Remove the aerator, rinse aerator, and place It 1n theM1111-Q blank bottle.
6. Allow strip recorder to return to baseline.
7. Repeat for additional samples.
Quality Control:
Establish a standard curve with the standards listed above plus ablank. Record the absorbance check standard in the absorbancecheck book. The absorbances should remain consistent from run torun. If not, necessary troubleshooting must be performed beforecontinuing (check wavelength, tubing, lamp alignment, pump, etc.)
A quality control calibration standard of 0.005 mg/L 1s to beanalyzed Initially, and after every 10 samples. This standardIs to be carried through the digestion procedure. If less than 10samples are analyzed, a calibration standard 1s still required.The last sample must be within acceptable ranges or the samplesrun after the last acceptable calibration standard are to bereanalyzed. Record the calibration standard in the qualitycontrol book. The confidence limits are noted in the qualitycontrol book.
HG2-5

3. A reagent blank 1s to be carried through the digestion procedureand analyzed with every set of samples as a check for contamination.
4. Duplicate and spike a minimum of 1 out of 10 samples. If less than10 samples are analyzed, a duplicate and spike are still required.Duplicates are to be averaged. Spike recoveries and duplicate resultsare to be within acceptable ranges or the use of matrix modifiers,dilution, or method of standard additions 1s to be applied to reducethe Interferences.
Calculation:
1. Average the standard readings, subtract the absorbance of theblank standard from all readings.
2. Calculate using linear regression
Calculate the spike recovery as follows:
% Recovery * ug (spike) * ug (sample)0.5 ug
Revision Date
7-24-86Michael J. LlnskensLaboratory Manager 5-21-87
Flnnercal Laborartocy QA/QC Officer^-t-c
Lawrence D. AndersenVice President, Technical Services
[KAW-5-9] HG2-6

MERCURY MANUAL COLD VAPOR TECHNIQUE
Solid and Semi-Solid Samples
Scope and Application; This procedure 1s applicable for determining totalmercury (organic. Inorganic) 1n soils, sediments, andsludge-type samples. All samples must be subjectedto a digestion step prior to analysis.
Method: Mercury - Cold Vapor
Reference: EPA, 1983, Method 245.5
SW846, 1982, Method 7471
Detection Limit: 0.05 mg/kg (1f 1 gm sample allquots are used)
Sample Handling: Due to the extreme sensitivity of this procedure, samplingdevices and containers should be free from mercury* Soilsare analyzed as received. The sample should be crushed andthoroughly mixed before the sample 1s weighed for analysis.
Reagents and Apparatus: (All glassware 1s add washed and rinsed three timeswith M1111-Q water.) Use M1111-0 water only.
1. Mercury cold-vapor analyzer system2. Mercury lamp3. Instra-Analyzed nitric add4. Instra-Analyzed hydrochloric add5. Mercury stock and standard solutions6. Class A volumetric glassware7. Mill1-0 Hater8. Water bath set at 95*C9. 300 ml BOD bottles
10. Instra-Analyzed sulfuHc add11. Stannous chloride12. Sodium chloride13. Hydroxylamlne hydrochlorlde14. Potassium permanganate15. Drier! te16. Activated charcoal17. Glass wool18. Tygon tubing
Reagent Preparation; (Prepare fresh every 6 months, unless otherwise stated.)
1. Aqua - Regla: PREPARE IMMEDIATELY before use! PREPARE IN THE HOOD!3 volumes cone. HC1 + 1 volume cone. HN03
2- 0.5N HoSOA - Dilute 14.0 ml of cone. H2S04 to 1 liter with M1111-Q water.PREPARE IN THE HOOD!
HGAQR2-1

MERCURY MANUAL COLD VAPOR TECHNIQUE
Solid and Semi-Solid Samples
Scope and Application; This procedure 1s applicable for determining totalmercury (organic, inorganic) 1n soils, sediments, andsludge-type samples. All samples must be subjectedto a digestion step prior to analysis.
Method; Mercury - Cold Vapor
Reference; EPA. 1983, Method 245.5
SW846, 1982, Method 7471
Detection Limit; 0.05 mg/kg (if 1 gm sample aliquots are used)
Sample Handling; Due to the extreme sensitivity of this procedure, samplingdevices and containers should be free from mercury. Soilsare analyzed as received. The sample should be crushed andthoroughly mixed before the sample 1s weighed for analysis.
Reagents and Apparatus: (All glassware is acid washed and rinsed three timeswith M1111-Q water.) Use M1111-Q water only.
1. Mercury cold-vapor analyzer system --•>-, «2. Mercury lamp3. Instra-Analyzed nitric acid4. Instra-Analyzed hydrochloric add5. Mercury stock and standard solutions6. Class A volumetric glassware7. M1111-Q Water8. Water bath set at 95*C9. 300 ml BOO bottles
10. Instra-Analyzed sulfuric acid11. Stannous chloride12. Sodium chloride13. Hydroxylamine hydrochloride14. Potassium permanganate15. Orierlte16. Activated charcoal17. Glass wool18. Tygon tubing
Reagent Preparation; (Prepare fresh every 6 months, unless otherwise stated.)
1. Aqua - Regia; PREPARE IMMEDIATELY before use! PREPARE IN THE HOODJ3 volumes cone. HC1 + 1 volume cone. HN03
2. Q.5N HpSOa - Dilute 14.0 ml of cone. H2S04 *° * liter w1th M1111-Q water,PREPARE IB THE HOOD!
HGAQR2-1

3. Stannous chloride: Add 100.0 g stannous chloride to 1 L of 0.5N
4. Sodium chloride - hydroxylamine hydrochloride solution: Dissolve120.0 grams NaCl + 120.6 grams hydroxylamine hydrochlorlde in approximately100 nt M1111-Q water, dilute to 1 liter with M1111-Q water.
5. Potassium permanganate 51 solution; Dissolve 50.0 g potassium permanganatein M1111-Q water and dilute to 1 liter with M1111-Q water.
6. Intermediate mercury standard (10.0 mg/L); Transfer 1 mL stock mercury(1000 mg/L) solution, plus 1/2 mL concentrated nitric acid, into a100 ml volumetric flask and dilute to the mark with M1111-Q water.Prepare fresh daily!
7. Working mercury standard (0.100 mg/L): Transfer 10 ml of the 10.0 mg/Lintermediate standard, plus 1/2 rat concentrated nitric acid, Into a100 mL volumetric flask and dilute to the mark with M1111-Q water.Prepare fresh daily!
Notes:
1. Mercury is volatile and unstable; therefore intermediate and workingstandards must be prepared daily*
2. Because of the toxic nature of mercury vapor, precaution must betaken to avoid inhalation. Vent the mercury vapor into an exhausthood or pass the vapor through an absorbing media.
3. Rinse aerator off between samples and allow the meter to return tozero absorbance* When rinsing, be careful not to rinse too highon the aerator, otherwise the pump will suck the water Into theanalyzer.
4. A 102 solution of stannous sulfate maybe substituted for stannouschloride.
5. Hydroxylamine sulfate may be used rather than hydroxylaminehydrochlorlde.
6. A reagent blank 1s to be carried through the digestion procedureand analyzed with every set of samples as a check for contamination.
7. Interferences:
A. Potassium permanganate 1s added to eliminate possible Interferencefrom sulfide. Concentrations as high as 20 mg/L sulfide as sodiumsulfide do not Interfere.
HGAQR2-2

B. Copper has also been reported to Interfere; however, copperconcentrations as high as 10 mg/L have no effect on recovery ofmercury from spiked samples.
C. Seawaters, brines, and Industrial effluents high 1n chloridesrequire additional potassium permanganate. During theoxidation step, chlorides are converted to free chlorinewhich also absorbs at the same wavelength as mercury. Caremust be taken to ensure that free chlorine 1s absent beforethe mercury 1s reduced and swept Into the cell. This may beaccomplished by using an excess of hydroxylanrfne sulfatereagent. In addition, the dead air space 1n the BOD bottlemust be purged before adding stannous sulfate*
D. Certain volatile organic materials that absorb at this wavelengthmay also cause an Interference. A preliminary run without reagentsshould determine 1f this type of Interference Is present.
Instrument Conditions:
1. Mercury electrodeless discharge lamp with lamp energy set at 6.
2. Wavelength: 253.6 nnu Background 1s required.
3. Slit Width: 0.7
4. Mode: Peak height
5. Time » 25 seconds
6. Standards to use for curve set-up: 2.0, 5.0, 10.0 ug/L.
Cold Vapor System Set-up:
Cell Alignment:
1. Insert quart cell 1n burner chamber. (Replace the burnerhead in the burner chamber*}
2. Align cell 1n light path (use 0.5 sec t, adjust to the lowestabs. reading).
3. Check drying tube and charcoal tube - replace 1f necessary(see attached page).
4. Insert aerator Into a BOO bottle filled with 100 mis M1111-Qwater.
5. Turn on pump. Turn on strip recorder.
6. Let warm-up a few minutes.
7. Zero machine.
HGAQR2-3
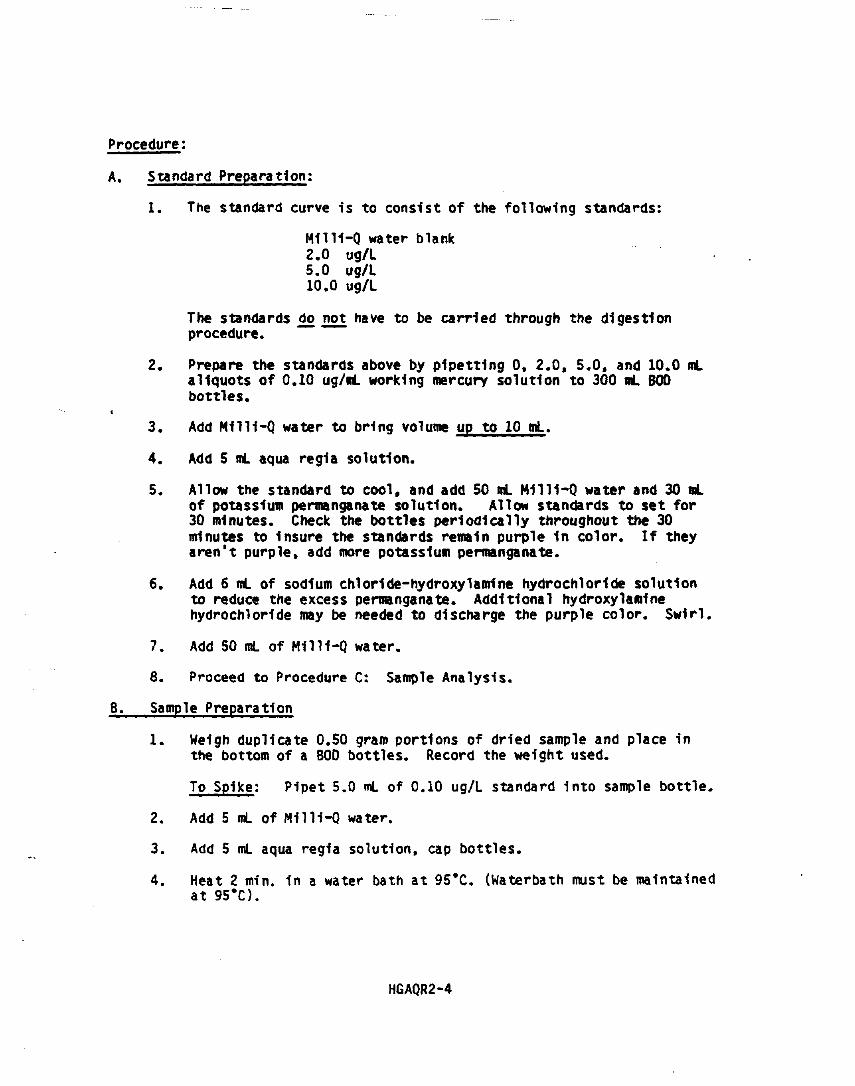
Procedure:
A, Standard Preparation:
1. The standard curve is to consist of the following standards:
M1TI1-Q water blank2.0 ug/L5.0 ug/L10.0 ug/L
The standards do not have to be carried through the digestionprocedure.
2. Prepare the standards above by pipetting 0, 2.0, 5.0, and 10.0 mlaliquots of 0.10 ug/nL working mercury solution to 300 nL BODbottles.
3. Add Mill1-Q water to bring volume up to 10 ml.
4. Add 5 ml aqua regia solution.
5. Allow the standard to cool, and add 50 mL M1111-Q water and 30 mLof potassium permanganate solution. Allow standards to set for30 minutes. Check the bottles periodically throughout the 30minutes to Insure the standards remain purple 1n color. If theyaren't purple, add more potassium permanganate.
6. Add 6 mL of sodium chloHde-hydroxylamlne hydrochlorlde solutionto reduce the excess permanganate. Additional hydroxylamlnehydrochlorfde may be needed to discharge the purple color. Swirl.
7. Add 50 mL of M1111-Q water.
8. Proceed to Procedure C: Sample Analysis.
B. Sample Preparation
1. Weigh duplicate 0.50 gram portions of dried sample and place inthe bottom of a BOD bottles. Record the weight used.
To Spike: Pipet 5.0 mL of 0.10 ug/L standard Into sample bottle.
2. Add 5 mL of Milli-Q water,
3. Add 5 mL aqua regia solution, cap bottles.
4. Heat 2 min. 1n a water bath at 95*C. (Waterbath must be maintainedat 95*C).
HGAQR2-4

5. Cool, add 50 nt MilH-Q water.
6. Add 15 ml potassium permanganate solution.
7. Mix thoroughly and place 1n a water bath at 95*C for 30 minutes.Check samples periodically throughout the 30 minutes to Insurethey are purple 1n color. If not. add potassium permanganate.
8. Cool samples and standards to room temperature.
9. Add 50 ml of M1111-Q water.
10. Proceed to Procedure C: Sample Analysis.
C. Sample Analysis:
1. Add 6 ml sodium chlorlde-hydroxylaralne hydrochlorlde to reducethe excess permanganate. Additional sodium chlorlde-hydroxylamlnehydrochlorlde may be needed to discharge the purple color. Swirl.
2. Add 5 ml of stannous chloride solution and Immediately Insert theaerator, making sure that the stopper provides a good seal.
3. Press the read button.
4. Record the absorbance reading.
5. Remove the aerator, rinse aerator, and place Into the M1111-Qblank bottle.
6. Allow the strip recorder to return baseline,
7. Repeat for additional samples.
Quality Control:
1. Establish a standard curve with the standards listed above plus ablank. Record the absorbance check standard in the absorbancecheck book. The aborbances should remain consistent from run torun. If not, necessary troubleshooting must be performed beforecontinuing (check wavelength, tubing, lamp alignment, pump, etc.,)
2. A quality control calibration standard of 0.005 mg/L Is to beanalyzed initially, and after every 10 samples. If less than 10samples are analyzed, a calibration standard 1s still required.The last sample analyzed in the run is to be the calibration standard.These standards must be within acceptable ranges or the samplesrun after the last acceptable calibration standard are to be reanalyzed.Record the calibration standard in the quality control book. Theconfidence limits are noted in the quality control book.
HGAQR2-5
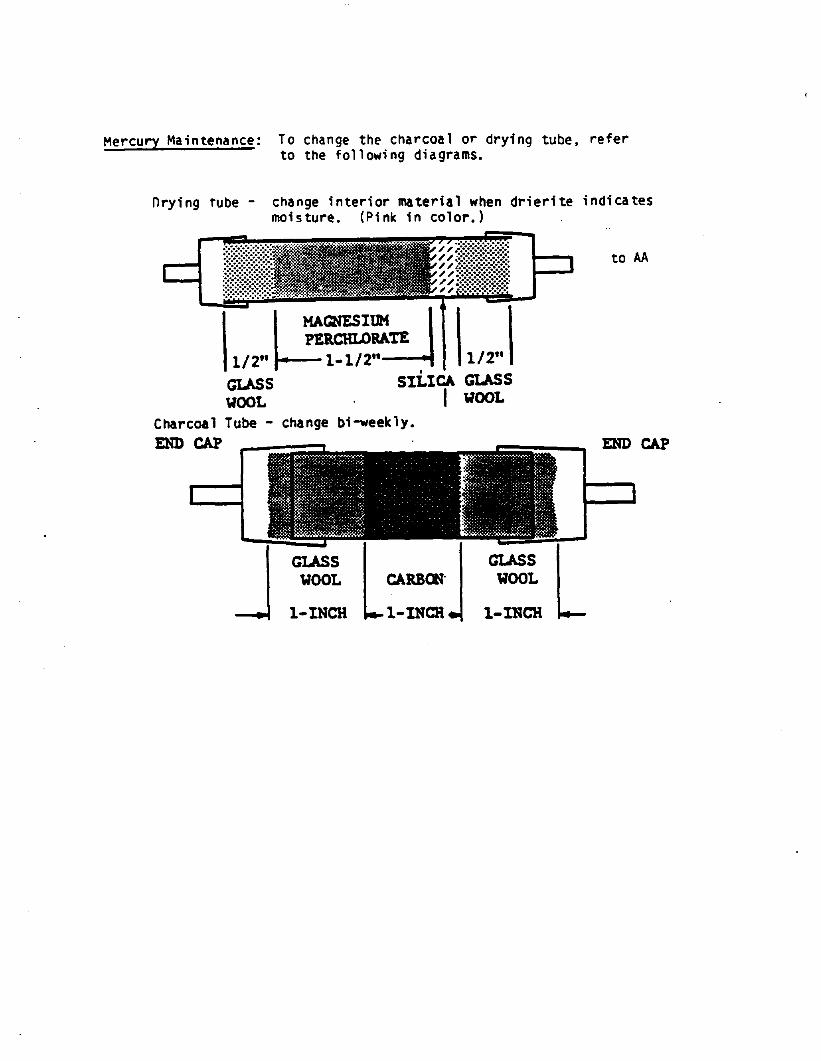
Mercury Maintenance: To change the charcoal or drying tube, referto the following diagrams.
Drying rube - change interior material when drierite indicatesmoisture. (Pink in color.)
to AA
MAGNESIUMPERCHLORATE
1/2" -——1-1/2"———• 1/2"GLASS SILICA GLASSWOOL I WOOL
Charcoal Tube - change bi-weekly.END CAP
CARBON
1-INCH*.
END CAP
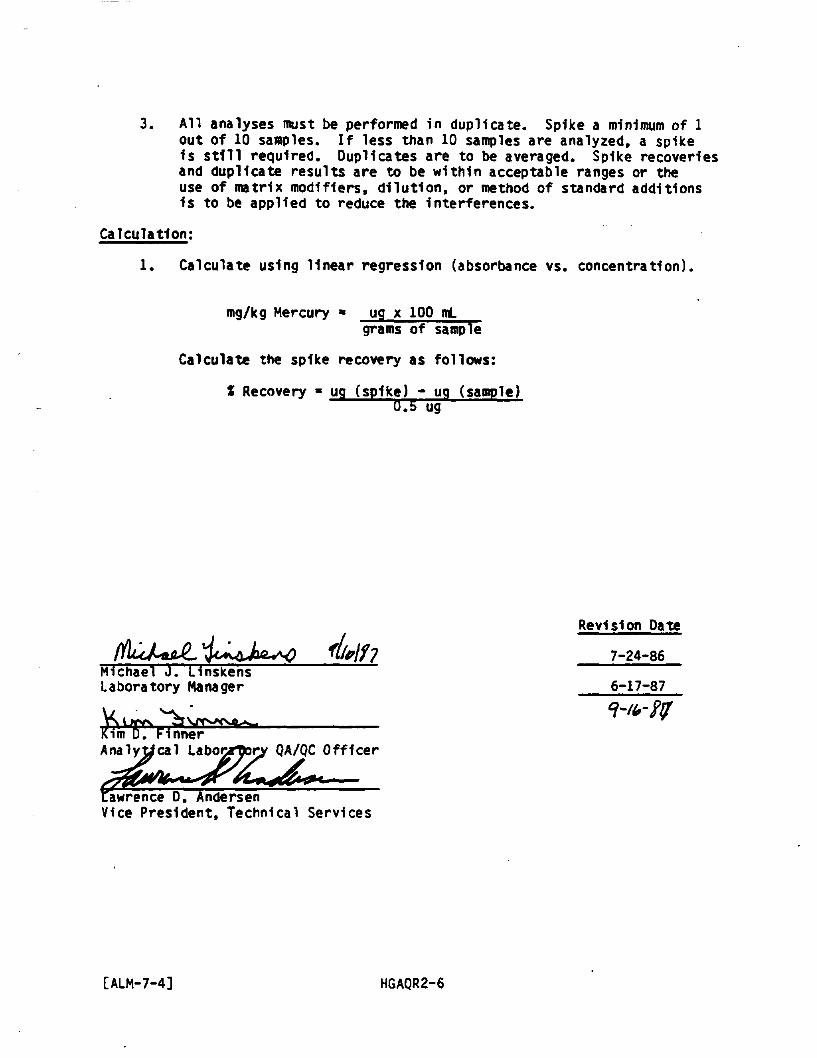
All analyses must be performed in duplicate. Spike a minimum of 1out of 10 samples. If less than 10 samples are analyzed, a spike1s still required. Duplicates are to be averaged. Spike recoveriesand duplicate results are to be within acceptable ranges or theuse of matrix modifiers, dilution, or method of standard additionsis to be applied to reduce the Interferences.
Calculation:
1. Calculate using linear regression (absorbance vs. concentration).
mg/kg Mercury « ug x 100 mlgrams of sample
Calculate the spike recovery as follows:
I Recovery « ug (spike) * ug (sample)0.5 ug
Revision Date
7-24-86Michael J. LinskensLaboratory Manager 6-17-87
,r\ijrfKirn D. FinnerAnalytical Labonrtor> QA/QC Officer^.awrence D. AndersenVice President, Technical Services
[ALM-7-4] HGAQR2-6

ANTIMONY
Method; AA - Flame; Direct Aspiration
Reference; EPA 1983, Method 204.1
"Analytical Methods for Atomic Absorption Spectrophotornetry",1982, Perkln-Elmer Corporation
Detection Limit; 0,50 mg/L
Optimum Concentration Range; 0.50 - 20.0 mg/L
Sample Handling; Acidify with nitric add to pH < 2. Drinking waters andfiltered groundwater free of participate matter andorganlcs may be analyzed directly, while wastewaters,leachates, sol Ids, etc. must be digested prior to analysis(refer to appropriate digestion procedures). Analyzewithin 6 months.
Instrument Conditions;
1. Antimony electrodeless discharge lamp with lamp energy set at 7.
2. Wavelength; 217.6 nm
3. Silt Width; 0.2 Normal
4. Fuel; Acetylene
5. Oxldant: A1r
6. Type of flame: Oxidizing, lean, blue
7. Standards to use for curve set-up: 2.00, 5.00, 10.0, 20.0 mg/L.
Reagent Preparation; (Prepare fresh every 6 months unless otherwise noted.)
1. Standard Antimony Solution (100 mg/L Antimony): P1pet 10 mL of the1000 ppm stock antimony solution Into a 100 mL volumetric flask,add 1/2 ml HN03, and dilute to the nark with M1111-Q water.
2. Standards (Prepare fresh every month.):
Concentrationof Standard
2.00 mg/L5.00 mg/L10.0 mg/L20.0 mg/L
Volume ofAntimony Standard
2 ml of 100 mg/L Sb5 mL of 100 mg/L Sb10 mL of 100 mg/L Sb20 mL of 100 mg/L Sb
Diluteto
100 mL100 mL100 mL100 mL
SbFlC-1

Notes:
1.
2. Standards are to be prepared 1n the same add concentrations as thesamples being analyzed*
3. The use of background correction 1s required.
4. This flame procedure can be used for digested samples, EP Toxldtysamples or any other samples where high concentrations of antimonyare expected and low detection limits are not required.
5. Lead, 1n concentrations of >100 mg/L. may Interfere. Use analternate wavelength of 231.1 na 1n this situation.
Procedure: For the analysis procedure, refer to the Atomic AbsorptionSpectrometry, Flame - Direct Aspiration section of this manual.
If antimony 1s to be analyzed 1n concentration mode, use the10.0 and 20.0 standards for standardization and follow theprocedure for analyzing 1n the concentration mode.
Quality Control:
1. Establish a standard curve with the standards listed above plusa blank. Record the absorbance check standard 1n the absorbancecheck book. The absorbances should remain consistent from runto run. If not, necessary troubleshooting must be performedbefore continuing (check wavelength, flame head alignment, lampalignment, etc.).
2. A quality control calibration standard of 5.00 mg/L 1s to beanalyzed, at a minimum, after every 10 samples. If less than 10samples are analyzed, a calibration standard 1s still required.The last sample analyzed 1n the run 1s to be the calibration standard.These standards must be within acceptable ranges or the samples runafter the last acceptable check standard are to be reanalyzed.Record the calibration standards 1n the quality control book. Theconfidence limits are noted In the quality control book.
3. Duplicate and spike a minimum of 1 out of 10 samples. If less than10 samples are analyzed, a duplicate and spike are still required.Duplicates are to be averaged. Spike samples with a standard oftwice the concentration of the sample 1n a 1:1 ratio of sample tostandard. Spike recoveries and duplicates are to be within acceptableranges or the use of dilution or method of standard additions Isto be applied to reduce the interferences.
SbFlC-2
Calculations:
1.
2. Calculate using linear regression, or
3. Calculate using concentration mode.
[ALM-8-8] SbFlC-3
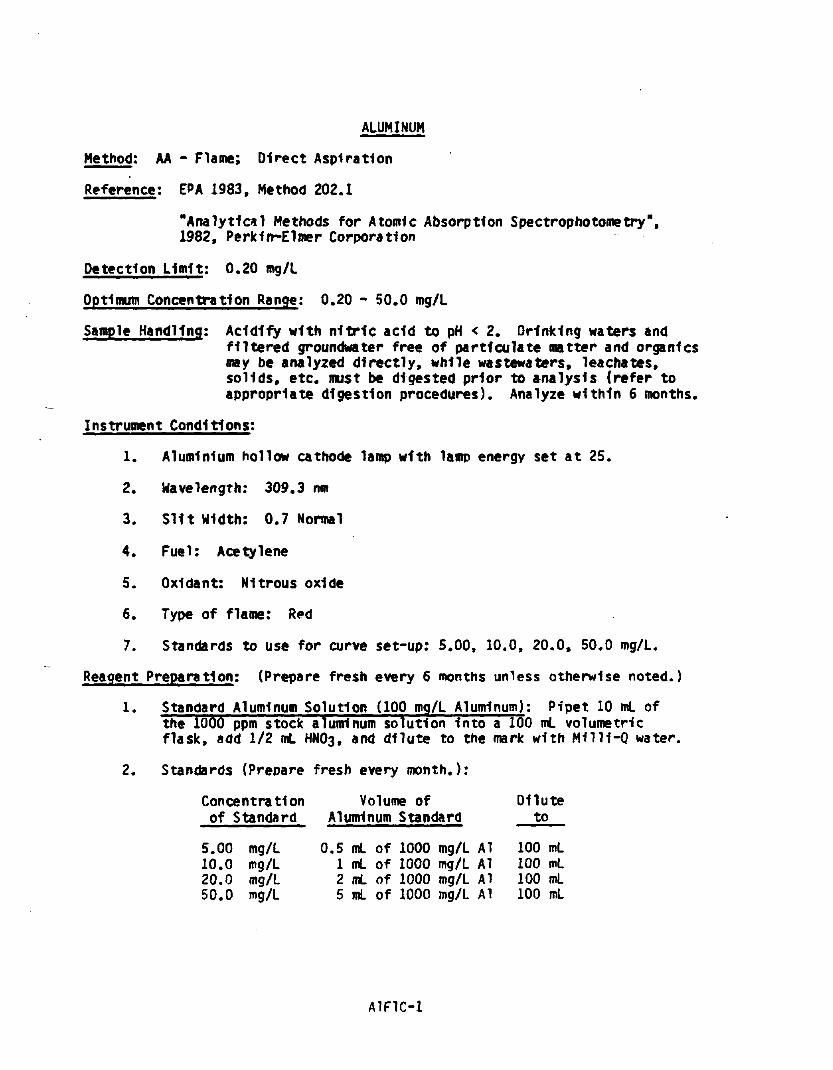
ALUMINUM
Method: AA - Flame; Direct Aspiration
Reference; EPA 1983, Method 202.1
"Analytical Methods for Atomic Absorption Spectrophotometry",1982, Perk1n-E1mer Corporation
Detection Limit: 0.20 mg/L
Optimum Concentration Range: 0.20 - 50.0 mg/L
Sample Handling: Acidify with nitric add to pH < 2. Drinking waters andfiltered groundwater free of participate matter and organlcsmay be analyzed directly, while wastewaters, leachates,solids, etc. must be digested prior to analysis (refer toappropriate digestion procedures). Analyze within 6 months.
Instrument Conditions;
1. Aluminium hollow cathode lamp with lamp energy set at 25.
2. Wavelength: 309.3 nm
3. Slit Width: 0.7 Normal
4. Fuel: Acetylene
5. Oxldant: Nitrous oxide
6. Type of flame: Red
7. Standards to use for curve set-up: 5.00, 10.0, 20.0, 50.0 mg/L.
Reagent Preparation: (Prepare fresh every 6 months unless otherwise noted.)
1. Standard Aluminum Solution (100 mg/L Aluminum): Pipet 10 mL ofthe 1000 ppm stock aluminum solution Into a 100 mL volumetricflask, add 1/2 mL HN03, and dilute to the mark with M1111-Q water.
2. Standards (Prepare fresh every month.):
Concentrationof Standard
5.102050
00.0.0.0
mg/Lmg/Lmg/Lmg/L
Volume ofAluminum
0.5125
mLmLmLmL
ofofofof
Standard
1000100010001000
mg/Lmg/Lmg/Lmg/L
AlAlAlAT
Diluteto
100100100100
mLmLmLmL
A1F1C-1

3. Potassium Chloride Solution: In a 1 liter volumetric flask,dissolve 95g KCL in M1111-Q water and dilute to the mark.
Samples must be diluted to obtain concentrations within the optimumconcentration range.
2-.
3.
4.
The use of background correction 1s required.
Aluminum 1s partially Ionized 1n the nitrous oxide-acetylene flame.This problem can be controlled by the addition of potassium. Add2 ml of 1000 ppm potassium to 100 ni. samples* blanks and standards.
Procedure: For the analysis procedure, refer to the Atomic AbsorptionSpectrom&try, Flame - Direct Aspiration section of this manual.
If aluminum 1s to be run in concentration mode, use the 10.0 and50.0 mg/L aluminum standards for standardization and follow theprocedure for analyzing 1n concentration mode.
To 10 nl of samples, blanks and standards, add 0.2 ml KCL solution.Mix and analyze.
Quality Control:
1. Establish a standard curve with the standards listed above plusa blank. Record the absorbance check standard 1n the absorbancecheck book. The absorbances should remain consistent from runto run. If not, necessary troubleshooting must be performedbefore continuing (check wavelength, flame head alignment, lampalignment, etc.).
2. A quality control calibration standard of 10.0 mg/L 1s to beanalyzed, at a minimum, after every 10 samples. If less than 10samples are analyzed, a calibration standard is still required.The last sample analyzed in the run is to be the calibrationstandard. These standards must be within the acceptable ranges orthe samples run after The last acceptable check standard are tobe reanalyzed. Record the calibration standards in the qualitycontrol book. The confidence limits are noted in the qualitycontrol book.
A1F1C-2
Duplicate and spike a minimum of 1 out of 10* samples. If less than10 samples are analyzed, a duplicate and spike are still required.Duplicates are to be averaged. Spike samples with a standard oftwice the concentration of the sample 1n a 1:1 ratio of sample tostandard. Spike recoveries and duplicates are to be within acceptableranges or the use of dilution or method of standard additions 1sto be applied to reduce the Interferences.
Calculations:
1. Plot concentration vs absorbance on graph. Determine unknowns usinggraph, or
2. Calculate using linear regression, or
3. Calculate using concentration mode.
[ALM-8-15]A1F1C-3

BARIUM
Method: AA - Flame; Direct Aspiration
Reference: EPA 1983, Method 208.1
"Analytical Methods for Atonic Absorption Spectrophotometry",1982, Perkln-Elraer Corporation
Contract Laboratory Program, "Statement of Work", July, 1985
Detection Limit; 0.20 mg/L
Optimum Concentration Range; 0.20 - 10.0 mg/L
Sample Handling: Acidify with«n1trfc add to pH < 2. Drinking waters andfiltered groundwater free of participate matter andorganlcs may be analyzed directly, while wastewaters,leachates, solids, etc. must be digested prior toanalysis (refer to appropriate digestion procedures).Analyze within 6 months.
Instrument Conditions;
1. Barium hollow cathode lamp with lamp energy set at 25.
2. Wavelength: 553.6 nm
3. Slit Width: 0.2
4. Fuel: Acetylene
5. Oxldant: Nitrous oxide
6. Type of flame: Red
7. Standards to use for curve set-up: 1.00, 2.00f 5.00, 10.0 mg/L.
Reagent Preparation: (Prepare fresh every 6 months unless otherwise noted.)
1. Standard Barium Solution (100 mg/L Barium): Pipet 10 mL of the1000 ppm stock barium solution Into a 100 mL volumetric flask,add 1/2 mL HN03 and dilute to the mark with M1111-Q water.
BaFlC-1

2. Standards (Prepare fresh every 1 month,):
Concentrationof Standard
1.00 mg/L2.00 mg/L5.00 mg/L10.0 mg/L
Volume of DiluteBarium Standard to
1 mL of 100 mg/L Ba 100 mL2 ml of 100 mg/L Ba 100 nt5 mL of 100 mg/L Ba 100 mL10 mL of 100 mg/L Ba 100 mL
3. Potassium chloride solution: In a 1 liter volumetric flask,dissolve 95g KCi in Milll-Q water and dilute to the mark.
Notes:
1. Samples must be diluted to obtain concentrations within the optimumconcentration range.
2. Standards are to be prepared in the same acid concentrations as thesamples beinq analyzed.
3. Barium is easily ionized in the nitrous oxide-acetylene flame. Thiscan be controlled by The addition of potassium. Add 2 mL of 1000 ppmpotassium to 100 mL sample and standards.
4. High calcium can cause an extremely noisy signal and high falsepositive values.
5. This flame procedure can be used for digested samples, EP Tdxidtysamples or any other samples where low detection limits are notrequired. EP Toxicity samples must be spiked to verify thatstandard additions are not required.
Procedure: For the analysis procedure, refer to the Atomic AbsorptionSpectrometry, Flame - Direct Aspiration section of this manual.
Potassium chloride solution is added as a matrix modifier tothe samples and standards at a ratio of 0.2 mL KCL to 10 ni.of sample or standard.
If barium Is to be run in concentration mode, use the 5.00 and10.0 standards and follow the procedure for analyzing 1n theconcentration mode.
Quality Control:
1. Establish a standard curve with the standards listed above plusa blank. Record the absorbance check standard in the absorbancecheck book. The absorbances should remain consistent from runto run. If not, necessary troubleshooting must be performedbefore continuing (check wavelength, flame head alignment, lampalignment, etc.).
BaFlC-2

2. A quality control calibration standard of 5.00 mg/L Is to be analyzed,at a minimum, after every 10 samples. If less than 10 samples areanalyzed, a calibration standard 1s still required. The lastsample analyzed 1n the run 1s to be the calibration standard.These standards must be within acceptable ranges or the samples runafter the last acceptable check standard are to be reanalyzed.Record the calibration standards 1n the quality control book. Theconfidence limits are noted In the quality control book.
3. Duplicate and spike a minimum of 1 out of 10 samples. If less than10 samples are analyzed, a duplicate and spike are still required.Duplicates are to be averaged. Spike samples with a standard oftwice the concentration of the sample In a 1:1 ratio of sample tostandard. Spike recoveries and duplicates are to be within acceptableranges or the use of dilution or method of standard additions Isto be applied to reduce the Interferences.
Calculations:
1. Plot concentration vs absorbance on graph. Determine unknownsusing graph, or
2. Calculate using linear regression, or
3. Calculate using concentration mode.
[ALM-10-1] BaFlC-3

BERYLLIUM
Method; AA - Flame; Direct Aspiration
Reference; ERA 1983, Method 210.1
"Analytical Methods for Atomic Absorption Spectrophotometry",1982, Perkln-Elmer Corporation
Detection Limit; 0,02 mg/L
Optimum Concentration Range: 0.02 - 2.00 mg/L
Sample Handling: Acidify with nitric add to pH < 2. Drinking waters andfiltered groundwater free of participate natter andorganlcs may be analyzed directly, while wastewaters,leachates, solids, etc. must be digested prior toanalysis (refer to appropriate digestion procedures).Analyze within 6 months.
Instrument Conditions:
1. Beryllium hollow cathode lamp with lamp energy set at 30.
2. Wavelength: 234.9 nm
3. SUt Width: 0.7 Normal
4. Fuel: Acetylene
5. Oxldant: Nitrous oxide
6. Type of flame: Red
7. Standards to use for curve set-up: 0.20, 0.50, 1.00, 2.00 mg/L.
Reagent Preparation; (Prepare fresh every 6 months unless otherwise noted.)
1. Standard Beryllium Solution (10.0 mg/L Beryllium): P1pet 10 mL ofthe 1000 ppmi stock beryllium solution Into a 1000 mL volumetricflask, add 1/2 mL HN03, and dilute to the mark with M1111-Q water.
2. Standards (Prepare fresh every month.):
Concentrationof Standard
0.20 mg/L0.50 mg/L1.00 mg/L2.00 mg/L
Volume ofBeryllium Standard
2 mL of 10.0 mg/L Be5 mL of 10.0 mg/L Be10 mL of 10.0 mg/L Be20 mL of 10.0 mg/L Be
Diluteto
100 mL100 mL100 mL100 mL
BeFlC-1
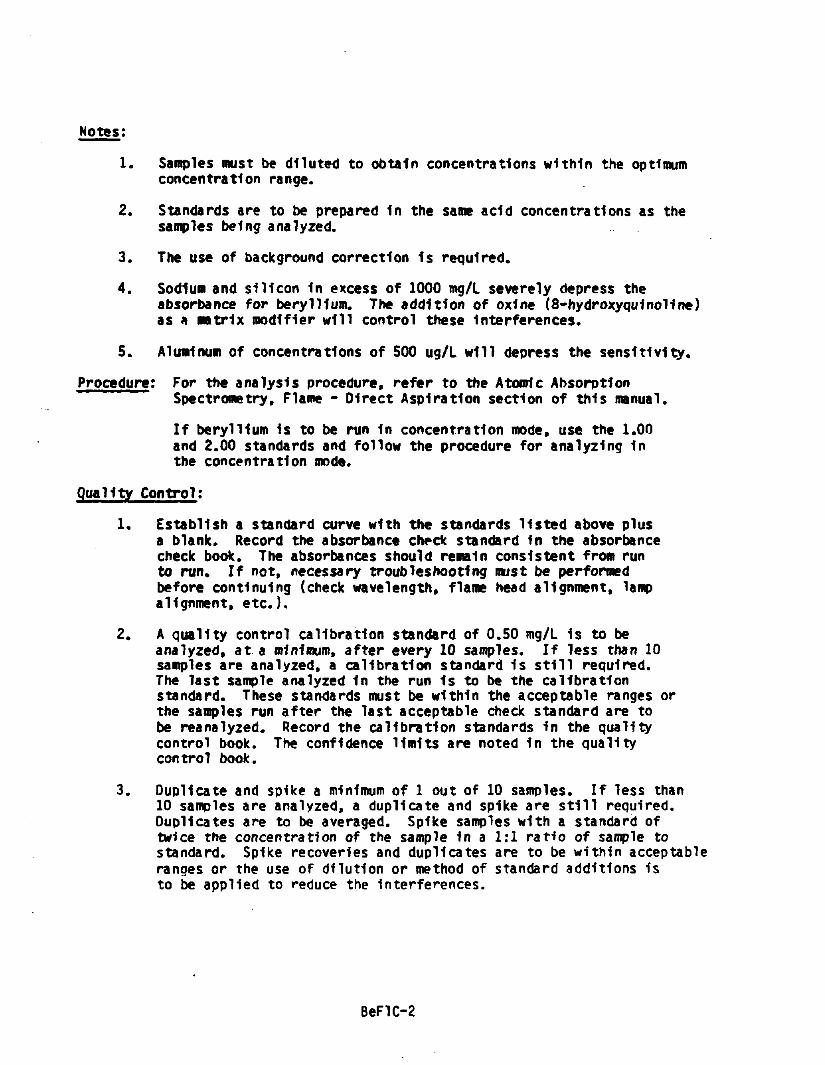
Notes;
1. Samples must be diluted to obtain concentrations within the optimumconcentration range.
2. Standards are to be prepared In the same add concentrations as thesamples being analyzed.
3. The use of background correction Is required.
4. Sodium and silicon In excess of 1000 mg/L severely depress theabsorbance for beryllium. The addition of oxlne (8-hydroxyqu1nol1ne)as a matrix modifier will control these Interferences.
5. Aluminum of concentrations of 500 ug/L will depress the sensitivity.
Procedure; For the analysis procedure, refer to the Atomic AbsorptionSpectrometry, Flame - Direct Aspiration section of this manual.
If beryllium 1s to be run In concentration mode, use the 1.00and 2.00 standards and follow the procedure for analyzing 1nthe concentration mode.
Quality Control;
1. Establish a standard curve with the standards listed above plusa blank. Record the absorbance check standard In the absorbancecheck book. The absorbances should remain consistent from runto run. If not, necessary troubleshooting must be performedbefore continuing (check wavelength, flame head alignment, lampalignment, etc.)*
2. A quality control calibration standard of 0.50 mg/L 1s to beanalyzed, at a minimum, after every 10 samples. If less than 10samples are analyzed, a calibration standard 1s still required.The last sample analyzed 1n the run 1s to be the calibrationstandard. These standards must be within the acceptable ranges orthe samples run after the last acceptable check standard are tobe reanalyzed. Record the calibration standards 1n the qualitycontrol book. The confidence limits are noted 1n the qualitycontrol book.
3. Duplicate and spike a minimum of 1 out of 10 samples. If less than10 samples are analyzed, a duplicate and spike are still required.Duplicates are to be averaged. Spike samples with a standard oftwice the concentration of the sample 1n a 1:1 ratio of sample tostandard. Spike recoveries and duplicates are to be within acceptableranges or the use of dilution or method of standard additions isto be applied to reduce the interferences.
BeFlC-2
Calculations:
1. Plot concentration vs absorbance on graph. Determine unknowns usinggraph, or
2. Calculate using linear regression.
3. Calculate using the concentration mode.
[ALM-10-2]
BeFlC-3
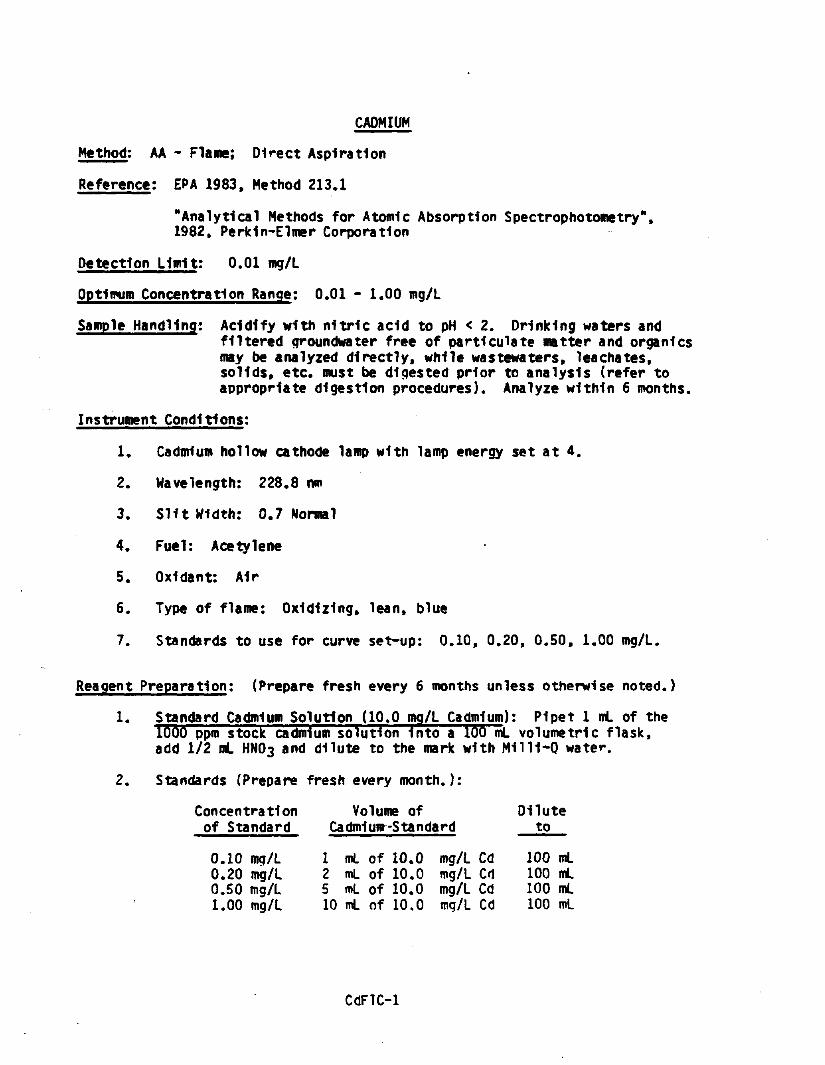
CADMIUM
Method: AA - Plane; Direct Aspiration
Reference: EPA 1983, Method 213.1
"Analytical Methods for Atomic Absorption Spectrophotometry",1982, Perkln-Elmer Corporation
Detection Limit: 0.01 mg/L
Optimum Concentration Range: 0.01 - 1.00 mg/L
Sample Handling; Acidify with nitric add to pH < 2. Drinking waters andfiltered groundwater free of participate matter and organlcsmay be analyzed directly, while wastewaters, leachates,solids, etc. must be digested prior to analysis (refer toappropriate digestion procedures). Analyze within 6 months.
Instrument Conditions:
1. Cadmium hollow cathode lamp with lamp energy set at 4.
2. Wavelength: 228.8 nm
3. SUt Width: 0.7 Normal
4. Fuel: Acetylene
5. Oxldant: A1r
6. Type of flame: Oxidizing, lean, blue
7. Standards to use for curve set-up: 0.10, 0.20, 0.50, 1.00 mg/L.
Reagent Preparation; (Prepare fresh every 6 months unless otherwise noted.)
1. Standard Cadmium Solution (10.0 mg/L Cadmium): Plpet 1 mL of the1000 ppm stock cadmium solution Into a 100 mL volumetric flask,add 1/2 mL HW>3 and dilute to the mark with M1111-Q water.
2. Standards (Prepare fresh every month.):
Concentrationof
0001
Standard
.10
.20
.50
.00
mg/Lmg/Lmg/Lmg/L
Volume of DiluteCadmium -Standard
12510
mLmLmLmL
ofofofof
10101010
.0
.0
.0
.0
mg/Lmg/Lmg/Lmq/L
CdC<1CdCd
to
100100100100
mLmLmLmL
CdFlC-1

Samples must be diluted to obtain concentrations within the optimumconcentration range.
2. Standards are to be prepared in the same acid concentrations as thesamples being analyzed.
3. The use of background correction 1s required.
4. This flame procedure can be used for digested samples, EP Toxldtysamples, or any other samples where low detection limits are notrequired. EP Toxlcfty samples must be spiked to verify that standardadditions are not required.
Procedure; For the analysis procedure, refer to the Atomic AbsorptionSpectrometry. Flame - Direct Aspiration section of this manual.
If cadmium Is to be run in the concentration mode, use the 0.50and 1.00 standards and follow the procedure for analyzing 1nconcentration mode.
Quality Control;
1. Establish a standard curve with the standards listed above plusa blank. Record the absorbance check standard In the absorbancecheck book. The absorbances should remain consistent from runto run. If not, necessary troubleshooting must be performedbefore continuing (check wavelength, flame head alignment, lampalignment, etc.).
2. A quality control calibration standard of 0.10 mg/L 1s to beanalyzed, at a minimum, after every 10 samples. If less than 10samples are analyzed, a calibration standard 1s still required.The last sample analyzed in the run 1s to be the calibration standard.These standards must be within the acceptable ranges or the samplesrun after the last acceptable check standard are to be reanalyzed.Record the calibration standards in the quality control book. Theconfidence limits are noted in the quality control book.
3. Duplicate and spike a minimum of 1 out of 10 samples. If less than10 samples are analyzed, a duplicate and spike are still required.Duplicates are to be averaged. Spike samples with a standard oftwice the concentration of the sample in a 1:1 ratio of sample tostandard. Spike recoveries and duplicates are to be withinacceptable ranges or the use of dilution or method of standardadditions is to be applied to reduce the interferences.
CdFlC-2

Calculations:
1. Plot concentration vs absorb*nee on graph. Determine unknowns usinggraph or
2. Calculate using linear regression or
3. Calculate using the concentration mode.
[ALM8-10]
CdFlC-3

CHROMIUM
Method: AA - Flame; Direct Aspiration
Reference: EPA 1983. Method 218.1
"Analytical Methods for Atomic Absorption Spectrophotometry".1982. Perkln-Elmer Corporation
Detection Limit; 0.05 rog/L
Optimum Concentration Range; 0.05 - 10.0 mg/L
Sample Handling: Acidify with nitric add to pH < 2. Drinking watersand filtered groundwater free of participate matterand organlcs may be analyzed directly, while wastewaters.leachates. solids, etc. must be digested prior to analysis(refer to appropriate digestion procedures). Analyzewithin 6 months.
Instrument Conditions;
1. Chromium hollow cathode lamp with lamp energy set at 25.
2. Wavelength: 357.9 nm
3. Slit Width: 0.7 Normal
4. Fuel: Acetylene
5. 0x1 dant: Nitrous oxide
6. Type of flame: Red
7. Standards to use for curve set-up: 1.00. 2.00, 5.00. 10.0 mg/L.
Reagent Preparation; (Prepare fresh every 6 months unless otherwise noted.)
1. Standard Chromium Solution (100 mg/L Chromium); P1pet 10 mL ofthe 1000 ppm stock chromium solution into a 100 mL volumetricflask, add 1/2 mL HNOa. and dilute to the mark with M1111-Q wat
2. Standards (Prepare fresh every month.):
Concentrationof Standard
125
10
.00
.00
.00
.00
mg/Lmg/Lmg/Lmg/L
Volume ofChromium
125
10
mLmLmLmL
ofofofof
Standard
100100100100
mg/Lmg/Lmg/Lmg/L
CrCrCrCr
Diluteto
100100100100
mLmLmLmL
CrFlC-1

Notes:
1. Samples must be diluted to obtain concentrations within the optimumconcentration range.
2. Standards are to be prepared In the same add concentrations as thesamples being analyzed.
3. This flame procedure can be used for digested samples* EP Toxldtysamples or any other samples where low detection Units are notrequired. EP Toxlclty samples must be spiked to verify thatstandard additions are not required.
Procedure; For the analysis procedure, refer to the Atomic AbsorptionSpectrometry, Flame - Direct Aspiration section of this manual.
If chromium 1s to be run 1n the concentration mode, use the 5.00and 10.00 standards and follow the procedure for analyzing 1n theconcentration mode.
Quality Control:
1. Establish a standard curve with the standards listed above plusa blank. Record the absorbance check standard in the absorbancecheck book. The absorbances should remain consistent from runto run. If not, necessary troubleshooting must be performedbefore continuing (check wavelength, flame head alignment, lampalignment, etc.).
2. A quality control calibration standard of 2.00 mg/L Is to beanalyzed, at a minimum, after every 10 samples. If less than 10samples are analyzed, a calibration standard 1s still required.The last sample analyzed in the run 1s to be the calibrationstandard. These standards must be within the acceptable ranges orthe samples run after the last acceptable check standard are tobe reanalyzed. Record the calibration standards In the qualitycontrol book. The confidence limits are noted In the qualitycontrol book.
3. Duplicate and spike a minimum of 1 out of 10 samples. If less than10 samples are analyzed, a duplicate and spike are still required.Duplicates are to be averaged. Spike samples with a standard oftwice the concentration of the sample in a 1:1 ratio of sample tostandard. Spike recoveries and duplicates are to be within acceptableranges or the use of dilution or method of standard additions isto be applied to reduce the interferences.
CrFlC-2
Calculations:
1. Plot concentration vs absorbance on graph. Determine unknowns usinggraph or
2. Calculate using linear regression or
3. Calculate using the concentration mode.
[ALM-10-3]CrFlC-3

CALCIUM \
Method: AA - Flame; Direct Aspiration v .-
Reference; EPA 1983. Method 215.1
"Analytical Methods for Atomic Absorption Spectrophotometry",1982, Perkln-Elmer Corporation
Detection Limit; 0.05 mg/L
Optimum Concentration Range; 0.05 - 25.0 mg/L
Sampling Handling; Acidify with nitric add to pH < 2. Drinking waters andfiltered groundwater free of particulate matter and organlcsmay be analyzed directly, while wastewaters, leachates,solids, etc. must be digested prior to analysis (refer toappropriate digestion procedures). Analyze within 6 months.
Instrument Conditions;
1. The Ca-Mg combination hollow cathode lamp 1s used. Set lampenergy to 25.
2. Wavelength; 422.7 mn
3. Slit Width; 0.7 Normal
4. Fuel; Acetylene
5. Oxldant: A1r
6. Type of flame; Oxidizing, lean, blue
7. Standards to use for curve set-up: 2.00, 5.00, 10.00, 25,0 mg/L.
Reagent Preparation: (Prepare fresh every 6 months unless otherwise noted.)
1. Standard Calcium Solution (100 mg/L Calcium); P1pet 10 mL of the1000 ppm stock calcium solution Into a 100 mL volumetric flask,add 1/2 ml HM03, and dilute to the mark with M1111-Q water.
2. Standards (Prepare fresh every 2 months.):
Concentrationof Standard
2.00 mg/L5.00 mg/L10.0 mg/L25.0 mg/L
Volume ofCalcium Standard
2 mL of 100 mg/L Ca5 mL of 100 mg/L Ca10 mL of 100 mg/L Ca25 mL of 100 mg/L Ca
Diluteto
100 mL100 mL100 mL100 mL
Ca2-l

3. Lanthanum Chloride Solution: In a 500 mL volumetric flask, dissolve29g of 1.8203 slowly and In small portions, 1n 250 ml cone. HCL(CAUTION:water.
Reaction Is violent!) and dilute to 500 ml with M1111-Q
Notes:
1.
2.
3.
Samples must be diluted to obtain concentrations within the optimumconcentration range.
Standards are to be prepared 1n the same acid concentrations as thesamples being analyzed.
Silicon, alumfnum, phosphate and sulfate depress the signal forcalcium. Lanthanum chloride Is added as a matrix modifier tocontrol these Interferences.
Procedure: For the analysis procedure, refer to the Atomic Absorption Spectro-metry. Flame - Direct Aspiration section of this manual but make thefollowing changes:
1. Turn the burner head counter clockwise as far as 1t willgo (approximately a 45* angle).
3. If calcium 1s to be run In the concentration mode, use the5.00 and 25.0 standards and follow the procedure for analyzing1n concentration mode.
Quality Control:
Establish a standard curve with the standards listed above plus ablank. Record the absorbs nee check standard 1n the absorbancecheck book. The absorbances should remain consistent from runto run. If not, necessary troubleshooting must be performedbefore continuing (check wavelength, flame head alignment, lampalignment, etc.).
A quality control calibration standard of 10.0 tng/L 1s to beanalyzed, at a minimum, after every 10 samples. If less than 10samples are analyzed, a calibration standard is still required.The last sample analyzed in the run is to be the calibration standard.These standards must be within acceptable ranges or the samples runafter the last acceptable check standard are to be reanalyzed.Record the calibration standards 1n the quality control book. Theconfidence limits are noted in the quality control book.
Ca2-2

3. Duplicate and spike a minimum of 1 out of 10 samples. If less than10 sanples are analyzed, a duplicate and spike are still required.Duplicates are to be averaged. Spike samples with a standard oftwice the concentration of the sample 1n a 1:1 ratio of sample tostandard. Spike recoveries and duplicates are to be within acceptableranges or the use of dilution or method of standardadditions 1s to be applied to reduce the interferences.
Calculations:
1. Plot concentration vs absorb*nee on graph. Determine unknowns usinggraph, or
2. Calculate using linear regression.
3. Calculate using the concentration mode.
Revision Date
11-14-86_______Michael J. LlnskensLaboratory Manager 4-13-87
uwKin i D. FlnnerAnalytical Labpratory QA/QC Officer
.awrence D. AndersenVice President, Technical Services
[ALM-8-7]
Ca2-3
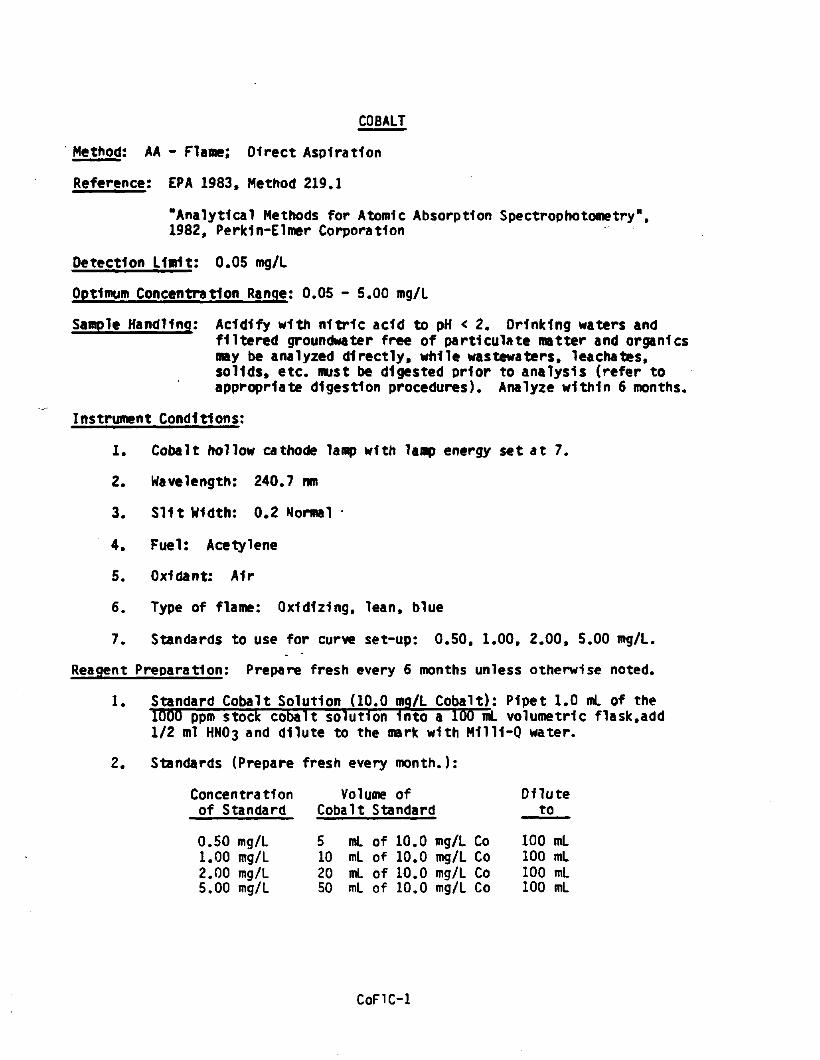
COBALT
Method: AA - Flame; Direct Aspiration
Reference: ERA 1983. Method 219.1
"Analytical Methods for Atomic Absorption Spectrophotometry",1982, Perk1n-Elmer Corporation
Detection Limit: 0.05 mg/L
Optimum Concentration Range: 0.05 - 5.00 mg/L
Sample Handling: Acidify with nitric add to pH < 2. Drinking waters andfiltered groundwater free of participate matter and organlcsmy be analyzed directly, while wastewaters, leachates,solids, etc. must be digested prior to analysis (refer toappropriate digestion procedures). Analyze within 6 months.
Instrument Conditions:
1. Cobalt hollow cathode lamp with lamp energy set at 7.
2. Wavelength: 240.7 ran
3. Slit Width: 0.2 Normal
4. Fuel: Acetylene
5. 0x1 tent: Air
6. Type of flame: Oxidizing, lean, blue
7. Standards to use for curve set-up: 0.50, 1.00, 2.00, 5.00 mg/L.
Reagent Preparation: Prepare fresh every 6 months unless otherwise noted.
1. Standard Cobalt Solution (10.0 mg/L Cobalt): P1pet 1.0 mL of the1000 ppm stock cobalt solution Into a 100 mL volumetric flask,add1/2 ml HNOs and dilute to the mark with M1111-Q water.
2. Standards (Prepare fresh every month.):
Concentrationof Standard
0125
.50
.00
.00
.00
mg/Lmg/Lmg/Lmg/L
VolumeCobalt
5102050
mLmLmLmL
of DiluteStandard
ofofofof
10101010
.0
.0
.0
.0
mg/Lmg/Lmg/Lmg/L
CoCoCoCo
to
100100100100
mLmLmLmL
CoFlC-1

Notes:
1. Samples must be diluted to obtain concentrations within the optimumconcentration range.
2. Standards are to be prepared 1n the same add concentrations as thesamples being analyzed.
3. The use of background correction Is required.
4. This flame procedure can be used for digested samples* EP Toxldtysamples or any other samples where high concentrations of cobalt(concentrations greater than 0.50 mg/L) are expected and low detectionlimits are not required*
Procedure; For the analysis procedure, refer to the Atomic AbsorptionSpectrometry, Flame - Direct Aspiration section of this manual.
If cobalt Is to be analyzed In concentration mode, use the 2.00and 5.00 standards and follow the procedure for analyzing In theconcentration mode.
Quality Control;
1. Establish a standard curve with the standards listed above plusa blank. Record the absorbance check standard 1n the absorbancecheck book. The absorbances should remain consistent from runto run. If not, necessary troubleshooting must be performedbefore continuing (check wavelength, flame head alignment, lampalignment, etc.),
2. A quality control calibration standard of 1.00 mg/L 1s to beanalyzed, at a minimum, after every 10 samples. If less than 10samples are analyzed, a calibration standard 1s still required.The last sample analyzed 1n the run 1s to be the calibration standard.These standards must be within acceptable ranges or the samples runafter the last acceptable check standard are to be reanalyzed*Record the calibration standards In the quality control book. Theconfidence limits are noted In the quality control book.
3. Duplicate and spike a minimum of 1 out of 10 samples. If less than10 samples are analyzed, a duplicate and spike are still required.Duplicates are to be averaged. Spike samples with a standard oftwice the concentration of the sample in a 1:1 ratio of sample tostandard. Spike recoveries and duplicates are to be within acceptableranges or the use of dilution or method of standard additions 1sto be applied to reduce the Interferences.
CoFlC-2

Calculations:
1. Plot concentration vs absorbance on graph. Determine unknowns usinggraph, or
2. Calculate using linear regression, or
3. Calculate using concentration mode.
[ALM-8-14]
CoFK-3

COPPER
Method; AA - Flame; Direct Aspiration
Reference; EPA 1983, Method 220.1
"Analytical Methods for Atomic Absorption Spectrophotometry",1982, Perkln-Elmer Corporation
Detection Llnrft; 0.02 mg/L
Optimum Concentration Range: 0.02 - 5.00 mg/L
Sample Handling; Acidify with nitric add to pH < 2. Drinking waters andfiltered groundwater free of particulars matter and organic*may be analyzed directly, while wastewaters, leachates,solids, etc. must be digested prior to analysis (refer toappropriate dlpestlons procedures). Analyze within 6 months.
Instrument Conditions;
1. The Copper hollow cathode lamp 1s used. Set lamp energy to 18.
2. Wavelength: 324.7 rm
3. SHt Width: 0.7 Normal
4. Fuel: Acetylene
5. Oxldant: A1r
6. Type of flame: Oxidizing, lean, blue
7. Standards to use for curve set-up: 0.50, 1.00, 2.00, 5.00 mg/L.
Reagent Preparation; (Prepare fresh every 6 months unless otherwise noted.)
1. Standard Copper Solution (100 mg/L Copper): P1pet 10 mL of the1000 ppm stock copper solution Into a 100 mL volumetric flask, add1/2 mL HNOj, and dilute to the mark with MW1-Q water.
2. Standards (Prepare fresh every month.):
Concentration Volume of Diluteof Standard Copper Standard to
0.50 mg/L 0.5 mL of 100 mg/L Cu 100 mL1.00 mg/L 1 mL of 100 mg/L Cu 100 mL2.00 mg/L 1 mL of 100 mg/L Cu 100 mL5.00 mg/L 5 mL of 100 mg/L Cu 100 mL
CuC-1

Notes:
1. Samples must be diluted to obtain concentrations within the optimumconcentration range*
2. Standards are to be prepared 1n the same add concentrations as thesamples being analyzed.
3. The use of background correction 1s required.
Procedure: For the analysis procedure, refer to the Atomic AbsorptionSpectrometry, Flame - Direct Aspiration section of this manual.
If copper is to be run In the concentration mode, use the 2.00,and 5.00 mg/L copper standards and follow the procedure foranalyzing 1n the concentration mode.
Quality Control:
1. Establish a standard curve with the standards listed above plusa blank. Record the absorbance check standard In the absorbancecheck book. The absorbances should remain consistent from runto run* If not, necessary troubleshooting must be performedbefore continuing (check wavelength, flame head alignment, lampalignment, etc.).
2. A quality control calibration standard of l.'OO mg/L 1s to beanalyzed, at a minimum, after every 10 samples. If less than 10samples are analyzed, a calibration standard Is still required.The last sample analyzed 1n the run is to be the calibration standard.These standards must be within acceptable ranges or the samples runafter the last acceptable check standard are to be reanalyzed.Record the calibration standards In the quality control book. Theconfidence limits are noted 1n the quality control book.
3. Duplicate and spike a minimum of 1 out of 10 samples. If less than10 samples are analyzed, a duplicate and spike are still required.Duplicates are to be averaged. Spike samples with a standard oftwice the concentration of the sample in a 1:1 ratio of sample tostandard. Spike recoveries and duplicates are to be within acceptableranges or the use of dilution or method of standardadditions is to be applied to reduce the Interferences.
Calculations:
1. Plot concentration vs absorbance on graph. Determine unknowns usinggraoh, or
2. Calculate using linear regression, or
CuC-2

3. Calculate using the concentration mode.
[ALM-8-2] CU(>3

IRON
Method: AA - Flame; Direct Aspiration
Reference; EPA 1983. Method 236.1
"Analytical Methods for Atomic Absorption Spectrophotometry",1982, Perkln-Elmer Corporation
Detection Limit; 0.05 mg/L
Optimum Concentration Range; 0.05 - 5.00 mg/L
Sample Handling; Acidify with nitric add to pH < 2. Drinking watersand filtered groundwater free of participate natterand organlcs may be analyzed directly, while wastewaters,leacnates, solids, etc. must be digested prior to analysis(refer to aporoprlate digestion procedures). Analyzewithin 6 months.
Instrument Conditions;
1. The Iron hollow cathode lamp 1s used. Set lamp energy to 18.
2. Wavelength: 248.3 nm
3. SUt Width: 0.2 Normal
4. Fuel: Acetylene
5. Oxldant: A1r
6. Type of flame: Oxidizing, lean, blue
7. Standards to use for curve set-up: 0.50, 1.00, 2.00, 5.00 mg/L.
Reagent Preparation; (Prepare fresh every 6 months unless otherwise noted.)
1. Standard Iron Solution (100 mg/L Iron): P1pet 10 mLs of the 1000ppm stock Iron solution Into a 100 ml volumetric flask, add l/2mLHN03, and dilute to the mark with M1111-Q water.
2. Standards (Prepare fresh every month.):
Concentration Volume of Diluteof Standard Iron Standard to
0.50 mg/L 1/2 mL of 100 mg/L Fe 100 mL1.00 mg/L 1 mL of 100 mg/L Fe 100 mL
1 2.00 mg/L 2 mL of 100 mg/L Fe 100 mL5.00 mg/L 5 mL of 100 mg/L Fe 100 mL10.0 mg/L 10 mL of 100 mg/L Fe 100 mL25.0 mg/L 25 mL of 100 mg/L Fe 100 mL50.0 mg/L 50 mL of 100 mg/L Fe 100 mL75.0 mg/L 75 mL of 100 mg/L Fe 100 mL
FeC-1
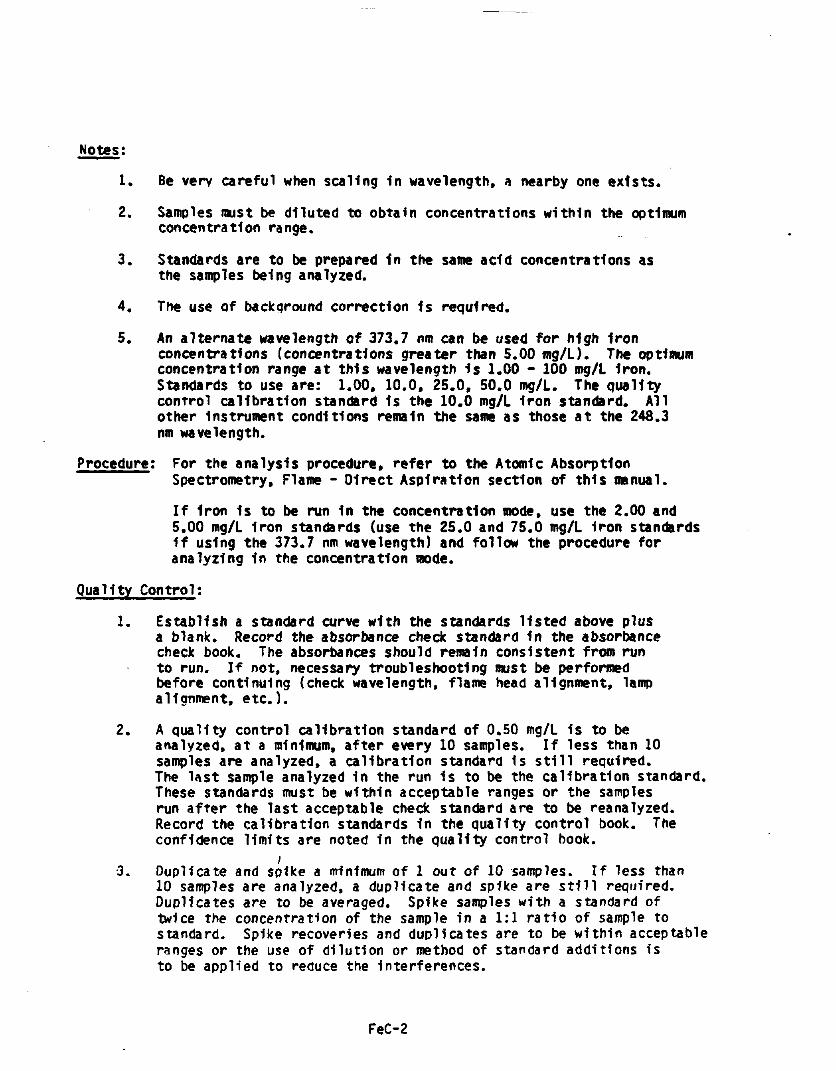
Notes:
1.
2.
3.
Be very careful when scaling 1n wavelength, a nearby one exists.
Samples must be diluted to obtain concentrations within the optimumconcentration range.
Standards are to be prepared 1n the same add concentrations asthe samples being analyzed.
4. The use of background correction 1s required.
5. An alternate wavelength of 373.7 nm can be used for high Ironconcentrations (concentrations greater than 5.00 tng/L). The optimumconcentration range at this wavelength 1s 1*00 - 100 mg/L Iron.Standards to use are: 1.00, 10.0, 25.Ov 50.0 mg/L. The qualitycontrol calibration standard Is the 10.0 mg/L Iron standard. Allother Instrument conditions remain the same as those at the 248.3nm wavelength.
Procedure: For the analysis procedure, refer to the Atomic AbsorptionSpectrometry, Flame - Direct Aspiration section of this manual.
If Iron Is to be run In the concentration mode, use the 2.00 and5.00 mg/L Iron standards (use the 25.0 and 75.0 mg/L Iron standards1f using the 373.7 nm wavelength) and follow the procedure foranalyzing 1n the concentration mode.
Quality Control:
1. Establish a standard curve with the standards listed above plusa blank. Record the absorbance check standard 1n the absorbancecheck book. The absorbances should remain consistent from runto run. If not, necessary troubleshooting must be performedbefore continuing (check wavelength, flame head alignment, lampalignment, etc.).
2. A quality control calibration standard of 0.50 mg/L 1s to beanalyzed, at a minimum, after every 10 samples. If less than 10samples are analyzed, a calibration standard Is still required.The last sample analyzed 1n the run 1s to be the calibration standard.These standards must be within acceptable ranges or the samplesrun after the last acceptable check standard are to be reanalyzed.Record the calibration standards 1n the quality control book. Theconfidence limits are noted in the quality control book.
/3. Duplicate and spike a minimum of 1 out of 10 samples. If less than
10 samples are analyzed, a duplicate and spike are still required.Duplicates are to be averaged. Spike samples with a standard oftwice the concentration of the sample in a 1:1 ratio of sample tostandard. Spike recoveries and duplicates are to be within acceptableranges or the use of dilution or method of standard additions isto be applied to reduce the interferences.
FeC-2

Calculations:
1. Plot concentration vs absorbance on graph. Determine unknowns usinggraph, or
2. Calculate using linear regression, or
3. Calculate using the concentration mode.
[ALM-8-3]
FeC-3
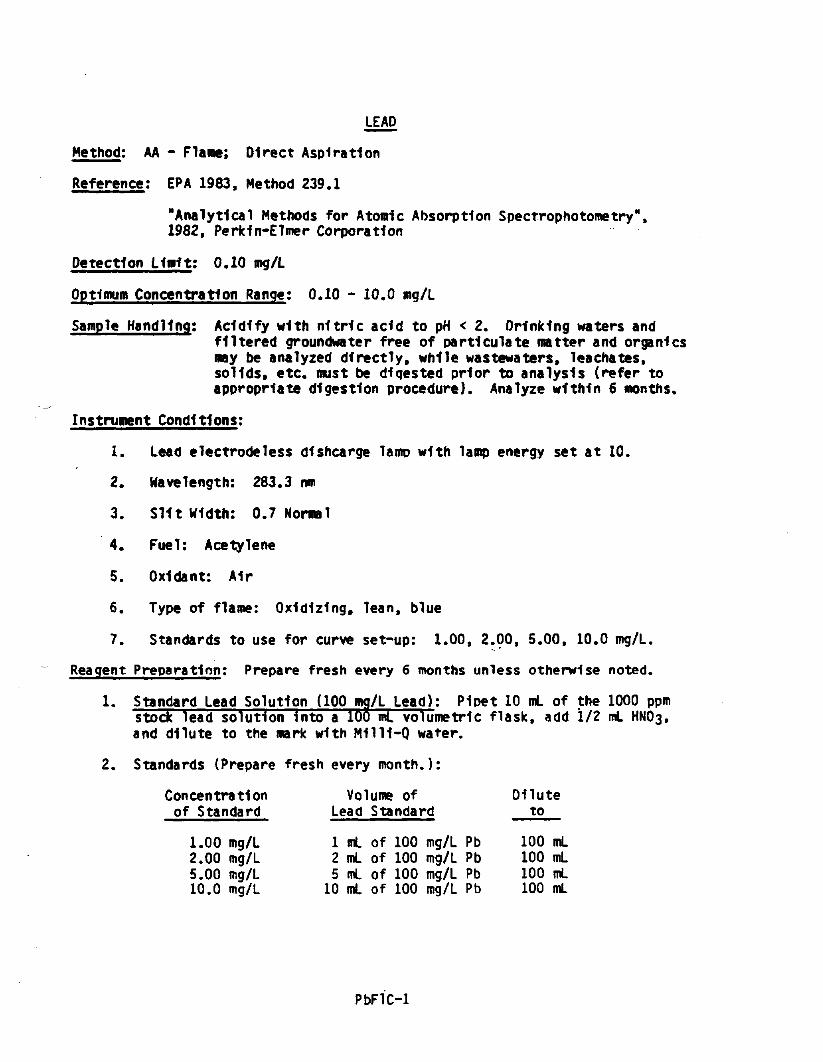
LEAP
Method: AA - Flame; Direct Aspiration
Reference: ERA 1983, Method 239.1
"Analytical Methods for Atomic Absorption Spectrophotometry",1982, Perkln-Elmer Corporation
Detection Limit; 0.10 mg/L
Optimum Concentration Range: 0.10 - 10.0 mg/L
Sample Handling; Acidify with nitric acid to pH < Z. Drinking waters andfiltered groundwater free of partlculate matter and organlcsmay be analyzed directly, while wastewaters, leachates,solids, etc. must be digested prior to analysis (refer toappropriate digestion procedure). Analyze within 6 months.
Instrument Conditions;
1. Lead electrodeless dlshcarge lamp with lamp energy set at 10.
2. Wavelength: 283.3 nm
3. Slit Width: 0.7 Normal
4. Fuel: Acetylene
5. Oxldant: A1r
6. Type of flame: Oxidizing, lean, blue
7. Standards to use for curve set-up: 1.00, 2.00, 5.00. 10.0 mg/L.
Reagent Preparation; Prepare fresh every 6 months unless otherwise noted.
1. Standard Lead Solution (100 mg/L Lead): P1pet 10 mL of the 1000 ppmstock lead solution Into a 100 ml volumetric flask, add 1/2 mL HM03,and dilute to the mark with M1111-Q water,
2. Standards (Prepare fresh every month.):
Concentration Volume of Diluteof Standard Lead Standard to
1.00 mg/L 1 mL of 100 mg/L Pb 100 mL2.00 mg/L 2 mL of 100 mg/L Pb 100 mL5.00 mg/L 5 mL of 100 mg/L Pb 100 mL10.0 mg/L 10 mL of 100 mg/L Pb 100 mL
PbFlC-1

Notes:
1. Samples must be diluted to obtain concentrations within the optimumconcentration range.
2. Standards are to be prepared 1n the same add concentrations as thesamples being analyzed*
3. The use of background correction 1s required.
4. This flame procedure can be used for digested samples, EP Toxldtysamples or any other sanples where low detection limits are notrequired. EP Toxldty samples must be spiked to verify that standardadditions are not required.
Procedure: For the analysis procedure, refer to the Atomic AbsorptionSpectrometry, Flame - Direct Aspiration section of this manual.
If lead 1s to be analyzed by the concentration mode, use the5.00 and 10.00 rog/L lead standards and follow the procedure foranalyzing 1n the concentration mode.
Quality Control;
1. Establish a standard curve with the standards listed above plusa blank. Record the absorbance check standard In the absorbancecheck book. The absorbances should remain consistent from runto run. If not, necessary troubleshooting must be performedbefore continuing (check wavelength, flame head alignment, lampalignment, etc.).
2. A quality control calibration standard of 5.00 mg/L 1s to be analyzed,at a minimum, after every 10 samples. If less than 10 samples areanalyzed, a calibration standard 1s still required. The last sampleanalyzed 1n the run 1s to be the calibration standard. Thesestandards must be within acceptable ranges or the samples run afterthe last acceptable check standard are to be reanalyzed. Recordthe calibration standards 1n the quality control book. The confidencelimits are noted 1n the quality control book,
3. Duplicate and spike a minimum of 1 out of 10 samples. If less than10 samples are analyzed, a duplicate and spike are still required.Duplicates are to be averaged. Spike samples with a standard oftwice the concentration of the sample 1n a 1:1 ratio of sample tostandard. Spike recoveries and duplicates must be within acceptableranges or the use of dilution or method of standardadditions is to be applied to reduce the interferences.
PbFlC-2

Calculations:
1. Plot concentration vs absorbance on graph* Determine unknowns usinggraph or
2. Calculate using linear regression or
3. Calculate using the concentration mode.
[ALM-8-9] PbFlC-3

MAGNESIUM
Method; AA - Flame; Direct Aspiration
Reference: EPA 1983. Method 242.1
"Analytical Methods for Atomic Absorption Spectrophotometry".1982, Perkln-Elmer Corporation
Detection Limit: 0,05 mg/L
Optimum Concentration Range; 0.05 - 10.0 mg/L
Sample Handling: Acidify with nitric add to pH < 2. Drinking waters andfiltered groundwater free of partlculate matter andorganlcs may be analyzed directly, while wastewaters,leachates, solids, etc. must be digested prior to analysis(refer to appropriate digestion procedure). Analyze within6 months*
Instrument Conditions;
1. The Ca-Mg combination hollow cathode lamp 1s used. Set lampenergy to 25.
2. Wavelength; 285.2 nm
3. Slit Width: 0.7 Normal
4. Fuel: Acetylene
5. Oxldant: Air
6. Type of flame: Oxidizing, lean, blue
7. Standards to use for curve set-up: 1.00, 2.00, 5.00, 10.0 mg/L.
Reagent Preparation: Prepare fresh every 6 months unless otherwise noted.
1. Standard Magnesium Solution (100 mq/L Magnesium): P1pet 10 mLof the 1000 ppm stock magnesium solution Into a 100 mL volumetricflask, add 1/2 mL HN03, and dilute to the mark with M1111-Q water.
2. Standards (Prepare fresh every month.):
Concentrationof
1.2.5.
10.
Standard
0000
mg/Lmg/Lmg/Lmg/L
Volume ofMagnesium Standard
125
10
mLmLmLmL
ofofofof
100100100100
mg/Lmg/Lmg/Lmg/L
MgMgMgMg
Diluteto
100100100100
mLmLmLmL
MgC-1
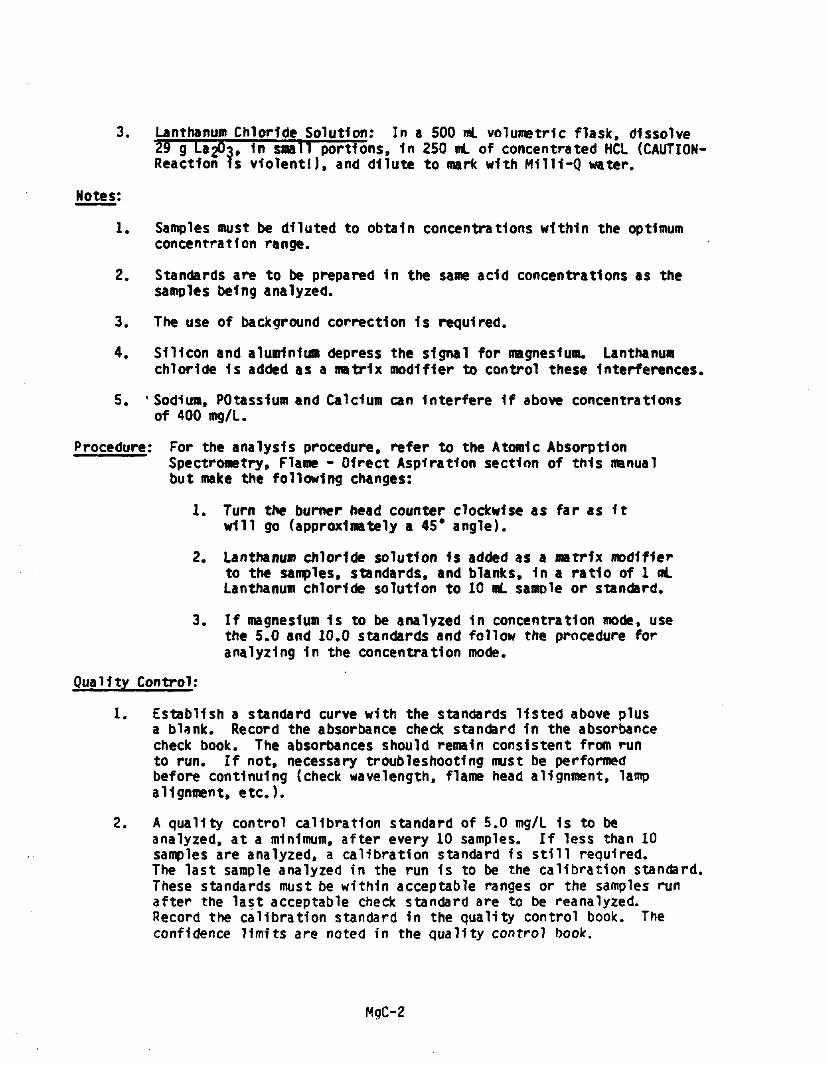
3, Lanthanum Chloride Solution: In a 500 mL volumetric flask, dissolve29 g 18^3, In small portions, in 250 ml of concentrated HCL (CAUTION-Reaction Is violent!), and dilute to mark with M1111-Q water.
Notes:
1. Samples must be diluted to obtain concentrations within the optimumconcentration range.
2. Standards are to be prepared in the same acid concentrations as thesamples being analyzed.
3. The use of background correction is required.
4. Silicon and aluminium depress the signal for magnesium. Lanthanumchloride is added as a matrix modifier to control these Interferences.
5. 'Sodium, POtassium and Calcium can interfere 1f above concentrationsof 400 mg/L.
Procedure: For the analysis procedure, refer to the Atomic AbsorptionSpectrometry, Flame - Direct Aspiration section of this manualbut make the following changes:
1. Turn the burner head counter clockwise as far as itwill go (approximately a 45* angle).
2. Lanthanum chloride solution is added as a matrix modifierto the samples, standards, and blanks, 1n a ratio of 1 mLLanthanum chloride solution to 10 mL sample or standard.
3. If magnesium 1s to be analyzed in concentration mode, usethe 5.0 and 10.0 standards and follow the procedure foranalyzing in the concentration mode.
Quality Control:
1. Establish a standard curve with the standards listed above plusa blank. Record the absorbance check standard 1n the absorbancecheck book. The absorbances should remain consistent from runto run. If not, necessary troubleshooting must be performedbefore continuing (check wavelength, flame head alignment, lampalignment, etc.).
2. A quality control calibration standard of 5.0 mg/L is to beanalyzed, at a minimum, after every 10 samples. If less than 10samples are analyzed, a calibration standard Is still required.The last sample analyzed in the run 1s to be the calibration standard.These standards must be within acceptable ranges or the samples runafter the last acceptable check standard are to be reanalyzed.Record the calibration standard in the quality control book. Theconfidence limits are noted in the quality control book.
MgC-2

3. Duplicate and spike a minimum of 1 out of 10 samples. If less than10 samples are analyzed, a duplicate and spike are still required*Duplicates are to be averaged. Spike samples with a standard oftwice the concentration of the sample 1n a 1:1 ratio of sample tostandard. Spike recoveries and duplicates are to be within acceptableranges or the use of dilution or method of standard additions 1sto be applied to reduce the Interferences.
Calculations:
1. Plot concentration vs absorbance on graph. Determine unknowns usinggraph, or
2. Calculate using linear regression.
3. Calculate using concentration mode.
[ALM-8-6]
MgC-3

MANGANESE
Method: AA - Flame; Direct Aspiration
Reference: EPA 1983. Method 243.1
"Analytical Methods for Atomic Absorption Spectrophotometry",1982, Perkln-Elmer Corporation
Detection Limit; 0.02 mg/L
Optimum Concentration Range: 0.02 - 2.50 mg/L
Sample Handling: Acidify with nitric add to pH < 2. Drinking waters andfiltered groundwater free of participate matter and organlcsmay be analyzed directly, while wastewaters, leachates,solids, etc. must be digested prior to analysis (refer toappropriate digestion procedures). Analyze within 6 months.
Instrument Conditions:
1. The Manganese hollow cathode lamp 1s used. Set lamp energy to 18.
2. Wavelength: 279.5 rnn
3. S11t Width: 0.2 Normal
4. Fuel: Acetylene
5. Oxidant: A1r
6. Type of flame: Oxidizing, lean, blue
7. Standards to use for curve set-up: 0.25, 0.50, 1.00, 2.50 mg/L.
Reagent Preparation; Prepare fresh every 6 months unless otherwise noted.
1. Standard Manganese Solution (100 mg/L Manganese): P1pet 10 ml ofthe 1000 ppm stock manganese solution Into a 100 mL volumetricflask, add 1/2 ml HN03 and dilute to the mark with M1111-Q water.
2. Standards (Prepare fresh every month.):
Concentrationof Standard
0.25 mg/L0.50 mg/L1.00 mg/L2.50 mg/L
Volume ofManganese Standard
1/2 mL of 1.00 mg/L Mn1 mL of 50 mg/L Mn2 mL of 50 mg/L Mn5 mL of 50 mg/L Mn
Diluteto
100 mL100 mL100 mL100 mL
MnC-1

Notes:
1. Samples must be diluted to obtain concentrations within the optimumconcentration range.
2. Standards are to be prepared In the same add concentrations as thesamples being analyzed. <
3. The use of background correction 1s required.
Procedure: For the analysis procedure, refer to the Atomic AbsorptionSpectrometry, Flame - Direct Aspiration section of this manual.
If manganese 1s to be run 1n the concentration mode* use the1.00, and 2.50 mg/L manganese standards and follow theprocedure for analyzing 1n the concentration mode.
Quality Control:
1. Establish a standard curve with the standards listed above plusa blank. Record the absorbance check standard In the absorbancecheck book. The absorbances should remain consistent from runto run. If not, necessary troubleshooting must be performedbefore continuing (check wavelength, flame head alignment, lampalignment, etc.).
2. A quality control calibration standard of 0.50 mg/L 1s to beanalyzed, at a minimum, after every 10 samples. If less than 10samples are analyzed, a calibration standard Is still required.The last sample analyzed 1n a run 1s to be the calibration standard.These standards must be within acceptable ranges or the samples runafter the last acceptable check standard are to be reanalyzed.Record the calibration standards 1n the quality control book. Theconfidence limits are noted 1n the quality control book.
3. Duplicate and spike a minimum of 1 out of 10 samples. If less than10 samples are analyzed, a duplicate and spike are still required.Duplicates are to be averaged. Spike samples with a standard oftwice the concentration of the sample 1n a 1:1 ratio of sample tostandard. Spike recoveries and duplicate results are to be withinacceptable ranges or the use of dilution or method of standardadditions 1s to be applied to reduce the Interferences.
Calculations:
1. Plot concentration vs absorbance on graph. Determine unknowns usinggraph, or
2. Calculate using linear regression, or
MnC-2

3. Calculate using the concentration mode,
CALM-8-5] MnC.3

NICKEL
Method; AA - Flame; Direct Aspiration
Reference: EPA 1983. Method 249.1
"Analytical Methods for Atomic Absorption Spectrophotometry",1982. Perkln-Elmer Corporation
Detection Limit: 0.04 mg/L
Optimum Concentration Range; 0.04 - 5.00 mg/L
Sample Handling: Acidify with nitric add to pH < 2. Drinking waters andfiltered groundwater free of participate matter and organlcsmay be analyzed directly, while wastewaters, leachates.solIds, etc. must be digested prior to analysis (refer toappropriate digestion procedure). Analyze within 6 months.
Instrument Conditions;
1. Nickel hollow cathode lamp with lamp energy set at 25.
2. Wavelength; 232.0 nrn
3. SUt Width: 0.2 Normal
4. Fuel: Acetylene
5. Oxldant: A1r
6. Type of flame: Oxidizing, lean, blue
7. Standards to use for curve set-up: 0.50, 1.00, 2.00, 5.00 mg/L.
Reagent Preparation; Prepare fresh every 6 months unless otherwise noted.
1. Standard Nickel Solution (100 mq/L Nickel): P1pet 10 mL of the1000 ppm stock nickel solution into a 100 mL volumetric flask, add1/2 mL HN03, and dilute to the mark with M1111-Q water.
2. Standards (Prepared fresh every month.):
Concentrationof Standard
0.50 mg/L1.00 mg/L2.00 mg/L5.00 mg/L
Volume ofNickel Standard
1/2 mL of 100 mg/L N11 mL of 100 mg/L N12 mL of 100 mg/L Ni5 mL of 100 mg/L Ni
Diluteto
100 mL100 mL100 mL100 mL
N1C-1

Notes:
1. Samples must be diluted to obtain concentrations within the optimumconcentration range.
2. Standards are to be prepared 1n the same add concentrations asthe samples being analyzed.
3. The use of background correction 1s required.
4. A nearby wavelength Is present. Take care 1n selection of thiswavelength.
Procedure: For the analysis procedure, refer to the Atomic AbsorptionSpectrometry, Flame * Direct Aspiration section of this manual.
If nickel 1s to be run 1n the concentration mode, use the 2.00,5.00 mg/L nickel standards and follow the procedure for analyzing1n the concentration mode.
Quality Control:
1. Establish a standard curve with the standards listed above plusa blank. Record the absorbance check standard 1n the absorbancecheck book. The absorbances should remain consistent from runto run. If not, necessary troubleshooting must be performedbefore continuing (check wavelength, flame head alignment, lampalignment, etc.).
2. A Quality control calibration standard of 0.50 mg/L 1s to be analyzed,at a minimum, after every 10 samples. If less than 10 samples areanalyzed, a calibration standard 1s still required. The last sampleanalyzed In the run 1s to be the calibration standard. Thesestandards must be within acceptable ranges or the samples run afterthe last acceptable check standard are to be reanalyzed. Recordthe calibration standards 1n the quality control book. The confidencelimits are noted 1n the quality control book.
3. Duplicate and spike a minimum of 1 out of 10 samples. If less than10 samples are analyzed, a duplicate and spike are still required.Duplicates are to be averaged. Spike samples with a standard oftwice the concentration of the sample 1n a 1:1 ratio of sample tostandard. Spike recoveries and duplicate results are to be withinacceptable ranges or the use of dilution or method of standardadditions 1s to be applied to reduce the interferences.
Calculations;
1. Plot concentration vs absorbance on graph. Determine unknowns usinggraph, or
2. Calculate using linear regression, or

3. Calculate using the concentration mode*
CALM-8-4]

POTASSIUM
Method; Flame Emission; Direct Aspiration
Reference: "Analytical Methods for Atomic Absorption Spectrophotometry",1982, Perkln-Elmer Corporation
Detection Unvft: 0.10 rog/L
Optimum Concentration Range: 0.10 - 5.00 mg/L
Sample Handling: Acidify with nitric add to pH < 2. Drinking waters andfiltered groundwater free of participate matter andorganlcs may be analyzed directly, while wastewaters,leachates, solids, etc. must be digested prior to analysis(refer to appropriate digestion procedures). Analyzewithin 6 months.
Instrument Conditions:
1. Set signal to emission. (No lamp Is required.)
2. Wavelength: 766.5 nm
3. SUt Width: 0.2 Normal
4. Fuel: Acetylene
5. Oxldant: A1r
6. Type of flame: Oxidizing, lean, blue
7. Standards to use for curve set-up: 0.50, 1.00, 2.00, 5.00 mg/L.
Reagent Preparation: (Prepare fresh every 6 months unless otherwise noted.)
1. Standard Potassium Solution (100 mg/L Potassium); P1pet 10 ml ofthe 1000 ppm stock potassium solution into a 1UO ml volumetricflask, add 1/2 nt HNOa, and dilute to the mark with M1111-Q water
2. Standards (Prepare fresh every month.):
Concentrationof Standard
0.50 mg/L1.00 mg/L2.00 mg/L5.00 mg/L
Volume ofPotassium Standard
0.5 mL of 100 mg/L1 mL of 100 mg/L2 mL of 100 mg/L5 mL of 100 mg/L
Diluteto
100 mL100 mL100 mL100 mL
KC-1

Samples must be diluted to obtain concentrations within the optimumconcentration range.
2. Standards are to be prepared 1n the same add concentrations as thesamples being analyzed.
Procedure; For the analysis procedure, refer to the Atomic AbsorptionSpectrometry, Flame ~ Direct Aspiration section of this manual.
If potassium 1s to be analyzed 1n concentration mode, usethe 2.00 and 5.00 standards and follow the procedure foranalyzing 1n the concentration mode.
Quality Control;
1. Establish a standard curve with the standards listed above plusa blank. Record the check standard in the ahsorbance check book.The emission readings should remain consistent from run to run.If not, necessary troubleshooting must be performed beforecontinuing (check wavelength, flame head alignment, etc.).
2. A quality control calibration standard of 1.00 mg/L Is to beanalyzed, at a minimum, after every 10 samples. If less than 10samples are analyzed, a calibration standard Is still required.The last sample analyzed 1n the run 1s to be the calibrationstandard. These standards must be within acceptable ranges or thesamples run after the last acceptable check standard are to bereanalyzed. Record the calibration standards 1n the quality controlbook. The confidence limits are noted 1n the quality control book.
3. Duplicate and spike a minimum of 1 out of 10 samples. If less than10 samples are analyzed, a duplicate and spike are still required.Duplicates are to be averaged. Spike samples with a standard oftwice the concentration of the sample In a 1:1 ratio of sample tostandard. Spike recoveries and duplicate to be within acceptableranges or the use of dilution or method of standard additions 1sto be applied to reduce the interferences.
Calculations:
1. Plot concentration vs absorbance on graph. Determine unknowns usinggraph, or
.2. Calculate using linear regression, or
KC-2

3. Calculate using the concentration mode.
[ALM-10-6]KC-3
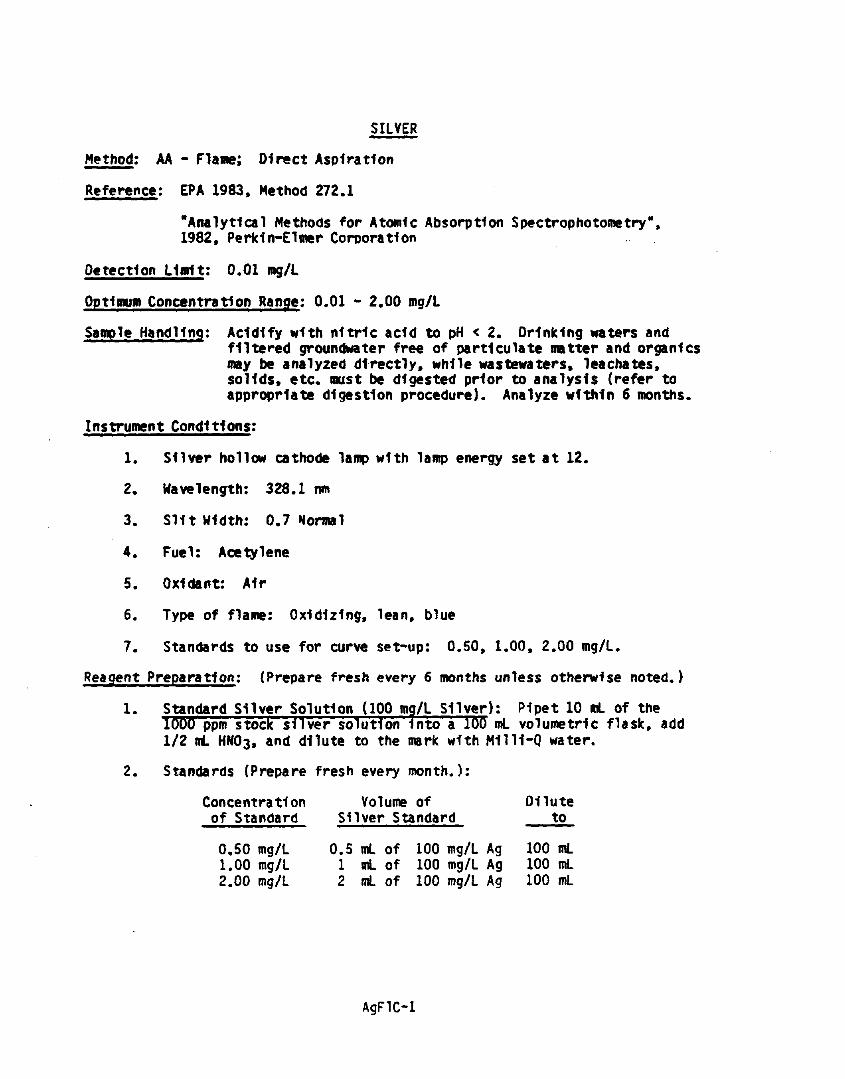
SILVER
Method: AA - Flame; Direct Aspiration
Reference: EPA 1983, Method 272.1
"Analytical Methods for Atomic Absorption Spectrophotometry",1982, Perkln-Elmer Corporation
Detection Limit: 0.01 mg/L
Optimum Concentration Range: 0.01 * 2,00 mg/L
Sample Handling: Acidify with nitric add to pH < 2. Drinking waters andfiltered groundwater free of partlculate matter and organlcsmay be analyzed directly, while wastewaters, leachates,solids, etc. must be digested prior to analysis (refer toappropriate digestion procedure). Analyze within 6 months.
Instrument Conditions:
1. Silver hollow cathode lamp with lamp energy set at 12.
2. Wavelength: 328.1 nm
3. Slit Width: 0.7 Normal
4. Fuel: Acetylene
5. Oxldant: A1r
6. Type of flame: Oxidizing, lean, blue
7. Standards to use for curve set-up: 0.50, 1.00, 2.00 mg/L.
Reagent Preparation; (Prepare fresh every 6 months unless otherwise noted.)
1. Standard Silver Solution (100 mg/L Silver): P1pet 10 nt of the1000 ppm stock silver solution into a 11/2 nt HN03, and dilute to the mark wit
2. Standards (Prepare fresh every month.):
„„_____ W1000 ppm stock silver solution into a 100 mL volumetric flask, add1/2 nL HN03, and dilute to the mark with M1111-Q water.
Concentrationof Standard
0,50 mg/L1.00 mg/L2.00 mg/L
Volume ofSilver Standard
0.5 mL of 100 mg/L Ag1 mL of 100 mg/L Ag2 mL of 100 mg/L Ag
Diluteto
100 mL100 mL100 mL
AgFlC-1

Notes;
1. Samples must be diluted to obtain concentrations within the optimumconcentration range.
2. Standards are to be prepared 1n the same acid concentrations as thesamples being analyzed.
3. The use of background correction is required.
4. This flame procedure can be used for digested samples. EP Toxldtysamples or any other samples where low detection limits are notrequired. EP Toxidty samples must be spiked to verify that standardadditions are not required.
5. Any groundwater samples which silver is detected* must be verifiedby furnace. (Detection limit is at the WI PAL limit.)
Procedure: For the analysis procedure, refer to the Atomic AbsorptionSpectrometry, Flame - Direct Aspiration section of this manual.
If silver Is to be run in the concentation mode, use the 1.00 and2.00 mg/L silver standards and follow the procedure for analyzingin the concentration mode.
Quality Control;
1. Establish a standard curve with the standards listed above plusa blank. Record the absorbance check standard in the absorbancecheck book. The absorbances should remain consistent from runto run. If not, necessary troubleshooting must be performedbefore continuing (check wavelength, flame head alignment, lampalignment, etc.).
2. A quality control calibration standard of 0.50 mg/L is to beanalyzed, at a minimum, after every 10 samples. If less than 10samples are analyzed, a calibration standard is still required.The last sample analyzed in the run is to be the calibration standard.These standards must be within acceptable ranges or the samples runafter the last acceptable check standard are to be reanalyzed.Record the calibration standards in the quality control book. Theconfidence limits are noted 1n the quality control book.
3. Duplicate and spike a minimum of 1 out of 10 samples. If less than10 samples are analyzed, a duplicate and spike are still required*Duplicates are to be averaged. Spike samples with a standard oftwice the concentration of the sample in a 1:1 ratio of sample tostandard. Spike recoveries and duplicates are to be within acceptableranges or the use of dilution or method of standard additions isto be applied to reduce the interferences.
AgFlC-2
Calculations:
1. Plot concentration vs absorbance on graph. Determine unknownsusing graoh or
2. Calculate using linear regression or
3. Calculate using the concentration mode.
[ALM-8-11]AgFlC-3
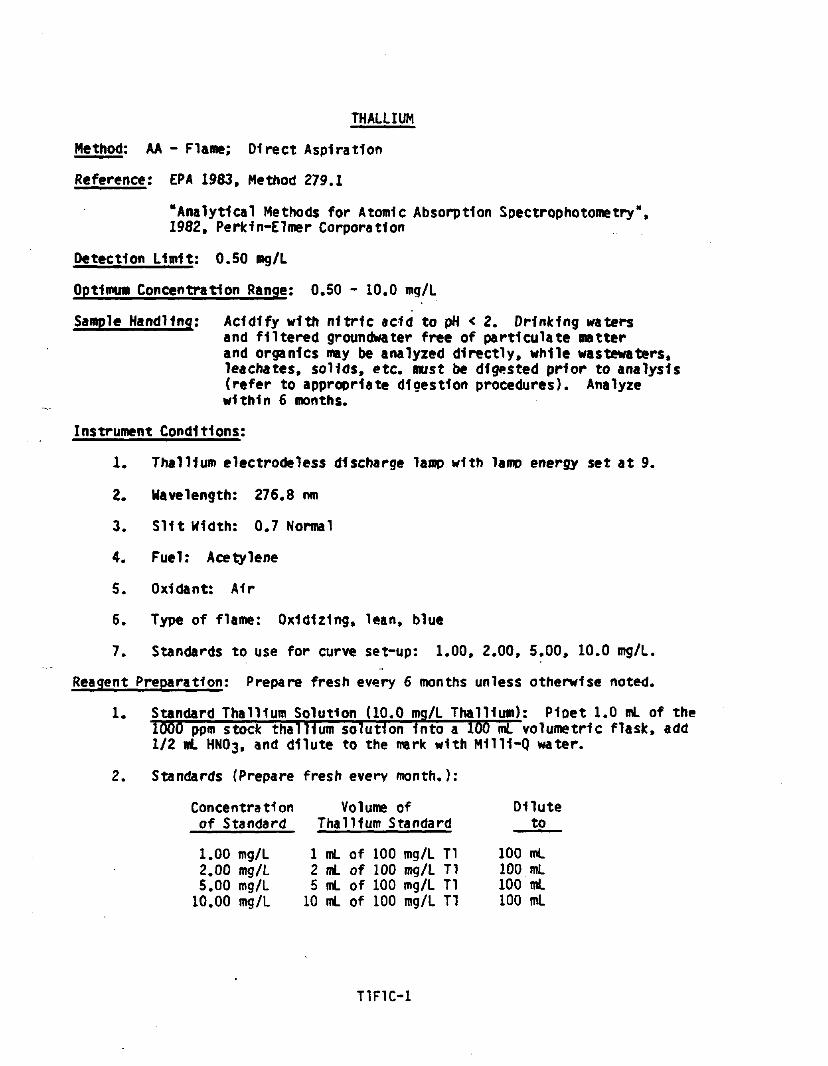
THALLIUM
Method: AA - Flame; Direct Aspiration
Reference: ERA 1983, Method 279.1
"Analytical Methods for Atomic Absorption Spectrophotometry",1982. Perkln-Elmer Corporation
Detection Llnrlt: 0.50 mg/L
Optimum Concentration Range; 0.50 - 10.0 mg/L
Sample Handling: Acidify with nitric add to pH < 2. Drinking watersand filtered groundwater free of participate natterand organlcs may be analyzed directly, while wastewaters,leachates, solids, etc. must be digested prior to analysis(refer to appropriate digestion procedures). Analyzewithin 6 months.
Instrument Conditions;
1. Thallium electrodeless discharge lamp with lamp energy set at 9.
2. Wavelength: 276.8 ran
3. SUt Width: 0.7 Normal
4. Fuel: Acetylene
5. Oxldant: Air
6. Type of flame: Oxidizing, lean, blue
7. Standards to use for curve set-up: 1.00, 2.00, 5.00, 10.0 mg/L.
Reagent Preparation: Prepare fresh every 6 months unless otherwise noted.
1. Standard Thallium Solution (10.0 mg/L Thallium); P1oet 1.0 mL of the1000 ppm stock thallium solution Into a 100 ml volumetric flask, add1/2 mL HN03, and dilute to the mark with M1111-Q water.
2. Standards (Prepare fresh every month.):
Concentration Volume ofof Standard Thallium Standard
1.00 mg/L 1 mL of 100 mg/L Tl2.00 mg/L 2 mL of 100 mg/L Tl5.00 mg/L 5 mL of 100 mg/L Tl
10.00 mg/L 10 mL of 100 mg/L Tl
Diluteto
100 mL100 mL100 mL100 mL
T1F1C-1
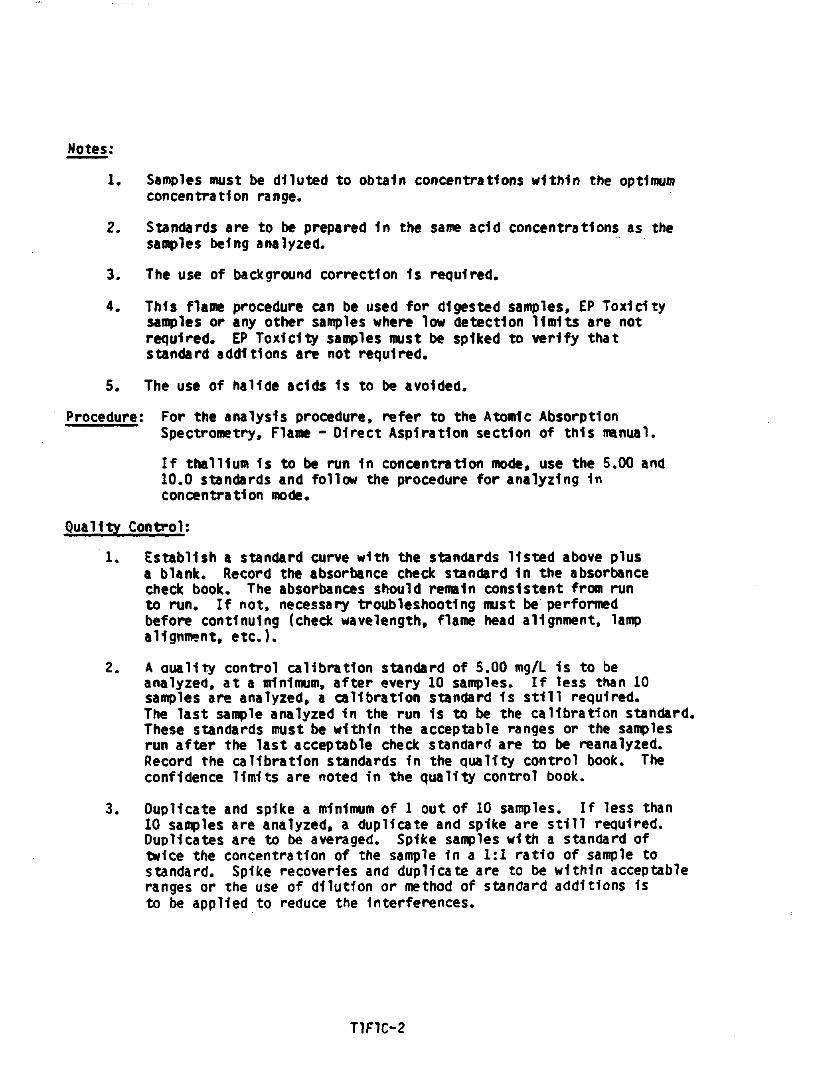
Samples must be diluted to obtain concentrations within the optimumconcentration range.
2. Standards are to be prepared in the same add concentrations as thesamples being analyzed.
3. The use of background correction 1s required.
4. This flame procedure can be used for digested samples, EP Tox1 citysamples or any other samples where low detection limits are notrequired. EP Toxlcity samples must be spiked to verify thatstandard additions are not required.
5. The use of halide adds is to be avoided.
Procedure; For the analysis procedure, refer to the Atomic AbsorptionSpectrometry, Flame - Direct Aspiration section of this manual.
If thallium is to be run in concentration mode, use the 5.00 and10.0 standards and follow the procedure for analyzing inconcentration mode.
Quality Control;
1. Establish a standard curve with the standards listed above plusa blank. Record the absorbance check standard in the absorbancecheck book. The absorbances should remain consistent from runto run. If not, necessary troubleshooting must be performedbefore continuing (check wavelength, flame head alignment, lampalignment, etc.).
2. A auallty control calibration standard of 5.00 mg/L 1s to beanalyzed, at a minimum, after every 10 samples. If less than 10samples are analyzed, a calibration standard 1s still required.The last sample analyzed in the run 1s to be the calibration standard.These standards must be within the acceptable ranges or the samplesrun after the last acceptable check standard are to be reanalyzed.Record the calibration standards in the quality control book. Theconfidence limits are noted in the quality control book.
3. Duplicate and spike a minimum of 1 out of 10 samples. If less than10 samples are analyzed, a duplicate and spike are still required.Duplicates are to be averaged. Spike samples with a standard oftwice the concentration of the sample in a 1:1 ratio of sample tostandard. Spike recoveries and duplicate are to be within acceptableranges or the use of dilution or method of standard additions isto be applied to reduce the interferences.
T1F1O2

Calculations:
1. Plot concentration vs absorbance on graph. Determine unknowns usinggraph, or
2. Calculate using linear regression, or
3. Calculate using concentration mode.
[ALM-8-13]
T1F1C-3
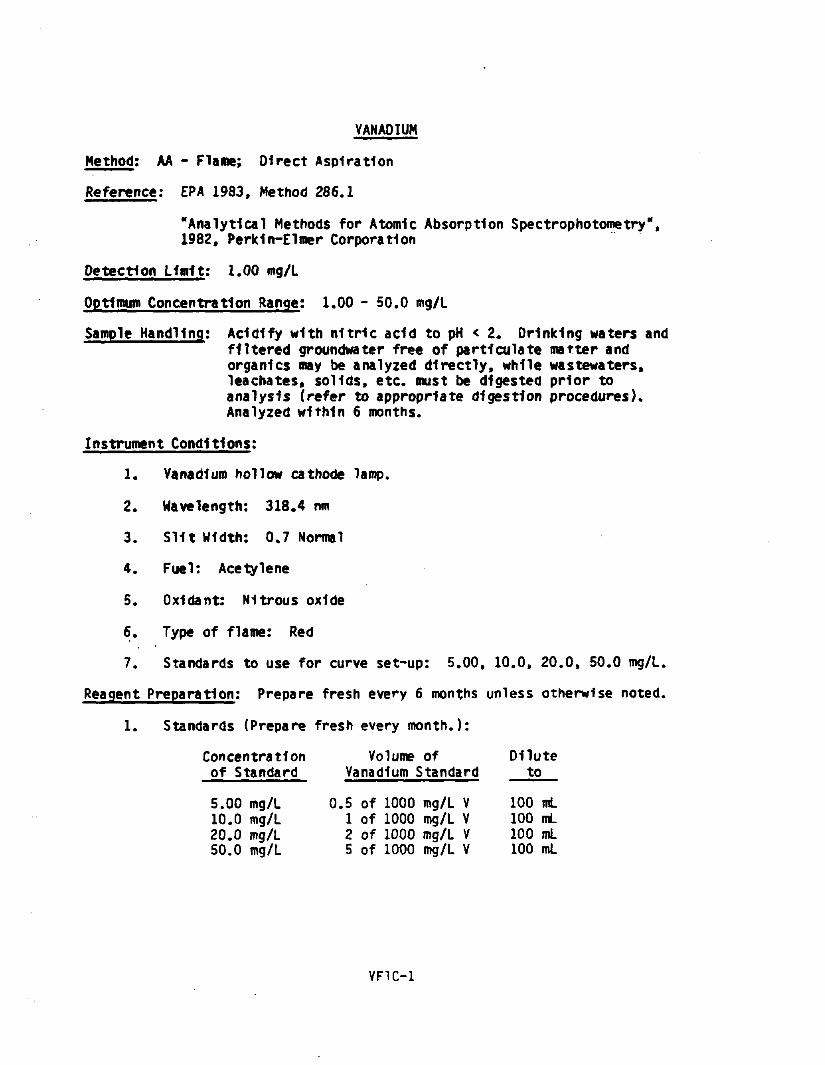
VANADIUM
Method; AA - Flame; Direct Aspiration
Reference; EPA 1983, Method 286.1
"Analytical Methods for Atomic Absorption Spectrophotometry",1982, Perkln-Elmer Corporation
Detection Limit; 1.00 mg/L
Optimum Concentration Range; 1.00 - 50.0 mg/L
Sample Handling; Acidify with nitric add to pH < 2. Drinking waters andfiltered groundwater free of participate matter andorganlcs may be analyzed directly, while wastewaters,leachates, solids, etc. must be digested prior toanalysis (refer to appropriate digestion procedures).Analyzed within 6 months.
Instrument Conditions:
1. Vanadium hollow cathode lamp.
2. Wavelength: 318*4 nm
3. SUt Width: 0.7 Normal
4. Fuel: Acetylene
5. Oxldant: Nitrous oxide
6. Type of flame: Red
7. Standards to use for curve set-up: 5.00, 10.0, 20.0, 50.0 mg/L.
Reagent Preparation; Prepare fresh every 6 months unless otherwise noted.
1. Standards (Prepare fresh every month.):
Concentrationof Standard
5.00 mg/L10.0 mg/L20.0 mg/L50.0 mg/L
Volume ofVanadium Standard
0.5 of 1000 mg/L V1 of 1000 mg/L V2 of 1000 mg/L V5 of 1000 mg/L V
Diluteto
100 mL100 mL100 mL100 mL
VF1C-1

2. Aluminum nitrate solution: In a 200 mL volumetric flask, dissolve139g Al(N03)i 1n 150 ml of M1111-Q water. Heat to dissolve Intosolution. Allow to cool. Dilute to 200 ml with M1111-Q water.
Notes:
1. Samples must be diluted to obtain concentrations within the optimumconcentration range.
2. Standards are to be prepared In the same add concentrations as thesamples being analyzed.
3. The use of background correction 1s required.
4. High concentrations of aluminum and titanium Increase the sensitivityof vanadium. This Interference can be controlled by adding excessaluminum to both samples and standards (2 nt of aluminum nitratesolution to 100 ml samples and standards).
Procedure: For the analysis procedure, refer to the Atonrlc AbsorptionSpectrometry, Flame - Direct Aspiration section of this manual.
Add 0.2 ml of A1N03 to 10 ml of samples, blanks and standards.
If vanadium 1s to be run-In the concentration mode, use the 20.0and 50.0 standards and follow the procedure for analyzing 1n theconcentration mode.
Quality Control;
1. Establish a standard curve with the standards listed above plusa blank. Record the absorbance check standard In the absorbancecheck book. The absorbances should remain consistent from runto run. If not, necessary troubleshooting must be performedbefore continuing (check wavelength, flame head alignment, lampalignment, etc.).
2. A quality control calibration standard of 20.0 mg/L 1s to be analyzed,at a minimum, after every 10 samples. If less than 10 samples areanalyzed, a calibration standard 1s still required. The lastsample analyzed 1n the run 1s to be the calibration standard.These standards must be within the acceptable ranges or the samplesrun after the last acceptable check standard are to be reanalyzed.Record the calibration standards In the quality control book. Theconfidence limits are noted 1n the quality control book.
3. Duplicate and spike a minimum of 1 out of 10 samples. If less than10 samples are analyzed, a duplicate and spike are still required.Duplicates are to be averaged. Spike samples with a standard oftwice the concentration of the sample 1n a 1:1 ratio of sample tostandard. Spike recoveries and duplicate to be within an acceptableranges or the use of dilution or method of standard additions isto be applied to reduce the interferences.
VF1C-2
Calculations:
1. Plot concentration vs absorbance on graph. Determine unknowns usinggraph, or
2. Calculate using linear regression, or
3. Calculate using the concentration mode.
[ALM-10-20] VF1C-3

ZINC
Method: AA - Flame; Direct Aspiration
Reference: EPA 1983, Method 289.1
"Analytical Methods for Atomic Absorption Spectrophotometry",1982, Perkln-Elmer Corporation
Detection Limit: 0.01 mg/L
Optimum Concentration Range: 0.01 - 1.00 mg/L
Sample Handling: Acidify with nitric add to pH < 2. Drinking waters andfiltered groundwater free of participate matter and organic*may be analyzed directly, while wastewaters, leachates,solids, etc. must be digested prior to analysis (refer toappropriate digestion procedures). Analyze within 6 months.
Instrument Conditions:
1. The Z1nc hollow cathode lamp with lamp energy set at 27.
2. Wavelength: 213.9 ran
3. Slit Width: 0.7 Normal
4. Fuel: Acetylene
5. Oxldant: Air
6. Type of flame: Oxidizing, lean, blue
7. Standards to use for curve set-up: 0.10, 0.20, 0.40, 1.00 mg/L.
Reagent Preparation: (Prepare fresh every 6 months unless otherwise noted.)
1. Standard Zinc Solution (20.0 mg/L Z1nc); P1pet 2 mis of the 1000 ppmstock zinc solution Into a 100 mL volumetric flask, add 1/2 mL HN03,and dilute to the mark with M1111-Q water.
2. Standards (Prepare fresh every month.):
Concentration Volume of Diluteof Standard Z1nc Standard to
0.10 mg/L 0.5 mL of 20.0 mg/L Zn 100 mL0.20 mg/L 1 mL of 20.0 mg/L Zn 100 mL0.40 mg/L 2 mL of 20.0 mg/L Zn 100 mL1.00 mg/L 5 mL of 20.0 mg/L Zn 100 mL
ZnC-1
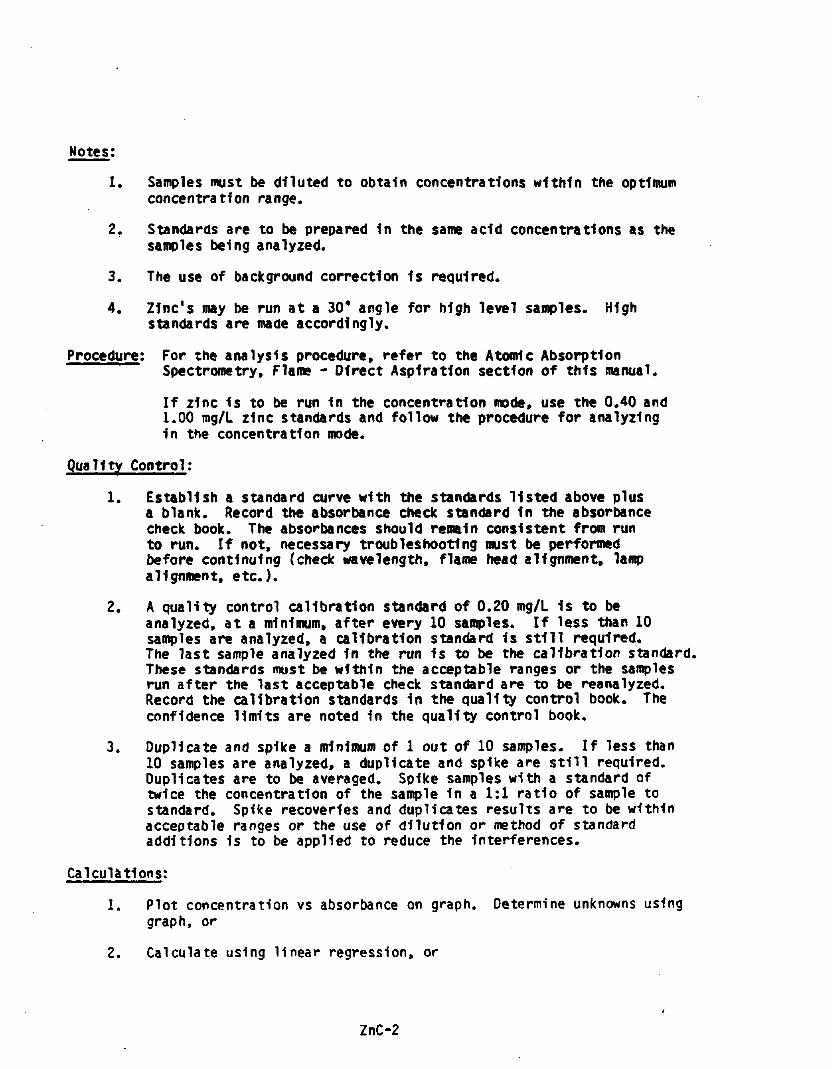
Samples must be diluted to obtain concentrations within the optimumconcentration range.
2. Standards are to be prepared in the same acid concentrations as thesamples being analyzed.
3. The use of background correction 1s required.
4. Zinc's may be run at a 30* angle for high level samples. Highstandards are made accordingly.
Procedure: For the analysis procedure, refer to the Atomic AbsorptionSpectrometry, Flame - Direct Aspiration section of this manual.
If zinc 1s to be run 1n the concentration mode, use the 0.40 and1.00 mg/L zinc standards and follow the procedure for analyzing1n the concentration mode.
Quality Control:
1. Establish a standard curve with the standards listed above plusa blank. Record the absorbance check standard In the absorbancecheck book. The absorbances should remain consistent from runto run. If not, necessary troubleshooting must be performedbefore continuing (check wavelength, flame head alignment, lampalignment, etc.).
2. A quailty control calibration standard of 0.20 mg/L 1s to beanalyzed, at a minimum, after every 10 samples. If less than 10samples are analyzed, a calibration standard 1s still required.The last sample analyzed 1n the run 1s to be the calibration standard.These standards must be within the acceptable ranges or the samplesrun after the last acceptable check standard are to be reanalyzed.Record the calibration standards 1n the quality control book. Theconfidence limits are noted 1n the quality control book.
3. Duplicate and spike a minimum of 1 out of 10 samples. If less than10 samples are analyzed, a duplicate and spike are still required.Duplicates are to be averaged. Spike samples with a standard oftwice the concentration of the sample 1n a 1:1 ratio of sample tostandard. Spike recoveries and duplicates results are to be withinacceptable ranges or the use of dilution or method of standardadditions 1s to be applied to reduce the interferences.
Calculations:
1. Plot concentration vs absorbance on graph. Determine unknowns usinggraph, or
2. Calculate using linear regression, or
ZnC-2

3. Calculate using the concentration mode.
[ALM-8-12] ZnC-3

ANTIMONY
Method: AA - Furnace; Direct Injection
Reference: EPA 1983. Method 204.2
"Analytical Methods for Furnace Atomic Absorption Spectrophotometry",1982. Perkln-Elmer Corporation
"Techniques In Graphite Furnace Atomic Absorption Spectrophotometry11,1985, Perkln-Elmer Corporation
Contract Laboratory Program, "Statement of Work", July, 1985
Detection Unit; 0.005 mg/L
Optimum Concentration Range:
Instrument Conditions:
0.005 - 0.050 mg/L•
1. Antimony electrodeless discharge lamp with lamp energy set at 7.
2. Wavelength: 217.6 ran
3. S11t Width: 0.2 Alternate
4. Mode: Peak Height
5. HGA Furnace Programming:
Step 1:Step 2:Step 3:
Step 4:
12010002000
* Alsot »
2200
(dry temp)(char temo)(atom temp)
press the read,3 sec.
(max temp)
1026
(ramp time)(ramp time)(ramp time)
record and stop
0 (ramp time)
20 (hold time)20 (hold time)
3 (hold time)
flow buttons;
3 (hold time
Press the record button.
6. Sample Volume: 20 uL
7. Standards to use for curve set-up: 10.0, 20.0, 50.0 ug/L.
Sample Handling; Acidify with nitric add to pH < 2. Analyze within 6 months.
SbFuC-1

Reagent Preparation:
1. Standard Antimony Solution (1000 uq/1 Antimony); P1pet 1.00 ml ofthe 1000 ppm stock antimony solution Into a 1000 ml volumetricflask, add 1/2 ml HN03 and dilute to the mark with M1TH-Q water.Prepare fresh every month.
2. Standards (Prepare fresh every week.):
Concentrationof Standard
10.0 ug/L20.0 ug/L50.0 ug/L
Volume ofAntimony Standard
1 mi of 10002 mL of 10005 ml of 1000
ug/L Sbug/L Sbug/L Sb
Diluteto
100 mL100 mL100 mL
Notes:
1.
2.
3.
4.
Samples must be diluted to obtain concentrations within the optimumconcentration range.
Standards are to be prepared In the same acid concentrations asthe samples being analyzed.
The use of background correction 1s required.
The use of hallde adds should be avoided.
5. Be careful when reporting the units!
Procedure; For the analysis procedure, refer to the Atomic AbsorptionSpectrometry, Furnace - Direct Injection section of this manual.
For the use of concentration mode, use the 20,0 and 50.0 standardsand follow the procedure for using the concentration mode.
Quality Control:
1. Establish a standard curve with the standards listed above plusa blank. Record the absorbance check standard in the absorbancecheck book. The absorbances should remain consistent from run torun. If not, necessary troubleshooting must be performed beforecontinuing (check wavelength, furnace alignment, lamp alignment,graphite tube, etc.)
2. A quality control calibration standard of 20 ug/L 1s to be analyzed,at a minimum, after every 10 samples. If less than 10 samples areanalyzed, a calibration standard Is still required. The last sampleanalyzed in the run 1s to be the calibration standard. These standardsmust be within acceptable ranges or the samples run after the lastacceptable calibration standard are to be reanalyzed. Record the calibrationstandard in the quality control book. The confidence limits arenoted in the quality control book.
SbFuC-2
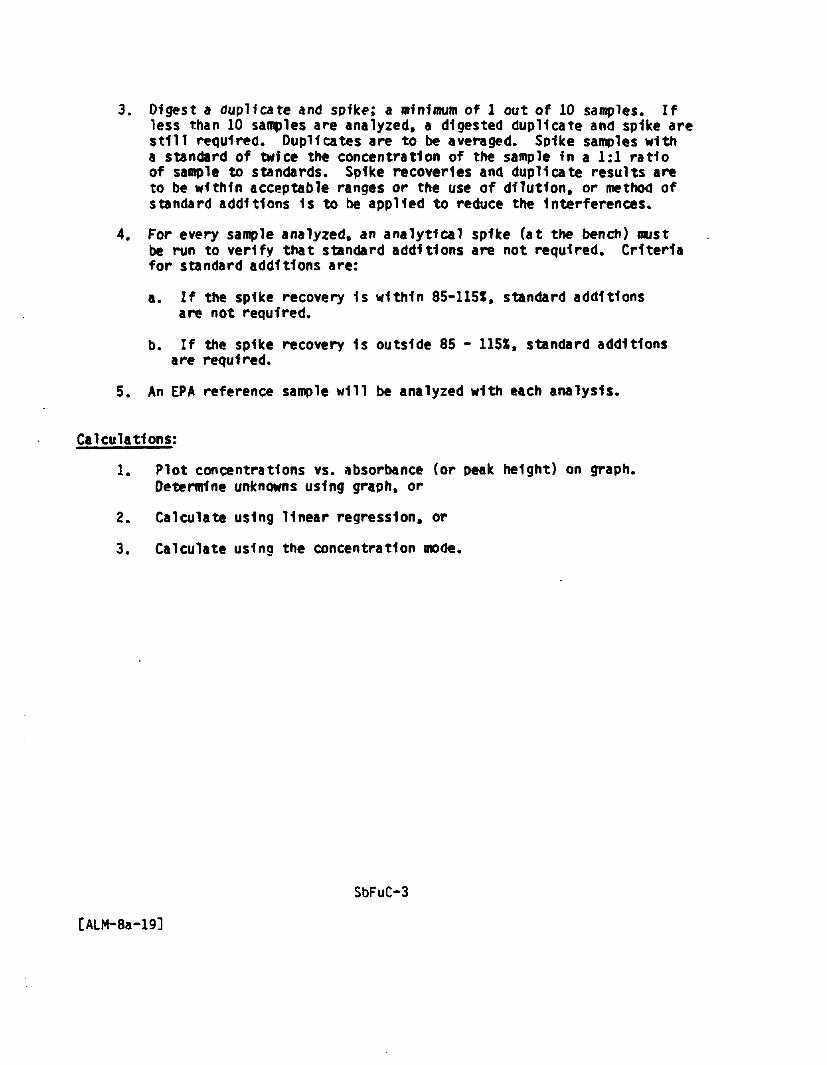
3. Digest a duplicate and spike; a minimum of 1 out of 10 samples. Ifless than 10 samples are analyzed, a digested duplicate and spike arestill required. Duplicates are to be averaged. Spike samples witha standard of twice the concentration of the sample in a 1:1 ratioof sample to standards. Spike recoveries and duplicate results areto be within acceptable ranges or the use of dilution, or method ofstandard additions is to be applied to reduce the interferences.
4. For every sample analyzed, an analytical spike (at the bench) mustbe run to verify that standard additions are not required. Criteriafor standard additions are:
a. If the spike recovery is within 85-115%, standard additionsare not required.
b. If the spike recovery is outside 85 - 115X, standard additionsare required.
5. An EPA reference sample will be analyzed with each analysis.
Calculations:
1. Plot concentrations vs. absorbance (or peak height) on graph.Determine unknowns using graph, or
2. Calculate using linear regression, or
3. Calculate using the concentration mode.
SbFuC-3
[ALM-8a-19]

ARSENIC
Method: AA - Furnace; Direct Injection
Reference; ERA 1983, Method 206.2
"Analytical Methods for Furnace Atomic Absorption Spectrophotometry",1982, Perkln-Elmer Corporation
"Techniques 1n Graphite Furnace Atomic Absorption Spectrophotometry",1985, Perkln-Elmer Corporation
Contract Laboratory Program, "Statement of Work", July, 1985
Detection Limit; 0.002 mg/L
Optimum Concentration Range; 0.002 - 0.050 mg/L
Sample Handling; Acidify with nitric add to pH < 2. Analyzed within 6months. All samples must be digested prior to analysis.
Instrument Conditions;1. Arsenic electrodeless discharge lamp with lamp energy set at 8.
2. Wavelength: 193.7 nm
3. SUt Width; 0.7 Alternate4. Mode: Peak height
5. HGA Furnace Programming:Step 1: 130 (dry temp) 10 (ramp time) 20 (hold time)Step 2: 1300 (char temp) 10 (ramp time) 10 (hold time)Step 3: 2500 (atom temp) 0 (ramp time) 3 (hold time)
* Also press the read, record and stop flow buttons; enter t • 3 sec,
Step 4: 2500 (max temp) 0 (ramp time) 3 (hold time)
Press record button.
6. Sample Volume: 20 uL7. Standards to use for curve set-up: 5.0, 10.0, 20.0, 50.0 ug/L.
8. Pyrolytlc tubes must be used.
AsFuC-1
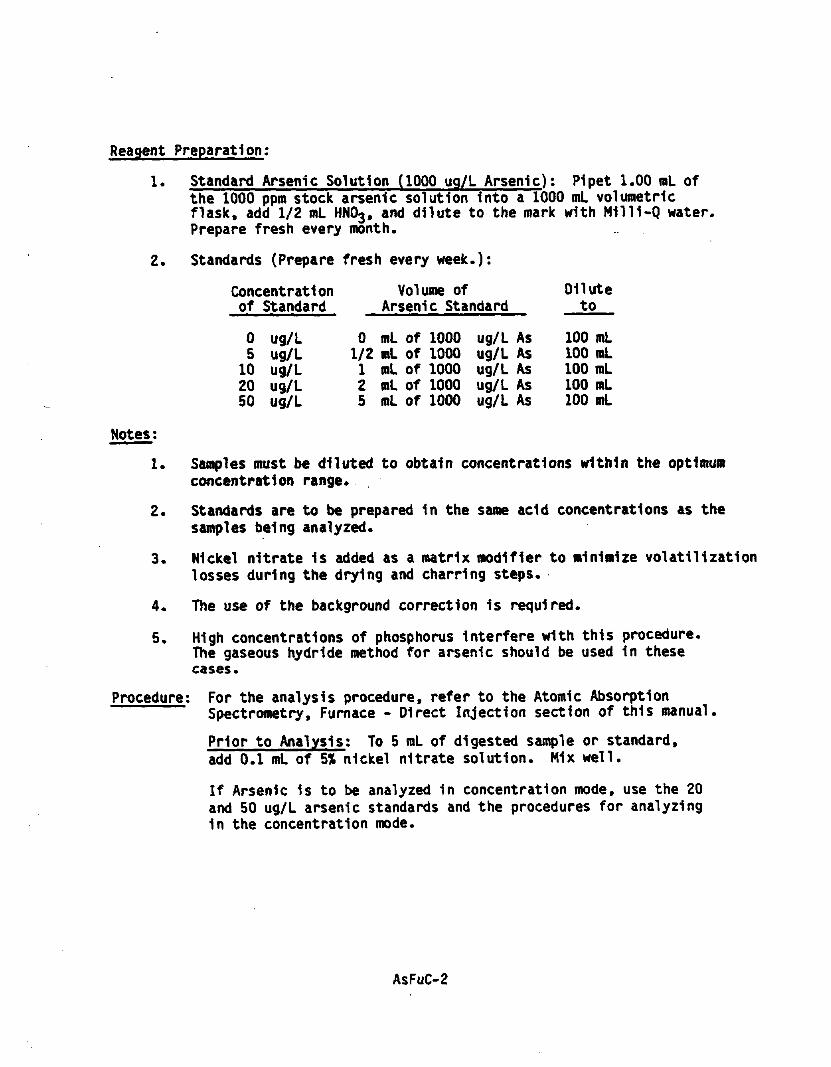
Reagent Preparation:
1. Standard Arsenic Solution (1000 ug/L Arsenic): P1pet 1.00 mL ofthe 1000 ppm stock arsenic solution Into a 1000 ml volumetricflask, add 1/2 ml HNO^ and dilute to the mark with M1111-Q water.Prepare fresh every month.
2. Standards (Prepare fresh every week.):
Concentrationof
05
102050
Standard
ug/Lug/Lug/Lug/Lug/L
Volume ofArsenic Standard
01/2125
mLmLmLmLmL
ofofofofof
10001000100010001000
ug/Lug/Lug/Lug/Lug/L
AsAsAsAsAs
Diluteto
100100100100100
mLmLmLmLmL
Notes:1. Samples must be diluted to obtain concentrations within the optimum
concentration range*2. Standards are to be prepared 1n the same add concentrations as the
samples being analyzed.
3. Nickel nitrate 1s added as a matrix modifier to minimize volatilizationlosses during the drying and charring steps.
4* The use of the background correction 1s required.5. High concentrations of phosphorus Interfere with this procedure.
The gaseous hydride method for arsenic should be used in thesecases.
Procedure; For the analysis procedure, refer to the Atomic AbsorptionSpectrometry, Furnace - Direct Injection section of this manual.Prior to Analysis; To 5 raL of digested sample or standard,add 0.1 mL of 5% nickel nitrate solution. Mix well.
If Arsenic 1s to be analyzed in concentration mode, use the 20and 50 ug/L arsenic standards and the procedures for analyzingIn the concentration mode*
AsFuC-2
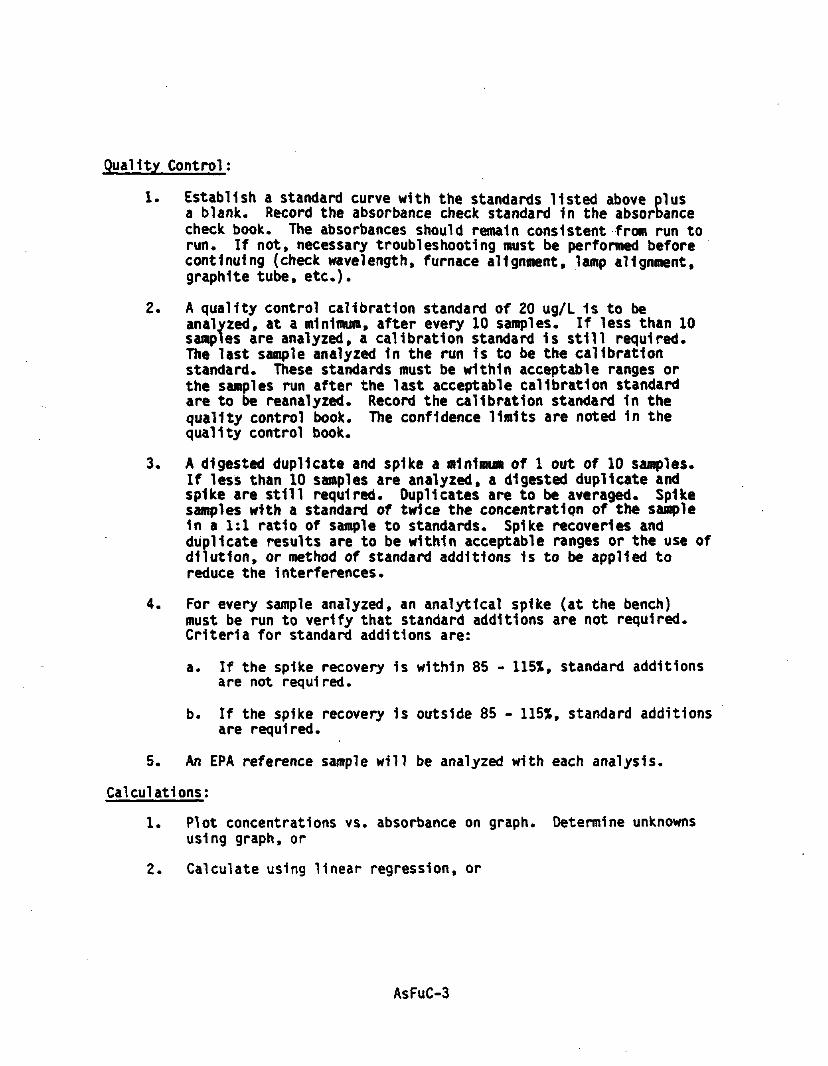
Quality Control:
1. Establish a standard curve with the standards listed above plusa blank. Record the absorbance check standard in the absorbancecheck book. The absorbances should remain consistent from run torun. If not, necessary troubleshooting must be performed beforecontinuing (check wavelength, furnace alignment, lamp alignment,graphite tube, etc.).
2. A quality control calibration standard of 20 ug/L 1s to beanalyzed, at a minimum, after every 10 samples. If less than 10samples are analyzed, a calibration standard 1s still required.The last sample analyzed in the run 1s to be the calibrationstandard. These standards must be within acceptable ranges orthe samples run after the last acceptable calibration standardare to be reanalyzed. Record the calibration standard in thequality control book. The confidence limits are noted in thequality control book.
3. A digested duplicate and spike a minimum of 1 out of 10 samples.If less than 10 samples are analyzed, a digested duplicate andspike are still required. Duplicates are to be averaged. Spikesamples with a standard of twice the concentration of the samplein a 1:1 ratio of sample to standards. Spike recoveries andduplicate results are to be within acceptable ranges or the use ofdilution, or method of standard additions 1s to be applied toreduce the interferences.
4. For every sample analyzed, an analytical spike (at the bench)must be run to verify that standard additions are not required.Criteria for standard additions are:
a. If the spike recovery 1s within 85 - 115%, standard additionsare not required.
b. If the spike recovery 1s outside 85 - 115%, standard additionsare required.
5. An EPA reference sample will be analyzed with each analysis.
Calculations;1. Plot concentrations vs. absorbance on graph. Determine unknowns
using graph, or
2. Calculate using linear regression, or
AsFuC-3

3. Calculate using the concentration mode.
[ALM-8a-9] AsFuC-4

CADMIUM
Method: AA - Furnace; Direct Injection
Reference: EPA 1983, Method 213.2
"Analytical Methods for Furnace Atomic Absorption Spectrophotometry",1982, Perkln-Elmer Corporation
"Techniques 1n Graphite Furnace Atomic Absorption Spectrophotometry",1985, Perkln-Elmer Corporation
Contract Laboratory Program, "Statement of Work", July, 1985
Detection Limit: 0.0002 mg/L
Optimum Concentration Range; 0.0002 - 0.0020 rog/L
Sample Handling; Acidify with nitric add to pH < 2. All samples must bedigested prior to analysis (refer to appropriate digestionprocedures). Analyze within 6 months.
Instrument Conditions;
1. Cadmium hollow cathode lamp with lamp energy set at 4.
2. Wavelength: 228.8 ran
3. SUt Width: 0.7 Alternate
4. Mode: Peak area
5. HGA Furnace Programing:
Step 1: 120 (dry temp) 10 (ramp time) 20 (hold time)Step 2: 250 (char temp) 10 (ramp time) 20 (hold time)Step 3: 21Qb (atom temp) 2 (ramp time) 3 (hold time)
* Also press the read, record and stop flow buttons; enter t a 5 sec
Step 4: 2700 (max temp) 1 (ramp time) 5 (hold time)
Press record button.
6. Sample Volume: 20 ul
7. Standards to use for curve set-up: 0.50, 1.00, 2.00, ug/L
8. Pyrolytic tubes must be used.
CdFuC-1

Reagent Preparation:
1. Standard Cadmium Solution (1000 ug/L Cadmium); P1pet 1.00 ml ofthe 1000 ppm stock cadmium solution into a 1000 ml volumetricflask, add 1/2 ml HN03f and dilute to the mark with M1111-Q water.Prepare fresh every month.
2. Working Cadmium Solution (100 ug/T Cadmium); P1pet 10 ml of the1000 ug/1 cadmium Into a 100 mL volumetric flask and dilute tothe mark with M1111-Q water. Prepare fresh every month.
3. Standards (Prepare fresh every week.):
Concentration Volume of Diluteof Standard Cadmium Standard to
0.00 ug/L 0 mL of 100 ug/L Cd 100 nt0.50 ug/L 0.5 mL of 100 ug/L Cd 100 mL1.00 ug/L 1 mL of 100 ug/L Cd 100 mL2.00 ug/L 2 mL of 100 ug/L Cd 100 mL
Notes;
1. Samples must be diluted to obtain concentrations within the optimumconcentration range*
2. Standards are to be prepared In the same add concentrations as thesamples being analyzed.
3. The use of background correction 1s required.
4. The cadmium flame procedure Is recommended where concentrationsof greater than 0.10 mg/L are expected.
Procedure: For the analysis procedure, refer to the Atomic AbsorptionSpectrometry, Furnace - Direct Injection section of this manual.
Use of peak area Is required.
If cadmium 1s to be analyzed in concentration mode, use the 1.00and 2.00 ug/L cadmium standards and follow the procedures foranalyzing 1n the concentration mode.
Quality Control:
1. Establish a standard curve with the standards listed above plus ablank. Record the absorbance check standard 1n the absorbance checkbook. The absorbances should remain consistent from run to run. Ifnot, necessary troubleshooting must be performed before continuing(check wavelength, furnace alignment, lamp alignment, graphite tube,etc.).
CdFuC-2

2. A quality control calibration standard of 1.00 ug/L 1s to be analyzed,at a minimum, after every 10 samples. If less than 10 samples areanalyzed, a calibration standard 1s still required. The last sampleanalyzed 1n the run 1s to be the calibration standard. These standardsmust be within the acceptable ranges or the samples run after thelast acceptable calibration standard are to be reanalyzed. Recordthe calibration standard 1n the quality control book. The confidencelimits are noted 1n the quality control book.
3. A digested duplicate and spike a minimum of 1 out of 10 samples.If less than 10 samples are analyzed, a digested duplicate andspike are still required. Duplicates are to be averaged. Spikesamples with a standard of twice the concentration of the sample1n a 1:1 ratio of sample to standards. Spike recoveries and duplicatesare to be within acceptable ranges or the use of dilution, ormethod of standard additions 1s to be applied to reduce theInterferences.
4. For every sample analyzed, an analytical spike (at the bench)must be run to verify that standard additions are not required.Criteria for standard additions Is:
a. If the spike recovery 1s within 85 - 1151, standard additionsare not required.
b. If the spike recovery 1s outside 85 - 1151, standard additionsare required.
5. An ERA reference sample will be analyzed with each analysis.
Calculations:
1. Plot concentrations vs. peak area on graph. Determine unknownsusing graph, or
2. Calculate using linear regression, or
3. Calculate using concentration mode.
Revision Dates
Michael J. LlnskensLaboratory Manager
xv\ rsv
K1m 0. FlnnerAnalytical Laboratory QA Officer
Lawrence D. AndersenVice President, Technical Services
[ALM-8a-13] CdFuC-3

CHROMIUM
Method: AA - Furnace; Direct Injection
Reference: EPA 1983. Method 218.2
"Analytical Methods for Furnace Atomic Absorption Spectrophotometry",1982, Perkln-Elmer Corporation
Techniques 1n Graphite Furnace Atomic Absorption Spectrophotometry",1985, Perkln-Elmer Corporation
Contract Laboratory Program, "Statement of Work", July, 1985
Detection Limit: 0.0002 mg/L
Optimum Concentration Range; 0.0002 - 0.010 mg/L
Sample Handling; Acidify with nitric acid to pH < 2. Drinking waters andfiltered groundwater free of partlculate matter and organlcsmay be analyzed directly, while wastewaters, leachates,solids, etc. must be digested prior to analysis (refer toappropriate digestion procedures). Analyze within 6 months.
Instrument Conditions:
1. Chromium hollow cathode lamp with lamp energy set at 25.
2. Wavelength: 357.9 nrn
3. SUt Width: 0.7 Alternate
4. Mode: Peak height
5. HGA Furnace Programming:
Step 1: 130 (dry temp) 15 (ramp time) 15 (hold time)Step 2: 1000 (char temp) 10 (ramp time) 15 (hold time)Step 3: 2300 (atom temp) 0 (ramp time) 3 (hold time)
* Also press the read, record and stop flow buttons; enter t « 3 sec
Step 4: 2300 (max temp) 0 (ramp time) 3 (hold time)
Press the record button.
6. Sample Volume: 20 uL
7. Standards to u'se for curve set-up: 1.00, 5.00, 10.0 uq/L.
CrFuC-1

Reagent Preparation:
1. Standard Chromium Solution (1000 ug/L Chromium): P1pet 1.00 mL ofthe 1000 ppm stock Chromium solution Into a 1000 ml volumetric flask,add 1/2 mL HM03. and dilute to the mark with M1111-0 water. Preparefresh every month.
2. Working Chromium Standard (100 ug/L Chromium); P1pet 10 ml of the1000 ug/L chromium into a 100 ml volumetric* flask and dilute tothe mark with M1111-Q water. Prepare fresh every month.
3. Standards (Prepare fresh every week.):
Concentrationof
1.5.10
Standard
0000.0
ug/Lug/Lug/L
Volume ofChromium
15
10
.0
.0
.0
mLmlmi
ofofof
Standard
100100100
ug/Lug/Lug/L
CrCrCr
Diluteto
100100100
mLmLmL
4. Calcium Nitrate: 11. 8g Ca(N03)2» dilute to 100 mL a volumetric flask,
5. Hydrogen Peroxide; 30X H . purchased.
6. Mixed Ca(NCh) + H?0? Solution; rlO^rnL CaOK^Jg mL In a volumetricflask solution +10 mi H202t dilute to 100 mL.
Samples must be diluted to obtain concentrations within the optimumconcentration range.
Standards are to be prepared in the same acid concentrations as thesamples being analyzed.
Low concentrations of calcium may cause Interferences, yet atconcentrations above 200 mg/L calcium, the effect Is constant. Toensure a constant effect, calcium Is added as a matrix modifier.
4. 30? hydrogen peroxide 1s added (1 mL of 301 H^ to 100 mL sampleand standards) to convert all chromium to the trfvalent state.
5. Be careful when reporting units!
Procedure: For the analysis procedure, refer to the Atomic AbsorptionSpectrometry, Furnace - Direct Injection section of this manual.
To 10 mL of samples, standards, and blanks add 1 mL of thesolution.
If chromium Is to be analyzed 1n concentration mode, use the5.00 and 10.0 ug/L chromium standards and follows the procedurefor analyzing In the concentration mode.
CrFuC-2
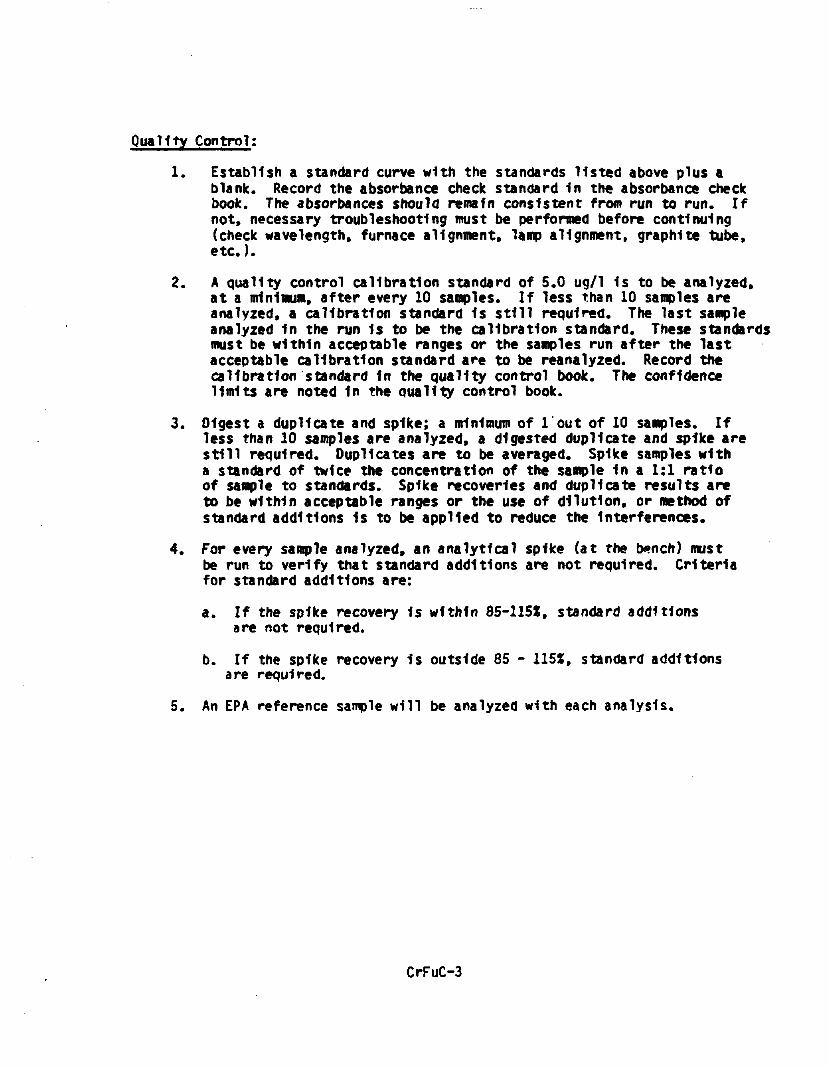
Quality Control:
1. Establish a standard curve with the standards listed above plus ablank. Record the absorbance check standard 1n the absorbance checkbook. The absorbances should remain consistent from run to run. Ifnot, necessary troubleshooting must be performed before continuing(check wavelength, furnace alignment, lamp alignment, graphite tube,etc.).
2. A quality control calibration standard of 5.0 ug/1 Is to be analyzed,at a minimum, after every 10 samples. If less than 10 samples areanalyzed, a calibration standard 1s still required. The last sampleanalyzed 1n the run 1s to be the calibration standard. These standardsmust be within acceptable ranges or the samples run after the lastacceptable calibration standard are to be reanalyzed. Record thecalibration standard In the quality control book. The confidencelimits are noted In the Quality control book.
3. Digest a duplicate and spike; a minimum of 1 out of 10 samples. Ifless than 10 samples are analyzed, a digested duplicate and spike arestill required. Duplicates are to be averaged* Spike samples witha standard of twice the concentration of the sample 1n a 1:1 ratioof sample to standards. Spike recoveries and duplicate results areto be within acceptable ranges or the use of dilution, or method ofstandard additions 1s to be applied to reduce the Interferences.
4. For every sample analyzed, an analytical spike (at the bench) mustbe run to verify that standard additions are not required. Criteriafor standard additions are:
a. If the spike recovery 1s within 85-115%, standard additionsare not required.
b. If the spike recovery 1s outside 85 - 115X, standard additionsare required.
5. An ERA reference sample will be analyzed with each analysis.
CrFuC-3

Calculations:
1. Plot concentrations vs. absorbance (or peak height) on graph.Determine unknowns using graph, or
2. Calculate using linear regression, or
3. Calculate using the concentration mode.
Revision Date
11-14-86_^Michael J . L l n s k e n s 'Laboratory Manager 4-13-87
Klm'D. FlnnerAnalytical Labpratory QA/QC Officer
,^-^^^L^. //f£sLawrence 0. AndersenVice President, Technical Services
CrFuC-4
[ALM-8a-21]
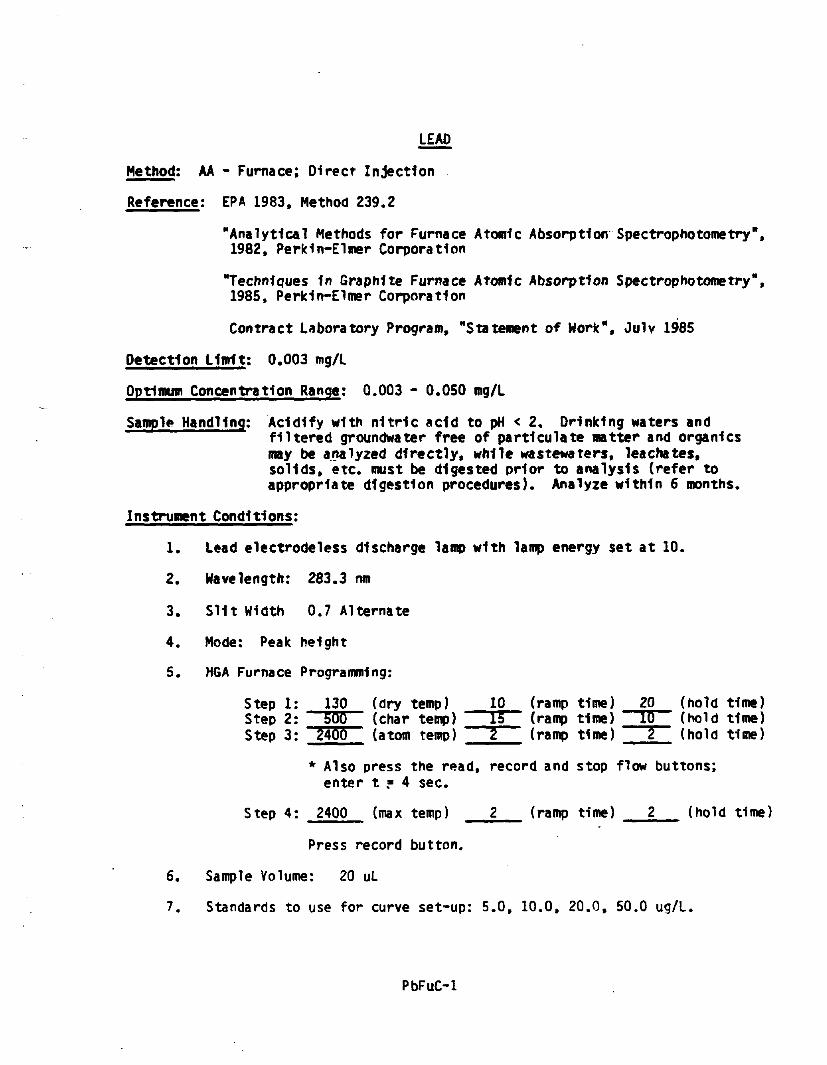
LEAD
Method: AA - Furnace; Direct Injection
Reference: EPA 1983, Method 239.2
"Analytical Methods for Furnace Atomic Absorption Spectrophotometry",1982, Perkln-Elmer Corporation
"Techniques In Graphite Furnace Atomic Absorption Spectrophotometry",1985, Perkln-Elmer Corporation
Contract Laboratory Program, "Statement of Work", July 1985
Detection Limit: 0.003 mg/L
Optimum Concentration Range; 0.003 - 0.050 mg/L
Sample Handling; Acidify with nitric acid to pH < 2, Drinking waters andfiltered groundwater free of participate matter and organlcsmay be analyzed directly, while wastewaters, leachates,solids, etc. must be digested prior to analysis (refer toappropriate digestion procedures). Analyze within 6 months.
Instrument Conditions:
1. Lead electrodeless discharge Tamp with lamp energy set at 10.
2. Wavelength: 283.3 nm
3. S11t Width 0.7 Alternate
4. Mode: Peak height
5. HGA Furnace Programming:
Step 1: 130 (dry temp) 10 (ramp time) 20 (hold time)Step 2: 500 (char temp) 15 (ramp time) 10 (hold time)Step 3: 2400 (atom temp) 2 (ramp time) 2 (hold time)
* Also press the read, record and stop flow buttons;enter t » 4 sec.
Step 4: 2400 (max temp) 2 (ramp time) 2 (hold time)
Press record button.
6. Sample Volume: 20 uL
7. Standards to use for curve set-up: 5.0, 10.0, 20.0, 50.0 ug/L.
PbFuC-1
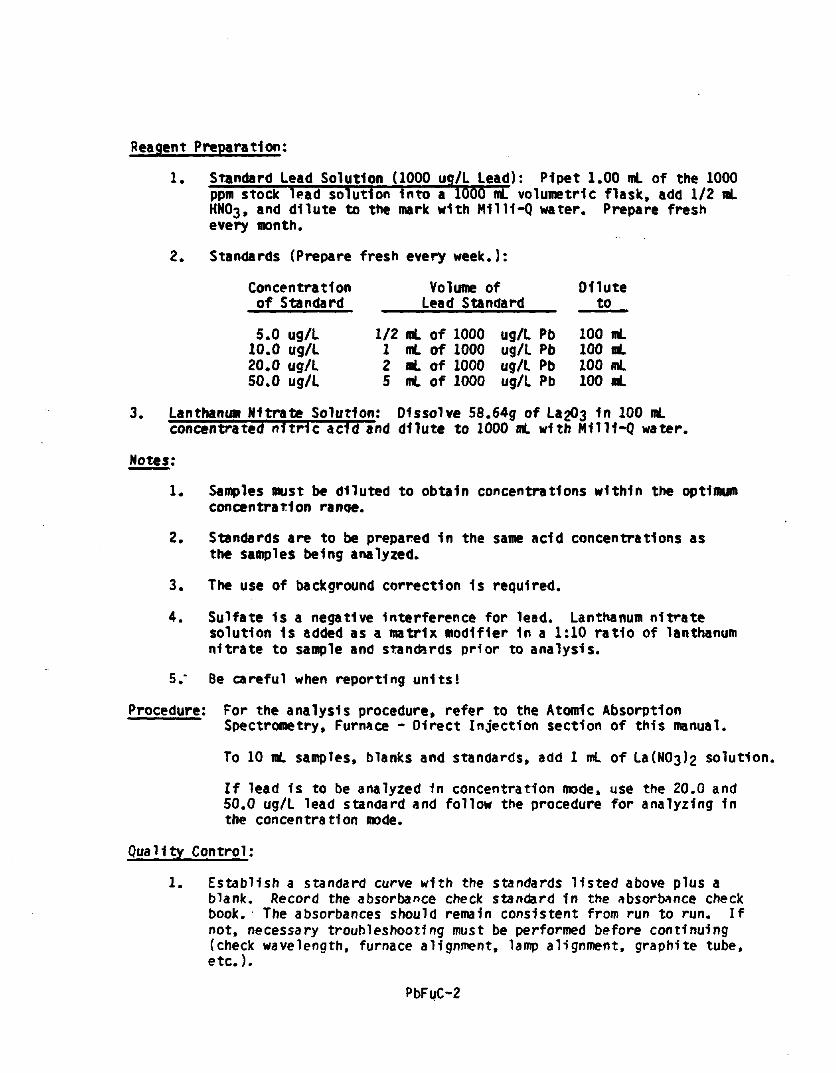
Reagent Preparation:
1. Standard Lead Solution (1000 ug/L Lead): Plpet 1.00 ni of the 1000ppm stock lead solution into a 1000 rnL volumetric flask, add 1/2 mLHN03, and dilute to the mark with M1111-Q water. Prepare freshevery month.
2. Standards (Prepare fresh every week.):
Concentration Volume of Diluteof Standard Lead Standard to
5.0 ug/L 1/2 ml of 1000 ug/L Pb 100 mL10.0 ug/L 1 mL of 1000 ug/L Pb 100 nL20.0 ug/L 2 mL of 1000 ug/L Pb 100 mL50.0 ug/L 5 mL of 1000 ug/L Pb 100 mL
3. Lanthanum Nitrate Solution: Dissolve 58.64g of La^a 1n 100 raLconcentrated nitric acid and dilute to 1000 mL with M1111-Q water.
Notes:
1. Samples must be diluted to obtain concentrations within the optimumconcentration ranqe.
2. Standards are to be prepared in the same acid concentrations asthe samples being analyzed.
3. The use of background correction 1s required.
4. Sulfate 1s a negative interference for lead. Lanthanum nitratesolution 1s added as a matrix modifier 1n a 1:10 ratio of lanthanumnitrate to sample and standards prior to analysis.
5." Be careful when reporting units!
Procedure: For the analysis procedure, refer to the Atomic AbsorptionSpectrometry, Furnace - Direct Injection section of this manual.
To 10 mL samples, blanks and standards, add 1 mL of La(N03>2 solution.
If lead is to be analyzed in concentration mode, use the 20.0 and50.0 ug/L lead standard and follow the procedure for analyzing Inthe concentration mode.
Quality Control:
1. Establish a standard curve with the standards listed above plus ablank. Record the absorbance check standard 1n the absorbance checkbook. The absorbances should remain consistent from run to run. Ifnot, necessary troubleshooting must be performed before continuing(check wavelength, furnace alignment, lamp alignment, graphite tube,etc.).
PbFuC-2

2. A quality control calibration standard of 20.0 ug/1 1s to be analyzed,at a minimum, after every 10 samples. If less than 10 samples areanalyzed, a calibration standard 1s still required. The last sampleanalyzed 1n the run 1s to be the calibration standard. These standardsmust be within acceptable ranges or the samples run after the lastacceptable calibration standard are to be reanalyzed. Record thecalibration standard 1n the quality control book. The confidencelimits are noted In the quality control book.
, 3. Digest a duplicate and spike; a minimum of 1 out of 10 samples. Ifless than 10 samples are analyzed, a digested duplicate and spike arestill required. Duplicates are to be averaged. Spike samples witha standard of twice the concentration of the sample 1n a 1:1 ratioof sample to standards. Spike recoveries and duplicate results areto be within acceptable ranges or the use of dilution, or method ofstandard additions 1s to be applied to reduce the Interferences.
4. For every sample analyzed, an analytical spike (at the bench) mustbe run to verify that standard additions are not required. Criteriafor standard additions are:
a. If the spike recovery 1s within 85-115%, standard additionsare not required.
b. If the spike recovery Is outside 85 - 115X, standard additionsare required.
5. An EPA reference sample will be analyzed with each analysis.
Calculations:
1. Plot concentrations vs. absorbance (or peak height) on graph.Determine unknowns using graph, or
2. Calculate using linear regression, or
3. Calculate using the concentration mode.
Revision Date
11-14-86Michael J. LlnskensLaboratory Manager 4*13-87
\>Kirn D. FlnnerAnalytical Laboratory QA/QC Officer
Lawrence D. AndersenVice President, Technical Services
PbFuC-3
[ALM-8a-22]
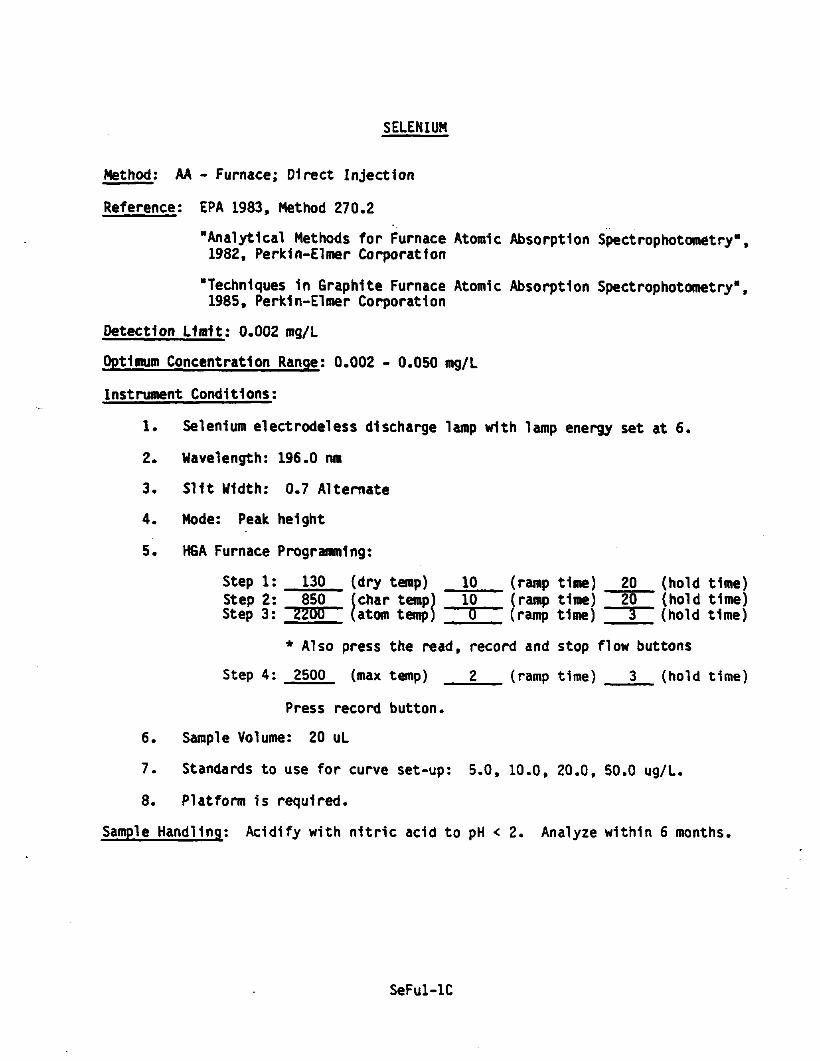
SELENIUM
Method; AA - Furnace; Direct Injection
Reference; EPA 1983, Method 270.2
"Analytical Methods for Furnace Atomic Absorption Spectrophotometry",1982, Perkln-Elmer Corporation
"Techniques 1n Graphite Furnace Atomic Absorption Spectrophotometry",1985, Perkln-Elmer Corporation
Detection Uroit: 0.002 mg/L
Optimum Concentration Range: 0.002 - 0.050 mg/L
Instrument Conditions;
1. Selenium electrodeless discharge lamp with lamp energy set at 6.
2. Wavelength: 196.0 nm
3. Slit Width: 0.7 Alternate
4. Mode: Peak height
5. HGA Furnace Programming:
Step 1: 130 (dry temp) 10 (ramp time) 20 (hold time)Step 2: 850 (char temp) 10 (ramp time) 20 (hold time)Step 3: zzoo (atom temp) 0 (ramp time) 3 (hold time)
* Also press the read, record and stop flow buttonsStep 4: 2500 (max temp) 2 (ramp time) 3 (hold time)
Press record button.6. Sample Volume: 20 uL
7. Standards to use for curve set-up: 5.0, 10.0, 20.0, 50.0 ug/L.
8. Platform 1s required.
Sample Handling; Acidify with nitric add to pH < 2. Analyze within 6 months.
SeFul-lC

Reagent Preparation:
1* Standard Selenium Solution (1000 ug/L Selenium): PI pet 1.00 mLof the 1000 ppcn stock selenium solution Into a 1000 ml volumetricflask, add 1/2 HN03, and dilute to the mark with M1111-Q water.Prepare fresh every month.
2. Standards (Prepare fresh every week.):
Concentrationof
10.20.50.
Standard
05000
ug/Lug/Lug/Lug/Lug/L
Volume ofSelenium Standard
01/2125
mLmLmLmLmL
ofofofofof
10001000100010001000
ug/Lug/Lug/Lug/Lug/L
SeSeSeSeSe
Diluteto
100100100100100
mLmLmLmLmL
3. Nickel Nitrate 5% Solution: Dissolve 25.0 grms of Nickel nitrateto 100 mLs of D.I* water
Samples must be diluted to obtain concentrations within the optimumconcentration range.
2. Standards and samples are to be digested prior to analysis.(See AsSedlg for aqueous samples and Soil Dig for non-aqueoussamples.)
3. Chloride (> 800 rog/L) and sulfate (> 200 mg/L) Interfere withthis selenium procedure. Nickel nitrate 1s added as a matrixmodifier to minimize these Interferences.
4. Background correction 1s required.
5. Selenium may also be analyzed by the gaseous hydride technique.
6. Platform technique 1s required.
Procedure: For the analysis procedure, refer to the Atomic AbsorptionSpectrometry, Furnace - Direct Injection section of this manual.
For concentration mode, use the 20.0 and 50.0 standards andfollow the procedure for analyzing using the concentration mode.
Quality Control;
1. Establish a standard curve with the standards listed above plus ablank. Record the absorbance check standard in the absorbance checkbook. The absorbances should remain consistent from run to run. Ifnot, necessary troubleshooting must be performed before continuing(check wavelength, furnace alignment, lamp alignment, graphite tube,etc.).
SeFul-2C

2. A quality control calibration standard of 20.0 ug/L Is to be analyzed,at a minimum, after every 10 samples. If less than 10 samples areanalyzed, a calibration standard 1s still required. The last sampleanalyzed 1n the run 1s to be the calibration standard. These standardsmust be within acceptable ranges or the samples run after the lastacceptable calibration standard are to be reanalyzed. Record thecalibration standard in the quality control book. The confidencelimits are noted in the quality control book.
3. Duplicate and spike a minimum of 1 out of 10 samples. If lessthan 10 samples are analyzed, a duplicate and spike are stillrequired. Duplicates are to be averaged. Spike samples with astandard of twice the concentration of the sample in a 1:1 ratioof sample to standards. Spike recoveries and duplicates are to bewithin acceptable ranges or the use of matrix modifiers, dilution,or method of standard additions 1s to be applied to reduce theInterferences.
4. An ERA reference standard will be analyzed with each analysis.
Calculations;
1. Plot concentrations vs» absorbance (or peak height) on graph.Determine unknowns using graph, or
2. Calculate using linear regression, or
3. Calculate using concentration mode.
[ALM-8a-5] SeFul-3C
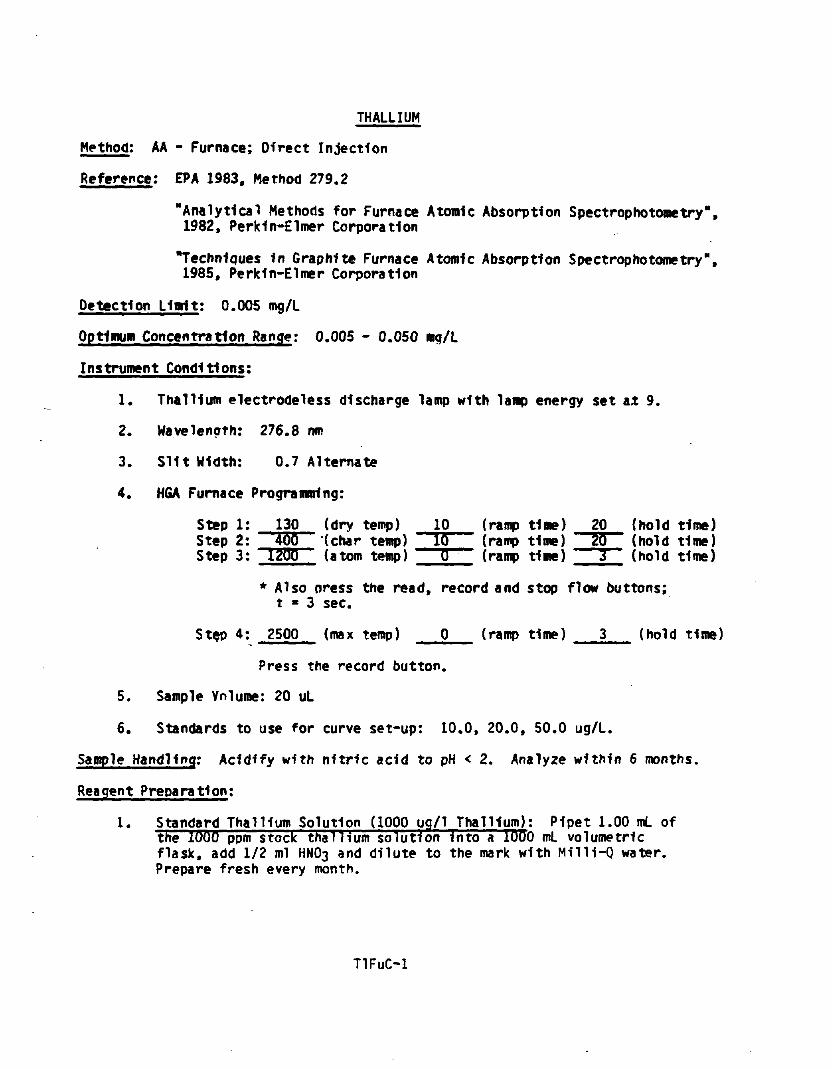
THALLIUM
Method; AA - Furnace; Direct Injection
Reference: EPA 1983, Method 279.2
"Analytical Methods for Furnace Atomic Absorption Spectrophotometry11,1982. Perkin-Elmer Corporation
"Techniques In Graphite Furnace Atomic Absorption Spectrophotometry",1985, Perkln-Elmer Corporation
Detection Limit: 0.005 mg/L
Optimum Concentration Range; 0.005 - 0.050 mq/L
Instrument Conditions:
1. Thallium electrodeless discharge lamp with lamp energy set at 9.
2. Wavelength: 276.8 ntn
3. Slit Width: 0.7 Alternate
4. HGA Furnace Programming:
Step 1: 130 (dry temp) 10 (ramp time) 20 (hold time)Step 2: 400 '(char temp) 10 (ramp time) 20 (hold time)Step 3: XZUO (atom temp) 0 (ramp time) 3 (hold time)
* Also press the read, record and stop flow buttons;t « 3 sec.
St$p 4; 2500 (max temp) 0 (ramp time) 3 (hold time)
Press the record button.
5. Sample Volume: 20 uL
6. Standards to use for curve set-up: 10.0, 20.0, 50.0 ug/L.
Sample Handling; Acidify with nitric add to pH < 2. Analyze within 6 months.
Reagent Preparation;
1. Standard Thallium Solution (1000 ug/1 Thallium); P1pet 1.00 mL ofthe 1000 ppm stock thallium solution into a 1000 ml volumetricflask, add 1/2 ml HN03 and dilute to the mark with Milli-Q water.Prepare fresh every month.
TlFuC-1

Standards (Prepare fresh every week.):
Notes:
Concentrationof Standard
10.0 uq/L20.0 ug/L50.0 ug/L
Volume ofThallium Standard
1 ml of 1000 uq/L Tl2 mL of 1000 ug/L Tl5 mL of 1000 ug/L Tl
Diluteto
100 ml100 nL100 mL
1. Samples must be diluted to obtain concentrations within the optimumconcentration range.
2. Standards are to be prepared In the same acid concentrations asthe samples being analyzed.
3. The use of background correction 1s required.
4. B* careful when reporting the units!
Procedure: For the analysis procedure, refer to the Atomic AbsorptionSpectrometry, Furnace - Direct Injection section of this manual.
For the use of the concentration mode, use the 20.0 and 50.0 standardsand follow the procedure for analyzing In the concentration mode.
Quality Control:
1. Establish a standard curve with the standards listed above plus ablank. Record the absorbance check standard 1n the absorbance checkbook. The absorbances should remain consistent from run to run. Ifnot, necessary troubleshooting must be performed before continuing(check wavelength, furnace alignment, lamp alignment, graphite tube,etc.).
2. A quality control calibration standard of 20.0 ug/1 Is to be analyzed,at a minimum, after every 10 samples. If less than 10 samples areanalyzed, a calibration standard 1s still required. The last sampleanalyzed In the run 1s to be the calibration standard. These standardsmust be within acceptable ranges or the samples run after the lastacceptable calibration standard are to be reanalyzed. Record thecalibration standard 1n the quality control book. The confidencelimits are noted 1n the quality control book.
3. Duplicate and spike a minimum of 1 out of 10 samples. If less than10 samples are analyzed, a duplicate and spike are still required.Duplicates are to be averaged. Spike samples with a standard oftwice the concentration of the sample 1n a 1:1 ratio of sample tostandards. Spike recoveries and duplicates are to be within anacceotable range or the use of matrix modifiers, dilution, or methodof standard additions 1s to be applied to reduce the interferences.
TlFuC-2

4. An ERA reference standard will be analyzed with each analysis.
Calculations:
1. Plot concentrations vs. absorbance (or peak height) on graph.Determine unknowns using graph, or
2. Calculate using linear regression, or
3. Calculate using concentration mode.
[ALM-8a-2] TlFuC-3

VANADIUM
Method: AA - Furnace; Direct Injection
Reference: EPA 1983, Method 286.2
"Analytical Methods for Furnace Atomic Absorption Spectrophotoraetry".1982, Perkln-Elmer Corporation
"Techniques 1n Graphite Furnace Atomic Absorption Spectrophotometry",1985, Perkln-Elmer Corporation
Contract Laboratory Program, "Statement of Work", July, 1985
Detection Limit: 0.002 mg/L
Optimum Concentration Range: 0.002 - 0.050 mg/L
Instrument Conditions:
1. Vanadium hollow cathod lamp with lamp energy set at 40.
2. Wavelength: 318.4 ran
3. Slit Width: 0.7 Alternate J " '
4. Mode: Peak Height
5. HGA Furnace Programming:
Step 1: 130 (dry temp) 15 (ramp time) 15Step 2: 1000 (char temp) 10 (ramp time) 20Step 3: 2600 (atom temp) 0 (ramp time) 3
* Also press the read, record and stop flow buttons;t » 3 sec.
Step 4: 2600 (max temp) 0 (ramp time) 3 (hold time)
Press the record button.
6. Sample Volume: 20 uL
7. Standards to use for curve set-up: 5.00, 10.0, 20.0, 50.0 ug/L.
Sample Handling: Acidify with nitric add to pH < 2. Analvze within 6 months.
VFUC-1
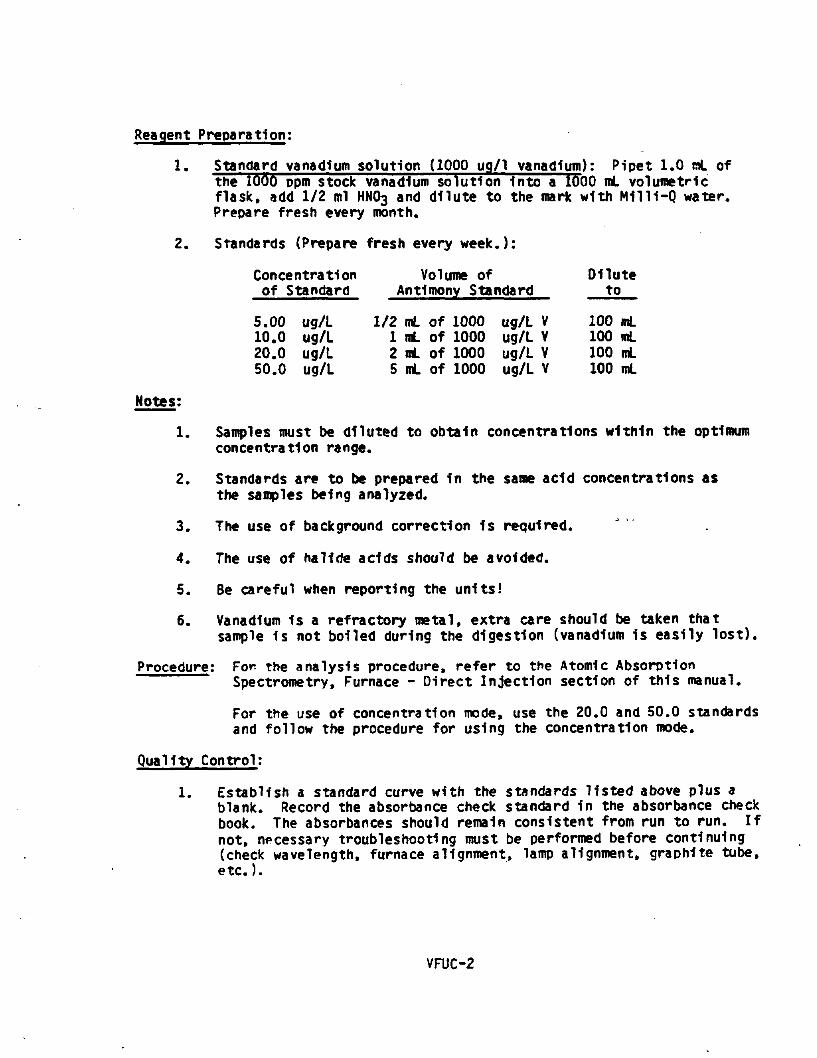
Reagent Preparation:
1. Standard vanadium solution (1000 ug/1 vanadium): Pipet 1.0 ml ofthe 1000 Dpm stock vanadium solution Into a 1000 ml volumetricflask, add 1/2 ml HN03 and dilute to the mark with M1111-Q water.Prepare fresh every month.
2. Standards (Prepare fresh every week.):
Concentrationof Standard
5.0010.020.050.0
ug/Lug/Lug/Lug/L
Volume ofAntimony Standard
1/2125
mLmLmLmL
ofofofof
1000100010001000
ug/Lug/Lug/Lug/L
VYVV
Diluteto
100100100100
mLmLmLmL
Samples must be diluted to obtain concentrations within the optimumconcentration range.
2. Standards are to be prepared In the same add concentrations asthe samples being analyzed.
3. The use of background correction 1s required.
4. The use of hallde adds should be avoided.
5. Be careful when reporting the units!
6. Vanadium 1s a refractory metal, extra care should be taken thatsample 1s not boiled during the digestion (vanadium 1s easily lost).
Procedure: For the analysis procedure, refer to the Atomic AbsorptionSpectrometry, Furnace - Direct Injection section of this manual.
For the use of concentration mode, use the 20.0 and 50.0 standardsand follow the procedure for using the concentration mode.
Quality Control:
1. Establish a standard curve with the standards listed above plus ablank. Record the absorbance check standard 1n the absorbance checkbook. The absorbances should remain consistent from run to run. Ifnot, necessary troubleshooting must be performed before continuing(check wavelength, furnace alignment, lamp alignment, graphite tube,etc.).
VFUC-2
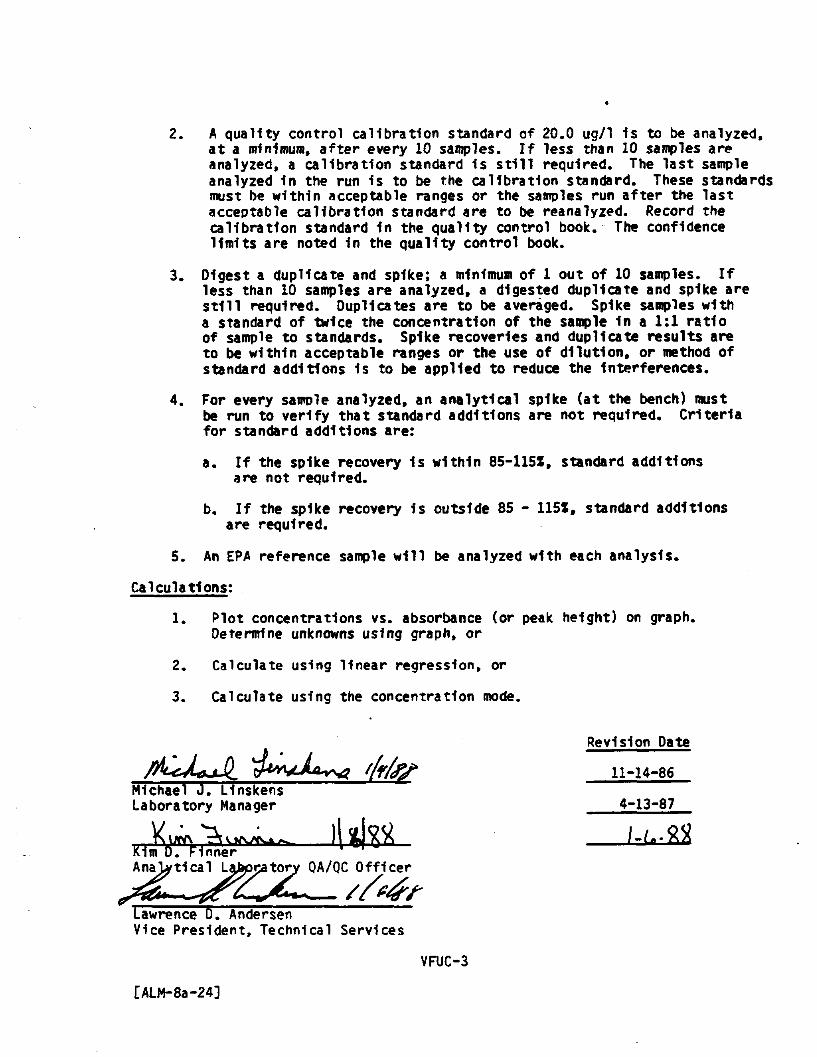
2. A quality control calibration standard of 20.0 ug/1 1s to be analyzed,at a minimum, after every 10 samples. If less than 10 samples areanalyzed, a calibration standard is still required. The last sampleanalyzed in the run is to be the calibration standard. These standardsmust be within acceptable ranges or the samples run after the lastacceptable calibration standard are to be reanalyzed. Record thecalibration standard in the quality control book. The confidencelimits are noted in the quality control book.
3. Digest a duplicate and spike; a minimum of 1 out of 10 samples. Ifless than 10 samples are analyzed, a digested duplicate and spike arestill required. Duplicates are to be averaged. Spike samples witha standard of twice the concentration of the sample 1n a 1:1 ratioof sample to standards. Spike recoveries and duplicate results areto be within acceptable ranges or the use of dilution, or method ofstandard additions 1s to be applied to reduce the Interferences.
4. For every sample analyzed, an analytical spike (at the bench) mustbe run to verify that standard additions are not required. Criteriafor standard additions are:
a. If the spike recovery is within 85-1151, standard additionsare not required.
b. If the spike recovery is outside 85 - 115X. standard additionsare required.
5. An EPA reference sample will be analyzed with each analysis.
Calculations:
1. Plot concentrations vs. absorbance (or peak height) on graph.Determine unknowns using graph, or
2. Calculate using linear regression, or
3. Calculate using the concentration mode.
Revision Date
11-14-86____^ _______Michael J. LlnskensLaboratory Manager 4-13-87
K1m D. FinnerAnalytical Laboratory QA/QC Officer
M %J ftX ___ l-t** A a
S*&* —— 1Lawrence D. AndersenVice President, Technical Services
VFUC-3
[ALM-8a-24]
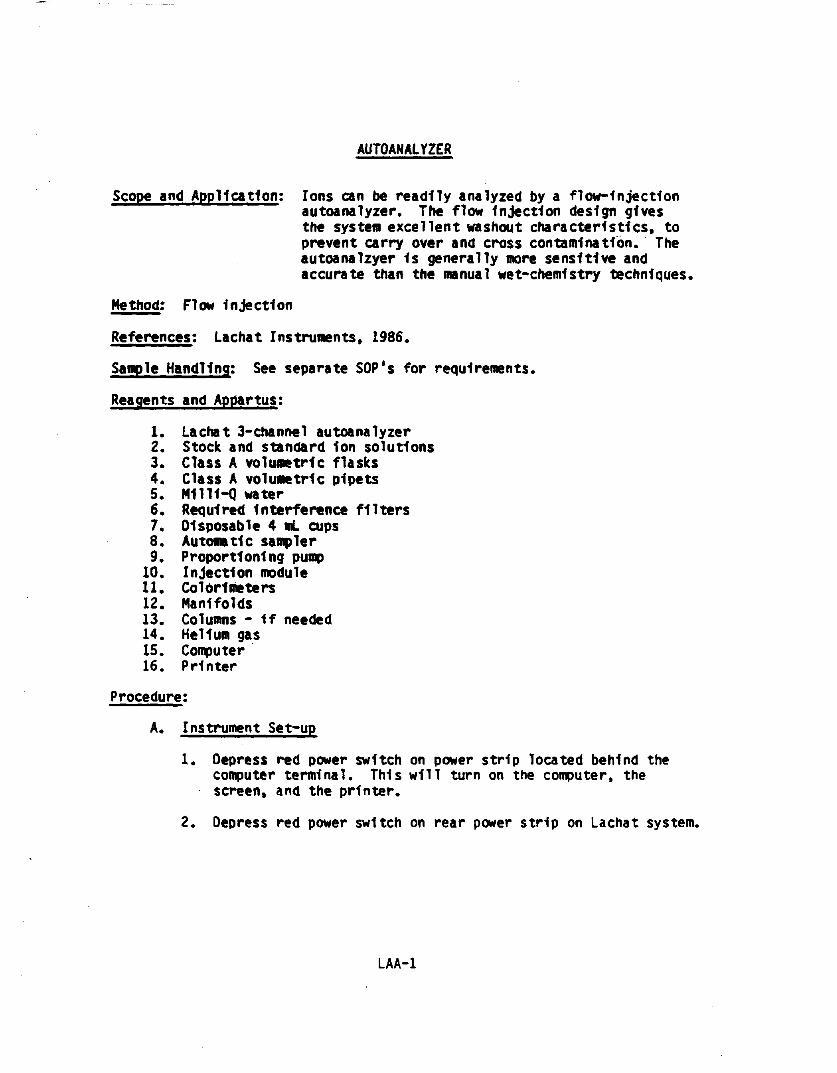
AUTOANALYZER
Scope and Application: Ions can be readily analyzed by a flow-Injectionautoanalyzer. The flow Injection design givesthe system excellent washout characteristics, toprevent carry over and cross contamination. Theautoanalzyer 1s generally more sensitive andaccurate than the manual wet-chemistry techniques.
Method: Flow Injection
References; Lachat Instruments, 1986.
Sample Handling; See separate SOP's for requirements.
Reagents and Appartus:
1. Lachat 3-channel autoanalyzer2. Stock and standard 1on solutions3. Class A volumetric flasks4. Class A volumetric plpets5. M1111-Q water6. Required Interference filters7. Disposable 4 ml cups8. Automatic sampler9. Proportioning pump
10. Injection module11. Colorimeters12. Manifolds13. Columns - 1f needed14. Helium gas15. Computer16. Printer
Procedure:
A. Instrument Set-up
1. Depress red power switch on power strip located behind thecomputer terminal. This will turn on the computer, thescreen, and the printer.
2. Depress red power switch on rear power strip on Lachat system.
LAA-1
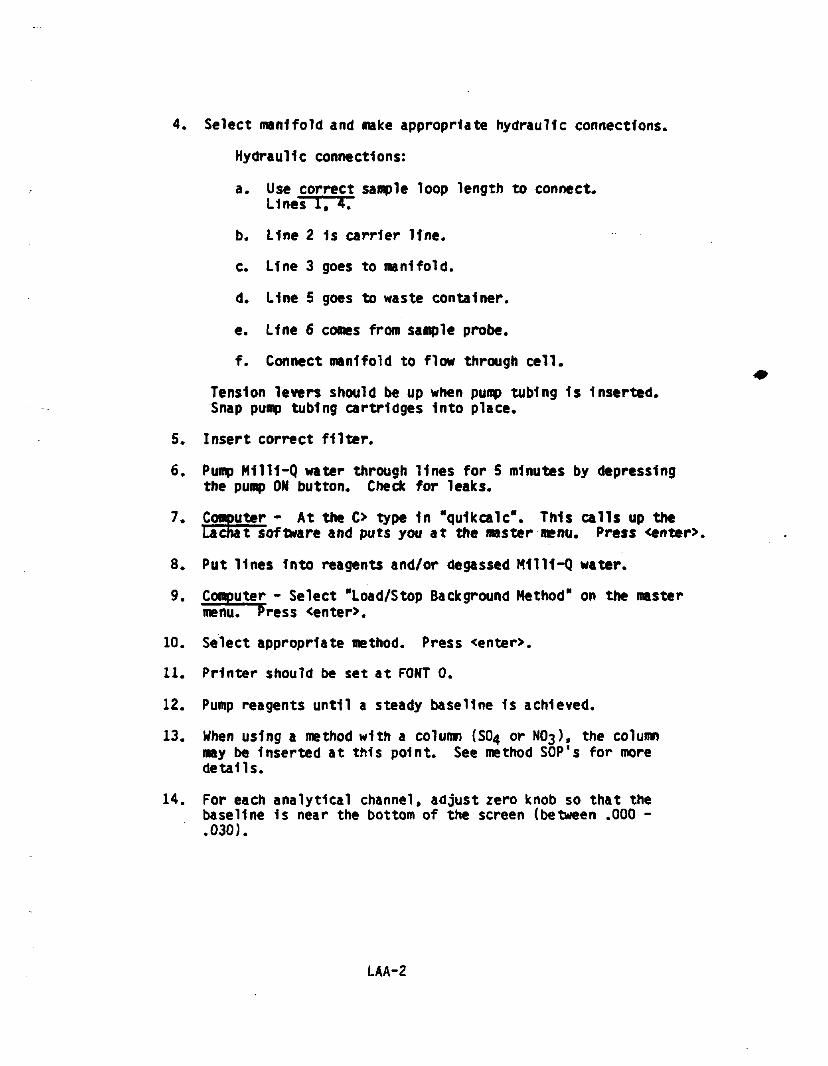
4. Select manifold and make appropriate hydraulic connections.
Hydraulic connections:
a. Use correct sample loop length to connect*Lines 1. 4.
b. Line 2 1s carrier line.
c. Line 3 goes to manifold.
d. Line 5 goes to waste container.
e. Line 6 comes from sample probe.
f. Connect manifold to flow through cell.
Tension levers should be up when pump tubing Is Inserted.Snap pump tubing cartridges Into place.
5. Insert correct filter.
6. Pump H1111-Q water through lines for 5 minutes by depressingthe pump ON button. Check for leaks.
7- Computer - At the C> type 1n "qulkcalc". This calls up theLacnat software and puts you at the master menu. Press <enter>,
8. Put lines Into reagents and/or degassed M1111-Q water.
9. Computer - Select "Load/Stop Background Method" on the mastermenu. Press <enter>.
10. Select appropriate method. Press <enter>.
11. Printer should be set at FONT 0.
12. Pump reagents until a steady baseline 1s achieved.
13. When using a method with a column (804 or N03), the columnmay be Inserted at this point. See method SOP's for moredetails.
14. For each analytical channel, adjust zero knob so that thebaseline Is near the bottom of the screen (between .000 -.030).
LAA-2
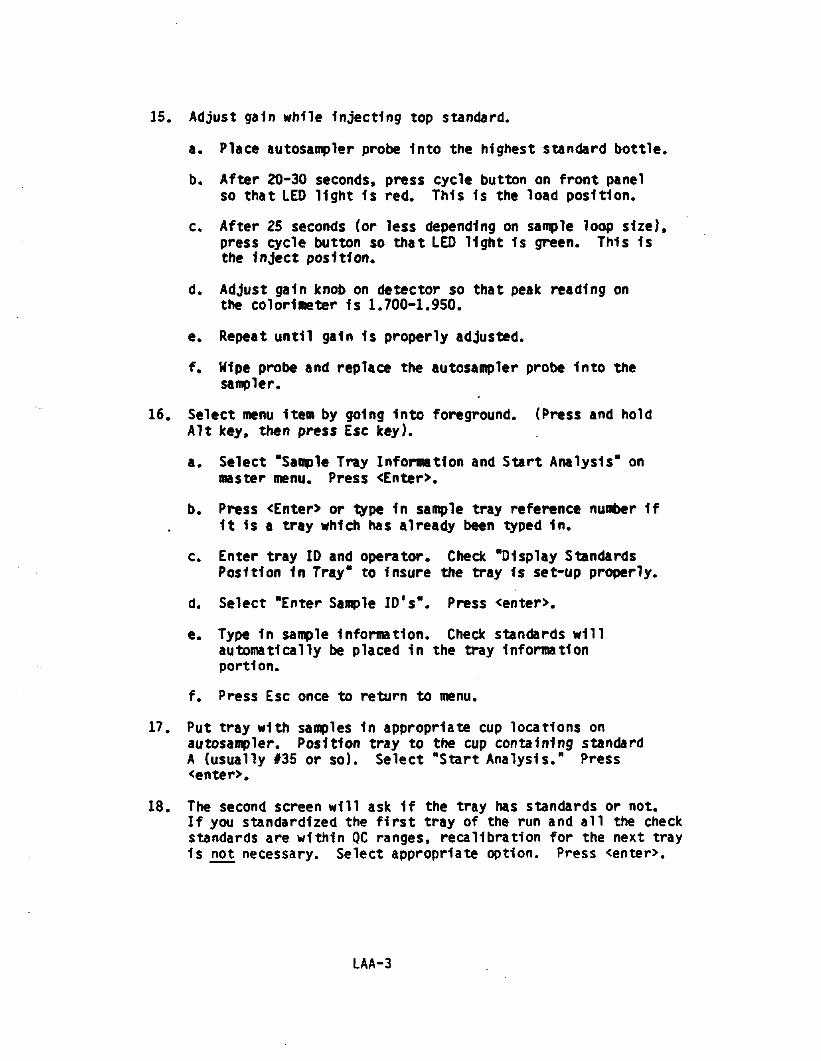
15. Adjust gain while Injecting top standard.
a. Place autosampler probe Into the highest standard bottle*
b. After 20-30 seconds, press cycle button on front panelso that LED light 1s red. This Is the load position.
c. After 25 seconds (or less depending on sample loop size),press cycle button so that LEO light Is green. This Isthe Inject position.
d. Adjust gain knob on detector so that peak reading onthe colorimeter Is 1.700-1.950.
e. Repeat until gain 1$ properly adjusted.
f. Wipe probe and replace the autosampler probe Into thesampler.
16. Select menu Item by going Into foreground. (Press and holdAlt key, then press Esc key).
a. Select "Sample Tray Information and Start Analysis" onmaster menu. Press <Enter>.
b. Press <Enter> or type In sample tray reference number 1f1t 1s a tray which has already been typed 1n.
c. Enter tray ID and operator. Check "Display StandardsPosition 1n Tray" to Insure the tray Is set-up properly.
d. Select "Enter Sample ID's". Press <enter>.
e. Type 1n sample Information. Check standards willautomatically be placed 1n the tray Informationportion.
f. Press Esc once to return to menu.
17. Put tray with samples 1n appropriate cup locations onautosampler. Position tray to the cup containing standardA (usually #35 or so). Select "Start Analysis." Press<enter>.
18. The second screen will ask 1f the tray has standards or not.If you standardized the first tray of the run and all the checkstandards are within QC ranges, recallbratlon for the next tray1s not necessary. Select appropriate option. Press <enter>.
LAA-3

19. Press Alt, Esc keys together, to get back to background toview the calibration peaks.
After calibration 1s complete:
- go Into the foreground (Press Alt, Esc keys)
- select "display calibration graph" (Press <enter>)
- review the data
- return to the background (Press Alt, Esc keys)
- press "G" for good calibration. Analysis will continue.
- press "R" for re-calibration. Remember to refill standardcups and reposition sample tray before pressing "R"!
B. Instrument Shut-Down
1. Press Alt/Esc keys to get to the foreground. Select "Load/StopBackground Method". Press <enter>. To quest1on-"Stop background(Y/M)?" Press "Yes". Press Esc key to main menu.
2. If column 1s used, stop the pump and disconnect from manifold.
3. Pull lines from reagents Into a wash beaker of D.I..
4. Pump D.I. through lines for 2-5 minutes.
5. Pump air through lines until manifold Is dry.
6. Turn off pump.
7. Release tubing cartridges and lower tension levers.Release tubing.
8. Turn off main switch on rear power strip.
9. Empty and rinse waste containers, If necessary.
10. Perform back-up on current data files, once a week.(see section C )
11. Turn off the computer and printer.
LAA-4

C. Backing-up the Data Files
1. Exit to DOS
2. At C> Type: cd\f1alab\data Press <enter>
3. At C> Type: copy *.rpt a: Press <enter>After everything 1s copied - remove disc.
4. At C> Type: del *.*. Press <enter>
5. Are you sure (Y/NJ? Type: Y Press <enter>
6. At C> Type: cd\ Press <enter>
7. Turn off the red switch on the computer power strip toturn off the computer, printer and screen.
Revision Date
Michael J. Llnskens 8-18-87Laboratory Managerit.n m jtv
D. FinK1m D. FlnnerAnalytical Laboratory QA/QC Officer
Lawrence D. AndersonVice President, Technical Services
[KAW-3-10] LAA-5

ALKALINITY - AUTOANALYZER
Scope and Application: This method 1s applicable to drinking water,surface water, groundwater and wastewater.
Reference; EPA 1983, Method 310.2Lachat Instruments 1986, Method 10-303-31-1-C
Sample Handling; Refrigerate at 4'C and analyze within 14 days of collection.
Detection Limit: 5.0 mg/L as CaC03
Optimum Concentration Range: 5.0 - 500 mg/L
Instrument Conditions;
1. Pump speed: 352. Cycle period: 60 seconds3. Load period: 30 seconds4. Inject period: 15 seconds5. Inject to start of peak period: 10 seconds6. Inject to end of peak period: 56 seconds7. Gain: 150 x 108. Zero: 1809. Interference filter: 410 nm
10. Sample loop: 90 cm11. Standards for curve set-up: 0, 20.0, 50.0, 100, 250, 500 mg/L.
Reagent Preparation; (Prepare fresh every 6 months, unless otherwise stated.)
1. Degassed M1111-Q water - 2 options:
a. Boll M1111-Q water vigorously for 5 minutes. Cool and store1n cubltalner.
b. Bubble helium, using the fritted gas dispersion tube, throughthe M1111-Q water (15 m1n/20 L.) Store 1n cubltalner.
2. Stock alkalinity standard (1000 mg/L as NapCO-Q: In a 1 litervolumetric flask, dissolve 1.060 g of anhydrous primary standardgrade sodium carbonate (Na2C03-dr1ed at 140"C for 4 hours) 1napproximately 900 mL of helium purged M1111-Q water, and diluteto mark.
ALKAA-1
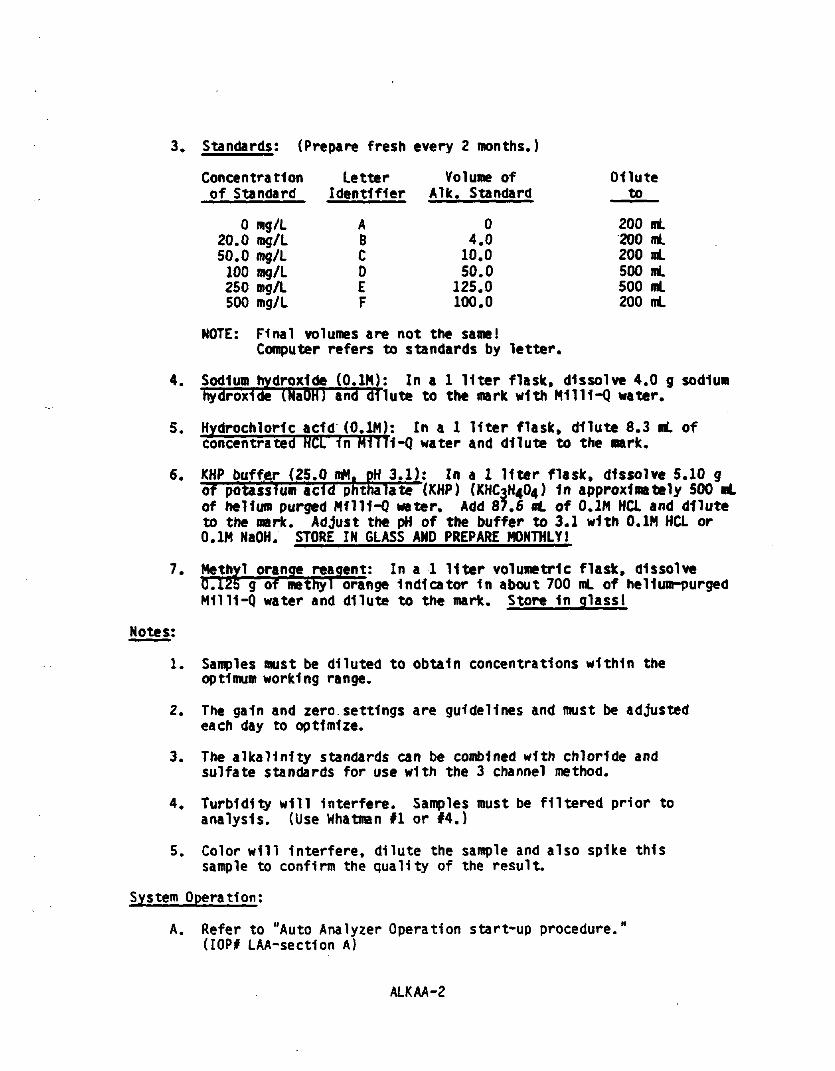
3. Standards: (Prepare fresh every 2 months.)
Concentrationof Standard
0 mg/L20.0 mg/L50.0 mg/L
100 mg/L250 mg/L500 mg/L
LetterIdentifier
ABCDEF
Volume ofAlk. Standard
04.0
10.050.0
125.0100.0
Diluteto
NOTE: Final volumes are not the same!Computer refers to standards by letter.
4. Sodium hydroxide (0.1M): In a 1 liter flask, dissolve 4.0 g sodiumhydroxide (NaOHJ and dilute to the mark with M1111-Q water.
5. Hydrochloric ?c1d (O.IH): In a 1 liter flask, dilute 8.3 nL ofconcentrated HCL in M1111-Q water and dilute to the mark.
6. KHP buffer (25.0 n*. pH 3.1); In a 1 liter flask, dissolve 5.10 gof potassium add phthalate (KHP) (KHCiH ) 1n approximately 500 Rtof helium purged M1111-Q water. Add 87.6 at of 0.1M HCL and diluteto the mark. Adjust the pH of the buffer to 3.1 with 0.1H HCL or0.1M MaOH. STORE IN GLASS AND PREPARE MONTHLY!
7. Methyl orange reagent: In a 1 liter volumetric flask, dissolve0.125 g of methyl orange Indicator 1n about 700 mL of helium-purgedM1111-Q water and dilute to the mark. Store 1n glass 1
Samples must be diluted to obtain concentrations within theoptimum working range.
2. The gain and zero settings are guidelines and must be adjustedeach day to optimize.
3. The alkalinity standards can be combined with chloride andsulfate standards for use with the 3 channel method.
4. Turbidity will Interfere. Samples must be filtered prior toanalysis. (Use Whatman #1 or 14.)
5. Color will Interfere, dilute the sample and also spike thissample to confirm the quality of the result.
System Operation:
A. Refer to "Auto Analyzer Operation start-up procedure."(IOP# LAA-sect1on A)
ALKAA-2
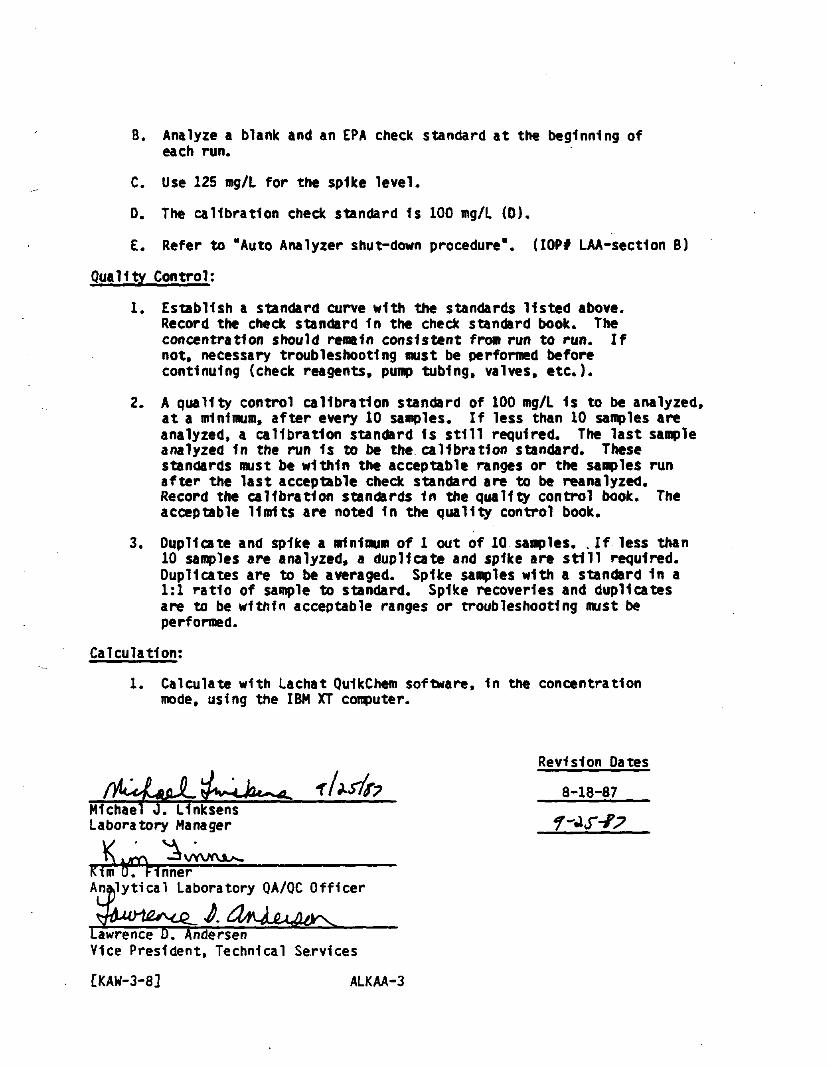
B. Analyze a blank and an ERA check standard at the beginning ofeach run.
C. Use 125 mg/L for the spike level.
D. The calibration check standard 1s 100 mg/L (D).
E. Refer to "Auto Analyzer shut-down procedure". (IOP* LAA-sect1on B)
Quality Control:
1. Establish a standard curve with the standards listed above.Record the check standard In the check standard book. Theconcentration should remain consistent from run to run. Ifnot* necessary troubleshooting must be performed beforecontinuing (check reagents, pump tubing, valves, etc.)*
2. A quality control calibration standard of 100 mg/L 1s to be analyzed,at a minimum, after every 10 samples. If less than 10 samples areanalyzed, a calibration standard Is still required. The last sampleanalyzed 1n the run 1s to be the calibration standard. Thesestandards must be within the acceptable ranges or the samples runafter the last acceptable check standard are to be reanalyzed.Record the calibration standards 1n the quality control book. Theacceptable limits are noted In the quality control book.
3. Duplicate and spike a minimum of 1 out of 10 samples. . If less than10 samples are analyzed, a duplicate and spike are still required.Duplicates are to be averaged. Spike samples with a standard 1n a1:1 ratio of sample to standard. Spike recoveries and duplicatesare to be within acceptable ranges or troubleshooting must beperformed.
Calculation;
1. Calculate with Lachat QuIkChem software, In the concentrationmode, using the IBM XT conputer.
Revision Dates
8-18-87^___^ ________Michael J. LlnksensLaboratory Manager
nyrrv ^Kin I 0. FlnnerAnalytical Laboratory QA/QC Officer
Lawrence D. AndersenVice President, Technical Services
[KAW-3-8] ALKAA-3
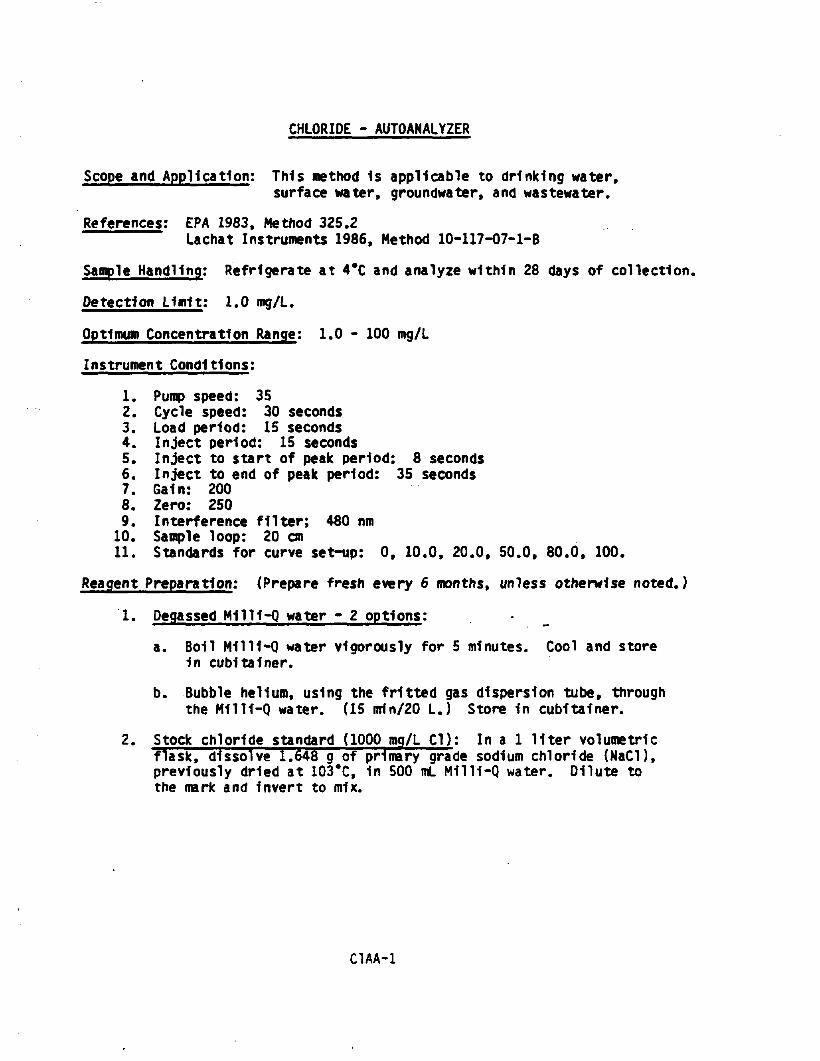
CHLORIDE - AUTOANALYZER
Scope and Application: This method 1s applicable to drinking water,surface water, groundwater, and wastewater.
References; EPA 1983, Method 325.2Lachat Instruments 1986, Method 10-117-07-1-B
Sample Handling; Refrigerate at 4*C and analyze within 28 days of collection,
Detection Limit; 1.0 mg/L.
Optimum Concentration Range; 1.0 - 100 mg/L
Instrument Conditions;
1. Pump speed: 352. Cycle speed: 30 seconds3. Load period: 15 seconds4. Inject period: 15 seconds5. Inject to start of peak period: 8 seconds6. Inject to end of peak period: 35 seconds7. Gain: 2008. Zero: 2509. Interference filter; 480 nm
10. Sample loop: 20 cm11. Standards for curve set-up: 0, 10.0, 20.0, 50.0, 80.0, 100.
Reagent Preparation; (Prepare fresh every 6 months, unless otherwise noted.)
1. Degassed M1111-Q water - 2 options:
a. Boll M1111-Q water vigorously for 5 minutes. Cool and store1n cubltalner.
b. Bubble helium, using the fritted gas dispersion tube, throughthe M1111-Q water. (15 nrin/20 L.) Store In cubltalner.
2. Stock chloride standard (1000 mg/L CD: In a 1 liter volumetricflask, dissolve 1.648 g of primary grade sodium chloride (Nad),previously dried at 103*C, 1n 500 mL M1111-Q water. Dilute tothe mark and Invert to mix.
C1AA-1
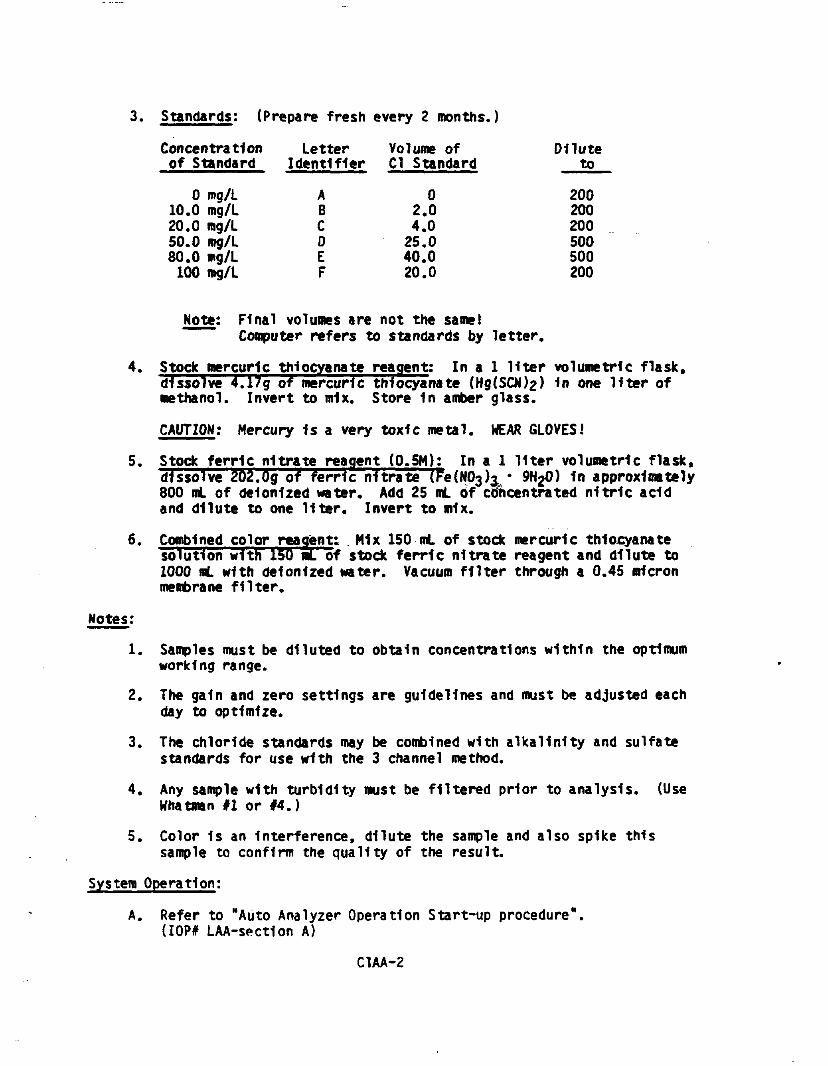
3. Standards: (Prepare fresh every 2 months*)
Concentrationof Standard
0 mg/L10.0 mg/L20.0 mg/L50.0 mg/L80.0 mg/L
100 mg/L
LetterIdentifier
ABC0EF
Volume ofC1 Standard
02.04.0
25.040.020.0
Diluteto
200200200500500200
Note: Final volumes are not the same!Computer refers to standards by letter.
4. Stock mercuric thiocyanate reagent: In a 1 liter volumetric flask,dissolve 4.17g of mercuric thlocyanate (Hg(SCN)2) 1n one liter ofmethanol. Invert to mix. Store 1n amber glass.
CAUTION: Mercury 1s a very toxic metal. WEAR GLOVES!
5. Stock ferric nitrate reagent (0.5M): In a 1 liter volumetric flask,dissolve 202.Og of ferric nitrate (Fe(N03)3 • QH^) 1n approximately800 mL of delonlzed water. Add 25 mL of concentrated nitric addand dilute to one liter. Invert to mix.
6. Combined color reagent: Mix 150 mL of stock mercuric thlocyanatesolution with 150 mL of stock ferric nitrate reagent and dilute to1000 mL with delonlzed water. Vacuum filter through a 0.45 micronmembrane filter.
Notes:
1. Samples must be diluted to obtain concentrations within the optimumworking range.
2. The gain and zero settings are guidelines and must be adjusted eachday to optimize.
3. The chloride standards may be combined with alkalinity and sulfatestandards for use with the 3 channel method.
4. Any sample with turbidity must be filtered prior to analysis. (UseWhatman fl or 14.)
5. Color 1s an Interference, dilute the sample and also spike thissample to confirm the quality of the result.
System Operation:
A. Refer to "Auto Analyzer Operation Start-up procedure".LAA-sect1on A)
C1AA-2
8. Analyze a blank and an EPA check standard at the beginning ofeach run,
C. Use a 40 ppm Cl for the spike level.
D. The calibration check standard Is 50 mg/L (0)*
E. Refer to "Auto Analyzer Shut-down procedure".(IOP* LAA-sect1on B)
Quality Control;
1* Establish a standard curve with the standards listed above.Record the check standard In the check standard book. Theconcentration should remain consistent from run to run. Ifnot, necessary troubleshooting Bust be performed beforecontinuing (check reagent, pump tubing, valves, etc.).
2. A quality control calibration standard of 50.0 mg/L 1s to beanalyzed, at a minimum, after every 10 samples. If less than 10samples are analyzed, a calibration standard 1s still required.The last sample analyzed In the run Is to be the calibrationstandard. These standards-must be within the acceptable rangesor the samples run after the last acceptable check standard areto be reanalyzed. Record the calibration standards In the qualitycontrol book. The acceptable limits are noted 1n the qualitycontrol book.
3. Duplicate and spike a minimum of 1 out of 10 samples. If less than10 samples are analyzed, a duplicate and spike are still required.Duplicates are to be averaged. Spike samples with a standard 1n a1:1 ratio of sample to standard. Spike recoveries and duplicatesare to be within acceptable ranges or troubleshooting must beperformed.
Calculations:
1. Calculate with Lachat QuIkChem software, 1n the concentrationmode, using the IBM XT computer.
Revision Date
/JJL^f^J^ fltSle? 8*18-87Michael J. LlnskensLaboratory Manager
Kirn D. FlnnerAnalytical Laboratory QA/QC Officer
V-Lawrence D. AndersenVice President, Technical Services
[KAW-3-9] C1AA-3

CYANIDE. TOTAL - DISTILLATIOH
Scope and Application; This method Is applicable to the determination ofcyanide 1n drinking water, surface watert ground-water, sludges, soils and Industrial wastes.
Methods; Distillation, Automated Colorioetric
Reference; EPA 1983, Method 335.2
SW-846, Method 9010
Standard Methods, 16th Edition, Method 412Detection Limit; 0.005 mg/L
Optimum Range; 0.01 - 0.40 mg/L
Sample Handling; Preserve with sodium hydroxide to pH >12 and refrigerateat 4*C. Analyze samples within 14 days.
Reagents and Apparatus;
1. Cyanide reflux distillation apparatus2. 25 mL and 50 ml graduated cylinders3. Vacuum pump4. Heating mantle5. Thermometer6. 250 mL volumetric flasks '7. Sodium hydroxide8. Sulfurlc add, concentrated9. Magnesium chloride
10. D«Ionized water11. Bismuth nitrate12. Sulfanrfc add13. Acetic add, concentrated14. Sodium thlosulfate, crystals
Reagent Preparation; (Prepare fresh every 6 months, unless otherwise noted.)
1. Sodium Hydroxide (1.25N):
Dissolve 50.0 g NaOH 1n D.I. water and dilute to 1 liter 1n avolumetric flask. Store 1n a plastic bottle.
2. Magnesium Chloride Solution;
Dissolve 510.0 g MgCl2'6H20 1n D.I. water and dilute to 1 liter.Store 1n a plastic bottle.
[602-95a]CNDISC-1
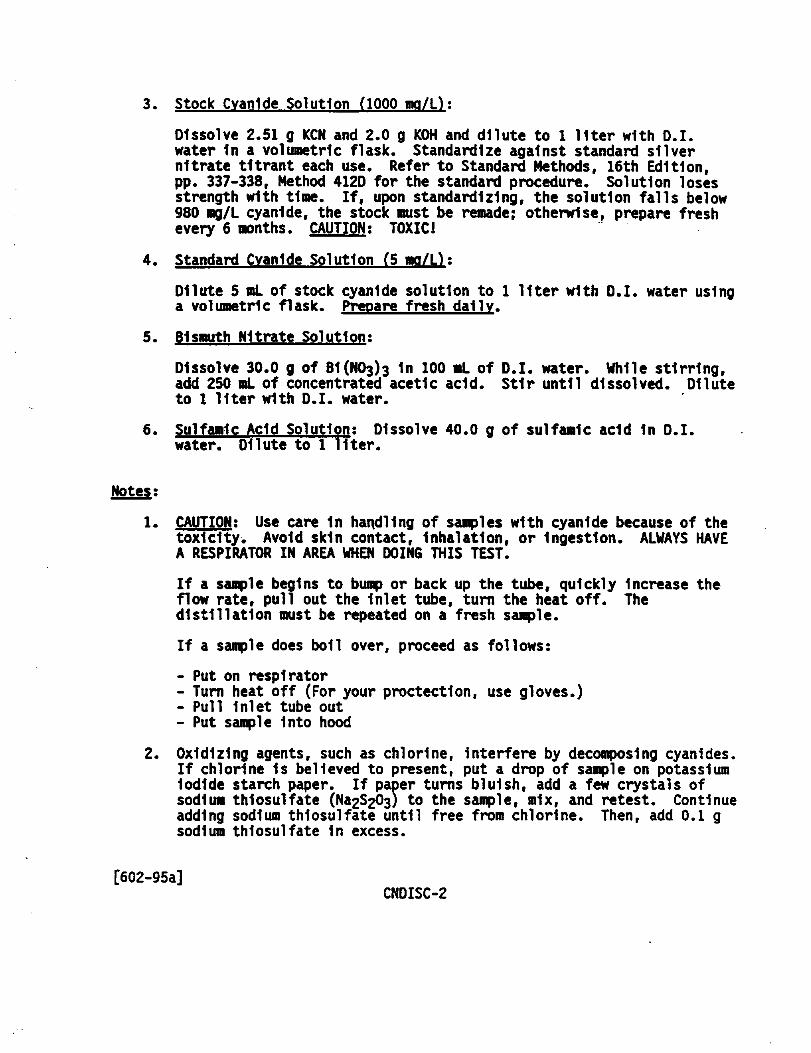
3. Stock Cyanide Solution (1000 mo/L):
Dissolve 2.51 g KCN and 2.0 g KOH and dilute to 1 liter with D.I.water 1n a volumetric flask. Standardize against standard silvernitrate tltrant each use. Refer to Standard Methods, 16th Edition,pp. 337-338, Method 4120 for the standard procedure. Solution losesstrength with time. If, upon standardizing, the solution falls below980 mg/L cyanide, the stock must be remade; otherwise, prepare freshevery 6 months. CAUTION; TOXIC!
4. Standard Cvanlde Solution fS mo/Li;
Dilute 5 mL of stock cyanide solution to 1 liter with D.I. water usinga volumetric flask. Prepare fresh daily.
5. Bismuth Nitrate Solution:
Dissolve 30.0 g of 81(1*03)3 1n 100 mL of D.I. water. While stirring,add 250 mL of concentrated acetic add. Stir until dissolved. Diluteto 1 liter with D.I. water.
6. Sulfamlc Add Solution; Dissolve 40.0 g of sulfamlc add 1n D.I.water. Dilute to 1 liter.
Notes;
1* CAUTION; Use care 1n handling of samples with cyanide because of thetoxldty. Avoid skin contact, Inhalation, or 1ngest1on. ALWAYS HAVEA RESPIRATOR IN AREA WHEN DOING THIS TEST.
If a sample begins to bump or back up the tube, quickly Increase theflow rate, pull out the Inlet tube, turn the heat off. Thedistillation must be repeated on a fresh sample.
If a sample does boll over, proceed as follows:- Put on respirator- Turn heat off (For your proctectlon, use gloves.)- Pull Inlet tube out- Put sample Into hood
2. Oxidizing agents, such as chlorine, Interfere by decomposing cyanides.If chlorine 1s believed to present, put a drop of sample on potassiumIodide starch paper. If paper turns bluish, add a few crystals ofsodium thlosulfate ( S ) to the sample, mix, and re test. Continueadding sodium thlosulfate until free from chlorine. Then, add 0.1 gsodium thlosulfate In excess.
[602-95a]CNDISC-2
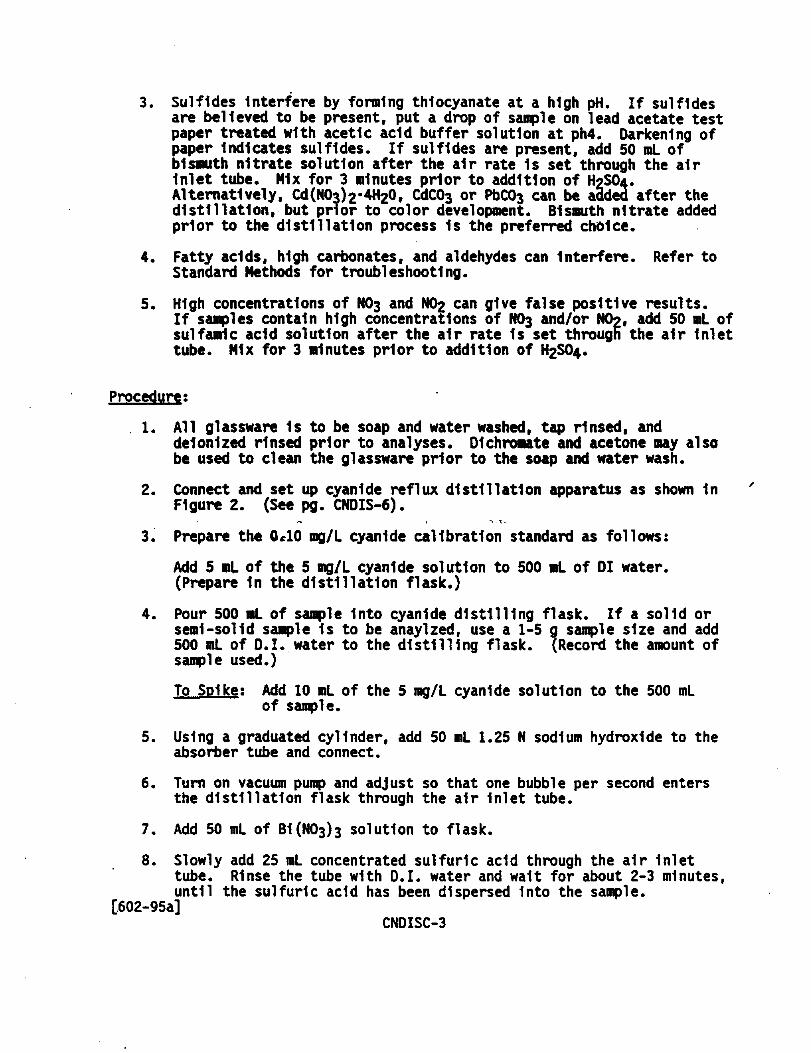
3. Sulfldes Interfere by forming thlocyanate at a high pH. If sulfidesare believed to be present, put a drop of sample on lead acetate testpaper treated with acetic add buffer solution at ph4. Darkening ofpaper Indicates sulfides. If sulfides are present, add 50 mL ofbismuth nitrate solution after the air rate 1s set through the airInlet tube. Mix for 3 minutes prior to addition of HgSO*.Alternatively, Cd(N<h)2-4H20, CdCOa or PbCOa can be added after thedistillation, but prior to color development. Bismuth nitrate addedprior to the distillation process 1s the preferred choice.
4. Fatty acids, high carbonates, and aldehydes can Interfere. Refer toStandard Methods for troubleshooting.
5. High concentrations of N03 and N02 can give false positive results.If samples contain high concentrations of N03 and/or NOo, add 50 ml ofsulfamic acid solution after the air rate Is set through the air Inlettube. Mix for 3 minutes prior to addition of $04.
Procedure;1. All glassware 1s to be soap and water washed, tap rinsed, and
deIonized rinsed prior to analyses. Dlchromate and acetone may alsobe used to clean the glassware prior to the soap and water wash.
2. Connect and set up cyanide reflux distillation apparatus as shown 1nFigure 2. (See pg. CNDIS-6).
** i ->. i.3. Prepare the 0*10 mg/L cyanide calibration standard as follows:
Add 5 ml of the 5 mg/L cyanide solution to 500 mL of DI water.(Prepare 1n the distillation flask.)
4. Pour 500 ml of sample Into cyanide distilling flask. If a solid orsemi-solid sample 1s to be anaylzed, use a 1-5 g sample size and add500 ml of O.I. water to the distilling flask. (Record the amount ofsample used.)
To Spike: Add 10 ml of the 5 mg/L cyanide solution to the 500 mLof sample.
5. Using a graduated cylinder, add 50 mL 1.25 N sodium hydroxide to theabsorber tube and connect.
6. Turn on vacuum pump and adjust so that one bubble per second entersthe distillation flask through the air Inlet tube.
7. Add 50 mL of B1(N03)3 solution to flask.
8. Slowly add 25 mL concentrated sulfurlc add through the air Inlettube. Rinse the tube with O.I. water and wait for about 2-3 minutes,until the sulfurlc add has been dispersed Into the sample.
[602-95a]CNDISC-3
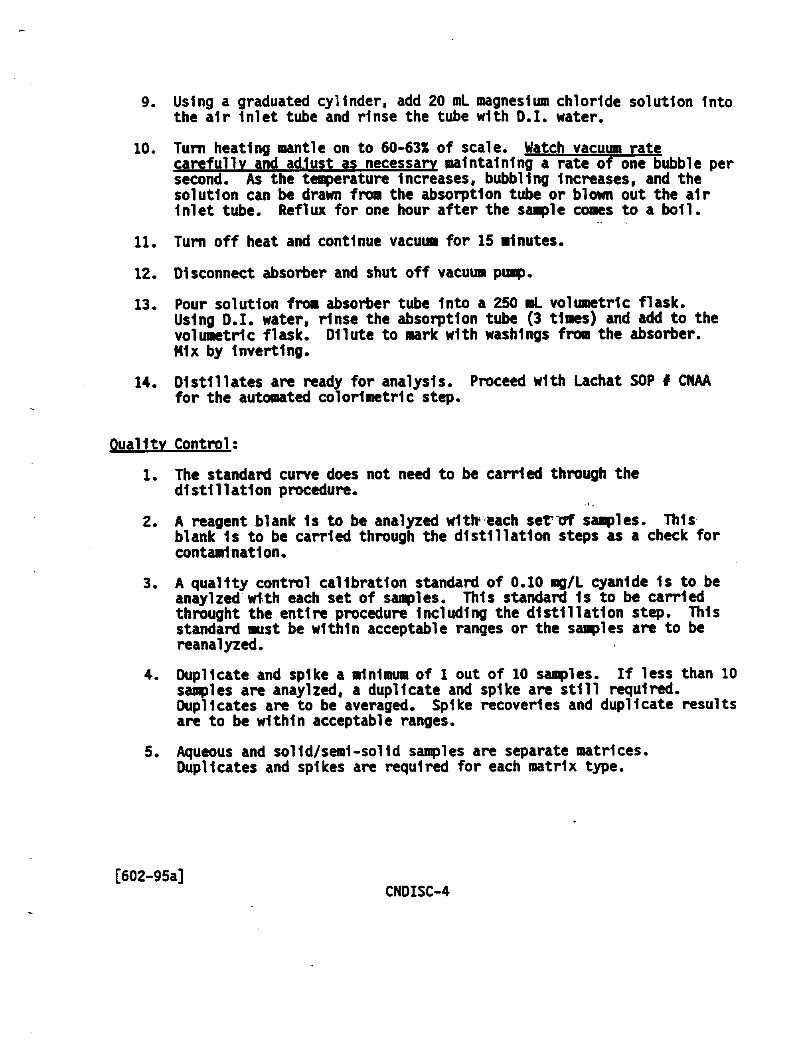
9. Using a graduated cylinder, add 20 ml magnesium chloride solution Intothe air Inlet tube and rinse the tube with D.I. water.
10. Turn heating mantle on to 60-635 of scale. Watch vacuum ratecarefully and adjust as necessary maintaining a rate of one bubble persecond. As the temperature Increases, bubbling Increases, and thesolution can be drawn from the absorption tube or blown out the airInlet tube. Reflux for one hour after the sample comes to a boll.
11. Turn off heat and continue vacuum for 15 minutes.
12. Disconnect absorber and shut off vacuum pump.13. Pour solution from absorber tube Into a 250 mL volumetric flask.
Using D.I. water, rinse the absorption tube (3 times) and add to thevolumetric flask. Dilute to mark with washings from the absorber.Mix by Inverting.
14. Distillates are ready for analysis. Proceed with Lachat SOP I CNAAfor the automated colorlmetrfc step.
Quality Control;
1. The standard curve does not need to be carried through thedistillation procedure.
2. A reagent blank 1s to be analyzed wltfr each ser of samples. Thisblank 1s to be carried through the distillation steps as a check forcontamination.
3. A quality control calibration standard of 0.10 mg/L cyanide 1s to beanaylzed with each set of samples. This standard 1s to be carriedthrought the entire procedure Including the distillation step. Thisstandard must be within acceptable ranges or the samples are to bereanalyzed.
4. Duplicate and spike a minimum of 1 out of 10 samples. If less than 10samples are anaylzed, a duplicate and spike are still required.Duplicates are to be averaged. Spike recoveries and duplicate resultsare to be within acceptable ranges.
5. Aqueous and sol1d/sera1-solid samples are separate matrices.Duplicates and spikes are required for each matrix type.
[602-95a]CNDISC-4

Calculation;
1. Calculate with Lachat QuIkChen software, 1n the concentration node,using the IBM XT computer. (Be sure to calculate 1n any distillationdilution Into the final result*)
2. Calculate the spike recovery as follows:(Solke value - sample value) x 100 » % recovery
0.10
[602-95a]CNDISC-5

c
COOLING WATER
INLET TUBE-
SCREW CLAMP
TO LOW VACUUMSOURCE
- ABSORBER
- DISTILLING FLASK
HEATER —
FIGURE 2CYANIDE DISTILLATION A P P A R A T U S
CNDISC-6
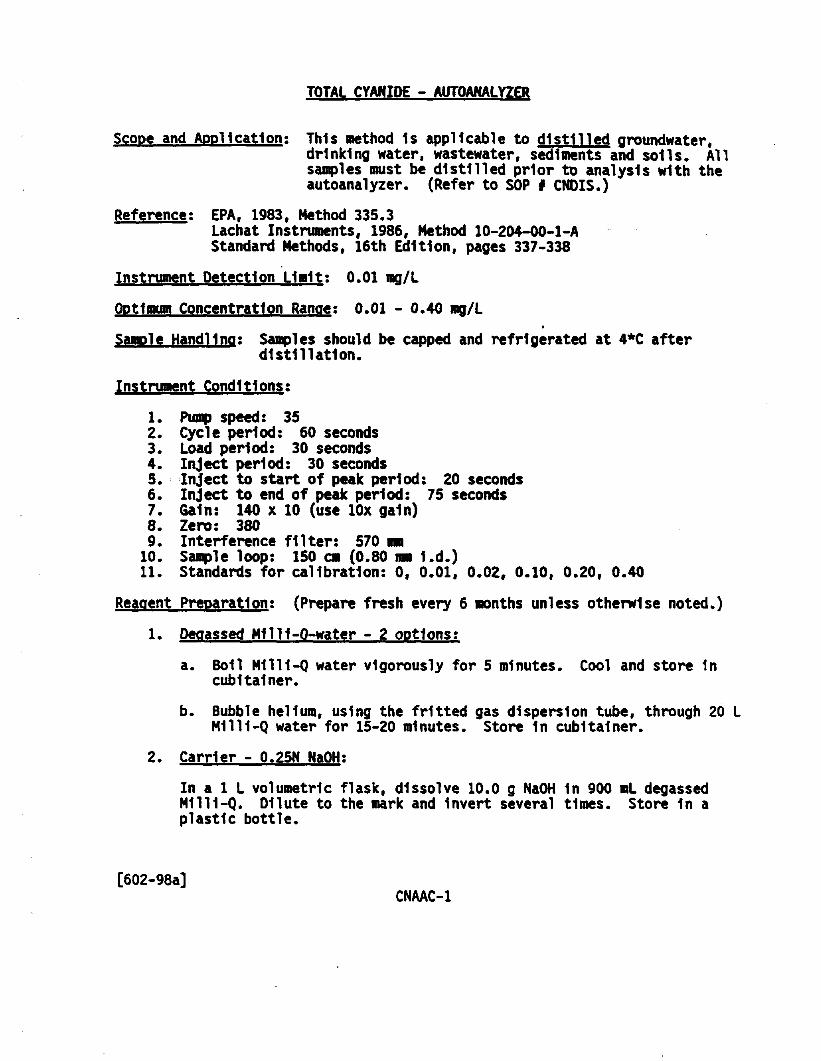
TOTAL CYANIDE - AUTOANALY2ER
Scope and Application; This method 1s applicable to distilled groundwater,drinking water, wastewater, sediments and soils. Allsamples must be distilled prior to analysis with theautoanalyzer. (Refer to SOP I CNDIS.)
Reference; EPA, 1983, Method 335.3Lachat Instruments, 1986, Method 10-204-00-1-AStandard Methods, 16th Edition, pages 337-338
Instrument Detection Limit: 0.01 mg/L
Optimum Concentration Range; 0.01 - 0.40 mg/LSample Handling; Samples should be capped and refrigerated at 4*C after
distillation.Instrument Conditions;
1. Pump speed: 352. Cycle period: 60 seconds3. Load period: 30 seconds4. Inject period: 30 seconds5. Inject to start of peak period: 20 seconds6. Inject to end of peak period: 75 seconds7. Gain: 140 x 10 (use lOx gain)8. Zero: 3809. Interference filter: 570 mm
10. Sample loop: 150 cm (0.80 mm l.d.)11. Standards for calibration: 0, 0.01, 0*02, 0.10, 0.20, 0.40
Reagent Preparation; (Prepare fresh every 6 months unless otherwise noted.)1. Degassed M1ll1-Q*water - 2 options;
a. Boll M1111-Q water vigorously for 5 minutes. Cool and store 1ncubitalner.
b. Bubble helium, using the fritted gas dispersion tube, through 20 LM1111-Q water for 15-20 minutes. Store 1n cubitalner.
2. Carrier - 0.25N NaOH;
In a 1 L volumetric flask, dissolve 10.0 g NaOH 1n 900 mL degassedM1111-Q. Dilute to the mark and Invert several times. Store 1n aplastic bottle.
[602-98a]CNAAC-1

3. Phosphate Buffer - 0.86H foH 5.2);
In a 1 L volumetric flask, dissolve 97.0 g KHgK^ In 800 ml degassedN1111-Q water. Add 8.1 ml concentrated (85X) phosphoric add. Diluteto the nark and Invert several times.
4. Chloram1ne-T Solution;
Dissolve 2.0 g of ch1oram1ne-T 1n 500 ml degassed M1111-Q. Preparefresh weekly and store refrigerated.
5. Pvrldlne - Barbituric Add Reaoent;
In the fine hood, place 15.0 g barbituric add In a 1 L beaker and add100 ml of degassed H1111-Q water, rinsing down the sides of the beakerto wet the barbituric add. Add 75 nL pyrldlne (C5H5N) while stirringwith stir bar. Mix until barbituric add dissolves. Add 15 wLconcentrated HCl and stir. Transfer to a 1 L volumetric flask, diluteto the nark with degassed M1111-Q water and Invert several tines.Refrigerate. Prepare fresh every 2 months.
6. Stock Cvanlde Solution (1000 no/I):
Dissolve 2.51 g KCN and 2.0 g KOH and dilute to 1 liter with D.I.water In a volumetric flask. Standardize against standard silvernitrate tltrant each use. Refer to Standard Methods, 16th Edition,pp. 337-338, Method 412D for the standard procedure. Solution losesstrength with tine. If, upon standardizing, the solution falls below980 mg/L cyanide, the stock must be remade; otherwise, prepare freshevery 6 months. CAUTION; TOXIC!
7. Standard Cvanlde Solution (5.0 ma/L);
Dilute 5 ml of stock cyanide solution to 1 liter with D.I. water usinga volumetric flask. Prepare fresh weekly.
[602-98a]CNAAC-2

8. Cvanlde Standards;
Prepare by pipetting the volumes noted below Into 250 mL volumetricflasks, adding 50 ml of 1.25N NaOH, and diluting to the nark with D.I.water. (The 1.25N NaOH must be added - very Important!) Preparefresh daily.
Concentration Letter Volume of 5 rag/Iof Standard Identifier working standard
0.00 mg/L A 0 ml0.01 mg/L B 0.5 mL0.02 mg/L C 1.0 mL0.10 mg/L D 5.0 mL0.20 mg/L E 10 mL0.40 mg/L F 20 mL
NOTES:
Note; Computer refers to standards by letter.
1. This chemistry 1s temperature sensitive. It 1s crucial to have allreagentsv samples and standards at room temperature before runningsamples or sensitivity drift will result.
2. Any sa >1e dilutions must be diluted with 0.25N NaOH, not water. Youmay use the carrier or the zero standard for this.
3. Interferences are reduced or eliminated by the distillation procedure.Cyanide analyses suffer from many Interferences. See EPA and StandardMethods references for detailed discussion. Information andrecommendations for the manual pyrldlne-barblturlc add colordevelopment also apply to this automated method.
4. Samples must diluted to obtain concentrations within the optimumworking range.
5. The gain and zero settings are guidelines and must be adjusted eachday to optimize.
6. Color Is an Interference, dilute the sample and also manually spikethis sample to confirm the quality of the result.
System Operation;1. Refer to "Auto Analyzer Operation Start-up Procedure" (SOP * LAA -
Section A).
[602-98a]CNAAC-3
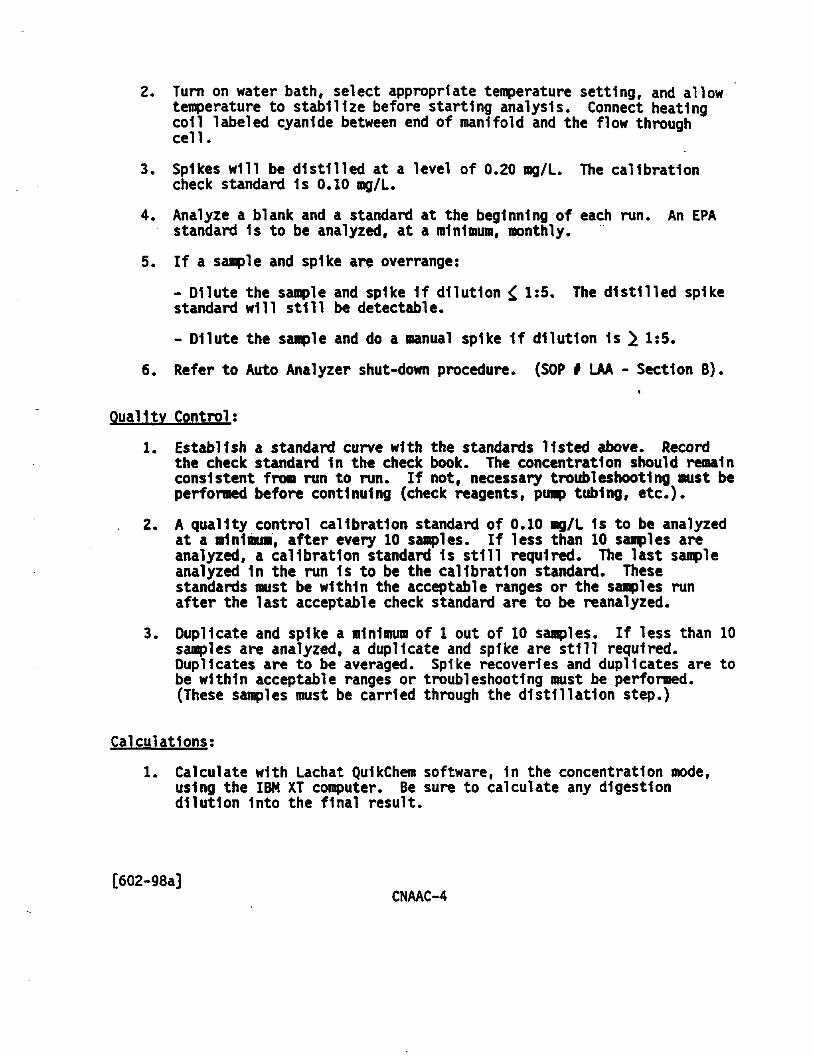
2. Turn on water bath, select appropriate temperature setting, and allowtemperature to stabilize before starting analysis. Connect heatingcoll labeled cyanide between end of manifold and the flow throughcell.
3. Spikes will be distilled at a level of 0*20 mg/L. The calibrationcheck standard 1s 0.10 rog/L.
4* Analyze a blank and a standard at the beginning of each run. An ERAstandard 1s to be analyzed, at a minimum, monthly.
- Dilute the sample and spike 1f dilution £ 1:5. The distilled spikestandard will still be detectable.
- Dilute the sample and do a manual spike 1f dilution 1s > 1:5.6. Refer to Auto Analyzer shut-down procedure. (SOP f LAA - Section B).
«Quality Control:
1. Establish a standard curve with the standards listed above. Recordthe check standard 1n the check book. The concentration should remainconsistent from run to run. If not, necessary troubleshooting must beperformed before continuing (check reagents, pump tubing, etc.).
2. A quality control calibration standard of 0.10 mg/L 1s to be analyzedat a minimum, after every 10 samples. If less than 10 samples areanalyzed, a calibration standard 1s still required. The last sampleanalyzed 1n the run Is to be the calibration standard. Thesestandards must be within the acceptable ranges or the samples runafter the last acceptable check standard are to be reanalyzed.
3. Duplicate and spike a minimum of 1 out of 10 samples. If less than 10samples are analyzed, a duplicate and spike are still required.Duplicates are to be averaged. Spike recoveries and duplicates are tobe within acceptable ranges or troubleshooting must be performed.(These samples must be carried through the distillation step.)
Calculations;
1. Calculate with Lachat QuIkChem software, 1n the concentration mode,using the IBM XT computer. Be sure to calculate any digestiondilution Into the final result.
[602-98a]CNAAC-4

TOTAL PHOSPHORUS - DIGESTION
Scope'and Application; This method 1s a determination for total phosphorusand 1s applicable to drinking water, surface water,groundwater, domestic and Industrial wastewaters.Soils, sludges and solid waste samples may be analyzedby this method.
Method; Persulfate digestion, automated color1metric.
Reference; EPA 1983, p. 365.1.
Detection Limit: 0.01 mg/L for aqueous samples2.00 mg/kg for non-aqueous samples
Optimum Ranoe; 0.01 - 1.00 mg/L
Sample Handling; Preserve aqueous samples with concentrated $€4 to pH <2and refrigerate at 4*C. Non-aqueous samples must berefrigerated at 4*C. Analyze samples within 28 days ofcollection.
Reagents and Apparatus;
1. Sulfurlc add, concentrated - >/2. Ammonium persulfate3. Erlenmeyer flasks, 125 ml4. Hot plate ^r
5. Analytical balance, 0.0001 g sensitivity6. Assorted volumetric pi pets and glassware7. Wide mouth plpets8. Boiling chips, Hengar9. Delonlzed water
10. Hydrochloric add, 10X
Reaoent Preparation; Prepare fresh every 6 months, unless otherwise stated.1. Stock phosphorus solution (500 mg/L); Dry 3-5 g KH2P04 at 105*C for
1 hour and desslcate. Dissolve exactly 2.1970 g of the dried KH2P041n delonlzed water, add 2 mL concentrated HgSC and dilute to 1 L In avolumetric flask.
2. Standard phosphorus solution (5 mg/L); In a volumetric flask, dilute10 mL of the stock phosphorus solution to 1 liter with delonlzedwater.
3. Sulfurlc add solution (UN); Slowly add 155 mL concentrated H2$04 to300 mL delonlzed water. Let cool and dilute to 500 mL.
[602-97a]TPDIGC-1

Notes;
1. Contamination 1s a problem. Glassware should be washed with aphosphate-free detergent followed by add and delonlzed water rinsesbefore use.
2. Interferences:
a. High Iron concentrations can cause precipitation and subsequentloss of phosphorus. (See EPA Method 365.3 for alternativeanalysis.)
b. High concentrations of arsenate can cause a positive Interference1n phosphorus determinations.
3. If high concentrations are expected In samples, an aliquot of samplediluted to 50 ml with delonlzed water may be digested.
Procedure;
1. Glassware should be washed with a phosphate-free detergent, tap rinsefollowed by a 10% add (HCL) rinse and delonlzed water rinse prior toanalysis.
2. Prepare the 0.50 mg/L phosphorus calibration standard as follows:P1pet 5 ml of the standard phosphorus solution (5 mg/L) Into the125 ml Erlenmeyer flask and add 45 ml D.I. water.
3. For Aqueous Samples; Measure out 50 mL of sample, or an allguotdiluted to 50 ml, and pour Into a 125 ml Erlenmeyer flask. (Use asmaller sample size 1f sample contains organic matter to Insureadequate digestion.)For Non-Aaueous Samples; Weigh out between 0.2500 - 1.0000 g sample(record weight used] Into a 125 ml Erlenmeyer flask and add 50 mLdelonlzed water.To Spike Samples: P1pet 5 mL of the standard phosphorus solution(5 mg/L) Into the 125 mL Erlenmeyer flask containing the sample. Thiscorresponds to a 0.50 mg/L spike.
4. Bring solution to a gentle boll and reflux gently on a hot plate forabout 30-40 minutes or until the sample volume Is about 10 mL. Do notallow sample to oo to drvness!
5. Cool and add about 10 mL of D.I. water.
6. If sample 1s not clear at this point, filter through a Whatman 140filter.
[602-97a]TPDIGC-2

7. Transfer the sample Into a 50 rat volumetric flask. Rinse the flask3 tines with deIonized water, transferring each rinse to thevolumetric flask. Dilute to the nark with delonlzed water.
8* The dlgestates are now ready for analysis. Proceed with LachatSOPI TPAA for the automated color1metrie procedure.
Quality Control;
1. The standard curve does not need to be carried through the digestionprocedure.
2. A reagent blank and a 0.50 ng/L check standard are to be carriedthrough the digestion procedure and analyzed with each set of samplesas a check for contamination and digestion efficiency. The blank andstandard must be within acceptable ranges or the sanples must bereanalyzed.
3. Duplicate and spike a minimum of 1 out of 10 samples. If less than10 samples are analyzed, a duplicate and spike are still required.Duplicates are to be averaged. Spike recoveries and duplicate resultsare to be within acceptable ranges.
Calculation:
1. Calculate with the Lachat Qulk Chen software, 1n the concentrationmode, using the IBM XT computer. Be sure to calculate any digestiondilutions Into the final result.
2. To calculate the spike:% Recovery « (spike value - sample value) X 100
0.50
[602-97a]TPDIGC-3
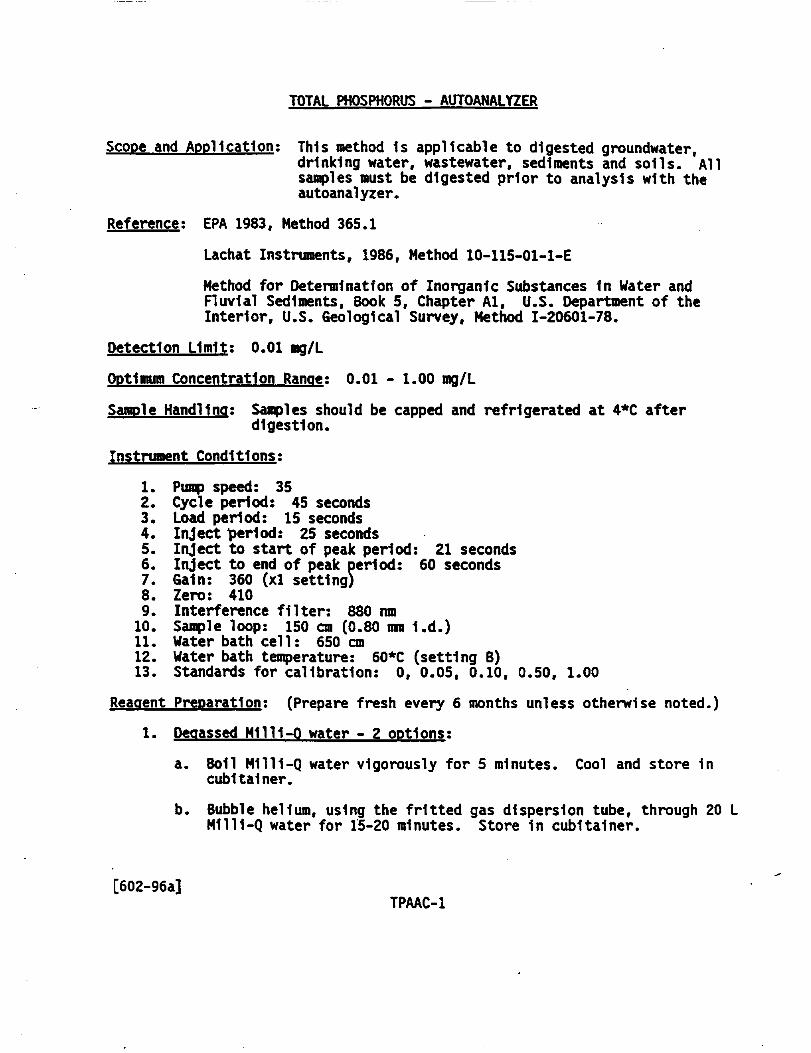
TOTAL PHOSPHORUS - AUTOANALYZER
Scope and Application; This method 1s applicable to digested groundwater,drinking water, wastewater, sediments and soils. Allsamples must be digested prior to analysis with theautoanalyzer.
Reference; EPA 1983, Method 365.1
Lachat Instruments, 1986, Method 10-115-01-1-E
Method for Determination of Inorganic Substances In Water andFluvial Sediments, Book 5, Chapter Al, U.S. Department of theInterior, U.S. Geological Survey, Method 1-20601-78.
Detection Limit; 0.01 mg/L
Optimum Concentration Range; 0.01 - 1.00 mg/L
Sample Handling; Samples should be capped and refrigerated at 4*C afterdigestion.
Instrument Conditions;
1. Pump speed: 352. Cycle period; 45 seconds3. Load period: 15 seconds4. Inject period: 25 seconds5. Inject to start of peak period: 21 seconds6. Inject to end of peak period: 60 seconds7. Gain: 360 (xl setting)8. Zero: 4109. Interference filter: 880 ran
10. Sample loop: 150 on (0.80 mm 1.d.)11. Water bath cell: 650 on12. Water bath temperature: 60*C (setting B)13. Standards for calibration: 0, 0.05, 0.10, 0.50, 1.00
Reagent Preparation; (Prepare fresh every 6 months unless otherwise noted.)1. Degassed Mill1-0 water - 2 options;
a. Boll Mill 1-Q water vigorously for 5 minutes. Cool and store 1ncubitalner.
b. Bubble helium, using the fritted gas dispersion tube, through 20 LMill1-Q water for 15-20 minutes. Store In cubitalner.
[602-96a]TPAAC-1
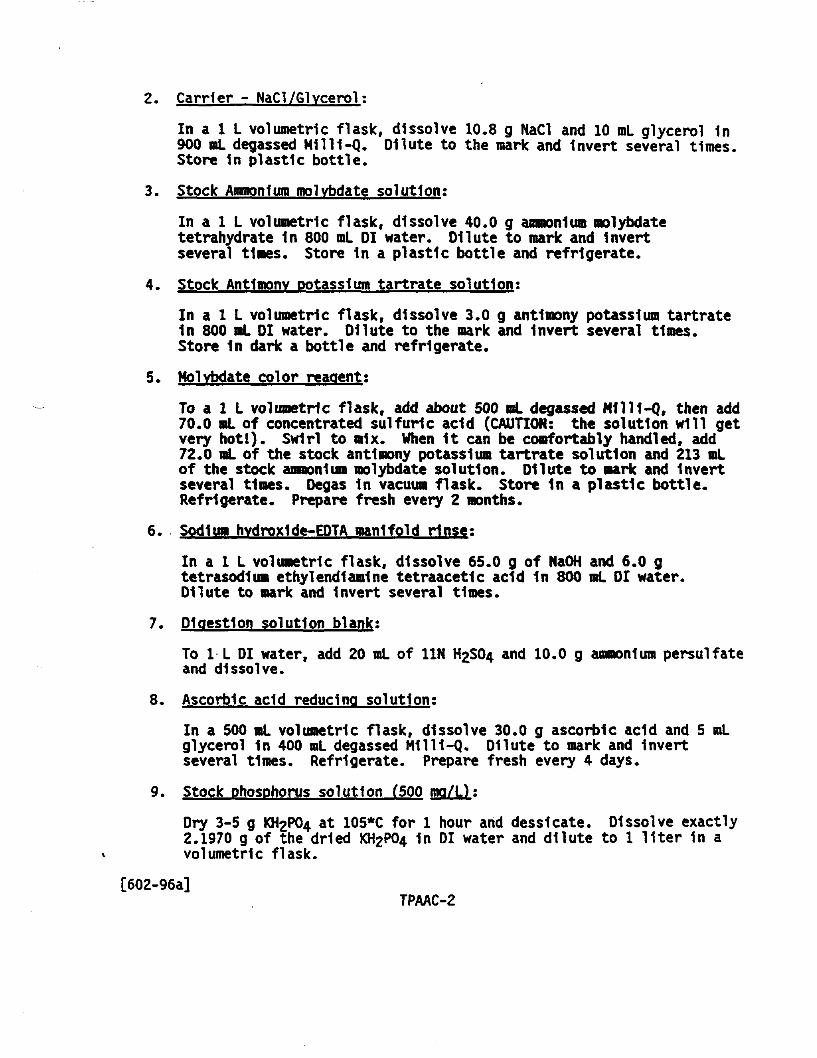
2. Carrier - NaCl/Glvcerol;
In a 1 L volumetric flask, dissolve 10.8 g NaCl and 10 ml glycerol In900 mi. degassed M1111-Q. Dilute to the mark and Invert several times.Store 1n plastic bottle.
3. Stock Ammonium molvbdate solution;In a 1 L volumetric flask, dissolve 40.0 g ammonium molybdatetetrahydrate In 800 ml DI water. Dilute to mark and Invertseveral times. Store 1n a plastic bottle and refrigerate.
4. Stock Antimony potassium tartrate solution:
In a 1 L volumetric flask, dissolve 3.0 g antimony potassium tartrate1n 800 rat 01 water. Dilute to the mark and Invert several times.Store In dark a bottle and refrigerate.
5. Molvbdate color reagent:
To a 1 L volumetric flask, add about 500 mL degassed M1111-Q, then add70.0 mL of concentrated sulfurlc add (CAUTION: the solution will getvery hot!). Swirl to mix. When 1t can be comfortably handled, add72.0 ml of the stock antimony potassium tartrate solution and 213 mlof the stock ammonium molybdate solution. Dilute to mark and Invertseveral times. Degas 1n vacuum flask. Store 1n a plastic bottle.Refrigerate. Prepare fresh every 2 months.
6. Sodium hvdroxlde-EDTA manifold rinse;
In a 1 L volumetric flask, dissolve 65.0 g of NaOH and 6.0 gtetrasodlum ethylendlamine tetraacetlc add 1n 800 mL DI water.Dilute to mark and Invert several times.
7. Digestion solution blank;
To 1 L DI water, add 20 ml of UN H£S04 and 10.0 g ammonium persulfateand dissolve.
8. Ascorbic acid reducing solution;
In a 500 ml volumetric flask, dissolve 30.0 g ascorbic add and 5 mlglycerol 1n 400 mL degassed M1111-Q. Dilute to mark and Invertseveral times. Refrigerate. Prepare fresh every 4 days.
9. Stock phosphorus solution (500 mo/L);
Dry 3-5 g KH2P04 at 105*C for 1 hour and desslcate. Dissolve exactly2.1970 g of the dried KH2P04 In DI water and dilute to 1 liter In avolumetric flask.
[602-96a]TPAAC-2

10. Standard Phosphorus solution (5 mo/U;
In a volumetric flask, dilute 10 ml of the stock phosphorus solutionto 1 liter with DI water.
11. Working standards; (Prepare fresh monthly.)
P1pet the volumes stated below of the 5 rog/L phosphorus standard Into100 ml volumetric flasks, and dilute to the mark with the digestionsolution blank.Concentration Letter Volume of 5 mg/Lof Standard Identifier Working Standard
0.00 mg/L A 00.05 mg/L 8 1.0 mL0.10 mg/L C 2.0 mL0.50 mg/L 0 10 mL1.00 mg/L E 20 mL
NOTE: Computer refers to standards by letter.
Notes;1. Heated chemistries tend to liberate dissolved gases from the reagents
causing air spikes during peak Integration. To prevent this, thewaste line from the flow cell should Include a coll several meterslong (as described 1n the Lachat Sulfate analysis).
2. Any sample dilutions must be diluted with the digestion solutionblankt not water.
3. $11 tea forms a pale blue complex which also absorbs at 880 nra. ThisInterference Is generally Insignificant as a silica concentration ofabout 4000 ppm would be required to produce a 1 ppm positive error.
4. Concentrations of ferric Iron greater than 50 mg/L result 1n anegative Interference due to competition of the complex with thereducing agent ascorbic add. Samples high In Iron can be pretreatedwith sodium blsulflte to eliminate this Interference. Treatment withblsulflte will also remove the Interference due to arsenates.
System Operation;
1. For digestion procedure refer to manual procedure (SOPf - TPDIG).
2. Refer to "Auto Analyzer Operation Start-up Procedure"(SOP* LAA - Section A).
[602-96a]TPAAC-3

NITRATE - AUTOANALYZER
Scope and Application: This method Is applicable to drinking water.surface water, groundwater and wastewater.
Reference; EPA 1983, Method 353.2Lachat Instruments, 1986
Detection Limit; 0.02 mg/L
Optimum Range: 0.02 - 2.00 mg/L M03.
Sample Handling; Analyze within 48 hours of collection. If this 1s notpossible, preserve the sample with 2 mL concentratedH2S04/1 liter and analyze within 14 days.
Instrument Conditions:
1* Pump speed: 352. Cycle period: 50 seconds3. Load period: 20 seconds4. Inject period: 20 seconds5. Inject to start of peak period: 22 seconds6. Inject to end of peak period: 68 seconds7. Gain: 4508. Zero: 4009. Interference filter: 520 nm
10. Sample loop: 17 cm11. Standards for curve set-up: 0, 0.20, 0.50, 1.00, 2.0012. Column: (see reagents 7*10)
Reagent Preparation: (Prepare fresh every 6 months, unless otherwise stated.)
1. Degassed H1111-Q water (2 options):
a. Boll M1111-Q water vigorously for 5 minutes. Cool and store1n a cubltalner, or
b. Bubble helium, using the fritted gas dispersion tube, throughthe M1111-Q water. Store In a cubltalner. (15 nrin/20 L)
2. Stock nitrate standard (100 mg/L Njfe); In a 1 liter volumetric flask,dissolve 0.7218 potassium nitrate (KNOa) 1n about 600 mL of M1111-Qwater. Add 2 mL of chloroform, as a preservative. Dilute to themark. Store 1n a dark glass bottle.
3. Working stock nitrate standard (10 mg/L NOi): In a 100 mL volumetricflask, p-fpet 10.0 mL of the stock nitrate standard and dilute to themark with M1111-Q water. Standard 1s good for 2 weeks 1f H2S04 preserved.
M03AA-1
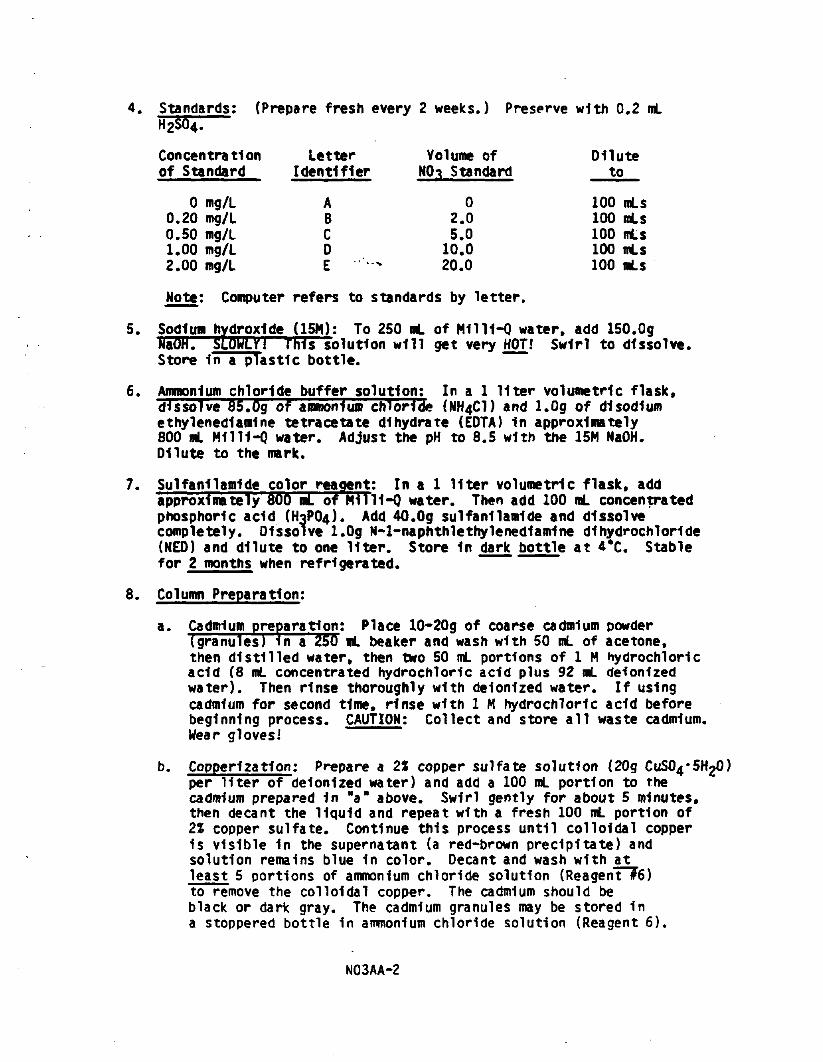
4. Standards: (Prepare fresh every 2 weeks.) Preserve with 0.2 nt
Concentration Letter Volume of Diluteof Standard Identifier N(h Standard to
0 mg/L A 0 100 nts0.20 mg/L B 2.0 100 nts0.50 mg/L C 5.0 100 nts1.00 mg/L D 10.0 100 nts2.00 mg/L E —— 20.0 100 nts
Note: Computer refers to standards by letter.
5. Sodium hydroxide (15M): To 250 at of MH11-Q water, add 150. OgNaUH. slOMLYl This solution will get very HOT! Swirl to dissolveStore In a plastic bottle.
6. Ammonium gh1or1<te buffer solution: In a 1 liter volumetric flask,dissolve 85. Og of ammonium chloride {NH4CD and l.Og of d1 sodiumethylenedlamlne tetracetate d1 hydrate (EDTA) In approximately800 nt M1111-Q water. Adjust the pH to 8.5 with the 15M NaOH.Dilute to the mark.
7. Sulfanllanide color reagent: In a 1 liter volumetric flask, addapproximately 800 nt of N1111-Q water. Then add 100 ml concentratedphosphoric add (^04). Add 40. Og sulfanllamlde and dissolvecompletely. Dissolve l.Og N~l-naphthlethylened1am1ne dlhydrochlorfde(NED) and dilute to one liter. Store 1n dark bottle at 4*C. Stablefor 2 months when refrigerated.
8. Column Preparation;
a. Cadmium preparation; Place 10-20g of coarse cadmium powder(granules) in a 250 nt beaker and wash with 50 nt of acetone,then distilled water, then two 50 nt portions of 1 M hydrochloricadd (8 nt concentrated hydrochloric add plus 92 nt de -ionizedwater). Then rinse thoroughly with delonlzed water. If usingcadmium for second time, rinse with 1 M hydrochloric add beforebeginning process. CAUTION; Collect and store all waste cadmium.Wear gloves!
Copper1zat1on; Prepare a 2% copper sulfate solution (20<jper liter of delonlzed water) and add a 100 nt portion to thecadmium prepared in "a" above. Swirl gently for about 5 minutes,then decant the liquid and repeat with a fresh 100 nt portion of2% copper sulfate. Continue this process until colloidal copperis visible in the supernatant (a red-brown precipitate) andsolution remains blue in color. Decant and wash with atleast 5 portions of ammonium chloride solution (Reagent #6)to remove the colloidal copper. The cadmium should beblack or dark gray. The cadmium granules may be stored ina stoppered bottle in ammonium chloride solution (Reagent 6).
N03AA-2

c. Packing the column (wear gloves!): Place a small piece ofpolyurethane foam (or glass wool) loosely 1n the end of theglass tube. Insert the plugged end of the glass tube Intothe column end fitting. Cut a length of 0.032" 1d teflontubing 3 to 4 Inches longer than the column.
Insert the teflon tube 1n the end fitting and fill the wholetube with water, holding the flexible tube 1n a U-shape sothat the ends are level. Place the second end fitting onthe other end of the teflon tubing. (Placing a small funnelonto the end fitting may aid filling.) Taking care that noair bubbles are Introduced, place the copper!zed cadmiumgranules In the column. Tap the column gently, every 1-2 cm,to pack the granules. When the column 1s packed to withinabout 5 mm of the end of the glass column, Insert anotherfoam plug, then the column end fitting. Store the columnwith the ends connected with a length of teflon tubing, asair pockets or having the column dry out will necessitaterepacking. If air remains In the column, connect the columnto the manifold and turn the pump on maximum. Tap columnfirmly until all air Is removed.
d. Column activation: The column must be activated before useor it win not reduce nitrate. This may be accomplished bypumping the 10 mg/L nitrate standard through the samplerline. When the solution 1s Injected, a brilliant pinkcolor will be visible 1n the coll. The cadmium columneffedency should be above 801, 1f less, the column must berepacked.
Notes:
1. Interferences:
- Build up of suspended matter 1n the reduction column willrestrict sample flow. Since nitrate-nitrogen Is found 1na soluble state, the sample must be pre-f1ltered.
- Low results might be obtained for samples that containhigh concentrations of Iron, copper or other metals. EDTA1s added to the samples to eliminate these Interferences.
- Samples that contain large concentrations of oil and greasewill coat the surface of the column. This Interference 1seliminated by pre-extracting the sample with an organicsolvent.
2. Samples must be diluted to obtain concentrations within theoptimum working range.
N03AA-3

3. The gain and zero settings are guidelines and must be adjustedeach day to optimize.
4. Color will Intefere; dilute the sample and also spike this sampleto confirm the quality of the result.
5. ACS grade ammonium chloride has been found occasionally tocontain significant nitrate contamination, so an alternativepreparation for the ammonium chloride buffer (Reagent 6) 1s asfollows:
In the hood, add 126 ml concentrated HC1 to a 1 liter volumetricflask containing 500 ml degassed M1111-Q water. Mix. Add 95 mlammonium hydroxide and 1*0 gm d1sodium EDIA. Dissolve and diluteto the mark. The pH should be 8.5 ± .1, adjust pH 1f necessary.
System Operation;
1. Refer to Auto Analyzer Operation - Start-up Procedure(IOP* LAA-sect1on A).
2. After pumping reagents through the lines, turn off the pump andInsert column, making sure that air bubbles are not IntroducedInto the column.
3. Activate column. (See *8d. above.)
4. Analyze a blank and EPA check standard at the beginning ofeach run.
5. Use 0.5 ppm spike levels. The calibration check standardIs 1.00 mg/L N03 (D).
6. If only nitrate 1s requested, nitrites must be analyzed andsubtracted from the nitrate + nitrite value.
7. However, since this method analyzes both forms of nitrogen,If the nitrate + nitrite result 1s <0.02, nitrite does notneed to be run for that sample.
8. After use, turn off the pump and remove the column from themanifold.
9. Refer to Auto Analyzer Shut-down Procedure.(IOPI LAA-sect1on B.)
Quality Control:
1. Establish a standard curve with the standards listed above.Record the check standard In the check standard book. Theconcentration should remain consistent from run to run. Ifnot, necessary troubleshooting must be performed beforecontinuing (check reagents, pump tubing, valves, etc.).
N03AA-4
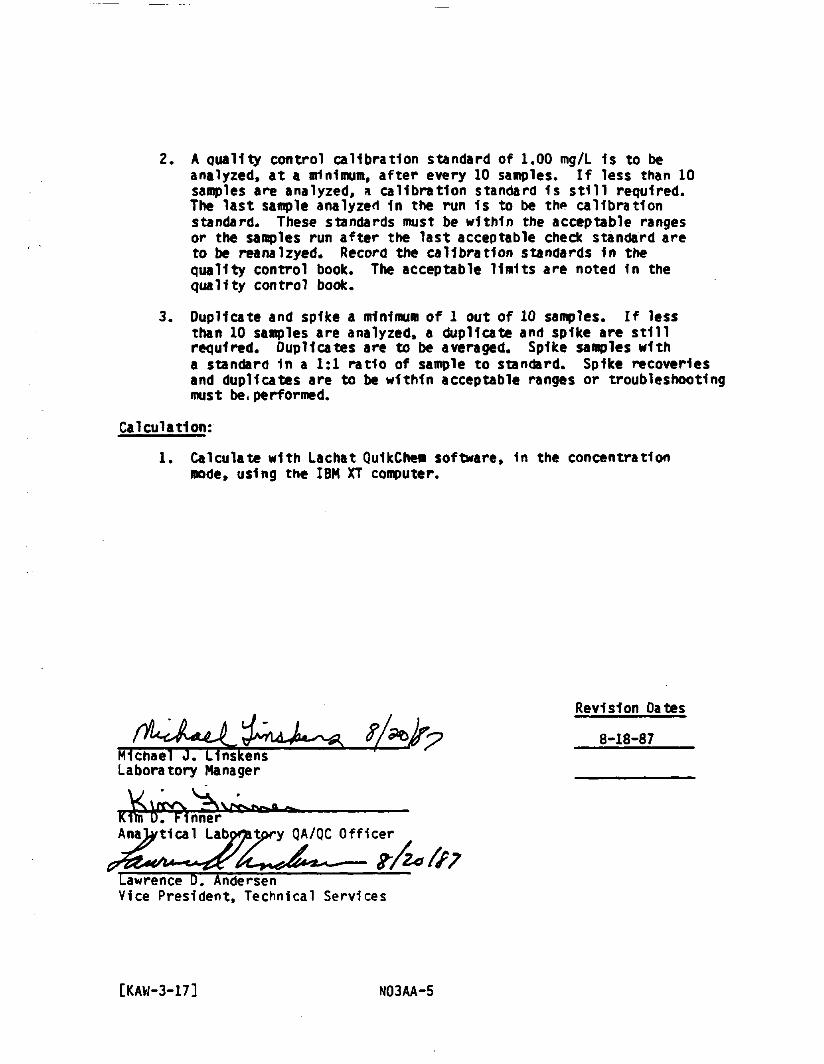
2. A quality control calibration standard of 1.00 mg/L Is to beanalyzed, at a minimum, after every 10 samples. If less than 10samples are analyzed, a calibration standard 1s still required.The last sample analyzed 1n the run 1s to be the calibrationstandard. These standards must be within the acceptable rangesor the samples run after the last acceptable check standard areto be reanalzyed. Record the calibration standards In thequality control book. The acceptable limits are noted in thequality control book.
3. Duplicate and spike a minimum of 1 out of 10 samples. If lessthan 10 samples are analyzed, a duplicate and spike are stillrequired. Duplicates are to be averaged. Spike samples witha standard 1n a 1:1 ratio of sample to standard. Spike recoveriesand duplicates are to be within acceptable ranges or troubleshootingmust be. performed.
Calculation:
1. Calculate with Lachat QuIkChem software, 1n the concentrationmode, using the IBM XT computer.
^Michael J. UnskensLaboratory Manager
Revision Dates
8-18-87
». FtnnerAnalytical Labpflatpry QA/QC Officer
e&i«A+~«*d'&^Lawrence D. AndersenVice President, Technical Services
[KAW-3-17] N03AA-5
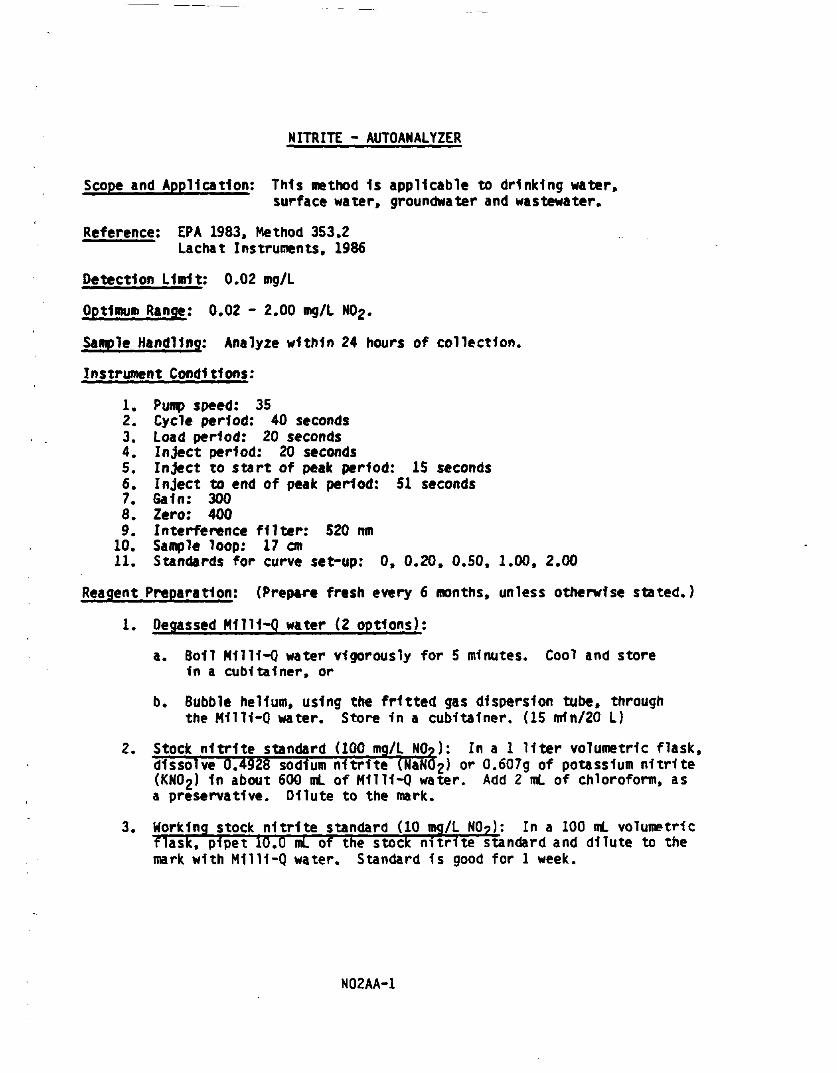
NITRITE * AUTOANALYZER
Scope and Application; This method 1s applicable to drinking water,surface water, groundwater and wastewater.
Reference; EPA 1983. Method 353.2Lachat Instruments, 1986
Detection Limit; 0.02 mg/L
Optimum Range; 0.02 - 2.00 mg/L M02-
Sample Handling; Analyze within 24 hours of collection.
Instrument Conditions:
1. Pump speed; 352. Cycle period; 40 seconds3. Load period: 20 seconds4. Inject period; 20 seconds5. Inject to start of peak period: 15 seconds6. Inject to end of peak period: 51 seconds7. Gain; 3008. Zero: 4009. Interference filter: 520 nm
10. Sample loop: 17 cm11. Standards for curve set-up: 0, 0.20, 0.50, 1.00, 2.00
Reagent Preparation; (Prepare fresh every 6 months, unless otherwise stated.)
1. Degassed M1111-Q water (2 options);
a. Boll M1111-Q water vigorously for 5 minutes* Cool and storeIn a cubitalner, or
b. Bubble helium, using the fritted gas dispersion tube, throughthe M1111-Q water. Store 1n a cubltalner, (15 nrin/20 L)
2. Stock nitrite standard (100 mg/L NO?): In a 1 liter volumetric flask,dissolve 0.4928 sodium nitrite (NaN02> or 0.607g of potassium nitrite(KN02) 1n about 600 nt of M1111*Q water. Add 2 mL of chloroform, asa preservative. Dilute to the mark.
3. Working stock nitrite standard (10 mg/L NO?): In a 100 mL volumetricflask, plpet 10.0 mL of the stock nitrite standard and dilute to themark with M1111-Q water. Standard 1s good for 1 week.
N02AA-1

4. Standards: (Prepare fresh daily.)
Concentration Letter Volume of Diluteof Standard Identifier NO? Standard to
0 mg/L A 0 100 mLs0.20 mg/L B 2.0 100 mLs0.50 mg/L C 5.0 100 mLs1.00 mg/L D 10.0 100 mLs2.00 mg/L E 20.0 100 mLs
Note; Computer refers to standards by letter.
5. Sodium hydroxide (15M): To 250 mL of M1111-Q water, add 150.OgNaQH. slOHLYlThis solution will get very HOT! Swirl to dissolve.Store In a plastic bottle.
6. Ammonium chloride buffer solution; In a 1.liter volumetric flask,dissolve 85.Og of ammonium chloride (NHAC1) and l.Og of 01 sodiumethylenedlanrlne tetraacetate d1 hydrate (EDTA) In approximately800 mL M1111-Q water. Adjust the pH to 8.5 with the 15M NaOH.Dilute to the mark.
7. Sulfanllanrtde color reagent: In a 1 liter volumetric flask, addapproximately 800 mL of M1111-Q water. Then add 100 mL concentratedphosphoric add (HiPO^). Add 40.Og sulfanllamlde and dissolvecompletely. Dissolve l.Og N-l-naphthlethylened1anrfne dlhydrochlorfde(NED) and dilute to one liter. Store in dark bottle at 4*C. Stablefor 2 months when refrigerated.
Notes:
1. Samples must be diluted to obtain concentrations within theoptimum working range.
2. The gain and zero settings are guidelines and must be adjustedeach day to optimize.
3. Turbidity will Interfere. Samples must be filtered prior toanalysis. (Use Whatman II or *4.)
4. Color will Interfere, dilute the sample and also spike thissample to confirm the quality of the result.
5. ACS grade ammonium chloride has been found occasionally tocontain significant nitrate contamination, so an alternativepreparation for the ammonium chloride buffer (reagent 6) isas follows:
N02AA-2

In the hood, add 126 ml concentrated HC1 to a 1 liter volumetriccontaining 500 ml degassed M1111-Q water. Mix. Add 95 nianmonlum hydroxide and 1.0 gm dlsodlura EOTA. Dissolve and diluteto the nark. The pH should be 8.5 +_ .1, adjust pH 1f necessary.
System Operation;
1. Refer to Auto Analyzer Operation - Start-up Procedure(IOP* LAA-sect1on A).
2. Analyze a blank and a check standard at the beginning of eachrun. There are no outside EPA standards available for this analyte.
3. Use a 0.50 ppm spike level.
4. The calibration check standard 1s 1.00 mg/L (D).
5. Refer to "Auto Analyzer Shut-down Procedure".(IOP* LAA-sect1on BJ
Quality Control:t
1. Establish a standard curve with the standards listed above.Record the check standard In the check standard book. Theconcentration should remain consistent from run to run. Ifnot, necessary troubleshooting must be performed beforecontinuing (check reagents, pump tubing, valves, etc.).
2. A quality control calibration standard of 1.00 mg/L 1s to beanalyzed, at a minimum, after every 10 samples. If less than10 samples are analyzed, a calibration standard 1s still required.The last sample analyzed 1n the run 1s to be the calibrationstandard. These standards must be within the acceptable rangesor the samples run after the last acceptable check standard areto be reanalzyed. Record the calibration standards 1n thequality control book. The acceptable limits are noted In thequality control book.
3. Duplicate and spike a minimum of 1 out of 10 samples. If lessthan 10 samples are analyzed, a duplicate and spike are stillrequired. Duplicates are to be averaged. Spike samples witha standard 1n a 1:1 ratio of sample to standard. Spikerecoveries and duplicates are to be within acceptable ranges ortroubleshooting must be performed.
N02AA-3

Calculation:
1. Calculate with Lachat QuUcChem software, In the concentrationmode, using the IBM XT computer.
Revision Dates
8-18-87Michael J. LlnskensLaboratory Manager
£ t/y> /n oItn D. Flnner
Analytical Laboratory QA/QC Officer
Lawrence 0. AndersenVice President. Technical Services
[KAW-3-18] N02AA-4
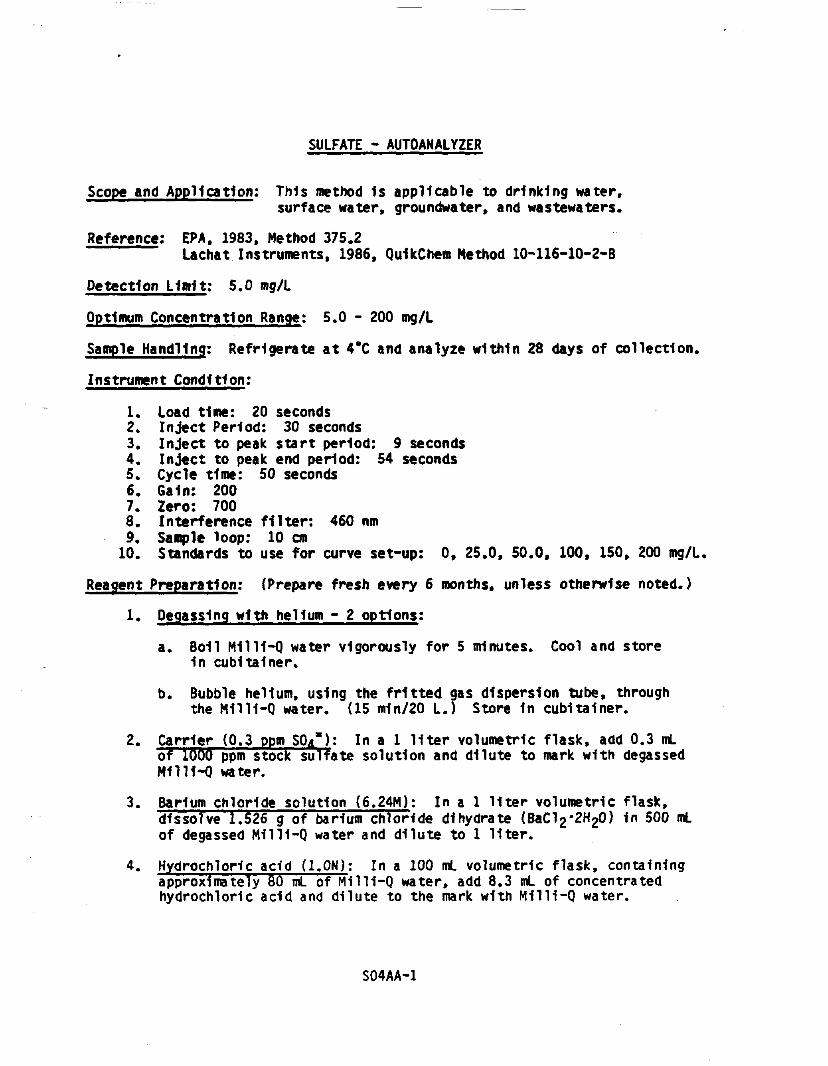
SULFATE - AUTOANALYZER
Scope and Application: This method 1s applicable to drinking water.surface water, groundwater, and wastewaters.
Reference: EPA, 1983. Method 375.2Lachat Instruments, 1986, QuIkChem Method 10-116-10-2-8
Detection Limit: 5.0 mg/L
Optimum Concentration Range: 5.0 - 200 mg/L
Sample Handling; Refrigerate at 4*C and analyze within 28 days of collection.
Instrument Condition:
1* Load time: 20 seconds2. Inject Period: 30 seconds3. Inject to peak start period: 9 seconds4. Inject to peak end period: 54 seconds5. Cycle time: 50 seconds6. Gain: 2007. Zero: 7008. Interference filter: 460 nm9. Sample loop: 10 cm
10. Standards to use for curve set-up: 0, 25.0, 50.0, 100, 150, 200 mg/L.
Reagent Preparation; (Prepare fresh every 6 months, unless otherwise noted.)
1. Degassing with helium - 2 options:
a. Boll Mil 11-Q water vigorously for 5 nrfnutes. Cool and store1n cubltalner.
b. Bubble helium, using the fritted gas dispersion tube, throughthe M1111-Q water. (15 nrln/20 L.) Store 1n cubltalner.
2. Carrier (0.3 ppoi SOa*); In a 1 liter volumetric flask, add 0.3 mLof 1000 ppm stock sulfate solution and dilute to mark with degassedM1111-Q water.
3. Barium chloride solution (6.24M): In a 1 liter volumetric flask,dissolve 1.526 g of barium chloride dlhydrate (BaCl2'2H20) 1n 500 mLof degassed M1111-Q water and dilute to 1 liter.
4. Hydrochloric acid (l.ON); In a 100 mL volumetric flask, containingapproximately 80 mL of M1111-Q water, add 8.3 mL of concentratedhydrochloric add and dilute to the mark with M1111-Q water.
S04AA-1
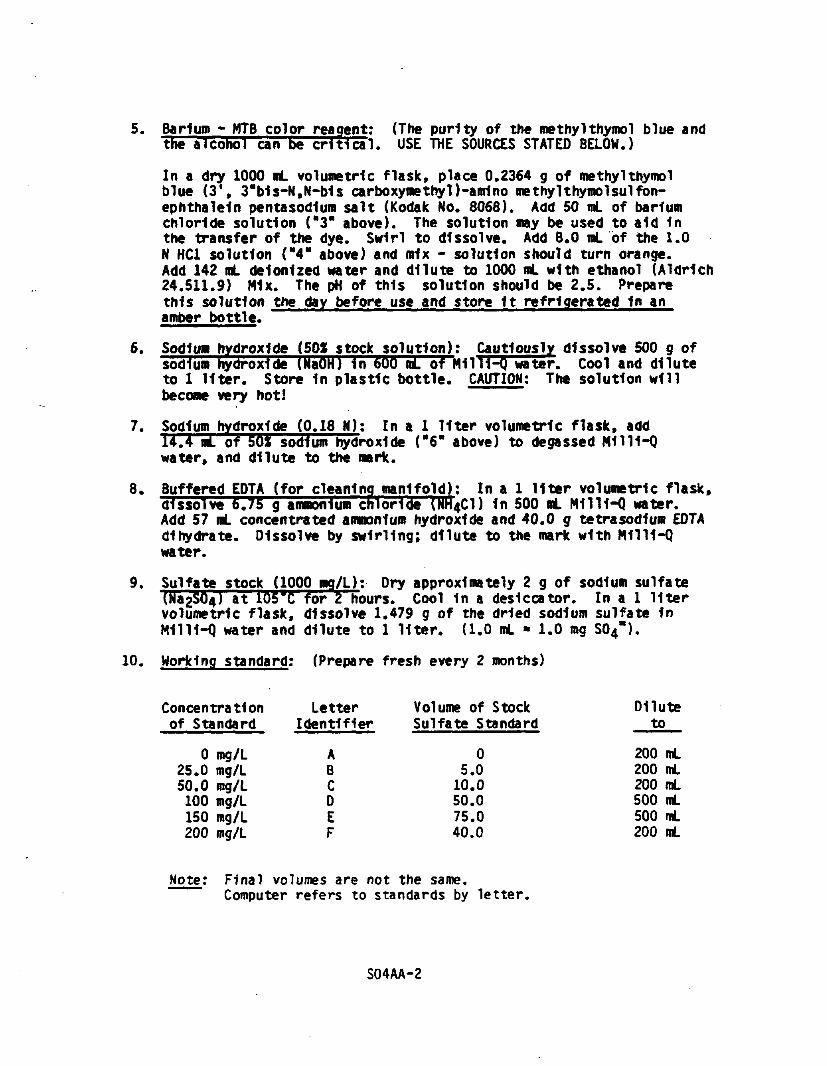
5. Barium * MTB color reagent: (The purity of the methyl thymol blue andthe alcohol can be critical. USE THE SOURCES STATED BELOW.)
In a dry 1000 mL volumetric flask, place 0.2364 g of me thy! thymolblue (3\ 3"b1s-N,N-b1s carboxymethyD-anrfno methylthymolsulfon-ephthaleln pentasodlum salt (Kodak No. 8068). Add 50 ml of bariumchloride solution ("3" above). The solution may be used to aid 1nthe transfer of the dye. Swirl to dissolve. Add 8.0 ml of the 1.0N HC1 solution ("4" above) and mix - solution should turn orange.Add 142 mt 6eIonized water and dilute to 1000 ml with ethanol (AldHch24.511.9) Mix. The pH of this solution should be 2.5. Preparethis solution the day before use and store 1t refrigerated 1n anamber bottle.
6. Sodium hydroxide (50* stock solution): Cautiously dissolve 500 g ofsodium hydroxide (NaOH) In 600 rat of M1111-Q water. Cool and diluteto 1 liter. Store 1n plastic bottle. CAUTION: The solution willbecome very hot!
7. Sodium hydroxide (0.18 N): In a 1 liter volumetric flask, add14.4 mi of 50X sodium hydroxide ("6" above) to degassed M1111-Qwater, and dilute to the mark.
8. Buffered EDTA (for cleaning manifold); In a 1 liter volumetric flask,dissolve 6.75 g ammonium cniorlde (NH4C1) 1n 500 mi M1111-Q water.Add 57 ml concentrated ammonium hydroxide and 40.0 g tetrasodlum EDTAdlhydrate. Dissolve by swirling; dilute to the mark with M1111-Qwater.
9. Sulfate stock (1000 mg/L): Dry approximately 2 g of sodium sulfate(Na2S04> at 105*C for 2 hours. Cool In a desiccator. In a 1 litervolumetric flask, dissolve 1.479 g of the dried sodium sulfate InM1111-Q water and dilute to 1 liter. {1.0 ml « 1.0 mg S04").
10. Working standard: (Prepare fresh every 2 months)
Concentration Letter Volume of Stock Diluteof Standard Identifier Sulfate Standard to
0 mg/L A 0 200 mL25.0 mg/L B 5.0 200 mL50.0 mg/L C 10.0 200 mL
100 mg/L D 50.0 500 mL150 mg/L E 75.0 500 mL200 mg/L F 40.0 200 mL
Note: Final volumes are not the same.Computer refers to standards by letter.
S04AA-2

Preparation of Ion Exchange Column:
1. Make a slurry of approximately 0.5 g of BloRex 70, 50-100 mesh ionexchange resin 1n M1TI1-Q water.
2. Remove one column end from the glass column. F111 the column withwater, then aspirate the slurry or allow It to settle by gravity topack the column. Take care to avoid trapping air bubbles In the
Notes:
'ingaTTcolumn and Its fittings at this point and all subsequent operations.
3. After the resin has settled, replace the end fitting. To ensure agood seal, remove any resin particles from the threads of the glass,the column end and the end fittings. To store the column, the endsof the Teflon tubing may be joined with a union.
4. To test the effectiveness of the column, make up a standard of puresodium sulfate and compare Its peak height to an Identical standardwith hardness typical of the samples added. If the column Is beingdepleted, the standard with hardness will read lower because thedivalent cations are complexlng the free MTB. The concentration ofthe standard should be mid-range. If depletion has occured, repackthe column with fresh resin.
5. Regenerating Resin: Batch regeneration 1s recommended because thehyarogen form of BloRex 70 can swell considerably more than thesodium form. Collect the used resin In a small beaker or flask.Wash with dilute HC1 until the wash tests free of calcium and/ormagnesium. This procedure removes the divalent cations byconverting the carboxylate exchange group to the protonated form -COOH. Convert the resin back to the sodium form by neutralizingwith washes of 0.5M NaOH until the wash has a pH of 9 or greater.Rinse with deionized water for storage or repacking. A column maybe used for 3-4 trays (approximately 150 samples) before It needsto be replaced.
1. Samples must be diluted to obtain concentrations within the optimumworking range.
2. Sulfate standards may be combined with alkalinity and chloridestandards for use with the 3-channel method.
3. The gain and zero settings are guidelines and must be adjusted eachday to optimize.
S04AA-3

Inteferences:
- The cation exchange column removes multlvalent cations. Run amid-range sulfate standard containing a typical concentration ofCaC(>3 periodically to check performance. Any decrease 1n peakheight should Indicate the need to regenerate or replace theresin. (At 600 ppm CaC039 the column Is good for 80 + Injections.)
- Samples with pH less <2 should be neutralized. High acidconcentrations can displace multlvalent cations from the column.
- Color will Interfere. Dilute the sample and also spike this sampleto confirm the quality of the result.
- Turbidity - turbid samples may be filtered (use Whatman #1 or#4} prior to analysis on La chat*
- Orthophosphate also forms a precipitate with barium at high pH.Check the response of pure orthophosphate standards. If samplesare known to be high 1n
5. Troubleshooting;
A. Baseline noise with reagents pumping.
1. Noise with column In line but good baseline without column.
a. Repack column, air bubbles may be causing pulsing.
b. Check flow fit connectors and end fittings on columnfor blockage or leaks.
2. Noise with and without column in line.
a. Degas carrier and/or reagents. Fine bubbles causesharp spikes on baseline.
b. Place a longer piece of manifold tubing on the outletof the flow cell leading to the waste container. Thismethod requires the use of the screw type flow cell.
c. Replace the pump tubes. The sill cone tube, used for thecolor reagent, wears faster than the PVC pump tubes.
d. With water pumping 1n the lines, check all hydraulicconnections for blockages, leaks, etc.
SQ4AA-4

B. Baseline drift*
1. Clean the manifold with the buffered EOT A.
2. Turn the gain high and use the shortest sample loop possible.This Improves the linearity of the calibration curve, prolongsthe useful life of the column, and minimizes the build up ofBaS04 on the manifold tubing.
System Operation;
1. Refer to "Auto Analyzer Operation Start-up procedure" (SOP* LAA-sectlon A).
2. Pump reagents through lines until baseline 1s stable. Then turn offpump and Insert column.
3. Pump reagents through the lines before Inserting the column. Use ashort piece of manifold tubing 1n place of the column. When all airhas passed and the baseline Is steady, turn off the pump and Insertthe column. The column should be placed 1n a vertical position withflow 1n the top and out the bottom. In this configuration, the columnwill operate effectively even if the resin packs down more to leave agap at the top. Resume pumping.
4. Analyze a blank and an ERA check standard at the beginning ofeach run.
5. Use a 75 ppm spike level. The calibration check standard is100 mg/L (D).
6. To shut down, turn off pump and remove the column*
To remove the column:
a. Turn off the pump.b. Remove the column.c. Join ends of the column with a union.d. Replace the column on the manifold with the short teflon tubing
piece.e. Rinse manifold with M11H-Q water,f. Rinse manifold with EDTA cleaning solution,g. Rinse manifold again with M1111-Q water,h. Pump dry.
Follow "Auto Analyzer Shut-down procedures" (SOPt LAA-Section B).
Quality Control:
S04AA-5

AMMONIA NITROGEN
Scope and Application: This method 1s applicable to the determinationof ammonia-nitrogen In drinking water, surfacewater, groundwater, sludges, soils, and Industrialwastes.
Method; Micro-distillation, ColoMmetMc
Reference: ERA, 1983, Method 350.2
Detection Limit: 0.10 mg/L for aqueous samples5.00 mg/kg for soils and sludges
Optimum Range: 0.10 - 2.00 mg/L for aqueous samples5.00 - 100 mg/kg for soils and sludges
Sample Handling: Acidify aqueous samples with concentrated sulfurlc acidto pH <2 and refrigerate at 4°C. Refrigerate soils andsludges at 4°C. Analyze within 28 days of sampling.
Reagents and Apparatus:
1. Kjeldahl flasks, 100 ml2. Keeney distillation apparatus3. Spectrophotometer, set at 425nm with slpper cell4. Erlenmeyer flasks, 50 mL5. Sulfurlc add, concentrated6. M1111-Q water7. pH meter, 0.1 pH unit sensitivity8. Volumetric glassware, Class A (pipets and flasks)9. Top loading balance, O.Olg sensitivity
10. Graduated cylinders, 50 mL11. Mixing cylinders, 50 mL12. Ammonium chloride (NH4C1)13. Boric acid14. Mercuric Iodide (Hglp)15. Potassium iodide (KI)16. Sodium hydroxide (NaOH)17. Sodium tetraborate (Na2B407*lDHoO)18. Sodium thlosulfate (NaoS203*5H20)19. Analytical balance, O.OOOlg sensitivity20. 150 mL beaker21. Stir bars and stir plate
Reagent Preparation: (Prepare fresh every 6 months, unless otherwise stated.)
1. Ammonium chloride stock solution (1000 mg/L): In a 1 liter volumetricflask, dissolve 3.819 g NH l in approximately 300 mL Milli-Q waterand bring to volume.
NH3DT1-1

2. Ammonium chloride standard solution (10 mg/L); Dilute 10.0 ml ofof the ammonium cmorlde stock solution to 1 liter with M1111-Qwater 1n a volumetric flask.
3. Boric add solution: Dissolve 20. Og ^803 In M1111-Q water anddilute to 1 liter 1n a volumetric flask.
4. Nessler reagent: Dissolve lOOg of mercuric Iodide and 70g ofpotassium Iodide In about 200 ml of M1111-Q water. Add thismixture slowly, while stirring to a COOLED solution of 160gNaOH In 500 ml M1111-Q water. Dilute the mixture to 1 liter.Store 1n a Pyrex bottle and keep out of direct sunlight.
5. Sodium hydroxide (IN): Dissolve 40g of NaOH In M1111-Q waterand dilute to 1 liter.
6. Sodium hydroxide (0. IN): Dilute 100 ml of IN NaOH to1 liter with M1111-Q water.
7. Sodium tetraborate solution (0.025M): Dissolve 9.5g of NapB^or 5.0g anhydrous NagB^y In M1111-Q water and dilute to 1 liter.
8. Borate buffer: Add 88 ml of 0.1N NaOH solution to 500 ml of 0.025Msodium tetraborate solution. Dilute to 1 liter.
9. Sodium thiosulfate (1/70N): Dissolve 3.5g NagSgOo'SHgO 1n M1111-Qwater and dilute to 1 liter. (1 ml of this solution will remove1 mg/L of residual chlorine In 500 mL of sample.)
Notes :
1. Residual chlorine must be removed prior to distillation by pretreatingthe sample with sodium thlosulfate solution.
2. Pre-steam the distillation apparatus with 10% NaOH before use for eachbatch analyzed.
3. Cyanate and some volatile alkaline compounds may cause an offcolornesslerlzatlon. This off-color can be eliminated by boiling the sampleat a low pH (pH 2-3) to drive off the compound. This should be doneprior to the distillation step.
Procedure;
Distillation:
1. All glassware is to be soap and water washed, tap water rinsed,and Milli-Q water rinsed prior to use.
NH3DT1-2

2. The reservoir should be 2/3 full with M1111-Q water. Add a fewboiling chips. Add sulfuric acid to reservoir to bring to a ph <2.Turn on the heater. Set heater control to about 6. Allow thesteam reservoir to heat up. This unit will take about 45 minutesto heat-up. Turn the heater control to about a setting of 9 and bringto boiling. Analysis can begin once boiling begins.
3. Prepare the distillation apparatus as follows: Steam out the dis-tillation apparatus with a 10% NaOH solution. Analyze a blank toconfirm no trace of ammonia exists (no color change with the additionof the Nessler reagent to the distillate).
4. Aqueous samples:
Place 40 ml or an aliquot of sample diluted to 50 ml 1n a 150 mLbeaker. Record the volume used. Add IN NaOH while stirring veryslowly until the pH is 9.5 using pH paper*
To spike: Place 45 ml sample and 5 ml of the 10 mg/L ammonia standardto the Kjeldahl flask and continue with procedure.
Non-aqueous samples:
Place approximately l.Og in a 150 ml beaker. Record weight used.Add 50 ml M1111-Q water and adjust the pH with IN NaOH, whilestirring slowly, to pH 9.5 using pH paper.
To spike: Place l.Og sample, 1 ml of the 10001 mg/L ammonia standardIn the Kjeldahl flask. Add 50 ml M1111-Q water and continue withprocedure.
5. Transfer the pH-adjusted sample to a 100 ml Kjeldahl flask. Add 2.5mL of borate buffer.
6. Add 5 mL of boric acid to a 50 mL erlenmeyer flask and place flaskat the condenser outlet with the tip of the condenser immersed inthe boric add.
7. Connect the Kjeldahl flask to the distillation apparatusand secure with springs.
8. Open the stopcock to the still on the condensation chamber.Close the drain stopcock. The steam will now pass throughthe Kjeldahl flask.
9. Steam distill 30-40 mL at a rate of 4-5 mL/min.
10. Remove the erlenmeyer flask.
NH3DT1-3

11. Rinse the tip of the condenser and steam outlet Into a waste beaker.
12. Continue distilling remaining samples, blanks and standards. Whenall samples, blanks and standards are distilled, the colorimetricdetermination can be performed.
Colormetrlc Determination:
1. Prepare the following series of blanks and standards 1n 50 mL mixingcylinders (These do not need to be taken throught the distillation
step.)
ml of 10 mg/Lammonium chloride Dilute Concentration
solution to (mg/L)
0 50 ml BLANK0.5 50 mL 0.101.0 50 mL 0.202.0 50 mL 0.405.0 50 mL 1.00
10.0 50 mL 2.00
2. Add 2.0 mL of Messier reagent to the blank and standards. Stopperand mix by Inverting several times.
3. After 20 minutes, read the absorbances on the spectrophotometer setat 425 nm using the sipper cell. Zero the spectrophotometer to theund1st1lled reagent blank.
4. Transfer distilled samples to 50 mL volumetric flasks and dilute to50 mL with M1111-Q water. Mix.
5. Determine the ammonia in the distillate as follows:
• Transfer 25 mL of distillate, or an aliquot diluted to 25 mL, toa mixing cylinder.
• Add 1 mL of Nessler reagent and mix by inverting several times.
• After 20 minutes, read the absorbance as described in step 3.
Calculations:
1. Aqueous Samples:
a. Calculate using linear regression.
b. Multiply in any dilution factors performed in the distillationand colorimetric steps to obtain the final result in mg/L.
NH3DT1-4

2. Non-Aqueous samples:
a. Calculate using regression to obtain a mg/L value.
b. Multiply In any dilution factor performed 1n the colorlmetricstep (mg/L).
c. Multiply result obtained from "Step b" by 50 and divide by gramsof sample used to obtain the final result in mg/kg.
1. Spike calculation:[Total mL][Conc. of] [ ml ][Conc. of]
% Recovery = [SA + STD][ spike ] "~ [SA used][ SA ](ml STD used)(Cone. STO)
Where SA = sampleSTO = standard
juality Control:
1. Establish a standard curve with the standards listed above plus a blank.The standard curve must be carried through the distillation process.Record the absorbance check standards (1*00 mg/L) In the absorbancecheck book. The absorbances should remain consistent from run to run.If not, necessary troubleshooting must be performed before continuing(check wavelength, spectrometer bulb, solutions, etc.).
2. A distilled blank and standard (1.00 mg/L) 1s to be analyzed Initiallyand at the end of the analytical run. The standard must be withinacceptable ranges (+_ 10% of true value), or troubleshooting must beperformed.
3. A quality control calibration standard of 1.00 mg/L is to be analyzed,Initially and after every 10 samples. This standard does not need becarried through the distillation procedure. The last sample analyzedin the run Is to be the calibration standard. These standards must bewithin the acceptable ranges (+ 10% of the true value) or the samplesrun after the last acceptable "check standard are to be reanalyzed.
4. Duplicate and spike a minimum of 1 out of 10 samples. If less than 10samples are analyzed, a duplicate and spike are still required. Duplicatesare to be averaged. Spike recoveries and duplicate results are to bewithin acceptable ranges.
KAW-4-2] NH3DT1-5
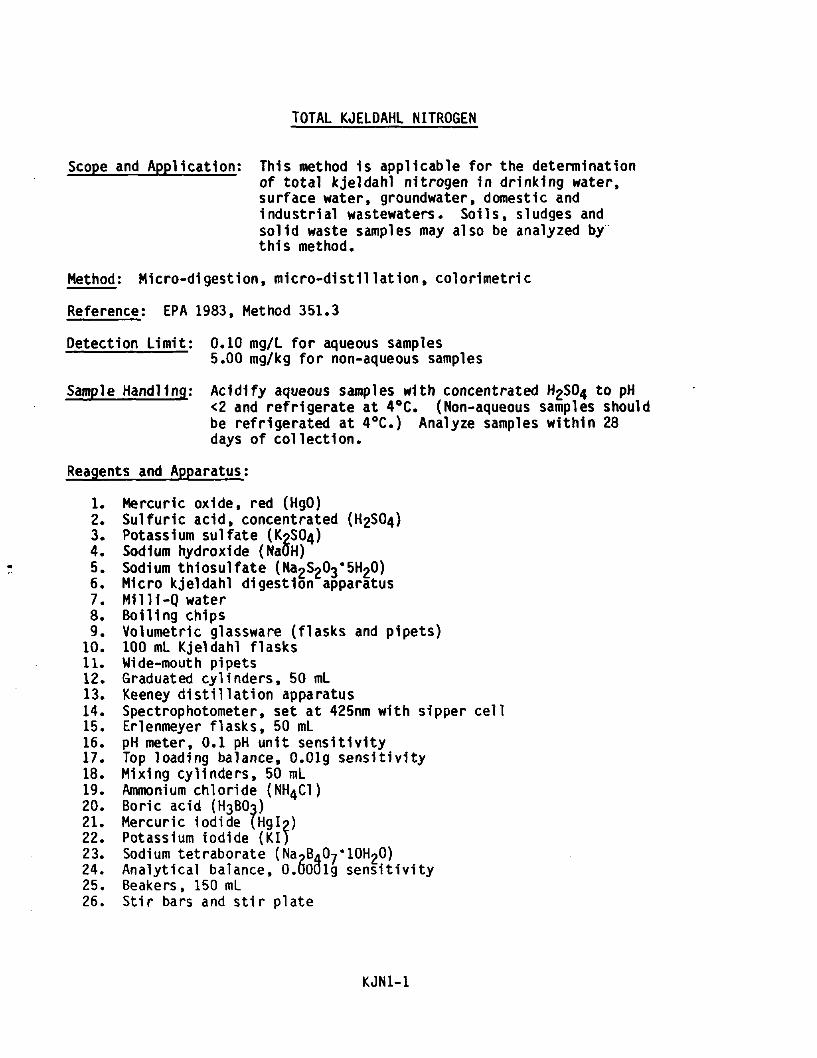
TOTAL KJELDAHL NITROGEN
Scope and Application: This method 1s applicable for the determinationof total kjeldahl nitrogen in drinking water,surface water, groundwater, domestic andindustrial wastewaters. Soils, sludges andsolid waste samples may also be analyzed bythis method.
Method: Micro-digestion, micro-distillation, colorimetrlc
Reference: EPA 1983, Method 351.3
Detection Limit: 0.10 mg/L for aqueous samples5.00 mg/kg for non-aqueous samples
Sample Handling: Acidify aqueous samples with concentrated H2S04 to pH<2 and refrigerate at 4°C. (Non-aqueous samples shouldbe refrigerated at 4°C.) Analyze samples within 28days of collection.
Reagents and Apparatus:
1. Mercuric oxide, red (HgO)2. Sulfuric acid, concentrated (H2S04)3. Potassium sulfate (KoS04)4. Sodium hydroxide (NaOH)5. Sodium thiosulfate (Na2S203'5H20)6. Micro kjeldahl digestion apparatus7. M1111-Q water8. Boiling chips9. Volumetric glassware (flasks and pipets)
10. 100 mL Kjeldahl flasks11. Wide-mouth pi pets12. Graduated cylinders, 50 mL13. Keeney distillation apparatus14. Spectrophotometer, set at 425nm with sipper cell15. Erlenmeyer flasks, 50 mL16. pH meter, 0.1 pH unit sensitivity17. Top loading balance, O.Olg sensitivity18. Mixing cylinders, 50 mL19. Ammonium chloride (NH4C1)20. Boric acid (^3603)21. Mercuric iodide (Hglp)22. Potassium iodide (KI)23. Sodium tetraborate (NaoBrfOy ' lO^O)24. Analytical balance, O.OOOlg sensitivity25. Beakers, 150 mL26. Stir bars and stir plate
KJN1-1

Reagent Preparation: (Prepare fresh every 6 months, unless otherwise stated.)
1. Mercuric sulfate solution: Dissolve 4.0g red HgO In 25 ml of 1:4sulfurlc acid (5 ml cone. ^SO^ZO ml M1111-Q water) and dilute to50 ml with N1111-Q water.
2. Digestion solution: Dissolve 133.5g KgS04 in 650 mL Nil 11-Q.waterand 200 mL cone. ^04* Add 25 mL of mercuric sulfate solution anddilute to 1 liter with N1111-Q water. Store at room temperature Inglass to prevent crystallization. If crystals do form, heat slowly,while stirring, to dissolve.
3. Sodium hydroxide-sodium thiosulfate solution; Dissolve 500g NaOHand 25.Og Na2S2Oj'5H20 in N1111-Q water and dilute to 1 liter.Store in a plastic bottle.
4. Ammonium chloride stock solution (1000 mg/L): In a liter volumetricflask, dissolve 3.819g NH^Cl in approximately 300 mL N1111-Q water andbring to volume.
5. Ammonium chloride standard solution (10 mg/L): In a volumetric flask,dilute 10.0 mL of the ammonium chloride stock solution to 1 liter withNilli-Q water.
6. Boric acid solution: In a volumetric flask, dissolve 20.Og H3B03 1nN1111-Q water and dilute to 1 liter.
7. Nessler reagent; Dissolve lOOg of mercuric Iodide and 70g ofpotassium iodide 1n about 200 mL of N1111-Q water. Add thismixture slowly, while stirring to a COOLED solution of 160gNaOH in 500 ml N1111-Q water. Dilute the mixture to 1 liter.Store in a Pyrex bottle and keep out of direct sunlight.
8. Sodium hydroxide (IN): Dissolve 40g NaOH in Nilli-Q water anddilute to 1 liter.
9. Nicotim'c Acid: (Soils) - Dissolve 1.6481g in 750 mL Nilli-Q water,add 1 mL HoSOa and dilute to 1 liter.
(Waters) - Dissolve 0.8790g in 900 mL Nilli-Q water and 2 ml H2S04and dilute to 1 liter.
Notes:
1. High nitrate concentrations (10 times or greater that of the TKNlevel) result in low TKN values. Dilute samples and spike ifnitrate interferences are expected.
KJN1-2

2. The distillation unit can occasionally build up with mercury. Washthe distillation unit with 10% HCL to prevent build-up in thetubes.
3. Contamination can be a problem. Be sure to wash all glassware andapparatus thoroughly and rinse with M1111-Q water prior to use.
Procedure:
A. Digestion:
1. All glassware must be soap and water washed, tap water rinsed andM1111-Q water rinsed prior to use.
2. For aqueous samples: Measure out 50 ml sample (or an aliquotdiluted to 50 ml 1f elevated TKN levels are expected) into a 100 mlKjeldahl flask. Record the volume used.
To spike: Measure 25 ml sample and 25 ml of the 5 ppm. Nlcotinicacid solution for a final concentration of 2.5 mg/L.
For non-aqueous samples: Weigh out approximately l.Og sample Intoa 100 ml Kjeldahl flask. Record weight used. Add 50 ml M1111-Qwater.
To spike; Weigh out approximately 1.0 g sample, add 1 ml of the 1000mg/L ammonium chloride standard and proceed. Record weight used.
3. Add 10 ml of digestion solution to the kjeldahl flask using a 10 mlwide-mouth pipet. Add 3-5 boiling chips.
4. Place flask on micro Kjeldahl digestion apparatus and digest untildense, white 803 fumes are given off and the solution turns colorlessor straw yellow. Digestion must be performed In the hood! Digestthe samples with the digestion apparatus set at 3-4.
5. Digest for 30 minutes more.
6. Cool and add 30 ml M1111-Q water,
7. Proceed to the distillation portion of the procedure.
B. Distillation:
1. All glassware is to be soap and water washed, tap water rinsed, andMilli-Q water rinsed prior to use.
KJN1-3
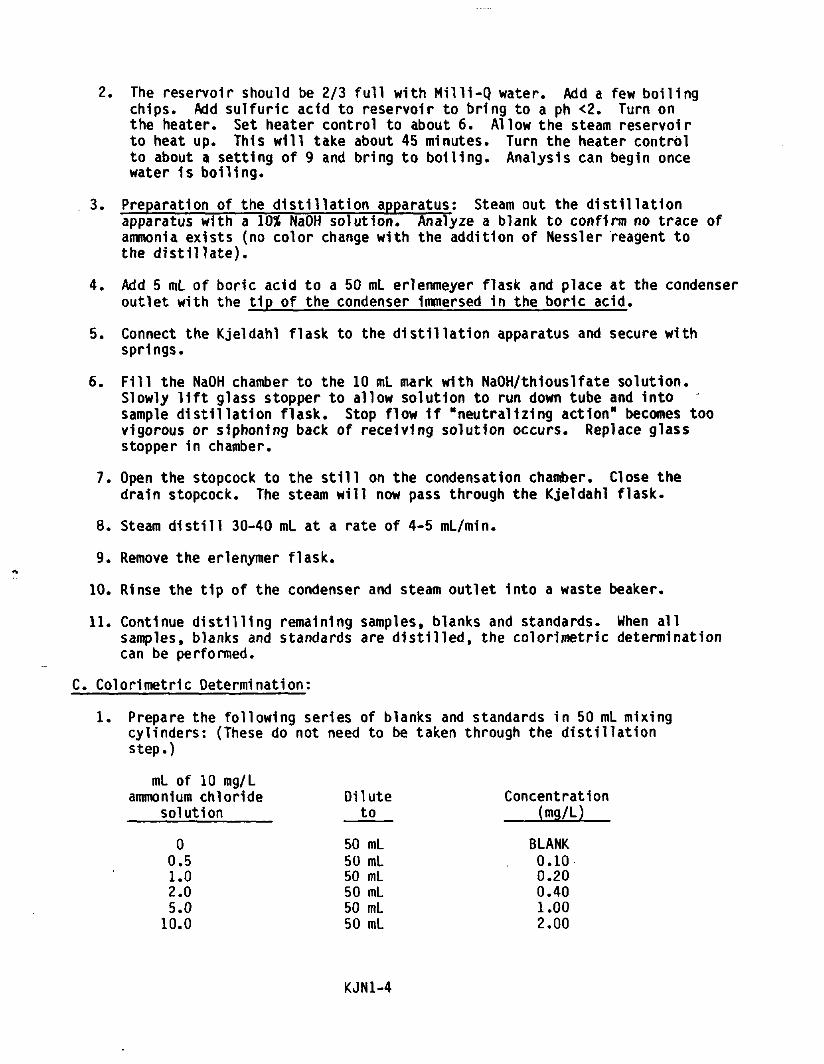
2. The reservoir should be 2/3 full with Milli-Q water. Add a few boilingchips. Add sulfuric acid to reservoir to bring to a ph <2. Turn onthe heater. Set heater control to about 6. Allow the steam reservoirto heat up. This will take about 45 minutes. Turn the heater controlto about a setting of 9 and bring to boiling. Analysis can begin oncewater is boiling.
3. Preparation of the distillation apparatus; Steam out the distillationapparatus with a 10% NaOH solution. Analyze a blank to confirm no trace ofammonia exists (no color change with the addition of Messier reagent tothe distillate).
4. Add 5 ml of boric add to a 50 ml erlenmeyer flask and place at the condenseroutlet with the tip of the condenser Immersed in the boric acid.
5. Connect the Kjeldahl flask to the distillation apparatus and secure withsprings.
6. Fill the NaOH chamber to the 10 ml mark with NaOH/thiouslfate solution.Slowly lift glass stopper to allow solution to run down tube and intosample distillation flask. Stop flow 1f "neutralizing action" becomes toovigorous or siphoning back of receiving solution occurs. Replace glassstopper 1n chamber.
7. Open the stopcock to the still on the condensation chamber. Close thedrain stopcock. The steam will now pass through the Kjeldahl flask.
8. Steam d1still 30-40 ml at a rate of 4-5 mL/min.
9. Remove the erlenymer flask.
10. Rinse the tip of the condenser and steam outlet Into a waste beaker.
11. Continue distilling remaining samples, blanks and standards. When allsamples, blanks and standards are distilled, the colorlmetrlc determinationcan be performed.
C. Colorlmetric Determination:
1. Prepare the following series of blanks and standards in 50 ml mixingcylinders: (These do not need to be taken through the distillationstep.)
ml of 10 mg/Lammonium chloride Dilute Concentration
solution____ to (mg/L)
0 50 mL BLANK0.5 50 mL . 0.10-1.0 50 mL 0.202.0 50 mL 0.405.0 50 mL 1.00
10.0 50 mL 2.00
KJN1-4

2. Add 2.0 ml of Messier reagent to the blank and standars. Stopper andmix by Inverting several times.
3. After 20 minutes, read the absorbances on the spectrophotometer set at425 nm using the slpper cell. Zero the spectrophotometer to theundistilled reagent blank.
4. Transfer distilled samples to 50 ml volumetric flasks and dilute to 50 mlwith M1111-Q water. Mix.
5. Determine the ammonia 1n the distillate colorimetrically as follows:
• To 25 ml of distillate or an allguot diluted to 25 ml In a mixingcyllner.
• Add 1 ml of Nessler reagent. Stopper and mix by Inverting severaltimes.
• After 20 minutes, read the absorbance as described in step 3.
Calculations:
1. Follow the calculations as stated 1n the ammonia nitrogen SOP. Makesure to calculate 1n any digestion dilution Into the final result toobtain the TKN value.
Quality Control;
1. Establish a standard curve with the standards listed above plus a blank.Distill the standard curve and blank. Record the absorbance checkstandard (1.00 mg/L) In the absorbance check book. The absorbancesshould remain consistent from run to run. If not, necessarytroubleshooting must be performed before continuing (check wavelength,spectrometer bulb, solutions, ect.).
2. A digested/distilled blank and standard (1.00 mg/L) is to analyzedinitially and at the end of the analytical run. The standard must bewithin acceptable ranges (+ 10% of the true value) or troubleshootingmust be performed.
3. A quality control calibration standard of 1.00 mg/L is to be analyzed,initially, and after every 10 samples. This standard does not need tobe carried through the digestion/distillation procedure. The lastsample analyzed 1n the run is to be the calibration standard. Thesestandards must be within the acceptable ranges (_+ 10% of the true value)or the samples run after the last acceptable standard are to be reanalyzed,
KJN1-5
4. Duplicate and spike a minimum of 1 out of 10 samples. If less than 10samples are analyzed, a duplicate and spike are still required. Duplicatesare to be averaged. Spike recoveries and duplicate results are to bewithin acceptable ranges.
[KAW-4-3] KJN1-6
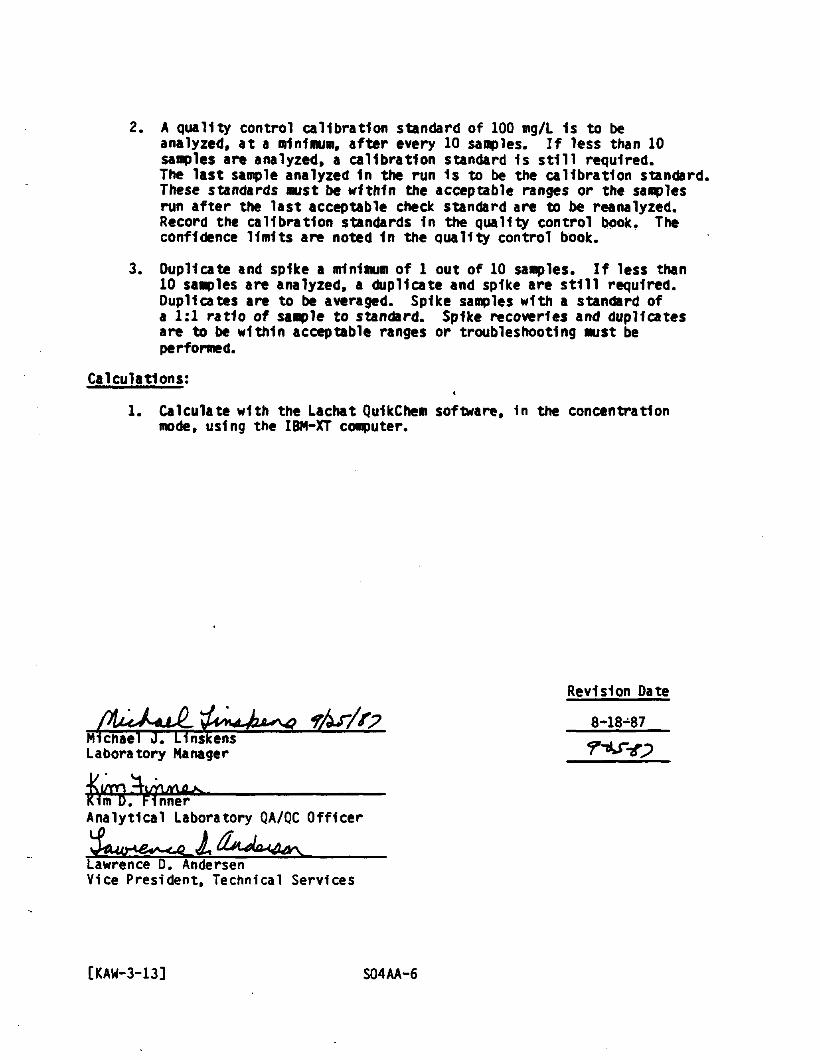
2. A quality control calibration standard of 100 mg/L 1s to beanalyzed, at a minimum, after every 10 samples. If less than 10samples are analyzed, a calibration standard 1s still required.The last sample analyzed In the run 1s to be the calibration standard.These standards must be within the acceptable ranges or the samplesrun after the last acceptable check standard are to be reanalyzed.Record the calibration standards In the quality control book. Theconfidence limits are noted 1n the quality control book.
3. Duplicate and spike a minimum of 1 out of 10 samples. If less than10 samples are analyzed, a duplicate and spike are still required.Duplicates are to be averaged. Spike samples with a standard ofa 1:1 ratio of sample to standard. Spike recoveries and duplicatesare to be within acceptable ranges or troubleshooting must beperformed.
Calculations:
1. Calculate with the Lachat QuikChem software, in the concentrationmode, using the IBM-XT computer.
Revision Date
8-18-87Michael J. LinskensLaboratory Manager
/m "TL/Y1m D. Flnner
Analytical Laboratory QA/QC Officer
Lawrence D. AndersenVice President, Technical Services
[KAW-3-13] S04AA-6

BIOCHEMICAL OXYGEN DEMAND
Scope and Application; This method 1s applicable to surface water,sewage, wastewater and groundwater.
Method; 5-day Incubation 0 20*C
Reference; EPA 1983. Method 405.1.
Standard Methods. 16th edition. Method 507.
Detection Unrft: 1 mg/L
Sample Handling; Refrigerate at 4*C and set up within 48 hours after sampling.
Reagents and Apparatus;
1. 20 L cubltalner filled with M1111-Q water2. Phosphate buffer solution3. Magnesium sulfate solution4. Calcium chloride solution5. Ferric chloride solution6. Sodium hydroxide, IN7. Sulfurlc add, IN8. Volumetric pipettes9. Magnetic stfrrer and stir bars
10. pH meter, calibrated11. BOO Incubator, at 20*C "" **"12. Dissolved oxygen probe and meter. YSI13. 300 nt or 60 mL BOD bottles with stoppers and plastic caps14. M1111-Q water15. Glucose * glutamlc add solution16. Air pump with plastic tubing17. Nitrification Inhibitor
Reagent Preparation; (Prepare fresh every 6 months unless otherwise noted).
1. Phosphate buffer solution; Dissolve 8.5 g potassium dihydrogenphosphate (KHoPO^, 21.75 g dlpotasslum hydrogen phosphate(K2HP04). 33.4 g d1sodium hydrogen phosphate heptahydrate(NagHPO^HpO), and 1.7 g ammonium chloride (NH^l), 1n about500 ml M1111-Q water and dilute to 1 liter in a volumetricflask. The pH of this buffer should be 7.2 without furtheradjustment.
2. Magnesium sulfate solution; Dissolve 22.5 g magnesium sulfate(MgS04'7H20), 1n M1111-Q water and dilute to 1 liter In a volumetricflask.
3. Calcium chloride solution; Dissolve 27.5 g anhydrous calciumchloride. CaCl2» 1n M1111-Q water and dilute to 1 liter 1n avolumetric flask.
BOD1-1

4. Ferric chloride solution; Dissolve 0.25 g ferric chloride,(FeCl3'6H20). In M1111-Q water and dilute to 1 liter 1n a volumetricflask
5. Sodium hydroxide (IN); Dissolve 40.0 g of sodium hydroxide(NaOH) in M1111-Q water, and dilute to 1 liter.
6. Sulfurlc add (IN); Add 28 mL of cone. H2S04 to about 500 mL ofM1111-Q water and dilute to 1 liter.
7. Glucose - glutamlc add solution; Dry glucose and glutamlc addat 103"C for 1 hour. Add 150 mg glucose and 150 mg glutamlc addto M1111-Q water and dilute to 1000 mL In a volumetric flask.Place a stir bar 1n flask and mix until dissolved. Prepare fresheach use!
A 21 solution (6 mL glucose glutamlc add solution/300 mL dilutionwater) has a concentration of 200 ± 37 mg/L BOD.
8. Nitrification Inhibitor; Available from Hach Chemicals, 12533.
Notes;
1. This test will not work with samples containing toxic substances,such as heavy metals.
2. Samples and BOD bottles with sample 1n them should be kept out oflight to prevent formation of dissolved oxygen by algae.
3. Discard any reagent 1f there 1s any sign of biological growth1n the stock bottle.
4. Add 0.0033 g of nitrification Inhibitor to each sample 1f anitrification Inhibited BOD 1s requested.
5. Avoid samples that contain residual chlorine by sampling aheadof the chlorlnatlon process. If chlorinated samples must beanalyzed, consult Standard Methods for the pretreatment procedure.
6. 300 mL BOD bottles are the preferred bottle size.
7. A general rule of thumb to keep 1n mind - If COD's or TOC's are alsorequired, the ratio of the 3 for the most part are as follows;BOD * TOC x 2; BOD « COD/2. Keep 1n mind that these may not alwaysbe true, but 1t can be helpful 1n determining dilutions need forBOD analyses.
BOD1-2

Procedure:
1. Rinse bottles with tap water and deIonized water. Wash with hotsoapy water and scrub Inside of bottles thoroughly. If bottlesare visibly dirty, bottles are to be soaked In dlchromate solution.Then follow above procedure.
2. To determine dissolved oxygen (D.O.) as required In this method,refer to the YSI Dissolved Oxygen Meter IOP and the DissolvedOxygen SOP.
3. Clean 20 L cubltalner and tubing with 10* HC1. Rinse 3X withM1111-Q water, and then fill cubltalner with M1111-Q water.
4. Aerate M1111-Q water for 1 hour. The dilution water should be atroom temperature before making dilutions of samples. If 1t 1scooler than room temperature, air bubbles will form during Incubationbiasing the results.
5. While aerating, use a graduated cylinder and add 20 ml of each ofthe following to the M1111-Q water 1n this order:
a. Phosphate buffer solutionb. Magnesium sulfate solutionc. Calcium chloride solutiond. Ferric chloride solution
6. Each day BOD's are analyzed, a glucose/glutamlc add standard 1sto be analyzed. P1pet 6 ml of this solution Into two 300 mL BODbottles, add 1.0 mL of seed, and continue as other BOD bottles.The concentration should be 200 ± 37 mg/L as BOD.
7. After allowing samples to come to room temperature, place onstir plate and stir for several minutes.
8. Adjust to a pH of about 7 with IN H2S04 or IN NaOH. If pH hasto be adjusted, the sample must be seeded. Samples high Inchlorine, or chlorinated substances must also be seeded.
9. Samples should be seeded with primary treated sewage when It isbelieved there are few microorganisms present. Seed with 1 mLof seed per 300 mL BOD bottle and 0.2 mL of seed per 60 mL bottle(make a 10/100 mL dilution with dilution water and plpet 2 mLInto bottles). A series of seed dilutions, with 5, 10 and 15 mLof seed must be set up so the oxygen depletion of the seed can bedetermined.
BOD1-3
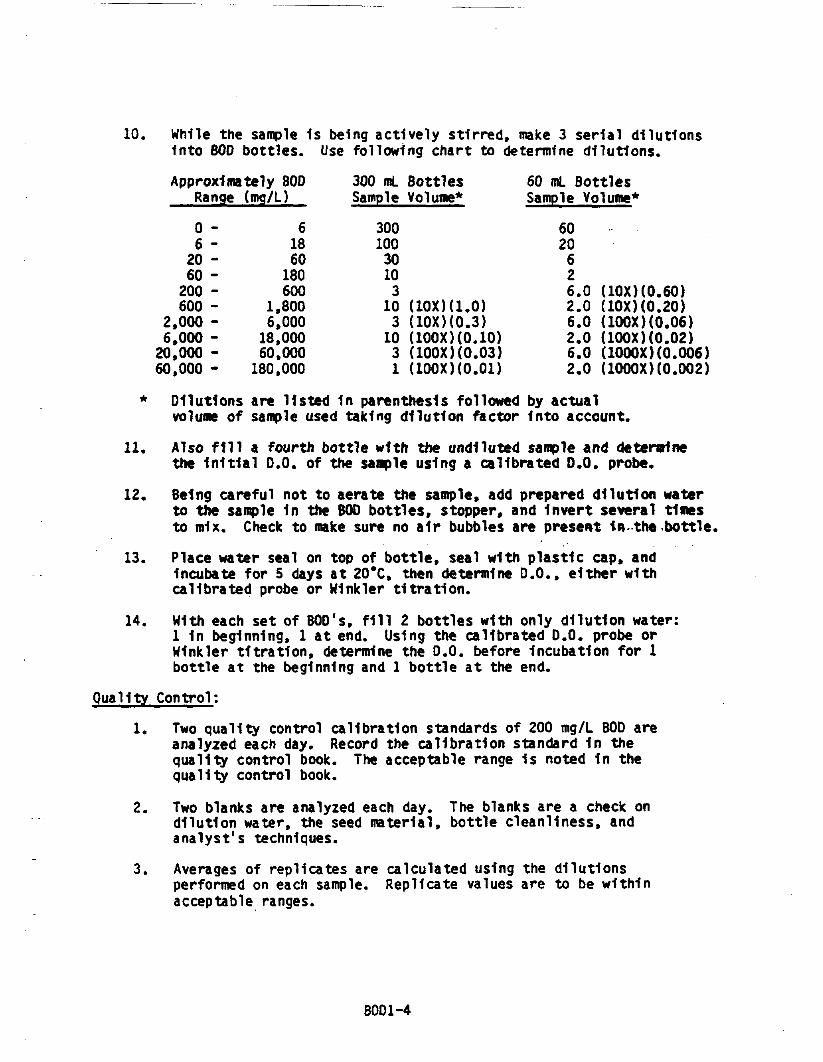
10. While the sample 1s being actively stirred, make 3 serial dilutionsInto BOD bottles. Use following chart to determine dilutions.
Approximately BOORange (mg/L)
0 -6 -
20 -60 -
200 -600 -
2,000 -6,000 -
20,000 -60,000 -
61860
180600
1,8006,000
18,00060,000
180,000
300 ml BottlesSample Volume*
30010030103
103
1031
UOXHl.O)(10XH0.3)(100XH0.10)UOOXH0.03)(100X1(0.01)
60 ml BottlesSample Volume*
6020
626.02.06.02.06.0
(10XH0.60)(10X)(0.20)UOOXH0.06)(100XH0.02)(1000X)(0.006)
2.0 (1000X)(0.002)
* Dilutions are listed 1n parenthesis followed by actualvolume of sample used taking dilution factor Into account.
11. Also fill a fourth bottle with the undiluted sample and determinethe Initial D.O. of the sample using a calibrated D.O. probe,
12. Being careful not to aerate the sample, add prepared dilution waterto the sample 1n the BOO bottles, stopper, and Invert several timesto mix. Check to make sure no air bubbles are present in the bottle,
13. Place water seal on top of bottle, seal with plastic cap, andIncubate for 5 days at 20*C, then determine D.O., either withcalibrated probe or Kinkier tltratlon.
14. With each set of BOD's, fill 2 bottles with only dilution water:1 1n beginning, 1 at end. Using the calibrated D.O. probe orWlnkler tltratlon, determine the D.O. before Incubation for 1bottle at the beginning and 1 bottle at the end.
Quality Control:
2.
3.
Two blanks are analyzed each day. The blanks are a check ondilution water, the seed material, bottle cleanliness, andanalyst's techniques.
Averages of replicates are calculated using the dilutionsperformed on each sample. Replicate values are to be withinacceptable ranges.
BOD1-4

Calculation:
A, When no seed 1s used:
mg/L BOD - Dj-Dfs -
where DJ « (Initial D.Q. sample) ml sample + (Initial D.O. dll. water) ml d1l. water300 or 60* 300 or 60*
Df • D.O. of entire sample after Incubation
S « ml sample300 or 60*
* 300 for 300 ml bottles and 60 for 60 ml bottles iB. When seed 1s used:
mg/L BOD - (D«-Df )-(B«-B*)rH>
B1 - (Initial D.O. seed) wL seed * (Initial D.O. dll. water) ml dll, watercontrol 300 or 60* 300 or 60*
Bf « D.O. of entire seeded sample after Incubation
"*• of !??d 1n Samples (D1)300 or 60* " . ml of seed In samples
of seed 1n seed control (Bll ml of seed In control
300 or 60*ml sample
300 or 60*
Example:
1. Calculate (B1-Bf)r. This equation calculates the loss of D.O. byeach dilution of the seed control and relates it to the D.O* lostby the addition of 1 mL of seed to the samples.
(BI-Bf)r » (8.8-7.6) 1 mL - 0.245 ml
(8.8-6.2) ImL =* 0.26"HTmL
(8.8-4.8) 1 ml - 0.27TTniL ———
Average D.O. lost per 1 ml ofseed added to samples = 0.27
BOD1-5

2. The mg/L of BOD is calculated by the following formula;
mg/L BOD , (01-Df) - (Bi-Bf)rS
» C(D1-Df) - 0.27)] x 300 or 60*nt of sample
Revision Date
7-24-86Michael J. LlnsfcensLaboratory Director
V'TN.. UYV\Kirn D. FlnnerAnalytical Laboratory QA/QC Officer
[ALM-1-20] BOD1-6

CHEMICAL OXYGEN DEMAND
Scope and Application: This method 1s applicable to surfacewater, sewages,wastewater, and groundwater.
Method: D1chr ornate reflux, Color1roetr1c
Reference: ERA 1983. Method 410.4.
Detection Limit: 20 mg/L
Optimum Range: 20-700 mg/L
Sample Handling: Preserve with sulfuric add to a pH <2 and refrigerate at4*C. Analyze within 28 days.
Reagents and Apparatus;
1. D1 chroma te - mercuric sulfate-sulfurfc add digestion solution2. Silver sulfate - sulfuric add catalyst solution3. COD standard solutions4. Block digester, set at 150*C5. 16 x 100 mm culture tubes with teflon lined screw caps6. Eppendorf ma cropl peter, 0-5 oL7. Spectrophotometer, set at 600 not wavelength with slpper cell8. Eppendorf pfcroHter plpeter, 10-100 ul9. 2 Replpette Dispensers, 1000 mL
10. M1111-Q water
Reagent Preparation; (Prepare fresh every 6 months, unless otherwise noted.)
1. Digestion Solution; Add 10.2 g of dried potassium dlchromate(KJtCr^y), 33.3 g of mercuric sulfate (HgSO^ and 167 mL ofconcentrated H2S04 to about 500 mL of M1111-Q water; dilute to1000 mL In a volumetric flask and stir until dissolved. Store1n a dark place.
2. Silver Sulfate-Sulfurlc Acid Catalyst Solution: Add 22.0 g of silversulfate <Ag2S04) to a 2.5L bottle of cone. ^504. Stir to dissolve.
3. COD Stock Standard. 1000 mq/L: Carefully weigh O.SSOOg of driedpotassium acid phtfialate (KHP), dissolve 1n M111-Q water and diluteto 1 liter 1n a volumetric flask. Refrigerate.
4. Working COD Standards; (Prepare fresh monthly and refrigerate.)
A. 700 mq/L COD Standard: To a 100 mL volumetric flask, add 70 mLof 1000 mg/L COD Stock Standard and dilute to the mark with M1111-Qwater.
COD1-1

B. 300 mq/L COD Standard: To a 100 mL volumetric flask, add30 ml of 1000 rog/L stock standard and dilute to the markwith MW1-Q water.
C. 100 mq/L COD Standard; To a 100 mL volumetric flask, add10 mL of 1000 mg/L COD Stock Standard and dilute to the mark withMW1-Q water.D* .--9 mgft- COP Standard: To a 100 ml volumetric flask, add 5 raLof 1000 mg/L COO Stock Standard and dilute to the mark withM1111-Q water.E* ._?? "^ _9P Standard: To a 100 ml volumetric flask, add 2 mlof 1000 mg/L COD Intermediate Standard and dilute to the mark withM1111-Q water.
If a dark green or turquoise color occurs when sample 1s added orwhen the tube Is being heated; 1t 1s over the upper limit of thecurve and must be diluted.
2. Interference; Chlorides represent a positive Interference.Mercuric suifate Is added to the digestion tubes to complex thechloride. Mercuric suifate can complex up to 2,000 mg/L chloridebefore reacting with dlchromate In the sample. If chloride exceeds2,000 mg/L, dilute the sample.
3. Reagents are corrosive and toxic. Avoid skin contact.
4. Store standards In the refrigerator.
5. Store the dlchromate solution and prepared tubes 1n the dark.
6. To clean the tubes, rinse several times 1n M1111-Q water.
Procedure:
1. All glassware 1s to be soap and water washed, tap rinsed andM1111-Q water rinsed prior to analysis. Rinse digestion tubes andcaps with M1111-Q water prior to use. Caps deteriorate overtime. Discard caps after 3 uses.
2. Into each tube, plpet exactly 1.5 mL of COD digestion solution,using repipetter dispenser.
3. Into each tube, plpet exactly 3.5 mL of the silver sulfate-sulfuricacid solution, using the repipetter dispenser, down the side of thetube. These tubes may be stored, with caps having teflon liners.indefinitely. Store in the darki
COD1-2

4. The standard curve consists of the following standards:
3 M1111-Q water blanks2-20 mg/L2-50 mg/L1-100 mg/L1-300 mg/L1-700 mg/L
The standards are carried through the digestion step.5* To Spike: In a disposable cup. place 2.5 raL sample, add 2.5 mL
of the 300 mg/L standard. Mix well. Take 2.5 mL of this mixture,proceed as follows.
Using the Oxford 0-5 oL plpet, add 2.5 mL of sample, standard,blank or spike to the tube. Be careful to avoid air bubbles 1nthe plpet tip and to eject all of the sample. Cap tubes tightlyand mix by Inverting 10-12 times.
6. Place tubes in a block heater at 150*C for 2 hours. Block heatershould be preheated at least 1 hour prior to use.
7. Remove tubes from block heater. Cool to room temperature. Read theabsorbance on spectrophotometer, set at 600 nm, using the slppercell. Samples can be stored 1n refrigerator overnight and readthe next day. Do not shake tubes. Be very careful not-to aspirateany of the precipitate In the bottom of the tube. Initially zerowith the blank standard, and after 20 samples rezero.
Quality Control;
1. Establish a standard curve with the standards listed above plusa blank. Record the absorbance check standard 1n the absorbancecheck book. The absorbances should remain consistent from runto run. If not, necessary troubleshooting must be performedbefore continuing (check wavelength, spectrophotometer bulb,solution, etc.)
2. A quality control calibration standard of 100 mg/L COO 1s to beanalyzed. Initially and after every 10 samples. If less than 10samples are analyzed, a calibration standard Is still required.The last sample analyzed In the run 1s to be the calibrationstandard. These standards must be within the acceptable ranges orthe samples run after the last acceptable check standard are to bereanalyzed. Record the calibration standards 1n the quality controlbook. The confidence limits are noted 1n the quality control book.
COD1-3

3. Duplicate and spike a mlnlumum of 1 out of 10 samples. If less than10 samples are analyzed, a duplicate and spike are still required.Duplicates are to be averaged. Spike recoveries and duplicateresults are to be within acceptable ranges.
Calculation;
1. Calculate using linear regression.
To Calculate Spike:
(spike value) - (0.5)(sample value) x 100% Recovery » ISO
Revision Date
7-23-86Michael J. LlnskensLaboratory Manager
•KimKirn D. FlnnerAnalyt>cjJ Laboratory QA/QC Officer
in^ j ^^^^^^^^ r
Thomas JQA Officer
[AL-1-13]
COD1-4

TOTAL DISSOLVED SOLIDS
Scope and Application: This method Is applicable to drinking water, surfacewater, groundwater, and domestic and Industrialwastewaters.
Method: Gravimetric, dried at 180*C
Reference; EPA 1983V Method 160.1
Detection Limit; 10 mg/L (using a 100 mL sample volume)
Sample Handling; Refrigerate at 4*C and analyze sample within 7 days of sampling.
Reagents and Apparatus:
1. Glass fiber filters, Whatman GF/C2. Gelman filtration funnel and support3. Suction flask, 1000 nt4. Porcelain evaporating dishes5. Graduated cylinder, 100 mL6. Drying oven at 180*C + 2*C7. Desslcator8. Analytical balance9. Delonized water
Notes:. .!. . . . , , - . , , .„.,.«$,-. r*ge-.-...,..*K;--s< f
. fl ,. Interferences! Samples with high Concentrations of bicarbonate,Ca, Mg, Cl, and $04 will require prolonged drying, desslcatlon,and rapid weighing.
2. Total residue should be < 200 mg. Excessive residue (>200 mg)Is difficult to dry thoroughly. Use a smaller volume 1f TDS Issuspected to be high; likewise use a larger volume if TDS 1ssuspected to low.
3. Groundwater samples which have already been filtered through a0.45 micron membrane filter do not need to be carried throughthe filtration step of the procedure.
Procedure;
1. All glassware 1s to be soap and water washed, tap rinsed anddeIonized rinsed prior to analysis.
2. Evaporating D1sh Preparation; If volatile dissolved solids 1salso to be analyzed, prepare the evaporating dishes by ashing at550 ^50*C for one hour 1n a muffle furnace.
Otherwise, heat the dishes at 180 + 2'C for one hour. Cool 1ndesslcator. Weigh. Record the weight. The dishes must be coolbefore being weighed (about one hour). Repeat this cycle untila constant weight 1s obtained (£ 0.5 mg). Weigh just before use.
TDS1-1

3. Filter Preparation: Place the glass fiber filter on the filtrationsupport, place the funnel on top, and wash the filter with three-20mL portions of deIonized water while vacuum 1s applied. Discardthe washings. The filters may be prepared ahead of time. Ifthis 1s the case, dry them for 1 hour at 103 - 105*C and store1n the desslcator until needed.
4. Assemble the filtering apparatus, place a prepared filter onthe support and begin suction. Shake the sample and measure out100 ml 1n graduated cylinder.
5. Filter the sample, then rinse the cylinder and funnel with a smallamount of delonlzed water. Apply vacuum until all the samplehas been filtered. Rinse with 3 - 10 ml portions of D.I. waterand continue the vacuum until filtration Is complete.
6. Pipet 50 ml of the filtrate (less, 1f the sample 1s expected tohave a high dissolved solids content) Into a prepared evaporatingdish.
7. Evaporate the sample to dryness 1n the oven at 180 *2*C. Cool1n a desslcator for at least one hour and weigh. Repeat thedrying cycle until the weight loss Is <0.5 mg.
Quality Control:
1. Duplicate 1 out of 10 samples. If less than 10 samples are analyzed,a duplicate 1s still required. Duplicates should be within acceptable
*-*-••'.: - ranges. Duplicate results are to be averaged.'* ' ' """ ' • • - - " . . . . . . . . . ;.**«.- _l$. .-.,. .. -
- - - ' • - " - . . ,I=J
2. A blank must be analyzed with each run. (This is a check oncontamination, cleanliness of dishes, oven, pipettes, etc.).
Calculation:
TDS, mg/L - (A-B) x 1000000
Where A * weight of dish plus residue (g)B - weight of dish (g)C * volume of filtered sample used (ml)
Revision Date
^ _ _ _ _ _ _ 7-23-86Michael J. LfnskensLaboratory Manager «5-.j/-g>
. FlnnerAnalytical Laboaratory QA/QC OfficerV L - f j7 f'^^^^dy^cA^_______^Thomas J, Lirnch'QA Officer
[ALM-5-16] TDS1-2
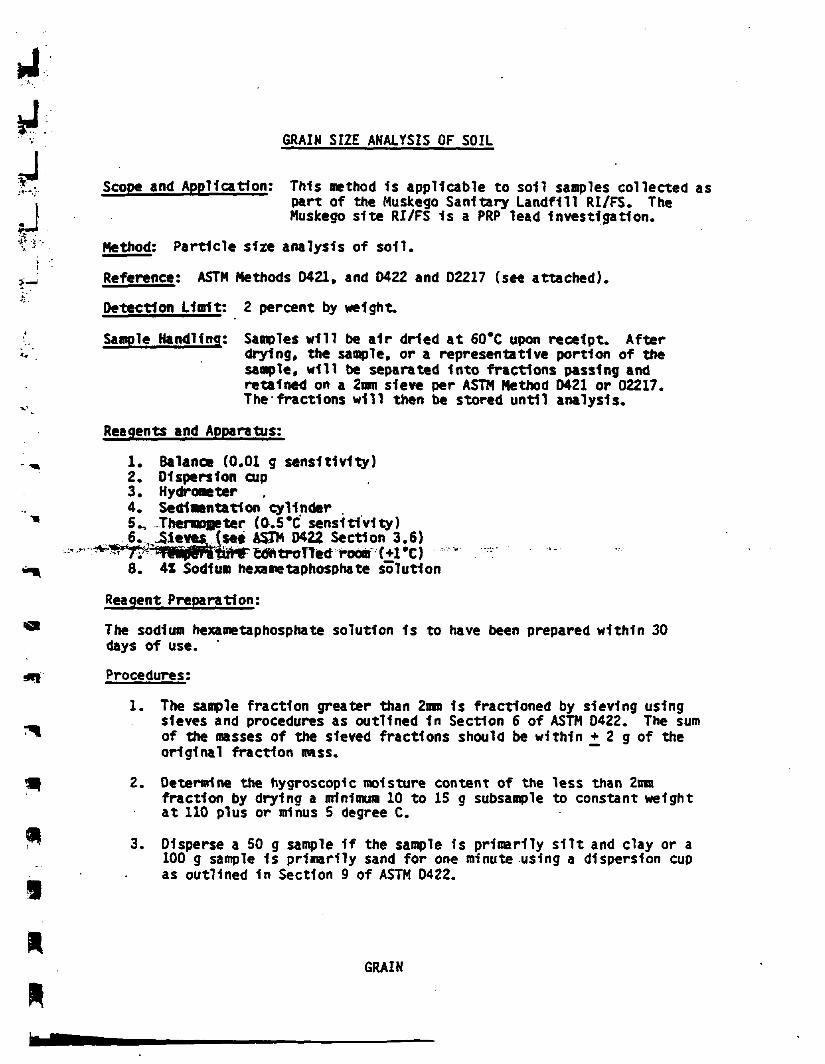
J
jGRAIN SIZE ANALYSIS OF SOIL
Scope and Application; This method 1s applicable to soil samples collected aspart of the Muskego Sanitary Landfill RI/FS. TheMuskego site RI/FS 1s a PRP lead Investigation.
V*v. Method; Particle size analysis of soil.i ••
>J Reference; ASTM Methods D421t and 0422 and 02217 (see attached).
Detection Limit: 2 percent by weight.
'. Sample Handling; Samples will be air dried at 60*C upon receipt. Afterdrying, the sample, or a representative portion of thesample, will be separated Into fractions passing andretained on a 2ran sieve per ASTM Method 0421 or 02217.The fractions will then be stored until analysis.
Reagents and Apparatus;
*^ 1. Balance (0*01 g sensitivity)2. Dispersion cup3. Hydrometer4. Sedimentation cylinder .
*" 5^ Therwofflcter (0.5'C sensitivity)6.v, JSIevM (sett ASTM D422 Section 3.6)
^ s*?! ^ - •-:**t 8. 41 Sodium hexametaphosphate solution
Reagent Preparation;101 The sodium hexametaphosphate solution Is to have been prepared within 30
days of use.
*T Procedures;
1. The sample fraction greater than 2mm 1s fracrfoned by sieving usingsieves and procedures as outlined 1n Section 6 of ASTM 0422. The sum
^ of the masses of the sieved fractions should be within i 2 g of theoriginal fraction trass. ""
9t 2. Determine the hygroscopic moisture content of the less than 2mnfraction by drying a minimum 10 to 15 g subsample to constant weightat 110 plus or minus 5 degree C.
mr* 3. Disperse a 50 g sample 1f the sample Is primarily silt and clay or a
100 g sample 1s primarily sand for one minute using a dispersion cupas outlined 1n Section 9 of ASTM 0422.
9
GRAIN
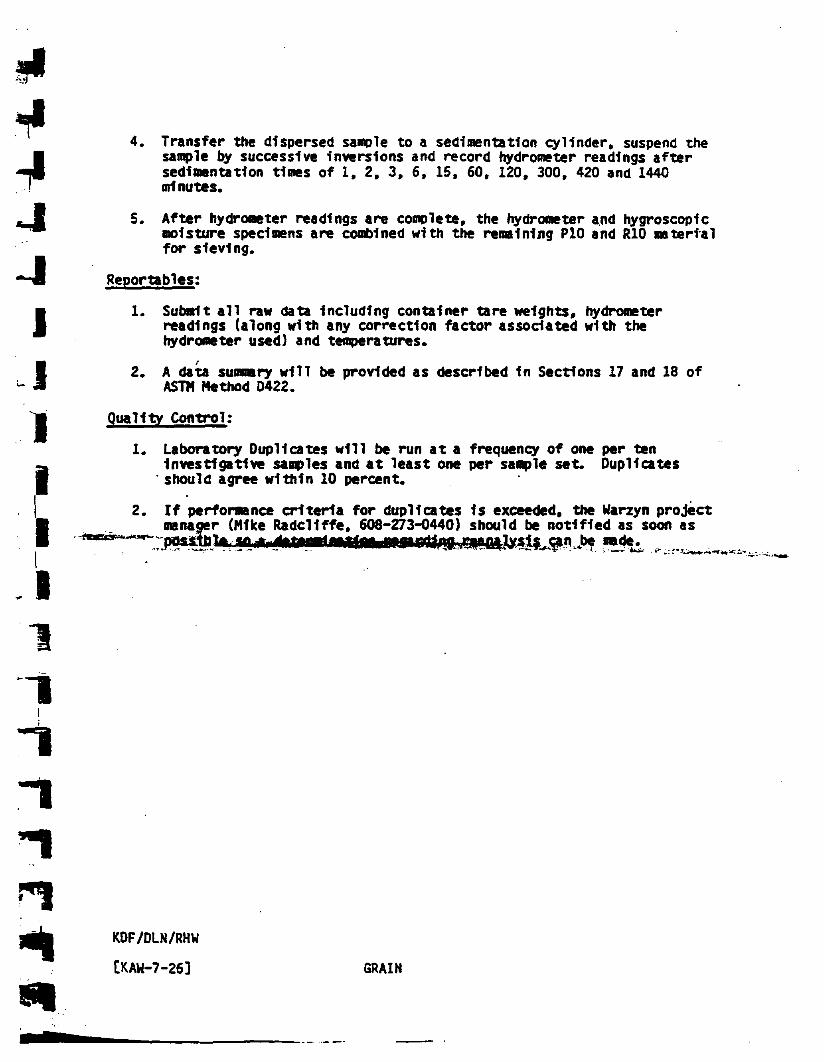
i
4. Transfer the dispersed sample to a sedimentation cylinder, suspend thesample by successive Inversions and record hydrometer readings aftersedimentation times of 1, 2, 3, 6, 15, 60, 120, 300, 420 and 1440minutes.
5. After hydrometer readings are complete, the hydrometer and hygroscopicmoisture specimens are combined with the remaining P10 and RIO materialfor sieving.
Reportables:
1. Submit all raw data Including container tare weights* hydrometerreadings (along with any correction factor associated with thehydrometer used) and temperatures.
J 2. A data summary will be provided as described 1n Sections 17 and 18 ofASTN Method 0422.
*•' Quality Control;
1. Laboratory Duplicates will be run at a frequency of one per tenInvestigative samples and at least one per sample set. Duplicates
* should agree within 10 percent.
2. If performance criteria for duplicates 1s exceeded, the Uarzyn projectmanager (Mike Radcllffe, 608-273-0440) should be notified as soon as
iiii
KDF/DLN/RHW
[KAW-7-26] GRAIN

""t
Ntire f—Other i* iHu leu procedure* art beingxcpiftrf by ASTM Comraiiue D-ll.
9.2 The soil and rock investigation should.iiiuisi of the following steps.
9.2.1 A review of all available Information»n the geologic history and formation of rock.M soil, or both, and ground-water conditionsMX'urring at the proposed location and In themmediate vicinity.
92.2 On-site investigation of the surface anduhsurface materials by either wash borings,land- or power-auger borings, lest pits, rotaryir cable-tool (churn) drilling, and geophysicalnet hods.
9.2.2.1 A determination of the depths 10 wa*;r lable and firm foundation material, eithercdrock or satisfactory load-bearing soils.9.2.2.2 Field identification of soil and rock
/pcs with depth records of their occurrence,nd location of their structural discontinuities.9.2.2.3 The recovery of representative dU-
irbed samples for laboratory classificationrsts of soil, rock, and local construction mate*al. These should be supplemented by undls*irbcd specimens suitable for the determinationf those engineering properties pertinent to theivcstigation.9.2.3 An evaluation of performance of exisl-g installations in the immediate vicinity ofc proposed site, relative to their foundationalcrial and environment.i. Classification of Material10.1 Treat samples of soils and rock submil-
it to the laboratory for identification and1 unification tests in accordance with one ofe following:10.1.1 Test Method D 2417.10.1.2 Practice D 3282.Ml.1.3 Descriptive Nomenclature C 294.
tis is a brief, useful description of the moremm on minerals and rocks as they occur Inlure.. Interpretation of Results11.1 Interpret ihc results of an investigationIt* Mmttemttt l**ci Mfwlrir/K Ttut*f........ _.... —.fmtl* mtmtto*fmi* ,m*m mmmmmtm. VIST
Mr wrA fmttM rif All, m*m Mr rltk tft*fri*gt*uM tfTmtt Xm*J*t4 tt mtkjHf*Mftfittm.tmntt
ionly in terms of actual findings and make ...effort to collect and Include all field and laferalory data from previous Investigations la Msame area, extrapolation of data into loo]areas not surveyed and tested can be doaeea)rwhere geologically uniform subsurface daftsltion of soil and rock arc known lo ed*Engineering properties of the soils and mfcencountered on Important projects ahouU ajbe predicted wholly on field IdemUfcatloaiticlassification but should be checked by M>4ratory and field tests made on samples coHcdslIn accordance with t.l and 9.1. •' $
11.2 The recommendations for rfcstga ak1
rameters can be made only by pfofesskaiengineers or geologists who have spedaUidithe field of soils and foundations or Ugh«aj|engineering, and who are familiar wtth *'problems for which the study Is being sue*Soil mechanics, rock mechanics, and geoaNijphologkal concepts must be combined wM|knowledge of structural or pavemeal taglateijIng in order to make a complete appUcaltoeafthe results of the soil and rock survey. A BMMdetailed study than that envisioned by tjrecommended practice may be necessary befasjdesign recommendations can be made.
12. Report -.-.12.1 A subsurface Investigation repast
should: 412.1.1 Locale the area Investigated U lemi'
pertinent to the project This may lacMfsketch maps or aerial photos on which the Mholes, pits, and sample areas are located, a)well as topographic hems relevant to the aW'mination of the various soil and rock lyw!such as contours, streambeds, pot holes, ciaVetc. Where feasible. Include a geologic ftuaafthe area Investigated In the report ';
12.1.2 Include copies of all borings aaefle*hole logs and of all laboratory lest results.'; j!
12.1.3 Describe and relate the (ladings e*lained under Sections 1,4, 5, and 6, ttsfagaVsubhead titles for the respective sections.
Hfku
Designation: D 421-
A HjjkU, met tmttrtty iMr #M> tlm* *r «** mpwuftj* ue**tt»l ttmmHttt m*4 mtut 94 ttvttwtJ mrjrjtft ftmt
m „ ™.^ .mm,, tmrnffwivwm Wt wmmmtmm*. Jim CMHHMHU mtt 9*9m*4 €mmtt/* f«*IWM fftimtttmtmlmrmtf/tr tmmwtlmm-tJt «W ImfVrnt W fmrnttlttmt^ ASTM Htmmfltmfttft. Y*# ttmtmtmtl Wff ttftttt C«^U tt*tUmirttmHl M m Hlttmm^ if At •mUtt«€mmlc*l€0mmllUt. WmlCm J9* It*/mttt*m. If Jfw*ft»t tkmt ft** €0mtmtmt» kmVt Ml ftfttftmmfttf mtmftMtfUl Jmmlj '**r 9m)~t !M«H w t*< ASTM Cwmmlntt M St-**--*, Hit *«, Jt. fUmtm^kmt, /A IH6I. I -.
Standard Praetloa forDRY PREPARATION OF SOIL SAMPLES FOR PARTICLE-SIZE ANALYSIS AND DETERMINATION OF SOIL
M CONSTANTS1
I to tow* w*r ** au4 O 41 1:
._ .tTWs practice coven the dry preparationmm ttmpfcs as received from the Held for
trtliVjIic analysis and the determination of
i, ti Ta/i jomtardntay inrofye kaxarthtts ma-» eptmlom. and fgttlpinettt. This tiantlard
•W with to use.' ttset this naiidbn/ lo consult and
t epfraprlat r utftiy ontf AraM prorrlm
tfriortouse.
ilAlfNcal DotvaKals
D|JI? Pnetke for Wet Preparation of Soilfor Particfc-Siie Analysis and De-
iaatuMi of Soil Constants1
Specification for Wire-Cloth Sieves forFesliai Purposes1
taaslUseETais practice can be used to prepare sam-
r partlck-siu aad pUstlciiy tests where It10 determine test values on air-dried
or where it is knowa that air dryingI have an effect on test results relative toprepared la accordance with Practice
, sensitive to 0.1 g.Moftar awa* XMofar-Ctfirrnr* /Vi/rV, suita-
tcsihcye»r of
ble for breaking up the aggregations of soil par-tides.
4.3 SiVrM— A series of sieves, of square meshwoven wire cloth, conforming to SpecificationEll. The sieves required are as follows:
No. 4(4.7S-mm)No. 1011.00-mm)
4.4 Sampler— A rifiksampkr or sample split-ter. for quartering the samples.
S. Sampling i5.1 Expose the soil sample as received from
the field lo the air at room temperature untildried thoroughly. Break up the aggregations thor-oughly in the mortar with a rubber-covered pes-tle. Select a representative sample of the amountrequired to perform the desired tests by themethod of quartering or by the use of a sampler.The amounts of material required lo perform theIndividual tests are as follows:
5.1.1 PartkfaSkrAnalwis—FM the particle-size analysis, material passing a No. 10 (2.00*mm) sieve Is required In amounts equal to 1 15 gof sandy soils and 65 ft of either silt or clay soils.
5.1.2 Texts for Sttf Cwtsiaitis— For the testsfor soil constants, material passing the No. 40
1 Tfctt ptMkt to M*T OM JMfedictiM *f ASTM CMH«{IICCO-ll «i SoM Mtf Rocfc Mtf to iM diftct mp«ui>ililiiybfoamilllu Oil A) M T«Mwt. Pbuiciir. *
CwicM cAiM ippioirt Jirfy 14. 19S5.bcr IH1 OHtfAOy uMiitiH M D4ll * J5T. Uri
tm

J J J Jl- ~ -'J(425-fim) sieve is required in total amount of 220(g, allocated as follows:
TcsiLiquid MmkPtoslic KmilCcnirifuftc moisture equivalentVolumciric shrinkaacCheck Icsu
Grams100
IS103065
6. Preparation of Tesl Sample6.1 Select that portion of Ihe air-dried sample
selected for purpose of lens and record the massas the mass of Ihe total lesl sample uncorrectedfor hygroscopic moisture. Separate Ihe lest urn*pk by sieving with a No. 10 (2.00-mm) sieve,Cirind lhal fraction retained on the No. 10 sievein a mortar with a rubber-covered pestle untilIhe aggregations of soil panicles are broken upinio Ihe separate grains. Then separate Iheground soil into two fractions by sieving with aNo. 10 sieve.
6.2 Wash lhal fraction retained after the sec-
0421
ond sieving free of all flne material, dry, aalweigh. Record this mass as the mass of cornmaterial. Sieve the coarse material, after bdajwashed and dried, on Ihe No. 4 (4.73-mm) sk«and record Ihe mass retained on Ihe No. 4 stem
7. Tesl Sample for Particle-Slit Analysis7.1 Thoroughly mix together the fractal
passing Ihe No. 10 (2.00-mm) sieve In both sk»iIng operations, and by Ihe method of quarteriajTor Ihe use of a sampler, select a portion wtighiajlapproxlmalely 113 g for sandy soils and appro*.. |imaiely 63 g for sill and day soil for partlde-eW:|analysis.
I. Tesl Sample for Soil Constants .,I.I Separate the remaining portion of the sti!l
- «J (Reapproved 1I72)-1
t *
lerial passing Ihe No, 10 (2.00-mm) sieve latojtwo parts by means of a No. 40 (423-um)sla&lJDiscard Ihe fraction retained on the No. 40 sleitilUse the fraction passing the No. 40 sieve for fc'ldetermination of Ihe soil constants. . s£l
SI.„„„——..« l«i«^M|lW»n«*)r«r«/ r<^Uun*ito****4*ttxrratlr**toHk#*t#»l**b* 4fitoMMhr4WM f
" " * " «MI tttjotuMBiv.
Standard Method forPARTICLE-SIZE ANALYSIS OF SOILS1
iKt ytlf of
IM4.
SeepsI.I This method covers Ibe quantitative de-
lta of the distribution of particle sizesThe distribution of particle sizes larger
73 urn (retained on the No. 200 sieve) IsIncd by sieving, while the distribution ofsizes smaller than 73 urn Is determined
[a sedimentation process, using a hydrometer[secure the necessary data (Notes I and 2).
pNors I—Separation may be made on the No. 4tMHMsiX No. 40 (423*»). or No. 200 (73^m) sieve
I of the No. 10. For whale vtr sieve used, the sizeI be Indicated In ike report
[Van 2—Two types of dttpenfcMi devices art pro*(I) a high-speed mechanical stlrrcr, aad (2) air
Extensive invesltaukws Indicate lhal air*device* prodwce a more positive dispersion
" i below the 20 im slia aad appreciably
Ivasnagtsiha, hi me b recoHi mended. The rcsvks from the twotod of devkes dMer In magiiilodr, dtpindiog uponai type, leediog to saarked diflerenoM fa* pan
diMan, taji<cMI> tot abas faer than ID pi
j^
'pa*.
AafUcatie DocuiMnls
l*D42( Practice for Dry Preparation of SoilSafppka for Particle-Size Analysis and De-
E It Specification for Wire-Cloth Sieves forTesting Purposes1
E 100 Spcdflcatkm for ASTM Hydrometers4
Ihe material retained on a No. 10 sieve.J.2 Stirring Apparatus—Either apparatus A
or B may be used.3.2.1 Apparatus A shall consist of a mechan-
ically operated stirring device In which a suitablymounted electric motor turns a vertical shaft aia speed of not less than 10 000 rpm without load.The shaA shall be equipped with a replaceablestirring paddle made of metal, plasiic, or hard,rubber, as shown In Fig. I. The shift shall be ofsuch length lhal Ihe stirring paddle will operatenot less than ft In. (19.0 mm) nor more than IViin. (31.1 mm) above the bottom of the dispersioncup. A special dispersion cup conforming toeither of Ihe designs shown In Fig. 2 shall beprovided to hold the sample while it U beingdispersed.
3.2.2 Apparatus B shall consist of an atr-jeidispersion cup1 (Note 3) conforming lo Ihe gen-eral details shown In Fig. 3 (Notes 4 and 5).
Nora 3—The amount of air required by an air-jetdispersion cup b of the order of 1 n'/mln; some snuNair compressor! an SUM capable of svpoljri*| sufficientair lo operate a cvp.
Nora 4—Another air-type dispersion device,known as a dispersion lube, developed by Ctu andDtvidton at Iowa Stale CoMt|c. has bee* shown 10 give
AaparalM. XI Aifcurej—A balance sensitive to 0.01 ghr weighing the material passing a No. 10 (2.00-M) sieve, and a balance sensitive lo 0.1 % ofAc saass of the sampk to be weighed for weighing
1 Tnh nwu«d Is «nda Ift* jwfaActiM of ASTM ComD-ll on Soil MM! Rock Md k Utf «raci lapMiMlity otJMbcnm mfcut PI Ml on Tmme. ftottdiy. tn< DcM«tr Ow-tcsiffstksofgank .
Cwnnl «*UM torn** Nev. 11. INI OrigtMBr P*.UifccJ I*)J, RcptMes 0 421 - 41.
few *M a* MI iwUW* Mmminil COM Srnm HH AnmiCM Sackiv to Taifni ••« M»-KfUH. If 14 Rjce St. nubdctpnte. f A It 10).No. 12-4042104)0.

Tin** equivalent 10 mote secured by the alrjet dupcr-linn cups. When ta b used, soaking of Ihe simple canie done in |hc sedimentation cytiadcr. thus eHminaifoahe need tot transferring ibc sluny. V/bea Iht air-lispcnion lube b Mod. li shall be so indicated la Ihe
II M mvfl i«anv
Nf vrt 5—Water may condense In air lines when notUK. This water must be removed, diner by using a
vaier trap on the air line, or by blowing iht water out* ihc Kne before wing any of Ihe air Ax dtspcnionirptttCS.
3.3 llydromtttr—An ASTM hydrometer,.raduated to read In either specific gravity of theispension or grams per litre of suspension, andinforming to the requirements for hydrometersIH or I52H In Specifications E 100. Dimeo-
ions of both hydrometers are the same, the scale:mg (he only item of difference.3.4 Sedimentation Cylinder—A glass cylinder
ssentially 18 In. (457 mm) In height and Vft In.J.5 mm) in diameter, and marked for a volume
1000 mL. The Inside diameter shall be suchiat the 1000-mL mark is 36 ± 2 cm from thextom on Ihe inside.3.5 Thermometer—A thermometer accurateIT (0.3*0.3.6 Sieves—\ series of sieves, of square-mesh
'Oven-wire cloth, conforming lo the requlre-icnts of Specification E 11. A full set of sieveseludes the following (Note 6);
3-ia. (7Vmm) No. 10 (2.00-mm)2-in. (SO-mm) No. 20 (IMHira)Ift in (37.3-mm) No. 40 (425-fim)I-in. (25.0-mm) No. 60(250>m)Vfin.(19.0-mm) No. I40(l0e^im)Vin (9.5-mm) No. 200 (75-jim)No. 4 (4.75-mm)
NOTS 6—A KI of sieves giving uniform spacing ofinis for ihc graph. *s required in Section 17. may be
<-d if iksircd. This sel consists of Ihe following sieves:J-in. (75-mni) No. I6(l.ll-mm)IW»ft ()7,J mm) No. 30 (600-fimt*-in. (19.0-mm) No. SO OOO-pm)Mn. (9.5-mm) No. lOO(IMHim)No. 4 (4.7J-mm) No. 200 (73-um)No.g(2.36-mm)
3.7 Water Bath or Consiant-Temptraturti—A water bath or constant-temperature
om for maintaining the soil suspension al a>nsiant temperature during the hydrometerulysis. A satisfactory water tank is an Insulatednk lhai maintains Ihe lemperalure of Ihc Su>nsion at a convenient constant temperature alnear 68'F (20'C). Such a device is illustratedFig. 4. In cases where the work is performeda room at an automatically com rolled constant
0422
lemperalure, Ihe water bath U not ___/Mf,3.1 *«*w—Abeakerof250-mLcapacS!j. 13.9 Timing Deyfcr—A watch or dock wi*i|
secondhand.
4. Dispersing Agent4.1 A solution of sodium hexameuphospask
(sometimes called sodium metaphosphale) sMbe used In distilled or demlneralited water, M Atrate of 40 g of sodium hexametaphospbaleynlitof solution (Note 7). '"'
Nott 7-5oniiioo* of this salt. If addle, start/!vert or bydrolyu back to the orthophotphalt fa rcauhant decrease la dispersive action. , .»|should be prepared frequently (al least one* a saean]|or adjusted lo pH of I or 9 by Means of soiaajcaibonala. Bottles oonUlntiig somUoas should ha* ft]date of preparation narked on then. if
4.2 All waler.used shad be cither diniflo)?ftmiiicraJiicd water. ~ * - - - - - -'
•fUrattf PMtldn.
m 0g.ii(HJ|
Ma»af*»nloo,g2000MOO4000MOO
ill J The site of the portion passing Ihe No.Ill sieve shall be approximately 115 g for sandy•*% and approximately 45 g for sttt and day
jf/12 Provision fg made In Section 5 of PracticeDill for weighing of the air-dry sod selected for&POM'of tests, Ihe separation of Ihe soil on the
. 10 sieve by dry-sieving and washing, and Ihe•ting of Ihe wished and dried fraction re-
* on the No. 10 sieve. From these twoI the percentages retained and passing Ihe
'10 sieve can be calculaled In accordance. •* •till.
For example, if the sedimentation cylinder, litfbe placed In Ihe water bath, the distilled or 4$jmineralized waier to be used shall be brougbVi)the temperature of Ihe controlled water hath; idif the sedimentation cylinder b used In a mnwith controlled lemperalure, the water for i\test shall be at the lemperalure of Ihe room. Ikbasic temperature for Ihe hydrometer lest is ttj(20'C). Small variations of lemperalure do piintroduce differences that are of practical sisji|icance and do not prevent ihe use of correcooaiderived as prescribed. '•••*
5. Test Sample5,1 Prepare Ihc test sample for
analysis as outlined in Practice D42I. DwfejIhe preparation procedure the sample Is dlvlInto two portions. One portion contains ipanicles retained on Ihe No. 10 (2.00-mm) sinfwhile ihe other portion contains only partkkjpassing the No. 10 sieve. The mass of alr-driajsoil selected for purpose of tests, u prescribe* l(Practice D 421, shall be sufficient to yield oWlilies for mechanical analysis as follows: " <£
5.1.1 The size of the portion retained oa fcNo. 10 sieve shall depend on the maximum styof panicle, according lo the following s^heoWj
!S±to^ponla* passiing the No. isit
of sha washed aad
In. (
oven*
fetVI ANALYSIS OP PORTION RETAINED£ ON NO. I«(1J0*M) SIEVE
fi Procedure,..,... Separate the portion retained on the No.p(L0Q-mm) sieve Into a scries of fractions usinglk»V(75-mm), Mn- (50-mmX IMn. (37.5-Ls»X l-io. (25.0.0101), Vein. (19.0-mm). H-in.
„ No. 4 (4.75*mm). and No. 10 sieves,[eras many as may be needed depending on ther.—^ gj. upOn ipecliicaijoiii fo, (he maie-
erlcst.'t2 Conduct Ibe sieving operation by means' • lateral and vertical motion of ihc sieve,•empanicd by a jarring action In order lo keepsaatple moving continuously over ihe surface
'ihe ileve. In no case turn or manipulate frag-[jkett In the sample through ihe sieve by hand.^Mlla* sieving until not more than I mass %/•te residue on a sieve passes that sieve duringtjjeiln of sieving. When mechanical sieving Is
tJBi lest the thoroughness of sieving by usingFit need method of sieving as described above.r* 13 Determine Ihe mug of each fraction on a
' "p conforming to Ihe requirements of 3.1.end of weighing, Ihe sum of Ihe massesd on all the sieves used should equalihe original mass of ihe quantity sieved.
D422
HYDROMETER AND SIEVE ANALYSIS OFPORTION PASSING TIIE NO. ig(2.o0-»»)
SIEVE
7. Dettrmlulio* of Composite Correction forHydrometer Reading
7.1 Equations for percentages of soil remain-ing in suspension, as given in 14.3, are based onihe use of distilled or demfneralized water. Adispersing agent Is used in the waler, however.and the specific gravity of Ihe resulting liquid isappreciably greater than that of distilled or de-mineralized water.
7.1.1 Both soil hydrometers are calibrated at6IT(20*C), and variations In lemperalure fromthis standard lemperalure produce InaccuraciesIn Ihe actual hydrometer readings. The amountof the Inaccuracy Increases as Ihe variation fromIhe standard lemperalure increases.
7.1.2 Hydromeien are graduated by the man-ufacturer to be read at Ihe bottom of the menis-cus formed by Ihe liquid on the stem. Since it isnol possible lo secure readings of soil suspensionsat Ihe bottom of Ihe meniscus, readings musi betaken al Ihe lop and a correction applied.
7.1.3 The net amount of the corrections forIhe three Items enumerated Is designated as thecomposite correction, and may be determinedexperimentally.
7.2 For convenience, a graph or table of com-posite corrections for a series of I' lemperaluredifferences for Ihe range of expected lest lemper-aiures may be prepared and used u needed.Measurement of Ihe composite corrections maybe made ai iwo tempera lures spanning the rangeof expected lest temperatures, and corrections forIhc intermediate temperatures calculated assum-ing a straight-line relationship between the twoobserved values. :
7.3 Prepare 1000 mL of liquid composed ofdistilled or demlneraUzed water and dispersingagent in Ihe same proportion as will prevail inIhe sedimentation (hydrometer) lest Place theliquid In a sedimentation cydinder and Ihe cyl-inder In ihe constani-iempeniure water bath, selfor one of the Iwo temperatures to be used. WhenIbe lemperalure of Ihe liquid becomes constant,insert ihe hydrometer, and. after a short Intervalto permit the hydrometer lo come to the lemper-alure of the liquid, read the hydrometer al Ibclop of the meniscus formed on the stem. Forhydrometer 151H the composite correction is the .difference between this reading and one: for hv-

I ing to Stokes* taw:/>- -<7,)|xt/r
Iwncrc;I/I - diameter of panicle, mm,-|M - coefficient of viscosity of the suspending
medium (in this case water) in poises (varieswith changes In temperature of the sus-pending medium),
|/. - distance from the surface of the suspensionto the level at which Ihe density of thesuspension is being measured, cm. (For •given hydrometer and sedimentation cyl-inder, values vary according to Ihe hydrom-eter readings. Thb distance b known aseffective depth (Table 2)K
|/' - interval of lime from beginning of sedimen-tation to Ihe taking of Ihe reading, mln,
i « specific gravity of soil particles, and| i i - specific gravity (relative density) of sus-
pending medium (value may be used as1.000 for all practical purposes).
N»re H—Since Siokes* law considers the terminalI dnvii} ufa single sphere fatting la an Infinity of liquid,Ihc JJ/ti calculated represent Ihe dbmeter of spheres|tiai would fall at Ihe same me at the sott panicles.
15.2 For convenience in calculations Ihe| U»vc equation may be written as follows:
O - KJLftIlk-re:; * constant depending on Ihe temperature of
Ihc suspension and the specific gravity ofthe soil particles. Values of A* for a range oftemperatures and specific gravities are givenin Table 3. The value of A'does not changefor a series of readings constituting a lest,while values of L and 7* do vary.
\ 5.3 Values of D may be computed with suf-Iricnt accuracy, using an ordinary 10-in. slidelik*
Mm i 15—The %-alue oft Is divided by r using Ihe• ami H-scales, the square root being Indicated oa Ihe
| -H-asr. Without ascertaining the value of Ihe squarei ii may he multiplied by A', using either Ihe C* or
\\. Sieve Analysis Values for Portion Finer lhaaNo. lQ(2.00-mm)Slere
16.1 Calculation of percentages passing IheiritHis sieves used in sieving the portion of Ihcm|4c from the hydrometer lest involves several:pv The first step is to calculate Ihe mass of the
fraction thai would have been retained oatjjNo. 10 sieve had ta not been removed. Thbavjb equal to the total percentage retained] oa sj(|No. 10 sieve (100 minus total percentage.times the mass of the total sample represeailjlby the mass of soil used (as calculated In Ii
, and the result divided by 100.16.2 Calculate ne&l the total mass passing i
No. 200 sieve. Add together Iht fractional muretained on as) DM sbves. Including U* No.sieve, and subtract thb sunk from the mass of)total sample (as cakubied In 14.2).
16.) Cakulaia nest the total masseseach of the other sieves, In ft mannerthat given in 12.2. -«|
16.4 Calculate last the total percentages pss>|Ing by dividing the total mass passing (as eaftbled in 16.3) by Ihe total mass of samptsfacalculated in 14.2), and multiply the rankij•I0°* '-ij17. Graph *
17.1 When Iht hydrometer analysis b p»formed, a graph of the test results shall be maa;plotting the diameters of the particles on a lostrilhmk scale as Ihe abscissa and the perccntagijsmalkr than the corresponding diameters to ttarithmetic scale as the ordinate. When U* I?dromeier analysts b not made on a portion s!|Ihe soil, the preparation of the graph Is option^since values may be secured directly from Ub>bled data. ' '11. Report
111 The report shall include Ihe following;11.1.1 Mail mum size of particles, '11.1.2 Percentage passing (or retained an)
each sieve, which may be tabulated or preseawby plotting on a graph (Nole 16),
111.3 Description of sand and gravel par*cfcs: '
11.1.3.1 Shape—rounded or angular,11.1.3.2 Hardness—hard and durable, soft, at
weathered and friable,111.4 Specific gravity, If unusually high at
low,111.3 Any difficulty in durxrsii*ln*fr^aioi
passing Ihe No. 10 (2.00-mm) sieve, indkatinjany change in type and amount of dlspenb|agenl. and: 111.6 The dispersion device used and satlength of the dispersion period. \
16—Thb tabulation of graph represents
Icoatataofl In HHJ saMpSS wcia iwstovM bewn.Sl»feportn^elsosis^grvfag«Was»o<in<as>d
For maieriab tested lor compliance withispecMcs4iong, Int fractloAS caDod fer in
i sbaJI bt reported. Tk* ftac-
D422
«)Conoids, smaller than 0.001 aim
ftft
limalitrthantheNa 10 sieve shaN be read
Fur materiab for which compliance with! apcdficttkms b not Indleated and whenI b composed almost entirely of particlesthe No. 4 (4.75-mm) sbvt, Ihe results
t !h«r graph may be reported as fottows:
114 For materials for which compliance withdefinite specifications b not Indicated and whenthe soil contains material retained on Ihc No. 4sieve sufficient to require a sieve analysis on thaiportion. UK results may be reported as follows(Now 17):
Swvt ANAL VMSPciccaiate
Sieve Sb* Passing
, passing 3-ln. and retained onNo.4sbv«
ifand, passing No. 4 sieve and n>
"&) CowMSMd, passing No. 4 sbw> and nislatd on No. 10 sbvapt) Msdhim sand, passJaj No. 10
j1^. MW* UMl Mliihiifd on No. 40
Hnt na4, passuuj No. 40 simand fiiatatd on No. 200 sbva
ft
ft
ft
ftft
I-U,fc-ln.K-in.No.4(4.75.m«)
No.200<1SfiM)ANALVSU
0.074 mm . . . . . . . . . .0.005 mm . . . . . . . . . .0.001 mm ..........
Non 17— No. I (2J6-mm) and No. 50 (300iim)sbves may bt substituted for No. 10 «d No. 40 sieve*.
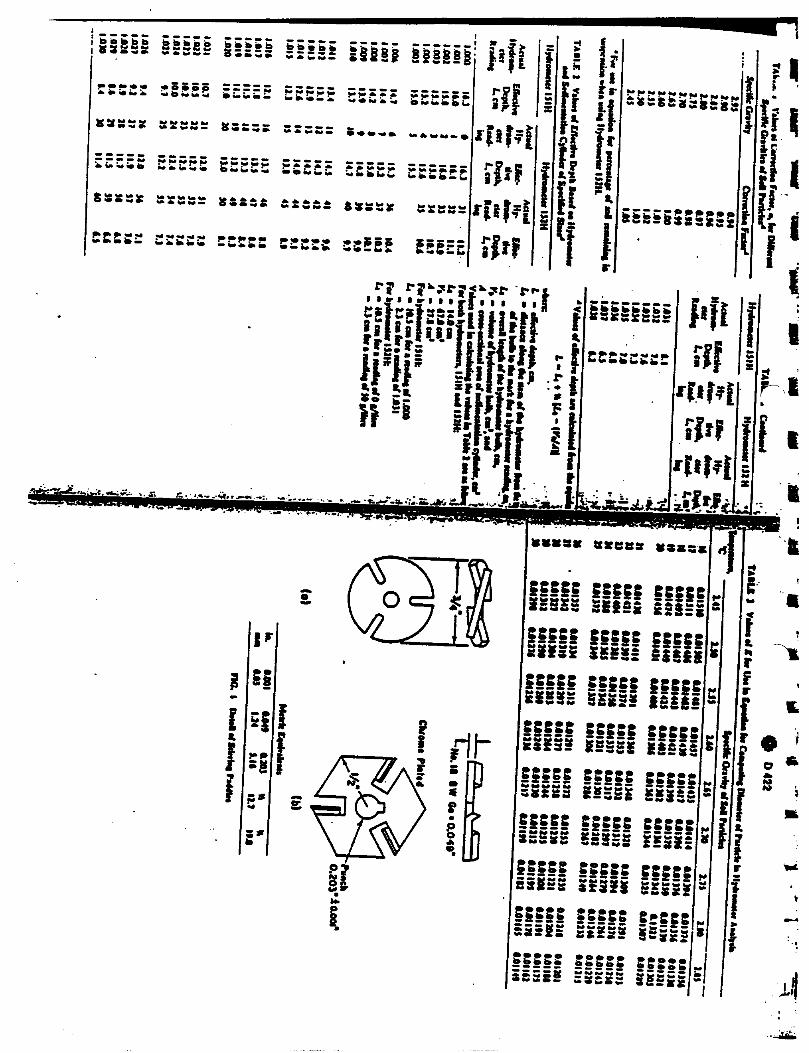
»bbb bb0ob bbbbb bbabb bjI ft* ** M W M »WM M fit ~ * *•* S ...•». .1»*•«*•» ^* ^ w**» O * • ^« »* ^ ^ »^ — O i
ISi
5*
.' 8. fcr. 2»> J
SKS6SSSSSS
????? esses sssss „28E55 SSiii illgl£????? SSgSS SSSSS « r ^ ;5SS33 SSSSi S f I • '
!: f __ j&
iilii ????? fussi=555 552=:= Isiiisssss
IISSS SSS2S.-.ssasS HSHSS 555§i -I
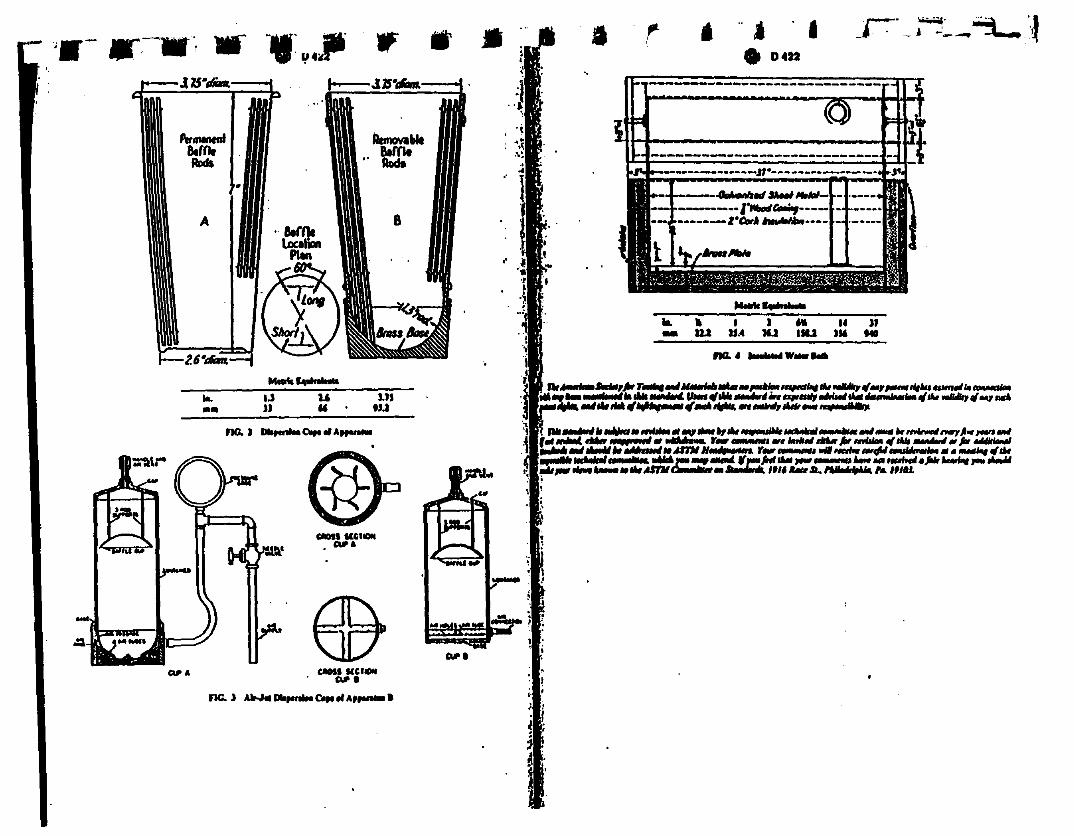
i*. i.Jmm II
uM •U
FMX 1
3
'»5
m. ft I 1 M 14 IfM 1U 214 MJ IttJ JU MO
Iterr<i» numifftfi irff /aerfar «
IMAJL
He. J

Reductiofl of moisture content may beatvnmpfishcd as follows: by exposure 10 air aiimlinary room temperature, by healing in anmrn at a temperature not exceeding 230TIlin'O. hy boiling, by filtering on a BocfinerIMIIIH-I. nr by use of filler candles. During evap-uriiiiiin ami cooling, slir I he sample often enoughin prevent overdrying of the fringes and soil
pinnacles on the surface. Cool Ihe healed SMWlo normal room temperature before lesliaftjsoil samples containing soluble sails, mmethod of water reduction that win not cU«jIhe soluble salts from ihe lest sampk. Prokdiprepared sampk in a suitable containerfurther drying until all required tests havtperformed.
.4
':-<fV MtMr/ V"**r *n* nltAri Aucirtrrf to
If M JUCV ».
'i
rDMlgiMNM: D1321 - M (Hf •ppovMt
Standard Tttl Method forCAPILLARY-MOISTURE RELATIONSHIPS FOR COARSE-AND MEDIUM-TEXTUREO SOILS BY POROUS-PLATEAPPARATUS'
ilUi *w4Mtf fcihiM4 Mttr IM Awl dnltMilM D1I2S; At MMta thcytvrf
•Ifen—SM!M I MM •Metf fdbwUy Mtf trite
.1,1 This lesl method covers the determinationWcapttary-molMurc relationship* lor coarse*
medlum-teilured soils as indicated by thef jstaoistun tension relations for tensions be-
10 and 101 kPa (a I and I aim). Underconditions, moisture tension b dc*
[led as the equivalent negative fate pressure, orratetlon, corresponding to a soil moisture content.Flab test method determines the equilibrium
content retained In a soil subjected toa abcii soft-water tension. This lest method is
' art suitable for very fine-tcxlured soils.Non I— For deknftiulkw of cap<hiry*iMlfiiift
JmWihlpl for Ajtt-feilurtd wilt. refer 10 Tcsl(IfcttddDJISl
tlD42I Practice for Dry Preparation of Soil
Samples for Particle-Size Analysis and De-ItmrfsMilkHt of Soil Constants'
0691 Test Methods for MoiMure-Densliy Re-Islions of SoHs and Soft-Aggregate MixturesUsini 5.Wb (2.49-kg) fUmmer and 12-ln.(JOS-MnODrop*
D3IS2 Test Method for Capillary MoistureRelationships for Fine-Tenured Soils byPressure-Membrane Apparatus'
£ Satftaiary «/ M elbcdII Saturated soft samples arc placed In con-
| M with a saturated porous plait installed withinisffssiire chamber. The bottom of each ptate is
covered by a rubber membrane, or otherwisesealed lo be airtight The bottom of each plate ismaintained at atmospheric pressure by means ofa small drain tube or opening through the sideof the pressure chamber. A desired air pressureadmitted to the pressure chamber, and conse-quently to the top of the porous plate, creates apressure drop across the porous plate. The satu-rated soil samples on the plates establish equilib-rium with the water In the plate. The water, heldai a tension less than the pressure drop across theporous plate, win then move out of the soil,through the plate, and out through the drain lube.When water has ceased to flow from the sampleand porous plate, (indicating equilibrium for thatparticular tension), the muisiure content of eachsample is determined. A series of these tests atvarious tensions Is required to prepare a completecurve of the capillary-moisture relationship forany particular soil.
4. AtfaralM4.1 An assembly of the apparatus is shown in
Fig. I.4.1.1 Porous Pbtt Apparatus, consisting of
the following:4.1.1.1 fresntft Container, (such as a pressure
cooker), of approximately !5-L(l6-ql) capacity.
' TWi Ml **tke4 fc MMfci *t i•MHcc O-ll M Sot M4 Mrt *Wk At 4t+rtimmkM DUAl M UHnfefk **lUdi.
of A$TM CMH
WSo*
CwnM «MM •fvnnrf Scyi. I J.Oim-44T.Un>«i»MMililitt1 -4*t*W «Mft 44 STU A-JUA

m4.1 ttttfatitr. sensitive to 0.1 g.
D2217
Trtu lor PrtcmUiUoa rf $oi COMUMI:I L._tj«t_••
. _- _-..»- • «*»r. •HIM-i* lor breaking up the aggregations of soil par-
tides.4..I AVnrt. No. 10 (2.00-mm) and No. 40
(•05-uni). of square mesh wovcn-wire doth, con*liirming to Specification E11.
4.A .Vrt/ii/i/rr—A riffle sampler or sample split-ter I'or quartering the samples.
•I 5 Drrinjt Apparatus—ThermostaticallyI'liiilrolkd doing oven for use al 140*F (60*C) orMow and al 2JO'F (110'C), infrared lamps; airdrier; or other suitable device for drying samples.
•1.6 fitter runnels ttr Candles—BQchner fun*iK*h 10 in. (254 mm) in diameter and filler paperiir tiller candles.
•1.7 \li\ccllamwts /Equipment--Pans 12 in.i.MM.N mm) in diameter and 3 in. (76.2 mm) inik*|Hh: a suitable container that will prevent lossid'moisture during storage of the moisl test sam-!*!»• iHcnarcd in Procedure B.
101IJM
* CVctic«i.$
NOTI I—Wbeii the ufflpte contains padldashale or sindstone or slmUtr weak material, prop«UtJ fc* *«»«-ii——' •- ----•>be cierefacd lo arold txcesslvc reducUoa k
I'ROCKDURE A
I. Sampling
5.1 DO' the soil sample as received from thek-M. using one of the following methods: (J) innr at room temperature. (}) in a drying oven ati temperature not exceeding I40*F(60*Q. or(J)i\ing any warming device thai will not raise theI'Mipcraturc of the sample above MOT. Breakip thoroughly any aggregations of particles usingIK* mortar and rubber-covered pcsilc or othertillable device (Note I). Select a representativeHHtton by Ihc method of quartering or by use ofhe sampler. This portion must be sufficient to•ruvidc samples for particle-site analyses of ma*.•rial retained on and passing the No. 10 (2.00-ini) sieve, and lo provide an adequate amountf material passing Ihc No. 40 (425-um) sieve forH- tests lo determine soil constants. Themounts of material required to perform the- i:-; ' • • • ' tests arc as follows:
•Xwc AMlytts of Material Rciaiard
40QOIOIOOOO1300
400
111•5
N.IAMl}*» at Milribl fatting
rbjry *n
i. Preparation of Ttsl Samples6.1 K* Partk-lf-Siit Analysis:6.1.1 Weigh the portion of the lest «
selected for particle-size analysis and retosjithe weight of test sample uncorrtcicd for kjyscopic moisture. Separate this material torn*portions using the No. 10 (2.00-mm) skit, jaside the portion passing for later recombiatflwith additional material washed from the ponlretained on the No. 10 (2.00-mm) sieve.
6.1.2 Place the material retained on shell10 (2.00-mm) sieve In a pan. cover with **•and allow to soak until the particle aggrcgatipsjbecome soft. After soaking, wash the malerisJfla No. 10 (2.00-mm) sieve in the following amncn Place an empty Ma 10 (2.00-mm) sit*sithe bottom of a dean pan and pour the vaijfrom the soaked sample Into the sieve. Adds*ficienl water to bring Ihc level approximate)*!In. (12.7 mm) above the mesh of the sieve. Tm|fcr the soaked material to the sieve in incremtstnot exceeding I tt> (0.45 kg), stirring each mo*mem with the fingen while agitating the sfentjand down. Crumble or mash any lumps Afhave not slaked, using the thumb and fiasjotRaise the sieve above the water in the pu M|complete the washing operation using a sajamount of dean water. Transfer the washed mlerial on the sieve to a clean pan before ptatisjanother increment of soaked material Msieve.
6.1.3 Dry the material retained on the Nsx ^(2.00-mm) sieve at a temperature of 230 * W(110 ±5*C). sieve on the No. I0(2.00-mni)ifc*and add the material passing the sieve to sMvmaterial obtained In 6.1.1. Set aside the maferfjretained on the sieve for use In the partkk-stianalysis.
6.1.4 Set aside the pan containing the wisVings for a period of several hours or unll Atwater above the panicles Is ckar. Decant, pipcf,or siphon off as much of the clear water apossible (Note 2). Dry the soil remaining la At
\ st a temperature noj exceeding 140*F (60"Q.H the dried soil in the mortar with the rub-
rad pestb or other suitable device, andi with similar material obtained In 6.1.1.
11.5 Alternatively, after «N the soaked mate-'s! hs* been washed, remove most of the waterr muring the wash water on one or more Buck*v toads filled with filler paper or by using
BKT candles. Remove the moist soil from thepttr paper or filter candles, combine with anymUttni remaining In the pan, and dry at •pnpentura not exceeding I40T (60*Q. Grindt *fed soil In we mortar with a rubber-covered
its* or other suitable device and combine with(Wtf material obtained lo 6.1.1.
I—In some Inuaaccs, me wash water wBI aot
nmst be tvaporatcd.( ,12 for Detcrminaltott o/ Soil Constants—hoctcd In accordance with 6.1. subtUluting a
40<425-iim) ileve for the No. 10 (2.00-mm)
rt.fton 3—In aomt areas NbposuMa that we caiioMof uhs present M lac lap waicr may eicfcuge wiu it*•atfwal cation* m ma soil awl alter tignincaiiuy tto!tatas of me soi constants slwNild lap water be used tofcffiU^ajkdwtsliiiigopmu^UiutttfclskMwii•st swft) catioM ait atot prcstat m Ift* tap water.tmlbJ or demiacralbed water should be used. The
MlagMtdwiifcliigopcrilloa»Mlrtfii»ovtioMi»eali<fnatilirsl fa the soi. When soluble salts arc pfcscrt toffc saa\ me wash water should be saved and tvapontcd.
! Test Samples, IJ Keeping each portion separate from the[amtf portion, mix thoroughly the portions of thejol simple passing the No. 10 (2.00-mm) sieve;im1lht No. 40 (425-|im) sieve. By the method
E'tfoMrtering or by the. use of the sampler, select'gal weigh out lest samples of the weights indi*carnl In Section 5, M may be needed to make
LSamnlesH Samples prepared in accordance with this
ffocedurc must be skipped from the field to the(moratory In sealed containers and must containsi mdr natural moisture. Samples obviouslycontaining only particles passing the No. 10(100-mm) sieve may be tested In the particle-
02217
site analysis without first washing on the No. 10(2.00-mm) sieve. Samples obviously containingonly particles passing the No. 40 (425-um) sievetnay be used In the tests 10 determine soil con-stants without first washing on the No. 40 (425-um) sieve.
>. Preparation of Ttsl Samples9.1 For Particle-Sixe Analysis:9.1.1 Select and weigh • representative por-
tion of the moist sample estimated lo contain 50g of particles passing the No. 10 (2.00-mm) sievefor silly and dayey soil, or 100 g for sandy soil.For samples containing panicles not passing theNo. 10 (2.00-mm) sieve for which a particle-sizeanalysis b required, select and weigh a represent-ative sample estimated to contain the requiredamounts of partfdes both passing and not passingthe No. 10 (2.00-mm) sieve/Dctermine the mois-ture content at 230 ± 9'F (MO ± 5'C) using anauxiliary sample, for use in Method D422.
9.1.2 Soak the moist sample and wash on aNo. 10 (2.00-mm) sieve as described in 6.1.2.After washing, dry the material retained on theNo. 10 (2.00-mm) sieve In an oven at a temper-ature of 230 ± 9T(110 ± 5'CX weigh, and retainfor the particle-size analysis. If the volume of thewash water and soil Is loo large for use In thesedimentation procedure of the lest for particle-size analysis, evaporate excess water by exposurelo air at room temperature, by healing in an ovenat a temperature not exceeding 2JO'F(110'C). orby boiling. Regardless of the method of evapo-ration used, the following precautions must betaken: (/) stir the slurry from time to lime toprevent a dry soil ring from forming on the wallsof the evaporation .vessel, and (2) return thetemperature of the sample to room temperaturebefore testing.
9.2 Far Dei trtninat ion of Sail Con ttants—Se-lect a representative portion of the moist sampleestimated to contain sufficient particles passingthe No. 40 (425-ftim) sieve to make Ihc requiredtests for determination of soil constants. Soakthis selected portion of the moist sample andwash on the No. 40 (425-um) sieve as describedIn 6.2 (Note 2). Reduce the moisture content ofIhc material passing the No. 40 (425-um) sieveuntil the mass reaches a putty-like consistency(such as JO to 35 drops of the cup In the liquidlimit test) but never below the natural moisture

to. P HI an/. ...urae) curacy of this tesl Jhod have not yet10.1 Requirements for the precision and ac- developed.
fDesignation: 1^217-g*
rV
M fMiOinfc; IfM Am St. Mfe**4fe, A* rtMJL
Standard Pracllc* (orWET PREPARATION OF SOIL SAMPLES FOR PARTICLE-SIZE ANALYSIS AND DETERMINATION OF SOILCONSTANTS'
•rtliulr Mo»««i *« *tl|M4lai Indium g» yw el
^<wri^ ^
1.1 TMs practice coven the wei preparationf ie4 simples as received from the field for
|sflkk-sbc awUysis and determination of soilasiaais.U frocedure A provide! for drying the field
at a temperature not eiceedinf I40Taukini • wet separation on Ihe No. 10
(LOO-ann) sieve, or No. 40 (425-um) sieve, orM. as needed, and finally drying at a temper-HSK aot etcecdjni I40T. Procedure D providest* nV sampte shall be kept at a moisture con*ml equal to or greater than the natural waterSMfcat The procedure lo he used should be
M the specification for Ihe materiallda| tested. If no procedure Is specified, the
of Procedure B shaN govern.
Ajrfah tjfrathiu. end fttulprntnt. Tklt standardtttt M* f&porl 10 cddrtss «M qflke st&typrob-
Its use. ll It Mr /n/wv/WAs>n/iri»0nvr tuts ikb standard to coiwtk and
tqfrijmnd ktobk fvaalcn
E II Specification for Wire CkMh Sieves forTesting Purposes1
3. Significance and Use3.1 Procedure A is used to prepare soil sam-
ples for plasticity tests and pankle-size analysiswhen Ihe coarse-grained panicles of a sample aresoft and pulverize readily, as in Practice D42I.or when the fine panicles are very cohesive andtend lo resist removal from the coarse particles,
3.2 Some soils never dry out in nature andmay change their characteristics greatly whendried. If the Irue natural gradation and plasticitycharacteristics of such soils are desired. Ihcse soilsshould be shipped to the laboratory in sealedcontainers and processed in accordance wilh Pro-cedure 0 of this practice.
3.3 Liquid limil and plasticity index valuesderived from samples containing their naturalmoisture are usually, but not always, equal lo orhigher than values derived from similar samplesof Ihe dried soil In the case of fine-grainedorganic soil, there is a radical drop in plasticitydue to oven drying.
0421 fnctfae for Dry Prcpartltoa of Soil
1 Tfcfc fnnkt h wrier rtvjwMdktffti tf ASTM C«Miflk>D-JI M lot Mtf JUct *** * *•

rn

APPENDIX E
INTERNAL CHAIN OF CUSTODY PROCEDURESFOR HAZLETON LABORATORIES AMERICA

•OFFICIAL COPY-DO NOT DUPLICATE
Hazleton LaboratoriesAmerica. Inc.
Quality Assurance Unit
DEPAR PROCEDURE
OP-PROJ. 1PAGE 1 OF 2
Ji
IALTRADE SECRET
HAZLETON LABORATORIES^: */"/87AMERICA, INC. ^EPUCES: 4/2
DO NOT DUPLICATE4/21/86
PROCEDURE IDENTIFICATIONi EPA UA-82-A155 Hazardous Waste Analysis
PROCEDURE TITLE: Chain of Custody ProceduresAREA OF APPLICABILITY:
PURPOSE:
Hazleton Laboratories America, Inc.Environmental Analysis
Future legal proceedings my necessitate Hazleton Laboratories America, Inc.(HLA) to produce documentation that traces the custody of samples from receiptthrough completion of analysis. In Heu of this, 1t 1s necessary for HLA toguarantee the continuous custody of samples by either the sample custodian orthe lab analyst.PROCEDURE:
The following procedures for documentation of chain of custody for samplesreceived under Contract UA-82-A155 will be followed 1n addition to or as anaddendum to those previously stated under OP-OIY 7 and OP-PROJ 2.1. All samples will be stored locked In refrigerators located on the third
and fourth floors. A 11st of sample numbers, arranged by EPA case number,will be maintained by the sample custodian.1.1 All bottles received for extractable compounds (semlvolatlles or
pesticides) will be stored at 4'C In one of two double-doorrefrigerators located on 3 South 1n Room 301.
1.2 All bottles received for volatile analysis will be stored at 4°C on4 South 1n the Mass Spectrometry area, 1n the refrigerator designatedfor volatile samples only.
2. Only the designated sample custodian and supervisory personnel will havekeys to the double-door refrigerators.
3. Samples will remain 1n the designated refrigerators until removed forsample preparation and/or analysis.
4. All transfers of samples Into or out of the double door refrigerators willbe documented on an internal chain of custody record (see attached).These records are maintained by the sample custodian.
5. Once a sample Is removed from a refrigerator by the analyst, he/she 1sresponsible for the custody of the sample. Each analyst must returnsamples to the double door refrigerator before the end of the workingday. Samples are not allowed to sit on the bench over tne evening.
JI

II4r1
OFFICIAL COPY-DO NOT DUPLICATE
Hazieton LaboratoriesAmerica. Inc.
Quality Assurance Unit
OP-PROJ. 1PAGE 2 OF 2DATE: 2/11/87
APPROVED BY:
CONFIDENTIAL
HAZL^^ORWORI g"0"1 ""'"AMERICA, INC.
DO NOT DUPLICATE
DATE 2-"-SE-Wlrtz
Environmental Analysis
David HillsProject Leader
REVIEWED BY:Debra Cur ley Arndt ^JManager, Quality Assurance Unit
DATE
(1458E)
44
4J4J
JJ

i
4d4
-OFFICIAL COPY-DO NOT DUPUCATE
Hazleton LaboratoriesAmerica, Inc.
Quality Assurance Unit
Case No.
CONFIDENTIALTRADE SECRET
HAZLETON LA3ORATORAMERICA , INC.
EPA WASPAMQMWPU^U&Chain of Custody
StorageStorage
Laboratory Removed Date/ TineSample Ho. by Removed Reason
OP-PROJ. 1JE3TTACHMENT
SIS
LocationDate
Date/ n meReturned
MM.1r«r"r"

444
44
4444
-OFFICIAL COPYDO NOT DUPLICATE
Hazleton LaboratoriesAmerica. Inc.
Quality Assurance Unit
CONFIDENTIALTRADE SECRET OP-PROJ. i
HAZLETON LABORATORIES'*0""011
AMERICA, INC.
PROJECT IDENTIFICATION: EPA WA-82-A155 Hazardous Waste AnalysisPROCEDURE TITLE:DISTRIBUTION:
Ham
David C. HillsNark W1rtz
Chain of Custody Procedures
'Title
Section SupervisorDocumentation Custodian/Sample Custodian
Department/Cost Center No.Environmental Analysis/6004Environmental Analysis/6004
J4
1I
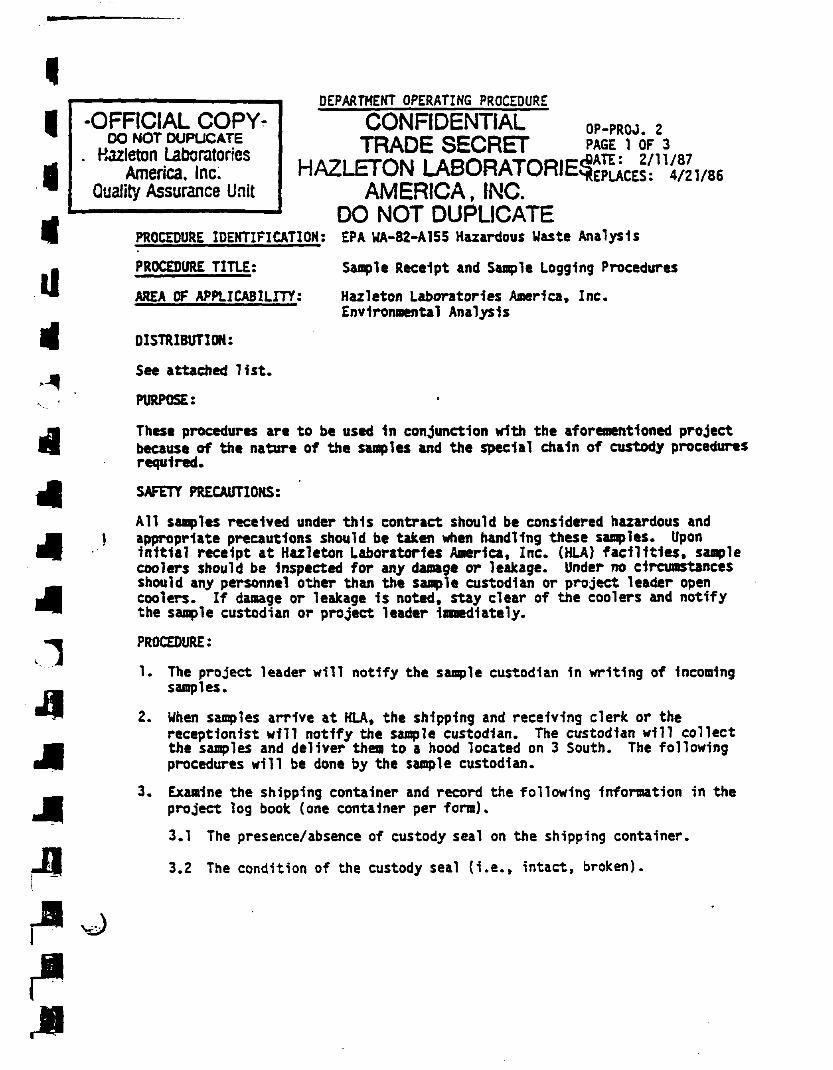
II
d44
4JiJiJI
-OFFICIAL COPY-DO NOT DUPLICATE
Kazleton LaboratoriesAmerica. Inc.
Quality Assurance Unit
PROCEDURE IDENTIFICATION
PROCEDURE TITLE;
AREA OF APPLICABILITY:
DEPARTMENT OPERATING PROCEDURECONFIDENTIALTRADE SECRET
HAZLETON LABORATORIESAMERICA, INC.
DO NOT DUPLICATEEPA WA-82-A155 Hazardous Waste Analysis
OP-PROJ. 2PAGE 1 OF 3'ATE: 2/11/87EPLACES: 4/21/86
Sample Receipt and Sample Logging ProceduresHazleton Laboratories America, Inc.Environmental Analysis
DISTRIBUTION:
See attached 11st.PURPOSE:
These procedures are to be used in conjunction with the aforementioned projectbecause of the nature of the samples and the special chain of custody proceduresrequired.
SAFETY PRECAUTIONS:
All samples received under this contract should be considered hazardous andappropriate precautions should be taken when handling these samples. UponInitial receipt at Hazleton Laboratories America, Inc. (HLA) facilities, samplecoolers should be Inspected for any damage or leakage. Under no circumstancesshould any personnel other than the sample custodian or project leader opencoolers. If damage or leakage 1s noted, stay clear of the coolers and notifythe sample custodian or project leader Immediately.PROCEDURE:
1. The project leader will notify the sample custodian 1n writing of Incomingsamples.
2. When samples arrive at HLA, the shipping and receiving clerk or thereceptionist will notify the sample custodian. The custodian will collectthe samples and deliver then to a hood located on 3 South. The followingprocedures will be done by the sample custodian.
3. Examine the shipping container and record the following Information In theproject log book (one container per form).3.1 The presence/absence of custody seal on the shipping container.
3.2 The condition of the custody seal {i.e., intact, broken).
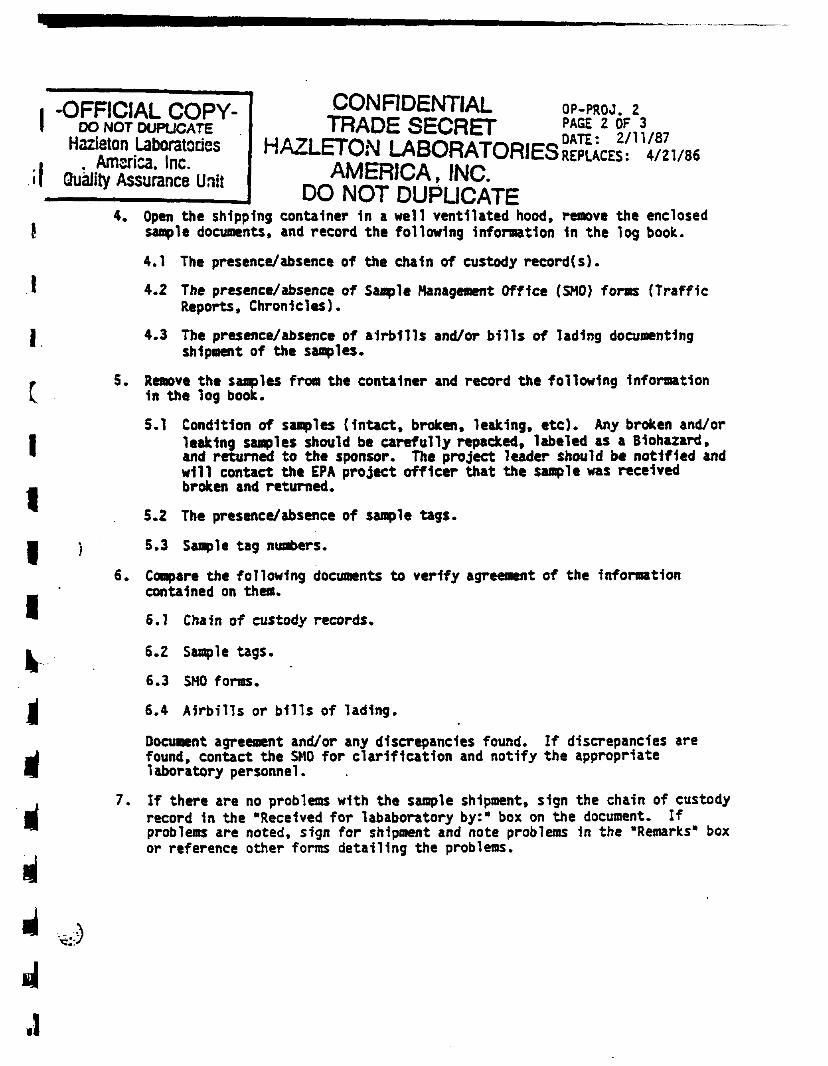
I -OFFICIAL COPY-I DO NOT DUPLICATE
Hazieton Laboratories• . America. Inc.I Quality Assurance Unit
CONFIDENTIAL OP-PROJ. 2TRADE SECRET !« 2 EDATE: 2/11/87
HAZLETON LABORATORIES SEPUCES: i/zvseAMERICA, INC.
DO NOT DUPLICATE4. Open the shipping container 1n a well ventilated hood, remove the enclosed
( sample documents, and record the following Information 1n the log book.4.1 The presence/absence of the chain of custody record(s).
I 4.2 The presence/absence of Sample Management Office (SMO) forms (TrafficReports, Chronicles).
| 4.3 The presence/absence of airbills and/or bills of lading documentingshipment of the samples.
» 5. Remove the samples from the container and record the following Information^ 1n the log book.
5.1 Condition of samples (Intact, broken, leaking, etc). Any broken and/orI leaking samples should be carefully repacked, labeled as a Blohazard.* and returned to the sponsor. The project leader should be notified and
will contact the EPA project officer that the sample was received- broken and returned.
5.2 The presence/absence of sample tags.M ) 5.3 Sample tag numbers.
6. Compare the following documents to verify agreement of the Information_ • contained on them.™ 6.1 Chain of custody records,
a 6.2 Sample tags.6.3 SMO forms.
j| 6.4 Airbills or bills of lading.
Document agreement and/or any discrepancies found. If discrepancies are^ found, contact the SMO for clarification and notify the appropriate9 laboratory personnel.
. 7. If there are no problems with the sample shipment, sign the chain of custody• record In the "Received for lababoratory by:* box on the document. If^ problems are noted, sign for shipment and note problems in the "Remarks" box
or reference other forms detailing the problems.
4
.1

•OFFICIAL COPY-DO NOT DUPLICATE
Hazlston LaboratoriesAmerica, Inc.
Quality Assurance Unit
CONFIDENTIALTRADE SECRET TE:
HAZLETON LABORATORI ENLACES : 4/21'86
AMERICA, INC.DO NOT DUPLICATE'IT Log-in MB ian >les
8.1 Figure 1 is an example of a type of form the sample custodian could use1n order to log-In samples and to record the Information previouslydescribed*
9. Send preprocessing request form to Sample Entry requesting that HLA numbersbe assigned to the samples, and that they be logged onto the LIMS under theappropriate mnemonic for tracking and billing.9.1 The following LIMS pmemonics will be used for this contract:
KGMS Hazardous Waste GCMS AnalysisEPAP - Priority Pool Pesticides
9.2 Upon receipt of sample HLA numbers, log these HLA numbers Into the book.
10. Sample Storage.10.1 All bottles received for extractable compounds (semlvolatlles or
pesticides) will be stored at 4»C 1n one of two double-doorrefrigerators located on 3 South 1n Room 301.
10.2 All bottles received for volatile analysis will be stored at 4°C on4 South 1n the Mass Spectronetry area, 1n the refrigerator designatedfor volatile samples only. At the time of storage a storage blank willbe prepared -Identified with the case number and date prepared. Thisblank will be analyzed with those samples stored on the designated dateto monitor the potential for cross-contamination of samples duringstorage.
APPROVED BY:Markj WirtzEnvironmental Analysis
DATE Z-//-0?-
DATE .David HillsProject Leader
REVIEWED BY:Debra Curley A r n d t L JManager, Quality Assurance Unit
DATE all It fen
(1459E)
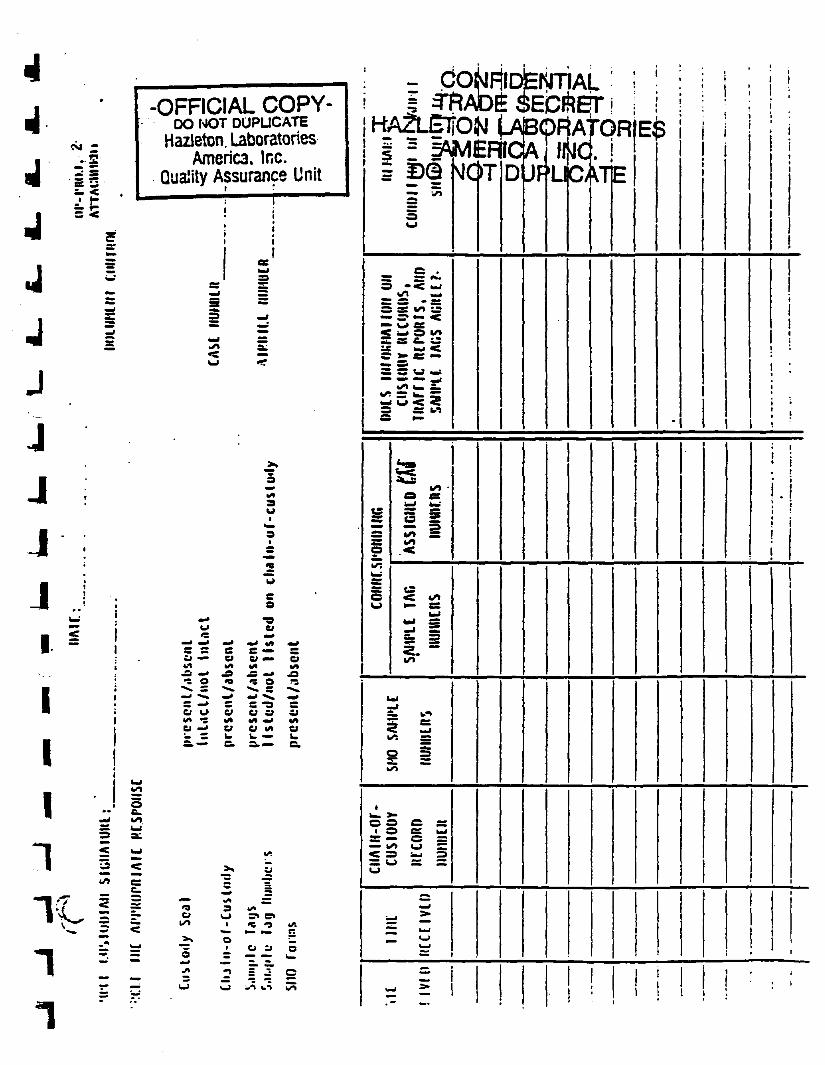
444 11^ as y
J ws
jJJJJ J •=
k-i s
I1
i1 ^
• • o• c.^ — I i-O
«/) c:_ c.
T -Y ^ ?x^ B <
OFFICIAL COPY-DO NOT DUPLICATE
HazJeton. LaboratoriesAmerica, Inc.
Quality Assurance Unit> ii ;
i 1i i!
K
3
2 -fMl ™
5
3
1
o1
5
co
u c/
ody
Seal
pi
cscn
l/abs
cnln
l«ic
L/no
t In
ii-of
-Cus
tody
pr
cscn
l/abs
cnIc
F«
ujs
prcs
cnt/a
bscn
Ic
fjg H
um he
is
Hst
od
/no
t H
i
Form
s pr
csen
lAib
senl
J 5 Iji £
; - c\ j 4l
I T_C-\ f\ |^» 1
i y^5
O •< tej
» w fie^c ^^ ^d ^^
*^ L i-*^ — 5
o es
illsE *n ^p .<
u»
O < 4rtw »— es
< -j
O 5
CIIA
IH-O
r-CU
SIOU
Y
iticon
nnu
MH[ii
s =
lor^A^^\ j
MlMC
."- ~
tfDEM lEF>T
[ID: 5
1CD
B
AJF
JT
^HU
IAI1C
!A^JCa
Trc(T
)R
E
E^
1I
i
•
,
i
I
I
ii
1I
i
•
ii
•i•
I*.
I
!iI
i • i
!
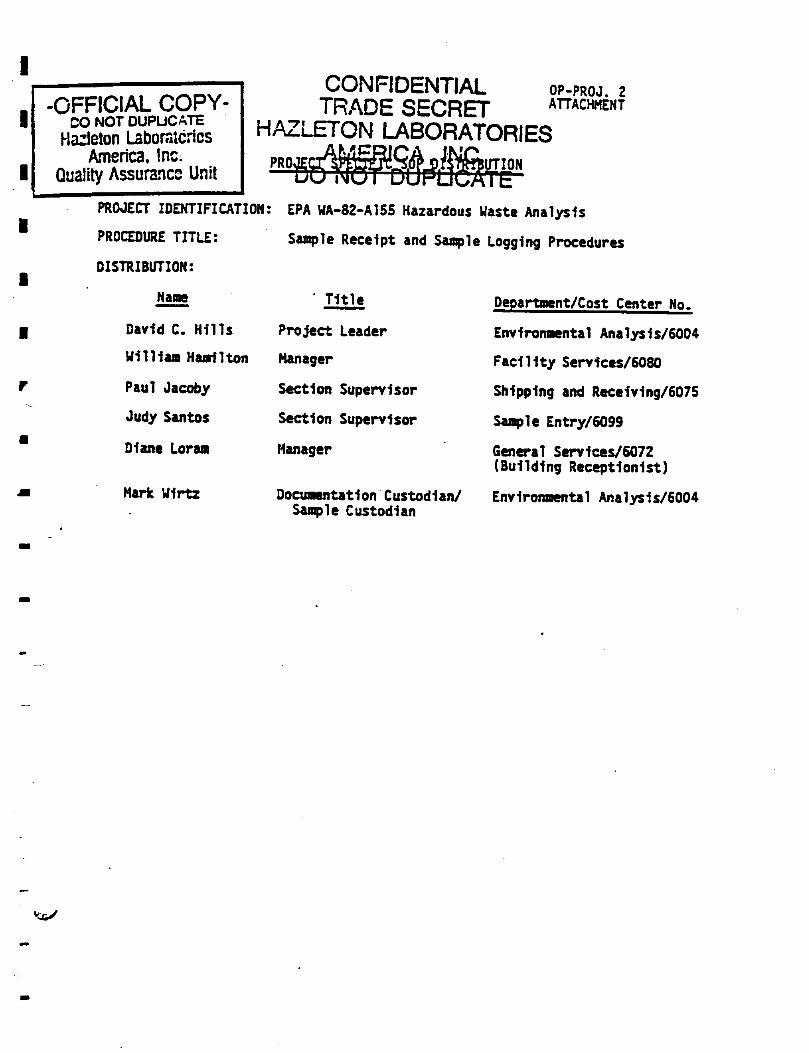
III
II
I
I
I
-OFFICIAL COPY-DO NOT DUPLICATE
Hadeton LaboratoriesAmerica, inc.
Quality Assurance Unit
CONFIDENTIALTRADE SECRET
OP-PROJ. 2ATTACHMENT
HAZLETON LABORATORIES
PROJECT IDENTIFICATION: EPA WA-82-A155 Hazardous Waste AnalysisPROCEDURE TITLE:
DISTRIBUTION:
Name
David C. HillsW1ll1a0 Hanilton
Paul JacobyJudy Santos
Dlane Loran
Mark W1rtz
Sample Receipt and Sample Logging Procedures
* Title
Project LeaderManager
Section SupervisorSection SupervisorManager
Documentation Custodian/Sample Custodian
Department/Cost Center No,
Environmental Analysis/6004
Facility Services/6080
Shipping and Receiving/6075
Sample Entry/6099
General Services/6072(Building Receptionist)Environmental Analysis/6004

4i
dJ
.-OFFICIAL COPY-DO NOT DUPLICATE
Huleton LaSoratcrasAmerica, inc.
Quality Assurance Unit
DEPARTMENT OPERATING PROCEDURE
CONFIDENTIAL OP-PROJ. 3TRADE SECRET ffif:1 &
HAZLETON LABORATORIES REPLACES; 1/3/33AMERICA, tNC.
DO NOT DUPLICATEEPA WA-82-A155 Hazardous Waste AnalysisION:
PROCEDURE TITLE:
AREA OF APPLICABILITY:
Duties and Responsibilities of the DocumentationCustodian and Procedures for Data Assembly andFiling
Hazleton Laboratories America, Inc.Environmental Analysis
DISTRIBUTION;
See attached 11st.
PURPOSE;
To specify the duties and procedures of the documentation custodian for theabove-mentioned contract.PROCEDURE;
1. The documentation custodian will organize and assemble all documentsrelating to each EPA case.
2. This procedure will ensure that all documents to be submitted to EPA arecompiled in one location, preferably 1n single case files arranged by SMOsample number.
2.1 Prepare case file folders as follows:.2.1.1 Assign one folder to each case according to SMO case number.
2.1.2 Place all documents, sample tags, SMO forms, and laboratory-generated data, pertaining to one case 1n the assigned folder,
2.1.3 Arrange all documents by type within the case folders, i.e.,all sample tags together, all Traffic Reports together, allhardcopy Mass Spectra together, etc.
2.1.4 File these document case files in one location in a securearea.

-OFFICIAL COPY-Hazleton Laboratories
America, Inc.Quality Assurance Unit
Bering*»t^ Ml
CONFIDENTIALnoNOTniiPt!-A-r= TRADE SECRET DATE: 4/21/86TO HAZLETON LABORATORIES vrua*: 1/3/33
AMERICA, INC.
J 3.1 Assignment of Accountable Numbers to laboratory-generated data.
3.1.1 Inventory each document of a case and assign It a serializedi number (an identifier) associating it with a particular case.
(I For example:
m SMO case » - serialized document folderJ 5081 01
3.1.2 Inventory and number all documents pertaining to each case• Including the following:
3.1.2.1 Sample traffic records, weekly reports.J • 3.1.2.2 Custody records, sample tags, airbills, internal** custody records.
J 3.1.2.3 Laboratory log books, personal log books, Instrumentlog books, benchsheets.
J 3.1.2.4 Laboratory data (sorted by sample), calibration andquality control results*
_ 3.1.2.5 Data sundries and reports.** 3.1.2.6 All other documents, forms, or records referencing
the samples.m3.2 Preparation of a Document Inventory.
J 3.2.1 Prepare a document Inventory list to provide a record of alldocuments and their corresponding document numbers that areIncluded 1n the completed case file.
J 3.2.2 If documents for a case are sent to an EPA Region forenforcement action or other action, tne laboratory willretain a copy of the document Inventory list for that case.i
iiii

-OFFICIAL COPY-DO NOT DUPLICATE
Hazleton LaboratoriesAmerica, Inc,
Quality Assurance Unit
CONFIDENTIALTRADE SECRET
HAZLETON LABORATORIESAMERICA, WC.
DO NOT DUPLICATE
OP-PROJ. 3PAGE 3 OF 3DATE: 4/21/86REPLACES: 1/3/83
APPROVED BY:
REVIEWED BY:
Mar* u i r t z ' 7 C "Environmental Analysrsr
David H111SProject Leader
DATE
DATE
s ^Detora Curley Arndt DATEManager, Quality Assurance Unit
(0725E)

JJ OFRCIAL COPY-
OO NOT DUPLICATEHazleton Laboratories
America. Inc.Quality Assurance Unit
DocumentControl Number
III
"1
CONFIDENTIALTRADE SECRET
HAZLETON LABORATORIES
OP-PROJ. 3ATTACHMENT
DO NOT DUPLICATE
File InventorySample Tags
Sample Tracking Documents
EPA Chain of Custody
Airbills
Organic Traffic ReportsExtraction Worksheets/Screens
Copies of Analyst's Notebook PagesIdent1f1cat1on/Quant1tat1on WorksheetsCopies of SC and GC-MS Operation LogsCopies of Standard Preparation Log
Other Correspondence/Menus
QC Sumnary Package
Data Summary PackageSample Data Package
Raw QC Data PackageStandard Package
Pesticide Raw Data
Number of Pages
i
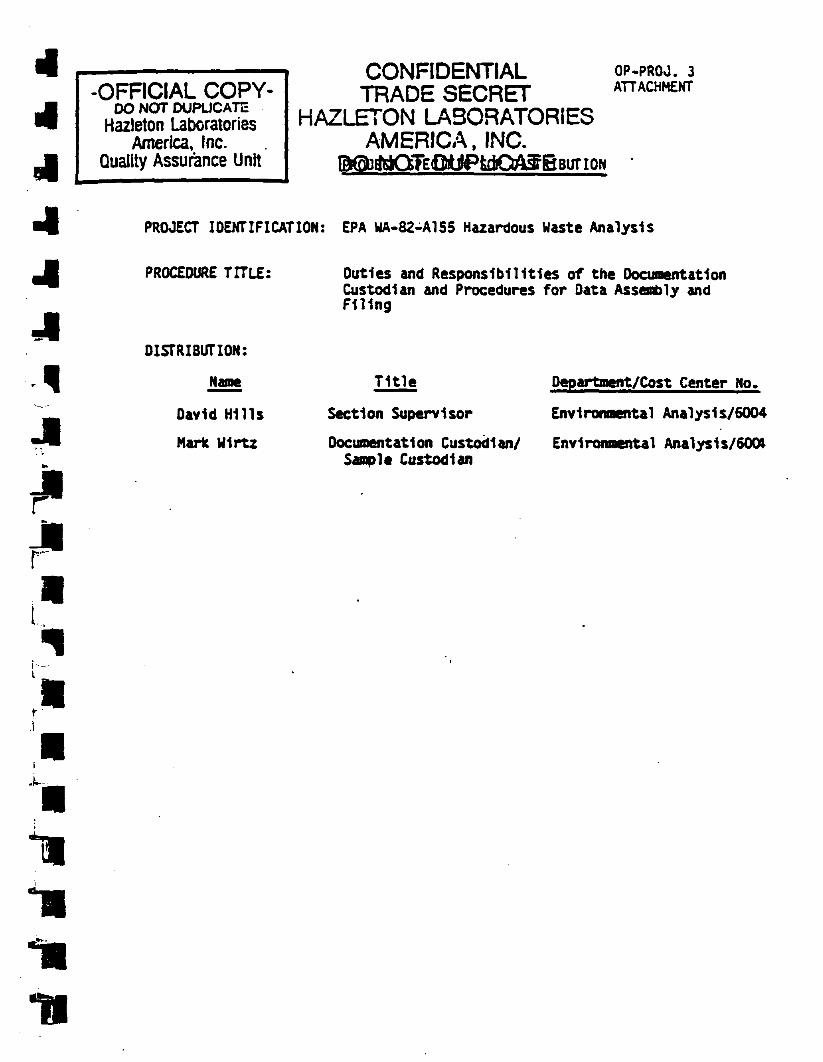
44
444
J
•OFFICIAL COPY-DO NOT DUPLICATE
Hazleton LaboratoriesAmerica, Inc.
Quality Assurance Unit
CONFIDENTIALTRADE SECRET
HAZLETON LABORATORIESAMERICA, INC.
OP-PROO. 3ATTACHMENT
PROJECT IDENTIFICATION: EPA WA-82-A155 Hazardous Waste Analysis
PROCEDURE TITLE:
DISTRIBUTION:
Name
David HillsMark W1rtz
Duties and Responsibilities of the DocumentationCustodian and Procedures for Data Assembly andFiling
Title
Section SupervisorDocumentation Custodian/Sample Custodian
Department/Cost Center No,Environmental Analysis/6004Environmental Analysis/6001
;•r•
n

JiJiJi
-OFRCIAL COPY-DO NOT DUPLICATE
Hazleton LaboratoriesAmerica, Inc.
Quality Assurance Unit
DEPARTMENT OPERATING PROCEDURECONFIDENTIALTRADE SECRET OP-PROJ. 4
PAGE 1 OF 2HAZLETON LABORATORIES 2£F;«*'Z1'«
AMERICA .INC. REPLACES: 1/3/83
DO NOT DUPLICATEPROJECT IDENTIFICATION;
PROCEDURE TITLE;
AREA OF APPLICABILITY:
EPA UA-82-A155 Hazardous Waste Analysis
Duties and Responsibilities of the Sample Custodian
Hazleton Laboratories America, Inc. .Environmental Analysis
DISTRIBUTION:
See attached 11st.PURPOSE;
To specify the duties of the sample custodian for the above-mentioned contract.PROCEDURE;
Duties and responsibilities Include:
1. Receiving samples (OP-PROJ 2).
2. Inspecting sample shipping containers for presence/absence and conditionof:2.1 Custody seals* locks, "evidence tape*, etc.2.2 Container breakage and/or container Integrity.
3. Recording condition of both shipping containers and sample containers(bottles, jars, cans, etc.) 1n log books or on appropriate forms.
4. Signing appropriate documents shipped with samples (I.e., chain of custodyrecord(s), SMO Traffic Reports, etc).
5. Verifying and recording agreement or non-agreement of Information onsample documents (I.e., sample tags, chain of custody records. TrafficReports, airbills, etc.) In log books or on appropriate forms. If there1s non-agreement, record the problems, contact the SMO for direction, andnotify appropriate laboratory personnel.
II

-OFFICIAL COPY-DO NOT DUPLICATE
Hazleton LaboratoriesAmerica, Inc.-
Quality Assurance Unit
OP-PROJ. 4CONFIDENTIALTRADE SECRET WTE. 4/21/86
HAZLETON LABORATORIES REPLACES: 1/3/33AMERICA, INC.
DO NOT DUPLICATE6. Initiating sample analysis procedures on appropriate laboratory documents
or according to laboratory stanaara operating procedures Includingestablishing case and sample files and Inventory sheets.
7. Labeling samples with HLA sample numbers.8. Securely storing samples, sample extracts* and spent samples.9. Controlling access to stored samples and assuring that KLA standard
operating procedures are followed when samples are removed from andreturned to storage (see OP-PROJ 1).
10. Assuring that sample tags are removed from sample containers and are givento the laboratory personnel for Inclusion 1n the sample case file.Missing tags are to be accounted for by putting a written memo Into thesample case file. Information from the tags should be Included 1n the
», 1f available.11. Monitoring storage conditions for proper sample preservation such as,
refrigeration temperature and prevention of cross-contamination.12. Returning snipping containers to the proper sampling teams.
APPROVED BY:
REVIEWED BY:
Man* Mlrtz '7^Environmental Analysis^
C.
DATE
DATEDavid HillsProject Leader
DATE)ebra Curley ArndtManager, Quality Assurance Unit
(0726E)

Jt*
J
I
I
t
-OFFICIAL COPY-DO NOT DUPLICATE
Haziston LaboratoriesAmerica, Inc.
Quality Assurance Unit
CONFIDENTIALTRADE SECRET
HAZLETON LABORATORIESAMERICA, INC.
OP-PROJ. 4ATTACHMENT
PROJECT IDENTIFICATION: EPA WA-82-A155 Hazardous Waste Analysis
PROCEDURE TITLE:
DISTRIBUTION:
NameDavid HillsMark W1rtz
Duties and Responsibilities of the Sample Custodian
TitleSection SupervisorDocumentation Custodian/Sample Custodian
Department/Cost Center No,Environmental Analysis/6004
Environmental Analysis/6001


APPENDIX F
DOCUMENT CONTROL AND THE EVIDENTARY FILESYSTEM FOR WHEELER PIT RI/FS

APPENDIX FDOCUMENT CONTROL AND THE EVIDENTIARY FILE
SYSTEM FOR WHEELER PIT SITE RI/FS
ACCOUNTABLE DOCUMENTS
Accountable documents will Include all logbooks, field data records,correspondence, sample tags, graphs, cha1n-of-custody records, and othersample documentation forms used, original data Including laboratory benchsheets, photographic prints and planning documents.
FILE STRUCTURE
Documents will be arranged 1n the evidentiary file using the format specified1n Table 1 (attached).
LOGGING OF DOCUMENTS
Documents will be received by the Document Control Officer who will log themand assign a number to each such that documents within each document subclassare separately serialized. An exception to this will be sample tags, chaln-of-custody forms or other documents that are numbered prior to assignment foruse*
DOCUMENT ACCESS
Project documents will be secured 1n a separate, locked file cabinet. Accesswill be limited by the Document Control Officer to project personnel. Acheck-out log will be maintained as a record of access.
EVIDENCE FILE AUDIT
Upon project completion, the Warzyn Quality Assurance Officer will audit theevidence file for completeness. Results of the audit will be documented onthe attached form and kept 1n the Final Evidence file.
FINAL DISPOSITION OF FILE CONTENTS
The Final Evidence file will be maintained by Warzyn as described 1n SectionXX., Record Preservation, of the Consent Order. The file will be maintainedduring the pendancy of the Consent Order and for a minimum of four years afterIts termination.

February 17, 1988 - 2 - 13256.60
TABLE 1
DOCUMENT CLASSES AND STRUCTUREFOR SUPERFUND EVIDENTIARY FILES
DocumentClasses File
File Index
Contracts/Proposals/Bids A
Financial B
Correspondence
Contents
Work PlanDocuments
Check out logs and 11st ofactive files
Proposals, contracts, purchaseorders, spec1f1cat1ons-COPIES ONLY
Summary of Invoice status; Invoicescorrespondence re: accountsreceivable; copy of budget andproject task setup; COPIES ONLY
Various Incoming and outgoingletters, memorandums, diary notesCl-In-house correspondence;diary notes and memos
C2-Outgo1ng letters/meroos
C3-Incom1ng correspondence
C4-Correspondence logged
Documents other than proposals; IncludingHealth and Safety plans, Samplingplans, QAPPs, permit plans; specialInstructions/outlines for conductingthe project; Work Plans; WEI plansand specifications

February 17, 1988
QA File
Field Data
Laboratory Data
- 3 - 13256.60
QA Work Plan and budget; projecthistory file; sample documentationrecords, etc.El-Sample tags
E2-Cha1n-of-Custody Records
E3-Rece1pt of Samples forms
E4-Transfer of Samples forms
Original field data/notebooks
Fl-Fleld boring logs
F2-Well construction details
F3-Geotechn1cal testing
F4-Geophys1cal testing
F5-Water Quality testing
F6-Da11y field logs
F7-Ba1ldown testing
FS-Structural testing
F9-M1seel 1aneous/Other
Laboratory test data, Includingoriginal analytical logbooks, labdata, calculations, bench records,graphs, etc. for original data andquality control dataGl-Analyt1cal laboratory data
G2-Geotechn1cal laboratory data
G3-Mater1als testing laboratory data
G4-Subcontracted laboratory data

February 17, 1988
Calculations H
Photographs I
Originals J
Warzyn Reports K
Warzyn Drawings L
Other Reports/Drawings
Miscellaneous
Checkprlnt
- 4 - 13256.60
Calculations, quantity estimates,computer printouts of tabularlzeddata
Photographs, stereo pairs, site maps(published zoning, topography,geology, groundwater, bedrock,negatives)
Warzyn original reports or drafts
Copies of the project report orprevious pertinent WEI reports
Reference list of report drawings;copies or reduced copies oforiginal drawings. Note: originalor reduced mylars will be storedseparatelyNon-Warzyn reports and drawingsIncluding literature, references,etc.
Other file Information which doesnot fit Into other categories; filemust be namedTEMPORARY FILE of checkprlnts, draftreports or other work In progress. Filemust be removed upon job completion.
12660.00RCW/Jpl/JAH[Jpl-601-54e]
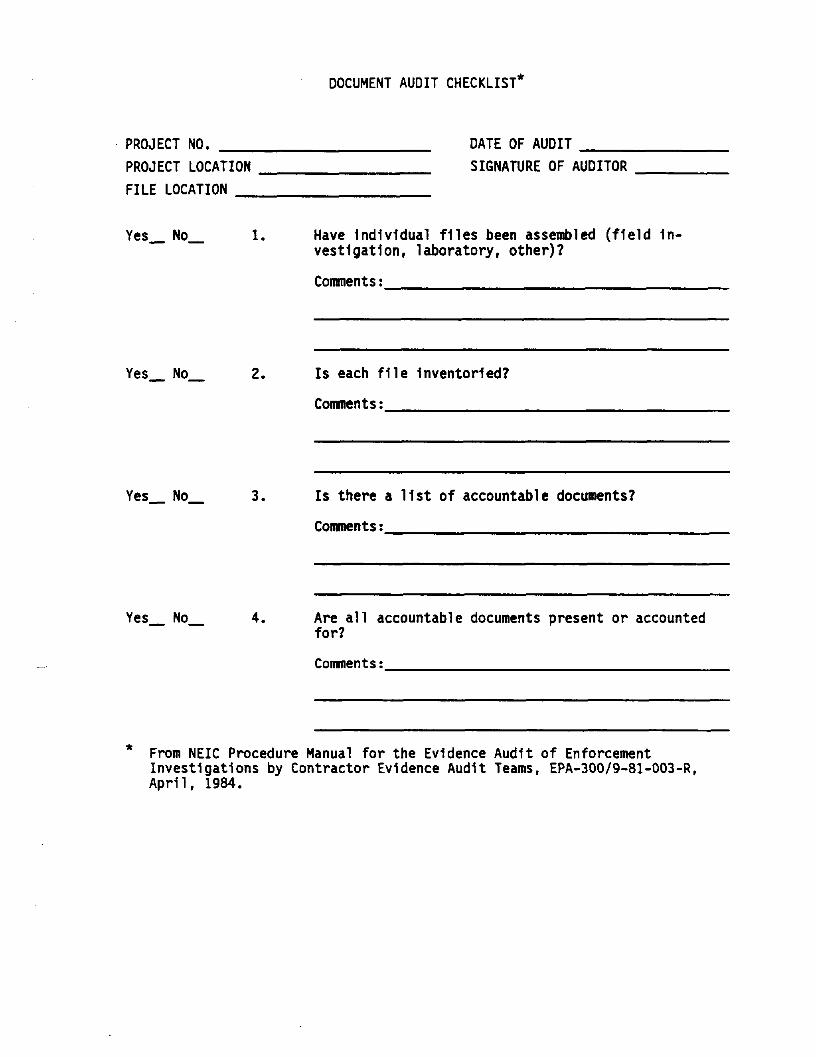
DOCUMENT AUDIT CHECKLIST"
PROJECT NO.PROJECT LOCATIONFILE LOCATION
DATE OF AUDITSIGNATURE OF AUDITOR
Yes No 1. Have Individual files been assembled (field In-vestigation, laboratory, other)?
Comments:_______________________
Yes No 2. Is each file Inventoried?
Comments:_____ ____
Yes No 3. Is there a 11st of accountable documents?
Comments:_____ ____ _________
Yes No 4. Are all accountable documents present or accountedfor?
Comments: __________________________
From NEIC Procedure Manual for the Evidence Audit of EnforcementInvestigations by Contractor Evidence Audit Teams, EPA-300/9-81-003-R,April, 1984.
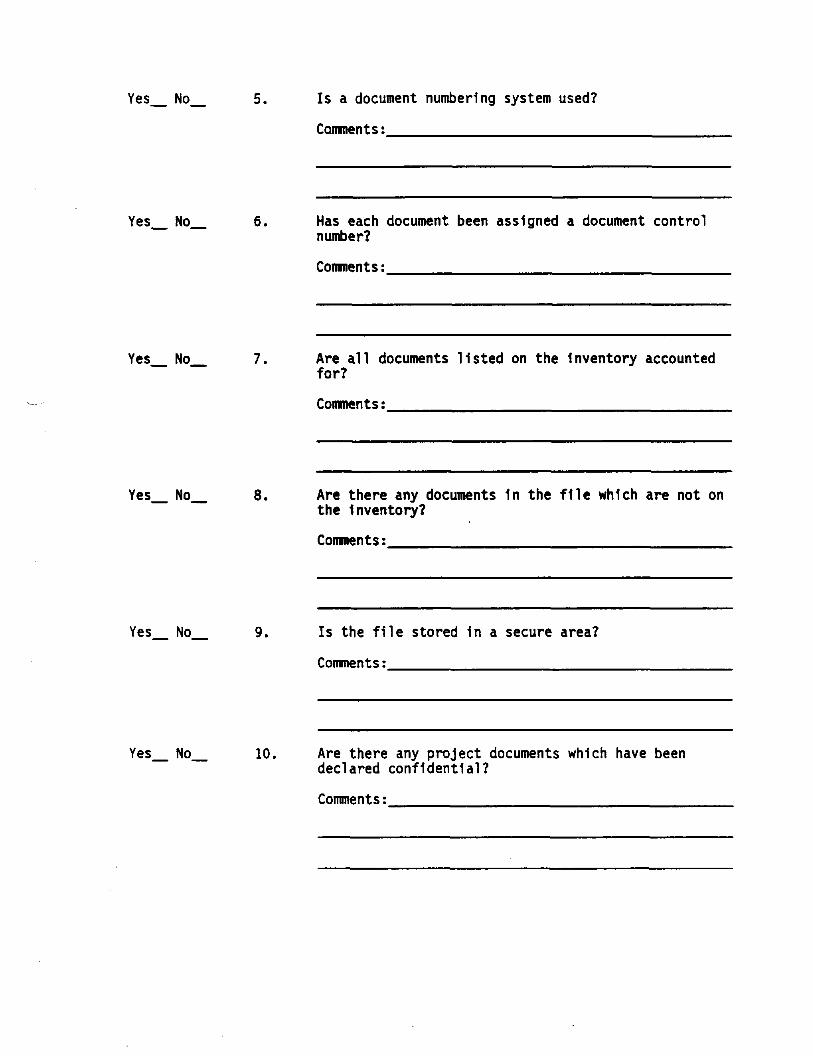
Yes_ No_ 5. Is a document numbering system used?
Comments:_________________
Yes_ No_ 6. Has each document been assigned a document controlnumber?
Comments:__________________________
Yes_ No_ 7. Are all documents listed on the Inventory accountedfor?
Comments:__________________________
Yes_ No_ 8. Are there any documents 1n the file which are not onthe Inventory?
Comments:____________________________
Yes_ No_ 9. Is the file stored 1n a secure area?
Comments:___________________
Yes_ No_ 10. Are there any project documents which have beendeclared confidential?
Comments:_________________________

Yes_ No_ 11. Are confidential documents stored In a secure areaseparate from other project documents?
Comments:__________________________
Yes_ No_ 12. Is access to confidential files restricted?
Comments:_____________________
Yes_ No_ 13. Have confidential documents been marked or stamped"Confidential"?
Comments:__________________________
Yes_ No_ 14. Is confidential Information Inventoried?
Comments:___________________
Yes_ No_ 15. Is confidential Information numbered for documentcontrol?
Comments:____ ___________________
Yes_ No_ 16. Have any documents been claimed confidential underTSCA?
Comments:___________________________
[jpl-601-54e]