
Volume XI Issue 8 (46)Winter 2016 - CESMAA
107
Volume XI Issue 8 (46) Winter 2016 ISSN-L 1843 - 6110 ISSN 2393 - 5162
-
Upload
khangminh22 -
Category
Documents
-
view
1 -
download
0
Transcript of Volume XI Issue 8 (46)Winter 2016 - CESMAA

1511
Volume XI Issue 8 (46) Winter 2016
ISSN-L 1843 - 6110 ISSN 2393 - 5162

Editorial Board
Editor in Chief
PhD Professor Laura GAVRILĂ (formerly ŞTEFĂNESCU)
Managing Editor PhD Associate Professor Mădălina CONSTANTINESCU
Executive Editor PhD Professor Ion Viorel MATEI
International Relations Responsible PhD Pompiliu CONSTANTINESCU
Proof – readers PhD Ana-Maria TRANTESCU – English
Redactors PhD Cristiana BOGDĂNOIU PhD Sorin DINCĂ PhD Loredana VĂCĂRESCU-HOBEANU
European Research Center of Managerial Studies in Business Administration http://www.cesmaa.eu Email: [email protected] Web: http://cesmaa.eu/journals/jaes/index.php

1513
Editorial Advisory Board
Claudiu ALBULESCU, University of Poitiers, France, West University of Timişoara, Romania Aleksander ARISTOVNIK, Faculty of Administration, University of Ljubljana, Slovenia Muhammad AZAM, School of Economics, Finance & Banking, College of Business, Universiti Utara, Malaysia Cristina BARBU, Spiru Haret University, Romania Christoph BARMEYER, Universität Passau, Germany Amelia BĂDICĂ, University of Craiova, Romania Gheorghe BICĂ, Spiru Haret University, Romania Ana BOBÎRCĂ, Academy of Economic Science, Romania Anca Mădălina BOGDAN, Spiru Haret University, Romania Giacommo di FOGGIA, University of Milano-Bicocca, Italy Jean-Paul GAERTNER, l'Institut Européen d'Etudes Commerciales Supérieures, France Shankar GARGH, Editor in Chief of Advanced in Management, India Emil GHIŢĂ, Spiru Haret University, Romania Dragoş ILIE, Spiru Haret University, Romania Cornel IONESCU, Institute of National Economy, Romanian Academy Elena DOVAL, Spiru Haret University, Romania Camelia DRAGOMIR, Spiru Haret University, Romania Arvi KUURA, Pärnu College, University of Tartu, Estonia Rajmund MIRDALA, Faculty of Economics, Technical University of Košice, Slovakia Piotr MISZTAL, Technical University of Radom, Economic Department, Poland Simona MOISE, Spiru Haret University, Romania Mihail Cristian NEGULESCU, Spiru Haret University, Romania Marco NOVARESE, University of Piemonte Orientale, Italy
Rajesh PILLANIA, Management Development Institute, India Russell PITTMAN, International Technical Assistance Economic Analysis Group Antitrust Division, USA Kreitz RACHEL PRICE, l'Institut Européen d'Etudes Commerciales Supérieures, France Mohammad TARIQ INTEZAR, College of Business Administration Prince Sattam bin Abdul Aziz University (PSAU), Saudi Arabia Andy ŞTEFĂNESCU, University of Craiova, Romania Laura UNGUREANU, Spiru Haret University, Romania Hans-Jürgen WEIßBACH, University of Applied Sciences - Frankfurt am Main, Germany

Journal of Applied Economic Sciences
Journal of Applied Economic Sciences is a young economics and interdisciplinary research journal, aimed
to publish articles and papers that should contribute to the development of both the theory and practice in the field
of Economic Sciences.
The journal seeks to promote the best papers and researches in management, finance, accounting,
marketing, informatics, decision/making theory, mathematical modelling, expert systems, decision system
support, and knowledge representation. This topic may include the fields indicated above but are not limited to these.
Journal of Applied Economic Sciences be appeals for experienced and junior researchers, who are
interested in one or more of the diverse areas covered by the journal. It is currently published quarterly in 2
Issues in Spring (30th March), Summer (30th June), Fall (30th September) and Winter (30th December).
Journal of Applied Economic Sciences is indexed in SCOPUS www.scopus.com, CEEOL www.ceeol.org,
EBSCO www.ebsco.com, and RePEc www.repec.org databases.
The journal will be available on-line and will be also being distributed to several universities, research
institutes and libraries in Romania and abroad. To subscribe to this journal and receive the on-line/printed
version, please send a request directly to [email protected].
1515
Journal of Applied Economic Sciences ISSN-L 1843 - 6110 ISSN 2393 – 5162
Table of Contents
Leonid Nachimovich YASNITSKY Technique of Design for Integrated Economic and Mathematical Model for Mass Appraisal of Real Estate Property. Study Case of Yekaterinburg Housing Market 1519
Gheorghiţă DINCĂ, Marius Sorin DINCĂ, Maria Letiţia ANDRONIC, Ioan Bogdan ROBU The Impact of Electoral Cycle Upon Local Public Expenditures in Case of Romanian Municipalities 1531
Nadezhda A. SEREBRYAKOVA, Natalya V. DOROKHOVA, Ekaterina S. DASHKOVA, Mikhail I. ISAENKO Directions of Transformation of Labor Relations in the Modern Conditions 1542
SUMARYOTO The Influence of Regional Revenue on Government Investment and Its Implication to the Regional Economic Growth 1552
Nataliia SIMCHENKO, Svetlana TSOHLA, Iryna PODSMASHNAYA Application of the Analytic Hierarchy Process to Structure the Motivational Expectations of the Economically Active Population of the Republic of Crimea 1569
Silvia MEGYESIOVA, Vanda LIESKOVSKA Development of the Socio-Economic Characteristics and Standardised Death Rates of the European Union Member States 1581
Ugryumov Yevgeny ALEKSANDROVICH, Shindina Tatyana ALEKSANDROVNA Intellectual Data Analysis of Production Profitability Influence on the Competitiveness of Construction Enterprises 1594
Júlia ĎURČOVÁ, Rajmund MIRDALA Offshoring Intensities and Skill Upgrading of Employment in the Slovak Republic 1600
Mikhail Evgenievich KOSOV, Ravil Gabdullaevich AKHMADEEV, Olga Alekseevna BYKANOVA, Vladimir Sergeevich OSIPOV, Ksenia Valerievna EKIMOVA, Svetlana Viktorovna FRUMINA Economic Practicability Substantiation of Financial Instrument Choice 1613
2
1
3
4
5
6
7
8
7
9 9

Konstantin ASATUROV Time-Varying Beta of Russian Companies 1624
Giacomo Di FOGGIA Infrastructure-Driven Development Policies: An Empirical Impact Analysis 1642
Yulia Mikhailovna GRUZINA, Aleksandr Alikirimovich ZEINALOV, Natalia Dmitrievna ILIENKOVA, Dmitrii Arkadievich ILIENKOV Crowdinvesting as a Perspective Instrument of Financing Small and Middle-Sized Businesses in the Russian Federation 1650
Sergey Vsevolodovich SHKODINSKY, Igor Anatolyevich PRODCHENKO Methodological Approaches to Assessment for the Economic Effects of the State’s Participation in Integration Processes 1661
Aekkachai NITTAYAGASETWA, Jiroj BURANASIRI Performance Comparison Between Real Estate Securities and Real Estate Investment using Stochastic Dominance and Mean –Variance Analysis 1673
Yuliya Pavlovna SOBOLEVA, Inna Grigorievna PARSHUTINA, Irina Evgenjevna VORONKOVA, Olga Aleksandrovna SHAPOROVA Managing Regional Consumer Market Based on the Improved Approach to Evaluating Customer Needs for Food Commodities 1681
Erik ŠOLTÉS, Tatiana ŠOLTÉSOVÁ, Tatiana HRIVÍKOVÁ Spatial Analysis of Income Poverty and Social Exclusion in European Union - 28 in 2014 1692
Yuriy S. KOLESNIKOV, Zhenny D. DARMILOVA Archaic Forms of Economic Activity in Peripheral Regions and Problems of Systematic Structural Reforms of the Russian Economy 1708
FAISAL, M. Shabri Abd. MAJID Re-Examination of Calendar Anomalies in the Indonesian Stock Market 1714
18
13
12
11
10
14
15
16
17
10
11

1517
L Anna A. MIKHAYLOVA
The Role of Human Capital in Providing Innovation Security of the Region 1724
Said Zamin SHAH, Ahmad Zubaidi BAHARUMSHAH The Time-Varying Correlation Between Macroeconomic Uncertainty Inflation and Output Growth: Evidence From AR(p) - EGARCH Model for Sri Lanka 1736
Andrey P. KLEMESHEV, Tatyana Yu. KUZNETSOVA, Gennady M. FEDOROV Population Dynamics: Geographical Differences in Countries of the Baltic Sea Region 1750
Olga V. KARSUNTSEVA Forecast of Development of the Russian Machine-Building Complex in the Context of Unstable Economic Environment 1761
Irina RODIONOVA, Tatiana KOKUYTSEVA, Alexandr SEMENOV Features of Migration Processes in Different World Industries in the Second Half of XX Century 1769
Alexander CHURSIN, Andrey TYULIN, Alexander YUDIN The Model of Risk Assessment in the Management of Company's Competitiveness 1781
???? a Adriana DUCOVA
Selected Determinants of Quality of Life and Their Implications for Health System 1791
20
21
22
23
24
25
19 19


Journal of Applied Economic Sciences
Technique of Design for Integrated Economic and Mathematical Model for Mass Appraisal of Real Estate Property. Study Case of Yekaterinburg Housing Market
Leonid Nachimovich YASNITSKY
National Research University Higher School of Economics, Russia1 [email protected]
Vitaliy Leonidovich YASNITSKY National Research University Higher School of Economics, Russia
Abstract:
There are a number of economic and mathematical models designed for mass appraisal of residential real estate at the moment, which take into account their construction and performance characteristics but do not take into account the evolving macroeconomic situation in the country and in the world. The drawback of such static models is their rapid obsolescence, the need for constant updating and unsuitability for medium-term forecasting. On the other hand, there are dynamic models that take into account the current macroeconomic situation but are designed for predicting and studying the overall price situation on the market rather than for mass appraisal of real estate with their variety of construction and performance characteristics.
This paper proposes a technique of creating integrated models with properties of such static and dynamic models, i.e. taking into account both construction and performance characteristics of residential facilities and evolving macroeconomic situation in the country and in the world. Development of the technique and creation of models is carried out with the use of neural network technology on the basis of statistical data for the period from 2006 to 2016. In addition to its main purpose – the mass appraisal of urban apartments, the model is suitable for medium-term forecasting and identification of the patterns of the housing market. For example, the model was used to study the effect of the state financial policy on the housing market in Yekaterinburg. Computer experiments have shown that in case of growth in housing lending, the apartment prices will rise, and the rate of growth of luxury apartments with larger area will be about 2.2 times higher than the growth rate of cheaper apartments with smaller area. It was found that an increase in housing construction in Yekaterinburg up to 2,550 thous. sq.m. would lead to a further increase in value of apartments. However, with the increase in new housing above the 2,550 thous. sq.m. mark, the model predicts market saturation, prices growth cessation and their further decline. Similar studies and forecasts can be made for the real estate market in other countries and cities using the proposed technique.
Keywords: regional real estate market, mass appraisal, macroeconomic indicators, appraisal, forecasting, neural network.
JEL Classification: L70, L74, O12.
Introduction According to the analysis of the literature, there are a lot of papers that note the importance and relevance
of designing precise techniques of mass appraisal of real estate. For example, the paper (Hefferan and Boyd, 2010) provides an overview of the international literature, as well as interviews with government officials and appraisers from many countries, from which it follows that the systems of mass appraisal and property taxation are "an important and solid basis for increasing state revenues." The paper (Davis et al. 2012) notes that the existing property appraisal systems based on economic and mathematical models are "a useful tool for tax computation in a number of developing and emerging countries. The paper (Manganelli et al. 2014) reports that such models are "useful in the field of taxation and in supporting decision making in the planning of territorial transformations."
Reports of successful attempts to create systems of mass appraisal of real estate property on the basis of the new mathematical tool – neural networks – emerge in Western literature in the 1990s. Apparently, one of the first studies in this direction could be the 1991 publication of Tay and Ho (1991), who applied the multilayer perceptron trained by back propagation to determine the market price of real estate property in Taiwan. It was an alternative to the method of multivariate regression.
Evans, James and Collins (1991) used neural networks to appraise the residential property in England and Wales in the same year. As a result, they concluded that "the neural network model is best for appraisal of real estate."
1 Russia, 614070, c. Perm, Studencheskaya Street, 38
Volume XI, Issue 8 (46) Winter 2016
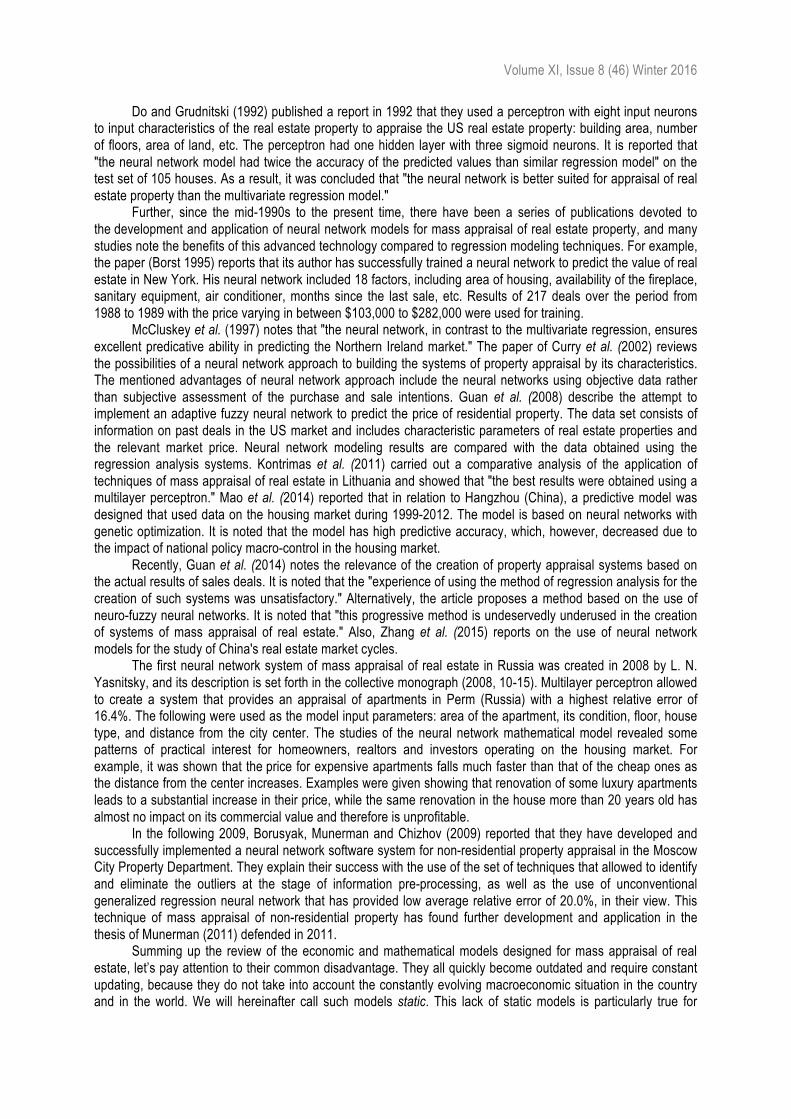
Do and Grudnitski (1992) published a report in 1992 that they used a perceptron with eight input neurons to input characteristics of the real estate property to appraise the US real estate property: building area, number of floors, area of land, etc. The perceptron had one hidden layer with three sigmoid neurons. It is reported that "the neural network model had twice the accuracy of the predicted values than similar regression model" on the test set of 105 houses. As a result, it was concluded that "the neural network is better suited for appraisal of real estate property than the multivariate regression model."
Further, since the mid-1990s to the present time, there have been a series of publications devoted to the development and application of neural network models for mass appraisal of real estate property, and many studies note the benefits of this advanced technology compared to regression modeling techniques. For example, the paper (Borst 1995) reports that its author has successfully trained a neural network to predict the value of real estate in New York. His neural network included 18 factors, including area of housing, availability of the fireplace, sanitary equipment, air conditioner, months since the last sale, etc. Results of 217 deals over the period from 1988 to 1989 with the price varying in between $103,000 to $282,000 were used for training.
McCluskey et al. (1997) notes that "the neural network, in contrast to the multivariate regression, ensures excellent predicative ability in predicting the Northern Ireland market." The paper of Curry et al. (2002) reviews the possibilities of a neural network approach to building the systems of property appraisal by its characteristics. The mentioned advantages of neural network approach include the neural networks using objective data rather than subjective assessment of the purchase and sale intentions. Guan et al. (2008) describe the attempt to implement an adaptive fuzzy neural network to predict the price of residential property. The data set consists of information on past deals in the US market and includes characteristic parameters of real estate properties and the relevant market price. Neural network modeling results are compared with the data obtained using the regression analysis systems. Kontrimas et al. (2011) carried out a comparative analysis of the application of techniques of mass appraisal of real estate in Lithuania and showed that "the best results were obtained using a multilayer perceptron." Mao et al. (2014) reported that in relation to Hangzhou (China), a predictive model was designed that used data on the housing market during 1999-2012. The model is based on neural networks with genetic optimization. It is noted that the model has high predictive accuracy, which, however, decreased due to the impact of national policy macro-control in the housing market.
Recently, Guan et al. (2014) notes the relevance of the creation of property appraisal systems based on the actual results of sales deals. It is noted that the "experience of using the method of regression analysis for the creation of such systems was unsatisfactory." Alternatively, the article proposes a method based on the use of neuro-fuzzy neural networks. It is noted that "this progressive method is undeservedly underused in the creation of systems of mass appraisal of real estate." Also, Zhang et al. (2015) reports on the use of neural network models for the study of China's real estate market cycles.
The first neural network system of mass appraisal of real estate in Russia was created in 2008 by L. N. Yasnitsky, and its description is set forth in the collective monograph (2008, 10-15). Multilayer perceptron allowed to create a system that provides an appraisal of apartments in Perm (Russia) with a highest relative error of 16.4%. The following were used as the model input parameters: area of the apartment, its condition, floor, house type, and distance from the city center. The studies of the neural network mathematical model revealed some patterns of practical interest for homeowners, realtors and investors operating on the housing market. For example, it was shown that the price for expensive apartments falls much faster than that of the cheap ones as the distance from the center increases. Examples were given showing that renovation of some luxury apartments leads to a substantial increase in their price, while the same renovation in the house more than 20 years old has almost no impact on its commercial value and therefore is unprofitable.
In the following 2009, Borusyak, Munerman and Chizhov (2009) reported that they have developed and successfully implemented a neural network software system for non-residential property appraisal in the Moscow City Property Department. They explain their success with the use of the set of techniques that allowed to identify and eliminate the outliers at the stage of information pre-processing, as well as the use of unconventional generalized regression neural network that has provided low average relative error of 20.0%, in their view. This technique of mass appraisal of non-residential property has found further development and application in the thesis of Munerman (2011) defended in 2011.
Summing up the review of the economic and mathematical models designed for mass appraisal of real estate, let’s pay attention to their common disadvantage. They all quickly become outdated and require constant updating, because they do not take into account the constantly evolving macroeconomic situation in the country and in the world. We will hereinafter call such models static. This lack of static models is particularly true for

Journal of Applied Economic Sciences
Russia and a number of countries, the market of which is under development and is therefore dependent on the evolving macroeconomic factors: oil prices, dollar rate, gross domestic product (GDP), stock indices, states policies, etc.
It should nevertheless be noted that there is a series of works devoted to the creation of economic and mathematical models that do take into account these macroeconomic parameters, but are designed only for modeling and studying the dynamics of the real estate market, rather than for the purpose of mass appraisal. We call such models dynamic. For example, in their paper Becker et al. (1999) have used such macroeconomic factors as inflation, economic growth, GDP, unemployment, etc. in the study of the dynamics of the real estate market. Links between macroeconomic indicators and the behavior of the real estate market were investigated in the paper of Greenwood et al. (1991).
Nevertheless, in spite of the fundamental nature of these studies, we must note once again that the dynamic models are designed primarily for the study of the dynamics of the market as a whole, rather than for mass appraisal of specific properties. Indices of value of apartments calculated in such models (average unit costs of apartments normalized to a square meter) can of course be translated into the cost of specific apartments based on their construction, operational, environmental and other parameters. However, such conversion can be done only using additional techniques, which are not usually used for the purposes of mass appraisal of real estate because of their inefficiency. The problem is that the unit price of apartments of the same type located in the same area, or even in the same building, may differ from each other. Therefore, it requires the use of a more differentiated approach.
Thus, on the one hand, we have a number of static models designed for mass appraisal of real estate property, which take into account their construction, operational, geographical, environmental, climatic, economic characteristics, but do not take into account the evolving macroeconomic situation in the country and the world, and therefore quickly becoming outdated, requiring constant updating and not suitable for medium-term forecasting. On the other hand, there are dynamic models that take into account the overall state of the economy but are designed to predict and study the overall price situation in the real estate market, rather than for mass appraisal of individual residential units. In this regard, the aim of this paper is to develop the technique of creating integrated neural network economic and mathematical models that have properties of static and dynamic models described above, i.e. taking into account both construction and performance characteristics and evolving macroeconomic situation in the country and in the world. The development of the technique and creation of the model is carried out by the example of the residential real estate market of Yekaterinburg, which refers to the developed cluster of Russian cities with the highest incomes and relatively high prices on the housing market.

Volume XI, Issue 8 (46) Winter 2016
Concluding remarks Thus, an integrated economic and mathematical model of mass appraisal of residential real estate in
Yekaterinburg was created, taking into account both construction and performance parameters of apartments and the evolving economic situation in the country and the world. In contrast to the static economic and mathematical models that take into account only construction and performance parameters, the developed model does not require frequent updating and is also suitable for medium-term forecasting of the behavior of the real estate market in order to extract useful knowledge.
The developed integrated model has allowed us to conduct research of the residential real estate market in Yekaterinburg, identify patterns and perform some forecasts, the most interesting of which are the onset of market saturation effect with the increasing housing construction (Figure 10) and the effects of the increase in mortgage lending volumes (Figure 9).
In conclusion, we shall note that the proposed technique was demonstrated by the example of appraisal and prediction of the residential real estate market of Yekaterinburg, which refers to the developed cluster of Russian cities with the highest incomes and relatively high prices on the housing market. Similar studies and forecasts using the proposed technique can be made for other countries and cities. References [1] Becker, С., and Morrison, A.R. (1999). Urbanization in Transforming Economies. Handbook of Regional and
Urban Economics, 3: 1673–1790. [2] Borst, R. A. (1995). Artificial Neural Networks in Mass Appraisal. Journal of Property Tax Assessment &
Administration, 1(2): 5–15. [3] Borusyak, K. K., Munerman, I. V., and Chizhov S. S. (2009). Neyrosetevoye modelirovaniye v zadache
massovoy otsenki nezhiloy nedvizhimosti g. Moskvy [Neural Network Modeling in the Problem of Mass Appraisal of Non-residential Real Estate in Moscow]. Economic Science of Modern Russia, 4: 86-98.
[4] Curry, B., Morgan, P., Silver, M. (2002). Neural Networks and Non-linear Statistical Methods: An Application to the Modelling of Price-quality Relationships. Computers and Operations Research, 29(8): 951–969.
[5] Davis, P., McCluskey, W., Grissom, T.V., and McCord, M. (2012). An Empirical Analysis of Simplified Valuation Approaches for Residential Property Tax Purposes. Property Management, 30(3): 232–254.
[6] Do, A. Q., and Grudnitski, G. A. (1992). Neural Network Approach to Residential Property Appraisal. The Real Estate Appraiser, 58: 38–45.
[7] Evans, A., James, H., and Collins, A. (1991). Artificial Neural Networks: An Application to Residential Valuation in the UK. Journal of Property Valuation and Investment, 11(2): 195–204.
[8] Greenwood J., and Hercowitz, Z. (1991). The Allocation of Capital and Time Over the Business Cycle. Journal of Political Economy, 99: 1188–1214.
[9] Guan, J., Shi, D., Zurada, J. M., and Levitan, A. S. (2014). Analyzing Massive Data Sets: An Adaptive Fuzzy Neural Approach for Prediction, with a Real Estate Illustration. Journal of Organizational Computing and Electronic Commerce, 24(1): 94–112.
[10] Guan, J., Zurada, J., and Levitan, A. S. (2008). An Adaptive Neuro-fuzzy Inference System Based Approach to Real Estate Property Assessment. Journal of Real Estate Research, 30(4): 395–422.
[11] Hefferan, M. J. and Boyd, T. (2010). Property Taxation and Mass Appraisal Valuations in Australia - Adapting to a New Environment. Property Management, 28(3): 149–162.
[12] Kontrimas, V., and Verikas, A. (2011). The Mass Appraisal of the Real Estate by Computational Intelligence. Applied Soft Computing Journal, 11(1): 443–448.
[13] Manganelli, B., Pontrandolfim, P., Azzato, A., and Murgante, B. (2014). Using Geographically Weighted Regression for Housing Market Segmentation. International Journal of Business Intelligence and Data Mining, 9(2): 161–177.

Journal of Applied Economic Sciences
[14] Mao, Y. H., Zhang, M. B., and Hangzhou Yao, N. B. (2014). Housing Demand Forecasting Model Based on BP Neural Network of Genetic Algorithm Optimization (Conference Paper). Applied Mechanics and Materials, 587-589: 37–41.
[15] McCluskey, W. J., Dyson, K., McFall, D., and Anand, S. (1997). The Mass Appraisal of Residential Property in Northern Ireland. In W. J. McCluskey, and A. Adair (Eds.), Computer Assisted Mass Appraisal Systems. London: Gower Publishers, 59–77.
[16] Munerman, I. V. (2011). Neyro-nechetkiye modeli i instrumenty dlya regionalnogo upravleniya obyektami kommercheskoy nedvizhimosti [Neuro-fuzzy Models and Tools for Regional Management of Commercial Real Estate Entities], Thesis of candidate of econsciences. Gubkin Russian State University of Oil and Gas, Moscow, 56.
[17] Tay, D. P., and Ho, D. K. (1991). Artificial Intelligence and the Mass Appraisal of Residential Apartments. Journal of Property Valuation and Investment, 10 (2): 525–540.
[18] Yasnitsky, L. N., Bondar, V. V., and Burdin S. N. et al. (2008). Permskaya nauchnaya shkola iskusstvennogo intellekta i yeye innovatsionnyye proyekty [Perm Scientific School of Artificial Intelligence and Its Innovative Projects]. Moscow-Izhevsk: Scientific Publishing Center "Regular and Chaotic Dynamics", 75.
[19] Yasnitsky, L. N. (2005). Vvedeniye v iskusstvennyy intellekt [Introduction to Artificial Intelligence]. Moscow: Publishing center "Academy", 176.
[20] Zhang, H., Gao, S., Seiler, M. J., and Zhang, Y. (2015). Identification of Real Estate Cycles in China Based on Artificial Neural Networks. Journal of Real Estate Literature, 23 (1): 67–83.

Volume XI, Issue 8 (46) Winter 2016
The Impact of Electoral Cycle Upon Local Public Expenditures in Case of Romanian Municipalities
Gheorghiţă DINCĂ
Transilvania University of Brasov2, Romania [email protected]
Marius Sorin DINCĂ Transilvania University of Brasov, Romania
Maria Letiţia ANDRONIC Transilvania University of Brasov, Romania
Ioan Bogdan ROBU University of Iasi3, Romania
[email protected] Abstract:
This paper addresses the link between level and structure of Romanian local government expenditures and electoral cycle, as well as spending interactions among Romanian municipalities. We have obtained the research results using general linear models with cross fixed-effects and time fixed-effects. We have also included mayors’ political affiliation and some socio-economic factors in the proposed models. We have noticed increased public spending during election years, preceded and respectively followed by decreased spending in pre- and post-election years. Others findings revealed that mayors’ political affiliation, other local administrative units’ public spending policies and some socio-economic factors have had a significant influence upon Romanian municipalities’ public expenditures.
Keywords: public interest, local public expenditures, electoral cycle, local spending externalities, mayors’ political affiliation.
JEL Classification: C31, C58, H72.
Introduction The public spending – electoral cycle relationship is a continuous subject of research, given that previous
studies demonstrated both positive and negative inter-correlations. The allocation and use of public funds at central and local levels are a major concern for the public at large and individual researchers, as well as for politicians. The ongoing debate over the size, structure and efficiency of central and local government spending intensifies in the pre-election and election years. Taxation and resource distribution at a certain administrative level generate externalities upon other local jurisdictions.
The query we intend to answer is whether electoral cycle and mayors’ political affiliation have influenced Romanian municipalities’ public spending level. We have used a general linear model on a sample of 38 municipalities having a population of more than 50,000 inhabitants (excluding Bucharest Municipality) over a period of 14 years (1999-2012). To our knowledge, this is the first study ever done for Romania concerning the relationship between electoral cycle’s phases and local expenditures, hereby contributing to the field literature.
Besides the introduction part, the paper is structured in five more sections. In section two we review the local government spending and electoral cycle concepts, in section three we introduce the Romanian local government sector’s institutional structure, in section four we address research design and empirical models, in section five we are presenting the main results of our analysis, while section six concludes.
2 1 Colina Universitătii Street, Alexandru Ioan Cuza 3 22 Carol I Street

Journal of Applied Economic Sciences
Conclusion As we proved in this article, the motivation for our research was related to several aspects. Firstly, we
have tested the general perception that Romanian local elections where more or less influenced by precedent and election years’ local public expenditures increases, either investment-oriented (usually for right-wing affiliated mayors) or socially-oriented (usually for left-wing affiliated mayors). Secondly, we consider this study important as it can assist Romanian voters in exerting their constitutional right with a better knowledge about the interests and motivations behind the actions of former and current mayors. Thirdly, the results can be of interest to local and foreign investors, as they can identify patterns of increase or decrease for public investments/consumption during different phases of the electoral cycles and have a better planning of their activity/investments.
Our paper has explored possible correlations between local public expenditures and the electoral cycle, as well as externalities generated by one public local administration’s spending policy upon other administrations. Other researchers’ findings confirm the existence of a connection between (local) public expenditures and political elections, generally for unconsolidated democracies. In what concerns the modification of public expenditures’ structure according to electoral cycle, the results are notably different, with investment spending perceived as having the biggest electoral impact. The results generated allowed us to reach the objectives of our study. As such we have estimated and tested the influence of determining factors during various electoral phases of the 1990-2012 period upon Romanian municipalities’ local public expenditures.
The ANOVA method allowed testing for the existence of significant differences in TE’s level over time. Subsequently, based on the general linear model, we have estimated and tested factors’ influences upon TE’s, for different electoral cycle’s phases and according to mayor’s political affiliation.
One important result indicates a significant influence of precedent year’s local public expenditures (indiscriminate of mayor’s political affiliation) as well as of the other municipalities’ expenditures (AE). Also, we have found that AE’s influence upon TE differs over time, according to electoral cycles’ phases, being especially visible during the pre-election year, election year and post-election first year.
At the same time, we have discovered that unemployment rate determines an increase of local public expenditures, especially due to social security expenditures. The increased population density generates a decrease of the TE, as public utility expenditures do not increase at the same rate with population increase. This is normal due to the economies of scale.
The mayors’ political affiliation revealed that the right-winged affiliation supports local public expenditures’ increase (especially new public investments or continuing previously started ones) as compared to the left-wing mayors. Inclusion of fixed time-effects and cross-municipalities’ effects revealed that right-winged affiliated mayors sometimes determined the decrease of local public expenditures (probably decreasing social protection expenditures.
The decentralization process started in Romania in 1998 has determined the transfer of certain responsibilities to local authorities with an obvious impact upon the local public expenditures’ increase. The process has not yet resulted into a real democratization of the allocation and spending process at local governments’ level as, quite often, the authorities send important amounts of funds towards dedicated voters and constituents as subsidies, social security and other forms of direct and indirect financial support. The practice of organizing referendums for important investment projects has not broken yet into the habits of Romanian local governments.
Our study main limitation refers to studying local public expenditures at an overall level rather for the different categories of budgetary expenditures (investments, social protection, and current expenditures). Our future line of study relates to differentiating for these types of budgetary expenditures and deepening the analysis of TE’s determining factors’ influences. Another direction refers to increasing the study sample, including the communes which match the number of inhabitants’ criteria (corresponding to the municipalities’ population threshold) in order to test TE’s differences according to the urban or rural environment. References [1] Baicker, K. (2001). The spillover effects of state spending. Journal of Public Economics, 89: 529-544. [2] Benito, B., Bastida, F., and Vicente, C. (2013). Municipal Elections and Cultural Expenditure. Journal of
Cultural Economics, 37(1): 3-32.

Volume XI, Issue 8 (46) Winter 2016
[3] Borck, R., Caliendo, M., and Steiner, V. (2006). Fiscal competition and the composition of public spending: theory and evidence. IZA Discussion Papers, No. 2428, Available at: http://nbn-resolving.de/urn:nbn:de:101:1-20081202229 (accessed September 15, 2015).
[4] Brender, A., and Drazen, A. (2013) Elections, leaders, and the composition of government spending. Journal of Public Economics, 97: 18-31.
[5] Brender, A., and Drazen, A. (2008). How do budget deficits and economic performance affect reelection prospects? Evidence from a large panel of countries, American Economic Review, 98(5): 2203-2220.
[6] Brender, A., and Drazen, A. (2005) Political budget cycles in new versus established democracies, Journal of Monetary Economics, 52: 1271-1295.
[7] Buettner, T. (2003). Tax base effects and fiscal externalities of local capital taxation: evidence from a panel of German jurisdictions, Journal of Urban Economics, 54: 110-128.
[8] Case, A. C., Rosen, H. S., and Hines, J. R. (1993). Budget spillovers and fiscal policy interdependence: evidence from the states, Journal of Public Economics, 52: 285-307.
[9] Dahlberg, M., and Mörk, E. (2008) Is there an election cycle in public employment? Separating time effects from election year effects, Working Paper 4. Available at: http://www.diva-portal.org/smash/get/diva2: 43748/FULLTEXT01.pdf (accessed September 15, 2015).
[10] Drazen, A., and Eslava, M. (2005). Electoral manipulation via expenditure composition: theory and evidence, NBER Working Paper, 11085, no. 1-4. Available at: http://www.nber.org/papers/w11085.pdf?new_window=1 (accessed October 6, 2015).
[11] Drazen, A., and Eslava, M. (2010). Electoral Manipulation via Voter-Friendly Spending: Theory and Evidence. Journal of Development Economics, 92: 39–52.
[12] Ehrhart, H. (2010). Elections and the structure of taxation in developing countries. Document de travail de la série Etudes et Documents E, 27. Available at: http://www.cerdi.org/uploads/ed/2010/2010.27.pdf
[13] Field, P. 2013. Discovering statistics using SPSS, 4th Edition, London: Sage Publications Ltd., ISBN: 9781446249185
[14] Figlio, D. N., Kolpin, V. W., and Reid, W. E. (1999). Do States play welfare games? Journal of Urban Economics, 46: 437-454.
[15] Foucault, M., Madiès, T. and Paty, S. (2008). Public Spending Interactions and Local Politics. Empirical Evidence from French Municipalities. Public Choice, 137(1/2): 57-80.
[16] Guillamón, Ma., D., Bastida, F. and Benito, B. (2013). The electoral budget cycle on municipal police expenditure, European Journal of Law and Economics, 36(3): 447-469.
[17] Jaba, E., Robu, I.B., Balan, C.B., Robu, M.A. (2012). Using ANOVA method to generate audit evidences regarding domain’s effect upon the variation of financial position and performance measures. Audit Financiar, 10(8): 3-12.
[18] Litschig, S., and Morrison, K. (2011). Government Spending and Re-election: Quasi-Experimental Evidence from Brazilian Municipalities’, Barcelona GSE Working Paper Series, WP 515. Available at: http://www.econ.upf.edu/docs/papers/downloads/1233.pdf (accessed September 18, 2015).
[19] Shi, M., and Svensson, J. (2006). Political budget cycles: Do they differ across countries and why? Journal of Public Economics, 90: 1367 – 1389.
[20] Veiga, L. G., Veiga, F. J. (2007). Political business cycles at the municipal level. Public Choice, 737(1-2): 45-64.
[21] Vergne, C. (2009). Democracy, elections and allocation of public expenditure in developing countries. European Journal of Political Economy, 25(1): 63-77.
[22] Vicente, C., Benito, B., and Bastida, F. (2013). Transparency and Political Budget Cycles at municipal level. Swiss Political Science Review, 19(2): 139–156.

Journal of Applied Economic Sciences
Directions of Transformation of Labor Relations in the Modern Conditions
Nadezhda A. SEREBRYAKOVA Voronezh State University of Engineering Technologies, Voronezh, Russia, Russia
Natalya V. DOROKHOVA Voronezh State University of Engineering Technologies, Voronezh, Russia
Ekaterina S. DASHKOVA Voronezh State University, Voronezh, Russia
Mikhail I. ISAENKO Voronezh State University of Engineering Technologies, Voronezh, Russia
[email protected] Abstract:
Modern stage of development of society is peculiar by deep changes in all spheres of life activities. Relations between labor and employment are characterized by high level of uncertainty which requires full analysis and study, as well as development of adequate state policy of management. The purpose of this paper is to study directions of transformation of labor relations in the modern conditions and to develop recommendations for improvement of state policy in the sphere of labor and employment. These goals were achieved with the help of economic & statistical methods and methods of economic and comparative analysis. The practical developments were based on the following approaches: complex and structural & logical, expert, methods of comparison and modeling. The performed research determined directions for transformation of labor relations at the modern stage of development of society, change of labor motives and forms of population’s employment. The process of formation and development of non-standard forms of employment in economy of the Russian Federation is studied, and recommendations for development of state policy of employment management are given which take into account the growth of “flexibility” of modern labor market as an objective process.
Key words: labor, labor relations, population employment, non-standard forms of population.
JEL Classification: J23.
1. Introduction Development of society at the modern stage is characterized by fundamental changes that take place in
all spheres of its life activities and in economy, in particular. It is considered that as of now, the global society has entered the stage of post-industrial development. This radical transformation is caused by significant increase of the role of innovations, new knowledge, and information. Intellectualization of economic environment, innovational entrepreneurship, and possession of information flows has become a basis for existence of highly efficient and competitive market economy.
Transition to post-industrial society influenced all aspects of labor activities. Human labor, as main production force, stops playing the leading role in the process of production. Deep transformations take place in individual’s psychology, its labor, life values and needs, as well as conditions of life activities.
Under these conditions, forms of interaction between key subjects of labor suffer deep changes. Subject of labor is actively working, perceiving, and transforming individual or social group with conscience and will. In the modern conditions, subject of labor should conform to the following requirements: high level of development of professionally important qualities of personality; satisfaction with labor; adequate reflection of object of labor; development of self-regulation system; acquisition of socially developed methods of activities; development of the skills of self-evaluation, sense of self-esteem and self-respect.
The above requirements are caused by influence of transition of modern economy to innovational, post-industrial stage of development. Novelties in society lead to changes in economic relations, including labor relations. Labor relations are relations arising between people in the process of labor. However, it should be noted that during the whole historic way of human society development, labor relations and labor itself played the key role. Human constantly changes the conditions of his existence in labor, transforms them according to his developing needs, and creates the world of material and spitirual culture which is created by human to the same extern to which a human is formed by culture (Dorokhova, 2012)

Volume XI, Issue 8 (46) Winter 2016
Besides, labor is very important in the process of establishment and development of personality (Figure 1)
Figure 1 - Scheme of promotion of needs and capabilities of human in the process of labor (Dorokhova 2012)
Initially, labor plays an important role in the process of formation of personality depending on activities chosen by human; besides, the final results of labor determines well-being of society and satisfaction of own needs, including professional activities (Drobizheva et al.). Thus, it is difficult to overestimate the importance of the possibility to work for a particular human. Taking this possibility from human and perspective of transition to the status of unemployed leads to negative associative sense with human: absence of work, idleness, uncertainty in tomorrow, famine, and poverty.
Change of labor relations in the modern conditions and appearance of new forms of labor relations is expressed in the labor market in development of non-standard forms of employment.
Non-standard forms of employment are the form of labor relations with non-standard conditions of labor, work in the part-time regime on the basis of term contract at enterprise or organization. Non-standard employment includes such types of employment as: partial employment; temporary employment; casual employment; part-time employment; underemployment; overemployment; secondary employment; self-employment; employment in informal sector; borrowed labor (outsource, outstaffing, personnel lease) remote employment (Dashkova and Dorokhova 2013).
In the modern conditions, change of labor relations and employment and diversity of their forms turn into an important competitive advantage. With the development of society and economy, new forms of employment arise, which determined the capability of labor market to adapt to constant changes in economic, social, and institutional environment. Directions of transformation in the sphere of labor and employment are the key ones in development of economy and society and require thorough study.
Human with new capabilities and needs
Human with initial capabilities and needs
Consumption sphere
Increase of capabilities
Satisfaction of needs
Labor sphere
Development of
capabilities for labor
Creation of product

Journal of Applied Economic Sciences
Conclusions It is possible to state that in Russian economy employment relations are not sufficiently diversified, and it
determines labor market’s capability to adapt to constant changes in economic, social, and institutional environment. Diversification of employment relations is negatively related to roughness of labor laws. The more the state tries to put labor relations into strict limits of standard employment, the lower is the competitiveness of labor force. For that, institutional environment should be more “friendly” regarding innovational changes in labor market.
It is obvious that under the conditions of growing processes of в globalization and informatization, the policy of regulation of employment should take into account inevitable development of various types of non-standard employment at domestic labor market.
The following measures will help Russian Federation’s transition to civilized relations in the sphere of non-standard employment.
Firstly, it is necessary to form common legal field for regulation of non-standard forms of employment. This will lead to amendments to the Constitution, Civil, Labor, Tax, and Criminal Codes, and a large number of other normative acts. Improvement of laws should be combined with support for scientific research as effective practices and perspectives and problems related to new characteristics of population’s employment. There’s necessity for support for Internet forums on these issues, as well as printed media.
Secondly, as a consequence of legal transformations, change of employment’s institutional environment. Thirdly, realization of a complex of measures aimed at transformation of motive in favor of increase of
significance of moral and ethical values, namely: popularization of moral and ethical foundations of labor activities through realization of corresponding projects in mass media and the Internet; reduction of bureaucratic barriers in labor sphere; development of professional orienting work with the youth. References [1] Khorev, A. I., Salikov, Y. A., and Serebryakova, N. A. (2015). Conceptual Features of the Balanced
Development of Business Organizations. Asian Social Science (Special Issue), 11 (20): 22-29. [2] Serebryakova, N.A., Sibirskaya, E., Stroeva, O., and Lyapina, I. (2014). The Contents and Structure of
Innovative Activity in the Russian Economy. Asian Social Science (Special Issue), 10 (23): 51-59. [3] Serebryakova, N. A., Sibirskaya, E., Stroeva O., and Petruchina, E. (2014). The Need of the Uniform
Information Platform "Innovations of Russia" Formation. Asian Social Science (Special Issue), 10 (23): 78-85. [4] Serebryakova, N. A., Gryshchenko, N., Syroizhko, V. (2014). Sustainable economic development of regions:
Monograph, Volume 5/ Ed. by Shlossman, L. – Vienna: “East West” Association for Advanced Studies and Higher Education GmbH. 158 p. ISBN-13 978-3-902986-25-2.
[5] Serebryakova, N. A., Salikov Y. A., Kolomytseva, O. Y., Pakhomova, T. A., and Grishchenko, N. V. (2015) Actual Issues of Planning of Well-Balanced Development of Innovative & Investment Activities. Asian Social Science (Special Issue), 11 (20): 193-206.
[6] Azarnova, T. V. (2013). Algorithm of analysis of dynamics of change of quality of market labor functioning during realization of various strategies of quality management / Azarnova, Т.V., Popova, Т.V., Leontyev, А.N.//Bulletin of VTU, series Systemic Analysis and Information Technologies, 2: 79-87.
[7] Dorokhova, N. V. (2012). Unemployment: subjective and objective relations/Dorokhova, N.V.//Bulletin of VSU. Series Economy and Management, 2: 131-135.
[8] Dashkova, Е. S. (2013). Population’s employment in Russia: modern tendencies/ Dashkova, Е.S., Dorokhova. – Voronezh N., V: Voronezh CNTI – branch of REA. 88 p.
[9] Castells, M. (2010). The Information Age: Economy, Society and Culture Volume 1: The Rise of the Network Society. 2nd Edition Oxford: Wiley Blackwell. p. 406. Available at: http://www.gumer.info/bibliotek_Buks/ Polit/kastel/06.php
[10] Rudenko, G. (2009). Economic crisis and establishment of virtual employment / Rudenko G., Merko A.// HR manager. HR management. No. 6.

Volume XI, Issue 8 (46) Winter 2016
[11] Drobizheva, L. M. et al. (2008). Social sphere today, tomorrow, and day after tomorrow. View from the center and regions of Russia. Information and analytical bulletin of Institute of Sociology of Russian Academy of Sciences. No. 1: 4-71.
[12] Dashkova, E. S. (2005). System of personnel bonuses on the basis of complex evaluation of its activities: PhD thesis: 08.00.05 / VSU.
[13] Khorev, А. I., Salikov, Y. А., Isaenko M. I. (2015). Functions of security service and its role in organization’s structure. Economics. Innovations. Quality Management. 2: 45-49.
[14] Isaenko М. I. (2010). Development of the model of work place as a tool of organization’s HR management. Economics. Innovations. Quality Management, 4 (9): 15-18.

Journal of Applied Economic Sciences
The Influence of Regional Revenue on Government Investment and Its Implication to the Regional Economic Growth
SUMARYOTO
University of Indraprasta4 PGRI, Indonesia [email protected]
Abstract: The aim of this study is to identify the determinants of the influence of regional revenue (RR) on government
investment and its implication to the regional economic growth. Economic growth in Bekasi, Indonesia, is always above national economic growth such investment preparation linked to the RR. This research is limited on RR and its impact on economic growth in Bekasi. Variables studied focused on RR, government investment, and economic growth, was modelled based on Path Analysis approach. Then, the effectiveness of RR management in achieving sustainable economic growth in Bekasi enable to be evaluated economically, through local government investment.
Key Words: regional revenue, government investmen, economic growth.
JEL Classification: E22, H71.
1. Introduction In the year of 2013, the Indonesian Gross Domestic Product have reached Rp 2770.3 trillion (US$.
245,259.2 million/estimately) or about 5.78% increased than the previous year achiievement. The highest economic growth was contributed by the transport and communication sectors with 10.19%; growth while the lowest growth experienced by mining and quarrying sectors as 1.34% (CBS 2011). By GDP total analysis, Java is still the highest contributing zone to Indonesian economy growth, then raised relatively as 57.99% in 2023 as well. Followed by Sumatra as 23.81%; Borneo as 8.67%; Sulawesi as 4.82%; Bali and Nusa Tenggara as 2.53%, and the remaining 2.18% contributed by Maluku and Papua.
There are three provinces in Java with the largest contribution to economic growth such as Jakarta, East Java and West Java. On the expenditure side, the highest economic growth was contributed by goods and services exports amount of 5.30%. Then successively by 5.28% of household consumption component; 4.87% of government expenditure components, 4.71% of Gross Fixed Capital Formation component 4.71%, as well as 1.21% of imported components as a deduction aspect.
As one of the highest economic growth province in Indonesia, West Java has a unique position in the national economic growth. This successful is certainly influenced by the strong government role, which succeed to coordinate all of its resources, even though at the other side there are many problems that challenging. Those are related with the opinion of Millner, Ollivier and Simon (2014, 84) that said "Many of the most important public policy problems require democratic country face cumulative effort by successive Governments to be successfully managed". Relavance opinion comes from, Gelb A et al (1999) stated that Governments in developing countries should, and do, provide valuable goods and services which generate a derived demand for production factors. However, public sector differs from private sector in the extent to which it is subject to political pressures for employment.
Besides having the largest population in Indonesia, West Java province is also directly adjacent to the capital of the country, namely Jakarta. Among the 27 districts/ cities in West Java province, 6 areas were located in the Jabodetabekjur area namely: Bogor district, Bogor city, Depok city, Bekasi district, Bekasi city, and Cianjur district. Similarly, among 11 autonomous administrative regions located in Jabodetabekjur regions, West Java province contribution is relatively larger than Jakarta and Banten. Overall, those administrative autonomous regions, consisting of 3 Provincials Government (DKI Jakarta, West Java and Banten) and 8 Regencies/Cities Government (Bogor regency, Bogor city, Depok, Tangerang regency, Tangerang City, Bekasi regency, Bekasi city, and Cianjur Regency.
4 Jl. Nangka No. 58c Tanjung Barat, Jakarta Selatan 12530

Volume XI, Issue 8 (46) Winter 2016
Source: Google Map
Figure 1 - District of Bekasi, Province of West Java, Indonesia
In the year of 2013, West Java Province experienced economic growth of 6.06% over the previous year (Statistic Bureau Center/BPS of West Java Province 2011). This growth was relatively higher than the national economic growth. Growth occurred in all sectors, except mining and quarrying, which felt down by 0.66%. The highest growth occurred in the transport and communications sector, which amounted to 9.66%. On the expenditure side, the highest economic growth was contributed by goods and services exports, which amounted to 10.06%.
Then successively, followed by components of Gross Fixed Capital Formation 6.60%, 5.51% of government expenditure, 4.02% of household consumption; 0.61% of inventory change and imported components as a deduction instruments, grew by 12.65%. Relatively, its appears that the growth of government spending components in West Java Province is larger than the growth of the national component of government spending. Similarly, it appears that the growth of government spending components in West Java province is greater than the growth in household consumption component. This show that government contribution in West Java in promoting region economic growth is relatively higher than the contribution of other economic actors.
As the fourth largest city in Indonesia, Bekasi City has an important position in development cooperation in the Jabodetakjur as a dynamic region as well as the highest social and economic activity issues in Indonesia. The rapid development of Jakarta as the State Capital, causing spill-over city development into the surrounding area, so there was a wide range of over the designation function in cities around Jakarta, including Bekasi city. Recently, Economic growth in Bekasi which in 2012 amounted to 6.85% (Statistic Bureau/BPS, Bekasi 2013).
Growth occurred in all sectors, except mining and quarrying. Consecutive economic growth in sectors that experienced, growth in Bekasi are: the building sector, which amounted to 12.09%; financial, rent, and services sector companies 8.64%; electricity, gas and water 8.54%; trade, hotels and restaurants 8.11%; the industrial sector 6.25%; the services sector 6.23%; transport and communications 3.27%; and the agricultural sector 0.24%.
In the last period, year to year economic growth in Bekasi is always above the economic growth of West Java province and national economic growth. This is due to local governments’ intervention to facilitate trade activities, proved to be the biggest growth in the service and trade sector. As Hornok and Koren (2015: S110) discloses that "They hope to increase of trade volumes without endangering government revenues by reducing inefficiencies", bring the authorities idea to develop trade sector to boost economic growth in Bekasi City.
In promoting economic growth, local governments have a very important role which is conditioned by how do local governments could be able to manage the region financial potentialily. Jhingan (2003, 67) argues that one of the factors that may affect economic growth is capital accumulation or investment, whether by government or society. If there is greater investment program, it will encourage an increasing production of goods/services activity then will stimulate national or regional production.
Journal of Applied Economic Sciences
One of investment instrument is capital expenditure (Mankiw 2003, 453), government investment was sourced from revenues excess over government investment as government saving. Thus, government savings show the government investment capacity that potentially could be done. While government investment shows the investment amount that realized by the government.
The economy of our state and the related health and social processes have been extremely deeply impacted by the ongoing globalization and the global crisis, which exposed the so-called "unsustainability" of various concepts with elements of minimal state involvement (Gavurova and Grof 2016). Region economic growth strongly related with variety of factors, inter alia, an investment in the certain regions, in particularly local governments investment. Local government investment which is not well prepared neither implemented by consistently and effectively as well, will impact on unexpected economic growth. Based on the region financial potential outlook, investment preparation by local governments investment closely linked to the local income, particularly RR and the Government Investment
In order to stimulate RR, required an effective local financial potential management so that can increase RR and allocate it base on economic development plan priorities and expected targets economic growth There is no define how RR could be able to influence government investment as well as the effect of both variables on regional economic growth, particularly in Bekasi city.
This research is limited on RR and its impact on economic growth in Bekasi, directly or indirectly through government investment. Variables studied focused on RR, government investment, and economic growth. As for influence between variables was modelled based on the structural model approach through Path Analysis. By using Path Analysis, the effectiveness of RR management in achieving sustainable economic growth in Bekasi enable to be evaluated economically, through local government investment, either directly or indirectly.

Volume XI, Issue 8 (46) Winter 2016
Conclusion § Regional Revenue (RR) is a determinant factor of the increasing government investment in Bekasi and has a
positive influence on the direction of government investment. The higher RR will affect the higher Government Investment, then RR contribution influence are relatively very strong and significant.
§ RR and the Government Investment are not determining growth factor in Bekasi. RR and Investment Government together as well as indiviually do not significantly influence economic growth. Contributions effect of the two together is weak and insignificant. Individually, although the direction of the influence of both positive, i.e those the higher of regional revenue and government investment, economic growth, but the contribution effect is not significant.
§ Overall, the high-low economic growth in Bekasi more influenced by external factors other than the Local Revenue and the Government Investment. The findings of this study indicate that RR and local government expenditure (government expenditure), the government investment, has not much role in encouraging economic growth in Bekasi. The role of government investment, potentially geting lower than local revenue.
Then, there are two suggestions be proposed, such as: § It is recommended to the administrator of Bekasi to maintain their independence in empowering RR as
government investment decisions base. The local government also advised to more intensively explore the potential of RR and increase government savings and investment through government consumption efficiency.
§ It is recommended for local governments to improve the accuration of the investment objectives and autonomous investment that can drive economic growth in the region through infrastructure development priorities that facilitates regional economic activity. It also includes private investment in regional development and facilitated by developing a conducive investment climate through bureaucratic efficiency.
References: [1] Almilia, L., Hartono, S., Supriyadi, J., Nahartyo, E. (2013). Examining the effects of presentation patterns,
orders, and information types in investment decision making. Gadjah Mada International Journal of Business, 15 (2): 171-182.
[2] R. A., Lima, R., Neto, S. (1998). Economic growth in Brazilian micro-regions: a spatial panel approach, PhD student, Department of Economics, Federal University of Pernambuco, 50670-901. Available at: http://www.regionalstudies.org/uploads/Economic_Growth_in_Brazilian_Micro-regions_Ricardo_Carvalho.pdf
[3] Arsyad, L. (1999). Development Economic. Issue 4. Yogyakarta. Publisher: Sekolah Tinggi Ilmu Ekonomi (STIE) YKPN.
[4] Barata, A. A., and Hartanto, B.T. (2004). State/Local Financial Management Authority. Jakarta: Elex Media. [5] Gavurova, B., and Grof, M. (2016). Relevance of outcomes implementation of specific economic and social
analyses of mortality for modification of avoidable mortality concepts. Journal of Applied Economics Sciences, 11 (1): 56-65.
[6] Gelb, A., Knight, J. B., Sabot, R. H. (1999). Public Sector Employment, Rent Seeking and Economic Growth, The Economic Journal, (September I99I), I i86-i I99 Printed in Great Britain.
[7] Goode, R. (1984). Government Finance in Developing Countries. Studies of Gouvernment Finance. The Brookings Institution, 1775 Massachusetts Avenue, NW, Washington DC. ISBN 0-8157-3195-7
[8] Hakim, A. (2003). Development Economics, Ekonisia, FEUII, Yogyakarta. [9] Hoetoro, A. (2014). Cooperation and competition among clustered MSEs in East Java. Gadjah Mada
International Journal of Business, 16 (3): 275-293. [10] Hornok, C., Koren, M. (2015). Administrative barriers to trade. Journal of International Economics, 96: S110-
S122. [11] Jhingan, M. L. (2000). The Economics of Development and Planning (translation). Jakarta: Fajar
Interpratama Offset.

Journal of Applied Economic Sciences
[12] Kaldor, N. (1966). in André Nassif, Carmem Feijó and Eliane, Structural Change and Economic Development: Is Brazil Caching Up Or Falling Behind? UNCTAD/OSG/DP/2013/1.
[13] Kunarjo. (2002). Development Program, Planning and Controlling Press. Jakarta: Penerbit Universitas Indonesia.
[14] Mankiw, N.G. (2003). Macroeconomics. Worth Publisher. [15] Millner, A., Ollivier, H., and Simon, L. (2014). Policy experimentation, political competition, and
heterogeneous beliefs. Journal on Public Economics, 120, 84-96. [16] Musgrave, R. A., and Musgrave, P. B. (1984). Public Finance in Theory and Practice. Mc Graw Hill Book
Coy., 4th International Student Edition. ISBN-10: 007044126X; 13: 978-0070441262 [17] Musgrave, R. A. (1959). The Theory of Public Finance: A study in public economy. International Student
Edition. New York, McGraw-Hill, OCLC Number 243503. [18] Özyurt and Daumal. (2013). in Ricardo et al, Economic growth in Brazilian micro regions: a spatial panel
approach, PhD student, Department of Economics, Federal University of Pernambuco, 50670-901. [19] Partadiredja, A. (1998). National Revenue Measurement Analysis. Yogyakarta: BPFE, UGM. [20] Rosen, H. S. (2005). Public Finance. Singapore: Mc. Graw Hill Inc. ISBN 10: 0072876484 ISBN
13:9780072876482 [21] Singarimbun, M., and Effendi, S. (1995). Survey Research Method. Jakarta: LP3ES. *** Statistic Center Berau of West Java. 2014. Official Statistic News, No. 10/02/32/Th.XVI. Jakarta. *** Statistic Center Berau of West Java. 2014. West Java, City and District Financial Statistic, 2013, Bandung
Statistik Keuangan Pemerintah Daerah Provinsi dan Kabupaten/Kota di Jawa Barat Tahun 2013 *** Statistic Center Berau, 2014, Official Statistic News, No. 16/02/Th.XVII. Jakarta. *** Economic Indicator, in 2013, Jakarta. *** Gross Domestic Regional Product, in 2013, Jakarta. *** Constitution Act. No. 32 of 2004; about Regional Administration.

Volume XI, Issue 8 (46) Winter 2016
Application of the Analytic Hierarchy Process to Structure the Motivational Expectations of the Economically Active Population of the Republic of Crimea
Nataliia SIMCHENKO
V. I. Vernadsky Crimean Federal University, Simferopol, Russian Federation [email protected]
Svetlana TSOHLA V. I. Vernadsky Crimean Federal University, Simferopol, Russian Federation
Iryna PODSMASHNAYA V. I. Vernadsky Crimean Federal University, Simferopol, Russian Federation
[email protected] Abstract:
Based on an analysis of the dynamics of labor relations, the article studies the structure of motivational expectations of the economically active population of the Republic of Crimea. The authors have justified the use of Saaty’s Analytic Hierarchy Process when constructing models of motivation under conditions of economic modernization. The results of structuring motivational expectations of the economically active population of the Republic of Crimea make it possible to perform a realistic assessment of motivational preferences in various segments of the labor market in the region. The obtained results provide possibility for the formation of a regional socio-economic policy of employment, taking into account the transformations in the Crimean labor motivation system.
Keywords: motivation, motivational expectations, analytic hierarchy process.
JEL Classification: J01, M54, O15, P25.
Introduction Current transformation processes in the socio-economic development of the Republic of Crimea determine
changes in the system of motivation. Implementation of the policy of modernization of the regional economy implies the structural transformations in motivational expectations of the economically active population of the Republic of Crimea. Of course, it is important to study the structure of motivational expectations of the different segments of the labor market in order to create a regional socio-economic employment policy, taking into account the transformations in labor motivation system of Crimea.
Work motivation is a phenomenon that is the subject of interdisciplinary study, as an effective increase in motivation of the economically active population is practically possible only with the use of the achievements of the psychological, sociological and economic sciences. In recent studies on motivation, the analytical issues of structuring and modeling the behavior of an individual are actively studied in order to increase the labor productivity. The relevance of the application of AHP in the study of management and economic processes is determined by the need for structuring a specific process in order to prioritize tasks and assess them afterwards.

Journal of Applied Economic Sciences
Conclusion Structuring of motivational expectations of the population of the Republic of Crimea in the context of
economically active and inactive population has made it possible to identify among a variety of the proposed to respondents’ criteria those that have the greatest impact on the motivation level: salary, bonuses and allowances, social security guarantees, working conditions, opportunities for self-realization, training and development, corporate culture and team spirit. The criteria selected for the analysis cover a complex of possible forms and methods of motivation, forming motivational environment, which has made it possible to consider the three options as alternatives: the material forms of motivation, the application of non-material forms of motivation or the use of combined forms of motivation.
In terms of certain categories of economically active and inactive population of the Republic of Crimea, the analytic hierarchy process tools have made it possible to: determine the significance of the criteria; explicate motivational expectations when determining the most preferred forms and methods of motivation to enhance the work behavior of the population category under study; identify and assess the potential of different forms of motivation to improve the motivation of categories of the population involved in the study.
The assessment of consistency of respondents’ opinions has determined that the structure of motivational expectations for the categories of the employed and unemployed population is relatively homogeneous. The structure of the motivational expectations of the economically inactive population has much in common with those of the economically active population, but there are features related to the interpretation of the results of analysis of the importance of the "bonuses and allowances" criteria, the importance of which for the economically inactive population is significantly lower than for the employed and unemployed people. The "working conditions" criterion ranks second in terms of importance for the economically inactive population while for the employed and unemployed people this criterion is at the penultimate place in the importance terms.
The significance of material forms of motivation is high for the economically active population, and for employed people this value is significantly lower than for the unemployed category (0.38 and 0.57 respectively). The potential of the increasing the level of motivation for the employed and unemployed population through the use of non-material forms of motivation or combined forms of motivation is almost equal (0.32 to 0.3 and 0.21 to 0.22 respectively).
For the category of economically inactive population, the potential of the application of material motivation forms is the lowest one. Intangible forms are a top priority, combined forms of motivation rank second (0.61 and 0.27 respectively).
According to the results of the analysis, we can conclude that the analytic hierarchy process is a tool that provides possibility to get valid results when structuring the motivational expectations, as due consideration is paid to the importance of each criterion of the system formed in the first stage of the research; the opinions of respondents, the answers of which are not compatible with each other or contradictory, are not considered when performing calculation; this process make it possible to accurately structure motivational expectations for the team studied, the labor market segment or the whole society that enhances the relevance of the data in terms of further research or applying them in practice. Acknowledgement
The work was supported by Russian Foundation for Humanities, Science Project No. 15-22-01001. References
[1] Avtonomov, Y. (2006). Modeling of morality as an element of internal motivation of individuals and a mechanism of correction of market failures. Preprint WP3/2006/06. Moscow: Higher School of Economics, State University.
[2] Blyumin, S. L. (2001). Models and methods of decision making under uncertainty. Lipetsk: Lipetsk Eco-Humanitarian Institute.
[3] Bugorski, V.N., Kotlyarov, I.D., and Fomin, V.I. (2007). Principles of mathematical modeling of work motivation. Applied Informatics, no 3. Available at: URL: http://cyberleninka.ru/article/n/printsipy-matematicheskogo-modelirovaniya-motivatsii-k-trudu (accessed 15.06.2016)
[4] Hell, M., Krneta, M., and Krneta, P. (2013). Application of AHP method for the selection of business plan software. Croatian Operational Research Review (CRORR), 4.

Volume XI, Issue 8 (46) Winter 2016
[5] Kim, S. (2014). Decision Support Model for Introduction of Gamification Solution Using AHP. Scientific World Journal. DOI: 10.1155/2014/714239.
[6] Leini, Y.G. (2011). Methods and tools for the corporate motivation evaluation. [Electronic resource]. Science and modernity, 8-2: 64-69. Available at: http://cyberleninka.ru/article/n/metody-i-instrumenty-otsenki-motivatsii-v-organizatsiyah (accessed 29.05.2016).
[7] Novikov, D. A. (2013). Reflection and management: mathematical models. Moscow: Publishing House of Physical and Mathematical Literature.
[8] Ponomarev, I. P. (2004). Motivation by work in the company. Moscow: URSS Editopial. [9] Popov, A. V. (2013). Modern aspects of labor motivation of the population [Electronic resource]. Territorial
Development Issues. Available at: http://cyberleninka.ru/article/n/sovremennye-aspekty-trudovoy-motivatsii-naseleniya (accessed 29.05.2016).
[10] Saaty, T. L. (1980). The Analytic Hierarchy Process: Planning Priority Setting, Resource Allocation. Mcgraw-Hill (Tx).
[11] Saaty, T., L., and Vargas, L., G. (2013). Decision Making with the Analytic Network Process: Economic, Political, Social and Technological Applications with Benefits, Opportunities, Costs and Risks. New York: Springer. DOI 10.1007/978-1-4614-7279-7
[12] Samolejová, A., Wicher, P., Lampa, M., Lenort, R., Kutáč, J., and Sikorová, A. (2015). Factors of human resource planning in metallurgical company. Metalurgija, 54 (1): 243-246.
[13] Sedenkova, M., and Horak, J. (2006). Multivariate and Multicriteria Evaluation of Labour Market Situation. NOTA DI LAVORO 67. VSB – Technical University, Institute of Geoinformatics. Corso Magenta, 63, 20123 Milano. Available at: http://ageconsearch.umn.edu/bitstream/12088/1/wp060067.pdf
[14] Steenge, A.E. (1986). Saaty’s consistency in static and analysis: an application to problems dynamic input-output models. Socio-Economic Planning, 20 (3): 173-180.
[15] Wen-Hsiang, Lai and Nguyen, Quang Vinh. (2013). An application of AHP approach to investigate tourism promotional effectiveness. Tourism and Hospitality Management, 19(1): 1-22.
[16] Zunk, B.M. (2015). Exploration of Factors Influencing the Customers’ Motivation in Buyer-supplier Relationships on Industrial Markets. International Journal of Engineering Business Management, 1-6. DOI: 10.5772/62110

Journal of Applied Economic Sciences
Development of the Socio-Economic Characteristics and Standardised Death Rates of the European Union Member States
Silvia MEGYESIOVA
University of Economics, Faculty of Business Economics5, Kosice, Slovakia [email protected]
Vanda LIESKOVSKA University of Economics, Faculty of Business Economics, Kosice, Slovakia
[email protected] Abstract:
Gross domestic product per capita and the health expenditure per capita of the European Union Member States are strongly a positively correlated. The convergence process of the GDP and health expenditure per capita was stronger before 2009, before economic crises began to influence the economies. Health expenditure (HE) per capita increased more intensively between 2000 and 2014 than the GDP per capita, which resulted to a higher ratio of the HE per capita to the GDP per capita. In countries with a high living standard and a high level of HE per capita lower standardised death rates (SDR) in total and SDR for some of the non-communicable diseases were typical. The lowest SDR for most of the non-communicable diseases (NCD) were achieved at the Mediterranean Islands of Cyprus, Malta and also Portugal. The Mediterranean diet can be one of the main factors that caused the best status of lowest death rates in selected NCD.
Keywords: cluster analysis, principal component analysis, standardised death rate, GDP per capita, health expenditure per capita.
JEL Classification: C38, I10, I15.
Introduction Socio-economic development of the European Union (EU) Member States belongs to the main goals of
the policy makers in the candidate countries. Gross domestic product per capita is often used as a measure of standard of living. We expect that there exists an association between the living standard and the public health outcome. Public health is a one of the components of sustainable development. Society in good health represents added value for the economy and social development (Sustainable development in the EU, 2015). Sustainable development and public health quite strongly correlate, being connected and conditioned by one another (Seke et al. 2013). Public health spending increased intensively in the past and healthcare spending will increase in the nearest future for example due to the population aging. Also, a bad life style of population can result in an increase of health expenditure due to increased morbidity and mortality. The non-communicable diseases (NCD) are strongly associated with the life style of population (Brummer 2009). The most risk factors of the NCD are obesity, poor diet, alcohol consumption, smoking, lifestyle with no or irregular physical activity (Liu et al. 2012, Cohen et al. 2006, Hu et al. 2001). The impact of NCD in population extends beyond mortality with large financial consequences (Muka et al. 2015). The aim of our paper is to discover the association between the selected socio-economic variables and standardised death rates of some diseases.
5 Tajovskeho 13, 040 31 Kosice, Slovakia

Volume XI, Issue 8 (46) Winter 2016
Conclusion Gross domestic product per capita is positively and significantly correlated with the HE per capita of the
EU Member States. The real increase of the HE was stronger than the growth of the GDP per capita which resulted in an increase of the ratios of HE per capita to the GDP per capita. According to the coefficient of variation the convergence process of both variables was positive. Using cluster analysis tools, it was discovered that the clusters were usually composed of either “old” or “new” Member States. Only exceptionally the “new” Member State joined a cluster with “old” Member States. The clusters with “old” Member States can be characterized as clusters with a high living standard, high HE per capita but also with lower SDR in total and lower SDR of some chronic diseases. For the clusters of “new” Member States are typical lower levels of GDP per capita, HE per capita and higher SDR of some analysed diseases. Hungary is the only country that in all analyzes periods created a separate cluster. Hungary achieved the worst results in terms of very high SDR compared to other clusters. Bad living standard can radically influence morbidity and mortality of the population. The Mediterranean diet is well known as a healthy kind of eating and this could be one of the reasons while the Mediterranean islands of Cyprus, Malta and also Portugal despite of lower GDP and HE per capita had the best outcome in terms of lowest standardised death rates of almost all diseases in our analysis. References [1] Brummer, P. (2009). Coronary Mortality and Living Standard. Acta Medica Scandinavica, 186 (1-6): 61-63.
DOI:10.1111/j.0954-6820.1969.tb01440.x [2] Buckland, G., and Antonio Agudo., A. (2015). The Mediterranean Diet and Mortality. The Mediterranean Diet,
47-60. DOI:10.1016/b978-0-12-407849-9.00005-1 [3] Jonathan, C., Boerwinkle, E., Mosley, T. H., and Hobbs, H. (2006). Sequence Variations in PCSK9, Low
LDL, and Protection against Coronary Heart Disease. New England Journal of Medicine 354 (1): 1264-272. DOI:10.1056/nejmoa054013
[7] Hoffman, R., and Gerber., M. (2011). The Mediterranean Diet: Health and Science. Chichester, West Sussex, UK: Wiley-Blackwell. 1st Edition.
[8] Frank, B., Hu, M. D., JoAnn, E., Manson, M. D., Meir, J., Stampfer, M. D., Graham Colditz, M. D., Simin Liu, M. D., Caren, G., Solomon, M. D., Walter C., Willett, M. D. (2001). Diet, Lifestyle, and the Risk of Type 2 Diabetes Mellitus in Women. New England Journal of Medicine 345 (11): 790-97. DOI:10.1056/nejmoa010492
[9] Liu, K., Daviglus, M. L., Loria, C. M., Colangelo, L., Spring, A. B., Moller, A.C., and Lloyd-Jones, D.M. (2012). Healthy Lifestyle Through Young Adulthood and the Presence of Low Cardiovascular Disease Risk Profile in Middle Age: The Coronary Artery Risk Development in (Young) Adults (CARDIA) Study. Circulation 125 (8): 996-1004. DOI:10.1161/circulationaha.111.060681
[10] Muka, T., Imo, D., Jaspers, L., Colpani, V., Chaker, L., Van Der Lee, S. J., Mendis, S., Chowdhury, R., Bramer, W. M., Falla, A., Pazoki, R., and Franco, O. H. (2015). The Global Impact of Non-communicable Diseases on Healthcare Spending and National Income: A Systematic Review. Eur J Epidemiol European Journal of Epidemiology, 30 (4): 251-77. DOI:10.1007/s10654-014-9984-2
[11] Seke, K., Petrovic, N, Jeremic, V., Vukmirovic, J., Kilibarda, B., and Martic, M. (2013). Sustainable Development and Public Health: Rating European Countries. BMC Public Health, 13, no. 1. DOI:10.1186/1471-2458-13-77
*** Sustainable Development in the European Union: 2015 Monitoring Report of the EU Sustainable Development Strategy. 2015 Edition. Luxembourg: Publications Office of the European Union, 2015.
*** World Health Organization. 2016. ICD-10. International Statistical Classification of Diseases and Related Health Problems. 5th Edition. Volume 2.
*** World Bank. Database. Available at: http://data.worldbank.org/ (accessed September 03, 2016). *** Eurostat. Luxembourg. Eurostat database. Available at: http://ec.europa.eu/eurostat/data/database

Journal of Applied Economic Sciences
*** Eurostat. Luxembourg. Causes of death. Reference Metadata. Available at: http://ec.europa.eu/eurostat/ cache/metadata/EN/hlth_cdeath_esms.htm (accessed August 30, 2016).
*** Eurostat. Luxembourg. The standardised death rates. Available at: http://ec.europa.eu/eurostat/statistics-explained/index.php/Glossary:Standardised_death_rate_(SDR) (accessed August 25, 2016).

Volume XI, Issue 8 (46) Winter 2016
Intellectual Data Analysis of Production Profitability Influence on the Competitiveness of Construction Enterprises
Ugryumov Yevgeny ALEKSANDROVICH South Ural State University, Chelyabinsk6
Shindina Tatyana ALEKSANDROVNA South Ural State University, Chelyabinsk
[email protected] Abstract:
The article is devoted to the development of market relations in a construction sphere and development of competitive relations that are important factors for development of methods for competitive estimation of construction enterprises. The competitiveness of a construction enterprise characterizes competitive advantages and disadvantages that are crucial aspects for making effective management decisions and working out organization development strategies. Competitiveness development in the market of fixed assets construction is one of the main tasks of government policy. That's why competitive estimation of an enterprise is important either for a particular organization or for government in general. The questionnaire results among construction organizations directors of Chelyabinsk, Sverdlovsk and Moscow regions in 2015-2016 are represented in the article. The authors offered an economic and mathematical model based on intellectual analysis of product profitability in construction enterprises. They put forward and disproved theories of various factors influence on the competitiveness of construction enterprises. The authors analyzed research results and drew conclusions about an application of the offered technique and further approach of scientific research.
Keywords: intellectual analysis, profitability, competitiveness, construction, company, products, index.
JEL Classification: D40, D41, L74.
Introduction
The development of market relations in construction sphere and development of competitive relations prove the importance of estimation methods of construction organizations competitiveness (Kruglov 1998). The competitiveness of a construction enterprise characterizes competitive advantages and disadvantages that are crucial aspects for making effective management decisions and working out organization development strategies (Ugryumov and Shindina 2016). Development of competitiveness on the market of fixed assets construction is one of the main tasks of government policy. That's why the competitive estimation of an enterprise is important either for a particular organization or for government in general.
6 454138, Chelyabinsk, Komsomolsky Prospekt, 33, 14.
Journal of Applied Economic Sciences
Conclusion In the resulting regression equation, there are indicators with negative coefficients which prove a reverse
connection between the independent variable and the resulting one. Indicators with the highest negative values are the turnover rate (-7.675) and discretion in the use of resources (-7.252). This means that it is necessary for a construction company in its activity to pay special attention to these indicators because they are very sensitive to changes and can seriously reduce the outcome (result) indicator of the competitiveness that is the production profitability. According to the regression equation, the equipment supply with 13.77 coefficient influences the production profitability most. It is the improvement of the technical level of construction machinery and equipment that can significantly increase the production profitability.
Summarizing the study, it should be noted that the calculated regression equation allows us to objectively evaluate the competitive position and the competitiveness of the construction enterprise in general, as well as to identify its strengths and weaknesses. An adequate assessment of the competitive position and competitiveness shows the real condition of an object under the research, which eventually helps to choose the right strategy for further development. References [1] Alotaibi, F. A., Yusoff, Z. R. A., and Islam, R. B. (2013). The meadiating effect of quality culture on the
relationship between total quality management practices and competitiveness. World Applied Sciences Journal, 23(5): 670-678.
[2] Chen, H. L. (2009). Model for Predicting Financial Performance of Development and Construction Corporations. Journal of Construction Engineering & Management, 135(11): 1190-1200. DOI: 10.1061/(ASCE)CO.1943-7862.0000077
[3] Drew, D. A., Skitmore, M. B., and Lo. H.P.C. (2001). The effect of client and type and size of construction work on a contractor's bidding strategy. Building and Environment, 36(3): 393-406.
[4] Ercan, T., Koksal, A., (2015). Competitive Strategic Performance Benchmarking (CSPB) model for international construction companies. KSCE Journal of Civil Engineering, 20(5): 12-24.
[5] Horta, I. M., Camanho, A. S., and Moreira da Costa, J. (2012). Performance assessment of construction companies: A study of factors promoting financial soundness and innovation in the industry. International Journal of Production Economics, 137(1): 84-94. DOI: 10.1016/j.ijpe.2012.01.015
[6] Keung, C. C., Shen, L.Y.B. (2014). Building an effective interfirm networks for enhancing contractors' project competitiveness. Proceedings of the 17th International Symposium on Advancement of Construction Management and Real Estate, 687-695.
[7] Kosinova, N. N., Tolstel, M. S., Chekalkina, A. A. (2014). Comprehensive evaluation of investment potential (the case of the Southern Federal District). Asian Social Science, 10(23): 231-243.
[8] Kruglov, M.I. (1998). Strategic company management. Moscow: Russian business literature Delovaia. 768 p. [9] Lim, J. N., and Peltner, F. B. (2011). Innovation performance of construction enterprises: An empirical
assessment of the German and Singapore construction enterprises. Construction Innovation, 11(3): 282-304. [10] Ma, Z., Lei, H., and Cai, Y. (2015). Research on performance and e-business strategy in sme’s enterprises
based on dynamic competitive ability. International Journal of Multimedia and Ubiquitous Engineering. 10(10): 385-394.
[11] Makasi, A. A., Govender, K. B., Rukweza, C. C. (2014). Building brand equity through advertising. Mediterranean Journal of Social Sciences, 5(20): 2613-24.
[12] Matejun, M. (2014). The role of flexibility in building the competitiveness of small and medium enterprises. Management, 18(1): 154-168. DOI: 10.2478/manment-2014-0012
[13] Popescu, M. E. (2014). Analysis of the EU member states based on economic growth and competitiveness (Conference Paper). Proceedings of the 24th International Business Information Management Association Conference - Crafting Global Competitive Economies: 2020 Vision Strategic Planning and Smart Implementation 2014, Milan, Italy, 193-200.

Volume XI, Issue 8 (46) Winter 2016
[14] Siskina, A., Arvydas, J., and Apanaviciene, R. (2009). Rasa Evaluation of the competitiveness of construction company overhead costs. Statybos imones pridetiniu islaidu konkurencingumo ivertinimas. Journal of Civil Engineering and Management, 15(2): 215.
[15] Testa, F., Iraldo, F, and Frey, M. (2011). The effect of environmental regulation on firms' competitive performance: The case of the building & construction sector in some EU regions. Journal of Environmental Management, 92(9): 2136-44.
[16] Tucker, G. C., Windapo, A., Cattell, K. S. (2015). Exploring the use of financial capacity as a predictor of construction company corporate performance. Journal of Engineering, Design & Technology, 13(4): 596-611.
[17] Ugryumov, E. A., Shindina, T. A. (2016). Analysis of residential properties in Chelyabinsk by the type and subjects of the market. Bulletin of SUSU. Series Economics and Management, 10(1): 148-156.
[18] Weshah, N., El-Ghandour, W., Falls, L.C., Jergeas, G. (2014). Enhancing project performance by developing multiple regression analysis and risk analysis models for interface. Canadian Journal of Civil Engineering, 41 (11): 929-944. DOI: 10.1139/cjce-2013-0499
[19] Zainol, Z. A., Yasin, N.M.B, Omar, N.A.C., Hashim, N.M.H.N.D, Osman, J. A. (2015). The effect of customer-brand relationship investments on customer engagement: An imperative for sustained competitiveness. Jurnal Pengurusan, 44: 117-127.
[20] Zhao, X., Minrong, Li., Jianping, Li. (2013). The Competitiveness of G20 Nations: Report on the Group of Twenty (G20) National Innovation Competitiveness Development, (2001-2010). China International Analysis and Evaluation Reports. China: Paths International Ltd.
Journal of Applied Economic Sciences
Offshoring Intensities and Skill Upgrading of Employment in the Slovak Republic
Júlia ĎURČOVÁ Faculty of Economics, Technical University of Košice, Slovak Republic
Rajmund MIRDALA Faculty of Economics, Technical University of Košice, Slovak Republic
[email protected] Abstract:
Offshoring representing one of the main characteristics of the current stage of globalization contributed to reduction of the demand for relative unskilled workers resulting in falling wages of unskilled labor in developed countries. The shift away from low-skilled workers is driven by offshoring to Central and Eastern Europe (CEE) countries However, the Slovak Republic, like other European countries experienced considerable skill upgrading of employment over past decade. The study of intertemporal sectorial development of employment and growth rate of person engaged clearly indicates a change in the structure of employment. Therefore, it is interesting to examine how offshoring and domestic outsourcing influences these trends. In order to estimate the impact of offshoring on skill structure of labor demand in the Slovak Republic the system of cost share equations will be derived from translog cost function. The equations for different cost shares are estimated using seemingly unrelated regression (SUR). Our results indicate that offshoring contribution to the change of employment share in case of low and medium skill-levels was negative while positive for high-skilled labor demand. Keywords: offshoring, outsourcing, employment, translog cost function, skill level. JEL Classification: J31, F14, F16. Introduction
International fragmentation of production, as a new phenomenon of last few decades, emerged together with intensified distribution of value added within production chains across countries. While the territorial proximity or common trade areas are still considered as crucial determinants of this process, their importance is generally decreasing during the period of the last 15-20 years (Ederer and Reschenhofer 2014). Narrow trade linkages among the Euro Union member countries represent one of the key implications of deeper economic integration in Europe. Intention to examine substantial characteristics of mutual flows of production among individual countries significantly increased since the establishment of the Euro Area due to growing current account imbalances between North and South of the Euro Area (Belke and Dreger 2011). As a result, mutual linkages among national productions can be also examined according to their contribution to external imbalances (Ederer, Reschenhofer 2014). Some authors analyses flow of goods and intermediate goods within the global supply chains, volumes of cross-country flows of production employed in domestic production that is subsequently exported abroad. Relationship between participation of a country in these flows and the overall advancement of the country can be also examined considering the role of regionalism in these production chains with clearly identified regional centers and regional structure (Baldwin and Lopez-Gonzalez 2013). Increasing interdependence associated with international fragmentation of production also affects business cycle synchronization among countries (Ng 2010, Takeuchi 2011, Amighini 2012).
Declining coordination and transport costs caused that production processes increasingly fragment across borders. This fundamentally alters the nature of international trade, away from trade in goods towards trade in tasks and activities, with profound implications for the geographical location of production, the patterns of gains from trade and the functioning of labor markets (Feenstr and Hong 2007).
In this paper, we examine impact of offshoring on skill structure of labor demand in the Slovak Republic, one of the CEE countries. The industry level data indicate considerable skill upgrading of employment over past 14 years. The share of workers with low education has fallen between 1995 and 2009 from 9.5 to 3.8%. There is also evidence of increased offshoring and decreased domestic outsourcing for the Slovak Republic. We estimate the system of cost share equations derived from translog cost function. The equations for different cost shares are estimated using seemingly unrelated regression (SUR). The data covers period 1995-2009 and come from World Input–Output Database (WIOD) database.
The paper is divided into six sections. Following the introduction, the relevant empirical literature is reviewed in Section 2. In Section 3 we provide a description of facts regarding skill upgrading in the Slovak Republic. In Section 4 we provide a brief overview of model that we employ to examine the impact of offshoring on labor demand. In Section 5 we discuss main results. Finally, concluding remarks are made in Section 6.
Volume XI, Issue 8 (46) Winter 2016
Conclusion Offshoring is frequently used for explanation of employment upgrading and a reason for reduction of the
demand for relative unskilled workers. The main objective of this paper was to examine how offshoring and domestic outsourcing affects the trends in labor demand over the period 1995-2009. The offshoring intensities was computed as the share of imported intermediate in value added creation and domestic outsourcing as the share of domestic intermediate use in value added. A system of cost share equations derived from translog cost function was estimated using SUR technique.
The Slovak Republic, like other European countries, experienced considerable skill upgrading of employment over past decade. The study of intertemporal sectorial development of employment and growth rate of person engaged clearly indicates a change in the structure of employment in the Slovak Republic. The growth of jobs requiring the medium and high skilled workers increases the demand for high skilled labor.
According to the results of the estimations for all sectors, the contribution of offshoring to the change of employment share in case of low and medium skill-levels was negative while it seems to be positive for high-skilled labor demand. When consider the regression coefficients the results showed that the medium-skilled labor was hit hardest by offshoring. The coefficient for low-skilled labor for both offshoring and domestic outsourcing we found insignificant. Acknowledgement
This paper was written in connection with scientific project VEGA no. 1/0961/16. Financial support from this Ministry of Education`s scheme is also gratefully acknowledged. References [1] Amighini, A. A. (2012) China and India in the International Fragmentation of Automobile Production, China
Economic Review, 23(2): 325-341. Available at: http://dx.doi.org/10.1016/j.chieco.2012.01.002 [2] Baldwin, R., Lopez- Gonzales, J. (2013). Supply-Chain Trade: A Portrait of Global Patterns and Several
Testable Hypotheses, [NBER Working Paper, no. 18957], Cambridge, National Bureau of Economic Research, 39 p. Available at: http://www.nber.org/papers/w18957.pdf
[3] Berndt, E., Wood, D. (1975) Technology, Prices and the Derived Demand for Energy, The Review of Economics and Statistics, 57(3): 259-268. Available at: http://www.aae.wisc.edu/aae705/References/ Berndt.pdf
[4] Belke, A., Dreger, C. H. (2011) Current Account Imbalances in the Euro Area: Catching up or Competitiveness?, [DIW Discussion Papers, No. 1106/2011], Berlin, German Institute for Economic Research, 21 p. Available at: https://www.diw.de/documents/publikationen/73/diw_01.c.368749.de/ dp1106.pdf
[5] Brejčák, P. (2016). Zo stoky hore: Ako sa Írsko opäť stalo ekonomickým tigrom Európy, Trend 05.04.2016, Available at: http://www.etrend.sk/ekonomika/zo-stoky-hore-ako-sa-irsko-opat-stalo-ekonomickym-tigrom-europy.html (accessed September, 2016).
[6] Ederer, S., Reschenhofer, P. (2014) A Global Value Chain Analysis of Macroeconomic Imbalances in Europe, WWWForEurope Working Paper 67. Available at: http://www.foreurope.eu/fileadmin/documents/pdf/ Workingpapers/WWWforEurope_WPS_no067_MS221.pdf
[7] Ekholm, K., Hakkala, K. (2005) The Effect of Offshoring on Labour Demand: Evidence from Sweden. [RIIE Working Paper, no. 654], Stockholm, The Research Institute of Industrial Economics, 36 p. Available at: http://www.ifn.se/Wfiles/wp/WP654.pdf
[8] Feenstra, R. C., Hong, C. H. (2007). China’s Exports and Employment, [NBER Working Paper, no. 13552], Cambridge, National Bureau of Economic Research, 39 p. Available at: http://www.nber.org/papers/ w13552.pdf
[9] Foster-MCgregor, N., Stehrer, R. (2013) Value Added Content of Trade: A Comprehensive Approach. Economics Letters 120, 354–357. Available at: http://dx.doi.org/10.1016/j.econlet.2013.05.003
Journal of Applied Economic Sciences
[10] Foster-MCgregor, N., Stehrer, R., De Vries, G.J. (2013) Offshoring and the Skill Structure of Labor Demand, Review of World Economics, 149(4): 631-662. Available at: http://dx.doi.org/10.1007/s10290-013-0163-4
[11] Habrman, M. (2013) Vplyv export na pridanú hodnotu a zamestnanosť v slovenskej ekonomike, Ekonomický ústav SAV Working Paper, ISSN 1337-5598. Available at: http://www.ekonom.sav.sk/uploads/journals/ 239_wp_53_habrman.pdf
[12] Hertveldt, B., Michel, B. (2012) Offshoring and the Skill Structure of Employment in Belgium, Federal Planning Bureau Working Paper 7-12. Available at: http://www.plan.be/admin/uploaded/201206080832090. WP_1207_E.pdf
[13] Hijzen, A., Swaim, P. (2007) Does Offshoring Reduce Industry Employment? National Institute Economic Review, 201: 86-96. Available at: http://www.jstor.org/stable/23879219
[14] Johnson, R.C., Noguera, G. (2012) Fragmentation and Trade in Value Added over Four Decades, [NBER Working Paper, no. 18186], Cambridge, National Bureau of Economic Research, 61 p. Available at: http://www.nber.org/papers/w18186.pdf
[15] Lábaj, M. (2014) Štrukturálne aspekty ekonomického rozvoja. Slovenská ekonomika v globálnych súvislostiach. In: Vydavateľstvo Ekonóm, Bratislava, ISBN 978-80-7144-2233. Available at: http://www.ekonom.sav.sk/uploads/journals/255_labaj-monografia-2.pdf
[16] Lábaj, M. (2013) Zmeny vo význame domáceho dopytu pre generovanú produkciu vo svetovej ekonomike v období rokov 1995-2009, Finančné trhy, August. Available at: http://www.derivat.sk/index.php?PageID=2113
[17] Los, B., Timmer, M., De Vries G., J. (2015). How Important Are Exports for Job Growth in China? A Demand Side Analysis, Journal of Comparative Economics, 43(1): 19-32. Available at: http://dx.doi.org/10.1016/j.jce.2014.11.007
[18] Luptáčik, M., et al. (2013) Národohospodársky význam automobilového priemyslu na Slovensku, Katedra hospodárskej politiky, Bratislava. Available at: http://dx.doi.org/10.13140/2.1.2476.4167
[19] Ng, E.C.Y. (2010) Production Fragmentation and Business Cycle Comovement, Journal of International Economics. 82: 1-14. Available at: http://dx.doi.org/10.1016/j.jinteco.2010.06.002
[20] Slušná, Ľ., Balog, M. et al. (2015) Automobilový priemysel na Slovensku a globálne hodnotové reťazce. In: Slovenská inovačná a energetická agentúra, Bratislava, ISBN 978-80-88823-60-5. Available at: https://www.siea.sk/materials/files/inovacie/publikacie/studia_Automobilovy_priemysel_na_Slovensku_a_globalne_hodnotove_retazce_SIEA_web.pdf
[21] Takeuchi, F. (2011) The Role of Production Fragmentation in International Business Cycle Synchronization in East Asia, Journal of Asian Economics, 22(6): 441-459. Available at: http://dx.doi.org/10.1016/j.asieco.2011.07.003
[22] Timmer, M.P., Dietzenbacher, E., Los B., Stehrer R., De Vries G.J. (2015). An Illustrated User Guide to the World Input-Output Database: The Case of Global Automotive Production, Review of International Economics, 23(3): 575-605. Available at: http://dx.doi.org/10.1111/roie.12178

Volume XI, Issue 8 (46) Winter 2016
APPENDIX 1 Table 8 - Industry classification in WIOT
Industry Name ISIC Code TOTAL INDUSTRIES TOT AGRICULTURE, HUNTING, FORESTRY AND FISHING AtB MINING AND QUARRYING C FOOD, BEVERAGES AND TOBACCO 15t16 Textiles and textile 17t18 Leather, leather and footwear 19 WOOD AND OF WOOD AND CORK 20 PULP, PAPER, PAPER, PRINTING AND PUBLISHING 21t22 Coke, refined petroleum and nuclear fuel 23 Chemicals and chemical 24 Rubber and plastics 25 OTHER NON-METALLIC MINERAL 26 BASIC METALS AND FABRICATED METAL 27t28 MACHINERY, NEC 29 ELECTRICAL AND OPTICAL EQUIPMENT 30t33 TRANSPORT EQUIPMENT 34t35 MANUFACTURING NEC; RECYCLING 36t37 ELECTRICITY, GAS AND WATER SUPPLY E CONSTRUCTION F Sale, maintenance and repair of motor vehicles and motorcycles; retail sale of fuel 50 Wholesale trade and commission trade, except of motor vehicles and motorcycles 51 Retail trade, except of motor vehicles and motorcycles; repair of household goods 52 HOTELS AND RESTAURANTS H Other Inland transport 60 Other Water transport 61 Other Air transport 62 Other Supporting and auxiliary transport activities; activities of travel agencies 63 POST AND TELECOMMUNICATIONS 64 FINANCIAL INTERMEDIATION J Real estate activities 70 Renting of m&eq and other business activities 71t74 PUBLIC ADMIN AND DEFENCE; COMPULSORY SOCIAL SECURITY L EDUCATION M HEALTH AND SOCIAL WORK N OTHER COMMUNITY, SOCIAL AND PERSONAL SERVICES O PRIVATE HOUSEHOLDS WITH EMPLOYED PERSONS P

Journal of Applied Economic Sciences
Economic Practicability Substantiation of Financial Instrument Choice
Mikhail Evgenievich KOSOV Plekhanov Russian University of Economics, Russia
Ravil Gabdullaevich AKHMADEEV Plekhanov Russian University of Economics, Russia
Olga Alekseevna BYKANOVA Plekhanov Russian University of Economics, Russia
Vladimir Sergeevich OSIPOV Institute of Economics of Russian Academy of Sciences, Russia
The Federal Research Institute of System Analysis the Accounts Chamber of the Russian Federation, Russia [email protected]
Ksenia Valerievna EKIMOVA Plekhanov Russian University of Economics, Russia
Svetlana Viktorovna FRUMINA Financial University under the Government of the Russian Federation, Russia
[email protected] Abstract:
When forming investment portfolio of a sovereign fund it is very important to choose the goals which allow taking into account any risks, preferences and restrictions, principles and financial instruments which consider the requirements to the portfolio managers. While substantiation of regulation about the risk level reduction by investment fund portfolio diversification there is developed a hypothesis.
The portfolio modern theory defines the practicability of operations with financial assets by two interrelated characteristics “profitability – risk”. To decrease the characteristics of risk there are implemented investment decisions which consider portfolio diversification taking into account redistribution of invested sum between different kinds of assets. But for all that it is possible to consider the following statement to be wrong: if every portfolio asset is determined by dispersion of profitability, then the profitability of the portfolio has dispersion which depends on its composition. On this hypothes is there is developed an assumption: while portfolio forming, an investor can choose any combination of investment decisions, whereby expected return and standard derivation (risk) of the portfolio are the best. To proof it there were carried out researches of used financial instruments diversification (three groups): assets of the biggest world companies which are in the rating FT Global 500, precious metals which have London Gold Market Fixing Ltd. quotations and property in Germany, Russia, Spain, Switzerland and the USA. Structured common portfolio of investment fund on financial assets of three groups corresponds to profitability rate 4,18% from the biggest world companies shares, 0,13% from gold and 0,82% from property in Germany. Criteria of accepted risk vary from 0,093535962 to 0,006718239 and fulfill conditions of efficient equity frontier parameter adherence.
The most important factor while estimation of sovereign funds management is the principle of maximum actions transparence. At the same time, it has to be implemented to all kinds of world sovereign funds. In the world economy, the majority of investment transactions are imposed by revenue-based levy (capital gain), thereby it increases operational expenses, besides levy can influence expected profitability level of investors. The differences in assets levy in different countries stimulate investors to choose the portfolios with grace variant of levy.
Keywords: investment assets of sovereign fund, revenue-based levy, profitability of financial instruments, global economics, investment policy.
JEL Classification: O47, P45, P47.

Volume XI, Issue 8 (46) Winter 2016
Introduction Specific conglomerates represented by banks, trade and manufacturing corporations, insurance
companies are principal members of international financial markets. The most popular are represented as hedgefunds which are like private investment funds. The peculiarity of their functioning is the absence of statutory regulation or subjection to weaker regulation from the government, inaccessibility for general public. As a rule, such funds service very prosperous clients who manage the money of qualified investors, their bankruptcy doesn’t cause serious negative social consequences. That’s why these organizations are free from the majority of financial regulation standards and use almost unlimited financial instruments and risky investment, arbitral and speculative strategies in their policy.
Sovereign funds (funds of national welfare) are a specific group of international financial market participants. Such funds are created in countries with stable trade balance surplus which is connected with export of hydrocarbon (Norway, Russia, Saudi Arabia, the United Arab Emirates) or non-raw material export (Chinese People's Republic, Singapore, Australia) for further investment including foreign assets. Such funds are created for the following aim: to make a financial “safety bag” for the government while the decrease of world prices on export goods or the demand on them and also to prevent economically unjustified strengthening of national currency which can lead to the imbalance of economy in the country. According to their policy sovereign funds adhere to different strategies in order to fulfill investment portfolio diversification. Some funds adhere to conservative policy of money investment by way of investment in reliable bonds and less by way of investment in the biggest companies’ assets. Other sovereign funds use more aggressive investment policy and invest in different financial instruments of not so big companies, property and hedgefunds.
It’s necessary to note that the theory of portfolio investment was worked out for the first time in the 50s of the 20th century. Using mathematical algorithm Markowits Harry M. defined the most profitable ways to register the assets portfolio structure and to minimize its cost in accordance with expected risk value or to minimize the risk with prescribed value of expected return (with risk tolerance) which is comfortable for an investor.
Grounding on the hypothesis of effective market building Sharpe William F., an American economist, formed an assumption that market factors have an influence on financial instruments profitability. In this connection being the adherent of passive investment he defined the following regularity. It isn’t possible to get excess profit on effective market thus it makes any investment portfolio management not useful and effective by investment first of all in share investment funds. A worked out, capital asset pricing model (CAPM) is a theoretical base for future profitability of fund asset portfolio forecasting. However, the use of such model has a number of restrictions. Particularly the influence of financial non-transparency of market is not taken into account. Thus Richard Roll, an economist, was sure that it isn’t possible to examineCAPM model as nobody can really observe expected return but only its average value. It isn’t possible to get to know if the proportion in the model is really right. At the same time, there are zero transaction costs and zero levy rates in CAPM model. Also, every transaction is followed by expenses, in particular by transaction costs. Using CAMP model, it is meant that an investment isn’t imposed by levy and the levy doesn’t influence investment.
However, in the world economy the majority of investment transactions are imposed by levy (capital increase) thereby it increases operational expenses. More than that the levy can influence expected level of return for an investor. The differences in assets levy in different countries stimulate investors to choose portfolios with grace variant of levy.
In the theory of random processes investment economists J. Cox, Jonathan E. lngersoll Jr., Stephen A. Ross concluded analytical forms of rational investor behavior characteristics taking into consideration the factor of random interest rate or project costs on the assumption that other parameters are constant. The sense of this model is that an investor at a starting moment t invests 1 dollar in order to get 1 dollar in real terms at moment t + T. Thus, financing of one project doesn’t influence other investment projects or potential investor’s possibilities.
All mentioned models are the most important developing stages of the theory about the high possibility to model and foresee investment portfolio structure of sovereign fund. At the same time the majority of investment decisions are based on the following basic assumptions: § investments are often fully or partially irrevocable if an investor in any period of time after the beginning of the
investment process wants to return invested money; § the value of expected reward in invested money isn’t specified. In this case an investor can get probabilistic
characteristics which can influence investment attractiveness of an investment portfolio; § investors have certain freedom of time in relation to decision-making time in the exercise of investment process,
or they can put it aside till the moment they get additional information which will be available in the future.

Journal of Applied Economic Sciences
Conclusion On the basis of generated hypothesis about the investor choice in forming the portfolio of any combination
of investment decisions, in which the expected profitability and standard deviation (risk) of portfolio is the best, the conducted research on the diversification of used financial instruments of three groups (assets of the biggest world companies which are in the rating of FT Global 500, precious metals which have London Gold Market Fixing Ltd. quotations and property in Germany, Russia, Spain, Switzerland and the USA) allowed to formulate the following conclusions.
1. Having regard to shares of the eight biggest world companies the final values of covariance dependencies allowed to include only the securities of three companies in the portfolio: Apple (risk indicator was 0,145026849, profitability indicator was 0,062184534), Wells Fargo (risk was 0,103856026, profitability was 0,034142577) and Johnson@Johnson (risk was 0,058501221 and profitability was 0,021045751)
Figure 2 - Functional dependency of a pair of «risk - profitability» of Apple, Wells Fargo and Johnson@Johnson stocks
Thus, it’s optimal to recognize Apple and Wells Fargo stocks while observing setting of effective boundaries of equality for the investment portfolio according to the minimal risk criteria for a given value of д profitability. In this case, the equation taking into account the covariance coefficients would be:
(6)
The portfolio formed from stocks of the noted companies (Apple share is 0,27; Wells Fargo share is 0,73 for a minimal risk) shows the profitability of 4,18%.
Having regard to precious metals (according to Table 4) the average value of investment profitability in platinum is negative, and taking into account the calculated indicators, the values of covariance coefficient of the financial instrument «silver» 0,027929 is more than others, that indicates a greater risk of such investments (Table 9). Thus, «gold» is the most effective asset of investments.
Table 9 - The values of covariance coefficient of precious metals, which have London Gold Market Fixing Ltd. quotations
Indicators Gold Silver Platinum Gold 0,006756
Silver 0,010378 0,027929 Platinum 0,005031 0,013009 0,009657
Speaking about property in Germany, Russia, Spain, Switzerland, and USA the obtained negative
covariance coefficients show the contrary profitability ratios change of investment in real property subject to the inclusion of these objects in a single asset of portfolio (Table 10).

Volume XI, Issue 8 (46) Winter 2016
Table 10 - The values of covariance coefficient of property in selected countries
Indicators Germany Russia Spain Switzerland USA Germany 0,000043
Russia -0,000053 0,003082 Spain 0,000027 0,000037 0,000097
Switzerland -0,000003 -0,000004 0,000002 0,000026 USA 0,000032 0,000205 0,000021 0,000002 0,000142
Thus, property in Spain is excluded from the most optimal investment in view of the negative average value of profitability (Table 4). The covariance dependence on property between Germany, Russia and Switzerland shows the highest degree of risk when placing in the same portfolio, and property in USA has the riskiest prospects (the biggest covariance coefficient except Russia). Consequently, the inclusion in the total portfolio of investments in German property is the most optimal for this type of financial assets. The profitability index was 0,82% with a minimal risk in the amount of 0,006718239.
Consequently, the total portfolio of the formed investment fund according to the structure of financial assets subject to the parameters of the effective equality border takes the following form (Table 11).
Table 11 - The structure of the investment fund, corresponding to the optimal criterion «risk - profitability»
Structure of portfolio Profitability, % Risk, share Apple and Wells Fargo shares 4,18% 0,093535962 Precious metal - gold 0,13% 0,083960654 Property in Germany 0,82% 0,006718239
It should be noted that investments aimed at developing the economy, especially, investments in import-substituting technology, in infrastructure and other capital-intensive investments are characterized by low or even negative investment profitability and also by longness of a payback period. It’s necessary to assess the effectiveness of public projects to evaluate the long-term and low-risk projects. At the same time the job gains in the territory, where the project is implemented, the average salary of employees in the implementation of this project and exceeding the average level of wages over wages in other sectors will characterize the public efficiency. When assessing investment funds, it’s necessary to consider whether the chosen direction of investment corresponds to adopted long-term economic strategy of development of the country or plans of diversification.
The factor of ensuring the maximum transparency of their activity is the most important criterion for evaluation of sovereign funds management, which should be applied to all types of the world sovereign wealth funds. The growth of sovereign wealth funds and the amount of finance accumulated in them, attracts attention in view of the fact that the funds may have a significant impact not only on the stock markets, but also on the economy of the country. Foreign investments of sovereign funds may affect national security, because the purpose of the investment may be obtaining control over the strategically important industries and technologies. Consequently, the applicable principles should correspond to the fundamental positions: maintaining a transparent and stable organizational structure of fund management, involving the proper operational control and the nature of risk management; enforcement of legal rules for the disclosure of information in countries where sovereign wealth funds make investments; procedure of investment, taking into account the economic and financial risk and profitability factors; contribute to the stability of the global financial system and free flow of capital and investment. References [1] Akhmadeev, R.G., Kosov, M.E., Bykanova, O.A., Korotkova, E.M., and Mamrukova, O.I. (2016). Assessment
of the Tax Base of the Consolidated Group of Taxpayers in Russia using the Method of Polynomial Interpolation. Indian Journal of Science and Technology, 9(12), March. DOI: 10.17485/ijst/2016 /v9i12/89533
[2] Bagnall, A.E., and Truman, E.M. (2013). Progress on Sovereign Wealth Fund Transparency and Accountability: An Updated SWF Scoreboard. Working paper. Peterson Institute for International Economics. Available at: URL: https://piie.com/publications/pb/pb13-19.pdf
[3] Barone-Adesi, G., and Whaley, R. (1987). Efficient analytic approximation of America option values. Journal of Finance, Vol. 42 (2): 301-320. DOI: 10.1111/j.1540-6261.1987.tb02569.x

Journal of Applied Economic Sciences
[4] Bell, G. (1993). Volatile exchange rates and the multinational fin.: entry, exit, and capacity options. In: TRIGEORGIS, L. (Ed.). Real Options in Capital Investment: new contributions. New York: Praeger. Available at: URL: http://www.jstor.org/stable/3665826
[5] Carr, P. (1988). The valuation of sequential exchange opportunities. Journal of Finance, Vol. 43 (5): 1235-1256. DOI: 10.1111/j.1540-6261.1988.tb03967.x
[6] Castelli, M., Scacciavillani, F. (2012). The New Economics of Sovereign Wealth Funds. John Wiley and Sons.
[7] Cox, J., Ross, S., and Rubinstein, M. (1979). Options pricing: a simplified approach. Journal of Financial Economics, 7 (3): 229-263. DOI:10.1016/0304-405X(79)90015-1
[8] Dixit, A. (1989). Entry and exit decisions under uncertainty. Journal of Political Economy, 97 (3): 620-638. Available at: URL: http://www.jstor.org/stable/1830458
[9] Dixit, A., and Pindyck, R. (1994.) Investment under Uncertainty. Princeton University Press. Princeton: NJ. [10] Ingersoll, J., and Ross, S. (1992). Waiting to Invest: Investment and Uncertainty. Journal of Business. No 65.
Available at: URL: http://www.jstor.org/stable/2353172 [11] Kim, J. (1994). Analytic approximation of the optimal exercise boundaries for American future options.
Journal of Futures Markets, 14: 1–24. February 1. DOI: 10.1002/fut.3990140103 [12] Kosov, M.E., and Akhmadeev, R.G. (2016). Offshore jurisdictions as an instrument for international tax
planning. Europaische Fachhochschule, 4: 46-48. [13] Kosov, M.E., Akhmadeev, R.G., Osipov, V.S., Kharakoz, Y.K., and Smotritskaya, I.I. (2016). Socio-Economic
Planning of the Economy. Indian Journal of Science and Technology, 9 (36). DOI: 10.17485/ijst/2016/v9i36/102008
[14] Markowitz, H. (1952). Portfolio Selection. The Journal of Finance, 7 (1): 77-91. DOI: 10.2307/2975974 [15] Osipov, V.S., Skryl, T.V., Nevskaya, N.A., and Shavina, E.V. (2016). The Territories of the Priority
Development: Genesis of the Institutes. International Business Management. 10 (9): 1649-1657. [16] Robichek, A., and Van Horne, J. (1967). Abandonment value and capital budgeting. The Journal of Finance,
22: 577–589. DOI: 10.1111/j.1540-6261.1967.tb00293.x [17] Roll, R. (1977). A critique of the asset pricing theory's tests Part I: On past and potential testability of the
theory. Journal of Financial Economics, 4 (2): 129-176. DOI: 10.1016/0304-405X(77)90009-5 [18] Ross, S. (1995). Uses, Abuses, and Alternatives to the Net-Present-Value Rule. Financial Management. 24
(3). Available at: http://www.jstor.org/stable/3665561 [19] Sharpe, W.F. (1991). Capital Asset Prices with and without Negative Holdings. The Journal of Finance, 46
(2): 489-509. DOI: 10.2307/2328833. [20] Shemirani, M. (2016). Sovereign Wealth Funds and International Political Economy. Routledge. Taylor and
Francis. December 2016. [21] Tsenina, E. V., Danko, T. P., Ekimova, K. V., Sekerin, V. D., Gorohova, A. E. (2016). Indication of
competitiveness of the potential of the region through Hurwitz and Wald criteria. Global Journal of Pure and Applied Mathematics. 12 (1): 325-335.
[22] Weiss, M. A. (2008). Sovereign Wealth Funds: Background and Policy Issues for Congress. Congressional Research Service, September 3. Available at: http://fpc.state.gov/documents/organization/110750.pdf

Volume XI, Issue 8 (46) Winter 2016
Time-Varying Beta of Russian Companies
Konstantin ASATUROV Department of Finance
National Research University – Higher School of Economics, Russia [email protected]
Abstract:
This paper examines the dynamic beta of Russian companies within the framework of the market model. The closing weekly prices of 29 Russian stocks, six Russian sector indices and the MICEX Index as a market index during the period from January 2009 to June 2015 are used to estimate time-varying beta using various econometric techniques. According to the results for the analyzed period, semiparametric regressions are confirmed to be the most effective model. As regards the forecast period, multivariate GARCH models surprisingly outperform all the other methods. An analysis of beta dynamics shows that most of time-varying betas are non-stationary.
Keywords: time-varying beta, russian stock market; DCC-GARCH model; Kalman filter; semiparametric regression.
JEL Classification: C14, C22, C58, G10, G12.
Introduction In classic market and CAPM models (Markowitz 1952, Sharpe 1964, Lintner 1965) beta coefficient
reflecting stock sensitivity to market portfolio is assumed to be constant over time. Within the framework of these models, beta is estimated by regression analysis, where asset returns is a dependent variable and market returns is a regressor. Thus, beta is the covariance between the market’s returns and the asset’s returns divided by the variance of the market returns. However, the OLS method of constant beta valuation has been criticised on numerous occasions. In particular, it was found that financial assets and market index volatility strongly varies over time (Bollerslev, Engle and Woolbridge 1992), thereby directly impacting beta values.
Beta represents one of the key financial indicators used for the valuation of companies and projects, target price estimation, risk assessment and evaluation of portfolio managers’ performance. Analysts and investors use beta as a framework for fundamental analysis (DCF, DDM, LBO, etc), stock selection, hedging strategies and quantitative modeling. The study of beta and its features contributes to a better understanding of financial market mechanisms and can be useful in operations conducted by stock analysts, portfolio managers, investment bankers and hedgers.
Fabozzi and Francis (1978) and Bos and Newbold (1984) were the first who suggested that a beta can change over time within a CAPM model and proved that a beta representing systematic risk indicator is unstable. These results laid the groundwork for further research papers in the field. Therefore, Sunder (1980) confirmed beta non-stationarity for the US market, Bos and Fetherston (1992) for the Korean market, Kim (1993) for the Hongkongese market, Bos, Fetherston, Martikainen and Perttunen (1995) for the Finnish market, Kok (1992) for the Malaysian market, Wells (1994) for the Sweden market, Faff, Lee and Fry (1992) for the Australian market, as well as Shah and Moonis (2003) for the Indian market.
Subsequently, this field has experienced considerable development alongside the improvement in econometric and mathematical tools. Nowadays, there are several approaches to estimating dynamic beta based on certain econometric methods. These include Bayesian (Jostova and Philipov 2005), SV (Johansson 2009), Markov regime-switching (Mergner and Bulla 2008) and other less popular econometric models. Be that as it may, in this article we shall apply three modern techniques for time-varying beta estimation and forecast, which will be discussed later.
The employed models are rolling OLS, three types of multivariate GARCH models, semiparametric regressions and the Kalman filter. While the rolling OLS and Kalman filter methods are commonly used beta estimation techniques, multivariate GARCH models and semiparametric regressions are rarely applied in the literature, although in some cases they are capable of providing better estimates. Among GARCH models, DCC-GARCH, DCC-GJR-GARCH (including asymmetry in conditional volatility) and ADCC-GJR-GARCH (including asymmetry in conditional volatility and correlation) with both normal and Student's distribution assumptions, are employed. Among semiparametric regressions, those with normal, Epanechnikov and uniform kernel types are applied for beta estimation.
The sample includes data on 29 Russian companies, six sectoral indices and the MICEX index as a market portfolio. Based on the data, all of the models are compared for in-sample and out-sample performance.

Journal of Applied Economic Sciences
Then estimated betas are investigated for stationarity by Augmented Dickey-Fuller, Philips-Perron and Kwiatkowski–Phillips–Schmidt–Shin tests. Four proposed hypotheses are tested in this paper.
Typical research has never been carried out for Russian companies before, and in general it is seldom found in the literature. Thus, testing Russian betas for stationarity is innovative for the research field. Another novelty of the paper is methodological and involves use of DCC-GJR-GARCH and ADCC-GJR-GARCH models, which have never been employed in analogous works earlier, while they are modern and powerful econometric tools for estimation and forecasting. Moreover, in typical papers, semiparametric models are also rarely compared with the Kalman filter and much less with GARCH models.
The paper is structured as follows: the following section will offer a brief review of the literature on beta estimations, while Section 3 will lay out hypotheses and Section 4 will describe the sample used. Section 5 will explore the models and criteria employed for their comparison. Section 6 will set out the results of the research, while Section 7 draws conclusions.

Volume XI, Issue 8 (46) Winter 2016
Conclusions In this paper, 29 Russian stocks and six sector indices during the period from 2010 to 2013 were
investigated for beta time-variation. Employing various econometric methods, it was concluded that the Kalman filter and semiparametric regressions showed the best performance for the analyzed period. However, for the forecast period multivariate GARCH models demonstrated greater efficiency (in 24 of 35 cases), which is a surprising result for typical research. According to the results, most of the beta dynamic processes are proven to be non-stationary under the Augmented Dickey-Fuller (29 out of 35), Philips-Perron (27 out of 35) and KPSS (34 out of 35) tests.
It is believed that the results of this study make a contribution to broadening scholarly understanding of Russian stock beta behavior. Beta estimates make it possible to correctly rank Russian stocks depending on the systematic risk and their possible change (expressed by a standard beta deviation).
The present research could be helpful when attempting to determine beta under popular DCF, LBO and other valuation models. Nowadays most equity research analysts working on emerging markets use Hamada formulae for company beta calculation rather than use regression to estimate beta directly. The reasons of such preference are the regression results inconsistent with corporate finance theory, poor market efficiency, high volatility and great exposure to external shocks. In these cases, dynamic models, which takes into account heteroscedasticity and allows to estimate time-varying alpha as well, are to be employed. Their usage lead to more accurate beta estimates than those available under the standard approach involving the use of regressive analytical models.
The proposed methodology could also be a valuable tool for risk managers, traders and portfolio managers. On the basis of out-sample beta and alpha forecasts beta-neutral portfolio can be constructed (portable alpha strategy), market sensitivity of which is close to zero, while alpha is maximized. For this kind of portfolio even small beta changes is significant for risk-return characteristics, therefore, dynamic models should be applied for its regular calibration and market-neutral position keeping. Employed in the study methods can possibly be used for active hedging strategies, as beta stands for optimal hedging ratio for portfolio comprised of an asset and market index. In case of beta non-stationarity importance of time-varying beta estimation techniques increases even greater, as OLS method assumes its constancy. According to the literature, beta non-stationarity is more frequently observed for emerging markets. Thus, emerging markets participants should consider it in their work. References
[1] Ang, A., Kristensen, D. (2012). Testing Conditional Factor Models. Journal of Financial Economics, 106: 132-156.
[2] Bodurtha, J., Mark, N. (1991). Testing the CAPM with Time-Varying Risk and Returns. Journal of Finance, 46: 1485-1505.
[3] Bollerslev, T. (1986). Generalized Autoregressive Conditional Heteroscedasticity. Journal of Econometrics, 31: 307-327.
[4] Bollersev, T., Engle, R. F., Wooldridge, J. M. (1988). A capital asset pricing model with time-varying covariances’, Journal of Political Economy, 96: 116-131.
[5] Bollerslev, T., Engle, R. F., Woolbridge, J. M. (1992). ARCH Modeling in Finance: A Review of the Theory and Empirical Evidence. Journal of Econometrics, 52(1-2): 5-60.
[6] Bos, T., Newbold, P. (1984). An Empirical Investigation of the Possibility of Stochastic Systematic risk in the Market Model. Journal of Business, 57: 35-41.
[7] Bos, T., Fetherston, T. A. (1992). Market Model Nonstationarity in the Korean Stock Market. Pacific Basin Capital Market Research, 3: 287 – 301.
[8] Bos, T., Fetherston, T. A., Martikainen, T., Perttunen, J. (1995). The International Comovements of Finnish Stocks. European Journal of Finance, 1: 95-111.
[9] Brooks, R. D., Faff, R. W., McKenzie, M. D. (1998). Time-Varying Beta Risk of Australian Industry Portfolios: A Comparison of Modelling Techniques. Australian Journal of Management, 23: 1-22.

Journal of Applied Economic Sciences
[10] Brooks, R. D., Faff, R. W., McKenzie, M. D. (2002). Time-Varying Country Risk: An Assessment of Different Modelling Techniques. European Journal of Finance. 8: 249-274.
[11] Capiello, L., Engle, R. F., Sheppard, K. (2006). Asymmetric Dynamics in the Correlations of Global Equity and Bond Returns. Journal of Financial Econometrics, 4: 537-572.
[12] Choudhry, T., Wu, H. (2008). Forecasting Ability of GARCH vs Kalman Filter Method: Evidence from Daily UK Time-Varying Beta. Journal of Forecasting, 27: 670-689.
[13] Collins, D. W., Ledolter, J., Rayburn, J. (1987). Some Further Evidence on the Stochastic Properties of Systematic Risk. Journal of Business, 60(3): 425-448.
[14] DeJong, D., Nankervis, J., Savin J., Whiteman, C. (1992). The Power Problems of Unit Root Tests in Time Series with Autoregressive Errors. Journal of Econometrics, 53: 323-344.
[15] Eisenbeiss, M., Kauermann, G., Semmler, W. (2007). Estimating Beta-Coefficients of German Stock Data: A Non-Parametric Approach. European Journal of Finance, 13(6): 503-522.
[16] Engle, C., Rodrigues, A. (1989). Tests of International CAPM with Time-Varying Covariances. Journal of Applied Econometrics, 4: 119-138.
[17] Engle, R. F. (2002). Dynamic Conditional Correlation: A Simple Class of Multivariate Generalized Autoregressive Conditional Heteroscedasticity Models. Journal of Business and Economics Statistics, 20: 339–350.
[18] Esteban, M. V., Orbe-Manadaluniz, S. (2010). A Nonparametric Approach for Estimating Betas: the Smoothed Rolling Estimator. Applied Economics, 42: 1269 - 1279.
[19] Fabozzi, F., Francis, J. (1978). Beta as a Random Coefficient. Journal of Financial and Quantitative Analysis, 13: 101-116.
[20] Faff, R. W., Hillier, D., Hillier, J. (2000). Time-Varying Beta Risk: An Analysis of Alternative Modeling Techniques. Journal of Business Finance and Accounting, 27: 523-554.
[21] Faff, R. W., Lee, J. H. H., Fry, T. R. L. (1992). Time Stationarity of Systematic Risk: Some Australian Evidence. Journal of Business and Accounting, 19: 253-270.
[22] Fama, E. F., French, K. R. (1993). Common Risk Factors in the Returns on Stocks and Bonds. Journal of Financial Economics, 33(1): 3-56.
[23] Glosten, L. R., Jaganathan, R., Runkle R. (1993). On the Relation between the Expected Value and the Volatility of the Nominal Excess Return on Stocks. Journal of Finance, 48(5): 1779-1801.
[24] Groenewold, N., Fraser, P. (1999). Time-Varying Estimates of CAPM Betas. Mathematics and Computers in Simulations, 48: 531-539.
[25] Hastie, T., Tibshirani, R. (1993). Varying-Coefficient Models. Journal of the Royal Statistic Society, Series B (Methodology), 55(4): 757-796.
[26] He, Z., Kryzanowski, L. (2008). Dynamic Betas for Canadian Sector Portfolios. International Review of Financial Analysis, 17: 1110–1122.
[27] Johansson, A. C. (2009). Stochastic Volatility and Time-Varying Country Risk in Emerging Markets. European Journal of Finance, 15(3): 337-363.
[28] Jostova, G., Philipov, A. (2005). Bayesian Analysis of Stochastic Betas. Journal of Financial and Quantitative Analysis, 40(4): 747-778.
[29] Kalman, R. E. (1960). A New Approach to Linear Filtering and Prediction Problems. Journal of Basic Engineering, 82(1): 35–45.
[30] Kim, D. (1993). The Extent of Non-Stationarity of Beta. Review of Quantitative Finance and Accounting, 3: 241-254.

Volume XI, Issue 8 (46) Winter 2016
[31] Kok, K. L. (1992). Stability and Predictability of Betas of Malaysian Securities. Securities Industry Review, 18: 65-74.
[32] Li, Q., Racine, J. S. (2010). Smooth Varying-Coefficient Estimation and Inference for Qualitative and Quantitative Data. Econometric Theory, 26: 1607-1637.
[33] Li, Y., Yang, L. (2011). Testing Conditional Factor Models: A Nonparametric Approach. Journal of Empirical Finance, 18: 972-992.
[34] Lie, F., Brooks, R., Fama, R. (2000). Modelling the Equity Beta Risk of Australian Financial Sector Companies. Australian Economic Papers, 39: 301-311.
[35] Lintner, J. (1965). The Valuation of Risky Assets and the Selection of Risky Investments in Stock Portfolios and Capital Budgets. Review of Economics and Statistics, 47: 13-37.
[36] Markowitz, H. M. (1952). Portfolio Selection. Journal of Finance, 12: 77-91. [37] Mergner, S., Bulla, J. (2008). Time-Varying Beta Risk of Pan-European Industry Portfolios: A Comparison of
Alternative Modeling Techniques. European Journal of Finance, 14(8): 771-802. [38] Schwert, G. W., Seguin, P. (1990). Heteroskedasticity in Stock Returns. Journal of Finance, 45: 1129-1155. [39] Shah, A., Moonis, S., A. (2003). Testing for Time Variation in Beta in India. Journal of Emerging Markets
Finance, 2(2): 163–180. [40] Sharpe, W. F. (1964). Capital Asset Prices: a Theory of Market Equilibrium under Conditions of Risk. Journal
of Finance, 45: 425-442. [41] Sunder, S. (1980). Stationarity of Market Risk: Random Coefficients Tests for Individual Stocks. Journal of
Finance, 4: 1129-1155. [42] Wells, C. (1994). Variable Betas on the Stockholm Exchange 1971-1989. Applied Economics, 4: 75-92. [43] Yun, J. (2002). Forecating Volatility in the New Zealand Stock Market. Applied Financial Econometrics, 12:
193-202.

Journal of Applied Economic Sciences
Infrastructure-Driven Development Policies: An Empirical Impact Analysis
Giacomo Di FOGGIA Department of Business Administration, Finance, Management and Law
University of Milano-Bicocca, Milan, Italy [email protected]
Abstract:
One of the paradigms of the Infrastructure-driven development concept is the idea that public policies shall direct consistent resources towards infrastructures to stimulate growth in economically lagging regions. Nonetheless, despite the general macro implications for growth demonstrated by several studies, the impact of infrastructure on local growth need further evidence and specific methodology for micro-level analysis. This paper focuses on the financing and development of the so-called social, economic and territory infrastructures. Financing and incentives for infrastructure development require specific policies; among such policies there is the negotiated planning. Based on an empirical analysis, the paper evaluates their effectiveness. Projects are analyzed in terms of structures taxonomy and how they are intended to meet identified problems. Factors associated with success in terms of economic development are discussed. Results suggests that the scope and purpose of projects as well as the level of agreement between stakeholders drive positive outcomes.
Key words: political economy, local policies, economic development, infrastructure financing.
JEL Classification: O10, O47, H54. Introduction
Government at different levels try to address the persistent problems of depressed and weak areas by supporting locally-based policies along with infrastructure investments. Since the evaluation of policies is a key ingredient of today’s public decision-making process, the identification of successful drivers is a thought-provoking topic. Yet, both the ex-ante appraisal and the ex-post evaluation is challenging because of the complexity related to the multiplicity entities called upon to interact in order to converge on agreed plan for socio-economic development. Though, there is wider recognition that successful projects should be sustainable with clearly defined long-term objectives so that the expectations of stakeholders persist constant (Agrawal 2001). Also, long-term success depends on adopting and then being able to manage different strategies simultaneously (Di Foggia 2016a) regardless the different objectives levels e.g. general, specific and operational. The negotiated programming for local development (NPLD) is a form of agreed regulation between public authorities at various levels and stakeholders – e.g. local authorities, employers, community, trade unions, co-operatives, development agencies – interested in the implementation of pre-defined projects. The backbone of NP is infrastructure development, specifically infrastructure assets, systems and networks that provide essential services for local development. In the past decade, much has been said about both their efficiency and effectiveness. One of the aspects for which the discussion has been pretty long is the lack of empirical evidence. It is inevitable that a different efficiency in the returns from projects may occur due to different geographical and resource endowments. Infrastructure has therefore become a ubiquitous theme in the policy debate (Zhang, Wu, Skitmore, and Jiang 2015).
This work contributes to the existing literature offering some considerations that come from an empirical analysis. Yet, it is important to note two aspects. The first is that in the majority of cases, we know little about the efficiency of these measures since as just mentioned the concerned empirical analysis are deficient. The second aspect is relative to the fact that, even if the objectives are many, the principle one is the reduction of differential territorial development (objective of cohesion). This paper support policy makers and decisions in the light of a sound analysis supported by reliable data. Specifically, the paper contributes to design better policies by facilitating better-informed decision making. Another objective is the improvement of the quality of policy proposals. The analysis of political acceptability is not considered even if the results provide sufficient evidence to respond to concerns that are likely to arise in the decision-making process. These ideas are developed presenting mainly the results of the quantitative analysis based on data and accompanied evaluation of those involved for various reasons in the projects. In the first part of the document we refer to the literature on this subject trying to evaluate the common aspects, after that the instruments, their origin, the legislative framework, and the objectives. In the next section, before a concise discussion we define the methodology of the research. After that the presentation of the results comes. Conclusions and policy implications follow.

Volume XI, Issue 8 (46) Winter 2016
Concluding remarks Policy makers face the persistent problems of depressed and weak areas supporting local policies and
infrastructure investments. The Infrastructure-driven development approach suggests that public policies shall direct consistent resources towards infrastructures to stimulate growth in economically lagging regions. Since both quantity and quality of infrastructures positively impact on local growth, it Is difficult to identify which infrastructure subsector matters the most in different circumstance. Regardless the subsector, investments in infrastructures have often been financed with public funds. The public sector has been the main actor in this field, given the inherent public good nature of infrastructure and the positive externalities. Development policies seek to mitigate such problems support local economies. There is no one definition of success since it depends on the objectives and on definitions of success which may vary amongst the stakeholders of the same project.
This paper focused on a specific development policy aimed at equipping territories with infrastructures and bringing greater local participation in the decision-making. These instruments base on local social and economic infrastructures that in turn support the local economic development. No wonder that the evaluation of these policies is challenging. This is mainly due to the level of complexity related to the multiplicity of public and private entities called upon to interact in order to converge on an organic and structured plan of a territory socio-economic development. Besides being sustainable for the long-term, successful projects shall ensure the cooperation convergence of views of the local authorities and community as well as the potential stakeholders. In addition to the economic benefits these projects provide, the related investments also bring social welfare, such as improved connections and services provided the following fundamental characteristics. Social and productive forces must converge on a clearly defined territory development plan.
Also, the presence of entrepreneurship that makes feasible the plan agreed by intervening with its own financial resources is recommended. Equally important is the presence of multiple projects that reinforce each other allowing the integrated development of the territory. In fact, modern society is reliant on the stability and performance of infrastructure networks for almost every social and economic interaction. As per the scope and the amplitude of the projects, it is important that the projects could be executed in the short term and be proportional to the requirements. In addition, the local consultation is a key tool to converge uniformly on the development goals identified in the conciliation process. Indeed, the consultation phase characterizes this tool as a bottom-up approach. No wonder that good local infrastructure can implement the competitiveness and the attractiveness of territories, improve the standard of living strengthening local identities and support territories’ networks with tangible and intangible assets related to accessibility and knowledge. References [1] Accetturo, A., De Blasio, G. (2011). Policies for local development: an evaluation of Italy’s “Patti Territoriali".
Mimeo. Rome. Available at: http://www.bancaditalia.it/pubblicazioni/temi-discussione/2011/2011-0789/en_tema_789.pdf
[2] Agrawal, A. (2001). Common property institutions and sustainable governance of resources. World Development, 29(10): 1649–1672. Available at: http://doi.org/10.1016/S0305-750X(01)00063-8
[3] Amann, E., Baer, W., Trebat, T., and Lora, J. V. (2016). Infrastructure and Its Role in Brazil’s Development Process. The Quarterly Review of Economics and Finance, 62: 66–73. Available at: http://doi.org/10.1016/j.qref.2016.07.007
[4] Blagojević, M. R., and Tufegdžić, A. (2016). The new technology era requirements and sustainable approach to industrial heritage renewal. Energy and Buildings, 115: 148–153. Available at: http://doi.org/10.1016/j.enbuild.2015.07.062
[5] Casadio, P., and Paccagnella, M. (2012). Criticalities in the Funding, Planning and Selection of Infrastructure Projects in Italy. QA Rivista dell’Associazione Rossi-Doria, 1: 127–153. Available at: http://doi.org/10.3280/QU2012-001005
[6] Chopra, S. S., and Khanna, V. (2015). Interconnectedness and interdependencies of critical infrastructures in the US economy: Implications for resilience. Physica A: Statistical Mechanics and Its Applications, 436: 865–877. Available at: http://doi.org/10.1016/j.physa.2015.05.091
[7] Di Foggia, G. (2016a). Effectiveness of Energy Efficiency Certificates as Drivers for Industrial Energy Efficiency Projects. International Journal of Energy Economics and Policy, 6(2): 273–280.

Journal of Applied Economic Sciences
[8] Di Foggia, G. (2016b). Steering the implementation of urban sustainability projects: Implications for policy. Journal of Environmental Management and Tourism, 7(1): 5–20. Available at: http://doi.org/10.14505/jemt.v7.1(13).01
[9] Di Foggia, G., and Arrigo, U. (2016). The political economy of public spending on italian rail transport: A European view. Journal of Applied Economic Sciences, 11(2): 192–206.
[10] Friedl, C., and Reichl, J. (2016). Realizing energy infrastructure projects – A qualitative empirical analysis of local practices to address social acceptance. Energy Policy, 89: 184–193. Available at: http://doi.org/10.1016/j.enpol.2015.11.027
[11] Galetto, M. (2009). I patti territoriali nella letteratura giuridica e socio-economica. Polis, 23: 481–502. [12] Hastings, S. L. (2010). Triangulation. In Encyclopedia of Research Design (pp. 1538–1541). Sage
Publications. Available at: http://doi.org/10.4135/9781412961288 [13] Koutroumpis, P. (2009). The economic impact of broadband on growth: A simultaneous approach.
Telecommunications Policy, 33(9): 471–485. Available at: http://doi.org/10.1016/j.telpol.2009.07.004 [14] Laprise, M., Lufkin, S., and Rey, E. (2015). An indicator system for the assessment of sustainability
integrated into the project dynamics of regeneration of disused urban areas. Building and Environment, 86: 29–38. Available at: http://doi.org/10.1016/j.buildenv.2014.12.002
[15] Loures, L. (2015). Post-industrial landscapes as drivers for urban redevelopment: Public versus expert perspectives towards the benefits and barriers of the reuse of post-industrial sites in urban areas. Habitat International, 45(P2): 72–81. Available at: http://doi.org/10.1016/j.habitatint.2014.06.028
[16] Misbakhova, C. A., Shinkevich, A. I., Belozerova, Y. M. F. Y. G., and Stakhova, L. V. (2016). Innovation Infrastructure of Engineering and Small Innovative Business in Development of National Innovation System. Journal of Advanced Research in Law and Economics, 7(2): 323–331. Available at: http://doi.org/10.14505/jarle.v7.2(16).16
[17] Nechaev, A. S., and Antipina, O. V. (2016). Assessing the Innovation Attractiveness of Areas: Problems and Solutions. Journal of Advanced Research in Law and Economics, 7(3): 564–571. Available at: http://doi.org/10.14505/jarle.v7.3(17).12
[18] O’Brien, P., and Pike, A. (2015). The governance of local infrastructure funding and financing. Infrastructure Complexity, 2(3): 9. Available at: http://doi.org/10.1186/s40551-015-0007-6
[19] Riera Pérez, M. G., and Rey, E. (2013). A multi-criteria approach to compare urban renewal scenarios for an existing neighborhood. Case study in Lausanne (Switzerland). Building and Environment, 65: 58-70. Available at: http://doi.org/10.1016/j.buildenv.2013.03.017
[20] Silverthorne, T. (2006). What constitutes success in brownfield redevelopment? A review. WIT Transactions on Ecology and the Environment, 94: 39–49. Available at: http://doi.org/10.2495/BF060051
[21] Tortajada, C. (2016). Policy dimensions of development and financing of water infrastructure: The cases of China and India. Environmental Science and Policy, 64: 177–187. Available at: http://doi.org/10.1016/j.envsci.2016.07.001
[22] Uhlmann, V., Rifkin, W., Everingham, J. A., Head, B., and May, K. (2014). Prioritising indicators of cumulative socio-economic impacts to characterise rapid development of onshore gas resources. Extractive Industries and Society, 1(2): 189–199. Available at: http://doi.org/10.1016/j.exis.2014.06.001
[23] Zhang, X., Wu, Y., Skitmore, M., and Jiang, S. (2015). Sustainable infrastructure projects in balancing urban-rural development: Towards the goal of efficiency and equity. Journal of Cleaner Production, 107: 445–454. Available at: http://dx.doi.org/10.1016/j.jclepro.2014.09.068
*** OECD. (2001). Best Practices in Local Development. Paris: OECD Publishing. Available at: http://doi.org/10.1787/9789264193369-en

Volume XI, Issue 8 (46) Winter 2016
Crowdinvesting as a Perspective Instrument of Financing Small and Middle-Sized Businesses in the Russian Federation
Yulia Mikhailovna GRUZINA Financial University under the Government of the Russian Federation, Moscow, Russia
Aleksandr Alikirimovich ZEINALOV Financial University under the Government of the Russian Federation, Moscow, Russia
Natalia Dmitrievna ILIENKOVA Financial University under the Government of the Russian Federation, Moscow, Russia
Dmitrii Arkadievich ILIENKOV Financial University under the Government of the Russian Federation, Moscow, Russia
[email protected] Abstract:
The article substantiates the relevance of developing alternative funding ways for project activity of small and middle-sized businesses in the Russian Federation. Therefore, this research aims at working out proposals for forming a common outline and individual infrastructure elements of a crowdinvesting system to activate project and investment activity of such businesses in the Russian Federation. Desk and sociological research was applied to achieve the research objectives. Desk research was done, using the available statistical and analytical information, Russian laws and regulations, and secondary sources. Data regarding current state of the small and middle-sized business sector were collected, and lists of potential respondents were compiled, and latest contacts of such respondents were collected within the desk research. Sociological research included questionnaire surveying, using e-forms to submit data and sending requests via e-mail. Sample included 31 small and middle-sized Russian businesses. The article presents findings obtained within research and development done out of public funds according to the 2016 Governmental Assignment of the Financial University in Creating a system of public investment (crowdinvesting) to activate small and middle-sized businesses. Research materials present basic concept of mainstreaming project and investment activity of small and middle-sized Russian businesses.
Keywords: crowdinvesting, equity-based crowdfunding, blockchain, financial technologies, P2P lending, fundraising, innovations, venture investment.
JEL Classification: G11, G24, O31.
Introduction A theory of crowdsourcing and crowdfunding appeared in mid 2000's to summarize the first results. The
history of crowdsourcing concept is closely associated with Jeff Howe, who published his article The Rise of Crowdsourcing in June 2006 and used the idea of crowdsourcing for the first time in the world. He describes the phenomenon of people uniting to solve a certain problem with such union not including any award or including a small award, and the effects of such unions on companies that solve similar tasks professionally.
Further on, the theory of crowdsourcing and crowdfunding was picked up by followers of the managerial and economic approaches. Daren C. Brabham developed a technique of application of crowdsourcing as a tool to solve communication problems and he reasons application of crowdsourcing practices in developing and making managerial decisions in his publications (Howe 2012). Crowd-technologies are defined as a tool to solve managerial tasks, a mechanism to regulate life of an organization within this approach; however, application of crowdtechnologies is reduced in reality to a tool of discovering ideas for appropriate managerial decisions to rely on. A close relation of crowd-technologies, primarily of crowdsourcing and crowdfunding, to development of information technologies and social changes was recognized within our research, in particular to better understand the nature of crowd-technologies. One should mention studies done by the following authors to this context:
§ the theory of symbolic interactionism (Mead G. H), as a model of crowd interaction and motivation (Blumer 1984);
§ the theory of information society (Bell, D., Toffler, E., Castells, M.) (Melnik2005). Globalization and accelerated rates of scientific and technological expansion lead to increased relevance
of the ideology of joint project implementation, which was applied in practice in a great variety of forms with

Journal of Applied Economic Sciences
crowdsourcing, crowdfunding and crowdinvesting being most popular. Despite differences between the said varieties of crowd-technologies, one can also point out common characteristics that determined their popularity:
§ broad coverage. Access to results achieved by large groups of people is available online; § a wide array of choices and alternatives. Crowdsourcing allows us to see the existing problems from
different points of view thanks to involvement of large sections of the public possessing varying personal and professional knowledge;
§ unprecedented speed. Usually, crowdsourcing projects are characterized by fixed deadlines, which allows for prompt solving the problems stated, when combined with decentralization of multiple participants;
§ efficiency, arising as result of mass involvement of the public and use of cheap remote labor; § user involvement. Currently, crowdsourcing is applied effectively to fulfill a great number of tasks, including: solving R&D
problems; testing software; recruiting; attracting funds; developing products, design etc.; troubleshooting for organizational problems of a business; forecasting; marketing research.
We believe Wikipedia, a successful developing project with its contents being created and moderated predominantly by volunteers and it also being funded by a great number of small donations, is the most popular and, obviously, successful project.
Crowdsourcing has rapidly gained popularity in Russia (Figure 1), which is associated with its relevance to the Russian realia and relatable to traditional values like communality and team spirit. Low efficiency of the bureaucracy against high level of governmental influence over economy and society and purely developed private sector, including small businesses, on the one hand, and public associations created a number of niches for crowdsourcing projects.
Along with clones of successful foreign projects, a lot of in-house projects arose in Russia that are highly competitive with the foreign examples in their innovation and performance. RosYama is a vivid example, when users monitor conditions of roads together and interact directly with the government. There are also interesting social projects available that target the disabled, e.g. No barriers, or Subway for everyone. In most cases, users of such resources do not even think about them being involved in crowdsourcing, they just share their knowledge, information and opinions with others.
Volume XI, Issue 8 (46) Winter 2016
Conclusion The situation at the Russian crowdfunding market is mostly determined by the young age of such financial
instrument. Most Russian crowd-projects are overall associated with fulfillment of social initiatives or non-commercial histories and are extremely rarely associated with creation of innovations or real goods.
However, they may generate a substantial pulse from the economic point of view. We are talking primarily about development of applied and consumer-oriented innovations with the help of such projects. Every person may be a consumer and at the same time the author and design team member of such project in this industry (Ovseichik et al. 2015). To the most part, these are FMCGs that solve our real everyday problems and affect the quality of life for each of us. This is an enormous market. Even now, non-food retail turnover exceeds RUB1 tln. However, the bulk of consumer goods (e.g. kitchen and household goods) that are presented at the Russian market are still developed and produced and China or Europe. The existing internal demand of such goods is a giant source of development itself. This is the very market for product of our innovators and inventors (Ilienkova et al. 2012).
We believe that crowdinvesting has a future in the Russian economy, as long as it can undergo perspective development due to a great number of factors:
§ the technological industry is obsolete and is not capable of satisfying the demand of innovations because of obsolete logistics of financial relations;
§ innovations have moved from the plane of technologies into the plane of politics and can be one of socially important lifts;
§ the modern innovation system does not meet the reshaped demand anymore and is now a bottle neck, instead of innovation development stimulator;
§ such challenges as shortage of resources, poor environmental conditions, climate change and medicine have grown to be global and cannot be resolved by a single government;
§ global finances and collective financing technologies reduce the input threshold and educational standard abruptly for professional investors and amateurs with the idea of financial support of the innovation;
§ traditional financial institutions are ready to use this model to benefit from the boost of the financing institution;
§ maintaining competitive power of regional economies. Acknowledgments
This article presents findings of the research founded out of public funds according to the 2016 Governmental Assignment of the Financial University in Creating a system of public investment (crowdinvesting) to activate small and middle-sized businesses. References [1] Andreeva, L. N., Anischenko, Y. A., Georgians, Y. M., Korotkov, T. L. et al. (2014). Problems of innovative
development of the economy. Novosibirsk: CRNS Publishing House. [2] Blumer, H. (1984) Society as a symbolic interaction. In Modern foreign social psychology. Moscow State
University Press, 173-179. [3] Gruzina, Yu. M., Zeinalov A. A., and Ilienkov, D. A. (2016). Analysis of national and foreign expertise in
applying crowdtechnologies in the context of activating project and investment activity of small and middle-sized businesses. Innovations and investment, 10: 8-10.
[4] Gruzina, Yu. M., Patraev, G. V, and Stiazhkina, A. S. (2014). Development perspectives for small and middle-sized business in Russia on the Internet. Infrastructural Economic Sectors: Development Challenges and Perspectives, 6: 174-177.
[5] Howe, J. (2012). Crowdsourcing: why the power of the crowd is driving the future of business. Translated from English. Moscow: Alpina Publisher. Available at: https://www.amazon.com/Crowdsourcing-Power-Driving-Future-Business/dp/0307396215
[6] Kickstarter (2015). The Inventor of "super-jacket" for travelers has collected more than $ 9 million for the start-up. Available at: http://news.eizvestia.com/news_technology/full/675-izobretatel-superkurtki-dlya-puteshestvennikov-sobral-na-startap-bolee-9-mln

Journal of Applied Economic Sciences
[7] Ilienkov, D. A. (2014). Crowdfunding: awarding models for participants. Economy and Management of Innovative Technologies, 11(38): 58-61.
[8] Ilienkova, S. D., Ilyenkova, N. D., Gohberg, L. M., Kuznetsov, V. I. et al. (2012). Innovative Management: a textbook (4th Edition, reviewed). Moscow: Unity-Dana.
[9] Larionov, N. A. (2014). Crowdfunding as a financial instrument of venture investment. In: Nesterenko, E., A. (Ed.) Modern development of mechanisms of public and corporate finances in Russia: Monograph. Saratov Social Economic Institute Press, 96-142 pp.
[10] Melnik, L. G. (2005). Preconditions for formation of an information society. Social and economic challenges of an information society. Sumy: Universitetskaia Kniga.
[11] Mollick, E. R. (2013). The Dynamics of Crowdfunding: An Exploratory Study. Journal of Business Venturing, 29(1): 1–16. Available at http://papers.ssrn.com/sol3/papers.cfm?abstract_id=2088298 (accessed August 23, 2016).
[12] Ovseichik S., E., and Gruzina, Yu., M. Supporting small and middle-sized businesses in the conditions of economic instability. Materials of III International Scientific Congress Entrepreneurship and Business in the Conditions of Economic Instability. Financial University under the Government of the Russian Federation
*** Crowdconsulting (2015). What is crowdfunding? Available at: http://www.crowdconsulting.ru/crowdfunding

Volume XI, Issue 8 (46) Winter 2016
Methodological Approaches to Assessment for the Economic Effects of the State's Participation in Integration Processes
Sergey Vsevolodovich SHKODINSKY
Moscow Region State University1, Russia [email protected]
Igor Anatolyevich PRODCHENKO State Research Institute of System Analysis of the Accounts Chamber, Russian Federation2
[email protected] Abstract:
The scientific article actualizes the problem of assessment of the economic effects of the countries’ participation in integration processes; the purpose of the study is to develop methodological approaches to assessment and forecast of the economic effects (positive and negative) received by the Russian Federation from participation in the global integration processes. The methodology of the study is based on the use of methods of logical, structural, comparative, economic and statistical analysis. The scientific, analytical and reference materials of the Russian and foreign authors, as well as official statistical data of Russia, Belarus, Kazakhstan, foreign countries and international organizations were used in preparation of the paper. The most important scientific results include the development of methodological approaches to assessment of the economic effects received by the Russian Federation from participation in the global integration processes. The scientific novelty includes systematization of various options of application of the index approach for assessment of the effects of the regional economic integration; disclosure of the peculiarities of the technique of assessment of the impact of elimination of the financial and administrative barriers to the movement of goods between the Customs Union member states; description of the procedure of application of the technique of the effect analysis based on allocation of sensitive product groups; application of the technique of assessment of the effects of Russia's participation in the integration processes on the basis of descriptive approach.
Keywords: integration, effects, techniques, integration processes, participation, trade.
JEL Classification: F02, F15.
Introduction The last two decades are described by an increased interest in the problems of international trade and
economic integration (Johnson and Noguera 2011) and, in particular, of the formation of preferential trade agreements (PTAs). Regional trade integration has become one of the drivers of the development of international trade. Participation of countries in global and regional integration processes has some influence on its economic performance, and therefore the task of quantitative and qualitative assessment of such effects becomes particularly urgent.
In recent years, Russia has been an active participant in the integration processes, in particular, in the framework of creation of the Customs Union of Russia, Belarus and Kazakhstan. In addition, in 2012, Russia joined the World Trade Organization (WTO), undertaking international obligations in the field of trade and investment regulation. These developments undoubtedly carry certain effects, both positive and negative, for the Russian economy (Strategic Global Forecast 2030, 2011).
In the meantime, despite the importance of quantitative and qualitative assessment of the impact of Russia's participation in integration processes on its economic performance, there is a lack of fundamental papers on the topic at the moment (Turuntseva 2011). This is partly due to the fact that it has been a relatively short period of time since the creation of the Customs Union and Russia's accession to the WTO, which significantly complicates the application of a range of analytical tools and models (Volochkova and Turdyeva 2011).
1 141014, Moscow Region, city of Mytishi, Very Voloshinoy Street, 24 2 119048, Moscow, Usacheva Str., 64, Bld.1

Journal of Applied Economic Sciences
Conclusion As a result of the study, methodical approaches were summarized that allow to assess the impact of
Russia's participation in global integration processes on the economic performance of the country in the most complete and comprehensive way.
These approaches include: technique of assessment of integration effects on the basis of the index approach; technique of analysis of the effect of participation in integration processes based on definition of sensitive product groups; technique of assessment of the impact of elimination of financial and administrative barriers to the movement of goods between the CU member states; technique of assessment from the point of view of global value chains; technique of assessment of integration effects using econometric methods; technique of assessment of the effects of Russia's participation in the integration processes on the basis of a descriptive approach.
In this study, we were unable to determine the most effective tools for analysis, and further testing of the provided methodological approaches to the assessment of the economic effects of the country's participation in integration processes is required. Acknowledgements
The authors express their gratitude for help and support in the preparation of this article to staff of the State Research Institute of System Analysis of the Accounts Chamber of the Russian Federation and the employees of the Russian Academy of Foreign Trade of the Ministry of Economic Development of the Russian Federation Maria Ptashkina and Ksenia Proka. References [1] Akkoyunlu, S., Kholodilin, K. A., and Siliverstovs, B. (2006). The Effect of Economic Reforms of 1980s and of
the Customs Union 1996 upon the Turkish Intra-Industry Trade. No 649. Discussion Papers of DIW Berlin from DIW Berlin, German Institute for Economic Research. Available at: http://www.diw.de/documents/ publikationen/73/diw_01.c.44977.de/dp649.pdf
[2] Balassa, B. (1965). Trade Liberalization and Revealed Comparative Advantage. The Manchester School of Economic and Social Studies, 33: 99-123.
[3] Bergstrand, J. H. (1985). The Gravity Equation in International Trade: Some Microeconomic Foundations and Empirical Evidence. Review of Economics and Statistics, 67 (3): 474-481.
[4] Christie, E. (2001). Potential Trade in Southeast Europe: A Gravity Model Approach, Balkan Observatory Working Papers, 11. The Vienna Institute for International Economic Studies, 35.
[5] Grubel, H. G., and Lloyd, P. J. (1975). Intra-Industry Trade: The Theory and Measurement of International Trade in Differentiated Products. London: Macmillan, 213.
[6] Johnson, R., and Noguera, G. (2011). Proximity and Production Fragmentation. Dartmouth College, 407-411. [7] Karakaya, E., and Ozgen, F. B. (2002). Economic Feasibility of Turkey's Economic Integration with the EU:
Perspectives from Trade Creation and Trade Diversion. International Economics Research Conference, September 11-14, 2002. Available at: http://papers.ssrn.com/sol3/papers.cfm?abstract_id=1014031 (accessed 23.12.2015)
[8] Linneman, H. (1967). An Econometric Study of International Trade Flows. The Economic Journal, 77(306): 366-368.
[9] Tinbergen, J. (1962). Shaping the World Economy: Suggestions for an International Economic Policy. Twentieth Century Fund, New York. Available at: http://repub.eur.nl/pub/16826 (accessed 02.12.2015).
[10] Turuntseva, M. Yu. (2011). Prognozy vneshnetorgovykh pokazateley: sravnitelnyy analiz kachestvennykh svoystv razlichnykh modeley [Forecasts of Trade Indicators: Comparative Analysis of Qualitative Properties of Various Models]. Russian Foreign Bulletin, 2: 35.
[11] Volochkova, N., and Turdyeva, N. (2011). Rossiya i VTO [Russia and the WTO]. Available at: http://www.cefir.ru/download.php?id=3182 (accessed 15.12.2015).
Volume XI, Issue 8 (46) Winter 2016
[12] Wall, H. (1999). Using the Gravity Model to Estimate the Costs of Protection. Federal Reserve Bank of St. Louis Review, 81(1): 33-40.
[13] Yudin, E. G. (1997). Metodologiya nauki. Sistemnost. Deyatelnost [Methodology of the Science. Consistency. Activities]. Moscow: URSS, 444.
*** Baza dannykh statistiki VTO [Database of the WTO statistics]. Available at: http://stat.wto.org/Home/ WSDBHome.aspx?Language=E (accessed 25.12.2015)
*** Federalnaya sluzhba gosudarstvennoy statistiki [Federal State Statistics Service]. Available at: http://www.gks.ru/ (accessed 17.12.2015)
*** Federalnaya tamozhennaya sluzhba [Federal Customs Service]. Available at: http://www.customs.ru./ (accessed 18.12.2015)
*** Natsionalnyy statisticheskiy komitet Respubliki Belarus. [National statistical committee of the Republic of Belarus]. Available at: http://www.belstat.gov.by./ (accessed 20.12.2015).
*** Ofitsialnyy sayt Ministerstva finansov Rossiyskoy Federatsii [Official Website of the Russian Federation Ministry of Finance]. Available at: http://minfin.ru/ru/(accessed 05.12.2015).
*** Ofitsialnyy sayt Tsentralnogo banka Rossiyskoy Federatsii (Bank Rossii) [Official Website of the Central Bank of Russian Federation (Bank of Russia)]. Available at: http://www.cbr.ru./ (accessed 09.12.2015).
*** Statisticheskoye agentstvo Respubliki Kazakhstan [Statistical Agency of the Republic of Kazakhstan]. Date Views 19.12.2015. Available at: http://www.stat.gov.kz/ (accessed 19.12.2015).
*** Statistika UN COMTRADE [Statistics of UN COMTRADE]. Available at: http://comtrade.un.org/db/(accessed 21.12.2015).
*** Strategicheskiy globalnyy prognoz 2030. Rasshirennyy variant [Strategic global forecast 2030. Extended version], 2011. In by A.A. Dynkin (Eds.). Moscow: Magistr, 17-18.
*** Tsentralnaya baza statisticheskikh dannykh Rosstata [Central Database of Rosstat Statistical Data]. Available at: http://cbsd.gks.ru/(accessed 25.12.2015).
*** World Integrated Trade Solution. Available at: http://wits.worldbank.org/WITS/WITS/Restricted/Login.aspx (accessed 21.12.2015).

Journal of Applied Economic Sciences
Performance Comparison Between Real Estate Securities and Real Estate Investment Using Stochastic Dominance and Mean-Variance Analysis
Aekkachai NITTAYAGASETWA
National Institute of Development Administration, Bangkok, Thailand [email protected]
Jiroj BURANASIRI Srinakharinwirot University, Bangkok, Thailand
[email protected] Abstract:
Unlike in the past, different choices for real estate investment are now available for investors. Real estate securities were introduced as another alternative investment vehicle for real estate investors. To promote efficient investment in real estate and real estate securities, this paper explores the relative performance of different types of real estate investment including land, town home, single house, and real estate securities in Thailand from April 2008 to May 2016 by applying mean-variance and stochastic dominance techniques. The results of this examination suggest that the real estate market is not efficient and asset allocation plays important role in real estate investment performance. Mean-variance and stochastic dominance analysis report the same result that town home investment dominates single house investment and land investment dominates condominium investment. Beside trying to choose the best real estate or real estate security in their portfolio, investors should put extra effort in finding the proper types of real estate for their portfolio.
Keywords: performance, investment, real estate, real estate securities, mean-variance analysis, stochastic dominance.
JEL Classification: G11, G14, O53.
Introduction The real estate asset class is one of the common asset classes in many investors’ portfolios for many
reasons. For example, real estate is considered a low risk asset. It has value even when the economy is extremely poor. The imperfect correlation of its return and other assets’ return helps in lowering a portfolio’s diversifiable risk. It is in the long-term and safe investment class which is appropriate for people in aging society. Recently, real estate securities were introduced to let low-wealth investors be able to invest their money in real estate. However, the increase in real estate investment’s choices brings about more difficulty for investors in making proper investment decision. Besides, the knowledge about the investment in real estate and real estate securities is quite limited since there are not many researches in this area.
This paper applies the mean-variance and stochastic dominance techniques to compare the performance of the different types of real estate and real estate securities to promote more understanding on real estate investment. The findings should help investors to gain more understanding on real estate and real estate securities investment and provide academic researchers additional evidence about the existence of market efficiency in real estate investment and comparative natures of the performance of different types of real estate investment. The study focuses on the relative performance of different types of real estate investment in Thailand because of its lucrative real estate and real estate securities investment’s opportunity which comes from the introduction of ASEAN Economic Community (AEC) in 2015.

Volume XI, Issue 8 (46), Winter 2016 Conclusion
The problem of real estate investment on the lack of investment tools is less significant since there are many types of real estate investment available for investors in many markets. This study analyses the relative performance of different types of real estate and real estate securities investment by using mean-variance and stochastic dominance techniques to provide more information to investors to use in improving their portfolio.
The examination by mean-variance analysis apparently points that town home investment dominates single house investment and land investment dominates condominium investment. When stochastic dominance analysis is applied, the study finds that there is no type of real estate investment first-order stochastically dominates other types of real estate investment. However, at the second-order stochastic dominance analysis, the results appear the same as mean-variance analysis. In addition, when the further analysis on stochastic dominance is applied, the investigation shows that, for traditional real estate, single house investment and town home investment third-order stochastically dominates condominium investment. All of traditional real estate investment third-order stochastically dominates real estate securities investment.
In theory, the existence of the dominated types of real estate investment is the evidence which is against the idea of market efficiency. In practice, the results imply that investors should pay attention not only on the selection of the specific real estate or real estate security but also on the choosing of the types of real estate investment to avoid having the inferior sub-asset class in their portfolio.
Nonetheless, there are at least two obvious limitations on this study. First, the period of study might be too short. The seasonality impact might not be completely counted into the findings. Second, the scope of the data is limited to only Thailand market. Hence, the further study should be done to overcome these limitations and to provide more complete results. References [1] Gordon A. J., and Baptista, A. M. (2002). Economic implications of using a mean-VaR model for portfolio
selection: A comparison with mean-variance analysis. Journal of Economic Dynamics and Control, 26 (7): 1159-1193.
[2] Mueller, A., and Glenn, M. (2003). Public and private real estate in a mixed-asset portfolio. Journal of Real Estate Portfolio Management 9 (3): 193-203.
[3] Björk, T., Murgoci, A., and Zhou, X. Y. (2014). Mean–Variance Portfolio Optimization with State-Dependent Risk Aversion. Mathematical Finance, 24 (1): 1-24.
[4] Brounen, D., and Eichholtz, P. M. A. (2003). Property, common stock, and property shares. The Journal of Portfolio Management 29 (5): 129-137.
[5] Clayton, J., and MacKinnon, G. (2003). The relative importance of stock, bond and real estate factors in explaining REIT returns. The Journal of Real Estate Finance and Economics, 27 (1): 39-60.
[6] Fugazza, C., Guidolin, M., and Nicodano, G. (2007). Investing for the long-run in European real estate. The Journal of Real Estate Finance and Economics, 34 (1): 35-80.
[7] Giliberto, M. (2009). Equity real estate investment trusts and real estate returns. Journal of Real Estate Research, 5: 259-263.
[8] Hadar, J., and Russell, W. R. (1969). Rules for ordering uncertain prospects. The American Economic Review. 59 (1): 25-34.
[9] Martin, H., Lekander, J., and Witkiewicz, W. (2004). International Evidence on Real Estate as a Portfolio Diversifier. Journal of Real Estate Research, 26: 161–206.
[10] Martin, H., and Oikarinen, E. (2012). Are REITs real estate? Evidence from international sector level data. Journal of International Money and Finance, 31(7): 1823-1850.
[11] Ibbotson, R. G., and Siegel. L. B. (1984). Real estate returns: a comparison with other investments. Real Estate Economics, 12 (3): 219-242.
[12] Haim. L., (1992). Stochastic dominance and expected utility: survey and analysis. Management Science, 38 (4): 555-593.

Journal of Applied Economic Sciences
[13] Haim, L., and Wiener, Z. (1998). Stochastic dominance and prospect dominance with subjective weighting functions. Journal of Risk and Uncertainty, 16 (2): 147-163.
[14] MacKinnon, G. H., and Zaman, A. A. (2009). Real estate for the long term: The Effect of return predictability on long-horizon allocations. Real Estate Economics, 37 (1): 117-153.
[15] Markowitz, H. M., Todd, G. P., and Sharpe, W. F. (2000). Mean-variance analysis in portfolio choice and capital markets. Frank J. Fabozzi Series: book, Vol. 66. Wiley, Hoboken
[16] Oikarinen, E., Hoesli, M., and Serrano.C. (2011). The Long-Run Dynamics between Securitized and Direct Real Estate. Journal of Real Estate Research, 33 (1): 73–104.
[17] Shinzato, T. (2015). Self-Averaging Property of Minimal Investment Risk of Mean-Variance Model, PloS ONE 10(7): e0133846. DOI:10.1371/journal.pone.0133846.
[18] Westerheide, P. (2006). Cointegration of real estate stocks and reits with common stocks, bonds and consumer price inflation-an international comparison. ZEW-Centre for European Economic Research Discussion Paper 06-057
[19] Whitmore, G. A. (1970). Third-degree stochastic dominance. The American Economic Review, 60 (3): 457-459.
Volume XI, Issue 8 (46), Winter 2016
Managing Regional Consumer Market Based on the Improved Approach to Evaluating Customer Needs for Food Commodities
Yuliya Pavlovna SOBOLEVA
Orel State University of Economics and Trade, Orel, Russian Federation [email protected]
Inna Grigorievna PARSHUTINA Orel State University of Economics and Trade, Orel, Russian Federation
Irina Evgenjevna VORONKOVA Orel State University of Economics and Trade, Orel, Russian Federation
Olga Aleksandrovna SHAPOROVA Orel State University of Economics and Trade, Orel, Russian Federation
[email protected] Abstract:
Regional consumer market can be regarded as an economical category occupying an important position in the social reproduction system and reflecting the conditions of the regional economy. Being the final stage of the regional reproduction process, consumption is a predetermining factor of improving the economic system efficiency. In this regard, developing the system of customer preference evaluations is one of the ways for supplying the population demand in the region and, simultaneously, for increasing the return levels of local commodity producers. The customer needs analysis allows the companies to develop the strategy that is adequate to the market conditions and thus to affect the improvement of the investment climate in the region. This stipulates the necessity to develop better mechanism for identifying the unsatisfied needs and for formulating, based on this mechanism, an action plan that would ensure the solution to this problem.
The objective of this study is to improve the widely-accepted marketing approach to studying the consumer needs for food commodities for the purposes of optimization of the regional consumer market management. The undertaken marketing research identifies the factors that predetermine the effective demand for food commodities and the degree of consumer satisfaction with the existing consumption level.
Keywords: regional consumer market, needs, food commodities, analysis, evaluation.
JEL Classification: P42, P46, R58, M31, L66.
Introduction Within the framework of the earlier investigations dedicated to studying the investment climate in the
region it has been established that the consumer potential represents the most significant indicator for evaluating the readiness of the regional economy for attracting and implementing the investments (Golaydo and Soboleva 2015, Soboleva, Golaydo and Lygina 2015, Soboleva and Parshutina 2016). Based on developing the marketing approach to managing the regional food market, the authors of this study suggested the process algorithm for regulating the demand (Soboleva and Parshutina 2015), (Soboleva, Lygina and Rudakovа 2015). This model is founded on the consumer needs. Insofar, as the food commodities possess the largest specific weight within the whole amount of the products consumed by the population, the values of the needs for them should be among the basic indicators for developing the food-manufacturing industry and retail sector. In this regard, development and practical implementation of the approach to the profound analysis of consumer needs for food commodities will make it possible for the producers to maximize their profits through the complete satisfaction of the needs of the population. In modern environment customer affairs become ever more significant for each participant of the market relations (Stroeva, Shinkareva, Lyapina and Petruchina 2015). The abovementioned facts highlight the actual importance of the problem of identifying and studying the consumer needs for food products.
Journal of Applied Economic Sciences
Conclusion The problem of identifying the needs of the population is not new. Many studies have already been
dedicated to the issue. However, identifying and forming the customer needs at the regional food market represent special case of these issues; therefore, their scientific studies have not been sufficiently extensive. In the course of this study, for the purposes of improving the regional consumer market management, the authors have developed recommendations for further more profound investigations of consumer preferences; particularly, the model of forming the needs on the food market has been developed. Based on the accomplished marketing research study, the factors have been identified that predetermine the effective demand for food products and the degree of customer satisfaction with the existing level of consumption. To eliminate the abovementioned disadvantages that occur in the process of carrying out the survey on customer preferences, the authors of this study suggest that it should be supplemented with the evaluation of the preference system. The most important aspect of food product consumption is represented by product quality. For the purposes of taking into account the quantitative and qualitative parameters of food consumption, including the subjective descriptions of quality by customers, the authors suggest that the method of calculating total integrated factor of diet quality should be applied that should account for the relative level of satisfying the needs for food of the population apart from the quantitative and qualitative characteristics.
Complex application of the marketing and the statistical approaches to identifying and to evaluating the suggested indicators, and, on this basis, of applying the analytical approach to generalizing the results will make it possible to improve the efficiency of the regional consumer market management and to adjust the supply of goods taking into account the customer requirements on regular basis. To optimize the procedure of the marketing research on the needs, a mechanism was suggested for evaluating the preference patterns. For the purposes of improving the regional consumer food market management, it was recommended that the integrated diet quality indicator should be calculated. This would make it possible to take into account quantitative and qualitative parameters of food consumption together with the relative level of satisfying the consumer needs. Acknowledgments
This article was developed within the framework of the state order of the Ministry of Education and Science of the Russian Federation (order 2014/512). References [1] Abalkin, L. I., Pogosov, I. A., Glovatskaya, N. G., Lazurenko, S. G. (2004). Strategic response of Russia to
the challenges of new century: Monograph Ed. by L.I. Abalkin. Moscow: Ekzamen. [2] Astratova, G. V. (1996). Marketing of the food market: Conceptual approach. Monograph. Shadrinsk: PO
Iset Publishing house. [3] Bakayeva, V. V., Rogaleva, N. L., Shchetinina, N. A. (2013). Managing competitive advantages in retail:
monograph. Petropavlosk-Kamchatskiy: KamchGTU. Available at: http://www.kamchatgtu.ru/ CMSFiles37/file/
[4] Chernev, A., Sternthal, B. (1997). The effect of common features on brand choice: moderating role of attribute importance. Journal of Consumer Research. 23 (4): 304 - 310. Available at: http://www.chernev.com/research/articles/The_Effect_of_Common_Features_on_Brand_Choice_Moderating_Role_of_Attribute_Importance_1997.pdf
[5] Deming, E. W. (2012). Out of the crisis; translated from English. 5rd Edition. Available at: http://kniga.biz.ua/ pdf/1253-vykhod-iz-krizisa.pdf
[6] Fetyukhina, O. N. (2011). Functioning and development of agricultural and food market in Russia under conditions of globalization: Theory, methodology, practice: extended abstract of Thesis for PhD Degree (Ec.). Stavropol: FGBOU VPO Stavropol State Agrarian University. Available at: http://www.stgau.ru/science/dis/avtoreferat/fetuhina.pdf
[7] Gerchikova, I. N. (1995). Management. 2nd Edition. Moscow, Banks and stock exchange, UNITY. [8] Golaydo, I. M., Soboleva, Y. P. (2015). Assessment and management of factors of the regional investment
potential. Asian Social Science. 11(7): 240 - 251. Available at: http://dx.doi.org/10.5539/ass.v11n7p240 [9] Gracia, A, Albisu, L. M. (2001). Food consumption in the European Union: main determinants and country
differences. Agribusiness, 17 (4): 469-488. DOI: 10.1002/agr.1030

Volume XI, Issue 8 (46), Winter 2016 [10] Greenberg, R. S., Rubinstein, A. Ya., Abalkin, A. I. (2010). Strategic reference points of economic
development in Russia. Scientific report. Saint Petersburg, Aleteya. [11] Oancea, O.E.A. (2015). The Influence of the Integrated Marketing Communication on the Consumer Buying
Behaviour. Procedia Economics and Finance, 23: 1446-1450. Available at: http://dx.doi.org/10.1016/S2212-5671(15)00446-3
[12] Kennedy, O. B., Stewart-knox B. J., Mitchell P. C., Thurnham D. I. (2004). Consumer perceptions of poultry meat: a qualitative analysis. Nutrition & Food Science. 34(3): 122-129. DOI: 10.1108/00346650410536746
[13] Kоtler, Ph. (1984). Marketing Essentials. The Prentice-Hall Series in Marketing. Prentice-Hall, Inc., Englewood Cliffs, NJ.
[14] Macak, T., Regnerova, O., Toth, S. (2014). Design of Experiments for Analysis Factors Influencing Consumer Behaviour. Procedia Economics and Finance, 12: 371-378. Available at: http://dx.doi.org/10. 1016/S2212-5671(14)00357-8
[15] Naumov, V. N. (2009). Models of consumer behavior in marketing systems. Saint Petersburg, Publishing house SPbGUEF. Available at: http://marketing-digital.ru/library/12.pdf
[16] Nazarenko, V. I. (2001). The security of Russia. Legal, socoi-economicand scientific-tehnicalaspects. Food security. Parts 1. 2. Moscow. Znanie.
[17] Niv, G. (2005). Space of Dr. Deming. The principles of sustainable business: translated from English. Moscow, Alpina Business Books.
[18] Pervan, M., Višić, J., Pavić, I. (2015). Inconsistency in Consumer Preferences: Some Interesting Insights. Procedia Economics and Finance, 23: 726-732. Available at: http://dx.doi.org/10.1016/S2212-5671(15) 00461-X
[19] Potter, N., N., Hotchkiss, J. H. (1995). Food Science. 5th Ed. New York; Washington: Chapman and Hall. Available at: https://books.google.ro/books?id=GRQJAgAAQBAJ&pg=PR5&dq=Food+Science+1995+%09 Potter&hl=ro&sa=X&ved=0ahUKEwjF0-fk6fbQAhXDExoKHWIZBrEQ6AEIJjAA#v=onepage&q=Food%20 Science%201995%20%09Potter&f=false
[20] Rimashevskaya, N. M., Budilova, E. V., Migranova, L. A. (2012). The causes of low life expectancy in regions of Russia. Sociological Research, 51 (2): 19–36.
[21] Schumpeter, J., A. (2004). History of Economic Analysis. Oxford University Press, 1954. (Russian edition: J. Schumpeter. History of Economic Analysis. In 3 volumes. Saint Petersburg,).
[22] Sinyayeva, I. M. (2011). Marketing in commerce. M.: Publishing and trade corporation Dashkov and Co. [23] Soboleva, Y. P, Golaydo, I. M, Lygina, N. I. (2015). Strategy of Expanding the Distribution Network Based
on the Evaluation of the Investment Attractiveness of the Regions. Modern Applied Science, 9 (5): 304-313. Available at: http://dx.doi.org/10.5539/mas.v9n5p304
[24] Soboleva, Y. P, Lygina, N. I, Rudakovа, O. V. (2015). Human potential as an element of innovative-investment attraction. Procedia Economics and Finance, 24С: 666-674.
[25] Soboleva, Y. P, Parshutina, I. G. (2016). Management of Investment Attractiveness of the Region by Improving Company Strategic Planning. Indian Journal of Science and Technology, 9(14).
[26] Soboleva, Y. P, Parshutina I. G. (2015). Marketing Approach to Forecasting of Regional Market Consumption Potential. Indian Journal of Science and Technology, 8 (S10). DOI: 10.17485/ijst/2015/v8is(10)/84871
[27] Soyan, Sh., Ch. (2012). Meaningful factors of forming the needs of the population. Russian Entrepreneurship, 1 (199): .26-31.
[28] Stroeva, O. A., Shinkareva, L. I., Lyapina, I. R., Petruchina, E. V. (2015). Optimization of Approaches to the Management of Investment Projects in Regions of Russia. Mediterranean Journal of Social Sciences, 6 (3): 87-94. Available at: http://www.mcser.org/journal/index.php/mjss/article/view/6794/6503
[29] Stukanova, I. P. (2015). Food consumption: actual and rational criteria. Agricultural Science and Agricultural Industry at the Turn of the Century, 10: 161-164.
[30] Tsounis, N., Aspasia, V., Safiullin, L. N., Oduntsova, J. L, Safiullin, N. Z. (2015). Theory of Demand in the Conditions of Heterogeneity of Goods and Consumers. Procedia Economics and Finance, Vol. 24: 288-295. Available at: http://dx.doi.org/10.1016/S2212-5671(15)00662-0

Journal of Applied Economic Sciences
Spatial Analysis of Income Poverty and Social Exclusion in European Union - 28 in 2014
Erik ŠOLTÉS University of Economics in Bratislava, Faculty of Economic Informatics, Bratislava, Slovakia
Tatiana ŠOLTESOVA University of Economics in Bratislava, Faculty of Economic Informatics, Bratislava, Slovakia
Tatiana HRIVÍKOVÁ University of Economics in Bratislava, Faculty of Applied Languages, Bratislava, Slovakia
[email protected] Abstract:
The aim of the article is to compare the conditions of income poverty and social exclusion in the European Union - 28 member countries in 2014 in terms of 3 dimensions: income poverty and income inequality, material deprivation and labour-market exclusion. Each dimension is mapped by means of several indicators, majority of which is used for monitoring progress of Europe 2020 strategy in the area of poverty and social exclusion. Due to correlations among the indicators, we used factor analysis to create mutually independent factors determined by several source indicators. The factors characterize the particular dimensions, and serve as a basis for a cluster analysis used in the article, in order to gain relatively homogeneous clusters of European Union - 28 countries in terms of income poverty and social exclusion, while countries of various clusters would significantly differ in one or more dimensions.
Regarding the observed dimensions, the resulting findings provide a rather comprehensive view of the conditions of poverty and social exclusion in the European Union. The paper puts emphasis on the visualisation of results obtained by statistical methods, therefore, the analyses were carried out by means of SAS JMP.
Keywords: income poverty, social exclusion, material deprivation, low work intensity, unemployment, cluster analysis. JEL Classification: I32, C38, E24.
Introduction Poverty and social exclusion have become serious social problems concerning even the most advanced
European countries. The European Union (EU) is well aware of that fact. Hence, among the main priorities of the Europe 2020 strategy, a target was laid out to reduce the number of persons in the EU who are threatened by poverty or social exclusion by 20 million. According to Mareš and Rabušic (Mareš and Rabušic 1996) a sole, correct scientific definition of poverty does not exist and therefore a universally valid method of its measurement cannot exist either. Only certain concepts of poverty are measurable. We agree with the opinion of the authors Betti et al. (Betti et al. 2015) that to be able to evaluate the condition of poverty, deprivation and social exclusion a multidimensional approach to those phenomena is necessary. This article is based on a 3-dimensional concept of poverty and social exclusion used by Eurostat to monitor progress of EU in achieving the abovementioned key target of the Europe 2020 strategy. The concept reflects 3 dimensions: income poverty, material deprivation and low work intensity. Eurostat uses an aggregate indicator at risk of poverty or social exclusion (AROPE) combining three rates: at-risk-of-poverty rate, severe material deprivation rate and low-work-intensity rate.
Poverty, material deprivation and labour market exclusion are serious problems to which the EU will have to pay much closer attention since, according to the European Commission, meeting the Europe 2020 strategy goals in the area of poverty and social exclusion seems improbable (European commission 2016). Between years 2009 and 2012, the rate of population at risk of poverty and social exclusion kept growing (Frazer et al. 2014), and only in 2012 there began a slow decrease in the total of people whose income was either below the at-risk-of-poverty threshold or were materially deprived or lived in households with low work intensity1. In 2014 more than 112 million people representing 24.4% of the total population of the EU-28 countries lived at risk of poverty or social exclusion (Eurostat 2015). In other words, nearly ¼ of the EU-28 population disposed of an equivalised income below the at-risk-of-poverty threshold and/or could not afford at least 4 out of 9 monitored material deprivation items and/or lived in households with low work intensity - less than 20%. The largest part of that population suffered from income poverty (17.2%). 11% of the EU-28 population lived in low work intensity
1 http://ec.europa.eu/eurostat/web/europe-2020-indicators/europe-2020-strategy/headline-indicators-scoreboard (accessed
August 25, 2016)

Volume XI, Issue 8 (46), Winter 2016 households and 9% of the EU-28 population experienced severe material deprivation. According to Eurostat (European commission 2015) the at-risk-of-poverty-or-social-exclusion (AROPE) rate increased in 2014 compared to 2008 by 0.6 p.p., meaning that in 2014 there were more people at risk of poverty and social exclusion than in 2008 by 2.4 million.
The aim of the article is to map income poverty and social exclusion in EU-28 countries and present a spatial comparison of those phenomena based on the most recent available data from EU-SILC survey and selected statistics provided by Eurostat. Because of the complexity of the data, we chose the year 2014 as the reference period. Due to relatively strong correlations among the dimensions of poverty and social exclusion mentioned in the introduction, we used a correlation and factor analysis in the 3rd part of the paper to prepare a database for cluster analysis. The 4th section of the article provides an interpretation of results obtained both through the cluster analysis by factors designed in the 3rd part of the article, and in terms of the original source indicators. The 5th part deals with the impact of particular dimensions on overall poverty and social exclusion in EU-28 countries and country clusters. The final, analytical part of the article (6th section) compares the income poverty and social exclusion in EU-28 countries based on an integral indicator determined by the factors obtained in the factor analysis. Eventually, the results of our analyses are compared with the ranking list of countries in Social Progress Index.
Journal of Applied Economic Sciences
Conclusion The paper evaluates and compares poverty and social exclusion in EU-28 member countries based on
statistical analyses of selected indicators in 2014. Multidimensional statistic methods were used for that purpose, such as correlation analysis, factor analysis, cluster analysis, analysis of poverty and social exclusion determination by various dimensions, and a comparison of total poverty and social exclusion and its dimensions by means of factors and an integral factor derived from them. Each method provides a different view of the researched topic, it confirms and above all complements the results obtained by other methods. The factor analysis identified 3 factors in the original set of indicators of poverty and social exclusion representing 3 dimensions: 1 income poverty and income inequality, 2 material deprivation, 3 labour market exclusion. The correlation analysis confirmed the strong dependence among indicators included in each dimension. In that section of the article a concise synthesis of results was presented.
In terms of poverty and social exclusion, the cluster of the following countries exhibited the best results in 2014: Austria, the United Kingdom, France, Slovenia, Denmark, the Netherlands, Finland, Belgium, and Malta. Poverty and social exclusion was in those countries determined quite evenly by all three dimensions. The integral indicator of poverty and social exclusion confirmed the above average positive social performance in those countries of EU-28 with a note that Malta registered an above average risk of material deprivation and Belgium an above average risk of labour market exclusion.
The situation in Luxembourg and Sweden was in 2014 according to the integral indicator even better than in the countries of the previously mentioned cluster and comparable to Germany. Though, a slightly above the EU-28 average risk of income poverty and income inequality was registered in those three countries. Nevertheless, we need to realise that in terms of income poverty only relative concepts are used, therefore, the poverty risk threshold is set differently in various countries. While in Luxembourg the at-risk-of-poverty threshold for a one-member- household in 2014 was set at 20,000 euro and in Western and Northern Europe at 12,000 to 17,000 euro, in the postsocialist countries it was under 5,000 euro (except Slovenia – 7,146 euro) and in Romania only 1,317 euro. The reason for including Luxembourg, Sweden and Germany into the same cluster with Poland and Estonia showing average values of the integral indicator and with Lithuania and Latvia where the integral indicator was below the EU-28 average, was the above average income poverty and income inequality in those three countries.
While countries of Western Europe and Scandinavia registred a relatively low level of poverty and social exclusion risk, the postsocialist countries (except the Czech Republic and Slovenia) together with the countries of Southern Europe recorded above average risk of poverty and social exclusion in at least one dimension of that phenomenon. As mentioned earlier, the Baltic States registered a high degree of income poverty and income inequality, though, combined with a relatively low unemployment and labour market exclusion. The highest risk of poverty and social exclusion among the Baltic States was quantified in Latvia recording in 2014 a high level of material deprivation as well.
Based on the integral indicator, the overall risk of poverty and social exclusion was in 2014 the highest in Geece, Bulgaria, Spain, Romania and Croatia. Greece showed an increased risk in all three dimensions and the absolutely highest degree of labour market exclusion of all EU-28 member countries.
Though Bulgaria registered below average degree of labour market exclusion, the relatively good result in one dimension could not compensate for negative values in the other two. Bulgaria had to face extremely high levels of material deprivation, the most serious in the whole EU-28.
Spain did not have problems with material deprivation in 2014 but similarly to Greece, it recorded a high degree of unemployment and labour market exclusion. The risk of poverty and social exclusion was in 2014 so similar in Greece and Spain that the two countries created a separate cluster.
Romania had to face in 2014 the highest risk of income poverty and income inequality eventhough it had the lowest poverty threshold among all EU-28 countries. It is remarkable that Romania recorded in 2014 the lowest risk of labour market exclusion, so that only 15% of poverty and social exclusion was determined by that dimension while income poverty and income inequality had a three times stronger impact on the overall poverty and social exclusion in that country. Romania registered the least typical representation of the dimensions and their shares in the formation of poverty and social exclusion which was reflected in the cluster analysis where Romania was presented as a separate cluster.
Croatia completes the quintuple of EU-28 countries with the highest risk of poverty and social exclusion. Croatia and Greece were the only two countries where the risk of poverty and social exclusion was above

Volume XI, Issue 8 (46), Winter 2016 average in all three dimensions. But Croatia recorded significantly better results than Greece in all three dimensions. Labour market exclusion was the most detrimental dimension for Croatia, reaching the 4th worst level among the EU-28 countries.
Several EU-28 countries that according to the integral indicator did not face as high levels of poverty and social exclusion as Croatia, still recorded significantly higher risks in some other dimensions than Croatia. It was Ireland and Hungary besides the already mentioned Estonia which recorded the 2nd highest degree of income poverty and income inequality risk after Romania. Ireland, as a consequence of high degree of low job intensity registered the 3rd highest level of labour market exclusion (after Greece and Spain). In Hungary, the 2nd highest level of material deprivation was listed (after Bulgaria). In both cases (Hungary and Ireland) the negative results in the mentioned dimensions were compensated for by a low risk of income poverty and income inequality, the lowest among the EU-28 countries. References [1] Betti, G., et al. (2015). Comparative measures of multidimensional deprivation. Empirical Economics, 49(3):
1071-1100, DOI: 10.1007/s00181-014-0904-9. [2] Frazer, H., Guio, A. C., Marlier, E., Vanhercke, B. and Ward, T. (2014). Putting the fight against poverty and
social exclusion at the heart of the EU agenda: A contribution to the Mid-Term Review of the Europe 2020 Strategy. Observatoire Social Européen, N° 15. Available at: http://www.ose.be/files/publication/OSEPaper Series/Frazer_Guio_Marlier_Vanhercke_Ward_2014_OseResearchPaper15.pdf (accessed August 5, 2016).
[3] Fusco, A., Guio, A., C., and Marlier, E. (2011). Income Poverty and Material Deprivation in European Countries, LISER Working Paper Series from LISER No 2011-04. JEL-codes: I32. Available at: https://www.researchgate.net/publication/254424742_Income_Poverty_and_Material_Deprivation_in_European_Countries (accessed August 18, 2016).
[4] Gerbery, D. (2012). Vybrané aspekty materiálnej deprivácie. Bratislava: Inštitút pre výskum práce a rodiny. Available at: http://www.ceit.sk/IVPR/images/IVPR/vyskum/2012/Gerbery/gerbery_2266.pdf (accessed March 20, 2016).
[5] Gerbery, D. (2013). Nízka intenzita práce a riziko chudoby u pracujúcich v nadväznosti na hodnotenie chudoby a sociálneho vylúčenia. Inštitút pre výskum práce a rodiny, Bratislava. Available at: http://www.ceit. sk/IVPR/images/IVPR/vyskum/2012/Gerbery/2265_gerbery_web.pdf (accessed April 11, 2016)
[6] Guio, A., C. (2009). What can be learned from deprivation indicators in Europe? Luxembourg: Eurostat, Methodologies and working papers. Available at: http://ec.europa.eu/eurostat/documents/ 3888793/5845041/ KS-RA-09-007-EN.PDF/6d80bc28-534a-4fae-9783-9983e05ca20a (accessed May 5, 2016)
[7] Guio, A., C., and Maquet, E. (2007). Material deprivation and poor housing. What can be learned from the EU-SILC 2004 data? How can EU-SILC be improved in this matter? In: Comparative EU Statistics on income and living conditions: Issues and challenges. Luxembourg: Eurostat, Methodologies and working papers. Chapter 2, pp. 193-228. Available at: http://www.uni-mannheim.de/edz/pdf/eurostat/07/KS-RA-07-007-EN.pdf (accessed April 29, 2016).
[8] Guio, A., C., and Marlier, E. (2013). Alternative vs. current measures of material deprivation at EU level: What differences does it make? ImPRovE Discussion Paper No. 13/07. Available at: http://improve-research.eu/?wpdmact=process&did=MzQuaG90bGluaw== (accessed May 5, 2016).
[9] Guio, A., C., Gordon, D., and Marlier, E. (2012). Measuring material deprivation in the EU. Indicators for the whole population and child-specific indicators. Luxemburg: Eurostat, Methodologies and Working papers. Available at: http://ec.europa.eu/eurostat/documents/ 3888793/5853037/KS-RA-12-018-EN.PDF/390c5677-90a6-4dc9-b972-82d589df77c2 (accessed April 25, 2016).
[10] Hallerod, B., Bradshaw, J., and Holmes, H. (1995). Adapting the consensual definition of poverty. Gordon, D. and Pantazis, C. (eds) Breadline Britain in the 1990s, Department of Social Policy and Planning, University of Bristol, Bristol, Chapter 10, pp. 213-234. Available at: http://www.poverty.ac.uk/sites/default/files/ attachments/Breadline%20Britain%20in%20the%201990s%20(Gordon%20%20Pantazis%201997)_0.pdf (accessed August 15, 2016).

Journal of Applied Economic Sciences
[11] Hebák, P., Hustopecký, J., Pecáková, I., Průša, M., Řezánková, H., Svobodová, A. and Vlach, P. (2005). Vícerozmerné statistické metody (3). 2005, 1. vyd, česky, Informatorium, Praha, 255 stran.
[12] Horáková, M., Jahoda, R., Kofroň, P., Sirovátka and T., Šimíková, I. (2013). Příjmová chudoba a materiální deprivace v České republice podle indikátorů EU –vývoj v důsledku krize, fiskální konsolidace a sociální reformy. Praha: Výzkumný ústav práce a sociálních věcí, v.v.i., 2013. 151 s.
[13] Hungler, S. (2012). The poor, the unemployed and the public worker – a comparative essay on national unemployment policies contribution to deepening poverty. International and Comparative Law Review, 12(1): 117–134.
[14] Israel, S., and Spannagel, D. (2013). Material Deprivation – an Analysis of cross-country Differences and European Convergence. FP7 project ‘Combating Poverty in Europe: Re-organising Active Inclusion through Participatory and Integrated Modes of Multilevel Governance’. Work Package 3 – Poverty and its socio-economic structure in Europe. Available at: http://www.cope-research.eu/wp-content/uploads/2013/05/ Material_Deprivation.pdf (accessed April 28, 2016).
[15] Kretowicz, P., Chaberko, T., Grad, N. and Łebek, S. (2012). Geographical distribution of poverty In Poland. Prace Geograficzne, 130: 43-54, DOI: 10.4467/20833113PG.12.019.0660.
[16] Labudová, V., Vojtková, M., and Linda, B. (2010). Application of multidimensional methods to measure poverty. E & M Ekonomie a Management, 13(1): 6-22.
[17] Leskošek, V., and Dragoš, S. (2014). Social inequality and poverty in Slovenia – policies and consequences. Družboslovne Razprave, 30(76): 39-53.
[18] Loster, T., and Pavelka, T. (2013). Evaluating of the results of clustering in practical economic tasks. In: The 7th International Days of Statistics and Economics, Prague, September 19-21, 2013, pp. 804-818.
[19] Mack, J., and Lansley, S. (1985). Poor Britain, London: Allen and Unwin. Available at: http://www.poverty. ac.uk/system/files/poor-britain-Mack&Lansley.pdf
[20] Mareš, P., and Rabušic, L. (1996). K měření subjektivní chudoby v české společnosti. Sociologický Časopis, 32(3): 297-315.
[21] Mysíkova, M., Večerník, J., and Želinský, T. (2015). Impact of the Low Work Intensity on Poverty in the Czech Republic and the Slovak Republic. Ekonomický časopis / Journal of Economics, 63(6): 555-575.
[22] Nolan, B., and Whelan, C., T. (2010). Using Non -Monetary Deprivation Indicators to Analyse Poverty and Social Exclusion: Lessons from Europe? Journal of Policy Analysis and Management, 29(2): 305–325.
[23] Šoltés, E., and Ulman, P. (2015). Material deprivation in Poland and Slovakia - a comparative analysis. Zeszyty naukowe Cracow review of economics and management, 11(947): 19-36. Available at: http://dx.doi.org/10.15678/ZNUEK.2015.0947.1102.
[24] Stankovičová, I., and Vojtková, M. (2007). Viacrozmerné štatistické metódy s aplikáciami. Iura Edition, spol. s r. o. Oravská 17. 821 09. Bratislava Rok vydania: 2007. Počet tlač. strán: 261. Väzba: tvrdá. ISBN 978-80-8078-152-1. Cena: 445
[25] Stávková, J., Birčiaková, N., and Turčínková, J. (2012). Material deprivation in selected EU countries according to EU-SILC Income Statistics. Journal of Competitiveness, 4(2): 145-160, DOI: 10.7441/joc.2012.02.10.
[26] Štreimikienė, D., and Barakauskaitė-Jakubauskienė, N. (2012). Sustainable development and quality of life in Lithuania compared to other countries. Technological and Economic Development of Economy, 18(4): 588-607. Available at: http://dx.doi.org/10.3846/20294913.2012.708676.
[27] Townsend, P. (1979). Poverty in the United Kingdom: A Survey of Household Resources and Standards of Living. University of California Press Berkeley and Los Angeles. ISBN: 0-520-03871-1 (cloth), ISBN: 0-520-03976-9 (paper)
[28] Vojtková, M. (2014). Classification of EU countries on the basis of selected indicators od social inclusion using self-organizing maps. In: Nerovnosť a chudoba v Európskej únii a na Slovensku II, Košice: Technická

Volume XI, Issue 8 (46), Winter 2016
univerzita v Košiciach, October 22-24, 2014, pp. 112-119. Available at: http://www.ekf.tuke.sk/chudoba2014 /proceedings/PDF/14_vojtkova.pdf (accessed August 23, 2016).
[29] Želinský, T. (2010a). Porovnanie alternatívnych prístupov k odhadu individuálneho blahobytu domácností ohrozených rizikom chudoby. Ekonomický časopis / Journal of Economics, 58(3): 251–270.
[30] Želinský, T. (2010b). Analysis of poverty in Slovakia based on the concept of relative deprivation. Politická ekonomie, 58(4): 542-565, DOI: 10.18267/j.polek.746.
[31] Želinský, T. (2012). Changes in Relative Material Deprivation in Regions of Slovakia and the Czech Republic. Panoeconomicus, 59(3): 335-353, DOI: 10.2298/PAN1203335Z.
*** European commission (2015). European semester thematic fiche. Poverty and exclusion. Available at: http://ec.europa.eu/europe2020/pdf/themes/2015/poverty_social_exclusion_20151126.pdf (accessed July 20, 2016).
*** European commission (2016). 2016 European Semester: Country-specific recommendations. Available at: http://ec.europa.eu/europe2020/pdf/csr2016/csr2016_eccom2016_en.pdf (accessed July 21, 2016).
*** Eurostat (2015). People at risk of poverty or social exclusion. Available at: http://ec.europa.eu/eurostat/ statistics-explained/index.php/People_at_risk_of_poverty_or_social_exclusion (accessed May 8, 2016).
*** http://ec.europa.eu/eurostat/statistics-explained/index.php/Glossary:At-risk-of-poverty_rate (accessed August 25, 2016).
*** http://ec.europa.eu/eurostat/statistics-explained/index.php/Glossary:At-risk-of-poverty_gap (accessed August 25, 2016).
*** http://ec.europa.eu/eurostat/statistics-explained/index.php/Glossary:Income_quintile_share_ratio (accessed August 25, 2016).
*** http://ec.europa.eu/eurostat/statistics-explained/index.php/Glossary:Material_deprivation (accessed August 25, 2016).
***http://ec.europa.eu/eurostat/statisticsexplained/index.php/EU_statistics_on_income_and_living_conditions_%28EU-SILC%29_methodology_-_material_deprivation_by_dimension (accessed August 25, 2016).
***http://ec.europa.eu/eurostat/statisticsexplained/index.php/Glossary:Persons_living_in_households_with_low_work_intensity (accessed August 25, 2016).
*** http://ec.europa.eu/eurostat/en/web/products-datasets/-/TIPSUN20 (accessed August 25, 2016). *** http://ec.europa.eu/eurostat/web/products-datasets/-/tipslm70 (accessed August 25, 2016). *** http://ec.europa.eu/eurostat/web/europe-2020-indicators/europe-2020-strategy/headline-indicators-scoreboard
(accessed August 25, 2016). *** http://13i8vn49fibl3go3i12f59gh.wpengine.netdna-cdn.com/wp-content/uploads/2016/06/Social-Progress-Index-
2014-Executive-Summary.pdf (accessed September 2, 2016).
Journal of Applied Economic Sciences
Archaic Forms of Economic Activity in Peripheral Regions and Problems of Systematic Structural Reforms of the Russian Economy
Yuriy S. KOLESNIKOV North-Caucasus Research Institute of Economic and Social Problems
Southern Federal University, Russia [email protected]
Zhenny D. DARMILOVA
Department of World Economics and Management Kuban State University, Russian
Abstract: The article analyzes the role and scope of the rooted economy of peripheral regions, which constitute the significant
portion of archaic, traditional economic practices of the population, resources and informal institutions governing them. The study of traditional economic practices is carried out within the framework of the concepts of peripheral
economy, rooted economy and ethno-economy. The given statistic empirical evidence demonstrates the basic role of traditional economic practices of the population in the reproduction of resources of the rooted economy sector of the region. The hypothesis about the high level of commercialization of economic structures of ethno-economics is justified and confirmed by the sample of the economic-sociological research. It is shown that an integral part of the concept of structural reforms of the Russian economy should be the strategy of capitalization of economic resources of the archaic peripheral regions. Keywords: archaic economy, rooted economy, traditional economic practices, economic structure, peripheral economy. JEL Classification: A1, R12. Introduction
The modern theory of economics basically operates categories of market economy, in the optics of which it becomes more and more problematic to provide the description and interpretation of a number of objects, structures, processes and relations of economic reality.
In today’s world, especially in the countries that have returned to the market economy recently, entirely take place processes that reanimate the archaic economic structure – traditional economic practices, historically developed in specific natural-landscape and the economic-geographical conditions of living of the nations and ethnic groups.
Consideration of the market economy mechanisms as a self-sufficient, not needing taking in account the economic features of non-market and quasi-market forms of economic activity in theory and practice of economic reforms in Russia (where the extensive economic periphery with a large proportion of archaic economic practices of the population and traditional social institutions takes place) slows the economic growth and increases the risks of modernization of the Russian economy, especially makes complex the choice of an adequate model of structural reforms in the economy.
In this regard, it raises the necessity to update the problems of identification and evaluation of the potential of archaic, traditional economic practices in Russia, especially the problems connected with the search of strategies and mechanisms for their inclusion in the processes of modernization, the determination of the place of this segment in the models of structural reform of the Russian economy. So, archaic economic structures on an example of a typical peripheral regions of Southern Russia were considered in this study namely as an integral part of a mixed economy of Russia, which must become an operational strategic target in structural reform policy.

Volume XI, Issue 8 (46), Winter 2016
Conclusion Therewise, the study confirmed the proposition that economic archaic (ethnoeconomy) is the systemic (not
an afterthought. alien) element of the economy of Russian multiform peripheral regions and fulfills the key role in the reproduction process.
Small-commodity nature, social institutions regulating economic activities and archaic technological structure of this economy segment reflect not only its historical limitations and objective natural-economic conditions (scarcity of resources, isolation, fragmentation, lack of communication, harsh climatic conditions, landscape, etc.) to which the local population have to adapt to, creating a form of economic and social institutions, meeting these requirements. The evolution of forms of organization of production through the creation of large corporate structures is quite limited.
Economic practices of the population, as a rule, reflect the ethnic feature, have multi-specialized production and are regulated mainly by informal institutions, based on the authority and resources of the family, clan, type, neighborhood community, social communities, ethnic kinship and others.
The family labor, inherent economy, households ("court"), private farms, peasant farmers’ economy play the role of the main economic entity in this segment of the economy. As an object of strategic management of economic archaic (ethnoeconomy), firstly, appears as a certain integrity of resources, forms of economic activity regulation of social institutions and infrastructure.
Identification (operationalization) in the practice of public management of this economic sector is insufficient, incomplete, and reduces the level of control of the system in this area only as a "small business" (which is reflected in the practice of creation of "programs" for State support of small business in all regions). So, the entire sector of ethnoeconomy should become the object of control and strategy development based on a variety of forms and resources of family-labor farms that form the base of rooted sector of economy in the region. Secondly, the economic archaic is only partially regulated by market institutions and mechanisms. The main part of it is under the control of non-market and quasi-market regulation factors, that require a substantial expansion of indirect forms of state support to the population and economic activities in peripheral regions, especially the institutional (legal regulation of economic transactions in the interests of family-labor farms, organization (support for cooperative intentions of business entities), information (creation of unified information environment for access to the technologies. materials. investment), infrastructure (road development. logistics. marketing. service centers. etc.), including the expansion access of business entities of ethnoeconomy at the public procurement market, simplifying the interaction with regulatory. supervisory and law enforcement agencies.
The provided economic and sociological research fully confirmed the hypothesis that the marketability of business practices of the population of the region and the base value of reproducible resources for the economy of the Republic of Karachay-Cherkessia are at the high level.
The objective of a particular attention and importance in this case are the measures to reduce institutional deficits in the development of entrepreneurship in all sectors of multistructure economy in peripheral regions, convergence fragmented markets in the region on the basis of creating a modern transport and logistics infrastructure and the development of forms of cooperation links between producers, peasant farms with, forming a large network of business-structures.
So, the content of structural reforms in Russia conceptually cannot be restricted by more than once manifested tasks of macroeconomic proportions, the redistribution of financial flows in favor of the innovative economy sector, the decentralization of government, and the reduction of the government’s share in the economy, and others.
The most important systemic part of the structural economic reforms should be the creation of institutional and infrastructural conditions for the capitalization of the resources of the vast economic sector of the archaic (ethnoeconomy) peripheral regions, based on the initiative and activity of family-labor economies which could become an additional source of economic growth in Russia. Acknowledgment
This article was prepared with the financial support of RHSF "Cultural practices of the nation of the North Caucasus: Ethnoeconomics - XXI Century" project № 15-02-00200. The authors of this article express their gratitude to Professor Tambiev Abubakir Hasanovic and Associate Professor Bedzhieva Fatima Magomedovna for their help in organizing and conducting the field of sociological research on the territory of the of Karachay-Cherkess Republic.

Journal of Applied Economic Sciences
References [1] Bakhtizin, A. R., Buchwald, E. M., Kolchugina, L. Y. (2016), Ranking of Russian regions according to the
capacity and pace of socio-economic development. Region: Economics and Sociology, 2: 3-22. [2] Chereshnev, V. A., Tatarkina, A. N. (2015), Socio-economic potential as a basis of progressive development
in post-perestroika Russia. M.: Economics. [3] Ivanter, V. V. (2016) The Strategy of transition to economic growth. Studies on Russian Economic
Development, 27(1): 1-4. [4] Nefedova, T.G. (2008). Russian periphery as a socio-economic phenomenon. Regional Studies, 5 (20):14-31. [5] Sdasyuk, G. V., Baranskiy, N. N. (2016). The founder of national geography: the development of ideas, the
prevention of risks of social disintegration of Russia in the XXI century. Socio-Economic Geography. Bulletin of the Association of Russian Geographers and Social Scientists. 2.
[6] Suslov, V. I. (2015). Technological basis for reindustrialization of the country and the region. Region: Economics and Sociology, 4: 46-64.
*** Rosstat (2014). Regions of Russia: socio-economic indicators. M.: Rosstat.

Volume XI, Issue 8 (46), Winter 2016
Re-Examination of Calendar Anomalies in the Indonesian Stock Market
FAISALFaculty of Economics and Business
Syiah Kuala University, Darussalam, Banda Aceh, Indonesia [email protected]
M. Shabri Abd. MAJID Faculty of Economics and Business
Syiah Kuala University, Darussalam, Banda Aceh, Indonesia [email protected]
Abstract:
This study re-examines three well-known calendar anomalies of stock returns, including the effects of month-of-year, the turn-of-month, and the weekend in the Indonesian stock market during the period 2001 to 2014. The multiple regression analysis with dummy variables is employed to empirically re-examine differences of the stock returns in each calendar anomalies period. Out of the three calendar effects re-examined, the study only found the existence of two calendar effects, i.e., the turn-of-month and the weekend effects.
Two major findings are documented. Firstly, the returns were abnormally high on the last trading days of the month and on the first four-trading day of the subsequent month, respectively. Secondly, the returns were abnormally high on the Friday, but it was abnormally low on the Monday. The existence of these anomalies has imperative implications for the hypothesis of efficient market and the investors’ trading behavior. These findings shed some lights for the investors in determining the right timing for investing their monies as well as for gaining abnormal returns.
Keywords: stock market, calendar anomalies, abnormal returns, market efficiency, Indonesia.
JEL Classification: C32, C53, G39.
Introduction Calendar anomalies are anomalies in stock return that related to calendar, known as phenomena founded
in financial market; particularly in stock market. According to Brooks (2004), calendar anomalies could be loosely defined as the tendency of financial asset returns to portray systematic fashions at certain times of day, week, month or year. Several previous studies have been encountered an existences of calendar anomalies in many stock markets globally. These anomalies are of particular interest due to their presence contravenes the market weak-form efficient hypothesis, because asset prices are not random, but those asset prices predictable based on some calendar effects.
There are various types of calendar anomalies documented by previous researches. Returns are systematically lower or higher depending on the time of the day, the week day, the week of the month and the MoY (Elton and Gruber 1995). In certain months of the year, the stock returns are found to be highly abnormal as a result of month-of-year (MoY) effect, namely January, and in some trading days within a month as a result of the turn-of-month ToM effect. Lastly, in certain specific days of week, the stock returns are found to be highly abnormal as a result of the day-of-week (DoW) effect, namely Friday.
The studies on calendar anomalies have been intensively emphasized on the developed stock markets such as in the stock markets of the US (Gibbons and Hess 1981), Japan (Kato and Schalheim 1985), Canada (Tinic et al. 1987), Greece (Floros 2008), and Russia (Compton et al. 2013). Similar studies have also conducted on the emerging markets such as in Nigeria and Zimbabwe (Ayadi et al. 1998), Ghana (Ayadi et al. 1998), Jordan (Maghayereh 2003), eastern Europe (Ajayi et al. 2004), China (Gao and Kling 2005), Thailand (Chan et al. 1996; and Tangjitprom 2011), India (Raj and Kumari 2006), Bangladesh (Bepari and Mollik 2009; and Rahman and Amin 2011); Malaysia (Muhammad and Rahman 2010), and Pakistan (Khan et al. 2014). In addition, there have been some previous studies conducted across seven developed stock markets, comprising Australia, Japan, Canada, the UK, Japan, French and Singapore (Condoyanni et al. 1987) and across four Asian stock market, consisting of Malaysia, India, Singapore and Thailand (Chan et al. 1996).
Meanwhile, the studies on the Indonesian stock market have been limited comparing to the vast growing of the market in the region. Studies on the calendar anomalies on the Indonesian stock markets have been conducted by Kamaludin (2004), Cahyaningdyah (2005), Sumiyana (2008), and Iskamto (2015). These studies empirically investigated the DoW effect for the period 1993-2003 (Kamaluddin 2004), the week-four effect and the January effect for the period 2001-2003 (Cahyaningdyah 2005), the DoW and Monday effect for the period from January to December 2006 (Sumiyana 2008), and the weekly and monthly effects for the period 2010-2014

Journal of Applied Economic Sciences
(Iskamto 2015), respectively. These studies documented mixed evidences, some found the existences of the calendar anomalies and some other found the otherwise.
Unlike the previous studies on the calendar anomalies in Indonesia stock market, which only investigated several calendar anomalies and focused on shorter period of the study, this present study re-examined more comprehensive types of calendar anomalies and utilized a longer period of study. Specifically, this study has several advantages compared to the earlier studies on this issue in the Indonesian stock market. Firstly, this study tested three kinds of calendar anomalies, namely the MoY effect, the ToM effect, the weekend effect and the January effect. Secondly, this study utilized longer study period from 2001-2014 (15 years), comprising 3,369 observations. To the best of our knowledge, this study is among the first studies to re-examine the calendar anomalies in Indonesia by adopting the longest study period.
By using the daily stock returns and applying the parametric statistics by multiple regression analysis, the findings of this study are hoped to shed some lights for investors to design trading strategies to gain abnormal return on the basis of such anomalies.
The rest of the study is organized in the following sequences: the next section highlights the previous studies on the calendar anomalies both in the advanced and emerging markets. The research method and data, on which the analysis is conducted, are presented in the Section 3. Section 4 discusses the findings and implications of the paper. Finally, Section 5 concludes the paper.

Volume XI, Issue 8 (46), Winter 2016
Conclusions The purpose of the study is to re-examine the presence of calendar anomalies in stock market of
Indonesia during the period 2001 to 2014. The study empirically explored the existences of the three well-known calendar anomalies, i.e., the MoY effect or the January effect, the ToM effect, and the DoW effect. Empirical evidences showed that the ToY effect was inexistence in the stock market of Indonesia, even though the average abnormal return during December and January were relatively higher as compared to any other months. Then, the ToM effect was documented to exist in Indonesia, implying that the abnormal returns in the stock market of Indonesia was concentrated on some days within the last trading day, also on few trading days at the beginning of the next month. Finally, the study found that the weekend effect was also existed in the Indonesian stock market, denoting that the returns on Friday were abnormally high, while the returns on Monday were abnormally low.
In a nutshell, the study concluded that the calendar anomalies have existed in the Indonesian stock market during the period 2001 to 2014. These findings shed some lights for the investor in the Indonesian market to grasp the opportunity to make profit due to the existences of calendar anomalies in the market. However, the investor should also consider the transaction cost, if they want to exploit the opportunities of the weekend effect and the ToM effect. This could be very helpful to decide the investment timing for the investors. Thus, this allows the investors to develop the proper trading strategies to gain those abnormal profits on the basis of such anomalies.
The findings of the study are based on the methodology outlined above. For more reliable and robust findings, further studies should cover broader stock market worldwide with a comparative treatment. It is also suggested for further researches to investigate the existence of calendar anomalies across industrial sectors of the stock market, including the recent emerging of the Islamic stock markets. Additionally, further researches should utilize longer period of the study so that the finding could be generalized for different stock markets with similar characteristics. References [1] Agrawal, A., and Tandon, K. (1994). Anomalies or Illusions? Evidence from Stock Markets in Eighteen
Countries. Journal of International Money and Finance, 13: 83-106. Available at: http://dx.doi.org/10.1016/0261-5606(94)90026-4.
[2] Ajayi, R. A., Mehdian, S., and Perry, M. J. (2004). The Day-of-the-Week Effect in Stock Return: Further Evidence from Eastern European Emerging Markets. Emerging Markets Finance and Trade, 40 (4): 53-62. Available at: http://dx.doi.org/10.1080/1540496X.2004.11052582.
[3] Ariel, R. A. (1987). A Monthly Effect in Stock Return. Journal of Financial Economics, 18(1): 161-174. DOI 10.1016/0304-405X(87)90066-3
[4] Ayadi, O. F., Dufrene, U. B., Chatterjee, A. (1998). Stock Return Seasonalities in Low-Income African Emerging Market. Managerial Finance, 24(3): 22-33. Available at: http://dx.doi.org/10.1108/03074359810765408.
[5] Bepari, K., and Mollik, A. T. (2009). Seasonalities in the Monthly Stock Returns: Evidence from Bangladesh Dhaka Stock Exchange (DSE). International Research Journal of Finance and Economics, 24: 167-176, Available at: http://papers.ssrn.com.sci-hub.cc/sol3/papers.cfm?abstract_id=1654334
[6] Boudreaux, D. O. (1995). The Monthly Effect in International Stock Markets: Evidence and Implications. Journal of Financial and Strategic Decision, 8(1): 15-20. http://citeseerx.ist.psu.edu/viewdoc/download? doi=10.1.1.200.6880&rep=rep1&type=pdf
[7] Branch, B. (1977). A Tax Loss Trading Rule. Journal of Business, 50: 198-207. [8] Brooks, C. (2004). Introductory Econometrics for Finance. (6th Edition). The United Kingdom: Cambridge
University Press. Available at: http://hdl.handle.net/10.1002/ijfe.223 [9] Cahyaningdyah, D. (2005). Analisis Pengaruh Hari Perdagangan terhadap Return Saham: Pengujian Week-
Four Effect dan Rogalski Effect di Bursa Efek Jakarta. Jurnal Ekonomi dan Bisnis Indonesia, 20 (2): 175-186.

Journal of Applied Economic Sciences
[10] Chan, M. W. L., Khanthavit, A., and Thomas, H. (1996). Seasonality and Cultural Influences on Four Asian Stock Markets. Asia Pacific journal of Management, 13(2): 1-24. DOI: 10.1007/BF01733814
[11] Claessens, S., Dasgupta, S., and Glen, J. (1995). The Cross-Section of Stock Returns: Evidence from Emerging Markets. Policy Research Working Paper Series, The World Bank, 1505.
[12] Compton, W., Kunkel, R. A., Kuhlemeyer, G. (2013). Calendar Anomalies in Russian Stocks and Bonds. Managerial Finance, 39 (12): 1138-1154, Available at: http://dx.doi.org/10.1108/MF-03-2013-0067
[13] Condoyanni, L., O’Hanlon, J., Ward, C. W. R. (1987). Day of the Week Effect on Stock Returns: International Evidence. Journal of Business Finance & Accounting, 14 (2): 159-174. DOI 10.1111/j.1468-5957.1987.tb00536.x
[14] Damodaran, A. (1989). The Weekend Effect in Information Release: A Study of Earnings and Dividend Announcements. The Review of Financial Studies, 2(4): 607-980, Available at: http://rfs.oxfordjournals.org/ content/2/4/607.short.
[15] De Bondt, W. F. M., and Thaler, R. H. (1987). Further Evidence on Investor Overreaction and Stock Market Seasonality. The Journal of Finance, 42(3): 557-581. DOI 10.2307/2328371.
[16] De Bondt, W. F M., and Thaler, R. (1985). Does the Stock Market Overreact? Journal of Finance, 40(3): 793-808. DOI 10.1111/j.1540-6261.1985.tb05004.x
[17] Elton, E. J., and Gruber, M., J. (1995). Modern Portfolio Theory and Investment Analysis (5th Edition), USA: John Wiley & Sons, Inc.
[18] Floros, C. (2008). The Monthly and Trading Month Effects in Greek Stock Market Return: 1996-2002. Managerial Finance, 34(7): 453-464. Available at: http://dx.doi.org/10.1108/03074350810874415
[19] French, K., R. (1980). Stock Returns and the Weekend Effect. Journal of Financial Economics, 8(1): 55-69, DOI 10.1016/0304-405X(80)90021-5
[20] Gao, L., and Kling, G. (2005). Calendar Effects in Chinese Stock Market, Annals of Economics and Finance, 6, 75-88, Available at: http://www.aeconf.net/articles/may2005/aef060105.p
[21] Gibbons, M. R., and Hess, P. (1981). Day of the Week Effects and Asset Returns. Journal of Business, 54 (4): 579-596. Available at: http://www.jstor.org/stable/2352725
[22] Givoly, D., and Ovadia, A. (1983). Year-End Tax-Induced Sales and Stock Market Seasonality. The Journal of Finance, 38(1): 171-185, DOI 10.1111/j.1540-6261.1983.tb03633.x
[23] Granger, C., and Newbold, P. (1974). Spurious Regressions in Econometrics. Journal of Econometrics 2(2): 111-120. DOI 10.1016/0304-4076(74)90034-7
[24] Gujarati, D. N., and Porter, D. C. (2009). Basic Econometrics, Fifth Edition, Mcgraw-Hill, Singapore. [25] Gultekin, M. N., and Gultekin, N. B. (1983). Stock Market Seasonality: International Evidence. Journal of
Financial Economics, 12: 469-81. DOI 10.1016/0304-405X(83)90044-2
[26] Haugen, R. A., and Jorion, P. (1996). The January Effect: Still There After All These Years. Financial Analysts Journal, 52(1): 27-31. Available at: http://dx.doi.org/10.2469/faj.v52.n1.1963
[27] Iskamto, D. (2015). Anomaly Pasar pada Bursa Efek Indonesia. Jurnal Tepak Manajemen Bisnis, Volume VII (3): 388- 398.
[28] Kamaludin (2004). Calendar and Daily Information Effect in Jakarta Stock Exchange, Jurnal Bisnis dan Akuntansi, Volume XIV, (3): 273-292.
[29] Kato, K., and Schallheim, J. S. (1985). Seasonal and Size Anomalies in the Japanese Stock Market. The Journal of Financial and Quantitative Analysts, 20(2): 243-260. Available at: http://dx.doi.org/10.2307/2330958
[30] Khan, M. I., Khan, M. S., and Khan, A. (2014). Calendar Anomalies, Reality or an Illusion? KSE-Pakistan. Journal of Economics and International Finance, 6(4): 80-84. DOI 10.5897/JEIF2013.0488

Volume XI, Issue 8 (46), Winter 2016 [31] Lakonishok, J., Shleifer, A., Thaler, R., and Vishny, R. (1991). Window Dressing by Pension Fund Managers.
American Economic Review, 8(2): 227-231. DOI 10.3386/w3617
[32] Maghyereh, A. I. (2003). Seasonality and January Effect Anomalies in the Jordanian Capital Market. Retrieved. Available at: http://papers.ssrn.com/so13/papers.cfm?abstract_id=441081
[33] Muhammad, N. M. N, and Rahman, N. M. N. A. (2010). Efficient Market Hypothesis and Market Anomaly: Evidence from Day-of-the Week Effect of Malaysian Exchange. International Journal of Economics and Finance, 2 (2): 35-42. Available at: http://search.proquest.com/openview/d297956e2186fb13d0caa460ee78 d7ff/1?pq-origsite=gscholar
[34] Ng., L., and Wang, Q. (2004). Institutional Trading and the Turn-of-the-Year Effect. Journal of Financial Economics, 74(2): 343-366. Available at: http://dx.doi.org/10.1016/j.jfineco.2003.05.009
[35] Ogden, J. (1990). Turn-of-Month Evaluations of Liquid Profits and Stock Returns: A Common Explanation for the Monthly and January Effect. Journal of Finance, 45(4): 1259-1272. DOI 10.1111/j.1540-6261.1990.t b02435.x.
[36] Rahman, M. L., and Amin, A. S. (2011). Monthly Seasonality in Emerging Market: Evidence from Bangladesh, The Global Journal of Finance and Economics, 8 (1): 61-76. Available at: http://serialsjournals. com/serialjournalmanager/pdf/13 28864503.pdf.
[37] Raj, M., Kumari, D. (2006). Day-of-the-Week and Market Anomalies in the Indian Stock Market. International Journal of Emerging markets, 1(3): 235-246. Available at: http://dx.doi.org/10.1108/17468800610674462.
[38] Reinganum, M. R., and Shapiro, A. C. (1987). Taxes and Stock Return Seasonality: Evidence from the London Stock Exchange. Journal of Business, 60: 281-295. Available at: http://www.jstor.org/stable/2352814
[39] Rozeff, M. S., Kinney, W. J. (1976). Capital Market Seasonality: The Case of Stock Returns. Journal of Financial Economics, 3(4): 379-404. DOI 10.1016/0304-405X(76)90028-3
[40] Steeley, J. (2001). A Note on Information Seasonality and the Disappearance of the Weekend Effect in the UK Stock Market. Journal of Banking & Finance, 25(10): 1941-1956, Available at: http://dx.doi.org/10.1016/ S0378-4266(00)00167-9
[41] Sumiyana (2008). Day of the Week dan Monday Effect: Fenomena yang Terbuktikan tidak Konsisten di Pasar Modal Indonesia. Jurnal Manajemen Teori dan Terapan, 1 (1): 1-30. Available at: http://e-journal.unair. ac.id/index.php/JMTT/ article/view/2359/1709
[42] Tangjitprom, N. (2001). The Calendar Anomalies of Stock Return in Thailand. Journal of Modern Accounting and Auditing, 7(6): 565-577. Available at: http://www.davidpublishing.com/davidpublishing/Upfile/2/29/ 2012/201202296619 1525.pdf
[43] Tinic, S. M., Barone-Adesi, G., and West, R. R. (1987). Seasonality in Canadian Stock Process: A Test of the “Tax-Loss Selling” Hypothesis. Journal of financial and Quantitative Analysts, 22: 51-64. Available at: http://dx.doi.org/10.23 07/2330869.
Journal of Applied Economic Sciences
The Role of Human Capital in Providing Innovation Security of the Region
Anna A. MIKHAYLOVA Immanuel Kant Baltic Federal University, Kaliningrad, Russia
[email protected] Abstract:
Innovation security is one of the most important imperatives of sustainable development of the region in the long term. The primary task of providing innovation security in the region is to build and maintain its human capital, which is an embodiment of knowledge, competencies and motivations, concentrated in a particular area that are inseparable from their possessors. Article considers the major vital interests and threats to the region in the context of the development of its human resources component of the regional innovation system. The catalyst and inhibitor factors of building the capacity of the regional innovation system, affecting the overall competitiveness of the region are highlighted. The development of human resources component of the regional innovation system of the westernmost subject of the Russian Federation, an exclave on the Baltic Sea – the Kaliningrad region, is evaluated in the logic of innovation security approach. The role of human capital in the provision of innovation security of Kaliningrad region is shown.
Keywords: innovation security, human capital, regional innovation system, kaliningrad region.
JEL Classification: D83, D85, F52, O33.
Introduction Displacement of the researchers’ interest from studying the economic-geographical position of the region
towards its properties as a source of competitive advantage has occurred against the background of the empirical registration of a number of demographical phenomena conceptualized as ‘edge cities’ (Garreau 1991), ‘cities – states’ (Peirce 1993), ‘mega-regions’ (Florida 2008) and others, and the development of spatial (formerly social, human) capital theories (Becker 1964, Shultz 1971, Hall 1999, Ferragina 2013, Camagni and Capello 2013). From this perspective, the capital of the region is considered as a set of local assets (natural, human, organizational, cognitive, network) that make up its competitive potential. The idea of territorial cohesion made the central point of the new approach to regional development, which is the territorial dimension of sustainability and provides a basis for the collective development of the region in three areas: territorial efficiency, territorial quality, territorial identity (Torre and Wallet 2014). In each of the areas a significant attention is paid to man, as a source of competitive advantages of the territory (the carrier of knowledge, a part of the social capital, etc.), as a subject, that sets a vector of development of the territory, as the user of the infrastructure in a particular area. It should be noted that the dependence of the geography and social development factor has been noticed by the French sociologist of the XIX century Frederic Le Play, who wrote that the place determines the conditions of labour, and labour, in turn, determines the organization of the family and society as a whole (Le Play 1879).
The study of the social component of the region in its representation as a territorial socio-economic structure led to the formation of a special scientific approach to the competitiveness of the region, allowing to take into account the impact of social, cultural, cognitive proximities on the course of regional development processes (Mikhaylov 2016). From this perspective, the strategic competitive advantages of the region lie in tacit knowledge, which cannot be partially or completely alienated from its creator, codified and systematized. This knowledge is expressed in skills, abilities, experience, skilled personnel, technical practices, formalized norms of behaviour, culture, etc. The knowledge classification suggests that there is a pure tacit knowledge that cannot be codified, articulated or explicated, and the tacit explicit knowledge, which at the moment is implicit, but can be explicated in the future (Brokel and Binder 2007). The primary feature of tacit knowledge is its causal ambiguity generated by the inability of formal expression. The dual nature of this kind of knowledge is characterized by implicitness (i.e. tacitness), complexity, stability, integrity of transmission (Szulanski 1996). The diffusion of tacit knowledge reveals another special feature of its type – ‘stickiness’, characterized by increased complexity of its transmission. Sharing accumulated tacit knowledge between actors in the region is undertaken through collective learning process, visualized by David Kolb as a learning loop (Kolb 1976). Efficiency of learning depends on many factors: the difference in the technological processes of regional firms (knowledge base, agility in technological change, the nature of technologies), dependence on external sources of knowledge or information, such as other firms, suppliers and others, various depths in the level of technological development (Lall 2001). However, the primary role is played by the human capital that is accumulated in the region, which can be defined as a totality of innate abilities and acquired knowledge, skills and motivations localized on the common territory (Becker 1964).
Volume XI, Issue 8 (46), Winter 2016
Conclusion After the collapse of the USSR the innovation system of the Kaliningrad region has experienced significant
structural changes, including its human resources component. Dramatically reduced the number of research staff, their composition has changed. Due to the transition to a market economy model and the collapse of economic relations established in the Soviet period, there have been major changes in the region’s economy. As a result of the economic restructuring, a range of activities have minimized or reduced their significance (e.g. pulp and paper industry, ferrous metallurgy, light industry, etc.). This resulted in a decline in employment in these areas and the drop in the demand for corresponding skills.
At the moment, an innovation system of the Kaliningrad region is in its infancy. New institutions are being created, new actors emerge, new cooperative links and networks of cooperation are being formed, and new research directions are developing. In accordance with the requirements of the time, the objectives and priorities of the region have changed. The innovative model of development came to the forefront, which implies the presence of a high level of accumulated human capital. In this context, the key problems of the region associated with an increase in the efficiency of the HR component of its innovation system have aggravated, which is expressed in a low level of per capita income of the population, the presence of institutional and tariff barriers that restrict labour mobility, the lack of involvement of the population in continuous education and the narrow coverage of the current and future staffing needs by the regional educational system.
Some steps to address these problems in order to increase the innovation security in the region have already been taken. In the Kaliningrad region formed favourable conditions for the accumulation of knowledge and competences required for the economy of the region through the attraction of qualified specialists from abroad, and increasing the efficiency of internal education sector. With a substantial support from the state, in the region was founded and is actively developing one of the ten federal universities of Russia, included in the top-100 Russian universities. By the share of students as well as by the number of people employed with higher education, the Kaliningrad region is ahead of most of the NUTS2 regions of the Baltic Sea region and the subjects of the North-West Federal District of Russia. The region has an effective system of reproduction of academic staff, which enables to develop new breakthrough research areas such as life sciences, neuroscience, biochemistry, genetics and molecular biology, and others. References [1] Afonasova, M. A., and Bogomolova, A. V. (2013). Innovative security of the region in the context of
development of integration processes. VII International extramural scientific-practical conference Innovative Development of Socio-Economic Processes: Problems and Prospects.
[2] Bagaryakov, A. B. (2012). Innovational security in the system of a region's economic security. Economy of Region. 2: 302- 305.
[3] Bagaryakov, A. B., and Nikulina, N. L. (2012). Investigation of economic security in terms of relations “innovation security — innovation culture”. Economy of Region, 4: 178-185.
[4] Bagaryakov, A. B., Nikulina, N. L., Bystray, G., P., and. Pecherkina, M. S. (2014). Innovations in the Context of the Regional Economic Security. Upravlenets (The manager). 6(52): 54-59.
[5] Barchuk, I. D., and Maslennikova, O. A. (2013). Present-day aspects of innovation activities security and stimulation: problems and decisions. Bulletin of Orenburg State Agrarian University. 1(39): 122-125.
[6] Becker, G. S. (1964). Human Capital. N.Y: Columbia University Press. Available at: http://link.springer.com/ article/10.1186/s40172-014-0012-2
[7] Brokel, T., and Binder, M. (2007). The regional dimension of knowledge transfers – a behavioral approach. Industry and Innovation. 14 (2): 151–175.
[8] Burmistrova, T. V. (2011). Problems of innovative security of the Russian economy. International scientific conference “Innovative development of Russia's economy: the institutional environment”. April 20-22, 2011, Moscow State University.
[9] Camagni, R., and Capello, R. (2013). Regional competitiveness and territorial capital: a conceptual approach and empirical evidence from the European Union. Regional Studies. 9(47): 1383-1402.
Journal of Applied Economic Sciences
[10] Ferragina, E. (2013). The socio-economic determinants of social capital and the mediating effect of history: Making Democracy Work revisited. International Journal of Comparative Sociology. 1(54): 48-73.
[11] Florida, R. (2008). Who’s Your City? How the Creative Economy Is Making where to Live. New York: Basic Books.
[12] Garreau, J. (1991). Edge City: Life on the New Frontier. New York. Knopf Doubleday Publishing Group. [13] Golova, I., M. (2014). Substantiation the strategic priorities of innovation regional development security.
Economy of Region. 3: 218-232. [14] Hall, P. A. (1999). Social Capital in Britain. British Journal of Political Science. 29: 417-461. [15] Kolb, D. A. (1976). The Learning Style Inventory: Technical Manual. Boston. McBer and Company [16] Kormishkin, E. D., Sausheva, O. S. (2013). Innovative security as a condition for the effective functioning of
the regional innovation system. Regional Economy: Theory and Practice. 34(313): 2-8. [17] Kuklin, A. A., Bagaryakov, A. B., and Nikulina, N. L. (2013). Innovation security and living standards of the
population in the region. Bulletin of South Ural State University. 4(7): 20-25. [18] Kulagin, N. A. (2012). Criteria of the material and technical component as the element of AIC economic
security. Economics and Management, 4(89): 66-69. [19] Kuznetsova, E. I. (2015). Innovative security and prioritize the implementation of innovation policy in Russia.
National Interests: Priorities and Security. 31(316): 10-17. [20] Lall, S. (2001). Competitiveness, Technology and Skills. Cheltenhman: Edward Elgar. Cheltenham, UK;
Northampton, MA, USA: Edward Elgar. Available at: http://dx.doi.org/10.4337/978178195550555 [21] Le Play, F. (1879). Le ouvriers europeens [The European workers]. Vol. 1—6. Paris: Alfred Manne et fils. [22] Mikhaylov, A. S. (2016). Approaches to the identification of the boundaries of spatial networks as
multidimensional territorial socio-economic systems. International Journal of Economics and Financial Issues. 6(4): 1696-1701.
[23] Mikhaylova, A. A., and Mikhaylov, A. S. (2015a). Antecedents and Barriers to the Formation of Regional Innovation System: Case Study of the Kaliningrad Region. Modern Applied Science, 2(9): 178-187.
[24] Mikhaylova, A. A., and Mikhaylov, A. S. (2015b). Instruments of Innovation Security. International Journal of Economics and Financial Issues, 2(5): 128-135.
[25] Naboichenko, S. S., Kuklin, A. A., Myzin, A. L. et al. (2003). Diagnosis and modeling of development of higher education, scientific and technological capacity and regional economy. Ekaterinburg: Publishing house Ural state university.
[26] Peirce, N. R., Johnson C. W., Hall, J. S. (1993). Citistates: How Urban America Can Prosper in a Competitive World. Washington, D. C. Seven Locks Press.
[27] Sapir, E. (2007). Internationalization of knowledge and innovative security (in the context of geo-economics and global studies). World Order XXI: Worldview, World Order. The experience of humanitarian and social research / eds. V.N. Kuznetsov. - Moscow: Book and business: 219 – 241.
[28] Shultz, T. (1971). Investment in Human Capital. New York: The Free Press. Available at: http://journals.cambridge.org/abstract_S0022050700077391
[29] Sukhovey, A. V. (2014). The Problems of Providing Innovative Security in Russia. Economy of Region. 4: 141-152.
[30] Szulanski, G. (1996). Exploring internal Stickiness: Impediments to the transfer of best practice within the firm. Strategic Management Journal, 17: 27–43.
[31] Tatarkin, A. I., Lvov, D. S., Kuklin, A. A., Myzin. A. L. et al. (2000). Scientific and technological security of Russian regions: methodological approaches and results of diagnosing. Ekaterinburg: Publishing house Ural State University.

Volume XI, Issue 8 (46), Winter 2016 [32] Torre, A., and Wallet, F. (2014). Regional Development and Proximity Relations. Cheltenham: Edward Elgar
Publishing. *** Kaliningrad region in figures. (1968). Kaliningrad: Knizhnoe izdatelstvo. *** Kaliningradstat (1986). Kaliningrad region in the 11 Five-Year Plan: statistical yearbook. CSO RSFSR *** Rosstat (2015). Labour and Employment in Russia – 2015.: stat. collection. Moscow: Rosstat. *** Statistical management of the Kaliningrad Region. Kaliningrad: Knizhnoe izdatelstvo.
Journal of Applied Economic Sciences
The Time-Varying Correlation Between Macroeconomic Uncertainty, Inflation and Output Growth: Evidence from AR(p)-EGARCH Model for Sri Lanka
Said Zamin SHAH
Department of Economics, Faculty of Economics and Management University Putra1 Malaysia, Malaysia
and Department of Economics, Islamia College University2, Pakistan
Ahmad Zubaidi BAHARUMSHAH Department of Economics, Faculty of Economics and Management
University Putra Malaysia, Malaysia [email protected]
Abstract:
This study utilizes an AR(p)-EGARCH model to examine the causal links and volatility transmissions between inflation uncertainty, output growth uncertainty and macroeconomic performance measured by inflation and output growth in Sri Lanka for the period 1993-2014. The empirical results show that higher inflation does cause welfare loss, both directly and indirectly, through the inflation uncertainty channel. Thus, there is an overwhelming support for Friedman-Ball hypothesis that higher inflation is accelerating inflation uncertainty. Secondly, inflation is negatively affecting output growth (and its uncertainty) while inflation uncertainty is increasing output growth. Finally, output growth generates output uncertainty while there is no evidence of the mutual effects of nominal and real uncertainties on one another. Our estimated results suggest that policy makers should make use of monetary policy for achieving multiple policy objectives such as reducing inflation and its volatility while restoring sustained and stable economic growth.
Keywords: inflation uncertainty, output uncertainty, inflation, output growth, AR(p)-EGARCH, Sri Lanka.
JEL Classification: C22, C32, C51, C52, E0, E10, E30.
1. Introduction The central objective of macroeconomic policy makers is to attain economic growth and to keep inflation at
a low level. The reason is that high and volatile inflation is harmful to economic growth due to its significant welfare costs. Thus, the issue of whether inflation and its uncertainty have significant positive or negative effects on real economic activity, has been the matter of extensive debate among economists and policy makers because of its relevant policy purpose. The issue gets further significance in developing countries where high and volatile inflation frequently prevails. It is important for policy designers to understand the causal linkages and volatility transmissions between inflation and its uncertainty in order to design concrete macroeconomic policies for targeting inflation while considering sustained economic growth.
Inflation uncertainty is both the result and cause of higher inflation. Theoretically, the issue got significance with emergence of Friedman's (1977) claim that rising inflation leads to higher inflation uncertainty. Ball (1992) strengthened the Friedman’s idea by arguing that higher inflation not only cause inflation uncertainty but also poses significant negative welfare costs on real economic growth as it distorts the effectiveness of price mechanism and economic efficiency and results a decline in economic growth. Conversely, the positive effect of inflation uncertainty on level inflation was proposed by Cukierman and Meltzer (1986) while the negative effect is illustrated by Holland (1995). There is also ambiguous debate on the dynamic interactions between macroeconomic uncertainty and economic growth. There is also heated theoretical and empirical debate on the trade-offs between inflation and economic growth. Theories and related empirical studies on the relationship between inflation and economic growth have exhibited either no relationship such as Sidrauski (1967), negative relationship, such as Barro (1995), Fischer (1993) and positive relationship such as Tobin (1965) and Mallik and Chowdhury (2001). Further, both output uncertainty and inflation uncertainty may affect output growth and also have considerable direct and indirect effect on one another. Theoretically, there is a lack of consensus and empirically, the issue of liaison between macroeconomic uncertainty and inflation and output growth is still under the coverage of empirical research as there exists different views on the interaction between macroeconomic uncertainty and performance, particularly in developing countries. 1 43400 Serdang, Selangor, Malaysia 2 Peshawar, Khyber Pukhtunkhwa, Pakistan

Volume XI, Issue 8 (46), Winter 2016
Like the other emerging and developing countries, economic growth and price stability have been the twin leading objectives of monetary policy framework of Central Bank of Sri Lanka (CBS). Monetary policy authority has employed and even currently utilizing different policy measures (e.g. credit, monetary aggregate and interest rate channels etc.) from the very early till recent in various political regimes to attain these twin targets. The argument is that generally, monetary policy makers in Sri Lanka consider inflation as harmful to real economic activity and aims price stability an essential goal to restore sustained economic growth. As the empirical studies are still indecisive about whether the macroeconomic stability promotes output growth or output losses in the short run due to policy contractions. Following such line of reasoning, the main aim of this study is to empirically investigate the controversial and dynamic issue of the causal links and volatility transmissions between inflation, its uncertainty, output growth and real uncertainty for Sri Lanka3. Being located in a poor and relatively less developed region of the world and also as a developing country, the sample area is an ideal region for the increasing macroeconomic fluctuations and higher inflation. Historically, the country is inherited economic problems such as macroeconomic and political instability, over population, poverty and unemployment. This empirical analysis is made through utilizing the AR(p)-EGARCH type model to assess whether higher inflation is having any consequences on future inflation and economic growth and whether, output uncertainty and inflation uncertainty affect inflation and economic growth.
Our empirical findings show that higher inflation does cause negative welfare costs through direct and indirect channels. The estimated results also propose that inflation rate induces its uncertainty and reduces output uncertainty. Output growth is leading towards real uncertainty while there is negative effect of higher inflation on real economic activities and inflation uncertainty is positively affecting output growth. Thus, a robust evidence in support for the casual dynamics and volatility transmissions between macroeconomic uncertainty and inflation and economic growth would deliver a solid ground for the development of macroeconomic models to empirically test such multidimensional relationships, specifically in less developing countries.
The rest of the paper is organized as follows: section 2 briefly presents an overview of the existing theoretical and empirical literature on the causal links and volatility spillovers of macroeconomic uncertainty on macroeconomic performance; section 3 outlines empirical approach and estimation strategy while the data and data sources are presented are in the next section. The empirical results and discussions are documented in section 5, followed by final concluding remarks and policy recommendations.
3 This study is confined only to Sri Lanka as there is some literature (e.g. Javed et al. (2012), Chowdhry (2014) and Paul
(2012) on other three major South Asian economies like Pakistan, India and Bangladesh while for the rest of three countries (Nepal, Bhutan and Maldives), the required monthly data is not available.
Journal of Applied Economic Sciences
Conclusion and policy recommendations High and sustained economic growth along with low and stable inflation is the central objective of
macroeconomic policy but there is perceived trade-off between lowering inflation and attaining economic growth. Also, there is lack of consensus and clear cut empirical evidence on the effect of higher inflation on inflation uncertainty and its inverse. Importantly, the situation is also same on the effect of real uncertainty on output growth and inflation. This study has, therefore, empirically inspected the causal links between inflation, output growth and their related uncertainties in an ideal economy, experiencing high macroeconomic instability and economic uncertainty. The study also attempt to empirically determine whether uncertainty of both inflation and output growth rate is symmetric or asymmetric. Explicitly, the study tries to test the various related hypotheses developed by Friedman (1977), Ball (1992), Cukierman and Meltzer (1986), Pindyck (1991), Holland (1995) and Dotsey and Sarte (2000) by the testing of various parameters for Sri Lankan economy.
Using AR(p) - EGARCH methodology to measure conditional variances for both inflation and output growth, the empirical results have several important conclusions for the study area as well as for the other neighbouring developing countries. Firstly, the widely-used Friedman’s doctrine of positive impact of inflationary shocks on inflation uncertainty is strongly evidenced. Also, inflation is a negative determinant of economic growth as observed by the estimated results directly and indirectly (through the channel of nominal uncertainty as proposed by Friedman (1977) Thus, the estimated findings explore the view that higher inflation has real effects and demands for the goal of lower and stable inflation for the central monetary authority of the country. Secondly, output growth is a positive determinant of real uncertainty. This result is robust but theoretically, there is indecisive literature on the effects of real growth on its uncertainty. Still, our estimated results have important policy implications for the construction and designing of macroeconomic and macro econometric models for ensuring economic growth. The results also impart the view that policy makers should aim to attain stable and robust economic growth. Specifically, it evaluates the analysis of business cycles variability and economic growth and argues that unlike to the separate studies of the both (as evidenced in the earlier business cycles literature), the macroeconomic modelling makers should include both output growth and real variability in their macroeconomic modelling frameworks. Consequently, the claim that output growth is reducing real uncertainty does not appear to find support here. Thirdly, higher inflation is rising output growth uncertainty and inflation uncertainty is encouraging output growth. These results imply that higher inflation has not only its direct effect on inflation uncertainty but also on real growth and its stability.
The empirical findings of this study are vital to macroeconomic policy makers, macroeconomists, financial analysts, academicians and central bank officials in understanding the casual dynamics and volatility transmission between inflation, its uncertainty, output growth and real uncertainty. This study imparts guideline for them to take appropriate policy measures to maintain price stability along with output growth stimulation. This study eliminates the doubts existed in the empirical studies on the cause and effect of inflation and its uncertainty. It also specifies whether inflation has any significant effect on output growth and whether economic growth uncertainty has consequences for level growth and inflation. While filling the knowledge, this study has important theoretical implications for the policy makers to expectations formations and macroeconomic uncertainty process. In this study, the empirical strong evidence that inflation raises future inflation uncertainty necessitates the need for better monetary stabilization and demand for targeting inflation by independent authority of central bank. More importantly, the current macroeconomic environment of the Sri Lankan economy (where inflation is rising continuously), appeal for more dynamic stabilization policy implication for central banks to deal with high inflation along with safety to economic growth. The causal links between inflation, output growth and their uncertainties also augment the policy makers to explore the desirable policy frame work. The study also tests the validity of various hypotheses and point out the existing phenomenon in the study area. This study suggests the use of monetary policy for achieving multiple policy objectives such as reducing inflation and its volatility after considering economic growth. However, the study calls for empirical work needed on uncertainty of interest rate and exchange rate in order to better understand the causal direct and indirect interactions of inflation and output growth and their uncertainties. Further research may also require to examine the possible structural breaks and non-linearities of these variables and to augment the findings with other GARCH family models.
Volume XI, Issue 8 (46), Winter 2016 References [1] Baharumshah, A. Z., and Soon, S. V. (2014). Inflation, inflation uncertainty and output growth: what does the
data says for Malaysia? Journal of Economic Studies, 41(3): 370–386. Available at: http://doi.org/10.1108/JES-05-2012-0073
[2] Baillie, R., Chung, C., and Tieslau, M. (1996). Analyzing inflation by the fractionally integrated ARFIMA-GARCH model. Journal of Applied Econometrics 11(1): 23-40. Available at: http://doi.10.1002/(SICI)1099-1255(199601)11:1<23::AID-JAE374>3.0.CO;2-M
[3] Ball, L. (1992). Why does high inflation raise inflation uncertainty? Journal of Monetary Economics. 29(3): 371-388. Available at: http://doi.org/10.1016/0304-3932(92)90032-W
[4] Barro, R. J. (1995). Inflation and economic growth. working paper No: 5326. National Bureau of Economic Research. DOI: 10.3386/w5326
[5] Bernanke, B. (1983). Irreversibility, uncertainty and cyclical investment. The Quarterly Journal of Economics, 98(1): 85–106. Available at: http://doi.org/10.2307/1885568
[6] Berument, H., and Nergiz Dincer, N. (2005). Inflation and inflation uncertainty in G-7 countries. Physica A: Statistical Mechanics and Its Applications, 348: 371–379. Available at: http://doi.org/10.1016/j. physa.2004.09.003
[7] Bhar, R., and Hamori, S. (2004). The link between inflation and inflation uncertainty: Evidence from G7 countries. Empirical Economics, 29(4): 825–853. Available at: http://doi.org/10.1007/s00181-004-0220-x
[8] Bhar, R., and Mallik, G. (2010). Inflation, inflation uncertainty and output growth in the USA. Physica A: Statistical Mechanics and Its Applications, 389(23): 5503–5510. Available at: http://doi.org.10.1016/j.physa.2010.06.063
[9] Bhar, R., and Mallik, G. (2012). Inflation, inflation uncertainty and macroeconomic performance in Australia. Economic Analysis and Policy, 42(3): 305–318. Available at: http://doi.org.10.1016/S0313-5926(12)50031-7
[10] Black, F. (1987). Business cycles and equilibrium. Basil Blackwell, New York. [11] Blackburn, K., and Pelloni, A. (2004). On the relationship between growth and volatility. Economics Letters,
83(1): 123–127. Available at: http://doi.org/10.1016/j.econlet.2003.10.010 [12] Bollerslev, T. (1986). Generalized autoregressive conditional heteroskedasticity. Journal of econometrics,
31(3): 307-327. DOI: 10.1016/0304-4076(86)90063-1 [13] Bollerslev, T. (1987). A conditionally heteroskedastic time series model for speculative prices and rates of
return. The Review of Economics and Statistics, 542-547. Available at: http://doi.10.2307/1925546 [14] .Bollerslev, T., Chou, R. Y., and Kroner, K. F. (1992). ARCH modelling in finance: A review of the theory and
empirical evidence. Journal of Econometrics, 52(1-2): 5-59. DOI: 10.1016/0304-4076 (92)90064-X [15] Bollerslev, T., Engle, R., and Nelson, D. (1994). ARCH models, in Engle R. and McFadden D. (eds),
Handbook of Econometrics, Vol. IV, North Holland, Amsterdam, pp. 2959–3038. [16] Bredin, D., and Fountas, S. (2009). Macroeconomic uncertainty and performance in the European Union.
Journal of International Money and Finance, 28(6): 972–986. Available at: http://doi.org/10.1016/j.jimonfin.2008.09.003
[17] Brunner, A. D., and Hess, G. D. (1993). Are higher levels of inflation less predictable? A state-dependent conditional heteroscedasticity approach. Journal of Business & Economic Statistics, 11(2): 187-197.
[18] Bruno, M., and Easterly, W. (1998). Inflation crises and long-run growth. Journal of Monetary Economics. Available at: http://doi.org/10.1016/S0304-3932(97)00063-9
[19] Caporale, G., M., Onorante, L., and Paesani, P. (2012). Inflation and inflation uncertainty in the euro area. Empirical Economics, 43(2): 597–615. Available at: http://doi.org/10.1007/s00181-011-0489-5
[20] Caporale, T., and McKiernan, B. (1996). The relationship between output variability and growth: Evidence from post war UK data. Scottish Journal of Political Economy, 43(2), 229–236. Available at: http://doi.org/10.1111/j.1467-9485.1996.tb00675.x

Journal of Applied Economic Sciences
[21] Caporale, T., and McKiernan, B. (1998). The Fischer Black hypothesis: Some time-series evidence. Southern Economic Journal, 64(3): 765–771. Available at: http://doi.org/10.2307/1060792
[22] Carporale Tony, Mckiernan, B. (1997). High and variable inflation: Further evidence on the Friedman hypothesis. Economic Letters, 54(2): 65–68. Available at: http://doi.org/10.1111/j.1745-4565.2006.00066.x
[23] Chowdhury, A. (2014). Inflation and inflation-uncertainty in India: the policy implications of the relationship. Journal of Economic Studies, 41(1): 71–86. Available at: http://doi.org/10.1108/JES-04-2012-0046
[24] Conrad, C., and Karanasos, M. (2005). Dual long memory in inflation dynamics across countries of the Euro area and the link between inflation uncertainty and macroeconomic performance. Studies in Nonlinear Dynamics & Econometrics. Available at: http://doi.org/10.2202/1558-3708.1147
[25] Cukierman, A., and Gerlach, S. (2003). The inflation bias revisited: Theory and some international evidence. Manchester School, 71(5): 541–565.
[26] Cukierman, A., and Meltzer, A., H. (1986). A theory of ambiguity, credibility and inflation under discretion and asymmetric information. Econometrica, 54(5): 1099–1128. Available at: http://doi.org/10.2307/1912324
[27] Daal, E., Naka, A., and Sanchez, B. (2005). Re-examining inflation and inflation uncertainty in developed and emerging countries. Economics Letters, 89(2): 180–186. Available at: http://doi.org/10.1016/j.econlet.2005.05.024
[28] Davidson, R., MacKinnon, J., (1981). Estimation and Inference in Econometrics. Oxford University Press, New York.
[29] Devereux, M. (1989). A positive theory of inflation and inflation variance. Economic Inquiry, 27: 105–116. [30] Dotsey, M., and Sarte, P. D. (2000). Inflation uncertainty and growth in a cash-in-advance economy. Journal
of Monetary Economics. Available at: http://doi.org/10.1016/S0304-3932(00)00005-2 [31] Dickey, D. A., and Fuller, W. A. (1979). Distribution of the estimators for autoregressive time series with a
unit root. Journal of the American Statistical Association, 74(366a): 427-431. [32] Dickey, D. A., and Fuller, W. A. (1981). Likelihood ratio statistics for autoregressive time series with a unit
root. Econometrica: Journal of the Econometric Society, 1057-1072. [33] Fischer, S. (1993). The role of macroeconomic factors in growth. Journal of Monetary Economics. Available
at: http://doi.org/10.1016/0304-3932(93)90027-D [34] Fountas, S. (2001). The relationship between inflation and inflation uncertainty in the UK: 1885-1998.
Economics Letters, 74(1): 77–83. Available at: http://doi.org/10.1016/S0165-1765(01)00522-5 [35] Fountas, S. (2010). Inflation, inflation uncertainty and growth: Are they related? Economic Modelling, 27(5):
896–899. Available at: http://doi.org/10.1016/j.econmod.2010.06.001 [36] Fountas, S., and Karanasos, M. (2006). The relationship between economic growth and real uncertainty in
the G3. Economic Modelling, 23(4): 638–647. Available at: http://doi.org/10.1016/j.econmod.2006.03.002 [37] Fountas, S., and Karanasos, M. (2007). Inflation, output growth and nominal and real uncertainty: Empirical
evidence for the G7. Journal of International Money and Finance, 26(2): 229–250. Available at: http://doi.org/10.1016/j.jimonfin.2006.10.006
[38] Fountas, S., Karanasos, M. ,and Kim, J. (2002). Inflation and output growth uncertainty and their relationship with inflation and output growth. Economics Letters, 75(3): 293–301. Available at: http://doi.org/10.1016/S0165-1765(02)00009-5
[39] Friedman, M. (1977). Nobel Lecture: Inflation and unemployment. Journal of Political Economy, 85(3): 451–472. Available at: http://doi.org/10.2307/1830192
[40] Fuhrer, J. C. (1997). Inflation/output variance trade-offs and optimal monetary policy. Journal of Money, Credit, and Banking, 214-234.
[41] Granger, C. W. (1969). Investigating causal relations by econometric models and cross-spectral methods. Econometrica: Journal of the Econometric Society, 424-438. DOI: 10.2307/1912791
[42] Grier, K. B., Henry, Ó. T., Olekalns, N., and Shields, K. (2004). The asymmetric effects of uncertainty on inflation and output growth. Journal of Applied Econometrics, 19(5): 551–565. Available at:

Volume XI, Issue 8 (46), Winter 2016
http://doi.org/10.1002/jae.763 [43] Grier, K. B., and Perry, M. J. (1996). Inflation, inflation uncertainty and relative price dispersion: Evidence
from bivariate GARCH-M models. Journal of Monetary Economics, 38(2): 391–405. Available at: http://doi.org/10.1016/S0304-3932(96)01280-9
[44] Grier, K., Perry, M. (1998). On inflation and inflation uncertainty in the G7 countries. Journal of International Money and Finance, 17 (4): 671 - 689.
[45] Grier, K. B., and Perry, M. J. (2000). The effects of real and nominal uncertainty on inflation and output growth: some GARCH-M evidence. Journal of Applied Econometrics, 58: 45– 58. Available at: http://doi.org/10.1002/(SICI)1099-1255(200001/02)15:1<45::AID-JAE542>3.0.CO;2-K
[46] Gunasinghe, C. (2007). Inflation and economic growth: a case study of Sri Lanka. Proceedings of the fourth academic sessions. Available at: www.ruh.ac.lk/research/academic_session/2007-mergepdf/9-22.pdf
[47] Gylfason, T., and Herbertsson, T. T. (2001). Does inflation matter for growth? Japan and the World Economy, 13(4): 405–428. Available at: http://doi.org/10.1016/S0922-1425(01)00073-1
[48] Haslag, J. H. (1997). Output, growth, welfare and inflation: a survey theories on inflation and growth. Economic Review, Second Qua, 11–21.
[49] Heidari, H., Katircioglu, S. T., and Bashiri, S. (2013). Inflation, inflation uncertainty and growth in the Iranian economy: an application of BGARCH-M model with BEKK approach. Journal of Business Economics and Management, 14(5): 819–832. Available at: http://doi.org/10.3846/16111699.2012.670134
[50] Holland, A. S. (1995). Inflation and uncertainty: tests for temporal ordering. Journal of Money, Credit and Banking, 27(3): 827-837. Available at: http://doi.org/10.2307/2077753
[51] Hwang, Y. (2001). Relationship between inflation rate and inflation uncertainty. Economics Letters, 73(2): 179–186. Available at: http://doi.org/10.1016/S0165-1765(01)00482-7
[52] Hwang, Y. (2007). Causality between inflation and real growth. Economics Letters, 94(1): 146–153. Available at: http://doi.org/10.1016/j.econlet.2006.09.010
[53] Javed, S., and Khan, S. (2012). Inflation and inflation uncertainty nexus: empirical evidence from Pakistan. International Journal of Economics and Financial Issues, 2(3): 348–356.
[54] Jiranyakul, K., and Opiela, T. P. (2010). Inflation and inflation uncertainty in the ASEAN-5 economies. Journal of Asian Economics, 21(2): 105–112. Available at: http://doi.org/10.1016/j.asieco.2009.09.007
[55] Joyce, M. (1995). Modelling UK inflation uncertainty: The impact of News and the relationship with inflation. Bank of England Working Paper No. 30. Available at: https://ssrn.com/abstract=114788
[56] Kearney, P. S. C., and Chowdhury, K. (1997). Inflation and economic growth: a multi-country empirical analysis. Applied Economics, 29: 1387–1401. Available at: http://dx.doi.org/10.1080/00036849700000029
[57] Kevin B., Grier Mark J. P. (1998). On inflation and inflation uncertainty in the G7 countries. Journal of International Money and Finance, 17: 671–689.
[58] Klump, R. (2003). Inflation, factor substitution and growth. Working paper 280, EU Central Bank. Available at: https://www.ecb.europa.eu/pub/pdf/scpwps/ecbwp280.pdf?3743934bfc73fa90f36c13e27c163 da9
[59] Kontonikas, A. (2004). Inflation and inflation uncertainty in the United Kingdom: evidence from GARCH modelling. Economic Modelling, 21(3): 525–543. Available at: http://doi.org/10.1016/j.econmod.2003.08.001
[60] Madurapperuma. (2016). Impact of inflation on economic growth in Sri Lanka. Journal of World Economic Research, 5(1): 1-7. Available at: http://doi:10.11648/j.jwer.20160501.11
[61] Mallik, G., and Chowdhury, A. (2001). Inflation and economic growth: Evidence from four South Asian countries. Asia-Pacific Development Journal, 8(1): 123–135.
[62] Mohd, S.H., Baharumshah, A. Z., and Fountas, S. (2012). Inflation, inflation uncertainty and output growth : recent evidence from ASEAN 5-countries, Discussion Paper No. 07/2012, 30(7): 1–24.
[63] Nasr, A., Ben, and Ajmi, A. N. (2014). Causality between inflation and inflation uncertainty in South Africa : Evidence from a Markov-Switching vector autoregressive model, Mehmet Balcilar Goodness C. Aye Rangan Gupta Reneé van Eyden, (October). Available at: http://doi.10.1016/j.ememar.2015.05.003

Journal of Applied Economic Sciences
[64] Nas, T. F., and Perry, M. J. (2000). Inflation, inflation uncertainty, and monetary policy in Turkey: 1960–1998. Contemporary Economic Policy, 18(2): 170-180.
[65] Nelson, D. B. (1991). Conditional heteroskedasticity in asset returns: A new approach. Econometrica: Journal of the Econometric Society, 347-370. DOI: 10.2307/2938260
[66] Okun, A. (1971). The mirage of steady inflation. Brookings papers on economic activity. 1971, 2: 485-498. [67] Özdemir, Z., and Fisunoglu, M. (2008). On the inflation-uncertainty hypothesis in Jordan, Philippines and
Turkey: A long memory approach. International Review of Economics and Finance, 17(1): 1–12. Available at: http://doi.org/10.1016/j.iref.2005.10.003
[68] Paksha, Paul, B. (2012). Inflation–growth nexus: some bivariate EGARCH evidence for Bangladesh. Macroeconomics and Finance in Emerging Market Economies, (March 2015), 1–11. Available at: http://doi.org/10.1080/17520843.2012.695385
[69] Phillips, P. C., and Perron, P. (1988). Testing for a unit root in time series regression. Biometrika, 75(2): 335-346. DOI: 10.1093/biomet/75.2.335
[70] Pindyck, R. S. (1991). Irreversibility, uncertainty and investment. Journal of Economic Literature, 29(3): 1110–1148. Available at: http://doi.org/10.1007/s11146-007-9087-x
[71] Ramey, G., and Ramey, V. A. (1995). Cross-country evidence on the link between volatility and growth. American Economic Review, 85, 1138–1151. Available at: http://doi.org/10.2307/2118417
[72] Rizvi, S. K. A., and Naqvi, B. (2009). Asymmetric behaviour of inflation uncertainty and Friedman-ball hypothesis: evidence from Pakistan. 26th International Symposium on Money, Banking and Finance, Orleans, France.
[73] Rizvi, S. K. A., Naqvi, B., Bordes, C., Mirza, N. (2014). Inflation volatility: an Asian perspective. Economic Research-Ekonomska Istraživanja, 27(1): 280–303. Available at: http://doi.org/10.1080/1331677X. 2014.952090
[74] Sidrauski, M. (1967). Inflation and economic growth. The Journal of Political Economy, 75(6): 796–810. [75] Speight, A.E.H., Cm, A. (1999). UK output variability and growth : some further evidence. Scottish Journal of
Political Economy, 46(2). Available at: http://doi.10.1111/1467-9485.00127 [76] Taylor, J. B. (1979). Estimation and control of a macroeconomic model with rational expectations.
Econometrica, 47(5): 1267–86). Available at: http://doi.org/10.2307/1911962 [77] Thornton, J. (2007). The relationship between inflation and inflation uncertainty in emerging market
economies. Southern Economic Journal, 73 (4): 858-870. [78] Thornton, J. (2008). Inflation and inflation uncertainty in Argentina, 1810-2005. Economics Letters, 98(3):
247–252. Available at: http://doi.org/10.1016/j.econlet.2007.04.034 [79] Tobin, J. (1965). Money and economic growth. Econometrica, 33(4): 671–684. Available at:
http://doi.org/10.2307/1910352 [80] Ungar, M., and Zilberfarb, B. (1993). Inflation and its unpredictability--theory and empirical evidence. Journal
of Money, Credit and Banking, 25(4): 709–720. Available at: http://doi.org/10.2307/2077800

Volume XI, Issue 8 (46), Winter 2016
Population Dynamics: Geographical Differences in Countries of the Baltic Sea Region
Andrey P. KLEMESHEV
Department of Politics, Social Technologies and Mass Communications Immanuel Kant Baltic Federal University, Russia
Tatyana Yu. KUZNETSOVA Department of Geography, Environmental Management and Spatial Development
Immanuel Kant Baltic Federal University, Russia [email protected]
Gennady M. FEDOROV Department of Urban Planning, Land Management and Design
Immanuel Kant Baltic Federal University, Russia [email protected]
Abstract:
Prior to the 1990s, the population of all states of the Baltic region increased in spite of the countries’ natural, social, economic and political differences. Since then, the cross-country particularities have become significant due to the increased differences of both natural and, in particular, migratory population movements. Using the graphical-analytical methods and typology analysis techniques, the authors analyze demographics of the nine countries of the region and identify their demographic types by features of the specific components of their population dynamics.
The article presents the main reasons for the qualitative differences. It is noted that the concept of the Second demographic transition cannot be applied at least to a part of the Baltic region, and the attention should be paid to the interdependence of economic and demographic processes.
Keywords: baltic sea region, population dynamics, population reproduction, migration, second demographic transition.
JEL Classification: F22, F52, F66, J61.
Introduction In the second half of the twentieth century, there were dramatic changes in population dynamics in the
Baltic region countries1. In some states, such as the Nordic countries, the initially relatively high growth rate declined. In others, e.g. the Baltic States, the population began to decline since the beginning of the 1990s. In Russia, after the drop the number of inhabitants began to rise again in the 1993 – 2009. Germany saw a slight reduction in the 1970s and 1990s. In Poland, the population was shrinking in 2010 and in 2012 – 2015.
With all the differences of dynamics, ranks of countries in terms of population have not changed over 65 years. As before, the Russian Federation has the first place, Germany coming second, and Poland third, followed by Sweden, Denmark and Finland. The smallest in terms of population size are Lithuania, Latvia and Estonia.
In the context of the Baltic region states, the article considers the components of population dynamics (natural and migratory movement), as well as the main causes of emerging qualitative interstate differences in the demographic situation.
1 The countries of the Baltic region include Russia, Germany (until 1990 existed in the form of two states – Federal Republic
of Germany and East Germany – and West Berlin with its special status), Poland, the three Nordic countries – Sweden, Denmark and Finland and the three Baltic states, which until 1991 were part of the Soviet Union – Lithuania, Latvia and Estonia. All of these countries, and they alone, have access to the Baltic Sea, which has a significant impact on their development.

Journal of Applied Economic Sciences
Conclusion The analysis of demographic processes in the countries of the Baltic region enables identification of
several groups of countries differing not only in their specific population dynamics, but also in the level and specificity of the socio-economic development impacting on the geographical differences of demographic and migratory behavior of the population and, consequently, on indicators characterizing the demographic processes and structures. Current research results suggest four groupings: 1. Denmark, Sweden, and Finland: population growth is ensured by both the excess of births over deaths and the
influx of migrants. 2. Germany: a positive balance of migration fully or partially compensates for the natural loss of population, which
marked the first half of the 1970s. 3. Lithuania, Latvia, Estonia and Poland constitute a separate subtype: the population is reduced as a result of
natural population decline (since the beginning of the 1990s) and migration outflows (from 1989 – 1990). In Poland, the birth rate exceeded the death rate (except for a brief period from 2002 to 2005. with a small natural decrease) that partially or fully compensates the loss of migration.
4. Russia: a positive balance of migration fully or partially compensates for the natural loss of the population that was evident from 1992 to 2012.
The main disadvantage of the demographic situation in all countries of the Baltic region is sharply narrowed reproduction of the population, and a long-going depopulation. Attempts to replace the missing labor by the influx of migrants (in countries with a positive balance of migration), although being economically advantageous, can lead to unpredictable political consequences, especially when it comes to the influx of immigrants from countries with very different civilizational features. Therefore, it seems appropriate to undertake an active demographic policy aimed at increasing the birth rate to a level that provides at least the simple (i.e. basic) reproduction of the population. The outflow of the population (usually of young age) from countries with a high negative net migration (the Baltic states) makes it even more difficult to increase the birth rate and cannot be evaluated positively either from the standpoint of economic development of the respective countries or in terms of reproduction of the population. References [1]. Agafonov, N. T. (1970). About the Types of Demographic Situation in the Regions of the USSR, in
Proceedings of the V Congress of the Geographical Society of the USSR, 31-32 pp. [2]. Agafonov, N. T. (1982). Regional Economic and Demographic Situation: The Main Provisions of the
Concept, in Social Geography of the Kaliningrad region. Kaliningrad: Kaliningrad University Publishing, 25-42 [3]. Agafonov, N. T., and Golubev. A. N. (1973). Categories and Factors of Demographic Situation, in Applied
Demography. Moscow, 29-36 pp. [4]. Fedorov, G. M. (1984). Geo-demographic Situation: Theoretical and Methodological Foundations. Leningrad:
Nauka, 112. Available at: http://dx.doi.org/10.2478/bog-2014-0032 [5]. Fedorov, G. M. (2014). The concept of geo-demographic situation and geo-demographic typology of the
subjects of the Russian Federation, Bulletin of Geography. Socio-economic Series, 25: 101-114. [6]. Göler, D., Krišjāne, Z., and Bērziņš, M. (2014). International Migration in the Periods of Transition and Crisis:
the Case of Latvia. Baltic Region, 2: 75-85. DOI: 10.5922/2079-8555-2014-2-6. [7]. Lesthaeghe, R., and Van de Kaa, D. J. (1986). Two Demographic transitions? in Population: Growth and
Decline, ed Van de Kaa, D. J., and Lesthaeghe, R. Deventer: Van LoghumS laterus, 9-24 pp. [8]. Van de Kaa, D. J. (1999). Europe and its population: the long view, in European Populations: Unity in
Diversity, ed. Van de Kaa D. J., Leridon, H., Gesano, G., Okolski, M. Dordrecht: Kluwer Academic Publishers, 1-194 pp.
[9]. Van de Kaa, D. J. (2002). The Idea of a Second Demographic Transition in Industrialized Countries. Paper presented at the Sixth Welfare Policy Seminar of the National Institute of Population and Social Security, Tokyo, Japan, January 29, 2002. Available at: http://www.ipss.go.jp/webj-ad/webjournal.files/population/ 2003_4/kaa.pdf (accessed May 20, 2016)

Volume XI, Issue 8 (46), Winter 2016
Forecast of Development of the Russian Machine-Building Complex in the Context of Unstable Economic Environment
Olga V. KARSUNTSEVA
Samara State Technical University1, Russia [email protected]
Abstract: The article is devoted to identifying the peculiarities and justification of the priority areas of development of the machine-
building complex of the Russian Federation. Based on the analysis of statistical data on the state of the productive capacity of the Russian machine-building complex, the author has developed the scenarios of the strategic production potential of the Russian machine-building industry for the period up to 2025: inertial, modernization, partner; the choice of a partner scenario of development as the target has been justified. It was found that the Russian economy has necessary conditions and opportunities to solve the issue of complex modernization and ensure the pace of the advanced development of domestic machine-building enterprises. It is justified that an effective state import substitution program, which corresponds to modern requirements and is capable of ensuring the integrity and diversity of the process of transformation, must become the foundation for the realization of these goals.
Keywords: machine building, production potential, predictive model, scenarios of development, strategy, multiplier effect.
JEL Classification: E51, L60, L69.
Introduction The development of machine-building production in Russia in the medium and long term will be defined by
the volume of investment in the renewal of the material and technical base of the enterprises and by the level of competitiveness of the produced goods in the domestic and foreign markets. Investment activity of buyers will be the main factor in creating the demand for engineering products. The logical consequence of the activation of innovative activity should be an improvement in the competitiveness of enterprises in both domestic and foreign markets.
The results of the analysis of the prospects of strategic development of the Russian machine-building industry (Karsuntseva 2014) suggest the presence of three alternative solutions to a systemic problem.
1. Inertial scenario, which involves maintaining the current trends in the development of machine-building complex of the country without any major changes. The implementation of the inertial scenario will cause a further increase in the share of imports in the domestic market and the decline in the share of Russian exports with the sequential degradation of the domestic machine-building industry. The inertial scenario does not require any substantial action by the state. The role of the state can be minimized and be, for example, in continuation of policies to encourage certain areas of research and project activities, in maintaining an optimal level of tariffs on the import of equipment from abroad, in increase of the level of localization of production equipment, in subsidizing and other forms of support of domestic producers that do not contravene the conditions and requirements of the WTO. In the case of the implementation of the inertial scenario, the current negative trends in the development of the machine-building complex will remain, which may lead to further undesirable consequences:
§ production capacity of enterprises will decrease and stagnate (degrade) to a complete loss of the key technologies of the Russian machine-building industry;
§ share of imported equipment in the Russian market could grow to 90% within 5-7 years, and complete replacement of domestic products is possible for certain types of machinery equipment (Galeeva 2015);
§ reduction in the number of people employed in machine-building industry due to a sharp drop in production (Tatarskykh 2014).
The implementation of the inertial rate means an approaching industrial collapse, the loss of the domestic market, deterioration of production potential of the machine-building industry (Fatkhutdinov 2011). In this case, it will cause serious damage to the technological security of the Russian economy and sharp increase in the total costs in related industries (energy, metallurgy, mining sector, etc.) due to the increasing dependence on imports. The manifestation of the negative impact of foreign oligopolists on the Russian economy is also possible. In the
1 443100, Russia, Samara, Molodogvardeyskaya Street, 244

Journal of Applied Economic Sciences
macroeconomic scale, all this will lead to an increase in unemployment and social tension in society, a significant deterioration of the geopolitical position of the Russian Federation.
2. Modernization scenario that provides constant state support in the field of research and development of domestic producers and modernization of material and technical base of enterprises, in promoting the transfer of Western technology, in the implementation of measures to improve the investment attractiveness of the machine-building complex. Intensification of processes of creation of joint ventures with leading foreign manufacturers upon terms of technology transfer and a high level of localization of production is expedient in the interests of the national economy, as it allows to quickly master the production of new products and compete on equal terms with foreign companies in both domestic and foreign markets (Tsenina et al. 2016). State participation in the implementation of this scenario involves the formation of conditions to ensure the investment attractiveness of the Russian economy for the foreign capital. However, the importance of public control over the activity of enterprises of strategic importance for national security is worth noting (Ershova 2010). The modernization scenario is not considered further in the work as a target, as excessive amounts of investment at the design stage will lead to an outflow of funds and render impossible the normal implementation of the next stages of the life cycle of innovation – commercialization, diffusion and routinization.
3. Partner scenario is described by modern trends of formation and development of institutional and organizational alliances on the basis of close cooperation between public authorities and private businesses. It is an active use of possibilities of public-private partnership (PPP) (Deryabina 2010), which ensure the implementation of innovations throughout the entire period, from creating the project to its final phase (Starkey 2002). The positive results of the implementation of a partner scenario include: dynamics of growth in the number of innovative design-oriented businesses (Davenport and Beck 2002) in the machine-building complex; reducing the time to create and develop new products through strengthening the coordination of the research and development (Nilsson and Olve 2001); growth of co-financing from non-budgetary sources; increase in the likelihood of successful implementation of investment projects and rational choice of priority areas of research and development.

Volume XI, Issue 8 (46), Winter 2016
Conclusion Innovation and technological renovation of production facilities of the machine-building industry should
have a positive effect on the efficiency of economic activities of enterprises and their contribution to the formation of the general results of the socio-economic development of the country (Table 4).
The expansion of industrial activity will be followed by an increase in human resource potential, which has a positive impact on macroeconomic indicators such as employment and unemployment. However, it should be noted that the dynamics of the headcount of industrial production personnel will be somewhat lower than the rate of industrial production (Table 4). The increase in the personnel headcount will be ensured by the growth of production capacity and increase in the shift index, while the increase in production will primarily be determined by the productivity of labor. This factor will be crucial in shaping the performance of production activities of enterprises throughout the forecast period, and its value will be determined by the pace of renovation of production equipment. Table 4 - Assessment of the impact of raising the level of use of production potential of the machine-building industry on the
dynamics of macroeconomic indicators of the Russian Federation: the target scenario, %
Indicator Typical period 2014, %
Medium-term period (2016 - 2020)
Long-term period (2020 - 2025)
Rate of growth of gross value added 100 176 248 Rate of growth of the share of value added in production output 100 110 126
Rate of growth of the industrial personnel headcount 100 103 112 Rate of average wage growth 100 155 215
The main factor determining the formation of positive dynamics of macroeconomic indicators of Russia will be a multiplier effect obtained as a result of innovation and technological re-equipment of enterprises of the machine-building complex. The implementation of the integrated national program of import substitution in the machine-building industry will support cross-sectoral interaction, which would entail a substantial increase in investment and innovation activity in related industries. Sustainability of machine building and economy of the state as a whole will depend on the number of domestic manufacturers of machine-building products involved in the mechanism of innovation multiplier. This implies that an increase in the level of use and innovative development of the production potential has the dominant influence on the formation of the system of socio-economic factors in the development of the Russian economy, while the sustainability of economic growth is primarily determined by the level of innovation and investment activity of the enterprises of the real sector of the economy. References [1] Davenport, T., and Beck, J. (2002). The strategy and Structure of Firms in the Attention Economy. Ivey
Business Journal, 4: 48-53. [2] Deryabina, M. (2010). Gosudarstvenno-chastnoye partnerstvo: teoriya i praktika [Public-private Partnership:
Theory and Practice]. Available at: http://institutiones.com/general/1079-gosudarstvenno-chastnoe-partnerstvo.html (accessed 23.09.13)
[3] Dudin, M., Lyasnikov, N., Veselovsky, M., Aleksakhina, V., and Sekerin, V. (2014). The Problem of Forecasting and Modeling of the Innovative Development of Social-economic Systems and Structures. Life Science Journal, 11-8: 549-552.
[4] Ershova, I. V., and Kopytov, I. V. (2010). Gosudarstvennoye regulirovaniye i organizatsionnyye formy innovatsionnogo razvitiya promyshlennykh predpriyatiy [State Regulation and Organizational Forms of Innovative Development of Industrial Enterprises]. Management Issues, 11: 48-53.
[5] Fatkhutdinov, R. A. (2011). Proizvodstvennyy menedzhment [Production Management]. Saint-Peterburg: Peter, 496.
[6] Galeeva, E. I. (2015). Razvitiye Rossii v usloviyakh sanktsiy [Development of Russia in the Context of Sanctions]. Current Problems of Economics and Law, 2: 59-68.

Journal of Applied Economic Sciences
[7] Grabozdin, Yu. P. (2014). Sistema vzaimosvyazannykh pokazateley upravleniya kachestvom konsultatsionnykh uslug [System of Interrelated Indicators of Consulting Services Quality Management]. Bulletin of the Altai Academy of Economics and Law, 5 (37): 39-42.
[8] Karsuntseva, O. V. (2013). Conceptual Foundation of Detecting Reserves by Analyzing the Resource Component of the Productive Capacity. World Applied Sciences Journal, 26-7: 891-895.
[9] Karsuntseva, O. V. (2014). Proizvodstvennyy potentsial predpriyatiy mashinostroyeniya: otsenka, dinamika, rezervy povysheniya [Production Potential of Enterprises of Mechanical Engineering: Evaluation, Dynamics, Enhancement Potential]. Moscow: INFRA-M, 211.
[10] Lyasnikov, N., Dudin, M., Sekerin, V., Veselovsky, M., and Aleksakhina, V. (2014). The National Innovation System: The Conditions of its Making and Factors in its Development. Life Science Journal, 11-6: 535-538.
[11] Nilsson, F., and Olve, N. (2001). Control Systems in Multibusiness Companies: from Performance Management to Strategic Management. European Management Journal, 4: 344-348.
[12] Pecherskaya, E., Zhabin, A., Kamaletdinov, Y., and Grishina, P. (2015). Key Success Factors Analysis in the Context of Enterprise Resources Planning Systems Projects Implementation. Modern Applied Science, 9-5: 133-143.
[13] Prastacos, G., Soderquist, Y., and Van Wassenhove, L. (2002). An Integrated Framework for Managing Change in the New Competitive Landscape. European Management Journal, 1: 55-60.
[14] Salter, A., and Torbett, R. (2003). Innovation and Performance in Engineering Design. Construction Management & Economics, 6: 573-577.
[15] Starkey, K. (2002). Executives and Strategy. European Management Journal, 1: 20-26. [16] Tatarskykh, B. Ya. (2013). Strategic Areas of Efficiency Enhancement in the Machine-building Complex of
Russia. The Bulletin of the Samara State University, 10 (111): 89-94. [17] Tatarskykh, B. Ya. (2014). Osnovnyye organizatsionno-ekonomicheskiye problemy innovatsionno-
tekhnologicheskogo razvitiya mashinostroyeniya [Basic Organizational and Economic Problems of Innovative and Technological Development of Mechanical Engineering]. Bulletin of the Samara State University of Economics, 7 (117): 74-80.
[18] Tsenina, E., Danko, T., Ekimova, K., Sekerin V., and Gorohova A. (2016). Indication of Competitiveness of the Potential of the Region through Hurwitz and Wald Criteria. Global Journal of Pure and Applied Mathematics, 12-1: 325-335.
*** Promyshlennost Rossii [Russian Industry]. 2006. Moscow: Federal State Statistics Service (Rosstat), 460. *** Promyshlennost Rossii [Russian Industry]. 2008. Moscow: Federal State Statistics Service (Rosstat), 384. *** Rosstat. 2013. Tsentralnaya baza statisticheskikh dannykh [Central Statistical Database].
www.gks.ru/dbscripts/Cbsd/DBInet.cgi#1 (accessed 11.04.15)

Volume XI, Issue 8 (46), Winter 2016
Features of Migration Processes in Different World Industries in the Second Half of the XX Century
Irina RODIONOVA Peoples' Friendship University of Russia1, Russia
Tatiana KOKUYTSEVA Peoples' Friendship University of Russia, Russia
Alexandr SEMENOV Peoples' Friendship University of Russia, Russia
[email protected] Abstract:
The study of driving forces and particular changes in the territorial structure (or spatial organization) of the global industry is one of the traditional tasks for specialists in economic geography and economists. Its relevance is confirmed by the significantly accelerated processes dynamics in the context of globalization. The article shows that the structural approach in the study of changes in the spatial organization of the world industry must be combined with systemic and historical approaches. Therefore, the article presents the analysis of changes in the global industry for 50 years based on described selected research methodology. The authors reveal the forces, which have influenced the spatial organization of global industrial production, as well as characterizes structural changes and migration processes in the global industry taking place in the second half of the XX century. It is noted that the point of influence of the global industrial production has shifted to the Asian region.
Keywords: migration processes, industry, spatial dynamism.
JEL Classification: R12, F22, N50, N60.
Introduction Globalization and innovative development led to profound changes in the sectoral structure of the global
economy. The economy has been "servicized”. Currently, the proportion of the distribution and services (tertiary sector) in global GDP is 62.4% (the proportion of secondary industry is 31.1%, agriculture - 6.5%, 2014) (The World Factbook). However, recall that despite the domination of the distribution and services in the creation of the global GDP and employment of population, the source of the progress of civilization and its measure is the improvement of forms and methods of material production, and primarily industrial production.
Deindustrialization, considered from the perspective of having the reduction of employment in the global industry, does not mean "irrelevance" of this sector to the economy (Rodionova 2014). Industrial development is crucial in achieving high performance and efficiency of the whole economic mechanism.
In this study, we were interested in the processes taking place in the global industry in the second half of the XX century (from 1950 to 2000). Enhancing the role of manufacturing industry in the sphere of material production in the concerned period was caused by a number of features of the postwar economic development of all countries in the world. It should also be noted that a number of industries from other sectors of the economy actually moved into the industry (including that from public catering sector - the production of semi-finished products. Now many foods are available in the retail network after industrial processing, etc.). Construction industry, as a new sub-industry, was also developing rapidly: construction increasingly has become just the assembly of finished parts of buildings and structures. Mechanization in all sectors of the economy largely contributed to the increase in industrial output.
New productions and advanced industries, such as nuclear industry, aerospace, electronics, bio-industry, etc. emerged in global economy. Initially, their development was carried out in the sector of military production, and only after a while their emerged production of consumer goods based on military technical background. Today the largest part of the R&D expenses accounts for most advanced industry sectors. Many new products (chemical fiber, synthetic rubber, detergents, medicines, vitamins, etc.) were commercialized. New and even old industries were engaged in manufacturing of fundamentally new types of products with the same purpose that was produced previously, though more efficient and advanced. Thus, manufacturing of synthetic detergents such
1 Miklukho-Maklaya 6, Moscow, Russia. 117198

Journal of Applied Economic Sciences
as washing powder, cleaning preparations, bath gels and shampoos, etc. was entered into mass production. Technical improvement of traditional types of products was carried out commonly enhancing their production technology and quality. The impact of scientific and technological revolution has affected both the changing demand of production and consumer demand of the population that also determined the differences in the growth and development rates of individual plants and industries.
In the second half of the XX century, primarily under the influence of scientific and technological revolution, there were important shifts in both the sectoral structure of global industry and at the level of individual sectors of the manufacturing industry. Global industry system was formed based on the interaction of factors and the subordinated location of production facilities in many industries and various industrial territorial combinations in the territory of countries and regions. Changes occurred in various structures of global industrial production (global industry): industry-specific, organizational, and spatial structures.

Volume XI, Issue 8 (46), Winter 2016
Conclusion In summary, we conclude the following. A feature of the contemporary system of the global industry is its
high spatial agility. Analysis of large amounts of collected statistical data, calculations of indicators and indices of structural changes, and cartographic monitoring of industries at country and regional level allow us to conclude that in the second half of the XX century there were significant migrations of global industrial production in the various branches of mining and manufacturing. However, they had different nature: in some industries shifts, can be considered as pivotal, while in others they were ordinary. All industries included in the analysis have shown a regrouping of forces, the redistribution of global industrial production at both country and regional level.
At that, in the wake of the significant difference in the growth rate of industrial production in different regions of the world, they are more clearly differentiated into the advanced and the underperformed regions. The observed structural changes often correspond to the intensification of disparities in the distribution of industry on a global level rather than smoothing this level. Characterizing the spatial structure of global industrial production, it should be noted that the differences in terms of "North" – "South" (developed nations - developing countries) still remain. Though competition in global markets forces entrepreneurs of advanced nations to move "the lower and middle floors" of production to less developed countries (where labor is cheaper), especially if the workforce training level is sufficient for certain types of enterprises or industries. As already mentioned, shifts of production capacities to developing countries was noted in many industries.
Spatial redistribution of industrial production between countries and regions of the world occurs mainly due to the "semi-periphery" of the world economy. Industrial production moves to the countries of the "periphery" at a slower pace, whereas the countries of "deep periphery" (least developed, according to the UN terminology) are almost not included in international production.
The identification of the Asian priorities in the new situation of world industrial powers can be considered as the current general trend. We can say that there is a new balance of power. The point of influence of world industrial production, which previously was in Western Europe, in the second half of the XX century moved to North America, while currently it is directed to the Asian region.
Data analysis conducted by the authors on the development of the global industry in the period from 2000 to 2015, confirms once again previously identified trends and changes in the spatial organization of the world industrial production (Rodionova et al. 2009, Rodionova 2014, Rodionova et al. 2016). Acknowledgements
The article was supported by the Ministry of Education and Science of the Russian Federation (the Agreement No 02.a03.21.0008). References [1] Alaev, E. B. (1983). Social'no-ehkonomicheskaya geografiya: Ponyatijno-terminologicheskij slovar' [Socio-
economic geography: Conceptual and terminological dictionary], Moscow: Misl. Available at: http://www.geogr.msu.ru/cafedra/segzs/nauchd/pubs/stuff_pubs/SLOVAR%202013.pdf
[2] Alisov, N. V. (1987). O sootnoshenii i vzaimosvyazyah faktorov, uslovij i predposylok razmeshcheniya promyshlennosti kak kategorij raznyh sistem [About the ratio and relationships between factors, conditions and prerequisites of industrial distribution as different systems categories]. Issues of the Industrial Geography of the USSR and Foreign Countries, 5: 9-14.
[3] Alisov, N. V., and Khorev, B. S. (2000). Ekonomicheskaya i social'naya geografiya mira (obshchij obzor) [Economic and social geography of the world (the general review)], Moscow: Gardarika, in Sokol’skii, V. M., “Industry as an object of economic and geographic research (in terms of the chemical industry)”. DOI: 10.1134/S2079970511040101
[4] Baransky, N. N. (1990). Metodika prepodavaniya ehkonomicheskoj geografii [Methods of teaching economic geography]. Moscow: Prosveshchenie. Available at: http://mirznanii.com/a/174627/metodika-prepodavaniya-uroka-geografii
[5] Bolotin, B. M. (2001). Mirovaya ehkonomika za 100 let [The world economy for 100 years]. World Economy and International Relations, 9: 90-114.
Journal of Applied Economic Sciences
[6] Vitver, I. A. (1963). Istoriko-geograficheskoe vvedenie v ehkonomicheskuyu geografiyu zarubezhnogo mira [Historical and geographical introduction to the economic geography of the foreign world]. Publisher: Moskva, Gos. izd-vo geogr. lit-ry, 1963. OCLC Number: 28684450
[7] Witkowski, O. V. (1997). Geografiya promyshlennosti zarubezhnyh stran [The geography of foreign countries industry: Textbook]. Moscow: Moscow University Publishing House. Available at: http://mirznanii.com/a/ 306441/geografiya-ugolnoy-promyshlennosti-stran-sng
[8] Vol'skiy, V. V., and Kolosova, Yu. A. (1975). Gosudarstvennoe regulirovanie razmeshcheniya proizvoditel'nyh sil v kapitalisticheskih i razvivayushchihsya stranah [State regulation of productive forces distribution in the capitalist and developing countries]. Moscow: Misl.
[9] Gorkin, A. P. (2008). Prostranstvennaya organizaciya obrabatyvayushchej promyshlennosti mira v nachale XXI veka: metodika i metodologiya izucheniya [Spatial organization of global manufacturing industry in the early XXI century: Methods and methodology]. Bulletin of RUDN. The Economic Series, 1: 23-31.
[10] Granberg, A. G. (2000). Osnovy regional'noj ehkonomiki [The foundations of the regional economy], Moscow: National Research University Higher School of Economics.
[11] Gusakov, N. P. and Shkvarya, L. V. (2011). Vliyanie mirovoj ehkonomiki na razvitie mezhstranovyh torgovo-ehkonomicheskih otnoshenij v usloviyah globalizacii [The impact of global economy on the development of cross-border trade and economic relations in the context of globalization], The Scientific Review. Series 1. Law and Economics, 1: 3-18.
[12] Dmitrewsky, Yu. D. (1990). Ocherki social'no-ehkonomicheskoj geografii [Essays on the socio-economic geography]. Leningrad: Nauka.
[13] Zimin, B. N. (1991). Geografiya mirovogo hozyajstva. Geografiya mirovoj promyshlennosti [Geography of the world economy. Geography global industry]. Moscow: Institute of General Education, Institute of Geografy of the SSSR Academy of Sciences.
[14] Zimin, B. N. (2003). Razmeshchenie proizvodstva v rynochnoj srede [Production location in the market environment. From the works of B.N. Zimin]. Moscow: Alfa-M.
[15] Kokuytseva, T. V., Evtushenko, O. N. and Kashirin, A. I. (2015). Analiz mirovoj praktiki korporativnogo upravleniya innovacionnym razvitiem v naukoemkih otraslyah promyshlennosti [The analysis of world practice of corporate management of innovative development in knowledge-intensive industries], Microeconomics, 6: 54-58.
[16] Kokuytseva, T. V., Rodionova, I. A., and Galkin, M. A. (2013). Raskhody na nauchnye issledovaniya i liderstvo stran v proizvodstve i ehksporte vysokotekhnologichnyh tovarov v XXI veke: mir i Rossiya [Expenditure on research and leadership of countries in the production and export of high technology goods in the XXI century: the world and Russia]. ETAP: Economic Theory, Analysis, Practice, 3: 41 – 56.
[17] Kondratiev, N. D. (1993). Izbrannye sochineniya [Selected writings]. Moscow: Economy. [18] Kochetov, E. G. (2006). Geoehkonomika (Osvoenie mirovogo ehkonomicheskogo prostranstva). [Geo-
Economics (Mastering the world economic space)]. Moscow: Izd. BECK. [19] Lappo, G. M. (1997). Geografiya gorodov [The geography of cities]. Moscow: Vlados. Available at:
http://mirznanii.com/a/304145/geografiya-gorodov [20] Lipets, Yu. G., Pularkin, V. A. and Schlichter, S. B. (2000). Geografiya mirovogo hozyajstva: Uchebnoe
posobie dlya vuzov [Geography of the world economy: textbook for universities]. Moscow: Vlados. [21] Maergoiz, I. M. (1986). Territorial'naya struktura hozyajstva [The territorial structure of the economy].
Novosibirsk: Nauka. [22] Maksakovsky, V. P. (2009). Geograficheskaya kartina mira. Kn. 1 i 2 [Geographical pattern of the world,
book 1 and 2]. Moscow: Drofa. [23] Mironenko, N. S. and Tverdokhlebov, I. T. (1981). Rekreacionnaya geografiya [Recreational geography].
Moscow: Moscow State University.
Volume XI, Issue 8 (46), Winter 2016 [24] Probst, A. E. (1965). EHffektivnost' territorial'noj organizacii proizvodstva (metodologicheskie ocherki) [The
efficiency of territorial organization of production (methodological essays)]. Moscow: Nauka. [25] Rodionova, I. A., et al. (2009). Izmeneniya v prostranstvennoj organizacii promyshlennosti mira: vtoraya
polovina XX v. – nachalo XXI v. [Changes in the spatial organization of the industrial world: the second half of the XX century – beginning of XXI century]. Moscow: Ekon-Inform, pp. 8-19
[26] Saushkin, Yu. G. (1973). Ekonomicheskaya geografiya: istoriya, teoriya, metody, praktika. [Economic geography: history, theory, methods, practice]. Moscow: Mysl’.
[27] Khorev, B. S. (1981). Territorial'naya organizaciya obshchestva [Territorial organization of society]. Moscow: Nauka.
[28] Khrushchev, A. T. (1997). Ekonomicheskaya i social'naya geografiya Rossii [Economic and social geography of Russia]. Moscow: Kron-Press.
[29] Shishkov, Y. V. (1991). Proizvodstvennyj process vyhodit za nacional'nye granicy [The production process beyond national borders]. Moscow: Nauka.
[30] Schlichter, S. B. (1995). Geografiya mirovoj transportnoj sistemy. Vzaimodejstvie transporta i territorial'nyh sistem hozyajstva [The geography of the world transport system. The interaction of transport and territorial systems of the economy]. Moscow: Moscow University Publishing House.
[31] Schumpeter, J. A. (1982). The theory of economic development. Moscow: Progress. Available at: http://compaso.eu/wp-content/uploads/2013/01/Compaso2012-32-Croitoru.pdf
[32] Castells, M. (2010). The Information Age: Economy, Society and Culture. (Volume 1-3) Oxford: Wiley-Blackwell.
[33] Cristaller, W. (1966). The central places of Southern Germany. Englewood Cliffs, New York: Prentice-Hall. OCL Number: 192818
[34] Derunova, E., Semenov, A., Balash, O., and Firsova, A. (2016). The mechanisms of formation of demand in the high-tech. International Journal of Economics and Financial Issues, 6(1): 96-102.
[35] Fisher, Р. (1998). Globalization and competitiveness of regional blocks. Intereconomics, 33(4): 167-170. [36] Hamilton, I., and Ling, G. (1979). Spatial analysis of industry and the industrial environment. Industrial
Systems, 1: 1–23. [37] Hagerstrand, T. (1953/1967). Innovations for loppet ur Korologisk Synpunkt. (A. Perd, translated & reprinted).
Innovation diffusion as a spatial process. Chicago: Univ. of Chicago Press, p. 334. [38] Hirsch, S. (1967). Location of industry and international competitiveness. Oxford: Clarendon P. OCLC
Number 239367 [39] Isard, W. (1960). Methods of regional analysis. Publisher Cambridge: Published jointly by the Technology
Press of the Massachusetts Institute of Technology and Wiley, New York Available at: http://uf.catalog.fcla.edu/uf.jsp?st=UF002868868&ix=nu&I=0&V=D
[40] Kashirin, A., Semenov, A., Ostrovskaya, A., Kokuytseva, T. (2016). The modern approach to competencies management based on IT solutions. Journal of Internet Banking and Commerce, 21(1): 163-175.
[41] Kushida, K. E. (2015). The politics of commoditization in global ICT industries: A political economy explanation of the rise of Apple, Google, and industry disruptors. Journal of Industry, Competition and Trade, 1(15): 49-67.
[42] Lösch, A. (1940). Die räumliche Ordnung der Wirtschaft: eine Untersuchung über Standort, Wirtschaftsgebiete und internationalem Handel. Jena: Fischer. ISBN-10: 3878811632. ISBN-13: 978-3878811633
[43] Porter, M. (1998). Location, clusters, and the «new» micro-economics of competition. Business Economics, 33(1): 7-13.

Journal of Applied Economic Sciences
[44] Rodionova, I. (2014). World industry in post-industrial society: tendencies and regional shifts. Miscellanea Geographica - Regional Studies on Development, 18: 31-37.
[45] Rodionova, I., Sluka, N. (2016) Novaya geografiya mirovoi promishlennosni; globalnie trendi [The new geography of global industry: global trends]. - Moscow. Geography at School, 5: .5-15.
[46] Smith, A. (1962). Investigation on nature and reasons of nation riches. Moscow: Publishing House of Social-economic Literature.
[47] Vernon, R. (1966). International investment and international trade in product cycle. Quarterly Journal of Economics, 80: 190–207.
[48] Wallerstain, I. (1989). The modern world-system. New York: Academic Press. Available at: https://thebasebk.org/wp-content/uploads/2013/08/The-Modern-World-System.pdf
[49] Weber, A. (1909). Űbеr den Standort der Industrien Berlin. Tübingen: J.C.B. Mohr. ID Numbers Open Library. Internet Archive ueberdenstandort00webeuoft
*** World Steel Association. (2016). Available at: http://www.worldsteel.org (accessed June 14, 2016).
*** Mineral Commodity Summaries, (2016). US Geological Survey. Available at: http://www.worldsteel.org (accessed June 14, 2016).
*** The World Factbook – Central Intelligence Agency. (2016). Available at: https://www.cia.gov/library/ publications/the-world-factbook/geos/xx.html (accessed June 14, 2016).

Volume XI, Issue 8 (46), Winter 2016 The Model of Risk Assessment in the Management of Company's Competitiveness
Alexander CHURSIN
Peoples' Friendship University of Russia1, Russian Federation [email protected]
Andrey TYULIN Joint Stock Company Russian Space Systems2, Russian Federation
Alexander YUDIN Peoples' Friendship University of Russia, Russian Federation
[email protected] Abstract:
The article concentrates on the topical problem of studying and considering the stochastic factors in the process of managing competitiveness of high-tech corporations. The paper puts forward an economic-mathematical model, which describes negative factors and their influence on the cost indicators of a knowledge intensive project implemented by a company, which tries to add to its competitiveness. The advantage of this model is its ability to take into consideration the specific features of a particular knowledge intensive project. The results of calculations completed under the model are given in the form of model analysis.
Keywords: competitiveness management of a company, risk identification, project life cycle, project costs, economic mathematical modeling.
JEL Classification: L23, O12, D81.
Introduction It is a matter of fact that developing and manufacturing a product with new consumer properties often
comes amid various risk factors (Thornton 2003, Yoe 2011). One of company's characteristics, when its competitiveness is to be assessed, is the company’s ability to resist negative impact of uncertainty and risks (Chursin and Makarov 2015, Drucker 2007, Mensch 1975). As result it is necessary to identify and assess risks inherent in new projects of a company (Santo 1990, Hargadon 2007). The problem of identification and probabilistic estimate of risks in panning financial and economic activity of a company can be effectively addressed through the use of economic-mathematic modeling. The general approach in this case implies the assessment of potential losses derived from adverse impact of different risk factors with different probability of these factors manifestation. Methods
Consider the process of risk management in the new projects implementation by the company in terms of knowledge intensive products. The project for the development of a new high-tech product is implemented in some stages, which are its life cycle (Kahneman and Tversky 1979; Bianco 2009). It is characteristic of projects implemented by a high-tech company, to have a predictive life cycle of its implementation that is fully described in the project plan (Farr 2011). As a rule, each stage of the project differs from every previous one. Each stage of the project corresponds to a certain set of actions and operations (Suhányi and Suhányiová 2014). Every project has its specific sequence of stages (Osadchy 2006). The possible sequence for a high-tech project is shown in Figure 1.
1 6 Miklukho-Maklaya st, Moscow, 117198 Russian Federation 2 53 Aviamotornaya st, Moscow, 111250 Russian Federation

Journal of Applied Economic Sciences
Conclusion Prediction of probable losses in the preparation for the project activities on the production of space
products facilitates timely risk management and increase of the economic sustainability of the high-tech project implementation. Thus, measures for predicting and considering the probability of risk factors contribute to the preservation of the competitive advantages of the current project. Taking risks into account in the implementation of projects is one of the instruments that accompany the process of organizing the production of new types of products to enhance the company's competitiveness. Acknowledgement
This paper was financially supported by the Ministry of Education and Science of the Russian Federation on the program to improve the competitiveness of Peoples’ Friendship University (RUDN University) among the world’s leading research and education centers in the 2016-2020. References [1] Bianco, D. (2009). Growth and Competition in a Model of Human Capital Accumulation and Research.
Journal of Applied Economic Sciences, 4 (3): 341-348. [2] Chursin, A., Makarov, Yu. (2015) Management of Competitiveness. Theory and Practice. Springer
International Publishing [3] Drucker, P. (2007). Business and innovations. Williams. [4] Farr, J. V. (2011) Systems Life Cycle Costing: Economic Analysis, Estimation, and Management
(Engineering Management). CRC Press. [5] Hargadon, E. (2007). Innovation Management. Experience of leading companies. Williams. [6] Kahneman, D., and Tversky, A. (1979) Prospect Theory: An Analysis of Decision under Risk. Econometrica.
47(2): 263-291 [7] Mensch, G. (1979). Stalemate in Technology: Innovations overcome Depression, New York: Ballinger
(original 1975 German publication Das Technologische Patt: Innovation Uberwinden die Depression, Frankfurt: Umschau).
[8] Nechaev, A. S. and Antipin, D. A. (2012). Some Aspects of the Financing of Innovative Operation of the Enterprises in the Russian Federation. Modern Studies of Social Problems, 3(1).
[9] Nechaev, A. S., and Prokopieva, A. V. (2013). Risk Management Process Algorithm in Innovative Operation. Bulletin of Irkutsk State Technical University, 4 (75): 196-201.
[10] Nechaev, A.,S. and Prokopieva, A., V. (2014). Risk Identification and Management in the Enterprise Innovative Operation. Economic Magazine-XXI, 5-6: 72-77.
[11] O'Leary, D., E. (2000) Enterprise Resource Planning Systems: Systems, Life Cycle, Electronic Commerce, and Risk.. Cambridge University Press; 1st Edition (July 31, 2000).
[12] Osadchy, E., A. (2006). Investments and innovations in real production sector as a basis of formation of financial stability of domestic enterprises, Messenger of the Chuvash University (Humanities), 7: 418-422.
[13] Szántó, B. (1997). Technology Policy: The Implementation of Innovation as a Tool of Economic Development. Chapter from Central State to Free Global Market Economy. Volume 14 of the series NATO ASI Series, pp.95-105. DOI: 10.1007/978-94-015-8955-0_9.
[14] Suhányi, L., and Suhányiová, A. (2014). Multi-criteria decision-making tool design for the investment decisionmaking of territorial self-government regions. Journal of Applied Economic Sciences, Volume IX, 1(27): 110- 122.
[15] Thornton, A. C. (2003) Variation Risk Management: Focusing Quality Improvements in Product Development and Production. Wiley, 1st Edition (November 5, 2003).
[16] Yoe, C. (2011) Principles of Risk Analysis: Decision Making Under Uncertainty. CRC Press. 1st Edition.

Volume XI, Issue 8 (46), Winter 2016 Selected Determinants of Quality of Life and Their Implications for Health System
Adriana DUCOVA
Faculty of Economics Technical University of Košice3, Slovak Republic
[email protected] Abstract:
Health spending in European countries grew until 2009 at a faster pace than in other sectors of the economy and the health sector is gaining a larger share of gross domestic product (GDP). At a time of financial and economic crisis in 2008 many European countries have begun to reduce health expenditure in order to cope with large budget deficits and increasing debt ratio. Although these restrictions were necessary, some measures may have an impact on the modification of the fundamental objectives of health systems. Continuous monitoring of data, health indicators and health systems is now extremely important. For this reason, it is essential to underpin the underlying determinants of lifestyle diseases in developed countries which influence health financing system directly, as well as indirectly and they are reflected in many indicators and determinants of life expectancy.
In this paper, I pay attention to selected determinants such as alcoholism, smoking and obesity that have side effects apparent not only from a macro point of view, but also greatly affect the quality of life of individuals, whether in primary or caused intentions.
Keywords: health systems, healthcare, quality of life, determinants, alcohol consumption, taxes.
JEL Classification: H51, I15, I18.
Introduction European countries have spent considerable funds in recent decades to ensure the health of their
population. Life expectancy at birth has increased in the member states of the European Union (EU) by more than six years since 1980 and reached 79 years in 2010, with premature mortality significantly reduced. More than three quarters of this age can be projected to survive without limitation of activity. Increasing life expectancy has been stimulated and prompted by the improvement of living and working conditions and certain types of behaviour of citizens in relation to health and but also better access to healthcare and quality healthcare. This is declared by indicators of significant decrease in mortality after a heart attack or stroke. Improvement of health brings in many cases considerable financial costs and therefore is the question of financing the health systems a priority in most countries.
3 Němcovej 32, 040 01 Košice, Slovak Republic

Journal of Applied Economic Sciences
Conclusion Health indicators and data, they are based on need to be monitored because of several reasons. They are
extremely important for the assessment of the country and the effectiveness of its health sector. They can essentially affect the lifestyle of people and they overall well-being. The most important determinants are smoking, alcohol consumption and obesity, which are the subject of interest of this paper.
Social and economic costs cover the negative economic impacts of alcohol consumption on the material welfare of the society as a whole. They comprise both direct costs - the value of goods and services delivered to address the harmful effects of alcohol, and indirect costs - the value of personal productive services that are not delivered as a consequence of drinking. In industrialized countries, estimates of social and economic costs of alcohol use can reach a certain value of the Gross Domestic Product (GDP). Estimating the costs of the impact of alcohol on the material welfare of society is often difficult and requires estimates of the social costs of treatment, prevention, research, law enforcement, lost productivity and some measure of years and quality of life lost.
It is important to look at this problem also from another way, by a comparison of those costs and the benefits for the country, for the economy. It is also presented in this article. Basic costs that flow into the Slovak economy from alcohol consumption are high and are a big part of the state budget. Therefore, before every decision making, it is essential to take into account also this point of view and include it into the decision-making process to achieve he most optimal outcome for the health status of citizens and the homeland economy, also. References [1] Amato, L. et al. (2005). An overview of systematic reviews of the effectiveness of opiate maintenance
therapies: Available evidence to inform clinical practice and research. Journal of Substance Abuse Treatment, 28(4): 321-329, DOI: 10.1016/j.jsat.2005.02.007
[2] Antonosky, A. (1967). Social class, life expectancy and overall mortality. Milbank Memorial Fund Quarterly, 45: 31-73
[3] Arraras, J. I. et al. (2016). Quality of Life in Spanish advanced non-small-cell lung cancer patients: determinants of global QL and survival analyses. SpringerPlus, 5(1): 836. DOI: 10.1186/s40064-016-2559-9
[4] Babinčák, P. (2013). Measurement of quality of life: Overview studies analysis in selected data-bases [Meranie kvality života: Analýza prehl'adových štúdií vo vybraných databázach]. Ceskoslovenska Psychologie, 57(4): 358-371.
[5] Bakaniene, I., Prasauskiene, A., Vaiciene-Magistris, N. (2016). Health-related quality of life in children with myelomeningocele: a systematic review of the literature. Child: Care, Health and Development, 42(5): 625-643. DOI: 10.1111/cch.12367
[6] Bart, G. (2012). Maintenance medication for opiate addiction: The foundation of recovery. Journal of Addictive Diseases, 31(3): 207-225. DOI: 10.1080/10550887.2012.694598
[7] Blue, S. et al. (2016). Theories of practice and public health: Understanding (un)healthy practices. Critical Public Health, 26(1): 36-50, DOI: 10.1080/09581596.2014.980396
[8] De Maeyer, J. et al. (2013). Profiles of quality of life in opiate-dependent individuals after starting methadone treatment: A latent class analysis. International Journal of Drug Policy, 24(4): 342-350. DOI: 10.1016/j.drugpo.2012.09.005
[9] De Maeyer, J., Vanderplasschen, W., Broekaert, E. (2010). Quality of life among opiate-dependent individuals: A review of the literature. International Journal of Drug Policy, 21(5): 364-380. DOI: 10.1016/j.drugpo.2010.01.010
[10] Dixon, A. E. et al. (2010). An official American Thoracic Society Workshop report: obesity and asthma. Proceedings of the American Thoracic Society, 7(5): 325-335, ISSN: 19435665
[11] Gashi, A., Mojsoska-Blazevski, N. (2016). The Determinants of Students’ Well-being in Secondary Vocational Schools in Kosovo and Macedonia. European Journal of Education, 51(3): 333-344. DOI: 10.1111/ejed.12181
[12] Gavurová, B., Štefko, R., Bačík, R. (2014). The analysis of social services’ structure in a specific region and its significance for health and social policy in Slovakia. [Analiza struktury usług socjalnych w okreslonym

Volume XI, Issue 8 (46), Winter 2016
regionie i jej znaczenie dla zdrowia i polityki socjalnej na Słowacji]. Polish Journal of Management Studies, 10 (2): 43-53.
[13] Jolly, M., Sequeira, W., Block, J. A. (2014). Health and quality of life outcomes. Health and Quality of Life Outcomes, 12(1): 173. DOI: 10.1186/s12955-014-0173-5
[14] Krebs, E. et al. (2016). Characterizing long-term health related quality of life trajectories of individuals with opioid use disorder. Journal of Substance Abuse Treatment, 67: 30-37. DOI: 10.1016/j.jsat.2016.05.001
[15] Palenik, C. J. et al. (2013). Are the predictors of hookah smoking differing from those of cigarette smoking? Report of a population-based study in Shiraz, Iran, 2010. International Journal of Preventive Medicine, 4(4): 459-466.
[16] Singh, A. et al. (2016). heoretical basis and explanation for the relationship between area-level social inequalities and population oral health outcomes - A scoping review. SSM - Population Health, 2: 451-462. DOI: 10.1016/j.ssmph.2016.06.001
[17] Ştefanescu, L. et al. (2013). Quantitative Fire Risk Assessment Procedure at Pesticide Storage Facilities in Romania. NATO Science for Peace and Security Series C: Environmental Security, 134: 249-256. DOI: 10.1007/978-94-007-6461-3_22
[18] Šoltés, V., Gavurová, B. (2014a). Analysis of selected demographic aspects of day surgery in Slovak health policy. Journal of Applied Economic Sciences, 9(3): 142-152.
[19] Šoltés, V., Gavurová, B. (2014b). The possibilities of day surgery system development within the health policy in Slovakia. Health Economics Review, 4: 35. DOI: 10.1186/s13561-014-0035-1.
[20] Tokárová, V. et al. (2013). Feasibility and constraints of particle targeting using the antigen-antibody interaction. Nanoscale, 5(23): 11490-11498. DOI: 10.1039/c3nr04340a
[21] Wu, X. et al. (2016). Health behaviours, body weight and self-esteem among grade five students in Canada. SpringerPlus, 5(1): 1092. DOI: 10.1186/s40064-016-2744-x
*** International Agency for Research on Cancer Monograph Working Group (2013). Carcinogenicity of some drugs and herbal products. The Lancet Oncology, 14(9): 807-808.
*** Ministry of Finance of the Slovak Republic. 2015. http://www.finance.gov.sk/En/Default.aspx. *** Organisation for Economic Co-operation and Development (OECD). Health at a Glance: Europe 2014. OECD
Publishing. Available at: http://www.oecd-ilibrary.org/social-issues-migration-health/health-at-a-glanceeurope- 2014_health_glance_eur-2014-en
*** Slovensko.sk. https://www.slovensko.sk/sk/agendy/agenda/_spotrebna-dan-z-alkoholickych

Volume XI, Issue 8 (46), Winter 2016
1800
*** World Health Organization (WHO). Global status report on alcohol and health 2014. Geneva. ISBN: 978 92 4 156475 5
ISSN 2393 – 5162 ISSN - L 1843-6110