Volume 6 Issue 1 2013 - International Federation for Home ...
349
Volume 6 Issue 1 2013
-
Upload
khangminh22 -
Category
Documents
-
view
1 -
download
0
Transcript of Volume 6 Issue 1 2013 - International Federation for Home ...

Volume 6 Issue 1 2013


International Journal of Home Economics
i
This refereed journal is an official publication of the International Federation for Home Economics. Electronic access via IFHE website for subscribers and members only: www.ifhe.org
IJHE editor
Donna Pendergast AustraliaE-mail: [email protected]
Book review editor
Donna Pendergast AustraliaE-mail: [email protected]
Editorial administrator & graphic designer
Joy Reynolds AustraliaE-mail: [email protected]
Website
For more information please visit the International Journal of Home Economics website:
http://ijhe.weebly.com/index.html
Frequency of publication
The International Journal of Home Economics is published twice a year. Papers for review will be accepted throughout the year to e-mail: [email protected]
International Federation for Home EconomicsKaiser Friedrich Strasse 1353113 BONNGermanyTel: 0049 (0) 228 9212590Fax: 0049 (0) 228 9212591E-mail: [email protected]: www.ifhe.orgISSN 1999-561X

International Journal of Home Economics
ii
IJHE Editor
Professor Donna Pendergast, PhDSchool of Education and Professional StudiesGriffith UniversityGold Coast, AustraliaPhilosophy, research, education
Editorial Board Members
Dr Mona Sharaf Abdelgalil Department of Home Economics, Alexandria UniversityAlexandria, Egypt Food management; consumer studies; household activities and everyday life
Associate Professor Jette BennInstitute of Didactics, The Danish School of Education, Aarhus University DenmarkHome Economics education; Home Economics philosophy and history; consumer and nutrition education
Dr Vassiliki CostarelliHuman Ecology Laboratory, Department of Home Economics and Ecology, Harokopio UniversityAthens, GreeceNutrition and cancer; nutrition in childhood and adolescence; disordered eating attitudes and behaviours; nutrition in pregnancy/ postpartum depression; nutrition and the athlete
Professor Meei-Ruey HsuDepartment of Tourism, Ming Chuan UniversityTaiwanCurriculum and instruction; gender education; hospitality education; teacher education
Associate Professor Amoroso Catherine LeslieThe Fashion School, Kent State University, Ohio, United States of AmericaHistorical and biographical research, apparel and textiles, entrepreneurial activity, consumer behaviour, arts and crafts (or handicrafts)
Professor Sue LT McGregor Faculty of Education, Mount Saint Vincent UniversityHalifax, Nova Scotia, CanadaConsumer and global citizenship; consumer studies, policy and education; Home Economics leadership; Home Economics philosophy; transdisciplinary and integral inquiry
Kathryn McSweeney, MEdSt. Angela’s College Lough Gill, Sligo, IrelandEducational assessment; empowerment and advocacy studies; social marketing; teaching strategies in textiles studies; textile and embroidery samplers

International Journal of Home Economics
iii
Associate Professor Seema PuriDepartment of Nutrition, Institute of Home Economics, University of DelhiIndiaAging; food security; infant and child nutrition; institutional management; nutrition
Dr Janet ReynoldsPrincipal Education Officer, Teaching & Learning, Department of Education & TrainingQueensland, Australia
Professor Kaija TurkkiFaculty of Behavioural Sciences, University of HelsinkiFinlandConsumer citizenship; FCS in higher education; global education; Home Economics in higher education; Home Economics philosophy; household activities and everyday life
Dr Hena YasminDepartment of Home Economics, Faculty of AgricultureSwazilandChild care and development; consumer education; education; HIV/AIDS; household technology; nutrition
Professor Taemyung YooDepartment of Home Economics Education, College of Education, Gyeongsang National UniversityKorea
Griffith Institute for Educational Research
The International Journal of Home Economics gratefully acknowledges the assistance and support of the Griffith Institute for Educational Research.

International Journal of Home Economics IJHE Vol 6 No 1 2013
iv
Contents
Editorial Volume 6 Issue 1, call for papers, call for proposals, correction 1
Donna Pendergast
Food management challenges of working mothers in Abia State: coping strategies for sustainable future
5
Georgina O. Anozie
Meeting household nutritional needs and poverty reduction amid scarce household energy in Abia State, Nigeria
13
Georgina O. Anozie
Conceptualising of quantities by low-income consumers to guide recipe format 21
Sara S Duvenage, Wilna H Oldewage-Theron, Abdulkadir A Egal
Well-being: One personality at a time 34
Jeanne Godin
Money management practices in transition economies: how findings from Financial Literacy Surveys may inform Home Economics educators
48
Irina Kunovskaya, Brenda Cude, Joan Koonce
Effect of implementing eco-cooking at commercial cooking facilities 65
Ayako Mikami,Keiko Nagao
Male perception of an ideal body figure for a Swazi woman 78
Londiwe Mngomezulu & Pinkie Zwane
Nutritional and sensory properties of soybean and plain flour blends in cookies 89
Motunrayo Funke Olumakaiye
Factors associated with the consumption of selected vitamin A-rich foods in Iddo Local Government Area of Oyo State
97
Mojisola Fauziyah Oyewole
Prospects for the fit of ready-to-wear clothing 108
Kirsti Salo-Mattila
The impact of cooperative societies on the socio-economic status of the Obafemi Awolowo University Staff
122
Kolawole Soyebo
To what extent does compulsory schooling prepare professional cooks for later career transition?
132
Cam Woolcock
Notes for contributors 149

International Journal of Home Economics
1
Editorial Volume 6 Issue 1
Donna Pendergast
Publication in IJHE provides wide exposure to journal articles and adds to the professional literature base of the field. Theoretical papers, literature reviews, and a wide range of genres along with research papers are invited for publication in the journal. As editor, I strongly encourage submissions to the journal. The papers included in this issue of the journal represent a diverse range of genres but share a common thread—a strong link to enhancing wellbeing.
This issue of the IJHE includes a selection of the refereed papers presented at the IFHE XXII World Congress focusing on Global Wellbeing which was held in Melbourne, Australia from 16–21 July 2012.
As always, the articles have undergone rigorous, double-blind review, and are adding to the professional literature base of the field.
Professor Donna Pendergast, PhDEditor, IJHE

International Journal of Home Economics
2
Call for Papers
Special Issue of the International Journal of Home Economics
20th Anniversary of the International Year of the Family (IYF)
2014 marks the 20th Anniversary of the International Year of the Family (IYF), offering an opportunity to refocus on the role of families in development; take stock of recent trends in family policy development; share good practices in family policy making; review challenges faced by families worldwide and recommend solutions. The International Federation for Home Economics (IFHE) will support the anniversary with a campaign focusing on “Empowering
Families, Individuals and Communities through Home Economics.”
The International Journal of Home Economics (IJHE) will publish a special issue with a focus on family to align with this significant anniversary. The Journal will be published in December 2014. The intent of the special issue is to provide a platform for the examination of various aspects of family research and thus to foster progress in its theoretical development.
Conceptual and empirical research with a theoretical basis that advances knowledge are being sought. Studies using quantitative and/or qualitative approaches are welcomed. Also of interest are philosophical and contextual papers providing challenges and insights with regard to family studies.
Members and non-members of IFHE are encouraged to submit articles for review. Manuscripts should follow the usual journal guidelines and be submitted in full by the closing date. An e-mail with an abstract proposal is required by November 1 2013 to flag an interest in publishing in this exciting issue.
Interest in submitting a paper:
To: [email protected] date: 1 November 2013
Full paper submission details:
To: [email protected] date: 1 January 2014

International Journal of Home Economics
3
Call for Proposals
Guest editorial and special themed issue 2015
Members of the International Federation for Home Economics are invited to submit a proposal to serve as Guest Editor of the International Journal of Home Economics (IJHE) for a special themed issue related to their area of expertise of relevance to Home Economics in 2015.
An example of a forthcoming special issue in 2014 is the special issue themed on the 20th
Anniversary of the International Year of the Family (IYF).
Applicants are invited to provide the following proposal information by 1 January 2014:
Description of the proposed theme and a justification of its relevance to the Home Economics field of study – 3-500 words
Curriculum vitae of guest editor
Proposals to
To: [email protected] date: 1 January 2014

International Journal of Home Economics
4
Correction
Volume 5 Issue No 2 2012 carried a paper “Kenyan student teachers' health conceptualisations” that was attributed to Kari Dahl. This paper should have been attributed to Kari Kragh Blume Dahl.

International Journal of Home Economics
5
Food management challenges of working mothers in Abia State: coping strategies for sustainable future
Georgina O. Anozie
Michael Okpara University of Agriculture, Umudike, Nigeria
Abstract
The study identified the food management challenges of working mothers in Abia state and the coping strategies for sustainable future. To achieve the above objective, two research questions were employed. A purposive sample of 560 working mothers in Abia state was used for the study. A validated questionnaire was used for data collection. The data collected for the study was analyzed using means and standard deviation. The study revealed five majorchallenges faced by working mothers in the management of family feeding. These include scarce energy resources, lack of cooperation from their husbands, expensive food resources, time factor, and poor storage and preservation facilities. Working mothers in Abia state face some challenges in the management of family feeding. As a result of these challenges, family members are sometimes not adequately fed. Coping strategies for sustainable future were also recommended.
Key words: Food, management, working mothers, challenges, Abia state
Introduction
Food management is the application of management principles of planning, organizing,implementing and evaluating in solving the problems associated with feeding or the provision of foods (Anozie & Ekeh, 2009). It involves the utilization of the human resources of knowledge and skills in planning, controlling and organizing the non-human resources of money, food supplies and equipment to achieve good health (Muddie & Gottam, 1995; Anyakoha & Eluwa, 2007; Anozie & Ekeh, 2009). It is also viewed as a process of setting objectives for using available resources and formulating plans for achieving these objectives (Osuala, 1987; Anfani-Jones, 1993; Nwagbara, 1986. Food is not only a biological need but has also become an economic and political weapon in all countries of the world (Federal Ministry of Health, 2000). It is a material resource and its use provides for the realization of many other goals and values such as good health, wealth, happiness and love among others (United Nations, [UN] 2000). Globally, significant progress has been made in hunger reduction with the proportion of hungry people in developing countries dropping from 25% in 1970 to 16% in 1995 (UN, 2006). In spite of this success, the UN also noted that the number of underfed people remains unacceptably high at over 840 million. Food is scarce and many countries of the world are suffering from food insecurity.
Food and Agriculture Organization (FAO,2010) reported that prices of grains like rice have doubled while the cost of dairy products, soya beans, wheat and sugar have also surged. The

Anozie: Food management challenges IJHE Vol 6 No 1 2013
6
report also revealed that an estimated 10 million people are being pushed into hunger and poverty by soaring prices of foodstuffs. Miller and Branscum (2012) reported that increasing food prices contributed to the economic strain in the United States. They also reported that food choices and diet quality were influenced by food costs. Families faced with diminishing incomes consumed less expensive foods to maintain energy intakes at a lower cost and lower quality diets were consumed by individuals with limited economic means.
In Nigeria, as reported by Okoli (2009), common staple foods, including cereals, starchy roots,tubers, fruits, legumes such as cowpea, oil bean and bambara nuts, are also expensive.However, as the prices of foods continue to soar, much of the salary goes to food and households continue to have food crisis. Many families that could afford to buy food may lack skills and facilities for preservation and storage of the foods. In the absence of these factors, as noted by Adama and Obasi (2010), food might be contaminated with bacteria and virus,and, to a large extent, various forms of fungi and parasites. This could also lead to deficiency diseases. This calls for adequate management of available foods.
Food management implies meeting the nutritional needs of the family members, preventing malnutrition and avoiding food wastage and some nutritional deficiencies such as marasmus and kwashiorkor (Nwamara & Uwaegbute, 2007). Good management of foods is aimed at providing the consumers with nutritious and safe foods to achieve good health. This demands appropriate knowledge, skills and facilities which many working mothers may not possess. Working class mothers, are female workers employed by different tiers of government, organization and institution. Unlike the full-time housewives, these working mothers have limited time to carry out the household chores. It is, however, important that the working class mothers in Abia state manage family food and the related activities effectively so as to reduce nutritional deficiencies like marasmus and kwashiorkor. This can be achieved only when the food management challenges of these working mothers are identified and solutions proffered. This paper therefore identified the food management challenges of working mothers in Abia state and the coping strategies for sustainable future.
Research questions
This study sought answers to the following questions:
What are the major challenges working mothers face in the management of family feeding?
What are the coping strategies working mothers adopt in the management of family feeding?
Methodology
The study employed a survey research design. It was conducted in Abia state, Nigeria. The population for the study was made up of 4,989 working-class women from 10 establishments in Umuahia, capital of Abia state and its environs. A purposive sample of 560 married women was selected from the population of the study. A validated questionnaire was used for data collection. It was developed through extensive review of related literature and was based on the specific objectives of the study. Structured questions had response options of strongly

Anozie: Food management challenges IJHE Vol 6 No 1 2013
7
agreed, agreed, undecided, disagreed and strongly disagreed, corresponding to the values of5, 4, 3, 2 and 1, respectively, on a Likert scale. Any item with a mean of 3.00 and above was considered as agreed with (for research question 1) or adopted (for research question 2), whereas any item with a mean below 3.00 was considered as disagreed with or not adopted. Five hundred and sixty copies of the instrument were administered by hand with the help of two research assistants. The two research questions were answered using means and standard deviations.
Results
Research Question 1: What are the major challenges working mothers face in the management of family feeding?
The data for answering this research question is summarized in Table 1.
Table 1 Mean ratings of working mothers on the major challenges faced in the
management of family feeding
S/N Items (N=560) Mean Standard Deviation (SD)
Remark
1 Expensive food resources with low income 4.34 0.58 A
2 Scarce energy resources 4.13 0.67 A
3 Lack of cooperation from their husbands 4.12 0.67 A
4 Poor storage and preservation facilities 3.98 0.71 A
5 Time factor 3.89 0.69 A
6 Exhausting the food budget before the end of the month 3.06 0.78 A
Note: Mean ratings were on a 5-point scale where 5 was strongly agreed and 1 was strongly disagreed
Table 1 revealed five major challenges faced by working mothers in the management of family feeding (Items 1-5 with means ranging from 3.06–4.34). The respondents also see Item 6 (mean 3.06) as a challenge, but one that is not as serious as the challenges represented by the other five items. They all met the cut-off point of 3.00 and above. The SD ranged from 0.58 to 0.78 showing the closeness of the opinions of the respondents.
Research Question 2: What are the coping strategies working mothers adopt in the management of family feeding?
The data for answering this research question is summarized in Table 2.

Anozie: Food management challenges IJHE Vol 6 No 1 2013
8
Table 2 Mean ratings of working mothers on the coping strategies adopted in the
management of family feeding
S/N COPING STRATEGIES Mean Standard Deviation
(SD)
Remark
1 Using money budgeted for other family needs to make up feeding expenses 4.01 0.77 A
2 Purchasing ingredients on daily basis after office hours 3.90 0.80 A
3 House helps prepare the family meals most of the time 3.82 0.82 A
4 Heating left over foods every day when there is power failure 3.78 0.75 A
5 Buying only cheap ingredients to save money for other needs 3.77 0.72 A
6 Buying prepared food from a nearby restaurant most of the time 3.45 0.84 A
7 Purchasing ingredients in bulk and storing in the freezer 2.84 0.88 NA
8 Planning family weekly menu on weekends 2.65 0.70 NA
9 Storing prepared foods in the refrigerator or freezer 2.45 0.81 NA
10 Giving children money to buy what they like in the school 2.02 0.78 NA
11 Preparing a market list before making food purchases 1.98 0.79 NA
12 My husband provides extra money for family feeding when the need arises 1.88 0.82 NA
13 My husband prepares family meals when I am busy in the office 1.23 0.83 NA
Note: A=Adopted, NA= Not Adopted, Mean ratings were on a 5- point scale where 5 was strongly adopted
and 1 was not strongly adopted
Table 2 showed that the respondents adopted 7 out of 13 coping strategies identified (Items 1-7). These seven items met the cut-off point of 3.00 and above. The SD ranged from 0.70 to 0.88 showing the closeness of the opinions of the respondents.
Discussion
Some of findings from the current study corroborate previous research findings on the challenges faced by families in the management of family meals. These major challenges, asrevealed in Table 1, include scarce energy resources, lack of cooperation from husbands, limited time, expensive food resources, and poor storage and preservation facilities. The challenge of expensive food resources has the highest mean (4.34). This finding is in agreement with the reports from Miller and Branscum (2012) that increasing food prices contributed to the economic strain of families. Families faced with diminishing incomes consumed less expensive foods to maintain energy intakes at a lower cost and lower quality diets were consumed by individuals with limited economic means. They also reported that food choices and diet quality were influenced by food costs. This finding is also in consonance with the findings of Okoli (2009), who noted that in Nigeria common staple foods, including cereals, starchy roots, tubers, fruits, legumes such as cowpea, oil bean and bambara nuts,are also expensive. However, as the prices of foods continue to soar, much of the salary goes

Anozie: Food management challenges IJHE Vol 6 No 1 2013
9
to food and households continue to have food crisis. It is also consistent with report of FAO (2008), which revealed that prices of grains like rice has doubled while the cost of dairy products, soya beans, wheat and sugar have also surged in the recent months.
Table 1 also revealed that scarce energy resources was rated highly (mean 4.13) by the respondents as one of the major challenges they face in the management of family feeding. This finding is not far from the findings of Onyekuru, Eboh, Enete & Obizoba (2009) who found that the rise in oil prices and the associated increase in the prices of petroleum products that has occurred since the end of 2003 have had adverse effects on the users of petroleum products in all countries. The effects are felt especially in countries where price increases have been passed to a large extent or fully to end users. Poor storage and preservation facilities were among the major findings of this study. Lack of good storage and preservation facilities can easily lead to food poisoning as observed by Cesarani, Kinton, and Folkett (1995) and Anozie & Ekeh (2009), who noted that an outbreak of food poisoning is particularly likely to occur in eating places where foods are cooked and stored under poor conditions, which allow pathogens to multiply. This finding did not come as a surprise because of the problem of incessant power supply that is common in Nigeria.
Time was also identified as a challenge for these working mothers in managing the family feeding. This is understandable because most of these mothers leave their homes around 7.30am and return around 5pm after office work. Most of the time they come back to their homes and still do other household chores like washing clothes, cleaning and preparing the family meals. This is not an easy task, especially when their husbands are not cooperating as revealed in Tables 1 and 2. In Nigeria, it is the responsibility of the woman to prepare the family meals and do other household chores while men are the breadwinners. Presently, in many families, husbands and wives work to make ends meet. Some men provide little assistance to their wives, even when both of them are working. Some even find it difficult to provide money for feeding because they believe their wives are working and as such should provide the family meals.
Table 2 revealed the coping strategies adopted by the respondents to overcome the challenges they are facing in the management of family feeding. These coping strategies include buying only cheap ingredients, preparing those meals that require less time, purchasing ingredients after office hours and using house helps to prepare family meals. Others are buying prepared foods from restaurants, heating leftover foods and using money allocated for other family needs to make up. Most of these coping strategies adopted by the respondents are not advisable and cannot help the family members feed adequately now and in future.
Some of the coping strategies identified by the researcher in Table 2 which will help the respondents overcome some of the challenges found out in Table 1 were not adopted by the respondents. These include planning family weekly menus on weekends, storing prepared foods in the refrigerator or freezer and purchasing ingredients in bulk and storing in the freezer. Preparing a market list before making purchases was also not adopted by the respondents as a coping strategy. These findings are not in agreement with that of Anyakoha and Eluwa (2007), who noted that in the management of family feeding, the first step one has

Anozie: Food management challenges IJHE Vol 6 No 1 2013
10
to take is to make adequate planning for one to make wise purchases in the market and also feed the family adequately with the available resources. They also noted that it is important to prepare a market list before making purchases to spend wisely and reduce impulse buying.Olatoregun, Anozie and Okoh (2009) similarly noted that the family’s well being and health are dependent on how well their meals are planned by the home maker. Inappropriate food choices due to lack of knowledge contribute to nutrient inadequacies in many populations (Bruce & Meggitt, 2002). Since these working mothers have limited time to carry out the household chores, storing prepared foods in the refrigerator or freezer and purchasing ingredients in bulk and storing in the freezer will help those who can afford it save a lot of time. Another coping strategy that will help these working mothers overcome the identified challenges is cooperation from their husbands, but as revealed in Table 2, this cooperation does not occur in many families.
Conclusion
The following conclusions were drawn based on the findings of this study: The challenges working mothers in Abia state face in the management of family feeding include scarce energy resources, lack of cooperation from husbands, limited time, expensive food resources, and poor storage and preservation facilities. As a result of these challenges, family members are sometimes not adequately fed. Some of the coping strategies adopted by the working mothers in Abia state to overcome these challenges include buying only cheap ingredients, preparing those meals that require less time, purchasing ingredients after office hours and using house helps to prepare family meals. Others are buying prepared foods from restaurants, heating leftover foods and using money allocated for other family needs to make up the food budget. These coping strategies adopted by the respondents are not encouragingand cannot help the family members feed adequately now and in future.
Recommendations
Based on the findings of this study, the following recommendations were made:
1. Home economics and women’s associations should stress the need for adequate planning of family menu and purchasing of ingredients in bulk to save cost.
2. Government should subsidize the prizes of petroleum products to enable families to purchase scarce energy resources for family feeding.
3. Government should also support the agricultural sector to help bring down the prices of foodstuff.
4. Families should go into food production to obtain some of the required food resources from the family farm.
5. Meals should be prepared in advance and stored in the freezer to save time.
6. Husbands should be enlightened, through mass media, on the need to cooperate with their wives in the management of family feeding.
Anozie: Food management challenges IJHE Vol 6 No 1 2013
11
Biography
Dr Georgina Anozie is an associate professor and Head of Department of Home Economics/Hotel Management and Tourism, Michael Okpara University of Agriculture, Umudike, Abia State, Nigeria. Georgina researches and writes about clothing, foods, nutrition and health. Georgina is a member of IFHE, SNEB and HERAN. She has many articles in reputable journals both locally and internationally. E-mail: [email protected] or [email protected]
References
Adama, G. N., & Obasi, E. O. (2010). Food management practices of home makers: Case study of women workers university of Nigeria, Nsukka medical centre. Journal of Home Economics Research, 12, 130-137
Anozie, G. O., & Ekeh, J. I. (2009). Food management principles adopted by street food vendors in urban areas of Anambra state. Nigerian Journal of Home Economics (NigJHEC), 1(1), 77-82.
Anfani-Jones, M. E. (1993). Home management for senior secondary schools. Ibadan: University Press.
Anyakoha, E. U., & Eluwa, M. A. (2007). Home management for schools and colleges. Onitsha: Africana First Publishers Ltd.
Bruce, T & Meggit, C. (2002). Child care and education (3rd ed.). London: Hodder Arnold.
Cesarani, V. Kinton, V. & Foskett, D. (1995). Practical cookery. London: Hodder and Stoughton.
Food and Agriculture Organisation (2010). “The state of food insecurity in the world”. Retrieved on 9th June, 2012 from http://www.fao.org/docrep/016/i3027e/i3027e00.htm.
Federal Ministry of Health. (2000). National policy on food hygiene. Lagos: FM.
Miller, C. K. & Branscum, P. (2012). The effect of a recessionary economy on food choice: Implication for nutrition education. Journal of Nutrition Education and Behavior,44(2), 100-106. doi: 10.1016/j.jneb.2011.01.015
Muddie, P., & Gottam, A. (1995). The management and marketing of service. London: Butterworth Heinmann Ltd.
Nwagbara, C. C. (1986). Home management residency. Owerri: Government printer.
Nwamara J. U., & Uwaegbute, A. C. (2007). Organoleptic evaluation of buns snacks based on soyabean and yam flour blends. Journal of Home Economics, 3, 207-214.
Olatoregun, G.O, Anozie, G. O., & Okoh, E. (2009). Principles of meal management and nutrition. Nigeria: His Glory Prints.

Anozie: Food management challenges IJHE Vol 6 No 1 2013
12
Okoli, J. N. (2009). Basic nutrition and diet therapy. Nigeria: University of Nigeria Press.
Onyekuru, N. A. Eboh, E. C., Enete, A. A., & Obizoba, I. C. (2009). Household cooking energy use and expenditure. Nigerian Journal of Nutritional Sciences, 30, 62-68.
Osuala, E. C. (1987). Fundamentals of Nigerian marketing. Onitsha: Cape Publishers Ltd.
United Nations. (2006). Diet related chronic diseases and the double burden of malnutrition in West Africa. United Kingdom: Lavenhan Press
United Nations. (2000). Nutrition and agriculture. United kingdom: Lavenhan Press.

International Journal of Home Economics
13
Meeting household nutritional needs and poverty reduction amid scarce household energy in Abia State, Nigeria
Georgina O. Anozie
Michael Okpara University of Agriculture, Umudike, Nigeria
Abstract
The cost of cooking gas, kerosene and firewood has become so high in recent times that Nigerian families are confused about the present condition of living. This, coupled with irregularity in supply of cooking gas and kerosene, frequent power failure and uncertain supplies of fossil fuels, makes domestic energy consumption an area of concern for families, especially in Abia state. This study examined the effect of scarce household cooking energy on families in Abia state and also identified coping strategies adopted by households for sustainable living. The study was carried out in Abia state, Nigeria. Multistage sampling method was used to select a total of 260 respondents. Validated questionnaire was used to collect relevant data from the respondents. Data was analyzed using descriptive statistics. The findings of the study revealed that households in Abia state spend up to 12% of their income on household cooking energy (kerosene, gas and firewood). It was also found out that nutritious foods such as beans and peas are not popular because they require more energy for cooking. Reduction in the feeding allocation, poor storage and preservation facilities, malnutrition, food-borne diseases and inadequate supply of water are some of the adverse effects of scarce household energy on families. It was found that, to alleviate some of these problems, families had to substitute one type of fuel for others depending on the situation. Some rich families use a renewable source of electricity (solar). Others use mainly ready-to-cook foods to save fuel while some families prefer to eat outside in restaurants and hotels to save money. Money for daily household food needs is sacrificed for the purchase of cooking energy. This is inevitable as energy is required on a daily basis to cook food. The consequence is that poor households are deprived of daily adequate diet and thus suffer malnutrition and food-borne illnesses. Reduced reliance on oil for cooking and diversifying by the use of non-petroleum sources of energy are solutions for families who can afford it. A proactive and pragmatic approach to the issue of price might involve upholding the policy of subsidy at least for kerosene because it is the most common cooking energy for the households. This will go a long way to help households achieve a sustainable future.
Keywords: Household, nutrition, cooking energy, poverty reduction, coping strategies
Introduction
United Nations has organized many conferences in the past to solve the energy problems of the third-world countries, but the problem is still not solved. In Nigeria, like most developing countries, transportation links between the urban and the rural areas are not well developed.

Anozie: Meeting household needs and poverty reduction IJHE Vol 6 No 1 2013
14
In most cases, transporting domestic fuels from where they are produced to a point where households can access them is very expensive due to remoteness, distances involved and poor roads. In most of the rural areas and even some urban areas, electricity as a source of energy is not available. Despite poor access to modern energy services, poor people often spend a significant proportion of their scarce income on energy.
In urban areas, especially those experiencing wood scarcities around their perimeter, the price of fuel wood for cooking often is higher than modern fuels. Although the poor do have less energy expenditure than more wealthy households, energy as a percentage of total expenditure is often well above ten percent of their income. Absence of sufficient biomassbrings serious negative socioeconomic consequences for the rural livelihood (Arnolds, Kohlin, Persson, & Shepherd, 2003; Mekonnen, 1999). The rural population thus depends largely on wood fuel as their major source of energy. The scarcity of firewood has put pressure on trees and other woody vegetables, and this has ecological consequences. Available firewood cannoteven meet the energy needs of the rural dwellers. The demand for firewood in recent times has increased so much that the trend for those who can afford it is to use kerosene and natural gas for cooking. This has led to an increase in demand for kerosene and gas in spite of the high cost.
Malnutrition is on the increase as nutritious processed foods such as beans and peas are not popular, because they require much energy for cooking (Rossete, 2006). A single meal daily is common in many homes. The diet of people in developing countries is adversely affected by scarcity of cooking energy. In some places, people are forced to barter some of their limited food supplies to obtain fuel to cook the rest. It is therefore important to note that reducing the cost of fuel increases money for food (Darwin, 2006).
Cooking energy accounts for about 90% of all household energy consumption in developing countries. Worldwide, 2.5 billion people use biomass fuels (fire wood, charcoal or wood) for cooking (International Energy Agency, [IEA] 2002). Especially women and children suffer from eye irritation and cough caused by the exposure to smoke from inefficient cook stoves. In order to combat diseases caused by particulate matter in indoor air, the United Nations and World Health Organization have founded the Global Alliance for Clean Cook Stoves (GACC, 2011), a public-private partnership of different stakeholders who work together in order to save lives, empower women, improve households and combat climate change by creating athriving global market for clean and efficient household cooking solutions.
Very recently as reported by Steync, Pacula, and Stamminger (2012), the International Federation for Home Economics (IFHE) has joined the alliance as a champion partner, and theProgramme Committee on Household Technology and Sustainability (PC HTS) took on the support of the alliance mission and vision. Besides the development of energy-efficient stoves, a change in cooking habits is needed to optimize cooking processes in terms of saving resources and reducing smoke from combustion. Since 2010, public, private and non-profit partners have worked together to create a thriving global market for clean efficient cooking solutions. The aim is to provide 100 million households with modern efficient stoves by 2020. Modern household energy practices do not only contribute to reducing child mortality and improving women’s health, but are also essential for tackling poverty and achieving the

Anozie: Meeting household needs and poverty reduction IJHE Vol 6 No 1 2013
15
millennium development goals overall (Eva & Nigel, 2006). Up to 4000 deaths a day may be prevented by providing the world’s poor with access to modern household energy (Eva & Nigel in Onyekuru, Eboh, Enete, & Obizoba, 2009). However, in the year 2003, more than three billion people (52% of the world population) used solid fuels for cooking. The United Nations millennium project highlights the role of energy services as a prerequisite for development. The project calls on countries to adopt the following additional Millennium Development Goal (MDG) target to pave the way for achieving all the MDGs: to reduce the number of people without effective access to modern cooking fuels by 50% by 2015, and to make improved cooking stoves widely available. In many developing countries, the pressure for government response to lessen the burden of higher world oil prices is great and policies to minimize budgetary support meet fierce opposition. This study therefore examined some of the adverse effects of scarce household cooking energy on families in Abia state and also identified coping strategies adopted by households for sustainable living.
Purpose of the Study
The major purpose of the study was to determine the effect of scarce household cooking energy on families in Abia state with a view to evolving coping strategies for sustainable living. Specifically, the study determined the following:
Percentage of household income spent on cooking energy per month
The problems encountered by households in the management of family feeding due to scarce cooking energy
Coping strategies adopted by households in the management of scarce cooking energy
Methodology
This study employed a survey research design. The study was carried out in Abia state, in the south eastern part of Nigeria. Based on the information collected from the National Population Commission (NPC, 2006), the estimated population of households in Abia state is 665,206. Multistage sampling was adopted in this study. The state has two important urban centres, namely Umuahia and Aba. From each of these urban areas, two wards were purposively selected to ensure that the areas selected had the true urban characteristics required. From the rural areas, six wards were also selected, giving a total of 10 wards; and 26 households were selected from each of the selected wards, giving a total of 260 households. Food managers from these households (either male or female) formed the sample for the study, giving a total of 260 respondents. A structured questionnaire was used for data collection in line with the research questions. The instrument was face validated by five experts, including two Home Economics lecturers and two measurement and evaluation lecturers from Michael Okpara University of Agriculture, Umudike, Abia state. The questionnaire was also used as an interview schedule for non-literate respondents. Data collected were analyzed using percentages, means and standard deviation.

Anozie: Meeting household needs and poverty reduction IJHE Vol 6 No 1 2013
16
Results/findings of the study
Research question 1: What is the percentage of household income spent on cooking energy by households in Abia state? The data for answering this research question is summarized in Table 1.
Table 1 Percentage of household income spent on cooking energy monthly
Monthly Allocation (%)
S/n Type of cooking energy Urban Rural
1 Kerosene 4 6.5
2 Fuel wood 1 4
3 Charcoal 1.5 2
4 Gas 3 -
5 Electricity 2.5 .5
Total 12 16
Note: S/n= Serial number
Table 1 indicates that the monthly allocation on kerosene and fuel wood is higher in the rural households (6.5% and 4%) than in the urban households (3.5% and 1%), while monthly allocation to gas and electricity is higher in urban areas (3.5% and 2.5%) than in the rural areas (nil and 0.5%)
Research question 2: What are the problems encountered by households in the management of family feeding due to scarce energy resources? The data for answering this research question is summarized in Table 2. Table 2 reveals that all the identified items are problems encountered by households in the management of family feeding due to scarce energy resources.
Table 2 Problems encountered by households in the management of family feeding
due to scarce energy resources
Note: S/n = Serial Number, SD= Standard deviation, A= Agreed by households as a problem, Mean ratings were on
a 4- point scale where 4 was strongly agreed and 1 was strongly disagreed
S/n Problems encountered by households Mean SD Remarks
1 Reduction in feeding budget 3.74 0.57 A
2 Poor storage facilities 3.18 0.82 A
3 Poor preservation facilities 3.16 0.85 A
4 Malnutrition 2.91 0.83 A
5 Food-borne diseases 3.12 0.80 A
6 Inadequate supply of water 3.97 0.39 A
7 Cooking only those foods that require less cooking energy 2.79 0.74 A
8 Inadequate feeding 3.44 0.68 A

Anozie: Meeting household needs and poverty reduction IJHE Vol 6 No 1 2013
17
Research question 3: What are the coping strategies adopted by households in the management of scarce cooking energy? The data for answering this research question is summarized in Table 3.
Table 3 Coping strategies adopted by households in the management of scarce cooking
energy
S/n Coping strategies Mean SD Remarks
1 Substituting one type of fuel for the other 3.23 0.95 A
2 Using renewable sources of electricity 3.65 0.56 A
3 Using more convenience foods 3.57 0.61 A
4 Eating out most of the time 3.50 0.54 A
5 Storing some fuel for emergencies 3.56 0.59 A
6 Cooking only one type of food and using it for the whole day 3.61 0.67 A
7 Checking the cooking range after cooking to ensure it is turned off 3.23 0.95 A
8 Measuring out the cooking fuel to be used in a day 3.58 0.61 A
Note: S/n = Serial Number, SD= Standard deviation, A= Adopted coping strategies by households, Mean
ratings were on a 4-point scale where 4 was strongly adopted and 1 was not strongly adopted
Table 3 reveals that all the coping strategies identified were adopted by the respondents. They all met the cut-off point of 2.5 and above.
Discussion of findings
The findings of this study on the percentage of household income spent on cooking energy per month revealed that households in urban and rural areas spend up to 12% of their income on cooking energy alone. Kerosene has the highest allocation in both the urban and rural areas,as shown in Table 1. This is in line with the findings of Onyekuru et al. (2009), who found that the average monthly per capital expenditure of the rural households on kerosene was higher than that for firewood. This may be attributed to the fact that kerosene is easy to obtain, easy to use and facilitates cooking. Table 1 also revealed that in the urban areas, the monthly allocation on kerosene was highest, followed by gas, while allocation to fuel wood and charcoal were lesser. This is not in consonance with the findings of Onyekuru et al.(2009), who found that gas has the highest per capital expenditure in urban areas when compared to kerosene, fire wood and charcoal. Fuel preference may be significantly related to educational level of respondents, as noted by Akpan (1995). This indicates that as more women acquire education above primary school level, more households will be using gas for cooking because they consider gas to be fast, neat and easy to manage. Akpan also found that employment status of the home manager was one of the factors that affected household energy use. Specifically, a home manager who is not employed outside the home has a certain amount of time to regulate activities in the home and exercise control in the use of resources to eliminate wastage. Outside employment made it difficult for some respondents to be present when energy supply is available.

Anozie: Meeting household needs and poverty reduction IJHE Vol 6 No 1 2013
18
The rural households spent more on kerosene than did the urban households. This is attributable to the low income of the rural dwellers. This could also be one of the reasons poverty still persists in the rural areas. Rural households spent the major part of their income on kerosene. The cost of kerosene in the country is very high. As a result of this, some households in the rural areas have no choice other than to use firewood, a cheaper source of energy. In sub Saharan Africa, more than 92% of the rural population is un-electrified. This number has doubled in rural areas and tripled in urban areas in the last 30 years. This has led to the widespread use of fuel wood and charcoal. The scarcity of local supplies forces people,especially women and children, to spend productive hours gathering fuel wood and other forms of biomass farther away from home. This, as noted by Onyekuru et al. (2009), reducesthe time for other activities such as farming and education, and has an impact on people’sability to fend for themselves.
Table 2 showed that households encounter many problems in meeting nutritional needs as aresult of scarce energy resources. These problems identified include reduction in feeding budget, poor storage facilities, poor preservation facilities, malnutrition, food-borne diseases, inadequate supply of water, and cooking only those foods that require less cooking energy. As a result of these problems, many households in both the urban and rural areas are not adequately fed. Insufficient cooking fuel means eating uncooked and undesired food. Table 3 showed the coping strategies adopted by households in the management of scarce energy resources. These include substituting one type of fuel for the other, using renewable sources of electricity, using more convenience foods, eating out most of the time, storing some fuel for emergencies, cooking only one type of food and using it for the whole day, checking the cooking range after cooking to ensure it is turned off and measuring out the cooking fuel to be used in a day. This finding is in line with that of Akpan (1995) who found that families had to substitute one type of fuel for others depending on the situation. Families that use gas often substituted sun drying and smoking for oven drying during gas shortage. Akpan also found that families control their resources by storing fuel foremergencies, checking appliances after each use to make sure they are turned off, measuring some amount for each use especially when the home maker is not at home and using a little wood at a time.
Conclusion
Based on the findings of this study, the following conclusions were drawn: households in urban and rural areas spend up to 12% of their income on cooking energy alone, and kerosene has the highest allocation. Reduction in feeding budget, poor storage facilities, poor preservation facilities, malnutrition, food-borne diseases, inadequate supply of water andcooking only those foods that require less cooking energy were some of the problems households encounter. To cope with these problems, families substitute one type of fuel for the other, use renewable sources of electricity, use more convenience foods, eat out most of the time, store some fuel for emergencies, cook only one type of food and use it for the whole day, check the cooking range after cooking to ensure it is turned off and measure out the cooking fuel to be used in a day.

Anozie: Meeting household needs and poverty reduction IJHE Vol 6 No 1 2013
19
As a result of the problems described above, many households in both the urban and rural areas are not adequately fed. Money for daily household food needs is sacrificed for the purchase of cooking energy. This is inevitable as energy is needed on daily basis to cook food. The consequence is that poor households are deprived of daily adequate diet. In the light of the above, many people suffer from malnutrition and food-borne illnesses.
Recommendations
To alleviate the problems encountered by households in the management of family feeding due to scarce energy resources, the following were recommended:
1. There is need for a more efficient supply of household energy resources by the government.
2. Price control authorities should be established in all the states to monitor the price of fuel and control the excesses of the fuel distributors.
3. Proactive and pragmatic approach to the issue of price might involve upholding the policy of subsidy at least for kerosene because it is the most common cooking energy for the households. This will go a long way to help households achieve sustainable future.
4. Reduced reliance on oil for cooking and diversifying by the use of non-petroleum sources of energy is another solution for families who can afford it.
Biography
Dr. Georgina Anozie is an associate professor and Head of Department of Home Economics/Hotel Management and Tourism, Michael Okpara University of Agriculture, Umudike, Abia State, Nigeria. Georgina researches and writes about clothing, foods, nutrition and health. Georgina is a member of IFHE, SNEB and HERAN. She has many articles in reputable journals both locally and internationally. E-mail: [email protected] or [email protected]
References
Akpan, A. (1995). Household energy management of Nigerian urban dwellers: A case study of Uyo urban. Journal of Home Economics Research, 1, 7-12
Arnold, M., Kohlin, G., Persson, R., & Shepherd, G. (2003). Fuel wood revisited – what has changed in the last decade? (Occasional Paper 39). Jarkata, Indonesia: Center for International Forestry Research (CIFOR).
Darwin, O. C. (2006). Solar cooking and health. UK: Hedon Household Energy Network.
Eva, R., & Nigel, B. (2006). Household energy for life. UK: Hedon Household Energy Network.
Global Alliance for Clean Cook Stoves (GACC). (2011). Global Alliance for Clean Cook Stoves.Retrieved from http/cleancookstoves.org/the-alliance/

Anozie: Meeting household needs and poverty reduction IJHE Vol 6 No 1 2013
20
International Energy Agency. (2002). World energy outlook. Paris: OECD.
Mekonnen, A. (2009). Rural household biomass fuel production and consumption in Ethiopia: A case study. Journal of Forest Economics, 5(1), 69-97.
National Population Commission (2006). Population and housing census of the Federal Republic of Nigeria: National and state population and housing tables, priority tables, (Vol. 1) pages 1&28
Onyekuru, N.A., Eboh, E.C., Enete, A. A., & Obizoba, I. C. (2009). Household cooking energy use and expenditure. Nigerian Journal of Nutritional Sciences, 30, 62-68.
Rosette, K. (2006). Mass dissemination of rocket lorena stoves in Uganda. UK: Hedon Household Energy Network.
Steync, H., Pacula, C., & Stamminger, R. (2012). Scaling up clean cooking technologies. InFidzani (Ed.), The family in a changing world: Challenges and opportunities (pp. 53-57). University of Botswana: Department of Family and Consumer Sciences.

International Journal of Home Economics
21
Conceptualising of quantities by low-income consumers to guiderecipe format
Sara S. Duvenage, Wilna H. Oldewage-Theron, Abdulkadir A. Egal
Vaal University of Technology
Abstract
Availability of soy was improved through a home-gardening project in rural Qwa-Qwa. Soy-containing recipes were developed and need to be published. The challenge was to identify guidelines, suiting the target consumers (n=91), for measuring units and for lay-out of recipes. Trained fieldworkers, fluent in the indigenous language, conducted personal interviews.
Spoons and cups in general household use were employed for measuring purposes, using levelled measures. Units reported as cups and spoons were muchpreferred to metric units. Perceptions of quantities for cups were reported correctly for full (89%), half (78%), one third (3%) and one quarter (31%) cup units. For spoons, perceptions were reported correctly for full (97%), half (90%) and quarter (77%) units. Numeric format was indicated as being clearer than visual units for indicating quantities, but most preferred a combination of both methods for all quantities.
To meet consumer perceptions, quantities will be specified as full or half cups, and smaller units as tablespoons, teaspoons and units thereof. To allow for the use of commercial measuring equipment and the physical limitations of recipe book format, both forms of measurement will be employed. However, a comparison table will be compiled, including the visual format, to indicate different standardised options for measuring equal quantities.
Introduction
South Africa (SA) is food secure at national level, but limited resources and rampant poverty are typical of the situation in rural regions (Koch, 2011), compromising food security. A situation analysis conducted in the rural Qwa-Qwa region of the Free State province found poverty and household insecurity typified by a lack of good-quality protein sources in the habitual diet, as well as marginal iron and zinc deficiency in children and their caregivers, aggravated by poor nutrition knowledge (Oldewage-Theron & Egal, 2010). A successful nutrition education programme was launched in combination with a home-gardening project to improve availability of and access to safe, affordable and nutritious food as measures to improve self-sufficient (and therefore more sustainable) food security (Love, Maunder, &Green, 2008).
To substantiate and address these findings in the broader region, the project “Improving household food security in Qwa-Qwa” was initiated. In three additional but similar communities, poverty and aggravated shortfalls in dietary intake, especially for protein and

Duvenage et al: Conceptualising of quantities to guide recipe format IJHE Vol 6 No 1 2013
22
energy (Protein Energy Malnutrition (PEM)) were identified, confirming the need for this approach (Oldewage-Theron, Duvenage, & Egal, 2012).
Soy is the only plant source of complete protein (United Soybean Board (USB), 2011). Being affordable and capable of cultivation in home gardens in this region, it was an ideal choice of crop for enhancing protein intake at household level. Included in the mix of vegetables cultivated in a home garden, soy could make a valuable contribution to the intake of various nutrients compromised by the diets of the target population, including total dietary fibre, calcium, iron, magnesium, zinc, and folate (Faber, Witten, & Drimie, 2011). When regularly consumed, soy also acts as a protective factor against cardiovascular diseases (Sadler, 2004).
The challenge of overcoming the barrier of unfamiliarity regarding the household preparation and consumption of soy dishes was addressed step by step. First, a series of ten recipes was developed, utilising ingredients habitually available in these households and acknowledging the limitations in food preparation facilities and cultural practices. The recipes were standardised to provide at least 15g soy protein per person for a household of six, in addition to the rest of the dietary intake (Pelembe, 2009; USB, 2006) when two dishes per day containing soy were consumed (Duvenage, Oldewage-Theron & Egal, 2012). At the same time, this intake delivers a further contribution of 784kJ per person per day.
Time and financial constraints necessitated a dual approach. In a time frame of three months, over three sessions in each of the three communities, not more than three recipes were demonstrated in a session, followed by assessment for sensory and cultural acceptance. The product attributes tested included appearance, taste and texture, as well as acceptance by household members and willingness to try the recipe at home. The aim was to increase acceptance of the use of soy for human consumption through familiarisation. Results revealed a high level of sensory acceptance and willingness to try the recipes at home (Duvenage et al., 2012).
The preparation of low-cost nutritious meals to meet dietary recommendations could pose an exceptional challenge to households with limited resources (Food Research and Action Center, 2010; Koszewski, Behrends, Nichols, Sehi & Jones, 2011). In this setting, meals are often of a monotonous nature, starch based, energy dense and of limited dietary variety (Faber et al., 2011; Farm Foundation, 2006). Moreover, cooking competence is influenced by a range of factors (Ternier, 2010; Chenhall, 2011), impacting on self-reliance, nutrition knowledge, dietary behaviour and quality, and therefore on personal health (and those of household members) (Ternier, 2010). The literature indicates that mothers and cooking classes are the most important sources of cooking skills (Chenhall, 2011). These facts illustrate the long-term impact of nutrition knowledge and cooking competence on household health.
Low-income households tend to keep to familiar products as they have no money available for repurchasing of ingredients (Marumo, 2009). To try something new poses a risk to them. As the only recipes which will be re-used are those which produce acceptable results the first time, all care should be taken to ensure achievable results to build confidence and trust in the recipes.

Duvenage et al: Conceptualising of quantities to guide recipe format IJHE Vol 6 No 1 2013
23
Consequently, the development of material to support the sustained preparation of soy-containing dishes by these low-income households presents a challenge. The objective of this study was to identify guidelines, based on the perceptions and preferences of the target population, for the format of measuring units and for the lay-out of recipes for publication in a recipe book.
The implication was that the users should feel competent in preparing these recipes containing home-produced soy and be satisfied with the results obtained. This approach could encourage repeated use to enhance nutrient intake at household level.
Methods
Ethics
This study, imbedded in the major study “Improving household food security in Qwa-Qwa,”obtained approval from the University of the Witwatersrand Medical Ethics Committee for Research on Human Beings (M080931). The criteria stipulated by the South African Medical Research Council (MRC, 2002) and the Declaration of Helsinki for Research on Human Beings(Office of Human Subjects Research, 2004) directed procedures as applicable. Only respondents from whom informed consent was obtained were included as part of the study. The life, health, privacy and dignity of all human subjects were protected at all times. A reasonable likelihood existed that all participants stood to benefit from the results of this research.
Study population and sampling
The same respondents involved in the acceptance testing of soy dishes for home-preparation participated in the current phase of the research initiative. In an earlier phase of the study, 60% of the respondents were typified as very poor or poor, with an approximate income per capita per USA$1) (Oldewage-Theron et al., 2012), equalling the international poverty line (International Development Association, 2004). With an average household size of five, most of the respondents (56%) spent approximately 86% of their total household income on food, with no other needs provided for.
In accordance with a purposive sampling strategy, only permanent residents of rural Qwa-Qwa who were members of one of three specific communities, and who had children in the household, and were participants in the home-gardening initiative (implying availability of home-produced soy), either male or female, could take part in the study.
Opportunity sampling was applied during fieldwork to include all household representatives attending the session in the three communities (n = 91).
Sample size
Ninety-one respondents from the three communities participated in the survey, constituting a valid consumer sample (Gacula & Rutenbeck, 2006).

Duvenage et al: Conceptualising of quantities to guide recipe format IJHE Vol 6 No 1 2013
24
Study design
A cross-sectional descriptive survey approach was applied to assess the occurrence of potentially related factors at one specific point in time in a sample of the broader population in order to provide information regarding the situation (Babbie, 2010; National EMSC Data Analysis Resource Center, 2012). Both quantitative and qualitative aspects were included.
Procedures
Measuring tool
A questionnaire was developed and tested to accommodate household availability/choice of measuring equipment, conceptualisation of quantities (including units preferred for measuring ingredients, perceptions of quantities, format for indicating quantities to enhance clarity and method for indicating ingredients), and choice of recipe lay-out.
Data gathering
Two trained and experienced fieldworkers, fluent in South Sotho, applied a one-on-one interviewing technique. The need to ensure comprehension of terminology also became apparent, necessitating the use of physical examples to differentiate between terms like measuring cup and measuring jug, for example, and the different types of cups/spoons used in the household.
Statistical analysis
Quantitative descriptive analysis involved the use of the Statistical Package for Social Sciences (SPSS) version 19.0 to report the distribution range of values to allow comparison between options. Pearson chi-square (x2) and likelihood ratio (lr) were applied to measure differences, if there were any, between options.
A top-down conceptual content analysis was applied to the qualitative data to identify the most important dimensions (Corbin & Strauss, 2008), followed by quantitative analysis to determine the frequencies of the most important dimensions.
Results
Demographic profile
Of the respondents participating in the study (n = 91), the age groups from 30 to 39 (n = 22) and 50 to 59 (n = 19) were best represented (44.3%). Three other age groups were smaller but of about even size (20 to 29 = 13.2%; 40 to 49 = 17.2%; and 60 to 69 = 13.1%). Four percent of the group belonged to the age bracket 70 years and older. Overall, 8.2% of the respondents did not know how old they were.

Duvenage et al: Conceptualising of quantities to guide recipe format IJHE Vol 6 No 1 2013
25
Household availability/choice of measuring equipment
Equipment utilised at household level for measuring ingredients
Choice of equipment to measure tablespoonfuls of dry ingredientsMost respondents (92.1%) indicated that spoons generally in use at home were used for this purpose, while only 5.6% made use of measuring spoons.
Choice of equipment to measure cupfuls of liquidsLiquids were mostly measured by using cups generally in use at home (84.7%), but an additional 11.8% of respondents reported that they made use of an enamel jug.
Choice of equipment to measure cupfuls of dry ingredientsDry ingredients were mostly measured with glass or porcelain cups generally in use at home (97.7%).
Perceptions of correct measurement
Most (94%) of the respondents indicated levelling of a tablespoon as the correct way of taking a measurement. This perception could have been influenced by the series of food preparation demonstrations they had observed over time for recipes containing home-produced soy.
Conceptualising of quantities
It was of importance to the researchers to develop an understanding of the conceptualisation of quantities and measurement by the target population in order to formulate the quantities for the recipes in such a way that they would be correctly understood and utilised. The metric system, reporting physical measurements in a decimal style, has been utilised for household application in SA since 1961 (Ancestry 24, 2010). Standardised equivalents, or parts thereof, are in use (1 teaspoon = 5 millilitres (ml), 1 tablespoon = 15ml, 1 cup = 250ml, 1 litre = 1,000ml or 4 cups). Smaller units are often reported as 0.5ml, 1ml, 2ml, and as part of a teaspoon, tablespoon, cup or litre.
Units preferred for measuring quantities of ingredients
It is clearly evident from Table 1 that most of the respondents preferred cups, tablespoons and teaspoons as units for measuring ingredients (85% to 97%). Only 3% to 6% preferred metric units (for example 125ml), while slightly more respondents (5% to 10%) preferred measurements in tablespoons to indicate quantities for a cup and part of a cup (½, , ¼).
Perceptions of quantities
Five black and white images of cups (not filled, and filled to full, half, one-third and one-quarter level, respectively) were shown to respondents without any indicators. When asked what these images showed, most respondents (75%) indicated that they were different cups. Only 21% indicated that the images showed different levels of measurement. To assess perceptions of quantities related to spoons, four black and white images (not filled, and filled to full, half and one quarter of surface, respectively), were shown to respondents. Only 18% indicated that these were different levels of measurement.

Duvenage et al: Conceptualising of quantities to guide recipe format IJHE Vol 6 No 1 2013
26
Table 1 Percentage of respondents who indicated units preferred to measure
quantities (n = 91)
Units for quantities Cups, spoons (%) Metric
(%)
Part of a cup in
tablespoons (%)
1 cup 90.8 4.6 4.6
½ cup 88.5 4.6 6.9
cup 85.1 4.6 10.3
¼ cup 85.1 4.6 10.3
1 tablespoon 90.8 3.4 5.7
1 teaspoon 96.6 3.4 N/a
½ teaspoon 96.6 3.4 N/a
¼ teaspoon 94.2 5.8 N/a
When respondents were requested to indicate the meaning of the empty cup image, 67% perceived it as an empty cup, while 9% more indicated that it was filled with a white ingredient like milk. When shown the image of the full cup, 89% responded correctly, while 78% perceived the content of the half cup correctly, with 4% of respondents providing no comment. For the image of a cup one-third full, only 3% of perceptions were correct while 5% of respondents preferred to provide no comment, and, for the image of a cup one-quarter full, 31% of respondents’ perceptions were correct and 3% did not comment. From these findings it became clear that most respondents have a clear perception of the meaning of quantities relating to a full cup and half a cup, but perceptions of quantities for a quarter of a cup, and especially a third of a cup, seemed to be unreliable.
Only 18% of the respondents indicated the meaning of the spoon images as related to measuring. When asked about the meaning of the different spoon images, 91% reported correct perceptions for the empty spoon, while 6% indicated it as being full of white ingredients, for example baking powder. Likewise, most respondents (90%) indicated a clear perception of the meaning of half a spoon, while 77% understood the meaning of a quarter of a spoon. Overall, a better perception was portrayed for quantities measured by spoon than by cup.
Format for indicating quantities to enhance clarity
For the purpose of validation, respondents were requested to indicate the format they found to be clearer for measuring different quantities of ingredients. Options included measurements to be indicated in (1) numerical, non-metric units of cups and spoons and part thereof, (2) visual units of cups and spoons and part thereof, and (3) other (specify) (see Table 2).

Duvenage et al: Conceptualising of quantities to guide recipe format IJHE Vol 6 No 1 2013
27
Table 2 Format perceived to be clearer for indicating quantities
Numerical non-metric units Visual units Other
1 cup Other: specify
½ cup Other: specify
cup Other: specify
¼ cup Other: specify
1 tablespoon Other: specify
½ teaspoon Other: specify
¼ teaspoon Other: specify
From these options, the average results for the three communities are reported in Table 3.
Statistically, in terms of x2 and lr, the difference between the three formats for indicating quantities (Table 3) was not significant. All values for the three variables were highly correlated, supporting the results of the x2 and lr analyses.
From Table 3, it seems that more respondents preferred quantities for ingredients to be indicated in numeric units, rather than in visual units. Most respondents (between 43% and 45.3%) requested that both options should be applied to indicate quantities for ingredients in recipes.

Duvenage et al: Conceptualising of quantities to guide recipe format IJHE Vol 6 No 1 2013
28
Table 3 Percentage of respondents reporting the format perceived as clearer for the
indicating of quantities (n = 91)
Units for quantities
Numeric (%) Visual
(%)
Both
(%)
Pearson
Chi-square
(p-value)
Likelihoodratio
(p-value)
½ cup 34.9 22.1 43 0.442 0.224
cup 33.7 23.3 43 0.441 0.211
¼ cup 33.7 23.3 43 0.441 0.211
1 tablespoon 34.9 20.9 44.2 0.444 0.247
½ teaspoon 33.7 20.9 45.3 0.443 0.256
¼ teaspoon 34.1 22.4 43.5 0.441 0.225
Method for indicating ingredients
Overall, more respondents indicated a preference for identifying the ingredients, for examplespinach, in words (42.7%) rather than in pictures (19.1%), while 38.2% preferred that both methods be incorporated in recipes.
Recipe lay-out
Two options for formal recipe lay-out were offered, namely the traditional (list of ingredients in sequence of use followed by step-by-step method), and mass-catering formats (landscape layout, with ingredients listed on the left according to sequence of use; with blocks grouping ingredients together and the instructions applicable to these ingredients indicated to the right). Preferences indicated for the different formats were about equal, being 49.4% and 46.1% respectively, while 4.5% were uncertain.
Discussion and conclusions
Overall, most respondents utilised equipment generally available in the household (spoons 92.1%, glass or porcelain cups to measure liquids 84.7%, glass or porcelain cups to measure dry ingredients 97.7%). It is of interest that an enamel cup, a 380ml standardised cup available at most retail outlets in SA, was used by 11.8% of respondents to measure liquids. Generally the perception is that the sizes of household cups were smaller than those of measuring cups (250ml) and enamel cups (380ml). This implies that if a standardised recipe is followed, the balance of the ingredients will be totally skewed – possibly with negative consequences for the quality of the dish.
Only a small section of the study population used standardised measuring equipment (5.6% used measuring spoons, 1.2% used a measuring cup for liquids while 2.4% used a measuring jug, and a measuring cup or measuring jug were each used by 1.2% for dry ingredients). These results indicated the need for training, although most respondents (94%) indicated the levelling of dry ingredients in the equipment as the correct procedure.

Duvenage et al: Conceptualising of quantities to guide recipe format IJHE Vol 6 No 1 2013
29
Overall, a cup was indicated as the unit of choice for both dry and liquid ingredients (85% to 97%). Only a small section of the study population (3% to 6%) indicated the use of metric units in recipes as a preference, but preferred a part of a cup to be indicated in tablespoons (7% to 10%).
From the perceptions of quantities as portrayed by images, only quantities for the full cup (89%) and half cup (78%) were perceived correctly by most of the population. This implies that measurements for a part of a cup should rather be specified in terms of a certain number of tablespoons. The validity of this approach is supported by the clear perception reported for most respondents regarding the meaning of a full (91%), half (90%) and quarter (77%) spoonful.
Results concurred with earlier findings that the measurement of quantities in cups and spoons was significantly preferred to the decimal format. The most preferred format was a combination of measurements indicated in cups (full and half) and spoons (for one third and one quarter cups, and smaller quantities) in combination with the visual format (earlier findings, Table 3).
However, it was also important to combine the preferences indicated by the respondents with the characteristics of measuring equipment available in the marketplace in order to be able to use the recipes as a training tool. Bearing in mind the limitations imposed by printed matter (e.g., limited space, font size, applicable to recipe book format), it was decided to indicate measurements in cups for larger quantities and in spoons and teaspoons for smaller quantities, as well as in metric units. To support a clear conception of quantities, a comparison table was developed for inclusion in the recipe book to indicate different standardised ways of measuring equal quantities. This table included the abbreviations indicated on the measuring equipment (for example, ½ c), the indicated quantity written out in numbers and words (½ cup), the metric equivalent (125ml), the equivalent quantity indicated in smaller units (8 tablespoons), and the visual image of a cup half filled.
Each participating household received a sponsored set of measuring equipment. A workshop was arranged in each of the communities to train the respondents in the use of the measuring equipment, including the comparison table, as well as in the preparation of soy bread (recipe in the recipe book). The aim was to familiarise respondents with the use of the measuring equipment and food preparation with home-cultivated soy.
This staple-based food (bread) could be prepared on an almost daily basis, supporting the intake of life-giving protein and energy (as well as other nutrients), especially if preparedwith soy milk. Although the perception is that cookery classes are more important than recipe books to lower social classes (Caraher et al., 1999), an attempt was made to ensure the comprehension and usability of the recipe book in order to encourage the inclusion of soy on the daily menu on a sustainable basis. The inclusion of a photograph of each of the dishes, as well as preparation hints, further enhanced comprehension.

Duvenage et al: Conceptualising of quantities to guide recipe format IJHE Vol 6 No 1 2013
30
Home gardens producing soy could offer a healthier food choice and assist in the prevention of many nutrition problems by bridging the gap between dietary recommendations and consumer behaviour (Kris-Etherton, 2004), but only if the soy is consumed. The nutrition knowledge gained, the availability of home-produced soy, and the cooking competence achieved should promote positive dietary behaviour and quality, influencing personal and household health as a consequence.
Limitations of the study
The level of individual competence in food preparation was not measured, and, owing to financial and time constraints, further formal training programmes for respondents will not be presented. However, in order to deal with any lack of competency or other problems that could hinder household preparation of soy-containing dishes, a “train-the-trainer” programme will be launched as part of a follow-up study. The aim was that self-help groups, under leadership of a local resident trainer, could provide ongoing support through sharing of competencies (and addressing lack thereof) to promote household preparation and intake of soy-containing dishes in a sustainable manner. In a year’s time, a re-assessment will be conducted to determine the self-sustainability of this initiative to address the PEM levels of the children in the participating households.
Acknowledgements
The contributions of the following are recognised with appreciation:
South Africa-Netherlands Research Programme on Alternatives in Development (SANPAD) for funding;
Centre of Sustainable Livelihoods, Vaal University of Technology, for creating the opportunity for the study;
Prof. R. Gaede, Vaal University of Technology, for assistance with the questionnaire and drafting of the visual images;
Chiefs and respondents from the three rural communities in Qwa-Qwa for their positive collaboration;
Fieldworkers Ms J. Senoelo and Ms T. Nyathela for their professionalism, dedication and enthusiasm.

Duvenage et al: Conceptualising of quantities to guide recipe format IJHE Vol 6 No 1 2013
31
Biographies
Dr Duvenage freelances as researcher, specialising in community-involved affordable food product formulation to meet nutrient deficiency and food product acceptance needs of low-income consumers to support food security. She has presented at conferences, supervised MTech research, authored/co-authored publications and is membership officer for the South African Association of Family Ecology and Consumer Science.
Prof Oldewage-Theron (PhD Dietetics) is a registered dietician and Director of the Research Centre of Sustainable Livelihoods (CSL). Her focus is on addressing household food insecurity and malnutrition, specifically micronutrient deficiencies and nutrition education, in low-income communities. She manages, markets and seeks funding for CSL. She has successfully supervised ten DTech and 20 MTech students and is author/co-author of 50 full-length peer-reviewed papers, mostly in international journals. She has also presented at various national and international conferences. She is the President of the African Nutrition Society (ANS).
Dr Abdulkadir A. Egal is a Senior Researcher in the Centre of Sustainable Livelihoods (CSL) at the Vaal University of Technology. His research interests are child growth and malnutrition, specifically focusing on micronutrient deficiencies. He has presented at various national and international conferences and authored and/or co-authored 19 articles published in scientific journals and as part of conference proceedings. He was employed by USAID projects in Somalia as deputy project manager (1981-1986) in two projects (Ground water & Range), as well as by the United Nations World Food Programme as programme officer (1986-1997).
References
Ancestry 24. (2010). Weights and measures. Retrieved from Ancestry24.com/learning-centre/weights-and-measures/
Babbie, E. (2010). The practice of social research (12th ed.). Belmont, CA: Wadsworth Cengage Learning.
Chenhall, C. (2011). Improving cooking and food preparation skills: A synthesis of the evidence to inform program and policy development. Healthy Living Issue Group of the Pan-Canadian Public Health Network. Retrieved from http://www.hc-sc.gc.ca/fn-an/nutrition/child-enfant/cfps-acc-synthes-eng.php
Corbin, J., & Strauss, A. (2008). Basics of qualitative research (3rd ed.). Los Angeles: SAGE.
Duvenage, S. S., Oldewage-Theron, W. H., & Egal, A. A. (2012). Acceptance of home-prepared soy dishes in low-income rural Qwa-Qwa communities. International Journal of Home Economics, 5(2), 151-166.
Faber, M., Witten, C., & Drimie, S. (2011). Community-based agricultural interventions in the context of food and nutrition security in South Africa. South African Journal of Clinical Nutrition, 24(1), 21-30.

Duvenage et al: Conceptualising of quantities to guide recipe format IJHE Vol 6 No 1 2013
32
Farm Foundation. (2006). Food marketing analysis: Consumer demand issues. Retrieved fromhttp://www.farmfoundation.org/projects/documents/ConsumerDemands.pdf
Gacula, M. J. R., & Rutenbeck, S. (2006). Sample size in consumer test and descriptive analysis. Journal of Sensory Studies, 21, 129-145.
International Development Association. (2004). Proportion of the population below USD1/day poverty line. Global monitoring system, The World Bank Group. Retrieved fromhttp://ddp-ext.worldbank.org/ext/GMIS/gdmis.do?siteld=1&contentld=Content_2&menuld=LNAV01HOME2
Koch, J. (2011). The food security policy context in South Africa. International Policy Centre for Inclusive Growth, United Nations Development Programme. Retrieved from http://www.ipc-undp.org
Koszewski, W., Behrends, D., Nichols, M., Sehi, N., & Jones, G. (2011). Patterns of family meals and food and nutrition. Family and Consumer Sciences Research Journal, 39(4), 431-441. Retrieved from http://onlinelibrary.wiley.com/doi/10.1111/j.1552-3934.2011.02080.x/full
Kris-Etherton, P. M. (2004). Dietary advice and practice. In J. Westrate (Ed.), The healthy choice, an easy choice (pp. 18-22). Vlaardingen, The Netherlands: Unilever Health Institute.
Love, P., Maunder, E. M. W., & Green, J. M. (2008). Are South African women willing and able to apply the new Food-Based Dietary Guidelines? Lessons for nutrition educators. South African Journal of Clinical Nutrition, 21(2), 17-26.
Marumo, K. (2009). Food product attributes guiding purchasing choice by low-income households. South Africa: Vaal University of Technology.
Medical Research Council. (2002). Guidelines on ethics for medical research: General principles including research on children, vulnerable groups, international collaboration and epidemiology. Cape Town, South Africa: Author.
National EMSC Data Analysis Resource Center. (2012). Descriptive study. Retrieved from www.nedarc.org/statisticalHelp/projectDesign/descriptiveStudy.html
Office of Human Subjects Research. (2004). Declaration of Helsinki. World Medical Association. National Institutes of Health. Regulations and ethical guidelines. Policy. Retrieved from http://ohsr.od.nih.gov/guidelines/helsinki.html
Oldewage-Theron, W. H., & Egal, A. A. (2010). Nutrition knowledge and nutritional status of primary school children in QwaQwa. South African Journal of Clinical Nutrition, 23(3), 149-154.
Oldewage-Theron, W. H., Duvenage, S. S., & Egal, A. A. (2012). Situation analysis as indicator of food security in low-income rural communities. Journal of Family Ecology and Consumer Sciences, 40, 38-58.
Pelembe, L. (2009). Soy on your table is health on your table: Soy recipes booklet. Maputo, Mozambique: World Initiative for Soy in Human Health.

Duvenage et al: Conceptualising of quantities to guide recipe format IJHE Vol 6 No 1 2013
33
Sadler, M. J. (2004). Meat alternatives – market developments and health benefits. Trends in Food Science and Technology,15, 250-260.
Ternier, S. (2010). Understanding and measuring cooking skills and knowledge as factors influencing convenience food purchases and consumption. Studies by Undergraduate Researchers at Guelph, 3(2). Retrieved fromhttp://journal.lib.uoguelph.ca/index.php/surg/article/viewArticle/1122/1668
United Soybean Board (USB). (2006). Soyfoods guide: Tips and information for using soyfoods.Indianapolis, IN: Stevens.
United Soybean Board (USB). (2011). Soy nutritional composition. United States Department of Agriculture.

International Journal of Home Economics
34
Well-being: One personality at a time
Jeanne Godin
Université de Moncton
Abstract
Self-knowledge is an important means to achieving well-being. This study investigated whether the knowledge of the Enneagram personality system affects psychological well-being and unconditional self-acceptance of university students who have been attending university for at least a year. A two-group design was employed, wherein a control and an experimental group completed a pre-test and two post-tests on psychological well-being and unconditional self-acceptance. The randomly selected experimental group received three weekly educational sessions on the Enneagram system.
Results show that the knowledge of the Enneagram personality system does not have a significant effect on psychological well-being. Due to a small sample size and violation of the assumptions required to conduct an ANCOVA, it was not possible to determine if the knowledge of the Enneagram affects unconditional self-acceptance.
Recommendations include using a larger sample, changing the number of educational sessions or their format, or assuring that the intervention becomes an integral part of a family and consumer sciences university course. Despite the results of this study, there are indicators that suggest that the teaching of the Enneagram personality system would help students increase self-knowledge as a means to achieving well-being.
Introduction
Individual well-being is a core concept of the family and consumer sciences body of knowledge model (Nickols et al., 2009). Brown and Paolucci (1979) and Brown (1993) state that self-knowledge can help identify thought patterns that promote personal well-being and those that should be reassessed, abandoned or changed as they hamper one’s well-being andare detrimental to interpersonal relationships. Although Brown and Paolucci propose that self-knowledge is an important means to achieving well-being and that the family and consumer sciences educator’s role is to assist individuals and families to achieve a better state of well-being, they provide little guidance on how this can be accomplished.
In her critique of the formulations of the concept of well-being, Ryff (1989) explains how the different concepts of well-being used in research are not strong theoretically and lack aspects of positive psychological functioning. She provides examples such as the balance of the positive and negative affect, which became the index of happiness, the life satisfaction index, and subjective well-being. Therefore, Ryff (1989) and Ryff and Singer (2008) melded the theories derived from the positive psychological functioning literature of Maslow, Rogers,

Godin: Well-being: One personality at a time IJHE Vol 6 No 1 2013
35
Allport, Jung, Erickson, Neugarten, Frankl, Jahoda and Buhler into the formulation of psychological well-being (PWB) to describe a person functioning well in six dimensions: (a) self-acceptance, (b) positive relations with others, (c) autonomy, (d) environmental mastery, (e) purpose in life, and (f) personal growth. Schmutte and Ryff (1997) investigated the connection between personality and psychological well-being and demonstrated that psychological well-being may be achieved by more people than just the extraverted and non-neurotic, as previous results have suggested.
The rational emotive behavioral theory (REBT) developed by Ellis (Ellis, 1987; Ellis & Abrams, 2009) integrates the concepts of personality, self-knowledge, self-acceptance, and the questioning of thought patterns accumulated through socialization in order to increase well-being. Ellis’s theory supports the idea that if an individual increases self-knowledge, he or she should be able to understand how one may be holding beliefs and enacting behaviours that are detrimental to his or her own well-being. Ellis also suggests that psycho-educational strategies may help individuals realise the amplitude of their irrational beliefs, thus acknowledging the use of an educational intervention to increase self-knowledge and deter irrational thoughts.
REBT also suggests that the concept self-knowledge is part of the broader concept of unconditional self-acceptance. Ellis explains that everyone possesses levels of self-knowledge but the key factor to improving one’s well-being is unconditional self-acceptance (USA). Ellis and Abrams (2009) define USA as an attribute of individuals who accept one’s good and undesirable aspects without self-rating. According to Ellis’s theory and Chamberlain (1999), Chamberlain and Haaga (2001a, 2001b), and Davies’ (2006) research, personality plays a critical role in self-acceptance. Ellis and Abrams (2009) define personality as the overt and covert actions, behaviours, styles of thought, speech, perception, and interpersonal interactions that are consistently characteristic of an individual.
Cervone (2004), also on the subject of personality, presents a critique of the traditional assessment strategies based on “between-persons factor-analytic construct.” He deplores that these strategies do not treat people as human beings, claiming that four of the five dimensions of the five factor model (Costa & McCrae, 1990) can be found not only among persons, but also animals. He believes that personality assessments should focus on unique qualities of humans. Cervone (2004) also cites Borsboom, Mellenbergh, and van Heerden (2003) who criticize how between-persons factor-analytic constructs are obtained from averages of many individuals, meaning that they really do not represent anyone in particular.Both these views lead to looking at other types of personality assessments, such as the Enneagram, which has not been studied in relation to USA and PWB.
The knowledge of the Enneagram system (Dallaire, 2000, 2004, 2010; De Lassus, 2006; Riso & Hudson, 1999), a theory based on nine personality types, helps individuals understand and accept not only themselves, but also others, which can lead to more compassionate relationships and improved well-being. Riso and Hudson (Enneagram Institute, 2010) define the system as a person-centred trait approach, known as a prototypical approach, to aid personal understanding and development. It can be thought of as a particular pattern, a profile, or a configuration of trait attributes that can encompass healthy to unhealthy

Godin: Well-being: One personality at a time IJHE Vol 6 No 1 2013
36
behaviours, motivation, values, thinking styles, and problem-solving skills. In Appendix A, the nine Enneagram personality types are briefly described and are compared with other typologies. The comparison demonstrates how each type is specific and different from the traits of other known typologies such as the DSM-IV categories of personality disorders, Freud’s typology and the five factor model (Bartram & Brown, 2005; Riso & Hudson, 1999).
The Enneagram has been investigated in several research studies. Wagner (1981), Wagner and Walker (1983), Newgent (2001), Newgent, Parr, and Newman (2002), Newgent, Parr, Newman, and Higgins (2004), Bartman and Brown (2005), and Brown and Bartram (2005) evaluated the reliability and validity of the Riso-Hudson Enneagram Type Indicator, the instrument used to identify the personality type. Cohen (2007) suggests applications of the Enneagram to psychological assessment, and Matice (2007) promotes the Enneagram as a tool in relationship counselling. Jervis (2006) argues its symbolism and contemporary use.Luckcock (2008), in an article on spiritual intelligence in leadership development, suggests to include the Enneagram system in educational leadership programs.
Kale and Shirvastava (2001), Kale and De (2006), and Kamineni (2005) discussed how the knowledge of the Enneagram system could be applied to human resources sub-functions such as recruitment and selection, training and development, performance appraisal, pay, andcompensation and motivation. The article by Kale and De (2006) is unfortunately not favourable for pro-consumer family and consumer sciences teachers whose aim is to empower individuals and families to question the neo-liberalism ideology and capitalist society, as explained by McGregor (2009). The article presented by Kale and De at the Australian and New Zealand Marketing Academy conference in December 2006 states: “Given the wealth of information the Enneagram potentially affords, scholars in marketing are urged to employ this framework for marketing-related research” (p. 5). It is therefore important that the Enneagram system be taught in schools and university to help prepare students to be more conscious of how marketing agencies manipulate such knowledge to their advantage.McGregor (2009) agrees with this when she reminds family and consumer sciences educatorsto empower individuals to become transformational leaders for the well-being of humanity, rather than advantage a few powerful neoliberal corporations.
Operationalisation of psychological well-being by Ryff (1989), Ryff and Keyes (1995), and Ryff and Singer (2008) is the most compatible with the Enneagram personality system, the family and consumer sciences body of knowledge model, and Ellis’s (1987) REBT.
The present research contributes theoretically to the question of whether USA and PWB can be enhanced through an education intervention, specifically, one that focuses on knowledge of the Enneagram personality system. The family and consumer sciences educators have a responsibility to teach the area of study of “interpersonal relationships” to which the concepts of personality, self-knowledge, and well-being are inherent. The competency: “Analyze the effect of personal characteristics on relationships” (National Association of State Administrators of Family and Consumer Sciences, 2008, p.1) indicates that some form of self-knowledge has to be taught. Therefore, the findings will be important to family and consumer sciences educators and practitioners as they may indicate whether this strategy may be useful in helping young adults in reaching increased USA (and self-knowledge) and affect PWB. The

Godin: Well-being: One personality at a time IJHE Vol 6 No 1 2013
37
current study also contributes to the validation of Brown and Paolucci’s (1979) philosophical proposition that self-knowledge through USA and PWB can help identify thought patterns that may be detrimental to individuals, their families and other interpersonal relationships. Specifically, this study is guided by the following hypotheses. 1) There is a significant relationship between the knowledge of the Enneagram personality system and total PWB scores (Ryff, 1989). 2) There is a significant relationship between the knowledge of the Enneagram personality system and total USA scores (Chamberlain & Hagga, 2001a).
Method
This quasi-experimental study employed a two-group design wherein a control and an experimental group completed a pre-test and two post-tests on PWB and USA. Following the pre-test, the experimental group received three educational sessions on the Enneagram personality system. The first post-test was completed the week following the sessions and the last data collected was collected two months later in order to detect any consequence or presumed effect of the treatment (Lobiondo-Wood & Haber, 2009).
Upon obtaining ethics approval in 2009 from the Research Ethics Board of Mount Allison University and from the Institutional Review Board of Iowa State University, the director of the Office of Research Services from Mount Allison University provided a list of professors who taught large group classes of 50 students or more. The courses selected were offered mostly to second- and third-year students. The participants, young adults (19 years of age and older) who have been attending Mount Allison University, in New Brunswick, Canada for at least a year, were recruited through visits in large classes.
The choice of selecting post first-year students avoided measuring the first-year adaptation period, which generally occurs when most students move from high school to university studies (Gore, 2005). During the class visits, the students were explained the incentives to participate in the research. Apart from being eligible to win a $200 CAN ($175 USA) bursary,all participants would benefit from receiving the educational sessions worth $400 CAN ($350 USA) as the sessions were also offered to the control group after the research was finished.
The instruments used in this study were the Unconditional Self-acceptance Questionnaire(Chamberlain & Haaga, 2001a), Ryff’s (1989) Psychological Well-being Scale and a demographics questionnaire. The Ryff Psychological Well-Being Scale used in this study is composed of the 9-item subscales derived from the shortened 14-item subscales which Ryff is currently using in the Wisconsin Longitudinal Study (C. D. Ryff, personal communication, October, 2008).
The construct validity of the original Ryff Psychological Well-Being Scale, composed of 20-item subscales, ranged between .32 and .76 (Ryff, 1989). The three intercorrelations which were above .72 were for the subscales of environmental mastery and self acceptance, purpose in life and self acceptance, and personal growth and purpose in life. Ryff recognizes these numbers as high but asserts that they are unique because they represent theory-driven dimensions and load on different factors in multivariate and mean levels analysis.

Godin: Well-being: One personality at a time IJHE Vol 6 No 1 2013
38
Participants responded using a six-point scale: strongly disagree (1), moderately disagree (2), slightly disagree (3), slightly agree (4), moderately agree (5), and strongly agree (6).Examples of the items include “I enjoy personal and mutual conversations with family members and friends” and “I have difficulty arranging my life in a way that is satisfying to me.” Responses to negatively scored items were reversed in the final scoring procedures so that high scores indicate high self-ratings on the dimension assessed.
The Unconditional Self-acceptance Questionnaire (USAQ, Chamberlain & Haaga, 2001a)consists of 20 items measuring various aspects of unconditional self-acceptance philosophy. Participants responded to each item on a scale ranging from 1 (almost always untrue) to 7 (almost always true) depending on how the characteristic matched the perception of themselves. Examples of the items include “I feel worthwhile even if I am not successful in meeting certain goals that are important to me” and “When I am criticized or when I fail at something, I feel worse about myself as a person.” According to Chamberlain and Haaga (2001), the USAQ demonstrates a moderate internal consistency (alpha = .72). A test-retest reliability was conducted by Stiner (2007) with a Pearson r of .70 over a two-week period.Stiner also established the construct validity of the two subscales; a correlation coefficient of .43 supports the idea that there are two separate subscales, which are related but distinct.
The demographic questionnaire asked participants to indicate their sex, whether they had attended this university for more than a year, and whether they had heard of the Enneagram personality system. One question asked about the number of stressful events they had experienced in the past three months.
Three two-hour educational sessions on the Enneagram personality system were provided for the intervention group in this study. The first session, an introduction to the Enneagram system, presented the definition and origin of both the word Enneagram and the symbol and a detailed description of the nine basic personality types. Session two discussed how one’s personality type affects relationships. The dynamics of the Enneagram and its variations through the explanation of the wings, the instinctual variants, were also explained. As homework, participants were asked to complete the Riso-Hudson Enneagram Type Indicator,Version 2.5 (Riso & Hudson, 1999) available online from the Enneagram Institute, and reflect on the results. In the last session, the results of the online Riso-Hudson Enneagram Type Indicator were discussed and the REBT theory was also presented for the students to continue to be mindful of their irrational beliefs in the following months.
The data analysis, using SPSS version 18, was conducted for the 29 participants (15 experimental and 14 control) who completed all three questionnaires. Klein (2005) and Tabachnick and Fidell (2001) remind researchers that data preparation and screening are crucial; therefore the following preliminary analyses were conducted. First, the original data were transcribed and each transcription was proofread twice to ensure accuracy. Second, the pattern of missing values was examined. The missing values (a percentage smaller than 1%)were randomly scattered between 10 cases and 7 observations, which is evidence of general pattern of missing data (Little & Rubin, 2002). As these authors suggest doing for a small sample size, the missing data were filled using the model-based imputation method of

Godin: Well-being: One personality at a time IJHE Vol 6 No 1 2013
39
maximum likelihood using expectation-maximisation (EM) algorithm with EQS version 6.1. There was no missing data in the USA questionnaire.
Through an inspection of descriptive statistics, the data were screened for univariate and multivariate outliers. Normality of variables was assessed by statistical measures of skewness and kurtosis (Tabachnick & Fidell, 2001).
Results
The purpose of this study was to examine whether knowledge of the Enneagram personality system effects PWB and USA total scores. The recruitment phase ended with 21 participants in each of the control and experimental groups. The control group included 14 females and 7 males and the experimental group consisted of 13 females and 8 males.
The three weekly educational sessions were held in the evening to avoid being in conflict with university classes. At the first session, 16 of the 21 participants attended, at the second, 12 participated and at the final 11 were present. Even if only eight students from the experimental group attended all three educational sessions, 15 (10 females and five males) completed the Time 2 questionnaire. From the control group, 17 (10 females and seven males) completed the Time 2 questionnaire, giving a total of 32 participants who completedthe post-test.
Two months later, both groups were convened to complete the final questionnaire. From the experimental group, all 15 completed the questionnaire, and from the control group, 14 (ninefemales and five males) completed it.
First, the total scores for each questionnaire (PWB and USA) were tabulated, and descriptive statistics, including mean, standard deviations, skewness, and kurtosis, were calculated for the pre-test and two post-tests. An independent-samples t-test was conducted to compare the PWB scores at Time 1 for the control and experimental groups. There were no significant differences in scores for the control group, M = 4.40, SD = .68 and the experimental group, M= 4.61, SD = .67; t (27) = -.870, p = .392 (two-tailed). The magnitude of differences in the means (mean difference = 1.03, 95% CI: -.73 to .30) was small to moderate (eta squared = 0.02).
A second independent-samples t-test was conducted to compare the USA scores at Time 1 for the control and experimental groups. There were no significant differences in scores for the control group M = 3.76, SD = .57 and the experimental group, M = 4.03, SD = .60; t (27) = -1.20, p = .238 (two-tailed). The magnitude of differences in the means (mean difference = .89, 95% CI: -.71 to .18) was small to moderate (eta squared = 0.03).
Tabachnick and Fidell (2001) specify that assumptions must be tested prior to performing an analysis of covariance (ANCOVA). The first assumption implies that the covariate, which in this case are the Time 1 total scores on PWB and USA scales, are measured prior to the treatment (the sessions on the Enneagram personality system). This assumption was not violated.
Godin: Well-being: One personality at a time IJHE Vol 6 No 1 2013
40
The second assumption concerns the score reliability estimate reported using the Cronbach’s coefficient alpha. Tabachnick and Fidell (2001) state that scales with reliability coefficient values above .7 are considered reliable. The internal consistency of the PWB scale was .9 at all three administration times, and for the USA scale Cronbach’s coefficient alpha was .7 at Time 1 and 3, but .6 at Time 2. Due to the inconsistency in the USA scale, the Guttman’s lambda-6 coefficient is reported with an internal reliability coefficient of .719.
The third assumption, homogeneity of regression slopes, concerns the relationship between the covariate (Time 1) and the dependent variable (Time 3) for each group. This assumption was assessed statistically. In all cases, Time 1 versus Time 2 and Time 1 versus Time 3 and for both scales (PWB and USA), all probability values were above .05; therefore this assumption was not violated.
The fourth and last assumption concerns linearity. The general distribution of scores of the groups was checked with scatterplot graphs. Unfortunately, the relationship between the dependent variable (PSW Time 3) and the covariate (PWB Time 1) was not linear. The same results were found for USA Time 3 and USA Time 1. The linear relationship between the dependent variables and the covariate was also checked between Time 2 and Time 1 for both the PWB total score and the USA total score. Only the relationship between PWB Time 2 was linear with the PWB Time 1.
The testing of the assumptions indicates that the only ANCOVA that could validly be performed was for hypothesis one, between the dependent variable of PWB total scores at Time 2 and the covariate PWB at Time 1 (D’Alonzo, 2004; Hamilton, 1977; Karpman, 1980).
Preliminary checks were conducted to ensure that there were no violations of the assumptions of normality, linearity, homogeneity of variances, homogeneity of regression slopes, and reliable measurements of the covariate. After adjusting for the pre-intervention scores, there was no significant difference between the experimental and control group on the post-intervention scores on the PWB scale, F (1, 26) = .25, p = .62, partial eta squared = .01. There was a strong relationship between the pre-intervention and post intervention scores on the PWB Time 1 scores, as indicated by a partial eta squared value of .81.Therefore, there is no significant relationship between the knowledge of the Enneagram personality system and total PWB scores.
For the second hypothesis “There is a significant relationship between the knowledge of the Enneagram personality system and total unconditional self-acceptance scores,” preliminary checks were conducted to ensure that there were no violations of the assumptions of normality, homogeneity of variances, homogeneity of regression slopes, and reliable measurements of the covariate. Unfortunately, the assumption of linearity was violated; therefore the ANCOVA could not be performed for this hypothesis.
Discussion
This quasi-experimental study investigated whether the knowledge of the Enneagram system affects unconditional self-acceptance and psychological well-being of university students who have been attending university for at least a year. A two-group design was employed, wherein

Godin: Well-being: One personality at a time IJHE Vol 6 No 1 2013
41
a control (N = 14) and an experimental group (N=15) completed a pre-test and two post-tests on psychological well-being and unconditional self-acceptance. The randomly selected experimental group received three weekly educational sessions on the Enneagram system.
Results show that the knowledge of the Enneagram personality system does not have a significant effect on psychological well-being. Due to a small sample size and violation of the assumptions required to conduct an ANCOVA it was not possible to determine if the knowledge of the Enneagram affects unconditional self-acceptance.
These results differ from the research conducted by Schmutte and Ryff (1997), Lopes, Salovez, and Straus (2003), Fleeson and Heckhausen (1997), Hall, Hill, Appleton, and Kozub (2009), Hall, Hill, Appleton, and Kozub (2008), and Davies (2006). Although the above research studies were done with different designs, populations, and constructs, they all share one quality which is missing from this research: a large sample. The number of participants of these research studies which found a significant effect varied from 107 to 398.
By contrast, the only research which found results similar to these was the study done by Stiner in 2007. The REBT-based quasi-experimental study had an independent sample (n = 22), an experimental group (n = 23) and a control group (n = 26). In discussing the results, Stinersuggests that the time elapsed (6 weeks) may not have been enough to have a significant impact on USA. The present results may indicate that 3 months may not be long enough to have a significant effect on USA, as Ryff and Singer (2008) claim that self-acceptance is a long-term process.
These assumptions are confirmed by Wallen and Fraenkel (2001), who recommend having 40 participants per group, while 30 is the minimum required. Initially 91 participants had volunteered to participate, knowing the time commitment required, but only a third participated fully in the research. Attrition is not an isolated occurrence in experimental design with educational intervention (Bloom, 1984; Little & Yau, 1998).
Future research in this domain should first ensure that sufficient participants are recruited.According to Cohen (1988), in order to obtain an 80% probability of detecting a medium effect with a 0.05 significance, 150 participants would be needed. A larger university could be selected and more incentives could be offered to the students to increase sample size. At Mount Allison University, students in psychology courses are allocated credits to participate in research. Unfortunately, I was not in a position to offer the students this same advantage.
It may also be pertinent to sample older participants. During her training sessions, Dallaire (F. Dallaire, personal communication, 2008) recommended to participants in their 40s to answer the personality questionnaire while thinking how they used to be at age 25. She referred to that life period as the time when one’s personality is at its purest. This statement seems to imply that the personality was not completely formed for the participants of this research because none of the experimental group members were older than 25. Therefore, future research may produce better outcomes with participants who are 25 and older. The global trend of the end of the transitional adolescent period being pushed back from 22 to 26 years

Godin: Well-being: One personality at a time IJHE Vol 6 No 1 2013
42
old (Arnett, 2000) may also be a factor that influences personality development and self knowledge of young people.
This last suggestion also brings the question of whether or not this theory should be taught in high schools. Can it contribute to increased self knowledge and improve well-being as suggested by Brown and Paolucci (1979) and Brown (1993)? Even if the results of the present study did not show a significant effect there is a ray of hope that transpires in the eta squared values of .81. This result may indicate a certain influence on PWB through the Enneagram personality system which may have been significant if the sample was larger.
Nevertheless the educators of family and consumer sciences have a responsibility to teach the national standards. The area of study which personality, self-knowledge, and well-being are inherent to is interpersonal relationships. The competency: “Analyze the effect of personal characteristics on relationships” (National Association of State Administrators of Family and Consumer Sciences, 2008 p.1) certainly indicates that some form of self-knowledge has to be taught. The Enneagram personality system may need a study which resembles more that of Alder-Beader, Kerpelman, Schramm, Higginbotham, and Paulk (2007). Through funds received from the U.S. government (Federal Deficit Reduction Act 2005) the authors implemented a relationship program of twelve lessons with a sample of 340 high school students from nine public schools, and found significant results in five dimensions of relationship knowledge. They recommend the implementation of curricula that integrates engaging and active learning, which may be more effective than lecture sessions. Therefore, in a future study it may be favourable that the intervention be an integral part of a family and consumer sciences university course.
This study has limitations. First, social desirability may have influenced the total scores onthe PWB and USA instruments. Secondly, Ryff (1989), author of the PWB instrument, also warns that the questionnaire mostly depicts middle-class values. The students attending the Mount Allison University in Sackville may not all be from this social class. It should also be noted that the students volunteered to participate in the research knowing the subject was personality and well-being; therefore they had an initial interest in the subject. Three basic assumptions are also contained in this research. First, it was assumed that all participantsanswered sincerely when responding to the instruments. Second, all respondents were assumed to be capable of perceiving and accurately reporting their PWB and USA. Finally, it was assumed that three information sessions about the Enneagram personality system were sufficient to create knowledge change in the participants.
Another limitations is that the funds available to complete this research were limited. The results can generalize only to a student population similar of a similar age and demographic status to the current sample.
In conclusion, Ellis and Abrams (2009) recall a time when any type of research on religious or spiritual topics was considered a career-ender. The Enneagram is a personality grid (see Table 1) which links personality and spirituality.

Godin: Well-being: One personality at a time IJHE Vol 6 No 1 2013
43
Table 1 Nine Enneagram personality types and other typologies
Type Basic Characteristics
DSM-IV categories (personality disorders)
Freud’s typology Big 5
One: Reformer Principled, Self-
controlled,
Perfectionist
Obsessive-
compulsive
Anal retentive High C, Average A,
Low E, O, ES
Two: Helper Caring, Generous,
Intrusive
Histrionic Anal expulsive Above average E, A,
Average O, ES, C
Three: Achiever Efficient, Adaptable,
Image conscious
Narcissistic Phallic receptive Above average E,
Average O, ES, C, A
Four: Individualist Intuitive, Expressive,
Temperamental
Avoidant Oral retentive Above average O,
Average A, E, C,
Below average ES
Five: Investigator Perceptive,
Innovative, Detached
Partly paranoid and
partly schizotypal
Oral expulsive Above average O,
Average E, ES , Low
E, A
Six: Loyalist Committed,
Responsible, Anxious
Dependent Anal receptive Average A, E, C,
Below average ES,
Low O
Seven: Enthusiast Spontaneous,
Talkative, Scattered
Histrionic with manic
features
Phallic retentive High E, Above
average ES, O,
Average A, Below
average C
Eight: Challenger Self Confident,
Decisive,
Confrontational
Antisocial Phallic expulsive High E, ES, Above
average C,O, Below
average A
Nine: Peacemaker Calm, Reassuring,
Complacent
Dependant Oral receptive Above average A,ES,
Below average E, C,
Low O
E – extraversion, ES – emotional stability, A – agreeableness, O – openness, C – conscientiousness
SOURCE: Adaptation of Bartram & Brown (2005) and Riso & Hudson (1999).
This research has not demonstrated its effect on psychological well-being and unconditional self-acceptance, but the review of literature demonstrated that others such as Kale and Shrivastava (2001) and Kale and De (2006) are exploring its use for marketing strategies. Although Rutter and Smith (1995) remind us that in the last 50 years, economic prosperity and new technologies have not dramatically improved adolescents’ or adults’ well-being, it is still important that the Enneagram system be taught in schools and university to help prepare students to be more conscious of how marketing agencies manipulate such knowledge to their advantage. McGregor (2009) reiterates this when she reminds family and consumer sciences educators to empower individuals to become transformational leaders for the well-being of humanity rather than enrich a few corporations.
Godin: Well-being: One personality at a time IJHE Vol 6 No 1 2013
44
Biography
Jeanne Godin, PhD, is a professor at the École des sciences des aliments de nutrition et d’études familiales at Université de Moncton in Moncton, New-Brunswick, Canada.
References
Alder-Beader, F., Kerpelman, J. L., Schramm, D. G., Higginbotham, B., & Paulk, A. (2007). The impact of relationship education on adolescents of diverse backgrounds. Family Relations, 56, 291-303.
Arnett, J. (2000). Emerging adulthood: A theory of development from the late teens through the twenties. American psychologist, 55, 469-480.
Bartman, D., & Brown, A. (2005). Putting the person into personality: SHL Short research report 2005. SHL White paper. Retrieved 7 December, 2007, from http://www.Enneagraminstitute.com/articles/Person_into_personality.pdf
Bloom, H. S. (1984). Accounting for no-shows in experimental designs. Evaluation Review, 8,225-246.
Borsboom, D., Mellenbergh, G. J. & van Heerden, J. (2003). The concept of validity. Psychological Review, 111(4), 1061-1071. doi: 10.1037/0033-295X.111.4.1061
Brown, A., & Bartram, D. (2005). Relationships between OPQ and Enneagram types. Retrieved 7 December, 2007, from www.ennegraminstitute.com/articles/SHLresearch.pdf
Brown, M. M. (1993). Philosophical studies of home economics in the United States: Basic ideas by which home economists understand themselves. East Lansing: Michigan State University.
Brown, M. M., & Paolucci, B. (1979). Home economics: A definition. Washington, DC: American Home Economics Association.
Chamberlain, J. M. (1999). An empirical test of rational-emotive behavior therapy's unconditional self-acceptance theory (Unpublished doctoral dissertation). The American University, Washington, DC.
Chamberlain, J. M., & Haaga, D. A. (2001a). Unconditional self-acceptance and psychological health. Journal of Rational-Emotive & Cognitive-Behavior Therapy, 19(3), 163-176.
Chamberlain, J. M., & Haaga, D. A. (2001b). Unconditional self-acceptance and responses to negative feedback. Journal of Rational-Emotive & Cognitive-Behavior Therapy, 19(3), 177-189.
Cervone, D. (2004). Personality assessment: Tapping the social-cognitive architecture of personality. Behavior Therapy, 35, 113-129.
Cohen, J. (1988). Statistical power analysis for the behavioural sciences. Hillsdale: Lawrence Erlbaum.

Godin: Well-being: One personality at a time IJHE Vol 6 No 1 2013
45
Cohen, M. C. (2007). Application of the Enneagram to psychological assessment. Retrieved 2 April, 2010, from www.Enneagram.com/PDF_EnneagraminPsychologicalAssessment.pdf
Costa, P. T., & McCrae, R. R. (1990). Personality disorders and the five–factor model of personality. Journal of Personality disorders, 4, 362-371.
Dallaire, F. (2000). Quelle est votre énigme personnelle? [What is your personal enigma?]. Outremont: Quebecor.
Dallaire, F. (2004). S’aimer authentiquement grâce à l’ennéagramme [Love oneself through the Enneagram]. Outremont: Québecor.
Dallaire, F. (2010). Donner des ailes à votre âme. [Give wings to your soul]. Outremont: Québecor.
D’Alonzo, K. T. (2004). The Johnson-Neyman procedure as an alternative to ANCOVA. Western Journal of Nursing Research, 26 (7), 804-812.
Davies, M. F. (2006). Irrational beliefs and unconditional self-acceptance. III. The relative importance of different types of irrational beliefs. Journal of Rational-Emotive & Cognitive-Behavior Therapy, 26(2), 102-118.
De Lassus, R. (2006). L’ennéagramme, les 9 types de personnalité. [The Enneagram, the 9 personality types]. Barcelone: Marabout.
Ellis, A. (1987). The impossibility of achieving consistently good mental health. American Psychologist, 42(4), 364-375.
Ellis, A., & Abrams, M. (2009). Personality theories: Critical perspective. Thousand Oaks: Sage.
Enneagram Institute. (2010). The Enneagram institute: World headquarters. Retrieved 10 April, 2010, from http://www.enneagraminstitute.com/
Fleeson, W., & Heckhausen, J. (1997). More or less “me” in past, present, and future: Perceived lifetime personality during adulthood. Personality and Aging, 12(1), 125-136.
Gore, J. S. (2005). Determinants of self-concept change in new environments. (Doctoral dissertation). Retrieved from Proquest. (UMI No. 3172216).
Hall, H. K., Hill, A. P., Appleton, P. R., & Kozub, S. A. (2008). Perfectionism and burnout in junior elite soccer players: The mediating influence of unconditional self-acceptance. Psychology of Sport and Exercise, 9, 630-644. Retrieved 3 December, 2008, from http://www.sciencedirect.com
Hall, H. K., Hill, A. P., Appleton, P. R., & Kozub, S. A. (2009). The mediating influence of unconditional self-acceptance and labile self-esteem on the relationship between multidimensional perfectionism and exercise dependence. Psychology of Sport and Exercise, 10, 34-44 doi:10.1016/j.psychsport.2008.05.003

Godin: Well-being: One personality at a time IJHE Vol 6 No 1 2013
46
Hamilton, B. (1977). An empirical investigation of the effects of heterogeneous regression slopes in analysis of covariance. Educational and Psychological Measurement, 37, 701-712.
Jervis, J. (2006). The Enneagram: Symbolism and community in the Age of Aquarius (Doctoral dissertation). [Abstract]. Retrieved from ProQuest Dissertation and Theses database. (AAT NR31129)
Kale, S. H., & De, S. (2006, December). Using the Enneagram for internal marketing in service establishments. [Electronic version] Paper presented at the Australian and New Zealand Marketing Academy (ANZMAC) Conference, Brisbane, Australia.
Kale, S. H., & Shrivastava, S. (2001). Applying the Enneagram to manage and motivate people. Journal of Spirituality, Leadership and Management, 22(4), 308-328.
Kamineni, R. (2005). The next stage of psychographic segmentation: Use of Enneagram. Journal of American Academy of Business, 6(1), 315-320.
Karpman, M. B. (1980). ANCOVA – A one covariate Johnson-Neyman algorithm. Educational and Psychological Measurement, 40, 791-793.
Klein, R. B. (2005). Principles and practice of structural equation modeling (2nd ed.). New York: The Guilford Press.
Little, J. A., & Rubin, D. B. (2002). Statistical analysis with missing data (2nd ed.). NJ Hoboken: John Wiley & Sons Inc.
Little, J. A., & Yau, L. H. Y. (1998). Statistical techniques for analyzing data from preventionstrials: Treatment of no-shows using the Rubin’s causal model. Psychological Methods, 3(2), 147-159.
Lobiondo-Wood, G., & Haber, J. (2009). Nursing research in Canada: Methods and critical appraisal for evidence-based practice (2nd ed.). Toronto: Mosby Elsevier.
Lopes, P. N., Salovez, P., & Straus, R. (2003). Emotional intelligence, personality, and perceived quality of social relationships. Personality and Individual Differences, 35,641-658.
Luckcock, T. (2008). Spiritual intelligence in leadership development. Educational Management Administration & Leadership, 36(3), 373-391.
Matice, M. (2007). The Enneagram: An innovative approach. Journal of Professional Counseling, Practice, Theory, & Research, 35(1), 38-58.
McGregor, S. L. T. (2009, May). Contemporary family economics: A call for transformation.Paper presented at the New Brunswick Home Economics Association Conference, Moncton, NB, Canada.
National Association of State Administrators of Family and Consumer Sciences. (2008).Standards and competencies: Area of study: Interpersonal relationships. Available from: http://www.doe.in.gov/octe/facs/sc_interpersonal.html

Godin: Well-being: One personality at a time IJHE Vol 6 No 1 2013
47
Newgent, R. A. (2001). An investigation of the reliability and validity of the Riso-Hudson Enneagram Type Indicator. (Doctoral dissertation). Retrieved from Proquest. (UMI No. 3005901).
Newgent, R. A., Parr, P. E., & Newman, I. (2002). The Enneagram: Trends in validation. ED 468 827. ERIC/CASS in Resources in Education (CG031949)
Newgent, R. A., Parr, P. E., Newman, I., & Higgins, K. K. (2004). The Riso-Hudson Enneagram type indicator: Estimates of reliability and validity. Measurement and Evaluation in Counseling and Development, 36(4), 226-237.
Nickols, S. H., Ralston, P. A., Anderson, C., Browne, L., Schroeder, G., Thomas, S., & Wild, P. (2009). The family and consumer sciences body of knowledge and the cultural kaleidoscope: Research opportunities and challenges. Family and Consumer Sciences Research Journal, 37(3), 266-283.
Riso, D. R., & Hudson, R. (1999). The wisdom of the Enneagram: The complete guide to psychological and spiritual growth for the nine personality types. New York: Bantam Books.
Rutter, M. & Smith, D.J. (1995). Psychosocial Disorders in Young People, Time Trends and Their Causes. Chichester, England: John Wiley & Sons.
Ryff, C. D. (1989). Happiness is everything, or is it? Explorations on the meaning of psychological well-being. Journal of Personality and Social Psychology, 57(6), 1069-1081.
Ryff, C. D., & Keyes, C. L. M. (1995). The structure of psychological well-being revisited. Journal of Personality and Social Psychology, 69(4), 719-727.
Ryff, C. D., & Singer, B. H. (2008). Know thyself and become what you are: A eudaimonic approach to psychological well-being. Journal of Happiness Studies, 9, 13-39.
Schmutte, P. S., & Ryff, C. D. (1997). Personality and well-being: Reexamining methods and meanings. Journal of Personality and Social Psychology, 73(3), 549-559.
Stiner, A. (2007). Psychometric properties of the unconditional self-acceptance questionnaire and the association of self-acceptance with eating disorders. (Doctoral dissertation). [Abstract]. Retrieved from ProQuest Dissertation and Theses database. (UMI 3302732).
Tabachnick, B. G., & Fidell, L. S. (2001). Using multivariate statistic (4th ed.). Needham Heights: Allyn & Bacon.
Wallen, N. E., & Fraenkel, J. R. (2001). Educational research: A guide to the process.Mahwah: Lawrence Erlbaum Associates.
Wagner, J. P. (1981). A descriptive, reliability, and validity study of the Enneagram personality typology (Doctoral dissertation). (Doctoral dissertation). [Abstract].Retrieved from ProQuest Dissertation and Theses database. (No. 8109973).
Wagner, J. P., & Walker, R. E. (1983). Reliability and validity study of a sufi personality typology: The Enneagram. Journal of Clinical Psychology, 39(5), 712-717.

International Journal of Home Economics
48
Money management practices in transition economies: How findings from Financial Literacy Surveys may inform Home
Economics educators
Irina Kunovskaya, Brenda Cude, Joan Koonce
University of Georgia
Introduction
A family's capability to manage its financial resources is widely recognised as a contributing factor to its financial status as well as the present and future economic well-being of the individuals in that family. Given the growing complexity of financial markets as well as a shrinking safety net in some countries, including the U.S., financial management is increasingly challenging.
Families in transitional economies face unique challenges. Virtually all families in transitional economies within the last two generations have lost savings due to numerous financial shocks. Many have limited trust in financial intermediaries because of negative experiences, including, for example, with pyramid schemes. These families usually do not have a tradition of positive experiences with formal financial services and their products to offset these recent negative interactions. Additionally, recent unprecedented expansion of the retail financial services industry and especially consumer credit increases the risk to the financial status of families in transitional economies.
In recent decades the role of financial literacy in the management of financial resources has been acknowledged in many countries around the world, including countries with transitional economies. The World Bank's diagnostic work on consumer financial protection and financial literacy in several middle-income countries in Europe and Central Asia revealed that the public-at-large lacks basic financial literacy and is largely unaware of their rights as financial consumers (Rutledge, 2010). The Organization for Economic Co-operation and Development (OECD) has recognised the importance of financial literacy in developing and emerging economies because of the influence that financially capable households can have on the development of efficient and competitive markets and the economy's growth (The International Bank for Reconstruction and Development/The World Bank, 2009).
The literature on the broad topics of financial literacy, financial capability, and financial education is abundant. Yet little is known about money management practices in transitional economies. Without this knowledge, it is difficult to design effective education efforts. This paper contributes to the debate by providing an overview from existing literature of money management practices and their relationship to financial capability. It reports results from an empirical analysis of data on the money management practices of Russians and compares the results to available data for other transitional economies. The data come from nationwide financial literacy surveys conducted in 2008-2010 in Azerbaijan (The Central Bank of the

Kunovskaya: Money management practices in transition economies IJHE Vol 6 No 1 2013
49
Republic of Azerbaijan, 2010), Bulgaria (Alpha Research, 2010)2010). Finally, the paper identifies core challenges for financial literacy education.
Literature
The terms “financial literacy” and “financial capability” have often been used interchangeably in the literature; other times, they have been used to represent distinct but related concepts. Traditionally, financial literacy has been the preferred term in North America while financial capability is the term preferred in Great Britain (Social and Enterprise Development Innovations, 2004, p. 5). The evolution of the title of U.S. President’s Advisory Council from Financial Literacy to Financial Capability in its second incarnation in 2010 may, however, signal a change in North America.
There has been much debate but little consensus about the conceptualisation of both terms. Remund (2010) reviewed 100 resources including research studies, expert opinions, and intervention programs and reported that the regulatory, research, and practitioners’ communities have not yet reached consensus on what financial literacy is. Huston (2010) reviewed 71 studies and found that almost one half defined financial literacy as financial knowledge. Others defined financial literacy as broader than knowledge but there were inconsistencies in what the additional component was. Some added money management skills (Jump$tart Coalition for Personal Financial Literacy, 2007; the President’s Advisory Council on Financial Literacy, 2008), while for others the additional component was the ability to make effective decisions (Lusardi & Tufano, 2009; Mandell, 2007; Noctor, Stoney, & Stradling, 1992) or practical experience (Moore, 2003). The breadth in the conceptual definitions of financial literacy makes it challenging to operationalise it. It also creates difficulties to systematically collect data to assess financial literacy (Ardic, Ibrahim, & Mylenko, 2011) and to identify mechanisms to impact financial literacy through financial education (Hung, Parker, & Yoong, 2009).
Generally, financial capability is considered a broader concept than financial literacy (Dixon, 2006; Johnson & Sherraden, 2007). While both are often assumed to include knowledge as well as skills and/or behaviours (Kempson, Collard, & Moore, 2005; Policy Research Initiative, 2006), financial capability is distinct in that it also is often assumed to include financial access (Green, 2011) and links individual functioning to institutions (Johnson & Sherraden, 2007). Access to financial products is a challenge in developing economies, including countries in transition. A high proportion of individuals do not have a transaction account in such countries: for example, Armenia, 91% (Beck, Demirguc-Kunt, & Martinez Peria, 2007), Latvia and Lithuania, 65%; Poland, 58%; Slovakia, 48% (Andreloni, Bayot, Bledowski, Iwanicz-Drozdowska, & Kempson, 2008), and Russia, 31% (Honohan, 2008).
Theory
The conceptualisation of financial capability may be theoretically grounded in Sen’s (1993, 1999) “capability approach” to well-being. Sen has argued that people who increase their capabilities can improve their quality of life and expand their “real freedom” (Sen, 1999). In a capabilities-oriented reasoning, a person who lacks financial knowledge or access to financial services has limited opportunities to a life of real “financial freedom” and to pursue

Kunovskaya: Money management practices in transition economies IJHE Vol 6 No 1 2013
50
her financial goals. The demonstrated ability to exercise financial knowledge and skills has become increasingly viewed as a contributing factor to individuals’ and families’ well-being on the micro-level, and to a country’s financial stability and economic growth on the macro-level (Holzman, 2010).
A precise definition of financial capability is important to create empirically measured indicators with the ultimate goal of more effective educational interventions. The Financial Services Authority (FSA), which conducted an exploratory study (Kempson, Collard, & Moore, 2005) using focus groups as well as several subsequent studies (FSA, 2006), proposed that financial capability could be conceived as being composed of four different domains: managing money, planning ahead (making provisions for unexpected expenses and old age), choosing (financial) products, and staying informed (including basic knowledge of financial services and getting advice and redress). This approach was successfully used for baseline survey development in several countries to measure financial capability and to learn if interaction with financial institutions was beneficial. Robert Holzman (2010) identified this approach as “the nucleus for an international methodology to measure financial literacy/capability across time and space” (p. 5). Atkinson, McKay, Kempson, and Collard (2006), using a survey commissioned by the FSA to explicitly measure financial capability in Britain, created financial capability scores within each domain based on the assumption that individuals who do well in one of the four domains would not necessarily do well in all of the others. They found that older people with higher incomes and those in couples with no dependent children had the highest financial capability scores. They also reported that “individuals may be particularly capable in one or more areas, but lack skills or experience in other areas” (p. 138). In particular, those with less experience with financial services did not fare well in the “choosing products” domain, even if they had relatively greater strengths in the other domains.
This study applies the FSA’s approach of measuring financial capability as four different domains (Atkinson et al., 2006; Kempson et al., 2005) to focus on only one of the four domains – managing money. Managing money is often considered in the literature as a central component of financial capability (Taylor, 2011). One’s money management practices are important even when financial capability is constrained by the current financial situation,
practices in transitional economics is important because in Soviet times, people had limited incentives to pay attention to managing their own finances (Matul, 2009).
Several researchers have included measures of money management in their research. Atkinson et al. (2006) included 16 questions about money management in their survey of
variables), and Melhuish, Belsky, and Malin (2008) (four variables) assessed money management(Romania).
This research also has suggested that money management is not necessarily unidimensional. Atkinson et al. (2006) reported that two factors were needed to adequately represent money management – making ends meet and keeping track of money.

Kunovskaya: Money management practices in transition economies IJHE Vol 6 No 1 2013
51
Thus, the hypothesis of this study is that characteristics other than income will influence whether a Russian individual reports managing her money well. Specifically, we expect that, holding all else constant, age, education, and employment status will be related to positive money management. To examine this hypothesis, we created a Money Management Index that is based on seven items. We also examined and compared the money management of respondents in three other countries in transition – Azerbaijan (The Central Bank of the Republic of Azerbaijan, 2010), Bulgaria (Alpha Research, 2010) ,2010).
Data and sample
The surveys used for this study, the Nationwide Financial Literacy Surveys, were a part of the World Bank’s country-level diagnostic reviews of the legal and regulatory frameworks of consumer protection and financial literacy in selected countries (The International Bank for Reconstruction and Development/The World Bank, 2011). In each of the four countries (Azerbaijan, Bulgaria, Romania, and Russia), the surveys used a common methodology and asked about 50 similar but not always precisely the same questions to provide country-specific information regarding respondents’ understanding of basic financial concepts, awareness of financial consumer rights, patterns of household financial management, use of financial services, and attitudes regarding financial markets. All data were collected between 2008 and 2010 via face-to-face interviews with respondents 18 years of age or older. Sample sizes were between 1,207 (in Azerbaijan) and 1,912 (in Romania). The Russian data were from 1,600 individuals in May-June 2008. The samples were nationally representative of the countries’ populations by gender, age, education, and areas of residence.
Table 1 reports the summary statistics describing the samples. The gender distribution was relatively equal; just more than one half were female in Russia and Bulgaria and male in Azerbaijan and Romania. The mean age was 42in Azerbaijan, 47 in Bulgaria, 48.6 years in Romania, and 44.5 years in Russia. The mean household size was higher in Azerbaijan (4) than in Russia (3). Most respondents (76.3% in Romania, 80.5% in Bulgaria, 88.9% in Russia, and 97% in Azerbaijan) lived in households with two to four people, including themselves.
In Russia the largest group (43.3%) had completed technical college (vocational education) or had some college education, followed by completion of secondary education or lower education (39.6%). Much smaller proportion was college graduates (17.1%). A small proportion of respondents in Romania had completed education above secondary level (15.2%). Azerbaijan had a higher proportion (27.2%) of respondents with higher education compared with other countries (10.4% in Romania, 17.1% in Russia, 19.6% in Bulgaria).
Just over one half of the respondents were in the labour force in Azerbaijan, Bulgaria, and Russia. The non-working group in each country was comprised of registered unemployedindividuals, students, non-working retirees, and household workers such as housewives. Romania had the highest proportion of retired respondents (36.8%).
Nearly one-half of the respondents were from rural areas in Azerbaijan (46%) and Romania (47.9%). In Russia and Bulgaria the largest groups came from urban areas (73.2% and 71.9% respectively).

Kunovskaya: Money management practices in transition economies IJHE Vol 6 No 1 2013
52
Table 1 Characteristics of the samples by countries: Azerbaijan, Bulgaria, Romania,
and Russia (% of respondents)
Variables
Azerbaijan
N=1207
Bulgaria
N=1432
Romania
N= 1912
Russia
N=1600
Age 42.0 47.0 48.6 44.5
Less than 29 22.0 21.7 19.5 24.7
30-49 49.3 34.6 32.4 37.0
50 and older 28.7 43.6 46.8 38.3
Gender
Female 48.3 52.4 48.1 54.6
Male 51.7 47.6 51.9 45.4
Household size 4.4 3.0
Single 3.0 19.5 23.7 11.1
More than one 97.0 80.5 76.3 88.9
Education
High school or less 51.4 55.4 84.8 39.6
Vocational education orincomplete higher education
21.4 26.0 4.8 43.3
Higher education 27.2 19.6 10.4 17.1
Employment status
In the labour force 50.1 54.4 41.1 56.4
Retired 17.2 27.0 36.8 24.3
Students 3.5 5.9 9.1 12.6
Other not in the labour force 29.2 12.7 13.0 6.7
Settlement type
Urban 54.0 71.9 52.1 73.2
Rural 46.0 28.1 47.9 26.8
Variables and method
Selection of variables in the secondary data set used for this research was based on previous research. The variables selected to assess money management are described in detail in Table 2. These variables included practices, such as keeping records; the respondents’ financial situation, such as having unspent money at the end of the month and running out of money (52.5%); external forces, such as financial shocks; and self-perceptions and aspirations (e.g., trying to save). (The first question in the Financial Literacy surveys of Bulgaria and Romania was asked slightly differently: As a whole, how satisfied are you with your life nowadays? Response options were: very unsatisfied, rather dissatisfied, rather satisfied, very satisfied, and don’t know (Alpha Research, 2010)). For each variable, a higher mean value indicated the respondent was more likely to engage in a positive aspect of money management. An empty cell indicates a question that was not asked in a country.
As previous research has suggested that money management is not unidimensional, we employed factor analysis to create a composite index for money management capability that retained as much information from the original variables as possible (Fabrigar, Wegener,

Kunovskaya: Money management practices in transition economies IJHE Vol 6 No 1 2013
53
MacCallum, & Strahan, 1999; Gorsuch, 1983). This statistical technique has been widely applied in social sciences for a variety of applications including research in financial literacy, behaviour, and education. Because the variables chosen have different scales, they were standardised to have a mean of zero and a variance of one. The series mean among the non-missing data was used to impute the missing information.
Table 2 Money management domain: Percent engaging in variables selected from the
Financial Literacy Surveys (Azerbaijan, Bulgaria, Romania, and Russia).
Variable VariableDescription
Azerbaijan Bulgaria Romania RussiaMean(SD)/
Percent
Percent Mean (SD)/
Percent
Mean (SD)/
Percent
Self-reported
financial situation (Q1)
A five-point Likert-type item reflecting respondent’s perception of the financial situation in her family
2.64
(0.77)
2.33
(max=4)
(.76)
1.84
(max= 4)
(0.74)
2.9
(.66)
= 5 if very good, .8 2.1 1.3 .8
= 4 if good, 7.8 44.2 17.0 12.9
= 3 if satisfactory, 54.0 - - 63.9
= 2 if bad, 29.4 38.1 46.8 20.5
= 1 if very bad. 8.0 15.6 35.0 1.9
Making ends meet(Q2)
A variable reflecting respondent’s assessments of how she/her family makes ends meet, recorded as ordinal
NA 2.13
(1.05)
2.12
(.89)
2.8
(.8)
=5 if can afford quite expensive things, 1.8 1.7 .3
=4 if has no trouble buying durable goods, 9.3 4.2 16.4
=3 if has enough money to buy food and clothes, 24.1 24.1 51.7
=2 if has enough money to buy food but not clothes,
28.9 44.2 23.1
=1 if hardly makes ends meet. 35.9 25.9 6.8
Trying to save(Q3)
A variable reflecting a respondent’s self-reported assessment of managing everyday revenues and recorded as ordinal
2.51 (1.6)
1.87
(1.26)
2.18 (1.32)
2.65
(1.45)
=5 if she tries to save something and spends the rest,
23.0 8.2 10.0 19.3
=3 if she spends money on everyday needs and saves the rest,
30.0 24.4 39.9 44.8
=1 if she does not save anything, spending all the money on everyday needs.
47.0 66.5 50.2 36.0
Having unspent money (Q4)
A five-point Likert-type item reflecting how often during the last year a respondent (her family) had any money unspent from previous earning before new revenues arrived
1.96
(1.20)
1.98
(1.07)
2.07 (1.00)
2.14 (1.15)
=5 if always, 5.6 2.2 2.6 5.9
=4 if very often, 6.5 9.0 5.3 5.3
=3 if sometimes, 18.2 16.5 22.4 23.3
=2 if very rarely, 17.8 29.2 35.1 27.9
=1 if never. 51.9 43.0 34.6 37.8

Kunovskaya: Money management practices in transition economies IJHE Vol 6 No 1 2013
54
Variable VariableDescription
Azerbaijan Bulgaria Romania RussiaMean(SD)/
Percent
Percent Mean (SD)/
Percent
Mean (SD)/
Percent
Keeping records (Q5)
A variable reflecting if a respondent (her family) is used to keeping records of income and expenditures, and recorded as an ordinal variable
2.13
(1.11)
4.01
(1.09)
3.37
(1.02)
3.74
(1.27)
= 5 if she keeps records of everything, entering all revenues, or if she keeps records of everything but does not enter all of them,
27.0 57.8 23.7 48.0
=3 if she does not keep records of everything but knows in general her monthly budget,
38.2 38.8 70.5 43.1
=1 if she does not keep records of family resources and does not have a general idea of her monthly budget.
34.8 3.4 5.8 8.9
Borrowing (Q6)
A five-point Likert-type item reflecting how often during the last year a respondent (her family members) had to borrow to pay back other debts
3.55
(1.16)
4.02
(1.08)
3.75
(1.17)
3.91 (1.09)
= 1 if always, 3.8 2.2 4.3 1.9
= 2 if very often, 16.7 9.0 11.7 9.7
= 3 if sometimes, 26.5 16.5 21.8 25.6
= 4 if very rarely, 26.1 29.2 27.9 21.7
= 5 if never. 27.0 43.0 34.4 39.8
Having Debts (Q7)
A binary variable reflecting if a respondent reported having any debts
3.07 (1.99)
2.70
(1.98)
3.92
(1.78)
3.72 (1.86)
= 5 if no, 51.9 42.5 73.0 68.2
=1 if otherwise. 48.1 57.5 27.0 31.8
Running out of money (Q8)
A five-point Likert-type item reflecting how often during the last year a respondent (her family) ran out of money from previous earnings before the new money arrived
2.67
(1.31)
2.7
(1.98)
3.22
(1.21)
3.23 (1.23)
= 1 if always, 21.4 7.5 9.3 8.3
= 2 if very often, 31.1 18.0 18.3 20.2
= 3 if sometimes, 20.1 40.5 33.2 33.9
= 4 if very rarely, 14.2 17.8 20.8 16.0
= 5 if never. 13.2 16.1 18.5 21.6
Income shock Q(9)
A binary variable reflecting if a respondent reported experiencing an unexpected significant reduction in her income over the last three years
3.26
(1.98)
3.31
(1.98)
3.61
(1.99)
3.12
(1.99)
= 5 if no, 56.4 57.8 65.3 53.0
= 1 if otherwise. 43.6 42.2 34.7 47.0
Results
Table 2 suggests that money management practices in the selected countries, including Russia, are generally not very positive. In Russia, just less than two thirds (63.9%) reported that their current financial situation was satisfactory and almost one quarter (23.1%) reported having enough money to buy food, but not clothes. Nearly two thirds (65.7%) said they very

Kunovskaya: Money management practices in transition economies IJHE Vol 6 No 1 2013
55
rarely or never have any unspent money at the end of the month, and 11.6 % said they always or very often have to borrow money to pay back debt. Only 19.3% tried to set aside savings before spending on everyday needs, and 36% did not even try to save. On the other hand, all but 8.9% said they either kept spending records or knew their budget. However, the proportions engaged in positive money management practices in the other three countries reported in Table 2 were even lower. More than one third (34.8%) of respondents from Azerbaijan did not keep records of family spending and did not have a budget. More than one half of these same respondents never had any unspent money and always or very often ran out of money. More than one half (53.7%) of Bulgarian respondents had a bad or very bad perception of their financial situation. Almost two thirds of Bulgarian (66.5%) and one-half of Romanian (50.2%) respondents said they never tried to save anything, spending all of their money on everyday needs.
Table 3 reports the Spearman rank correlation coefficients matrix which suggests reasonable factorability of selected variables for the Russian sample of 1,600 respondents. The strongest associations (>.3) were between self-reported financial situation (Q1) and reported ability to make ends meet (Q2), between reported ability to make ends meet (Q2) and having unspent money before the arrival of new revenues (Q4), and between borrowing (Q6) and having debts (Q7) as well as borrowing (Q6) and running out of money (Q8).
Table 3 Correlations between money management variables: 2008 the Financial
Literacy Survey, Russia
Variable Q1 Q2 Q3 Q4 Q5 Q6 Q7 Q7 Q8
Q1 1 .46 .19 .27 .02 .14 .04 .20 .19
Q2 1 .23 .30 -.01 .18 .04 .26 .17
Q3 1 .41 .01 .12 .05 .19 .13
Q4 1 .01 .17 .11 .29 .15
Q5 1 -.01 .01 .00 .00
Q6 1 .36 .37 .27
Q7 1 .17 .15
Q8 1 .27
Q9 1
Item analysis was conducted to find those variables that formed an internally consistent scale of money management capability and to eliminate those variables that did not. Internal consistency implies that variables measure the same construct (Spector, 1989) and uses both item-total coefficient and coefficient alpha (Cronbach, 1958) for investigation. Examination of the item-total coefficients revealed that the variables with low coefficients (< .3) were “keeping records” (.008) and “having debts” (.221). Removing both of these values increased

Kunovskaya: Money management practices in transition economies IJHE Vol 6 No 1 2013
56
the coefficient alpha to a level .68 which is close to acceptable level of .7 (Nunnally & Bernstein, 1994). The Kaiser-Meyer-Olkin measure of sampling adequacy was .73, above the recommended value of .6, and Bartlett’s test of sphericity was significant (p < .001). The diagonals of the anti-image correlation matrix were all greater than .7, supporting the inclusion of each of the items in the factor analysis after removing the variables “keeping records” and “having debts.”
Principle component analysis using SPSS (PASW18.0) was the method of extraction used to compute a composite Money Management Index (MMI). An MMI could be used to trace changes in money management over time for one country as well as to compare money management practices across countries.
The two-component solution, which explained 47.2 % of the variance, was preferred. All variables had primary loadings over .5. The factor loading matrix for this final solution is presented in Table 4. This solution was selected on the basis of the eigenvalues-greater-than-1 rule (Kaiser criteria) (Kaiser, 1960) and the scree test, which identifies the point of “leveling off” of eigenvalues on the scree plot. Several rotation solutions were examined before selecting a varimax rotation as the one that provided the best defined factor structure.
Table 4 Factor loadings and communalities based on a principle components analysis
with varimax rotation for seven variables in the money management domain
of financial capability (N = 1600)
Variables Component 1 Component 2 Communalities
Making ends meet .711 .530
Self-reported financial situation .696 .492
Having unspent money .661 .478
Trying to save .619 .387
Borrowing .779 .612
Running out of money .695 .554
Income shock .674 .464
The factor analysis suggested a Money Management Index with two components. Inspection of the variables forming the first component suggested it is composed of variables reflecting positive aspects of money management – a positive self-perception, being able to cover everyday needs, trying to save, and having some money left at the end of the month. This appears to parallel the factor that Atkinson et al. (2006) identified as “making ends meet” (Component 1). The second component is composed of variables that are negative in nature –running out of money before payday, borrowing to pay back other debts, and experiencing an unexpected income reduction. This component, even though not easily described, was identified as “coping with financial risks” (Component 2). Using regression scoring, a factor

Kunovskaya: Money management practices in transition economies IJHE Vol 6 No 1 2013
57
score was computed for each component; these are reported in Table 5. Each score reflects the weighting for each variable in the component and indicates the respondents’ relative standing for that component. For example, a person with a score of 2.9 on the first component is very capable on that component compared with a person with a score of -2.9. In addition, a composite Money Management Index was calculated and then rescaled to take values from 0 to 100. For almost three quarters of the Russian respondents, the Money Management Index was less than 68. A significant proportion of the population was at the far left of the distribution; the MMI was less than 38 for one quarter of the respondents. An MMI this low indicates that Russian respondents clearly experience difficulties in managing money effectively.
Table 5 Descriptive statistics for component scores and the Money Management Index
Mean Standard
deviation
Min Max
Making ends meet: score 0.0 1.00 -2.849 3.316
Coping with financial risks: score 0.0 1.00 -2.756 2.117
Money Management Index: composite score 50.0 17.68 3.48 95.16
We used Ordinary Least Squares (OLS) regression to identify socio-demographic variables available from the 2008 Nationwide Financial Literacy (Russia) survey that explain the variance in the Money Management Index. Specifically, our hypothesis was that, holding all else constant, age, education, and employment status would be related to positive money management. Table 6 reports the results of linear regression as well as the mean values of the MMI. (For binary variables, positive coefficients mean that respondents with the corresponding socio-demographic characteristic would have a higher MMI compared with respondents in the reference group.)
All of the variables in the regression, with the exception of settlement size (or the population of the respondent’s community), were significant in explaining the variation in the MMI. The estimated coefficients on the significant variables were positive, indicating a positive relationship between the MMI and each variable. ANOVA was used to further investigate the relationships (results not reported here). The results indicated that there were positive and significant relationships between age (younger than age 29), gender (male), household size (single), education (vocational and higher education), employment status (student), and higher income. Being a single male under 30 and being a student, having above secondary school education, and having a higher income contributed significantly to higher scores.

Kunovskaya: Money management practices in transition economies IJHE Vol 6 No 1 2013
58
Table 6 Regression analysis for Money Management Index
Exploratory variablesMMI
Mean
OLS Regression
Coefficients
Constant -7.028***
Age
Younger than 29 53.2 .159**
Ages 30-49 (reference group) 50.7 .027
Older than 50 47.3 .182***
Gender
Female (reference group) 48.9
Male 51.4
Household size
Single 50.4 .213**
More than one (reference group) 46.6
Education
Primary or incomplete secondary (reference group) 45.4
Vocational education or incomplete higher education 52.1 .409***
Higher education 55.4 .625***
Employment status
In the labor force 51.5 .028
Retired 45.5 .092
Students 55.6 .478***
Other not in the labor force (reference group) 49.1
Settlement size
Over 500K 53.0 .079
Less than 500K (reference group) 48.8
Income ($) /(log) .705***
Quartile 1 41.4
Quartile 2 46.3
Quartile 3 53.4
Quartile 4 59.3
Note: *p-value < .05; ** p < .01; *** p < .001; Quartiles1-4 are not included in the regression
These results were consistent with our expectations and with previous research. While income is important in explaining differences in the MMI, it is reassuring that other characteristics are important as well; that is, individuals other than those with high incomes can manage their money well. Previous research has demonstrated a link between income and financial literacy (Hung et al., 2009; Taylor, 2009; Taylor, Jenkins, & Sacker, 2009).However, it is not well understood how that linkage works.

Kunovskaya: Money management practices in transition economies IJHE Vol 6 No 1 2013
59
Researchers have demonstrated gender differences in financial and debt literacy (Lusardi & Mitchell, 2008; Lusardi & Tufano, 2009) as well as in saving and investment behavior (Hira & Loibl, 2008; Lusardi, Keller, & Keller, 2008). In each of these studies, women were disadvantaged relative to men; our research indicates that gender is important in transitional countries as well and in the same way as established in previous research.
Students and those younger than age 29 scored at the highest level across all groups. This is likely due in part to the inclusion of having debt as a part of the MMI. In transitional economies compared to developed economies, young people usually do not have easy access to loans and credit cards. They start their financially independent lives later and have support from their extended families for longer periods. However, higher MMIs for students and young adults are inconsistent with Worthington’s (2006) suggestion that differences in financial literacy based on employment status were due to non-working respondents’ lack of exposure to financial transactions and receipt of simpler sources of income. The mean MMI for single respondents was greater than for larger families. Canner and Luckett (1990) have suggested that U.S. families with children have an increased probability of debt delinquency relative to families without children.
Discussion
This research followed the work of others to create a multidimensional measure of one aspect of financial capability – managing money. Although the use of a secondary data set restricted our choice of variables, the resulting Money Management Index is a richer measure than a single measure would be yet retains as much of the information from the original variables as possible. An MMI and similar indices for the three remaining dimensions of financial capability (planning ahead, choosing products, and staying informed) could be used asdiagnostic tools to assist both educator and student to target the information to the greatest need.
In creating the index, examination of the coefficients led us to exclude the variable “keeping records.” Conceptually, it seems illogical to exclude a “keeping records” variable from a Money Management Index. However, relative to the other variables, this variable was unique in that it is a self-reported voluntary behaviour rather than a response or a self-perception. Also, the response choices were broader than just keeping records, and included budgeting. Future measures of money management should strive to include measures of both budgeting and tracking spending but as two separate concepts.
As the Russian economy and economies of other countries in Eastern Europe grow and transition to market-based financial systems, their population will be faced with a host of new choices in financial products and services that did not exist in these countries just a generation ago. To ensure prosperous households and a stable national economy, the governments of these countries are taking a proactive approach to the financial education of their citizens. This creates new challenging opportunities for Home Economic educators in those countries. Experience from other countries teaches that simply creating educationally sound materials is not enough. Home economics educators must take steps to ensure the materials will be adjusted to the country’s specific economic environment if they are to be successfully adopted by educators and positively received by students. Therefore, materials

Kunovskaya: Money management practices in transition economies IJHE Vol 6 No 1 2013
60
must be developed with a careful consideration of existing money management practices. This is true whether the instruction is taking place within a traditional school context or as part of a stand-alone Home Economics program. The regression results suggest that materials must be properly tailored to the learners’ age, gender, education, and occupational status so lessons on money management are seen as relevant to the students’ lives and engaging to keep the students’ interest. For younger students it is important to have a multimedia component to compete for attention with other information and materials to which young people are accustomed. From the educator perspective the materials should contain teacher training tools, be linked to existing national educational standards (on math, economics, family finance, or other courses), and offer ways to evaluate not just the students but the effectiveness of the program itself.
Biography
Irina Kunovskaya as a Program Evaluation Specialist provides leadership in building internal evaluation capacity, accountability and program improvement within departments of Family and Consumer Science College and Extension Services of the University of Georgia. Dr Kunovskaya is an innovative researcher seeking to identify effective ways of motivating positive financial behaviour through financial literacy interventions. Dr Kunovskaya has over 20 years’experience in the financial sector, much of it in the financial literacy area. She has served as CEO of the National Foundation for Financial Literacy in Russia and has held numerous positions at universities worldwide including department chair, professor and visiting scholar. [email protected]
Brenda J. Cude is a Professor of Consumer Economics in the Department of Housing and Consumer Economics at the University of Georgia. Her current research focus is financial literacy. She also is engaged in outreach efforts to teach financial education, specifically to college students.
Joan Koonce is a Professor and Financial Planning Specialist in the Department of Housing and Consumer Economics at the University of Georgia (UGA). She provides leadership to Cooperative Extension in the areas of insurance, investments, taxes, retirement, and estate planning. She received her Masters of Science and Ph.D. from The Ohio State University with a major in Consumer Economics and a minor in Business Finance. She has also taught personal finance courses at UGA and is the co-founder of UGA’s Certified Financial Planner program. She is an Accredited Financial Counselor (AFC) and Certified Personal and Family Finance Educator (CPFFE).
Kunovskaya: Money management practices in transition economies IJHE Vol 6 No 1 2013
61
References
Alpha Research. (2010). Report on the key findings of the survey prepared for the World Bank. Sophia, Bulgaria: Author. Retrieved from http://www.areresearch.org
Andreloni, L., Bayot, B., Bledowski, P., Iwanicz-Drozdowska, M., & Kempson, E. (2008). Financial services provision and prevention of financial exclusion. Brussels: European Commission. Retrieved from http://www.libertysecurity.org/article2304.html
Ardic, O., Ibrahim, J., & Mylenko, N. (2011). Consumer protection laws and regulations in deposit and loan services: A cross-country analysis with a new data set (Policy Research Working Paper 5536). Washington, D.C.: The World Bank. Retrieved from http://econ.worldbank.org
Atkinson, A., McKay, S., Kempson, E., & Collard, S. (2006). Levels of financial capability in the UK: Results of a baseline survey. London: Financial Services Authority. Retrieved from http://www.fsa.gov.uk
Beck, T., Demirgüç-Kunt, A., & Martinez Peria, M. (2007). Reaching out: Access to and use of banking services across countries. Journal of Financial Economics, 85(1), 234-266.
Canner, G. B., & Luckett, C. A. (1990). Consumer debt repayment woes: Insights from a household survey. Journal of Retail Banking, 12(Spring), 55-62.
Cronbach, L. J. (1958). Proposals leading to analytic treatment of social perception scores. In R. Tagiuri & L. Petrullo (Eds.), Person perception and interpersonal behavior (pp. 353-379). Stanford, CA: Stanford University Press.
Dixon, M. (2006). Rethinking financial capability: Lessons from economic psychology and behavioural finance. London: Institute for Public Policy Research. Retrieved from http://www.ippr.org
Fabrigar, L. R., Wegener, D. T., MacCallum, R. C., & Strahan, E. J. (1999). Evaluating the use of exploratory factor analysis in psychological research. Psychological Methods, 4(3), 272-299.
Financial Services Authority (FSA). (2006). Financial capability in the UK: Establishing a baseline. London: Author. Retrieved from http://www.fsa.gov.uk
Gorsuch, R. L. (1983). Factor analysis (2nd ed.). Hillsdale, NJ: Erlbaum.
Green, M. (2011, April 29). Financial literacy vs. financial capability [Web log post]. Retrieved from http://exchanges.nyx.com/michelle-greene/financial-literacy-vs-financial-capability
Hira, T., & Loibl, C. (2008). Gender differences in investment behavior. In J. J. Xiao (Ed.), Handbook of consumer finance research (pp. 253-270). New York, NY: Springer Science & Business Media.
Holzman, R. (2010). Bringing financial literacy education to low and middle income countries: The need to review, adjust, and extend current wisdom. Bonn: The Institute for the Study of Labor (IZA). Retrieved from http://siteresources.worldbank.org/SOCIALPROTECTION/Resources/SP-Discussion-papers/Social-Protection-General-DP/1007.pdf

Kunovskaya: Money management practices in transition economies IJHE Vol 6 No 1 2013
62
Honohan, P. (2008). Cross-country variation in household access to financial services. Journal of Banking and Finance, 32(11), 2493-2500.
Hung, A., Parker, A., & Yoong, J. (2009). Defining and measuring financial literacy (Rand Labor and Population Working Paper WR-708). Santa Monica, CA: Rand Corporation. Retrieved from http://www.rand.org/pubs/working_papers/2009/RAND_WR708.pdf
Huston, S. (2010). Measuring financial literacy: A proposed approach. The Journal of Consumer Affairs, 45(2), 296-316.
Johnson, E., & Sherraden, M. S. (2007). From financial literacy to financial capability among youth. Journal of Sociology and Social Welfare, 34(3), 119–145.
Jump$tart Coalition for Personal Financial Literacy. (2007). National standards in K-12 personal finance education. Washington, D.C.: Author. Retrieved from http://www.jumpstart.org/assets/files/standard_book-ALL.pdf
Kaiser, H. F. (1960). The application of electronic computers to factor analysis. Educational and Psychological Measurement, 20, 141-151.
Kempson, E., Collard, S., & Moore, N. (2005). Measuring financial capability: An exploratory analysis. London: Financial Services Authority. Retrieved from http://ecri.eu/new/system/files/FinCap_Workshop_I_papers.pdf#page=44
Lusardi, A., Keller, P., & Keller, A. (2008). New ways to make people save: A social marketing approach. In A. Lusardi (Ed.), Overcoming the saving slump: How to increase the effectiveness of financial education and saving programs (pp. 209–236). Chicago: University of Chicago Press.
Lusardi, A., & Mitchell, O.S. (2008). Planning and financial literacy: How do women fare? American Economic Review: Papers & Proceedings, 98, 413-417.
Lusardi, A., & Tufano, P. (2009). Debt literacy, financial experiences, and overindebtedness(NBER Working Paper 14808). Retrieved from http://www.nber.org/papers/w14808.pdf
Mandell, L. (2007). Financial literacy of high school students. In J.J. Xiao (Ed.), Handbook of consumer finance research (pp. 163-183). New York, NY: Springer Science & Business Media.
Matul, M. (2009). Financial behaviors and vulnerability to poverty in low-income households in transition context. Microinsurance Innovation Facility, Geneva: International Labor Organisation (ILO).
Melhuish, E., Belsky, J., & Malin, A. (2008). An investigation of the relationship between financial capability and psychological wellbeing in mothers of young children in poor areas in Britain (Occasional Paper No 30). London: FSA. Retrieved from http://www.fsa.gov.uk
Moore, D. (2003). Survey of financial literacy in Washington State: Knowledge, behavior, attitudes, and experiences (Technical Report n. 03-39). Pullman, WA: Social and Economic Sciences Research Center, Washington State University. Retrieved from http://www.dfi.wa.gov/news/finlitsurvey.pdf

Kunovskaya: Money management practices in transition economies IJHE Vol 6 No 1 2013
63
Noctor, M, Stoney, S., & Stradling, S. (1992). Financial literacy: A discussion of concepts and competences of financial literacy and opportunities for its introduction into young people’s learning. National Foundation for Educational Research.
Nunnally, J. C., & Bernstein, I. H. (1994). Psychometric theory (3rd ed.). New York: McGraw-Hill.
Policy Research Initiative (PRI). (2006). Why financial capability matters: Synthesis report on Canadians and their money: A National Symposium on Financial Capability held on June 9-10, 2005 in Ottawa. Ottawa, Canada: Author.
Remund, D. (2010). Financial literacy explicated: The case for a clearer definition in an increasingly complex economy. The Journal of Consumer Affairs, 45(2), 276-295.
Rutledge, S. (2010). Improving consumer protection and financial literacy: Lessons from nine country studies. World Bank Private and Financial Sector Development Department: Europe and Central Asia Region. Washington, D.C.: The World Bank Press. Retrieved from http://siteresources.worldbank.org/INTECAREGTOPPRVSECDEV/Resources/WorkingPaper_CPFL_Feb10.pdf
Sen, A. (1993). Capability and well-being. In M. Nussbaum & A. Sen (Eds.), The quality of life (pp. 30-53). Oxford: Clarendon Press.
Sen, A. (1999). Development as freedom. New York: Anchor Books.
Social and Enterprise Development Innovations (SEDI). (2004, July). Financial capability and poverty: New approaches for addressing poverty and exclusion (Discussion Paper). Toronto, Canada: SEDI. Retrieved from http://www.sedi.org/DataRegV2-unified/sedi-Publications/PRIEnglishAug2004.pdf
Spector, P. (1989). Summated rating scale construction: An introduction. Newbury Park, CA: Sage Publications.
Analysis of the financial literacy survey in Romania and recommendations. Bucharest, Romania: Institute for the Study of the Quality of Life. Retrieved from http://microdata.worldbank.org
Taylor, M. P. (2009). The impact of life events on financial capability: Evidence from the BHPS (FSA Consumer Research Paper 79). London: FSA. Retrieved from http://www.fsa.gov.uk/pubs/consumer-research/crpr79.pdf
Taylor, M.P. (2011). Measuring financial capability and its determinants using survey data. Social Indicators Research, 102(2), 297-314.
Taylor, M. P., Jenkins, S. P., & Sacker, A. (2009). Financial capability and wellbeing: Evidence from the BHPS (FSA Occasional Paper 34). London: FSA. Retrieved from http://www.fsa.gov.uk/pubs/occpapers/op34.pdf
The Central Bank of the Republic of Azerbaijan. (2010). Final report: Results of the Financial Literacy Survey. Baku, Azerbaijan. Retrieved from http://microdata.worldbank.org

Kunovskaya: Money management practices in transition economies IJHE Vol 6 No 1 2013
64
The International Bank for Reconstruction and Development/The World Bank. (2011). Good practices for financial consumer protection (Consultative draft). Washington, D.C.: Author. Retrieved from http://web.worldbank.org
The International Bank for Reconstruction and Development/The World Bank. (2009). The case for financial literacy in developing countries. Washington. Retrieved from http://www.oecd.org/dataoecd/35/32/43245359.pdf
The President’s Advisory Council on Financial Literacy. (2008). 2008 Annual report to the President. Washington, D.C.: The Department of the Treasury.
Worthington, A. (2006). Predicting financial literacy in Australia. Financial Services Review, 15(1), 59-79.

International Journal of Home Economics
65
Effect of implementing eco-cookingat commercial cooking facilities
Ayako Mikami,Keiko Nagao
Tokyo Gas Co., Ltd., Tokyo Kasei University
Abstract
Eco-cooking comprises a series of activities which involves shopping, cooking,and cleaning performed in an ecologically friendly manner. This approach started in Japan in 1995 and today is regarded as one of the effective measures that any household can adopt in order to reduce global warming.
We have already reported that gas can be reduced by 45%, water by 80%, and waste by 60% just by teaching eco-cooking concepts and methods to university students. Therefore, if all households in Japan implemented eco-cooking, it is estimated that total annual CO2 emission would be reduced by 5.9 million ton.
In our research, we investigated the probable CO2 reduction if eco-cooking wasintroduced to commercial cooking facilities in Japan. Shinjuku-gyoen restaurant helped with various cooking exercises to achieve the aim of our study. We selected three different menu items: curry with rice and stewed beef with rice,both popular dishes at the restaurant, and eco-cooking dry curry with rice,which was designed especially for this study. Each menu item included abeverage. We then employed two different methods of cooking; one did not involve eco-cooking and the other involved implementing an eco-cooking approach. All data were converted into CO2 emission equivalents.
We also performed other exercises to measure the effect of eco-cooking by introducing 25 key eco-cooking methods for the preparation of other menu items at the restaurant.
For dry-curry with rice, we reduced gas by 31%, water by 86%, and waste by 81%, which can be equated to a 49% reduction in CO2 emission. In addition, applying eco-cooking to the other two menu items revealed similar results.
Implementation of the 25 key methods to other regular menu items reduced gas by 16%, water by 22%, and waste by 37% when compared with regular cooking that was previously practiced at the same restaurant.
Based on these results, we estimated that a 2-ton reduction in CO2 emission per year can be obtained if the restaurant continues to apply eco-cooking to all cooking activities.
In conclusion, promoting eco-cooking to not only regular households but also commercial facilities will contribute greatly to reducing environmental problems such as shortage of food, water, and energy.

Mikami & Nagao: Effect of implementing eco-cooking at commercial cooking facilities IJHE Vol 6 No 1 2013
66
Introduction
“Eco-cooking” refers to environmentally conscious eating habits such as keeping the environment in mind while shopping, cooking, and cleaning. Eco-cooking is an initiative to take food, which is fundamental to our survival, and to re-evaluate the way in which we currently live while contributing to solutions to global environmental issues through specific actions. The reason for this is that the food sector is a microcosm for the global environmental issues responsible for the various problems facing us today. Such problems include the way in which the environment, energy, water, waste, and global warming relate to what we eat.
Although there has been no formal systemisation in Japan, attitudes which form the basis of eco-cooking are time honoured. For example, Japan’s Edo period society is said to have exemplified a society based on recycling. In that time, people would purchase seasonal foods from their local area in only the required amounts, and they used all edible parts of the food, without waste. Due to the effort required to light the fire and collect water for cooking, people in the Edo period adopted means to cook efficiently and thriftily. Any leftovers, including ash and manure, were reused on the fields.
In recent times, a number of environmental problems such as global warming, depletion of the ozone layer, diminishing bio-diversity, air and water contamination, and issues related to waste have been escalating on a global scale. Furthermore, there is an increasing worldwide concern over these global problems. Accordingly, in addition to efforts by the government and industry, there is a drive for each citizen in Japan to address environmental issues. Onesuch effort is “Challenge 25,” a national campaign launched in January 2010 and promoted by the government for the prevention of global warming (MOE, 2010). “Eco-cooking” was selected as a part of that campaign. Meanwhile, there has been a surge in the number of people obtaining qualifications as “Eco-cooking Instructors” authorised by the Eco-Cooking Promotion Committee, which consists of members from a variety of fields. As of March 2012,there were over 2,300 Eco-cooking Instructors across Japan (ECPC, 2011).
This effort, commenced by Japan’s main gas provider in 1995, is currently becoming a national effort toward realising a low-carbon society, while it is also incorporating training in schools by introducing methods of considering food from the perspective of energy and the environment. It is thus becoming a catalyst to re-examine Japan’s modern food habits.
The authors initially conducted an experimental study targeting students majoring in Home Economics at the Department of Nutrition of Tokyo Kasei University to observe the educational effectiveness of eco-cooking. As a result of this study, it was reported that when education regarding eco-cooking was undertaken, gas consumption could be reduced by approximately 45%, water consumption by approximately 80%, and waste by approximately 60% (Nagao et al., 2007). The study also verified that the energy reduction and water conservation benefits of eco-cooking as well as the education of elementary school children have uniform outcomes (Nagao, et al., 2008, 2009; Mikami et al., 2010a, 2010b, 2010c,2011a, 2011b). In addition, taste testing was performed for both ordinary cooking and eco-cooking in previous studies, and it was confirmed that there was no significant difference in taste between the two approaches.

Mikami & Nagao: Effect of implementing eco-cooking at commercial cooking facilities IJHE Vol 6 No 1 2013
67
We also measured the energy consumption, water consumption, and amounts of wasteproduced when cooking in the average household on the basis of typical menus of actual Japanese eating habits. It was clear from estimations of CO2 emission that there is potential for a nation-wide reduction of 5.9 million tons of CO2 annually.
In our study we therefore considered that the implementation of eco-cooking in commercial facilities would have an even greater effectiveness. We planned the first implementation of eco-cooking in a commercial facility to verify this consideration. We obtained cooperation of the “Shinjuku Gyoen Restaurant” in Tokyo, a Ministry of the Environment establishment, and measured the levels of gas consumption, water consumption, and waste produced when cooking meals on the restaurant’s menu. We then calculated the CO2 emission and discovered a reduction in each aspect. Following this, we developed a list of 25 “eco-points” which we believed should be introduced, and attempted to implement these points for all aspects of the restaurant. Comparing the restaurant’s consumption of gas, water, and levels of waste before and after the introduction of eco-cooking in this restaurant, there was a clear reduction in annual CO2 emissions. This case can therefore be presented as a positive example of environmental load reduction through improved practices in commercial facilities.
Survey Methods and Content
In order to demonstrate the effects of eco-cooking, we first needed to investigate the effects of eco-cooking using an experimental menu. We surveyed three menu items which consistedof set meals, each including a drink. The first two were curry with rice and stewed beef with rice, which together comprised a large proportion of the restaurant’s sales, and the third was eco dry curry with rice, an item developed especially for this study. Cooking was done using both ordinary methods of preparation without regard to the environment, referred to as ordinary preparation, and methods of preparation while keeping eco-cooking in mind, referred to as eco-preparation. Then for each preparation method, we measured gas, water, and waste, and calculated CO2 emission.
To further investigate the effects of introducing eco-cooking to all aspects of the restaurant, we developed the “eco-point” list of 25 items which we believed should be introduced. Weplan to implement these points to all retail premises. We then measured the effects based on a before-and-after comparison of gas, water, and waste levels.
The effects of eco-cooking retail menu items
The three retail menus adopted in the experiment
In this study we surveyed three set menu items, each served with a drink, which were eco dry curry with rice, a menu item developed in advance of this study; as well as curry with rice and stewed beef with rice, the restaurant’s two best-selling menu items. The retail menu used in this experiment is shown in Figure 1. We carried out a comparative survey at least three times by cooking a four-serving quantity of each item.
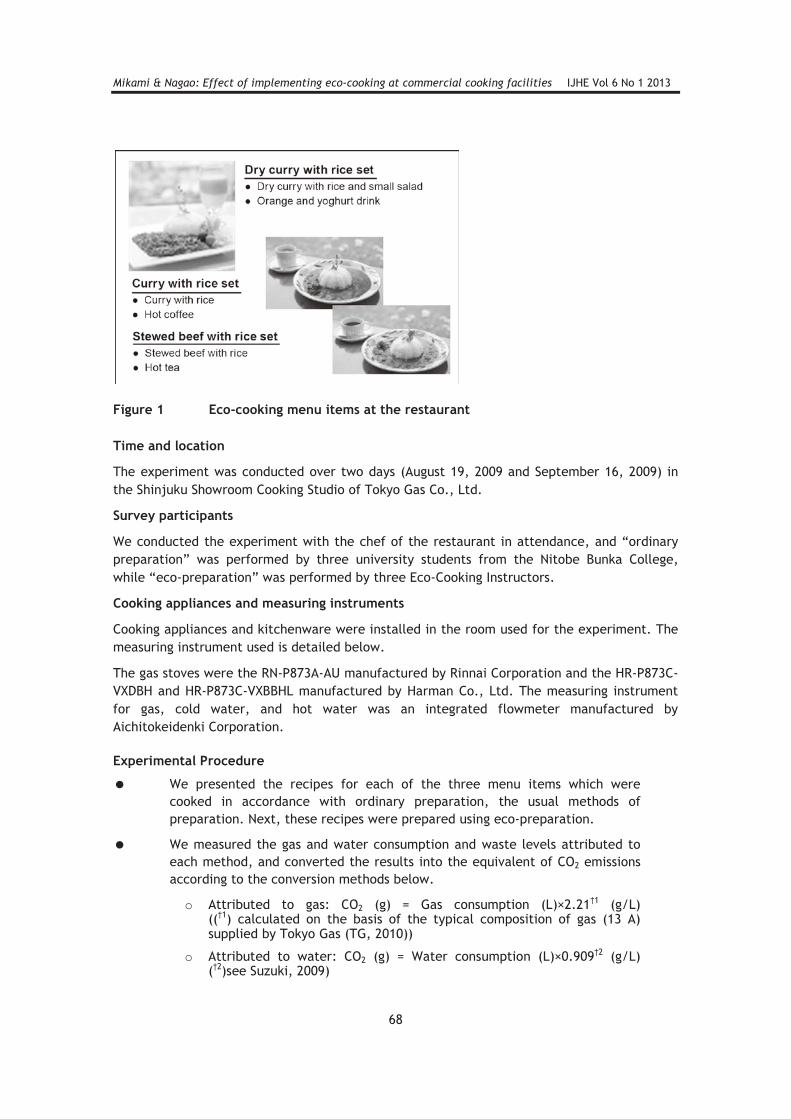
Mikami & Nagao: Effect of implementing eco-cooking at commercial cooking facilities IJHE Vol 6 No 1 2013
68
Figure 1 Eco-cooking menu items at the restaurant
Time and location
The experiment was conducted over two days (August 19, 2009 and September 16, 2009) in the Shinjuku Showroom Cooking Studio of Tokyo Gas Co., Ltd.
Survey participants
We conducted the experiment with the chef of the restaurant in attendance, and “ordinary preparation” was performed by three university students from the Nitobe Bunka College, while “eco-preparation” was performed by three Eco-Cooking Instructors.
Cooking appliances and measuring instruments
Cooking appliances and kitchenware were installed in the room used for the experiment. The measuring instrument used is detailed below.
The gas stoves were the RN-P873A-AU manufactured by Rinnai Corporation and the HR-P873C-VXDBH and HR-P873C-VXBBHL manufactured by Harman Co., Ltd. The measuring instrument for gas, cold water, and hot water was an integrated flowmeter manufactured by Aichitokeidenki Corporation.
Experimental Procedure
We presented the recipes for each of the three menu items which were cooked in accordance with ordinary preparation, the usual methods of preparation. Next, these recipes were prepared using eco-preparation.
We measured the gas and water consumption and waste levels attributed to each method, and converted the results into the equivalent of CO2 emissions according to the conversion methods below.
o Attributed to gas: CO2 (g) = Gas consumption (L)×2.21†1 (g/L)((†1) calculated on the basis of the typical composition of gas (13 A)supplied by Tokyo Gas (TG, 2010))
o Attributed to water: CO2 (g) = Water consumption (L)×0.909†2 (g/L) (†2)see Suzuki, 2009)

Mikami & Nagao: Effect of implementing eco-cooking at commercial cooking facilities IJHE Vol 6 No 1 2013
69
o Attributed to waste: CO2 (g) = Waste (g)×0.43†3) (g/g) (†3)see Nagata et al., 2000)
Effects of introducing eco-cooking to the whole restaurant
Next, in order to improve the overall ecological performance of the restaurant, including in regard to other menu items not adopted for this experiment, we developed the eco-cooking points devised during the course of this study and set out 25 items which should be followed to implement eco-cooking.
Table 1 Eco-cooking – 25 items
Cat No Item Details
Shoppin
g
1 Carefully select ingredients Ingredients that have low environmental impact during production and distribution
2 Use in-season foods only Energy for growing such foods can be decreased
3 Use locally produced foods intended for local consumption
Such foods require the least energy for transportation
4 Use no-wash rice No-wash rice does not require washing so water is neither used nor dirtied. It is also better to choose no-wash rice because it has a low negative impact during production
5 Carefully select seasoning Use basic, domestic seasoning manufactured by low environmental impact processes
6 Use simple packaging Choose foods with minimal and recyclable wrapping to ensure a low environmental impact
Cookin
g
7 Plan before cooking Plan the meal beforehand and use as few tools as possible to conserve energy
8 Use as few tools as possible Water will be conserved when washing
9 Wash slightly soiled vegetables in a tub
Use water to wash slight soiled vegetables before heavily soiled ones, then use running water
10 Use all edible parts of vegetables
Use all edible parts of vegetables such as peels and stems by carefully removing the root and non-edible parts
11 Effective use of ingredients Seaweed and dried bonito (used in boiled water for broth/soup) are reused as ingredients for further dishes, and the hot water used to boil them can be reused to make soup and similar dishes.
12 Use the same pan for multiple items
For example, use the same pan to cook meat and meat sauce
13 Do not use a larger flame than necessary
Use a flame just large enough for the size of the pot or pan and one suitable for the ingredients to conserve energy
14 Cook multiple items at the same time
The oven is used for multiple items simultaneously; the grill cooks the main and side dish, while the stove boils pasta and vegetables
15 Use a lid on pots and pans Use a lid on pots and pans or kettles to conserve energy by retaining heat
16 Cook only the necessary amount
Do not cook more food than required at one time to conserve energy
17 Decrease potential leftovers Dish up the correct quantity to decrease leftovers
18 Select eco-friendly tableware and consumables
Use tableware that will last a long time; do not use consumables like paper plates. Choose recyclable commodities and recycle necessary paper products

Mikami & Nagao: Effect of implementing eco-cooking at commercial cooking facilities IJHE Vol 6 No 1 2013
70
Cat No Item Details
Cle
anin
g
19 Dry waste materials Dispose waste materials in a dry state. Do not dispose waste down the sink drain or in a sink-corner trash bag
20 Wipe utensils before washing
Use an old cloth or scraper to remove grime before washing
21 Consider the washing order
Wash slightly dirty tableware and utensils before dirtier ones
22 Reuse the hot water from boiling pasta and vegetables for washing
Cooking utensils and tableware can be washed with the hot water used to boil pasta and vegetables because hot water is more effective than cold water at removing dirt and grime. In addition, the amount of water used can be decreased
23 Conserve water Use only as much water as necessary for a particular task; switch off the tap to avoid running water when not required
24 Use a dishwater Dishwashers use less water than conventional sink-based washing techniques;hot water models are the most efficient, and energy-saving models are the most eco-friendly
25 Separate waste Separate recyclable items. Consider using organic waste as compost in the garden.
On the basis of these 25 eco-cooking points shown in Table 1, we examined areas of possible improvement with respect to ingredients, preparation methods, and methods of serving for all menu items available in the restaurant. We ultimately attempted to improve aspects corresponding to all 25 items on the list. Taking into consideration seasonal variation in the total number of menu items sold, we compared gas and water consumption and waste level for the same months over two years before and after implementing eco-cooking (November–December 2008 compared with November–December 2009) and calculated the approximate annual reduction in CO2 emission. We also distributed a questionnaire regarding the eco-cooking menu for a launching event to introduce eco-cooking.
Results and discussion
Effects of eco-cooking on three restaurant menu items
The results of reducing gas and water consumption, the amount of waste of each menu item, and the average values for each of the three retail set menus used in this experiment are shown in Table 2.
For the eco dry curry with rice prepared according to eco-preparation methods, the observable reduction was approximately 31% for gas consumption, 86% for water consumption, and 81% for waste. For curry with rice, the corresponding reductions were approximately 46%, 84%, and 19%, respectively. The reductions for stewed beef with ricewere approximately 34%, 81%, and 38%, respectively. The average reductions over the three set menu items were approximately 38% for gas, 84% for water, and 47% for waste.

Mikami & Nagao: Effect of implementing eco-cooking at commercial cooking facilities IJHE Vol 6 No 1 2013
71
Table 2 Gas and water consumption and amount of waste of each item
Set Menu
Gas consumption (L) Water consumption (L) Amount of waste (g)
Normal cooking
Eco-cooking
Reduction rate (%)
Normal Cooking
Eco-Cooking
Reduction rate (%)
Normal cooking
Eco-cooking
Reduction rate (%)
Eco-cooking dry curry with rice
84.7 58.7 31 61.5 8.4 86 100.0 18.6 81
Curry with rice
100.3 54.3 46 75.5 12.2 84 135.3 109.0 19
Stewed beef with rice
84.3 55.3 34 61.6 11.7 81 87.0 53.5 38
Average of 3 set menus
89.8 56.1 38 66.2 10.8 84 107.3 57.3 47
Although there were differences in cooking time, as well as other factors, between each of the items, a reduction effect was observed with respect to gas consumption for each of the three items when cooked in accordance with eco-preparation methods. In particular, the combination of adjusting the heat under the pan and using a lid was an effective method. From trials prior to this experiment we were able to confirm that the reduction of water consumption was very effective regardless of the menu item prepared. For each of the menu items adopted in this experiment, there was a considerable reduction effect of over 80%, with an average water reduction of over 50 L. Effective techniques included using water according to need and removing food stuck to cooking utensils and kitchenware with a scraper or by wiping with a cloth prior to washing.
The waste reduction rate differed depended on the type and amount of ingredients used. The eco dry curry with rice, which used eleven kinds of vegetables, had the most effective reduction effect of over 80%; however, the waste reduction effect for curry with rice, which used only four kinds of vegetables, was limited to 19%. It can be said that practices such as cutting techniques to get the most out of edible portions of raw ingredients and the use of peels and stalks were effective for reducing waste.
Next, CO2 emission was calculated from the gas and water consumption and from the amount of waste for each of the retail menu items used in the experiment. From this we could observe a possible reduction of approximately 50% in CO2 emission for any of the menu itemswhen cooked with eco-preparation methods. The average reductions for the three menu items are shown in Figure 2. The reduction in water consumption was the greatest; however, by looking at the reduction effect on CO2 emission for overall preparation, we confirmed that it was the reduction of gas consumption, followed by the reduction in waste, which had the greatest effect on reducing CO2 emissions.

Mikami & Nagao: Effect of implementing eco-cooking at commercial cooking facilities IJHE Vol 6 No 1 2013
72
Based on the above findings, we found that by adopting eco-cooking methods, reductive effects are attainable even with respect to menu items which are not developed especially for eco-cooking use.
Furthermore, based on a monthly average sales volume of 9,000 items, with a food to drink ratio of 6:4, a simple hypothetical calculation on the basis of the assumption that only these menu items are served throughout the year equates to a potential annual reduction effect of two tons of CO2 emission.
Figure 2 Average CO2 emission for the three menu items
The effect of introducing eco-cooking across all aspects of the restaurant
Next, we were able to compile a list of 25 items as a result of developing eco-cooking points, which we thought, based on previous studies, would likely be highly effective if introduced to the restaurant. The six points given with respect to shopping were:
(1) careful selection of ingredients;
(2) use of in-season foods only;
(3) use of locally produced foods intended for local consumption;
(4) use of no-wash rice;
(5) careful selection of seasoning; and
(6) use of simple packaging.
The 11 points given with respect to cooking were:
(7) plan before cooking;
(8) use as few tools as possible;
(9) wash slightly soiled vegetables in a tub;
(10) use all edible parts of vegetables;
(11) use ingredients effectively;
(12) use the same pan for multiple items;

Mikami & Nagao: Effect of implementing eco-cooking at commercial cooking facilities IJHE Vol 6 No 1 2013
73
(13) do not use a larger flame than necessary;
(14) cook items at the same time;
(15) use a lid on pots and pans;
(16) cook only the necessary amount; and
(17) decrease potential leftovers.
Finally, the eight points given with respect to cleaning were:
(18) select eco-friendly tableware and consumables;
(19) use recycled advertising materials to hold scraps;
(20) wipe utensils before washing;
(21) consider the washing order;
(22) reuse the water from boiling pasta and vegetables for washing dishes;
(23) conserve water;
(24) use a dishwasher; and
(25) separate waste.
Of the above points, 25 items were implemented across the whole restaurant. As shown in Figures 3 through to 6, based on the average reductions from the two-month period of November and December in 2008 and 2009, there was a 16% reduction in gas consumption, 22% reduction in water consumption, and 37% reduction in waste. We calculated the CO2
emissions for a single menu item based on a sales average of 9,000 items per month in this restaurant, and by calculating annual CO2 emissions, we discovered that this would lead to an approximate annual reduction of 2.4 tons of CO2. Because the data measured in Experiment 1 was an estimated value close to approximately 2 tons, using the actual cooking techniques in a restaurant enabled us to confirm that the eco-friendly methods were effective in the restaurant as a whole.
Figure 3 Gas consumption per plate
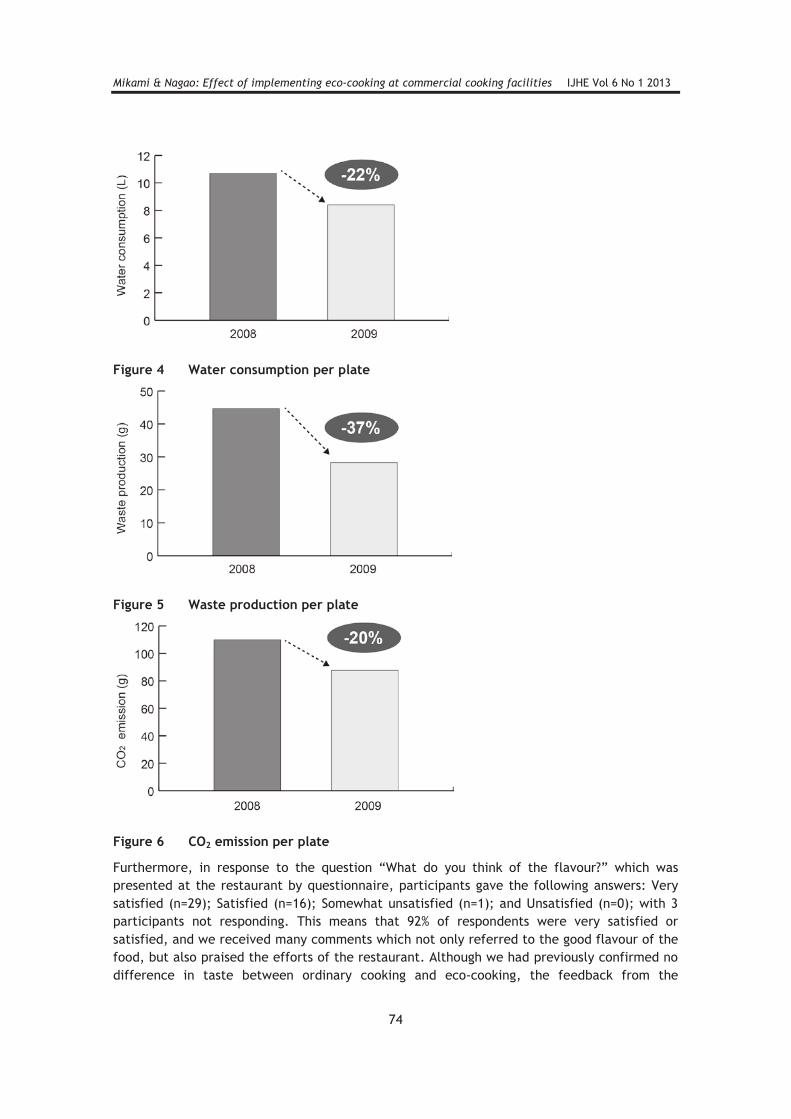
Mikami & Nagao: Effect of implementing eco-cooking at commercial cooking facilities IJHE Vol 6 No 1 2013
74
Figure 4 Water consumption per plate
Figure 5 Waste production per plate
Figure 6 CO2 emission per plate
Furthermore, in response to the question “What do you think of the flavour?” which was presented at the restaurant by questionnaire, participants gave the following answers: Very satisfied (n=29); Satisfied (n=16); Somewhat unsatisfied (n=1); and Unsatisfied (n=0); with 3 participants not responding. This means that 92% of respondents were very satisfied or satisfied, and we received many comments which not only referred to the good flavour of the food, but also praised the efforts of the restaurant. Although we had previously confirmed no difference in taste between ordinary cooking and eco-cooking, the feedback from the

Mikami & Nagao: Effect of implementing eco-cooking at commercial cooking facilities IJHE Vol 6 No 1 2013
75
customers confirmed that eco-cooking was in fact being accepted and that it was not only the head chef who was satisfied with the flavour.
In addition, since there are 448,000 general eateries in Japan, excluding hotels and other accommodation facilities, according to Ministry of Internal Affairs and Communications statistics (2006 data), it is thought that implementation of eco-cooking would have an even greater effect on retail scale calculations if the implementation of eco-cooking measures is promoted in the respective establishments.
Conclusion
As a result of testing the implementation of eco-cooking methods in commercial facilities, we were able to achieve the following effects with respect to decreasing the environmental burden.
Effects of eco-cooking on a retail menu
By cooking three restaurant menu items using eco-preparation methods, we reduced gas consumption by approximately 31-46%, water consumption by approximately 81-86%, and waste by approximately 19-81%. The approximate reduction rates, achieved by averaging the three kinds of menu items, were 38%, 84%, and 47%, respectively. As a result, we could see that the use of eco-cooking methods achieved a reduction effect for all menu items prepared, not only for those developed for eco-cooking purposes.
In addition, it was revealed that a reduction of approximately 50% in CO2 emissions was possible with respect to any of the menu items. Considering the various reduction rates for gas, water, and waste, the water consumption reduction was the most effective. However, we confirmed that the reduction of gas consumption, followed by waste, had the greatest impact on CO2 emission when taking overall preparation into account.
The effect of implementing eco-cooking across the entire restaurant
We compiled a list of 25 items from developing eco-cooking points that we considered would be effective if implemented in a restaurant. This list included six items related to shopping, such as the careful selection of ingredients and the use of in-season foods; 11 items related to cooking, such as the effective use of ingredients and cooking foods simultaneously; as well as eight items related to cleaning, which included using recycled advertising materials to hold scraps and taking care with the amount of water allowed to run from the tap.
Comparing values before and after eco-cooking was implemented across the entire restaurant following the introduction of these points. Gas consumption was decreased by approximately 16%, water consumption by approximately 22%, and waste by approximately 37%. Consequently, CO2 emissions were reduced by approximately 20%. In total, from calculations based on average monthly sales of 9,000 menu items, it was apparent that this would lead to approximately two tons annually of reduced CO2 emissions for a single restaurant. Since there are 448,000 general eateries of all sizes in Japan, excluding hotels and other accommodation facilities, we believe that an even greater effect would be possible if eco-cooking is

Mikami & Nagao: Effect of implementing eco-cooking at commercial cooking facilities IJHE Vol 6 No 1 2013
76
implemented in these establishments. Furthermore, we believe that raising awareness with the people who visit restaurants will contribute to the spread of eco-cooking attitudes.
Based on the foregoing, if eco-cooking attitudes are promoted with a focus on commercial establishments, and not only on general households, we believe that such attitudes can make a positive contribution to shortfalls in food, water, and energy supplies, as well as to global environmental problems. We hope that this study will be used as a model for the future and one that leads to fostering the spread of eco-cooking in other commercial establishments.
We would like to express our deep gratitude to the following people, in addition to all participants, who assisted with the conduct of this experiment: everyone at the Shinjuku Gyoen National Garden Association, Yoko ARAKI and Maki SASAHARA from Nitobe Bunka College, Kie ITO and Tomomi Nunomata of the Eco-Cooking Promotion Committee.
Biography
Ayako Mikami holds a Doctor of Science of Human Life from Tokyo Kasei University. She is currently a lecturer in the Human Life Support Center at Tokyo Kasei University.
Keiko Nagao holds a doctorate from Osaka Prefectured University and is currently a Professor at Tokyo Kasei University.
References
Eco-cooking Promotion Committee (ECPC), (2011). Eco-cooking leader training textbook. 176-177.
Ministry of the Environment Government of Japan (MOE), (2010). Annual Report on the Environment -The Sound Material-Cycle Society and the Biodiversity in Japan. 1-65.
Mikami, A., Kita, N., Matsuda, R., Sogo, S., Nagao, K., (2009). Effect of Daily Eco-cooking in the Home on Saving Energy and Reducing CO2 Emissions. The Japan Society of Cookery Science, 42, 300-308.
Mikami, A., Kita, N., Sato, K., Nagao, K., (2010a). Comparative Effects on Energy Requirements and CO2 Emission of Different Methods of Cooking by Wok and Other Cookware. The Japan Society of Cookery Science, 43, 98-105.
Mikami, A., Akaishi, N., Sato, K., Nagao, K., (2010b). Analysis of the Amount of Water Use in Different Stages of Cooking and the Effect of Water-saving Actions. The Japan Society of Home Economics, 61, 729-735.
Mikami, A., Nagao, K., Imai, E., (2010c). Educational Effect of Eco-cooking Model Lessons on the Fifth Graders in Nishitokyo City. The Japan Association of Home Economics Education, 53, 279-289.
Mikami, A., Nagao, K., (2011a). A Detailed Analysis of Eco-cooking Education Effects on Students Majoring in Home Economics Education - Waste ratio of vegetables Number of Employed Tools, CO2 Emission, Energy Consumption (Cooking Cost) - . The Japan Association for the Integrated Study of Dietary Habits, 21, 272-280.

Mikami & Nagao: Effect of implementing eco-cooking at commercial cooking facilities IJHE Vol 6 No 1 2013
77
Mikami, A., Sato, K., Ito, K., Murakami, K., Nagao, K., (2011b). Analysis of water pollution reduction with eco-cooking in model menu. The Japan Society of Cookery Science, 44,367-374.
Mikami, A., Nagao, K., (2011c). Positive Impact of Eco-Cooking on Environmental Load. Asian Regional Association for Home Economics, 330 18, 7-13.
Nagao, K., Kita, N., Mikami, A., (2007). Effects of Eco-Cooking Seminar on Students Majoring in Home Economics Education. The Japan association of Home Economics Education, 50,176-183.
Nagao, K., Kita, N., Matsuda, R., KATO, K., Sogo, S., Mikami, A., (2008). Effect of “Eco-Cooking” Practices on the Reduction of CO2 Emissions. The Japan Society of HomeEconomics, 59, 903-910.
Nagata, K., Kaizuka, R., Oshio, T., (2000). Life Cycle Assessment of New Refuse Disposal Technology—Assessment of Combinations of New Refuse Disposal Technology. Proceedings of the 11th Annual Conference of the Japan Society of Waste Management Experts, 147 – 149
Suzuki, T., (2009). Comparison of the Carbon Dioxide Output (LC-CO2) in the Production and Use of No-wash Rice and Conventional Rice. Japan Society of Cookery Science, 42, 342-348.
Tokyo Gas Co., Ltd., (TG), (2010). Ultra Shouene Book. 176-177.

International Journal of Home Economics
78
Male perception of an ideal body figure for a Swazi woman
Londiwe Mngomezulu, Pinkie Zwane
University of Swaziland
Abstract
There is no universally acceptable ideal body figure given the nuances in cultures and what people in various cultures perceive as appealing. Aim: The purpose of the study was to investigate how males define an ideal female body figure in their conception of beauty. Methods: The study was descriptive in nature, where a modified Delphi technique was used in developing the instrument for data collection. A convenience sample of third- and forth-year male students was selected from a population of 320 males at the University of Swaziland, Luyengo Campus that only has the Faculty of Agriculture. The sample size was 18% of the male population on campus, which gave a total sample size of 60 males. The first phase of data collection used pictures of five female body types: hourglass, inverted triangle, triangle, rectangle, and oval shapes. Reliability and validity of the instrument were determined prior to data collection. Qualitative data were analysed into categories, and quantitative data were analysed using means, standard deviation, and correlation. Results: Findings revealed that the body figure type preferred by males was the triangle shape (or pear shape). It was further shown that as much as males considered facial appearance in a female when judging beauty, they focused more on the personality of the female. There was no significant correlation between the male perceptions and their demographic variables. Conclusion: Male students of the Luyengo Campus, at the University of Swaziland, perceived a triangular-shaped body of a female as being ideal compared to the western society that perceives the hourglass as ideal.
Key words: Swazi ideal figure, African beauty perception, body shapes.
Introduction
An ideal body figure (for females) can be defined as the body shape that is viewed as best or perfect and is accepted by a particular group of people or society. It represents the perfect body that every woman tries to attain for self-acceptance and improvement of self-esteem. The manner in which we perceive and relate to our own physical aesthetics or body image is influenced by cultural and social factors. In addition, cultural ideas of what is desirable and attractive have important implications in the development of body image (Alicke, Smith, &Klotz, 1986).
Body image is constantly changing and dominant standards of beauty for women have changed over time. This is influenced by the degree to which the real body conforms to the prevailing norm. Throughout history, emphasis has focused on different parts of the body with an

Mngomezulu & Zwane: Male perception of an ideal body figure for a Swazi woman IJHE Vol 6 No 1 2013
79
increased emphasis on thinness in the late 20th century (Fallon, 1990). The most dramatic look and body type of the 20th century was that of a flapper girl who had short hair with a boyish, athletic figure. It was a sharp contrast to the tight-laced figures of the Victorian era. As a result, it brought change as women were involved more in the workforce, which gave them personal economic power for the first time. This transcended to the responsibility and liberation reflected in how women looked and dressed (Warren, 2003). Ideal beauty standards for women today are often influenced by current fashion and mass media.
Western women are said to be under continual social pressure to be slimmer, which results in marked emotional distress, restlessness regarding appearance, and unhealthy weight control practices to the extent of unnecessary cosmetic surgery. On the contrary, it is suggested that, in traditional non-Western societies, a relatively fat body is regarded as a sign of health and a symbol of prosperity (Lee, Hsu, & Wing, 1992). The Western aesthetic ideal dominates or has influence on how people perceive or define an ideal body figure, yet there is amultiplicity of cultures with their different perceptions or definitions of the ideal female figure. It has been observed that the pressures to achieve a thin body shape amongst females may arise from comparisons of their own figures with the female figures thought to be idealto same- and opposite-sex peers (Cohn & Adler, 1992).
A variety of risk factors appear to make women more susceptible than men to body image and eating disorders. Influences that range from personality vulnerabilities to unhealthy media representations of women have been found to contribute to women’s dissatisfaction with their bodies (Cash, 2004). Most Swazi women are less confident with their bodies and as a result they engage in unhealthy practices to boost their self- esteem. Because most females are greatly affected by males’ perceptions of an ideal body figure for women, there was a need to create awareness among Swazis about the different body shapes that exist, and to accept and appreciate certain body features prevalent to Swazi females. The purpose of the study was to investigate the how males define an ideal body figure in their conception of beauty. The objectives of this study were to identify the female body figure preferred by males; determine how males judge beauty when assessing attractiveness of a female; and determine the relationship of occupation, age, home area, and nationality with male perception of beauty.
Theoretical framework
Swazi people originally belong to the Bantu clan. They migrated from the northern part of Africa and today are found in the southern part of the continent, in a small country called Swaziland. Swazis are predominantly Negroid in appearance with variations in complexion, stature, and facial features. Earlier Swazis were, on average, smaller in size and lighter in complexion than Zulus (Magagula, 2002). Now, Swazi women have nuances in body figures, due to cross cultural marriages prevalent today.
Ideal body figure for females
In the 1940s, the cultural ideal figure for women became significantly thinner compared to the actual female figure. The difference between the current and ideal figure placed a high demand on women to diet. This pressure to conform to beauty standards has been linked to

Mngomezulu & Zwane: Male perception of an ideal body figure for a Swazi woman IJHE Vol 6 No 1 2013
80
many types of eating disorders (Fallon, 1990). In earlier years there was a correlation between body image perception and ethnicity of a girl. The younger a girl was, with body image discrepancies, the more likely she was to be Caucasian. According to Clay, Vignoles,and Dittmar (2005), the situation has now changed; girls that are of minority status have similar views on body dissatisfaction as Caucasian girls. Hispanic girls were reported to have a higher rate of body dissatisfaction than any other ethnic group. It can be hypothesised that this is greatly a consequence of the trends in Hollywood to be skinny, which has caused Latin role models like Jennifer Lopez and Penelope Cruz to become more “Americanised.” Through globalisation, Africa has not been spared this trend in body perception among females.
A well-proportioned figure is not always slim or tall, but the figure must have equal measurements of the hips and bust (hourglass figure). It is known that body figure standards are based on a Western concept of what is ideal (Armstrong, 1987). Armstrong (1987) reported that there can never be a universally acceptable standard because of the variety in anatomical figure types, and other countries set their own standards based on their own regional concepts of an ideal figure. A body figure considered to be ideal must be preferred by a majority of those who assess it.
Body image and self-presentation
Body image has been defined as the mental construct and perception that an individual holds of his or her body, and it includes subjective feelings about the body (Cash, 1990; Fallon,1990). According to Cash (1990), body image leads individuals to actively manage the aesthetics of their physical appearance and self-presentation. Rudd and Lennon (2001) defined body image as a theoretical construct integrating aesthetics and the social psychology of dress. They agreed that appearance management behaviours such as the act of clothing one’s body not only create an individual’s appearance but also provide aesthetic pleasure to the individual through the experience. They also suggested that individuals use clothing in an attempt to achieve the Western aesthetic ideal by emphasising certain positive features of their bodies while concealing negative features. Thus, appropriate aesthetic attributes in clothing serve as a coping strategy for females by allowing them to minimise the discrepancy between cultural beauty ideals and their perceived appearance, leading to a better self-image and strong self-esteem.
Self-presentation is linked to appearance management. It is the private introspection and self-understanding when alone, and it can be the way we want other people to perceive us in public. It may be motivated by the desire to seek or maintain a sense of personal control or power over situations (Kaiser, 1998). It is a way of managing the disparity between the actual and ideal self-image. The incongruence between the two may be managed by body enhancers that result in self-satisfaction.
Difference in perception of body ideal by sex
Among college-aged couples, individuals’ satisfaction with their own bodies has been related to their perceptions of their significant other’s satisfaction with their bodies (Miller, 2001). Although women’s concerns about their peers’ perceptions of their bodies were not

Mngomezulu & Zwane: Male perception of an ideal body figure for a Swazi woman IJHE Vol 6 No 1 2013
81
guaranteed, Collins (1991) indicated that women misinterpret men’s standards of bodily attractiveness. Women believed that men prefer thinner women than they actually do.
Existing stereotypes of body ideals for women are more distorted than the stereotypes of body image that are held about men. Fallon and Rozin (1985) reported that women and girls participated in more appearance-related activities than men, but men engaged in weight training and took steroids more than women did. However, women and girls dieted, weighedthemselves, counted calories, were more concerned about being overweight, and experienced more guilt and anxiety compared to men and boys.
Methodology
The study utilised a descriptive-survey design on a convenience sample of males; 51 (85%) of whom were students and nine (15%) of whom were academic staff members at the University of Swaziland, Luyengo Campus. A modified Delphi technique was used for instrument development, which consisted of two phases. For the first phase, a questionnaire consisting of two parts was used. One part consisted of open-ended questions based on objectives, and had pictures of five female body figures which were: hourglass, triangle, inverted triangle, rectangle, and oval shapes. The second part consisted of questions regarding demographic information of the respondents.
The second phase questionnaire consisted of categorised responses derived from phase one of the Delphi technique, which were then rated on a six-point Likert scale. Validity of the instrument was ascertained through the use of three experts from the University of Swaziland in the Textile, Apparel Design and Management Department. For reliability, pilot testing was done using males from the non-academic staff members and second-year male students at the University of Swaziland, representing the two strata of respondents. The reliability coefficient was 0.66, representing an acceptable instrument. Data were analysed using the Statistical Package for Social Sciences (SPSS) version 10. Means, standard deviation, andcorrelation were used for statistical analyses. Analysed categorical data were presented in a bar chart and tables. Other data from open-ended sections were summarised into themes.
Results and discussion
Respondents chose their preferred female body shapes from five body shapes. As shown in Figure 1, the most preferred body figure was the triangle, preferred by 45% (27) of respondents, followed by the hourglass figure, preferred by 43.3% (26) of the respondents. Four respondents preferred the inverted triangle figure and two preferred for the rectangle figure type. The least preferred body figure was the oval, which was chosen by only one respondent.
The overall mean in Table 1 of this domain was 4.43 with an overall standard deviation of 1.11, which indicated that the respondents agreed that used descriptors defined an ideal body figure for Swazi females. There was variability in responses, but not much. Respondents strongly agreed that an ideal body figure for females was to have a beautiful face (M = 5.55) with a standard deviation of 0.89, indicating a low variation.

Mngomezulu & Zwane: Male perception of an ideal body figure for a Swazi woman IJHE Vol 6 No 1 2013
82
Figure 1 Percentage distribution on the preferred female body figure by males
Table 1 Males’ level of agreement with statements describing an ideal female body
figure
Definition Mean Standard deviation
Has a small waist and visible hips 5.23 1.15
Has a slim body 4.63 1.27
Has a small bust 4.08 0.89
Has a beautiful face 5.55 0.89
Must be tall 3.58 1.27
Has big buttocks 3.55 1.19
Total 4.43 1.11
Note: Strongly Agree= 6, Agree= 5, Slightly Agree=4, Slightly Disagree=3, Disagree= 2, Strongly Disagree= 1
They further agreed that a small waist girth (circumference) and visible hips (M = 5.23) constituted an ideal body figure for Swazi females, with a slightly high variation of 1.15 compared to the strongly agreed beautiful face. Being tall (M = 3.58) and having relatively big buttocks (M = 3.55) were slightly agreed upon.
Table 2 shows results regarding the influence of females’ self-presentation on males’ ratings of females’ bodies. The overall mean was found to be 4.47 with an overall standard deviation of 1.10, indicating that self-presentation was important for Swazi males as an influencing factor in perceiving an ideal body figure. There was a high level of agreement (M = 5.60; SD = 0.74) with the statement that neatness is crucial in females’ self-presentation. The lowest level of agreement (M = 3.38; SD = 1.43) was for the statement that body shape influences females’ personalities.
0%
5%
10%
15%
20%
25%
30%
35%
40%
45%
50%
Triangle Hourglass Inverted
triangle
Rectangle Oval
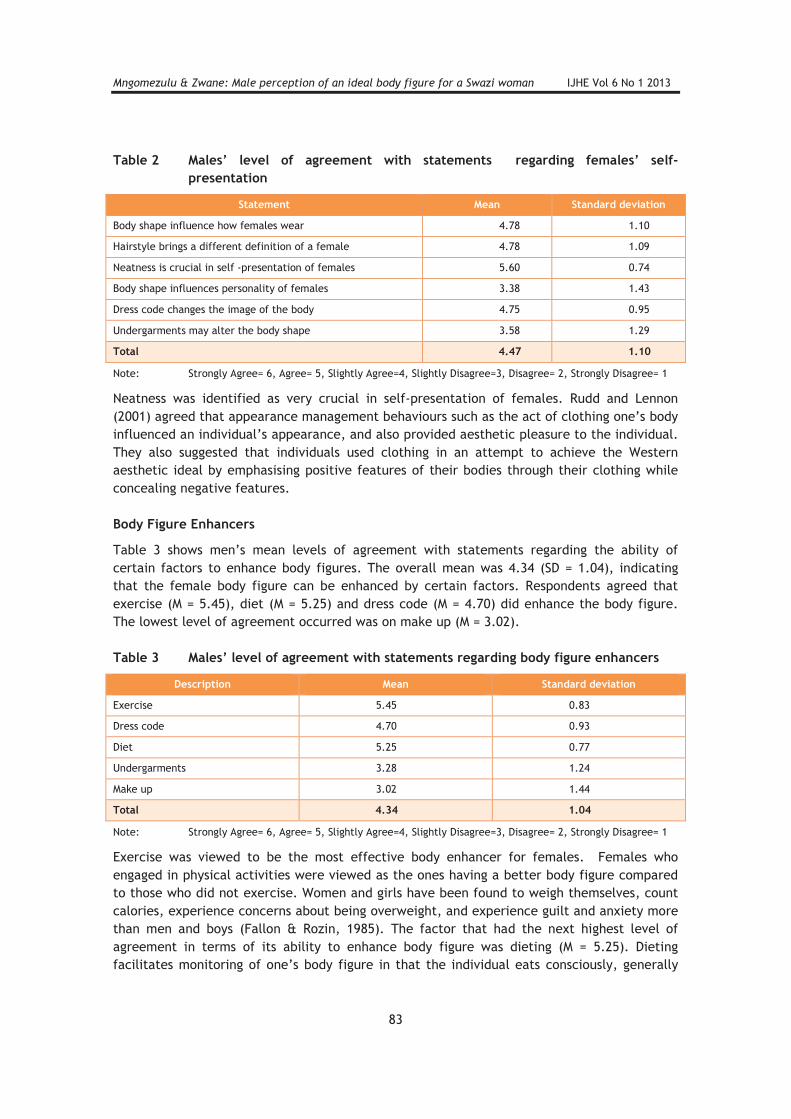
Mngomezulu & Zwane: Male perception of an ideal body figure for a Swazi woman IJHE Vol 6 No 1 2013
83
Table 2 Males’ level of agreement with statements regarding females’ self-
presentation
Statement Mean Standard deviation
Body shape influence how females wear 4.78 1.10
Hairstyle brings a different definition of a female 4.78 1.09
Neatness is crucial in self -presentation of females 5.60 0.74
Body shape influences personality of females 3.38 1.43
Dress code changes the image of the body 4.75 0.95
Undergarments may alter the body shape 3.58 1.29
Total 4.47 1.10
Note: Strongly Agree= 6, Agree= 5, Slightly Agree=4, Slightly Disagree=3, Disagree= 2, Strongly Disagree= 1
Neatness was identified as very crucial in self-presentation of females. Rudd and Lennon (2001) agreed that appearance management behaviours such as the act of clothing one’s body influenced an individual’s appearance, and also provided aesthetic pleasure to the individual. They also suggested that individuals used clothing in an attempt to achieve the Western aesthetic ideal by emphasising positive features of their bodies through their clothing while concealing negative features.
Body Figure Enhancers
Table 3 shows men’s mean levels of agreement with statements regarding the ability of certain factors to enhance body figures. The overall mean was 4.34 (SD = 1.04), indicatingthat the female body figure can be enhanced by certain factors. Respondents agreed that exercise (M = 5.45), diet (M = 5.25) and dress code (M = 4.70) did enhance the body figure.The lowest level of agreement occurred was on make up (M = 3.02).
Table 3 Males’ level of agreement with statements regarding body figure enhancers
Description Mean Standard deviation
Exercise 5.45 0.83
Dress code 4.70 0.93
Diet 5.25 0.77
Undergarments 3.28 1.24
Make up 3.02 1.44
Total 4.34 1.04
Note: Strongly Agree= 6, Agree= 5, Slightly Agree=4, Slightly Disagree=3, Disagree= 2, Strongly Disagree= 1
Exercise was viewed to be the most effective body enhancer for females. Females who engaged in physical activities were viewed as the ones having a better body figure compared to those who did not exercise. Women and girls have been found to weigh themselves, countcalories, experience concerns about being overweight, and experience guilt and anxiety more than men and boys (Fallon & Rozin, 1985). The factor that had the next highest level of agreement in terms of its ability to enhance body figure was dieting (M = 5.25). Dieting facilitates monitoring of one’s body figure in that the individual eats consciously, generally

Mngomezulu & Zwane: Male perception of an ideal body figure for a Swazi woman IJHE Vol 6 No 1 2013
84
eating only what is essential, or small amounts. It is important that dieting habits are healthy; dangerous fad diets are widespread in the world. In societies where thinness is equated with success and happiness, many females suffer from issues relating to dieting, weight, body shape, and self-image (Bemis, 1978). Over 20 years (1959-1978), there was a significant decrease in the weight of women in Playboy centerfolds and Miss America Pageant contestants. Because it was primarily men who judged these models, women's desire to be thinner may be partly explained by their correct perception of men's preferences (Garner, Garfinkel, Schwartz, & Thompson, 1980).
Clothes are a significant way of enhancing oneself, leading to greater self-confidence and self-esteem (Magagula, 2002). The way Swazi females dress helps enhance their figure types; it helps them conceal their figure flaws and emphasise the positive parts of their figures. Self-monitoring refers to the extent to which individuals attempt to exercise control over the way they present themselves to others (Gangestad & Snyder, 1985). According to Cash (1990), body image leads individuals to actively manage the aesthetics of their physical appearance and self-presentation. One’s appearance does not only affect their feeling but can also portray a certain message to other people (Magagula, 2002).
Males’ age, home area and nationality showed no significant correlation with their perception of facial appearance of a female; but there was significant correlation (r = 0.261) between perception of facial appearance and occupation of respondents (see Table 4). There was no significant correlation in perception of beauty based on body structure and personality of females and the demographic data of respondents. Males’ agreement with the statement regarding neatness had a significant correlation (r = 0.285) with participants’ ages, but not with occupation, home area, or nationality.
Body figure preference revealed that the female body figure for Swazis preferred as ideal was the triangle figure, as opposed to the hourglass figure in the Western world. Armstrong (1987) revealed that a well-proportioned figure was not always slim or tall (Western concept),and suggested that there can never be a universally acceptable standard due to cultural differences in the perception of beauty and ideal figure type.
Table 4 Correlation of males’ demographic variables with their perception of female
beauty
Variable Correlation Occupation Age Home Area Nationality
Facial Appearance
Corr. Coefficient 0.261 -0.169 0.129 -0.043
Sig. Value 0.044* 0.196 0.325 0.747
Body Structure Corr. Coefficient 0.235 -0.085 0.167 -0.173
Sig. Value 0.070 0.518 0.203 0.187
Personality Corr. Coefficient -0.088 0.118 0.100 -0.085
Sig. Value 0.502 0.370 0.449 0.518
Neatness Corr. Coefficient -0.073 0.285 0.162 0.095
Sig. Value 0.577 0.027* 0.217 0.468
Note: Spearman’s rho (Significance level: 0.05)

Mngomezulu & Zwane: Male perception of an ideal body figure for a Swazi woman IJHE Vol 6 No 1 2013
85
Factors that influence males’ perception
Table 5 shows that respondents strongly agreed that they considered personality (M = 5.73; SD = 0.57) in judging beauty. The factor with the next highest level of agreement was neatness (M = 5.60; SD = 0.74). There were high levels of agreement that body structure (M = 5.48; SD = 0.72) and facial appearance (M = 5.15; SD = 1.23) influence judgements of beauty. There was slight agreement with the statements that the sound of the voice (M = 4.23; SD = 1.07)and the walk (M = 4.11; SD = 1.02) were considerations in judging beauty. The total mean was 5.1, indicating high agreement with statements describing factors that influence males’ perception of female beauty, with little variability of the responses from the mean (SD = .088).
Table 5 Means of male’s perception of female beauty
Description Mean Standard deviation
Facial appearance 5.15 1.23
Behaviour 5.40 0.80
The sound of the voice 4.23 1.07
Body structure 5.48 0.72
The walk 4.11 1.02
Personality 5.73 0.57
Neatness 5.60 0.74
Total 5.1 0.88
Note: Strongly Agree= 6, Agree= 5, Slightly Agree=4, Slightly Disagree=3, Disagree= 2, Strongly Disagree= 1
The model in Figure 2 was based on responses regarding males’ perception of the ideal female figure and female beauty. The key variables that affected males’ assessment offemale beauty were personality, neatness, body structure, and facial appearance. It was found that these variables were crucial in males’ perception of female beauty.
Figure 2 Proposed model on factors influencing male perception of female beauty

Mngomezulu & Zwane: Male perception of an ideal body figure for a Swazi woman IJHE Vol 6 No 1 2013
86
When assessing beauty of a female, males not only looked at the outside appearance, but also considered the personality of a female, which they viewed as the most important component of a female. Research suggests that high self-esteem influences the want to behave in socially acceptable ways. Males are highly concerned with what others think of them and areespecially sensitive to cues on the appropriateness of their behaviour (Day, Unckless, Schleicher, & Hiller, 2002).
Body structure and facial appearance of a female were also found to be factors that influenced males’ perceptions; these two factors provided the physical body image. Body image was defined as the mental construct and perception that an individual held of his or her body and includes subjective feelings about the body (Cash, 1990; Fallon, 1990). According to Cash (1990), body image leads individuals to actively manage the aesthetics of their physical appearance and self-presentation. The incongruence in actual and ideal body images is harmonised by self-enhancement that results in satisfaction with one’s body image (Kaiser, 1998).
Generally, males’ perceptions did not vary with their demographic information. This may have been because all the respondents were from a non-Western society. Western women are said to be under continual social pressure to be slimmer, which results in marked emotional distress, restlessness regarding appearance, and unhealthy weight control practices to the extent of unnecessary cosmetic surgery (Graber & Brooks-Gunn, 1996). On thecontrary, in traditional non-Western societies, a relatively fat body is regarded as a sign of good health and a symbol of prosperity (Lee, Hsu, & Wing, 1992), and this is the case intraditional African societies.
Conclusions
An ideal body figure can be defined in various ways. Males from the University of Swaziland, Luyengo campus defined an ideal body figure differently from the figure typically identified as ideal in a Western society. Respondents in this study preferred the triangle body figure compared to the Western ideal body figure known to be the hourglass body figure. It is generally thought that an ideal body figure has to do with only the outside appearance of a female, but this is not the case according to this study. Males concentrate more on the personality and behaviour of a female. Physical presentation is also important as males considered neatness as a crucial factor in women’s attractiveness. Findings revealed that most men assessed woman’s beauty in a similar way; this applied to different ethnic groups (although few in number), backgrounds and age groups. It is recommended that a similar study be replicated using males from diverse backgrounds and in different parts of the country, for generalisability of findings.

Mngomezulu & Zwane: Male perception of an ideal body figure for a Swazi woman IJHE Vol 6 No 1 2013
87
Biography
Ms Londiwe Mngomezulu is a Textiles, Apparel Design and Management graduate from the University of Swaziland; she completed her studies in 2010. She is currently teaching at a high school in Swaziland.
Prof P Zwane, a Textile and Consumer Scientist, is currently the Dean of the Faculty of Agriculture at the University of Swaziland. She held a position of Head of Department of Consumer Sciences at the same university from 2008-2012. She has worked at the Council for Scientific and Industrial Research in South Arica, where she helped in setting up a Clothing Technology area. Among the procured equipment was a full body scanner to capture anthropometric data and a sweating manikin for an objective measure of comfort in apparel. She supervised students on research projects at undergraduate and M.Sc. level. Currently, Prof. Zwane is Principal Investigator of a Ruforum Research Grant that funds 2 M.Sc. students.
References
Alicke, M., Smith, R., & Klotz, M. (1986). Judgements of physical attractiveness: The role of faces and bodies. Personality and Social Psychology Bulletin, 12, 381-347.
Armstrong, H. (1987). Pattern making for fashion design. USA: Harper Collins Publishers.
Bemis, K. M. (1978). Current approaches to the etiology and treatment of anorexia. Psychological Bulletin, 85, 593–617.
Cash, T. F. (2004). Body image: Past, present, future. Body Image, 1, 1–5.
Cash, T. F. (1990). The psychology of physical appearance: Aesthetics, attributes, and images. In T. F. Cash and T. Pruzinsky (Eds.) Body images: Development, deviance, and change (pp.51-79). New York: The Guilford Press.
Clay, D., Vignoles, V. L., & Dittmar, H. (2005). Body image and self-esteem among adolescentgirls: Testing the influence of socio-cultural factors. Journal of Research on Adolescence, 15, 4.
Cohn, L. D., & Adler, N. E. (1992). Female and male perceptions of ideal body shapes: Distorted views among Caucasian college students. Psychology of Women Quarterly,16, 69-79.
Collins, M. E. (1991). Body figure perceptions and preferences among pre-adolescent children. International Journal of Eating Disorders, 10,199–208.
Day, D., Unckless, A., Schleicher, D., & Hiller, N. (2002). Self-monitoring personality at work:A meta analytic investigation of construct validity. Journal of Applied Psychology,87(2), 390-401.
Fallon, A. (1990). Culture in the mirror: Socio-cultural determinants of body image. In T. F. Cash & T. Pruzinsky (Eds.), Body images: Development, deviance, and change (pp. 80-109). New York: The Guilford Press.

Mngomezulu & Zwane: Male perception of an ideal body figure for a Swazi woman IJHE Vol 6 No 1 2013
88
Fallon, A.R., & Rozin, P. (1985). Sex differences in perceptions of desirable body shape. Journal of Abnormal Psychology, 94, 102-105.
Gangestad, W., & Snyder, M. (1985). To carve nature at its joints: On the existence of discrete classes in personality. Psychological Review, 92, 317-349.
Garner, D. M., Garfinkel, P. E., Schwartz, D., & Thompson, M. (1980). Cultural expectations of thinness in women. Psychological Reports, 4, 483-491.
Graber, J. A., & Brook-Gunn, J. (1996). Expectations for and precursors to leaving home in young women. Psychological Review, 71, 21-38.
Kaiser, S. B. (1998). The social psychology of clothing. Fairchild Publishers, New York, USA.
Lee S., Hsu L. K., & Wing Y. K. (1992). Bulimia nervosa in Hong Kong Chinese patients. British Journal of Psychology, 161, 545-551.
Magagula, N. (2002). Developing a new sizing system for women with disproportionate figure.Unpublished B.Sc. Dissertation, University of Swaziland, Luyengo, Swaziland.
Miller, D. J. (2001). Weight satisfaction among black and white couples: The role of perceptions. Eating Disorders, 9, 41-47.
Rudd, N. A., & Lennon, S. J. (2001). Body image: Linking aesthetics and social psychology of appearance. Clothing and Textiles Research Journal, 19(3), 120-133.
Warren, C. A. (2003). The girl on the magazine cover: The origins of visual stereotypes inAmerican mass media. National Women’s Studies Association (NWSA) Journal, 15(3), 219-223.

International Journal of Home Economics
89
Nutritional and sensory properties of soybeanand plain flour blends in cookies
Motunrayo Funke Olumakaiye
Obafemi Awolowo University, Ile Ife- Nigeria.
Abstract
Cookies were prepared from blends of soybean flour (SF) and plain flour (PF) to determine the nutritional and sensory properties.
Four cookie samples were prepared from blends of PF and defatted SF at 10%, 20% and 30% levels (PSF10, PSF20, PSF30, respectively) and from 100% PF (PPF).
The higher the SF level in cookies the higher the crude protein, crude fat and ash contents (p<0.05). PPF and PSF10 are higher in carbohydrate and crude fibre contents than PSF20, and PSF30 (p<0.05). All samples were low in calcium, iron,and magnesium concentrations. Sensory evaluation showed that cookie samples were not signifcantly different in texture (p>0.05) but differed significantly in taste, flavour, colour, and overall acceptability (p<0.05). SF substitution above 10% level was associated with a steady decrease in sensory scores. It was concluded that cookies of good appearance, organoleptic, and increased nutritional quality can be produced from plain and soybean flour blends.
Keywords: Plain Flour, Soybean, Cookies, Protein, Sensory Qualities
Introduction
Cookie is a major type of snack for school-aged children. A cookie is a small flat baked dessert and it is a snack usually made from wheat flour. Cookies are most commonly baked until crisp or just long enough that they remain soft. Flour that is used in baking comes mainly from wheat, although it can be milled from corn, rice, nuts or legumes. The type of flour used is vital in getting the product right. Soy flour is used to increase the proteincontent of breads and cakes. A mixture of soybean and plain flour to produce cookies will increase the nutritive value of cookies.
The protein content of soya is considerably higher than that of dairy products and meat. Its protein is also of higher quality than the protein of most crops. It is high in most essential amino acids except methionine and cysteine, which are present at lower levels (American Soybean Association [ASA], 1989; Osho, 1993). Soya has important functional properties, which make it a versatile food ingredient in the world. Compared with other legumes, it has the highest protein content and is also a very highly digestible protein (Ihekoronye & Ngoddy, 1985; Akubor & Onimawo, 2003). It has about 40% high quality protein and an unsaturated fat content of about 20% (International Institute of Tropical Agriculture [IITA], 1984).

Olumakaiye: Properties of Soycookies IJHE Vol 6 No 1 2013
90
Snacking is becoming the main eating style of children throughout the world. Some children skip meals and want only snacks; if these snacks are nutritious it will help them meet theirnutritional needs (Karen, 2001; Oogarah-Pratap & Heerah-Booluck, 2005). The protein content of wheat used in making cookies is low and in the face of insufficient animal protein in the cookies a good plant protein substitute is imperative.
Hence, this research was carried out to improve the nutritional quality of cookies, which are commonly consumed by both children and adults. The objective of this study was to determine the nutritional and sensory qualities of cookies made from blends of plain and soy flour.
Methodology
The study was carried out at the Department of Family, Nutrition and Consumer Sciences of the Obafemi Awolowo University, Ile Ife, Nigeria. The soybeans, plain flour, sugar, butter, eggs, salt, and vanilla essence were purchased at the local central market in Ile Ife, Nigeria.
Plain flour (PF) is flour that is used in baking comes mainly from wheat, although it can be milled from corn, rice, nuts, legumes, and some fruits and vegetables. The type of flour used is vital in getting the product right. Different types of flour are suited to different items; switching from one type to another could ruin the recipe. To achieve success in baking, it is important to know what the right flour is for the job.(www.whatscookingamerica.net/Bread/FlourTypes.htm)
All-purpose flour is a blend of hard and soft wheat; it may be bleached or unbleached. It is usually referred to as "plain flour." All-purpose flour is one of the most commonly used and readily accessible flours in the United States. Flour that is bleached naturally as it ages is labeled "unbleached," while chemically treated flour is labeled "bleached." Bleached flour has less protein than unbleached. Bleached is best for pie crusts, cookies, quick breads, pancakes and waffles (http://www.whatscookingamerica.net/Bread/FlourTypes.htm).
Production of defatted soybean flour
Defatted soybean flour was produced by a modified method from the Department of Food Science and Technology, Obafemi Awolowo University, Ile Ife, Nigeria (Ige, Ogunshua, & Oke,1984). Whole soybeans were cleaned to remove plant debris, broken grains, immature beans,and other extraneous materials. Cleaned seeds were poured into boiling water and allowed to boil for 20 minutes. This is to reduce the activation of beany flavour in the beans. Boiled soybeans were drained and dried at 800C in a hot air oven. Dried beans were then dehulled by coarse grinding. Winnowing was done to remove chaff, and milling was carried out using an attrition mill. Oil was extracted from the milled soybean by soxhlet extractor using n-hexane as the solvent. The resulting flour was dried at room temperature to allow the solvent (n-hexane) to escape from the flour, and then milled to fine flour, which finally produced the defatted soy flour.

Olumakaiye: Properties of Soycookies IJHE Vol 6 No 1 2013
91
Soybean and plain flour blends
The plain flour was mixed with soy flour at different substitution levels:
Sample PSF10: (225gm plain flour [90%] and 25gm soy flour [10%]),
Sample PSF20: (200gm plain flour [80%] and 50gm soy flour [20%]),
Sample PSF30: (175gm plain flour [70%] and 75gm soy flour [30%]) and
Sample PPF (pure plain flour) was 100% plain flour (control sample).
The mixing was done in a Philips blender at full speed for 10 minutes. The four samples were replicated in order to ensure accuracy.
Preparation of cookies
The cookies were prepared by a modification of the method (www.joyofbaking.com/shortbreads/shortbreadcookies.html). In a Kenwood mixer, 125g fat and 125g sugar were creamed together until soft, white, and creamy. Two eggs were beaten using an egg whisk and added to the butter and sugar mixture with the creaming continuing between each addition.
To form a dough, 250g flour, ¼ teaspoon salt, and 1 teaspoon vanilla essence powder were sifted together and added to the mixture. The dough was kneaded lightly to a smooth ball, rolled out thinly to 1-2cm thickness and cut into desired shapes with cookie cutters. The cookies were then placed on floured baking sheets and baked in an oven at 1500C for 20-25 minutes. The temperature at which cookies were baked was lowered because baked products containing soy flour may brown quicker than those without (ASA, 1989). Six replicates of cookies were baked for each mixture for accuracy.
Test of quality
Sensory evaluation test
The cookies were evaluated using a 5-point hedonic scale (Tyagi, Manikanten, Harinder, & Gurlen, 2006). The four samples were named in codes (PSF10, PSF20, PSF30, and PPF) and presented to a 20-member untrained panel that were randomly selected from the university community. Cookie samples were scored for appearance, taste, flavour, texture, and overall acceptability. The panel was provided with clean and safe water to rinse their mouth thoroughly between evaluations.
The data was statistically analysed using ANOVA to determine if there were any significant differences between the samples. Significance was accepted at p<0.05.
Nutritional quality
Proximate analysis was carried out on the samples using the Association of Officials Analytical Chemist (AOAC) method (AOAC,1990), and mineral elements were also determined.

Olumakaiye: Properties of Soycookies IJHE Vol 6 No 1 2013
92
Results
Proximate Composition
The results of the proximate composition of the samples of cookies made from plain flour and blends of plain and soy flour are as shown in Table 1. Sample of cookies from 100% plain flour (PPF) had the highest moisture content. Among the samples from blends of plain flour and soy flour (PSF10, PSF20, PSF30), the higher the soy flour proportion the higher the moisture content (p<0.05). Moisture content tends to decrease with decrease in soy flour proportion.
Table 1 Proximate composition of cookies samples
Sample Moisture Crude fat Crude protein Ash Crude fibre Carbohydrate
PPF 5.71±0.37b 3.95±0.41 d 8.31±0.21 d 2.06±0.02 b 2.47±0.02 a 77.60±0.02 a
PSF10 4.75±0.22 a 7.74±0.35 a 10.56±0.17 a 3.22±0.05 a 2.39±0.03 a 71.38±0.13 a
PSF20 5.49±0.18 b 10.60±0.60 b 12.49±0.18 b 3.40±0.18 a 1.76±0.08 b 65.70±1.12 b
PSF30 5.49±0.27 b 12.94±0.18 c 14.45±0.88 c 3.44±0.38 a 1.10±0.06 c 62.89±0.98 c
Note: Values in a column bearing the same superscript have no significant difference (p >0.05). Results
were means of three determinations.
Cookies made from blends of plain flour and soy flour had higher crude fat contents than samples made from 100% flour. The PPF sample had the lowest crude fat content. The difference in the crude fat content of the cookie samples was statistically significant (p<0.05).
The protein content ranged from 8.31% to 14.45%. PPF cookies sample had the lowest protein content (8.31±0.21), and PSF30 cookies had the highest protein content (14.45±0.88). The higher the soy flour composition of the cookies, the higher the protein contents. All samples were statistically different from one another in protein content (p<0.05).
The ash content is an indication of the mineral composition of the samples. Sample PSF30 had the highest value while sample PPF had the lowest. The high ash contents in the samples produced from various blends indicated that the mineral contents of soy flour were possibly higher than that of plain flour. The difference between the blends and the plain was significant (p<0.05).
Cookies from the PPF sample had the highest fibre value, afollowed by the samples with PSF10, PSF20, and PSF30 respectively. Statistically, PSF10 cookies compared favourably with the PPF in crude fibre content.
PPF cookies had the highest carbohydrate content (77.60%), followed by PSF10, PSF20, and PSF30 cookies in that succession. The higher the plain flour in the cookies, the higher the carbohydrate content.

Olumakaiye: Properties of Soycookies IJHE Vol 6 No 1 2013
93
Mineral composition
Table 2 showed the mineral elements of interest in this study. Iron, calcium and magnesium were generally low in the cookie samples. The highest amount of iron was found in PPF. However, the iron content in cookies with soy flour increases with increase in the soy flour content, which means PSF30 has the highest content of iron in that category. Calcium and magnesium were higher in cookies with soy flour blends, which increase with an increase in soy flour content.
Table 2 Mineral composition of cookies samples (mg/g sample)
Sample Iron Calcium Magnesium
PPF 0.124 0.018 1.105
PSF10 0.016 0.027 1.117
PSF20 0.018 0.028 1.163
PSF30 0.028 0.053 1.837
Sensory Evaluation
The sample PSF10 received the highest scores for taste, followed by the control sample (PPF). This followed the same order for flavour and appearance of the sample. The flavour and appearance of PSF10 and PPF were acceptable to the panel. The samples PSF20 and PSF30 were less preferred for taste, flavour, texture, and appearance. However, of all the samples PSF10
was preferred, followed by PPF, PSF20, and PSF30, respectively. The mean sensory scores of the cookies are shown in Table 3. Samples PPF and PSF10 (p>0.05) were similar in appearance (colour), taste, flavour, and overall acceptability. Samples PSF20 and PSF30 were also closely related (p>0.05). The results show that samples PPF and PSF10 were both significantly different (p<0.05) from PSF20 and PSF30. The result also show that there was no significant difference (p>0.05) between the four cookie samples with respect to texture.
Table 3 Mean sensory scores of cookies
Samples Appearance (colour)
Taste Flavour Texture Overall Acceptability
PPF 4.55 0.83 4.25 0.97 4.50 0.79 4.20 1.15 4.55 1.00
PSF10 4.35 0.67 4.40 0.60 4.40 0.68 4.15 0.93 4.05 0.83
PSF20 3.65 0.93 3.75 0.69 3.95 0.87 3.90 0.99 3.75 0.73
PSF30 3.25 1.07 3.45 1.07 3.65 0.89 3.60 1.02 3.70 0.72
Overall acceptability of cookie samples was highest in cookies without soy flour, and decreased with an increase in soy flour contents. Substitution up to 10% was acceptable, and acceptability of this substitution differed significantly from other samples (p<0.05).

Olumakaiye: Properties of Soycookies IJHE Vol 6 No 1 2013
94
Discussion
Soybean is one of the world’s valuable oil seed legumes with tremendous potential of alleviating protein-based malnutrition (Addo & Oguntona, 1993). Protein quality of soybeans is generally high; protein in soy flour complements the protein in plain flour because of high lysine content (ASA, 1989). Mixture of soy flour and other types of flour has been used variously to improve the protein quality of food products: Gari fortified with soy-melon blends (Oluwamukomi, Adeyemi, & Odeyemi, 2007), defatted soy flour supplement in Gulabjamum (Awadhesh, Dattatreya, Saxena, & Singh, 2009), chapattis (Muhammad, Muhammad, Shahzad, & Muhammad, 2005), weaning food (Ijarotimi & Ashipa, 2006). Pure defatted soya flour is not meant to be used directly but can be mixed with any other flour like wheat flour, corn flour, cassava flour, etc. The quantity should be 10% to 15% soya flour mixed with the other flour. Soya flour can also be added to cake, pastry, biscuit, and chocolate mixes and even dough for pizza bases. Addition of soya flour increases the nutritional quality of the preparation (http://www.gensoy.com/gensoy_prem_.htm).
Cookies are among the most commonly consumed snacks among young people (Oogarah-Pratap & Heerah-Booluck, 2005). In this study, increasing the amount of soy flour in the blends resulted in an increase in all other nutrients except carbohydrate. Cookies and biscuits are generally low in protein (http://www.annecollins.com/protein_diet/protein-cookies-biscuits.htm). All the blends at various substitution levels in the samples had higher protein contents than cookies made from plain flour. The protein content increased with increasing incorporation of soy flour in cookies, although the protein quality of the blends was not determined. The protein content of soybean is higher than that of dairy products and some meat. Its protein is also of higher quality than the protein of most crops. It is high in most essential amino acids except methionine and cystein, which are present in lower quantity. Essential amino acids cannot be synthesised by human beings and must be supplied in the food (Osho, 1993).
Moisture contents of the blends were generally low and this implied that the cookie samples exhibit good keeping properties and hence the shelf life would increase. The moisture content of any food is an index of its water activity.
Meanwhile, there may be an interference with the storage life as a result of general high fat content of soybean, leading to susceptibility to rancidity especially when the fat contains unsaturated fatty acids, as in soybean. Hence, defatted flour was used for the production of cookies in this study in order to reduce the fat content to a manageable level, although unsaturated fatty acid is a desired fat in food because of its health implications, compared to saturated fat. Soy oil is highly digestible, is high in polyunsaturated fatty acids, and contains no cholesterol. Soy oil contains about 85% unsaturated fat and is high in linoleic and linolenic acids, precursors to omega-3 fatty acid (Panelvo, Salunkhe, & Sathe, 1993).
Carbohydrate contents of blends reduce with an increase in soy flour substitution. Small quantities of glucose were reported to be present in soybean (Osho, 1993; Akubor &Onimawo, 2003).
The ash content of a food is an indication of the mineral element composition. The sample from the various blends had higher ash contents, implying higher mineral element contents than plain flour. Microelements are necessary for all categories of people and it must be

Olumakaiye: Properties of Soycookies IJHE Vol 6 No 1 2013
95
supplied by food consumed. Though not all mineral elements were analysed in this study, the three elements of interest in this study were iron, calcium, and magnesium. Besides the quality of mineral elements, bioavailability must be considered. The low concentration of calcium and iron in the cookie samples from blends can be attributed to the ability of soybean to chelate divalent ions such as calcium and iron, thereby lowering their availability.
Sensory evaluation scores decreased with increasing level of soy flour in the cookies, though at 10% substitution, the product was still very acceptable, probably because the organoleptic qualities were similar to the conventional cookies. Organoleptic characteristics of a product are an important factor in the choice of any product. In an similar study (Morteza,Mohammad, & Mohammad, 2008), adding 3% to 7% defatted soy flour gave as good a loaf of bread as the 100% wheat flour, with higher nutritional quality and acceptable consumer attitude and sensory characteristics.
In conclusion, cookies made from blends of soy flour and plain flour had higher protein, fat,and ash contents compared to cookies made from plain flour only. The organoleptic qualities at 10% soy flour substitution also compete favourably with the plain flour cookies. It is therefore recommended that commercial cookies producers should substitute the plain flour with 10% or a little more soy flour in order to improve the nutritional quality.
Biography
Motunrayo Funke Olumakaiye is a Senior Lecturer in the Department of Family, Nutrition and Consumer Sciences, Obafemi Awolowo University, Ile-Ife, Nigeria. She received a Ph.D degree in Public Health Nutrition in 2007 from University of Ibadan, Nigeria and a Post-Graduate Diploma from Wagenenigen University, Netherlands in 2009. She has attended many international conferences and published about 18 articles in reputable international and national journals. Her research areas are adolescent/school children health and nutrition, nutritional analyses and recipe development. She has served as a consultant with Partnership for Child Development, Imperial College London in the area of School Meal programme.
References
Addo, A.A. and Oguntona, C.R.B (1993). Nutritional value of soya beans. Paper presented atthe Training Workshop for extension workers on Soya bean processing and utilization, FMAWRand RS/UNAAB. Soybean Popularization Project/ AMREC, UNAAB, Nigeria.
Akubor, P. I. and Onimawo, I. A. (2003). Functional properties and performance of soybean and maize flour blends in cookies. Plant Foods for Human Nutrition, 58, 1-12.
AOAC Official Method of Analysis (1990). (15 edn) Washington, DC Association of Official Analytical Chemistry.
ASA (1989). Proceeding of the Workshop on Soya beans Production. Workshop held at Sheraton Hotel Ikeja Lagos.
Awadhesh, K. S, Dattatreya, M.K, Saxena, and Singh, R.P. (2009). Efficacy of deffated soyflour supplement in Gulabjamum. African Journal of Biochemistry Research, 3(4), 130-135.

Olumakaiye: Properties of Soycookies IJHE Vol 6 No 1 2013
96
GenSoy Premium Soya Flour (2008). http://www.gensoy.com/gensoy_prem_.htm. Accessed, 23-6-2008.
Ige, M. M., Ogunshua, A. O and Oke, O.L. (1984). Functional properties of protein of someNigerian oilseeds. Journal of Agricultural Food Chemistry, 32, 822-825.
Ihekoronye , A.I and Ngoddy, P, O (1985). Integrated Food Science and Technology for the Tropics 1985. I.I.T.A Research perspective. Annual report, Ibadan, Nigeria.
Ijarotimi, O. S and Ashipa, F. (2006). Evaluation of nutritional composition, sensory andphysical property of home processed weaning food based on low cost locally available food material. Journal of Nutritional and Food Science. 2006; 36(1): 6-17.
Karen, M. C (2001). National network for child’s cares connection newsletter. August edition.
Morteza, M., Mohammad, .R. M., Mohammad, H. E (2008). Effect of fortification of defattedsoy flour on sensory and rheological properties of wheat bread. International Journal of Food Science and Technology, 43(9),1693 – 1698.
Muhammad, I. K., Muhammad, A., Shahzad, H and Muhammad, T. T (2005). Effect of soy flour supplementation on mineral and phytate contents of unleavened flat bread (chapattis). Journal of Nutrition and Food Science, 5(3), 163-168.
Oluwamukomi, M.O., Adeyemi, I.A and Odeyemi, O.O (2007). Physiochemical Properties of ‘Gari’ Fortified with Soy-Melon blends at different stages of Processing. Research Journal Biological Science, 2 (1), 28-32.
Oogarah-Pratap, B. and Heerah-Booluck, B.J. (2005). Children’s consumption of snacks at school in Mauritius. Journal of Nutritional and Food Science, 35 (1), 15-19.
Osho, S. M (1993). Developed soya bean technologies for small scale and industrial level processing of soya beans. IDRC/IITA. Soybean utilization project phase 2 (IITA Publication).
Panelvo, A.Y., Salunkhe, D. K and Sathe, S.K. (1993). Legumes lipids. In chemistry and biochemistry of legumes. Arora, S. K (Ed) Edward Arnold Pub. Ltd. London.
Protein Content of Cookies http://www.annecollins.com/protein_diet/protein-cookies-biscuits.htm Shortbread cookies recipehttp://www.joyofbaking.com/shortbreads/shortbreadcookies.html Accessed, 27-6-2008
Tyagi, S.K., Manikantan, M.R., Harinder, S.O and Gurlen, K (2006). Effect of mustard flour incorporation on nutritional, textural and organoleptic characteristics of biscuits Journal of Food Engineering, 80(4), 1043-1050.
Type of flour http://www.whatscookingamerica.net/Bread/FlourTypes.htm Accessed, 7-4-2008.

International Journal of Home Economics
97
Factors associated with the consumption of selected vitamin A-rich foods in Iddo Local Government Area of Oyo State
Mojisola Fauziyah Oyewole
University of Ibadan, Nigeria
Abstract
The study investigated factors associated with the inadequate consumption of selected vitamin A-rich foods in Iddo Local Government Area of Oyo State. The population for the study includes all heads of randomly selected households within the selected villages in Iddo Local Government Area of Oyo State. An interview schedule was used to elicit information from 140 respondents on their sociocultural and economic situation that influences the consumption of selected vitamin A-rich foods, the health factors that affect the consumption of selected vitamin A-rich foods and the production strategies of vitamin A-rich foods in the study area. Descriptive statistics were used to summarise the data while Chi-square and correlation was used to test the hypotheses. The study population was dominated by farmers (61.43%). Respondents consume eggs most among the animal sources of vitamin A, while they consume leafy vegetables, pepper, and palm oil more than other plant sources, implying there is no cultural barrier against the consumption of vitamin A-rich foods. The cost of the sources is the greatest factor mitigating against vitamin A food consumption. A significant relationship existed between respondents’ health situations and consumption of vitamin A-rich food (r = 0.80, p < 0.05). Sources of income
) and contact with ’ consumption of
vitamin A-rich food sources among others,8.71, p = 0.07) had no influence on their consumption pattern. The study concludes that respondents are not well educated of the importance of preventive health care.
Keywords: Vitamin A, deficiency, consumption, households.
Background to the study
Vitamins which constitute one of the micro-nutrients of food are inevitably necessary for good health. Vitamins are also referred to as accessory food factors and thus are defined as a group of complex organic compounds present in trace amounts in food that the body requires for its metabolism. Vitamins are classified into two main groups, namely water-soluble and fat-soluble vitamins. The water-soluble vitamins are those that dissolve in water, and these are the B complex vitamins, namely B1, B2, B12, folic acid, niacin, bioticn, panthothenic acid and vitamin C. The fat-soluble vitamins are those that cannot dissolve in water but can dissolve in fats and oils. These are vitamins A, D, E, and K (Sakai et al., 2010).

Oyewole: Factors associated with the consumption of selected vitamin A-rich foods IJHE Vol 6 No 1 2013
98
Foods with high vitamin content but which are seldomly eaten are of little value unless they are deliberately included as a dietary component. There are many factors limiting the availability of these nutrients in the body, for example inadequate intake in quantity and quality, processing methods and preservation techniques, as well as loss in cooking water. Vitamins play vital roles in assisting the synthesis of other nutrients such as proteins, fats, carbohydrates, and minerals in the body, and also in the formation of blood cells, hormones, genetic material, and the nervous system. However, the absence of these vitamins in the body as required are attended by some forms of deficiency diseases and symptoms such as night blindness, skin diseases, rickets, stunted growth, and so forth (Health Day News, 2010).
The chemical name for vitamin A is retinol. It is a yellow substance which is also known as the antixerophthalmic vitamin. The active form of vitamin A occurs only in foods of animal origin but as carotene in green fruits and vegetables, and cryptoxanthine in yellow corn. These substances that can be converted to vitamin A in the body are provitamin A as they form the precursor of vitamin A. Food sources of Vitmain A from animal sources are liver, fish, milk, butter, cheese, egg yolk, cod liver oil, milk products; while plant sources (B-carotene) include carrots, pawpaw, mango, tomatoes, yellow maize, green leafy vegetables, pumpkin, and red palm oil (Gerli, Mignosa, & Di Renzo, 2003; Hooper et al., 2008).
Vitamin A plays an important role in maintaining the health of human beings throughmaintaining many physiological processes needed for growth; enhancing the storage of energy in the body; influencing the formation of hormones; helping to maintain the mucous membrane particularly in the eyes, skin and gastro intestinal tract, thus keeping the surface moist and healthy; helping the formation of bones, blood cells, teeth and nervous system;and assisting with vision in dim light.
Vitamin A deficiency (VAD) is marked with keratinization of epithelial surfaces of the body, resulting in a build-up of keratin in the pores of the skin. vitamin A deficiency that results from inadequate consumption of vitamin A-rich foods can cause blindness, mortality, rough and dry skin, and dry eyelids (Health Supplements Nutritional Guide, 2010; Nolan, McIntosh, Allam, & Lamey, 1991). Adequate nutrition cannot be easily achieved without fruits andvegetables and other vitamin A-rich foods. Despite the production and availability of vitamin A-rich foods in Ido Local Government Area, the problem of inadequate consumption of vitamin A-rich food still persists. This study will therefore investigate some factors limiting the adequate consumption of vitamin-A rich foods in these local communities.
Objective of the study
The general objective of the study is to assess the factors associated with the inadequate consumption of selected vitamin A-rich foods in Ido Local Government Area, of Oyo State.

Oyewole: Factors associated with the consumption of selected vitamin A-rich foods IJHE Vol 6 No 1 2013
99
Hypotheses of the study
H01: There is no significant relationship between consumption of selected vitamin A-rich foods and personal characteristics of respondents
H02: There is no significant relationship between consumption of selected vitamin A-rich foods and health situations of respondents.
Methodology
The area of study is Ido local government area of Oyo State. The population for the study includes all the heads or the mothers of randomly selected households within the selected villages in Ido Local Government Area of Oyo State. Within the local government area of the study, there are 10 registered villages, from which six were selected using a stratified random sampling technique. The villages selected were based on the availability and production of vitamin A-rich foods by the farmers in the community and were classified according to their degree of rurality, using population as the criterion. Villages with fewer than 500 people were classed as rural communities (Group 1); villages with a population between 500 and 1,000people were classed as semi-urban communities (Group 2); and villages with a populationabove 1,000 people were classed as urban (Group 3). The villages selected by stratification were:
Group 1: Awotan and Alaro (Rural communities)
Group 2: Omiadio and Ido (Semi-urban communities)
Group 3: Apata and Apete (Urban communities)
The households were randomly selected and respondents were sampled from each of the 10 percent of the households; thus, 140 respondents were interviewed. This constitutes the sample size.
Table 1 Participants
Groups Name of villages Population No of households No of respondents
Group 1 Awotan and Alaro Less than 500 200 20
Group 2 Omi Adio and Ido Between 500 and 2000 400 40
Group 3 Apata and Apete 1000 and above 800 80
Total 1400 140
Data were obtained through two sources. The primary data source was a questionnaire, and the secondary data sources included past research work and official records. An interview schedule was organised based on a structured questionnaire and administered to the respondents. Descriptive and inferential statistics were used to analyse the data. Chi-square and correlation were used to test the hypotheses.

Oyewole: Factors associated with the consumption of selected vitamin A-rich foods IJHE Vol 6 No 1 2013
100
Results and discussion
Table 2 shows the frequency distribution and percentages of the ages of respondents.Approximately 36% of the respondents were aged between 31 and 45 years. They were expected to be enlightened of the importance of consuming vitamin A-rich foods. Most interviewees were males, who were interviewed considered to be the heads of householdswhen the head of the household was not available; the principal caregiver of the household was then interviewed. Approximately 82.9% of the respondents were married. Few (9.3%) of the respondents attended secondary schools where the importance of vitamins is likely to be taught. The highest percentage (47.1%) of the study population was Christians followed by Islam (44.3%). This did not affect consumption of vitamin A-rich foods. The study population was dominated by farmers (61.43%) which suggest a high potential for production of vitamin A-rich foods in the study area. Table 2 also shows that the farmers are small-scale subsistence farmers, who consumed part of what they produce.
Table 2 Distribution of respondents by their personal characteristics
Characteristic Frequency Percentage
Age (Years)
Less than or equal to 30 14 10
31-45 51 36.4
46-59 39 27.9
60 and above 35 25
No response 1 0.7
Sex
Male 89 63.57
Female 51 36.43
Marital Status
Single 0 0
Married 116 82.86
Divorced 9 6.44
Widow 5 10.7
Education
No formal education 28 20.0
Primary education 50 35.7
Secondary education 27 19.3
National Certificate of Education 10 7.1
Ordinary National Diploma 14
Bachelor degree 10 7.2
Higher National Diploma 0 0
No Response 1 0.7
Religion
Traditional 11 7.9
Islam 62 44.3
Christian 66 47.1
Others 1 0.7
Main Occupation

Oyewole: Factors associated with the consumption of selected vitamin A-rich foods IJHE Vol 6 No 1 2013
101
Characteristic Frequency Percentage
Farming 86 61.43
Civil servant 30 21.43
Self employed 21 15.00
Others 2 1.43
No response 1 0.71
Total 140 100
Size of the Farm
Less than 1 hectare 55 39.28
1-2 hectares 65 46.43
3-5 hectares 13 9.29
Over 5 hectares 7 5.00
Total 140 100
Table 3 shows that a large number (43.57%) of the respondents produced vegetables and fruits, 37.14% were involved in animal husbandry, and only 19.30% produced cash crops.
Table 3 Distribution of respondents on the type enterprises they are involved in
(n=140)
Enterprises Frequency Percentage
Vegetable / fruit production 61 43.57
Animal husbandry 52 37.14
Cash crop production 27 19.30
Total 140 100
Table 4 shows the level of consumption of selected vitamin A-rich foods of the respondents. Of the animal sources rich in vitamin A, egg had the highest consumption, with 43.6% of respondents consuming egg daily and 37.1% comsuming egg weekly. Cheese had the lowest consumption, with 74% of participants never consuming it and 50% consuming it yearly. Of the vegetable sources, leafy vegetables were consumed daily by 42.8% of respondents; peppers were consumed daily by 68.5% of respondents; palm oil was consumed weekly by 43.6% of respondents; and tomatoes were consumed weekly by 32.8% of respondnents. Respondents therefore consume eggs most among the animal sources of vitamin A, and leafy vegetables, peppers and palm oil more among the plant sources. Factors that can influence the consumption of vitamin A sources include the utility of the vitamin A sources, the availability of the sources, nutrition education on use of vitamin A sources, and awareness of the importance of vitamin A food sources.

Oyewole: Factors associated with the consumption of selected vitamin A-rich foods IJHE Vol 6 No 1 2013
102
Table 4 Distribution of respondents across the levels of consumption of selected
vitamin A-rich foods
Vitamin A-richfood sources
Never Yearly Monthly Forthnightly Weekly Daily
Liver 17(12.1)
5(3.6)
49(35)
24(17.1)
29(20.7)
16(11.4)
Milk 0(0)
10(7.1)
34(24.3)
16(11.4)
54(38.6)
26(18.6)
Butter 20(14.3)
15(10.7)
31(22.1)
27(19.3)
39(27.9)
8(5.7)
Cheese 65(46.4)
16(11.4)
14(10)
10(7.1)
19(13.6)
16(11.4)
Eggs 0(0)
0(0)
20(14.5)
7(5)
52(37.1)
61(43.6)
Leafy vegetables 6(4.3)
9(6.4)
10(7.1)
15(10.7)
40(28.6)
60(42.8)
Peppers 0(0)
0(0)
6(4.3)
8(5.7)
30(21.4)
96(68.5)
Tomatoes 0(0)
0(0)
20(14.2)
34(24.2)
46(32.8)
Sweet potatoes 12(8.6)
100(71.4)
10(7.1)
12(8.5)
4(2.8)
2(1.4)
Carrot 32(22.8)
88(62.9)
16(11.4)
4(2.9)
0(0)
0(0)
Onions 0(0)
0(0)
36(27.7)
48(34.3)
32(22.8)
24(17.1)
Palm oil 0(0)
2(1.4)
3(2.1)
32(22.8)
61(43.6)
42(30)
Pawpaw 6(4.3)
63(4.5)
40(28.6)
26(18.6)
2(1.4)
3(2.1)
Acocado pear 40(28.6)
58(41.4)
31(22.1)
6(4.3)
3(2.1)
2(1.4)
Mango 26(18.6)
94(67.1)
13(9.3)
7(5)
0(0)
0(0)
Pumpkin 38(27.1)
98(70)
2(1.4)
2(1.4)
0(0)
0(0)
*Percentages are in parentheses
Table 5 shows that 27.14% of the respondents were afflicted with drying of the skin and11.43% were afflicted with night blindness. This shows that respondents were deficient invitamin A. No cultural factors of the respondents prevented the consumption of vitamin A-rich foods. This implies that if these vitamin A-rich foods are available in the study area the people of the area will continue to consume them, unless there is an economic barrier.
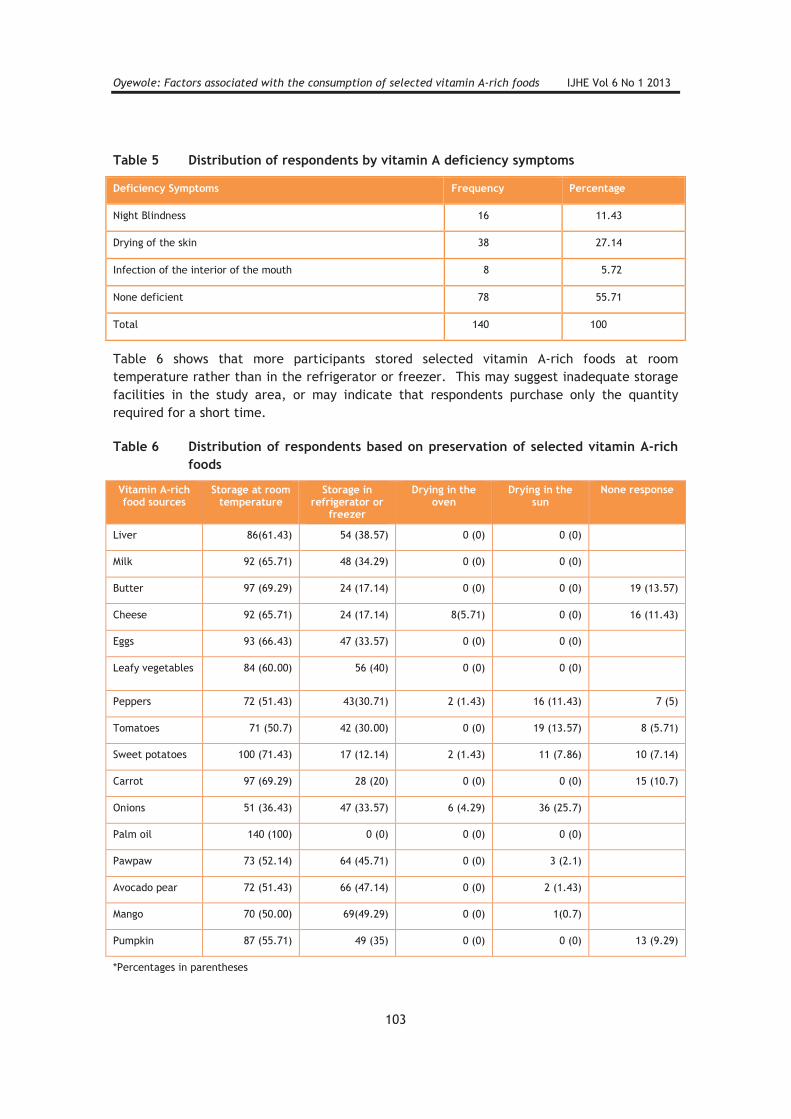
Oyewole: Factors associated with the consumption of selected vitamin A-rich foods IJHE Vol 6 No 1 2013
103
Table 5 Distribution of respondents by vitamin A deficiency symptoms
Deficiency Symptoms Frequency Percentage
Night Blindness 16 11.43
Drying of the skin 38 27.14
Infection of the interior of the mouth 8 5.72
None deficient 78 55.71
Total 140 100
Table 6 shows that more participants stored selected vitamin A-rich foods at room temperature rather than in the refrigerator or freezer. This may suggest inadequate storage facilities in the study area, or may indicate that respondents purchase only the quantity required for a short time.
Table 6 Distribution of respondents based on preservation of selected vitamin A-rich
foods
Vitamin A-richfood sources
Storage at room temperature
Storage in refrigerator or
freezer
Drying in the oven
Drying in the sun
None response
Liver 86(61.43) 54 (38.57) 0 (0) 0 (0)
Milk 92 (65.71) 48 (34.29) 0 (0) 0 (0)
Butter 97 (69.29) 24 (17.14) 0 (0) 0 (0) 19 (13.57)
Cheese 92 (65.71) 24 (17.14) 8(5.71) 0 (0) 16 (11.43)
Eggs 93 (66.43) 47 (33.57) 0 (0) 0 (0)
Leafy vegetables 84 (60.00) 56 (40) 0 (0) 0 (0)
Peppers 72 (51.43) 43(30.71) 2 (1.43) 16 (11.43) 7 (5)
Tomatoes 71 (50.7) 42 (30.00) 0 (0) 19 (13.57) 8 (5.71)
Sweet potatoes 100 (71.43) 17 (12.14) 2 (1.43) 11 (7.86) 10 (7.14)
Carrot 97 (69.29) 28 (20) 0 (0) 0 (0) 15 (10.7)
Onions 51 (36.43) 47 (33.57) 6 (4.29) 36 (25.7)
Palm oil 140 (100) 0 (0) 0 (0) 0 (0)
Pawpaw 73 (52.14) 64 (45.71) 0 (0) 3 (2.1)
Avocado pear 72 (51.43) 66 (47.14) 0 (0) 2 (1.43)
Mango 70 (50.00) 69(49.29) 0 (0) 1(0.7)
Pumpkin 87 (55.71) 49 (35) 0 (0) 0 (0) 13 (9.29)
*Percentages in parentheses

Oyewole: Factors associated with the consumption of selected vitamin A-rich foods IJHE Vol 6 No 1 2013
104
Table 7 shows the frequency distribution of respondents based on some environmental factors that are barriers to the consumption of selected vitamin A-rich foods. The cost of the sources is the greatest factor mitigating against vitamin A food consumption, except for leafy vegetables, which are very cheap and readily available. Storage facilities and stability of electricity are also problems for almost all the sources (except for palm oil). Palm oil, avocado pear and pumpkin and reported as the most expensive while leafy vegetables are most affected by inadequate of storage facilities.
Table 7 Distribution of respondents based on environmental factors that are barriers
to consumption of selected vitamin A-rich foods
Vitamin A-rich food sources Food cost Inadequate storage
facilities
Food additives
Liver 82 (58.57) 51 (36.43) 7 (5)
Milk 75 (53.57) 52 (37.14) 13 (9.29)
Butter 92 (65.71) 11 (7.86) 37 (26.43)
Cheese 70(50.00 39 (27.86) 31 (22.14)
Eggs 62 (44.29) 58 (41.43) 20 (14.29)
Leafy vegetables 0 (0) 140 (100) 0 (0)
Peppers 40 (28.57) 100 (71.43) 0 (0)
Tomatoes 45 (32.14) 95 (67.86) 0 (0)
Sweet potatoes 41 (29.29) 99 (70.71) 0 (0)
Carrot 98 (70) 42 (30) 0 (0)
Onions 101 (72.14) 39 (27.86) 0 (0)
Palm oil 140 (100) 0 (0) 0 (0)
Pawpaw 97 (69.29) 43 (30.7) 0 (0)
Avocado pear 102(72.29) 38(27.14) 0 (0)
Mango 95 (67.86) 45 (32.14) 0 (0)
Pumpkin 104 (74.29) 36 (25.71) 0 (0)

Oyewole: Factors associated with the consumption of selected vitamin A-rich foods IJHE Vol 6 No 1 2013
105
Hypothesis 1
Table 8 shows that there is significant relationship between age, gender, marital status, education, family size and religion and the consumption of vitamin A-rich foods. A potential reason for the relationship between age and consumption of vitamin A-rich foods is that more of the older people were involved in the farming activities and therefore had more of the farm produce such as vegetables, pawpaws, peppers, tomatoes, and mangoes available for consumption. The relationship between gender and consumption of vitamin A-rich foods is that the men were more involved in the locality.
Most of the respondents were married while most of them had one form of education (formalor informal), which could have influenced their consumption of these vitamin A-rich foods. Awareness of available vitamin A-rich foods presumably influences the consumption habits of participants’ family members. Moreover, the larger the family size, the more hands that will farm the land (i.e., larger farm size) and the more produce that will be available for consumption.
Respondents’ incomes would help determine if the respondents could afford some of the vitamin A-rich foods for consumption. The higher their source of income, the higher the purchase of some vitamin A-rich foods for consumption. The type of farm produce grown such as vegetables and fruits may also encourage the consumption of some vitamin A-rich foods. There is significant relationship between contact with extension agent and consumption ofvitamin A-rich foods because the extension agents would provide the respondents with adequate information on the production of some vitamin A-rich foods, such as information regarding fertilizer application on vegetables. Nutritional programmes provide the respondents of the study area with necessary nutritional information and education would which promote the consumption of vitamin A-rich foods.
Contrary to the hypothesis, religion had a significant relationship with the consumption of vitamin A-rich foods. Most of the vitamin A-rich sources of foods such as carrot, mango, liver, and green leafy vegetables are usually consumed by people of all religions. There was no significant relationship between consumption of selected vitamin A-rich foods and main occupation.
Table 8 Relationship between respondents’ consumption of selected vitamin A-rich
foods and personal characteristics
Variables X2 value Df P Remarks
Age 41.63 4 0.00 Significant
Gender 13.44 2 0.001 Significant
Marital status 9.05 3 0.03 Significant
Education 27.10 9 0.001 Significant
Family size 17.17 3 0.001 Significant
Religion 20.79 3 0.00 Significant
Main occupation 8.71 4 0.07 Not significant
Source of income 26.32 4 0.00 Significant

Oyewole: Factors associated with the consumption of selected vitamin A-rich foods IJHE Vol 6 No 1 2013
106
Variables X2 value Df P Remarks
Farm size 43.26 4 0.00 Significant
Farm produce 15.38 3 0.002 Significant
Income 29.21 5 0.00 Significant
Contact with extension agent 11.36 2 0.003 Significant
Preferred vitamin A-rich foods sources 13.43 3 0.004 Significant
Household size 8.77 1 0.03 Significant
Nutritional programme 8.38 2 0.05 Significant
Hypothesis 2
Table 9 reveals a significant relationship between respondents’ health situations and consumption of vitamin A-rich food. This finding suggests that many are compelled to consume vitamin A-rich food as a result of their various health challenges. This implies that they would not ordinarily consume such diets if there was no health problem. From this finding one can conclude that respondents are not well educated of the importance of preventive health care. This means that a lot of awareness campaign on prevention education is required among the residents of Iddo Local Government Area of Oyo State.
Table 9 Relationship between respondents consumption of selected vitamin A-rich
foods and their health situations
Variable R p Decision
Consumption of selected vitamin A-rich foods versus health situations 0.80 0.00 Significant
Conclusion
Respondents’ health situation, sources of income, household size and contact with extension agents influence their consumption of vitamin A-rich food sources, but respondents’ occupation had no influence on their consumption pattern. Also, respondents are not well educated of the importance of preventive health care. A more vigorous awareness campaign on prevention education is required among the residents of Iddo Local Government Area of Oyo State. There is also need to mobilise more extension workers in the area.

Oyewole: Factors associated with the consumption of selected vitamin A-rich foods IJHE Vol 6 No 1 2013
107
Biography
Mrs Oyewole is a graduate of Ambrose Alli University Ekpoma, and University of Ibadan and currently pursuing her PhD in Agricultural Extension and Rural Development.
References
Gerli, S., Mignosa, M., & Di Renzo, G. C. (2003). Effects of inositol on ovarian function and metabolic factors in women with PCOS: A randomized double blind placebo-controlled trial. European Review for Medical and Pharmacological Sciences, 7, 151-159.
Health Day News. (2010). Vitamin deficiency. Retrieved July 20, 2011 from: http://www.wrongdiagnosis.com/v/vitamin/intro.htm
Health Supplements Nutritional Guide. (2010). Vitamin chart: Vitamin deficiency symptoms and benefits. Retrieved July 18, 2011 from: http://www.healthsupplementsnutritionalguide.com/vitamin-deficiency-symptoms.html
Hooper, L., Kroon, P. A., Rimm, E. B., Cohn, J. S., Harvey, I., Le Cornu, K. A., Ryder, J. J., Hall, W. L., & Cassidy, A. (2008). Flavonoids, flavonoid-rich foods and cardiovascular risk: A meta-analysis of randomized controlled trials. American Journal of Clinical Nutrition, 88, 38-50.
Nolan, A., McIntosh, W. B., Allam, B. F., & Lamey, P. J. (1991). Recurrent aphthous ulceration: Vitamin B1, B2 and B6 status and response to replacement therapy. Journal of Oral Pathological Medicine, 20(8), 389-391.
Sakai, K., Kino, S., Takeuchi, M., Ochi, T., Da Cruz, G., & Tomita I. (2010). Analysis of antioxidant activities in vegetable oils and fat soluble vitamins and bio-factors by the PAO-SO method. Methods and Molecular Biology, 594, 241- 250.

International Journal of Home Economics
108
Prospects for the fit of ready-to-wear clothing
Kirsti Salo-Mattila
University of Helsinki
Introduction
In garment design, the goal is to arrange the lines, forms, and ease allowances around the body in a way that satisfies both the person who wears the garment and the one who watches it. The success is measured by using the concept of fit. Appraisal of fit emphasises the realisation of lines, forms, and ease allowances in accordance with the design, the functionality of ease allowances, and the fulfilment of the user's personal preferences of style and ease. (For the discussion of fit, see DeLong, Ashdown, Butterfield, & Turnbladh, 1993; Ashdown & O'Connel, 2006).
Fit has been identified as the most important criterion or among the most important criteria in consumers' purchase decisions (Kawabata & Rabolt, 1999; Hsu & Burns, 2002). Concerns about sustainable development do not appear to change the importance of fit. In a recent study of ethical consumption of clothing, more than 95% of the respondents in all categories of ethical commitment considered fit one of the criteria that affected their purchase decisions most (Niinimäki, 2010).
To improve the fit of ready-to-wear clothing, the industry introduced mass customisation for women's clothes as early as the late 19th century. The solution was made-to-measure production based on mail orders. However, with the advance of mass production in the 20th century, the drive was from mass customisation to sizing standardisation, especially in the second half of the century (Aldrich, 2007). In terms of the fit of clothes, the results of standardization were poor. In the late 1990s, it was estimated that 70% of women in the United States could not find clothing that would fit well (LaBat, 2007).
Toward the end of the 20th century, improvement of the fit of ready-to-wear clothing was suggested through new ways of mass customisation enabled by advances in computer technology. Delong et al. (1993) studied data specification needed for the new form of mass production, and concluded that each customer's individual ease preferences had to be accommodated. The preferred ease amounts were different at different body locations, but still subject to experiencing the garment as a whole (Delong et al., 1993). New sizing systems for mass customisation and tools for analysing body scanning data have been developed on the premise that customisation must start from a garment pattern that is correctly shaped for each customer. A process where the customer is measured and her fit preferences mapped would offer improved fit, ideally without resorting to any try-on (Loker, 2007).
The purpose of the present paper is to examine what the prospects for an improved fit of ready-to-wear clothing are in the next 10 years. A mixed-methods approach is applied. The

Salo-Mattila: Prospects for the fit of ready-to-wear clothing IJHE Vol 6 No 1 2013
109
first part of the study considers the possibility of satisfaction with the fit of ready-to-wear clothing in the view of fashion theory. The second part asks to what extent an improved fit is possible in the light of quantitative data that describes the satisfaction of young female adults with different dimensions of ready-to-wear clothing.
Although the fit of ready-to-wear clothing and its improvement toward custom fit have been studied extensively during the past 20 years, the literature has not discussed customer fit satisfaction on the level of detail that is used to construct a garment. The effect of fashion on the quality of desired fit has not been studied either.
Review of literature
Based on body scan data, most women seem to be out of tolerance with the measurements of their standard size. By analysing the data, it is possible to introduce new shape categories that better accommodate the subject bodies (Simmons, Istook, & Devarajan, 2004a, 2004b; Loker, Ashdown, & Schoenfelder, 2005). It has been demonstrated that such an analysis can be automated (Connell, Ulrich, Brannon, Alexander, & Presley, 2006). It is also conceivable that body scan data could be used for automatic pattern drafting. Modular pattern pieces would be developed for different shapes in certain areas of the body, and the proper shape and size selected from the scan measurements (Loker, 2007).
In the studies of automatic creation of custom-fitted patterns from scanning data, human intervention in the process has proven unavoidable (Ashdown & Dunne, 2006; Voellinger Griffey & Ashdown, 2006). In the study of Ashdown and Dunne (2006), automatic conversion of scanning data into measurements required manual adjustment of measuring points in the system, and automatic alteration of graded style patterns according to custom measurements necessitated changes in the underlying body chart. Finally, provisionary trial garments were used to achieve a satisfactory fit.
It is obvious that the problem of ease as outlined by Delong et al. (1993) remains hard to solve. The shape and size dependence of ease amounts for pants’ fit has been investigated by one study that, however, did not consider the effects of personal preferences (Petrova & Ashdown, 2008). On a more general level, fit preferences have been extensively studied, especially in the United States. Several studies have shown that fit preferences are related to body satisfaction. Those who feel better about their bodies or body parts prefer a closer fit (Anderson et al., 2001; Alexander, Connell, & Presley, 2005; Chattararam & Rudd, 2006; Pisut & Connell, 2007). One study found that women who desired fitted pants sought the "fashion forward" and "sexy" aspects of clothing, and that fit preferences did not affect satisfaction with the fit of ready-to-wear garments (Kinley, 2010). In a case of online shopping, perceived self-discrepancies with online models were related to body dissatisfaction and concerns with fit and size of garments (Kim & Damhorst, 2010).
The results of Pisut and Connell (2007) indicate that the fit of ready-to-wear clothing continues to be a major problem for consumers in the United States. Eighty percent of the respondents reported fit problems in two or more areas of the body, and nearly half of them had done alterations on ready-to-wear garments. Tightness and length were the most common complaints for poor fit. Surprisingly, only some 20% of the respondents expressed

Salo-Mattila: Prospects for the fit of ready-to-wear clothing IJHE Vol 6 No 1 2013
110
dissatisfaction with ready-to-wear garments. If that is interpreted as some 80% of the respondents being satisfied with ready-to-wear garments, the result is in line with Kinley’s(2010) finding that more than 80% of the respondents were "satisfied," "somewhat satisfied," or "extremely satisfied" with the current fit of garments in the marketplace. Obviously, one cannot equate fit problems with overall dissatisfaction with fit.
Fashion and fit
Fashion and body
Roland Barthes (1915–1980) analysed the relationship between fashion and body in his Système de la Mode, which was published in 1967. According to Barthes (1983), fashion deals with two bodies: the abstract body presented by a fashion magazine, and the real body of the reader. The system of fashion captures the body and combines it with the prevailing fashion in the garment shown by the magazine. In Saussure's sign system, the garment presented in the magazine would be a sign with the prevailing fashion as signifier and the body as signified (Figure 1).
Figure 1 Fashion garment as a sign, according to Barthes. The arrows show how the
reference (dashed line) is realised through the signified that is the idea of the
body. Diagrams by the author.
The problem is which body the sign signifies to the reader: the abstract body in the magazine,or the real body of the reader herself (Barthes, 1983). According to Barthes (1983), the system of fashion has three ways to deal with the "discontinuity" or conflict between the abstract body in the magazine and the real body of the reader. Each way has a different effect on the reader. The first way presented by Barthes could be described as the strategy of a pure form. The unreal nature of the fashion model's body, its exaggerated slimness and overly long limbs, does not offer the reader any possibility to connect it with a specific body. The reader's attention will concentrate on the presented garment, and the conflict remains latent. The second way could be named the strategy of a fashionable body. The surroundings in the picture refer to reality and transform the model's body into a real one in the reader's mind. The conflict becomes acute. At the same time, the garment gets less attention. The
Salo-Mattila: Prospects for the fit of ready-to-wear clothing IJHE Vol 6 No 1 2013
111
third way could be called the strategy of transformation. With an individually tailored garment, the fashion system modifies the body image of the reader to have it correspond with the prevailing ideal in fashion. The conflict is settled. (For the analysis by Barthes, see Barthes, 1983; for the interpretation and strategies, see Salo-Mattila, 2007; Salo-Mattila, 2009; cf. Perthuis, 2005).
In the presentation of Barthes (1983), there is an inherent conflict between the reader's body image and the ideal in fashion. It is useless to try to settle the conflict by, say, pursuing a slim figure. Only if the reader can afford a garment tailored for her by the designer, she can adapt her body image to the ideal in fashion (Salo-Mattila, 2009).
Satisfaction with the fit of ready-to-wear clothing
Several studies (Turner & Hamilton, 1997; Kim & Lennon, 2007; Kim & Damhorst, 2010) support the view that the fashion system tends to leave a consumer dissatisfied with her body and with ready-to-wear garments. They are, however, silent on the effect of fashion on the qualities of desired fit.
Fundamentally, both Barthes (1983) and Delong et al. (1993) suggest that arranging ease around the body according to fashion and personal preferences is a necessary condition for fit satisfaction. For ready-to-wear clothing, that would mean realisation of custom fit. How this could be done without a try-on is yet to be solved even theoretically.
Survey design
From 2004 to 2010, first-year students in the textile teacher program (five years; MEd.) at a Finnish university were asked what their most common size of clothing was and which dimensions of ready-to-wear garments were too small or too large in their experience. The survey was designed for the dual purpose of collecting data and introducing students to the problems in measurements and fit in their first course of pattern design. The course work included drafting personal basic patterns for a blouse and a skirt, comparing them with the corresponding patterns produced by using a CAD system, designing the style patterns, and making trial garments of muslin based on the basic and style patterns. The questionnaire was presented to the students at the first meeting of the course, and the deadline was the following meeting. In all, 162 completed forms were returned; the response rate was 76%. Late returns were excluded.
The majority of the respondents were between the ages 19 and 23, and they had been active home sewers after graduation from high school. In the Finnish comprehensive school, all students learn crafts in Grades 1 through 9. In addition, a few have crafts as an elective in high school, in Grades 10 through 12. In Grades 5 through 7, the program offers a choice of emphasis between technical and textile work, and in Grades 8 and 9, it concentrates on one or the other. Most girls choose textile work, which includes the design and construction ofseveral pieces of clothing in Grades 5 through 9 (Finnish National Board of Education, 2009).
The questionnaire form showed the measurements in the so-called Nordic basic pattern system (Figure 2), and for each corresponding dimension of a garment, a five-level balanced

Salo-Mattila: Prospects for the fit of ready-to-wear clothing IJHE Vol 6 No 1 2013
112
Likert scale of "altogether too small," "to some extent too small," "suitable," "to some extent too large," and "altogether too large." The corresponding scale values of -2, -1, 0, +1, and +2 were used in the analysis. The value 0 or "suitable" was interpreted as representing fit satisfaction, while the values -1 and +1 or "to some extent too small" and "to some extent too large" were included in the concept of "approximate fit." The form also included an open question on ease preferences.
Figure 2 Measurements in the so-called Nordic basic pattern system.
Melkas, Raitio-Nyholm, & Räsänen, 1985. 1=height, 2=bust, 3=waist, 4=upper
hip, 5=upper hip depth, 6=lower hip, 7=lower hip depth, 8=back neck to
underarm line, 9=back neck to waist line, 10=back neck to kneeline, 11=back
width, 12=neck, 13=shoulder length, 14=back neck to bustline front, 15=back
neck to waistline front, 16=arm length, 17=upper arm, 18=elbow, 19=wrist,
20=side length, 21=inside leg length, 22=crotch depth.
The design of the Nordic basic pattern system was based on body measurements of 1,308 women in 1978. The sizing system with 48 measurements and 3 body types was published in 1980 and the basic pattern system in 1985. The theme of the sizing system was "measurements according to shape" (Vaatetusteollisuuden Keskusliitto, 1980; Melkas et al.,1985).
The most recent sizing system developed in Finland was based on the measurements of 1,550 women during the period 1999–2001 (Tekstiili- ja vaatetusteollisuus, 2001). The new sizing system was part of the international "Draft research project concerning the survey on the European population's sizes." Tekstiililehti, a trade journal, published a special issue on the
Salo-Mattila: Prospects for the fit of ready-to-wear clothing IJHE Vol 6 No 1 2013
113
development project and advanced manufacturing systems for made-to-measure production in 2000. The theme of the issue was "individually and industrially" (Tekstiililehti, 2000). The sizing system with 70 measurements and six body types, each with three waist types, was published in 2001, but a corresponding drafting system was not developed.
In the past 25 years, the industrial use of the Finnish pattern systems has declined. In 2009, approximately 90% of the ready-to-wear clothing sold in Finland was imported (for data, see Finatex, 2010). Nevertheless, the Nordic system still provides a good basis for understanding body measurements and learning basic patterns. The fact that the system was not used in the vast majority of ready-to-wear clothing during the survey period was estimated to have no influence on the results.
Survey results
Size and ease preferences
The respondents represented sizes 32–48 (USA sizes 2–18). The majority or 56% were within the size range 36–40 (USA sizes 6–10). For lower-body garments, 34% preferred a larger size than for upper-body garments. There was a gradual shift away from the sizes 32 and 34 (USAsizes 2 and 4) during the first four years of the survey period.
Answers to the open question of ease preferences emphasized a close fit. Such fit was in fashion, especially during the first four years of the survey period. Shoulder, bust, back, and hip areas were expected to be fitted, while midriff was supposed to exhibit a tight fit. Consequently, there were also worries about some dimensions, for example upper arm and thigh, being too tight. Shirt-style ease was considered fine. For lengths, a concern in the early years of the survey period was that midriff should not be exposed. The results are in line with those of Anderson et al. (2001), and Pisut and Connell (2007). They reported tightness and length as the most common complaints for poor fit.
Experience of fit for width and circumference
For the experience of fit for garment width and circumference, the means were within ±0.2 from zero, with standard deviations of less than 0.9. The linear correlations (Pearson) were generally weak, and the coefficient (r) values among the crucial midbody group of bust, waist, and hip (no. 6, or "lower hip" in Figure 2) were weaker than ±0.3. The only higher value in midbody was 0.51 (p<0.001) within the hip area, between "upper" and "lower" hip. The corresponding common variance (R2) in the experience of fit for the two dimensions was still only 26%. There were correlations of similar strength also between upper arm and elbow, 0.50 (p<0.001), and elbow and wrist, 0.52 (p<0.001).

Salo-Mattila: Prospects for the fit of ready-to-wear clothing IJHE Vol 6 No 1 2013
114
Table 1 Bust by waist evaluation
WaistTotal
-2 -1 0 1 2
Bust
-2 0 1 3 1 0 5
-1 2 9 16 7 0 34
0 3 15 37 18 2 75
1 1 4 19 13 4 41
2 0 2 4 0 1 7
Total 6 31 79 39 7 162
Table 2 Bust by hip evaluation
HipTotal
-2 -1 0 1 2
Bust
-2 1 0 4 0 0 5
-1 0 10 18 6 0 34
0 3 26 37 8 1 75
1 3 11 16 11 0 41
2 0 4 1 2 0 7
Total 7 51 76 27 1 162
Table 3 Waist by hip evaluation
HipTotal
-2 -1 0 1 2
Waist
-2 0 2 4 0 0 6
-1 2 7 16 6 0 31
0 2 29 34 14 0 79
1 2 12 18 6 1 39
2 1 1 4 1 0 7
Total 7 51 76 27 1 162
The cross tabulations for bust, waist, and hip showed that 23% of the respondents were satisfied with both bust and waist dimensions, 23% with bust and hip dimensions, and 21%with waist and hip dimensions (Tables 1–3). Only 10% found all three dimensions satisfactory(Table 4).
In the annual breakdown of satisfaction, one can observe some increase toward the end of the survey period. The share of those satisfied with the combination of bust, waist, and hip dimensions rose clearly in the last two years, which may reflect the gradual shift of fashion during the survey period from a close fit toward a more relaxed fit (Table 4).

Salo-Mattila: Prospects for the fit of ready-to-wear clothing IJHE Vol 6 No 1 2013
115
Table 4 Annual breakdown of satisfaction with bust, waist, and hip
Year Satisfaction withbust and waist measurements
Satisfaction withbust and hip
measurements
Satisfaction withwaist and hip measurements
Satisfaction withbust, waist, and hip
measurements
2004 (n=28) 11% 18% 18% 4%
2005 (n=31) 16% 23% 6% 0%
2006 (n=30) 27% 20% 23% 13%
2007 (n=17) 24% 24% 18% 12%
2008 (n=17) 6% 29% 18% 6%
2009 (n=20) 30% 20% 40% 15%
2010 (n=19) 53% 32% 32% 26%
Total (n=162) 23% 23% 21% 10%
Among correlations of circumference and length, bust showed a correlation of 0.51 (p<0.001) with bust height, or the dimension described by the measurement from back neck to bustline front (no. 14 in Figure 2). The cross tabulation showed that 35% of the respondents were satisfied with both measurements.
Experience of fit for length
For the experience of fit for garment length, the means were within ±0.3 from zero, with standard deviations of 1.0 or less. The linear correlations (Pearson) included some fairly strong and statistically significant coefficients (r). In the group of height, side length, and inside-leg length, the value between height and side length was 0.77 (p<0.001), between height and inside-leg length 0.54 (p<0.001), and between side length and inside-leg length 0.74 (p<0.001). The common variance (R2) was 59% and 55%, correspondingly.
The cross tabulations for height, side length, and inside-leg length showed that 26% of the respondents were satisfied with both height and side length dimensions, 23% with height and inside-leg length dimensions, and 30% with side length and inside-leg length dimensions(Tables 5–7); 20% found all three dimensions satisfactory (Table 8).

Salo-Mattila: Prospects for the fit of ready-to-wear clothing IJHE Vol 6 No 1 2013
116
Table 5 Height by side length evaluation
Side LengthTotal
-2 -1 0 1 2
Height
-2 6 3 0 0 0 9
-1 2 15 7 0 0 24
0 1 5 42 12 3 63
1 0 1 12 32 9 54
2 0 0 1 3 8 12
Total 9 24 62 47 20 162
Table 6 Height by inside-leg length evaluation
Inside Leg LengthTotal
-2 -1 0 1 2
Height
-2 5 2 2 0 0 9
-1 4 9 11 0 0 24
0 1 7 38 14 3 63
1 0 4 18 24 8 54
2 0 3 3 2 4 12
Total 10 25 72 40 15 162
Table 7 Side length by inside-leg length evaluation
Inside Leg LengthTotal
-2 -1 0 1 2
Side
-2 8 0 1 0 0 9
-1 2 14 7 1 0 24
0 0 7 48 7 0 62
1 0 2 11 32 2 47
2 0 2 5 0 13 20
Total 10 25 72 40 15 162
Unlike in the case of bust, waist, and hip, the annual breakdown of satisfaction for height, side length, and inside-leg length did not show any particular trend during the survey period (Table 8).

Salo-Mattila: Prospects for the fit of ready-to-wear clothing IJHE Vol 6 No 1 2013
117
Table 8 Annual breakdown of satisfaction with height, side length, and inside-leg
length
Satisfaction with
Year height and side length
measurements
height and inside leg length
measurements
side length and inside leg length measurements
height, side length, and inside leg length
measurements
2004 (n=28) 18% 18% 21% 18%
2005 (n=31) 29% 26% 29% 23%
2006 (n=30) 17% 10% 20% 10%
2007 (n=17) 29% 29% 53% 29%
2008 (n=17) 47% 29% 41% 29%
2009 (n=20) 30% 40% 35% 25%
2010 (n=19) 21% 21% 21% 16%
Total (n=162) 26% 23% 30% 20%
Satisfaction with the combination of dimensions
The above results show that satisfaction with the combination of garment bust, waist, and hip dimensions was 10%, and satisfaction with the combination of height, side length, and inside-leg length dimensions 20%. Only 5% of the respondents were satisfied with all six dimensions.
However, if all dimensions are taken into account, and answers from "to an extent too small" (-1) to "to an extent too large" (+1) are counted, 50% of the respondents experienced ready-to-wear garments offering a fit that could be described as "approximate" or better. In other words, 50% of the respondents were satisfied with the garments they had purchased.
Discussion of survey results
Satisfaction with ready-to-wear garment dimensions
As a whole, 95% of the respondents were dissatisfied with the dimensions of ready-to-wear garments. However, 50% of the respondents in the present survey had experienced at least an "approximate" fit. That is still substantially below the level of satisfaction revealed by Pisut and Connell (2007) and Kinley (2010). Their results indicated that around 80% of women were satisfied with ready-to-wear clothing (Pisut & Connell, 2007) or its fit (Kinley, 2010). The informants in the present survey were knowledgeable about body measurements and dimensions of garments. Consequently, they may have been more critical in the assessment of fit than the population in general or respondents in the cited studies.
Salo-Mattila: Prospects for the fit of ready-to-wear clothing IJHE Vol 6 No 1 2013
118
The results of the survey reveal a general lack of correlation in dimensional fit experience, which suggests that a steep increase in the number of available sizes or improved fit through mass customisation would be necessary to secure even an "approximate" fit for a customer. The former way is probably not feasible economically, while the latter is facing serious technical problems as indicated by the review of literature in the foregoing.
Influence of fashion on survey results
During the early years of the survey period, a close fit was in fashion, and there was a subsequent shift toward a more relaxed fit. The observed gradual shift away from the smallest sizes during the first four years of the survey, and the increase in satisfaction with bust, waist, and hip toward the end of the survey, suggest that the fit experience of the respondents was influenced by changes in fashion. The answers to the open question of fit preferences support the interpretation. It is intuitive that pursuing a close fit would lead to complaints about fit, but the issue has not been discussed in literature.
However, changes in fashion were not systematically observed in the present survey. In addition, influence of body image and body cathexis on the assessment of fit was not controlled. This may have resulted in some misinterpretation as to the effects of fashion. Several studies have established a connection between body satisfaction and fit preferences or concerns with fit and size of garments (Anderson et al., 2001; Alexander et al., 2005; Chattaram & Rudd, 2006; Pisut & Connell, 2007; Kim & Damhorst, 2010). However, one study found that fit preferences did not affect satisfaction with the fit of ready-to-wear clothing (Kinley, 2010).
Conclusion
On the basis of the survey results, an improvement in the fit of ready-to-wear clothing seems to be possible only through the development of mass customisation. After some 20 years of work, it still seems to be in a laboratory stage, even for the realisation of an "approximate" fit. The theoretical considerations of the relationship between fashion and fit show that fit satisfaction would require a custom fit. In mass customisation, it should be realised without a try-on. The problem remains to be solved even theoretically. For consumer satisfaction, the ability to make alterations on ready-to-wear garments seems necessary for the next 10 years or so.
As discussed in the introduction, trends of sustainable development do not appear to change the importance of fit as perceived by consumers. A scenario proposed by Bras-Klapwijk and Knot (2001) for sustainable households in 2050 was based on made-to-measure clothing designed to be used for 10 years. The question is how consumer behaviour could be changed in that direction.

Salo-Mattila: Prospects for the fit of ready-to-wear clothing IJHE Vol 6 No 1 2013
119
Biography
Kirsti Salo-Mattila is Senior Lecturer and Adjunct Professor in Craft Studies at University of Helsinki. In 2007-2009, she was head of department for Home Economics and Craft Science. She earned her PhD in art history from University of Helsinki. Her background also includes a degree in teaching clothing and textiles and a professional degree in pattern design. She is responsible for research and doctoral studies in the field of textile culture. Her personal research interests focus on the relationship between art and craft, and on the structural design of garments. She has published extensively in both areas.
References
Aldrich, W. (2007). History of sizing systems and ready-to-wear garments. In S. P. Ashdown (Ed.), Sizing in clothing. Developing effective sizing systems for ready-to-wear clothing (pp. 1–56). Cambridge: Woodhead.
Alexander, M., Connell, L. J., & Presley, A. B. (2005). Clothing fit preferences of young female adult consumers. International Journal of Clothing Science and Technology,17(1), 52–64.
Anderson, L. J., Brannon, E. L., Ulrich, P. V., Presley, A. B., Woronka, D., Grasso, M., & Stevenson, D. (2001). Understanding fitting preferences of female consumers: Development [of] an expert system to enhance accurate sizing selection (National Textile Center Annual Report I98-A08). Retrieved from http://www.ntcresearch.org/pdf-rpts/anrp01/I98-A08-A1.pdf/
Ashdown, S. P., & Dunne, L. (2006). A study of automated custom fit: Readiness of the technology for the apparel industry. Clothing and Textiles Research Journal, 24(2), 121–136.
Ashdown, S. P., & O'Connel, E. K. (2006). Comparison of test protocols for judging the fit of mature women's apparel. Clothing and Textiles Research Journal, 24(2), 137–146.
Barthes, R. (1983). The fashion system. New York: Hill and Wang. Originally published as Système de la Mode in 1967
Bras-Klapwijk, R. M., & Knot, J. M. C. (2001) Strategic environmental assessment for sustainable households in 2050. Illustrated for clothing. Sustainable Development, 9,109–118.
Chattaraman, V., & Rudd, N. A. (2006). Preferences for aesthetic attributes in clothing as a function of body image, body cathexis and body size. Clothing and Textiles Research Journal, 24(1), 46–61.
Connell, L. J., Ulrich, P. V., Brannon, M. A., Alexander, M., & Presley, A. B. (2006). Body shape assessment scale: Instrument development for analyzing female figures. Clothing and Textiles Research Journal, 24(2), 80–95.
Delong, M., Ashdown, S., Butterfield, L., & Turnbladh, K. F. (1993). Data specification needed for apparel production using computers. Clothing and Textiles Research Journal,11(3), 1–7.

Salo-Mattila: Prospects for the fit of ready-to-wear clothing IJHE Vol 6 No 1 2013
120
Finatex. (2010). Statistics. Retrieved from http://www.finatex.fi/
Finnish National Board of Education. (2009). National core curriculum for basic education 2004. Helsinki. Retrieved fromwww.oph.fi/english/sources_of_information/publications/
Hsu, H-J., & Burns, L. D. (2002). Clothing evaluative criteria. A cross-national comparison of Taiwanese and United States Consumers. Clothing and Textiles Research Journal,20(4), 246–252.
Kawabata, H., & Rabolt, N. J. (1999). Comparison of clothing purchase behaviour between US and Japanese female university students. Journal of Consumer Studies and Home Economics, 23(4), 213–223.
Kim, H., & Damhorst, M. L. (2010). The relationship of body-related self-discrepancy to body dissatisfaction, apparel involvement, concerns with fit and size of garments, and purchase intentions in online apparel shopping. Clothing and Textiles Research Journal, 28(4), 239–254.
Kim, J-H., & Lennon, S. J. (2007). Mass media and self-esteem, body image, and eating disorder tendencies. Clothing and Textiles Research Journal, 25(1), 3–23.
Kinley, T. R. (2010). Fit and shopping preferences by clothing benefits sought. Journal of Fashion Marketing and Management, 14(3), 397–411.
LaBat, K. (2007). Sizing standardization. In S. P. Ashdown (Ed.), Sizing in clothing. Developing effective sizing systems for ready-to-wear clothing (pp. 88–107). Cambridge: Woodhead.
Loker, S. (2007). Mass customization and sizing. In S. P. Ashdown (Ed.), Sizing in clothing. Developing effective sizing systems for ready-to-wear clothing (pp. 246–263). Cambridge: Woodhead.
Loker, S., Ashdown, S., & Schoenfelder, K. (2005). Size-specific analysis of body scan data to improve apparel fit. Journal of Textile and Apparel Technology and Management,4(3). Retrieved from http://www.tx.ncsu.edu/jtatm/
Melkas, A., Raitio-Nyholm, S., & Räsänen, M-L. (1985). Naisten pukimien peruskaavat (Basic patterns for women's clothing). Pohjoismainen kaavajärjestelmä (Nordic pattern system). Vatevan mitoitusjärjestelmä (Sizing system by Vateva). Helsinki: Ammattikasvatushallitus.
Niinimäki, K. (2010). Eco-clothing, consumer identity and ideology. Sustainable Development,18, 150–162.
Perthuis, K. de. (2005). The synthetic ideal: The fashion model and photographic manipulation. Fashion Theory, 9(4), 407–424.
Petrova, A., & Ashdown, S. P. (2008). Three-dimensional body scan data analysis. Body size and shape dependence of ease values for pants’ fit. Clothing and Textiles Research Journal, 26(3), 227–252.
Pisut, G., & Connell, L. J. (2007). Fit preferences of female consumers in the USA. Journal of Fashion Marketing and Management, 11(3), 366–379.

Salo-Mattila: Prospects for the fit of ready-to-wear clothing IJHE Vol 6 No 1 2013
121
Salo-Mattila, K. (2007). Body image in clothing classes. In J. Lavonen (Ed.), Tutkimusperustainen opettajankoulutus ja kestävä kehitys. Osa 1 (pp. 264–272). Helsinki: University of Helsinki, Faculty of Behavioural Sciences.
Salo-Mattila, K. (2009). Ruumiin ja muodin välissä. Tutkimus vaatteen kaavoituksen kehityksestä (Between body and fashion. A study on the development of pattern drafting). Helsinki: University of Helsinki, Department of Home Economics and Craft Science.
Simmons, K., Istook, C. L., & Devarajan, P. (2004a). Female figure identification technique (FFIT) for apparel. Part I: Describing female shapes. Journal of Textile and Apparel, Technology and Management, 4(1). Retrieved from http://www.tx.ncsu.edu/jtatm/
Simmons, K., Istook, C. L., & Devarajan, P. (2004b). Female figure identification technique (FFIT) for apparel. Part II: Development of shape sorting software. Journal of Textile and Apparel, Technology and Management, 4(1). Retrieved from http://www.tx.ncsu.edu/jtatm/
Tekstiililehti. (2000). Publication by the Finnish Association of Textile Technology. 1/2000. Helsinki.
Tekstiili- ja vaatetusteollisuus (Finatex). (2001). Naisten vaatetuksen mittataulukko N-2001(Sizing system for women's clothing N-2001). Helsinki.
Turner, S. L., & Hamilton, H. (1997). The influence of fashion magazines on the body image satisfaction of college women. An exploratory analysis. Adolescence, 32(127), 603–614.
Vaatetusteollisuuden Keskusliitto (Vateva). (1980). Passeli – mitat muodon mukaan (Passeli –measurements according to shape). Helsinki.
Voellinger Griffey, J., & Ashdown, S. P. (2006). Development of an automated process for the creation fo a basic skirt block pattern from 3D body scan data. Clothing and Textiles Research Journal, 24(2), 112–120.

International Journal of Home Economics
122
The impact of cooperative societies on the socioeconomic status of the Obafemi Awolowo University Staff
Kolawole Soyebo
Obafemi Awolowo University, Ile-Ife, Nigeria.
Abstract
University staff formed cooperative groups by pooling their resources with the goal of improving their living standard. This research investigated the impact of membership of a cooperative society on the socioeconomic status of workers of the Obafemi Awolowo University (OAU), Ile – Ife, Nigeria. Specifically, the study examined years and level of participation of members; and investigated the savings and multiple of savings taken as loans. A questionnaire was administered to 56 members randomly selected from each of five registered cooperative societies in the institution. The findings show that 55.7% of the respondents had spent over 20 years in service, 72.9% participated as cooperative members for up to 20 years, almost 48% were ordinary members, and 69.6% earned up to N20,000 monthly. About 68% saved up to N10,000 monthly, 70% saved for a period of 12 months before taking a loan, 82.1% received three times their asset as loan and 53.6% repaid the loan taken within 18months. The range of possessions of members significantly increased (F = 13.648) after joining cooperative societies. This study points to the benefits of participation in cooperative societies in order to maintain and enhance socioeconomic status.
Keywords: Socioeconomic status, credit facilities, cooperative societies, loans, salaried workers
Introduction
A cooperative in its simplest sense is formed when individuals organise together around a common, usually economic, goal. For business purposes, a cooperative refers to the creation of a nonprofit enterprise for the benefit of those individuals using its services (Encyclopedia of Business, 2011). Epetimehin (2006) also described cooperatives as a business owned and controlled by the people who use its service. Some empirical evidences has shown that in most developing economies, savings and credit cooperatives have brought millions of citizens into cohesive financial institutions which are succeeding very well in providing financial services to its members and as a result improving their standard of living (Chirwa, 1997).
A cooperative society is an organisation or group of people with collective responsibilities and thoughts for the development of the needy, especially the under privileged (Dubey et al.,2009). Cooperatives have inherent advantages in alleviating poverty, tackling problems with food security, and generating employment. It is considered to have immense potential to deliver goods and services in areas where both the public and the private sector have failed (Verma, 2004). Economic benefits are distributed proportionally according to each member's level of participation in the cooperative, for instance by a dividend on sales or purchases,

Soyebo: Cooperative loans IJHE Vol 6 No 1 2013
123
rather than divided according to capital invested. Usually, the cooperative goals are economic in nature, but may also be educational and social. So, members of cooperative society perform better in terms of gross margin than individuals who are non-members (Adetunji, 2002). Dubey et al. (2009) affirmed that credit is a very powerful instrument for the empowerment of resource-poor people. It can generate “accelerated economic growth” when loans are easily available, properly utilised and repaid in time. Similarly, Asaolu (2004) argued that cooperative societies are potentially an important instrument of social transformation, especially in rural areas. Olesin (2007) opined that a well-run cooperative society provides a pool of funds from which individual members take loans to meet respective needs. Over the years, succeeding Nigerian civil servants have agitated for increases in the level of pay almost on a yearly basis, to better the lot of their immediate family members. This has been an illusion since the resultant effect of the increment has always been escalation in the prices of goods and services. Consequently, this increase in price often reduces the purchasing power of individuals and the family. This situation has also made it extremely difficult for most workers to save part of their regular income for unexpected contingencies. In a bid to make life meaningful and realise both the instrumental and long–term goals of the family, these workers organise themselves into groups called cooperative societies. There are five registered cooperative societies that serve the interest of staff members. These include Obafemi Awolowo University Credit Thrift and Cooperative Society (CTCS), Obafemi Awolowo University Progressives Cooperative Investments and Credit Society (PCICS), Ifeloju Cooperative and Credit Society (Ifeloju), Awovarsity Credit Thrift and Cooperative Society (Awovarsity), and Ife Trust Cooperative Investments and Credit Society (Trust). Both academic and non-academic staff members belonged to all the cooperative societies with the exception of Awovarsity, which is open only to academic staff. However, the mode of operation of the societies was virtually the same. Hence, this study seeks to determine the impact of cooperative societies on the socio-economic status of the OAU workers.
Objectives of the study
The main objective of the study was to determine the impact of cooperative society on the socioeconomic status of OAU workers. The specific objectives were to
i. examine years and level of participation of members;
ii. investigate the savings and multiple of savings taken/granted as loans; and
iii. determine what members gained through cooperative societies.
Hypothesis:
The hypothesis for the study was that there is no significant difference between the socioeconomic status of the respondents before and after joining cooperative society.

Soyebo: Cooperative loans IJHE Vol 6 No 1 2013
124
Methodology
This research work was conducted at the Obafemi Awolowo University (OAU), Ile—Ife, Osun State, Nigeria. The Obafemi Awolowo University is a comprehensive public institution established in 1962 as The University of Ife. The University is situated on a vast expanse of land totaling 11,861 hectares in Ile-Ife, Osun State, southwest of Nigeria. The University comprises the central campus, the students’ residential area, the staff quarters and a Teaching and Research Farm. The central campus comprises the academic, administrativeunits and service centres, and the students’ residential area is made up of eightundergraduate hostels and a postgraduate hall of residence. Enrolment is about 25,000 for both undergraduates and graduate students, and the staff strength is approximately 5,000. There are two major kinds of workers in the school which are the academic and non-academic staff.
Workers who are members of cooperative societies were targeted for the study. A simple random technique was utilised to select 56 members from each society using membership lists. A questionnaire was used to collect information from 280 respondents consisting of all categories of workers. Data collected were summarised by the use of frequency count, means, percentages and charts. The hypothesis was tested using Analysis of Variance (ANOVA).
Results and discussion
Years in service
Data in Table 1 show that 20.7% of the respondents had spent less than 10 years in service, 23.6% had spent 10-19 years in service, 20.7% had spent 20–29 years in service, and 35% had spent 30 or more years in service. The findings show that 55.7% of the respondents had spent over 20 years in service. This is the group of workers that is close to retirement, hence, are expected to put so many assets of convenience in place against their retirement years through cooperative efforts.
Table 1 Distribution of the respondents by years in service. N = 280
Years in service Frequency Percent
Less than 10 58 20.7
10 – 19 66 23.6
20 – 29 58 20.7
30 and above 98 35.0

Soyebo: Cooperative loans IJHE Vol 6 No 1 2013
125
Years and level of participation in cooperative societies
Data in Table 2 show that 49.3% of the respondents had spent 1-10 years as members of cooperative societies, 23.6% had spent 11-20 years as members, 7.1% had spent 21-30 years as members, and 20.0% had spent 31 or more years as members. This indicates that 80% of the respondents had spent up to 30 years as members of cooperative societies. Furthermore, 47.9% of the respondents were ordinary members, 37.9% were committee members, and 35.7% were officers of cooperative societies. This shows that about one third of the respondents were officers in their respective cooperative societies. This is possible because of dual membership of some members in at most two cooperative societies.
Table 2 Distribution of respondents by years and level of participation in cooperative
societies. N = 280
Years of participation Frequency Percent
1 – 10 138 49.3
11 – 20 66 23.6
21 – 30 20 7.1
31 and above 56 20.0
*Level of participation
Members 134 47.9
Committee members 106 37.9
Officers 100 35.7
*Multiple responses
Income and savings
Data in Table 3 show that about 31% of respondents earned up to N 100,000 monthly, 38.6%earned between N100,001 and N200,000 per month, almost 17.9% earned between N200,001 and N300,000 monthly, and 12.9% earned N300,001 and above monthly. The findings show that nearly 70% earned income less than or equal to N200,000 per month; thus, the majority earned less than $1,315 USA monthly. These are a group of people whose monthly income might not be sufficient to meet their daily living expenses.
Furthermore, Table 3 indicates that about 23% saved up to N5,000 monthly, almost 38% saved between N6,000 and N10,000 per month, 19.3% saved between N11,000 and N15,000 monthly, 11.4% saved between N16,000 and N20,000 every month, and 8.6% saved N21,000 and above per month. It can be inferred from this finding that nearly 61% of the respondents can afford to save up to N10,000 per month from their income. Monthly savings by the majority was approximately $66 USA. This accrues to a reasonable amount of money per year, which will enable them access assets substantial enough to embark on capital project/investment.

Soyebo: Cooperative loans IJHE Vol 6 No 1 2013
126
Table 3 Distribution of the respondents according to their income and savings per
month. N = 280
Income N Frequency Percent
Less than 100,000 86 30.7
100,001 – 200,000 108 38.6
200,001 – 300,000 50 17.9
300,001and above 36 12.9
Savings (N)
Up to 5,000 64 22.9
6,000 – 10,000 106 37.9
11,000 – 15,000 54 19.3
16,000 – 20,000 32 11.4
21,000 and above 24 8.6
Note: $1 equals 152
Savings period
Table 4 indicates the data that reveals 40.7% of the respondents saved for up to 6 months, 29.3% saved up to 12 months, 10% saved for 24 months, while 4.3% saved for more than 24 months before applying for loan. This implies that 70% of the respondents requested a loan very early, having saved for 12 months. About 44% saved beyond the minimum period before applying; perhaps for them to qualify or request the amount substantial enough to pursue their set goal. The minimum saving period to qualify for a loan is usually 6 months. This period also varies from one society to another. However, there could be waivers for exceptional cases, particularly for unforeseen contingencies.
Multiples of shares and savings
Table 4 further shows that 16.5% of the respondents received double of their shares and savings, 82.1% received times three of their asset worth, while only 1.4% received times four of their shares and savings as loans. Conventionally, at inceptions cooperative societies give out two times the member’s asset as loans on request by individual members. As the resource base as well as membership increases, it is possible that three times or four times the member’s asset may be granted as a loan. In the study area, PCICS, CTCS and Ifeloju give out three times individuals’ assets, Trust grants two times assets because it is growing, while Awovarsity grants four or more times depending on the repayment ability of the loanee.
Loan application
Data in Table 4 shows that most (84.3%) respondents had applied for a loan at one time, and 15.7% of the respondents had never applied for a loan. This is an indication that the majority of respondents had benefitted from cooperative societies loans. As an alternative to commercial banks, cooperative societies provide loans to members for varied purposes. This is in line with the assertion of Ahuja, Kawadia, Gwal, and Shrivastava (2008) that the cooperative societies are equally important institutional agencies for providing credit support for agricultural and rural development. Oke, Adeyemo, and Agbonlahor (2007) also affirmed
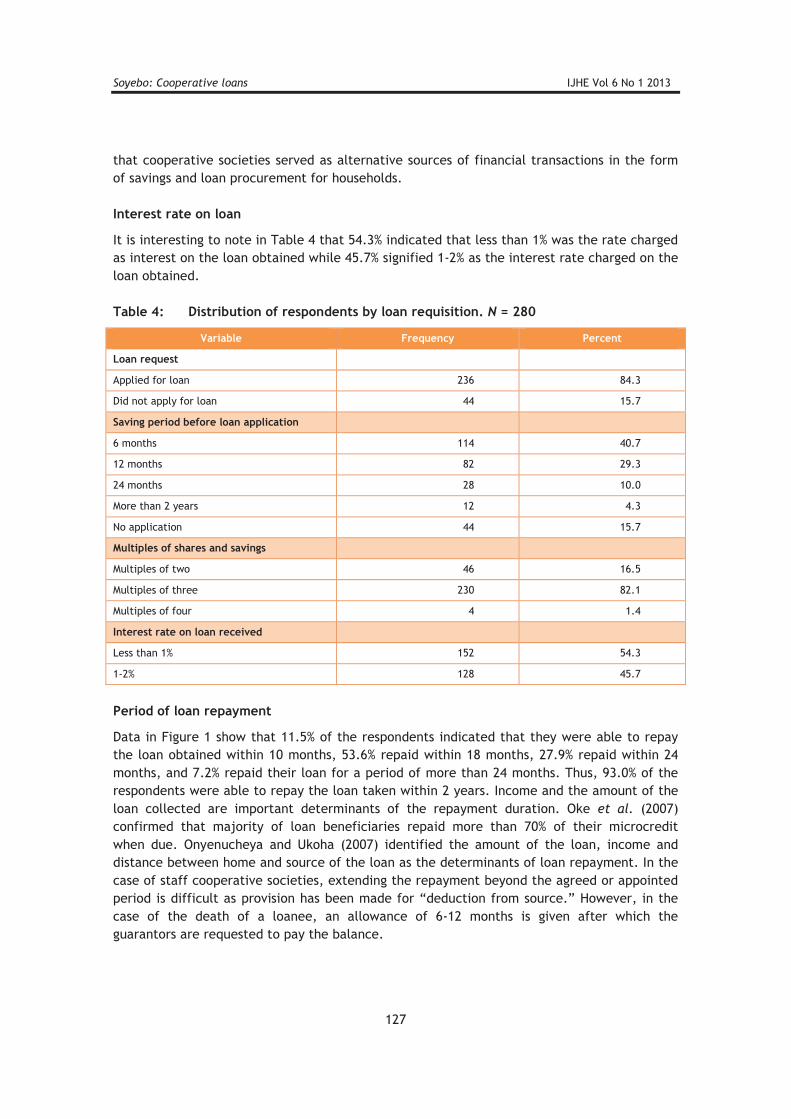
Soyebo: Cooperative loans IJHE Vol 6 No 1 2013
127
that cooperative societies served as alternative sources of financial transactions in the form of savings and loan procurement for households.
Interest rate on loan
It is interesting to note in Table 4 that 54.3% indicated that less than 1% was the rate charged as interest on the loan obtained while 45.7% signified 1-2% as the interest rate charged on theloan obtained.
Table 4: Distribution of respondents by loan requisition. N = 280
Variable Frequency Percent
Loan request
Applied for loan 236 84.3
Did not apply for loan 44 15.7
Saving period before loan application
6 months 114 40.7
12 months 82 29.3
24 months 28 10.0
More than 2 years 12 4.3
No application 44 15.7
Multiples of shares and savings
Multiples of two 46 16.5
Multiples of three 230 82.1
Multiples of four 4 1.4
Interest rate on loan received
Less than 1% 152 54.3
1-2% 128 45.7
Period of loan repayment
Data in Figure 1 show that 11.5% of the respondents indicated that they were able to repay the loan obtained within 10 months, 53.6% repaid within 18 months, 27.9% repaid within 24 months, and 7.2% repaid their loan for a period of more than 24 months. Thus, 93.0% of the respondents were able to repay the loan taken within 2 years. Income and the amount of the loan collected are important determinants of the repayment duration. Oke et al. (2007) confirmed that majority of loan beneficiaries repaid more than 70% of their microcredit when due. Onyenucheya and Ukoha (2007) identified the amount of the loan, income and distance between home and source of the loan as the determinants of loan repayment. In the case of staff cooperative societies, extending the repayment beyond the agreed or appointed period is difficult as provision has been made for “deduction from source.” However, in the case of the death of a loanee, an allowance of 6-12 months is given after which the guarantors are requested to pay the balance.

Soyebo: Cooperative loans IJHE Vol 6 No 1 2013
128
Figure 1 Pie chart showing respondents by period of loan repayment.
Request for and reason for needing an emergency loan
Data in Table 5 also show that 57.8% of respondents requested an emergency loan while 42.1% did not. This majority had requested an emergency loan to meet an unexpected obligation. Table 5 further reveals that respondents requested emergency loans for the payment of children’s school fees (32.1%), to settle hospital bills (2.1%), naming and burial ceremonies (2.1% each), wedding ceremonies (2.9%), and the completion of an ongoing project (8.6%). This implies that cooperative societies were able to respond to the unexpected financial needs of members.
Table 5 Distribution of respondents by request for emergency loan. N = 280
Request for emergency loan f %
Yes 162 57.9
No 118 42.1
Need for emergency loan
Payment of children school fee 90 32.1
Hospitalisation 6 2.1
Wedding ceremony 8 2.9
Naming ceremony 6 2.1
Burial ceremony 6 2.1
Ongoing project 46 16.4
Did not take emergency loan 118 42.1
16%
10%
53%
15%
6%
No loan
10 months
18 months
24 months
Above 24 months

Soyebo: Cooperative loans IJHE Vol 6 No 1 2013
129
Possessions before and after
Data in Table 6 shows that possessions of most respondents increased after joining cooperative societies.
Table 6 Distribution of the respondents according to the possessions acquired before
and after joining cooperative societies. N = 280
Possession Before After Percent increase
Frequency Percent Frequency Percent
Personal building 54 19.3 170 60.7 41.4
Cars 90 32.1 210 75 42.9
Executive furniture 130 46.4 166 59.3 12.9
Plasma television 142 50.7 186 66.4 15.7
Home theatre 152 45.7 176 62.9 17.2
Washing machine 20 7.1 68 24.3 17.2
Ceiling fan 124 44.3 272 97.1 52.8
Jewelries 30 10.7 240 85.7 75.0
Personal business 20 7.1 66 23.6 16.5
Refrigerator 114 40.7 228 81.4 40.7
Generator 104 37.1 162 57.6 20.5
Motorcycle 20 7.1 88 31.4 24.3
Deep freezer 30 10.7 112 40 29.3
Desktop computer 42 15 124 44.3 28.7
Laptop 90 32.1 142 50.7 18.6
7” x 6” Mattresses 136 48.6 240 85.7 37.1
Air conditioner 18 6.4 76 27.1 20.7
Water dispenser 18 6.4 72 25.7 19.3
Microwave oven 28 10 84 30 20.0
Blender 48 17.1 146 52.1 35.0
Land 14 5.0 166 59.3 54.3
*Multiple responses
The data show that possessions such as cars, personal buildings, ceiling fans, jewelry,refrigerators and land increased by 40% and more after joining cooperative societies. This confirms that cooperative societies have improved the socioeconomic status of the respondents. This finding is supported by the outcome of the studies of Zeller, Schrieder, Von Brown, and Heidhues (1997) and Oyeyinka (2002), who found that improved access to credit enables households to invest in farm assets and therefore increase income levels of beneficiaries. Further, Olesin (2007) described the idea of cooperation to be taking loansfrom pooled resources of members to buy households items, vehicles, land, or houses or do business; and also affirmed that cooperative societies have contributed to wealth creation and poverty reduction.

Soyebo: Cooperative loans IJHE Vol 6 No 1 2013
130
Revisiting the Hypothesis
The hypothesis of this study was that there is no significant difference between the socioeconomic status of the respondents before and after joining cooperative society.
Data in Table 7 shows that there was a significant difference between the socioeconomic status of the respondents before and after joining a cooperative society (F-0.05). Specifically, the socioeconomic status of the respondents after (mean = 4.6643) joining cooperative societies was significantly greater than before (mean = 3.1929) joining cooperative societies. This suggests that after joining cooperative societies the possessions of the respondents were increased compared to their possessions before joining cooperative societies.
Table 7 ANOVA result showing the difference between the socioeconomic status of
respondents before and after joining cooperative society.
Sum of squares df Mean square F Sig
Between groups 36.722 3 12.241 13.648 0.00
Within groups 247.549 276 0.897
Total 284.271 279
Conclusion and recommendations
This study revealed that typical Obafemi Awolowo University staff were ordinary members of cooperative societies for 20 years. They typically saved up to N10,000 ($66 USA) monthly for almost 12 months before typically taking a multiple of three of their assets as loans. The loans were typically repaid within a period of 18 months. The possessions of cooperative members reportedly increased after joining cooperative societies. Therefore, this study reveals that the cooperative loans provided the capacity for greater purchase of possessions and dealing with unexpected contingencies for O.A.U. workers. In order to draw comprehensive conclusions about the overall benefits of membership, a comparative study of those in similar circumstances, but who have not been members of cooperatives, should be undertaken to complement this study.
Biography
Dr. Kolawole Olamijulo Soyebo is a Senior Lecturer and Head of the Department of Family, Nutrition and Consumer Sciences, Obafemi Awolowo University, Ile –Ife. Nigeria. He is a member of International Federation of Home Economics and currently, the Secretary General of Family and Consumer Science Society of Nigeria. Dr Soyebo specialised in Family Resource Management.

Soyebo: Cooperative loans IJHE Vol 6 No 1 2013
131
References
Adetunji, S. O. (2002). Roles of cooperative saving and credit societies in mobilizing local savings for rural development. A Paper Presented at a two-day workshop for cooperative leaders by Federal Office of Statistic Cooperative Ltd. Oshogbo.
Ahuja, K., Kawadia, G., Gwal, A., & Shrivastava, A. Credit Disbursement by Primary Agricultural Credit Societies in Madhya Pradesh: An Inter-District Analysis. Vol. 13 January-June 2008 No., 61.
Asaolu, T. (2004). Evaluation of the performance of the Cooperative Investment and Credit Societies (CICS) in financing Small-Scale Enterprises (SSEs) in Osun State. Central Bank.
Chirwa, E. W. (1997). An econometric analysis of the determinants of agricultural credit repayment in Malawi. African Review of Money Finance and Banking, 107-122.
Dubey, A., Singh, A., Singh, R., Singh, L., Pathak, M., & Dubey, V. (2009). Cooperative Societies for Sustaining Rural Livelihood: A Case Study. Indian Res. J. Ext. Edu, 9(1).
Epetimehin, F. (2006). Understanding the Dynamics of Cooperatives: Tadon Publishers, Ibadan.
Oke, J., Adeyemo, R., & Agbonlahor, M. (2007). An empirical analysis of microcredit repayment in SouthWestern Nigeria. Journal of Human Behavior in the Social Environment, 16(4), 37-55.
Olesin, A. (2007, 18 February 2007). Making cooperative societies work for you, Sunday Punch Newspaper p. 7.
Onyenucheya, F., & Ukoha, O. (2007). Loan repayment and credit worthiness of farmers under the Nigerian Agricultural Cooperative and Rural Development Bank (NACRDB). Agricultural Journal, 2(2), 265-270.
Oyeyinka, R. (2002). Impact of Nigeria Agricultural and Cooperative Bank Small Holder Direct Loan Scheme on Farmers in Oyo State, Nigeria. D Dept. of Agric Extension Univeristy of Ibadan, 208.
Unknown. (2011). Cooperatives Encyclopedia of Business (2nd ed.).
Verma, S. K. (2004). Cooperative Centenary in India. New Sector Magazine(61).
Zeller, M., Schrieder, G., von Braun, J., & Heidhues, F. (1997). Rural finance for food security for the poor: International Food Policy Research Institute (IFPRI).

International Journal of Home Economics
132
To what extent does compulsory schooling prepare professional cooks for later career transition?
Cam Woolcock
Marian College
A chef-trainer observed “They can’t write very well, so they’re drawn to being creative in cooking.”
Based on personal observations both as a cookery student and as a chef-trainer there are two main learning environments for a Hospitality student. The traditional classroom will generally have chairs, tables, computers, and maybe a digital projector. Traditional classrooms are quiet when you walk in, often climate controlled and physical output is minimal. Permission is required to make noise and fidgeting is frowned upon. Differences stand out. Sensory input is restricted to sight and sound. Educators talk, students listen and take notes (or don’t). Some respondents had unpleasant memories of compulsory schooling and this type of classroom, both of which rely heavily on text-based assessment (Burns, 2002; Teese & Polesel, 2003). This, often prefaced with a negative expletive, is described as a “theory” class. One block student stated that “I hate the theory of the course; I’d rather be down there cooking every day.” By contrast, in a kitchen classroom, all the senses are confronted: the noise of extraction fans and ovens, emanating heat, the smells of sweat and food, palpable anxiety and pressure. This sensory overload means that personal nuances of lisps, tattoos, and body odour are absorbed into the melange and ignored. This is the comfort zone of many cooks: the political correctness and formality of school in the physical familiarity of a simulated professional kitchen. It is a location to excel, create, and show off. A place where they can do things that many others cannot: one rural apprentice proudly stated “not everyone can do what we do.” Skills are learnt by observation and doing. Achievement is assessed by what is put on a plate. This is known as “practical,” “prac,” or “kitchen.”
Introduction
Home Economics and Food and Technology will be defined as Home Economics for the purposes of this paper.
This study is an exploration of unexpected data from a Master of Education thesis which focused on how well Certificate III in Hospitality (Commercial Cookery) prepared students for further education (Woolcock, 2009). One strand of this research was the series of questions I asked apprentice cooks about their experiences of compulsory schooling: “how well have your studies to date prepared you for other education?” (Woolcock, 2009, p. 104). This was intended to specifically delve into the respondents’ experiences at TAFE, but instead they used it as a catalyst to discuss their experience of high school. Clearly, they wanted to voice their opinion about what had happened earlier in their education, rather than discuss what might happen when they left professional kitchens. These discussions motivated this paper.

Woolcock: Compulsory schooling preparation for professional cooks IJHE Vol 6 No 1 2013
133
The main focus of my thesis was studying how cooks fared post-cooking. Although some authors believe that cooks should ideally plan their vocational and educational careers (Brefere, Drummond, & Barnes, 2006), Fine (1996, p. 53) observes that mentoring relationships in kitchens are “serendipitous: a chance encounter that makes a life.” A cooking career depends on random or passive opportunities. This trend continues beyond career cooking. Past colleagues have followed seemingly unlikely transitions from sous chef to bricklayer’s labourer, from executive chef to fishmonger, or from pastry chef to university student. The respondents in my research seemed to want to add that, for many cooks, this habit of passiveness was, partially, a result of their compulsory schooling experience. Many cooks began as kitchen-hands and their transition into professional cookery was also often passively unplanned.
School failure is common amongst kitchen workers who often carry this “non-learner” stigma throughout their lives. They are often early school leavers and have a preference for the hands-on, on-the-job learning provided in professional kitchens. They sometimes become cooks.
Cooks are predominately young, male, and from lower socioeconomic status (SES) backgrounds. They desire the positive self-image and informal learning available from professional kitchen work. However, they enter a world where low profit margins encourage low pay and long, anti-social hours that lead to poor work/life balance and, potentially, burn out. On the other side, their TAFE (trade school) experience is narrowly focused, does not encourage critical thinking, is partly based in a traditional classroom, and is reminiscent of their experience of compulsory schooling.
Literature review
Introduction
Most cooks are young, male and from lower socio-economic (SES) backgrounds. Many are early school leavers with a preference for the hands-on, on-the-job learning provided in professional kitchens. This informal learning provides the positive self-image these cooks seek. The low profit margins in restaurants increase kitchen stressors which include low pay and long, anti-social hours leading to poor work/life balance and, potentially, burn out for cooks. The TAFE learning required of trade certification is narrowly focused, does not encourage critical thinking, and is partly based in a traditional classroom.
Traditionally a subject for girls to prepare for domestic duties, Home Economics has been reinvented to “learning through food,” a pedagogical change encouraging lifelong learning through critical thinking, Information and Communication Technology (ICT) skills, and deeper knowledge. However, the gendered stigma remains. Vocational Education and Training (VET) Hospitality closely matches the learning preferences of lower-SES males, who counter the perceived “female” role of cleaning by mimicking the hyper-masculine persona of the Celebrity Chef they seek to emulate.

Woolcock: Compulsory schooling preparation for professional cooks IJHE Vol 6 No 1 2013
134
Demographic
“Cooks are young men without much training or education” (Fine, 1996, p. 44). The Australian Government concurs regarding young men, but not the lack of training. While 39%of all Australian workers are between 15 and 34 years, 51% of chefs are in this age bracket and 75% of chefs are male (Australian Government, 2011). The Australian Government (2009) statement that 46% of chefs hold either a Certificate III or IV is slightly misleading: Althoughapproximately 18,000 students are studying Certificate III in Hospitality (Commercial Cookery) in Victoria, fewer than 1,000 are studying Certificate IV (Service Skills, 2009, p. 15).
Globally, the majority of professional cooks come from working-class backgrounds (Pepin, 2003; Pratten, 2003). Many chef-authors were initially attracted to kitchens as they were not connecting with compulsory schooling (Bennett, 2004; Hildred & Ewbank, 2001; Lethlean, 2003; Roche, 2004; White, 1990) and were early school leavers (Bennett, 2004; Hildred & Ewbank, 2001; Roche, 2003; White, 1990).
Cooks are no longer all young working-class males. Trends include significant increases in career changers (Ruhlman, 2006) and minor increases in female participation (Australian Bureau of Statistics, 2008a).
Experience cooking in professional kitchens
Customers in Victoria, Australia are generally not prepared to pay what good food shouldcost. Kitchen staffing, with a societal expectation of long hours and poor conditions (Bourdain, 2001; Orwell, 1933; Parkinson & Green, 2002), is a feasible area to cut costs, but this increases the stressors of kitchen labour through long, anti-social hours and low pay which puts demands on work/life balance and increases the risk of burn out.
Hours/pay
Full-time Australian cooks are paid AUD174 less and work an average of three hours a week more than the average of all occupations (Australian Government, 2011). The placement of these longer hours is atypical to most jobs (Cullen, 2000; Dornenburg & Page, 2003), making a cook’s lifestyle often incompatible with a “normal” family life (Brefere et al., 2006). Most restaurants are small- to medium-sized enterprises (SMEs), the employer group most likely to make demands on their workers’ work/life balance (Smith, Oczkowski, & Smith, 2008).
Burn out
The above stressors make burn out a common theme among chefs (Bourdain, 2001; Dornenburg & Page, 2003; Lethlean, 2003). The inability to cope with mounting pressures can lead to no longer wanting to cook professionally, but, in extreme examples, led to an award-winning chef committing suicide following a negative review (Samuel, 2009) and a Finnish culinary arts student shooting ten classmates (Popham & Green, 2008). Although the vacancy level of chefs is "very high," the unemployment of chefs is "above average" (Australian Government, 2011): There are jobs available, but cooks do not want to fill them (Broad, 2008; Richardson, 2007). This burn out will both motivate and inhibit career change.

Woolcock: Compulsory schooling preparation for professional cooks IJHE Vol 6 No 1 2013
135
Self-image
A cook can exert power in transforming a food product (Hass, 2005); juxtaposing the powerlessness of life before working in kitchens (Roche, 2004). Trainee cook, Erin, sums up the experience of many apprentice cooks, stating, “this is the only thing that I’ve been good at” (quoted in Smart, 2006).
On-the-job training
The opportunity to learn on-the-job creates greater levels of cultural capital which may partly compensate for poor pay (Fine, 1996) and other stressors discussed above. Cooks have a long tradition of learning on-the-job: Professional development was either doing a “stage”(working for nothing but the experience of a top kitchen) or changing jobs to learn (Symons, 1998). Formal educational credit for on-the-job learning is yet to be implemented (Hart & Sweetman, 2009).
TAFE experiences
The current outcomes-focused TAFE model atomises learning into low-level, narrow, specific outcomes (Pardy, 2007). McDermott (2008, p. 6) concurred, adding that Commercial Cookery “training packages do not encourage development of critical thinking skills,” instead requiring compliance (Hegarty, 2004).
Commercial Cookery is assessed through practical learning in a training kitchen and text-based “theory” in a traditional classroom. Paper-based learning is cost-effective and efficient (Print, 1993, p. 168), but a poor match for lower-SES males’ (Teese & Polesel, 2003) and apprentice cooks’ (Cullen, 2000) preferred learning mode. Learning through observation and doing is engaging; paper-based learning risks becoming “remote and dead—abstract and bookish" (Dewey, 1916, p. 9). TAFE, expected to provide hands-on, vocational preparation, instead repeats the negative expository learning experience from compulsory schooling.
Kitchen transition experiences
The transition into kitchens is often passive and not planned (Brefere et al., 2006; Dornenburg & Page, 2003). Many cooks are not so much drawn to cooking, as repelled from alternatives (Guerrier & Adib, 2000). For many cooks the entry point to professional kitchens was as a kitchen hand (Bourdain, 2001; Brefere, et al., 2006; Lefever, 1989; Orwell, 1933). Access via dishwashing occurs through an actual or perceived lack of choices, rather than an attraction to professional cookery.
Food education experiences during compulsory schooling
Compulsory schooling disengagement
For some students, compulsory education not only is unpleasant, but results in a self-image ofoneself as unmotivated or, worse, incapable of learning: “it is a sad reflection on school education that it turns people off education involvement later in life” (Burns, 2002, p. 213). Any later experience of lifelong learning for such people is more likely to be informal (Burns, 2002).

Woolcock: Compulsory schooling preparation for professional cooks IJHE Vol 6 No 1 2013
136
In Undemocratic Schooling (2003), Richard Teese and John Polesel critiqued the inequalities of the Victorian education system. Many cooks come from a lower-SES demographic that does not complete compulsory schooling, and this school failure can create an enduring self-image as incapable of learning. Teese and Polesel (2003, p. 149) observe that “the jobs of early leavers (...) are governed by the model of learning by experience, through immersion in practice.” During compulsory schooling, many males disliked written work and preferred non-text-based learning, showing a clear preference for practical learning in technology subjects. However, Home Economics, arguably the precursor to Hospitality, was unpopular with males,who rated it ninth of 11 preferred learning areas. The male dislike of Home Economics contrasts with the number of professional cooks predominantly being drawn from the lower-SES male demographic (Teese & Polesel, 2003).
Women’s place
The initial role of Home Economics was to prepare women for domestic duties. This served to both preserve (paid) labour market opportunities for men and keep women performing (unpaid) domestic tasks (Renold, 2008). Waring (1988) observed that domestic duties are traditionally not counted in a country’s budget. Unpaid work (meal preparation, kitchen cleaning, household cleaning, and laundry) was added as a question category in the 2006 census (Australian Bureau of Statistics, 2011). Although the gap is closing, in 2006, women spent over triple the amount of time of men doing housework (Australian Bureau of Statistics, 2008b): “Women’s work” largely remains the domain of women.
Girls’ subject: The role of Home Economics
Home Economics has undergone transformation to new content areas as it has struggled to rid itself of the perception of being a “girls’ subject.” In 1983, Home Economics had the "widest gender differential of all subjects with the overwhelming majority being female" (Attar, 1990, cited in Dewhurst & Pendergast 2008). In Queensland, Australia, female to male ratio in Home Economics was approximately 9:1, as compared to 3:1 in VET Hospitality (Queensland Studies Authority, 2007). In Dublin, Ireland, the ratio was 10:1 for Home Economics candidates (O'Donoghue & Mullaney, 2008). One Irish student alluded to the existing gendered nature of Home Economics when noting that “the aprons are too female and degrading” (O'Donoghue & Mullaney, 2008, p. 51). Home Economics continues to be perceived as practical subject for academically weaker girls (Dewhurst & Pendergast, 2008).
Home Economics and Hospitality: Gendered subjects
Although they share a common medium in food, Home Economics and VET Hospitality are different subjects. The Victorian Curriculum and Assessment Authority (2008, p. 12) states that "no significant duplication has been identified between the two VCE VET Hospitality programs and VCE studies (including Home Economics)." Pendergast (2007, p. 9) observes that "principles, practises or—importantly and critically—philosophy (of VET Hospitality and Home Economics…) are poles apart." The assessment of VET Hospitality is more immediate; at an academically lower-level; and is more readily taught through a hands-on method: an attractive mix for a lower-SES male (Teese & Polesel, 2003). In Pendergast (2001, pp. 122-123) the “blokey bloke” referred to in the book’s title stated that female Home Economics

Woolcock: Compulsory schooling preparation for professional cooks IJHE Vol 6 No 1 2013
137
teachers had an image as the “morning tea lady” which he appeared to counter with his own hyper-masculine self-image.
Contemporary Home Economics and lifelong learning
The Home Economics profession is in a phase of reinvention. Rather than just cooking, Home Economics students “have to be able to question modes of acting: individual, social, and societal (and global)" (Benn, 2009, p. 11). Pendergast (2007) advises Home Economists to engender broader skills to promote lifelong learning, including to “use the design process, critical thinking and problem-solving skills” (Victorian Curriculum and Assessment Authority, 2010, p. 7). A further proposal is a three-strand approach to Home Economics: technical action, emancipatory practice, and interpretative practice. This is a departure from the traditional technical action approach. Emancipatory practice promotes reflection of both the self and the wider community. Interpretative practice encourages the ability to adapt to change. These additional practices would allow a cook to seek a better world, including for themselves, and be more prepared for this career change. With these foci, Home Economics has the potential to be an excellent preparatory base for lifelong learning (McGregor, Pendergast, Seniuk, Eghan, & Engberg, 2008).
Media messages: The celebrity chef
The media promotes the message that working-class men, regardless of their school experience, can become bestowed with power, culinary omnipotence, and, potentially, fame,through hard work in kitchens (Pratten, 2003). Although research regarding the gender of celebrity chefs was not found, celebrity chefs were the foci of two articles, in which 12 out of 15 respondents were male (Palmer, Cooper, & Burns, 2007) and not a single female celebrity chef was named (Henderson, 2011). The reality of professional cooking is very different from what is portrayed on television (Dobson, 2003; Dornenburg & Page, 2003; Lethlean, 2003) and very few cooks achieve celebrity (Ruhlman, 2006).
Methodology
The qualitative research sought to describe the factors that affect Certificate III in Hospitality (Commercial Cookery) students’ preparation to later engage with formal education. The research design involved four focus groups with final-year Commercial Cookery students from two Victorian TAFEs and four semi-structured interviews with their predominant chef-trainers. There were 28 respondents, of whom 18 were male and 10 were female (Table 1). Seventeen were from the TAFE located in the greater metropolitan area of Melbourne (Metro) and 11 came from regional Victorian centre (Rural).
Purposeful sampling was used to invite TAFE participation and to select chef-trainers. The latter were selected by availability, access, and direct teacher-leaner relationship with students in the focus groups. They were all qualified cooks with years of experience in professional kitchens, were older than their late 20s, and had re-engaged with formal education to begin study of the minimum teaching qualification of TAFE trainers.
Three of the student groups were in their third year of a traditional apprenticeship-mode study. They attended TAFE one day per week during term, and worked a minimum of four

Woolcock: Compulsory schooling preparation for professional cooks IJHE Vol 6 No 1 2013
138
days a week in a professional kitchen. The Metropolitan-based TAFE offered in two groups of apprentices. The third group consisted of rural apprentices. The fourth group was undertaking one year of full-time block-study and was included to express their uncommon study experience of Certificate III in Hospitality (Commercial Cookery). This small group had the greatest diversity: two (one of each gender) who had recently left high school and were yet to be employed in kitchens; one mature-aged woman changing career into professional cookery from nursing; and two (a mature-aged woman and a late-20s male) participants seeking to formalise their significant experience of professional kitchens.
The data analysis program NVivo7 allowed various data outputs: under a theme or sub-theme, text frequency, or by respondent grouping. Data was coded by location (metro/rural); occupation (chef-trainer/apprentice/block student); gender (male/female), and life-stage (young/late twenties/mature). Like groupings (apprentices) were summarised and compared with other groupings (block study-mode students) (Eisenhardt, 2002). The themes of this comparison were looked at in terms of frequency, specificity, emotion, and extensiveness. Broad themes and sub-themes coded provided a structure for analysis and writing.
An audit trail was undertaken to achieve consistency. Participants were given the opportunity to verify the transcript of their study as true, providing “evidence for the validity of an account” (Hammersley, 2002, p. 75) and thereby improve truth value. One participant exercised veto on one comment.
The review of the literature strongly indicated that cooks’ experience of traditional learning environments would be negative. One of the potential limitations of this research was conducting focus group discussions in what may have been the wrong type of classroom. Retrospectively, research should have been conducted in a practical class: a kitchen. Thishighlights another omission: On-the-job trainees should have been included in the study design.
Although the small sample size (N=28) limits generalisability, the findings of this study should be applicable to the TAFEs involved in this research and may be of some relevance to other parts of the VET sector, particularly other trade studies.
Findings/discussion
This section represents the results of the focus groups and interviews. Experiences of compulsory schooling will be discussed first. As questions regarding the compulsory school experience of respondents were not the specific focus of the question route, these will also be extrapolated out from later effects of compulsory schooling. Particular attention will be paid to the reticence to return to formal education, including TAFE experiences, detailinglearning methods, the “ticket,” and the missed opportunity of ICT. An example of the effects of demanding work practices, “sickees,” will lead to incidences of burn out. Finally, three case studies will be presented, offering the conceivable educational and vocational experiences of both a male and female cook, and a potential pathway for cooks.

Woolcock: Compulsory schooling preparation for professional cooks IJHE Vol 6 No 1 2013
139
Experiences of compulsory schooling
The findings confirmed the literature review: Entry to professional kitchens is often largely unplanned, poorly researched, and influenced by misinformation from the media and other sources. Many cooks are young, working-class males who have had poor experiences in formal schooling and may have a self-perception as a non-learner and low self-image. This demographic brings specific needs that are often not well catered for in compulsory schooling. Those that struggled during compulsory schooling are likely to struggle at TAFE, especially with text-based assessment. That these students commence TAFE study is, in itself, significantly positive.
Cookery was picked as a course of study through a perceived lack of choices. A chef-trainer noted that cookery students “drift along, a lot of them; I think that they get into cookery because they don’t know what else to do and it seems like a good option.” This passive relationship with their futures is likely to continue post-professional cooking (Burns, 2002).
Conor, the experienced male metro chef-trainer, alluded to his own issues with text-based learning “I went through school and literacy was really quite hard for me, I had to work quite hard to get a pass” and went on to observe that some of his past students “had some issues with their learning, and it might be dyslexic (...), just poor handwriting, (...), or hyperactive. You know, you feel like you get the whole bag.” Here, Conor alludes to the service that kitchens provide to the wider community by employing and giving purpose to those that exist on society’s periphery. However, the way that their specific learning needs are generally dealt with does little to reduce the feelings of educational failure.
Some respondents were early school leavers, reminiscing negative experiences of compulsory schooling. One male apprentice believed “a lot of them (Cookery apprentices) have left high school... early... to come into this industry to work with their hands”; another apprentice in a different group added a specific non-engagement with text-based learning: “I left high school, to come here to not do theory, to work with my hands, I wanted to cook.” A rural apprentice recalled struggling to conform to the rules of a traditional classroom and not engaging; he “hated sitting down, doing nothing (at school).” Another male apprentice indicated a confrontation with his Home Economics teacher had prompted his entry into professional cookery: “I’ve only ever wanted to be a cook... ever since I told my... foods teacher, to go (gives the fingers) I just loved it from then on... I didn’t like rice back then and she made us cook rice, and I’m like ‘no way, I’m not cooking that shit! Give me me money back’... the passion got started there I reckon.” This highlights the paradox of disliking of Home Economics but being attracted to Commercial Cookery. By contrast, few females stated issues with compulsory schooling.
TAFE experiences
Learning methods—“theory” and “prac”
Most respondents disliked paperwork, preferring practical hands-on learning. This is represented by the following statement from a young male rural block student wanting to destroy the physical paperwork mislabelled as theory: “I look at that theory and I want to

Woolcock: Compulsory schooling preparation for professional cooks IJHE Vol 6 No 1 2013
140
burn it (laughs). Give me a recipe, tell me how you want it done, I’ll do it every time that way. Theory, I just don’t like it at all, it’s always be something that I’ve had a problem with.” For many cooks, traditional classrooms and text-based assessment do not play to their strengths. This has played a role in the high attrition rate, one metro apprentice noting “There’s only half of us left (from their first year class).” The respondents in this study were those “left standing,” those motivated enough to cast aside previous school failures and complete written assessments they “hated” in order to attain the one piece of paper that mattered: the “ticket.”
Success: The “ticket”
Educational success was a popular theme. Although many students stated a dislike for formal education, many were proud that their trade certification represented possibly their first formal educational achievement in addition to vocational competency:
Owen: “The first thing, obviously, is to obtain a qualification, which would be a thrill for me to have a piece of paper with my name on it.”
Anne: “To get a ‘ticket.’”
Aiden: “I’m set, as soon as they give me that paper, I’m done. I already know everything anyway; it’s just getting the piece of paper.”
Ellie: “The reason why I come here was to get the paperwork to show that I can do the job, with having to go through the BS of having to prove yourself.”
Overcoming a level of challenge may improve confidence and strengthens links to later re-engagement with further education. A mature-aged block student stated “yeah, well, I can do anything that is challenged in front of me.”
Missed opportunity: ICT
Competency in Information and Communications Technology (ICT) is likely to be required for future technological advancements (Rodgers, 2005), for administrative tasks of kitchen management (Brefere et al., 2006) and later further education (Burns, 2002). This may be covered in the Technology strand of VET’s Employability Skills (Cleary, Flynn, & Thomasson, 2006), but is encouraged in Home Economics (Victorian Curriculum and Assessment Authority, 2010). One chef-trainer noted that many of his peers were not computer literate; some “can’t even send an e-mail or attach a document.” One rural chef-trainer stated he was poor on computers; the other did not have an e-mail address. Several students did not have e-mailaddresses. One rural apprentice noted “I don’t know how to use much technology and computers and all that sort of gear, it’s just like, ‘I cook, that’s what I do.’” With increasing levels of ICT proficiency being assumed, computer illiteracy may be an obstacle.

Woolcock: Compulsory schooling preparation for professional cooks IJHE Vol 6 No 1 2013
141
Professional kitchens
Working conditions – “Sickees”
Again, the findings confirmed the literature review: Cooks work long anti-social hours for less than average pay. Further, a culture may exist in kitchens whereby anything not beneficial to the employer is discouraged. Calling in sick causes issues for kitchens running on minimal staffing, which several metro apprentices experienced. Young male metro apprentices stated superiors “make you feel bad about it”; while another preferred to work through sickness otherwise his employers “just change your day off around.” One young male metro apprentice said his employer had “a very small business, kind of independently run... the boss likes to keep his full time staff there practically all the time, so doing the 13-hour days” implying higher quality restaurants fitted the expected role of small- to medium-sized businesses by offering greater variety and quality of informal on-the-job learning, while making greater demands of work/life balance (Smith et al., 2008), including basic workplace rights such as calling in sick, which, over time, may lead to burn out.
Burn out
Most students had observed burn-out in older colleagues. One young rural apprentice stated the he had “known a few chefs who have had mental breakdowns... I don’t want to be like that, when you just snap.” Although many apprentices had observed burn out, most expressed a mixture of compassion for effected colleagues and bravado that it would not happen to them. One rural block student with industry experience observed the age of retirement: “I’ve seen a lot of them (laughs). They’re about 32, usually and they lose it.” However, two students indicated they were experiencing a level of burn out. One young metro apprentice, Nigel, openly stated that he wanted to do "absolutely anything else, I don’t care" because he was "sick of working twelve, fourteen, fifteen hours a day, you know, getting home exhausted, hating every second of it."
Case studies
The perceptions of preparation for further education from compulsory schooling for cooks was derived from the data and have been categorised into two broad case studies: Carl and Gretchen. These case studies use respondents’ experiences and comments of compulsory schooling, TAFE education, and professional cookery, postulating how this may impact later career transition. Tony, the third case study, uses a mixture of the respondent’s comments and fictional license to highlight potential future options and promote discussion.
Case study one
Carl preferred to learn with his hand and found most of compulsory schooling “bad,” “hatingsitting there, doing nothing.” He found work washing dishes more engaging. Carl was relieved to be accepted into a Certificate III in Hospitality (Commercial Cookery) course at TAFE and left high school. He was disappointed to spend three years studying theory-based paperwork, but thrilled with one piece of paper, “a ticket (with his) name on it.” Celebrating after his last day, he tells fellow graduates “I don’t know if I’ll step into another classroom ever again.” Work in professional kitchens begins well, an early promotion to head chef an

Woolcock: Compulsory schooling preparation for professional cooks IJHE Vol 6 No 1 2013
142
indication that four years of hard work is recognised. This comes with some administrative tasks requiring computer skills that he tends to avoid, as he is not good with computers. When the restaurant owner questions why he has not done the monthly stock take, Carl walks out yelling behind him “I cook, it’s what I do”. With no reference from his only employer, Carl drifts from job to job, sometimes cooking, sometimes “labouring,” “truck-driving,” or “shovelling gravel.” These low-level jobs make better money than cooking, but at 40 the work opportunities diminish. Carl considers that it is “too late to be hired.” He recalls another comment from his last day: “Don’t you think Centrelink’s (the Australian social security network) going to love us?”
Case study two
Gretchen passed Year 12 doing Home Economics with average marks. She was aware she had multiple options and chose Commercial Cookery as it suited her current interest in food. She found TAFE paperwork too easy as “they give you the answers to the questions!” TAFE assessment was fine “on paper, theory-wise, but when you get out in a kitchen and you have to do it, it’s totally different.” Gretchen enjoyed professional cookery, but knew her future was limited as she was not the most gifted cook. Instead, she used professional cookery to travel, before becoming a “business owner” making and selling high-profit cup-cakes, predominantly for better work/life balance. Aware of a skills gap Gretchen went back to TAFE to do some “short-courses” in Business, confident that she “could do it, I’m good at school, like I’ve got a brain for theory.”
Case study three
Tony did not enjoy much of high school. He stayed because VET Hospitality was offered in Year 10 and this was like his favourite TV show: Masterchef. Tony struggled through VET Hospitality in Years 10 and 11. Miss Smith, Tony’s Hospitality teacher, helped a lot, adapting the curriculum to get through the paperwork with annotated discussions and hard work. Food interest was sparked, so Tony stayed to study the final year of Home Economics in Year 12.Tony found his technical knowledge of food provided a context to the critical thinking, ICT,and lifelong learning skills required of Home Economics at 3/4 level: “The theory made sense ‘cos I had the experience.” He travels and cooks professionally for eight years as a cook, regularly keeping in touch with Miss Smith via e-mail. Realising he wants a career change, Tony applies the design process to his job hunting: researching job and learning opportunities; designing a short-term career change plan involving part-time study and unpaid work,supplementing income with casual cooking jobs; implementing this plan; and evaluating its effectiveness when it does not work the first time. Eventually, he studies a Certificate IV in Training and Assessment and becomes a chef-trainer. During this job he discovers an interest in ICT. He learns more computer skills and moves to an ICT support role within the TAFE.
Carl followed a traditional pathway for male cooks: compulsory schooling failure, passive entry into professional kitchens, gaining a “ticket,” later burning out, passively moving to a variety of labouring jobs, and finding limited options later in life for meaningful employment. Gretchen also followed a traditional pathway, but for females: passing high school, choosing to enter her TAFE course from a number of researched options, and engaging in text-based learning at TAFE. After her course, she worked in professional kitchens while travelling and

Woolcock: Compulsory schooling preparation for professional cooks IJHE Vol 6 No 1 2013
143
looking at alternate options. She had few reasons to not return to study to learn the skills required of her new business. Tony followed a potential path that represents a new way of looking at the relationship between Hospitality and Home Economics, engaging with the course that is technically focused (Hospitality), engendering lifelong learning skills of research, critical thinking, and ICT with the course that also encourages emancipatory and interpretive practice (Home Economics) (McGregor et al., 2008).
Conclusion
This section represents the results of the focus groups and interviews. Experiences of compulsory schooling were discussed, and showed that cooks had particularly strong negative memories of text-based learning, prompting disengagement and a passive non-committal relationship with education that may be carried for life. TAFE experiences repeated these difficulties, a testament to their resilience rewarded with a “ticket,” but with a number of missed learning opportunities, such as ICT. The perceived inability to call in when sick exemplified the demands of professional kitchen work, which are likely to lead to burn out. Finally, three case studies will be presented, offering the conceivable educational and vocational experiences of both a male and female cook, and a potential pathway for cooks involving both VET Hospitality and Home Economics was proposed.
The question posed by this study was:
To what extent does compulsory schooling prepare professional cooks for later career transition?
The respondents were not questioned directly regarding compulsory schooling experiences, SES status, or motivation to begin cooking, but spontaneously corroborated Teese and Polesel’s (2003) findings of males’ dislike of written work and Home Economics; the practical and manual labour preferred by workers generally of lower SES; and the self-image as a non-learner. Dishearteningly few male respondents intended to return to further education, likely to precede career transition, their general compulsory schooling experience turning “off education involvement later in life” (Burns, 2002, p. 213). This inability to reengage formal education leaves male cooks especially vulnerable in current and future labour markets. Conversely, almost all female respondents were prepared to study later in their lives.
The two subjects that lead into professional cookery, Home Economics and VET Hospitality, seem polarised in the literature review, but were neither confirmed nor denied in the findings: The questions simply did not generate these answers. The respondents were clear regarding learning methods: The focus on technical aspects of cookery “hands-on work” was engaging; paperwork was synonymous with negative. The only paperwork worth having were trade papers, however, for many males, this signified the end of formal education.
Professional kitchens are exhilarating, but demanding. Long anti-social hours, low pay, poor work/life balance, and a culture of compliance to “chef’s rules” rather than basic workplace rights led to cooks working when sick. Over time, this may lead to burn out, requiring career transition.

Woolcock: Compulsory schooling preparation for professional cooks IJHE Vol 6 No 1 2013
144
Lifelong learning skills of research, critical thinking, and ICT are likely to smooth the pathway to later career transition. These skills are ineffectively taught throughout many cooks’educational pathways. The interplay between Home Economics and VET Hospitality offers a potential path representing engagement of the student with the technically focused (Hospitality) course in Years 10 and 11, followed by the broader, and ultimately more important, lifelong learning skills in Year 12 Home Economics.
Currently, the preparation that professional cooks receive from compulsory schooling for later career transition is adequate for female cooks. However, for males it is at best inadequate and at worst damaging.
Recommendation one
Adopt the broader, whole-person approach to Home Economics based on the three strands of technical, emancipatory, and interpretive practice (McGregor et al., 2008). This may not just retain students in the senior years of compulsory schooling, but also prepare them for later reengagement with further education and career change. Home Economics is better placed for broader learning foci than the outcomes focus required by VET Hospitality. The design process when including ICT research requires searching through recipes, decision making, collection, critiquing and synthesising of knowledge to produce a plan, actioning this plan and finally reflecting on the overall effectiveness. This can readily be compared to the skills of job seeking or planning career change.
Recommendation two
Adopting a Hospitality 1/2 in Year 10 (portfolio entry), a Hospitality 3/4 in Year 11, and a Home Economics 3/4 in Year 12. Students begin with the “masculine” Hospitality subject, focusing on technical practice. With an interest in food piqued, students then may be motivated to engage in the deeper learning that Home Economics can provide of “learning through food.”
Recommendation three
Multiple modes of assessment be researched. The paradigm of text-based learning and assessment that dominates all levels of education is not appropriate for all learning styles.
Biography
Cam Woolcock started working in Hospitality as a kitchen hand at 14, later obtaining Cookery trade qualifications in his native New Zealand. Cam then cooked professionally in several countries before settling in Melbourne. He soon started work as a food educator in 2002, obtaining teacher qualifications in 2005, and immediately started a Master of Education at the University of Melbourne. The research focus was the preparation of Australian cooks for reengaging further education. Cam is currently VET Coordinator at Marian College, Sunshine West, a role that includes increasing VET offerings and settingup a Hospitality and Hairdressing Trade Training [email protected]

Woolcock: Compulsory schooling preparation for professional cooks IJHE Vol 6 No 1 2013
145
References
Australian Bureau of Statistics. (2008). How Australians use their time 2006 Canberra: Australian Government.
Australian Bureau of Statistics. (2008). Vocational Education and Training (VET) no 1301.0.Canberra: Australian Government.
Australian Bureau of Statistics. (2011). How Australia Takes a Census, 2011 Canberra: Australian Government.
Australian Government. (2009). Job Outlook. Canberra: Australian Government.
Benn, J. (2009). Practical wisdom, understanding of coherence and competencies for everyday life. International Journal of Home Economics, 2(1), 2.
Bennett, S. (2007). My Vue: Modern French Cookery. East Roseville: Simon & Schuster.
Bourdain, A. (2001). Kitchen Confidential: Adventures in the Culinary Underbelly. London: Bloomsbury.
Brefere, L., Drummond, K. E., & Barnes, B. (2006). So you want to be a chef Your guide to culinary careers. New Jersey: John Wiley & Sons.
Broad, J. (2008, 03 March 2008). Enough cooks for this broth The Age
Burns, R. (2002). The adult learner at work. Crows Nest: Allen & Unwin.
Cleary, M., Flynn, R., & Thomasson, S. (2006). Employability Skills: An Introductory Guide forTrainers and Assessors Retrieved 26 August 2011, from http://www.training.com.au/documents/Employability%20Skills_From%20Framework%20to%20Practices.pdf
Cullen, N. (2000). The world of culinary supervision, training and management. Upper Saddle River: Prentice Hall.
Dewey, J. (1916). Democracy and education: an introduction to the philosophy of education.New York: Macmillan.
Dewhurst, Y., & Pendergast, D. (2008). Home economics in the 21st century: a cross cultural comparative study. International Journal of Home Economics, 1(1), 63-87.
Dobson, R. (2003). Young chefs just can't stand the heat Retrieved 16 November 2005, from http://www.gradewinner.com/p/articles/mi_qn4159/is_200307/ai_n12742816
Dornenburg, A., & Page, K. (2003). Becoming a Chef. New Jersey: John Wiley & Sons.
Eisenhardt, K. M. (2002). Building Theories from Case Study Research. In A. M. Huberman & M. B. Miles (Eds.), The Qualitative Researchers Companion (pp. 5-35). London: Sage.
Fine, G. A. (1996). Kitchens: The culture of restaurant work. London: University of California Press.
Woolcock: Compulsory schooling preparation for professional cooks IJHE Vol 6 No 1 2013
146
Guerrier, Y., & Adib, A. (2000). Working in the hospitality industry. In C. Lashley & A. Morrison (Eds.), In search of hospitality : theoretical perspectives and debates (pp. 256-276). Oxford: Butterworth-Heinemann.
Hammersley, M. (2002). Ethnography and Realism. In A. M. Huberman & M. B. Miles (Eds.), The Qualitative Researchers Companion (pp. 65-80). London: Sage.
Hart, J., & Sweetman, J. (2009). SIT07 Implementation Guide: Doing it right. Industry requirements for implementing the Tourism, Hospitality and Events Training Package. Sydney: Service Skills Australia.
Hass, S. (2005). Why a Chef?: A Journey into the Darkest Regions of the Kitchen. Gastronomica, 5(2), 37-42.
Hegarty, J. A. (2004). Standing the heat: assuring curriculum quality in culinary arts and gastronomy. New York: Haworth Hospitality Press.
Henderson, J. C. (2011). Celebrity chefs: expanding empires. British Food Journal, 113(5), 613-624.
Hildred, S., & Ewbank, T. (2001). Jamie Confidential: The Biography of Britain's Best-Loved Chef. London: John Blake.
Lefever, M. (1989). Restaurant reality: a manager's guide. New York: John Wiley & Sons.
Lethlean, J. (2003). Young chefs leaving the table in droves 21 September 2003. Retrieved 29 October, 2005, from http://www.theage.com.au//2003/09/21/1063625263711.html?from=storyrhs
McDermott, R. (2008). Wasted Skills: The hospitality industry and its young chefs. Paper presented at the AVETRA 2008 Conference, Adelaide Holiday Inn. http://www.avetra.org.au/AVETRA%20WORK%2011.04.08/CS1.2%20-%20Richard%20Mcdermott.pdf
McGregor, S. L., Pendergast, D., Seniuk, E., Eghan, F., & Engberg, L. (2008). Choosing Our Future: Ideologies Matter in the Home Economics Profession. International Journal of Home Economics, 1(1), 43-62.
O'Donoghue, J., & Mullaney, M. I. (2008). Investigating Subject Selection of Home Economics in Ireland. International Journal of Home Economics, 1(2), 33-55.
Orwell, G. (1933). Down and out in Paris and London. London: Gollancz.
Palmer, C., Cooper, J., & Burns, P. (2007). Culture, identity, and belonging in the “culinary underbelly”. International Journal of Culture, Tourism and Hospitality Research, 4(4), 311-326.
Pardy, J. (2007). Education credentials and working lives. Paper presented at the Australian Vocational Education and Training Research Association Conference, Footscray Park. http://www.avetra.org.au/publications/28-Pardy.pdf
Parkinson, A., & Green, J. (2002). Cutting in fine: Inside the restaurant business. London: Vintage.

Woolcock: Compulsory schooling preparation for professional cooks IJHE Vol 6 No 1 2013
147
Pendergast, D. (2001). Virginal mothers, groovy chicks & blokey blokes : re-thinking home economics (and) teaching bodies. Bowen Hills: Australian Academic Press.
Pendergast, D. (2007). Sustaining the home economics profession in New Times (Part 2). VHETTA Journal, 47(2), 5-10.
Pepin, J. (2003). The apprentice: my life in the kitchen. Boston: Houghton Mifflin.
Popham, P., & Green, T. (2008). YouTube gunman slaughters 10 students. The Independent on Sunday, 24 September 2008. Retrieved from http://www.independent.co.uk/news/world/europe/youtube-gunman-slaughters-10-students-940306.html
Pratten, J. (2003). What makes a great chef? British Food Journal, 105(7), 454-459.
Print, M. (1993). Curriculum Development and Design (Vol. 2). Crows Nest: Allen and Unwin.
Queensland Studies Authority. (2007). 2007 Subject Enrolments and Levels of Achievement by Syllabus Advisory Committee and Sex. Brisbane: Queensland Government.
Renold, U. (2008). The role of education in equipping individuals and families to be resilient and active participants in the global community. International Journal of Home Economics, 1(2), 69-74.
Richardson, S. (2007). What is a skill shortage? Retrieved 1000 31 May, 2009, from http://www.ncver.edu.au/publications/1732.html
Roche, E. (2003). Return to Jamie's Kitchen: Elisa Roche Retrieved 1000 12 October, 2006, from http://www.channel4.com/life/microsites/J/jamie/trainees/elisa.html
Roche, E. (2004, 28 January 2004). If you can't stand the heat ... get some balls. The Guardian Retrieved 1000 18 July, 2009, from http://www.guardian.co.uk/g2/story/0,3604,1132605,00.html
Rodgers, S. (2005). Applied research and educational needs in food service management. International Journal of Contemporary Hospitality Management, 17(4), 302-314.
Ruhlman, M. (2006). The Reach of a Chef: Beyond the Kitchen. New York: Penguin.
Samuel, H. (2009). Michelin star French chefs quit over pressure of Red Guide Telegraph 02 March 2009. Retrieved 03 May, 2009, from http://www.telegraph.co.uk/news/worldnews/europe/france/4928743/Michelin-star-French-chefs-quit-over-pressure-of-Red-Guide.html
Service Skills. (2009). Tourism, Hospitality and Events Environmental scan 2009. Sydney: Service Skills Australia.
Smart, J. (Writer). (2006). Jamie's Kitchen Australia.
Smith, A., Oczkowski, E., & Smith, C. S. (2008). To have and to hold: Retaining and utilising skilled people. Retrieved from http://www.ncver.edu.au/publications/2045.html

Woolcock: Compulsory schooling preparation for professional cooks IJHE Vol 6 No 1 2013
148
Symons, M. (1998). The Pudding That Took A Thousand Cooks: The story of cooking in civilisation and daily life. Ringwood: Viking.
Teese, R., & Polesel, J. (2003). Undemocratic schooling: equity and quality in mass secondary education in Australia. Melbourne: Melbourne University Publishing.
Victorian Curriculum and Assessment Authority. (2008). VCE VET Hospitality Program Booklet.Victorian Curriculum and Assessment Authority, Retrieved 1100 21 May, 2011, from http://www.vcaa.vic.edu.au/vet/programs/hospitality/publications/Hospitality_booklet_2009.pdf
Victorian Curriculum and Assessment Authority. (2010). Food and Technology Victorian Certificate of Education Study Design. Melbourne: Victorian Curriculum and Assessment Authority,.
Waring, M. (1988). If Women Counted: A New Feminist Economics. San Francisco: Harper & Row.
White, M. P. (1990). White Heat. London: Beazley.
Woolcock, C. (2009). Out of the frying pan: To what extent does Certificate III in Hospitality (Commercial Cookery) prepare students for further education? Master of Education Research, University of Melbourne, Melbourne.
International Journal of Home Economics
149
Notes for contributors
Website
For more information please visit the International Journal of Home Economics website:
http://ijhe.weebly.com/index.html
Frequency of publication
The International Journal of Home Economics is published twice a year. Papers for review will be accepted throughout the year to e-mail: [email protected]
Focus
The International Federation for Home Economics is the only worldwide organisation concerned with Home Economics and Consumer Studies. It was founded in 1908 to serve as a platform for international exchange within the field of Home Economics. IFHE is an International Non-Governmental Organisation (INGO), having consultative status with the United Nations (ECOSOC, FAO, UNESCO, UNICEF) and with the Council of Europe.
This refereed journal brings together emergent and breaking work on all aspects of Home Economics, and, most importantly, how we might improve and renew the everyday work of Home Economists. It features quantitative and qualitative, disciplinary and trans-disciplinary, empirical and theoretical work and will include special editions on key developments. It aims to push the boundaries of theory and research—to seek out new paradigms, models and ways of framing Home Economics.
Contributors
The International Journal of Home Economics welcomes contributions from members and non-members, from a variety of disciplinary and theoretical perspectives.
Author’s biography
Please provide a brief (less than 100 words) paragraph for each author, including current role or memberships and an E-mail address for correspondence. For example:
Professor Donna Pendergast, PhD is Dean of the School of Education and Professional Studies at Griffith University, Brisbane, Australia. Donna researches and writes about Home Economics philosophy, education and practice. Donna recently completed her 4-year term as Vice President of the Pacific Region and member of the IFHE Executive. She continues to serve the profession as Chairperson of the IFHE Think Tank Committee and Editor of the International Journal of Home Economics. She has served as National President of the Home Economics Institute of Australia, and President of the Queensland division.

Notes for contributors International Journal of Home Economics Volume 5 No 2 2012
150
Manuscripts
Manuscripts should be sent electronically to Professor Donna Pendergast, School of Education by e-mail at [email protected]. Please send files as Microsoft Word documents(doc, docx) or in Rich Text Format (rtf). Paper length should not exceed 6000 words. Each document should be double-spaced, with generous margins.
A standard coversheet must be submitted with all manuscripts. It is available from the IFHE website and from here: http://ijhe.weebly.com/index.html.
. Papers submitted without coversheets will be returned to authors. A separate first page should include the full title, a short title for use as a running head. The title should not exceed 10 words (50 characters), and should be followed by an abstract of 100–200 words and up to five keywords. Material which requires substantial editing will be returned to the author.
No footnotes or endnotes are permitted, only References. Please avoid using italics and bold. Spellcheck using UK English. All pages should be numbered. Contributors should be aware that they are addressing an international audience. Jargon should be avoided and local terminology clarified for an international audience. Authors should use non-discriminatory language. Measurements should be in metric units. Articles should be original work and,where appropriate, should acknowledge any significant contribution by others.
Authors who want to refine the use of English in their manuscripts might consider utilising the services of SPi, a non-affiliated company that offers Professional Editing Services to authors of journal articles in the areas of science, technology, medicine or the social sciences. SPi specialises in editing and correcting English-language manuscripts written by authors with a primary language other than English. Visit www.prof-editing.com for more information about SPi’s Professional Editing Services, pricing, and turn-around times, or to obtain a free quote or submit a manuscript for language polishing.
Please be aware that IFHE has no affiliation with SPi and makes no endorsement of the company. An author’s use of SPi’s services in no way guarantees that his or her submission will ultimately be accepted. Any arrangement an author enters into will be exclusively between the author and SPi, and any costs incurred are the sole responsibility of the author.
Tables, figures and illustrations
Figures, diagrams and images must be cited in text and captions provided. Figures should be at a professional standard and supplied as separate electronic files (e.g., TIF, JPG, GIF). Tables must be cited in text and captions provided. Include all tables, figures and
illustrations in the correct location in the manuscript. All tables should be in text, not
provided as an image.

Notes for contributors International Journal of Home Economics Volume 5 No 2 2012
151
References
References should follow the American Psychological Association system (APA Publications Manual, 6th Edition).
The details required for books are:
Names of authors or editors (year of publication). Title of publication. Place of Publication: Publishers, for example:
Pendergast, D. (2001). Virginal mothers, groovy chicks & blokey blokes: Re-thinking Home Economics (and) teaching bodies. Sydney: Australian Academic Press
The details required for journals are:
Names of authors or editors. (year of publication). Title of article. Title of journal, volume(issue), page numbers, for example:
McGregor, S. L. T. (2007a). Consumer scholarship and transdisciplinarity. International Journal of Consumer Studies, 31(5), 487–495.
Copyright
Manuscripts submitted for publication must not have been previously submitted or published. Accepted papers become the permanent property of IJHE. By submitting a manuscript, the author(s) agree that copyright for their articles are automatically transferred to the IJHE, if and when articles are accepted for publication. The copyright gives IJHE the exclusive rights to reproduce and distribute the article.
Proofs
Proofs will be sent electronically to the corresponding author for return within 72 hours. It is the author’s responsibility to ensure the accuracy of these proofs. Correction other than printing errors should be kept to a bare minimum.

152
International Journal of Home Economics
www.ifhe.org
ISSN 1999-561X

Volume 6 Issue 2 2013


International Journal of Home Economics
i
This refereed journal is an official publication of the International Federation for Home Economics. Electronic access via IFHE website for subscribers and members only: www.ifhe.org
IJHE editor
Donna Pendergast AustraliaE-mail: [email protected]
Book review editor
Donna Pendergast AustraliaE-mail: [email protected]
Editorial administrator & graphic designer
Joy Reynolds AustraliaE-mail: [email protected]
Website
For more information please visit the International Journal of Home Economics website:
http://ijhe.weebly.com/index.html
Frequency of publication
The International Journal of Home Economics is published twice a year. Papers for review will be accepted throughout the year to e-mail: [email protected]
International Federation for Home EconomicsKaiser Friedrich Strasse 1353113 BONNGermanyTel: 0049 (0) 228 9212590Fax: 0049 (0) 228 9212591E-mail: [email protected]: www.ifhe.orgISSN 1999-561X

International Journal of Home Economics
ii
IJHE Editor
Professor Donna Pendergast, PhDSchool of Education and Professional StudiesGriffith UniversityGold Coast, AustraliaPhilosophy, research, education
Editorial Board Members
Dr Mona Sharaf Abdelgalil Department of Home Economics, Alexandria UniversityAlexandria, Egypt Food management; consumer studies; household activities and everyday life
Associate Professor Jette BennInstitute of Didactics, The Danish School of Education, Aarhus University DenmarkHome Economics education; Home Economics philosophy and history; consumer and nutrition education
Dr Vassiliki CostarelliHuman Ecology Laboratory, Department of Home Economics and Ecology, Harokopio UniversityAthens, GreeceNutrition and cancer; nutrition in childhood and adolescence; disordered eating attitudes and behaviours; nutrition in pregnancy/ postpartum depression; nutrition and the athlete
Professor Meei-Ruey HsuDepartment of Tourism, Ming Chuan UniversityTaiwanCurriculum and instruction; gender education; hospitality education; teacher education
Associate Professor Amoroso Catherine LeslieThe Fashion School, Kent State University, Ohio, United States of AmericaHistorical and biographical research, apparel and textiles, entrepreneurial activity, consumer behaviour, arts and crafts (or handicrafts)
Professor Sue LT McGregor Faculty of Education, Mount Saint Vincent UniversityHalifax, Nova Scotia, CanadaConsumer and global citizenship; consumer studies, policy and education; Home Economics leadership; Home Economics philosophy; transdisciplinary and integral inquiry
Kathryn McSweeney, MEdSt. Angela’s College Lough Gill, Sligo, IrelandEducational assessment; empowerment and advocacy studies; social marketing; teaching strategies in textiles studies; textile and embroidery samplers

International Journal of Home Economics
iii
Associate Professor Seema PuriDepartment of Nutrition, Institute of Home Economics, University of DelhiIndiaAging; food security; infant and child nutrition; institutional management; nutrition
Dr Janet ReynoldsPrincipal Education Officer, Teaching & Learning, Department of Education & TrainingQueensland, Australia
Professor Kaija TurkkiFaculty of Behavioural Sciences, University of HelsinkiFinlandConsumer citizenship; FCS in higher education; global education; Home Economics in higher education; Home Economics philosophy; household activities and everyday life
Dr Hena YasminDepartment of Home Economics, Faculty of AgricultureSwazilandChild care and development; consumer education; education; HIV/AIDS; household technology; nutrition
Professor Taemyung YooDepartment of Home Economics Education, College of Education, Gyeongsang National UniversityKorea
Griffith Institute for Educational Research
The International Journal of Home Economics gratefully acknowledges the assistance and support of the Griffith Institute for Educational Research.

International Journal of Home Economics IJHE Vol 6 No 2 2013
iv
Contents
Editorial Volume 6 Issue 2 153
Donna Pendergast
Attitudes and buying behaviours of cross-cultural college students toward apparel products
154
Amy Harden & Yuanyuan Zhang
Revolt against the ‘fusspot’ — Positioning oneself as Home Economics teacher 173
Karin Hjälmeskog
Rebranding Home Economics 186
IFHE Think Tank Committee
Corporate social responsibility: comparison of outward and inward-oriented manufacturers
207
Prabhjot Kaur & Navjot Kaur
Japanese and American high-school students’ awareness of poverty 227
Setsuko Nakayama, Jeffrey M Byford & Yoko Ito
The use of Meaningful Reception Learning in lesson on classification 243
Titilola T Obilade
Psychosocial factors influencing marital adjustment among couples in Ile-Ife, Osun State, Nigeria
250
David Oladeji
Psychosocial risk factors Influencing the abuse of drugs among adolescents of abused parents from selected households in Ibadan Metropolis, Nigeria
260
David Oladeji
The value of home economics to address the obesity challenge: An evaluation of comments in an online forum
272
Donna Pendergast, Susanne Garvis & Harold Kanasa
Developing a new concept of reversible textile furnishing 286
Sabrina Ramsamy-Iranah & Nirvana Budhai
The marital relationship and Saudi Arabian women’s private sphere dress 305
Widjan Tawfiq & Jennifer Paff Ogle
Chinese and US Teenage Tobacco Consumption and Quality of Life 320
Baomei Zhao, Sijia Wang, Richard Glotzer & Jessica A. Robb
Notes for contributors 334

International Journal of Home Economics
153
Editorial Volume 6 Issue 2
Donna Pendergast
Publication in IJHE provides wide exposure to journal articles and adds to the professional literature base of the field. Theoretical papers, literature reviews, and a wide range of genres along with research papers are invited for publication in the journal. As editor, I strongly encourage submissions to the journal. The papers included in this issue of the journal represent a diverse range of genres but share a common thread—a strong link to enhancing wellbeing. All refereed articles have undergone rigorous, double-blind review, and are adding to the professional literature base of the field.
2014 marks the 20th Anniversary of the International Year of the Family (IYF), offering an opportunity to: refocus on the role of families in development; take stock of recent trends in family policy development; share good practices in family policy making; review challenges faced by families worldwide and recommend solutions. The International Federation for Home Economics (IFHE) will support the anniversary with a campaign focusing on “Empowering
Families, Individuals and Communities through Home Economics.” The International Journal of Home Economics (IJHE) will publish a special issue with a focus on family to align with this significant anniversary in December 2014. The intent of the special issue is to provide a platform for the examination of various aspects of family research and thus to foster progress in its theoretical development. Papers are currently under review for this special issue.
Professor Donna Pendergast, PhDEditor, IJHE

International Journal of Home Economics
154
Attitudes and buying behaviours of cross-cultural college students toward apparel products
Amy Harden & Yuanyuan Zhang
Ball State University, US
Abstract
The purpose of this research study was to compare and contrast the fashion attitudes and buying behaviours of college students at a Midwestern university in the United States and at a metropolitan university in China toward apparel products, and to clarify the factors that contribute to differences and similarities among the two markets. Data were obtained from 317 American and Chinese college students with an age range of 18 to 24 years. The consumer decision-making characteristics related to fashion attitudes were supported by the buying behavioural results in this study. Although similarities overweighed differences overall, several subtle differences were identified in buying characteristics by country. The study confirmed that globalization and culturalbackground factors including demographics and psychographics have an impact on characterizing fashion attitudes and buying behaviours between American and Chinese college student consumers. Implications of the findings suggest to marketers of US apparel firms that several appropriate globalization and management strategies can be implemented for gaining successful market presence in China.
Key words: cross-culture, attitudes, shopping, apparel, college students
Introduction
Meeting multicultural consumer needs by providing the right products and services in today’s global market is a great challenge for marketers, retailers, and suppliers (Kim, Forsythe, Gu & Moon, 2002). Currently, fashion apparel industries, under the influence of globalization, have been eager to gain a larger market, not only in their country of origin, but in other markets with high potential (Kim, Forsythe, Gu & Moon, 2002). In the past two decades, global marketers have attempted to explore various market opportunities in China. China, with one fourth of the world’s population, has the world’s fastest rate of economic growth and ranks second in the world in gross domestic product (GDP: The World Bank, 2010). China offers enormous market opportunities for textile and apparel firms (Jin & Kang, 2010). On the other hand, the United States, with the largest purchasing power, saw imports of apparel products double between 1992 and 2002 to $63.8 billion (Kunz & Garner, 2007). In the apparel and textile sector, US companies claim only six percent of the imported apparel market in China compared to 46 percent for France and 38 percent for Italy (Zhang, Dickson, & Lennon, 2002). Most US apparel firms historically haven’t effectively exploited the opportunity to sell their brand in foreign markets (Kunz & Garner, 2007), although numerous US apparel companies

Harden & Zhang: Attitudes & buying behaviours of students IJHE Vol 6 No 2 2013
155
have actively sought overseas opportunities for business expansion. These facts clearly denote that the United States should pursue more market opportunities in China (Wu & Delong, 2006).
Consumers may choose particular products and brands, not only because they provide the functional reasons such as basic physical and survival needs, but also because products can be used to express consumers’ personality, social status or to fulfil their internal psychological needs (Kim, Forsythe, Gu & Moon, 2002). According to Yau (1994), consumers’ product choice and preference for a particular product or brand are generally affected by complex social influences and environment. Consumers’ preferences also change over time as their consumption situation and environment change (Yau, 1994). The development of global markets has resulted in an increase in product choices, retail channels (e.g., catalogues, Internet, and stores) and promotional activities that provide an abundance of information. These developments make consumers’ decisions more complex and perhaps even more important today than in the past (Walsh, Mitchell & Hennig-Thurau, 2001). Therefore, identifying and understanding cross-cultural consumers’ attitudes and buying behaviours toward apparel products is the primary task for successful global apparel firms. To be successful, US apparel firms should examine differences and similarities between American and Chinese buying behaviours and decision making styles, and clarify factors affected by these differences and similarities. A comparison of these two markets will help US apparel firms make appropriate globalization strategies to appeal to their target market and widen profit as a successful firm in the future.
The purpose of this study was to compare and contrast the fashion attitudes and consumer buying behaviours of US college students at a Midwestern university and Chinese college students at a metropolitan university toward apparel products. Specifically, the research questions included: 1) what fashion attitudes do American and Chinese college student consumers have based on consumer decision-making style toward apparel products? What are the similarities and differences? What factors influence their fashion attitudes? 2) what buying behaviours do American and Chinese college student consumers have toward apparel products? What are the similarities and differences? What factors influence their buying behaviours? and 3) is there any relationship between cross-national consumers’ fashion attitudes and buying behaviours toward apparel products?
Results of this empirical study can provide a better understanding of the cross-cultural fashion attitudes and buying behaviours between US and Chinese college students. Although several cross-cultural consumer decision-making styles toward apparel products research can be found (Hafstrom, Chae & Chung, 1992; Durvasula, Lysonski & Andrews, 1993; Lysonski, Durvasula & Zotos, 1996; Mitchell & Bates, 1998; Fan & Xiao, 1998; Hiu, Siu, Wang & Chang, 2001; Walsh, Mitchell & Hennig-Thurau, 2001; and Leo, Bennett & Hartel, 2005), updating a comparison study of cross-cultural consumer behaviour is needed as consumers’ purchase behaviour changes over time following their consumption situation and environment change (Yau, 1994). This is especially important among Chinese consumers due to the rapid economic growth that has occurred in recent years. Identifying the differences and similarities of consumer behaviour styles by using an established survey from previous studies would provide

Harden & Zhang: Attitudes & buying behaviours of students IJHE Vol 6 No 2 2013
156
the factors affecting these results. This information will help US apparel firms make appropriate globalization strategies for gaining successful global market presence.
Literature Review
In an increasingly globalized business environment, it is essential that marketing management learn about differences in cross-cultural consumer decision-making. The success of an organization in a culturally different market place may be largely affected by how well the decision-makers grasp the consumers’ buying behaviours, and how well they are able to incorporate such understanding into their marketing plan and strategies (Leo, Bennett, and Hartel, 2005). Shopping orientation research has covered various industries, products, and groups of consumers. Examples include: catalogue (Gehrt & Carter, 1992; Bellenger & Korgaonkar, 1980), grocery (Williams, Painter & Nicholas, 1978), non-store retail (Bellenger &Korgaonkar, 1980), supermarket (Darden & Ashton, 1974), cosmetics (Moschis, 1976), and recreational shopping (Bellenger & Korgaonkar, 1980).
Studies of consumers’ behaviour
Many researchers have attempted to explain consumers’ decision-making behaviours when choosing new products. According to Sproles and Kendall (1986), consumer decision-making style refers to the mental orientation that characterizes a consumer’s approach toward making choices. Consumer decision-making has both cognitive and affective characteristics. Although many factors influence consumer decision-making, consumers are thought to approach the market with certain basic decision-making styles (Sproles & Kendall, 1986). In the existing consumer behaviour literature, most studies assume that all consumers approach shopping with certain decision-making traits that combine to form a consumer’s decision-making style, such as brand/store loyalty (Moschis, 1976), quality consciousness (Darden &Ashton, 1974) or value consciousness (McDonald, 1993).
Previous literature suggests three ways to characterize consumer decision-making style: the consumer typology approach, the psychographics/lifestyle approach, and the consumer characteristics approach (Sproles & Kendell, 1986). The consumer typology approach seeks to categorize consumers into groups or types that are related to retail patronage (Bellenger & Korgaonkar, 1980). These studies have typically focused on specific products, product groups or on the general retail market place (Westbrook & Black, 1985). The psychographics/lifestyle approach identifies over a hundred characteristics related to consumer behaviour based on general activities interests or lifestyles (Lastovicka, 1982). Lastly, the consumer characteristic approach emphasizes the cognitive and affective orientations towards purchasing in consumer decision-making (Sproles, 1985; Westbrook & Black, 1985). This approach holds the assumption that consumers process cognitive and affective orientations to determine their consumer decision-making styles (Fan & Xiao, 1998; Sproles & Kendall, 1986).
Although the three approaches provide for a unified theme that consumers approach the market with basic decision-making styles (Sproles & Kendall, 1986), the consumer characteristics approach has been perceived to be more powerful and explanatory than the consumer typology or psychographics approaches in an attempt to measure the decision-

Harden & Zhang: Attitudes & buying behaviours of students IJHE Vol 6 No 2 2013
157
making styles of consumers in shopping orientations, as it focuses on consumers’ mental orientation (Lysonski, Durvasula & Zotos, 1996).
Measuring consumers’ decision-making style
Sproles (1985) and Sproles and Kendall (1986) developed a Consumer Style Inventory (CSI) to measure the decision-making styles of consumers in shopping orientations. This inventory has been widely validated and applied in different countries. Based on the literature related to consumer decision making in the field of marketing and consumer studies, Sproles (1985) developed an instrument to measure ‘general orientations toward shopping and buying’ in a sample of 111 undergraduate female students in two home economics classes at the University of Arizona. Consumers decision-making styles were measured by 50 five-point Likert-scale items with strongly disagree and strongly agree as the end points. In a conceptual framework for analysing consumer decision-making styles, nine hypothetical decision-making styles were derived. Using the principal factors methods with varimax rotation, six of nine hypothetical traits were confirmed. The other three trait orientations not confirmed were considered similar to several of the other traits (Sproles, 1985). That model presented the first time a quantitative instrument was developed to measure this range of six consumer decision- making style traits (Sproles & Kendall, 1986).
Development of consumer styles inventory (CSI)
In 1986, Sproles and Kendall (1986) used survey data from 482 high school students in 29 home economics classes to refine their original instrument (Sproles, 1985). The authors utilized a Consumer Styles Inventory (CSI), measured “Characteristics of consumer decision making”, and a Profile of Consumer Style (PCS), which consisted of a format for reporting an individual’s characteristics. They identified eight basic mental characteristics of consumer decision-making styles and confirmed the six style characteristics that had been identified in the original study (Sproles, 1985).
In addition, Sproles and Kendall (1986) added “Impulsive, Careless”, and “Habitual, Brand loyal” characteristics to their survey. The completed eight dimensions included in the CSI included: (1) Perfectionism or High-quality conscious – consumers seek the very best quality products, have high standards and expectations for consumer goods, and are concerned with the function and quality of products; (2) Brand consciousness – consumers are oriented toward the more expensive and well-known national brands and feel price is an indicator of quality; (3) Novelty-fashion consciousness – consumers gain excitement and pleasure from seeking out new things, and are conscious of the new things; (4) Recreational, Hedonistic Shopping consciousness – consumers find shopping pleasant, shop just for fun of it; (5) Price Conscious, or “Value for money” – consumers are low-price conscious, look for the best value for the money, and are likely to be comparison shoppers; (6) Impulsiveness, Careless – an orientation of consumers not planning to shop or aren’t concerned about the amount of money they spend; (7) Confused by Over-choice – consumers who perceive many brands and stores from which to choose and have difficulty making choices; and (8) Habitual, Brand-Loyal toward consumption – consumers who are apt to have favourite brands and stores.

Harden & Zhang: Attitudes & buying behaviours of students IJHE Vol 6 No 2 2013
158
To develop a model for the Profile of Consumer Style (PCS), Sproles and Kendall (1986) established scale reliabilities using Cronbach’s alpha for items that loaded above 0.4 on each factor and for subscales of the three top loading items on each factor. Although only the “Impulsive” characteristic recorded low reliability, the remainder had satisfactory reliabilities (> 0.48).
Studies of cross-cultural consumers’ decision-making comparison
From an international marketing point of view, a single instrument to measure decision-making styles that’s applicable to many different countries would be desirable because such an instrument could be used to identify similarities and differences in consumer decision making between countries and it could enhance comparability (Walsh, Mitchell & Hennig-Thaurau, 2001). Because the reliability and validity of the CSI were established using a sample of US high school students, Sproles and Kendall (1986) recommended validating the instrument across other populations, and further research has been required to demonstrate their applicability.
Although some concerns about the generalizability of the inventory have been expressed, the CSI represents the most-tested instrument currently available to assist marketers in examining cross-cultural decision-making styles (Walsh, Mitchell & Hennig-Thurau, 2001). At present, the CSI instrument has been applied to nine countries, including the US (Sproles and Kendall, 1986), Korea (Hafstrom, Chae and Chung, 1992), New Zealand (Durvasula, Lysonski & Andrews, 1993), Greece, India (Lysonski, Durvasula & Zotos, 1996), the United Kingdom (Mitchell & Bates, 1998), China (Fan & Xiao, 1998; Hiu, Siu, Wang & Chang, 2001), Germany (Walsh, Mitchell & Hennig-Thurau, 2001) and Singapore (Leo, Bennett & Hartel, 2005). Regardless of the past track record with CSI research, updating a comparison study of cross-cultural consumer behaviour is still needed as consumers’ purchase behaviour changes over time following their consumption situation and environment change (Yau, 1994). This is especially important among Chinese consumers due to the rapid economic growth that has occurred in recent years. The current quantitative study builds on this previous research to expand the knowledge of cultural similarities and differences related to attitudes and buying behaviours of apparel products.
Methods
Participants
Participants included college students from China and the United States. College students were chosen for three reasons: 1) the college students’ large purchasing power; 2) the ability to generalize the results from this study to previous studies; and 3) the convenience of data collection. The Chinese samples were obtained from a university in Shanghai, a major city in China. Shanghai was chosen as global apparel firms in Shanghai are cognizant of the fast growth increasing their competition, and it represents one of the largest consumer market and major commercial centres for fashion. Although findings from Shanghai participants couldn’t be generalized to the whole Chinese population, the city can be perceived as a good economic indicator in predicting the fashion consumption pattern of the Chinese consumers (Wu & Delong, 2006). The US sample was collected from a Midwestern university in the US.

Harden & Zhang: Attitudes & buying behaviours of students IJHE Vol 6 No 2 2013
159
Although findings from US Midwest participants may not be generalized to the entire United States population, the college population does represent a standard consumption market toward fashion products in the US.
Data were collected from 347 college students from the United States and China. All respondents who reported ages not between 18 through 24 years and those with incomplete responses were deleted, resulting in altogether 317 usable questionnaires, 219 from a Midwestern University in USA, and 98 from a Chinese University in Shanghai, China.
Table 1 Demographic Characteristics of the sample (n= 317)
Sample Characteristics Sample Group Total
US Chinese
Age 18 31.1% (68) 7.1% (7) 23.7% (75)
19 24.2% (53) 27.6% (27) 25.2% (80)
20 11.4% (25) 22.4% (22) 14.8% (47)
21 16.0% (35) 15.3% (15) 15.8% (50)
22 5.5% (12) 16.3% (16) 8.8% (28)
23 7.8% (17) 11.2% (11) 8.8% (28)
24 4.1% (9) 0.0% (0) 2.8% (9)
Gender Male 15.1% (33) 38.8% (38) 22.4% (71)
Female 84.9% (186) 61.2% (60) 77.6% (246)
Year Freshman 44.3% (97) 5.1% (5) 32.2% (102)
Sophomore 14.6% (32) 40.8% (40) 22.7% (72)
Junior 12.3% (27) 19.4% (19) 14.5% (46)
Senior 13.7% (30) 14.3% (14) 13.9% (44)
Fifth year or higher in UG degree 4.6% (10) 6.1% (6) 5.0% (16)
Graduate student 10.5% (23) 14.3% (14.3) 11.7% (37)
Major Technology/Engineering 11.6% (25) 4.1% (4) 9.3% (29)
Social Science 25.7% (55) 21.5% (21) 24.3% (76)
Fashion/ Fine Arts 15.9% (34) 0.0% (0) 10.9% (34)
Humanities 31.3% (67) 34.7% (34) 32.4% (101)
Science/Medicine 15.4% (33) 39.7% (39) 23.0% (72)
Survey instrument
An online survey was constructed using the software Qualtrics. All data collected was anonymous. No identifying information (e.g., name, student identification number) was collected. The survey questionnaire consisted of two parts. Part one included the items adapted from the instrument developed and used by Sproles and Kendall (1986) to measure consumer decision-making mental characteristics. This Consumer Style Inventory (CSI) is composed of 40 Likert-scaled items scored from 1 strongly disagree to 5 strongly agree. Part two included demographic questions (e.g., the participants’ age, gender, year in school and major) and shopping behavioural questions (e.g., frequency of visiting retailers and

Harden & Zhang: Attitudes & buying behaviours of students IJHE Vol 6 No 2 2013
160
purchasing apparel products, actual money amount and percentage of monthly spending on apparel products, and frequency of reading fashion magazines and advertisements.) The shopping behavioural questions profiled the underlying cross-national consumers’ buying behaviours toward apparel products in reality and to compare these buying behaviours between Chinese and American college students.
In this study, the original (English) version of questionnaire was translated from English into Chinese by two translators. The questionnaire was then back translated into English to enhance translation equivalence. The terminology was adapted to achieve an equivalence of meaning rather than a direct translation.
Data collection
An e-mail advertisement was sent to all students in both Universities. The email included the appropriate URL address (English version for participants from the US and Chinese version for participants from China) to an online survey. It took approximately ten minutes to complete the questionnaires. The URL links to the online survey were available to students until at least 200 complete surveys from each University were obtained or the survey had been available for a total of four weeks.
Data entry and analysis
The data analysis of consumer decision-making mental characteristics (Survey: Part 1) was completed by country in two steps following the method used by Sproles and Kendall (1986). The analysis examined the psychometric properties of the Consumer Style Inventory (CSI). First, the dimensionality of the CSI was assessed by examining the factor solution to identify participants’ decision-making characteristics. To obtain the factor solution, a principal components factor analysis was used with a varimax rotation. For comparability with Sproles and Kendall’s work (1986), an eight-factor solution was used for the factor analysis. Specifically, the amount of variance explained by the extracted factors (i.e., their eigenvalues) was noted to judge model adequacy. In addition, item-factor correlations (i.e., factor loadings) and other indices of model adequacy were examined. The purpose of factor analysing the 40-item inventory was to determine if the factors identified by Sproles and Kendall (1986) are common for current Chinese and US sample in this study. In the second step, Cronbach’s alpha coefficient for subscale of items loading above 0.4, the same level used by Sproles and Kendall (1986) for consistency, was computed to assess the scale reliabilities for each factor identified by country. In cross-cultural research, such an approach is common as a first step in determining the generalizability of a model or scale to another culture.
Next, once the consumer decision-making characteristics had been identified, descriptive analysis of profiling consumer style characteristics was developed using the same approach as Sproles and Kendall (1986). First, the three top-loading items for each factor (characteristic) were determined. Next, participants’ raw scores on the three top-loading items were added for each factor by country sample groups. This addition yielded scores of 3 to 15 for each subject on each characteristic. Because participants scored “5” points for strongly agree, and “1” point for strongly disagree in their answer, the more positive attitudes a subject had, the

Harden & Zhang: Attitudes & buying behaviours of students IJHE Vol 6 No 2 2013
161
more points they were given. The means score of each three-item scale for each factor, the percentages of participants scoring high (12-15), medium (7-11) and low (3-6) on each scale, and quartile score ranges were calculated by country. To clearly demonstrate the data scoring for similarities and differences between groups; means, frequencies, quartile score ranges, and percentages were reported.
The demographics and behaviour questionnaires data (Survey: Part 2) were analysed by country. Descriptive statistics and frequencies counts were calculated for age, gender, year in school, major, number of times visiting retailers and purchasing apparel products, actual money amount and percentage of monthly spending on apparel products, and number of times reading fashion magazines and advertisements.
Finally, the consumer style characteristics and the buying behaviours of US and Chinese college students toward apparel products were compared and contrasted. The comparisons were made in three areas to identify and understand the differences and similarities between US and Chinese college students: the validity and reliability of the consumer decision-making styles, the profile of consumer style characteristics, and the actual reported shopping behaviour. The results would identify the factors affecting the fashion attitudes and buying behaviour styles, which will help apparel firms make appropriate globalization strategies for gaining successful global market share.
Results
Consumer decision-making characteristics
A factor analysis was conducted to identify consumer decision-making mental characteristics. The factor analysis results of the 40-item inventory (the Consumer Style Inventory (CSI) developed by Sproles and Kendall (1986)) revealed an eight-factor solution for the 317 participants. The eight factor model appears adequate as it explained 62% of the variation (Sproles & Kendall, 1986); all eight factors have eigenvalues greater than 1.0 (the highest was 7.5 and lowest was 1.1), which is a rule often used to judge model adequacy. Each factor loading was higher than .500 (absolute value) (see Table 2).
Table 2 Consumer Style Characteristics: Eight Factor Model
Style Characteristics and Items FactorLoadings
Factor 1 – Perfectionistic, High-Quality Conscious Consumer
In general, I usually try to buy the best overall quality. .850
Getting very good quality is very important to me. .842
I make special effort to choose the very best quality products. .812
When it comes to purchasing apparel products, I try to get the very best or perfect choice. .760
My standard and expectations for apparel products I buy are very high. .595
Factor 2 – Brand Conscious, “Price Equals Quality” Consumer
The most advertised brands are usually very good choices. .724
Nice department and specialty stores offer me the best products. .703
I prefer buying the best- selling brands of products. .677

Harden & Zhang: Attitudes & buying behaviours of students IJHE Vol 6 No 2 2013
162
Style Characteristics and Items FactorLoadings
The well-known national brands are best for me .673
The higher the price of an apparel product, the better its quality. .661
The more expensive brands are usually my choice .593
Factor 3 – Novelty-Fashion Conscious Consumer
I keep my wardrobe up-to-date with the changing fashions. .756
I usually have one or more outfits of the very newest style. .747
Fashionable, attractive styling is very important to me. .708
To get variety, I shop different fashion retail stores and choose different brands. .629
Factor 4 - Recreational, Hedonistic Consumer
Going shopping is one of the enjoyable activities of my life. .768
Shopping the stores wastes my time. -.766
Shopping is not a pleasant activity to me. -.762
I enjoy shopping just for the fun of it. .703
I shop quickly, buying the first products I find that seems good enough -.626
I make my shopping trips fast. -.625
I really don’t give my apparel products purchases much thought or care. -.581
It’s fun to buy something new and exciting. .548
Factor 5 – Price Conscious, “Value for Money” Consumer
I look carefully to find the best value for the money. .682
The lower price products are usually my choice. .661
I take the time to shop carefully for best buys. .611
I buy as much as possible at sale prices. .581
I carefully watch how much I spend. .552
An apparel product doesn’t have to be perfect, or the best, to satisfy me
Factor 6 – Impulsive, Careless Consumer
I am impulsive when purchasing apparel products. .836
Often I make careless purchases I later wish I had not. .649
I should plan my shopping more carefully than I do. .635
I carefully watch how much I spend. -.510
Factor 7 – Confused by Over-choice Consumer
The more I learn about apparel products, the harder it seems to choose the best. .809
Sometimes it’s hard to choose which stores to shop. .806
All the information I get on different products confuses me. .760
There are so many brands to choose from that often I feel confused. .755
Factor 8 – Habitual, Brand-Loyal Consumer
Once I find an apparel product or brand I like, I stick with it. .721
I have favourite brands I buy over and over. .625
I change brands I buy regularly. -.624
I go to the same stores each time I shop. .573
Extraction Method: Principal Component Analysis.
Rotation Method: Varimax with Kaiser Normalization.

Harden & Zhang: Attitudes & buying behaviours of students IJHE Vol 6 No 2 2013
163
For determining the generalizability of the model, reliability coefficients or Cronbach’s alpha for subscale of top three highest loading items on each factor was computed to assess the scale reliabilities for each factor identified. The alpha estimates were generally similar for both samples, and the reliabilities are satisfactory in all cases with the possible exception of the “Habitual, Brand-Loyal consumer” characteristic in the Chinese sample, where alpha was below .40. Given that an alpha of .70 or better is desired for any measurement scale (Durvasula, Lysonski & Andrews, 1993), the factors “Perfectionistic,” “Brand Conscious,” “Novelty-Fashion Conscious,” “Recreational Shopping” and “Confused by Over-choice” consumer characteristics were stable and internally consistent in the two samples. The factor “Habitual, Brand-Loyal consumer” identified in the factor analysis had values of .735 for the US sample, however, the Chinese sample had a lower reliability with alpha of .350, therefore it may not be considered to be a reliable factor in identifying decision-making styles for the Chinese sample (see Table 3).
Table 3 Reliability Coefficient for Eight Consumer Style Characteristic for combined sample, US sample
and Chinese sample
Consumer Style Characteristics Chronbach Alpha for subscale of top three loading items
Combined US China
Perfectionistic (Factor 1) .866 .863 .868
Brand Conscious (Factor 2) .770 .757 .713
Novelty-Fashion Conscious (Factor 3) .844 .869 .821
Recreational Shopping (Factor 4) .827 .842 .704
Price-Value Conscious (Factor 5) .639 .603 .645
Impulsive (Factor 6) .699 .744 .522
Confused by Over-choice (Factor 7) .808 .794 .719
Habitual, Brand-Loyal (Factor 8) .655 .735 .350
Profiles of Consumer Decision-making Characteristics
Following the same approach used by Sproles and Kendall (1986), a profile of consumer decision-making styles for both the US and Chinese samples were established, employing the subscale of the top three highest loading items. Overall there were several similarities and differences between the US and the Chinese college students as demonstrated by their fashion attitudes. For example, more than 85% of both samples scored high or medium for the ‘perfectionism or high-quality conscious’ consumer characteristics, indicating both US and Chinese consumers in the sample are positively ‘perfectionistic or high-quality conscious’ consumers for apparel products; the large proportion of the Chinese sample scored in the medium range, while the large proportion of US sample scored in low and medium range for the ‘brand consciousness’ consumer characteristic; both samples had similar tendencies for their percentage scoring and quartile score range, and both sets of means scored in the medium range for ‘novelty-fashion consciousness’ consumer characteristic; more than two-thirds of US participants (67.1%) scored in the high range while only 25.5% of Chinese participants scored in that range indicating the US sample had a more positive attitude toward the 'recreational, hedonistic shopping consciousness’; 90% or more of the sample had ‘price conscious’, or ‘Value for money’ consumer characteristic, especially more than half (54.3%) of US sample scored in the high range; the percentage scoring in low range showed a

Harden & Zhang: Attitudes & buying behaviours of students IJHE Vol 6 No 2 2013
164
difference: 31.1% for US sample versus only 10.2% for Chinese sample in ‘impulsiveness or careless’ consumer characteristic; and almost one-quarter of the Chinese sample (23.5%) scored in the high range while only 5% of US sample scored high for the ‘confused by over-choice consumer’ characteristic; 90% of samples had average or advanced ‘habitual, brand-loyal toward consumption consumer’ characteristic while US samples scored slightly higher.
Table 4 Consumer Style Inventory: Statistical Analysis of Three-Item Subscales
Style Characteristics Mean Percentage Scoring: Quartile Score Ranges:
High (12-15)
Medium (7-11)
Low(3-6)
Upper 2nd 3rd Lower
Perfectionistic US 10.47 44.7% 42.5% 12.8% 13-15 12 10-11 3-9
China 11.10 54.1% 37.8% 8.2% 14-15 13 11-12 3-10
Brand Conscious US 7.37 4.6% 55.7% 39.7% 10-15 8-9 7 3-6
China 9.16 13.3% 74.5% 12.2% 12-15 10-11 9 3-8
Novelty-Fashion Conscious
US 8.63 23.7% 48.4% 27.9% 12-15 9-11 7-8 3-6
China 8.51 17.3% 55.1% 27.6% 11-15 10 7-9 3-6
Recreational Shopping
US 11.84 67.1% 27.9% 5.0% 15 13-14 11-12 3-10
China 9.79 25.5% 66.3% 8.2% 13-15 11-12 9-10 3-8
Price-Value Conscious
US 11.67 54.3% 45.2% 0.5% 14-15 13 12 3-11
China 10.64 40.8% 54.1% 5.1% 13-15 12 10-11 3-9
Impulsive US 8.18 12.8% 56.2% 31.1% 11-15 9-10 7-8 3-6
China 9.07 13.3% 76.5% 10.2% 11-15 10 9 3-8
Confused by Over-choice
US 7.05 5.0% 42.5% 52.5% 9-15 7-8 6 3-6
China 9.44 23.5% 68.4% 8.2% 12-15 10-11 9 3-8
Habitual, Brand-Loyal
US 10.41 35.6% 54.8% 9.6% 13-15 12 10-11 3-9
China 9.83 19.4% 73.5% 7.1% 12-15 11 10 3-9
Consumer Buying Behavioural Characteristics.
US college student consumers showed slightly more positive attitudes of buying behavioural characteristics on apparel products than Chinese college student consumers, although both samples had similar tendencies overall. The results demonstrated that US college students visit fashion retailers more frequently than Chinese college students although there was no significant difference in the “Actual purchasing apparel products frequency” between them; Chinese college student consumers were likely to spend a larger proportion of their disposable income on apparel products while both groups of consumers spent almost the same amount of money; and US college students read fashion magazine and advertisements slightly more often than Chinese students, but many from both countries reported never reading fashion magazines (see Table 5).

Harden & Zhang: Attitudes & buying behaviours of students IJHE Vol 6 No 2 2013
165
Table 5 Buying Behavioral Characteristics of the sample (n= 317)
Sample Characteristics Sample group
Total US Chinese
Visiting fashion retailers frequency
Never 0.5% (1) 1% (1) 1% (2)
Once every 2 or more months
21.9% (48) 50% (49) 23% (97)
Once a month 32.9% (72) 21% (21) 29% (93)
2-3 times a month 34.7% (76) 17% (17) 29% (93)
Once a week 6.8% (15) 9% (9) 8% (24)
More than 2-3 times a week
3.2% (7) 1% (1) 3% (8)
Actual purchasing apparel products frequency
Never 1.4% (3) 1% (1) 1% (4)
Once every 2 or more months
35.6% (78) 48% (47) 39% (125)
Once a month 33.3% (73) 34% (33) 33% (106)
2-3 times a month 23.7% (52) 16% (16) 22% (68)
Once a week 5.5% (12) 1% (1) 4% (13)
More than 2-3 times a week
0.5% (1) 0% (0) 0% (1)
Monthly spending on apparel products on average
$00.00 to $25.00 27.1% (59) 25% (24) 26% (83)
$25.01 to $50.00 29.4% (64) 40% (39) 33% (103)
$50.01 to $100.00 25.7% (56) 21% (21) 24% (77)
$100.01 to $150.00 10.6% (23) 6% (6) 9% (29)
More than $150.01 7.4% (16) 8% (8) 8% (24)
Percentage of monthly spending on apparel products
Less than 5% 28.6% (62) 19% (19) 26% (81)
5-10% 32.7% (71) 30% (29) 32% (100)
11-30% 20.7% (45) 37% (35) 26% (81)
31-50% 11.5% (25) 12% (12) 12% (10)
More than 51% 6.4% (14) 2% (2) 5% (16)
Reading fashion magazine frequency
Never 38.9% (84) 50% (49) 42% (133)
Once every 2 or more months
25.0% (54) 26% (25) 25% (79)
Once a month 0.5% (1) 1% (1) 1% (2)
2-3 times a week 21.9% (48) 50% (49) 23% (97)
Once a week 32.9% (72) 21% (21) 29% (93)
More than 2-3 times a month
34.7% (76) 17% (17) 29% (93)
Reading fashion advertisement frequency:
Never 6.8% (15) 9% (9) 8% (24)
Once every 2 or more months
3.2% (7) 1% (1) 3% (8)
Once a month 1.4% (3) 1% (1) 1% (4)
2-3 times a month 35.6% (78) 48% (47) 39% (125)
Once a week 33.3% (73) 34% (33) 33% (106)
More than 2-3 times a week
23.7% (52) 16% (16) 22% (68)
Harden & Zhang: Attitudes & buying behaviours of students IJHE Vol 6 No 2 2013
166
Discussion
The primary objectives of this study were to identify and understand characteristics of fashion attitudes and buying behaviours toward apparel products between US and Chinese college students. In addition, clarification of the factors that impact the differences and similarities among these two markets was investigated.
This study provided an examination of consumer decision-making styles by utilizing the Consumer Style Inventory (CSI) to identify the characteristics of buying attitudes of college student consumers in the US and China. The decision-making styles of college student consumers for both samples were established, and several similarities and differences in decision-making styles were identified between US and Chinese college student consumers.
The factor analysis results of the CSI revealed an eight consumer decision-making mental characteristics for 317 participants: “Perfectionistic”, “Brand consciousness”, “Novelty-Fashion conscious”, “Recreational”, “Price conscious”, “Impulsive”, “Confused by Over-choice” and “Habitual, Brand-Loyal” characteristics. Seven of the eight characteristics confirmed their validity as the scales measuring consumer decision-making styles for both USand Chinese college student consumers with approved reliability in this study, except the “Habitual, Brand-Loyal” consumer characteristic for Chinese consumers. Interestingly, the five factors excluding “Price conscious” and “Impulsive” traits were identified in previous studies investigating this behaviour internationally: the US (Sproles and Kendall, 1986), Korea (Hafstrom, Chae and Chung, 1992), New Zealand (Durvasula, Lysonski & Andrews, 1993), Greece, India (Lysonski, Durvasula & Zotos, 1996), and Germany (Walsh, Mitchell & Hennig-Thurau, 2001), indicating the cross-cultural generalizability of these factors. The “Habitual, Brand-Loyal” trait couldn’t be confirmed for Chinese college student consumers due to its low reliability with alpha of .350 in this study and was also relatively unreliable in most of the countries in previous studies.
This study integrated the concept of consumer decision-making style with responses about actual buying behaviours. Although the results of the profiles of consumer decision-making styles and buying behavioural characteristics between US and Chinese college students aren’t entirely equivalent because of their culture background, overall the similarities outweighed the differences. For example, most college consumers in both countries sought to find the best quality products as much as possible and were conscious of lower prices in general. They had medium to high standard expectations for products, and average or advanced habitual, brand-loyal consumer characteristics. In addition, more than half of consumers in both groups weren’t very brand conscious consumers with moderate level of fashion consciousness, and didn’t plan their shopping and how much they spent when buying. Moreover, most reported spending less than $100 for apparel products once a month, or once every two or more months, and rarely read fashion magazines.
The concept of “Globalization” with the availability of worldwide media and telecommunication tools might have created greater similarity on purchasing styles between young consumers in different nations than older age groups (Tully, 1994). The Chinese economic growth with great rising revenues has affected Chinese youth to be westernizing in recent years as they have become enabled to have a similar level of lifestyle with the people

Harden & Zhang: Attitudes & buying behaviours of students IJHE Vol 6 No 2 2013
167
in western countries, and these westernizing influences are causing a shift in values such as independence, self-expression, openness to new ideas and cultures, flexibility, mobility, and enjoyment of life among Chinese young consumers (Anderson & He, 1998; Moses, 2000). Especially since the US culture and their fashion have influenced young generations in China by the prevalence of US media, it homogenizes their preferences and fashion attitudes of their buying behaviours between US and Chinese youth consumers.
Overall, fashion attitudes and buying behaviour showed similar tendencies between Chinese and US college students as well as several subtle differences distinguished each group’s consumer buying styles. The demographic and psychographic factors including lifestyle values, interests, cultural values, and economic situations have had an impact on characterizing their own fashion attitudes and consumer behaviour of both US and Chinese college student consumers. For instance, more Chinese college student consumers may consider a price is an indicator of quality, or have “Brand conscious” consumer characteristics than American samples, according to the profiles of consumer decision-making characteristics in this study. It may be due to the “face-saving” value, which encourages the consumption of well-known foreign brands for their reputation, and the prevalence of counterfeited and unqualified poor quality products in market, which makes avoiding buying these products as one of the consumer issues for Chinese consumers.
Second, most of US college student consumers showed higher recreational shopping characteristics than Chinese consumers in this study. This may be related to the leisure time usage difference between US and Chinese young people. According to Baker and Hayatko (2000), American teens are heavy users of shopping malls or department stores, more than twice as many as compared to their Chinese counterpart. This logic would be supported by the results of visiting fashion retailers’ frequency in this study: American college student consumers visit retailers slightly more often than Chinese consumers in general, indicating they are likely to prefer going shopping to fashion retailers, not only for actual purchasing but also for window-shopping.
In addition to the “Recreational shopping” characteristic, the factor also supports the reason why less US college students were “Confused by Over-choice” as well. The slightly higher frequency of reading fashion magazines and advertisements and visiting fashion retailers in this study supports the greater maturity of young American consumers, which direct them to be familiar with the market. A culture value difference is a crucial factor to explain the “Confused by Over-choice” characteristics as well: western individualistic culture value, in which people tend to be quite aware of their preference and what they want, vs. Confucianism collectivism culture value, in which people are more concerned with other’s evaluation than their own preference (Hofstede, 2001).
Lastly, US college student consumers seemed to be slightly more concerned with getting the best value for their money and plan their shopping trips more carefully than Chinese students. This may be explained by the differences in the ease of earning their disposable money. While most Chinese students earn their allowance easily from “six-pockets” (parents and grandparents) in the “little emperors” family structure, the majority of US students have part-time jobs to earn their disposal income themselves. The explanation could be strongly

Harden & Zhang: Attitudes & buying behaviours of students IJHE Vol 6 No 2 2013
168
supported by the result of monthly spending reported in this study. The reported proportion of money spent showed that Chinese consumers were likely to spend a larger proportion of their disposable income on apparel products while both consumer groups spent almost the same amount of money regardless of the median income level of Chinese households which was less than the US consumers.
As discussed, there is a strong relationship between consumer decision-making characteristics and actual buying behavioural characteristics in this study. Each buying behavioural result gave strong support to clarifying consumer decision-making characteristics. Since the relationship between consumer decision-making characteristics and actual buying behavioural characteristics was supported in this study, the buying behavioural characteristics will give not only strong support for the consumer decision-making mental characteristics but also better in-depth understanding for their consumer styles identified in previous studies.
Implications
The theoretical analysis in this study provides useful insight on how globalization and cultural background affects consumer buying characteristics among cross-national young consumers for corporations expanding to global markets. Meeting multicultural consumer needs by providing the right products and services in today’s global market is a great challenge for marketers, retailers, and suppliers (Kim, Forsythe, Gu & Moon, 2002). The study of cultural values is still essential to effective globalization and management strategy as it enables the improvement of the quality of products and services.
The findings from this study provide an indication that marketers of US apparel firms could make appropriate globalization strategies for gaining successful global markets. For example, as “Confused by Over-choice” characteristic was strongly confirmed in Chinese samples, marketers could propose the development of special package/products to aid consumers to make faster and more effective buying decisions, and less complicated tags to reduce the stress from over-information (Walsh, Mitchell & Hennig-Thurau, 2001). In addition, according to the results of buying behavioural characteristics in this study, it is suggested that posting an advertisement on worldwide media such as Internet and satellite television would be effective for college student consumers, and it would be appropriate to set prices less than 50 dollars per item for the apparel firm aiming to reach the mass youth consumer market as the highest monthly spending amount on apparel products for both consumers was $25.01 to $50.00 in this study. Furthermore, because of the stronger “Brand Conscious” consumer tendency in Chinese college student consumers, US apparel firms could suggest advertising featuring their brand name as a well-known foreign brand. However, the “Brand-Loyal” characteristics were unconfirmed in the Chinese sample. The major goal of marketers operating in China should be to develop brand loyalty by communicating the benefits, such as lowered risk of buying an unsatisfactory product, time saving and savings in decision-making efforts.
Lastly, the profile of consumer-making style has a broad application in consumer education. Marketing or consumer researchers could add these decision-oriented traits to their inventories of psychographic and lifestyle studies to have better understanding of consumers

Harden & Zhang: Attitudes & buying behaviours of students IJHE Vol 6 No 2 2013
169
from the consumer mental and behaviour aspects (Hiu, Siu, Wang & Chang, 2001; Yu & Zhou, 2010).
By using an established survey from previous studies, and integrating the concept of consumer decision-making style with responses about actual buying behaviours, the differences and similarities of consumer behaviour characteristics, and factors of globalization and culture background affecting the results between US college students and Chinese college students were revealed in this study. These factors can be hints for marketers and educators to help US apparel firms make appropriate globalization strategies for gaining successful global market share in China.
Recommendations
Based on the results of this study, the following recommendations for future research are made. First, the comparability of samples from both countries could be controlled to make more direct comparisons. Although both US and Chinese samples were college students with approximately same average age in this study, there were variations in the number of participants in each country completing the survey, as well as in the demographics such as the proportion of gender, income level and geographic location between US sample and Chinese sample. To gain a better overview to college students for this study, future studies may increase the population size and improve the equivalence of the number of college students in the US and China to gain more valuable information.
Second, although the original eight-factor consumer styles, developed by Sproles and Kendall (1986), were supported in this study, reliability scores of some factors were relatively low and some factors were unstable such as “Brand-Loyal/Habitual” trait. This suggests that further study would be needed to develop new items for these factors so as to improve psychometric properties, or to apply lower scale decision-making model so as to be more applicable to cross-nationals as confirmed in previous studies (Fan & Xiao, 1998: Hiu, Siu & Chang, 2001).
Third, as the development of communication media today, the new field of buying behavioursuch as electronic commerce has been occurring. Questionnaires to examine these alternative buying behaviours suited to today’s market should be developed for future studies. Moreover, future research could examine specific demographic variables on each consumer buying style such as gender, age, major and income. Integrating different variables could provide a more in-depth analysis of the different demographic segments of future cross cultural studies.
Lastly, since the samples collected for this study only examined college students, it isn’t representative of all young consumers in China and the United States, and the results aren’t intended to be generalized. Testing young and non-college groups in future studies would help to establish generalizability of young consumers in both countries.

Harden & Zhang: Attitudes & buying behaviours of students IJHE Vol 6 No 2 2013
170
Biography
Amy Harden, PhD is an Assistant Professor in the Department of Family and Consumer Sciences, Ball State University, Muncie, Indiana, USA. Her field of interest includes technological advances in fashion merchandising: e-commerce, m-commerce; attitude and perceptions as well as international markets.
Yuanyuan Zhang completed her Master’s degree in the Department of Family and Consumer Sciences, Ball State University, Muncie, Indiana, USA. Her field of interest and research included cross-national markets and consumer behaviours in apparel industry. She is currently working in New York doing research for a Japanese trading company.
References
Anderson, P. M., & He, X. (1998). Price influence and age segments of Beijing consumers. Journal of Consumer Marketing, 15(2), 152-169.
Baker, J., & Hayatko, D. (2000). The mall as entertainment: exploring teen girls’ total shopping experience, Journal of Shopping Center Research, 7(1), 29-58.
Bellenger, D. N., & Korgaonkar, P. R. (1980). Profiling the recreational shopper. Journal of Retailing, 56(3), 77-91.
Darden, W.R., & Ashton, D. (1974-75). Psychographic profiles of patronage preference groups. Journal of Retailing, 50, 99-112.
Dickson, M. A., Lennon, S. J., Montalto, C. P., Dong, S., & Zhang, L. (2004). Chinese consumer market segments for foreign apparel products. Journal of Consumer Marketing, 21(5), 301-317.
Durvasula, S., Lysonski, S., & Andrew, C. (1993). Cross-Cultural Generalizability of a Scale for Profiling Consumers’ Decision-Making Styles. The Journal of Consumer Affair, 27(1), 55-65.
Fan, J. X., & Xiao, J. J. (1998). Consumer decision-making styles of young-adult Chinese. Journal of Consumer Affairs, 32(2), 275-294.
Gehrt, K. C., & Carter, K. (1992). An exploratory assessment of catalog shopping orientations.Journal of Direct Marketing, 6, 29-39.
Hafstrom, J. L., Chae, J., & Chung, Y. (1992). Consumer decision-making styles: comparison between United States and Korean young consumers. Journal of Consumer Affairs,26(1), 146-158.
Hiu, A. Y., Siu, N. M., Wang, C. L., & Chang, L. K. (2001). An investigation of decision-making styles of consumers in China. Journal of Consumer Affairs, 35(2), 326-345.
Hofstede, G. (2001). Culture’s consequences: Comparing Values Behaviours, Institutions and Organizations Across Nations. London: Sage Publications.

Harden & Zhang: Attitudes & buying behaviours of students IJHE Vol 6 No 2 2013
171
Jin, B., & Kang, J.H. (2010). Face or Subjective Norm? Chinese College Students’ Purchase Behaviours Toward Foreign Brand Jeans. Clothing and Textiles Research Journal, 28(3), 218-223.
Kim, J.-O., Forsythe, S., Gu, Q., & Moon, S.J. (2002). Cross-cultural consumer values, needs and purchase behaviour. Journal of Consumer Marketing, 19(6), 481-502.
Kunz, G. I., & Garner, M. B. (2007). Going Global: The Textiles and Apparel Industry. New York: Fairchild Publications.
Leo, C., Bennett, R. & Härtel, C. (2005). Cross-cultural differences in consumer decision-making styles. Cross Cultural Management: An International Journal, 12(3), 32-62.
Lastovicka, J. L. (1982). On the validation of lifestyle traits: A review and illustration. Journal of Marketing Research, 19, 126-138.
Lysonski, S., Durvasula, S., & Zotos, Y. (1996). Consumer decision-making styles: A multicountry investigation. European Journal of Marketing. 30 (1 2), 10-21.
Markus, H., & Kitayama, S. (1991). Culture and the self: Implications for cognition, emotion, and motivation, Psychological Review, 98(2), 224-253.
McDonald, W. L. (1993). The role of Demographics, purchases histories and shopper decision-making style in predicting consumer catalog loyalty. The Journal of Direct Marketing, 7(3), 55-65.
Mitchell, V.W., and Bates, L.(1998). UK Consumer Decision-Making Styles. Journal of Marketing Management, 14, 199-225.
Moschis, G.P. (1976). Shopping orientations and consumer uses of Information. Journal of Retailing, 52, 61-70.
Moses, E. (2000). The $100 Billion Allowance: Accessing the Global Teen Market, John Wiley & Sons, New York, NY.
National Center for Education Statistics. (2005, June). 2003-04 National Postsecondary Student Aid Study (NPSAS:04). US Department of Education Institute of Education Sciences, NCES 2005–163.
Sproles, G. B. (1985). From perfectionism to fadism: Measureing Consumers’ decision-making styles. Proceedings, American Council on Consumer Interests, 31. 79-85.
Sproles, G. B., & Kendall, E. L. (1986). A methodology for profiling consumers' decision-marking styles. Journal of Consumer Affairs, 20(2), 267-279.
The World Bank. (2011). The World Development Indicators (WDI) 2010. Retrieved March 24, 2011, from http://data.worldbank.org/data-catalog/world-development-indicators/wdi-2010.
Tully, S. (1994). Teens: the most global market of all, Fortune, 129(10), 90-97.
Tung, R. L. (1995). International organisational behaviour. In F. Luthans (Ed.), Virtual 0B, New York: MacGraw-Hill.

Harden & Zhang: Attitudes & buying behaviours of students IJHE Vol 6 No 2 2013
172
Walsh, G. W., Mitchell, V. W., & Hennig-Thurau, T. H. (2001). German consumer decision-making styles. The Journal of Consumer Affairs, 35(1), 73-96.
Westbrook, R. A., & Black, W. C. (1985). A motivation-based shopping typology. Journal ofRetailing, 61(1), 78-101.
Williams, R. H., Painter, J. J. & Nicholas, H. R. (1978). A policy-oriented typology of grocery shoppers. Journal of Retailing. 54, 27-43.
Wu, J., & Delong, M. (2006). Chinese perceptions of western-branded denim jeans: A Shanghai case study. Journal of Fashion Marketing & Management, 10(2), 238-250.
Yau, M. (1994). Consumer Behaviour in China: Customer Satisfaction and Cultural Values,Routledge, New York, NY.
Yu, J. & Zhou, J.X. (2010). Segmenting Young Chinese Consumers Based on Shopping-Decision Styles: A Regional Comparison. Journal of International Consumer Marketing, 22(1), 59-71.
Zhang, L., Dickson, M. A., & Lennon, S. J. (2002). The distribution channels for foreign-brand apparel in China: Structure, government’s role, and problems. Clothing and Textiles Research Journal, 20(3), 167-180.

International Journal of Home Economics
173
Revolt against the ‘fusspot’ — Positioning oneself as Home Economics teacher
Karin Hjälmeskog
Uppsala University, Sweden
Abstract
Teaching about home and family life has been the task of Home Economics teachers in Sweden for more than hundred years. The school subjects were introduced as part of a societal struggle to better the living conditions for individuals and families. The Home Economics teacher was instructed to transform natural science language understandable to the girls and teach about healthy living. Since 1962 the school subject ‘Home Economics’, now named ‘Home and consumer studies’(HCS), is mandatory for both boys and girls. The teachers teaching the subject, are positioned and positioning themselves in a play of different ways of being HCS teacher. The aim of the study is to examine how HCS teachers position and thus construct themselves. Eight teachers were interviewed. The analysis was undertaken in two steps, first, a HSC-teacher stereotype was established - the typical HCS teacher - as described by the interviewees. Second, a shift was made beyond these dominant beliefs/truths about the profession to locate other stories about of HCS-teacher. The typical HCS teacher was described as a fusspot, proper, whining, lecturing, and as one who knows ‘the right way’. The results reveal how this description has impact on the possibilities for the HCS teacher in school today to be professional and to work according to present steering documents. Furthermore, the results also show how the teachers resist and question the stereotypical picture of the HCS teacher, which thus becomes seriously challenged. Today there are not one but several ways of positioning oneself as HCS teacher.
Keywords: Home Economics, Home and Consumer Studies, Teacher, Construction, Positioning
Introduction
When Home Economics was introduced within the Swedish school system over hundred years ago a new category of teachers was created. For a long time that category were called ‘School kitchen teachers’. The aim in this article is to examine the construction of this specific category of teachers. When doing this I also ask questions about if and how the historical formation of the “School kitchen teacher” has impact on teachers in school today. First I will present some fragments of research that indicates the specific task given to the “School kitchen teacher” during 20th century and a glance back on the history of the school subject in Sweden.
Hjälmeskog: Revolt against the “fusspot” IJHE Vol 6 No 2 2013
174
The School kitchen teacher in history
The task of the School kitchen teacher was to educate women, who in turn should influence the rest of the family and the home. The school subject was introduced in the late 19th
century, during a time that in Sweden can be characterized by worries for a degenerated society. The described complex of problems included falling birth-rate, increasing consumption of alcohol, increasing crime, declining marriage-rate, increased prostitution, increased number of children born outside marriage etc. (Ambjörnsson 1976; Johansson 1987; Ohlander 1995; Vammen 1995). Educating girls in Home Economics was one out of several social efforts to turn this negative development around. This effort was built on the idea that poverty and other insufficient conditions were, at least partly, due to an ignorant housewife, her carelessness and incapability (Johansson 1987; Hjälmeskog 2000).
From this perspective the introduction of Home economics in school can be seen as part of politics, authority action, and social achievements, aiming to promote public health. A main argument for the introduction of the subject was the need for translation of research results from Chemistry and Nutrition into a language that the common person could understand (Johansson, 1987). Palmblad & Eriksson (1995) shows how the School kitchen teachers during the first half of the 20th century were assigned a key role in that work, for example concerning food, housing and hygiene.
Health education in the 20th century was a moral education (Palmblad & Eriksson, 1995). The forms of knowledge and the authorities has changed over time, but the normative elements in the mediation of rules for how to live ones life has been remarkable alike. A gradual change in public health policy from civil duty and collectivism to self-responsibility, where private choice is regarded central for change, can be noticed. But, at the same time as free choice is stressed, it is regarded of great importance that the choices are made in accordance with certain ideas on public health (ibid. p. 150).
School kitchen teachers also had a main role in learning the young generation resource management. Aléx (2003) analyses the Swedish discussion on right and wrong consumption during the 20th century. The terms ‘right’ and ‘wrong’ indicates the normative dimension in the conception of consumption. Among other things, Aléx studied official reports and national syllabuses in Home economics, and in the latter he finds that consumer education is a central theme over time. Strict economy was emphasised, which point at restricted consumption as norm. Saving was regarded something good, so was order and tidiness in general. The capacity of the family to manage resources was regarded of great importance, and that capacity should be intensified by Home economics education. An education guided by moraldecrees such as objectivity, order, rationality and long-term planning. During the 20th century knowledge in household budget and household bookkeeping was included in Home economics education (ibid.).
Out of these fragments from research on public health, consumption and Home Economics education comes the School kitchen teacher, pictured as doing the work assigned to them by the politicians and authorities. The struggle against poverty and social destitution, and for public health, bettered hygiene, housing and a more sound household finance (and in the end

Hjälmeskog: Revolt against the “fusspot” IJHE Vol 6 No 2 2013
175
also a more sound economic situation for the nation) included moral education executed by the School kitchen teacher teaching how to do things the right way.
In the study presented in this article the followers of the School kitchen teachers, i.e. the teacher in Home and consumer studies (HCS), are at stake. The aim is to analyse the construction of the teacher in HCS. This makes it possible to deepen the understanding of the situation of this specific category of teachers today. The picture appearing in the introduction can be understood as a discourse on the HCS-teacher, articulated in a public arena, i.e. the HCS-teacher as presented in official reports and national school documents. This empirical study focuses on how HCS-teachers construct themselves.
Home and consumers studies in school today and during the last hundred years
Today HCS-teachers mainly work in compulsory school (grundskolan) teaching the school subject Home and consumer studies. Counted by hours taught this is the smallest school subject in the timetable. For teachers this means teaching a great amount of pupils every semester. The aims and method of the subject requires the subject to be taught in a specially equipped classroom.
The situation of different categories of teachers in school today can be illuminated by the project School without a timetable, though it is impossible to specifically look at the HCS-teacher as the concept practical aesthetical subjects (PA-subjects) is used. Historically the subjects included in this group are: Art, Music, Physical education, Home and consumer studies and Craft (i.e. textiles, and wood and metal work). The official report (SOU 2005:101) states that the teacher in the so-called PA-subjects seldom are part of the working teams in school, and they seldom take part in pedagogical discussions. Further, the PA-teachers are not part of thematically projects in school to any degree worth mentioning, and if they participate it is as a “funny happening”. The report indicates that PA-teachers are marginalised and subordinated as the specific categories of teachers cannot be distinguished and due to the special status reported.
The three first national curriculum and syllabuses of compulsory school (grundskolan) (Lgr 62, Lgr 69, and Lgr 80) contains the school subject Home Economics. The number of lessons, compulsory for boys and girls, has varied over time. The biggest differences are the possibilities for students to choose optional Home Economics and the length of the lessons. In Lgr62 the subject was mandatory in grade 7 and it was possible for students to choose additional Home Economics in grade 8 and 9. The amount of time for one Home Economics lessons is an important factor when it comes to what kind of teaching is possible. Time limits influence choice of method, possibilities for exercising democracy in the classroom, time for reflection and how assessment is done. The time taught once a week varies from 240 minutes in Lgr62 to 120 minutes in Lgr80. Today when these kinds of decisions are made at the local school it usually varies between 60-120 minutes per week.
An even more accentuated change can be seen in Upper secondary school (gymnasieskolan). Up until 1990 the students were able to choose a program specialising in the area of Home Economics. There were also rural domestic schools, and so-called Home technology courses of different length (one or two semesters). In these programmes, schools and courses Home

Hjälmeskog: Revolt against the “fusspot” IJHE Vol 6 No 2 2013
176
Economics teachers worked, teaching food and nutrition, housing, instruction in family matters, economy, resource management etc. Still a few Home Economics teachers work in upper secondary schools, but not teaching for home and family life, but mainly in vocational education such as hotel management, catering etc. (see Hjälmeskog, 2006).
During the first 70 or 80 years in the history of Home Economics in Sweden the female gender coding was explicit. It was a school subject created by women for women, where only female teachers taught and where the focus was on female tasks in the private sphere, a sphere in turn female coded. The aim of the education was ambiguous. I have shown elsewhere (Hjälmeskog, 2000) different “Home Economics discourses” each representing a different aim for women’s Home Economics education The first three discourses came from analysing official reports, debates and other official documents. In the first discourse, Home Economics as a vocational education, the subject is counted as one among other vocational educations that women could choose from. Secondly, Home Economics as an education for women to be able to full fill their calling as mothers, wives and housewives. The third discourse is in itself ambiguous. It is about teaching women effective house keeping, but the reason for doing that was twofold. Either was the house keeping seen as work, as all work it should be done effectively (the efficient housewife or “the modern housewife”), or should the house keeping be done effectively to free time for the woman to enter the labour market (the working housewife). Finally a fourth discourse was constructed out of “forgotten pearls” from history, i.e. discussions on Home Economics, men and women and education: Home Economics as citizenship education. Here the aim is to include education for home and family life also in boys’ education and thus educate both men and women for all aspects of life, private, public and working life.
When compulsory school (grundskolan) was introduced in the early 1960ies Home Economicsbecame a compulsory subject for both girls and boys. It is stated in the syllabi at the time that Home Economics education should enable boys and girls to do the household chores as well as consumer education (Lgr 62, p. 335). This can be understood as an attempt to question the dualism between femininity and masculinity, as the aim was to educate consumers, not housewives or housemaids (Hjälmeskog, 2004).
Also the content of the school subject have varied over time, since Home economics was introduced in the late 19th century up until today. Questions on what we eat, how to prepare food and meals, choice of foodstuffs etc. has been and still is a central content. In the syllabus from 2000 the area is named “food and meals”. Some areas was included earlier, but are now excluded, such as child-care and family studies. Some are still included, such as cleaning, laundry etc. even though they are not focused as before. The latest revision of the school syllabus was made in 2011, and the main reason for the revision was to make the text more easily understood and, in the case of Home and consumer studies (HCS), more adapted to the amount of time in the timetable. Adjustments were also made due to changes in the grading system. Food and meals are still in focus, and issues concerning private finance is emphasised. One noticeable difference, studying the over a hundred year long history of the subject, is the demarcation of the subject in terms of spatiality. Said simply, a change from regarding the walls of the home or the fence of the farm as the outer limits of the subject, to no spatial limits at all. The whole world is regarded as central also for household work as the

Hjälmeskog: Revolt against the “fusspot” IJHE Vol 6 No 2 2013
177
relations between, the households, the society and the natural environment are at stake. Issues of household management are highlighted in the official report on sustainable consumption (SOU 2005:51). In the report HCS was suggested to play a key role in education for sustainable development. It is possible to understand the revision of the syllabi in 2011 to be in line with this suggestion, as sustainable development was included as the key perspective of HCS.
The study
Theoretical and methodological comments
The empirical study presented in this article is part of the wider project The teacher in the transformation of the Swedish society: The good teacher as a construction on different arenas 1945-2003. The complexity of what it means, and historically has meant to be a good teacher, is a point of departure for the project. Among participating researches some have focused on gender discourses together with other discourses on school, society and education that in complex ways produce understandings related to the good teacher. All of these studies are, in a broad sense, inspired by feminist post structural theories. Gender is seen as produced in and through use of language and other symbolic representations of human beings, society and the world as a whole. Gender is also produced in social practices, by human beings interacting (Butler, 2005; Scott, 1989).
Language and the meaning we assign words today are formed by myriads of earlier discursive practices. A word carries traces of the lives lived by women and men who have spoken them (Nye 1994, p. 162). From this perspective it can be argued that a historical perspective is essential to understand the present. At the same time it is important to stress that such a perspective doesn’t mean to look for similarities between now and the past, rather the contrary. It is the differences that are interesting. For example we can understand the situation of HCS-teachers as subordinated due to the historical roots of the profession, without necessarily finding the historical predecessor, “the School kitchen teacher”, in a subordinated position. Reverse, we can find an equal situation today with historical roots, even though subordination characterised the position in the past.
Also at one moment in time several different discourses are fighting over the power to dictate the right, the true and the good, and thus presenting different possible subject positions. As several discourses are active at the same time it is possible, at least to some degree, to make a choice by activating one specific gender discourse (Butler, 2005; Davies, 1997; Lenz Taguchi, 2004). Further, an analysis drawing from poststructuralist theory shows that the HCS-teacher can be understood as complex, contradictory and always in change. This means that one and the same teacher can both be subordinated and exercise power.
The empirical study consists of interviews with eight HSC-teachers. They were selected to represent a wide spectrum of positioning; this means that they took their teacher exam during different periods of time. Accordingly their teacher education was based on different National curriculum and syllabuses including National curriculum from 1969 (Lgr69), 1980 (Lgr80) and 1994 (Lpo94). They also differ in work experience for example they work in different schools concerning the student’s age and ability. All interviewees were women.

Hjälmeskog: Revolt against the “fusspot” IJHE Vol 6 No 2 2013
178
The interviews took place either in the interviewees working place or in their home, due to the choice of the interviewees. Duration time of the interviews was between one and two hours. I transcribed the recordings and in the analysis I used mainly the transcripts, but I did also re-listen at the tapes at several occasions. The interviews were based on three themes that I presented to the interviewees when starting up. The themes were: (1) expectations from others (the kind of HCS-teacher others want me to be) (2) own expectations (what kind of HCS-teacher do I want to be), and (3) how do I handle the different expectations (this is how I am and why). If needed, I had a set of follow-up question to keep their story to the themes. At the end of the interview I presented some words to describe a HCS-teacher, and the interviewee discussed the relevance of and own thoughts about each of the words (Cf. Pendergast, 2001; 2004). The analysis, with inspiration from Pendergast (2001; 2004), is divided into two steps. First, a HSC-teacher stereotype is characterised from the descriptions produced by the interviewees. Second, a shift beyond dominant beliefs/truths about the profession is pursued by seeking contradictions, deviations, and lack of continuity, instead of avoiding them. Instead of just confirming the already known story the researcher presentsother stories about of HCS-teachers.
Results
In this part of the article I will present the results of my interview study, followed by a discussion.
The “typical” teacher in Home and Consumer Studies
In this first part of my analysis I will, as mentioned above, focus on the homogeneity, stability and coherence. What I see is a discourse about a ‘Typical HCS-teacher’. She, because she is a ‘she’, is often described in negative terms, something also mentioned by the interviewees themselves. Examples on words used are: fusspot, proper, whining, lecturing, knows “the right way”, isolated, moaner, conventional. Other words, not only negative, are also used. To be ambitious can be positive if it is means to do a good job and have ambitions both for one self and for the students. But it can be apprehended as negative if it is a manifestation of fanaticism and lack of sensitivity for the students’ needs and wants. Another example of these ambiguous notions is to be accurate. It can be regarded positive when meaning to take care of things and see that things works, but negative if it means that there is one right way to do things, to be small-minded and to poke ones nose into every detail.
In the descriptions of the “typical” HCS-teacher also the physical appearance of the teacher is addressed. The HCS-teacher is “an elderly lady with some flour on her cheek and a check apron” (teacher C), as “a little chubby” (teacher F) or as a “person who looks to be healthy” (teacher B). Also the teachers interviewed by de Ron (2006) comments the body of the HCS-teacher. For example one of the interviewees says the HCS-teacher is “someone who is overweight and still talks about nutrients”. Also in de Ron’s study a discourse on the “typical HCS-teacher” is articulated, though de Ron names it pattern or form. In her study this pattern is most clearly seen when the interviewees’ talk about how other people, i.e. those who are not HCS-teachers, describes the HCS-teacher.

Hjälmeskog: Revolt against the “fusspot” IJHE Vol 6 No 2 2013
179
The HCS-teacher lives with these ideas of the “typical” HCS-teacher. She/he has to relate to this discourse all the time. When the interviewees in a related study (de Ron, 2006) describe a colleague one of them talks about “walk a tightrope with the pedantry”. Another describes herself with the expression “I am made after a pattern” (ibid.). Often a kind of resistance is expressed as several of the interviewees in my study denote that they do not see themselves as typical HCS-teachers. For example teacher C, when she states: “… I think I don’t fit in this model, I think I am a kind of rebel sometimes”. Several teachers in both studies mention that others tell them that they don’t look like HCS-teachers: “… she said you don’t look like a typical HCS-teacher at all, and I took it as a compliment” (teacher A).
The teachers who at the time of the interviews worked as HCS-teacher also lived with some common nicknames, for example they reported the following: pancake-witch; bun-making-miss; carrot-miss; and meatball-princess. These notions are created outside the academia, outside research and the professional context. Rather, they are created in the everyday school context (cf. Trondman, 1999). An examination of these nicknames shows that the first part of the names, pancake-, bun-, carrot-, and meatball- are all related to food. It could beargued that the food-related part of the names are positive connoted. The second part of the names, on the other hand, is clearly related to women: -witch, -miss, and -princess. Here the implied value of the connotation is less positive. One suggestion is that witch is something negative, princess something positive and, finally, miss is more neutral, or both negative and positive. To sum up, the nicknames used for HCS-teachers reveals the association to food and to women, it is more difficult to state the value of the nicknames, but the food-association draws towards a positive side.
A well known discourse
The ‘typical HCS-teacher’ is well known and tends to remain what she always has been, i.e. unchangeable. She tends to be described in negative terms, even if the nicknames association to food infiltrates some positivity into the picture. The ‘typical HCS-teacher’ exists. It isargued that we can find a well-known discourse on Home and consumer studies and the teacher teaching the subject, which is reflected in official reports, national school documents as well as in interviews. HCS is a subject in the margin, even though the school kitchen teachers in late 19th century were given an important task to teach young women about household management, hygiene and to cook nutritious food, all in line with the latest natural science findings. The HCS-teacher was to teach the rules for how to live our lives, a task clearly a part of the discourse of the “typical HCS-teacher”.
“The familiar tale of home economics” seems to be internationally spread and a more or less common discourse (Brown, 1993; Peterat & De Zwart, 1995; Pendergast, 2001). Pendergast (2001) states:
Home economists: know the field of study is marginalised; know the field is devalued; know the positioning is the result of the history and the origins of the field; know that it is recognised as ‘women’s work’; know that home economics will always struggle for legitimation in a world of narratives which favour certain structures. Home economics teachers know that they will be

Hjälmeskog: Revolt against the “fusspot” IJHE Vol 6 No 2 2013
180
seen as ‘cookers and sewers’; and know that they will continually struggle for it to be otherwise (p. 203, emphasis in original).
Through historical lenses it is possible to understand why the subject is marginalised, it is related to the historical fact that HCS is about what still seems to be regarded women’s work, about the unpaid work in the household, and thus excluded from the economical thinking ruling today. Further, HCS-teachers have been struggling for legitimacy, as economic structures and the public sphere have been, and still are favoured over care and the private sphere.
Less known discourses
In the second step of my analysis I leave the discourse on the typical HCS-teacher, with its stable, rational and coherent subject behind. Then I see totally different HCS-teachers. I see teachers who question and resist being positioned as typical HCS-teachers and thereby open up for variation, change and challenge. They are like rebels as expressed by teacher C: “… I think I don’t fit in this model, I think I am a kind of rebel sometimes”. The teachers themselves talk about the influence structural changes have had on, what I call, their ongoing process of inventing themselves. For example the teacher education reforms are mentioned. New teachers teach more than one subject (teacher A, teacher C, teacher G) and the organising of working-teams in schools (teacher A, teacher B, teacher F). New discourses implicate new ways of positioning as HCS-teachers. The positions are sometimes incompatible and contradictory to the well-known and “typical”, but still possible.
In this study there was not a single position as HCS-teacher. Rather, a spectrum of positions as HCS-teachers is revealed in the interviews. Teachers talked about themselves as good and neat, as someone who likes to tidy up in the HCS-classroom as well as in other places in school, such as the staff room. And those who leave all of this kind of work to the students as well as those who place themselves in the middle between these two extremes. Teacher H tells about the expectations on her to arrange nice meetings, breaking-up day etc., something she says is due to the association between her as HCS-teacher and food. At the same time she means that this is not what she is educated for, arrange for example the breaking-up day is something any teacher should be able to do:
“… and at the same time as one want to stand up for ones colleagues and be positive, one has to be careful about saying yes too often. It is not this kind of role one should have at school” (Teacher H).
Some teachers mean that the ‘practical’ skills are absolutely necessary to teach HCS. Others say that they are all fingers and thumbs and make this to a pedagogical asset, yet other place themselves in between these positions. There are teachers that are proud up-holders for the school-subject they teach and for their profession, also when entering leadership positions. Others prefer not to tell about their occupation. Also other contradictions are expressed in the interviews: some interviewees, on the one hand, say that HCS doesn’t count (Teacher G), and they don’t brag of their profession as HCS-teachers (teacher B) or become happy if they are not taken as HCS-teachers (teacher A). On the other hand some teachers argue the importance of being proud of one’s work and the subject one teaches (teacher F, teacher H).

Hjälmeskog: Revolt against the “fusspot” IJHE Vol 6 No 2 2013
181
When they on different occasions tell that they are HCS-teachers they are always told memories people have from their own time in school:
“… so people always remember that they had Home economics. No one remembers that they learned about nouns during the Swedish lessons, what the Swedish teacher said. But all of them remember that it is not proper to do the dishes under pouring water” (teacher E).
Some of the interviewees’ notes that the memories they are told sometimes are more like jokes, something shown in the use of “pancake witch” and other expressions mentioned above. One way of handling these discourses that places the HCS-teacher as subordinated or marginalised is not to tell that you are a teacher in Home and consumer studies at all.
HCS teachers look very different. As people in general there are bodies of HCS-teachers in all kind of dimensions. Some don’t worry about being a little chubby (teacher F), while others fight to meet up to the expectations of “live as you teach” (teacher B). To sum up, there is no consistent category of HCS-teacher. My results show that it is possible to talk about less well-known discourses of HCS-teachers where they are not at all poky, proper or practical, nor are they marginalised or lack of legitimacy.
Discussion and conclusion
Different discursive practices shape complex systems of meaning, which are apprehended as, and become truths. “The truth” of the teacher in Home and consumer studies is created in everything from official reports, to staff rooms and classrooms. The aim of the empirical study was to examine how HCS- teachers create themselves. In this on-going the HCS teacher positions her-self in ways she sees as possible. The result indicates that several positions are possible. The teachers interviewed in this study say that they are not “typical HCS-teachers”. They are also told so by people around them, mostly referring to physical attributes: they don’t look like HCS-teachers.
By referring to specific discourses in relation to themselves, the teachers show how they take part in the social play of different ways of being a HCS-teacher. In more or less conscious ways they challenge the traditional, stereotype notion of the HCS-teacher. The moralising and the gender coding of both the teacher and thus the subject and its content are questioned.
The interviewees in this study were all female, in that respect they are in line with the stereotype of the HCS-teacher. Even though still most student teachers studying Home and consumer studies in Sweden are female there is a tendency: at least some male student teachers choose HCS as one of their subjects.
As a “daemon” the discourse on the “typical HCS-teacher” seems to keep influencing what positions are possible for HCS-teachers today. One example mentioned above is from the project School without a timetable showing that HCS-teachers seldom are part of teacher teams or thematic work in school, if not as a funny feature. HCS-teachers seems to be expected to keep to cooking and baking, not to work according to the National Curriculum and Syllabus, which makes visible a much more comprehensive and complex far beyond a

Hjälmeskog: Revolt against the “fusspot” IJHE Vol 6 No 2 2013
182
limitation to practical skills, though these are important as well. As one of the teachers in de Ron’s study says:
Sometimes I wonder why not, it is not… how can I put it… no outspoken expectation that I keep to the national steering documents at school, I feel that way. If I do work according to the national steering documents, it becomes rather controversial. I have to keep a low profile to do that.
In what way?
No, the expectations of the subject is very stereotype, nothing have happened and I don’t think they mean to be mean. It’s not impossible. I think they just don’t know (de Ron, 2006, p. 31)
For a school subject to appear as a funny feature may be in line with dominating discourses about the subject and the “typical HCS-teacher”, but to work according the national steering documents aren’t. The quote above shows how such a discourse limit the teacher’s possibilities to act professional, even if the teacher her/him self does not want to be positioned within the discourse of the “typical HCS-teacher”. The teacher in the quote above explains the situation as she continues:
A problem with this [HCS] is that it is easy to comment as it is close to people’s lives. I don’t give opinions on other teachers or the subjects that they teach, if I don’t have knowledge about it, but somehow I feel – but maybe it is because I know what it is like to teach [HCS] – it is so easy to comment on it [HCS] (ibid.).
The teacher in HCS teaches a subject close to all of us as it concerns home and family life. It was and still is a female gendered area. The teacher in the quote above is given limited possibilities to position herself due to the stereotype views on the subject and the HCS-teacher. To be accepted as a member of the school staff when she challenges these stereotypes she needs to “keep a low profile”.
The expectations of the subject, as said by the HCS-teacher’s colleagues above, as “cooking and baking” and its focus on private life seems to be a hindrance for the possibilities to play a key role in education for sustainable development, as proposed in 2005. The subject, in Sweden studied by girls and boys since 1962, is still gender coded. The gender coding is visible at least in two ways. First, HSC is one of the school subjects in which the largest differences in marks between boys and girls, in girls favour, are found (SOU 2009:64). Second, even though equal responsibility for household chores is part of the gender equality policy in Sweden, the focus on private life and household chores seems to make the HSC-classroom mined ground for boys (Petersson, 2007). In line with the ideal of gender equality, household work is the responsibility of women and men alike; but statistics show that the situation in real life still looks different. Women in general take more responsibility and use more time for unpaid household work than men in general (Pipping Ekström & Hjälmeskog, 2006; Molén, 2012). Further, the female coding of home and family life and the separation between private

Hjälmeskog: Revolt against the “fusspot” IJHE Vol 6 No 2 2013
183
and public makes it difficult to address questions of education for sustainable development in a way that include HCS (Wihlborg & Skill, 2004).
This study gives at hand many changing and contradictory ways of being a HCS-teacher. To put it in other words: different ways to position oneself as HCS-teacher is available. However, a dominant discourse still seems to be one about the typical HCS-teacher. This is a discourse characterised by dualistic thinking leading to a marginalising of both the school subject and the teacher in Home and consumer studies. The HCS-teachers in school today handle the presence of this discourse in several ways, both by adopting to it and, as the teacher above, by keeping a low profile, or above all, and this may point towards a brighter future, by stepping out of the isolation in the shadow by revolting against the stereotype of the fusspot.
Biography
Karin Hjälmeskog, PhD is a senior lecturer at Department for Education at Uppsala University. Karin researches and writes about Home Economics Education from several perspectives, for example philosophical, historical, sustainable development, gender and care perspectives. Karin has served as chair in the Swedish Committee for Home Economics and continues Nordic as well as International networking through IFHE.
References
Aléx, Peder (2003). Konsumera rätt – ett svenskt ideal: Behov, hushållning och konsumtion.Lund: Studentlitteratur.
Ambjörnsson, Ronny (1976). Förord. I Ellen Key: Hemmets århundrade. Inledning och urval av Ronny Ambjörnsson. Stockholm: Aldus.
Brown, Marjorie M. (1993). Philosophical studies of Home Economics in the United States: Basic Ideas by which Home Economists understand themselves. Michigan StateUniversity.
Butler, Judith (2005). Könet brinner. Stockholm: Natur & Kultur.
Davies, Bronwyn (1997). The subject of Post-structuralism: a reply to Alison Jones. Gender and Education. 9 (3), 271-283.
de Ron, Lena (2006). Bortom schablonen. En analys med kvinnohistoriskt perspektiv om läraren i hem och konsumentkunskap. (Examensarbete i fördjupningskurs i pedagogik 61-80 poäng.) Stockholm: Lärarhögskolan.
Hjälmeskog, Karin (2000). “Democracy begins at home”: Utbildning om och för hemmet som medborgarfostran. (Uppsala Studies in Education 94.) Uppsala: Uppsala Universitet.
Hjälmeskog, Karin (2004). Konsument-medborgare – vilken utbildning behövs? I Tomas Englund (red). Skillnad och Konsekvens. Mötet lärare – studerande och undervisning som meningserbjudande. Lund: Studentlitteratur, s. 149-168.

Hjälmeskog: Revolt against the “fusspot” IJHE Vol 6 No 2 2013
184
Hjälmeskog, Karin (red.) (2006). Lärarprofession i förändring: Från ”skolkök” till hem- och konsumentkunskap. Stockholm: Lärarförbundets ämnesråd för hushållsvetenskap/Föreningen för svensk undervisningshistoria.
Johansson, Ulla (1987). Att skolas för hemmet: Trädgårdsskötsel, slöjd, huslig ekonomi och nykterhetsundervisning i den svenska folkskolan 1842-1919 med exempel från Sköns församling. Umeå: Umeå Universitet.
Lentz Taguchi, Hillevi (2004). In på bara benet. En introduktion till feministisk poststrukturalism. Stockholm: HLS förlag
Lgr 62 (1962). Läroplan för grundskolan. (Skolöverstyrelsens skriftserie 60.) Stockholm: SÖ-förlaget.
Lgr 69 (1969).Läroplan för grundskolan. Stockholm: Utbildningsförlaget.
Lgr 80 (1980). Läroplan för grundskolan. Stockholm: Liber läromedel.
Lpo 94 (1994). Läroplan för det obligatoriska skolväsendet, förskoleklassen och fritidshemmet. Stockholm: Fritzes.
Molén, Michael (2012). Mäns hushållsarbete ökar – men kvinnor gör fortfarande mest hemma. Välfärd No 1, pp. 13-17.
Nye, Andrea (1994). Philosophia: The Thought of Rosa Luxemburg, Simone Weil and Hannah Arendt. New York, London: Routledge.
Ohlander, Ann-Sofi (1995). Farliga kvinnor och barn. Historien om det utomäktenskapliga. I Kvinnohistoria. Stockholm: Utbildningsradion.
Palmblad, Eva & Eriksson, Bengt Erik (1995). Kropp och politik: Hälsoupplysning som samhällsspegel. Stockholm: Carlssons.
Pendergast, Donna (2001). Virginal Mothers, Groovy Chicks & Blokey Bloke: Re-thinking Home economics (and) Teaching Bodies. Brisbane, Australia: Australian Academic press.
Pendergast, Donna (2004). Constructing a professional identity: A view from within. Caribbean Journal of Home Economics, 3 (1), 3-19.
Peterat, Linda & DeZwart, Mary Leah (red). (1995). An Education for Women: The founding of Home Economics in Canadian Public Schools. Charlottetown: Home Economics Publishing Collective UPEI.
Petersson, Monica (2007). Att genuszappa på säker eller minerad mark: hem- och konsumentkunskap ur ett genusperspektiv. (Göteborg Studies in Educational Sciences 0436-1121). Göteborg: Göteborgs universitet.
Pipping Ekström, Marianne & Hjälmeskog, Karin (2006). 150 år av ”outsourcing” av hemarbete. I Karin Hjälmeskog (red.), Lärarprofession i förändring: Från ”skolkök” till hem- och konsumentkunskap. Stockholm: Lärarförbundets ämnesråd för hushållsvetenskap/Föreningen för svensk undervisningshistoria, 171-191.

Hjälmeskog: Revolt against the “fusspot” IJHE Vol 6 No 2 2013
185
Scott, Joan W (1989). Gender and the Politics of History. New York: Columbia University Press.
SOU 2005: 101. Utan timplan – för målinriktat lärande: Slutbetänkande från Timplanedelegationen. Stockholm: Utbildningsdepartementet.
SOU 2005: 51. Bilen, biffen, bostaden: Hållbara laster – smartare konsumtion: Slutbetänkande av utredningen om en handlingsplan för hållbar konsumtion – för hushållen. Stockholm: Jordbruksdepartementet.
SOU 2009:64. Flickor och pojkar i skolan – hur jämställt är det? Delbetänkande av delegationen för jämställdhet i skolan. Stockholm: Utbildningsdepartementet.
Trondman, Mats (1999). ”Språkkärringar” – finns ”dom”? I Mats Trondman, Kultursociologi i praktiken. Lund: Studentlitteratur.
Vammen, Tinne (1995). Sexualitetens outsider. I Kvinnohistoria. Stockholm: Utbildningsradion.
Whilborg, Elin & Skill, Karin (2004). Jämställd hållbar framtid. Idéer och vardag i samspel.Rapport 5422. Stockholm: Naturvårdsverket.

International Journal of Home Economics
186
Rebranding Home Economics
IFHE Think Tank Committee
Context
The International Federation for Home Economics (IFHE) provided funding support to the IFHE Think Tank Committee to investigate consideration of a rebranding process for the profession. The Think Tank Committee membership varied across the term of this project and all members are thanked for their contributions to this process. The funding support has enabled the continuation of the rebranding process first initiated and being undertaken voluntarily by members and associates of the Think Tank Committee. The goal to rebrand the profession emerged out of the IFHE Position Statement for the 21st Century. Analysis of several hundred surveys, employment of a rebranding consultant, and finally the endorsement of a strategy for rebranding are the key outcomes of this project.
This paper presents the findings of the responses to a Brand Pyramid survey. More than 200 individual and 74 collated responses representing a reported range of from 4 to more than 97 members were received. The survey was translated into several languages, and data translated back to English for inclusion in the development of the Brand Pyramid ensuring a global contribution to the process.
Understanding brands
In the twenty first century all business communication—and much of our social communication—is about brands. It is about building them, protecting them, buying and selling them, and about experiencing them. A ‘brand’ is something that is intrinsic and belongs to the individual in the sense that it is how they think, feel and react to a product, service, business or profession.
According to Davies (2009), a brand includes the perception of something along with its reputation, as well as its tangible look and feel. It epitomizes the character and values. In this way, the products, services and people of an organisation, profession or business are all part of the brand, and affect the way audiences perceive and interact with a given brand. Brands that are recognisable, easy to define, and successful, obtain a brand personality. This gives it a personality. Personality traits can be assigned to a brand, all from the recognition of its name. They remain the point of differentiation separating understanding with recognition.
A brand is regarded as being comprised of a range of components. Commonly, the categories are identified to be:
Attributes
Functional benefits
Rewards
Values
Personality
Brand simplicity

IFHE Think Tank Committee: Rebranding Home Economics IJHE Vol 6 No 2 2013
187
Attributes can be rational or emotional, but they will always be distinctive, always competitive and, most importantly, relevant to the customer. Safety is a good example of a brand attribute. Functional benefits are the second perspective of brands. Essentially benefits are the interpretation of each attribute into a benefit for the consumer. Functional benefits connect with the rewards that come from being associated with the brand. The fourth perspective of the brand is the values of the brand. Values are used to reinforce how the brand makes you feel about yourself. If a brand presents itself as having good old fashioned morals, then chances are your conscience will be clear in purchasing that brand. When a brand is prepared to back itself with a lifetime guarantee, chances are you’ll respond positively to that benefit because it reinforces the value of trust. Values can be viewed from 3 angles: values related to the organisation; values that summarise the brand; and values as they are perceived by customers. The fifth perspective of a brand is personality. Researchers typical invite focus group participants to describe the product they are researching as if it were a person, or a car, or some other ‘personality’ friendly descriptor. The final brand perspective is the essence or simplicity, a complicated fusion of the functional and the emotional components of a brand. This is often represented by a simple logo or slogan that captures the essence of the brand simply. What is branding?
Healey (2008) claims there are five main components to branding: positioning; storytelling; design; price; and customer relationship. The notion of branding is complex and time consuming, and relies on much more than the development of a logo and a slogan. Brands are built over time, and rely on the generation of emotional and social responses that can be consistently expected to be associated with a product, profession or business. With respect to the branding process, these five components are briefly outlined as follows:
Positioning This is to create an intangible idea of what a brand represents, particularly in relation to competitors. It requires interaction with the consumer in a dialogue. Brands (Healy, 2009) make use of “conventional symbols to communicate their essential qualities”.
Storytelling This involves the development of a good emotional story to draw the consumer in.
Design This includes all aspects of the craft of the product, and its packaging.
Price Price is about value, and status. A cheap brand may lose market share because it is perceived as being of a lower quality.
Customer relationship It is important that the customer feels valued by the organisation.

IFHE Think Tank Committee: Rebranding Home Economics IJHE Vol 6 No 2 2013
188
The platform for the Home Economics brand: The IFHE Position Statement
The first issue of the International Journal of Home Economics in 2008 featured the IFHE Position Statement, he21C, formally adopted at the 2008 World Congress and Council meeting. This document came about as result of the initiative of the Think Tank committee, originally convened in Bonn, Germany, in 2005. The following questions were addressed to home economists around the world:
What is home economics?
What is unique about home economics as a field of study and how can this uniqueness be employed to further the profession?
What contribution does home economics make?
What are the key elements of home economics?
What name should ‘home economics’ be?
What evidence is there of the impact of the subject/field in a range of contexts including: education, health, business etc.?
While the thrust of the process was to “utiliz[e] globalization in beneficial ways to further the interests of the profession”, he21c serves also to “locate the profession in a contemporary context”. Firstly, that:
[H]ome Economics is a field of study and a profession, situated in the human sciences that draws from a range of disciplines to achieve optimal and sustainable living for individuals, families and communities
and that the multiple disciplines that Home Economics draws on include:
food
nutrition and health
textiles and clothing
shelter and housing
consumerism and consumer science
household management
design and technology
food science and hospitality
human development and family studies
education and community services
and finally, that the essential component that all home economics courses of study must exhibit the following three dimensions:
1. a focus on fundamental needs and practical concerns of individuals and family in everyday life and their importance both at the individual and near community levels, and also at societal and global levels so that wellbeing can be enhanced in an ever changing and ever challenging environment;

IFHE Think Tank Committee: Rebranding Home Economics IJHE Vol 6 No 2 2013
189
2. the integration of knowledge, processes and practical skills from multiple disciplines synthesised through interdisciplinary and transdisciplinary inquiry and pertinent paradigms; and
3. demonstrated capacity to take critical/ transformative/ emancipatory action to enhance wellbeing and to advocate for individuals, families and communities at all levels and sectors of society.
Importantly, the position statement provides the context for the work presented in this paper associated with future proofing the profession utilising a branding strategy. It is important to note that the rebranding strategy is directed at home economics as a profession, not at the International federation for Home Economics (IFHE) which has a clear brand of its own. The relevant context from the Position statement is cited below under the section subtitledDirections for the decade:
[T]he focus on the decade ahead is on future proofing, which describes the elusive process of trying to anticipate future developments, so that action can be taken to minimise possible negative consequences, and to seize opportunities. Future proofing the Home Economics profession and the Federation is a challenging task but one which is necessary to ensure a sustainable vision both for the profession, and for individual members. The International Federation of Home Economics has commenced its future-proofing strategy by focussing on questions of sustainability, advocacy and the active creation of preferred futures for Home Economics, relevant disciplinary fields, and the profession itself, while critically reflecting upon and being informed by its historical roots. The 2008 IFHE World Congress Home Economics: Reflecting on the past; Creating the future, is a future oriented first step towards this strategy, as is the development of this Position Statement, Home Economics in the 21st Century.
Home Economics as a profession and field of study is challenged by questions of its own sustainability. This mirrors the UN Millennial Goals of Education for Sustainable Development, which aims at developing the pillars of sustainability within the education sector and within individual’s daily lives. Home Economics as a profession similarly is challenged to engage with questions of sustainability. Given the important role home economics has in education for sustainability, it is paramount that the profession future proof itself to ensure its own sustainability.
This project
Support of this project by IFHE enabled the continuation of the re-branding process conceived by the Think Tank Committee and supported by the members of IFHE through the executiveendorsement of the work of the committee, which was developed as an outcome of the development of the IFHE Position Statement for the 21st Century. Analysis of several hundred surveys administered around the globe, employment of a rebranding consultant, and development of a rebranding strategy are the key outcomes of this project. In early phases of the project, the goal was to launch the concept of a home economics ‘brand’ at the IFHE

IFHE Think Tank Committee: Rebranding Home Economics IJHE Vol 6 No 2 2013
190
World Congress in July 2012 in Melbourne, Australia. However, it became apparent that the processes of support and approval required greater deliberation and commitment prior to such a launch. This paper serves as a critical document to assist in this informing process.
Historical records of the Federation document the challenges various names, titles and terminology have posed for the profession, including the complexity of translation across the many languages around the globe. The name of the profession has been researched and theorised by a wide number of scholars, and this question was investigated by the Think Tank Committee as part of the development of the Position Statement, Home Economics in the 21st Century, where it was stated with great clarity and commitment that IFHE would retain the name Home Economics. Internationally, the field of study has consistently retained the name Home Economics and is recognised both within and beyond the boundaries of the profession. Hence, the name of the profession is not in question in this process of rebranding, and serves as a given underpinning all that follows.
Background and data collection
A number of strategies were utilised to inform home economists around the world of the project to develop a strategic approach to rebrand the profession. Key project briefing and data collection opportunities occurred in the following ways:
1. All IFHE 2008 Congress registrants received a copy of the IFHE Position Statement in their Congress satchel. Additional copies were also made available for those seeking extra copies. Attention was drawn to the Directions for the next decade section of the position statement which outlined the need for future proofing and rebranding the profession.
2. The inaugural issue of the International Journal of Home Economics (IJHE) featured the Position Statement, an outline of the collaborative process of producing the statement, and responses to the statement from prominent international home economists. Also featured in this issue was a peer reviewed journal article with the title he21C: A cross cultural comparative study,authored by Yvonne Dewhurst and Donna Pendergast, which provided a cross cultural study of perceptions of excerpts taken from the Position Statement.Recommendations to IFHE were made in this paper including the development of a re-branding strategy in order to future proof the profession.
3. At the 2008 World Congress the Special Organizational Member Event featured the unpacking of the Position Paper as an introduction, then outlined the process of data collection for the re-branding strategy. The methodology of developing a Brand Pyramid was outlined. This included the development of a research instrument in the form of a survey. Approximately 70 people attended this specially devised session on behalf of their professional organizations. A list of more than 20 people keen to apply the strategy in their context was solicited. The materials were distributed to these representatives and responses to the survey (see Table 1) have been received from around the world.

IFHE Think Tank Committee: Rebranding Home Economics IJHE Vol 6 No 2 2013
191
4. At the 2009 Leadership meeting a group session was conducted and data collected from participants at the meeting. As a follow-up to this session, the Vice-Presidents and regional representatives subsequently conducted their own data collection around the globe using the materials produced by the Think Tank committee.
5. Data were sent to the Think Tank convenor and collated for the purposes of creating a Home Economics Brand Pyramid, from which the underpinning formulation of a brand and a slogan could be achieved, as a starting point for the rebranding process.
The Brand Pyramid research process was used to obtain information used as a basis for informing the rebranding process. The brand pyramid approach is widely used by marketing experts to redefine and provide a pathway for rebranding.
Stakeholders from a range of sources around the globe were asked to follow a standardised process to engage with the brand pyramid exercise. Some of the responses came from workshops, and some from individual surveys. The following questions, presented in Table 1, guided the data collection.
Table 1 Survey collection instrument
Question Response
Attributes
1. What is the first thing that comes to mind when you hear ‘Home Economics’?
2. What do you believe are the fundamental principles of ‘Home Economics’?
Functional Beliefs
1. What is a key feature of the role of teachers/ practitioners in ‘Home Economics’?
2. How does the name ‘Home Economics’ play a part in the perception of the field
Rewards
1. What are the benefits of learning about ‘Home Economics’?
2. What do you and your students/clients find most enjoyable?
Values
1. What outcomes are you hoping students/clients will take from ‘Home Economics’?
2. How does ‘Home Economics’ benefit in the long term
Personality
1. If the field were a person, what kind of person would it be?
2. How would you describe the person?
3. Is this person ‘fun’, ‘outgoing’ … (list the words to describe the person)?
Brand Essence
1. Does the term ‘Home Economics rely on a prior knowledge by potential clients/students? If so, how?
2. Would this limit the capacity to gain a new client base?

IFHE Think Tank Committee: Rebranding Home Economics IJHE Vol 6 No 2 2013
192
As an example of the diversity of representation, the sources included:
Finnish Home Economics Professionals
Canadian Home Economics Academics
Australian high school Home Economics students
Irish Preservice Teachers
The International Federation of Home Economics Think Tank Committee
A cohort of IFHE Leadership delegates
Data analysis
Word Frequency Analysis was applied using the latest version of Nvivo, qualitative analysis software.
The following steps were followed:
1. All data were entered verbatim from the response sheets into an excel spreadsheet, which can be used as a casebook of data and attributes for future NVivo analyses. When specific questions had been left unanswered, a nil response (0) was entered.
2. Any parts of responses that could not be deciphered were marked and a second opinion was sought. Any parts of responses, or responses, were could still not be deciphered were removed from the final casebook.
3. Responses that included extended descriptors, phrases and sentences were reduced to one or more words. For example, the phrase ‘life skills development’ was reduced to the category title of ‘life skills’.
4. Once descriptors had been allocated, the content of each response was analysed and the ideas were collected under a category title according to shared themes. For example, responses such as ‘honest’ and ‘sincere’ were included in a single category (from the personality section) in order to limit the number of categories for analysis. New categories were inductively created when the themes and descriptors did not fit in to an existing category, or share ideas with the preceding responses.
5. The majority of surveys include multiple responses for each question or multiple ideas within an answer. Where these types of multiple responses have been given, each of the answers, or ideas contained therein, has been individually categorised and included in the analysis of responses. The phrase ‘a discipline that examines how families work together to manage their resources’, for example, has been amended to reflect the categories discipline, family and resource management. The category titles are used in place of the responses in the Excel file.
6. As a result of the inclusion of individual responses, rather than using only a single response to each question from each survey, the analyses may indicate, for example, that a particular question has received over 200 responses.
7. Specific categories were inductively identified through the initial analysis of responses to particular questions. Some categories, such as the ‘dynamic/ multi-faceted’ category in the rewards section, group together more than one related idea.

IFHE Think Tank Committee: Rebranding Home Economics IJHE Vol 6 No 2 2013
193
8. Where possible, the same category titles have been used for responses to related questions. The responses to the two questions about ‘values’, for example, have been coded according to the same categories which can then be used to collectively analyse all responses to the questions in this section.
9. The only exceptions to this approach have been in the ‘functional beliefs’ and ‘brand essence’ sections of the survey. The questions in both of these sections have very different areas of focus. The initial question in the ‘functional beliefs’ section, for example, is focused on ‘the role of teachers/ practitioners in home economics’, whereas the second question is focused on the name of the discipline. As a result of these divergent foci, the responses to these questions have not been collectively analysed.
10. The content analysis and creation of categories had been achieved prior to the analysis of the second set of data, which are included in the second worksheet of the two excel workbooks. These data were transcribed and described using the methods described.
11. Unlike the initial analysis, however, the content analysis used both inductive and deductive approaches to categorising responses. The thematic categories derived from the responses were used to guide the analysis of responses to each question, and in each section, from the 13 July data and collection of these responses under category titles. When the responses from the 13 July data did not fit within the existing response categories, the inductive approach used in the initial phase of data analysis was used to create new categories.
12. Once all of the responses had been categorised, the number of responses in each category were examined. Each worksheet contains the responses to the questions within individual sections of the survey and, where appropriate (see point 9), the total responses within each section have been provided.
13. The data have been presented predominantly in the form of tag clouds, which show proportional frequency of terms. This is a valid means of visual graphical presentation rather than the presentation of a series of tables of numerical data.
Findings
Following are the findings of each of the brand pyramid categories in the following order:
Attributes
Functional benefits
Rewards
Values
Personality
Brand simplicity

IFHE Thinktank: Rebranding Home Economics IJHE Vol 6 No 2 2013
194
Attributes
There were two questions associated with attributes, each will be presented separately.
1. What is the first thing that comes to mind when you hear ‘Home Economics’?
2. What do you believe are the fundamental principles of ‘Home Economics’?
Figure 1 Attributes - What is the first thing that comes to mind
when you hear ‘Home Economics’?
Figure 2 Attributes 2 - What do you believe are the
fundamental principles of ‘Home Economics’?
There is no surprise that the words home and economics stand out. Food, cooking and sewing are also very clearly linked. Importantly family and life are quite prominent.
Food, cooking and sewing are again significant. However, other key words here include: family, learning, life, skills and wellbeing

IFHE Thinktank: Rebranding Home Economics IJHE Vol 6 No 2 2013
195
Functional beliefs
There were two questions associated with functional benefits, each will be presented separately.
1. What is the key feature of the role of teachers/practitioners in ’Home Economics’?
2. How does the name ‘Home Economics’ play a part in the perception of the field?
Figure 3 Functional Beliefs - What is the key feature of the
role of teachers/practitioners in ’Home Economics’?
Figure 4 Functional Beliefs - How does the name ‘Home Economics’
play a part in the perception of the field?
Here the most prominent word is teaching, understandable given that the question asks the key role of teachers/practitioners.
Home Economics and cooking are the most obvious words in this tag cloud. It is important to note that while not frequent, the gendered term woman appears.

IFHE Thinktank: Rebranding Home Economics IJHE Vol 6 No 2 2013
196
Rewards
There were two questions associated with rewards, with both questions presented in one figure.
1. What are the benefits of learning about ‘Home Economics’?
2. What do you and your students/clients find most enjoyable?
Figure 5 Rewards (both questions)
While cooking and sewing make their usual appearance, it’s clear that practitioners and students of Home Economics value learning life
skills.

IFHE Thinktank: Rebranding Home Economics IJHE Vol 6 No 2 2013
197
Values
There were two questions associated with values, with each questions presented in separate figures.
1. What outcomes are you hoping students/clients will take from ‘Home Economics’?
2. How does ‘Home Economics’ benefit in the long term?
Figure 6 Values - What outcomes are you hoping
students/clients will take from ‘Home Economics’?
Figure 7 Values - How does ‘Home Economics’ benefit in the
long term?
The outcomes word frequency tag cloud shows that while cooking (and to a lesser extent sewing) is highly valued, learning skills, for everyday life and a healthy home are very important.
The question here is “How does ‘Home Economics’ benefit in the long term?” The interesting results show a high frequency of life, skills and you.
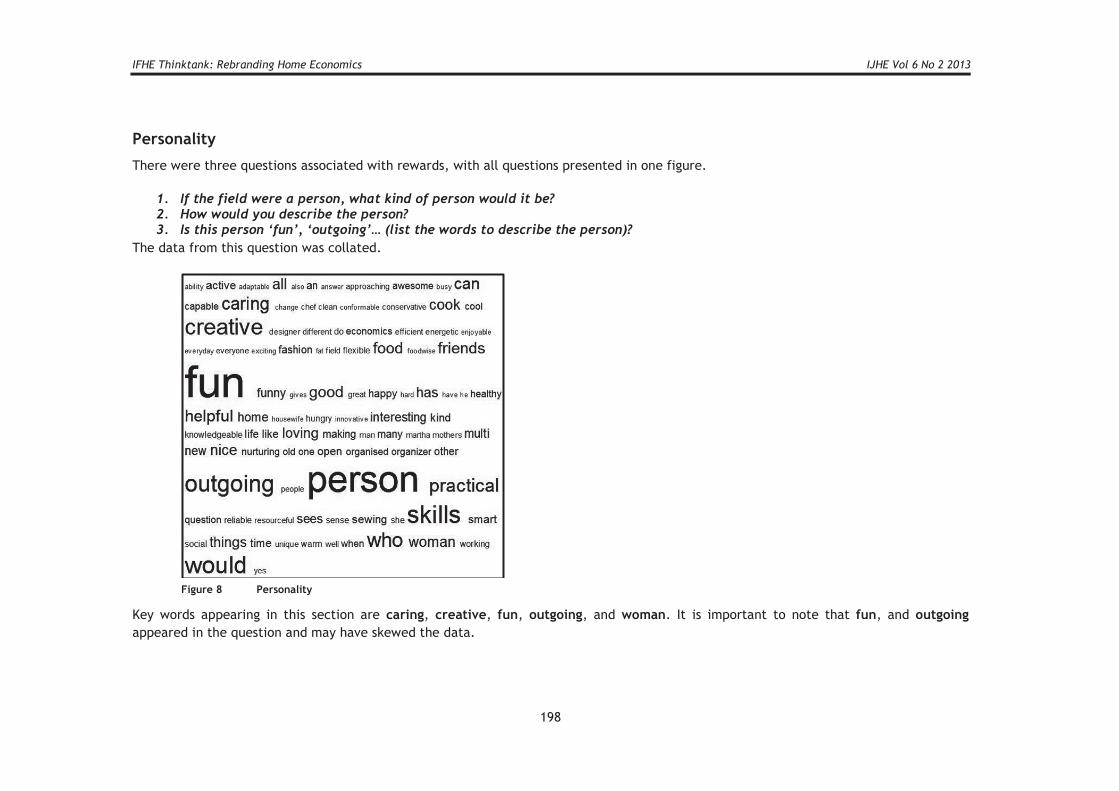
IFHE Thinktank: Rebranding Home Economics IJHE Vol 6 No 2 2013
198
Personality
There were three questions associated with rewards, with all questions presented in one figure.
1. If the field were a person, what kind of person would it be?2. How would you describe the person?3. Is this person ‘fun’, ‘outgoing’… (list the words to describe the person)?
The data from this question was collated.
Figure 8 Personality
Key words appearing in this section are caring, creative, fun, outgoing, and woman. It is important to note that fun, and outgoing
appeared in the question and may have skewed the data.

IFHE Thinktank: Rebranding Home Economics IJHE Vol 6 No 2 2013
199
Brand essence
There were two questions associated with values, with each questions presented in separate figures.
1. Does the term ‘Home Economics’ rely on a prior knowledge by potential clients/students? If so, how?
2. Would this limit the capacity to gain a new client base?
Figure 9 Brand Essence - Does the term ‘Home Economics’
rely on a prior knowledge by potential
clients/students? If so, how?
Figure 10 Brand Essence - Would this limit the capacity to gain a new
client base?

IFHE Thinktank: Rebranding Home Economics IJHE Vol 6 No 2 2013
200
Word Frequency comparison across areas
Each of the question sections from all respondents were analysed for the 100 most common words and word stems (for example, Answers covers answer, answered, answerers, answers). Within each set, the word/word stem was calculated at a weighted percentage. These weighted percentages were then compared across all areas.
Table 2 Word Frequency comparison
Word stem Attributes Brand Essence
Functional Beliefs
Personality Rewards Values Grand Total
Home 2.76 2.7 2.86 2.52 2.58 2.57 15.99
Cooks 2.79 2.46 2.55 2.46 2.71 2.56 15.53
Skills 2.16 2.05 2.17 2.13 2.24 2.32 13.07
Life 2.11 1.93 2 1.92 2.12 2.18 12.26
sewing 2.14 1.8 1.92 1.81 1.94 1.84 11.45
economics 1.82 1.86 1.85 1.67 1.7 1.68 10.58
Food 1.72 1.52 1.59 1.54 1.6 1.6 9.57
learns 1.49 1.45 1.43 1.39 1.66 1.53 8.95
You 1.39 1.51 1.39 1.37 1.56 1.55 8.77
How 1.16 1.1 1.17 1.07 1.15 1.23 6.88
making 0.93 0.89 0.96 0.9 0.97 0.98 5.63
everyday 0.92 0.84 0.87 0.84 0.95 0.89 5.31
things 0.89 0.86 0.86 0.87 0.92 0.9 5.3
can 0.79 0.85 0.82 0.85 0.88 0.89 5.08
teaching 0.83 0.76 1.01 0.76 0.75 0.78 4.89
persons 0.76 0.79 0.75 0.96 0.76 0.76 4.78
family 0.9 0.71 0.73 0.69 0.72 0.74 4.49
fun 0.7 0.68 0.69 0.89 0.68 0.67 4.31
knowledge 0.65 0.7 0.67 0.66 0.7 0.7 4.08
about 0.67 0.63 0.71 0.6 0.65 0.63 3.89
basic 0.66 0.61 0.65 0.58 0.64 0.63 3.77
helps 0.59 0.55 0.61 0.62 0.58 0.6 3.55
would 0.55 0.59 0.54 0.68 0.54 0.55 3.45
having 0.53 0.64 0.55 0.54 0.55 0.56 3.37
yes 0.52 0.75 0.53 0.54 0.51 0.51 3.36
practical 0.53 0.5 0.52 0.56 0.55 0.52 3.18
managing 0.54 0.48 0.5 0.48 0.54 0.55 3.09
what 0.49 0.53 0.51 0.48 0.5 0.5 3.01
people 0.48 0.55 0.47 0.47 0.45 0.47 2.89
subject 0.48 0.52 0.47 0.44 0.48 0.44 2.83
school 0.51 0.51 0.46 0.42 0.43 0.43 2.76
when 0.45 0.44 0.43 0.46 0.46 0.5 2.74

IFHE Thinktank: Rebranding Home Economics IJHE Vol 6 No 2 2013
201
Word stem Attributes Brand Essence
Functional Beliefs
Personality Rewards Values Grand Total
new 0.43 0.48 0.42 0.47 0.47 0.46 2.73
good 0.45 0.43 0.44 0.48 0.44 0.45 2.69
own 0.38 0.39 0.39 0.38 0.45 0.49 2.48
healthy 0.4 0.37 0.39 0.4 0.39 0.44 2.39
more 0.38 0.43 0.39 0.37 0.41 0.41 2.39
one 0.38 0.4 0.37 0.4 0.42 0.39 2.36
household 0.43 0.37 0.41 0.35 0.37 0.38 2.31
your 0.38 0.37 0.36 0.37 0.4 0.42 2.3
society 0.43 0.36 0.36 0.35 0.38 0.41 2.29
needs 0.38 0.41 0.37 0.36 0.38 0.37 2.27
caring 0.38 0.35 0.35 0.42 0.35 0.36 2.21
students 0.36 0.36 0.42 0.34 0.36 0.36 2.2
thinks 0.36 0.43 0.38 0.35 0.34 0.33 2.19
many 0.34 0.38 0.36 0.37 0.34 0.37 2.16
other 0.35 0.34 0.37 0.36 0.37 0.36 2.15
has 0.34 0.36 0.36 0.39 0.34 0.33 2.12
design 0.37 0.33 0.35 0.35 0.38 0.34 2.12
field 0.33 0.35 0.39 0.37 0.34 0.33 2.11
works 0.36 0.34 0.36 0.34 0.36 0.33 2.09
does 0.34 0.39 0.35 0.34 0.33 0.33 2.08
all 0.35 0.34 0.34 0.38 0.33 0.33 2.07
different 0.33 0.32 0.34 0.32 0.32 0.33 1.96
nutrition 0.35 0.31 0.33 0.3 0.34 0.33 1.96
well 0.34 0.32 0.33 0.32 0.32 0.33 1.96
creative 0.31 0.3 0.31 0.39 0.33 0.31 1.95
clothing 0.33 0.3 0.32 0.31 0.34 0.34 1.94
taking 0.33 0.32 0.29 0.31 0.32 0.33 1.9
get 0.31 0.32 0.3 0.3 0.35 0.31 1.89
eating 0.35 0.35 0.35 0.42 0.37 1.84
like 0.3 0.29 0.32 0.32 0.3 0.29 1.82
future 0.28 0.27 0.3 0.27 0.32 0.33 1.77
living 0.32 0.27 0.29 0.26 0.29 0.3 1.73
term 0.27 0.33 0.3 0.27 0.27 0.28 1.72
because 0.26 0.35 0.28 0.27 0.27 0.28 1.71
being 0.31 0.27 0.27 0.27 0.29 0.29 1.7
from 0.27 0.31 0.29 0.26 0.27 0.3 1.7
know 0.41 0.46 0.4 0.43 1.7
interesting 0.26 0.28 0.28 0.3 0.26 0.28 1.66
understanding 0.25 0.27 0.26 0.26 0.27 0.28 1.59

IFHE Thinktank: Rebranding Home Economics IJHE Vol 6 No 2 2013
202
Word stem Attributes Brand Essence
Functional Beliefs
Personality Rewards Values Grand Total
who 0.25 0.27 0.25 0.33 0.24 0.25 1.59
fashioned 0.33 0.31 0.33 0.29 0.3 1.56
outgoing 0.24 0.24 0.23 0.34 0.23 0.23 1.51
enjoy 0.28 0.27 0.28 0.34 0.3 1.47
way 0.23 0.24 0.26 0.24 0.25 0.25 1.47
benefit 0.23 0.23 0.23 0.23 0.24 0.29 1.45
part 0.26 0.24 0.25 0.22 0.24 0.21 1.42
values 0.24 0.22 0.24 0.23 0.23 0.26 1.42
able 0.22 0.22 0.22 0.23 0.25 0.27 1.41
some 0.23 0.26 0.24 0.22 0.22 0.21 1.38
health 0.23 0.21 0.21 0.21 0.23 0.26 1.35
hands 0.21 0.22 0.22 0.21 0.27 0.22 1.35
old 0.22 0.25 0.23 0.24 0.2 0.21 1.35
very 0.22 0.24 0.23 0.23 0.21 0.22 1.35
answers 0.23 0.21 0.23 0.23 0.22 0.22 1.34
name 0.21 0.24 0.27 0.21 0.2 0.2 1.33
use 0.31 0.32 0.34 0.34 1.31
teacher 0.2 0.21 0.24 0.23 0.21 0.2 1.29
also 0.2 0.2 0.21 0.23 0.2 0.24 1.28
preparing 0.21 0.2 0.22 0.24 0.22 1.09
cleaning 0.21 0.2 0.22 0.2 0.22 1.05
change 0.23 0.21 0.2 0.2 0.2 1.04
gives 0.23 0.24 0.26 0.24 0.97
creating 0.22 0.22 0.22 0.24 0.9
knows 0.39 0.41 0.8
experiences 0.2 0.25 0.23 0.68
useful 0.31 0.35 0.66
don't 0.25 0.2 0.2 0.65
independently 0.2 0.2 0.22 0.62
class 0.2 0.21 0.2 0.61
give 0.23 0.27 0.5
choices 0.19 0.26 0.45
may 0.25 0.2 0.45
create 0.21 0.23 0.44
friends 0.24 0.2 0.44
see 0.23 0.2 0.43
together 0.21 0.21 0.42
eats 0.35 0.35
fashion 0.33 0.33

IFHE Thinktank: Rebranding Home Economics IJHE Vol 6 No 2 2013
203
Word stem Attributes Brand Essence
Functional Beliefs
Personality Rewards Values Grand Total
enjoyable 0.29 0.29
loving 0.24 0.24
nice 0.24 0.24
cleanness 0.23 0.23
better 0.22 0.22
development 0.22 0.22
experiment 0.21 0.21
time 0.21 0.21
woman 0.21 0.21
really 0.2 0.2
social 0.2 0.2
stuff 0.2 0.2
Figure 11 Top 20 words across all areas

IFHE Thinktank: Rebranding Home Economics IJHE Vol 6 No 2 2013
204
Synthesis of findings
Following the Analysis stage of rebranding, it is crucial to synthesise the findings in order to develop a range of proposed logos and slogans in order to commence the lengthy process of gaining brand equity. The following pyramid serves as a visual synthesis of the tag clouds previously presented. The brand pyramid provides a useful way of synthesising each of the elements involved in the rebranding process.
Figure 2 Brand Pyramid for Home Economics
Discussion and Conclusions
There is much to be said for the existing brand equity presented as a result of the Brand Pyramid exercise. The brand pyramid provides insight into the existing equity in the home economics brand, which strongly reflects the IFHE Position Paper. In light of this position of strong equity, the IFHE is committed to re-branding and repositioning, not renaming the profession, which has historically led to a reversion to the original name, ‘home economics’. The existence of this pattern means that the title ‘home economics’ already has brand equity.
Brand equity is the added value that a brand is given beyond the functionality benefits it provides, and this is developed over a long period of time. ‘Home Economics’ would lose recognition if its name was to change, and as a result would lose the brand equity it has accrued over more than 100 years. Re-establishing brand equity requires returning to the

IFHE Thinktank: Rebranding Home Economics IJHE Vol 6 No 2 2013
205
fundamentals of marketing and brand identity must be re-established, its meaning needs to be re-developed. That is why it is important to re-brand the home economics profession.
Bibliography
Airey, D. (2012). Crowdsourced design is a risky business. Wired.co.uk Retrieved 23 October, 2012, from http://www.wired.co.uk/news/archive/2012-04/11/crowdsourced-design-risky-business
Balmer, J. (2006). Comprehending corporate marketing and the corporate marketing mix,Working Paper Series No. 06/08. Bradford: Bradford University School of Management.
Boatwright, P., Cagan, J., Kapur, D., & Saltiel, A. (2009). A step-by-step process to build valued brands. Journal of Product & Brand Management, 18(1), 38-49.
Corcoran, I. (2011). The art of digital rebranding. New York: Allworth Press.
Davies, M. (2009). The fundamentals of branding. Lausanne, Switzerland: Thames & Hudson.
Davis, M. (2008). On identifying our profession. International Journal of Home Economics, 1(1).
Dewhurst, Y., & Pendergast, D. (2008). he21C. International Journal of Home Economics, 1(1).
Dowdle, H. (2012). Bring Back Home Economics in Schools! Retrieved 10 October 2012, from http://www.cookinglight.com/eating-smart/nutrition-101/school-home-economics-00412000077150/
Healey, M. (2008). What is branding? Mies, Switzerland: RotoVision.
Internet World Stats: Usage and Population Statistics. (2012). Retrieved 10 October 2012, from http://www.internetworldstats.com/top20.htm
Kaikati, J., & Kaikati, A. (2003). A rose by any other name: rebranding campaigns that work. Journal of Business Strategy, 24(6), 17-23.
Kitchin, T. (2003), Corporate social responsibility: a brand explanation, Journal of Brand Management,. 10 (4/5), pp. 312-26.
Mixing the old and the new: How to succeed with corporate rebranding (2008). Strategic Direction, 24(7), 6-8.
Magrabi, F., & Iaker, G. (1981). State Strategies for New Initiatives in Home Economics.Washington, DC: Department of Agriculture, Science and Education
Parker, B. (2009). A comparison of brand personality and brand user-imagery congruence. Journal of Consumer Marketing, 26(3), 175-184.

IFHE Thinktank: Rebranding Home Economics IJHE Vol 6 No 2 2013
206
Poderis, T., & Braun Poderis, J. (2011). Pro Bono Services for Your Organization. Raise-funds.com Retrieved 23 October, 2012, from http://www.raise-funds.com/2007/pro-bono-services-for-your-organization/
Rhodes, J. (2011). Food & Think. Smithsonian.com Retrieved 10 October, 2012, from http://blogs.smithsonianmag.com/food/2011/09/is-home-economics-class-still-relevant/
Samson, M. (2012). Crowdsourced design is not a risky business. Wired.co.uk Retrieved 23 October, 2012, from http://www.wired.co.uk/news/archive/2012-05/03/crowdspring
Spaeth, T. (2012). What does it cost? Discussion of identity issues Retrieved 23 October, 2012, from http://www.identityworks.com/issues/issues7.htm
Stuart, H. J. (2011). An identity-based approach to the sustainable corporate brand. Corporate Communications, 16(2), 139-149.
Toluna: Opinions for all. (2011). Retrieved 10 October, 2012, from http://us.toluna.com/opinions/782001/Do_they_still_teach__Home_Economics__in_high_school%3F
Topalian, A. (2003). Experienced reality: The development of a corporate identity in the digital era. European Journal of Marketing, 37(7/8).
Torres, A. (2010). International Committee of the Red Cross:emblems of humanity. Marketing Intelligence and Planning, 28(2), 223-235.
Urde, M. (2009). Uncovering the corporate brand's core values. Management Decision, 47(4).
Veit, H. (2011). Time to Revive Home Ec. The New York Times: Opinion Pages Retrieved 10 October 2012, from http://www.nytimes.com/2011/09/06/opinion/revive-home-economics-classes-to-fight-obesity.html
Winchester, M., & Romaniuk, J. (2008). Negative brand beliefs and brand usage. International Journal of Market Research, 50(3).
Winchester, M., Romaniuk, J., & Bogomolova, S. (2008). Positive and negative brand beliefs and brand defection/uptake. European Journal of Marketing, 42(5/6).

International Journal of Home Economics
207
Corporate social responsibility: Comparison of outward and inward-oriented manufacturers
Prabhjot Kaur & Navjot Kaur
Government Home Science College, Continental Group of Institute
Abstract
The knitwear manufacturing units of Ludhiana in Northern India are facing an unusual situation as some of US based buyers cancelled their orders due to theallegations of child labour practices. This had a negative impact on the performance and growth of the sector. This study was undertaken to throw light on the adoption of Corporate Social Responsibility (CSR) with special focus on commitment - towards labour and workplace practices among inward- oriented and outward-oriented knitwear units of Ludhiana. Eighty industrial knitwear units belonging to the Knitwear Apparel cluster of Ludhiana (Punjab) were surveyed. Using a random sampling method (Lottery method) and an interview questionnaire, data regarding CSR practices were collected from 80 units in four major blocks. The results revealed that the majority of knitwear units provided conducive environments for employees to operate, with differences based on company orientation. Proper workforce practices were followed by most of outward-oriented units, like a system and procedure for complaints; no discrimination; technical and management training; safety; and medical facilities. But, none of the units gave freedom of association or permitted workers to form the trade unions, though some special benefits and facilities were provided to the female employees, such as, maternity leave patterns, part time work for mothers and facility of crèches/ child care facilities. Very few inward oriented units were engaged in such activities.
Keywords- Corporate Social Responsibility, Working environment, Workplace/Labour betterment practices, Medical, Safety facilities and Special facilities for women.
Introduction
“Action springs not from thought, but from a readiness for responsibility”.Dietrich Bonhoeffer (1906-1945)
Pastor, Theologian, German Resistance Fighter In World War II
The Indian knitwear industry has good prospects for being competitive, and, can be one of the key export destinations due to its small size, flexibility, along with controlled and lower overhead costs. But this can only be possible if labour standards and factory conditions are improved considerably and the industry becomes more compliant with the international labour, social and environmental standards. As lot of international pressure is mounting on the industry due to the allegations of labour abuse in its worst form—child labour and bonded labour is becoming increasing source of worry for the western buyers. Even if industry may cry them hoarse that they do not employ child labour, as they must comply fully with the

Kaur & Kaur: Corporate Social Responsibility IJHE Vol 6 No 2 2013
208
highest standards in accordance with the requirements of their buyers, they cannot say with confidence that the complete supply chain is clean. The US Department of Labour (DOL) continues to feature the Indian apparel industry on its Executive Order (EO) 13126 List that sets forth a list of products, by country of origin which US authorities believe might have been manufactured by forced or indentured child labour. Industry owners watches with fear that its continued mention in the DOL list would throw challenges to them in the coming year, especially with the indications that going forward brands could be made accountable for their trade with India. Hence it has become very important with regard to labour management to encourage unions and employers to develop better institutional arrangements and look into all the issues related to delayed payments, sudden and unexplained termination of workers, unhealthy working conditions and high-handed attitude of management etc.(Anonymous,2012a).
Review of Literature
Corporate social responsibility includes taking initiative for improving the working conditions so that the workforce can be both content and assured of a safe environment. According to Lord Holm and Richard Watts, CSR is the continuing commitment by business to behave ethically and contribute to the economic development while improving the quality of life of the workforce and their families as well as of the local community and the society at large. It makes the atmosphere conducive to assuring positive levels of productivity and improving theoperators’ performance through training, enhancing standard of living, attending to absenteeism and reducing labour turnover, and listening to employee suggestions. It also increases the competitiveness and market value of businesses because, in the long run, all that is ethical also becomes rational (Sharma, et.al, 2009).
There are many business benefits of healthy workplace practices. They include:
Increased employee satisfaction, resulting in lower turnover, improved ability to cope with change, increased productivity, significant savings and knowledge retention.
Better name recognition, improved reputation and larger talent pool, resulting in reduced recruitment costs and more unsolicited applications.
Reduced absenteeism, injuries, accidents, disability and compensation costs, healthcare and life insurance costs, temporary employee training costs, property damage costs, fines and insurance premiums.
Increased staff skills and competencies (Anonymous,2012b).
Modern life depends more and more upon goods produced by industry. Historically, there have always been struggles and clashes between workers and the employers on matters of wages, allowances, and other issues (Verma & Mohan, 2008). Human or labour rights are relevant to the economic, social, and environmental aspects of corporate activities. For example, labour rights requiring companies to pay fair wages affect the economic aspect of manufacturing. Human rights such as the right to non-discrimination are relevant to the social aspects. And the environmental aspects of corporate activity may affect a range of human rights, such as the right to clean drinking water. So, while the primary responsibility for the

Kaur & Kaur: Corporate Social Responsibility IJHE Vol 6 No 2 2013
209
enforcement of international human rights standards lies with national governments, there is a growing acceptance that corporations also have an important role to play.
The desire to create positive social change in the corporate world is not a new phenomenon, although current social, political, economic and ideological conditions have affected it in specific ways today (May, Cheney & Rober, 2007). The growing awareness of social responsibility can be traced to the sixties when a National Convention of businessmen was held in New Delhi (Goyal & Goyal, 2009-2010). After 2000, CSR has fast gained momentum as an important aspect of business practice in India. But still the lack of transparency and information sharing between and among the stakeholders were a reason for concern in 2012. To address these concerns, Apparel Export Promotion Council designed a compliance programme ‘Disha’ (Driving Industry Towards Sustainable Human Capital Advancement), which was coordinated and monitored in liaison with the Ministry of Textiles. Global apparel buyers like H&M and Adidas, were a part of the team that went behind consultations while drafting Disha, a faith-building exercise, which had brought in rigorous third party audit programme involving international auditing agencies in the supply chain (Anonymous, 2012a ).
Though large sums of money are spent on technology upgrades, but the back bone of theknitwear unit is its people. The thumb rule is that ‘technology makes 10% of a business while business processes, employees and culture makes up to 90%’ has been proved again and again. Hence it is very important to involve each and every worker in the unit’s activities. Sunita describes various workplace responsibility practices towards the workers as giving fair and competitive wages, providing good working conditions, taking proper safety measures to avoid health and life hazards, training and prospects for growth and development, no discrimination between different workers on the basis of sex, caste and colour, welfare facilities, fair promotional rules, job security and provident fund (Sunita,2005).
Greening & Turban (2000) found that job applicant and worker’s perceptions of a firm’s CSR, determines their attractiveness towards the organizations. A survey by Sirota Survey Intelligence (2007) affirmed that workers who were satisfied with their organization’s commitment to social and environmental responsibilities were likely to be more positive, more engaged and more productive than those working for less responsible employers. When the employees were positive about their organizations’ CSR commitment, their engagement rose to 86 per cent. On the other hand, when workers were negative about their employer’s CSR activities, only 37 per cent were highly engaged. Similarly, Murray (2008) on the basis of survey stated that more than one-third of respondents pointed that working for a caring and responsible employer was more important than the salary they earned and nearly half would turn away from an employer that lacked good corporate social responsibility policies. Shubham (2010) assessed the compliance levels of CSR of five selected units in Northern Capital region. Audits were carried out in 5 different garment manufacturing units according to audit programme specifications such as WRAP and SA 8000. Maximum non-compliance was seen in terms of health and safety of the workplace such as: emergency lights not installed, health, safety training, fire safety and personal problem equipment trainings not given to the workers. Other areas of non-compliance were documentation and maintenance of details such as age proof certificates, renewal of factory license etc.

Kaur & Kaur: Corporate Social Responsibility IJHE Vol 6 No 2 2013
210
A comparative analysis of inward and outward- oriented woollen units of Ludhiana was conducted to explore the extent of undertaking collective efforts and benefits derived by the knitwear units. The word inward and outward -oriented woollen units meant the woollen units dealing with exports (outward- oriented) and domestic markets (inward-oriented).It was found that most of the units competed with each other and believed in taking individual initiatives instead of group efforts to improve conditions in the units.
Various international standards for the certification like SA8000, OHSAS 18000 and so onencourages the manufacturing industries to develop, maintain and supply socially acceptable workplace practices or occupational health and safety management systems. Important elements included child labour, forced Labour, health and safety, freedom of association and right to collective bargaining, discrimination, discipline, working hours, compensation, management systems, hazard prevention and control measures, training investigation of work related injuries, , competence, responsibility and accountability, (Leipziger, 2010). Human resource audits are conducted by some international organizations like Fair Labour Association (FLA), Ethical Trading Initiative (ETI) , Worker Rights Consortium (WRC) , Business Social Compliance Initiative (BSCI) , Worldwide Responsible Apparel Production (WRAP) , Supplier Ethical Data Exchange(SEDEX )etc. to ascertain whether the existing systems are adequate and whether they function effectively. It not only indicate the deficiencies in the system but also provides the directions for improvement based on well-considered suggestions(Agarwal, Mishra & Agarwal, 2008).
A critical review of the literature revealed that number of studies had been conducted on Corporate Social Responsibility in other manufacturing industries but very little effort had been made to study its adoption and awareness in Ludhiana’s knitwear industry. Hence, this research was an attempt to bridge this research gap.
Definitions
Inward oriented unit: Unit which caters to domestic market.
Outward oriented unit: Unit which caters to international market.
Conducive environment: An environment conducive to the creation and growth or transformation of enterprises on a sustainable basis combines the legitimate quest for profit – one of the key drivers of economic growth – with the need for development that respects human dignity, environmental sustainability and decent work.
Workplace practices: These refer to the procedures and practices affecting the performance of work in the organization. It includes recruitment and promotion, discipline and grievance, termination, compensation, and practices that affect working conditions, such as employee participation, training, health and safety and working time.
Healthy workplace: It focuses on worksite safety and injury prevention for workers and includes programs that help employees choose healthy behaviours such as quitting smoking, healthy eating or getting physically active. It promotes the highest degree of physical, mental and social well-being of your employees and the protection from risks to health caused by working conditions.
Working hours: Indian Labour Law says that weekly working hours should not be more than 48 hours i.e. 8 hours without break and over time should not exceed 12 hours overtime in a week.

Kaur & Kaur: Corporate Social Responsibility IJHE Vol 6 No 2 2013
211
Migrant Workers Rural illiterate migrants which move to the city to take up work in the industry with no previous experience and had worked only in agriculture.
Performance: It is based on performing ones responsibilities effectively
Minimum wages: Paying decent wages is a prime social responsibility of any business. By offering wages above the minimum, an organization can better attract employees, reduce turnover and absenteeism, and build the firm’s community reputation.
Trainings: It is important as it helps employees succeed in their current job and position them for future responsibilities within the firm. Investments in employee training and development helps to build the firm’s overall capacity enabling it to achieve its business goals and also orient new hires, help employees adapt to new technologies or work processes, address performance challenges, or to support employees in adjusting to new responsibilities within the business.
Variables/Components of Corporate Social Responsibility (CSR)
1. Age of Recruitment (see Figure 1)
2. Working hours (see Figure 2)
3. Conducive environment (see Figure 3)Respecting human dignity, Environmental sustainability, Decent work.
4. Workplace practices (see Figure 4)Education to workers, Flexible working hours, Health, safety and welfare, Special facility to female workers, Providing information, No discrimination at workplace, Trainings provided, Fair play (Minimum wages & Statutory benefits), Complaints procedure, Freedom of association or Trade unions , Refreshment facilities,Transportation, No sexual harassment.
5. Comparable wages with others(see Figure 5)
6. Salary-related benefits (see Figure 6)Gifts on festivals, Special occasions, Bonuses; Weddings, Education, & Medical, Job security, Equal pay to same level employees, Regular payment of salary, Overtime.
7. Supporting Education (see Figure 7)Professional education, Management training, Language courses, Long-term education, Technical training.
8. Training provided (see Figure 8) Skill development& Up gradation, Smoking/drugs abuse, Family planning, HIV & AIDS, First aid, Technical issues, Health counselling, Safety training, Fire fighting, Aspects of human rights, Policies for protection of human rights, Conducting Exhibitions & Conference, Awareness of CSR issues, Disciplinary code & Complaints procedures, Performance review program.
Kaur & Kaur: Corporate Social Responsibility IJHE Vol 6 No 2 2013
212
9. Information provided (see Figure 9) Appointment letters & contracts, Important business matters, Future business prospect, Human resource report, Social community activities, Competitors, Major plan investment.
10. Factors affecting promotion (see Figure 10)Length of service, Political connections
11. Health facilities (see Figure 11)Ambulance, Medical room, Adequate number of Fire extinguishers, Adequate number of First aid boxes, Provide personal protective equipment, Emergency exit door, Maternity leave & benefits, Adequate lighting , Compliance with the national pension policy.
12. Accident practices (see Figure 12) Pay full medical bill, Rehabilitation, Pay full salary while medical treatment, Pay half salary while medical treatment, Medical Help
13. Worker death (see Figure 13) Bear full cost of burial, Pay terminal benefit to next kin, Give educational scholarships to children.
14. Special facilities for female employees (see Figure 14)Part-time work for mothers, Crèches/ child-care facilities, No arrangements
15. Maternity leave patterns (see Figure 15) Six weeks, Twelve weeks, Not applicable
Aims & Objectives-
To discover the adoption status of CSR components with special reference to labour- oriented practices in knitwear units of Ludhiana.
To comparatively analyse the commitment towards labour and workplace practices between inward-oriented and outward-oriented knitwear units of Ludhiana.
To explore the various special benefits and facilities provided to female employees in knitwear units.
To evaluate the safety arrangements for the benefit of the employees in the knitwear units.
To explore the information and trainings provided within the knitwear unit to the employees.
To assess the various salary and health related benefits and promotional rules followed in knitwear industry of Ludhiana.

Kaur & Kaur: Corporate Social Responsibility IJHE Vol 6 No 2 2013
213
Methodology
The sampling unit selected for the study was the individual knitwear unit in Ludhiana which was a member of Knitwear Club, a textile and knitwear industry association with membership of 800 Knitwear units which directly or indirectly are part of the value chain. Treating this as a proxy for the population, 80 medium knitwear manufacturing units (10% of the population) were selected using stratified random sampling. The four blocks were divided on the basis of geographical area and twenty units showing interest to participate in this research were randomly selected (Lottery method) from each block as seen in Table 1. After identifying the unit owners or their representatives, information regarding the industrial unit’s social commitment was collected personally by the researcher through personal interview of the unit owners or their representatives after making a telephone appointment. It wasaccompanied with personal visits to the knitwear units and observations of the workplace practices being followed. Talks with workers also helped in verifying the facts. The data collected was coded, tabulated and analysed.
Table 1 Sample Area Distribution
Type of
block
Places included Sample size
Block-I Rahon Road, Village Bhatiya, Jalandhar Byepass, Bhadur Ki Road & Tilak Nagar
20
Block-II New Madhavpuri, Sunder Nagar, Bajwa Nagar, Seikhayval & Madhapuri
20
Block-III Chandigarh Road, Focal Point, Industrial Area, Shivpuri & Sheerpur
20
Block-IV Civil Lines, Hambran Road, City Area, Manna Singh Nagar & New Kundanpuri
20
The Ludhiana knitwear industry is located in the Northern state of Punjab in India (as seen in Map-1) and is popularly known as “Manchester of India”. It is highly decentralized and mainly small scale contributing to 95% of country's woollen knitwear and employing 4 Lakh workersdirectly or indirectly. The annual turnover of the Cluster is approximately Rs.5000 Crores including exports of 1000 crores. The share of exports in total turnover is only 20%, hence Ludhiana mainly caters to the domestic market. It produces a wide range of woollen products for winter wear like sweaters, woollen socks, pullovers, cardigans, thermal wear, gloves, muffler, berets, caps, shawls, jackets, jersey and blankets, and for summer wear, items like T-shirts, cotton and blended socks, under garments, knitted bed sheet, skirts, tops, sportswear, night suits etc. Most of the knitwear units are unorganized and 'owner managed’. The owner performs all basic functions of marketing, procurement and finance and are not interested in appointing professionals or believe in trainings. External training programs are

Kaur & Kaur: Corporate Social Responsibility IJHE Vol 6 No 2 2013
214
rarely subscribed as these are considered expensive and a waste of productive man-hours. These units are mainly involved in knitting, fabric cutting, lot making, embroidery, final stitching, final checking, packing of garments ,retailing and marketing. Women workers are more involved in the work of designing, stitching and packing while male workers dominate the industry in the department of knitting, cutting, checking, retailing and marketing (Anonymous, 2009).
Map 1 Location of Ludhiana in India
Ludhiana knitwear Industry is mainly labour-intensive and most of the workers are migrants from nearby states of Uttar Pradesh, Bihar and also from Nepal, which are mainly unskilled though there are skilled and semiskilled labour workforce also. Indirect labour activities include tailoring, embroidery, packing, retailing and marketing. Subcontracting is a major critical attribute of Ludhiana industry with a large number of small and micro knitting and knitwear firms extending production and manufacturing support to the bigger firms and direct exporters. Most of the other allied activities like dyeing, cutting and embellishment etc. are carried out by contract-workers who mostly sit within the factory premises and are hired through sub-contractors. Issues like harmful work environment are very prominent in the subcontracted activities (Sodhi, 2008).
Results and discussions
Eighty knitwear units were surveyed to examine their commitment toward workplace and workforce practices, out of which 35 units were outward-oriented and 45 units were inward-oriented.
All the outward –oriented knitwear units in Ludhiana employed adult workers and had kept the lowest age for recruitment as 18 years, while 78% inward-oriented units follow this rule strictly (see Figure 1). A report ‘Children /child Labour 2010 compiled by Samu described incidents of child worker in Ludhiana, where as many 18 children working as bounded workers

Kaur & Kaur: Corporate Social Responsibility IJHE Vol 6 No 2 2013
215
were rescued by the district administration under ‘Bachpan Bachao Aandolan’. All these children, who either belonged to West Bengal or Bihar in the age group of 10 to 12 years were being paid Rs 25 to Rs 100 per week. Industry owners argued that some workers bring along young children to train them.
Figure 1 Distribution of respondents on the basis of age of recruitment
The majority of the outward-oriented units (75%) had ten hour working shift for regular employees, while 71% inward -oriented units worked mostly for 12-hour day (See Figure 2).Outward-oriented units were found more compliant to with work hours to 12 hours. The result goes with the findings of a study by Uchikawa(2012) as it proved that 12 hours work shift is the general trend in Ludhiana as most of the workers are on piece rate and they want to work longer time to earn more money.
Figure 2 Respondents on the basis of the Working Hours
The majority (96%) of the outward –oriented knitwear units in Ludhiana provided a conducive environment for workers to operate in comparison to 75% inward-oriented. Assessment of Conducive environment was done on three criteria -respecting human dignity, environmental sustainability and decent work (see Figure 3).

Kaur & Kaur: Corporate Social Responsibility IJHE Vol 6 No 2 2013
216
Figure 3 Respondents on the basis of a conducive environment
The majority of the units followed workforce practices, such as a procedures and systems for complaints by workers and presented no discrimination at workplace, none of the units gave freedom of association or permitted the formation of trade unions to their workers. The majority of the outward-oriented units practiced proper workforce practices, such as suitable arrangements for health, workers safety and welfare of employees, encouraging the use of safety equipment such as gloves and masks, provided special facilities for female employees such as employment, training and financial help, refreshment facilities including lunch/tea, canteen, bus transportation, skills-related training in comparison to very few inward-oriented units. Workers were provided clean drinking filtered water and, in some units an aqua guard water filters were installed as a welfare measure (See Figure 4).
Figure 4 Distribution of respondents on the basis of Workplace practices
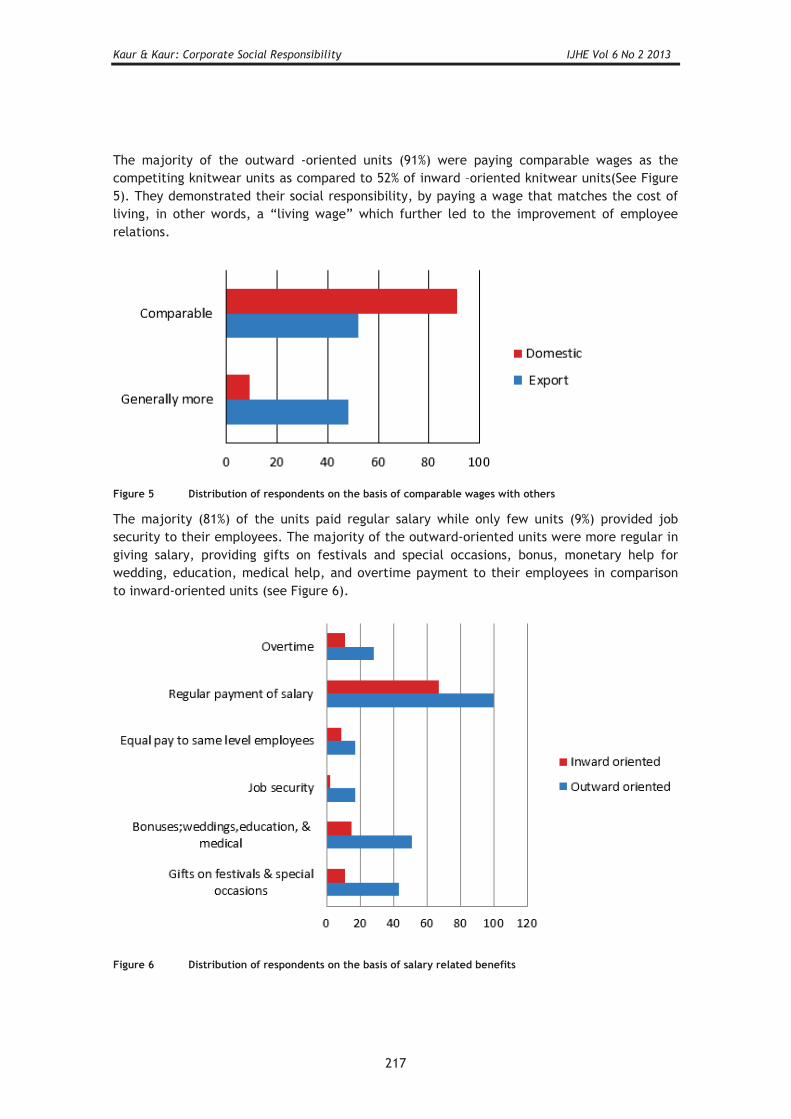
Kaur & Kaur: Corporate Social Responsibility IJHE Vol 6 No 2 2013
217
The majority of the outward -oriented units (91%) were paying comparable wages as the competiting knitwear units as compared to 52% of inward –oriented knitwear units(See Figure 5). They demonstrated their social responsibility, by paying a wage that matches the cost of living, in other words, a “living wage” which further led to the improvement of employee relations.
Figure 5 Distribution of respondents on the basis of comparable wages with others
The majority (81%) of the units paid regular salary while only few units (9%) provided job security to their employees. The majority of the outward-oriented units were more regular in giving salary, providing gifts on festivals and special occasions, bonus, monetary help for wedding, education, medical help, and overtime payment to their employees in comparison to inward-oriented units (see Figure 6).
Figure 6 Distribution of respondents on the basis of salary related benefits

Kaur & Kaur: Corporate Social Responsibility IJHE Vol 6 No 2 2013
218
Plate 1 Instruction Boards
The majority of units had displayed Instruction boards in their premises. Example of one such boards are shown in Plate 1 above. The majority of the units provided training in technical issues and management techniques to their employees, while only few were involved in long term education and language courses. All the outward-oriented units were involved in providing at least one other education facility to the employees while the inward-oriented units focused mainly on technical issues and management techniques (See Figure 7).
Figure 7 Distribution of respondents on the basis of facility of education of employees

Kaur & Kaur: Corporate Social Responsibility IJHE Vol 6 No 2 2013
219
The majority of the units provided training to employees such as skill development and upgradation, fire fighting, disciplinary and complaints procedures while only very few units provided training on the performance review program for the staff. The majority of outward-oriented units were more frequent in providing training on smoking/drugs abuse, family planning, HIV and AIDS, and technical issues in comparison to inward-oriented units(See Figure 8). By providing training on CSR issues, the company emphasized the extent of company’s commitment towards it and also trains workers to take CSR issues into account in their daily work. Skill development and upgradation training was generally in-house and on the job type.
Figure 8 Distribution of respondents on the basis of trainings provided
The majority of the units provided basic information to their employees, such as transparency in the appointment letters and contracts, future business prospects and operating climate and information about their competitors, while only few units provided information regarding their activities in local communities and unit’s human resources report. Outward-oriented units were more transparent in providing information to their employees in comparison to inward-oriented units (See Figure 9). Suggestions regarding various workplace problems were taken from the workers and practical suggestions were implemented to make small improvements in the work environment.

Kaur & Kaur: Corporate Social Responsibility IJHE Vol 6 No 2 2013
220
Figure 9 Distribution of respondents on the basis of information provided
The majority (81%) of the total units in Ludhiana promoted employees on the basis of their length of service followed by their performance while none of the units used political connections to employ the workers or promote them. A study on workplace practices of selected Jordanian private sector companies also revealed that promotions were directly tied to the defined criteria based on performance (See Figure 10).
Figure 10 Distribution of respondents on the basis of factors effecting employment

Kaur & Kaur: Corporate Social Responsibility IJHE Vol 6 No 2 2013
221
Plate 2 Fire safety Instruction & equipment
The outward-oriented units provided extended more health facilities like adequate number of fire extinguishers, personal protective equipment, pension, adequate lighting, maternity leave and benefits for female employees in comparison to inward-oriented units (See Plate 2 and Figure 11).
Figure 11 Distribution of respondents on the basis of health facilities provided
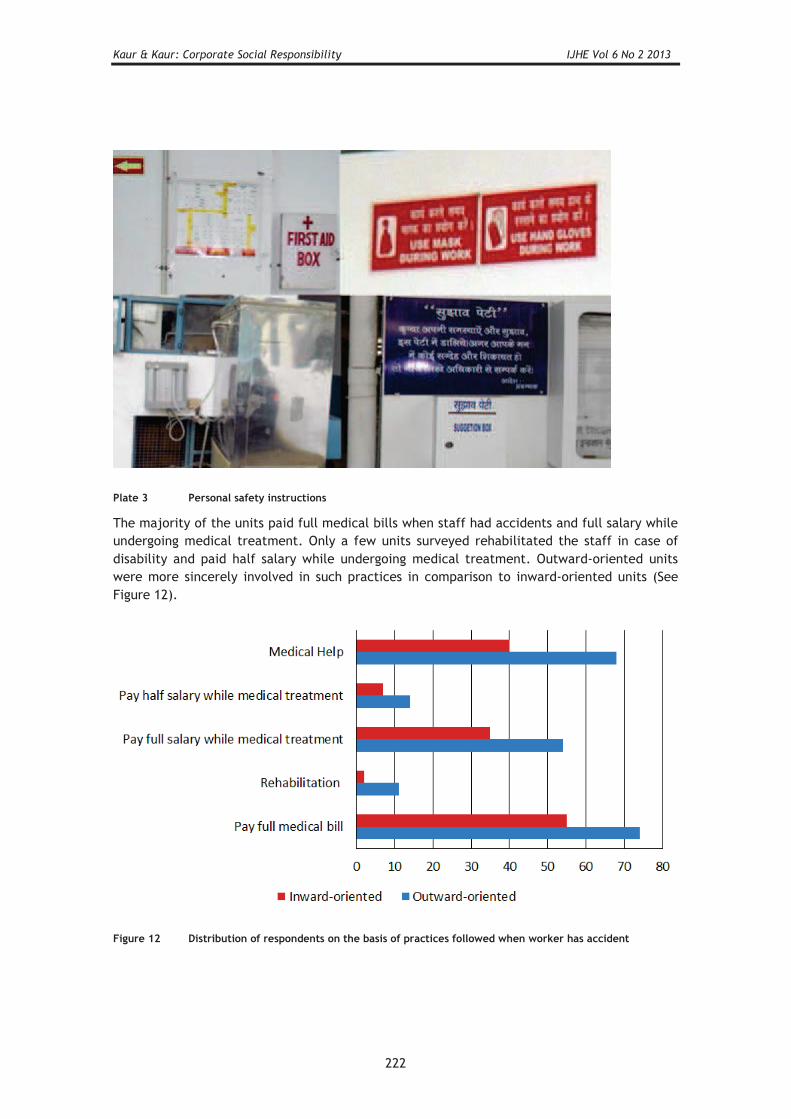
Kaur & Kaur: Corporate Social Responsibility IJHE Vol 6 No 2 2013
222
Plate 3 Personal safety instructions
The majority of the units paid full medical bills when staff had accidents and full salary while undergoing medical treatment. Only a few units surveyed rehabilitated the staff in case of disability and paid half salary while undergoing medical treatment. Outward-oriented units were more sincerely involved in such practices in comparison to inward-oriented units (See Figure 12).
Figure 12 Distribution of respondents on the basis of practices followed when worker has accident

Kaur & Kaur: Corporate Social Responsibility IJHE Vol 6 No 2 2013
223
The majority (81%) of the total bore full cost of burials/cremations and paid terminal benefit to the next kin in the case of worker’s death. Very few gave scholarships to surviving children. Outward-oriented units were seen practicing more of such arrangements in comparison to inward-oriented units (See Figure 13).
Figure 13 Distribution of respondents on the basis of practices followed on worker's death
The majority of the units in Ludhiana (52%) provided special facilities to female workers like part time work for mothers and crèches/child-care facilities for small children. All the outward-oriented units provided one or the other facilities to the female workers in comparison to only 15% of inward-oriented units (See Figure 14). Child-care facilities gave a chance to the women workers to work without any tension of engaging outside day-care services and ultimately led to increase in the employment of women.
Figure 14 Distribution of respondents on the basis of special facilities provided to female workers

Kaur & Kaur: Corporate Social Responsibility IJHE Vol 6 No 2 2013
224
The majority (93%) inward-oriented units did not provide maternity leave to their employees in comparison to 17% outward-oriented units. The majority of the outward-oriented units had a maternity related policy under which they mainly provided six weeks maternity leave and sometimes twelve weeks of maternity before and after the delivery (See Figure 15).
Figure 15 Distribution of respondents on the basis of maternity leave provided
Conclusion
It was found that Ludhiana knitwear industry is indulged in one or the other workplace CSR practice but there is lack of structured and concrete commitment. Health and safety practices are mainly followed but the workers are not very particular in their use of protective equipment like gloves, masks and glasses. Audits were not conducted in most of the units to keep a check on the compliance level. Very few units were providing special facilities to the women employees, job related benefits and business information to the employees. Most of the outward oriented units of Ludhiana are more committed towards workforce practices as compared to inward oriented units. Main reason found behind their commitment is that they strictly follow rules, laws, social, labour, environmental and ethical code of conduct as expected by the western buyers, while doing business with them. As Ludhiana industry is mainly small scale hence Low workplace commitment of the industry has become a big obstacle in their way to being competitive and successful.
In this present challenging environment, it has become very important that knitwear unit owners should not only consider the people employed by them but also those people living in their vicinity as a part of their own family which would further improve the socio – economic conditions of the people around and also help the industry itself in numerous ways. To help ensure a safe, productive workplace, the industry must adopt a safety, health and wellness policy, conduct inspections to ensure that hazards are eliminated and controlled, train employees on workplace hazards and apply health and safety regulations, hold regular meetings to identify unsafe conditions and implement solutions. It is recommended that in order to make the knitwear industry stand out clearly by virtue of their continuous crusade in the workplace industrial practices and beyond, owners should be made aware of CSR’s direct economic benefits by showing successful examples of CSR implementation as the management

Kaur & Kaur: Corporate Social Responsibility IJHE Vol 6 No 2 2013
225
being the main force behind serious commitment. As CSR initiatives are self motivated and self driven and more practical than spoken, hence every business schools which train the future managers should place emphasis on CSR and it should be integrated in their industry’s business strategy. Collective efforts by the entire industry will help to clear its present tarnished image resulting from allegations of Child labour so that they emerge as a sincere responsible compliant manufacturer. Further researches can be done on the assessment of compliance level of the knitwear industry of Ludhiana by conducting workplace audits using the international standards and compliance grid.
Biography
Prabhjot Kaur holds a Masters in Clothing and Textiles, UGC NET, BEd, Diploma in Computer Aided Design and Certified Lean Professional. She is also pursuing aPhD in Garment Production Exports Management. She has been teaching in Girls Colleges for the past 13 years in Jallandhar and Chandigarh. At present, she is working as Assistant Professor in the department of Clothing and Textiles in Government Home Science College, Chandigarh. Her twenty-two Research papers and articles have been published in various national and international refereed journals. She has presented papers, posters and has attended many conferences and training programs.
Navjot Kaur holds a Masters in Clothing and Textiles and is working as alecturer in Continental Group of Institute, Jalvehra, Fatehgarh Sahib, Punjab.
Bibliography
Agarwal. N. P., Mishra. B. K., & Agarwal. S. (2008). Human and Social Audit. Jaipur: RBSA Publishers, p.105-184.
Anonymous,(2002). Corporate Social Responsibility and Gender in the workplace: A study of selected Jordanian private sector companies. Retrieved from http://gsf-jo.org/inp/Upload/Corporate-Social-Responsibility-and-Gender-i-%20the-workplace.pdf
Anonymous(2009). Ludhiana Knitwear and Apparel Cluster Diagnostic study. A report prepared by Small Industries Development Bank in collaboration by Apex Cluster Development .Retrieved from http://msmefdp.net/ResourceBank/Diagnostic%20Study/Ludhiana-DS.pdf.
Anonymous, (2012a).Social Compliances continue to haunt. Stitch World. 9 (11), 16-17.
Anonymous, (2012b ) Corporate Social Responsibility: Employee Relations. Retrieved from http://www.ic.gc.ca/eic/site/csr-rse.nsf/eng/rs00591.html
Bonhoeffer ,D.((1906-1945). Inspirational Quotes by Dietrich Bonhoeffer.Retrieved from http://www.values.com/inspirational-quote-authors/1004-Dietrich-Bonhoeffer
Goyal, A., & Goyal, M. (2009-2010). Business Environment. New Delhi:V. K. (India) Enterprise. p. 450-51.

Kaur & Kaur: Corporate Social Responsibility IJHE Vol 6 No 2 2013
226
Greening, D.W, & Turban, D.B. (2000). Corporate social performance as a competitive advantage in attracting a quality workforce. Business and Society. 39, 254–280.
Holm, L and R. Watts(2000) Making Good Business Sense .A publication of World Business Council for Sustained Development. Retrieved from research.dnv.com/csr/PW_Tools/PWD/1/00/L/1-00-L-2001-01-0/lib2001/WBCSD_Making_Good_Business_Sense.pdf
Leipziger, D. (2010). Social Accountability SA8000. UK: Greenleaf Publishing Limited.pp-43, 44, 50, 51,167
May, S., Cheney, G., & Rober, J. (2007). The debate over CSR. Oxford University press, p-5,Retrieved March, 3, 2012 from (http://wiki.triastclematic.org/index.php/portal.corporate-social-responsibility/historical-perspective
Murray, N. E. (2008). Corporate Social Responsibility is the Number One Criteria for Job Hunters Today. Retrieved on March 30, 2008 from http://normmurray.org/2008/02/18/corporate-social-responsibility-is-the-number-one-criteria-for-job-hunters-today/
Samu,K.(2010). Children/Child Labour-2010. Human Rights Documentation, Indian Social Institute, New Delhi Retrieved from http://www.isidelhi.org.in/hrnews/HR_THEMATIC_ISSUES/Children/Children-2010.pdf
Sharma S., Sharma J. and Devi, A.(2009). Corporate Social Responsibility: The Key Role of Human Resource Management. Business Intelligence Journal.2 (1).205-213.
Shubham, R. (2010). Assessment of CSR in selected garment unit manufacturing unit.Unpublished masters’ dissertation, department of home science, lady Irwin College, New Delhi.
Singh, D.(2003). A comparative analysis of inward and outward oriented woolen units of Ludhiana cluster . Masters Dissertation. Department of Business Administration, Punjab Agricultural University, Ludhiana.
Sirota Survey Intelligence (2007) .CSR boosts employee engagement, Social responsibility boosts employee engagement. Retrieved 2007, 09 May from http://www.management-issues.com/2007/5/9/research/social-responsibility-boosts-employee-engagement.asp
Sodhi,J.S.(2008). CSR Perceptions and Activities of Small and Medium Enterprises in seven geographical clusters. A Survey Report by United Nations Industrial Development Organization, Vienna in cooperation with the UNIDO Cluster Development Programme, india.p-11,12 Retrieved from http://www.unido.org/fileadmin/user_media/Publications/Pub_free/CSR_perceptions_and_activities_of_SMEs_in_seven_geographical_clusters.pdf.
Sunita, (2005). Politic, Ethics and Social Responsibility of Business, Paragon Books, New Delhi.
Uchikawa, S(2012).The linkage between Agriculture and Industry in India. The Development of Apparel Industrial Cluster in India: A comparison between Ludhiana and Tiruppur(chap-1).IDE. Retrieved from http://www.ide.go.jp/Japanese/Publish/Download/Report/2011/pdf/103_ch1.pdf
Verma, A. P., & Mohan, N. (2008). Industrial management. S.K. Kataria & Sons. Delhi. p. 161-217.

International Journal of Home Economics
227
Japanese and American high-school students’ awareness of poverty
Setsuko Nakayama*, Jeffrey M Byford† & Yoko Ito*
*Chiba University, Japan; †University of Memphis, USA
Abstract
The purpose of this study was to examine Japanese and American high school students’ awareness and perceptions of poverty. The participants included 148 Japanese and 114 American high school students in the eleventh grade. The participants responded to a survey instrument consisting of 14 statements dealing with poverty and stereotypes of poverty. These 14 statements were grouped into four main themes: definition of poverty, causes of poverty, lifestyles associated with poverty, and societal attitude towards poverty. The first stage of analysis focused on the frequency of each response to each of the 14 statements. The second stage involved the generation of correlation and descriptive statistics. Japanese and American high school students’ views on poverty and stereotypes of poverty were compared and contrasted. This study provides insight into how Japanese high school students’ stereotypical views of poverty differ from those of their American counterparts.
Introduction
In recent years, poverty and related issues have received increasing attention in part due to the dramatic widening of income disparity in experienced in Japan between 2005 and 2008. During this period, the plight of the poor has surface in the public awareness as the middle class continues to shrink. With increasing numbers of parents being laid off from regular employment and having to rely on public welfare services, child poverty, in particular, has come to be perceived as a widespread social problem. Similar trends around the globe have led the Organization for Economic Co-operation and Development (OECD) to compare poverty rates among member nations (OECD, 2008). A recent survey conducted by the Japanese Government (Ministry of Health, Labor, and Welfare, 2010; Ministry of Health, Labor, and Welfare, 2011) revealed that 14.2% of Japanese children live in relative poverty, defined as households with incomes 50% or less than the national median income. The Japanese public is just beginning to understand the critical implications of increasing income disparity and poverty.
The growing awareness of such issues, however, does not mean there is a unified perception of poverty in Japan. A survey by Aoki (2009) revealed that 70 % of Japanese college students associated homelessness with poverty. Similarly, 52% of Japanese college students equated individuals on welfare with those living in poverty. The survey data also indicated that Japanese citizens’ perceptions of poverty vary by social status. In Japan, there is no

Nakayama et al: High school students awareness of poverty IJHE Vol 6 No 2 2013
228
commonly accepted income threshold in Japan by which poverty is defined (Sekine 2007). As a result, those in poverty are so designated based on other criteria such as work ethic and motivation (Yuasa, 2008).
There exists little research on poverty in Japan for the period between the mid-1950s and the 1960s (Iwata, 2008). Current research rarely focuses on the unequal impacts of poverty on children (Abe, 2008; Asai et al., 2008;Yuzawa et al., 2009; Aoto, 2009). Moreover, little research has attempted to capture Japanese children’s perceptions and stereotypes related to poverty.
Given the key role played by education in dispelling such stereotypes, there is an urgent need for educators to promote correct understanding of poverty within the Japanese education system. The 2008 and 2009 revisions of the national curriculum, however, did not address poverty as a domestic issue, despite its potential serious implications to Japanese society. Kubota (2010) and Morimitsu (2011) speculated that the omission of poverty-related curricula by the Japanese Educational Administration may reflect the paucity of public discussion of such issues. Despite the absence of poverty in the national curriculum, Japanese teachers are increasingly feeling the impacts of poverty in their classrooms. As a result, there is a growing grass-roots effort by teachers to incorporate poverty and related issues into social studies, home economics, and integrated studies curricula and homeroom activities (Inuma, 2008; Nishinari high school, 2009; Sagayama, 2009, Otake 2012).
In the United States, increasing unemployment and the recent global recession has led to renewed interest in the impacts of poverty on school age children. The United States has the highest child poverty rate among the world’s 24 wealthiest countries (Advance Humanity,2007). Current economic conditions foster low incomes and increased reliance on social welfare programs and charitable aide. Meanwhile, there is increasing interest in the potential detrimental impacts of the negative perceptions of poverty held by diverse groups of youths in the US (Bennett, 2008; Kozol, 2006; Payne, 2005; and Tatum, 2003). Negative perceptions of the working poor or long-term non-working poor among the nation’s youth may lead to negative and damaging perceptions of poverty.
Interest in poverty and students’ perceptions thereof in the US is not new. Such poverty research dates back to the 1960s, a period in which educational researchers and academics were primarily concerned with the sociological impacts of poverty on students’ learning. During this period, new curricula such as the Sociological Resources for the Social Studies (SRSS) were developed to provide students with experiences related to the social world. Students were asked to identify and analyse sociological diversity in order to confront and dispel commonly held social stereotypes. Two educational units designed to promote social understanding through such confrontation were Images of People and The Incidence and Effects of Poverty in the United States. These units explored the causes, stereotypes and various solutions to poverty. Lacking federal funding, the SRSS and other problem-based curricula were abandoned by the mid-1970s, with no subsequent large-scale effort to confront the stereotypes of poverty for almost twenty years.

Nakayama et al: High school students awareness of poverty IJHE Vol 6 No 2 2013
229
A study conducted by the US Census Bureau in 2009 revealed that, of the four largest ethnic groups in the United States, African Americans and Hispanics experienced the highest rates of poverty at 25.8 and 25.3%, respectively (US Census Bureau, 2010). While much of the US educational curriculum is geared toward white middle-class standards, minorities make up the highest percentage of low-income children (Hodgkinson, 2002). Poor households often have one working individual, experience substandard housing, and spend more than half of their income on rent and food (National Coalition for the Homeless, 2007). As a result, poor students either end up dropping out of the educational system or experiencing difficulties integrating into an educational system designed around the ideals of middle-class education.
In American society, images and stereotypes of poverty propagated by various media and personal experiences influence how students perceive poverty based on their own social, economic and political circumstances. Lawrence Mead (1994) identified various common perceptions or associations with poverty in American society: (1) matriarchy, 2) minorities (African American or Hispanic), 3) lack of self-sufficiency or opportunity, 4) absence of fatherfigure, 5) lack of education, 6) low income, 7) illegal immigrants, 8) unreliability in terms of employment, and 9) cultural stereotypes regarding lack of willingness to maintain employment.
Study Objectives
As is evident from efforts by the OECD (OECD, 2008) and other organizations, poverty is widely recognized as a topic of global importance. Meanwhile, in recent years, there is a growing awareness of and interest in the potential detrimental impacts of negative perceptions related to poverty. Yet, few studies have focused on perceptions of poverty among the next generation of global citizens (i.e. children), particularly in terms of cross-country comparison. In this context, the objective of this study was to identify differences and commonalities of Japanese and American high school students’ awareness and perceptions of poverty.
Methods
Participants
The study sample comprised purposively selected high school students in the United States and Japan. Purposeful sampling is used when researchers hope to discover, understand, and gain insight into a specific topic (Merriam 1998). Students in eleventh grade were selected based on an assumed stage of cognitive development in the selection of students. According to Sylwester (2000), students’ cognitive development occurs in stepwise fashion with measurable peaks in the third, sixth and ninth grades. We chose to investigate older (eleventh-grade) students whose cognitive development has presumably stabilized following the earlier period of progressive development. Both the US and Japanese sample of eleventh grade students represented average students who were subject to typical course requirements for graduation.

Nakayama et al: High school students awareness of poverty IJHE Vol 6 No 2 2013
230
The Japanese sample comprised 148 students from various economic backgrounds and levels of academic performance selected from two high schools in suburban Tokyo. As noted by Mimizuka (2007), students’ academic achievement is affected by monthly expenditure on education, educational expectation, and income.
The US sample comprised 114 students from two suburban high schools in a south-westernstate.
Survey Instrument
The survey instrument titled “Images of Poverty” replicated the Sociological Resources for the Social Studies Project created by the American Sociological Association and funded by the National Science Foundation. Researchers in Japan and the United States used the original survey with slight modification limited to language and terminology. The survey instrument contained 16 items consisting of 2 questions related to the respondents themselves and 14 statements dealing with poverty and stereotypes of poverty. The 14 questions arbitrarily categorized into four themes: definition, causes, lifestyles, and societal relevance of poverty based on the nature of the questions. The four themes were reasonable to examine Japanese and American students’ awareness and perceptions of poverty. Authors of several comparison studies have pointed out that definitions of poverty based on income and material living standards can be difficult to measure in cross-country surveys. They also note that socioeconomic structural and cultural contexts shape the experiences and understandings of poverty (Lister, 2004; Øyen, 1996). Students indicated their degree of agreement to the 14 statements on a five-point Likert scale, with responses being strongly agree (1), agree (2), neutral (3), disagree (4), and strongly disagree (5). The Likert scale responses were categorical. The numerical labels of the responses (1 through 5) were simply used to identify responses but did not constitute a quantitative measurement. (Howell, 2004, p. 17). The survey questions were translated into Japanese by a professional Japanese-English translator, and the first and third authors who were bilingual researchers reviewed the survey questions and reached consensus on translations (Taylor et al, 2000). The accuracy of the translation was confirmed by back translation.
Data collection
The Japanese survey was distributed to high school students and collected by two Japanese researchers, who are professors of education at a large Japanese suburban university. The US survey was distributed to high school and collected by one American researcher, who is a professor of education a large urban university. Surveys were conducted in both countries between January and February, 2011. The response rate was 100%. The definitions of specific terminology were explained to students from both countries before the students responded to the questionnaire. Students were told that their participation in the study was voluntary and that their refusal to participate would have no negative effect on evaluation of their school performance.
Data Analysis
The fourteen statements included in the questionnaire were grouped into four main themes related to the (i) definition, (ii) causes, (iii) lifestyles associated with, and (iv) societal

Nakayama et al: High school students awareness of poverty IJHE Vol 6 No 2 2013
231
attitudes towards poverty. The first stage of analysis focused on the frequency of each response to each statement. The second stage of analysis involved the generation of correlative and descriptive statistics.
Results
Sample Characteristics
The study sample consisted of 148 Japanese and 114 American high school students, with the gender distribution of both groups being approximately equal. Respondents were asked to identify their gender and their interest in attending college. As can be seen in Table 1, nearly all participants in both the Japanese and US sample expressed a similar desire to attend either a state college or university, i.e. to advance to post-secondary education.
Table 1 Sample Characteristics (N=262)
Japan (N=148) US (N=114)
number % number %
Gendermale 68 45.90% 56 49.10%
female 80 54.10% 58 50.90%
I plan on either attending a state college/university when I graduate
Strongly Disagree 0 0.00% 3 2.60%
Disagree 1 0.70% 1 0.90%
Undecided 4 2.70% 1 0.90%
Agree 24 16.20% 27 23.70%
Strongly Agree 119 80.40% 82 71.90%
Japanese high school students’ awareness of poverty
Definition and cause
As can be seen in Table 2, 26.4% of Japanese respondents strongly agreed and 43.2% agreed with the statement that “the best definition of poverty is the lack of money,” while 8.1% strongly disagreed and 6.1% disagreed. 24.3% strongly agreed and 50.0% agreed with the statement that “low income individuals tend to stay in poverty.” More than half of students agreed or strongly agreed (20.3 and 33.1%, respectively) that “low income individuals in Japan are minorities” and that they are “taken advantage of by society” (13.5 and 37.8%, respectively).

Nakayama et al: High school students awareness of poverty IJHE Vol 6 No 2 2013
232
When asked about the causes of poverty, 8.8% of Japanese respondents strongly agreed and 15.5% agreed that “if a low income persons does not have a job, he or she is probably lazy”, while 22.3% strongly disagreed and 24.3% disagreed with the statement. 12.2% strongly agreed and 25.0% agreed with the same statement that “most low income people have as many opportunities as everyone else.” 20.9% strongly agreed and 18.2% agreed with the statement that “children of low income families have the same opportunities of achieving upward mobility as children of middle and upper income families,” while 7.4% strongly disagreed and 26.4% disagreed with the same statement.
Lifestyle and relevance
As can be seen in Table 3, 17.6% of Japanese respondents strongly disagreed and 39.2% disagreed with the statement that “most low income families live in large cities,” while only 0.7% of students strongly agreed and 10.1% agreed with the statement. 41.2% of students strongly disagreed and 29.1% disagreed with the statement that “low income families really don’t mind inadequate housing, unemployment, and having to rely on governmental aid.” 22.3% of students strongly disagreed and 24.3% disagreed with the statement that “low income individuals spend more on alcohol and tobacco” than their middle-class counterparts.20.3% of students strongly disagreed and 35.1% disagreed with the statement that “low-income families don’t care for their children as much as middle income families proper childcare.” 14.2 % of students strongly disagreed and 31.8% disagreed with statement that “low income families value education.”
In terms of social support, 29.7% of students strongly disagreed and 42.6% disagreed with the statement that “the government is spending enough money to fight poverty." Furthermore, 18.2% of Japanese student strongly disagreed and 33.8% disagreed with the statement that “the idea of poverty is exaggerated” by the media.
American high school students’ awareness of poverty
Definition and cause
As can be seen in Table 2, 5.3% of American students strongly agreed and 50.0% agreed that “the best definition of poverty is lack of money,” while 3.5% strongly disagreed and 26.3% disagreed with the same statement. 4.4% of students strongly disagreed and 30.7% disagreed with the statement that “low income people tend to stay in poverty.” A similar mixed response was observed to the statement that “most low income persons in the US are minorities.” Regarding the relationship between low income individuals and society, 8.8% of American students strongly agreed and 33.3% agreed with the statement that the poor are “often taken advantage of by society.”

Nakayama et al: High school students awareness of poverty IJHE Vol 6 No 2 2013
233
Table 2 Awareness of poverty: definition and cause
With regard the causes of poverty, the majority of American students believed that a) laziness is not directly associated with joblessness, b) children of low income families have the same opportunities as those in other income groups, and c) impoverished individuals do not have the same opportunities for advancement as their middle class counterparts.

Nakayama et al: High school students awareness of poverty IJHE Vol 6 No 2 2013
234
Table 3 Awareness of poverty: lifestyle and relevance
Lifestyle and relevance
In terms of the geographical distribution of the poor, 3.5% of American students strongly agreed and 36.0% agreed with the statement that “most low income families live in big cities.” 31.6% of American students strongly disagreed and 37.7% disagreed with the statement that “low income families really don’t mind inadequate housing, unemployment, and having to rely on governmental aid.” 20.2% of students strongly disagreed and 33.3% disagreed with the statement “that most low income people spent more on alcohol and tobacco” than their middle-class counterparts. 47.4% of students strongly disagreed and 36.0% disagreed with the statement that “most low income families don’t care as much about their children as middle-income families do.” Only 0.9 % of students strongly disagreed and 14.9% disagreed with statement that “low income families value education.”

Nakayama et al: High school students awareness of poverty IJHE Vol 6 No 2 2013
235
In terms of social support, 13.2% of students strongly believed and 39.5% of students believed that their government is “now spending enough money to fight poverty.” Furthermore, 5.3% of American student strongly disagreed and 36.8% disagreed with the statement that “theidea of poverty is exaggerated” by the media.
Differences between Japanese and American high school students’ awareness of poverty
As shown in the Table 2, t-tests revealed several significant differences between Japanese and American high school students’ awareness of poverty. A higher proportion of Japanese students regarded the best definition of poverty to be lack of money than their American counterparts. A higher proportion of Japanese students significantly agreed low income people tend to stay in poverty. As for the cause of poverty, a greater proportion of American students strongly disagreed with the statement that most low income people have as many opportunities as everyone else.
In addition, a lower proportion of Japanese students identified low income families as living in big cities and valuing education than their American counterparts.
A higher proportion of American students disagreed with the statement that most low income families don’t care as much about their children as middle-class families do. Meanwhile, a higher proportion of Japanese students disagreed with the statement that their government was currently spending enough money to fight poverty, and American students had a greater tendency to view the idea of poverty as being exaggerated by the media.
Correlative and Descriptive Statistics
Examining correlations among student responses to individual statements reveals certain “clusters” of perceptions that provide insight into overall trends in American and Japanese students’ perceptions of poverty and the causes of poverty. Among Japanese students, responses to the statement that the poor are lazy (statement 5) were positively correlated with responses to statements that the poor have the same opportunities as others but do not avail themselves of these opportunities (statement 6), spend money on liquor and tobacco (statement 10), do not mind bad housing, unemployment, or being wards of the state (statement 9) and that the issue of poverty is exaggerated by the television and other media (statement 14). Furthermore, responses to the statement that the poor spend money on liquor and tobacco (statement 10) were correlated with responses to statements that the poor primarily live in big cities (statement 8) and that they do not care for their children. Among American students, responses to the statement that low income individuals tend to stay in poverty (statement 2) were correlated with the responses to statements that the poor are primarily minorities (statement 3), lazy (statement 2), spend money on liquor and tobaccos (statement 10), and do not take care of their children (statement 11). Response to statements that the poor are lazy (statement 5) and that they do not take care of their children (statement 11) were correlated responses to various other statements.

Nakayama et al: High school students awareness of poverty IJHE Vol 6 No 2 2013
236
Table 4 Japanese students' awareness of poverty: Correlation and Descriptive Statistics (N=148)
Table 5 American students' awareness of poverty: Correlation and Descriptive Statistics (N=114)
One of the main differences between Japanese and American students’ perceptions of poverty is that a smaller proportion of Japanese students believed that the majority of the poor live in big cities (statement 8). Given the significant negative correlation between the belief that poverty is best defined by lack of money (statement 1) and the belief that the poor live in cities (statement 8) (Table 4), it can be assumed that Japanese students believed that the poor live primarily in rural areas. This view, of course, does not reflect reality but rather indicates the trend in perceptions held by Japanese students.
Another difference between the two groups of students lies in the fact that a higher proportion of American students believed that low-income families value education (statement 12) than their Japanese counterparts. Students who believed that low-income families value education (statement 12) tended to disagree that poverty is best defined by lack of money (statement 1) (Table 5). Furthermore, the belief that low-income families value education (statement 12) was negatively correlated with the belief that poor families do not take advantage of opportunities (statement 6) , that the poor spent their money on

Nakayama et al: High school students awareness of poverty IJHE Vol 6 No 2 2013
237
alcohol and tobacco (statement 10), and that they did not take care of their children (statement 11). Meanwhile, Japanese students who had negative awareness of poverty—believed that the poor were minorities (statement 3), that the poor are lazy and their poverty was their own fault (statement 5), that the poor spent their money on alcohol and tobacco (statement 10) and did not care for their children (statement 11)—tended to disagree with the statement that low-income families value education (statement 12).
On the questions of whether or not the poor comprised primarily minorities (statement 3) or whether low-income children had (or did not have) the same opportunities as children from other economic classes (statement 7), the opinions of students from both countries were divided. Among American students, there was a positive correlation between those who believed that poverty is best defined by lack of money (statement 1) and those who believed that the poor largely comprises minorities (statement 3). Although similar correlations were observed among Japanese students, there was an additional association with the belief that low income families do not value education (statement 12). In addition, among American students, the belief that low-income children have the same opportunities as their middle-and upper-income counterparts (statement 5) was positively correlated with the beliefs that the families themselves have the same opportunities as other economic groups but do not take advantage of them (statement 6) and that the families do not value education (statement 12). From this, we surmise that the students believe that education provides opportunities for low-income children to escape poverty and that low-income children should take advantage of this opportunity. Meanwhile, given the positive correlation observed amongJapanese students between the belief that low-income families do not take advantage of the opportunities available to them (statement 6) and the belief that low income people are lazy (statement 5) and that they spend their money on alcohol and tobacco (statement 10)—i.e. waste their money, it is appears that Japanese students strongly tend to attribute poverty to the lack of self-responsibility.
Discussion
The main purpose of this paper was to deepen our understanding of how Japanese and American eleventh grade students perceive poverty. Japanese high school students held more stereotypical views of poverty than their American counterparts. The limited understanding and awareness of poverty among Japanese students may, in part, be due to the fact that theJapanese government has no official stance on poverty and has only recently begun to maintain poverty statistics. This, in turn, may reflect the government’s desire to deny the existence of poverty or to minimize its significance in Japanese society (Sekine, 2007). The minimum standard of living guaranteed by the Public Assistance Law serves as the virtual poverty line in Japan (Yuasa, 2008). Recently, the Japanese government, concerned with the alienation of specific minority groups and inequality among low income Japanese students, proposed a plan to identify poverty in the context of schools (Ministry of Health, Labor and Welfare, 2011). This increased emphasis on poverty may directly impact the approach typically taken in Japanese schools of not preferential treating or differentiating students based on family income—an approach which often ends up obscuring poverty-related issues in the context of schools (Morimitsu, 2011).

Nakayama et al: High school students awareness of poverty IJHE Vol 6 No 2 2013
238
The study also provides insight into the nature of stereotypical views on poverty held by Japanese high school students, which differed from those of American students. For example, Japanese students commonly believed that poverty is most prevalent in rural areas—aperception that may, in part, be the result of the students’ upper-income urban environment. As noted by Aoto (2009), in Japan, the issues of poverty and dropping out of school as a result of economic hardship are associated with so-called “lowest-achieving” schools rather than schools in a particular geographical (urban or rural) context.
Japanese students also seemed to believe that education is not necessary for breaking the cycle of poverty. Such a belief may be explained by Japanese culture. In Japan, an individual’s background is considered important and may determine an individual’s social class or status to a greater degree than in the US.
American students shared many views of poverty with their Japanese counterparts but differed in their attribution, definition, and association of poverty with certain lifestyles and attitudes. Differences in these areas may be the result of various societal influences and differing stereotypes related to poverty in each country.
American students agreed that poverty is best defined by the lack of money and that it is social problem primarily associated with minority populations. According to Hodgkinson (2002), African Americans and Latinos are the group with the highest proportion of their members living in poverty. While there is a sizeable population of Americans of Europeandescent who are also considered low income, minority low-income children in particular face multiple challenges in the country’s educational system. Gassoma (2012) suggests that education is a low priority for families living in poverty but that there is a belief in the society at large that education is a viable means to escape poverty. This is consistent with the opinion expressed by American students that while low income families do not have access to extensive educational resources, the idea of and opportunities for education are valued among the poor.
The perceived relationship between low income and education in American is influenced by students’ direct experiences in school, and particularly those of low income students who confront “personal biases” on a daily basis. Ching (2012) reports school districts across the country are providing ways to help teachers explore their conscious personal biases that low income students are: 1) poorly motivated; 2) suffer from emotional problems; 3) lack confidence and self-esteem; 4) lack family support; and 5) are unprepared for academic settings.
With increased of awareness of poverty in the nation’s public schools, American students believe that educational opportunities exist for low income families and students. The “American dream” of earning a college degree is perceived as becoming increasingly accessible for students living in poverty. Research (Gassama, 2012; Payne, 2005; and Delpit, 2006) suggests that while education is not the top priority among the poor, students can be successful. For example, the Southern Regional Education Board (2012) reports that a significant number of children from poor families are able to graduate from high school and

Nakayama et al: High school students awareness of poverty IJHE Vol 6 No 2 2013
239
attend institutes of higher education as a result of assistance in the form of scholarships, grants, government programs, and service in the US military.
There is an additional benefit to students and teachers who participated in this study. Williamson (2011) points out the importance of opportunities for students to examine poverty-related issues as opportunities to clear up misconceptions and exchange ideas. As Haberman (1991) suggests, all aspects of a curriculum should deepen students’ basic understanding of the persistent facts of life. From this perspective, we posit that the questionnaire used in this study itself is excellent educational material to help students and teachers focus in on poverty issues and to share their ideas through various class activities.
Implications and limitations of the study
Several conclusions can be drawn from this study. First, it should be recognized that children’s perceptions of poverty and stereotypes of poverty are influenced by the educational environment. This study demonstrates the importance of re-examining pedagogyrelated to poverty, which is a controversial issue of global significance. By providing students with increased opportunities to discuss and examine solutions tor poverty, educators strive to promote change from within the current educational and social frameworks. To this end, there is a need, particularly in Japan, to develop curricula dealing with poverty and related topics.
As in the case of all studies, the present study suffers from several limitations. Chief among these is the fact that the sample consists of Japanese and American high school students from only suburban areas. It should be noted that the opinions and perceptions of students living in either urban or rural environments may differ from those of students living in suburban settings. As such, further study of diverse populations is needed to develop a more comprehensive view of poverty in both the United States and Japan. In addition, the method for measuring perceptions of poverty could be improved. Although the instrument used in the present study was derived after rigorous discussion by the American and Japanese authors, there is a chance that students in the two countries interpreted the statements differently. To enable rigorous analysis, it is critical to that the measuring instrument is culturally unbiased.
Biography
Setsuko Nakayama is an associate professor of Faculty of Education at Chiba University in Japan and a Visiting Research Associate at the IOE, University of London (2012). She received her master’s degree in Integrated Studies from Oregon State University in 2002 and in education from Tokyo Gakugei University in 2003. She received her doctoral degree from Showa Women’s University in 2006. Her doctoral dissertation theme is Time-Use Surveys in The ESCAP Region and Time-Use Literacy as a Tool for Human Development and Education for Independence. Her current research interests are Home Economics curriculum and Education for Sustainable Development including poverty issues.
Jeffrey M Byford, Ph.D., is an Associate Professor of Social Studies Education at the University of Memphis. In addition, Dr. Byford serves as the Secondary

Nakayama et al: High school students awareness of poverty IJHE Vol 6 No 2 2013
240
Education Program Coordinator. He earned his BS, M.Ed. and Ph.D. from the University of Oklahoma. Dr. Byford's research interest includes differentiated instructional strategies used in social studies instruction and curriculum design, Cold War education research and design for high school students, the examination of 1960s/70s New Social Studies Projects, and social studies curriculum in Europe.
Yoko Ito is a Professor of Faculty of Education at Chiba University in Japan and a Visiting Professorial Fellow at the IOE, University of London in UK (2013). She received her doctorate in educational psychology from Ochanomizu University in 2003 and her master’s degree in child development from Ochanomizu University in 1983. She has served as the chief editor of the JAHEE from 2007 to 2011. She has published numerous articles and book chapters on child development education in Home Economics. Her current research interests include Education for Sustainable Development in Home Economics. She also takes part in cross-cultural studies of pre- parenting education in China, Japan, the United States and Sweden.
References
Abe, A. (2008). Kodomo no hinkon [Child poverty]. Tokyo: Iwanamishinsyo.
Advance Humanity. (2007). Child poverty in perspective: An overview of children well-being in rich countries (UNICEF Innocent Report Card 7). Retrieved fromhttp://www.unicef-irc.org/publications/pdf/rc7_eng.pdf
Aoki, O. (2009). Poverty reduction approaches in the West and Japan: a viewpoint of sustainable society. Journal of Education and Social Work, 15, 23-37.
Aoto, Y. (2009). Kokochutai [High school dropout]. Tokyo, Japan:Chikumashinsyo.
Asai, H., Matsumoto, I. & Yuzawa, N. (2008). Kodomo no hinkon [Childpoverty]. Tokyo, Japan: Akashishoten.
Bennett, M. (2008). Understanding the students we teach: Poverty in the classroom. The Clearing House, 81 (6), 251-256.
Ching, J. (2012). The poverty myth. Teaching Tolerance, 44, 44-45.
Delpit, L. (2006). Other people’s children: Cultural conflict in the classroom. New York, NY: New Press.
Gassama, S. (2012). The correlation between poverty and learning: What can be done? To help children with limited resources learn (ERIC Reproduction No. ED 530618). Retrieved from http://files.eric.ed.gov/fulltext/ED530618.pdf
Haberman, M. (1991) .The pedagogy of poverty versus good teaching. Phi Delta Kppan, 73-4, 290-294.
Hodgkinson, H.L. (2002). Demography and democracy. Journal of Teacher Education, 53 (2), 102-105.

Nakayama et al: High school students awareness of poverty IJHE Vol 6 No 2 2013
241
Howell, D.C. (2004). Fundamental statistics for the behavioural sciences (5th ed). Belmont, CA: Brooks/Cole Publishers.
Inuma, J. (2008). Koukousei ni hitsuyouna sukiru wo manabi syakai tomukaiau [A skill necessary to a high school student is learned, and it's confronted with society]. CRESCO, 8 (10), 31-33.
Iwata, M. (2008). Hinkon kenkyu ni naniga motomerarete iruka [What is required of poverty study?]. Journal of poverty, 1, 12-23.
Kozol, J. (2006). Rachel and her children. New York, NY: Three Rivers.
Kubota, M. (2010). A Study on the "Poverty" in Present Age Japan that the Junior High School Student and High School Student Learn. Bulletin of the Faculty of Education and Welfare, Aichi Prefectural University, 59, 1-8.
Lister, R. (2004). Poverty. Cambridge, England: Polity Press.
Mead, L.M. (1994). How little we know. The Social Service Review, 68 (3), 322-350.
Merriam, S.B. (1998). Qualitative Research and Case Study Applications in Education. San Francisco, CA: Josey-Bass Publishers.
Mimizuka, H. (2007). Syogakkou gakuryokukakusa ni idomu darega gakuryoku wo kakutoku surunoka [Determinants of Children's Academic Achievements in Primary Education]. The Japan Society of Educational Sociology, 80, 23-39.
Ministry of Health, Labor, and Welfare. (2010). Annual Health, Labor and Welfare Report 2009-2010. Retrieved from http://www.mhlw.go.jp/english/wp/wp-hw4/dl/honbun/2_2_3.pdf
Ministry of Health, Labor, and Welfare. (2011). Hinkon kakusa teishotokusya taisaku nikansuru siryo [Paper on government action of poverty, inequality and low-income]. Retrieved from http://www.mhlw.go.jp/stf/shingi/2r9852000001d2yo-att/2r9852000001d31e.pdf
Morimitsu, Y. (2011). Gakko ni okeru hinkon no araware to sono fukashika [Expression and invisibility of poverty in school: a case study of the school life of students from “Seikatsu Hogo” families]. The Japan Society of Educational Sociology, 88, 273-294.
National Coalition for the Homeless. (2007). Employment and homelessness (NCH fact sheet 4). Retrieved fromhttp://www.nationalhomeless.org/publications/facts/employment.html
Nishinari high school. (2009). Han hinkon gakusyu [Study for Anti-poverty]. Osaka, Japan: Kaihoshuppansya.
Organization for Economic Co-operation and Development. (2008). Growing Unequal? Income Distribution and Poverty in OECD Countries. Paris, France :OECD.
Otake, M., Nakayama, S. & Fujita, A. (Eds.). (2012). Anshin shite ikiru, hataraku manabu[Work, Live and Learn without anxiety: Lessons from high school Home Economics]. Tokyo, Japan: Kairyudo.

Nakayama et al: High school students awareness of poverty IJHE Vol 6 No 2 2013
242
Øyen, E. (1996). ‘Poverty research rethought’, In E. Øyen, S. M. Miller & S. A. Samad (Eds.), Poverty: A Global Review. Handbook on International Poverty Research. (pp. 3-17). Oslo, Norway: Scandinavian University Press.
Payne, R. (2005). A framework for understanding poverty (4th ed.). Highland, TX: aha! Process.
Sagayama, T. (2009). Hinkon no nakade ikiru kodomotachito [I work on making of presentation “homeless high school student" with the children who live in the poverty]. Ningen to Kyouiku, 61, 78-90.
Sekine, Y. (2007) Nihon no hinkon [Poverty in Japan: The Increasing Working Poor]. Japanese Journal of Labour Studies, 563, 20-30.
Southern Regional Education Board. (2012). Growing portion of children in poverty means more education challenges (ERIC Reproduction No. ED 533113). Retrieved from http://publications.sreb.org/2012/12E03_FBB_Apr.pdf
Sylwester, R. (2000). A biological brain in a cultural classroom: Applying biological research in classroom management. Thousand Oaks, CA: Corwin Press.
Tatum, B.D. (2003). Why are all the black kids sitting together in the lunchroom? A psychologist explains the development of racial identity (5th ed.). New York, NY: Basic Books.
Taylor, S.I., Wilson, J., Kaneda, T. & Oagawa, T. (2000). Rules are Made to Be Golden: a qualitative study of American and Japanese children’s morals. Kindergarten Education: theory, research, and practices, 5(1), 4-10.
US Census Bureau. (2010). State and county quick facts. Retrieved from http://facts.census.gov
Williamson, K. (2011). Talking to kids about poverty, hunger. Retrieved fromhttp://www.talkaboutgiving.org/talking-to-kids-about-poverty-hunger/
Yuasa, M. (2008). Han hinkon [Anti-Poverty]. Tokyo, Japan: Iwanamishinsho.
Yuasawa, N., Asai, H., Abe, A., Iwakawa, N., Konishi, Y., Nakanisi, S., Hirayu, M., Yamano, R. (2009). Kodomo no hinkon hakusyo [Child poverty white paper]. Tokyo, Japan: Akashishoten

International Journal of Home Economics
243
The use of Meaningful Reception Learningin lesson on classification
Titilola T Obilade
Virginia Polytechnic Institute and State University
Abstract
This paper begins with a learning theory of instruction. It describes how Meaningful Reception Learning can be used to teach in classification of items. Meaningful Reception Learning is a learning theory of instruction proposed by Ausubel who believed that learners can learn best when the new material being taught can be anchored into existing cognitive information in the learners. He also proposed the use of advance organizers as representations of the facts of the lesson. The principles of Meaningful Reception Learning; derivative subsumption, correlative subsumption, combinatorial subsumption and superordinate learning are used in the classification of items. The items classified in this paper are fabrics. The classification is divided into man- made fabrics and naturally occurring fabrics. The hypothetical learners in this paper are undergraduate students but the principles can be modified to fit a different audience.
Keywords: Meaningful Reception Learning, Learners, Advance Organizers, Subsumption, Ausubel
Introduction
The theory of Meaningful Reception Learning was developed by Ausubel (1960). Ausubel’s experiments (1960) supported the idea that when learners were presented with facts that were of relevance to the lesson being presented, the learners were more likely to understand the lesson. When these facts are presented ahead of the lesson, they are called advance organizers (Ausubel,1960). He noted that if learners were presented with the facts of the lesson in such a way that the facts subsumed into one another in a relational manner, the learners were more apt to learn (Ausubel, 1962, 1963).
Further, his experiment showed that when learners were provided with concepts that subsumed into one another like nested dolls, the learners were more likely to relate the concepts relationally. The use of concept mapping has been used successfully in improving performance in business and economic statistics (Chiou, 2009), problem solving (Hao, Kwok & Lau, 2010) and it has been used to improve performance in Biology (Udeani & Okafor, 2012).
The nested dolls in figure 1 are a representation of subsumption. The smallest doll can fit into the preceding doll which in turn can fit into the next doll until they all fit into the biggest doll. When the dolls are arranged in order of size, they can be seen relationally to one another. All the dolls can fit into the biggest doll.

Obilade: Meaningful Reception Learning (MRL) IJHE Vol 6 No 2 2013
244
Figure 1 Nested Dolls
The Learners
In this lesson, the learners would have prior knowledge of at least one or two fabrics. They would have seen different types of fabrics but may not necessarily know the classifications of these fabrics. At the end of the lesson, the learners should have been able to classify fabrics in a hierarchical structure. The lesson should not be presented in its final form as is expected in reception learning. Ausubel argued that whether the lesson was presented as reception or discovery learning, as long as the learner was able to relate it to the existing knowledge, the learner would learn the concepts (Ausubel, 1962). This is in contrast to rote learning where the learner just spits out the facts without knowing what it means. Students may recite the pledge of their country without knowing the implications (Driscoll, 2004).
Principles of Meaningful Reception Learning
The learners should be able to anchor specific information that they would just be learning on fabrics to what they already know about fabrics. They should not memorize any detail of the lesson because in their cognitive organization, they would have arranged the different types of fabrics in a hierarchical cognitive structure.
Derivative Subsumption
In derivative subsumption, the new fact is subsumed into the facts that the learners already know. As an example, if they know that corduroy, organdie and calico are cotton but they now just know that crepon is also cotton, then the new knowledge that they have that crepon is also cotton is derivatively subsumed into the existing knowledge of what they already know to be cotton.

Obilade: Meaningful Reception Learning (MRL) IJHE Vol 6 No 2 2013
245
Figure 2 shows a graphical representation of what the instructor can present to the learners. Crepon is written in red font or it may be bolded. The graphical representation in Figure 2 isadapted from Neal, M. M. (2005). Needlework for schools. Nelson Thornes Ltd: Cheltenham.
Figure 2 Graphical representation of derivative subsumption of crepon into existing knowledge of types of
cotton
Correlative Subsumption
The learners would also learn through a correlative subsumption. This would involve some high level of thinking because they would add something new to their knowledge. If for example the learners knew that winceyette was a fabric but did not know that winceyette was also a cotton fabric because it is usually sewn as a nightwear, the learners would now add winceyette as a new knowledge that cotton can also be used as nightwear in the form of winceyette (Neal, 2005).
Superordinate Learning
In Meaningful Reception Learning, the learners also learn through superordinate and combinatorial learning. As an example of superordinate learning, if the learners know that fabrics were bought in shops and thought all fabrics were man-made, then if they learn that cotton and wool are naturally occurring; this new information would be superordinate to their existing knowledge that all fabrics were man- made.
Combinatorial Learning
Another principle of Meaningful Reception Learning is combinatorial learning. In combinatorial learning, the new idea is similar to the existing concept but it is not above or below it. As an example, I would expect the learners to know that wool, silk, cotton and linen are all naturally occurring fabrics. Further, I would expect them to know that wool and silk are from animal sources while cotton and linen are from vegetable sources or plant sources.
The learners should be able to assimilate the new information into their existing information and anchor their ideas to prior existing ideas in order to be able to retain the new knowledge. If the learners do forget, it would be because what they learned through subsumption, got dissociated from the anchoring idea (Driscoll, 2004). Even if they do forget, it would be easier

Obilade: Meaningful Reception Learning (MRL) IJHE Vol 6 No 2 2013
246
to retrieve or easier to relearn than if they had learnt from rote memorization. In Meaningful Reception Learning, the learner is able to differentiate more of the concepts in the learning process because of the relational associations made.
Lesson Outline
Since Meaningful Reception Learning encourages meaningful learning rather than rote learning, the learning material should be presented in a carefully organized way. The advanced organizer can be presented using PowerPoint slides, flip charts, smart board, handouts and the chalk board. The instructor should give an introductory statement that would show the relationship of high-level concepts that is broad enough to encompass all the information that would follow. As an example, the instructor can say, “All fabrics can be divided into two broad categories”. The advanced organizer should present a general overview of what would be taught. It would show the broad concepts of the lesson, highlighting relationships amongst ideas that would be presented.
The advanced organizer should be easy to learn and use. It would be straight forward and show the logical relationships between naturally-occurring fabrics and man-made fabrics. In the advanced organizer, the instructor should make use of highlighting and bolding which is important in cognitive information processing because it is also important that there is clarity in the advanced organizer (Armbruster, & Anderson, 1988; Clark & Mayer, 2011; Glynn, S. M., & di Vesta, 1979 & Lohr, 2007). The learners can be encouraged to write the classification on flash cards.
In addition, a comparative organizer should be presented to compare and contrast the different types of fabrics, highlighting and clarifying those areas that may appear ambiguous. The instructor can make use of cross- referencing as some fabrics are made with a combination of man-made and naturally- occurring fabrics.
The instructor can make use of progressive differentiation, starting at the broadest classification of fabrics then narrow down to naturally- occurring which narrows further into wool and cotton which divides further into a myriad of other forms. In the man-made category, the instructor should progressively explain the differentiation of the man- made fabrics like rayon and chiffon.
The instructor should let the learners know the importance or relevance of the lesson to them. If they know how to differentiate the different types of fabrics, they would be able to choose the right sewing needle. They would be able to choose the appropriate fabrics for a particular dress design.
The learners should be discouraged from memorization because Meaningful Reception Learning would not occur by memorization (Driscoll, 2004). Meaningful Reception Learning can only occur when the learners are able to attach new knowledge (that is potentially useful) to existing knowledge that they already have (Ausubel, 1960 & Sweller, 2010).

Obilade: Meaningful Reception Learning (MRL) IJHE Vol 6 No 2 2013
247
The aim of the advanced organizer is to stimulate a recall of the prior knowledge of what the learner already knows about fabrics. The advanced organizer would also let the learners know what is important in the lesson.
After presenting the advanced organizer, the instructor should present the similarities between man- made fabrics and naturally occurring fabrics. I would give examples of the man-made fabrics and give examples of naturally-occurring fabrics. I would also give non-examples. For example, beads can be used to make dresses but they are not fabrics.
Fabrics could be man-made or they could be naturally- occurring. For meaningful learning to occur the instructor should teach the big ideas that are highest in the hierarchy first. Then the instructor moves from the largest division of fabrics (i.e. man-made or naturally-occurring), to the division of naturally-occurring fabrics into animal sources and plant sources. The animal sources are wool and silk. The plant sources are cotton and linen. The man-made sources are divided into two broad categories; natural polymers and synthetic polymers. The graphical representation in Figure 3 depicts the classification of the fabrics into natural and manmade fabrics and is adapted from an article from one of the projects by MIRALab (Meinander & Mäkinen, 2005). The MIRALab is involved in several projects including fabrics (MIRALab, 2013). It further describes the natural fabrics into fabrics derived from animal sources and fabrics derived from plant sources.
As the lesson is being taught, the students should look at the connections, the similarities, the differences, the concepts and encourage anchoring of the new information on to their existing knowledge.
At the end of the lesson, the instructor can create an empty chart with two large headings titled- Naturally occurring fabrics and Man-made fabrics. Each student can be given a card with the name of the fabric and a cut piece of the fabric. Each student can now be called upon to stick the fabrics under the right heading.
Some samples of the fabrics in the major divisions of the fabrics would be brought to class. PowerPoint Slides can be used to show the different types of fabrics. The instructor can actually bring different types of fabrics to class or the students can be encouraged to bring different types of fabrics to class. On a board or on a flip chart, the learners can make a table of the two major divisions of fabrics and place the appropriate fabrics underneath each table.
At the end of the lesson, these strategies would have resulted in meaningful learning because the learners were able to see the similarities and the differences in the divisions of the fabrics. They would have used derivative subsumption, correlative subsumption, combinatorial and superordinate subsumption.
The classification of fabrics is much more extensive than what I have represented but it hasbeen simplified to give an idea of what the chart would look like.

Obilade: Meaningful Reception Learning (MRL) IJHE Vol 6 No 2 2013
248
Conclusion
This paper has described the use of Meaningful Reception Learning in a hypothetical lesson of classification of fabrics. It has made use of subsumptions and advance organizers. This paper also described the conclusions of Ausubel on Meaningful Reception Learning. Learners can learn relationally when the concepts of the lesson are presented in a way that the learners can anchor the new knowledge to already existing concepts.
Recommendation
While other learning theories can be used in teaching a lesson on classifications, the use of Meaningful Reception Learning can be used in lessons involving classifications of facts. The use of advance organizers in Meaningful Reception Learning and the use of principles of subsumption make the relationships in the items being classified easy to see at a glance.
Biography
Titilola T Obilade, MB, BS, (Nigeria), MPH (Nigeria) is in the Instructional Design and Technology doctoral program at Virginia Polytechnic Institute and State University, USA. Email: [email protected]
References
Armbruster, B. B. & Anderson, T. H. (1988). On selecting "considerate" content area textbooks. Remedial and Special Education, 9(1), 47-52.
Ausubel, D. P. (1960). The use of advance organizers in the learning and retention of meaningful verbal material. Journal of Educational Psychology, 51(5), 267-272. doi: 10.1037/h0046669
Ausubel, D. P. (1962). A subsumption theory of meaningful verbal learning and retention. The Journal of General Psychology, 66 (2), 213-224.
Ausubel, D.P. (1963). Cognitive structure and the facilitation of meaningful verbal learning. Journal of Teacher Education. June 1963 14: 217-222, doi:10.1177 /002248716301400220
Chiou, C.-C. (2009). Effects of concept mapping strategy on learning performance in business and economics statistics. Teaching in Higher Education 14(1): 55-69.
Clark, R. C., & Mayer, R. E. (2011). E-learning and the science of instruction: Proven guidelines for consumers and designers of multimedia learning. San Francisco, CA: Pfeiffer.
Driscoll, M. P. (2004). Psychology of learning for instruction. Needham Heights, MA: Allyn & Bacon.
Glynn, S. M., & di Vesta, F. J. (1979). Control of prose processing via instructional and typographical cues. Journal of Educational Psychology, 71(5), 595-603. doi: 10.1037/0022-0663.71.5.595

Obilade: Meaningful Reception Learning (MRL) IJHE Vol 6 No 2 2013
249
Hao, J.-X., Kwok, R. C-W, Lau, R. Y-K, & Yu, A.Y. (2010). Predicting problem-solving performance with concept maps: An information-theoretic approach. Decision Support Systems 48(4): 613-621.
Kawakami, S., Watanabe, K & Matsumota, A. (2012). Development of meaningful reception learning in Japan: A case study. Biology Education for Social and Sustainable Development, Sense Publishers: 367-374. doi:10.1007/978-94-6091-927-5_39 Retrieved November 10, 2013, from Springer Link database.
Kirschner, P. A. & van Merriënboer, J. J. G. (2013). Do Learners Really Know Best? Urban Legends in Education. Educational psychologist 48(3): 169-183.
Lohr, L. L. (2007). Creating graphics for learning and performance: Lessons in visual literacy.Prentice Hall Press
Mäkinen, M., & Meinander, H. (2005). Influence of physical parameters on fabric hand.Retrieved November 10, 2013, from http://www.miralab.ch/repository/papers/203.pdf
MIRALab (2013) Research Projects. Retrieved November 10, 2013, from http://www.miralab.ch/
Neal, M. M. (2005). Needlework for schools. Nelson Thornes Ltd: Cheltenham.
Sweller, J. (2010). Element interactivity and intrinsic, extraneous, and germane cognitive load. Educational Psychology Review, 22(2), 123-138.
Udeani, U. & Okafor, P. N. (2012). The Effect of Concept Mapping Instructional Strategy on the Biology Achievement of Senior Secondary School Slow Learners. Journal of Emerging Trends in Educational Research and Policy Studies (JETERAPS) 3(2): 137-142.
International Journal of Home Economics
250
Psychosocial factors influencing marital adjustment among couples in Ile-Ife, Osun State, Nigeria
David Oladeji
Obafemi Awolowo University, Ile-Ife, Nigeria
Abstract
The study examined the psychosocial factors influencing marital adjustment among couples in Ife Central Local Government Area, Ile-Ife. A total of 200 respondents were randomly selected of which 113 were males and 87 were females. A closed ended structured questionnaire was used to collect information from the respondents and the hypotheses were subjected to Chi-square and correlation analysis. The findings revealed that psychological and social factors influencing marital adjustment among couples in Ife Central Local Government Area, Ile-Ife, Osun State. The results revealed that, significant relationship existed at (p<0.01 and p< 0.05) level of significance between marital satisfaction and marital adjustment. The results of Chi-square showed a significant relationship between psychological and social factors (depression, aggressiveness, illness, sexual satisfaction, communication, spending quality time, maturity) and marital adjustment. And also, the result of correlation analysis showed a significant relationship between marital satisfaction and marital adjustment. The Correlation coefficient value of marital satisfaction (r= 0.619, p < 0.01) and the Correlation coefficient value of marital adjustment (r= 0.619, p< 0.01) it means that there is significant relationship between marital adjustment and marital satisfaction. In conclusion, couples should be cognizance of the psychological and social factors listed in the study, influencing adjustment in marriage. It was recommended that in both premarital and marital counselling, couples should be introduced to the rudiments of infertility as one of the crucial factors towards marital adjustment. Through conjoint marital therapy, couples should be taught effective communication skills (interpersonal relationship). This is to enable them learn and adopt inter-personal communication skills that will lubricate their marital relationship to enhance harmony, understanding and compromise for stability
Keywords: Psychosocial factors, Marital adjustment, Couples, Ile-Ife, Nigeria
Introduction
Marriage institution pre-dates reliable recorded history; many cultures have legends concerning the origins of marriage. The way in which a marriage is conducted and its rules and ramifications have changed over time, as has the institution itself, depending on the culture or demographic of the time. Various cultures have had their own theories on the origin of marriage. One example may lie in a man's need for assurance as to paternity of his children. He might therefore be willing to pay a bride price or provide for a woman in

Oladeji: Psychosocial factors influencing marital adjustment IJHE Vol 6 No 2 2013
251
exchange for exclusive sexual access. Legitimacy is the consequence of this transaction rather than its motivation.
Uwe (2002) opines that compromise couples make help to move the family forward. When couples come together in marriage, they are faced initially with series of problems and differences that challenge their stability. This requires that on both sides, compromises, agreement and endurance must be met in dealing with issues such as parent in laws, finance, friends, habits, feeding, response to problems and purchases and use of home items. Other issues include attending to one’s feeling and emotions, attending to ones’ needs and attending to ones’ speech (communication use), procreation, career and academics to enhance marital adjustment or stability. Tawo et al (2006) reported a significant relationship between marital adjustment (stability) and social responsibilities. They concluded therefore that a high social responsibility to one’s marriage leads to a high marital adjustment. The social factors are akin to emotional intelligence. These findings by Dada and Idowu (2006) buttresses further the importance of emotional intelligence in marital adjustment. For instance, it is the contention of Willams (1977) that successful communication is a vital factor in all relationships. It facilitates interpersonal relationship; create intimacy, togetherness and understanding. In marriage, Akpan (2000) report that effective marital communication (verbal or non-verbal) gives partners a deep sense of satisfaction as they openly express their minds. Mullins (1996) buttresses that through communication, couples express socio-emotional behaviours such as solidarity, tension release, joy, anger, anxiety, satisfaction, love, seek, help, show disagreement or approval and discuss to provide solution amicably. Dean, Lucas and Cooper (1976) observed that if couples were fully communicating and sensitive to each other’s wishes they would be able to make accurate guesses concerning their spouses colourpreferences for domestic articles. Others include emotional, finance and sexual needs. Burke and Weir (1977) in their study found out that couples with happy marriages were more likely to discuss their problems while those with unhappy marriages were those who refuse to discuss their problems together.
Effective communication is an important characteristic of strong, healthy families. Research identifies communication as an essential building block of strong marital, parent-child, and sibling relationships. Family communication is the way verbal and non-verbal information is exchanged between family members (Epstein et al 1999). Markman, (1981) has observed that the more positively couples rated their communication, the more satisfied they were with their relationship five and a half years later and to compliment this, Noller and Fitzpatrick (1990) noted a strong link between communication patterns and satisfaction with family relationships. Poor communication is also associated with an increased risk of divorce and marital separation and more behavioural problems in children. Wuerffel, DeFrain and Stinnett (1992) and Wilcox (2002) viewed the scientific literature on humour and found that humourcan be used in many different positive and negative ways. Humour can reduce daily tension, facilitate conversations, express feelings of warmth and affection lessens anxiety, point out mistakes made by others, and entertain. It can also help put others at ease and help maintain a positive outlook on life. The study found positive correlations between the use of humourand how strong the families were, based on their responses to a family strength inventory. The stronger families in the study reported negative effects, however, when humour was used to put down other family members

Oladeji: Psychosocial factors influencing marital adjustment IJHE Vol 6 No 2 2013
252
Azar (2002) observed that characteristics of the home environment, such as warmth, emotional availability, stimulation, family cohesion, and day-to-day activities, have also been implicated in the notion of marital stability.
Marital satisfaction is a mental state that reflects the perceived benefits and costs of marriage to a particular person. The more costs a marriage partner inflicts on a person, the less satisfied one generally is with the marriage and with the marriage partner. Similarly, thegreater the perceived benefits are, the more satisfied one is with the marriage and with the marriage partner. Nearly 90% of all individuals marry at least once in their lifetime (Cherlin 2004). This can be taken as an indication of the value placed on the marital union. However, the rate at which marriages dissolve was 3.7 per 1,000 in April of 2009 (CDC 2009). The rate of marital dissolution is affected by levels of martial satisfaction and happiness within the marriage. Although we seem to value being married, that value is only retained if the marriage is happy and functional. Marital satisfaction appears to be essential in preserving a marriage (Previti and Amato 2003; South and Trent (2003). Marital satisfaction here is the perceived level of happiness and support experienced by each spouse. Being able to predict marital satisfaction is an important element in being able to maintain functional marriages. If we can predict marital satisfaction then we may be able to help couples attain and sustain high levels of satisfaction. Many studies have reported a significant decrease in marital satisfaction during the first few years of marriage.
Amato et al (2007) attribute this decline to what they refer to as relationship disenchantment. Their argument is that the first few years of a marriage require negotiation of the responsibilities of married life and to learn how to deal with the conflict that inevitably accompanies long-term relationships. Individuals with high or unrealistic views on their partners and the new marriage may become disappointed as they encounter the realities of married life. The association between marital satisfaction and instability and divorce has not been found to differ by age or marital duration or for men and women (Booth, JohnsonWhite, and Edwards 1986). Previous cross-sectional studies have found a U-shaped curve in regards to marital satisfaction (Kurdek 2004). This curve in satisfaction tends to decrease during the first few years of marriage and then tends to increase after all dependent children have left the home. Amato et al. (2007) reported that this U-shaped curve was not supported longitudinally. They attributed the misreporting of this curve to older cohorts of married couples experiencing higher levels of marital satisfaction than younger cohorts. In other words, it is not life transitions that affect trends in marital satisfaction but simply that older married couples are happier overall.
Research Methodology
Most people like to be married and tend to be happier and healthier when they are married. The study of marital adjustment has a long and well-documented history but the consistently high divorce and separation rates illustrate that still too little is known about ways to achieve and maintain a sufficient level of marital adjustment to assure marital success. Historically, marriage researchers have studied either the effects of marital characteristics, marital behaviours, effects of gender, and differences in marital satisfaction by life stage. While research has attempted to account for some of the influences on marital adjustment, it is time to consider more complex models, to account for the interrelationships between a

Oladeji: Psychosocial factors influencing marital adjustment IJHE Vol 6 No 2 2013
253
variety of influences on marital adjustment. Perhaps someday it will be possible to “crack thecode” on marital adjustment.
Objectives of the study
The main objective of this study was to examine the psychosocial factors influencing marital adjustment among couples in Ile-Ife central local government.
Specifically, the study sought the following:
i. to identify what psychological factors are likely to be responsible for marital adjustment
ii. to identify what social factors are responsible for marital adjustment.
iii. to examine if there is any relationship between marital adjustment and marital satisfaction among couples.
Research hypotheses
Based on the objectives the following hypotheses were formulated.
1. There is no significant relationship between the psychosocial factors and marital adjustment among couples.
2. There is no significant relationship between social factors and marital adjustment.
3. There is no significant relationship between marital adjustment and marital satisfaction among couples.
Research design
The study employed a descriptive survey research design. It is a method often used in studying behaviour whereby the researcher attempt to determine the frequency of occurrence of the distribution and the relationship among a variety of variables. The study is an empirical enquiry in which the researcher does not have direct control over conditions influencing subjects’ behaviour.
Sample size and sampling techniques
The target populations of the study were the married couples in Ife Central Local Government Osun State. Structurally, closed ended questionnaire was used to obtain information from a total number of 200 respondents by simple random selection.
Research instrument
The research instrument used for this study is a structured closed ended questionnaire. The questionnaire was administered to obtain relevant information about the respondents

Oladeji: Psychosocial factors influencing marital adjustment IJHE Vol 6 No 2 2013
254
(married couples) on the psychosocial factors that influences marital adjustment among couples.
Data analysis
The data was analysed using Chi - Square and Pearson Product Moment Correlation statistics that provided the relationship between the dependent and independent variables.
Results and Discussion
Table 1 Correlation of relationship between some independent variables and both marital adjustment and
marital satisfaction among couples.
Variables Correlation Coefficient (r )
Coefficient of determination (r² )
Percentage determination
Significance 2 –tailed
Aggressiveness 0.26 0.0676 6.76 0.00 (S)
Inability of couples to adjust
-0.15 0.0225 2.25 0.03 (S)
Effective communication
0.29 0.0841 8.41 0.00 (S)
Nature and pattern of employment
0.35 0.1225 12.25 0.00 (S)
Ability to manage crisis
0.15 0.0225 2.25 0.04 (S)
Spending quality time with spouse
1.00 0.200 1.25 0.14(S)
Positive marital adjustment
0.18 0.0324 3.24 0.01 (S)
Table 1 shows that marital adjustment and marital satisfaction is strongly correlated to aggressiveness, effective communication, the nature and pattern of employment, ability to manage crisis or conflicts, maturity of spouses, and, positive adjustment of the couples. The inability of the couples to adjust negatively correlated with negative marital adjustment (p-value < 0.01). Positive marital adjustment is highly correlated to depression due to no child, depression or stress at work, aggressiveness, effective communication, nature and pattern of employment, ability to manage crisis, maturity of spouse, and loss of self-concept which are all marital adjustment (p-values are 0.01). Marriages are bound to face different types of marital adjustment is in positive perfect correlation to aggressiveness, effective communication, ability to manage crisis, positive marital adjustment, and cooperation (p-values are 0.000). Spending quality time with spouses is in correlation with depression due to no child, depression or stress at work, aggressiveness, illness , effective communication, nature and pattern of the employment, ability to manage crisis or conflicts, adjustment, and also marriage type (p-value < 0.05). This shows that there is significant relationship between marital adjustment and marital satisfaction. And also there is relationship between marital

Oladeji: Psychosocial factors influencing marital adjustment IJHE Vol 6 No 2 2013
255
adjustment and marital satisfaction among couples. Marital adjustment occurs when each spouse enacts his/her role effectively to the satisfaction of the other (Obasa, 1990). Noller and Fitzpatrick (1990) noted a strong like between communication patterns and satisfaction with family relationship. Cherlin (2004) the rate of marital adjustment is affected by levels of marital satisfaction and happiness within the marriage.
Tests of Hypotheses
Hypotheses 1: There is no significant relationship between the psychosocial factors and marital adjustment among couples
Table 2 Statistical relationship between the psychosocial factors and marital adjustment among couples.
Marital adjustment Psychosocial factors
Chi – Square a, b 130.181 114.000
Df 25 37
Asymp. Sig 0.000 0.000
P-
Table 2 above shows that there is significant relationship between psychosocial factors and marital adjustment. The Chi-square values were 130.181 and 114.000 and the significant value is 0.000 which is far less the p-value which is 0.05, it means that there is significant relationship between psychosocial factors and marital adjustment. Hence, there is a significant relationship between psychosocial factors and marital adjustment. According to Mullins (1996) buttresses that through communication, couples express socio-emotional behaviours such as solidarity, tension release, joy, anger, anxiety, satisfaction, love, seek, help, show disagreement or approval and discuss to provide solution amicably. These findings by Dada and Idowu (2006) buttresses further the importance of emotional intelligence in marital adjustment. Thus, marital adjustment is attributed to a range of factors including role expectations of spouses, level of work commitment, job satisfaction, spouse values, socio-economic status, emotional instability among others (Denga, 1986).
Marital adjustment brings about peace and harmony in the home, marital satisfaction or success and marital stability. Marital adjustment occurs when each spouse enacts his/her role effectively to the satisfaction of the other (Obasa, 1990). It is the contention of Tawo et al (2006) that marital adjustment requires a lot of understanding and compromise from couples involved in the relationship.
Hypothesis 2: There is no significant relationship between social factors and marital
Adjustment

Oladeji: Psychosocial factors influencing marital adjustment IJHE Vol 6 No 2 2013
256
Table 3 Statistical relationship between social factors and marital adjustment among couples.
Marital adjustment Social factor
Chi-square 130.181 145.781
Df 25 26
Asymp.sig 0.000 0.000
P-
Table 3 above shows that there is a significant relationship between social factors and marital adjustment. The Chi-square values were 130.181 and 145.781 and the significant value is 0.000 which is far less the p-value which is 0.05, it means that there is significant relationship between social factors and marital adjustment. Hence, there is significant relationship between social factors and marital adjustment. Tawo et al (2006) reported a significant relationship between marital adjustment and social responsibilities. They concluded therefore that, a high social responsibility to one’s marriage leads to a high marital adjustment. The social factors are akin to emotional intelligence. In marriage, Akpan (2000) report that effective marital communication (verbal or non-verbal) gives partners a deep sense of satisfaction as they openly express their minds.
Hypothesis 3: There is no significant relationship between marital adjustment and marital
satisfaction among couples.
Table 4 Statistical relationship between the marital adjustment and satisfaction among couples
Variables Marital satisfaction Marital adjustment
Marital satisfaction Pearson Correlation 1 0.619**
Sig (2-tailed) 102 0.000
N 101
Marital adjustment Pearson Correlation 0.619** 1
Sig (2-tailed) 0.000 102
N 101
** Correlation is significant at the 0.01 level (2-tailed) * P-
Table 4 above shows that there is significant relationship between marital adjustment and marital satisfaction. The Correlation coefficient value of marital satisfaction (r= 0.619, p < 0.01) and the Correlation coefficient value of marital adjustment (r= 0.619, p< 0.01) it means that there is significant relationship between marital adjustment and marital satisfaction. Hence, the Ho (null hypothesis) is rejected, we therefore accept that there is a significant relationship between marital adjustment and marital satisfaction. Marital adjustment occurs

Oladeji: Psychosocial factors influencing marital adjustment IJHE Vol 6 No 2 2013
257
when each spouse enacts his/her role effectively to the satisfaction of the other (Obasa, 1990). Noller and Fitzpatrick (1990) noted a strong like between communication patterns and satisfaction with family relationship. According to Cherlin (2004) the rate of marital adjustment is affected by levels of marital satisfaction and happiness within the marriage. In terms of marital adjustment, it refers to the ability of individuals to become satisfied, happy and achieve success in a number of specific tasks in marriage. Marital adjustment brings about peace and harmony in the home, marital satisfaction or success and marital stability.
Conclusion and recommendations
Conclusion
It was established that these factors had a great role in determining how a couple is able to manage their marital life. Couples should be cognizance of the psychological and social factors enlisted earlier in the study because the factors have influence in the adjustment that occurs in marriages. It also shows that when couples adjust positively it brings about marital satisfaction which most couples are willing to enjoy in their marriage. Depression due to inability to bear children, depression or stress at work, infertility of the spouse, sexual satisfaction, addictive behaviour, aggressiveness, inability of the couple to adjust are all psychological factors that influences marital adjustment. While social factors are effective communication, nature and pattern of employment, cooperation, ability to manage crisis and conflicts, spending quality time, maturity of the spouse, all influences adjustment. And also when couples are able to adjust positively leads to marital satisfaction.
Recommendations
1. In both premarital and marital counselling, couples should be introduced to the rudiments of infertility as one of the crucial factors towards marital adjustment.
2. Through conjoint marital therapy, couples should be taught effective communication skills (interpersonal relationship). This to enable them learns and adopts interpersonal communication skills that will lubricate their marital relationship to enhance harmony, understanding and compromise for stability.
3. Couples should be helped to read, predict and understand each other’s needs, problems, hopes and aspiration and work towards helping themselves out.
4. Though, marital counselling couples should be helped to positively to manage their emotions in terms of joy, anger, problems, anxiety, depression towards one another. This is because, emotions are very important in marriages.
5. Also, they should ensure that God’s factor is not out of their marriage (prayer, faithfulness).
6. Couples should be cognizance of the psychological and social factors enlisted earlier in the study because the factors have great influence in the adjusting that occurs in marriages.

Oladeji: Psychosocial factors influencing marital adjustment IJHE Vol 6 No 2 2013
258
Biography
David Oladeji is currently a lecturer in Obafemi Awolowo University, Ile-Ife, Nigeria and a trained counselling psychologist from University of Ibadan, Nigeria.
References
Amato, P. R., Booth, A., Johnson, D. R., & Rogers, S. J. (2007). Alone together: How marriage in America is changing. Cambridge, MA: Harvard University Press.
Azar, S. (2002).Parenting and child maltreatment. In Handbook of parenting. Vol. 4, Social conditions and applied parenting. 2nd ed. M. Bornstein, ed. Mahwah, NJ: Lawrence Erlbaum Associates, pp. 361–88.
Akpan, J. (2000). “Children and Marital Stability.” Journal of Applied Psychology 39:531-540.
Amato, P. R., Booth, A., Johnson, D. R., & Rogers, S. J. (2007). Alone together: How marriage in America is changing. Cambridge, MA: Harvard University Press.
Burke, S and Weir, M.A.(1977). The Life Course: A Sociological Perspective. Englewood Cliffs, NJ: Prentice-Hall.
Booth, A., Johnson, D., Amato, P., & Rogers, S. (2003). Marital instability over the life course: A six-wave panel study, 1980, 1983, 1988, 1992-1994,1997, 2000. (Version 1) [Data file]. Ann Arbor, MI: Inter-university Consortium for Political and Social Research.
Cherlin, A. J (2004).The Institutionalization of American Marriage. Journal of Marriage and Family. 66, 848-861
Center for Disease and Control (2001). When Partners Become Parents: The Big Life Change for Couples. New York, NY: Basic Books.
Dean, A, Lucas, H, and Copper, M (1976). Effect of Economic Resources on Marital Quality in Black Married Couples. Journal of Marriage and the Family. 53: 645-655.
Denga, D.I. (1986). Marital adjustment and value orientations of selected Nigerian couples. The Counsellor, 6(2), 1-6.
Dada, M and Idowu, J (2006). Divorce over the Life Course: The Role of Marital Happiness.Nigerian Journal of Applied Psychology. 12:5-21
Epstein, J. A., Botvin, G. J., & Diaz, T. (1999). Social influence and psychological determinants of smoking among inner-city adolescents. Journal of Child and Adolescent Substance Abuse, 8
Markman, G. D., Balkin, D. B. & Baron, R. A. (2002). Inventors and new venture formation: The effects of general self-efficacy and regretful thinking. Entrepreneurship Theory and Practice, 27, 149-165.
Mullins, A. H (1996). Well-Being and the Transition to Parenthood: An Identity TheoryApproach. Sociological Perspectives 47:55-78.

Oladeji: Psychosocial factors influencing marital adjustment IJHE Vol 6 No 2 2013
259
Kurdek, L. (2004). Are gay and lesbian cohabiting couples really different from heterosexual married couples? Journal of Marriage and the Family, 880-900.
Noller, B and Fitzpatrick, K. (1990). Birth Timing and the Division of Labor in Dual-Earner Families: Exploratory Findings and Suggestions for Future Research. Journal of Family Issues 11:157-181.
Obasa, J. (1990). Work commitment, marriage role expectations and marital adjustment of married men and women in Kwara State. Unpublished Ph.D. Thesis, University of Ilorin, Nigeria.
Previti, D. & Amato, P. R. (2003). Why Stay Married? Rewards, Barriers, and Marital Stability. Journal of Marriage and Family, 65, 561-573.
Previti, D., & Amato, P. R. (2003a). People’s reasons for divorcing: Gender, social class, the life course, and adjustment. Journal of Family Issues, 24(5), 602-626.
Previti, D., & Amato, P. R. (2003b). Why stay married? Rewards, barriers, and marital stability. Journal of Marriage & Family, 65(3), 561-573.
South, S. J. & Trent, K. (2003). Spousal Alternatives and Marital Relations. Journal of Family Issues, 24(6), 787-810.
Tawo, W.J. (2006). Family Adaptations to Income and Job Loss in Nigeria. Journal of Counseling Psychology. 19:255-283.
Uwe, J. (2002). Economic Circumstances and Family Outcomes: A Review of the 1990s. Journal of Marriage and the Family. 62: 1035-1051.
Wuerffel, R.D.,Defrain, and Stinnetl G. H.(1992). Linking Economic Hardship to Marital Quality and Instability. Journal of Marriage and the Family. 52: 643-656.
Williams, C (1997). Becoming Parents: What has to Change? Pp. 119-139 in Partners Becoming Parents, edited by C. Clulow. London, England: Sheldon Press.
Wilcox, J (2002). Prenatal Expectations and Marital Satisfaction over the Transition to Parenthood. Journal of Family Psychology 21:155-164.
Williams, J.K.(1997). Religious Influence on Marital Stability. Journal for the Scientific Study of Religion. 36:382-392.

International Journal of Home Economics
260
Psychosocial risk factors Influencing the abuse of drugs among adolescents of abused parents from selected households in
Ibadan Metropolis, NigeriaDavid Oladeji
Obafemi Awolowo University, Ile-Ife, Nigeria
Abstract
This study examined the psychosocial risk factors influencing the use and abuse of drugs among adolescents of abused parents from selected households in Ibadan metropolis, Nigeria. The study adopted the descriptive survey, using 281 adolescents randomly selected from selected households in five local government areas of Ibadan Metropolis. The two instruments used were author-constructed questionnaires with 0.78 and 0.74 reliability coefficients respectively. The data obtained were analysed using chi-square (X2) analysis. Results obtained from this study showed that there are significant relationships between psychological risk factors (X2 = 121.5, df = 8, P <.05), social risk factors (X2 = 40.7, df = 6, P <.05) and the use and abuse of drugs among adolescents of abused parents. Based on these findings, it was recommended that: Mental health centres and social agencies are established exclusively for drug abusers, where they may offer short or long term therapy, or offer group sessions for counselling the drug abusers.
Keywords: Drug use and abuse, abused parents, adolescents psychological risk factors, and social risk factors.
Introduction
Drugs abuse is a social and health problem, not only because of it adverse effects on individuals, but also as a result of the negative consequences their use has for society as a whole. Everyone is a victim of drug abuse. Drugs contribute to problems within the family and the cost to crime rates, and the economic costs of drug abuse are enormous. Drug abuse also has serious consequences for health at both the individual and societal level (Mooney, Knox, & Schacht, 2005).
It is pertinent to first examine the working definitions of drug use and drug abuse as they relate to this study. In a social problems approach, a drug is any habit-forming substance that directly affects the brain and nervous system. It is a chemical that affect moods, perceptions, body functions, or consciousness and that has the potential for misuse because it may be harmful to the user. The definition would include food, insecticides, air pollutants, water pollutants, acids, vitamins, toxic chemicals, soap, and soft drinks (Zastrow, 1996) and (Johnson et al., 2003).
Another psychological theory, the theory of planned behaviour describes behaviour as being determined by intentions, attitudes, and normative beliefs (Ajzen & Fishbein, 2004).

Oladeji: Abuse of drugs among adolescents IJHE Vol 6 No 2 2013
261
Ethnographic research indicated that drinking is useful for manipulating social relationships in many places including the United States and is a social act that is part of virtually every social gathering (Myers & Stolberg, 2003). Moreover, according to this same ethnographic review article the ritual importance of drinking is shown by the fact that declining a drink is seen as disrespectful and unfriendly. Ethnography has documented problem drinking in communities suffering from deprivation, economic and social stagnation and scarce resources (Myers & Stolberg, 2003). This suggests that inner-city adolescents are an important group to study
Following the above working definitions of drug use and drug abuse, it has been observed that today’s adolescents expect fast results, and drugs are part of society’s response to that expectation (American Psychiatric Association, 1994; Nancy, 2004).
For instance, adolescents try drugs for many reasons, of course; the prevalence of drugs in society is just one of them. Adolescence itself is a time of experimentation, and many adolescents explore substances as well as roles and ideas. Part of the attraction of legal drugs such as cigarettes and alcohol is that they are used by adults; when adolescents use them, they feel more like adults (Nancy, 2004). Also, advertisements make their use look glamorous. Many adolescents experience peer pressure to use substances, and countless other adolescents use substances to boost low self-esteem, dull pain, feel more confident, or compensate for poor social skills (American Psychiatric Association, 1994; Nancy, 2004).
Millions of people in the United States (and elsewhere) find it impossible to get started in the morning without coffee or cigarette, or to relax in the evening without a drink. Millions moretake medication for pain, pills to sleep, laxatives to correct faulty diets, pills to suppress appetites, and vitamins supplements when they fail to eat enough. Adolescents see quick pick-me-ups and instant remedies modelled everywhere around them. It is little wonder that by their senior high school, 80% of late adolescents have tried alcohol, 71% have tried a cigarette, 42% have used marijuana, 7% have used some form of cocaine, and 16% have used some other illegal drug (Nancy, 2004).
Drug use must be conceptualized within the social context in which it occurs. Many youths who are at high risk for drug use have been “failed by society” – they are living in poverty; victims of abuse; dependents of addicted and neglectful parents; alienated from school (Fields, 2001; Siegel, 2002; Mooney, Knox, Schacht, 2005). Despite the social origins of drug use, many treatment alternatives, emanating from a clinical model of drug use, assume that the origin of the problem lies within the individual rather than in structure and culture of society.
Drug abuse in Nigeria before the fifties was largely limited to abuse and misuse of alcohol and tobacco and to a negligible degree isolated instances growing and smoking Indian Hemp. To the common people tobacco and alcohol are the only luxuries to which they have access. By the end of the fifties many young delinquents had began to smoke hemp (Okunola, 2002). Most adolescents in Nigeria are believed to have started smoking while in the secondary schools, and as well as, among adolescents with little or no education who are bus conductors or touts in Ibadan metropolis.

Oladeji: Abuse of drugs among adolescents IJHE Vol 6 No 2 2013
262
An ethnographic study of the need to smoke cigarettes found that a major reason that adolescents smoke is not because they crave or desire nicotine, but rather because of their perceived need to use cigarettes to manage social situations and maintain their social connections (Johnson et al., 2003). A criminology study found that variations in the behavioural and cognitive variables specified in the social learning process accounted for substantial portions of the variations in adolescent substance use and mediate substantial or in some cases nearly all the effects of gender, SES, age, family structure and community size on these forms of deviance (Lee, Akers, & Borg, 2004).
Johnston O’Malley, and Buchman (1989), Insel & Roth (2000), and Nancy (2004) observed that, over 50% of the adolescents who smoke half a pack or more a day said they tried to quit and had not been able to. Nearly 75% of those who smoke in high school on a daily basis were still doing so year later, although 5% thought they would continue when they began. These figures are not surprising, given the withdrawal symptoms adolescents experience when attempting to stop: irritability, nervousness, anxiousness, impatience, difficult concentrating, increased appetite, and weight gain.
The abuse of alcohol is associated with numerous complications. Alcohol is absorbed into all tissues of the body, affecting everything from the central nervous system, to internal organs to the skeletal muscles. Excessive use of alcohol can damage the liver, produce gastritis, affect kidney functioning, lead to sensory disturbances; it can cause blackout, memory loss, coma – and ultimately even death (Insel & Roth, 2000; Nancy, 2004).
The third drug to be considered in this study is Marijuana. Marijuana comes from the “Cannabis Sativa” plant, which contains the psychoactive substance. This substance produces a high characterized by feeling of relaxation and peacefulness, a sense of heightened awareness of one’s surroundings and of the increased significance of things. Marijuana can distort perception, affect memory, slow reaction time, and impair motor coordination, especially for unfamiliar or complex tasks. Because marijuana affects perception, the reaction action time, and coordination, it impairs one’s ability to drive. Yet adolescents under the influence of marijuana experience heightened confidence in their abilities and are likely to take greater risks while driving, despite their impaired functioning (Insel & Roth, 2000; Nancy, 2004).
In this study, three drugs were reviewed and considered very commonly used and abused among adolescents. It is therefore pertinent to show the relationship between psychosocial risk factors and the use and abuse of drugs among adolescents of abused parents. Out of the factors that place an adolescent at risk for drug abuse are psychological and social contexts.
One sociological study found that the relationship between older siblings' self reported tobacco and alcohol use remained significant with younger siblings' tobacco and alcohol use controlling for numerous shared family experiences (Fagan & Najman, 2005). While prior research that focused on the aetiology of specific drugs (cigarettes, alcohol or marijuana) in adolescence is informative, such work overlooks the more general process of drug initiation and progression among inner-city adolescents that could take combination of multiple substances and future use into account. Also research does not often focus on intentions to

Oladeji: Abuse of drugs among adolescents IJHE Vol 6 No 2 2013
263
use in the future, which is another important outcome according to theory of planned behaviour (Ajzen & Fishbein, 2004).
While prior research that focused on the aetiology of specific drugs (cigarettes, alcohol ormarijuana) in adolescence is informative, such work overlooks the more general process of drug initiation and progression among inner-city adolescents that could take combination of multiple substances and future use into account. Also research does not often focus on intentions to use in the future, which is another important outcome according to theory of planned behaviour (Ajzen & Fishbein, 2004).
Excessive drugs use, or, more precisely, drug abuse, is a different matter, adolescents who are frequent users of alcohol, tobacco, and other drugs score lower on measures of psychological adjustment as teenagers and more likely to have been maladjusted as children (Steinberg, 2002). Indeed, a team of researchers who had followed a sample of individuals from preschool into young adult report that, at age 7, the individuals who would later become frequent drug users as adolescents were described as “not getting along well with other children, not showing concern for moral issues, not painful or likely to think ahead, not trustworthy or dependable, and not self-reliant or confident”. As 11 year-olds, these individuals were described as deviant, emotionally labile, stubborn, and inattentive. In other words, drug and alcohol abuse during adolescence is often a symptom of prior psychological disturbance (Steinberg, 2002).
Brener and Collins (1998), Wu and Anthony (1999), Holmen, Barrett-Connor, Holmen, and Bjermer (2000), and Steinberg (2002) in their studies observed that, substance abuse during adolescence, whatever its antecedents, is associated with a host of other problems at school, experience psychological distress and depression, have physical health problems, engage in unprotected sexual activity, abuse alcohol as young adults, and become involved in dangerous or deviant activities, including crime, delinquency, and truancy.
The set of risk factors is social. Individuals with distant, hostile, or conflicted family relationships are more likely to develop substance-abuse problems than their peer who grow up in close, nurturing families. Drug-abusing youngsters on the other hand, are more likely than their peers to have parents who are excessively permissive, uninvolved, neglectful, or rejecting. They are more likely to come from homes in which one or more other family members (parents or siblings) use drugs or tolerant of drug use (Baumrind, 1991; Griesler, Kandel, and Davies, 1998; Dishion, Capaldi, and Yoerger, 1999; Kilpatrick et al., 2000; Farrel and White, 1998; and Steinberg, 2002).
In this study, however, the parents who are excessively permissive, uninvolved, neglectful, or rejecting are regarded as “abused parents” rather than “wife battering” which they are often involved, and more so, they are more likely to use and abuse drugs. Although, virtually all adolescents experiment alcohol, adolescents with an alcoholic parent move from experimentation to more frequent and heavier drinking and drug use more rapidly.
Nevertheless, individuals with drug abuse problems also are more likely to have friends who use and tolerate the use of drug, both because they are influenced by these friends and

Oladeji: Abuse of drugs among adolescents IJHE Vol 6 No 2 2013
264
because they are drawn to them. In the same vein, drug-using adolescents seek drug-using peers, and drug-using peers encourage even drug use among their friends (Hazard and Lee, 1999; Rose, Chassin, Presson, and Sherman, 1999; Steinberg, 2002). All other factors being equal, adolescents who have easy access to drugs, who believe that there are ample opportunities to use drugs, and who are exposed to messages that tolerate or even encourage drug use are more likely to use and abuse drugs.
This study therefore, examined psychosocial risk factors influencing the use and abuse of drugs among adolescents of abused parents from selected households in Ibadan metropolis, Nigeria.
Objectives of the Study
The main objective of this study was to examine relationship between psychosocial risk factors and the use and abuse of drugs among adolescents of abused parents from selected households in Ibadan metropolis, Nigeria.
Specific objectives are to:
Examine the relationship between psychological risk factors and the use and abuse of drugs among adolescents of abused parents.
Examine the relationship between social risk factors and the use and abuse of drugs among adolescents of abused parents.
Suggest strategies in regulating the use and abuse of drugs among adolescents in the society.
Methodology
Research Design
The descriptive survey design was used to examine psychosocial risk factors influencing the use and abuse of drugs among adolescents of abused parents’ from selected households in Ibadan metropolis, Nigeria.
Sample Size
The participants for the study were made up of 281 adolescents from selected households randomly drawn from five local government areas of Ibadan metropolis – Ibadan North, Ibadan North-East, Ibadan North-West, Ibadan South-West, and Ibadan South-East. Oyo State is made up of thirty-three local government areas of which, Ibadan metropolis is cosmopolitan in nature with different ethnic groups. A purposive sampling of 281 respondents (adolescents) of the study population was made. The adolescents’ ages range between 12 years and 17 years old, attending secondary schools, secondary school drop-outs, and those who engaged as bus conductors or touts from selected households in Ibadan metropolis. 121(43.1%) were those who currently in secondary schools, 100(35.5%) were the school drop-outs, and 60(21.4%)

Oladeji: Abuse of drugs among adolescents IJHE Vol 6 No 2 2013
265
were the bus conductors or touts. Eligibility was based on such criteria as adolescents’ parental background, their parents marital status, among others.
Instrumentation
The two instruments used in this study were – Psychological Risk Factors questionnaire (PRFQ), and Social Risk Factors Questionnaire (SRFQ). The two instruments were author-constructed. The psychological risk questionnaire was constructed by adapting psychological well-being inventory (PWI) with 42-items by Ryff (1989), Ryff and Keyes (1995), and Carr (1999). It measures psychological risk factors such as anger, depression, anxiety, impulsivity, academic difficulties, stress, and loss of memory. Thus 25 items were adapted out of original 42 items, and were measured on 3-point rating scale ranging from strongly agree (3) to disagree (1). The respondents were required to indicate their degree of agreement with each item by ticking one of the options for each item. The internal consistency estimate of PRFQ is .87, and revalidation reliability of .78 when administered 100 adolescents after three weeks of administration.
The second instrument – Social Risk Factors Questionnaire contained 20 items adopted 3-point rating scale ranging from strongly agree (3) to disagree (1). The questionnaire measured social risk factors such as truancy, deviance, sexual promiscuity, violence, delinquency, and academic difficulties. The questionnaire has a test-retest reliability of .78 at 2-week interval, and internal consistency of .74. All the two instruments were considered valid, through the favourable comments of Professors Bakare and Uwakwe in Test and Measurement Department on the suitability of the items.
Method of Data Collection
The questionnaires were administered on the adolescents, irrespective of their gender composition and their parental socio-economic status. The questionnaires were administered by the researcher and his research assistants employed. A total of 500 questionnaires were distributed out of which 281 were returned and well administered. This represents a return of 56.2% which is considered appropriate to analyse the results of the study.
Data Analysis
The data were analysed using Chi-Square (X2) statistics to establish the relationship between psychosocial risk factors and the use and abuse of drugs among adolescents of abused parents.
Table 1 shows the sample. The age bracket of (15-17 years) were mostly represented with 180 representing 67.0%. The male sex numbering 211 were mostly involved in the study representing 75.1% and among the ethnic group represented, the Yorubas numbering 101hard the highest representation with 36%, while the status of the participants revealed that, those attending school hard the highest representation with 171 representing 60.9%
The results in Table 1 indicated a significant relationship between psychological risk factors and the use and abuse of drugs among adolescents of abused parents. This is so because the X2 calculated value (121.5) is greater than X2 critical (2.73) at .05 level of significance. This

Oladeji: Abuse of drugs among adolescents IJHE Vol 6 No 2 2013
266
indicates that there is a significant relationship between psychological risk factors and the use and abuse of drugs among adolescents.
Table 1 Demographic Characteristics of the Sample involved in the study
Variables Frequency Percent (% )
Age
12- 14 101 36.0
15- 17 180 67-0
Total 281 100.0
Sex
Male 211 75.1
Female 70 24.9
Total 281 100.0
Ethnic group
Yoruba 101 36.0
Ibo 76 27.1
Hausa 64 22.8
Others 50 17.8
Total 281 100.0
Source: Field Survey 2010
Results
Table 2 shows the relationship between social risk factors and the use and abuse of drugs among adolescents of abused parents. The table reveals that X
2calculated value (40.7) is
greater than X2
critical value (1.64) at05 level of significance. The results indicate that there is a significant relationship between social risk factors and the use and abuse of drugs among adolescents of abused parents.
Table 2: Cross-Tabulation and Chi-Square analysis of psychological risk factors and the use and abuse of
drugs among adolescents of abused parents
Psychological Risk Factors
Respondents’ responses to the use and abuse of drugs
Total X2Cal. X2Critical Df P
Strongly Agree
Agree Disagree
Anger 17(6.0) 37(13.2) 33(11.7) 87(31.0)
Depression 17(6.0) 95(33.8) 9(3.2) 121(43.1)
Stress 4(1.4) 15(5.3) 16(5.7) 35(12.4) 121.5 2.73 8 <.05
Impulsivity 0(0.0) 29(10.3) 0(0.0) 29(10.3)
Loss of Memory 0(0.0) 9(3.2) 0(0.0) 9(3.2)
Total 38 185 58 281
X2 = 121.5, df = 8, P<.05

Oladeji: Abuse of drugs among adolescents IJHE Vol 6 No 2 2013
267
Table 3 Cross-Tabulation and Chi-Square Analysis of Social Risk Factors and the use and abuse of drugs
among adolescent of abused parents
Social Risk Factors Respondents’ Responses to the use and abuse of drugs
Total X2Cal X2
Critical
df P
Strongly Agree
Agree Disagree
Truancy/Violence 4(1.4) 54(19.2) 0(0.0) 58(20.6)
Deviance/delinquency 8(2.9) 77(27.4) 9(3.2) 94(33.5)
Sexual promiscuity 4(1.4) 116(41.3) 0(0.0) 120(42.7) 40.7 1.64 6 <.05
Academic difficulties 4(1.4) 5(1.8) 0(0.0) 9(3.2)
Total 20 252 9 281
X2 = 40.7, df = 6, P<.05
Discussion
The study examined the relationship between psychosocial risk factors and the use and abuse of drugs among adolescents of abused parents. The result obtained shows that there is no significant relationship between psychological risk factors and the use and abuse of drugs among adolescents of abused parents. The study therefore, showed the significant relationship between those psychological risk factors such as anger, depression, stress, impulsivity, and loss of memory and the use and abuse of drugs among adolescents in the study population.
The results are in support of the research findings of Brener and Collins (1998), Wu and Anthony (1999), Holmen, Barrett-Connor, Holmen, and Bjermer (2000), Farrel and Dintcheff (2000), Steinberg (2002), and Nancy (2004), found that individuals with certain personality characteristics, which typically are present before adolescence, are more likely to develop drug and alcohol problems than are their peers. These characteristics include anger, impulsivity, depression, stress, and loss of memory.
In the similar findings, Scheer and Unger (1998), Wills, Windle, and Cleary (1998), Dunn and Goldman (1998), and Steinberg (2002) found that, individuals who have more tolerant attitudes about drug use are at the greater risk for drug abuse, as are those who expect alcohol or other drugs to improve their social relationships. Even as children, for example, individuals who eventually become heavy drinkers as adolescents expect to have positive effects on them. They concluded that drug and alcohol abuse during adolescence, is often a symptom of prior psychological disturbances.
The results obtained from hypothesis 2 revealed that social risk factors are significantly positively related to the use and abuse of drugs among adolescents of abused parents. This finding corroborates the work of Dishion, Capaldi, and Yoerger (1999), Kilpatrick et al (2000), Farrel and Dintcheff (2000), Steinberg (2002), Nancy (2004), and Mooney, Knox, Schacht

Oladeji: Abuse of drugs among adolescents IJHE Vol 6 No 2 2013
268
(2005) found that, social risk factors such as truancy, deviance, sexual promiscuity, violence, delinquency, and academic difficulties are significantly related to the use and abuse of drugs among adolescents.
Furthermore, they observed that individuals with distant, hostile, or conflicted family relationships are more likely to develop drug-abuse problems than their peer who grow up in close, nurturing families. According to them, drug-abusing adolescents are more likely than their peers to have parents who are excessively permissive, uninvolved, neglectful, or rejecting. They are more likely to come from homes in which one or more other family members use drugs or tolerant of drug use. They concluded that adolescents who have easy access to drugs, who believe that there are ample opportunities to use drugs, and who are exposed to messages that tolerate or even encourage drug use are more likely to use and abuse drugs.
Implication of the Findings and Recommendations
A number of implications emerge from the results of this study. When psychosocial risk problems associated with the drug use and abuse among adolescents are difficult to control or prevent, counselling psychologists, family therapists, social workers, health professionals, schools, mass media, government, religious organizations, and non-governmental organizations (NGOs) should mount intervention strategies for curbing drug use and abuse among adolescents in the society Capaldi, and Yoerger (1999), Kilpatrick et al (2000), Farrel and Dintcheff (2000), Steinberg (2002), Nancy (2004), and Mooney, Knox, Schacht (2005).
The implication, however, is that there is a need for prevention of drug use and abuse among adolescents through government spending and media publicity to control or limit the availability of drugs, and finding ways of changing adolescents’ motivation to use drugs, and environment in which they live, since it has proven virtually impossible to remove drugs totally from society.
Recommendations
Following the findings of this study, the following recommendations were specifically made to curb or prevent the drug use and abuse among adolescents in the society.
1. There should be educational programmes showing “scare tactics” – showing pictures of fatal automobile crashes after drug use, suggesting that taking drugs would forever ruin the users’ lives. Although, this method may not be that effective because, the young see their parents, other adults, and peers using drugs without dire consequences. But in a more effective manner, the mass media and schools can launch major campaigns to prevent drunken driving, alcohol abuse, smoking, and illegal drug use. Dishion, Capaldi, and Yoerger (1999), Kilpatrick et al (2000), Farrel and Dintcheff (2000), Steinberg (2002), Nancy (2004), and Mooney, Knox, Schacht (2005).
2. Mental health centres and social agencies should be established exclusively for drug abusers. They may offer short-or long-term therapy, combine other chemical therapy, or offer group sessions for drug abusers . Brener and Collins (1998), Wu and Anthony (1999),

Oladeji: Abuse of drugs among adolescents IJHE Vol 6 No 2 2013
269
Holmen, Barrett-Connor, Holmen, and Bjermer (2000), Farrel and Dintcheff (2000), Steinberg (2002), and Nancy (2004).
3. Counselling psychologist, Social workers and those in the helping profession should help in a variety of traditional social work settings – juvenile courts, adult probation and parole, mental health clinics, hospitals, family counselling centres, schools, university health and counselling centres, and in private practice. (Baumrind, 1991; Griesler, Kandel, and Davies, 1998; Dishion, Capaldi, and Yoerger, 1999; Kilpatrick et al., 2000; Farrel and White, 1998; and Steinberg, 2002). In addition, many social workers are the administrators as well as the therapists, that can work with the psychiatrist, physician, psychologist, and often ex-addicts who may, or may not, have had professional training as counsellors to support the drug abusers when assistance is needed.
4. There should be government regulations limiting the use and distribution of legal and illegal drugs. Bjermer (2000), and Steinberg (2002). For instance, the government should impose sanctions on those who violate drug regulations. The sanctions should include the prohibitions about importing drugs, and law establishing 21-year-old drinking age.
Biography
David Oladeji is currently a lecturer in Obafemi Awolowo University, Ile-Ife, Nigeria and a trained counselling psychologist from University of Ibadan, Nigeria.
References
American Psychiatric Association (1994). Diagnostic and Statistical Manual of the American Psychiatric Association (DSM-IV). Washington, DC: Author.
Ajzen, I., & Fishbein, M. (2004). Questions raised by an action approach: Comment on Ogden (2003). Health Psychology, 23
Assistant Secretary for Planning and Evaluation (1999). Trends in the well-being of America’s children and youth 1998. Retrieved January 14, 2000, from http.//www.aspc.os.dhhs.gov/hsp/98trends/trend98.htm.
Baumrind, D. (1991). The Influence of parenting style on adolescent competence and substance use. Journal of Early Adolescence, 11, 56-95.
Brener, N and Collins, J. (1998). Co-occurrence of health-risk behaviours among adolescents in the United States. Journal of Adolescent Health, 22, 209-213.
Chen, C., O'Brien, M., & Anthony, J. C. (2005). Who becomes cannabis dependent soon after onset of use? Epidemiological evidence from the United States. Drug and Alcohol Dependence, 79,
Carr, D. (1999). Unfulfilled career aspirations and Psychological well-being. Research Reports. No. 99-432. Population Studies Centre. University of Michigan. PSC Publications. Retrieved from http:/www.pss.isa.umich.edu/pubs/

Oladeji: Abuse of drugs among adolescents IJHE Vol 6 No 2 2013
270
Dishion, T.J., Capaldi, D.M., and Yoerger, K. (1999). Middle Childhood antecedents to progressions in male adolescents substance use: An ecological analysis of risk and protection. Journal of Adolescent Research, 14(2), 175-205.
Fagan, A. A., & Najman, J. M. (2005). The relative contributions of parental and sibling substance use to adolescent tobacco, alcohol, and other drug use. Journal of Drug Issues, 35
Farrel, A.D., and White, K.S. (1998). Peer influences and drug use among urban adolescents: Family structure and parent-adolescent relationship as protective factors. Journal of consulting and Clinical Psychology, 43, 522-527.
Fields, R (2001). Drugs in Perspective. Boston, M.A: McGraw-Hill.
Griesler, P., Kandel, D., and Davies, M. (1998). Maternal smoking in Pregnancy, Child behaviour, and adolescent smoking. Journal of Research on Adolescence, 8, 159-185.
Graves, K. N., Fernandez, M. E., Shelton, T. L., Fra butt, J. M., & Williford, A. P. (2005). Risk and protective factors associated with alcohol, cigarette, and marijuana use during adolescence. Journal of Youth and Adolescence, 34
Hazard, B., and Lee, C. (1999). Understanding youth’s health-compromising behaviours in Germany: An application of the risk-behaviour framework. Youth and Society, 30,348-366.
Holmen., T, Barrett-Connor, E, Holmen, J, and Bjerner, L. (2000). Health problems in teenage daily smokers versus nonsmokers, Norway, 1995-1997. American Journal of Epidemiology, 151, 148-155.
Insel, P.M., and Roth, W.T. (2000). Core concepts in health (8th ed., 2000 update). Mountain view, CA: Mayfield.
Johnson, J. L., Bottorff, J. L., Moffat, B., Ratner, P. A., Shoveller, J. A., & Lovato, C. Y. (2003). Tobacco dependence: Adolescents' perspectives on the need to smoke. Social Science & Medicine, 56
Johnston, L.D., O’Malley, P.M., and Bachman, J.G. (1989). Drug use, drinking, and smoking: National survey results from High School, College, and young adult populations, 1975-1988 (DHHS Publication. No. ADM89-1638). Washington, DC: US Government Printing Office.
Kilpatrick, D.G., Acierno, R., Saunders, B., Resinick, H.S., Best, C.L., and Schnurr, P.P. (2000). Risk factors for adolescent substance abuse and dependence: Data from a national sample. Journal of Consulting and Clinical Psychology, 68, 19-30.
Lee, G., Akers, R. L., & Borg, M. J. (2004). Social learning and structural factors in adolescent substance use. Western Criminology Review, 5
Myers, P. L., & Stolberg, V. B. (2003). Ethnographic lessons on substance use and substance abusers. Journal of Ethnicity in Substance Abuse, 2
Mooney, L.A,. Knox, D., and Schacht, C. (2005). Understanding Social Problems (4th ed.). Belmont, CA: Thomson Wadsworth Publishing Company.

Oladeji: Abuse of drugs among adolescents IJHE Vol 6 No 2 2013
271
National Household Survey of Drug Abuse. (2003). THE NHSDA Report: From the Office of Applied Studies Division of Substance Abuse and Mental Health Services Administration (SAMHSHA).
Nichter, M., Nichter, M., Thompson, P. J., Shiffman, S., & Moscicki, B. (2002). Using qualitative research to inform survey development on nicotine dependence among adolescents. Drug and Alcohol Dependence, 68,
Nancy, J. Cobb. (2004). Adolescence: Continuity, Change, and Diversity (5th ed.). New York: McGraw-Hill.
Okunola, M.I. (2002). A Handbook for Nigerian Social Workers. Daybis Ltd., Ibadan.
Rose, J., Chassin, L., Presson, C., and Sherman, S. (1999). Peer Influences on adolescent cigarette smoking: A prospective sibling analysis. Merrill-Palmer Quarterly, 45, 62-84.
Ryff, C.D., and Keyes, C.L. (1995). The structure of psychological well-being revisited. Journal of Personality and Social Psychology, 57, 1069-1081.
Ryff, C.D. (1989). Happiness is everything, or is it? Exploration on the meaning psychological well-being. Journal of Personality and Social Psychology, 69(4), 719-727.
Siegel, Larry J. (2002). Juvenile Delinquency. Belmount, CA: Wadsworth.
Steinberg, L. (2002). Adolescence (6th ed.). New York: McGraw-Hill.
Wills, T., Windle, M., and Cleary, S. (1998). Temperament and novelty seeking in adolescent substance: Convergence of dimensions of temperament with constructs from Clonienger’s theory. Journal of Personality and Social Psychology, 74, 387-406.
Wu, L., and Anthony, J. (1999). Tobacco smoking and depressed mood in late childhood and early adolescence. American Journal of Public Health, 89, 1837-1840.
Zastrow, C. (1996). Introduction to social work and social welfare. (6th Edition). Pacific Grove, C A. Brooks/ Cole.

International Journal of Home Economics
272
The value of home economics to address the obesity challenge:An evaluation of comments in an online forum
Donna Pendergast, Susanne Garvis & Harold Kanasa
School of Education and Professional Studies, Griffith University, Australia
Abstract
Negative public perceptions of home economics have plagued the profession and created negative stereotypes for decades. Strategies such as a name change and shifting of curriculum components to other subjects in attempts to gain legitimacy have led to a general demise of the field as a unified profession. This paper reports on the text analysis of a self-selected group of members of the public who posted 130 comments to a website forum in response to the published article “Bring back home ec! Parents don’t have time to teach kids basic cooking and housekeeping, so schools must do it instead” (Bosch, 2012). The study provides a unique glimpse of the opinion of members of the public, of the value and contribution of home economics as a school subject, particularly with respect to its potential to address the obesity challenge through a greater awareness of food knowledge, theory and skill – collectively food literacy. Three themes emerged from the thematic analysis of the posts: The role of parents; the role of schools; and life skills. Findings from this investigation are important as they provide something of a litmus test about public perceptions of utilising home economics education as a mechanism to address a major public health challenge confronting humankind in the twenty-first century.
Introduction and literature
In 2010 an article titled Bring back home economics education was published in the Journal of the American Medical Association. The authors argued that the best solution to fighting the war against obesity is to “bring back home economics” in order to empower individuals with food knowledge and skills and that “providing a mandatory food preparation curriculum to students throughout the country may be among the best investments society could make” (Lichtenstein & Ludwig, 2010 p.1858). There is no doubt that child and adult obesity is a growing concern in affluent nations around the world with negative physical, psychological and social impacts (UNICEF, 2000; Zaninotto et al., 2006) as well as economic and cultural consequences (Wanless, 2002). The challenge of managing obesity is one that is at the core of public health concerns for humans in developed countries at this time. In the United States for example, obesity presently costs society almost $150 billion annually in increased health care expenditure (Finkelstein, Trogdon, Cohen, & Dietz, 2009). Lichtenstein and Ludwig’s message has served to stimulate renewed interest in the potential of home economics education to lead the way in a crusade of potentially massive significance to the health and wellbeing of the public.
It is interesting to note current calls for a reintroduction of home economics were not instigated by professionals from within the field, providing an opportunity for the profession

Pendergast et al: Home Economics & the obesity challenge IJHE Vol 6 No 2 2013
273
to sharpen its focus on providing for the needs of a new generation. The field emerged more than one hundred years ago at a time when public health related to sanitation and hygiene was of profound interest, with the importance of cleanliness and hygiene in domains such as food storage and preparation having significant public health benefits through the reduction of food contamination and subsequent illness and even death (Pendergast & McGregor, 2007). Out of this need, the profession of home economics emerged, and over more than one hundred years and in different contexts - dependent upon need - the field has adjusted to fulfil roles associated with optimizing the wellbeing of individuals and families in their near environment (International Federation for Home Economics [IFHE], 2008). In more recent decades, and closely linked to the increased affluence of modern society, the field has struggled to retain a positive identity, particularly as a curriculum area in schools, where it was fundamentally built to contribute to the education of individual’s wellbeing, as it has been challenged in terms of relevance in today’s world, and has been criticized for creating and reinforcing negative stereotypes of women, especially because of the perception that it accepts, without challenge, the confines of patriarchal ideology (Attar, 1990; Reiger, 1990).
In their comprehensive exploration of home economics and patriarchy, Pendergast and McGregor (2007, p.7) note “history confirms that (a) home economics was established within a society that was dominated by a patriarchal ideology and (b) the founders, predominantly women, were required to conform to its power distribution before they could establish a profession”. The acceptance of patriarchal ideology as the dominant philosophy underpinning society at the time of its development as a field has had, and will continue to have, profound effects although the field has struggled to shake off negative perceptions associated with its emergence at a time of patriarchal dominance. This effect is particularly powerful within the home economics profession because it is a field of study that brings together, in almost every sense, the least powerful of the binary pair, considered from the ideology of a patriarchal paradigm. Historically the field has been dominated by females (not males), has had a focus on the home, that is, the private sphere (not public), and is often unpaid (not paid) work (Pendergast, 2001). Hence, negative stereotypes of a disempowered curriculum area, catering for females have dominated public perceptions of the field of study, inevitably limiting its capacity to impact the wider community.
Home economics curriculum differs around the world, whether in a school, university or other educational location (Pendergast, 2012). Students undertake context specific content in a range of domains, yet, there is a shared theoretical and philosophical base and set of core practices that bind home economics curriculum globally. Recently, the IFHE Position Statement – Home Economics in the 21st Century (IFHE, 2008, p.1) captured this shared meaning by formulating the statement that as a curriculum area, home economics...
...facilitates students to discover and further develop their own resources and capabilities to be used in their personal life, by directing their professional decisions and actions or preparing them for life.
Hence, through the engagement in home economics curriculum, the individual is provided the learning opportunity to develop capabilities to enhance personal empowerment to act in daily contexts. Contexts may include, but are not limited to: Food, nutrition and health; textiles

Pendergast et al: Home Economics & the obesity challenge IJHE Vol 6 No 2 2013
274
and clothing; shelter and housing; consumerism and consumer science; household management; design and technology; food science and hospitality; human development and family studies; and, education and community services. In the Position Statement, it is argued that the capacity to draw from such disciplinary diversity is “a strength of the profession, allowing for the development of specific interpretations of the field, as relevant to the context” (IFHE, 2008, p.1).
In the context of the advocacy by Lichtenstein & Ludwig (2010) to mandate home economics education, the value of home economics education in fighting obesity is firmly constructed around the various elements of food literacy which are typically delivered in home economics curriculum. But is home economics the appropriate vehicle for delivery of this message given it has at best mixed status as a curriculum area in schools? A recent study by Pendergast, Garvis & Kanasa (2011) provided a unique insight into the responses of 97 contributors to an online forum responding to a newspaper article speculating about the inclusion of cooking in the Queensland, Australia, school curriculum. The analysis revealed that the wider community did not collectively understand the potential contribution of home economics to develop food literacy and it was recommended that further research be conducted to find positive ways to change perceptions of home economics in schools.
Another recent global investigation about the role of home economics in developing food literacy provides additional insights into the potential of home economics to play a significant role in addressing the food obesity challenge. In that study, Pendergast and Dewhurst (2012) collected data using an online survey with 1188 respondents from 36 different countries in the world sharing their views. Among key findings are the recognition of differences in understandings of food literacy and affirmation that “home economists globally are like-minded in their beliefs about the need for food literacy curriculum” (Pendergast & Dewhurst, 2012, p.13).
The publication in the Journal of the American Medical Association highlights another aspect of the “bring back home economics” plea as the title suggests the implied demise of the field and hence the need for it to be regenerated. Data from around the world confirms that home economics has suffered a demise in terms of the availability of curriculum for formal education in schools and in tertiary institutions, with a trend towards a dispersal of the content across related fields, such a food science, family studies, textiles design, technology and public health (IFHE, 2008). Linked to this demise is the global trend to change the name of the subject and the field to what have been considered to be more contemporary titles that can address negative stereotypes associated with the name ‘home economics’ (Pendergast & McGregor, 2007). Examples of name changes to family and consumer science; and human ecology, are both now widely utilized in the United States in preference to home economics. The use of a range of names for the field has led to fragmentation of curriculum and an apparent demise; hence the need to “bring back” home economics.
The public plea by Lichtenstein and Ludwig to “bring home economics back” heralds another element in what has been identified by Pendergast (2006) as a ‘convergent moment’ where a number of key factors have aligned to provide an opportunity to focus on the future of the field. Unexpected as it was, the 2010 publication points again to the need to privilege

Pendergast et al: Home Economics & the obesity challenge IJHE Vol 6 No 2 2013
275
education which focuses on wellbeing and which develops not only knowledge, but the ability to apply this knowledge in theoretical and practical ways.
Since the publication of the original article in the Journal of the American Medical Association, there has been considerable interest in the ideas shared in the paper, especially in the form of viral spin-offs utilising social media technologies. A Google search reveals dozens of articles, online debates, website blog posts, along with a Facebook campaign to bring home economics back to schools, and other opinion and commentary sites, all referring to the Lichtenstein and Ludwig (2010) article as the basis for these conversations and posts. One article appeared in the Slate magazine, which is published by The Washington Post. Slate magazine is a daily online paper described as offering “fresh angles on stories in the news and innovative entertainment coverage, all with its signature wit and irreverence. Pushing the boundaries of convention, Slate publishes provocative commentary on topics such as politics, culture, business and technology. Slate reaches 6.7 million online adults a month according to Nielsen” (The Washington Post, 2013). The Slate Magazine article is titled Bring back home ec! Parents don’t have time to teach kids basic cooking and housekeeping, so schools must do it instead, was written by Torie Bosch and posted on 5 June 2012. This article canvasses the potential of home economics in today’s society and posits the view that it is more valuable than ever, using as a basis the original publication by Lichtenstein and Ludwig (2010). Bosch presents a case that home economics never really disappeared from schools – it still exists but is often named differently and that home economics knowledge often seems to be “like common sense” because the core messages have effectively permeated society (Bosch, 2012).
It is this article that inspired the authors to investigate the accompanying discussion forum that was generated in response to the article. The self-selected, anonymous respondents provide a snapshot of comments in response to the article. Our analysis reveals that their comments could be grouped into three main themes: the role of parents; the role of schools; and life skills.
The Study
This study provided a unique opportunity to gauge the opinion of self selected members of the public regarding their ideas about the value and contribution of home economics as a school subject, particularly with respect to its potential to address the obesity challenge through a greater awareness of food knowledge, theory and skills. Soliciting the opinion of the public is valuable because the field has been impacted by negative perceptions over recent decades. The call to “bring back home economics” by authors in the prestigious medical journal points to a legitimising of the field by those beyond the usual advocates within the profession and may serve as a turning point through the contesting of negative public perceptions. This study will provide some insight into the responses to the ideas posed by the follow up article in Slate magazine.
Pendergast et al: Home Economics & the obesity challenge IJHE Vol 6 No 2 2013
276
Method
Data and data analysis
Comments were collected from the online article entitled Bring Back Home Ec: Parents don’t have time to teach kids basic cooking and housekeeping, so schools must do it instead in the online Slate Magazine (5 June, 2012). Many articles on the Slate website allow readers to post their comments in response to articles, and to comments from others. This particular forum recorded 264 posts from anonymous readers. Respondents were a self-selecting, convenience sample. As the posts were anonymous within the discussion forum beyond a selected username, identity of individuals within posts is unknown. Since the group were self-selecting (they had enough interest in the topic to respond), it is difficult to generalize beyond the sample presented and this is a limitation of the study.
On average, most participants wrote three to four sentences. All posts were downloaded and screened for use in this study. Comments were scrubbed to remove any extraneous text. Exploratory analysis of the comments revealed unacceptable concept map instability meaning a stable concept map could not be formed after repeated iterations of Leximancer recoding the concepts into themes. To resolve this issue the comments were coded by hand and subsequently 51% (n=134) of the comments were coded as irrelevant. Examples of removed comments included those that simply agreed or disagreed with previous comments, those inviting forum participants to events etc. These comments were removed and the analysis was completed with the 130 comments of relevance to the forum topic. The resultant stable map was achieved after two rounds of reclustering.
An adapted version of Cavana, Delahaye and Sekaran’s (2003) 15 stages of content analysis (based within the constant comparative method) was used as a guide to identify key themes and meanings in the data. This process allowed newly identified themes to be compared with previously identified themes to ensure that the new theme added more understanding about the phenomenon under investigation. Themes were located with frequency counts, with some themes entering two categories. Coding for manifest content (Wallen & Fraenkel, 2001) was used, which means that what was directly written in the online blog, as opposed to latent content which is implied, was used for the content analysis. The computer program Leximancer was used to assist the researchers build strength of association and visual maps after the themes were generated. The number of themes was set to five with Table 1 showing the resultant themes, their related concepts at the connectivity of the concepts within the themes.
Connectivity is a measure of how related the concepts within a theme are to other concepts in the map relative to the highest ranked theme. The themes of ‘learn’ and ‘day’ and their related concepts were disregarding as significant themes as their connectivities were 11% and 5% respectively. Figure 1, the resultant concept map also reflects this decision to remove those themes from further discussion. Leximancer automatically assigns the theme name as the most numerous concept. A closer examination of the individual concepts as they appear within the context of the quotes revealed the initial themes of ‘kids’, ‘home’ and ‘cook’ were better labelled as ‘role of the parents, ‘role of the school’ and ‘life skills’ respectively.

Pendergast et al: Home Economics & the obesity challenge IJHE Vol 6 No 2 2013
277
Table 1: Leximancer identified themes, their related concepts and connectivities
Theme Connectivity (%) Related concepts
Role of the parents 100 kids, skills, teach, time, parents, basic, people, life, things, taught, etc., doing, skill, schools, household
Role of the school 71 home, cooking, learned, class, school, take, sewing, work, shop, stuff, family, classes, students, grade
life skills 22 cook, food, laundry, course, meal, money, clothes
learn 11 learn, teaching, children, sense
day 5 day, making
Figure 1 shows the resultant concept map. Circles group related concepts into themes with the three themes with the highest connectivity being shown. Bayesian analysis is used to determine the relatedness of themes, therefore more related concepts are closer spatially in the concept map. For example, within the theme of ‘responsibility of parents’, the concepts of ‘life’ and ‘skills’ have been calculated to be highly related terms as shown by their closeness. The third layer of information within the concept map are connecting lines between concepts which indicate a statistically significant relationship between two or more concepts. For example, the concepts of ‘kids’, ‘parents’, ‘skills’ and ‘life’ are highly likely to be related in a significant manner as indicated by their grouping within the theme of ‘role of the parents’ and their connection with a line.
Findings
Each of the most significant themes (role of parents, role of the school and life skills) will now be discussed in the order of the prominence assigned by Leximancer and is shown heat mapped (i.e., red for the most prominent theme to yellow and green) in the concept map. Prominence is partly determined by how often the concepts in a theme are mentioned in the text and indicates the importance of those concepts and therefore the theme to the participants.
The role of the parents
As the most prominent identified theme (connectivity of 100%), the majority of comments focussed on the importance of the role parents and the home play in imparting important knowledge and skills, including those related to food and cooking skills, to their children. This is signified in the concept map by the close relationship of parents, taught, teach, kids, basic, life and skills. Many comments described how forum members had learnt important skills in their childhood or described how they are teaching their own children these skills, for example:
[B]y the time they were 10 years old, both of my kids (one of each) could scrub a bathroom, change their sheets, load and unload the dishwasher, and

Pendergast et al: Home Economics & the obesity challenge IJHE Vol 6 No 2 2013
278
do a load of laundry without breaking the washer or lighting the dryer on fire. (Comment 116)
Figure 12: The concept map
Other comments were related to how respondents had learnt important skills once they left home. The key theme in these comments was the importance of learning the necessary skills in the home context which would not necessarily be achieved in a classroom. In the main, the comments in this category advocated for ‘family’ to be the place where knowledge and skills that might be regarded as components of a home economics curriculum, would best be delivered.
Other comments in this theme generally tended to be critical of parents and their abrogation of responsibility to schools on this matter, hence still advocating for the family to provide the knowledge and skill development, for example:

Pendergast et al: Home Economics & the obesity challenge IJHE Vol 6 No 2 2013
279
[E]xcuse me, but exactly where are the parent's responsibilities to teach their children. A significant part of the difficulties in public education today is that parents drop their kids off at the school house door and think that is the end of their involvement in the process (not all parents, but a surprisingly large number). (Comment 111)
and
[S]chools exist to create informed citizens, not to teach your kids how to care for themselves and not be pigs. (Comment 72)
and
... I disagree with this idea that parents don't have time to teach their kids these simple life skills. We are all busy, but anyone who says they are too busy to give their kids these valuable lessons needs to just admit that it's not that they can't it's that they don't want to.(Comment 10)
But not all contributors to the forum within this theme advocated for family as being the sole source for developing knowledge and capabilities associated with food literacy and other related aspects of individuals wellbeing. For some, this was based on the lack of capacity in the family, for example:
[Y]eah, but not everybody has parents they can call to help them.(Comment 70)
and
I guess your answer is that in cases where the parents are low-skill, their kids can just follow in their footsteps? That's compassion. (Comment 80)
One forum participant presented alternate arguments to the view by other forum members that cooking (and nutrition) is common sense, noting that some parents lack the necessary expert skills; and further highlighting the potential benefits to society of appropriate education, such as that delivered in home economics classrooms. Their lengthy forum post follows:
[I]t's not common sense. People do not just understand calories, nutrition, and personal/household finances, *especially* when they are young. And learning about nutrition *before* you screw up and get fat is the best way to avoid a lifetime of struggling with your weight. Earlier is so much better. There are entire industries built up around balancing check books and people who make their living telling other people to save 20%. Why is that? It's because these things are not just absorbed. And unfortunately, the people with the means, resources, and awareness to educate themselves in these areas are the same people whose parents were able to equip them at a

Pendergast et al: Home Economics & the obesity challenge IJHE Vol 6 No 2 2013
280
younger age. You can't forget about all the kids who never made it past high school or the 9th grade- ...
Even if you imagine that all parents have the time to teach their kids, you can't ignore the fact that many parents don't have these skills themselves. If they never learned how to work a stove, how will they teach their children? And if their own finances are a mess, how do they teach their kids about household budgeting? ... It's kids whose parents are frankly not equipped to help them.
So why should we do this? Because we all pay the costs. When people don't know how to budget and spend within their means, we end up with bubbles and credit crises and toxic mortgages and a lot of good people who lose a lot of money because other people made bad decisions. Maybe if we can teach them to balance a check book and assess true affordability, we can reduce the chances of ever being in this mess again. 5% reduction you say? 3%? I'll take it! And when they don't know how to feed themselves, they get fat and cost the healthcare system money. They buy bad foods and prop up a food economy based on waste products and processed goods. They ensure that your grocery store is flooded with sugar and salt and pre-made things that provide no nutritional value, and they spend 30 cents on a 2-liter of soda every week instead of drinking tap water for free, then complain that a healthy diet is more expensive. .... Maybe if we educate people, we'll have a sounder economy, a more versatile workforce, lower healthcare costs, fewer unplanned pregnancies, fewer predatory companies, and more qualified elected officials. We should at least try. (Comment 7)
The content in this posting was repeated by many other forum contributors, though generally not as comprehensively as in this posting, and reflects a greater understanding of the potential value and contribution of home economics education. The large scale consequences of a deficit of what home economics education can provide in terms of individual and collective empowerment is captured in the examples provided, such as healthcare costs, consumer knowledge and so on.
The second theme with 71% connectivity to the most prominent theme (the role of parents) focussed on the role of schools to provide an education for all students in matters related to households and families. This high degree of connectivity reflects the similarity in the nature of comments in that those forum participants who made comments about the role of parents were also likely to make comments about the role of schools. A focus on the role of schools now follows.
The role of schools
While most forum contributors placed the onus on parents to educate their children on matters of household management, like in the previous theme, others argued that not all parents were equipped to pass on those skills – the notion of capital being used to describe

Pendergast et al: Home Economics & the obesity challenge IJHE Vol 6 No 2 2013
281
the capabilities – and that was a role that could and should be fulfilled by schools as a social good, for instance:
The decline of the “domestic sciences” also impacts the very real problem of entrenched poverty. After a few generations of children having children (be that in an urban or rural setting) the family domestic skill capital has diminished considerably. This impacts what food is consumed and how efficiently the money is spent. (Comment 83)
Some forum contributors pointed to the inability of parents to pass on important skills with the consequence being the responsibility fell to schools instead. The reasons for this failure were varied, and included: Lack of skills, lack of time, and lack of interest, as noted in the comment followings:
Parents don’t have time to teach kids basic cooking and housekeeping, so schools must do it instead. (Comment 94)
and
I am 54 and most certainly did not learn the operation of a home from my mother, who was raised with a full-time cook and housekeeper. While we had a full-time housekeeper when I was a child, we did not have a cook. My mother's cooking was simply awful.
In 7th grade, I was to take metal shop, while the girls took home economics. I rebelled - the trait started young – and I took home economics. I was going to be the only boy in the class until I explained to Mike Young, the captain of the our baseball team one ate the food one cooked in class, so he and several other players also signed up. To this day, that was one of the best classes I ever took. (Comment 41)
Anywhere there is a system of public education, it's in place to train citizens. It's not there out of some ‘higher calling’ to impart centuries of priceless knowledge. (Comment 76)
Comment 41 introduces the commonly experienced gendered divide of the curriculum with girls typically being required to study home economics while boys undertook study in one of the manual arts disciplines. Comments within this theme also retold both negative and positive experiences (as signified by the relationship between the concepts of school, take, shop and classes) with home economics and these tended to sway their views on whether home economics should be returned, as in the following comment.
I remember my home-economics class in junior high. I remember the tuna noodle casserole (yuck!!), fried chicken (something I don't eat as an adult), and worst of all that monstrosity that involved adding browned hamburger, onions, cooked carrots and green beans, and slices of hotdogs to Western

Pendergast et al: Home Economics & the obesity challenge IJHE Vol 6 No 2 2013
282
family mac and cheese (cooked with margarine of course!!!) adding government cheese and breadcrumbs and cooking it as a casserole. Also I knew more about sewing than the teacher. (Comment 130)
Life skills
The third main theme generated from the data is encapsulated by the notion of life skills. With a 22% connectivity to the main theme (the role of parents), forum contributors commented on the breadth of the home economics curriculum in developing a range of skills and capabilities, including financial management, consumer rights and responsibilities, food purchasing, storage and preparation (food literacy) and much more. The concept of money is strongly related to cook and clothes for slightly different reasons. In relation to cook, this word was often used by forum contributors around the idea of being able to manage a food budget and budgeting in general, for example:
...most people starting out need to know how to control their food budget. Budgeting was one of the primary aims of early home economics. Then it became about making a fancy meal and sewing an apron. Imagine acourse that talks about proper shopping for a budget, preparing meals within a budget, and controlling food waste. (Comment 108)
Other life skills to be included would be a comprehensive review of personal finance, including costs of debt and credit, banking fees, etc. (Comment 82)
Home economics as I took it in the late 80's wasn't particularly useful, but things like household budgeting, healthy cooking, etc. would be very helpful to just about everyone (even if you learned it at home, it couldn't hurt to brush up). I actually learned far more useful things from a culinary standpoint in Boy Scouts...how to cook, sure, but also how to make a menu, then a food list, then shop, prep, package, and prepare the food. To this day I make a mean beef stew...and it's a lot easier to do on a stove than it was kneeling in the rain over a campfire! (Comment 125)
In relation to clothes it tended to be around the idea that learning basic sewing skills saved money, while others argued that sewing in today’s society was irrelevant given how cheap (another money concept) clothing is to purchase, as exemplified in the following comment:
[F]ocusing on cooking, basic household budgeting, and basic home repairs ("how to fix a toilet," "how to unclog a drain," "how to set up a secure wireless network," "how to change the oil in a lawn mower," etc., etc.), and you've got a very useful class. Get rid of the sewing, though - waste of time. (Comment 44)
Discussion and Conclusion
This evaluation of an online discussion forum has provided a snapshot of views from members of the public regarding their ideas about the value and contribution of home economics

Pendergast et al: Home Economics & the obesity challenge IJHE Vol 6 No 2 2013
283
education as a school subject, particularly with respect to its potential to address the obesity challenge through a greater awareness of food knowledge, theory and skills. The evaluation of forum comments - which were stimulated by an opinion piece exploring the idea of reintroducing home economics into the curriculum as a key strategy to address child and adult obesity in affluent countries - revealed three main themes with a relatively high degree of connectivity between the two leading themes: the role of family and the role of schools. The third theme, life skills, recorded a lower degree of connectivity at 22%. It was typical for forum contributors to include comments about both the role of family and the role of school, with a high degree of connectivity (71%) observed in the data.
The evaluation further revealed a lack of consistency in respondents experiences of, and knowledge about, home economics education. This aligns with the previous study conducted by Pendergast, Garvis and Kanasa (2011) that revealed the community did not understand the potential contribution of home economics to the development of food literacy capabilities. It also revealed entrenched views of home economics as a traditional subject, often connected to gendered roles for girls and women and reinforcing the patriarchal views of the subject that have hampered its acceptance as a field for decades. Also debated in the forum with divergent views evident, was the taken-for-granted nature of home economics knowledge on the one hand, and on the other hand, arguments challenging this view.
In sum, there was not a decisive picture emerging from the data reflecting views from the wider public regarding the advocacy of the author to ‘bring back home ec’ (sic) (Bosch, 2012). Nevertheless, soliciting the opinion of the public is valuable because the field has been impacted by negative perceptions over recent decades. The call to “bring back home economics” by Lichtenstein & Ludwig (2010) in the prestigious medical journal may serve as a turning point by placing the question back on the agenda and by providing an opportunity to contest negative public perceptions. However, what is revealed is that there remains a large degree of uncertainty about the value and potential contribution of home economics to this public health agenda. This provides an opportunity for home economics professionals to shape the field and to position the profession appropriately for today’s context. Aligned with findings from Pendergast, Garvis and Kanasa (2011), this study also recommends that further research be conducted to find positive ways to change perceptions of home economics in schools. By way of conclusion, it is evident that some forum contributors held very high regard for the profession of home economics, as expressed in the following comment:
[T]raditional home economics subjects could be part of a whole curriculum of life classes. Basically, how to function in society. number one being how to manage not to get fat. (Comment 60)
Biography
Professor Donna Pendergast currently holds the position of Dean, School of Education and Professional Studies, Griffith University.
Dr Susanne Garvis is a Senior Lecturer in Early Childhood Education at Monash University.

Pendergast et al: Home Economics & the obesity challenge IJHE Vol 6 No 2 2013
284
Harry Kanasa is a lecturer in Science and Mathematics Education at Griffith University. He is currently completing his PhD on scientific literacy. His current research interests are thinking skills and students' understanding of the nature of science.
References
Attar, D. (1990). Wasting girls’ time: The history and politics of home economics. London: Virago Press Ltd.
Finkelstein, E., Trogdon, J., Cohen, J., & Dietz, W. (2009). Annual medical spending attributable to obesity: Payer- and service-specific estimates. Health Affairs (Millwood), 28(5), w822–w831.
International Federation for Home Economics. (2008). IFHE Position Statement – Home economics in the 21st Century. Bonn, Germany: Author.
Lichtenstein, A. & Ludwig, D. (2010). Bring back home economics education. Journal of the American Medical Association, 303(18), 1857-1858. Retrieved July 25, 2011 from http://jama.ama-assn.org/content/303/18/1857.full
Pendergast, D. (2001) Virginal Mothers, Groovy Chicks and Blokey Blokes: Re-thinking Home Economics (and) Teaching Bodies. Brisbane: Australian Academic Press. Available from http://www.kon.org/news.html.
Pendergast, D. (2006). Sustaining the home economics profession in new times – A convergent moment. In: Rauma, A., Pollanen, S. & Seitamaa-Hakkarainen, P. (Eds). Human Perspectives on Sustainable Future. Joensuu, Finland: University of Joensuu, 3-32.
Pendergast, D., (2012). The intention of Home Economics education: A powerful enabler for future-proofing the profession. In: D. Pendergast, D., S. McGregor & K. Turkki Creating Home Economics Futures: The next 100 years. Brisbane, QLD: Australian Academic Press, 12-23.
Pendergast, D. & Dewhurst, Y. (2012). Home economics and food literacy – An international investigation. Global creativity and innovation: Developing capacities for sustainable futures. The International Federation for Home Economics World Congress, 16-21 July, 2012, Melbourne Australia.
Pendergast, D., Garvis, S., & Kanasa, H. (2011). Public responses to the inclusion of food preparation skills in the Queensland curriculum: The role of formal and informal learning about food literacy. Family and Consumer Sciences Research Journal, 39(4), 415-430.
Pendergast, D. & McGregor, S. (2007). Positioning the Profession Beyond Patriarchy.Michigan: Kappa Omicron Nu. ISBN 10 1 929083 11 4
Reiger, K. (1990). Feminism and the future: Past lessons and present possibilities.Unpublished address to the Queensland Association of Home Economics Teachers, 5th May, Brisbane.
The Washington Post, (2012) News In Print and Online, Accessed 27 January 2013, http://www.washpostco.com/phoenix.zhtml?c=62487&p=irol-businessnewspapers

Pendergast et al: Home Economics & the obesity challenge IJHE Vol 6 No 2 2013
285
UNICEF (2000). Focusing Resources on Effective School Health (FRESH). Retrieved August 1, 2011 from http://www.unicef.org/lifeskills/files/FreshDocument.pdf
Wanless, D. (2002). Securing our future health: taking a long-term view. London, UK: HM Treasury.
Zaninotto, P., Wardle, H., Stamatakis, E., Mindell, J. & Head, J. (2006). Forecasting obesity to 2010. London, UK: Department of Health. Retrieved July 25, 2011 from http://www.dh.gov.uk/prod_consum_dh/groups/dh_digitalassets/documents/digitalasset/dh_073033.pdf

International Journal of Home Economics
286
Developing a new concept of reversible textile furnishing
Sabrina Ramsamy-Iranah & Nirvana Budhai
University of Mauritius, Reduit, Mauritius
Abstract
Textile Furnishing is one of the most vital components of any interior environment. Reversible Textile Furnishing is a product that has no true inside out since either side can be used to give a different appearance or an alternative decorative surface. The current study was carried out to discover the existing reversible textile products and aims at exploring the different ways of reversing a textile furnishing product. Hence, creative and innovative samples have been proposed and realized reflecting the project theme ‘Amalgamation –The Two in One’. In this context, reversible techniques have been introduced to provide several possible looks within one item with a finished appearance. The expected outcome from this current study is to bring an innovative concept through Reversible Textile Furnishing that could be sold on the local market.
Keywords: Reversible Techniques, Innovative, Textile Products, Amalgamation
Introduction
Textile Furnishing is one of the most vital components of any interior environment. They are not only meant for decoration but they also give every corner of a habitation its own individuality. A house furnished with exactly the right home furnishing fabrics at the right place truly gives a blissful experience. In reality, textile Furnishing gives a stylish, traditional as well as contemporary look to any decor. Textile home furnishing comprises of products right from bed linen, bathroom furnishing, kitchen linen, table linen, curtains to carpets. To furnish a home, every type of fabric can be used that is available in vast range of colours, designs, patterns and styles. They have to be strong enough or light, resistant to some materials such as water or fire, and should have many other properties according to the purpose they are intended to be used. Fabric is such a material that is used by most of the interior decorators to cure any flaw in the interior design. Reversible textile furnishing is a product that has no true inside out since either side can be used to give a different appearance or an alternative decorative surface. In this context, reversible techniques have been introduced to provide several possible looks within one item with a finished appearance so that when used there is no unsightly seam appearing on either side of the product. This study aims at researching in the different ways of reversible textile furnishing and fabrics through a literature review and market survey. A variety of creative and innovative samples and designs have been proposed and realized using cut and sew technique reflecting a theme. The idea behind this study was to offer different look to the interior decoration while using the same textile furnishing product. The outcome looks forward to be beneficial for people who need a change in interior decor. In fact, selling a piece of textile that can provide one or two additional styles for the price of one can be a good marketing strategy, as it is more durable and economic. The expected outcome from this current study was to bring an

Ramsamy-Iranah & Budhai: Reversible textile furnishing IJHE Vol 6 No 2 2013
287
innovative concept through reversible textile furnishing that could be sold on the Mauritian market. Despite the various fashionable items being available in the shops, some innovations are still missing regarding the possibility reversing a textile furnishing product.
Literature Review
The English word reverse, (adjective. reversible) devolves directly from the Latin reversus, past participle of revertere "turn around" (World Book,1994). In the context of fashion, reversible means the capability of being reversed or used with either side out that is a garment that can be worn inside out, with either side of the cloth showing (AudioEnglish, 2010).
The Literature Review consists of research into double faced fabrics, reversible techniques for neatening raw edges, reversible garments, revers, reversible curtains, quilt and table cloth.
Double Faced Fabrics
A Double Faced Fabric is any fabric with two attractive, useable sides. They can be exactly the same on either side, contrasting colours or contrasting textures as shown in Figure 2.1. They are therefore the perfect choice for reversible garments or mix and match coordinates (Neall, 2010). One most popular double faced fabric is Damask Fabric.
Figure 1 Double Faced Fabrics (Busan Textiles, n.d)
Damask Fabric
Damask is a reversible fabric that was created in Damascus, Syria. However, Chinese emperors were wearing damask fabric as early as the fifth century. This beautiful patterned fabric has been created all over the civilized world for nearly two thousand years. Damask rose to prominence in the 12th century for their unmatched beauty and flawless production. Traders coined the term "damask" for any ornamental patterned silk or satin fabric in reference to Damascus (Mireles, 2010).
Early Damask Clothing
During the 1700s damask silk was popularly used for ladies and menswear. From the earliest of times damask fabric was woven with lovely bright colours using metallic or gold threads to add to the beauty of the fabric. Damask as shown in (Figure 2 and 3) has been utilized in combination with jacquard and brocade from the earliest history for clothing but only by the wealthy who could afford these fabrics (Mireles Sandra, 2010).

Ramsamy-Iranah & Budhai: Reversible textile furnishing IJHE Vol 6 No 2 2013
288
Figure 21700’s Rococo Gown / Marie Antoinette (Vintage Costumers,2005)
Figure 3 1700’s Damask Design (Battista, 2009)
Damask Robes for Judges and Clergy
During the 15th century judges and priests wore elaborate robes made of damask fabric. Judges always wore black silk state robes over their clothing. These robes were ornate and flowing to the ground. During this same time period, pure white layered damask silk was used by the priests for robes used for the liturgy (Mireles Sandra, 2010). Figure 4 shows the damask clergy robe of the pope Benedict. Figure 4 Pope Damask Robe (The
Pope Benedict Forum, 2011)
Modern Damask Clothing
Damask silk has adorned wedding dresses, day dresses and robes during the 19th and 20th centuries. Styles come and go, but as recently as 2007 damask was being used for dresses and skirts. Wallis introduced a cream-colored jacquard damask skirt with a bow at the waist as part of their fall 2007 line (Figure 5).Damask continues to be a favourite fabric which can be extremely expensive at the high end (Mireles, 2010). Figure 5 Modern Damask,(Weston
Thomas, 2007
Contemporary Uses for Damask Fabric
The most commonly known contemporary use for damask is for tablecloths and napkins. Pure white damask tablecloths add a touch of elegance to any occasion. Damask is also used for draperies, bedding, curtains, cushions and even upholstery. The warp and weft of the fabric reveals the pattern design when light falls on it. The beauty and versatility of damask fabric assures that it will continue to be a part of history now and in the future (Mireles, 2010).

Ramsamy-Iranah & Budhai: Reversible textile furnishing IJHE Vol 6 No 2 2013
289
Oversewing Stitch of Double Cloth
Double cloth is two distinctly different fabrics joined together by very fine binder threads. It can be different colours, different patterns or different weights on either side of the fabric and is usually made from wool or wool blends, with a few exceptions. It is therefore doubly warm and an excellent choice for outerwear (Neall, 2010).
The oversewing stitch in double cloth is used to neaten and secure raw edges. It also keeps unfinished fabrics from fraying. The needle works on a diagonal stitch that comes up throughthe bottom of the fabric and over the side of the fabric (Figure 6).
Bias Binding
Bias tape and ribbon are used to bind and enclose straight or curved fabric edges. When used as a trim, they also provide a decorative colour accent to clothing and crafts (RBR Inc,2009). This is the easiest and cleanest way to achieve a clean edge on both the inside and outside of the garment (Figure 7).It is ideal for items that have visible seams.
Figure 6 Oversewing Stitch,(Olivia, n.d.) Figure 7 Bias Binding used in Reversible Quilt,(Aesbicher,2009)
Reversible Garments
A reversible garment is a garment that can be worn two ways. There is no true "inside out" to a reversible garment, since either way, it gives a fashionable appearance (Wikepedia,2009). Garments that are commonly made reversible are jackets with rever collars, sweaters, waistcoat and skirts (Figure 2.7a, b, c ). Reversible garments have some specific features like buttons on both sides, use of thicker fabrics, different types of stitching, and no tags.
Figure 8 Reversible Jacket of Cotton,(Bird R, 1994)
Figure 9 Woven Cardigan with Reversible Lapel,(Aryn, 2010)
Figure10 Reversible Shawl Collar (Mc Call’s,2011)

Ramsamy-Iranah & Budhai: Reversible textile furnishing IJHE Vol 6 No 2 2013
290
Reversible Textile Furnishing
A reversible textile furnishing product can be inverted in either way to expose decorative surface of the fabric, thus providing alternatives in changing the bedroom decor with the single product.
Reversible Quilts
Most common Reversible Textile Furnishing is Quilts. Quilted fabrics are layered materials consisting of two cloths that encase a filling and are stitched together to form a puffy unit. The outer layers of quilted fabrics used for apparel are generally of cotton, polyester, nylon, or blends of such fibres (Corbman,1983).
Reversible Tablecloth
There are lots of things that can be done to a kitchen to add ambiance, elegance or just a touch of colour. One thing that can really draw someone’s attention, though, is the type of tablecloth. An elegant lace tablecloth can set the mood for holidays or special occasions (Salkill, 2008). A reversible tablecloth enables to easily flip the first one and present the second, side of the tablecloth, at a moment's notice.
And the great thing is that the tablecloths can be as different as night and day. One side can be elegant and the other side, ordinary (Salkill, 2008).
Reversible Furnishing Products on International and Local Market
Some investigations were made on the internet to look for shops selling Reversible Textile Furnishing products. And it was found that there were many online catalogues available for purchasing Reversible Textile Furnishing. Mostly bedroom sets such as cushions covers, pillowcases and bed sheets were available (Figure 11 , 12).
Figure 11 Reversible Cushion Cover (Textiles Direct, 2010)
Figure 12 Reversible Modern Design Bed sheets (Kapas, 2010)
Research on Local Markets
The Local Market research was done in shops selling textile furnishings. Observations were made on the existing styles and details. However, it was noted that reversible textile furnishing items were not popular on the local market and few Mauritians were alert of this concept. Mostly Reversible Curtain Fabrics were available.

Ramsamy-Iranah & Budhai: Reversible textile furnishing IJHE Vol 6 No 2 2013
291
Methodology
Prior to the selection a theme for the collection, research was carried out on the current trends of fabrics.
Theme Title
The sourcing was based on ‘Checkered Fabric’ and ‘Striped Fabrics’ which are actually the trend in nowadays lifestyle. The two inspired fabrics were merged together thus forming the theme title: ‘Amalgamation – The Two in One’.
Visual Research
This part consisted mainly of gathering images to mount an inspirational board. Checkered and Striped Clothing images were collected from both primary and secondary sources (Figure 13). Pictures were taken from the local markets and also downloaded from the internet so as to have a global view of the actual clothing trend.
Primary and Secondary Visual Research:
Figure 13 Research on Striped and Checkered Fashion
Inspirational Board
Interesting pictures were assembled together to create a moodboard(Figure 14). The latter was used consequently as the main source for the development of the bedroom set collection. Both the primary and secondary materials were manipulated and then mounted on an A3 size format using Computer Aided Design (CAD) Software, and a brief explanation was added to describe the theme.
Some aspects which were mainly pointed out were:
The mix and match Style
The two Inspirations in one Feature
Colour Palette
Figure 14 Inspirational Board
Colour Palette
The colours chosen for the colour palette were derived from the inspirational board (Figure 15). The Orange ones represented the striped style and the brown ones were representative of the checkered style.
Figure 15 Colour Palette
Styling
Home decoration can be an expensive activity. A simple overturn of reversible textile furnishing can create a whole new look to the bedroom. The style and shape for the collection were based according to the brown and orange characteristics and some inspirations were taken from the actual existing textile furnishing.
Ramsamy-Iranah & Budhai: Reversible textile furnishing IJHE Vol 6 No 2 2013
292
The key items used were:
Simple Squared Cut
Pattern Fabric against plain Fabrics
Use of mostly warm colours.
Mix and Match of Contemporary and Modern Style
Sourcing of Fabrics
As stated in the introduction, a house furnished with exactly the right home furnishing fabrics at the right place truly gives a heavenly experience. In fact, fabrics can give stylish, traditional as well as contemporary look to any decor.
Characteristics of fabrics needed in textile furnishings:
Curtain fabrics should have light fastness.
Bedding fabrics should have resistance to pilling and stains.
Quilting fabrics and fabrics used for pillow covers, cushion covers, mattress cover should have resistance to snagging.
Proposed Fabrics
Striped and checkered fabrics can make a room look bright and informal and when different sized stripes and checks are mixed and matched with complimentary colours, they provide a contemporary look. Taking all these points into consideration, designs of fabrics in striped and checkered fabric were selected with plain fabrics as highlighter to create blends andcontrasting effects. The fabric utilized was cotton with blend of polyester, gingham and velvet.
Sample Development
The simple scheme of turning the textile piece inside-out accomplishes the reversal and allows it to be used on both sides. Therefore, reversible stitches were explored and used to eliminate raw edges or seams that are seen on either side of the textile product. For this research, the idea of double cloth was maintained. Double cloth makes the product more durable and therefore it lasts longer. Most of the experimental works were based upon the double cloth idea.
Reversible Techniques for Manipulating Fabrics
Manipulating fabric is a very creative way to embellish fabric. Fabric with three dimensional textures always looks interesting and can often look amazing. Gathers, ruffles, tucks, pleats and quilting are variations of fabric manipulation.

Ramsamy-Iranah & Budhai: Reversible textile furnishing IJHE Vol 6 No 2 2013
293
Pleats
A pleat is a type of fold formed by doubling fabric back upon itself and securing it in place. It is commonly used in clothing and upholstery to gather a wide piece of fabric to a narrower circumference Pleats are folds of fabric that are made to take in fullness. There are three main types of pleats. They are knife, inverted and box pleats.
Inverted pleat has two fold lines and a single placement line. The two folds butt together in the centre on the right side. Each Inverted pleats have a Box Pleat on the inside. Box pleats consist of folds on evenly spaced, marked lines that are secured at the top edge. Sample manipulation with reversible pleats is shown in Figure 16.
Figure 16 Reversible Inverted and Box Pleat
Pin Tucks
Tucks are stitched folds of fabric that are formed along the straight grain. The width of a tuck and the spacing between tucks depend on the fabric thickness and on the desired effect. Small tucks, especially multiple parallel tucks, may be used to decorate clothing or household linens. When the tucks are very narrow, they are called pin tucks. On the right side where the pin tucks are visible, one can feel and see the longitudinal textures available, whereas, on the reversed side, it is mostly flat and a slight embossed effect can be sensed.
Reversible Techniques for Neatening Hem
Hems are usually the last thing to be stitched on a textile product. Although a simple, turned-up, slipstitched hem is the one most commonly used, there are many other techniques available. For instance, a hem can be faced or it can be finished with a binding. There are also several methods for finishing the raw edge of a turned-up hem and for securing it with hand or machine stitching.
Topstitched Hem
Using a twin needle topstitched hem, theedge finished and a decorative effect is achieved on the right side of the fabric. In the sample manipulation shown in Figure 17, on the right side of the fabric, a band of striped orange fabric was stitched with orange matching thread for neatening the hem. On the reverse a topstitched hem were used; thus, giving two useable and reversible surfaces where one side is plain and the other side is faced with a contrasting fabric.
Figure 17 Reversible Topstitch hem

Ramsamy-Iranah & Budhai: Reversible textile furnishing IJHE Vol 6 No 2 2013
294
Topstitched Binding
Binding is used to enclose a raw edge of a fabric. It is made from a strip of fabric that is cut on the bias. Thus, for neatening double cloth, the use of binding is appropriate. Crème coloured bias binding was used as it matched both the gingham brown fabric and orange striped fabric. The bias binding was stitched using two colours of threads, respectively orange and dark brown thread. Sample manipulation is shown in Figure 18.
Figure 18 Reversible with Topstitch Binding
Reversible Techniques for Neatening Seams
The most widely used type of seam is a plain seam, which is suitable for nearly all fabrics. There are other kinds of seam that can be used when appropriate for the fabric or to add decorative detailing. French seam and other self neatening seams that conceal all raw edges are ideal for reversible textiles. This allows the textile product to be reversed without any seams seen on either side.
French Seam
A French seam is often used when the fabric is too delicate to overcast the seam allowance to prevent ravelling. The construction of a French seam provides a clean, finished, professional look to the inside of the textile product, such as concealing raw edges. The raw edge of the seam allowance is enclosed in a secondary seam, thus ideal for items that will have visible seams. Combined with the double cloth technique, the French seam can be slightly bulky due to the weight of the fabric. However from the viewpoint of neatness the outcome is excellent as no raw edge can be seen (Figure 19).
Figure 19 French Seam
Flat Felled Seam
Flat felled seams can be found on almost all jeans. Tough and durable, flat felled seams provide three stitch lines, two of which secure multiple layers of fabric. Flat felled seams also conceal the raw edges of the seam allowance, reducing the likelihood of fraying. There is no visible seam allowance on flat felled seams. It makes a neat, clean finish. Raw edges will not ravel because they are completely encased.
Application of Reversible Embellishments
Embellishment does not stop at clothing. Home Decorating with embellishments can make a house a home. Simple pillows can be made into something very special with a bit of embellishment.

Ramsamy-Iranah & Budhai: Reversible textile furnishing IJHE Vol 6 No 2 2013
295
Rosettes
Fabric rosettes are easy-to-make and it is an inexpensive embellishment that can add value to different craft projects. Firstly, the fabric must be cut in a circular shape. Then, about half a centimetre of the raw edge must be folded all round the circularshape and running stitch is done carefully. Once the running stitch round is completed, the thread is pulled to the maximum and then securely attached with a backstitch. The rosettes were used reversibly on both the inner and outer side of cushion covers on cushion covers (Figure 20).
Figure 20 Reversible Rosettes
Application of Reversible Fastenings for Cushion Cover
Buttons and Buttonholes
Buttonholes stitched with close zigzag stitch or close satin are the most common types of machine buttonhole. Reversible buttonholes are possible as two coloured threads can be used. In the sample manipulation in Figure 21, for sewing the machine buttonholes, orange thread was wounded in a bobbin and the dark brown thread was placed on the thread reel of the machine. Figure 21 Reversible Buttons
Buttons and Rouleau Loop
The length of button loops is based on the button size. The loops were pinned in place on the cushion edge and temporarily secure by placing a strip of adhesive tape or basting across the cut ends. Subsequently, they were sewn using machine stitches. The buttons were placed on both the right and reverse side (Figure 22).
Figure 22 Reversed Buttons & Rouleau Loop
Press Studs
A press stud is a pair of interlocking discs commonly used in place of buttons to fasten clothing. It was noted that reversible press studs could be used for the double cloth technique, as both sides are same (Figure 23).
Figure 23 Reversible of Press Studs

Ramsamy-Iranah & Budhai: Reversible textile furnishing IJHE Vol 6 No 2 2013
296
Application of Reversible Fastenings for Curtains
Draping of a curtain around a window or a door opening is carried out for decorative or for covering particular surface regions. There are different ways to hang curtains, for example, making use of eyelets, straps, hooks and curtain tapes. For this research double sided ideas were created to be able to make the curtains reversible so that both sides of a single curtain could be used.
Reversible Curtain Eyelets
Eyelets allow the curtain to be hung from the rod with curtain hooks or the rod can be threaded through the eyelets. Since many years curtain eyelets exists, but inappropriate stitching was used to make the curtain reversible. For this technique curtain tape was used along the top of the curtain in between the two fabrics as this strengthens the area of the curtains that will contain the eyelets. Eyelets were placed at equal intervals and marked. The circumference inside the eyelet was drawn and cut off. Afterward, the larger half of the eyelet was placed underneath the new hole and snapped the smaller half on top. This action was replicated at regular intervals across the top of the curtain (Figure 24).
Figure 24 Reverse Side of Eyelet
Reversible Fabric Loops for Hanging Curtains
Fabric Loops allow the curtain to be hung when threaded through the curtain rod. This was the simplest way of reversing a curtain as no curtain tapes were required. For this experiment, both right side and reversed side of the fabric was utilized as shown in Figure 25.
Figure 25 Right and Reverse of Fabric Loop
Attaching of Fabric Loop with buttons
In this technique, instead of sewing the fabric loop to the curtain, it was neaten and then attached with the help of two buttons. One button facing the right side of the curtain and the other button facing the reversed side of the curtain. The black rounded buttons were sewn together using black thread (Figure 26).
Figure 26 Right and Reverse Side of loops with buttons

Ramsamy-Iranah & Budhai: Reversible textile furnishing IJHE Vol 6 No 2 2013
297
Reversible Rouleau Loops for Curtain Hooks
The use of hooks for hanging curtains is very common and curtain tapes are usually placed to hold the hooks. However curtain tapes are unable to make a curtain reversible therefore a new innovative sample was created using the concept of hooks that could make a curtain reversible. The method consisted of using cotton cords attached to the curtain by means of loops (Figure 27).
Figure 27 Reversible of Sample with loops and hooks
Target Market
The concept of target marketing involves the design of complete marketing prospectus to meet the needs of different segments in the market. The process of finding and studying potential customers for this research was extremely important. The customers who were mostly targeted for this research were family unit. This idea of reversibility would be beneficial economically as one can change his interior home decoration without buying new products.
Data Collection
For this study, two questionnaire surveys and interviews were carried out among two specific groups:
Retailers dealing in textile furnishing
Customers
The aim of these surveys and interviews was to gather information about the preference and views of people on the reversible samples and products.
Results and Analysis
This part of the research consisted of proposing a final collection as a result of the samples produced and analysing the experimental samples. Some tests were carried out for the double cloth idea to determine their efficacy and evaluate if they could be appropriate for use in reversible textile furnishing.
Final Collection
A set of reversible textile bedroom furnishings was created based on the theme ‘Amalgamation’. The collection made denoted that a simple overturn of reversible textile furnishing can create a whole different new looks to the bedroom. The reversible textilefurnishings comprised of bed sheet, curtain, pillow and cushion cover and chair linen (Figure 28). The blend of plain, check and striped created a strong contrast (Figure 29).

Ramsamy-Iranah & Budhai: Reversible textile furnishing IJHE Vol 6 No 2 2013
298
Figure 28 Right Side of Bedroom Set and the Reverse Side
Figure 29 Contrast of Plain and Patterned Fabrics
Testing of Reversible Samples
Textile testing is a valuable aid for textile production, distribution, and consumption. Due to the complexity of reversible concepts, certain tests were conducted to determining the efficiency of the fabrics and techniques used.
Tests carried out on the samples:
Colour Fastness to Washing
Colour Fastness to Rubbing
Determination of Light Fastness
Dimensional Stability Test to Laundering
Colour Fastness to Washing
Colour fastness is a measure of how permanent a colour is on fabric. Colour can be adversely affected by a number of factors including exposure to light, to water and to normal wear and tear.
The resistance of a material to change in any of its colour characteristics, when subjected to washing is called colour fastness to washing. In the test, change in colour of the textile and also staining of colour on a multi fibre fabric were assessed.
Two swatches of 10 x 4 centimetre (cm) fabric (Cotton and Cotton Polyester Fabric) were taken and were stitched to a multi-fibre fabric (Figure 30). The sample and the multi-fibre fabric and a solution of Sodium Carbonate, ECE Detergent and Water were prepared with a liquor material ratio 50:1. Both the sample and the solution were placed in a stainless steel container and placed in a wash wheel with a thermostatically controlled water bath 60°C. After the washing treatment, the sample was removed and rinsed twice in cold water and then in running cold water under a tap. The change in colour of the specimen (Dyed Sample) and the staining of the multi-fibre fabric was assessed using the standard Grey Scales (1-5) on which "1" signifies maximum staining and "5" no staining. Table 1 presents the results of staining on the multi fibre fabric and Table 2 shows the results of change in colour of the specimen.
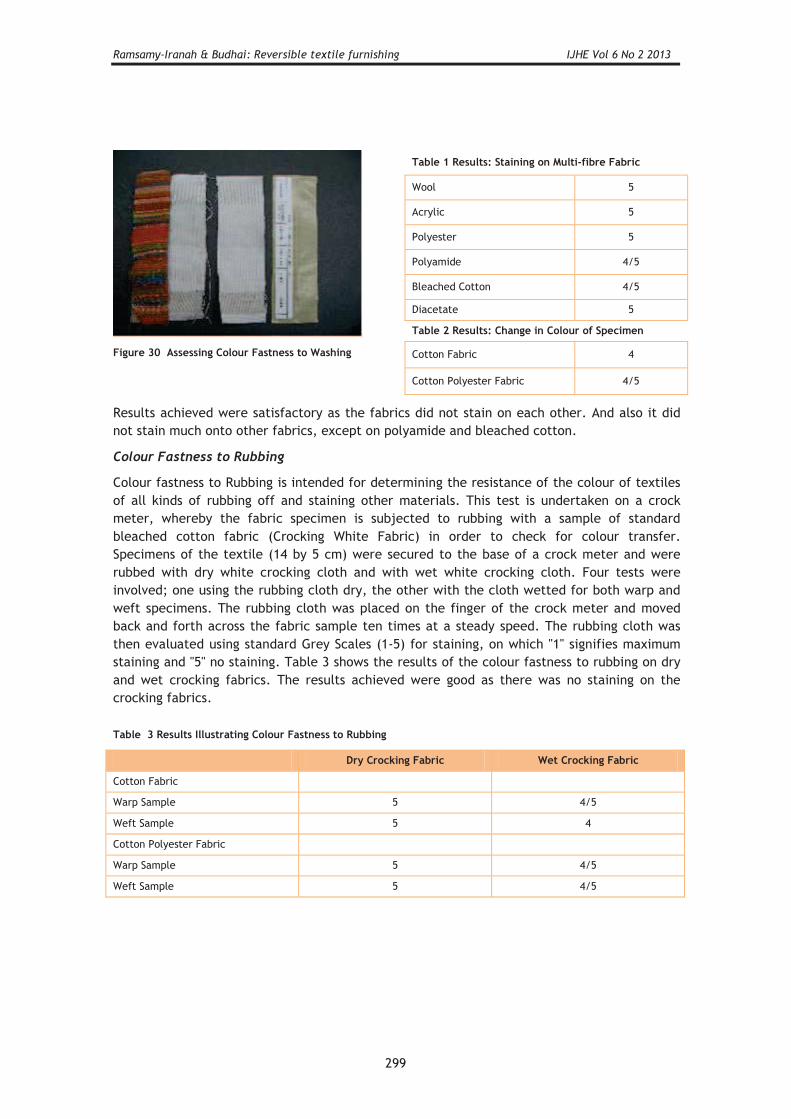
Ramsamy-Iranah & Budhai: Reversible textile furnishing IJHE Vol 6 No 2 2013
299
Table 1 Results: Staining on Multi-fibre Fabric
Wool 5
Acrylic 5
Polyester 5
Polyamide 4/5
Bleached Cotton 4/5
Diacetate 5
Table 2 Results: Change in Colour of Specimen
Figure 30 Assessing Colour Fastness to Washing Cotton Fabric 4
Cotton Polyester Fabric 4/5
Results achieved were satisfactory as the fabrics did not stain on each other. And also it did not stain much onto other fabrics, except on polyamide and bleached cotton.
Colour Fastness to Rubbing
Colour fastness to Rubbing is intended for determining the resistance of the colour of textiles of all kinds of rubbing off and staining other materials. This test is undertaken on a crock meter, whereby the fabric specimen is subjected to rubbing with a sample of standard bleached cotton fabric (Crocking White Fabric) in order to check for colour transfer. Specimens of the textile (14 by 5 cm) were secured to the base of a crock meter and were rubbed with dry white crocking cloth and with wet white crocking cloth. Four tests were involved; one using the rubbing cloth dry, the other with the cloth wetted for both warp and weft specimens. The rubbing cloth was placed on the finger of the crock meter and moved back and forth across the fabric sample ten times at a steady speed. The rubbing cloth was then evaluated using standard Grey Scales (1-5) for staining, on which "1" signifies maximum staining and "5" no staining. Table 3 shows the results of the colour fastness to rubbing on dry and wet crocking fabrics. The results achieved were good as there was no staining on the crocking fabrics.
Table 3 Results Illustrating Colour Fastness to Rubbing
Dry Crocking Fabric Wet Crocking Fabric
Cotton Fabric
Warp Sample 5 4/5
Weft Sample 5 4
Cotton Polyester Fabric
Warp Sample 5 4/5
Weft Sample 5 4/5

Ramsamy-Iranah & Budhai: Reversible textile furnishing IJHE Vol 6 No 2 2013
300
Determination of Light Fastness
This test measures the resistance to fading of textile when exposed to day light. The specimen sample, a velvet fabric for curtain was exposed to light for about 24 hours to 72 hours and compared to the original unexposed sample. The changes were assessed by Blue Scales (Figure 4.4).The samples, both right side and reversed side were cut 5 by 1 cm and were placed lengthwise one above the other and stapled on a 11×5 card board. The prepared specimen of fabric was then partly covered and exposed to artificial ultraviolet light along with a scale of light sensitive blue dyed wool standards designed to fade after different time periods. Only the uncovered part of the test sample was subjected to any fading (Figure 4.5).
Figure 31 Samples set in machine Figure 32 Results obtained after 72hours
After different periods of time, the blue wool faded in several degrees reaching whereas there was no change on both the right and reverse side of the velvet fabrics.
The velvet fabric is suitable to be used on both sides as both the right side and reversed side was not affected by sunlight.
Dimensional Stability Test to Laundering
The dimensional stability of fabric is the extent to which it keeps its original dimensions after processing. We may either have an increase in dimension, known as expansion; or a decrease in dimension known as shrinkage.
Fabric shrinkage can cause problem to double cloth. This was the reason why this test had been carried out.
The Specimen cotton and polyester fabric was cut into a sample size 50 by 50 cm. And a marking area 35 by 35 cm was marked. The warp direction was marked with an arrow. Domestic Detergent was then added to a laundry washcator. The Sample was then laundered at 400C for 60 minutes (Procedure 5A) together with some polyester bags in order to achieve a total load of 2 Kilograms. After Laundering the sample was laid flat to dry for 24 hours. Measurement was then taken in the warp and weft directions at three places (at upper line, at lower line and in the middle line) and the measurement of each was noted. The results of the shrinkage are presented in Table 4.

Ramsamy-Iranah & Budhai: Reversible textile furnishing IJHE Vol 6 No 2 2013
301
Table 4 Results Achieved after Laundering
Cotton Fabric Cotton Polyester Fabric
Warp Direction -4 -3.5 -3.5 -0.5 -0.5 -0.5
Weft Direction -2 -1 -1.5 -1 -1 -1
The cotton fabric shrinks and consequently it is not suitable for double cloth with cotton polyester fabric. Therefore, particular attention should be paid when choosing fabrics for the double cloth technique.
Acceptance of Reversible Textile Furnishing Concept
This section refers to the approval and acceptance of reversible textile furnishing concept on the local market. The majority of the responses turned out to be very positive, as such proving a potential opportunity for Reversible Textile Furnishing.
Chart 1 Acceptance of Reversible Textile Furnishing
Via the open-ended question stated in the customers’ survey questionnaire, it can be observed in more details the reasons for the answers provided in Chart 1 above. The points of views had been compiled as follows. Among the 8% population who gave a negative response to buy reversible textile furnishing has defined it as being inconvenient. It was noted that Reversible Textile Furnishing is time consuming as it takes time to reverse the products. And also it was stated that if one side of the product is spoiled, then it becomes unproductive as it turn out to be impractical to utilize its reversibility. On the other hand, 25% the population who were indecisive about reversible textile furnishing stated that they are more likely to

Ramsamy-Iranah & Budhai: Reversible textile furnishing IJHE Vol 6 No 2 2013
302
purchase or wholesale good quality products. And also, they asserted that the designs and the cost of the products were more vital for them.
In contrast, majority of the population, 67%, have answered that reversible textile furnishing does benefit since it provides two usable surfaces. It was also stated that Reversible Textile Furnishing tend to be more economic and they create more ease for usability. Reversible textile furnishing allows rapid change in the deco while using the single product made the customers keener to purchase it. And also it was declared that customers could largely benefit from the single product as continuous transformations could be made to change the mood of the environment.
Acceptance of Collection
The last part of the survey consisted of grasping an overview about the acceptance of the reversible textile furnishing bedroom set and samples made for this research. Most of the responses turned out to be very affirmative, as such proving that the population is likely to deal and purchase this type of reversible bedroom set.
Chart 2 Acceptance of Collection
As demonstrated in chart 2, 75% of the retailers and 70% of the customers are willing to wholesale and purchase this kind of Reversible Textile Furnishing. Therefore, it shows potential to be a forthcoming trend on the local market.
Conclusion
Generally speaking, the reversible textile furnishing concept led to a satisfying result due to its creativeness and appeal. Moreover, the target market group has described the research as being interesting and rich in charm and has asserted that the overall key features characterizing the present research is trendy.
Regarding the sample manipulations, they have been generally described as being eye-catching and fashionable. The respondents were fascinated by the majority of the samples due to their intricacy, originality and colour wise. The aesthetic look of the manipulations

Ramsamy-Iranah & Budhai: Reversible textile furnishing IJHE Vol 6 No 2 2013
303
was also a plus point. Thus, it can be said that the aim of the research, which was to create reversible techniques to obtain innovative and fashionable manipulations, was attained to a certain extent. As proved in the development of samples, reversible stitches and techniques gives a neater finish to a textile product. Therefore it would be more profitable to apply these techniques to reversible textile products. The present study led to an acceptable outcome and has proved to be beneficial, due to its double faced useable sides. It has been noted that on the local market, reversible textile furnishing are not really known and well developed. Further work can be done to educate people about this concept and its benefits.
Biography
Sabrina Ramsamy-Iranah has 18 years of experience in the field of Fashion and Textile, she completed her BA(Hons) Design in Cumbria and Masters Degree in Textile Design at the Heriot Watt University, UK. She has been a Fashion and Textile Design Lecturer at the University of Mauritius for the past ten years. She is also a freelance designer and design consultant for local companies in Mauritius. Her research topics cover tactile fabrics, bio-fashion and recycling materials, design crafts and sustainable fashion products and materials. She is currently undertaking her PhD in the area of Assistive Design at the University of Mauritius. Email:[email protected]
Nirvana Budhai is a freelance designer in the Fashion and Textile Field. She is currently working for a South African company establishing a brand in Mauritius. Her expertise covers cut and sew techniques, motif printing and appliqué work.
References
Aebischer,M.(2009). Lost my Rhythm: Bias Binding used for Reversible Quilt.. Retrieved February15,2011,fromhttp://theolivesparrow.typepad.com/theolivesparrow/2009/03/lost-my-rythmen-.html
Aryn,K (2010). Woven Cardigan with Reversible Lapel [image]. Retrieved February 13, 2011, from http://frostymint.blogspot.com/2010/12/aryn-k-womens-woven-cardigan-with-lapel.html
AudioEnglish. (2010). Reversible definition. Retrieved August 17, 2010, from http://www.audioenglish.net/dictionary/reversible.htm
Battista, A.(2009). Rubelli, from Venice to...Sex and The City?: 1700’s Damask Design [image].Retrieved February 26, 2011, from http://irenebrination.typepad.com/irenebrination_notes_on_a/2009/08/index.html
Bird, R. (1994). Reversible Jacket of Cotton [image]. Retrieved February 8, 2011, from http://www.birdross.com/newvocab.php
Busan Textiles Co Ltd.(n.d). Double Face [image]. Retrieved March 3, 2011, from http://www.tradekorea.com/e-catalogue/busantex
Corbman, B.P (1983). TEXTILES: Fiber to Fabric (6th Edition). New York. Mc Graw Hill.

Ramsamy-Iranah & Budhai: Reversible textile furnishing IJHE Vol 6 No 2 2013
304
Kapas, S (2010).Reversible Modern Design Bed Sheets. Retrieved March 2, 2011, from http://suterakapas.blogspot.com/2010/12/modern-design-bedsheet.html
Mc Call’s Pattern Co.(2011).Reversible Shawl Collar Jackets [image]. Retrieved February 13, 2011 from http://oklahomacity.olx.com/shawl-collar-jacket-sewing-pattern-easy-reversible-mccall-s-iid-137976978
Mireles,S. (2010). eHow: The History of Damask Fabric. Retrieved February 8, 2011 from http://www.ehow.com/about_6677037_history-damask-fabric.html
Neall,S.(2010). Double Cloth and Double Faced Fabrics. Sew Inspirational Issue 7. Retrieved February 17, 2011, from http://www.sewinspirational.com.au/sewing/fashion-sewing/Sewing_Double_Faced_Fabrics
Octavia.(n.d) Making Old Clothes into Funky Bags: Oversewing. Retrieved February 17, 2011, from http://www.squidoo.com/recycle_your_clothing
RBR Inc.(2009).Bind and Enclose a Fabric Edge Tutorial: How to Use or Apply Bias Tape or Ribbon [Image]. Retrieved March 3, 2011, from http://www.sewneau.com/how.to/bias.tape.html
Salkill,E.(2008). Easy Reversible Tablecloths You Make in Minutes. Retrieved March 4, 2011fromhttp://www.associatedcontent.com//article/583931/easy_reversible_tablecloths_you_make.html
Textile Direct (2005). Reversible Cushion Cover. Retrieved March 4, 2011 from http://www.textilesdirect.co.uk/store/Foyle-Chocolate-Reversible-Cushion-Cover.html
The Pope Benedict xvi Fan Club. (2001) Damask Dress: Pope Benedict Forum [image]. Retrieved February 26, 2011, from http://theratzingerforum.yuku.com/reply/61932/Re-Papal-clothing-and-liturgical-practices
Vintage Costumers. (2005). 1700's Rococo Gown / Marie Antionette [image]. Retrieved February26,2011,from http://www.vintagecostumers.com/historicalcostumes16001700.htm
Weston Thomas,P. (2007). Emma Somerset Autumn/Winter: Occasion Wear [image]. Retrieved February 26, 2011 from http://www.fashionera.com/trends_2008/gold_brocade_jewel_texture_fashion_07.htm
Wikipedia.(2009). Reversible Garment. Retrieved August 16, 2010 from: http://en.wikipedia.org/wiki/Reversible_garment
World Book, Inc.(1994). The World Book Encyclopedia (Volume 11). Chicago. World Book International.
International Journal of Home Economics
305
The marital relationship and Saudi Arabian women’s private sphere dress
Wijdan Tawfiq & Jennifer Paff Ogle
Colorado State University, USA
Abstract
This study explored the marital dyad as a context for Saudi women’s presentation of self through dress within the private sphere. The work was guided by symbolic interaction theory. Data were collected via in-depth interviews with 15 married Saudi couples and were analysed using constant comparison processes. Analyses revealed three key themes: (a) traditional and Western dress for the private sphere, (b) “his place” and “her place” in shaping private sphere dress decisions, and (c) forging the private sphere self through lived interaction. Findings revealed that there was some variation with regard to the roles assumed by husbands and wives in guiding wives’ private sphere dress decisions and in the value wives accorded their husbands’ appraisals of their appearances. The data provide evidence in support of the interactionist premise that the private sphere selves the wives constructed through dress were shaped, in part, through their interactions with their husbands.
Keywords: dress, marriage, private sphere, Saudi Arabian, women
Introduction
In the Islamic country of Saudi Arabia, family is key to a healthy culture as family ties are strong and Islam reinforces the importance of the familial unit (Long, 2005). Many aspects of life – including dress – are an integral part of the family unit and the marriage bond (Al-Dabbagh, 2006). How women present themselves through dress is often seen as a representation of their family, allowing context and audience considerations to play a critical role in shaping self-presentation (Al-Munajjed, 1997; Long, 2005). In one context, the public sphere – locations outside of the home where women are in the presence of males who are not considered to be next of kin – Saudi women are required by law to practice hijab or veiling (Le Renard, 2008). For Saudi women, observing hijab requires wearing the abbaya witha burqah or niqab, a form of traditional dress that covers the entire body, leaving only the eyes and hands exposed (Long, 2005). Dress conventions for Saudi women are different, however, within the private sphere, which encompasses women’s interactions with their next of kin (male or female) and/or with women to whom they are not related. These interactions may occur within private homes or gender-segregated locations, that is, spaces where only women are allowed. The private sphere of Saudi women encompasses a broad range situations and contexts, including their interactions with other women at gender-segregated schools, workplaces, shopping centres, and events e.g., weddings, holiday celebrations (Al Munajjed, 1997; Le Renard, 2008). In contrast to their public sphere dress, Saudi women’s private sphere dress is open to individual choice and may include traditional Saudi styles, for examplemodest, long dresses with long sleeves, or, in recent years, Western styles (Le Renard, 2008).

Tawfiq & Paff Ogle: Saudi women’s private sphere dress IJHE Vol 6 No 2 2013
306
Most of the existing research exploring Saudi women’s dress practices has focused upon dress worn in the public sphere, providing detailed descriptions of the abbaya and examining varied perspectives on the practice of hijab (e.g., Doumato, 1992; Fertile-Bishop & Gilliam, 1981; Pharaon, 2004; Rabolt & Forney, 1989). In contrast, a modicum of work has examined Saudi women’s private sphere dress practices, especially from the perspectives of the wearers, themselves, perhaps owing to the limited access of outside researchers into the private sphere of Saudi women. Further, although it has been suggested that Saudi Arabian husbands may play a role in their wives’ decisions about public sphere dress (Al-Munajjed, 1997; Bullock, 2003), researchers have not explored the potential role of husbands in shaping Saudi women’s private sphere dress. Thus, the purpose of the present interpretive study was to address existing gaps in the literature by considering the marital dyad as a context for Saudi women’s presentation of self through dress within the private sphere.
Literature review
Marital roles within the Islamic Saudi context
Traditionally, marital roles within Saudi Arabia have been defined by the teachings of Islam, with specific roles and expectations circumscribed for husbands and wives (Al-Jehani, 2005; Syed, 2004). As the head of their households, Saudi husbands have customarily been expected to provide food, clothing, and shelter for their wife; to groom themselves well; to be devotedonly to their wife; to guard their wife’s identity; and “to be zealous for their wife’s purity”,that is, to encourage his wife to shield her beauty by wearing the veil; to assist their wife with housework; and to not hinder their wife from work or study. Saudi wives, on the other hand, have traditionally been expected to submit to their husband’s authority, to maintain the home, and to bring up “proper” children (Bullock, 2003; Maki, 2004; Syed, 2004). This entails appropriately using the money they receive from their husband, not leaving the home without their husband’s permission, maintaining the family’s privacy, and creating a healthy and peaceful home. Like husbands, wives have been expected to groom themselves, which includes wearing clothing that appeals to their husband. Both parties have been responsible for living together with respect and for maintaining mutual sexual satisfaction (Al-Jehani, 2005; Bullock, 2003).
In recent years, as Saudi women have begun to access more freedoms, these traditional gender role expectations have begun to be redefined in some ways. For instance, as women have gained independence through education and work, they have questioned whether the husband’s authority within the family should be shared with the wife (Al-Jehani, 2005; Maki, 2004).
Saudi women’s private sphere dress
As noted, Saudi women wear two primary forms of dress within the private sphere: traditional and Western. The traditional private sphere dress of Saudi Arabia pre-dates the country’s founding in 1932 by several centuries (Al-Bassam & Sudqi, 1999; Long, 2005) and takes its form as a long-sleeved, floor-length dress with a high-collar. The silhouette is close fitting yet modest, minimizing bodily exposure. Frequently, the neckline, arms, and sleeves of the dress are richly embellished with colourful embroideries (Kennett, 1995) (see Figure 1).

Tawfiq & Paff Ogle: Saudi women’s private sphere dress IJHE Vol 6 No 2 2013
307
Figure 1. Women’s traditional private sphere dress
Although the traditional private sphere dress of Saudi Arabia has a long history, it has waned in popularity since the discovery of oil in the 1930s and the ensuing introduction of Western influences/media (Long, 2005; Yamani, 2004). Iskandarani (2006) has suggested that in contemporary Saudi society, women rarely wear traditional private sphere dress, reserving its use primarily for times of celebration and religious occasions. Al-Dabbagh’s (2006) research provides empirical support for the proposition that traditional dress is declining in its popularity for everyday use; her findings revealed that, between 1981 and 2004, there was a shift among Saudi women in preferences toward more Westernized dress for private sphere use.
The adoption of Westernized dress by Saudi women may be explained by diverse factors. Using an oral survey approach, Rabolt and Forney (1989) examined the dress preferences of Saudi women nationals and found that women who had higher socioeconomic status, had worked outside of the home, were more “cosmopolitan” (i.e., had travelled outside of Saudi Arabia), were more highly educated, and were younger were more likely to wear more Westernized dress in private settings. Overall, findings indicated less movement toward Westernized dress in public sphere dress choices as compared to private sphere dress choices. The researchers proposed that these findings may reflect Islamic laws forbidding the wearing of Westernized dress in public. Thus, from the perspectives of the participants, the private sphere may have been the only place where it was permissible for them to express their own identity through dress.

Tawfiq & Paff Ogle: Saudi women’s private sphere dress IJHE Vol 6 No 2 2013
308
For some contemporary Saudi women, the expanded possibilities for self-expression offered by the introduction of Western dress into the marketplace pose a dilemma of sorts. Zuhur (2005) has suggested that these women may experience a sense of being torn between adopting fashions promoted within the Westernized media and adopting more conservative fashions that traditionally have been valued within their native culture. For many, the result is a balancing act; for instance, based upon her field study exploring Saudi women’s lifestyles, Le Renard (2008) observed that although women attending university in Saudi Arabia were required to conform to expectations for traditional Saudi dress (e.g., they had to wear long skirts), they also dressed so as to display awareness of Western fashions.
Theoretical framework
Symbolic interactionists regard the dressed body as a social object invested with meanings that emerge through social interactions. These meanings allow individuals to use the appearance of their own bodies to establish identity and to draw inferences about others’ appearances (Stone, 1962). In turn, these inferences guide individuals’ interactions with others and form the basis for the feedback that interacting individuals provide to others about the body and self. Social feedback, or “reviews,” of one’s body and self can be positive or negative and thus, may represent a validation of or a challenge to a given presentation of the self through dress (Stone, 1962). Individuals reflect upon reviews about their dressed bodies and may integrate these reflected appraisals into their sense of self, using them to imagine future reactions to their physical selves (i.e., to take the role of a specific or generalized other) and to guide future dress-related behaviours and interactions (Cooley, 1902; Mead, 1934; Stone, 1962). In this way, people use others as “looking glasses” (Cooley, 1902) to tell them who they are, how they should dress and appear, and how they should behave toward their bodies and those of others (Stone, 1962).
Empirical findings lend support for the interactionist premise that women come to see their bodies through the eyes of their husbands. For example, in prior work with US samples, husbands’ evaluations of their wives’ appearances have been linked to their wives’ appearance self-assessments (Oh & Damhorst, 2009; Pole, Crowther, & Schell, 2004). Taken together, this work suggests that over time, a woman’s self-perceptions of her appearance may come to mirror her “accumulated understanding of [her] spouse’s appraisal of [her] body and appearance” (Oh & Damhorst, 2009, p. 43). Thus, there is both theoretical and empirical support for the proposition that a woman’s sense of the appearance is produced, in part, through her interaction with her husband. To date, however, research has not yet explored how, within the context of Saudi marriage, interactions between wives and husbands may shape Saudi women’s dress within the private sphere. Yet, both the cultural context of Saudi Arabia, in which Saudi husbands have traditionally been viewed as guardians of their wives’ identities (Maki, 2004), as well as prior work suggesting that Saudi husbands may exert an influence upon Saudi women’s public sphere dress choices (Al-Munajjed, 1997; Bullock, 2003), support the likelihood that Saudi women’s private sphere dress decisions may be negotiated within the context of their marriages. The questions that then arise are: What meanings do Saudi Arabian husbands and wives associate with various forms of private sphere dress available within the contemporary Saudi marketplace, including traditional and Western forms of dress? How do these meanings set a context for Saudi women’s dress-related interactions with their husbands? Further, what role do Saudi husbands play in shaping
Tawfiq & Paff Ogle: Saudi women’s private sphere dress IJHE Vol 6 No 2 2013
309
married Saudi women’s dress for the private sphere? And, how do interactions between Saudi wives and husbands lay a foundation for Saudi women’s self-presentations through private sphere dress?
Method
Institutional Review Board approval for this study was obtained from Colorado State University. An interpretive, qualitative approach that drew upon in-depth interviews with 15 married Saudi couples was adopted.
Participants
Purposive, nonprobability sampling was used to recruit participants from two metropolitan cities in Saudi Arabia (i.e., Jeddah and Medina). Two female Saudi informants provided initial contacts. Couples had been married for 3 months to 35 years. Wives’ ages ranged from 20 and 60 years (mean = 30 years), and husbands’ ages ranged from 20 to 67 years (mean = 35 years). Most participants share a middle-class or upper middle-class lifestyle. All but two wives had pursued some form of post-secondary education: eleven obtained bachelor’s degrees, and two held graduate degrees. Although a majority of the wives were homemakers, three worked outside the home in white-collar positions (human resources, education), and one was a student. Though several wives had travelled abroad, none had lived abroad. All husbands had received higher education degrees: four held associate’s degrees, four held bachelor’s degrees, and seven held graduate degrees. Four husbands had lived abroad while they were students. Husbands’ occupations varied (e.g., electrician, engineer, HR manager, physician). A summary of the background information on participants is presented in Table 1.
Procedures
All participants were interviewed by the first author, a married female Saudi researcher. An in-depth, semi-structured approach was used to explore guided topics of discussion. Questions focused upon (a) how participants viewed the wearing of traditional and Western dress within the private sphere (for the self or for their wives) and (b) how wives and husbands interacted about the wives’ dress worn within the private sphere and to what degree this affected wives’ decisions about dress. Interviews with wives and husbands were conducted separately. Wives’ interviews were conducted face-to-face in Saudi Arabia in a private setting (e.g., in the participants’ homes), lasting between 40 and 90 minutes. To honour Saudi cultural customs that mandate separation of unrelated men and women, husbands’ interviews were conducted over the phone or via Skype. Husband interviews lasted from 20 to 50 minutes. Three husbands chose to speak English in their interviews, but all other interviews were conducted in Arabic. Interviews were recorded, transcribed verbatim, and, when necessary, translated into English by the first author (a native Arabic speaker who also speaks fluent English).

Tawfiq & Paff Ogle: Saudi women’s private sphere dress IJHE Vol 6 No 2 2013
310
Table 1 Background Information on participants
Couple Wives Husbands
#Length of Marriage
AgeHighest Level of
Education CompletedOccupation
Travel Abroad
AgeHighest Level of
Education CompletedOccupation
Travel Abroad
1 9 yrs, 6 mths 28 Bachelor’s degree Housewife Yes 31 M.D. Physician Yes
2 4 yrs, 3 mths 22 Bachelor’s degree Housewife Yes 28 Master’s degree Ph.D. student Yes
3 4 yrs 22 Bachelor’s degree Housewife No 29 2 yrs. technical college Electronic technician No
4 2 yrs, 7 mths 20 3 yrs. of college College student No 20 3 yrs. of college College student No
5 35 yrs, 6 mths 60 Bachelor’s degree Housewife Yes 67 Bachelor’s degree Teacher Yes
6 2 yrs, 7 mths 31 Bachelor’s degree Housewife No 27 Bachelor’s degree Computer engineer No
7 3 mths 24 High school diploma Housewife Yes 29 3 yrs. technical collegeHuman resources administration
No
8 1 yr 29 Master’s degree Human resources coordinator
Yes 31 Master’s degree Mechanical engineer No
9 9 yrs 33 Bachelor’s degree Housewife No 35 Bachelor’s degree Accountant No
10 18 yrs 40 Bachelor’s degree Housewife No 47 Bachelor’s degreeGovernment; Ministry of Interior
No
11 4 yrs 25 Bachelor’s degree Housewife Yes 35 Master’s degree University lecturer Yes
12 6 yrs, 3 mths 31 High school diploma Housewife No 38 3 yrs. technical collegeGovernment; Ministry of Labor
No
13 9 yrs 37 Bachelor’s degree Housewife Yes 40 Master’s degree Treasury director Yes
14 10 yrs 28 Bachelor’s degreeGraduate student; teaching assistant
Yes 36 Master’s degreeHuman resource director
Yes
15 10 yrs 27 Master’s degree University lecturer Yes 32 Master’s degree University lecturer Yes

Tawfiq & Paff Ogle: Saudi women’s private sphere dress IJHE Vol 6 No 2 2013
311
Analysis
Data were analysed using constant comparison processes (Strauss & Corbin, 1998). Data were divided it into meaningful fragments. The researchers then took fragments from five wife and five husband interviews, comparing and analysing them to develop key concepts through the process of open coding. These key concepts were developed into a coding guide, which was applied to the whole of the data. Finally, the researchers used axial and selective coding to search for higher–order connections within the data (Strauss & Corbin, 1998). To establish trustworthiness, the first author used journaling (reflexivity). Additionally, an audit coder checked the application of the coding guide to the data. Interrater reliability was 96% and was calculated by dividing the total number of agreements in coding decisions by the total number of coding decisions made. Disagreements in coding were negotiated.
Findings
Emergent themes
In the spirit of the interactionist tradition, findings revealed that, among the Saudi couples in the sample, the marital relationship set a context for the negotiation of meanings about the private sphere dress worn by the wives. Specifically, three themes related to private sphere dress emerged from analyses: (a) traditional and Western dress for the private sphere, (b) “his place” and “her place” in shaping private sphere dress decisions, and (c) forging the private sphere self through lived interaction.
Traditional and Western dress for the private sphere
To understand how married Saudi couples negotiate meanings about women’s private sphere dress through their interactions, it is important first to understand the meanings that they associated with the various forms of dress worn within this context (i.e., traditional and Western). Although individual preferences for traditional versus Western dress were somewhat varied across the sample, a set of meanings about each of these forms of dress emerged as shared across numerous participants. Perhaps the clearest example of such an association was the linkage of traditional dress with modesty or conservatism and the teachings of Islam: “I’m in love with traditional or Eastern dress…it takes into account the rules of Islam in terms of modesty” (Husband 2). Traditional dress also frequently was viewed as central to the substance of certain traditional celebrations, such as the Ghomrah party, a customary Saudi bridal celebration: “The bride and her family must wear the traditional…they are losing the value of the party if they do not” (Wife 3). Finally, for everyday contexts, traditional dress was regarded as outdated and as the province of more mature women. Conversely, Western dress (e.g., jeans, t-shirts, short dresses) was viewed as fashionable and trendy, as potentially immodest (i.e., not all Western dress was viewed as equally immodest), and as youthful in its design:
Western dress is more chic…(Husband 1)
Not everything in the West is appropriate here. It’s not appropriate for our culture, our society, and our environment. (Wife 12)

Tawfiq & Paff Ogle: Saudi women’s private sphere dress IJHE Vol 6 No 2 2013
312
…the first time my husband saw me wearing skinny jeans with a revealing top….he told me that I looked younger and he didn’t recognize me….hethought I was our daughter! (Wife 10)
In varied ways, the aforementioned meanings formed the basis for wives’ and husbands’ interactions about private sphere dress (cf., Stone, 1962). As Zuhur (2005) reminds us, for many Saudi women, opposing cultural pulls in contemporary Saudi society may produce a sense of conflict about whether to adopt traditional styles that are consistent with Islamic teachings or to wear trendier (and often less conservative/modest) fashions that are promoted as desirable within the Westernized media. For a number of participants, this sense of conflict was played out within the context of the marital relationship. Here, wives and their husbands held differing views regarding the appropriateness of various forms of private sphere dress, inciting a sense of tension for the wives. For instance, some husbands, such as Husband 6, valued traditional styles and modesty in dress and regarded much Western dress as inappropriate (i.e., too immodest) for their wives, asking their wives not to wear such clothing in front of anyone other than them. This request was met with irritation on the part of Wife 6, who appreciated Western fashions and felt conflicted about trying to simultaneously appease her husband’s bid while satisfying her own tastes: “Sometimes, he wants me to change my clothes and that pisses me off….sometimes I will cancel going out.” In other cases, however, wives whose husbands expressed an affinity for Western dress expressed concern that their husbands would not support their decision to wear traditional dress for selected occasions, such as cultural events or celebrations: “My husband would make fun of me if I wore traditional dress” (Wife 15). Here, then, wives found themselves balancing their wish to heed cultural conventions for wearing traditional dress, which they held dear, and their desire to secure a validating response toward the self from their husbands (cf., Stone, 1962), which resulted in a measure of ambivalence. Interestingly, in one case, a couple (#5) who had initially disagreed about the wife’s private sphere dress – with the husband preferring traditional/modest dress and the wife preferring sparser, Western dress – came, over the years, to align their views on the matter, with the wife eventually mirroring her husband’s partiality for more modest styles. In the spirit of Oh’s and Damhorst’s (2009) work, then, Wife 5 gradually developed an “accumulated understanding” of her husband’s perspective, which in turn, seemingly came to shape her construction of the selfthrough dress (p. 43).
“His place” and “her place” in shaping private sphere dress decisions
As noted, symbolic interaction theory emphasizes the ways in which meanings arise through interactions. In turn, these interactions may contribute to a common or shared perspective that is developed over a period of time within a given cultural context (Charon, 1998; Heilman, 1976). In the present study, a shared understanding was observed across participant accounts with respect to the roles expected of husbands and wives on matters related to wives’ private sphere dress practices. Here, we conceptualize these expectations for behaviour – or these “prescribed roles” (Giddens, Duneier, Appelbaum, & Carr, 2009) – in terms of “his place” and “her place” within the context of Saudi marriage.

Tawfiq & Paff Ogle: Saudi women’s private sphere dress IJHE Vol 6 No 2 2013
313
Both husbands and wives addressed several components of “his place.” All participants, including wives who worked outside of the home, discussed the importance of the husband in providing funding for his wife’s wardrobe. This expectation was linked to Islamic teachings imploring the husband to provide for all household needs as well as to cultural beliefs about the wife’s appearance as a reflection of her husband’s character (e.g., religious values, social class) (Al-Munajjed, 1997). In some instances, participants also expressed that purchasing of clothing for one’s wife embodied an expression of affection.
Other aspects of “his place” revolved around the husband’s provision of guidance to the wife about her private sphere dress. For instance, in the early days of their marriages, many husbands established parameters of acceptability for their wives’ private sphere dress, particularly relative to the issue of modesty. Violating established norms of acceptability resulted in challenges to the wives’ self-presentations (Stone, 1962) from the husbands:
My rules regarding clothing originated long ago – since we got married…I don’t care about anything except for modesty…if she picks something short and revealing, then I will interfere, because she has broken our agreement. (Husband 6)
In other cases, husbands provided more “gentle” or flexible advice or opinions on (i.e., reviews of) their wives’ private sphere dress selections. Implicit in much of the dialogue surrounding the provision of advice about dress was a desire on the part of husbands to give their wives “space” to make their own dress decisions. Sometimes, advice offered to this end was solicited by wives, and in other cases, it was offered without invitation:
She has the complete freedom to choose what she wants to wear, and I only give her my opinion if she asks me to. (Husband 12)
From the day [a couple] gets married, her husband is her guardian angel, and he is responsible to take care of her. Her dress is part of her, so it is part of his responsibility to advise her as to what is appropriate. (Wife 5)
Interestingly, a handful of husbands regarded themselves as poor authorities on the topic of women’s dress and opted not to provide guidance to their wives on such matters. In some cases, these impressions of maladroitness seemingly were shaped by the husbands’ literal separation from the female sphere: “I have no idea about the “other side” of these occasions.
I can’t really judge the dress and say what’s appropriate or not. She knows more than me because, you know, in Saudi Arabia we keep the genders segregated. (Husband 10)
Some wives agreed that husbands should have little, if any, “say” with respect to wives’ dress decisions for anything other than intimate situations, noting that it was not a husband’s “right,” nor was it “appropriate” for a husband to think that he could “control” a woman’s dress. When husbands of these women offered reviews of their dress, the wives sometimes

Tawfiq & Paff Ogle: Saudi women’s private sphere dress IJHE Vol 6 No 2 2013
314
disregarded them, particularly when these reviews did not validate their chosen presentations of self (Stone, 1962):
For in front of other people, if he thinks [a certain outfit] is nice, then “Thanks!” If he doesn’t, then it is not his business…I say, “Thank you for giving your opinion, but I think I am going to wear it, anyway.” (Wife 2)
The primary component of “her place” – the Islamic obligation of a wife to groom herself for her husband’s enjoyment – was addressed at length within both the wives’ and the husbands’ accounts of the wives’ dress for intimate situations. Central to discussions about “her place” was the assumption that “the wife’s beauty and body are for her husband to enjoy and not for the others” (Husband 5). Husbands emphasized that, for intimate moments shared between husbands and wives, wives should “look their best” (Husband 6) and dress to satiate their husbands’ emotional and sexual desires through the wearing of clothing that husbands found appealing (e.g., lingerie, revealing clothing/Western clothing). Wives also found enjoyment in dressing to please their husbands, noting how the attention gleaned from satisfying their husbands’ eyes filled them with a sense of pride in fulfilling their womanly roles. Some women even described special appearance rituals (e.g., applying make-up, changing their clothes) they performed before their husbands awoke in the morning or returned home from work, ensuring that they stayed the prize of their husbands’ eyes.
Many wives also characterized submission to their husbands’ guidelines for dress as a key component of “her place” in dress: “Submission to your husband is mandatory in the Islamic law,” stated Wife 5, the strongest advocate for unquestioning obedience of one’s husband. In some cases, wives deferred to their husbands’ preferences for dress not only as a means by which to appease their husbands’ aesthetic preferences, but also as a way to express their affection for their husbands and to seek their husbands’ approval: “If he ever rejects something I wouldn’t wear it... I love him and I want him to be happy about what I am wearing even if I am out of the home” (Wife 7). As noted above, however, not all wives routinely acquiesced to their husbands’ preferences for how they presented themselves within the private sphere.
Finally, in articulating the various components of “her place” in dress, several wives spoke about a desire to use their private sphere dress to announce to others certain aspects of their identities (cf., Stone, 1962). For instance, in varying contexts, participants emphasized the value of traditional and/or Western private sphere dress to communicate to others that they were modest, fashionable, unique, authentic, or affluent.
Forging the private sphere self through lived interaction
As noted, Oh and Damhorst (2009) found that married, American couples relied on one another to inform their self-images. In a similar vein, for the Saudi wives in our sample, forging the private sphere self through dress was a task accomplished in conjunction with their husbands. As we discuss, both imagined and “real” or “lived” social feedback (i.e., reviews) from husbands was central in how Saudi wives came to construct their private sphere selves through dress.

Tawfiq & Paff Ogle: Saudi women’s private sphere dress IJHE Vol 6 No 2 2013
315
Central to the interactionist perspective is the assumption that people come to see themselves as others see them as a consequence of role-taking (Mead, 1934), or by imagining how others regard them. In turn, these reflected appraisals come to shape self-feelings and to guide lines of behaviour (Cooley, 1902). For the wives in the sample, reflected appraisals about husbands’ potential responses to various presentations of the self were frequently invoked in the contemplation of clothing choices and shopping decisions: “The only reason I was a little hesitant to buy this outfit is because I wasn’t sure if my husband was going to like it” (Wife 2). The accounts from the couples who had been married for an especially long time revealed that, over the years, the wives in these pairs became increasingly adept at taking the roles of their husbands, such that they developed a rather keen understanding of their husbands’ perspectives on their dress. This notion of gradually building an “accumulated understanding” of one’s significant other over the years (cf., Oh & Damhorst, 2009, p. 43) isaptly reflected in the following quote from Wife 5, who took pleasure in dressing in accord with her husband’s preferences:
We have been together for more than thirty years. We are the same. There is no way I would be able to choose something that he doesn’t like. We are of one mind.” (Wife 5)
Wives also spoke about the essential role of positive and negative reviews from their husbands in shaping their presentation of self in the private sphere: “If he tells me something is nice or looks good on me, I would be extremely happy. My husband is the only person that [sic] could make me like or hate a dress” (Wife 1). Thus, as Wife 1’s remark reflects, reviews from husbands frequently were valued and were used to inform lines of action regarding presentations of the self (Stone, 1962) (e.g., whether or not to wear a certain item of dress). Also reflected in Wife 1’s comment is the close association of positive reviews with increased self-esteem and satisfaction. Even wives who regarded their husbands’ influence upon their dress as limited still valued and appreciated positive reviews. One such woman, Wife 15, remarked, “All the wives would be very happy if they had nice comments from their husbands. It just completes me in my womanhood.” Interestingly, the accounts of several husbands suggested that they were aware of the validating effects of positive reviews upon their wives and sought to praise their wives’ dress, not only for the sake of asserting their opinion on their wives’ appearances, but also to “help [my wife] to be satisfied” (Husband 14).
In contrast to positive reviews, negative reviews challenged wives’ selves, decreasing their self-confidence and sometimes inducing confusion about their future self-presentations. In this vein, Wife 2 spoke about the trickiness in trying to decide how to present her self in a manner that allowed her to balance her own opinion and her husbands’ evaluations of her self-presentations:
I could have had a dress I really liked, but then I changed my mind when my husband told me he didn’t really like it – that caused a lot of problems for me in the first year of my marriage…it really bothered me and broke me…my self-confidence was weak…(Wife 2).

Tawfiq & Paff Ogle: Saudi women’s private sphere dress IJHE Vol 6 No 2 2013
316
As was the case with positive reviews, husbands were cognizant of the impact of negative reviews upon their wives. In the spirit of Goffman’s (1967) conceptualization of deferential avoidance, selected husbands took “…verbal care…so as to not bring into discussion matters that might be painful, embarrassing, or humiliating” to their wives (p. 65), sometimes using humour to address the topic of appearance and sometimes avoiding the topic of their wives’ appearances altogether. Although well-intended, this “silence” on the part of husbands was not always met with appreciation by the wives, who yearned for feedback from their husbands upon their appearances, which they relied upon as they constructed their private sphere selves:
I don’t like it when men are silent and don’t comment on anything. He must talk about his wife’s dress so the wife knows what he likes and what he doesn’t like, so she can take his tastes into account when shopping. (Wife 7)
Conclusions
Findings extend prior work based upon Western samples suggesting that husbands may exert a shaping influence upon how wives make sense of their appearances (Oh & Damhorst, 2009; Pole, Crowther, & Schell, 2004) by examining if and how this influence may play out within a very different cultural context: the private sphere of Saudi Arabia. In a myriad of ways, findings provided ample support for the interactionist premise that the self is “something of collaborative manufacture” (Goffman, 1959, p. 253). That is, the data were replete with accounts of Saudi wives invoking their husbands as “looking glasses” (Cooley, 1902) to tell them “who to be” and “how to dress” within the context of the private sphere. Thus, as wives contemplated whether to choose traditional or Western dress or how to appear for certain occasions, they frequently reflected upon imagined and “real” appraisals from their husbands as they planned their lines of behaviour.
Some wives spoke to their tendency to privilege their husbands’ preferences for their dress over their own, reflecting the Islamic tradition of wifely submission to one’s husband (Bullock, 2003; Syed, 2004). Such examples within the data provide evidence that within contemporary Saudi culture, conventional notions about the role of the husband in guarding –and in guiding – his wife’s identity (here, as manifested through dress) certainly do persist (see Maki, 2004). At the same time, however, findings revealed that participants varied in how they conceptualized the husband’s place in forging the wives’ private sphere dress decisions. For instance, some wives and husbands agreed that husbands should have relatively little “say” in what wives wore within the private sphere, and some wives occasionally disregarded their husbands’ appraisals of their dress (or felt ambivalent about them), lending support for the notion that symbolic interaction is an active theory of the self (Kaiser, 1997) and for Stone’s (1962) premise that not all reviews are valued equally. Thus, in some contexts, a new era may be dawning in which the wives make dress decisions more independently of their husbands, which mirrors observations by Arabic scholars that in recent years, Saudi women have begun to question their husbands’ authority to make unilateral decisions within the family unit (Al-Jehani, 2005; Maki, 2004).
The instances in which husbands and wives disagreed with respect to the presentation of the wife’s appearance within the private sphere – the only context where it was acceptable for a

Tawfiq & Paff Ogle: Saudi women’s private sphere dress IJHE Vol 6 No 2 2013
317
Saudi woman to create her own identity through dress (Rabolt & Forney, 1989) – seemed to incite a measure of ambivalence for some wives. At the core of this ambivalence were several struggles that seemed to embody larger conflicts that are being played out within the broader cultural context of Saudi Arabia: (a) choosing between more traditional and more contemporary (i.e., Western)/less modest self-presentations and (b) deciding whether to honour one’s husband or to listen to one’s own voice (see Zuhur, 2005). The challenge for home economics professionals (e.g., clothing designers, marriage and family therapists, family specialists) within Saudi Arabia lies in helping Saudi women to navigate these tensions within the evolving Saudi cultural context.
This study was limited in that the sample contained a fairly homogeneous group with respect to class. Additionally, only three of the wives held jobs outside of the home. Thus, in future work, it would be valuable to explore the experiences of participants from Saudi Arabia’s elite or lower classes to secure differing views on the importance of dressing to meet social standards. Including more women who are employed also may yield new insights regarding how wives and husbands negotiate meanings about wives’ private sphere dress presentations. Of interest in such a study would be if and how the greater freedoms these women might access at work would shape their private sphere dress practices and their roles within their marriages. Finally, it would be interesting to extend the present work to include a longitudinal component such that one could explore how interactions about private sphere dress may change over time as the marital relationship and its partners mature.
Acknowledgements
The authors would like to acknowledge Dr. Mohammed Hirchi, Colorado State University Department of Foreign Languages and Literatures, for his assistance with translation of the transcripts from Arabic to English.
Biography
Ms Wijdan Tawfiq is a graduate student in the Department of Design and Merchandising at Colorado State University, Fort Collins, CO. Her teaching and research interests focus upon the social and psychological aspects of dress and appearance as well as apparel merchandising. Upon the completion of her graduate education, she will assume a faculty position at King Abdulaziz University in Saudi Arabia.
Dr Jennifer Paff Ogle is a Professor of Design & Merchandising and a Faculty Affiliate and Board Member of the Center for Women Studies and Gender Research at Colorado State University, Fort Collins, CO. Her research interests include the body, appearance, and self in socio-cultural context and socially responsible alternatives in the textiles and apparel industry, particularly as related to advertising and promotion. She is active in the International Textiles and Apparel Association and in Educators for Socially Responsible Apparel Business.

Tawfiq & Paff Ogle: Saudi women’s private sphere dress IJHE Vol 6 No 2 2013
318
References
Al-Bassam, L., & Sudqi, M. (1999). [A comparison of traditional clothing: Bedouins in Egypt and Saudi Arabia]. Saudi Arabia, Jeddah: King Abdul Aziz University.
Al-Dabbagh, M. A. (2006, April). The demand and availability of Islamic women's apparel in the Saudi market. Paper presented at the ninth Conference on Helwan University for Home Economics, Cairo, Egypt.
Al-Jehani, A. H. (2005). [Matrimonial disputes in Saudi society from the viewpoint of wives associated
with Social Counseling Units] (Master’s thesis). Retrieved from http://ksu.edu.sa/sites/KSUArabic/Research/ncys/Documents/r319.pdf
Al-Munajjed, M. (1997). Women in Saudi Arabia today. New York: St. Martin's Press.
Bullock, K. (2003). Rethinking Muslim women and the veil: Challenging historical and modern stereotypes. London: The International Institute of Islamic Thought.
Charon, J. M. (1998). Symbolic interactionism: An introduction, an interpretation, an integration (6th ed.). Upper Saddle River, N.J.: Prentice Hall.
Cooley, C. H. (1902). Human nature and the social order. New York, NY: Charles Scribner's Sons.
Doumato, E. (1992). Gender, monarchy, and national identity in Saudi Arabia. British Journal of Middle Eastern Studies, 19(1), 31-47.
Fertile-Bishop, S., & Gilliam, M. (1981). In view of the veil: psychology of clothing in Saudi Arabia. Journal of Home Economics, 73(4), 24-26.
Giddens, A., Duneier, M., Appelbaum, R., & Carr, D. (2009). Introduction to sociology (7th
ed.). New York, NY: W. W. Norton & Company.
Goffman, E. (1959). The presentation of self in everyday life. Garden City, NY: Doubleday Anchor Books.
Goffman, E. (1967). Interaction ritual. New York, NY: Pantheon Books.
Heilman, S. C. (1976). Synagogue life: A study in symbolic interaction. Chicago, IL: University of Chicago Press.
Iskandarani, B. (2006). [Traditional clothes for women and bridal dresses in Medina] . Saudi Arabia, Jeddah: Khwarezm.
Kaiser, S. B. (1997). The social psychology of clothing (2nd ed. rev.). New York, NY: Fairchild.
Kennett, F. (1995). Ethnic dress. New York, NY: Facts on File.
Le Renard, A. (2008). “Only for women:” Women, the state, and reform in Saudi Arabia. Middle East Journal, 62(4), 610-629. doi: 10.3751.62.4.13.

Tawfiq & Paff Ogle: Saudi women’s private sphere dress IJHE Vol 6 No 2 2013
319
Long, D. E. (2005). Culture and customs of Saudi Arabia. Westport, Conn.: Greenwood Press.
Maki, Y. (2004, 4) [Social reality of Saudi women: The concerns and problems to be resolved]. Paper presented at the third meeting for the national dialogue, Saudi Arabia.
Mead, G. H. (1934). Mind, self, and society. Chicago: The University of Chicago Press.
Oh, K., & Damhorst, M. (2009). Coorientation of body image among older married couples. Body Image, 6(1), 43-47.
Pharaon, N. A. (2004). Saudi women and the Muslim state in the twenty-first century. Sex Roles Research Journal, 51(5), 349-366. doi: 10.1023/B:SERS.0000046618.62910.ef
Pole, M., Crowther, J. H., & Schell, J. (2004). Body dissatisfaction in married women: The role of spousal influence and marital communication patterns. Body Image, 1(3), 267-278.
Rabolt, N.J., & Forney, J.C. (1989). Contemporary Saudi Arabian women’s dress. Clothing and Textiles Research Journal, 7(3), 22-32.
Stone, G. P. (1962). Appearance and the self. In A. M. Rose (Ed.), Human Behaviour and the Social Processes: An Interactionist Approach (pp. 86-116). New York: Houghton Mifflin.
Strauss, A., & Corbin, J. (1998). Basics of qualitative research: Grounded theory procedures and techniques. Newbury Park, CA: Sage.
Syed, A. M. (2004). The position of women in Islam: a progressive view. Albany: State University of New York Press.
Yamani, M. (2004). Cradle of Islam: the Hijaz and the quest for an Arabian identity. London: I.B. Tauris.
Zuhur, S. (2005). Singing a new song: Bonding and breaking with the past. In F. Nouraie-Simone (Ed.), On shifting ground: Muslim women in the global era (pp.36-60). New York: Feminist Press at the City University of New York.

International Journal of Home Economics
320
Chinese and US Teenage Tobacco Consumptionand Quality of Life
Baomei Zhao*, Sijia Wang†, Richard Glotzer* & Jessica A. Robb*
*University of Akron, USA; †Kent State University, USA
Abstract
By 2030 tobacco use will be the single largest cause of death worldwide, accounting for about 100 million deaths per year. More than half of those accounting for this morbidity are now children and teenagers. This research applies Family Systems Theory to investigate teenagers’ individual, family and school/community environments in China and the United States (US) regarding tobacco consumption and perception of Quality of Life. Data were collected in ten middle/high schools in China and 5 middle/high schools in the US between 2007 and 2008. Factors promoting the undesirable smoking habit were identified. The research findings showed that gender, age of first trial of tobacco, frequency of tobacco use in the past 30 days, whether parents smoke, and family annual income, are indicators of quality of life. There were gender differences among teenagers regarding tobacco consumption. Whether or not parents smoke also impacts the teenagers’ attitudes towards smoking behaviour. This research contributes to the smoking prevention programs that target teenagers in China, the US, Australia, and other countries, and will promote policy enforcement and public health internationally.
Literature review
Approximately 1.1 billion people smoke worldwide, and in China, over 30% of the population are smokers. This represents more than 350 million people in China (Zhang, 2010) andaccounts for nearly one-third of the smokers in the world. Currently, cigarette consumption in China is as high as it was in the United States in 1950, when per capita consumption levels were reaching their peak. At that stage of the United States (US) epidemic, tobacco was responsible for 12 percent of the nation’s middle aged deaths. Today, in a striking echo of the US experience, tobacco is estimated to be responsible for about 12 percent of male middle-aged deaths in China. Researchers expect that within a few decades, if the smoking pattern does not change dramatically, the proportion in China will raise to about one in three, as it did in the US.
The serious situation in China is evidenced by the following statistics:
1. A 2009 survey in China revealed that only 37% of smokers knew that smoking causes coronary heart disease and only 17% knew that it causes stroke (World HealthOrganization [WHO]). There is also a gender difference; smokers accounted for 71% of the male population and 29% of female population respectively.

Zhao et al: Teenager consumption of tobacco IJHE Vol 6 No 2 2013
321
2. Many smokers started in adolescence or early adulthood when one is not fully ready to make the right decisions. A tradition in China is to use tobacco as a social instrument to start business conversations. Most new recruits and potential smokers start smoking by getting free cigarettes at social occasions; Huang, et al. (2012) report the average smoker receives five gifts of cigarettes yearly. New smokers underestimate the future costs of smoking, that is, the costs of being unable to stop smoking and harming their own health in later life. Their smoking also impacts the health of family members and the whole society.
3. Tobacco has already been shown to be a burden on family financial life among households (Zhao, Schulze & Wang, 2007).
4. Since China entered the WTO (World Trade Organization [WTO]) in 2001, new foreign products are available and encourage smoking international brands such as State Express 555 (the leading international brand in China), Benson & Hedges, Lucky Strike, Kent, Horizon, Hilton, Airdate and Commodore are available for all smokers and prospective smokers (Shanghai Daily, Jan. 7, 2002).
5. Most convenience stores selling cigarettes are open to all ages with no restriction on young ages. This makes it easy for the young to access tobacco (Zhao, Schulze & Wang, 2007).
6. Gao, Li, Chan, Lau, & Griffiths (2013) suggested that a risk factor for smoking among adolescents in China is maternal migration to employment; they indicate that addressing self-efficacy in adolescents may prevent smoking. Furthermore, student tobacco experimentation is associated with peer/friend smoking, parental smoking (one or both parents), inadequate smoking control at school, a high level of personal acceptance of tobacco usage, and higher levels of tobacco exposure in the media (Cai, et al., 2012).
In addition to the impact on the health of smokers, it is well established that people who donot smoke also suffer as the result of second-hand smoke exposure, especially children, who suffer from stilted physical development, impaired cognitive abilities, and lower academic achievement. Children who grow up exposed to smoking are also more likely to take up the habit themselves when they reach adolescence (Womach, 2003).
As shown above, there has been some research regarding differences in tobacco consumption as a factor of gender, age, education, occupation and income. In addition, there have been some investigations of the impact of government taxes on tobacco products and tobacco promotion restrictions. However, there have been not enough studies designed with regard to the perception of quality of life and smoking among adolescents.
Theorists generally agree that the quality of life concept in a Family Systems context refers to the overall effect of all the environmental and socioeconomic conditions of a given time and/or place in terms of the effect on human well-being (Campbell, 1981). There is less

Zhao et al: Teenager consumption of tobacco IJHE Vol 6 No 2 2013
322
agreement about which factors promote higher quality of life since Andrews’ & Withey’s original research was conducted in 1976.
Perception of quality of life is a subjective and a comparative notion, it is contingent on the social science field of interest and the specific focus of research. Proshansky and Fabian (1996) have suggested that a better understanding of perception of quality of life will be obtained from research questions that are more specific in their focus. For example, the research question is “What kind of quality, for what kinds of people, and in what kinds of places?” From the literature, there are at least two basic approaches to the measurement of quality of life in adolescence.
Health–related quality of life assesses some aspect of health status, using functional scales, symptom check lists, and measures of psychological or psychiatric problems, such as gender, age, sleeping hours, behavioural symptoms, before/after treatment medical indexes or observations, and patient self-reports.
Conceptual models, or theories, of quality of life: here quality of life is viewed as an emotional response to circumstances, the match between expectation and reality, the ability to meet his or her needs and an individual cognitive approach. The so-called “needs model” posits that quality of life is at its best when all, or most, of a person’s needs are met and gets progressively worse as fewer needs are met (Hunt, 1979).
The two basic research questions are developed based on the previous studies: (1) What is the overall perception of quality of life among teenagers? (2) What is the relationship among elements of the three perspectives of personal, family, and school/community on perceptions of quality of life regarding tobacco consumption within the teenager populations?
This research used the Family Systems model to combine these two topics together and lead a testimony research on quality of life and tobacco consumption among China and US teenagers (see Figure 1).
Figure 1 Simplified Model of Family System

Zhao et al: Teenager consumption of tobacco IJHE Vol 6 No 2 2013
323
Methodology
Objectives
The goal of this study was to research teenagers’ perceptions of Quality of Life and their attitudes toward tobacco consumption in China and in the US with two specific research objectives:
1. To find out the current tobacco consumption situation among middle /high school students and their exposure the second hand smoke at home or school environment in China and the US; and
2. to determine the relationship among demographic variables associated with teenager smoking in China and the US, such as perception of quality of life, individual view on smoking on gender differences, adolescent saving, parents’ tobacco consumption patterns, family members’ willingness to participate in anti-tobacco community activities, and school/community attitudes with tobacco consumption.
Methods
Various factors associated with teenager smoking are not independent and can be investigated with regard to Family Systems Theory (Rodney, 1995). The researchers adapted the sample questionnaires from International Anti-tobacco Research Institute and the Ohio Commission on Minority Heath, and were translated into Chinese for use. Data were collected from ten middle and high schools of urban and rural areas in five middle/high schools in Zhejiang Province and Jiangsu Province, China. The data collection started in May, 2007 and finished by May, 2008. Four hundred and seventy-two middle/ high school students participated in the survey in China, and 573 middle/ high school students participated in the survey in the US.
Data
China data
The total sample of 472 middle and high school students participated in the survey, aged from 13 to 20, with 218 females and 254 males (see Table 1).
Table 1- Student Questionnaire and Statistic (N=1041)
Questions Response China US
F-qncy Valid Percent
F-qncy Valid Percent
How do you feel your life in general?
Worst 22 4.7 28 4.9
Average 110 23.3 164 28.6
Better than average /Very good 340 72.0 381 66.5
How old are you? 15 or younger 107 22.7 533 93.0
16-17 213 45.1 26 4.5
18 or older 152 32.2 1 .2

Zhao et al: Teenager consumption of tobacco IJHE Vol 6 No 2 2013
324
Questions Response China US
F-qncy Valid Percent
F-qncy Valid Percent
Gender Female 218 46.2 307 52.9
Male 254 53.8 266 46.4
How old were you when you first tried a cigarette?
10 years old or younger 18 3.8 76 13.3
Between 11-15 years old 22 4.7 79 13.8
Between 16- 20 years old 18 3.8 4 .7
Never 414 87.7 411 71.7
During past 30 days, how often do you smoke?
Once or twice 11 2.3 31 5.4
Three to nine times 4 .8 14 2.4
Ten times or more 5 1.1 30 5.2
Never 452 95.8 497 86.7
Did your parents smoke?
None 7 1.5 146 25.5
Both 277 58.7 202 35.3
Father Only 7 1.5 106 18.5
Mother Only 5 1.1 89 15.5
I don’t know 176 37.3 28 4.9
Do you think cigarettes are harmful to your health?
Definitely/probably NOT 38 8.1 25 4.4
Probably /definitely YES 434 91.9 548 95.6
Do you think Second hand smoke is harmful?
Definitely/probably NOT 27 5.7 36 6.3
Probably /definitely YES 445 94.3 537 93.7
What do you think of a man smoking?
No response 19 4.0 34 5.9
Lack of confidence 81 17.2 174 30.4
Stupid 177 37.5 227 39.6
Loser 123 26.1 96 16.8
Successful or intelligent 17 3.6 21 3.6
Macho 55 11.7 21 3.7
What do you think of a woman smoking?
No response 10 2.1 41 7.2
Lack of confidence 43 9.1 177 30.9
Stupid 195 41.3 234 40.8
Loser 98 20.8 83 14.5
Successful or intelligent 15 3.2 22 3.9
Sophisticated 111 23.5 16 2.8
Are you in favor of banning?
No 56 11.9 169 29.5
Yes 416 88.1 385 67.2
During past 30 days, how many anti smoking media you have seen?
None 110 23.3 65 11.3
A few 282 59.7 238 41.5
A lot 80 16.9 253 44.2
During this school year, were you taught in your classes about the dangers of smoking?
No 187 39.6 153 26.7
Not sure 89 18.9 108 18.8
Yes 195 41.3 296 51.7
Do you get allowance No 179 37.9 0 0

Zhao et al: Teenager consumption of tobacco IJHE Vol 6 No 2 2013
325
Questions Response China US
F-qncy Valid Percent
F-qncy Valid Percent
from your parents every month?
Yes 293 62.1 573 100
Do you work outside home to get paid?
No 456 96.6 0 0
Yes 16 3.4 573 100
Do you have your own saving account?
No 193 40.9 0 0
Yes 279 59.1 573 100
What is your family total annual income?
20,000 or below 70 14.8 73 12.7
20,001-40,000 97 20.6 60 10.5
40,001-80,000 110 23.3 67 11.7
80,001-100,000 76 16.1 42 7.3
100,001-above 119 25.2 71 12.4
In general, respondents expressed better than average or very good when asked how they feel about their life in general, accounting for 340 students or 72% of total responses. One hundred ten students expressed feeling average about their life in general (23.3%); 22 students felt worst about their life in general (4.7%).
When asked, how old were you when you tried your first cigarette? 414 students (87.7%) had never tried a cigarette. For the participants who had tried cigarettes, most students werebetween the ages of 11 and 15 (N=22) at the time. Thirty-six participants reported being 10 years old or younger (N = 18, 3.8%) or between the ages of 16 and 20 years old (N = 18, 3.8%) at the time of their first cigarette. Participants were further asked to report on how often they have smoked in the past 30 days. Considering that the majority of students have never smoked and some may only have tried a cigarette, 95.8% of respondents (N = 452) did not smoke at all in the past 30 days. Of the respondents who did smoke in the past 30 days, eleven (2.3%) reported that they smoked only once or twice, four (.8%) reported smoking three to nine times, and five (1.1%) reported smoking ten times or more in the past 30 days. Participants were also asked if their parents smoked; 277 (58.7%) reported both parents smoked, 176 (37.3%) reported they did not know, and those who reported that either none, father only, or mother only smoked represented 4% of the population.
Participants were asked their viewpoints on smoking. When asked, do you think cigarettes are harmful to your health? and do you think second hand smoke is harmful? over 90% of the students (N = 434, 91.9%; N = 445, 94.3%) reported yes. When asked, what do you think of a man smoking? there were positive, negative and neutral responses. 3.6% of students (N = 17) reported positive descriptions of male smokers, describing it as successful or intelligent.80.8% reported negative descriptions of male smokers, describing it as stupid (N = 177, 37.5%), loser (N = 123, 26.1%), and lack of confidence (N = 81, 17.2%). 11.7% (N = 55) described it as macho, a neutral descriptor. 4% (N = 19) of students did not reply. When asked, what do you think of a woman smoking? there were positive, negative and neutral responses. Fifteen students (3.2%) reported positive descriptions of successful or intelligentand 111 students (23.5%) reported sophisticated, a neutral descriptor. 71.2% of students

Zhao et al: Teenager consumption of tobacco IJHE Vol 6 No 2 2013
326
reported negative descriptions of female smokers, describing it as stupid (N = 195, 41.3%), loser (N = 98, 20.8%), and lack of confidence (N = 43, 9.1%). 2.1% (N = 10) of students did not respond.
The assessment included questions on smoking in the media. When asked, Are you in favor of banning tobacco? 88.1% (N=416) reported yes while 11.9% (N = 56) were not in favor of banning. When asked, during the past 30 days, how many anti-smoking media have you seen?76.6% of students have seen anti-smoking media; 59.7% (N = 282) reported seeing a few and 6.9% (N = 80) reported seeing a lot. 23.3% (N = 110) of students reported not seeing any anti-smoking media. When asked, during this school year, were you taught in your classes about the dangers of smoking? 41.3% (N = 195) reported affirmatively while 58.5% reported no (N = 187, 39.6%) or not sure (N = 89, 18.9%).
Students were also asked questions about their financial situations. When asked, do you get allowance from your parents every month? 37.9% (N = 179) replied no and 42.2% (N = 199) reported 100 Yuan or less. 9.7% reported 101-300 Yuan, and 10.2% reported 301 Yuan or more. When asked, Do you work outside your home to get paid? 96.6% (N = 456) reported no.Students were also asked, Do you have your own savings account? 40.9% (N = 193) replied no,6.6% (N = 31) reported 100 Yuan or less and 14.6% of participants reported 101-1500 Yuan and37.9% reported 1501 Yuan or more.
Finally students were asked about their family’s total annual income. 14.8% (N=70) students reported their family annual income to be 20,000 Yuan or below, 20.6% (N=97) reported their annual income to be between 20,001—40,000 Yuan, 23.3% (N=110) reported their annual income to be between 40,001 - 80,000 Yuan, 16.1% (N =76) reported their annual income to be between 80,001-100,000 Yuan, and 25.2% (N=119) reported their annual income to be over 100,001 Yuan.
US data
The total sample of 573 middle and high school students participated in the survey, aged from 12 to 21, with 307 females and 266 males (See Table 1). In general, respondents expressed better than average or very good when asked how they feel about their life in general, accounting for 372 students or 64.9% of total responses. One hundred sixty-one students expressed feeling average about their life in general (28.1%); 28 students felt worst about their life in general (4.9%).
When asked, how old were you when you tried your first cigarette? 411 students (71.7%) had never tried a cigarette. For the participants who had tried cigarettes, most students werebetween the ages of 11 and 15 (N=79) at the time. Seventy-six participants reported being 10 years old or younger (13.3%) and four reported being between the ages of 16 and 20 years old (.7%) at the time of their first cigarette. Participants were further asked to report on how often they have smoked in the past 30 days. Considering that the majority of students have never smoked, 86.7% of respondents (N = 497) did not smoke at all in the past 30 days. Of the respondents who did smoke in the past 30 days, thirty-one (5.4%) reported that they smoked only once or twice, fourteen (2.4%) reported smoking three to nine times, and thirty (5.2%) reported smoking ten times or more in the past 30 days. Participants were also asked if their

Zhao et al: Teenager consumption of tobacco IJHE Vol 6 No 2 2013
327
parents smoked; 202 (35.3%) reported that both parents smoked, 146 (25.5%) reported none, 106 (18.5%) reported their father only, 89 (15.5%) reported their mother only, and 28 (4.9%) reported I don’t know.
Participants were asked their viewpoints on smoking. When asked, do you think cigarettes are harmful to your health? and do you think second hand smoke is harmful? over 95% of the students (N = 548, 95.6%; N = 537, 93.7%) reported definitely/probably yes. When asked, what do you think of a man smoking? there were positive, negative and neutral responses. 3.6% of students (N = 21) reported positive descriptions of male smokers, describing it as successful or intelligent. 86.8% reported negative descriptions of male smokers, describing it as stupid (N = 227, 39.6%), lack of confidence (N = 174, 30.4%), and loser (N = 96, 16.8%). 3.7% (N = 21) described it as macho, a neutral descriptor. 5.9% (N = 34) of students did not reply. When asked, what do you think of a woman smoking? there were positive, negative and neutral responses. Twenty-two students (3.9%) reported positive descriptions of successful or intelligent and sixteen students (2.8%) reported, sophisticated, a neutral descriptor. 86.2% of students reported negative descriptions of female smokers, describing it as stupid (N = 234, 40.8%), lack of confidence (N = 177, 30.9%) and loser (N = 83, 14.5%). 7.2% (N = 41) of students did not respond.
The assessment included questions on smoking in the media. When asked, are you in favor of banning tobacco? 67.2% (N=385) reported affirmatively while 29.5% (N = 169) were not in favour of banning. When asked, during the past 30 days, how many anti-smoking media have you seen? 85.7% of students have seen anti-smoking media; 44.2% (N = 253) reported seeing a lot and 41.5% (N = 238) reported seeing a few. 11.3% (N = 65) of students reported not seeing any anti-smoking media. When asked, during this school year, were you taught in your classes about the dangers of smoking? 51.7% (N = 296) reported affirmatively while 45.5% reported negatively (N = 153, 26.7%) or were not sure (N = 108, 18.8%).
Students were also asked questions about their financial situations. When asked, do you get allowance from your parents every month? 100% participants (N = 573) reported affirmatively. When asked, do you work outside your home to get paid? 100% participants (N = 573) reported affirmatively. Students were also asked, Do you have your own savings account? 100% participants (N = 573) reported affirmatively. Finally students were asked about their family’s total annual income. Most students did not reply (N = 259, 45.2%). Those that did reply mostly reported their annual income to be $20,000-below (N = 73, 12.7%), $20,001-40000 (N = 60, 10.5%). $40,001-80000 (N = 67, 11.7%), $80,001-100,000 (N = 42, 7.3%), and $100,001 or above (N = 71, 12.4%).
Analyses
SPSS software was used to run a multinomial regression. The student data were analysed with perception of life as the dependant variable and 16 independent variables. Results of the study are reported using likelihood ratio tests, and a multinomial regression of the model. The Nagelkerke value of Pseudo R-Square of the model was reported and reflected the goodness of fit of the models to the data.

Zhao et al: Teenager consumption of tobacco IJHE Vol 6 No 2 2013
328
In addition, gender analyses and whether a parent smoked were also analysed regarding teenager’s attitudes of smoking.
Findings
This data set showed an absolute majority of the teenagers felt satisfactory about their life in general for both countries (See Table 1).
The likelihood ratio tests of the multinomial regression showed that four of the independent variables were statistically significant at the level of .05 (see Table 2). These variables included: the age of first trial of tobacco, whether parents smoke, presence of any anti-smoking media during past 30 days, and whether being taught of the dangers of smoke in school classes. These are the factors that may impact the perception of quality of life among this population.
Table 2 Likelihood Ratio Tests (N=1041)
Effect -2 Log Likelihood of
Reduced Model
Chi-Square df Sig.
How old were you when you first tried a cigarette?
998.36 14.22 6 *
Did your parents smoke? 101.88 18.78 8 *
During past 30 days, how many anti smoking media you have seen?
997.24 11.13 4 *
During this school year, were you taught in your classes about the dangers of smoking?
106.09 12.91 4 *
Note: The chi-square statistic is the difference in -2 log-likelihoods between the final model and a reduced model. The reduced model is formed by omitting an effect from the final model. The null hypothesis is that all parameters of that effect are 0.
*: significant at the 0.05 level (2-tailed).
Detailed multinomial regression analyses were shown in Table 3: Parameter Estimates in the Model (N = 1041), the Nagelkerke value of this model is .34. The significant variables are gender, age of the first trial of tobacco, times of trial in the past 30 days, whether parents smoke, presence of any anti-smoke media in the past 30 days, and family annual income.
With quality of life being “worst” as the reference category, parameter estimates are reported using regression coefficients, significance, and odds ratio –Exp (B) as Table 2 shows.
1. The odds of being in “average” vs. being “worst” for those females are more than 5 times higher than for those males; those who tried tobacco at 10 or younger are significantly lower than those never tried tobacco; those who tried tobacco 3-9 times in the past 30 days are also significantly lower than those never tried tobacco; those who have seen anti-smoke media (a few times) in the past 30 days are about six times higher than those have never seen any anti-smoke media; those with both parent smokers are 100% lower than those with non-smoker parents.

Zhao et al: Teenager consumption of tobacco IJHE Vol 6 No 2 2013
329
2. The odds of being in “better than average or very good” vs. being “worst” for those females are about 5 times higher than for those males; those who tried tobacco 3-9times in the past 30 days are 10 times lower than those who never tried tobacco; those who have seen anti-smoking media (a few times) in the past 30 days are about ten times higher than those have never seen any anti-smoke media; those with an annual income 20,000 or below are slight lower than those with higher income.
Table 3 Parameter Estimates in the Model (N = 1041)
Items Average Better Than Average
Regression coefficient
B
Sig. Odds ratio: Exp (B)
Regression coefficient
B
Sig. Odds ratio: Exp (B)
Gender (F) 1.60 * 5.35 1.63 * 5.1
Age of first trial of tobacco (10 old or younger)
-18.30 *** 92047538.4
Past 30 days tried tobacco (3-9 times)
-19.18 *** 262450425.89
-2.33 ** 10.3
Past 30 days seen anti-smoke media (a few)
1.72 * 6.27 2.33 ** 10.3
Parents smoke (Both) -4.60 * 1.16
Family annual income 20,000 or lower
-2.23 * .11
Note: The reference category is: worst.
***: significant at the 0.001 level (2-tailed).
**: significant at the 0.01 level (2-tailed).
*: significant at the 0.05 level (2-tailed).
Nagelkerke value of this model: .34.
From the above results, we can draw the conclusion that perception of quality of life and tobacco consumption have some correlation with variables such as: gender, age of the first trial of tobacco, current use of tobacco, parental use of tobacco, influence from anti-tobacco media, and family income levels.
The results of the gender differences are shown in Table 4. Five of the variables were statistically significant: males were more likely to try tobacco at a younger age than females. During past 30 days, males were also more likely to smoke than females. Regarding a man smoking, female students were found to have more negative attitude than male students. Regarding a woman smoking, female students were found to have a more neutral attitude than male students. Females reported higher savings mean averages than male students when reporting on owning a personal saving account.

Zhao et al: Teenager consumption of tobacco IJHE Vol 6 No 2 2013
330
Table 4 Results of Gender Differences Analysis (N=1041)
Items Sig. (2-tailed) Gender
How old were you when you first tried a cigarette?*** F
M
During past 30 days, how often do you smoke? ** F
M
What do you think of a man smoking? * F
M
What do you think of a woman smoking? ** F
M
Do you have your own saving account? * F
M
***: significant at the 0.001 level (2-tailed).
**: significant at the 0.01 level (2-tailed).
*: significant at the 0.05 level (2-tailed).
Results of the effect of parental smoking status were shown in Table 5. Teenagers with parent smokers may report slightly lower perceptions of quality of life. Regarding a male smoker or female smoker, teenagers with parent non-smokers may view them in a negative way compared to teenagers with parent smokers who view them in a neutral way.
Table 5 Results of Parent Smoker /Non-smoker Differences Analysis (N=1041)
Items Sig. (2-tailed) Whether parents smoke t
How do you feel your life in general?* No -1.97
Yes -1.91
What do you think of a man smoking?*** No -3.41
Yes -3.75
What do you think of a woman smoking?* No -2.00
Yes -2.07
***: significant at the 0.001 level (2-tailed).
*: significant at the 0.05 level (2-tailed).
This analysis reveals:
1. Perception of quality of life and tobacco consumption correlate on gender among the two populations of the research. Males have a higher possibility of having the first trial of tobacco; the correlations on gender difference can be shown more strongly in the Chinese teenager population with male smokers more acceptable than female smokers. This was not shown in the US data.

Zhao et al: Teenager consumption of tobacco IJHE Vol 6 No 2 2013
331
2. Perception of quality of life and tobacco consumption correlate on the age of the first trial of tobacco, younger age to trial correlated with lower perception of quality of life;
3. Perception of quality of life and tobacco consumption correlate on current use of tobacco among teenagers, those reporting current use of tobacco showed lower perception of quality of life.
4. Perception of quality of life and tobacco consumption correlate on parental use of tobacco and family income levels. If parents smoke, there is a negative correlation with perception of quality of life. Income has positive correlation with perception of quality of life.
5. Perception of quality of life correlate with teenager’s individual savings/ earnings. It is statistically significant that a higher percentage of US teenagers reported having individual saving accounts (no specific amount was reported) or were working to earnmoney in/outside of home than Chinese teenagers.
6. Perception of quality of life correlates with influence from anti-tobacco media. If the school/community environment has a preventive influence on tobacco consumption, it will result in positive influence on teenagers’ perception of quality of life.
7. The findings reflect that Family Systems theory offers a way forward and can predict tobacco consumption for teenagers of different populations (China and US), and may have utility for future prevention programs.
Discussion
This study attempted to link teenager tobacco consumption with their perception of life. Teenagers' individual, family and community factors were considered. The research results expanded the quality of life research and tobacco consumptions.
Over 95% of the teenagers reported not smoking, less than 5% reported smoking. The smoking rate of teenagers decreased 4-9% compared to 1997 report (Wu, 1997). Over 90% of the teenagers recognized the negative health affects of tobacco consumption and second hand smoking; this is a much higher rate compared to 2000 research. These are positive effects of national and community based anti-tobacco consumption policies or programs.
Since gender differences exist, and male parent smokers are the majority, there is a need to help adult males to control tobacco consumption, and help teenagers to follow non-smoking role models. National policies and regulations also need to be enforced. Programs of anti-tobacco consumption could be designed to influence individual behaviour, create healthier family environments, and school/community non-smoking environments. Since tobacco consumption is a behaviour-related issue, prevention programs need input from individuals, families, communities and at the national level (World Health Organization, 2007).

Zhao et al: Teenager consumption of tobacco IJHE Vol 6 No 2 2013
332
Study limitations
The findings of this study were limited by the focus on primarily the population in Zhejiang Province and Jiangsu Province, China and the state of Ohio in the US. As a result, these findings cannot be applied to describe the consumption among the whole teenager populations of China and the US.
Although there are limitations in this study, there are several significant conclusions that can be drawn as reported and the methodology can be applied to future research.
Future Research
Regarding future research, three perspectives are worth considering. (1) Tobacco consumption is a personal behaviour resulting in addiction, it is very important to establish a preventive program for teenagers before their first trial use of tobacco. (2) Perceptions of quality of life are highly associated with environmental policies, rules and regulations. Future research can help prioritize the implementation of public policy and investigate the cause of first tobacco use, helping to eliminate the possibility of tobacco consumption in young populations and improve quality of life for the long run. (3) The importance of empirical data demonstrating the negative impact of tobacco use on the perception of quality of life cannot be underestimated (Zhao el. 2007). This study made some initial inroads. Future studies might use longitudinal research designs, monitoring changes in variables over time. A broader and deeper understanding of the quality of life construct and accompanying behavioural issues, contributes to anti-tobacco programs and the improvement of quality of life.
Biography
Baomei Zhao, PhD, Certified Family Life Educator (USA), got Master degrees from in Economics from Zhejiang University (China) and her PhD from in Family Studies from University of Kentucky (USA). Currently she is an Associate Professor at the School of Social Work, College of Health Professions, University of Akron (Ohio, USA). Her research interests are quality of life improvement and consumer behaviours. She has been a member of American Association of Family and Consumer Sciences and American Council of Consumer Interests for over 10 years, and served as a peer reviewer for several International Journals.
Sijia Wang is currently pursuing Ph.D. in Applied Mathematics at Kent State University (USA). She got Master’s degree in Financial Engineering from Kent State University. Her research interests are applied statistics and financial mathematics.
Richard Glotzer, PhD, holds Bachelor’s (Psychology), master's (Child and Family Studies) and doctoral Degrees (Education) from the University of Wisconsin-Madison, USA. He has focused on international research and has done research in Canada, the U.K. and South Africa. His primary interests are Lifespan Development and Educational Foundations. His articles on Sir Fred Clarke and Home Economics Teacher Training in Ghana (with Professor Lila Engberg) appeared in the Australian Journal Education Research and Perspectives. He is currently a Professor in the School of Social Work at the University of Akron, Ohio, USA, and a Fellow in the University's Institute for Lifespan Development and Aging.

Zhao et al: Teenager consumption of tobacco IJHE Vol 6 No 2 2013
333
Jessica A Robb is a current student in the Masters of Social Work program at the University of Akron (USA). Her research interests include quality of life improvement, particularly for ethnic and racial minorities.
Acknowledgement
This research was funded by the University of Akron Summer Research Fellowship, 2007
References
Andrews, F. M. & Withey, S. B. (1976). Social indicators of well-being: American’s perceptions of life quality. New York: Plehum Press.
Cai, H., Huang, J., Xu, G., Yang, Z., Liu, M., Mi, Y., & Qian, D. (2012). Prevalence and determinants of metabolic syndrome among women in Chinese rural areas. PLoS One,7(5), doi: 10.1371/journal.pone.0036936
Campbell, A. (1981). The sense of well-being in America. New York: McGraw Hill.
Gao, Y., Li, L., Chan, E. Y., Lau, J., & Griffiths, S. M. (2013). Parental migration, self-efficacy and cigarette smoking among rural adolescents in south China. PLoS One, 8(3), doi: 10.1371/journal.pone.0057569
Huang, L. L., Thrasher, J. F., Jiang, Y., Li, Q., Fong, G. T., & Quah, A. C. (2012). Incidence and correlates of receiving cigarettes as gifts and selecting preferred brand because it was gifted: Findings from the ITC China survey. BMC Public Health, 12(996), doi: 10.1186/ 1471-2458-12-996
Hunt, S.M. (1979). The problem of quality of life. Quality of Life Research. 6, 205-212.
Proshansky, H. M. & Fabian, A. K. (1996). Psychological aspects of the quality of urban life. In D. Frick (Ed.), The quality of urban life (pp. 19-29). New York: Walter De Gruyter.
Womach, J. (2003). Congressional Research Service, Resources, Science, and Industry Division. US tobacco production, consumption, and export trends (CRS: RL30947). Retrieved on Sept. 20, 2013 from UNT Digital Library website: http://digital.library.unt.edu/ark:/67531/ metacrs9644/m1/1/high_res_d/RL30947_2003Jun03.pdf
World Health Organization. (2008) Tobacco free initiative: Global youth tobacco survey.Retrieved June 15, 2008 from www.who.int/tobacco/surveillance/gyts/en/index.html
Wu, J, (1997). Considerations on China’s tobacco industry. China tobacco. Retrieved on Jan. 11, 2007 from http://www.grant.org
Zhang, X. (2010). China's health ministry to go tobacco-free. Retrieved from http://english.gov. cn/2010-05/11/content_1603242.htm
Zhao, B., Schulze, P., & Wang, Y. (2007). Chinese teenager tobacco consumption & perception of quality of life. Consumer Journal, 3, 81-97.

International Journal of Home Economics
334
Notes for contributors
Website
For more information please visit the International Journal of Home Economics website:
http://ijhe.weebly.com/index.html
Frequency of publication
The International Journal of Home Economics is published twice a year. Papers for review will be accepted throughout the year to e-mail: [email protected]
Focus
The International Federation for Home Economics is the only worldwide organisation concerned with Home Economics and Consumer Studies. It was founded in 1908 to serve as a platform for international exchange within the field of Home Economics. IFHE is an International Non-Governmental Organisation (INGO), having consultative status with the United Nations (ECOSOC, FAO, UNESCO, UNICEF) and with the Council of Europe.
This refereed journal brings together emergent and breaking work on all aspects of Home Economics, and, most importantly, how we might improve and renew the everyday work of Home Economists. It features quantitative and qualitative, disciplinary and trans-disciplinary, empirical and theoretical work and will include special editions on key developments. It aims to push the boundaries of theory and research—to seek out new paradigms, models and ways of framing Home Economics.
Contributors
The International Journal of Home Economics welcomes contributions from members and non-members, from a variety of disciplinary and theoretical perspectives.
Author’s biography
Please provide a brief (less than 100 words) paragraph for each author, including current role or memberships and an E-mail address for correspondence. For example:
Professor Donna Pendergast, PhD is Dean of the School of Education and Professional Studies at Griffith University, Brisbane, Australia. Donna researches and writes about Home Economics philosophy, education and practice. Donna recently completed her 4-year term as Vice President of the Pacific Region and member of the IFHE Executive. She continues to serve the profession as Chairperson of the IFHE Think Tank Committee and Editor of the International Journal of Home Economics. She has served as National President of the Home Economics Institute of Australia, and President of the Queensland division.

Notes for contributors International Journal of Home Economics Volume 6 No 2 2013
335
Manuscripts
Manuscripts should be sent electronically to Professor Donna Pendergast, School of Education by e-mail at [email protected]. Please send files as Microsoft Word documents(doc, docx) or in Rich Text Format (rtf). Paper length should not exceed 6000 words. Each document should be double-spaced, with generous margins.
A standard coversheet must be submitted with all manuscripts. It is available from the IFHE website and from here: http://ijhe.weebly.com/index.html.
Papers submitted without coversheets will be returned to authors. A separate first page should include the full title, a short title for use as a running head. The title should not exceed 10 words (50 characters), and should be followed by an abstract of 100–200 words and up to five keywords. Material which requires substantial editing will be returned to the author.
No footnotes or endnotes are permitted, only References. Please avoid using italics and bold. Spellcheck using UK English. All pages should be numbered. Contributors should be aware that they are addressing an international audience. Jargon should be avoided and local terminology clarified for an international audience. Authors should use non-discriminatory language. Measurements should be in metric units. Articles should be original work and,where appropriate, should acknowledge any significant contribution by others.
Tables, figures and illustrations
Figures, diagrams and images must be cited in text and captions provided. Figures should be at a professional standard and supplied as separate electronic files (e.g., TIF, JPG, GIF). Tables must be cited in text and captions provided. Include all tables, figures and
illustrations in the correct location in the manuscript. All tables should be in text, not
provided as an image.
References
References should follow the American Psychological Association system (APA Publications Manual, 6th Edition).
The details required for books are:
Names of authors or editors (year of publication). Title of publication. Place of Publication: Publishers, for example:
Pendergast, D. (2001). Virginal mothers, groovy chicks & blokey blokes: Re-thinking Home Economics (and) teaching bodies. Sydney: Australian Academic Press
The details required for journals are:
Names of authors or editors. (year of publication). Title of article. Title of journal, volume(issue), page numbers, for example:

Notes for contributors International Journal of Home Economics Volume 6 No 2 2013
336
McGregor, S. L. T. (2007a). Consumer scholarship and transdisciplinarity. International Journal of Consumer Studies, 31(5), 487–495.
Copyright
Manuscripts submitted for publication must not have been previously submitted or published. Accepted papers become the permanent property of IJHE. By submitting a manuscript, the author(s) agree that copyright for their articles are automatically transferred to the IJHE, if and when articles are accepted for publication. The copyright gives IJHE the exclusive rights to reproduce and distribute the article.
Proofs
Proofs will be sent electronically to the corresponding author for return within 72 hours. It is the author’s responsibility to ensure the accuracy of these proofs. Correction other than printing errors should be kept to a bare minimum.

337
International Journal of Home Economics
www.ifhe.org
ISSN 1999-561X