Visual awareness of objects and their colour
52
VISUAL AWARENESS 1 Title: Visual awareness of objects and their colour 1 Michael Pilling and Angus Gellatly 2 Department of Psychology, 3 Oxford Brookes University. 4 5 Running head: VISUAL AWARENESS 6 Published in Attention, Perception & Psychophysics (2011) 73:2026-2043. doi: 7 10.3758/s13414-011-0161-3 8 9 Address for correspondence 10 Dr. Michael Pilling, 11 Department of Psychology, 12 Oxford Brookes University, 13 Headington Campus, Oxford, OX3 0BP 14 United Kingdom 15 Tel: +44 (0) 1865 483788; Fax: +44 (0) 1865 483887 16 Email: [email protected] 17 18 Abstract word count = 200: Word count (excluding footnotes) = 13,438 19 20 Author note. Some of these data were previously reported at the European Society for 21 Cognitive Psychology conference September 2009, Krakow, Poland, and at the joint 22 Experimental Psychology Society/ Spanish Experimental Psychology Society conference 23 April 2010, Granada, Spain. We are grateful for the comments of the editor and two 24 anonymous referees on earlier versions of this manuscript. 25 26
-
Upload
oxfordbrookes -
Category
Documents
-
view
4 -
download
0
Transcript of Visual awareness of objects and their colour

VISUAL AWARENESS
1
Title: Visual awareness of objects and their colour 1
Michael Pilling and Angus Gellatly 2
Department of Psychology, 3
Oxford Brookes University. 4
5
Running head: VISUAL AWARENESS 6
Published in Attention, Perception & Psychophysics (2011) 73:2026-2043. doi: 7
10.3758/s13414-011-0161-3 8
9
Address for correspondence 10
Dr. Michael Pilling, 11
Department of Psychology, 12
Oxford Brookes University, 13
Headington Campus, Oxford, OX3 0BP 14
United Kingdom 15
Tel: +44 (0) 1865 483788; Fax: +44 (0) 1865 483887 16
Email: [email protected] 17
18
Abstract word count = 200: Word count (excluding footnotes) = 13,438 19
20
Author note. Some of these data were previously reported at the European Society for 21
Cognitive Psychology conference September 2009, Krakow, Poland, and at the joint 22
Experimental Psychology Society/ Spanish Experimental Psychology Society conference 23
April 2010, Granada, Spain. We are grateful for the comments of the editor and two 24
anonymous referees on earlier versions of this manuscript. 25
26

VISUAL AWARENESS
2
Abstract 1
At any given moment our awareness of what we ‘see’ before us seems to be rather 2
limited. If, for instance, a display containing multiple objects is shown (red or green disks), 3
when one object is suddenly covered at random observers are often little better than chance in 4
reporting about its colour (Wolfe et al., 2006). We test whether, when object attributes (such 5
as colour) are unknown, observers still retain any knowledge of the presence of that object at 6
a display location. Experiments 1-3 involve a task requiring two-alternative (‘Yes/No’) 7
responses about the presence or absence of a colour-defined object at a probed location. On 8
this task, if participants knew about the presence of an object at a location then responses 9
indicated that they also knew about its colour. A fourth experiment presented the same 10
displays but required a three-alternative response. This task did result in a data pattern 11
consistent with participants knowing more about the locations of objects within a display than 12
about their individual colours. However this location advantage, while highly significant, was 13
rather small in magnitude. Results are compared with those of Huang (2010) who also reports 14
an advantage for object locations but under quite different task conditions. 15
16
17
18
19
20
21
22
23
24
25
VISUAL AWARENESS
3
Visual awareness of objects and their colour 1
As we look at the environment around us our subjective visual perceptions seem filled 2
with detail. One is given the impression that at any moment we have awareness of everything 3
our eyes can tell us. Yet, though our eyes certainly do receive a wealth of detail about the 4
visible world, evidence from the psychophysics laboratory suggest that our subjective 5
experience of detailed vision is misleading. In fact our moment to moment visual 6
representations seem to be highly impoverished, containing little more than the basic ‘gist’ of 7
what is before our eyes (Noë, 2002; O'Regan & Noë, 2001; cf. Marr, 1982). The phenomenon 8
of change blindness (Simons & Levin, 1997) is one way in which the limited awareness of 9
what we see can be demonstrated. Change blindness is typically demonstrated using the 10
flicker paradigm (Rensink, 2000; Rensink, O’Regan, & Clark, 1997). In this paradigm two 11
different versions of a photographic image or display of objects are presented in alternation, 12
usually interleaved with a briefly presented blank screen. The observer is usually instructed to 13
locate and identify the change in the picture or display as quickly as possible. Most observers 14
are typically rather poor at this task, behaving as if blind to the existence of the change until it 15
is eventually located. The change blindness phenomenon occurs not just for subtle changes 16
but even when manipulations are more dramatic. To give an example, Rensink and 17
colleagues (Rensink et al., 1997) presented two versions of a photograph of a market scene 18
using the flicker task. As these two versions were shown in alternation the trousers of the 19
market stall attendant in the picture changed their colour between blue and brown. Observers 20
would often require tens of iterations before the change was spotted despite the substantial 21
colour change and despite the large area of the scene involved in the change. 22
An important aspect of the change blindness phenomenon is the obviousness of the 23
change once it is either discovered or pointed out to the observer. This shows that change 24
blindness is not simply a failure of sensory registration, of discrimination ability, or due to 25

VISUAL AWARENESS
4
low-level perceptual interference caused by the flickering of the display. Instead the 1
phenomenon seems to highlight a genuine difficulty in perceiving and identifying changes 2
when they are presented in a way in which the luminance transients, normally associated with 3
the appearance of a change, are masked: If no blank mask is inserted between the two 4
alternating versions of the scene then the change is rendered obvious due to its associated 5
luminance transient capturing our attention. 6
The flicker paradigm unquestionably demonstrates the importance of the bottom-up 7
guidance of transients in making us aware of changes as they occur in our environment. 8
However, the evidence it provides is not, by itself, conclusive evidence that we lack detailed 9
visual representations. The paradigm gives, at best, a rather indirect measure of our moment 10
to moment visual awareness: Even if our conscious perceptions represented the pre-change 11
scene in all relevant details, in order to detect a change this representation needs to be 12
retained intact through the presentation of both the blank interval mask and of the post-13
change scene (Angelone, Levin, & Simons, 2003; Mitroff, Simons, & Levin, 2004; Simons, 14
2000). Even were our pre-change scene representation robust enough to survive this, one 15
would still need some effective way of comparing the entire scene against the current scene 16
representation in order to assure the change component was detected (Varakin, Levin, & 17
Collins, 2007). In practice, the inherent spatial uncertainty as to the change’s location in the 18
flicker task requires multiple perceptual decisions to be made about the scene before the 19
change location is revealed (Wright, Green, & Baker; 2000; Wright, Alston, & Popple, 2002). 20
Thus the flicker paradigm presents us with a task which taps into a multitude of visual 21
processes. It is as much a measure of our ability to retain and compare visual information as 22
of our ability to initially apprehend it. These above considerations demonstrate fundamental 23
limitations in the paradigm as a tool for exploring visual awareness. Fortunately there are 24
alternatives which can be considered as more suited to this purpose. One such alternative is 25

VISUAL AWARENESS
5
the ‘mudsplash’ technique. This is a variant of the flicker paradigm in which a change is 1
repeatedly presented but without the intervening blank frame shown in the flicker paradigm; 2
instead a set of irrelevant objects (‘mudsplashes’) appear and disappear in the display in 3
synchrony with the change but in locations where they do not spatially overlap it (O'Regan, 4
Rensink, & Clark, 1999; Watanabe, 2003). The transients generated by the onset and offset of 5
the mudsplashes conceal the change transient which would otherwise be obvious. 6
With the change transient concealed in this way, change detection is almost as 7
effortful as in the flicker paradigm. However, again, what the task informs us about our 8
moment to moment visual perceptions is debatable. In addition to disguising the transient, the 9
mudsplashes presumably also interfere with the normal process by which attention is 10
allocated across a scene (Cole, Gellatly, & Blurton, 2001; Kramer & Sowon, 1995). This 11
mudsplash technique may therefore alter the nature of what we see by involuntarily drawing 12
our attentional resources away from what we might otherwise perceive towards the more 13
salient transients associated with the appearance and disappearance of the mudsplashes. 14
Furthermore the mudsplash technique, like the flicker paradigm, still involves spatial 15
uncertainty about the location of the required perceptual decision. This spatial uncertainty in 16
itself is likely to compound the difficulty of detecting a change since it means that all 17
perceptual comparisons must always be made across multiple regions of the display to locate 18
the change. 19
Another task, a modification of the mudsplash technique, presents a scene onto which 20
is added a single ‘mudsplash,’ which briefly occludes the display area where a change occurs 21
before itself disappearing. This method has the advantage of drawing attention to the change 22
location and so limiting the perceptual comparison to a single probed display region. Despite 23
the greater cognitive simplicity of this method compared to, say, the flicker paradigm, 24
O’Regan and colleagues still found that participants were rather poor in identifying the nature 25

VISUAL AWARENESS
6
of a change, consistent with their having only a limited representation of the scene to draw 1
upon. This difficulty was most apparent when participants were cued to a region of marginal 2
interest within a scene, e.g. changes to some letter markings on a photograph of a hockey 3
pitch rather than to the players at the centre of the image (O'Regan et al., 1999). 4
A further alternative to the ‘cued change detection’ task described above, and one 5
which arguably makes even fewer cognitive demands, is the immediate visual memory task 6
(Wolfe, Reineke & Brawn, 2006; Reinecke, Rinck, & Becker, 2006). This is a task in which 7
observers have just to make a simple decision about an object or location in a display or 8
scene which is abruptly cued while the display is being viewed. A single transient or 9
occluding mask is given both as a probe to the display location required for report and to 10
conceal the to-be-reported attribute. No detection of change is required so there is no 11
requirement to compare previous and current percepts, the immediacy of the probe’s 12
appearance means that memory requirements are as limited as possible. 13
Wolfe and colleagues (Wolfe, et al., 2006) presented observers with displays 14
consisting of different coloured shapes in an experiment which used such an immediate 15
memory task in an attempt to assess visual awareness. Individual shapes in the displays 16
typically had one of a limited number of attribute values. This choice of stimuli meant that 17
the task loaded heavily on the information held in visual representations, rather than on 18
potential verbal or semantic memory processes which might also be utilised with displays 19
consisting of mainly unique display items or with meaningful photographic scenes. In one 20
version of the task, observers were shown twenty red or green disks. After viewing the 21
display for about a second, one disk would suddenly become brighter. On half the trials the 22
disk would also change in colour (from red to green or green to red) simultaneously with the 23
brightness increase. Despite seeing the change as it happened in front of their eyes observers 24
were little better than chance (52% correct) in reporting whether a change in colour had 25

VISUAL AWARENESS
7
accompanied the increase in brightness. A second experiment showed that poor immediate 1
memory performance was not limited to colour. In this experiment, displays consisting of 2
thirty-two left or right leaning bars were presented for a similar duration to that in the 3
previously described colour task. A probe consisting of an occluding square was abruptly 4
presented to cover one of the bars and the task was simply to report the orientation of the 5
covered bar. Participants were no better than chance in this task. This was despite its apparent 6
simplicity in asking only for a report about an object immediately after it was being viewed, 7
with neither any spatial uncertainty about the to-be-reported upon location/object, nor any 8
intervening interval to contend with. 9
The results Wolfe and colleagues found from these immediate visual memory tasks 10
can be taken as direct evidence of a profoundly limited visual awareness of what is before our 11
eyes. In these tasks participants were doubtless aware that the scene contained a number of 12
coloured dots or diagonal lines as they viewed the displays. What they seemed largely 13
unaware of were the attributes of any particular object when actually tested. There seemed to 14
be no iconic-like representation available that participants could draw on to assist them under 15
these conditions of viewing when cued to report about what was at a location (c.f. Becker, 16
Pashler, & Anstis, 2000). 17
Further experiments reported by Wolfe and colleagues showed that spatial pre-cueing 18
an item leads to substantially improved accuracy in report of its attributes. For instance in one 19
of these experiments (Wolfe et al., 2006, Experiment 6) a display of 20 coloured squares was 20
presented, as observers viewed the display 3 to 8 of the items were pre-cued one by one by 21
briefly flashing in series. After this, one of the pre-cued items in the display was then covered 22
and the observer asked to report the colour of this item. The more recently this probed item 23
was pre-cued in the sequence the more likely it was that its colour was accurately reported. 24
Further analysis suggested that the pre-cueing advantage existed, at best, for the last four 25

VISUAL AWARENESS
8
items in the sequence. The advantage enjoyed by pre-cued items occurred presumably 1
because focal attention was drawn towards the item, leading to its consolidation in visual 2
short term memory (VSTM). The well documented item capacity limitations of the VSTM 3
store (Pashler, 1988; Vogel, Woodman, & Luck, 2001; cf. Wilken & Ma, 2004) accounting 4
for the limited pre-cueing benefit of only the most recently attended items (see also Reinecke, 5
Rinck, & Becker, 2006). 6
Together these results suggest that our visual awareness at any moment is constrained 7
to the attributes of no more than a maximum of four objects which can be maintained in 8
VSTM if our attention has been specifically focused on them. However, the tasks given by 9
Wolfe and colleagues, while suggesting a very limited awareness of object attributes under 10
conditions of diffuse attention, may underestimate what observers actually knew about the 11
displays. It is possible, for instance, that though observers may have been at (or near) chance 12
in reporting about, say, the colour of an object in a display, they may still have been aware of 13
the existence of an object at the tested location. Thus, it may be that our awareness of object 14
locations in a display may exceed awareness of what attributes these objects possess. Indeed, 15
work on change detection has shown evidence consistent with this possibility. Changes 16
consisting of the addition or deletion of an object tend to be detected more efficiently than 17
changes involving some object attribute or to changes to the semantic identity of an object 18
(e.g. Simons, 1996; Henderson & Hollingworth, 1999; Aginsky & Tarr, 2000; Bahrami, 19
2003; Henderson & Hollingworth, 2003; Cole, Kentridge & Heywood, 2004; Sanocki, 20
Sellers, Mittelstadt, & Sulman, 2010). 21
Such research possibly demonstrates that change detection mechanisms are rather 22
more sensitive to changes in object layout than to attribute changes. However, as we earlier 23
argued, standard change detection measures tend to give a rather indirect measure of 24
awareness in often being confounded by the involvement of other cognitive processes. Thus, 25

VISUAL AWARENESS
9
on this evidence alone it is unclear what such findings say about our visual awareness of 1
object location and attribute information when viewing a scene. 2
However, independently of this work on change detection, other paradigms have also 3
revealed advantages in participants reporting about location information. High accuracy is 4
often displayed on tasks where one need only rely on object location information; 5
performance tends to be lower when knowledge of object surface features is also required. 6
For instance, Horowitz and colleges (Horowitz, Klieger, Fencsik, Yang, Alvarez & Wolfe, 7
2007), using a multiple object tracking (MOT) task, found that observers were more efficient 8
in tracking objects in terms of just their positions than in tracking them when the task 9
required attention to the unique identity of an item as well as its position. 10
More closely related to Wolfe et al.’s immediate memory tasks are a series of 11
experiments performed by Huang and colleagues (e.g. Huang & Treisman, 2007). These tasks 12
required observers to report about the locations and features of objects presented in static 13
displays. They revealed an advantage in reporting about the former. In one of the tasks, two 14
objects appeared briefly in a display either simultaneously or in close temporal succession. 15
When presented in succession participants were just as accurate in reporting about colour and 16
location; with simultaneous presentation reporting of location was equally accurate as with 17
simultaneous presentation, while reporting of colour was substantially impaired. 18
These findings seem to reveal something fundamental about the underlying structure 19
of our visual representations (what Huang & Pashler refer to as ‘Boolean maps’) and how 20
they can be accessed at any given moment. It is argued that only a single feature value can be 21
accessed at a time from these maps while location information can always be accessed in 22
parallel (Huang & Treisman, 2007; Huang & Pashler, 2008). Further evidence supporting this 23
conclusion was obtained by Huang (2010). Here, using more complex displays containing 24
several objects, the same basic location-over-colour advantage was found. Participants were 25

VISUAL AWARENESS
10
presented with two separate displays each containing up to seven randomly located coloured 1
dots. Participants had to make a speeded decision concerning whether the pattern of colours 2
or locations of the dots matched across the two displays. Results showed that response times 3
increased substantially with set-size when the decision concerned object colour, while an 4
essentially flat set-size function was found when the decision concerned location. Thus, with 5
multiple items in a display participants were rather more efficient in reporting about the 6
locations of display items than about their colours. 7
Therefore, independent techniques suggest that location information about objects has 8
precedence in our visual awareness. The poor immediate visual memory for object attributes, 9
found by Wolfe and colleagues (Wolfe et al., 2006), may have underestimated what observers 10
knew about the displays they viewed. They may have had little-to-no awareness of whether a 11
certain location contained, say, a red or green or a left or right oriented item but they may 12
have been aware that a display item was present at that location and, correspondingly, aware 13
of the emptiness of locations which were unfilled by any item. The tasks used gave no 14
evidence either way on this possibility because observers were only ever responding about 15
display locations in which an item was present. 16
In four experiments we use a modified version of the immediate visual memory task. 17
The task is modified so that observers are probed at empty locations as well as ones 18
containing objects. This modification allows us to measure awareness of object attributes 19
compared against awareness of the presence/absence of an object at a tested location. 20
All reported experiments show participants displays which contain a variable number 21
of red and blue coloured shapes. In all experiments these displays are presented for several 22
hundred milliseconds before a probe (a small black square) appears to occlude a small region 23
of the display. On some trials the probe covers one of the coloured shapes; on other trials it 24
covers an empty location. All experiments require participants to make an unspeeded key 25
VISUAL AWARENESS
11
press to indicate something about what was at this indicated before it was occluded. In the 1
first three experiments participants make a simple two-alternative (‘Yes/No’) response 2
according to whether or not they think that a particular target object was present or absent at 3
the probe location (e.g. “did the location contain a red circle?). Within this task participants’ 4
knowledge about the locations of objects compared to knowledge about their colour was 5
determined by comparing false alarm (FA) rates in incorrectly reporting a specified target at 6
empty versus occupied display locations. 7
If observers did know more about object locations than about their colours a certain 8
pattern of false alarm (FA) errors was expected across different display locations. It was 9
expected that FA errors would be relatively infrequent at empty locations (since participants 10
should tend to know whether or not a display location contains an object), and relatively 11
frequent at distractor locations (because observers will often know the location contained an 12
object while being unaware of its colour -and thus be unaware of whether the object was a 13
target or distractor).i 14
In all four experiments, the number of items in the display was parametrically varied. 15
This was done for two reasons. The first was to determine how accuracy in immediate 16
memory was affected by this variable. A large number of visual cognitive tasks show robust 17
monotonic performance decrements associated with display set-size, including visual search 18
(Palmer, 1994; Treisman & Gelade, 1980), MOT (Pylyshyn & Storm, 1988), and change 19
detection (Kempgens, Loffler, & Orbach, 2007; Rensink, 2000; Wright et al., 2000, 2002). 20
To date this variable has yet to be explored systematically within the immediate memory 21
paradigm. The second reason for the set-size variation was to determine how the different 22
response error rates varied at empty and object-occupied locations. For instance, as Huang 23
(2010) found, differences in awareness of object features and object locations may be most 24
apparent when complex displays (i.e. ones containing many items) are viewed. 25

VISUAL AWARENESS
12
1
Experiment 1 2
Experiment 1 gave an initial test of the hypothesis that when viewing displays 3
participants tend to be more aware of object locations than object colour using a simple 4
variation on the basic paradigm used in Wolfe et al. (2006, Experiments 1-2). Participants 5
were shown a display of red and blue coloured letter ‘O’s. A probe then appeared which 6
covered a single display location, either one containing a red or blue letter or an empty space. 7
When the probe appeared observers had to respond ‘Yes’ if they thought the location 8
contained a red ‘O’ (hereafter referred to as a target), or otherwise respond ‘No’, i.e. if the 9
location contained a blue ‘O’ (hereafter referred to as a distractor) or was empty. In the 10
experiment the set-size of target and of non-target items was varied across trials to determine 11
these variables’ effect on overall performance and the error pattern produced across distractor 12
and empty locations. 13
14
Methods 15
Participants. The study employed sixteen participants aged between 18 and 45 and 16
recruited from staff and students in the Department of Psychology, Oxford Brookes 17
University. Ethical approval for this and all following experiments had been obtained from 18
the University ethics panel for research involving human participants. All participants were 19
of normal or corrected-to-normal visual acuity and had normal colour vision. Some 20
participants received a course credit for taking part in the experiment. 21
Stimuli. Stimuli were displayed on an 18” flat screen Sony Trinitron CRT monitor 22
running at a refresh rate of 60 Hz. The monitor was controlled by an IBM-PC compatible 23
computer containing an Intel Pentium 4 (2.66 GHz) CPU, and NVDIA GeForce 4 graphics 24
card, running purpose written software routines in Microsoft Visual Basic (Version 6.0). The 25

VISUAL AWARENESS
13
software controlled all aspects of the experiment, including randomisation, stimulus 1
presentation, response recording and presentation of auditory feedback via loudspeakers. The 2
monitor was viewed in a sound deadened and darkened room. Some limited diffuse 3
background illumination was provided by a light source positioned behind the participant in 4
order for them to be able to see the keyboard. The monitor was viewed from an approximate 5
distance of 120 cm. Accurate reproduction of stimuli was ensured by calibrating and testing 6
the monitor according to the procedure described by Hunt, (1991). Measurement during the 7
calibration procedure was performed using a CRS ColorCal Colorimeter (Cambridge 8
Research Systems, Cambridge, UK). The displayed stimuli consisted of coloured letters. In 9
Experiment 1 these were all letter ‘O’ characters presented in Arial font (size 50). At this size 10
each character subtended an angle of 0.69° at the given viewing distance. The letters were 11
either red (CIE 1931 coordinates Y=23.3, x=.42, y=.34) or blue (Y=23.3, x=.21, y=.25. Within 12
the experiment differing numbers of these items were presented at various locations on a 13
square neutral grey background region which was equal in luminance to the red and blue of 14
the letters (Y=23.3). This equal luminance of coloured items and background minimised the 15
possibility of afterimages being seen due to luminance contrast, which participants might 16
otherwise rely on when a location is probed. The background area subtended an angle of 17
13.01°×14.96°. The remaining portion of the monitor screen which fell outside the 18
background region was shown as a black border. 19
Procedure. Each trial consisted of presentation of a number of stimuli each positioned 20
at an individual location on the grey background display region. The number of targets and 21
distractors was varied factorially across conditions. Three target set-size conditions (6, 12, 22
24) and two distractor set-size conditions (6, 24) were given. Within each set-size condition 23
there was some deliberate variation in the number of the target and distractor items. Thus on 24
any trial the target and distractor items each had a 50% probability of having one less than the 25

VISUAL AWARENESS
14
specified set-size number. So for instance for the target set-size 12, distractor set-size 24 1
factorial condition, the number of targets would be 11 or 12 with equal probability and the 2
number of distractors 23 or 24, both with equal probability. This variation was necessary in 3
order to discourage participants from adopting a counting strategy to indirectly determine 4
whether or not an item had been present at the probe location, particularly in small set-size 5
conditions. Items were positioned at one of 81 locations on a notional 9×9 grid which itself 6
was positioned on the gray background. Individual positions on this notional grid were 7
spatially jittered across trials so that the grid was always irregular in shape and so that items 8
tended not to be aligned with one another in the displays. The spatial jittering of grid 9
positions was done with the constraint that adjacent items never overlapped or touched one 10
another. Allocation for individual red and blue items on the grid was determined on each trial 11
using a randomisation procedure. Empty locations were designated as notional grid locations 12
to which neither a red nor a blue item had been allocated on a particular trial. The display of 13
items was presented for a period that could vary randomly between 1000 and 1500 ms before 14
the appearance of the probe. The probe consisted of an opaque black square (subtending an 15
angle of 1.0°) which always covered one of the notional grid locations (see Figure 1 for a 16
schematic illustration of a single trial). The position in which the probe would appear on any 17
trial was pseudo-randomised within the notional grid. However probe position was weighted 18
so that it had an equal probability of occurring over each of the three types of location (target, 19
distractor, empty location). Participants were instructed that their task on each trial was to 20
report whether or not they thought there had been a target at the probe location before it was 21
covered. They were told to indicate their decision by making an unspeeded key-press of one 22
of two designated keys on a standard computer keyboard. They were told to press the right 23
slash key (‘/’) to make a ‘Yes’ response, and to press the left slash key (“\”) to make a ‘No’ 24
response. The left and right slash keys on the computer keyboard were appropriately 25

VISUAL AWARENESS
15
relabelled with a “Y” and “N” to indicate their respective meaning in the experiment. 1
Participants were told that they were required to guess if they were unsure on any trial. They 2
were also informed that approximately one third of trials would require a ‘Yes’ response, and 3
two third of trials a ‘No’ response. Responses were recorded by the computer’s hard drive. 4
Auditory feedback in the form of an error tone was given each time an incorrect response was 5
given in all practice trials and in the main trials. This feedback was given to maintain 6
participant alertness on the task and to minimise possible response biases. When the 7
participant had made a response on a trial this instigated the next trial after a 500 ms blank 8
inter-trial interval. A demonstration and some practice trials were given to participants before 9
starting the main trials to familiarise them with the displays, the nature of the task, and with 10
the required response mapping. Two versions of practice trials were given in sequence. The 11
first version of the task was deliberately made easy so that participants should not make 12
errors. In this version the probe was a hollow outline square rather than an opaque square. 13
This ensured that participants could still see whether the location contained a target or 14
distractor or was empty as they made their response. Giving this task ensured that participants 15
fully understood the instructions and the particular response mapping required. When 16
participants showed that they could perform these first practice trials without making errors 17
(meaning that they had successfully learned the response mapping required for the task) they 18
were then given a second set of practice trials which were the same as the main trials (i.e. the 19
probe was now opaque rather than hollow). Participants were given 30 randomly selected 20
practice trials including trials from each of the combinations of target and distractor set-size 21
conditions. There were 360 main trials. Within these there were equal numbers of trials with 22
each of the six factorial combinations of target and distractor set-sizes. Participants were 23
given a one minute break halfway through the experimental trials. 24
25
VISUAL AWARENESS
16
1
***Insert Fig. 1 about here*** 2
3
4
Results and Discussion 5
Results were analysed through calculation of the proportion of hits and of false alarms 6
in the responses for different trial-types. These were calculated separately for each set-size 7
condition. The proportion of hits (pHit) was calculated from trials in which target locations 8
were cued. On such trials correct responses were treated as hits, incorrect responses as 9
misses: pHit was computed as the sum of hits divided by the sum of hits plus misses. The 10
proportion of false alarms (pFA) was calculated from trials in which non-target locations 11
were cued. On such trials correct responses were treated as correct rejections and incorrect 12
responses as false alarms. Separate pFA measures were able to be calculated from the two 13
types of non-target location (distractor, empty). Finally a signal detection accuracy measure 14
was calculated using the A-prime statistic (A', see Macmillan & Creelman, 2005). A' is a 15
non-parametric response bias free measure of task performance; it is calculated from pHit and 16
pFA and returns a single value in a range between 0.5 (chance level) and 1.0 (perfect 17
performance). A' was calculated individually for each participant and for each set-size 18
condition; for the calculation of A' pFA was calculated from across both types of non-target 19
trial, distractor and empty. The across-participant means are shown in Figure 2 below. 20
Statistical analysis concentrated on the two aspects of the data most relevant for our 21
hypothesis: the A' measure of task accuracy and the pFA rates at distractor and empty 22
locations across the conditions. Both were looked at in terms of how they varied as a 23
consequence of set-size. 24

VISUAL AWARENESS
17
Across-participant means for each of these measures across the different conditions 1
are shown in Figure 2. It can be seen here that basic pattern of data was not consistent with 2
the hypothesis that participants knew more about object locations than about the colours of 3
objects at those locations. Against the hypothesis FAs were never greater in number in 4
distractor locations than empty locations. When there were 6 distractors in a display FAs 5
were most frequent in empty locations, i.e. opposite to the direction predicted by the 6
hypothesis (see Figure 2c); when there were 24 distractors than there was little difference in 7
the FA rates at distractor and empty locations (see Figure 2d). Further statistical analysis 8
reported below confirmed these observations. 9
10
***Insert Figure 2 about here*** 11
12
. A two-way repeated measures ANOVA (Target-Set-size [three levels: 6, 12, 24]; 13
Distractor-Set-size [two levels: 6, 24]) was performed on the A' scores. There was a 14
significant main effect of Target-Set-size, F[2, 30] = 55.41, MSE = 0.006, partial 2 = 0.787, 15
p < .001, and Distractor-Set-size, F[1, 15] = 5.88, MSE = 0.013, partial 2 = 0.282, p < .05), 16
but the interaction between the two factors was not significant, F[2, 30] = 0.816, MSE = 17
0.099, p = .45. For the pFA data separate 2-way ANOVAs were done for the 6 and 24 18
Distractor conditions. Each of these ANOVAs contained 2 factors, Target-Set-size (three 19
levels: 6, 12, 24) and Cue-Location (two levels: Distractor, Empty). For the 6 Distractor 20
condition both main effects were significant: Cue-Location, (F[1, 15] = 8.79, MSE = 0.061, 21
partial 2 = 0 .369, p < .01) and Target-Set-size (F[2, 30] = 32.64, MSE = 0.015, partial
2 = 22
0.685, p < .001). The Cue-Location x Target-Set-size interaction did not reach significance, 23
F[2, 30]= 2.74, MSE = 0.023, p =. 081). For the 24 Distractor condition the main effect of 24
Cue-Location was not significant (F[1, 15] = 0.24, MSE = 0.007, p = .63), but that of Target-25

VISUAL AWARENESS
18
Set-size was significant (F[1, 15] = 44.48, MSE = 0.013, partial 2 = 0.748, p < .001). For the 1
24 distractor condition, as with the 6 Distractor condition, the Cue-Location × Target-Set-size 2
interaction did not reach significance (F[1, 15]= 1.69, MSE = 0.005, p = .85). 3
Thus, Experiment 1, while showing clear effects of certain variables, found no 4
support for the hypothesis that participants knew more about the locations of objects than 5
about their colour. The A' measure showed that accuracy in the visual immediate memory 6
task was strongly influenced by set-size. Significant effects were found for both target and 7
distractor set-size. However the effect of distractor set-size was somewhat smaller, consistent 8
with the task irrelevance of these items within this experiment. Though accuracy declined 9
with set-size, even with the most difficult condition (24 targets and distractors) accuracy was 10
still well above chance. 11
As noted in the results section above, false alarm responses (pFA) displayed an 12
interesting pattern of data across distractor and empty locations, though not one which was 13
consistent with our hypothesis regarding awareness of object locations in relation to 14
awareness of their colour. When distractors were plentiful in the display (distractors=24), an 15
approximately equal proportion of these responses were found at distractor and empty 16
locations; when there were only a few distractors in the display (distractors = 6), a 17
substantially greater number of false alarms were found at empty locations compared to 18
distractor locations. Though this effect of location was significant, it was in the opposite 19
direction to our hypothesis: our prediction was that pFAs would be greater in distractor 20
locations than empty locations. 21
Though Experiment 1’s results were inconsistent with our hypothesis regarding 22
awareness of object locations and object colour it is quite possible that this is a consequence 23
of the way in which this hypothesis was tested. Certainly the results suggest that under some 24
conditions participants were adopting a grouping strategy which may have acted against us 25

VISUAL AWARENESS
19
finding our predicted pattern of results. The larger pFA rate at empty locations relative to 1
distractor locations when distractors are few in number suggests that, under these conditions, 2
participants tend to group distractors together as a single perceptual object. This grouping 3
should lead to a more efficient encoding of the individual object locations, associated with 4
the distractor colour which is the basis for the grouping. This might have the consequence of 5
reducing the FA rate for these distractor items compared to empty locations, consistent with 6
what we observed. 7
Such a grouping strategy would be far less effective when distractors were more 8
plentiful in the display. This explain why the FA rate was no longer proportionally smaller at 9
distractor locations compared to empty locations when 24 rather than 6 distractors were 10
present in a display. However it does not, by itself, explain why a higher FA rate was not now 11
observed for distractors given that these items could no longer easily be strategically grouped 12
together. Another aspect of the stimulus display might explain this It is well known that items 13
can be perceptually segregated efficiently on the basis of a single feature dimension such as 14
colour (Beck, Peterson, & Angelone, 2007; Treisman & Gelade, 1980). The nature of the task 15
may have allowed participants to weight attention towards the locations containing target 16
items and away from those containing distractors (Wolfe, 1994; Bacon & Egeth, 1994). With 17
attention weighted away from distractors this may have reduced the likelihood that these 18
items were in many cases consciously represented. 19
Experiment 2 was designed to increase the likelihood that distractor items are 20
attended on all trials regardless of the number of them in each display. In it targets were only 21
distinguishable from distractors by a feature conjunction of colour and shape to make 22
perceptually segregation of targets and distractors more difficult (Kim & Cave, 1995). 23
24
25

VISUAL AWARENESS
20
Experiment 2 1
Experiment 2 presented the same target items as Experiment 1 (red ‘O’s), unlike 2
Experiment 1, however, there were two types of distractor in the displays: ones differing in 3
colour from targets (blue ‘O’s), and ones differing in shape (red ‘X’s). It was expected that 4
this manipulation would made it harder to confine attention to the target items in the displays 5
without also attending to at least some distractors. This change was predicted to have two 6
effects. First, that distractor-set-size would have a greater effect on accuracy than it did in 7
Experiment 1. Secondly, if awareness of object locations was superior to awareness of object 8
colour, the greater attention received by distractor items in Experiment 2 would lead to a 9
pattern of results in which FAs were more frequent at distractor locations than locations 10
which were empty. 11
12
Method 13
Participants. Sixteen participants were recruited from the same population as for the 14
previous experiment. None had taken part in the previous experiment. 15
Stimuli & Procedure. All aspects of the Experiment were the same as for Experiment 16
1 except for the difference in the distractor items. Approximately half of the distractors were 17
blue ‘O’s and half were red ‘X’s 18
19
Results and Discussion 20
Data were analysed in the same manner described for Experiment 1. Across 21
participant averages for A', p(hit) and p(FA) statistics are shown in Figure 3. Here it can be 22
seen that the pattern of FAs was essentially the same as that in Experiment 1 with regards to 23
distractor and empty locations (see Figure 3 c, d), a pattern confirmed by the statistical 24
analysis of this data reported below. 25
VISUAL AWARENESS
21
1
2
***Insert Figure 3 about here*** 3
4
5
For A' scores, ANOVA showed a significant main effect of Target-Set-size (F[2, 32] = 6
10.46, MSE = 0.014, partial 2 = 0.395, p < .001), and Distractor-Set-size (F[1, 16]= 16.14, 7
MSE = 0.017, partial 2 = 0.502, p < .001), but no interaction between these two (F[2, 32] = 8
0.43, MSE = 0.007, p = .431). Further analysis of the accuracy data was done comparing the 9
scores in Experiment 2 with those in Experiment 1. This was done to test our second 10
hypothesis that the different type of distractor stimuli employed in Experiment 1 would lead 11
to a proportionally greater influence of distractors in this Experiment, compared with the 12
previous. In particular this analysis found a significant Target-Set-size × Distractor-Set-size × 13
Experiment interaction (F[2, 62]=134, MSE= 0.009, partial 2 = 0.041, p< .05). This 14
interaction shows that, while Target-set-size had a similar effect across the two experiments, 15
the Distractor-set-size variable had a proportionally greater effect in Experiment 2 than it did 16
in Experiment 1. Thus having targets defined by a feature conjunction as they were in 17
Experiment 2 altered the relative importance of targets and distractors in the task compared to 18
Experiment 1: While in Experiment 1 targets had a bigger effect on accuracy than distractors, 19
while in Experiment 2 the reverse was the case. 20
The increase in the effect of distractors on accuracy in Experiment 2 shows that 21
distractors were more difficult to ignore than targets in this task. Despite this, when we look 22
at the FA data we see essentially the same pattern as Experiment 1. In particular there was no 23
effect of cue location consistent with out hypothesis. For neither the 6 nor 24 Distractor 24
conditions were FA errors greater in distractor than empty locations. For the 6 Distractor 25

VISUAL AWARENESS
22
condition the main effect of Target-Set-size was significant (F[2, 32]= 7.29, MSE = 0.027, 1
partial 2 =313, p < .002), that of Cue-Location approached, but did not reach, significance 2
(F[1, 16] = 3.81, MSE = 0.082, p = .069), though, as with Experiment 1, because of a slightly 3
higher rate of FAs at empty locations rather than distractor locations. For the 24 Distractor 4
condition Target-Set-size was again significant as a main effect (F[2, 32] = 14.87, MSE = 5
0.010, partial 2 = .482, p < .001), but Cue-Location was not (F[1, 15] = 0.30, MSE = 0.012, 6
p = .865), reflecting the similar FA rate at distractor and empty locations in this condition. 7
Neither distractor condition exhibited any significant interaction between the two main 8
effects (min. p=.266). 9
10
Experiment 3 11
Neither of the first two experiments indicated any tendency for FA errors to be more 12
frequent in distractor locations than empty locations. These experiments were similar in 13
presenting displays in which participants knew some items were task relevant (targets) and 14
some which were task irrelevant (distractors). In independently varying these items these 15
experiments revealed some of properties of immediate visual memory, in particular the fact 16
that even irrelevant items influence the accuracy with which relevant items can be reported. 17
However these experiments were possibly not well suited to test our basic question about the 18
relative awareness of object locations and object colours because the task encouraged 19
participants to treat target and distractor items differently. The task situation is, therefore, 20
possibly different to that in Wolfe et al. (2006)ii. Experiment 3 was designed to produce an 21
equal spread of attention across targets and distractor locations. This was done firstly by 22
always presenting approximately equal numbers of target and, distractor items, and, secondly, 23
by varying the colour of to-be-reported targets across trials and only informing participants of 24
this colour at the point where a response was required from them. In Experiment 3 a high or 25

VISUAL AWARENESS
23
low tone informed participants about the target colour on any particular trial. Because items 1
of either colour could be the target on any given trial attention should be evenly distributed 2
across all items. Again it was predicted that if participants knew more about object locations 3
than about their colours then more false alarms should occur in reporting the presence of 4
targets at non-target locations than at empty locations. 5
6
Method 7
Participants. Twenty five participants were employed, recruited from the same 8
population as specified for the previous experiments. None took part in the previous 9
experiments 10
Stimuli And Procedure The same stimuli and equipment as in Experiments 1 were 11
used. There were four item set-size conditions (6, 12, 24, 48) and displays always contained 12
approximately equal numbers of red and blue items (co-varying target and distractor set-size) 13
Though as in the previous experiments some variation was introduced into the number of red 14
and blue items in each display to minimise the likelihood of a counting strategy being 15
adopted for smaller set-sizes. Displays were presented for a variable interval of between 16
1000-1500 ms before the onset of the cue. As in Experiment 1 the cue appeared with equal 17
probability at the location of a red ‘O’, blue ‘O’, or at an empty location. Simultaneously with 18
the cue onset, a tone lasting 500 ms was played through loudspeakers to inform participants 19
of the target colour for the trial: A high (1500 Hz) tone indicated that the target was a Red 20
‘O’; a low (200 Hz) tone indicated that it was a Blue ‘O’. High and low tones had an equal 21
probability of occurring on each trial. Participants used a standard computer keyboard to 22
respond. They were instructed to make an unspeeded response according to whether or not 23
the cued location contained a target. The ‘9’ key of the numeric keypad of the standard 24
keyboard was allocated as a ‘Yes’ response for trials where Red items were designated as 25
VISUAL AWARENESS
24
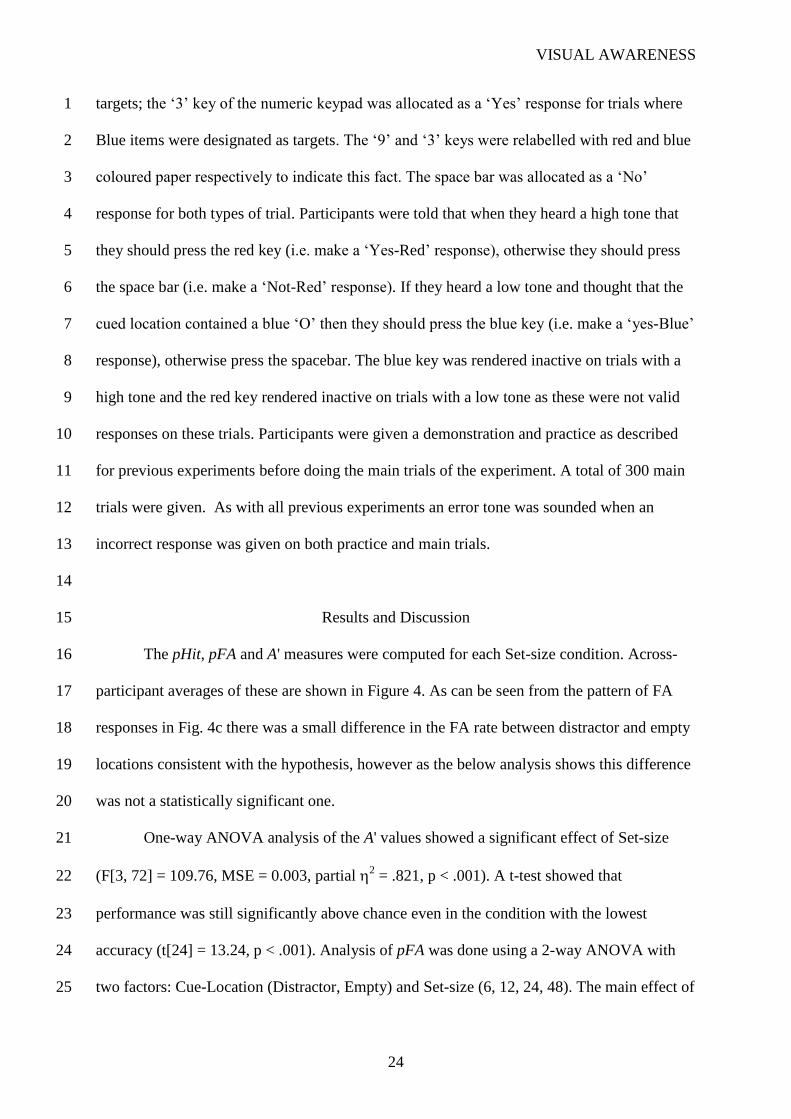
targets; the ‘3’ key of the numeric keypad was allocated as a ‘Yes’ response for trials where 1
Blue items were designated as targets. The ‘9’ and ‘3’ keys were relabelled with red and blue 2
coloured paper respectively to indicate this fact. The space bar was allocated as a ‘No’ 3
response for both types of trial. Participants were told that when they heard a high tone that 4
they should press the red key (i.e. make a ‘Yes-Red’ response), otherwise they should press 5
the space bar (i.e. make a ‘Not-Red’ response). If they heard a low tone and thought that the 6
cued location contained a blue ‘O’ then they should press the blue key (i.e. make a ‘yes-Blue’ 7
response), otherwise press the spacebar. The blue key was rendered inactive on trials with a 8
high tone and the red key rendered inactive on trials with a low tone as these were not valid 9
responses on these trials. Participants were given a demonstration and practice as described 10
for previous experiments before doing the main trials of the experiment. A total of 300 main 11
trials were given. As with all previous experiments an error tone was sounded when an 12
incorrect response was given on both practice and main trials. 13
14
Results and Discussion 15
The pHit, pFA and A' measures were computed for each Set-size condition. Across-16
participant averages of these are shown in Figure 4. As can be seen from the pattern of FA 17
responses in Fig. 4c there was a small difference in the FA rate between distractor and empty 18
locations consistent with the hypothesis, however as the below analysis shows this difference 19
was not a statistically significant one. 20
One-way ANOVA analysis of the A' values showed a significant effect of Set-size 21
(F[3, 72] = 109.76, MSE = 0.003, partial 2 = .821, p < .001). A t-test showed that 22
performance was still significantly above chance even in the condition with the lowest 23
accuracy (t[24] = 13.24, p < .001). Analysis of pFA was done using a 2-way ANOVA with 24
two factors: Cue-Location (Distractor, Empty) and Set-size (6, 12, 24, 48). The main effect of 25

VISUAL AWARENESS
25
Cue-Location was not significant (F[1, 24] = 1.73, MSE = 0.016, p = .201), the main effect 1
of Set-size was highly significant (F[3, 72]= 147.88, MSE = 0.009, partial 2 = .860, p < 2
.001). There was no significant interaction between the factors (F[3, 72] = 1.71, MSE = 3
0.008, p = .172). 4
5
6
***Insert Figure 4 about here*** 7
8
9
Experiment 3 was done to encourage participants to allocate equal attention to target 10
and distractor locations. In doing so the FA rate in Experiment 3, unlike in the proceeding 11
experiments, did exhibit a small tendency for the FA rate to be lower at empty locations 12
compared to distractor locations. However, this tendency was not one which reached 13
statistical significance. However, there is an issue with Experiment 3 which make the 14
interpretation of the results problematic with respect to the hypothesis regarding awareness of 15
object locations and their colour. This issue was response bias. The pattern of responses 16
suggested a tendency towards conservativism criterion when responding about the presence 17
of a target (i.e. to respond ‘No’ when unsure). A formal calculation of response bias (B''D, see 18
Donaldson, 1992) confirmed this tendency, which was particularly evident for the larger set-19
sizes (e.g. with set-size=48, B''D = +0.37 –positive values on this measure indicate 20
conservatismiii
). 21
It is not clear why participants displayed such a bias though there are at least two 22
aspects of the experiment which may have contributed towards it. One possibility is the task 23
contingencies, fewer trials required a ‘Yes’ response than a ‘No’. The lower frequency of 24
positive trials may have discouraged participants from making ‘Yes’ responses when 25

VISUAL AWARENESS
26
uncertain. A second possibility concerns the response mapping. While the ‘Yes’ response was 1
required only when a participant believed a target colour was present at a location, a ‘No’ 2
response was required in two cases, when the participant believed the location was empty, 3
and, when they believed it contained a non-target. This response mapping in which the ‘No’ 4
response indicated two forms of decision possibility may also have encouraged participants to 5
err towards making ‘No’ responses when uncertain. The response conservativism would 6
almost certainly have had the effect of reducing the number of FA errors on the task. As a 7
consequence this may have had reduced limited the sensitivity of FAs as a measure of visual 8
awareness and, in turn, reduced the possibility of us finding statistically reliable differences 9
across distractor and empty locations in this measure. 10
To tackle the possible influence of response bias one could manipulate the relative 11
occurrence of different trial-types (e.g. increase the number of trials on which a target item is 12
probed to try to increase ‘Yes’ responses). In the current experiment the cue was presented 13
with equal probability at target, distractor and empty locations. In increasing the number of 14
positive (target) trials this balance across the different trial types would be lost, in particular a 15
smaller proportion of trials would have to be given in which the cue covered one of the empty 16
locations. In addition, this manipulation would not to address the other possible issue 17
associated with the response bias mentioned in Experiment 3, that of the ‘Yes’ or ’No’ 18
response requirement in which a ‘Yes’ response is required for one trial type while a ‘No’ 19
decision is required for two trial-types. 20
Both of these problems are addressable by discarding the two-alternative ‘Yes-No’ 21
paradigm used in the experiments so far described, and instead adopting a task in which 22
participants are given three response alternatives, i.e. report ‘red’, ‘blue’, or ‘empty. This 23
three alternative response task (3AFC) confers several advantages for our task. Firstly it 24
means that each location-type is mapped onto a single response key in the experiment. 25

VISUAL AWARENESS
27
Secondly the 3AFC allows us to maintain the same task contingencies as Experiment 3 in 1
which the probe occurs with equal probability in each location-type. In allowing participants 2
to directly report what they thought was present at the location of the probe on each trial by 3
selecting one of three key presses it was hoped this would remove the response bias issue 4
present in Experiment 3, and in doing so provide a more sensitive measure of what people 5
know about the displays when tested. 6
Experiment 4 gave such a task as a final test of our original prediction. With the 7
3AFC task it is not possible to talk of false alarms as such. However, were it the case that 8
participants knew more about item locations than about their colours would expect a 9
particular pattern of response errors. Errors in incorrectly making a colour response (i.e. 10
incorrectly responding ‘red’ at a location where no red item was present or responding ‘blue’ 11
where no blue item was present) should occur more frequently at filled locations than empty 12
locations. For instance, we would expect to find that participants tended to incorrectly 13
respond ‘red’ to a location containing a blue item (or to incorrectly respond ‘blue’ to a 14
location containing a red item) more than to make these response errors at unfilled locations. 15
16
17
18
Experiment 4 19
Method 20
Participants. Twenty five participants were employed, recruited from the same 21
population as specified for the previous experiments. None took part in any of the previous 22
experiments 23
Stimuli and Procedure. The same stimuli and equipment were used as in Experiments 24
1 and 3. The presentation of the visual displays was the same as in Experiment 3 except that 25

VISUAL AWARENESS
28
no cue tone was presented when the probe appeared. When the probe appeared observers 1
were instructed to select from three response alternatives The same response keys for red and 2
blue were used as in the previous experiment; the space key was designated as the ‘empty’ 3
response key. These three keys were accordingly relabelled on the computer keyboard. A 4
demonstration and practice, as described for Experiment 1, was given before doing the main 5
trials of the experiment. A total of 300 main trials were given in the main experiment. 6
Feedback in the form of an error tone was given for incorrect responses in both practice and 7
main trials, 8
9
10
11
Results 12
The proportions of correct and incorrect responses were calculated for each 13
participant. The means of these are shown in Figure 5, which gives (a) the proportion of 14
correct ‘colour’ responses – i.e. trials in which the occluded location contained a red (or blue) 15
item and a ‘red’ (or ‘blue’) response was given; (b) the proportion of correct ‘empty’ 16
responses –i.e. trials in which the probe location was empty and an ‘empty’ response was 17
given; (c) the proportion of incorrect colour responses, –i.e. responses in which participants 18
incorrectly responded ‘red’ (or ‘blue) to a location where a red (or blue) item was not present, 19
separate bars are shown for the proportion of such errors at object locations (e.g. responding 20
‘red’ to the location of a blue item), and at empty locations (e.g. responding ‘red’ to an empty 21
location); and finally, (d) the proportion of incorrect empty responses –i.e. trials on which the 22
location was filled and the response was ‘empty’. 23
The key issue is the data pattern in Fig. 5c. Consistent with our hypothesis of 24
observers knowing more about the locations of objects than about their colour, errors in 25

VISUAL AWARENESS
29
reporting a coloured item were more frequent at filled (object) locations than at empty ones. 1
This was the case across all four set-sizes. 2
3
***Insert Figure 5 about here*** 4
5
These data in Figure 5c were subjected to a two-way ANOVA: Set-size (6, 12, 24, 6
48), and Location (Object, Empty). The main effect of Set-size was highly significant (F[3, 7
72]) = 269.12, MSE= 0.002, partial 2 = .918, p <.001), however, critically for the hypothesis 8
so was that of location (F[1, 24] = 10.2, MSE= 0.09, partial 2 = .30, p <.001). The 9
interaction between the two factors did not approach significance (F[3, 72] = .08, 10
MSE=0.003, p=.968. 11
12
13
Discussion 14
Experiment 4 involved presentations of the same stimulus displays as Experiment 3 15
yet the basic result was different in terms of its significance. Results suggested that 16
participants knew significantly more about object locations than about their colour. The 17
pattern of errors in Experiment 3, while showing a trend in this same direction, did not find 18
this effect to be statistically reliable. Thus, consistent with our original hypothesis, 19
Experiment 4 finally demonstrated that participants did know somewhat more about the 20
locations of the objects in the display than about the colours of objects. However, it must be 21
noted that this effect, though statistically reliable, was rather small in magnitude. 22
Given that the presented displays were the same in the two cases why should 23
Experiment 4 find a significant effect consistent with our hypothesis when Experiment 3 did 24
not? The only critical difference between the two experiments was in the responses 25

VISUAL AWARENESS
30
participants were required to make and the differing task demands associated with this. 1
Allowing three response options rather than two gives participants the opportunity to report 2
more directly about what they think they know about a tested location. This may have made 3
the task more sensitive to participants’ knowledge of what they had seen. When given a ‘Yes-4
No’ decision participants seemed biased towards responding ‘No’ under conditions of 5
uncertainty. Because of this what participants know about object locations was, perhaps, not 6
always expressed in the pattern of false alarms. Such ‘No’ responses were unavailable in 7
Experiment 4. In this experiment if participants knew an object was present at a cued 8
location but were not confident of its colour, it seems unlikely that they would respond 9
‘Empty’; it is more likely that they would choose to respond either ‘Red’ or ‘Blue’. Thus 10
participants’ knowledge about filled and empty locations would tend to be reliably expressed 11
in the incorrect ‘Colour’ response rate in a way that it was not in the task given in the 12
previous experiments. Indeed, examination of the response frequencies showed that the 13
response bias prevalent in Experiment 3 was no longer an issue in Experiment 4. While in 14
Experiment 3 there was a clear tendency towards a particular response this was not the case 15
in Experiment 4. In Experiment 4 each one of the three responses was made almost exactly 16
on one third of the trials. 17
18
General Discussion 19
Before deliberating on the findings of the four experiments regarding awareness of 20
object locations and colour we first briefly consider the immediate memory task itself. Across 21
all experiments setsize variations had a pronounced effect on immediate memory task 22
performance, generally the more items were in a display the greater were the number of 23
errors made, For target set size these effects were consistent with the greater load placed on 24
the resources of visual attentional and VSTM in monitoring and maintaining a representation 25

VISUAL AWARENESS
31
of these items (Luck, Hillyard, Mouloua, & Hawkins, 1996; Palmer, 1994; Luck & Vogel, 1
1997; Bays & Hussain, 2008). The task in Experiments 1 and 2, in having always the same 2
target type across all trials potentially, allowed these the distractors to be ignored. However, 3
these Experiments suggest that distractors were not ignored entirely. This is demonstrated by 4
the fact that the number of the task-irrelevant (distractor) items significantly affected the 5
accuracy with which the presence or absence of a target at a location was reported. The effect 6
of distractor number was most evident when these items differed from targets across a 7
conjunction of two features (Experiment 2); here the number of distractors in the display 8
influenced immediate memory accuracy more than did the number of targets. 9
The effect of distractors in these tasks presumably reflects the extent to which these 10
items, capture attention in an involuntary manner (Theeuwes, 2004; Foster & Lavie, 2008), 11
and in doing compete with targets for VSTM resources (Vogel, McCullough & Machizawa, 12
2005; Fukuda & Vogel, 2009). Work on visual marking has often reported that static 13
irrelevant items are presented in a similar manner to the current experiment they can be 14
effectively inhibited and thus ignored (Watson & Humphries, 2000; Donk, 2006). Contrary to 15
this our results suggested that irrelevant items were not totally disregarded, even when 16
distinguishable from targets by a simple colour disjunction (Experiment 1). This aspect of our 17
results was in accordance with findings of Vogel et al. (2005). These authors used a change 18
detection paradigm in which the memory and test array consisted of varying numbers of red 19
and blue tilted bars. There was a general tendency for accuracy in detecting orientation 20
changes to be lower when two blue bars were present compared to when none were present 21
(though this was most prevalent in participants deemed to have a low VSTM capacity). 22
Experiment 1 found a similar tendency for wholly irrelevant items to influence accuracy in 23
the rather different circumstances of an immediate memory task in which only the presence 24
or absence of a red item needed to be reported. The greater interference with distractors 25

VISUAL AWARENESS
32
defined by a conjunction (Experiment 2) occurs presumably because of the increased 1
difficulty of the allocating attention to targets when these are defined based on multiple 2
feature values (Wolfe, 1994; Kim & Cave, 1995; Pinsk, et al. 2004; Bettencourt & Somers, 3
2009). 4
Despite these effects there was no significant tendency for distractors to be 5
misreported as targets any more than empty locations. The only difference in the false alarm 6
rate observed between distractor and empty locations in Experiments 1-2 was in the opposite 7
direction of our hypothesis. Here a greater number of false alarms tended to be observed 8
when distractor number was small. This effect we attribute to distractors being grouped 9
together as a single object in the task when few in number. Similar grouping effects with 10
small numbers of objects have been reported with dynamic displays in MOT tasks (e.g. 11
Yantis, 1992). 12
The most critical experiments regarding our proposed hypothesis were Experiments 3 13
and 4. Unlike Experiments 1 and 2 these Experiments necessarily required equal attention to 14
target and distractor items. In Experiment 3 this was done by telling participants the colour of 15
the target item only after a display location was probed, in Experiment 4 it was done by not 16
designating any items as targets and simply getting participants to report what they thought 17
was contained at the probed location. 18
Experiment 3, like Experiments 1 and 2 preceding it, found no significant tendency 19
for distractor locations to be falsely reported as targets any more than empty locations. One 20
clear issue we noted with the Yes/No task in these experiments however was a marked 21
tendency for participants to show bias towards making negative responses when uncertain. 22
This may have meant that the participants’ knowledge about the locations of objects did not 23
clearly translate into the patter of errors this task produced. Experiment 4 in having three 24
response options rather than two seemed to address this possible response bias issue, here an 25
VISUAL AWARENESS
33
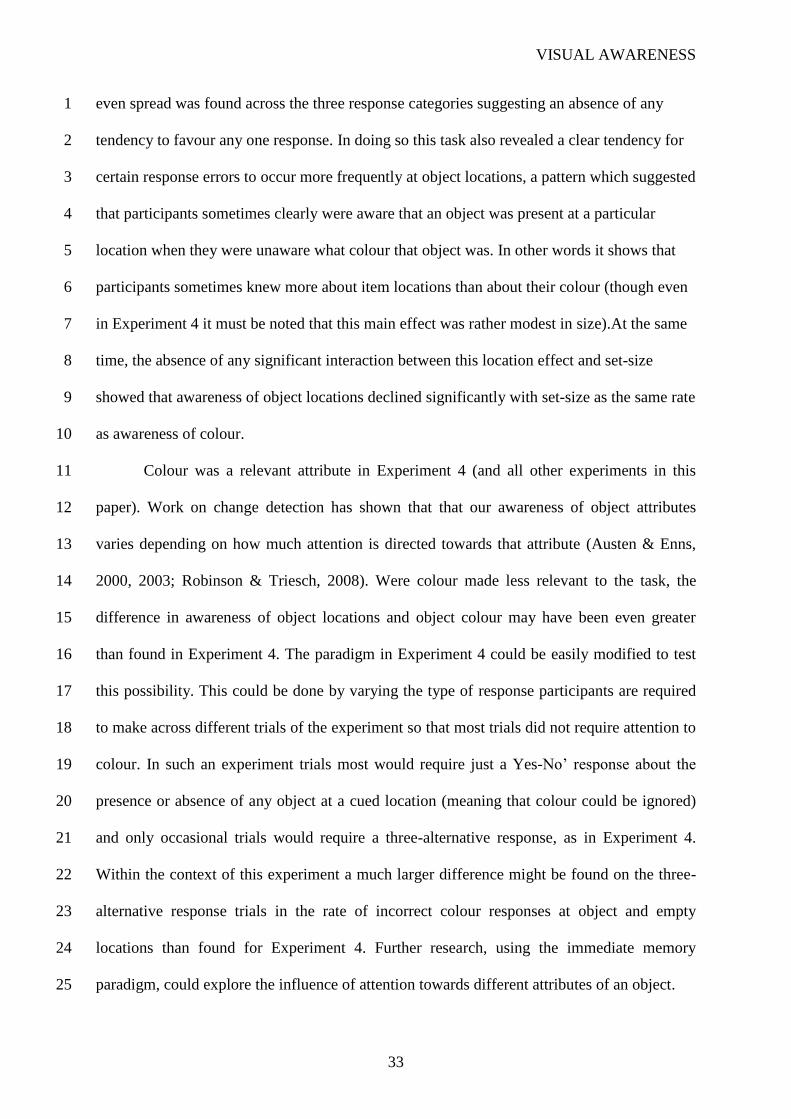
even spread was found across the three response categories suggesting an absence of any 1
tendency to favour any one response. In doing so this task also revealed a clear tendency for 2
certain response errors to occur more frequently at object locations, a pattern which suggested 3
that participants sometimes clearly were aware that an object was present at a particular 4
location when they were unaware what colour that object was. In other words it shows that 5
participants sometimes knew more about item locations than about their colour (though even 6
in Experiment 4 it must be noted that this main effect was rather modest in size).At the same 7
time, the absence of any significant interaction between this location effect and set-size 8
showed that awareness of object locations declined significantly with set-size as the same rate 9
as awareness of colour. 10
Colour was a relevant attribute in Experiment 4 (and all other experiments in this 11
paper). Work on change detection has shown that that our awareness of object attributes 12
varies depending on how much attention is directed towards that attribute (Austen & Enns, 13
2000, 2003; Robinson & Triesch, 2008). Were colour made less relevant to the task, the 14
difference in awareness of object locations and object colour may have been even greater 15
than found in Experiment 4. The paradigm in Experiment 4 could be easily modified to test 16
this possibility. This could be done by varying the type of response participants are required 17
to make across different trials of the experiment so that most trials did not require attention to 18
colour. In such an experiment trials most would require just a Yes-No’ response about the 19
presence or absence of any object at a cued location (meaning that colour could be ignored) 20
and only occasional trials would require a three-alternative response, as in Experiment 4. 21
Within the context of this experiment a much larger difference might be found on the three-22
alternative response trials in the rate of incorrect colour responses at object and empty 23
locations than found for Experiment 4. Further research, using the immediate memory 24
paradigm, could explore the influence of attention towards different attributes of an object. 25

VISUAL AWARENESS
34
The type of displays used in Experiment 4 may possibly explain the modest size of 1
effect found in this experiment with respect to errors at filled and empty locations. 2
Experiment 4, like Experiments 1 and 3 had displays containing items of one of two colours. 3
These two-colour displays may possibly encourage grouping strategies in which spatially-4
adjacent same-coloured items become represented as single perceptual objects (Rensink, 5
2001; Yantis, 1992). We, in fact noted evidence for such a process based on the patterns of 6
false alarms in Experiments 1 and 2. 7
Using a change detection paradigm, Sanocki et al. (2010) recently found that 8
participants tended to be rather good at detecting changes to object layout within a display. 9
The good performance observed on this task was suggested to be due to the efficiency with 10
which display items can be grouped by location. The authors argued that such grouping 11
would be less effective for other attributes of objects than they would be for location. 12
Contrary to this claim, our results seem to suggest that colour groupings are also effective. If 13
displays contained multiple colours, however, (rather than the two colour displays used here) 14
such grouping strategies might tend to founder and lead to poor accuracy in reporting about 15
colour. Further research could explore the involvement of grouping processes in determining 16
immediate memory performance and look at how the efficiency of such processes is affected 17
by factors such as the heterogeneity of the display items. 18
The results of Experiment 4 are consistent with the findings of Huang and colleagues 19
(e.g. Huang, 2010; Huang et al, 2007) discussed earlier. Across several tasks these authors 20
found location information was more readily available than colour information. For instance 21
Huang (2010) found that observers could more quickly determine whether two displays were 22
different in terms of the locations of the objects they contained than they could determine 23
whether they were different in the colours of the objects the displays contained. Their pattern 24
of results suggested that the advantage for location information resulted from the efficiency 25
VISUAL AWARENESS
35
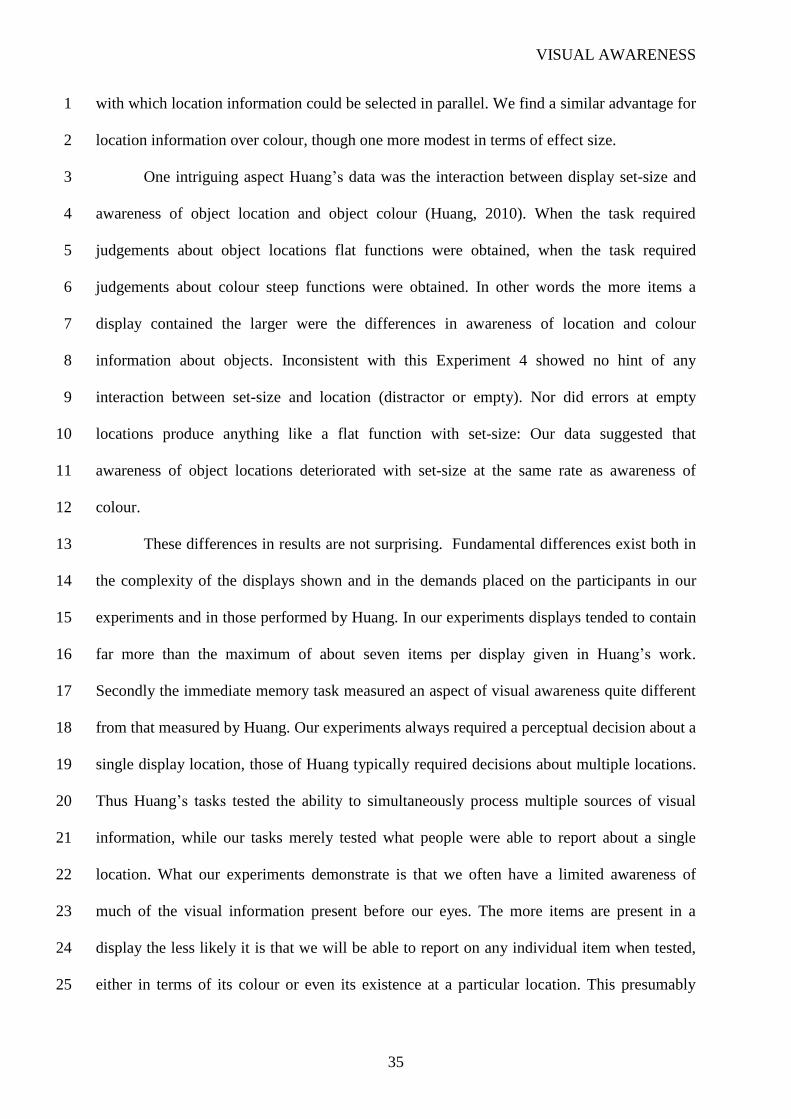
with which location information could be selected in parallel. We find a similar advantage for 1
location information over colour, though one more modest in terms of effect size. 2
One intriguing aspect Huang’s data was the interaction between display set-size and 3
awareness of object location and object colour (Huang, 2010). When the task required 4
judgements about object locations flat functions were obtained, when the task required 5
judgements about colour steep functions were obtained. In other words the more items a 6
display contained the larger were the differences in awareness of location and colour 7
information about objects. Inconsistent with this Experiment 4 showed no hint of any 8
interaction between set-size and location (distractor or empty). Nor did errors at empty 9
locations produce anything like a flat function with set-size: Our data suggested that 10
awareness of object locations deteriorated with set-size at the same rate as awareness of 11
colour. 12
These differences in results are not surprising. Fundamental differences exist both in 13
the complexity of the displays shown and in the demands placed on the participants in our 14
experiments and in those performed by Huang. In our experiments displays tended to contain 15
far more than the maximum of about seven items per display given in Huang’s work. 16
Secondly the immediate memory task measured an aspect of visual awareness quite different 17
from that measured by Huang. Our experiments always required a perceptual decision about a 18
single display location, those of Huang typically required decisions about multiple locations. 19
Thus Huang’s tasks tested the ability to simultaneously process multiple sources of visual 20
information, while our tasks merely tested what people were able to report about a single 21
location. What our experiments demonstrate is that we often have a limited awareness of 22
much of the visual information present before our eyes. The more items are present in a 23
display the less likely it is that we will be able to report on any individual item when tested, 24
either in terms of its colour or even its existence at a particular location. This presumably 25

VISUAL AWARENESS
36
reflects the limited capacity of VSTM (Wolfe et al., 2006; Vogel et al., 2001). The 1
experiments of Huang and colleagues’ demonstrate a different limitation, one of simultaneous 2
access to the attributes of multiple objects. While location information can be simultaneously 3
accessed in this way colour information cannot. Further work could explore the relationship 4
between the limitation in awareness revealed by the current tasks and the limitations imposed 5
by selection. This could be done within the immediate memory paradigm by presenting 6
displays in the same manner but with two probed locations on each trial, both of which 7
require report. The two cues could be presented simultaneously or in sequence after a short 8
temporal gap. Comparison between these conditions would show the extent to which 9
information about different attributes such as colour or location can be selected in parallel 10
under the conditions imposed by our experiment.iv
11
Another aspect of our data requires comment. Accuracy was generally rather better in 12
our experiments than those of Wolfe and colleagues (Wolfe et al., 2006). They found 13
observers were little better than chance in reporting which of two colours an object was in a 14
display, except in cases in which attention had been recently drawn to that item. We found 15
higher than chance accuracy levels even for displays of 48 items –i.e. more than double the 16
number of items present in the equivalent task in this earlier study (Wolfe et al. 2006, 17
Experiment 1). How can we explain the discrepancy? In Experiments 1 and 2 this could, 18
perhaps be explained by the fact that the task weighted attention towards a subset of the 19
display items. However Experiment 3 required participants to focus on all display items, 20
making this basic task at least as difficult as that in Wolfe et al’s original experiments (in fact, 21
arguably, it was more challenging because of the greater spatial uncertainty with which the 22
probe could appear in the display -it could appear in empty as well as filled locations; in 23
Wolfe et al.’s task the probe was constrained only to appear in filled locations). Despite this 24
performance remained well above chance for most participants even at the largest set-sizes. 25

VISUAL AWARENESS
37
We suspect the contingencies of the tasks might explain the better performance we 1
observe. In Wolfe and colleagues’ experiments display item number was held constant; in the 2
current experiment it was varied. With the smallest set-sizes presented in our experiments the 3
task was almost trivially easy and few errors were made. The inclusion of such easy trials 4
may have motivated participants to engage with the task more strongly, leading to better 5
performance than would have been observed had the experiment contained only the most 6
difficult trials. However, this is speculation. Further research would be needed to explore 7
these issues more thoroughly to determine the factors which influence the observed accuracy 8
level on these tasks. For now, it seems clear that immediate memory for colour may not be as 9
profoundly limited as might be concluded from Wolfe et al’s datav. 10
As described earlier the immediate memory paradigm can be considered to have 11
advantages over other methods (such as the flicker or mudsplash techniques) for measuring 12
what we know about what we see. One potential issue concerns the role of the probe in the 13
task. We have argued that when an observer makes an incorrect response in reporting about a 14
tested region this is because their conscious visual representation of the scene lacked the 15
required information. However there is an alternative possibility, it could be that a 16
representation was held but that it was substituted by the occluding probe object in a manner 17
similar to that which occurs in the phenomenon of Object Substitution Masking (see Di Lollo 18
Enns, & Rensink, 2000). Indeed Wolfe and colleagues suggested such a possibility as a 19
reason for the poor performance found with their occluding cue (Wolfe et al., 2005, pp. 756). 20
Against this explanation it has been shown that object substitution masking effects diminish 21
with the time with which items in a display are present, with items present or longer than 22
about 500-800 ms substitution effects are often weak or absent entirely (Gellatly, Pilling, 23
Carter, & Guest, 2010). Given the long (> 1000 ms) display exposure times given in these 24
immediate memory experiments this suggests that object substitution effects is unlikely to be 25
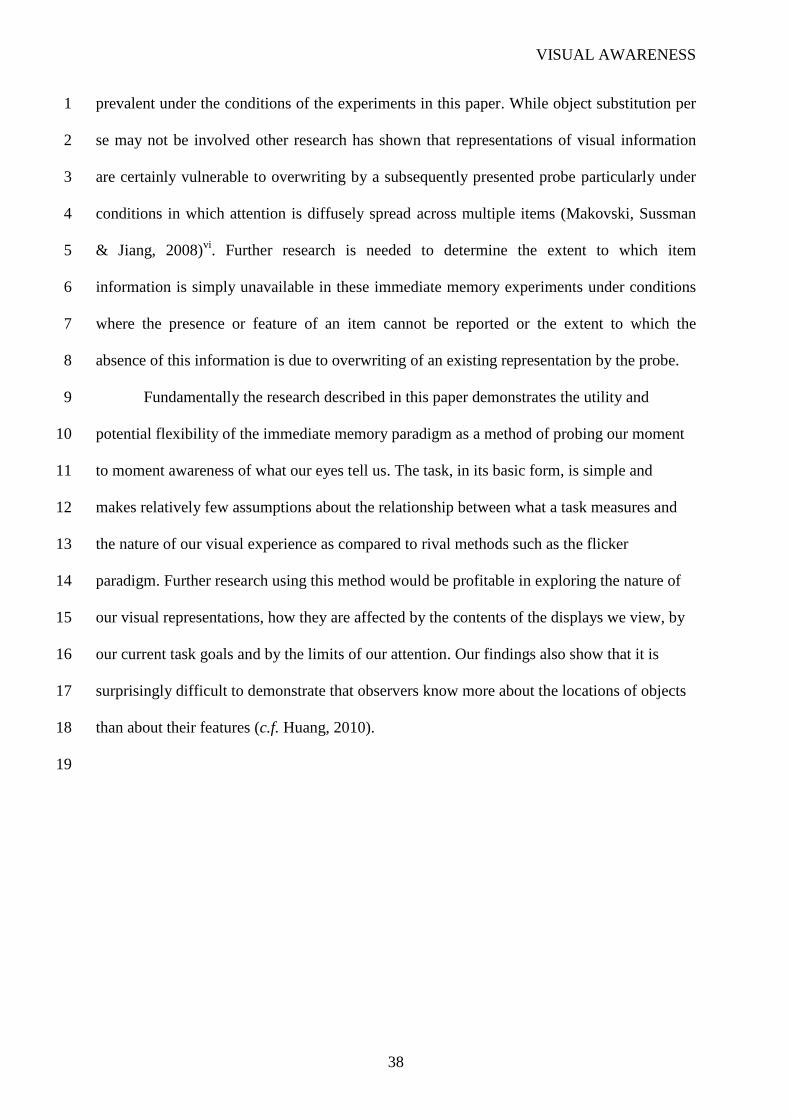
VISUAL AWARENESS
38
prevalent under the conditions of the experiments in this paper. While object substitution per 1
se may not be involved other research has shown that representations of visual information 2
are certainly vulnerable to overwriting by a subsequently presented probe particularly under 3
conditions in which attention is diffusely spread across multiple items (Makovski, Sussman 4
& Jiang, 2008)vi
. Further research is needed to determine the extent to which item 5
information is simply unavailable in these immediate memory experiments under conditions 6
where the presence or feature of an item cannot be reported or the extent to which the 7
absence of this information is due to overwriting of an existing representation by the probe. 8
Fundamentally the research described in this paper demonstrates the utility and 9
potential flexibility of the immediate memory paradigm as a method of probing our moment 10
to moment awareness of what our eyes tell us. The task, in its basic form, is simple and 11
makes relatively few assumptions about the relationship between what a task measures and 12
the nature of our visual experience as compared to rival methods such as the flicker 13
paradigm. Further research using this method would be profitable in exploring the nature of 14
our visual representations, how they are affected by the contents of the displays we view, by 15
our current task goals and by the limits of our attention. Our findings also show that it is 16
surprisingly difficult to demonstrate that observers know more about the locations of objects 17
than about their features (c.f. Huang, 2010). 18
19

VISUAL AWARENESS
39
References 1
Angelone, B. L., Levin, D. T., & Simons, D. J. (2003). The relationship between change 2
detection and recognition of centrally attended objects in motion pictures. Perception, 3
32(8), 947-962. 4
Austen, E. L., & Enns, J. T. (2000). Change detection: Paying attention to detail. Psyche: An 5
Interdisciplinary Journal of Research on Consciousness, 6(11). 6
Austen, E. L., & Enns, J. T. (2003). Change detection in an attended face depends on the 7
expectation of the observer. Journal of Vision, 3(1), 64-74. 8
Bacon, W. F., & Egeth, H. E. (1994). Overriding stimulus-driven attentional capture. 9
Perception & Psychophysics, 55(5), 485-496. 10
Bahrami, B. (2003). Object property encoding and change blindness in multiple object 11
tracking. Visual Cognition, 10(8), 949-963. 12
Bays, P. M. & Husain, M. (2008). Dynamic shifts of limited working memory resources in 13
human vision. Science 321, 851–854. 14
Beck, M. P., Peterson, M. S., & Angelone, B. L. (2007). The roles of encoding, retrieval, and 15
awareness in change detection. Memory & Cognition, 35(4), 610-620. 16
Becker, M. W., Pashler, H., & Anstis, S. M. (2000). The role of iconic memory in change-17
detection tasks. Perception, 29(3), 273-286. 18
Bettencourt, K. C., & Somers, D. C. (2009). Effects of target enhancement and distractor 19
suppression on multiple object tracking capacity. Journal of Vision, 9(7), -. 20
Cole, G. G., Gellatly, A., & Blurton, A. (2001). Effect of object onset on the distribution of 21
visual attention. Journal of Experimental Psychology-Human Perception and 22
Performance, 27(6), 1356-1368. 23

VISUAL AWARENESS
40
Cole, G. G., Kentridge, R. W., & Heywood, C. A. (2004). Visual salience in the change 1
detection paradigm: The special role of object onset. Journal of Experimental 2
Psychology-Human Perception and Performance, 30(3), 464-477. 3
Di Lollo, V., Enns, J. T., & Rensink, R. A. (2000). Competition for Consciousness Among 4
Visual Events: The Psychophysics of Reentrant Visual Processes. Journal of 5
Experimental Psychology: General, 129(4), 481-507. 6
Donaldson, W. (1992). Measuring recognition memory. Journal of Experimental Psychology: 7
General, 121, 275-278. 8
Donk, M. (2006). The preview benefit: Visual marking, feature-based inhibition, temporal 9
segregation, or onset capture? Visual Cognition, 14(4), 736 - 748. 10
Foster, S. & Lavie, N. (2008). Failures to ignore entirely irrelevant distractors: The role of 11
load. Journal of Experimental Psychology: Applied, 14, 73-83. 12
Fukuda, K. & Vogel, E.K. (2009), Human variation in overriding attentional capture. The 13
Journal of Neuroscience, 29, 8726–8733 14
Gellatly, A., Pilling, M., Carter, W., & Guest, D. (2010). How does target duration affect 15
object substitution masking? Journal of Experimental Psychology: Human Perception 16
and Performance, 36, 1267-1279. 17
Henderson, J. M., & Hollingworth, A. (1999). The role of fixation position in detecting scene 18
changes across saccades. Psychological Science, 10(5), 438-443. 19
Henderson, J. M., & Hollingworth, A. (2003). Eye movements and visual memory: Detecting 20
changes to saccade targets in scenes. Perception & Psychophysics, 65(1), 58-71. 21
Horowitz TS, Klieger SB, Fencsik DE, Yang KK, Alvarez GA, Wolfe JM. (2007). Tracking 22
unique objects. Perception & Psychophysics, 69, 172–184. 23
Huang, L. (2010). Characterizing the nature of visual conscious access: The distinction 24
between features and locations. Journal of Vision, 10, 24, 1–17. 25

VISUAL AWARENESS
41
Huang, L., Treisman, A., & Pashler, H. (2007). Characterizing the limits of human visual 1
awareness. Science, 317, 823–825. 2
Huang, L., & Pashler, H. (2007). A Boolean map theory of visual attention. Psychological 3
Review, 114, 599–631. 4
Hunt, R. W. G. (1991). Measuring Colour. Chichester, UK: Ellis Horwood. 5
Kempgens, C., Loffler, G., & Orbach, H. S. (2007). When change blindness fails: Factors 6
determining change detection for circular patterns. Journal of Vision, 7(9), 211-211. 7
Kim, M. S., & Cave, K. R. (1995). Spatial attention in visual search for features and feature 8
conjunctions. Psychological Science, 6(6), 376-380. 9
Kramer, A. F., & Sowon, H. (1995). Splitting the Beam: Distribution of Attention over 10
Noncontiguous Regions of the Visual Field. Psychological Science, 6(6), 381-386. 11
Landman, R., Spekreijse, H., & Lamme, V. A. F. (2003). Large capacity storage of integrated 12
objects before change blindness. Vision Research, 43(2), 149-164. 13
Luck, S. J., Hillyard, S. A., Mouloua, M., & Hawkins, H. L. (1996). Mechanisms of visual-14
spatial attention: Resource allocation or uncertainty reduction? Journal of Experimental 15
Psychology-Human Perception and Performance, 22(3), 725-737. 16
Luck, S. J. & Vogel, E. K. (1997). The capacity of visual working memory for features and 17
conjunctions. Nature 390, 279–281. 18
Macmillan, N. A.,& Creelman, C. D., (2005). Detection theory. A User’s Guide. (2nd ed.). 19
Mahwah, NJ: Erlbaum. 20
Makovski, T., Sussman, R., & Jiang, Y.V. (2008). Orienting attention in visual working 21
memory reduces interference from memory probes. Journal of Experimental 22
Psychology: Learning Memory and Cognition, 34, 369-380, 23
Marr, D. (1982). Vision. A Computational Investigation into the Human Representation and 24
Processing of Visual Information. New York: W.H. Freeman. 25

VISUAL AWARENESS
42
Mitroff, S. R., Simons, D. J., & Levin, D. T. (2004). Nothing compares 2 views: Change 1
blindness can occur despite preserved access to the changed information. Perception 2
& Psychophysics, 66(8), 1268-1281. 3
Noë, A. (2002). Is the visual world a grand illusion? Journal of Consciousness Studies, 9, 1-4
12. 5
O'Regan, J. K., & Noë, A. (2001). A sensorimotor account of vision and visual 6
consciousness. Behavioral and Brain Sciences, 24(5), 939-1031. 7
O'Regan, J. K., Rensink, R. A., & Clark, J. J. (1999). Change-blindness as a result of 8
'mudsplashes'. Nature, 398(6722), 34-34. 9
Palmer, J. (1994). Set-size effects in visual search - The effect of attention is independent of 10
the stimulus for simple tasks Vision Research, 34(13), 1703-1721. 11
Pinsk, M. A., Doniger, G. M., & Kastner, S. (2004). Push-Pull Mechanism of Selective 12
Attention in Human Extrastriate Cortex. J Neurophysiol, 92(1), 622-629. 13
Pylyshyn, Z. W., & Storm, R. W. (1988). Tracking multiple independent targets evidence for 14
a parallel tracking mechanism. Spatial Vision, 3(3), 179-198. 15
Reinecke, A., Rinck, M., & Becker, E. S. (2006). Spiders crawl easily through the bottleneck: 16
Visual working memory for negative stimuli. Emotion, 6(3), 438-449. 17
Rensink, R. A. (2000). Visual search for change: A probe into the nature of attentional 18
processing. Visual Cognition, 7(1-3), 345-376. 19
Rensink, R. A. (2001). Change blindness: Implications for the nature of visual attention. In 20
M. Jenkin & L. Harris, (Eds.), Vision & Attention. New York: Springer. 2001. 21
Rensink, R. A. (2004). Visual Sensing without Seeing. Psychological Science, 15, 27-32. 22
Rensink, R. A., O’Regan, J. K., & Clark, J. J. (1997). To see or not to see: The need for 23
attention to perceive changes in scenes. Psychological Science, 8(5), 368-373. 24

VISUAL AWARENESS
43
Robinson, A., & Triesch, J. (2008). Task-specific modulation of memory for object features 1
in natural scenes. Advances in Cognitive Psychology, 4, 1-4. 2
Ross, J., & Burr, D. C. (2010). Vision senses number directly. Journal of Vision, 10(2). 3
Sanocki, T., Sellers, E, Mittelstadt, J. & Sulman, N. (2010). How high is visual short-term 4
memory capacity for object layout? Attention, Perception & Psychophysics, 74, 1097-5
1109. 6
Simons, D. J. (1996). In sight, out of mind: When object representations fail. Psychological 7
Science, 7(5), 301-305. 8
Simons, D. J. (2000). Current approaches to change blindness. Visual Cognition, 7(1-3), 1-15. 9
Simons, D. J., & Levin, D. T. (1997). Change blindness. Trends in Cognitive Sciences, 1(7), 10
261-267. 11
Theeuwes, J. (2004) Top-down search strategies cannot override attentional capture. 12
Psychonomic Bulletin & Review, 11, 65-70 13
Treisman, A. M., & Gelade, G. (1980). A feature-integration theory of attention. Cognitive 14
Psychology, 12(1), 97-136. 15
Varakin, D. A., Levin, D. T., & Collins, K. M. (2007). Comparison and representation 16
failures both cause real-world change blindness. Perception, 36(5), 737-749. 17
Vogel, E. K., Luck, A.W. & Makizawa, M. G. (2005). Neural measures of individual 18
differences in controlling access to visual working memory. Nature, 483, 500-503. 19
Watanabe, K. (2003). Differential effect of distractor timing on localizing versus identifying 20
visual changes. Cognition, 88, 243-257. 21
Watson, D.G., and Humphries, G.W. (2000). Visual marking: Evidence for inhibition using a 22
probe-dot detection paradigm. Perception & Psychophysics, 62, 471-481. 23
Wilken, P., & Ma, W. J. (2004). A detection theory account of change detection. Journal of 24
Vision, 4(12), 1120-1135. 25

VISUAL AWARENESS
44
Wolfe, J. (1994). Guided Search 2.0: A revised model of visual search. Psychonomic Bulletin 1
& Review, 1(2), 202-238. 2
Wolfe, J. M., & Friedman-Hill, S. R. (1992). On the role of symmetry in visual search. 3
Psychological Science, 3, 194-98. 4
Wolfe, J. M., Reinecke, A., & Brawn, P. (2006). Why don't we see changes? The role of 5
attentional bottlenecks and limited visual memory. Visual Cognition, 14(4-8), 749-6
780. 7
Wright, M., Green, A., & Baker, S. (2000). Limitations for change detection in multiple 8
Gabor targets. Visual Cognition, 7(1-3), 237-252. 9
Wright, M. J., Alston, L., & Popple, A. V. (2002). Set-size effects for spatial frequency 10
change and discrimination in multiple targets. Spatial Vision, 15(2), 157-170. 11
Yantis, S. (1992). Multielement Visual Tracking - Attention and perceptual organization. 12
Cognitive Psychology, 24(3), 295-340. 13
14
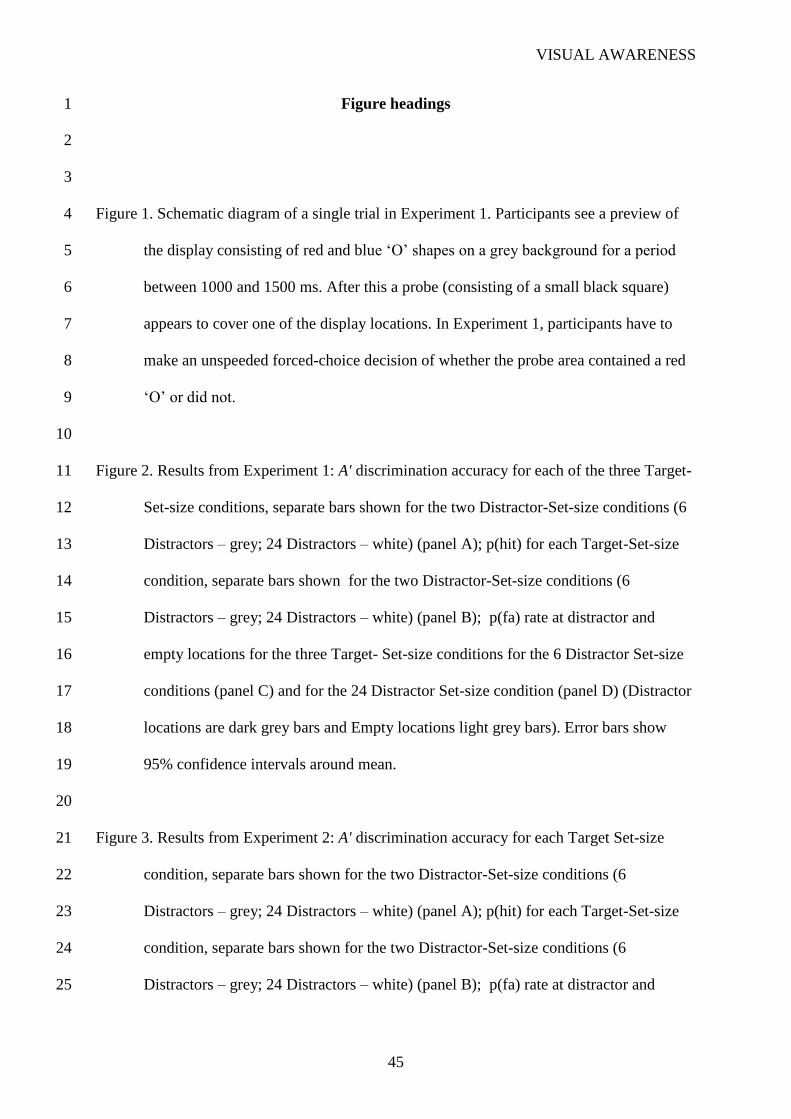
VISUAL AWARENESS
45
Figure headings 1
2
3
Figure 1. Schematic diagram of a single trial in Experiment 1. Participants see a preview of 4
the display consisting of red and blue ‘O’ shapes on a grey background for a period 5
between 1000 and 1500 ms. After this a probe (consisting of a small black square) 6
appears to cover one of the display locations. In Experiment 1, participants have to 7
make an unspeeded forced-choice decision of whether the probe area contained a red 8
‘O’ or did not. 9
10
Figure 2. Results from Experiment 1: A' discrimination accuracy for each of the three Target-11
Set-size conditions, separate bars shown for the two Distractor-Set-size conditions (6 12
Distractors – grey; 24 Distractors – white) (panel A); p(hit) for each Target-Set-size 13
condition, separate bars shown for the two Distractor-Set-size conditions (6 14
Distractors – grey; 24 Distractors – white) (panel B); p(fa) rate at distractor and 15
empty locations for the three Target- Set-size conditions for the 6 Distractor Set-size 16
conditions (panel C) and for the 24 Distractor Set-size condition (panel D) (Distractor 17
locations are dark grey bars and Empty locations light grey bars). Error bars show 18
95% confidence intervals around mean. 19
20
Figure 3. Results from Experiment 2: A' discrimination accuracy for each Target Set-size 21
condition, separate bars shown for the two Distractor-Set-size conditions (6 22
Distractors – grey; 24 Distractors – white) (panel A); p(hit) for each Target-Set-size 23
condition, separate bars shown for the two Distractor-Set-size conditions (6 24
Distractors – grey; 24 Distractors – white) (panel B); p(fa) rate at distractor and 25

VISUAL AWARENESS
46
empty locations for the three Target- Set-size conditions for the 6 Distractor Set-size 1
conditions (panel C) and for the 24 Distractor Set-size condition (panel D) (Distractor 2
locations are dark grey bars and Empty locations light grey bars). Error bars show 3
95% confidence intervals around mean. 4
5
Figure 4. Results from Experiment 3. A' discrimination accuracy for each of the four Display- 6
Set-size conditions (6-48), (panel A); p(hit) for each display Set-size condition (panel 7
B); p(fa) rate for each Display set-size condition with Distractor locations as dark 8
grey bars and Empty locations as light grey bars (panel C). Error bars show 95% 9
confidence intervals around mean. 10
11
Figure. 5. Results from Experiment 4 : p(correct ‘colour’ responses) for each Set-size 12
condition (panel A); p(correct ‘empty’ responses) for each Set-size condition (panel 13
B); p(incorrect ‘colour’ responses) for each Set-size condition, shown separately for 14
these errors at object and empty locations (panel C) ; p(incorrect ‘empty’ responses 15
for each Set-size condition (panel D). Error bars show 95% confidence intervals 16
around the mean. 17
18
19
20
21

VISUAL AWARENESS
47
1
2
3
4
5
6
7
8
9
10
11
12
13
14
15
16
17
18
19
20
Figure 1. 21
22
23
24
25

VISUAL AWARENESS
48
1
2
3
4
5
6
7
8
9
10
11
12
13
14
Figure 3. 15
16
17
18
19
20
Figure 2. 21
22

VISUAL AWARENESS
49
1
2
3
4
5
6
7
8
9
10
11
12
13
14
15
16
17
18
19
20
21
Figure 3. 22
23
24

VISUAL AWARENESS
50
1
Figure 4. 2
3
4
5
6
7
8
9
10
11
12
13
14
15
16
17
18
19
20
21
Figure 4. 22
23

VISUAL AWARENESS
51
1
2
3
Figure 4. 4
5
6
7
8
9
10
11
12
13
14
15
16
17
18
19
20
Figure 5. 21
22

VISUAL AWARENESS
52
Footnotes 1
i Alternatively one could express the hypothesis in terms of the correct rejection rate for distractor and empty
locations. The correct rejection rate is just the inverse of the false alarm rate: One would expect a significantly
higher correct rejection rate at empty locations than at distractor locations.
ii It could be argued that the ‘yes-no’ task in Experiments 1 and 2 and the ‘red or green’ task in Wolfe et al.’s
original experiments actually have similar demands. In both cases participants faced with a two alternative
decision about a cued display region: though the ‘yes-no’ task weights attention towards one set of items it
would make strategic sense in the ‘red or green’ task also to focus attention on just one set of items; for instance,
by focussing on the red item locations, if one of these item locations is not cued then it can be inferred that the
cued location must have contained a green item.
iii B''D values potentially range from +1 (extreme conservative bias) to -1 (extreme liberal bias), with 0 denoting
no bias.
iv One issue we have not yet discussed is the equitability of location and colour as different perceptual
dimensions. For instance Rensink (2004) found that changes in the location of an object were noticed more
readily than were changes to its colour. However in the absence of any baseline comparison of the salience of
these two changes it is difficult to conclude from such data whether it is the case that location information is a
more fundamental attribute in our visual representations of a scene, or, whether simply the change in location
within physical space in the display was simply greater in magnitude than the shift in colour feature-space
leading the former to appear more salient despite the possible incomparability of the two changes. Here our
specific claim is not about the relative salience of location- verses colour-attributes of objects but about
knowledge of what was present at a particular location.
v We have recently conducted some tasks similar to those reported here but with orientation, instead of colour,
as the key object attribute (Pilling & Gellatly, unpublished data). Observers had to perform a ‘yes-no’ task in
which targets were defined by the orientation of the bar (items were 45° left or right leaning bars). Visual
immediate memory for orientation was found to be significantly less accurate than that for colour, with results
more closely in agreement to those reported by Wolfe et al. This poorer visual memory for orientation was also
noted by Wolfe et al. and may reflect a generally greater perceptual confusability of orientation values
particularly when comparing amongst stimuli which are symmetrical across their vertical midline (Wolfe &
Friedman-Hill, 1992).
vi We would like to thank an anonymous reviewer for drawing our attention to this possibility.