vicious cycle of poverty in haor region of bangladesh: impact
146
Grants for Advanced Research in Education (GARE) Program Ministry of Education, Government of Bangladesh VICIOUS CYCLE OF POVERTY IN HAOR REGION OF BANGLADESH: IMPACT OF FORMAL AND INFORMAL CREDITS Professor Dr. Md. Nazrul Islam Department of Business Administration Shahjalal University of Science and Technology Sponsored by
-
Upload
khangminh22 -
Category
Documents
-
view
0 -
download
0
Transcript of vicious cycle of poverty in haor region of bangladesh: impact

Grants for Advanced Research in Education (GARE) Program
Ministry of Education, Government of Bangladesh
VICIOUS CYCLE OF POVERTY IN HAOR REGION OF BANGLADESH: IMPACT
OF FORMAL AND INFORMAL CREDITS
Professor Dr. Md. Nazrul Islam
Department of Business Administration
Shahjalal University of Science and Technology
Sponsored by

VICIOUS CYCLE OF POVERTY IN HAOR REGION OF BANGLADESH:
IMPACT OF FORMAL AND INFORMAL CREDITS1
Abstract
This research attempts to explore the key research questions of: what are the different
microcredit programs in Haor area in Bangladesh? And do microcredit programs have a positive
impact on livelihoods of the clients in terms of selected social indicators viz. income,
consumption, assets, net worth, education, access to finance, social capacity, food security and
handling socks etc. in Haor area in Bangladesh? Utilizing difference-in-difference and factor
analysis, we explore the nature and terms of conditions of available formal and informal micro-
creditss in Haor region of Bangladesh; and investigate the impact of micro-creditss on the
poverty condition of Haor people in Bangladesh. The findings showed that total income of
borrowers has been increased over non-borrowers (z=6.75) significantly. Among the components
of income, non-agricultural income has been increased significantly on the other hand income
from labor sale has been decreased significantly. Total consumption expenditure with its heads
of food and non-food consumption of both formal borrowers and informal borrowers have been
increased over the period 2016-2019 significantly. Most of the key informants agreed that the
findings are very much consistent with prevailing condition of micro-credits in Haor region.
However, some of them raised question about the impacts of micro-credits. They argued that
there is no straightforward positive impact of micro-credits on poverty condition of the
households.
1 Sponsored by the Grants for Advanced Research in Education (GARE) Program, Ministry of Education,
Government of Bangladesh.

Principal Investigator Professor Dr. Md. Nazrul Islam
University Research Centre
Shahjalal University of Science and Technology
Co-Investigator Professor Dr. Sabina Islam
Department of Statistics
Shahjalal University of Science and Technology
Other Contributors
Associate Investigator
Professor Dr. Md Zakir Hossain
Department of Statistics
Shahjalal University of Science and Technology
Research Assistant
Fazlur Rahman
M.S. Graduate Student, Department of Statistics
Shahjalal University of Science and Technology
July 2021

4 | P a g e
TABLE OF CONTENTS
List of Tables ................................................................................................................................... 8
List of Figures ............................................................................................................................... 10
List of Acronyms ........................................................................................................................... 11
Acknowledgement ......................................................................................................................... 12
Executive Summary ....................................................................................................................... 13
CHAPTER ONE: INTRODUCTORY ASPECTS OF THE STUDY ..................................... 24
1.1 Introduction ......................................................................................................................... 24
1.2 Background of the study ..................................................................................................... 24
1.3 Poverty in Bangladesh ........................................................................................................ 25
1.4 Measurement of the incidence of poverty in Bangladesh ................................................... 27
1.5 Trends of poverty in Bangladesh ........................................................................................ 27
1.6 Statement of the problem .................................................................................................... 28
1.7 Literature review ................................................................................................................. 29
1.8 Key research questions ....................................................................................................... 37
1.9 Objectives of the study........................................................................................................ 38
1.10 Conceptual framework of the Study ................................................................................. 39
1.11 Rationality of the study ..................................................................................................... 42
1.12 Scope and limitations of the study .................................................................................... 43
1.13 Conclusion ........................................................................................................................ 44
CHAPTER TWO: METHODOLOGY of the STUDY............................................................ 45
2.1 Introduction ......................................................................................................................... 45
2.2 Survey area.......................................................................................................................... 45
2.3 Designing the sample .......................................................................................................... 45
2.3.1 Sample design for household-level survey .................................................................. 45
2.3.2 Sample design for qualitative component .................................................................... 47

5 | P a g e
2.4 Survey instrument ............................................................................................................... 47
2.5 Data collection .................................................................................................................... 48
2.6 Analytical techniques of data .............................................................................................. 48
2.6.1 Before-after comparison .............................................................................................. 48
2.6.2 Difference-in-differences (DID) method ..................................................................... 49
2.6.3 Factor analysis ............................................................................................................. 50
2.6.4 Discriminant analysis ................................................................................................... 50
2.7 Conclusion .......................................................................................................................... 51
CHAPTER THREE: SOCIO-ECONOMIC FEATURES OF THE SURVEYED
HOUSEHOLDS IN RESPECT OF MICRO-CREDITS PROGRAMs ................................. 52
3.1 Introduction ......................................................................................................................... 52
3.2 Socio-demographic characteristics of the households ........................................................ 52
3.2.1 Profile of respondents .................................................................................................. 53
3.2.2 Profile of the household population ............................................................................. 54
3.3 Housing conditions and facilities of housing ...................................................................... 55
3.3.1 Housing condition ........................................................................................................ 56
3.3.2 Facilities of housing ..................................................................................................... 56
3.4 Landholdings of households ............................................................................................... 57
3.5 Possession of assets by households..................................................................................... 59
3.5.1 Possession of durable assets......................................................................................... 59
3.5.2 Possession of productive assets ................................................................................... 60
3.6 Knowledge and perception of respondents on micro-credits benefits ................................ 60
3.7 Reasons of not getting micro-credits from targeted source by eligible non-borrowers ...... 61
3.7.1 Descriptive statistics on reasons for exclusion from the targeted programs ................ 61
3.7.2 Factor analysis on reasons for exclusion from the targeted micro-credits programs .. 62
3.8 Conclusion .......................................................................................................................... 63
CHAPTER FOUR: PROFILE OF FORMAL AND INFORMAL MICRO-CREDITS ...... 65

6 | P a g e
4.1 Introduction ......................................................................................................................... 65
4.2 Sources and types of micro-credits in Haor region ............................................................ 65
4.3 Terms and conditions of formal and informal micro-credits .............................................. 67
4.4 Volume of over-all loans .................................................................................................... 69
4.5 Payment structure of loans .................................................................................................. 69
4.6 Purpose of micro-credits ..................................................................................................... 70
4.6.1 Descriptive statistics of purposes of micro-credits ...................................................... 70
4.6.2 Inferential statistics of purposes of micro-credits ........................................................ 71
4.7 Expenditure and investment pattern of both formal and informal micro-credits ................ 73
4.8 Comparative economic performance between borrower and non-borrower households: .. 75
4.8.1 Comparison of income between borrower and non-borrower households .................. 75
4.8.2 Comparison of expenditure between borrowers and non-borrower households: ........ 76
4.9 Causes of non–payment of loan .......................................................................................... 76
4.9.1 Descriptive statistics of causes of non-payment of loan in time .................................. 77
4.9.2 Inferential statistics on causes of non-payment of loans in time ................................. 78
4.10 Attitude of borrowers towards micro-credits .................................................................... 80
4.10.1 Descriptive analysis of attitude of borrowers towards micro-credits ........................ 80
4.10.2 Factor analysis of attitudes towards micro-credits ..................................................... 82
4.11 Conclusion ........................................................................................................................ 84
CHAPTER FIVE: CONSEQUENCES OF MICRO-CREDITS ............................................ 85
5.1 Introduction ......................................................................................................................... 85
5.2 Role of micro-credits on graduation of selected socio-economic status of the borrowers . 85
5.2.1 Ensuring food security ................................................................................................. 85
5.2.2 Social status ................................................................................................................. 86
5.2.3 Investment on education and healthcare ...................................................................... 86
5.3 Perceptions on micro-credits of borrowers ......................................................................... 87
5.3.1 Major dimensional factors for not graduating from poverty ....................................... 87

7 | P a g e
5.4 Impacts of micro-credits at the household level ................................................................. 90
5.4.1 Comparison of income related indicators between 2016 and 2019 ............................. 90
5.4.2 Comparison of expenditure and investment between 2016 and 2019 ......................... 91
5.4.3 Net impact of the micro-credits using difference-in-difference method ..................... 91
5.5 A comparative impact of formal and informal micro-credits ............................................. 92
5.5.1 Comparison of income related indicators in-between 2016 and 2019 ......................... 92
5.5.2 Comparison of expenditure and investment on different heads between 2016 and 2019
............................................................................................................................................... 92
5.5.3 Net impact of the micro-credits using difference-in-difference method ..................... 93
5.6 Conclusion .......................................................................................................................... 93
CHAPTER SIX: IMPACT OF MICRO-CREDITS ON POVERTY CONDITION AND
EFFICIENCY OF THE PROGRAM........................................................................................ 94
6.1 Introduction ......................................................................................................................... 94
6.2 Group means and standard deviation of the predictors of the discriminant analysis.......... 94
6.3 Significance of covariates for discriminating formal and informal credits source ............. 96
6.4 Estimation and validation of two-group discriminant analysis........................................... 97
6.5 Estimation of Fisher’s linear discriminant function.......................................................... 100
6.6 Conclusion ........................................................................................................................ 101
CHAPTER SEVEN: FINDINGS FROM THE QUALITATIVE SURVEYS ..................... 102
7.1 Introduction ....................................................................................................................... 102
7.2 Findings............................................................................................................................. 103
CHAPTER EIGHT: SUMMARY OF FINDINGS AND POLICY IMPLICATIONS ....... 107
References .................................................................................................................................. 118
Annex-1: Survey Questionnaire ................................................................................................ 130
Appendices .................................................................................................................................. 137

8 | P a g e
List of Tables
Table 1.1 Distribution of Haor areas of Bangladesh by districts ................................................. 25
Table 1.2 Incidence of poverty in Bangladesh ............................................................................. 28
Table 2 List of selected clusters (mouza/union) for primary data collection ............................... 46
Table 3.1 Household composition by micro-credits receiving status .......................................... 59
Table 3.2 Major dimensional factors for excluding from the micro-credit benefits .................... 63
Table 4.1 Sources and types of micro-credits .............................................................................. 66
Table 4.2 Terms and conditions of micro-credits in Haor region in Bangladesh ........................ 68
Table 4.3 Total, minimum, maximum, average, standard deviation, median and inter quartile
range of micro-credits ................................................................................................................... 69
Table 4.4 Total, average, paid and unpaid amount of loan in Haor regions of Bangladesh ........ 70
Table 4.5 Descriptive statistics of purposes of credits receivers.................................................. 71
Table 4.6 Major dimensional factors behind the purpose of receiving loan ................................ 73
Table 4.7 Expenditure and investment pattern of both formal and informal micro-credits ......... 74
Table 4.8 Sources and status of income between micro-credits receiving and non-receiving
households in Haor region of Bangladesh .................................................................................... 75
Table 4.9 Expenditures between borrower and non-borrower households in Haor region ......... 77
Table 4.10 Descriptive statistics of the cause of non-payment of loan timely............................. 78
Table 4.11 Major dimensional factors for the causes of scheduled non-payment of loan ........... 79
Table 4.12 Distribution of the attitude of borrowers on micro-credits ........................................ 81
Table 4.13 Major dimensional factors of the attitude of borrowers on micro-credits programs . 83
Table 5.1 Before-after comparison of prevalence of households’ food insecurity status by case-
control analysis in Haor regions of Bangladesh ........................................................................... 85
Table 5.2 Before-after comparison of households’ social status in Haor regions of Bangladesh 86
Table 5.3 Case-control comparison for the change in education and health expenditure in Haor
regions of Bangladesh ................................................................................................................... 87

9 | P a g e
Table 5.4 Causes of not over-coming from vicious cycle of poverty of HHs s of Haor regions 88
Table 5.5 Major dimensional factors of the causes of not over-coming from vicious cycle of
poverty among the households of the Haor areas in Bangladesh ................................................. 90
Table 6.1 Group means and standard deviation for group membership of micro-credits receivers
....................................................................................................................................................... 94
Table 6.2 Pooled within-groups correlation matrix of the predictors .......................................... 95
Table 6.3 Test of significance of function and equality of group means for each individual
predictor ........................................................................................................................................ 96
Table 6.4 Estimates of two-group discriminant analysis for formal and informal credits ........... 98
Table 6.5 Validation of the two-group discriminant analysis model ........................................... 99
Table 6.6 Estimates of Fisher’s linear discriminant function by two-group discriminant analysis
..................................................................................................................................................... 101

10 | P a g e
List of Figures
Figure 1 Haor areas of Bangladesh.............................................................................................. 26
Figure 3 Choice of the number of factors for reasons of excluded from micro-credits program 62
Figure 4.1 Choice of the number of components for the purposes of micro-credits ................... 72
Figure 4.2 Scree plot of factors for the causes of non-payment of loan ...................................... 79
Figure 4.3 Choice of the number of components among the attitude of borrowers on micro-
credits programs in Bangladesh .................................................................................................... 82
Figure 5 Choice of the number of components among the causes of not over-coming from
vicious cycle of poverty in Bangladesh ........................................................................................ 88

11 | P a g e
List of Acronyms
BBS Bangladesh Bureau of Statistics
BHWDB Bangladesh Haor and Wetland Development Board
CBN Cost of Basic Needs
CEGIS Center for Environment and Geographic Information Services
DCI Direct Calorie Intake
DID Difference-in-difference
FEI Food Energy Intake
FGD Focus Group Discussions
GoB Government of Bangladesh
HH Household
HIES Household Income and Expenditure Survey
LPL Lower Poverty Line
LPL Lower Poverty Line
MAS Multi-agent systems
MC Micro-credits
MDGs Millennium Development Goals
MFI Micro Finance Institution
MPI Multidimensional Poverty Index
NGO Non-Government Organization
PCA Principal Component Analysis
SACCOS Savings and Credits Co-operative Societies
SFYP Seventh Five Year Plan
SMCP Savings and Micro Credits Program
SPSS Statistical Package for Social Sciences
UP Union Parishad

12 | P a g e
Acknowledgement
The project was funded in the window of Grant of Advanced Research in Education (GARE)
for three years period (July 2018 to June 2021) by the Bangladesh Bureau of Educational
Information and Statistics (BANBEIS) under the Ministry of Education Government of the
People’s Republic of Bangladesh. So, at first, we are grateful to the authorities of BANBEIS for
giving opportunity in conducting the research project. Then we are also grateful to the data
collectors for collecting data from the respondents of survey households. The contribution of
Key Informant Interviewees and In-Depth Interviewees are also mentionable. Professor Dr. Md.
Zakir Hossain, Department of Statistics (SUST) has contributed in designing questionnaire and
sample size. So, we are thankful to him. The research assistant Mr. Fazlur Rahman has
contributed throughout the study in respect of supervision of data collection, compilation and
analysis of data. So, we are indebted to him. Mr. Minhaz Hasan has also contributed for
mapping the project. So, his contribution is not least though at last.
Professor Dr. Md. Nazrul Islam (Principal Investigator)
and
Professor Dr. Sabina Islam (Co-investigator)

13 | P a g e
Executive Summary
Though Haor districts of Bangladesh occupying 13.56% of total area of the country are though
resourceful with water, fishing, mineral and biodiversity and boro-rice cultivation yet the basic
avenues for life and livelihoods are largely absent for the people. The people of the regions are
poorer than the other parts of the country where about one-third people are extreme poor as they
lie below the lower poverty line and only about 30% of them lie above the upper poverty line.
Thus, the lion part of them suffers from food insecurity and others basic needs. Due to the
poverty, most of hoar people depend on borrowings from money lenders and micro-credits
institutions for their livelihood mainly in crisis period and about 80% of them borrowed money
from different formal and informal sources where 59% of them borrowed for purchasing food.
The rate of interest of different types of micro credits varied from 12.5% to 43% and in some
cases, it rose to 110%. The type and nature of both money and food borrowings in the Haor
region are still be unexplored and need an in-depth investigation to make proper policy for the
socioeconomic development of Haor people. Anecdotal evidences showed that most of the Haor
households (HHs) could not overcome the borrowing cycle and as a result they have become
handicapped to the lenders. Conventional literatures evidenced that most of the marginalized
households adopted credits from NGOs and local money lenders at a high interest with rigid
terms and conditions during the shocking/lean period. Most of the times, they could not comply
the rigid terms and conditions and sell their assets to repay the loan. Finally, the victim HHs falls
in credits trap and they could not increase income using the credits as they desired and as a
result, one credits creates another credit persistently. Till today, no rigorous study was found on
this issue and urgent research is essential to achieve the targets of the concerned SDGs
(Sustainable Development Goals # 1, 2 and 10). Considering these the present study has been
conducted to explore the nature of micro-credits in Haor region and evaluate the impact of
micro-credits on the poverty condition using solid ground level data. In conducting the study, we
have adopted cluster-sampling design where Haor-attached mouzas/unions have been treated as
clusters and a total 30 clusters have been covered in the survey. The study has covered 52
borrowers and 26 non-borrowers as control (50% of the cases) respondents from each cluster and
thus, the total sample size of the study stood at 2340 (78×30). The clusters have been selected
using systematic probability proportionate to size (PPS) sampling procedure from the Haor

14 | P a g e
prone districts. In collecting the household-level data from both micro-credits recipient and
control households separate semi-structured questionnaire but in the same form was used where
some parts were applicable for borrowers, some for non-borrowers and some were common for
both. The Key Informant Interviews (KII) has been conducted with the people who have
knowledge on Haor economy and impacts of micro- credits on livelihoods. The key informants
were the community leaders, professionals, and other stakeholders including the NGO delegates
working in Haor areas. The participants of In-depth Interviews were the selected victims of
poverty cycle, local money-lenders and delegates of existing MFIs working in the Haor region.
The study has conducted 30 KIIs and 30 IDIs for having in-depth understanding of the credits-
trap and its impact on poverty situation. In analyzing and presenting the collected data, both
descriptive and inferential statistical tools have been used. The descriptive statistics are
frequency distribution, tabulation, mean standard deviation etc. while inferential statistical tools
are, Z-test, t-test, before after comparison based, Difference-in-Difference (DID) method, factor
analysis and discriminant analysis.
The real data showed that out of total 2340 respondents 69% were borrowers (treatment group)
and 31% were non-borrowers (control group). In terms of relationship of respondents with
household heads lion portion (81%) respondents were the household heads, in terms of gender
76.8% were male and 23.2% were female, in respect of age 62% were between 31-50, in regard
to marital status 92.2% was married and 5% was widowed, in respect literacy more than half of
the respondents attended primary level education, in respect occupational characteristics about
20% engaged in agriculture, 23% in labor selling, 13% in off-farm activities, 19% in
business/service and 18.9% in household work, in respect of income earning nearly half are
found as full-time income earner and about 29% were part-time income earner and 21% had no
earning source while 3% of the respondents had disability.
The distribution of HHs’ population by sex indicated that 51.17% were male and 48.83% female
and from the age perspective 35.2% male and 37.9% female are up to 15 years, 26.7% male and
28.3% female between 16-30 years and 25.5% male 25.3% female are between 31-50 years 6.8%
male, 4.9% female are in between 51-60 age and 5.7% male and 3.7% female are above 60. The
marital status of the population 16 and above showed that the lion part of population is married

15 | P a g e
(66.4% for male and 73% for female) and female population is being getting early married than
their male counterpart, in terms of literacy near half of them has attended primary education and
only about 2% completed graduate and the illiteracy rate was higher of women than men, in
respect of occupation of male aged between 16 and 60 years is 8.9% farming, 13.5% day
laborer, 8.4% off-firm activities 13.7% service/business 11% student, 34.6% household work
and 9.9% others while 71% women is in household work, from earning capacity members
aged 16 and above showed that 28% were full-time earner and about 22% were part-time earner
and about one-quarter male and three-quarters female are found to no work at the survey point.
The ownership pattern of housing showed that about 95% owns house for living and 20% uses
one room, 42% of uses 2 rooms and 10% four and more rooms for living. The data on
landholdings showed that 8.5% HHs had no homestead land, 79.2% owned homestead land
between 1 to 15 decimals and only 12.3% owned homestead land more than 15 decimals, over
two-thirds have no agricultural land and 7% owned agricultural land between 1 to 15 decimals,
8% owned agricultural land between 16 to 50 decimals, and only 17% over 50 decimals.
The data possession of durable assets by HHs showed that 14.8% owned boats 1.2% owned
deep tube well, 20.6% owned tube well and 8.1% owned bicycle, 16.2% owned television, 6.2%
owned drawing room furniture, 28.5% owned watch 69.7% owned electric fan and 89.9% owned
mobile phone. The data on possession of productive assets showed that 664 HHs of borrowers
and 311 of non-borrowers possessed cultivating instruments, in respect possession of livestock
694 HHs of borrowers and 287 HHs of non-borrowers possessed on average 2.39 and 2.73
respectively showing significant difference between the groups. The average possession of
cultivating instruments, livestock is 3.20 and 2.49 respectively. Fifteen causes were given to the
eligible but not receivers of micro-credits to find out the causes of exclusion from micro-credits
and through PCA major four factors are identified as (i) availability of micro-credits, (ii)
institution and lenders, (iii) administration of loan and (iv) governance of loans.
Data revealed that in terms of loan receivers 1595 (99.3%) HHs borrowed cash loan and only
12(0.7%) in kinds and in terms of total amount the percentage is about same (99.29% cash and
0.71% in kinds). In terms of sources 1158 HHs (72.1%) borrowed from formal sources and 449

16 | P a g e
HHs (27.1%) from informal and in terms of amount of loan 66% from formal and 34% from
informal sources. More in sight it is found that there are sources of formal credits viz. (i)
government (Banks/Co-operatives; and (ii) nongovernment (MFI/NGO/Insurance) and 88 HHs
(5.5%) borrowed from the former and the 1070 HHs (66.6%) from the later and there are three
informal sources viz.(i) local money lender ; (ii) non-interest loan (Relatives/ friends/ neighbors);
and (iii) more than one sources and the data revealed that 393 HHs (24.5%) has taken loans
from the first, 53 HHs(3.3%) from the second and only 3 HHs(0.2%) from the third and in terms
of amount of loan 89.84% from the first, 9.88% from the second and 0.28% from the third.
Among the informal sources 408 HHs (90.9%) have taken from interest bearing sources and HHs
41(9.1%) from non-interest bearing and respect of amount loan 95.3% from the former and
4.70% from the latter. The data revealed that minimum amount of all types of loans is Tk. 2000,
maximum amount of formal loan, informal loan, in total are Tk. 550,000 and Tk. 11, 00,000 and
11, 00,000 respectively and mean is Tk. 34596 for formal and 45475 for informal and 37636 in
total. Among the informal loans maximum amount of interest bearing and non-interest bearing
are Tk. 1100000 and 150000 respectively. The mean of interest bearing and non-interest bearing
are loans are Tk. 47696 and Tk. 233656 respectively. In respect of interest rate for formal
credits 525 HHs got loan at 11% to 15% following 211 HHs 16% to 20%, 171 HHs between
21% and 25%, 141 HHs up to 10% and only 110 HHs at above 25%. In case of informal credits
185 HHs borrowed at more than 25% following 106 HHs 1% to 10%, 55 HHs 11% to 15%, 21
HHs between 21% and 25% and 41 HHs at interest free. The data on type of installment revealed
that in case of formal credits most of the HHs borrowed weekly and monthly basis while in case
of informal credits most of them monthly and annual basis. In overall the lion parts of HHs
borrowed on weekly, monthly and annual (634, 681 and 238 respectively) basis. The number of
installments revealed that in case of formal credits most of HHs borrowed on 24 and 2 to 12
installment bases while incase informal credits most of them borrowed on 2 to 12 and one time
installment basis and in overall most of them on 2 to 12 and more than 24 basis. The data
revealed that most of the HHs (1096) borrowed informal loans for one year and formal loans
(317 HHs) also for one year duration and in overall most of them (1413 HHs) for one year
duration. In fact, all the loans of both formal and informal (1512 HHs) are non-collateral basis.
The payment status of loans showed that 86% loan is recovered in time. The analysis of unpaid
loan explored that 946 HHs of formal credits in which 944 principal and 945interest failed to pay

17 | P a g e
loan in time and 402 informal borrowers in which 401 of principal and 326 of interests are in
unpaid. In overall, 1348 HHs are in unpaid in which 1345 principal and 1271 interest. There
were seventeen purposes of credits receiving and through PCA these dimensions are reduced into
five factors as (i) daily life and livelihoods, (ii) adaptability of natural shocks and farming (iii)
cropping and raring cattle the elements, (iv) business and marriage and (v) sending family
member to abroad. The respondents were given a list of 24 expenditures and investments items
of their loans and among those 14 items were marked by them. The items marked by 10% or
above borrowers in case of formal credits are family enterprise (15.76%), agricultural inputs
(15.09%), food consumption (15.05%), others (13%) and payment of loan (12.03%) similarly in
case of informal micro-credits the these are food consumption (23.24%), others (16.86%),
payment of loan (12.97%) and healthcare (11.68%). In total the top five sectors of expenditure
and investment are food consumption (17.34%), others (14.08%) family enterprise (13.60%),
agricultural inputs (13.03%) payment of loan (12.29%).
The annual income of borrowers depicted that income of majority 1053 (66%) HHs comes from
labor sale and in total 60 million (36%) following from agriculture 830 (56%) and in total 40
million (24%) non-agriculture 83 (52%) HHs and in total 36 million (22%), from business 400
(25%) HHs and in total 28 million (17%), from donations 208 (13%) and in total 2 million (1%).
The annual income of majority 464(63%) non-borrowers comes from business and in total
income 25millions (34%) following from agriculture 333(45%) HHs and in total 15 million
(20%), non-agriculture 331 (45%) HHs’ and in total 18 million (25%), from business 197(27%)
HHs and in total 15 million (20%) and from donations 81 (11%) HHs. It is seen that 22% of non-
borrowers HHs under the pressure of debt. There are significant differences between income of
borrowers and non-borrowers in respect of non-agriculture and debt.
Data on expenditure of both borrowers and non-borrowers HHs depicted that both the borrowers
and non-borrowers HHs incurred expenditure for consumption in respect of both food and non-
food but borrowers HHs incurred 80% for food and 20% for non-food while non-borrowers HHs
incurred 84% for food and 16% for non-food and there is significant difference in respect non-
food consumption as well as total consumption between borrowers and non-borrowers HHs.
There are twelve items of investment expenditure and the items above 5% of total expenditure

18 | P a g e
of borrowers HHs are agriculture (20%), healthcare (20%) family business (16%), house repair
(9%) and poultry /livestock (7%) while in respect of non –borrowers the investment items above
5% of in terms of percentage of total expenditure are healthcare (27%), agriculture (23%),
education (18%), family business 9% and house repair (9%). There is significant difference
between borrowers and non-borrowers in the items of education, healthcare, poultry/livestock,
productive assets, durable goods, house repair, others investment and also in total investment
expenditure as well as total expenditure (consumption plus investment).
In analyzing the causes non-payment of loan in time showed that the top five for non-payment of
loans agreed by formal borrowers are installment period is very short (80.9%) following rate of
interest is very high (70.6%), natural calamities (67.9%) medical treatment/medicine (67.7%),
acute food problem (63.7%). Similarly, the top five causes agreed by informal borrowers are rate
of interest is very high (92.8%) following misappropriation of loan (82.8%), medical
treatment/medicine (80.5%) installment period is very short (72.2%) and natural calamities
(71.1%). In total top five causes of nonpayment of loans are installment period is very short
(78.1%), rate of interest is very high (77.8%), medical treatment/medicine (71.9%),
misappropriation of loan (69.2%) and natural calamities (68.9%). The PCA reduced the fourteen
causes into four factors as related to food and medicine following marriage and legal problems,
terms of loan and investment and lastly related to cost of loan.
Data portrayed that among the sixteen dimensions on attitudes of borrowers towards
microcredits the top five positive dimensions of formal borrowers are -(i) by micro-finance your
food security has increased (54.3%); (ii) micro-finance is helping you in better access to
healthcare(53.8%); (iii) micro-finance is helping you in better financial situation of your
family(50.7%); (iv) due to micro-finance, employment opportunities have been increased(45.6%)
and (v) by micro-finance your income has increased (44%). In case of informal borrowers the top
five positive dimensions are- (i) local loans are easier to get than MFIs (76.8%); (ii) micro-
finance is helping you in better access to healthcare (61.2%); (iii) by micro-finance your food
security has increased (56.1%); (iv) micro-finance is helping you in better financial situation of
your family (52.3%); and (v) Operational assistance received from MFIs was helpful to run the
business (49.4%). In total top five negative dimensions are (i) cost of local loans is lower than

19 | P a g e
MFIs (73.6); (ii) local lenders are friendly than MFIs (58.4%); (iii) terms and conditions of local
loans are easier than MFIs (57.9); (iv) duration of credits is sufficient (56.4%); and (v) by micro-
finance your savings has increased (56.1%). The PCA reduced the sixteen causes into four
factors as related to income and savings following terms of loans, cost of loans and security of
food and health.
In analyzing the role of micro-credits on graduation of selected socioeconomic status of the
borrowers showed that in graduation of food security status the borrowers are found more food
secured than the non-borrower households. The proportion of households with moderate food
insecurity is significantly (p<0.01) reduced to 14.5% from 19.0% due to micro-credits program.
The incidence of normal food insecurity also significantly (p<0.01) reduced to 9.3% from 16.2%.
On the other hand, such type of changes is also observed among non-borrower households but
the decrease was found notably lower and statistically insignificant. In graduating socio-
economic status data showed that the percentage households having extreme poor and
moderately poor condition are estimated lower after receiving micro-credits. The micro-credits
have significant influence for reducing extreme poverty condition among credits receiving
households though the proportion also reduces to the non-borrower households but the
decrement was statistically insignificant. In respect of graduation of investment on education the
data showed the percentage of households with the increase of educational expenditure are
estimated higher in case of borrower households (63.8%) than that of non-borrower households
(51.0%) and the average educational expenditure increases significantly among borrower
households as well as among non-borrower households. In respect of and healthcare investment
data revealed that in case-control comparison healthcare expenditure has increased more among
borrower household (70.1%) than non-borrower household (60.3%) and healthcare expenditures
among borrower households has increased after inclusion in microcredits than the before
inclusion significantly but it is insignificant in case of non-borrower households.
The analysis to find out the causes of not graduating from poverty in spite of using micro-
credits among both case and control HHs fourteen dimensions were listed to the respondents and
the data showed that the principal cause was found as natural calamity among non-borrower
households (75.3%) and pressure of the payment of loan among borrower households (83.9%).
20 | P a g e
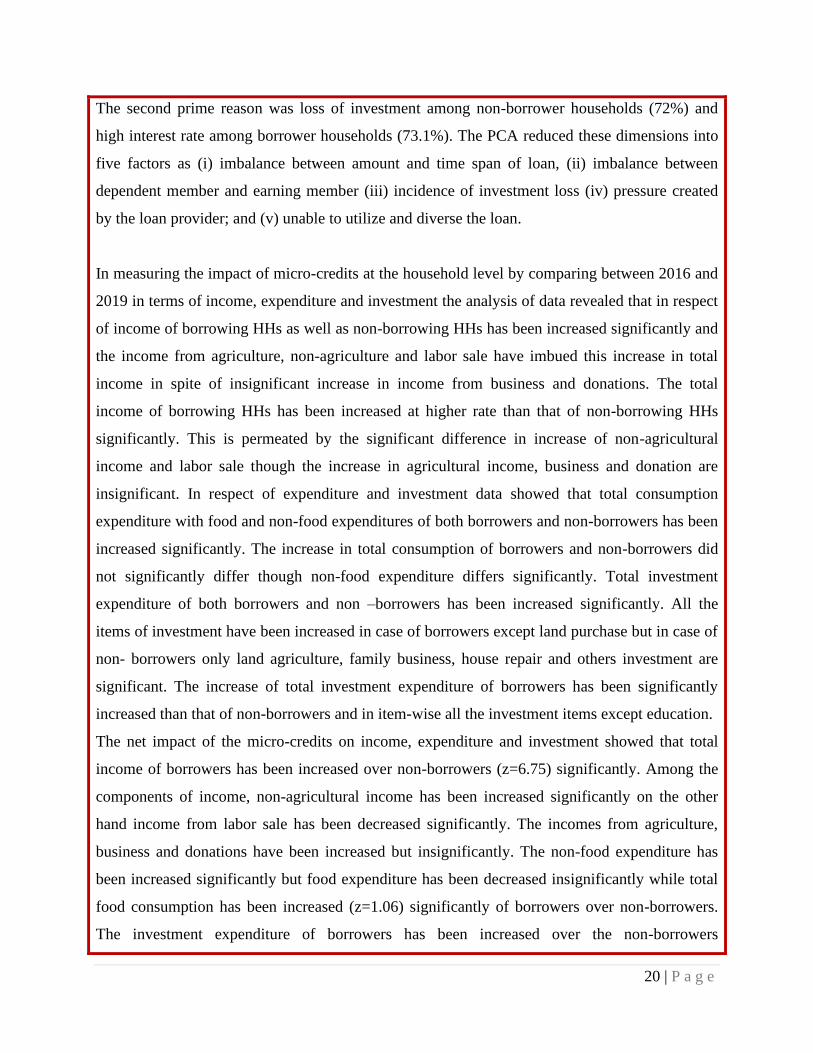
The second prime reason was loss of investment among non-borrower households (72%) and
high interest rate among borrower households (73.1%). The PCA reduced these dimensions into
five factors as (i) imbalance between amount and time span of loan, (ii) imbalance between
dependent member and earning member (iii) incidence of investment loss (iv) pressure created
by the loan provider; and (v) unable to utilize and diverse the loan.
In measuring the impact of micro-credits at the household level by comparing between 2016 and
2019 in terms of income, expenditure and investment the analysis of data revealed that in respect
of income of borrowing HHs as well as non-borrowing HHs has been increased significantly and
the income from agriculture, non-agriculture and labor sale have imbued this increase in total
income in spite of insignificant increase in income from business and donations. The total
income of borrowing HHs has been increased at higher rate than that of non-borrowing HHs
significantly. This is permeated by the significant difference in increase of non-agricultural
income and labor sale though the increase in agricultural income, business and donation are
insignificant. In respect of expenditure and investment data showed that total consumption
expenditure with food and non-food expenditures of both borrowers and non-borrowers has been
increased significantly. The increase in total consumption of borrowers and non-borrowers did
not significantly differ though non-food expenditure differs significantly. Total investment
expenditure of both borrowers and non –borrowers has been increased significantly. All the
items of investment have been increased in case of borrowers except land purchase but in case of
non- borrowers only land agriculture, family business, house repair and others investment are
significant. The increase of total investment expenditure of borrowers has been significantly
increased than that of non-borrowers and in item-wise all the investment items except education.
The net impact of the micro-credits on income, expenditure and investment showed that total
income of borrowers has been increased over non-borrowers (z=6.75) significantly. Among the
components of income, non-agricultural income has been increased significantly on the other
hand income from labor sale has been decreased significantly. The incomes from agriculture,
business and donations have been increased but insignificantly. The non-food expenditure has
been increased significantly but food expenditure has been decreased insignificantly while total
food consumption has been increased (z=1.06) significantly of borrowers over non-borrowers.
The investment expenditure of borrowers has been increased over the non-borrowers

21 | P a g e
significantly. Among the heads of investment expenditure healthcare, poultry livestock and
productive assets have been increased significantly of the borrowers over non-borrowers while
investment on education, agriculture, family business, house repair, land purchase and others
investment have been increased insignificantly. Therefore, total expenditure, total investment
and savings of borrowers have been increased significantly over the non-borrowers.
The more insight a comparative impact of formal and informal micro-credits in terms income,
expenditure and investment showed that the total income and its heads of income from
agriculture, non-agriculture and labor sale have been increased significantly of formal borrowers
over the study period while in case of informal credits total income and its heads of income from
agriculture and labor sale have been increased significantly. The heads of income from business
and donations in case of formal credits and incase of informal credits the heads of income from
non-agriculture, business and donations have been increased insignificantly. Data on total
consumption expenditure with its heads of food and non-food consumption of both formal
borrowers and informal borrowers have been increased significantly. In case of formal
borrowers’ total investment expenditure and its entire heads except land purchase and house
repairing have been increased significantly. The increase in total consumption of borrowers and
non-borrowers did not significantly differ though non-food expenditure differs significantly.
Total investment expenditure of both borrowers and non –borrowers has been increased
significantly. All the items of investment have been increased in case of borrowers except land
purchase but in case of non- borrowers only land agriculture, family business, house repair and
others investment are significant. Thus, the increase of total investment expenditure of borrowers
has been significantly increased than that of non-borrowers and in item-wise all the investment
items except education. The net impact on income and its heads showed that total income and its
entire heads do not differ significantly among the formal and informal sources except donation
income which has been decreased (z=-20.6) of formal sources over informal sources
significantly(p=.001).The data on total consumption showed that incase of formal borrowers the
total consumption has two heads and total consumption and food consumption did not change
significantly over informal borrowers (z=-13.68) but non-food expenditure has been decreased of
formal borrowers than informal borrowers significantly ((p=<0.01). Total investment has been
increased (z=18.53) of formal borrowers than that of informal significantly (p=<0.01) among the

22 | P a g e
items of investment, education, agriculture, poultry–livestock, productive assets and durable
goods have been increased significantly of formal borrowers over informal borrowers on the
other hand investment in health care, family business, house repair, land purchase and others
investment have been decreased significantly. The total expenditure and savings have been
increased of formal borrowers over informal significantly. The discriminant analysis between
formal and informal borrowers was done in respect of following fifteen predictors(variables):
gender, age, loan occupation, earning status, number of earning members, dependency ratio,
regularity of income, assets index, types of toilets, quantity of land, total annual income, amount
of loan, types of installments, duration of loan and interest rate. The analysis of data showed that
there is significant discriminant between the two groups of borrowers in respect all predicators.
Based on the estimates of the discriminant analysis such as Un-standardized coefficients,
Standardized coefficients and Structure Matrix we found the magnetite of discriminating power
of the predictors. The top most ten magnitude predictors are types of installments followed by
duration of loan, interest rate, gender, earning status, regularity of income, occupation, number
of earning members, age and amount of loan. We have established the Fisher’s linear
discriminant function for discriminating the formal and informal source of credits by the fifteen
stated variables above to predict or classify a new individual with the respective characteristics
who are supposed to borrow from formal source or informal source. The average of the functions
at group centroid is estimated at 0.44. Therefore, it is obvious that new members with
discriminant scores above 0.44 supposed to borrow from the informal sources, otherwise he/she
would be preferred to borrow from formal sources. The qualitative survey showed that though
there are numerous formal sources yet, the Haor people still depends on informal sources of
micro-credits for covering the emergency situation like treatment of household members,
covering the cost of food items during severe food shortages. The interest rate of micro-credits
from informal sources is sometimes rose to 60% in some season, particularly before harvesting
the crops. On the other hand, the interest rate of micro-credits is remains constant throughout the
year for institutional sources like banks, NGOs etc. The qualitative survey showed that the main
purpose of getting loans is for food expenditure, repairmen of living house, investment in
agriculture farming, investment in purchasing livestock, and expenditure for treatment of
household members are the main reasons for receiving micro-credits. The causes of not getting
formal and informal micro-credits are they do not know about some micro-credits programs,

23 | P a g e
nepotism, misappropriation of credits, lack of entry fee/bribe and bureaucratic problem. The
heads of utilization of micro-credits are to meet-up the food expenditure, repairing the living
house, investment in agriculture for harvesting crop along with loan repayment. The borrowers
told that the rate of interest is very high, credits period is insufficient and terms are rigid. The
causes of ineffectiveness of micro-credits for poverty reduction perspective are the lack of
policy, lack of skills, and investment in non-productive heads appeared as the hindrances for
effectiveness of the micro-credits on the perspective of poverty reduction. The main suggestions
for maximization of benefits from micro-credits are that in general, the micro-credits from
informal sources should be stopped, the volume of loan should be increased at lower rate, the
micro-credits from formal sources should be encouraged for the households whose members
acquired capability of start any economic activity through skill-development program. The
government could undertake a plan of action to review the existing micro-credit programs. Skill-
development training programs should be strengthening covering different investment areas for
the adult members of credit-receiver households and finally new research may be undertaken to
find out different pathways for eradication of poverty of Haor people in order to achieve the
targets of SDGs.

24 | P a g e
CHAPTER ONE
INTRODUCTORY ASPECTS OF THE STUDY
1.1 Introduction
The Haor region is an economic lacked area of Bangladesh due to geographical remoteness and
persistent negligence in development plan. As a result, the socioeconomic conditions of the Haor
people are not up to the mark as others parts of the country. Though Government of Bangladesh
(GoB) and many foreign and Non-Government Organizations (NGOs) have taken many
development projects to improve their socioeconomic situations yet they are sufferings from
unavailability of many socioeconomic benefits specially food insecurity, water and sanitation
etc. Many of them are living on credit from formal and informal sources and persistently they are
failing to come out from the credit. The first chapter of the study covered the followings:
❖ Background of the study;
❖ Poverty in Bangladesh;
❖ Measurement of incidence of poverty in Bangladesh;
❖ Trends of poverty incidence of Bangladesh;
❖ Statement of the problem
❖ Literature review;
❖ Key research questions
❖ Objectives of the study
❖ Conceptual framework of the study
❖ Rationality of the study;
❖ Scope and limitations of the study; and
❖ Conclusion of this chapter.
1.2 Background of the study
Haors are bowl-shaped large tectonic depressions which receive surface runoff water and
consequently become a very expensive water bodies in the monsoon and mostly dries up during
post-monsoon period. Haor districts (Sunamganj, Sylhet, Habiganj, Maulvibazar, Netrakona,
Kishoreganj and Brahmanbaria) of Bangladesh cover 19,998 sq. km land, which is 13.56% of

25 | P a g e
total area of the country. According to Center for Environment and Geographic Information
Services (CEGIS) the total land of the Haor districts is about 43% (8585 sq. km) is under
wetland (Haor) where 373 Haors are exists (CEGIS, 2012). The statistics of Haors in
Bangladesh is given in Table-1.1.
Table 1.1 Distribution of Haor areas of Bangladesh by districts
Districts Total area in ha
(% of total)
Haor area in ha
(% of total)
No. of Haor
(% of total)
Sunamganj 367,000 (18) 268,531 (31) 95 (25)
Sylhet 349,000 (17) 189,909 (22) 105 (28)
Habiganj 263,700 (13) 109,514 (13) 14 (4)
Maulvibazar 279,900 (14) 47,602 (6) 3 (1)
Netrakona 274,400 (14) 79,345 (9) 52 (14)
Kishoreganj 273,100 (14) 133,943 (16) 97 (26)
Brahmanbaria 192,700 (10) 29,616 (3) 7 (2)
Total 1,999,800 (100) 858,460 (100) 373
Source: Master Plan of Haor Area, Volume,1, Summary Report, Government of the People’s Republic of
Bangladesh Ministry of Water Resources Bangladesh Haor and Wetland Development Board. p.1.
The Haor region has long been lagging behind the main stream of the national development due
to geographical location and considering this, in 1974, then the Government of Bangladesh
(GoB) established an independent Board for the development of the Haor region (CEGIS, 2012).
Following this establishment of the Board, the GoB established the Bangladesh Haor and
Wetland Development Board (BHWDB) through a resolution approved by the Cabinet in 2000.
The mandate of the BHWDB is to coordinate the activities and formulate projects relating to a
holistic development of the Haor and wetlands of the country (CEGIS, 2012). The map of Haor
regions is given in Figure-1.1 (page 25).
1.3 Poverty in Bangladesh
Poverty alleviation is considered to be one of the most important indicators of the socioeconomic
development of a state and society. Bangladesh has achieved remarkable development in poverty
alleviation during the last few decades as a result of the combined efforts of both the
Government and non-government sectors. According to the ‘Millennium Development Goals:
End period Stocktaking and Final Evaluations Report’ the incidence of poverty has declined 1.74

26 | P a g e
percentage points on an average in Bangladesh during 2000-2010 against the MDGs target of
1.20 percentage points. According to the recently published ‘Household Income and Expenditure
Survey 2016’ the present poverty rate is 24.3 percent whereas it was 56.7 percent in 1991. The
Government has set up a target to reduce the poverty to 18.6 percent at the end of the 7th Five
Year Plan (2016-2020). Despite all these positive changes in poverty reduction, still one-fourth
population of Bangladesh lives below the poverty line. It would not be possible to attain the
desired level of socioeconomic development without emancipating this portion of population
from poverty. For this reason, the Government still considers poverty alleviation as a major
agenda on the policy and development issues of the country. Bangladesh has achieved a
significant progress in the Human Development Indicators. According to the UNDP
Development Report-2016 the position of Bangladesh has been ranked at 139-th among 187
countries. Furthermore, the report reveals that Bangladesh’s Multidimensional Poverty Index
(MPI) reduced to 0.188 in 2016 from 0.237 in 2007.
Figure 1 Haor areas of Bangladesh

27 | P a g e
1.4 Measurement of the incidence of poverty in Bangladesh
The measurement of the incidence of poverty in Bangladesh is taken from the report of
Household Income and Expenditure Survey (HIES). At present, the survey is renamed as
Household Income and Expenditure Survey (BBS, 2016). The first HIES in Bangladesh was
carried out in FY 1973-74 and after that up to FY 1991-92, few HIESs were conducted
maintaining the same strategies of the first one. HESs were accomplished by Food Energy Intake
(FEI) and Direct Calorie Intake (DCI) method. According to this survey, a man having calorie
intake of less than 2,122 kilo-calories daily to be considered as absolute poor. On the other hand,
a man having an intake of below 1,805 kilo-calories is considered as hard-core poor. The
Bangladesh Bureau of Statistics (BBS) has adopted ‘Cost of Basic Needs (CBN)’ for HIES for
the first time in 1995-96. The same method applied in the HIES in 2000, 2005 and 2010. This
method also considered non-food consumption items for compiling poverty index. The latest
HIES has been undertaken in 2016 and recently its result has been published.
1.5 Trends of poverty in Bangladesh
The incidence of income poverty (measured by CBN considering the upper poverty line)
declined nearly 7 percent (from 31.5 percent to 24.3 percent) over the period in 2010-2016.
During this period, the compound poverty declined 4.23 percent annually. On the other hand, the
rate of income poverty declined from 40.0 percent to 31.5 percent from 2005 to 2010. At that
time, compound poverty got reduced by 4.67 percent each year. Therefore, it is evident that
though poverty is decreasing gradually, the pace of reduction rate declined during the period of
2010-2016 compared to the period of 2005-2010. In urban areas poverty reduction rate is higher
(4.68 %) than rural areas (1.97%). During 2010 to 2016, the reduction rate of the depth of
poverty (measured by poverty gap) was 4.28 percent. It has also been observed that income
poverty reduction rate in urban areas is lower than that of rural areas (1.61% and 5.12%
respectively). Moreover, the reduction rate of the depth of severity of poverty (measured by
squared poverty gap) was also lower in urban areas compared to rural areas. The trends of
poverty are depicted in table 1.2. The HIES-2016 reveals that on the basis of lower poverty line
poverty rate in 31 districts is above national average. On the other hand, using the upper poverty
line poverty rate in 36 districts is above national average.

28 | P a g e
Table 1.2 Incidence of poverty in Bangladesh
Index 2016 2010 Annual Change (%)
(2010 to 2016) 2005
Annual Change (%)
(2005 to 2010)
Head Count Index
National 24.3 31.5 -4.23 40.0 -4.67
Urban 18.9 21.3 -4.68 28.4 -5.59
Rural 26.4 35.2 -1.97 43.8 -4.28
Poverty Gap
National 5.0 6.5 -4.28 9.0 -6.3
Urban 3.9 4.3 -1.61 6.5 -7.93
Rural 5.4 7.4 -5.12 9.8 -5.46
Squared Poverty Gap
National 1.5 2.0 -4.68 2.9 -8.81
Urban 1.2 1.3 -1.33 2.1 -8.64
Rural 1.7 2.2 -4.21 3.1 -8.75
Source: BBS-2019 (Report of HIES 2016)
1.6 Statement of the problem
As stated earlier, haors are bowl-shaped large tectonic depressions which receive surface runoff
water and consequently become a very expensive water bodies in the monsoon and mostly dries
up during post-monsoon period. Most of the Haors are in the districts of Sunamganj, Sylhet,
Habiganj, Maulvibazar, Netrakona, Kishoreganj and Brahmanbaria as given in table-1.1 of
Bangladesh cover 19,998 sq. km land, which is 13.56% of total area of the country. Among the
total land of the Haor districts, about 43% (8585 sq. km) area is wetland where 373 Haors are
exists (CEGIS, 2012). Though the Haor regions are resourceful with water, fishing, mineral and
biodiversity and Boro-rice cultivation, but the basic avenues for life and livelihoods are largely
absent. The people of the Haor regions are poorer than the other parts of the country. The long
seasonality of wet monsoon (6-7 months from May to October) forces the Haor people to remain
out of work for most of the times (HILIP, 2011). It is documented that nearly one-third of the
Haor people are extreme poor as they lie below the lower poverty line and only about 30% of the
Haor people lie above the upper poverty line (Chowdhury, 2014; HILIP, 2011). As a
consequence, the lion part of Haor-people suffers from food insecurity and others basic needs
(Kazal et al., 2017). Due to the poverty, most of Haor people depend on borrowings from money
lenders and micro-credits institutions for their livelihood, mainly in crisis period. A study

29 | P a g e
documented that about 80% of Haor people borrowed money from different formal and informal
sources and 59% of them borrowed for purchasing food (Kazal et al., 2010).
The rate of interest of different types of micro credits in Bangladesh varied from 12.5% to 43%
and in some cases, it rose to 110% (Institute of Microfinance, 2015). The rate of interest for
informal sector might be higher than the formal sectors. The type and nature of both money and
food borrowings in the Haor region are still unexplored and needs an in-depth investigation to
make proper policy for the socioeconomic development of Haor people of the country.
Anecdotal evidences showed that most of the Haor households could not overcome the
borrowing cycle and as a result they become handicapped to the lenders. Conventional literatures
evidenced that most of the marginalized households adopted credits from NGOs and local money
lenders at a high interest with rigid terms and conditions during the shocking/lean period. Most
of the times, they could not comply the rigid terms and conditions and sell their assets to repay
the loan. Finally, the victim households’ fall in credits trap and they could not increase income
using the credits as they desired; and as a result, one credit creates another credit persistently.
Till today, no rigorous study was found on this issue and urgent research is essential to achieve
the targets of the concerned SDGs (Sustainable Development Goals # 1, 2 and 10).
The study has been designed to explore the nature of micro-credits in Haor region of Bangladesh
and evaluate the impact of micro-credits on the poverty condition using solid ground level data.
The study has adopted both quantitative and qualitative approaches to collect the necessary data
and information. In particular, household-level data has been gathered from both micro-credit
recipient and control households. The qualitative data has been gathered through Key-Informant
Interviews (KIIs) and In-depth Interviews (IDIs) from stakeholders and micro-credits recipients
(including money lenders) respectively. The study has employed different descriptive statistical
tools and techniques including mean, SD, factor analysis, discriminant analysis etc. in analyzing
the data.
1.7 Literature review
There are a number of studies (Schreiner Mark, 2001; Mazumder Mohummed Shofi Ullah and
Wencong Lu, 2013; Bangladesh Bank, 2015; Rahman Sayma, 2007; Habib & Jubb, 2015;

30 | P a g e
Khandker Shahidur R. 2003, 2005; CGAP, 2010; Chowdhury M. Jahangir Alam et al., 2002 ;
Rabby Talukder Golam, 2012; Khanom Nilufa A., 2014; Zama Hassan,2001; Ahmed
Salehuddin,2017; Uddin Mohammed Salim, 2011; Shoji Masahiro, 2008; Fant Elijah Kombian,
2010; Lawrence Peter,2004) recognized that benefits of micro credits exceeds cost and it
instilled borrowers income, assets endowment, standard of living and poverty reduction,
productivity of business and agriculture, increase wealth, savings, mobilize local economy,
boost consumption, ensure sustainable finance for major expenses and increase capacity to cope
with shocks, improve food intake , create sustainable community and increase acquisition of
asset. Anthony Denise (2005) found that micro-credits as competing mechanisms has differential
effects in group identity sanctions and help in borrowing more of the group. Alam Saad, (n.d)
and Rankin Katharine N. (2001) opined that micro-credits amplify self-help approach and
enhance self-employment profit by 50% to 81%. Micro credits enhances credits facilities and
heighten repayment performance of borrowers (Ogaboh et al., 2014; Barboza and Barreto, 2006;
Giné and Karlan , 2007 & 2009).The long- run effects of micro-credits reduce inequality in the
society (Ahlin and Jiang, 2005) and make free poor people from the curse of poverty (Khandakar
Shahidur R., 1998). The borrowers of micro-creditss get training facilities on different soft and
hard skills (Karlan and Valdivia, 2006) and in household level play positive role in risk
management (Karlan and Zinman,2009). Midgle James (n.d.) found that micro-credits and
microfinance programs helped either to create small businesses or strengthened existing small
businesses in low-income communities. Angelucci et al. (2013) found the average effects of
micro credits on a rich set of outcomes and found that no transformative impacts, but more
positive than negative impacts. Banerjee et al. (2011) showed the randomized impact of a micro-
credits program to reach the poorest of the poor and elevate them out of extreme poverty and
revealed that the program results in a 15% increase in household consumption. Moreover, a
microcredit program targeted ultra-poor in haor areas has proven a short-run positive impacts on
other measures of household wealth and welfare, such as the efficient utilization of scarce
resources and promoting entrepreneurial activities (Alam and Hossain, 2018). Morduch Jonathan
(1999) experienced that many relatively poor households can save in quantity when given
attractive saving vehicle with micro-credits. A variant strand of literature found that micro
finance is used as an instrument of crisis and risk management and limits the migration from
rural to urban and help in creating and sustaining informal employment (Hossain and Ahamed,

31 | P a g e
2015; Shahnaz et al. 2018). Choudhury Haque Ariful et al. (2017) found that micro-credits have
a significant positive impact on household income, expenditures and savings and also the level of
education plays an important statistically significant role in increasing the household income,
expenditure and savings. Rika Terano et al. (2015) micro-credits programs have effectiveness on
earning ability, payment scheme, member’s cooperation, and well-being and improve
significantly the total income after joining the program. Khanam Dilruba et al. (2018)
established that the micro-loans have a statistically significant positive impact on the poverty
alleviation index and consequently improve the living standard of borrowers by increasing their
level of income and child nutritional outcomes (Islam, Alam, and Afzal, 2021). Islam Asadul et
al. (2014) found that households’ access to microfinance reduces the incidence of borrowing
from informal sources, but not the amount of borrowing and less poor households benefit more
in terms of reducing their reliance on informal borrowing and that the benefit accrues over time
and also found that access to microfinance increases women’s informal borrowing for small
consumption usage, without facilitating access to new business opportunities. Ferdousi Farhana
(2018) attempted to measure the effectiveness of microenterprise loans on increasing
entrepreneurs’ incomes and innovation and found the positive impact on entrepreneurs’ incomes.
Rana Muhammad Sohail Jafar et al. (2017) showed that microfinance is an innovative way to
poverty reduction because microfinance services poor people who can utilize their skills for
enhancement of household economic growth, educate their children and enhanced quality of life
of the poor resulting the more contribution to economic development and enhance the capacity to
fight against hunger and poverty alleviation.
Micro-credits play positive role in empowering women (Rahman Sayma, 2007; Khandker
Shahidur R., 2005; Omorodion, 2007). Pitt Mark M. and Khandker Shahidur R. (1998) found
micro credits program has a larger effect on the behavior of poor households in Bangladesh
when women are the program participants then men. Ahmed Ferdoushi (2011)explored that,
‘with credits’ women have a much lower percentage of poverty in terms of its incidence (80%),
intensity (28%) and severity (12%) compared to the ‘without credits’ respondents (99, 59 and
37% respectively) and also found that educational attainment of the respondents and income
earners in the family contribute positively to reduce poverty situation among the ‘with credits’
households more, as compared to ‘without credits’ households and his final conclusion was

32 | P a g e
that micro-credits program helps the rural women to reduce their poverty more effectively.
Abdalla Nagwa Babiker (2009) found that majority of women in Sudan live with low or no
income; economically they are dependent on their husbands' income; burdened with their
household activities and responsibilities to feed; educate and take care of many children,
encounter a core problem which is lack of access to credits and financial services to
economically, socially and politically empower themselves and improve their status. Rahman
Aminur (1998) indicated that worker and borrowing peer loan group members in centers press
on clients for timely repayment, rather than working to raise collective consciousness and
borrower empowerment as envisaged in the Bank's public transcript. Mwongera Rose K. (2014)
identified that majority of the young women entrepreneurs had borrowed money from the nearby
micro-finance institutions the loan accrues interest rate imposed by the financial institutions as
well as demand for collateral security and they found it unreasonable he also found out that most
of the entrepreneurs had attained secondary school certificate as their highest academic
qualification and was a determinant for uptake of loans and established that licensing of more
financial institutions would encourage uptake of loan among women entrepreneurs since uptake
of loan is low and this would influence business performance. Noreen Sara (2011) has made an
attempt to explore the socio-economic determinants of women empowerment in which
microfinance is crucial economic determinant. The results showed that women empowerment is
considerably influenced by age, education of husband, father inherited assets, marital status,
number of sons alive and microfinance. Age, education of husband, no of live sons and father
inherited assets are more statistically significant variables in this study. Bhattacharjee Priyanka
(2016) unveiled that most women failed to understand the process and effectiveness of micro-
credits programs and took loan for meeting the cash-demand of the male(s) within family as the
feel micro-credits as a medium to fulfill their emergency requirements. She also found that lack
of education, awareness, unwillingness to join other programs of microfinance institutions,
pessimistic thinking about micro-credits programs, hostile family structure, negligent attitude
towards repayment of loan(s), limited investing opportunities, etc. are the main causes that
hinders the road to development. Afrin Sharmina et al. (2008) showed that the financial
management skills and the group identity of the women borrowers have significant relationship
with the development of rural women entrepreneurship in Bangladesh and the experience from
the parent’s family of the borrowers and the option limit may also lead to the rural women

33 | P a g e
borrowers to be entrepreneurial. Mohamed Fauzia Mtei (2008) argued that women and micro
credits agencies have divergent understandings of money and its investment and its role in
poverty reduction, and even a long-run impact on their degree of environmental awareness
(Alam and Zakaria, 2021). Simojoki Hanna-Kaisa (2003) examined the socio-economic impact
of micro-finance on urban female micro-entrepreneurs in Nairobi, Kenya and found that micro-
credits play crucial role in empowering women in business control and decision making.
Adeyemo Comfort Wuraola (2014) examined the influence of vocational skills acquisition and
micro-credits loans on widows‟ socio-economic and psychological adjustments in South-western
Nigeria and found that vocational skill acquisition centers afforded widows the opportunities to
share their pains and experiences, thus assisting them to reduce loneliness, frustration, health-
related problems and adjust to the reality of spouse’s death. Vocational skill acquisition and
micro-credits loans considerably assisted widows in overcoming their socio-economic hardship
and psychological challenges. Karubi Nwanesi Peter (2006) established that micro-credits
provide finance to enhance market and rural women’s participation in production and trade. The
study further ascertains that woman have some control over their loans. Churk Josephine Philip
(2015) examined the Contribution of Savings and Credits Co-operative Societies (SACCOS) on
promoting rural livelihood revealed that SACCOS have played minimal role towards promoting
rural livelihoods in the study area. Waliaula Rael Nasimiyu(2012) conducted the study to
evaluate the relationship between micro-credits and the growth of SMEs in Kenya and found
that there was a very strong positive relationship between the variables. Gomez Rafael (2001)
examined the determinants of self-employment success for micro-credits borrowers and found
that social capital is a positive determinant of self-employment earnings and neighborhoods play
in fostering social capital and improving micro-entrepreneurial performance. Asgedom and
Muturi (2014) analyzed the socio-economic factors that affect the institution’s loan repayment
performance and revealed that the level of education, loan amount and loan category have
insignificant effect on the probability of the Savings and Micro Credits Program (SMCP) loan
repayment. On the other hand, age, gender, type of business and credits experience are
significant determinants where age and type of business have negative relationship and gender
and credits experience have positive relationship with the loan repayment probability. Islam
Khan Jahirul (2014) argued that to get positive impact from micro-credits in reduction of poverty
the nature and term should be dynamic with the nature of poverty. Rana Muhammad Sohail Jafar

34 | P a g e
et al. (2017) explored that microfinance empowers the women so women can also contribute in
the economic growth as well.
On the other hand, there are many scholars (Rogaly Ben, 1996; I.G. Okafor, 2016) who have
found that micro credits programs have negative and insignificant role on poverty reduction.
Diagne Aliou (1999) found that a higher share of land and livestock in the total value of
household assets is negatively correlated with access to formal credits. However, land remains a
significant determinant of access to informal credits. Matsuyama Kiminori (2006) found that a
movement in borrower net worth can shift the composition of the credits between projects with
different productivity levels and showed how investment-specific technological change may
occur endogenously through credits channels. Furthermore, such endogenous changes in
investment technologies in turn affect borrower net worth. These interactions could lead to a
variety of nonlinear phenomena, such as credits traps, credits collapse, leapfrogging, credits
cycles, and growth miracles in the joint dynamics of the aggregate investment and borrower net
worth. Osmani and Mahmud (2015) found that the impact of micro-credits on the lives and
livelihoods of the poor remains a contentious issue, there is no disputing the fact that there is
something novel, something special, about micro-credits that has allowed an altogether new
mode of financial intermediation to emerge, providing credits to millions of hitherto ‘un-
bankable’ poor without breaking the lender’s back. That is an extraordinary achievement in
itself. Nissank (2002) examined economics of microfinance as an instrument of microenterprise
development and poverty reduction as well as its delivery mechanisms and also assessed
empirical evidence of the performance of microfinance institutions and their impacts on poverty
alleviation and microenterprise development. The donors target might have unintended negative
effects on the very objectives of poverty reduction and microenterprise development. Ahlin
Christian (2009) extended the theory of micro credits movement management to examine
sorting when group size is larger than two and joint liability can take several forms and found
that moderately homogeneous sorting by risk in support of Ghatak’s theory and proved the
evidences of risk anti-diversification within groups while the anti-diversification results revealed
a potentially negative aspect of voluntary group formation and point to limitations of micro-
credits groups as risk-sharing mechanisms. Fasorant M.M. (2010) showed that the incidence of
poverty was high among the economically active age bracket as the mean age was 33 years of
the borrowers and all respondents acquired formal education as 60% had above primary school

35 | P a g e
education and 39.2% of total respondents had no specific occupation before the inception of
micro-credits scheme.
Some scholars found both positive and negative impact of micro-credits on poverty. Bylander
Maryann (2014) found that using micro credits in combination with migration allows households
to immediately meet consumption goals and utilize the credits being actively promoted by
microfinance institutions but also retreating from insecure and less profitable local livelihood
strategies. Mwangi and Sichei (2018) made a comparative study between the period 2006 and
2009 on access to credits of Kenyans using multinomial probit models and found that increase
in household size reduced access to bank loans and ASCAs while it promoted access to loans
from buyers of harvest. Increase in distance to service provider led to a decline in access to
credits even though the impact was marginal. On the other hand, increase in age; education and
income tend to enhance access to credits but the probability of access drops as one draws close to
retirement age. Mamun et al. (2013) argued that microfinance has developed innovative
management and business strategies by mobilizing the savings, loan repayment and
empowerment of women, but its impact on poverty reduction remains in doubt. It certainly plays
an important role in providing safety-net and consumption smoothening but identifying how
microfinance can be used as an important vehicle to make an even larger and more critical
contribution to alleviating poverty is in need of more careful assessment. Banerjee et al. (2015)
showed the causal evidence on micro-credits impacts informs theory, practice, and debates about
its effectiveness as a development tool and found that a consistent pattern of modestly positive,
but not transformative effects. Angelucci et al. (2013) showed that the average effects on a rich
set of outcomes measured of micro-credits suggest some good and little harm but estimators
identify heterogeneous treatment effects and effects on outcome distributions, but again yield
little support for the hypothesis that micro-credits cause harm. Khandker Shahidur R. et al.
(2014) examined the level of indebtedness of the micro credit borrowers in Bangladesh with
assumption that some borrowers might be taking loans that they will not be able to repay. He
found that 26% of micro-credits borrowers are over-indebted while 22% of non-micro-credits
borrowers. Cons and Paprocki (2010) opined that micro-credits and other ‘self-help’
development strategies operate through idealized notions of poverty and rural life. The scholars
explored the ongoing debate over micro-credits in his study area and reflect on how re-rooting

36 | P a g e
debates over development in specific places might move such debates from questions of ‘self-
help’ to grounded and historicized projects of self-determination. Selinger Evan (2008) remarked
on the debates about the Grameen Bank’s micro-lending practices depict participating female
borrowers as having fundamentally empowering or disempowering experiences and found that
this discursive framework may be too reductive. It can conceal how technique and technology
simultaneously facilitate relations of dependence and independence and it can diminish our
capacity to understand and assess innovative development initiatives. Babajide Abiola (2012)
found that access to microfinance does not enhance growth of micro and small enterprises in
Nigeria. However, other firm level characteristics such as business size and business location, are
found to have positive effect on enterprise growth. Karlan and Zinman (2011) found that
microloans increase ability to cope with risk, strengthen community ties, and increase access to
informal credits and therefore micro-credits here may work, but through channels different from
those often hypothesized by its proponents.
Few scholars have come to find the impact of micro credits on the livelihoods of hoar area of
Bangladesh. Among them Kazal et al. (2010) found the impact of micro credits on reduction of
poverty and found the 40% of micro-credits receivers could not repay loan and fall in vicious
cycle of credits. According to Khondker Bazlul Haque and Mahzab Moogdho Mim (laaging
district dev.) the monthly per capita income is the third lowest of Sunamganj district which is
only 2156 while the per capita monthly expenditure is 1978 the 11th lowest among the 15 lagging
districts in Bangladesh. According to Consulting Group to Assist the Poor (CGAP) in (2010)
micro finance helps hundreds of millions of people keep their consumption stable, finance major
expenses, and cope with shocks despite incomes that are low, irregular, and unreliable in hoar
area of Bangladesh. Planning Commission (2016) recommended from the workshop on
“Environment and Climate Change Policy Gap Analysis in Haor Areas” that Haor area is
enriched with valuable aquatic flora and fauna including different species of fish, other natural
resources and natural habitat. The Haor basin has its ecological and economic importance and
plays a vital role in the growth of the country but it is urgent to incorporate the economic
importance on the Hoar areas in the national curriculum, particularly for the pupils of the hoar
districts, so that the new generation can understand economic and environmental significance.
37 | P a g e
There two types of micro credits such as formal and informal and there is difference of impact
between these two types. Gichuki et al. (2014) found that the key challenges hindering micro
and small enterprises from accessing credits facilities to be high cost of repayment, strict
collateral requirements, unwillingness of people to act as guarantors, high credits facilities’
processing fees and short repayment period in case of formal micro- credits hence they
recommended that financial institutions(formal sources) set more flexible, affordable and
attractive requirements in financing micro and small enterprise while, Kazal et al. (2010) found
that in the Haor area informal credits is more stronger than formal sector. Barnaud et al. (2008)
explored the Multi-agent systems (MAS) and the results of a series of simulations exploring the
ecological, social and economic effects of various rules for formal and informal credits suggested
by the villagers-participants. The study highlighted the ability of MAS to deal with interactions
between social and ecological dynamics and to take into account social interactions, in particular
the concept of social capital which is a determining factor when dealing with sustainability
issues. Secondly, the study addressed the potential and limits of MAS models to support a
bottom-up (or participatory) modeling approach. This experiment suggests that the usefulness of
models relies much more on the modeling process than on the model itself, because a model is
usually useless if it is misunderstood by its potential users, or if it does not respond to their
current preoccupations. The intuitive representation of real systems provided by MAS and their
high flexibility are the two underlined characteristics favoring their appropriation by local
stakeholders. Phan Dinh Khoi (2012) in his PhD dissertation investigated the determinants of
households’ borrowing decisions in terms of formal and informal micro-credits and micro-credits
accessibility and found that informal micro-credits alter the households’ decisions to obtain a
formal microcredit. Khan Mohammad Mohaiminuzzaman (2013) in his master’s thesis found
that green formal micro-credits is becoming more popular among the natural resource-dependent
borrowers in Bangladesh in haior based area
1.8 Key research questions
The key research questions of the project are:
i. What are the different MC programs in Haor area in Bangladesh?
ii. What are the different MC programs run by the government in Haor area in Bangladesh?

38 | P a g e
iii. What are the different MC programs run by the non-government/donors /agencies in
Haor area in Bangladesh?
iv. Do MC programs have a positive impact on livelihoods of the clients in terms of selected
social indicators viz. income, consumption, assets, net worth, education, access to
finance, social capacity, food security and handling socks etc. in Haor area in
Bangladesh?
v. Whether the MF clients are improving more their socioeconomic condition than non-
clients in Haor area in Bangladesh?
vi. Whether the cost of micro-credits is higher than the rate of internal return of it or not in
Haor area in Bangladesh?
vii. Whether the volume of micro-credits is insufficient in terms of productive investment or
not in Haor area in Bangladesh?
viii. Whether the duration of credits is shorter than the client's need for productive outcome or
not in Haor area in Bangladesh?
ix. Whether the payment schedule of credits is tighter than the expectations of clients in
Haor area in Bangladesh?
x. Whether the continuation of credits is enough or not for productive outcome in Haor
area in Bangladesh?
xi. Whether there is any difference of impact of micro credits in terms of duration in Haor
area in Bangladesh?
xii. Whether there is any difference of impact of micro credits in terms of volume of credits
in Haor area in Bangladesh?
xiii. Which type of credits among formal and informal does have more impact on poverty
reduction of the borrowers in Haor area in Bangladesh?
xiv. Do all the eligible borrowers get credits in Haor area in Bangladesh?
xv. How does productive outcome of credits vary from one to another MC program in Haor
area in Bangladesh?
1.9 Objectives of the study
In response of the above questions the objectives of the project are designed to:

39 | P a g e
• explore the nature and terms of conditions of available formal and informal micro-creditss in
Haor region of Bangladesh; and
• investigate the impact of micro-creditss on the poverty condition of Haor people in
Bangladesh
1.10 Conceptual framework of the Study
Vicious cycle of poverty means a rotation of a sum of forces tending to act and re act one another
in such a way as to keep a poor man in a state of poverty permanently. For example, when a man
does not get enough food day by day, he became so weak and ultimately, he failed to earn and
remains poor or weak for a long time which pushes him to death. Thus, who are poor remain
poor because they are poor. Garcíay Carrasco (2004) point out that “poverty reproduces poverty”
and define vicious circle of poverty “as a circular dynamic of factors and lacks which feedback
each other”. As stated earlier in the literature reviews there are many studies (Schreiner Mark,
2001; Mazumder Mohummed Shofi Ullah and Wencong Lu, 2013; Bangladesh Bank, 2015;
Rahman Sayma, 2007; Habib & Jubb, 2015; Khandker Shahidur R. 2003, 2005; CGAP, 2010;
Chowdhury M. Jahangir Alam et al., 2002 ; Rabby Talukder Golam, 2012; Khanom Nilufa A.,
2014; Zama Hassan,2001; Ahmed Salehuddin,2017; Uddin Mohammed Salim, 2011; Shoji
Masahiro, 2008; Fant Elijah Kombian, 2010; Lawrence Peter,2004) that micro-creditss reduces
poverty and help the borrowers to come out from vicious cycle of poverty . Micro-creditss
enhance the self -help approach and enhance self-employment (Rankin Katharine N. (2001) and
boosts borrowing capacity of group (Anthony Denise, 2005). It improves repayment
performance of borrowers (Ogaboh et al., 2014; Barboza and Barreto, 2006; Giné and Karlan,
2007& 2009), reduce inequality in the society (Ahlin and Jiang, 2005) and make free poor
people from the curse of poverty (Khandakar Shahidur R., 1998). The borrowers of micro-
creditss get training facilities on different soft and hard skills (Karlan and Valdivia, 2006) and in
household level play positive role in risk management (Karlan and Zinman,2009). Midgle James
(n.d.) Micro-credits helped either to create small businesses or strengthened existing small
businesses in low-income communities. Banerjee et al. (2011) found that micro-credits elevate
the poor out of extreme poverty Morduch Jonathan (1999) found that micro-credits act as a
vehicle of savings. Shahnaz et al. (2018) explored that micro-credit is as an instrument of crisis
management. Micro-credits fuels household income, expenditures and savings and also the level

40 | P a g e
of education (Choudhury Haque Ariful et al.,2017) and boosts earning ability, payment scheme,
member’s cooperation, and well-being and improve significantly the total income after joining
the program (Rika Terano et al., 2015; Khanam Dilruba et al.,2018). Islam Asadul et al. (2014)
found access to microfinance increases women’s informal borrowing for small consumption
usage. Ferdousi Farhana (2018) attempted to measure the effectiveness of microenterprise loans
on increasing entrepreneurs’ incomes and innovation and found the positive impact on
entrepreneurs’ incomes. Rana Muhammad Sohail Jafar et al. (2017) found that micro-credits
help to gather skills, utilization of the skills of the members/borrowers, educate their children and
enhanced quality of life of the poor results the more contribution to economic development and
enhance the capacity to fight against hunger and poverty alleviation. Micro-creditss play positive
role in empowering women (Rahman Sayma, 2007; Khandker Shahidur R., 2005; Omorodion,
2007; Pitt Mark M. and Khandker Shahidur R., 1998; Ahmed Ferdoushi, 2011). Abdalla Nagwa
Babiker (2009) found that access to credits and financial services to women makes economically,
socially and politically empower themselves and improve their status. Mwongera Rose K. (2014)
identified that micro-credits helped entrepreneurs to attain highest academic qualification and
helped licensing of more financial institutions for women entrepreneurs. Noreen Sara (2011)
showed that women empowerment is considerably influenced by microfinance with others.
Bhattacharjee Priyanka (2016) unveiled micro-credits as a medium to fulfill their emergency
requirements of women. Afrin Sharmina et al. (2008) found micro-credits provides financial
management skills and the group identity of the women borrowers and helps the development of
rural women entrepreneurship in Bangladesh. Adeyemo Comfort Wuraola (2014) proved that
micro-credits assisted in acquiring vocational skill to widows by which they overcome their
socio-economic hardship and psychological challenges. Karubi Nwanesi Peter (2006) established
that micro-credits provide finance to enhance market and rural women’s participation in
production and trade. Nasimiyu (2012) found that micro-credits significantly helped in the
growth of SMEs. Rana Muhammad Sohail Jafar et al. (2017) explored that microfinance
empowers the women so women can also contribute in the economic growth as well.
According to Khondker Bazlul Haque and Mahzab Moogdho Mim(laaging district dev.) the
monthly per capita income is the third lowest of Sunamganj district which is only 2156 while the
per capita monthly expenditure is 1978 the eleventh lowest among the 15 lagging districts in

41 | P a g e
Bangladesh. Planning Commission (2016) recommended from the workshop on “Environment
and Climate Change Policy Gap Analysis in Haor Areas” that Haor area of Bangladesh is
enriched with valuable aquatic flora and fauna including different species of fish, other natural
resources and natural habitat. It also asserted that the Haor basin has its ecological and economic
importance and plays a vital role in the growth of the country. Furthermore, the Climate Fiscal
Framework is developed by the Finance Division (Finance Division, 2014) under the support of
the. Poverty Environment and Climate Mainstreaming (PECM) Project focuses on the eradicate
poverty and reduce inequalities through sustainable development in haor-basin areas by
designing a governance framework for climate change funds in haor areas under national fiscal
policy. Kazal et al. (2010) found that 40% of micro-credits receivers could not repay loan and
fall in vicious cycle of credits in the Haor region of Bangladesh. According to Consulting Group
to Assist the Poor (CGAP) in (2010) micro finance helps hundreds of millions of people keep
their consumption stable, finance major expenses, and cope with shocks despite incomes that are
low, irregular, and unreliable in Hoar area of Bangladesh. Khan Mohammad
Mohaiminuzzaman (2013) in his master’s thesis found that green formal micro-credits is
becoming more popular among the natural resource-dependent borrowers in Bangladesh in Haor
based area. Kazal et al. (2010) found that in the Haor area informal credits is stronger than
formal sector. Considering the above discussion, the conceptual framework of the study is given
in the following diagram:
Improved economic activity
Income
Consumption Productive investment
Under the vicious cycle of poverty
Low income Low saving Low investment Low production Low income
Received Micro-credits benefit

42 | P a g e
1.11 Rationality of the study
The review of literature revealed that micro credits have positive as well as a negative impact on
of poverty alleviation on the other hand there are many studies showing both positive and
negative and also neutral impact on poverty through different means or ways. Micro-creditss
have a positive impact on a variety of micro-economic indicators including self-employment,
business activities, household consumption and well-being (Bauchet et al., 2011). On the other
hand, many studies showed that micro-credits programs have either a positive or limited impact
on poverty reduction (Zeller& Meyer, 2003; Amin et al., 2001). About 33.33 million people
included in micro credits services out which 91% women and total loans allocated about
1362750 million (MRA, Brucher 2020). However, the formal sectors through micro-finance
institutions (MFIs) contribute nearly half of the credits and the rest are coming from informal
sector. The formal sector loans need collateral. However, the credits services are even to render
to the extreme poor households without any collateral and third-party guarantee in case of
informal sectors (Mujeri, 2015). Generally, loans are provided under intensive monitoring
mechanisms along with high interest rate in case of informal sectors. A number of studies in
Bangladesh proved that the positive impact of micro-creditss on clients with regard to material
well-being, reduction in exposure to seasonal vulnerability, contributions to consumption
smoothing, and a better ability to deal with crises (Khalily 2004; Mustafa et al., 1996). On the
other hand, many witnesses also found against the micro credits. Islam (2014) showed that
access of micro credits leads to an increase in vulnerability for those households which are
chronically poor. Poor peoples are trapped in the vicious cycle of poverty since the emergence of
micro-credits and are failing to come out from the cycle of poverty as well as micro credits (Pitt
and Khandker, 1996; Khandker, 2001). Another study found that 26% of micro-credits
1. Food security
2. Labor sale
1. Skill development
2. Agricultural investment
3. Fishing, livestock & poultry
4. Small business
Increase net income and get out from poverty

43 | P a g e
borrowers are over indebted (Khandker et al., 2014). Therefore, there are debates on the actual
impact of micro-credits in improving the wellbeing of the poor (Montgomery and Weiss, 2005).
People of Haor areas in Bangladesh are regarded as backward section citizens as they are far
behind from the main-stream population of the country in terms of education, per capita income,
per capita consumption, roads and electricity facility, infant mortality and poverty (Khondker
and Mahzab, 2015). It is documented that 56% of households of Bangladesh use micro-creditss
(Khandker et al., 2014). This rate is extremely high for Haor regions as it is documented that
about 80% of households borrowed money from different sources (Kazal, et al., 2015). As 70%
of Haor people are poor and suffer from food insecurity, most of them have no alternative other
than micro-credits, either formal or informal sectors, for their survival. The terms and conditions
of micro credits are not important issues at the time of receiving micro-credits for Haor people.
It is observed that local money lenders lend with rigid terms of references, which are generally
fail to comply by most of the borrowers and consequently, most of the borrowers take one credits
to repay another credit, and finally they remain in debt persistently. As a result, most of them
could not improve their poverty condition which is known as vicious cycle of poverty. A very
few studies with limited coverage are found in Haor areas on micro credits (Khan, 2014; Uddin,
2011), which are not sufficient to understand the actual scenario of the nature and behavior of
micro-credits on livelihoods. In addition, no study has been found to deal with the impact of
micro-credits in details. From the view of policy perspective, the exploration of the nature and
behavior of existing micro-credits is of utmost importance to remove the vicious cycle of poverty
of Haor people. The quantification of the impact of these micro-credits on life and livelihood
will guide for proper policy implementation. Hence an in-depth study on the nature and impact
of micro-credits, both formal and informal, is very much important for this very region. For
doing this, the study is planned to discover the existing nature and availability of micro credits in
the Haor areas meticulously and find out the negative facets of micro credits which are
especially accountable for vicious cycle of poverty.
1.12 Scope and limitations of the study
The study has designed to explore the nature of micro-credits in Haor region of Bangladesh and
evaluate the impact of micro-credits on the poverty condition using solid ground level data. The

44 | P a g e
study has adopted both quantitative and qualitative approaches to collect the necessary data and
information. In particular, household-level data has been gathered from both micro-credits
recipient and control households. The qualitative data has been gathered through Key-Informant
Interviews (KIIs) and In-depth Interviews (IDIs) from stakeholders and micro-credits recipients
(including money lenders) respectively. The study has used different descriptive statistical tools
and techniques including instrumental variable regression and logistic regression to analyze the
data. That the study has unveiled the existing credits-trap in Haor regions and has also identified
the factors acting for vicious cycle of poverty for proper policy formulation. But in collecting
data from the borrowers and non-borrowers it is observed that the respondents are not interested
to provide actual data on their income, expenditure, assets and liabilities. As a result the study
has failed to present actual data in the regards.
1.13 Conclusion
The present chapter has presented background of the study, poverty in Bangladesh and its
measurement and trends, statement of the problem, literature review, research questions,
objectives and conceptual framework, rationality and scope and limitations of the study. The
methodology of the study is presented in the next chapter.

45 | P a g e
CHAPTER TWO
METHODOLOGY OF THE STUDY
2.1 Introduction
In the previous chapter we have presented the background, problem literature review, rationality
objectives and scope of the study. Following the previous chapter, the study has adopted both
quantitative and qualitative techniques to gather the data and information and, in this line, the
present chapter aims to discuss the methodology followed in conducting the study
2.2 Survey area
The study has covered the six Haor prone districts of Bangladesh viz. Sunamgong, Sylhet,
Moulvibazar, Habiganj, Kishoreganj and Netrokona. Among these districts Haor are mostly
concentrated in Sunamgonj, Netrokona and Kishorgonj districts. According to the Haor Master
Plan sources, there are 370 Haor in the aforesaid six districts and only three belong to
Brahmanbaria district as stated in table 1.1 earlier. The selected clusters are given in table 2
(page 44).
2.3 Designing the sample
2.3.1 Sample design for household-level survey
The study has adopted cluster-sampling design and Haor-attached mouzas/unions have been
treated counted as clusters. A total of 30 clusters have been covered in the survey. Thirty clusters
are regarded as statistically representative sample of a population by internationally recognized
survey designs, such as WHO’s EPI cluster sampling design (Turner et al., 1996). The
recognized sample size determination formula2 [on the basis of 70% indicator percentage.
(proportion of households lie below the upper poverty line), 95% confidence interval, 0.04p
relative precision and highest response distribution with an assumed design effect 1.5] yields that
at least 1544 targeted (micro-credits recipient) households are required to cover for the study.
For rounding-up in clusters, the study increased the sample size from 1544 to 1560. Since one of
2Deff
p
Zppn
−=
2
2
)04.0(
)1(where, p is the indicator percentage, Z is the value of normal variate with 95%
confidence interval, 0.04p is the relative error margin and Deff is the design effect.

46 | P a g e
the core objectives of the study is to evaluate the impact of micro-credits on poverty cycle, hence
a control group must be selected to apply the sophisticated statistical techniques. The study has
covered 780 households as control (50% of the cases). The characteristics of the control
households are almost similar to the cases (micro-credits recipient) households. Thus, the total
sample size of the proposed study was 2340 poor households.
Table 2 List of selected clusters (mouza/union) for primary data collection
Cluster No District name Upazila name Union name
1 Sylhet Osmani nagar Pachim Pailanpur
2 Habiganj Ajmiriganj Kakailseo
3 Sunamganj Jamalganj Beheli
4 Sunamganj Jamalganj Fenarbak
5 Sunamganj Sunamgnaj sadar Rangar Char
6 Sunamganj Jagannathpur Raniganj
7 Sunamganj Jagannathpur Raniganj
8 Sunamganj Derai Charnachar
9 Sunamganj Derai Taral
10 Sunamganj Dakshin Sunamganj Shimulbag
11 Sunamganj Dakshin Sunamganj Patharia
12 Sunamganj Doarabazar Surma
13 Sunamganj Tahirpur Tahirpur
14 Sunamganj Tahirpur Uttor Badaghat
15 Sunamganj Tahirpur Balijuri
16 Sunamganj Bishwamvarpur Dakshin Badaghat
17 Sunamganj Dharmapasha Chamardani
18 Kishorganj Itna Mriga
19 Kishorganj Nikli Jaraitala
20 Kishorganj Nikli Jaraitala
21 Kishorganj Katiadi Masua
22 Habiganj Lakhai Bulla
23 Habiganj Baniachong Kagapasha
24 Habiganj Baniachong Subidpur
25 Habiganj Ajmiriganj Shibpasha
26 Netrokona Mohangonj Suair
27 Netrokona Mohangonj Magan Siadhar
28 Netrokona Mohangonj Magan Siadhar
29 Sunamganj Shalla Bahara
30 Sunamganj Shalla Shalla
The clusters have been selected using systematic probability proportionate to size (PPS)
sampling procedure. Since the numbers of Haor are different in the six districts (Annex 1), a
stratified random sampling with proportional allocation was adopted to estimate the number of
Haor from each district (stratum).

47 | P a g e
Therefore, following steps have been adopted in order to select the clusters and sample
households:
i. The number of Haors in each of the six strata was determined and defined.
ii. The Haors have been selected individually from the six strata using systematic PPS
sampling procedure.
iii. A mouza/union has been selected randomly from each of the selected Haors.
iv. The UNICEF pencil-spin method was used to select the households randomly within the
cluster.
v. Finally, 52 micro-credits recipient households and 26 control households have been
selected for interview from each cluster, totaling 2340 households from 30 clusters.
2.3.2 Sample design for qualitative component
The Key Informant Interviews (KII) have been conducted with the people who have knowledge
on Haor economy and impacts of micro credits on livelihoods. The key informants were the
community leaders, professionals, and other stakeholders including the NGO delegates working
in Haor areas. The participants of In-depth Interviews were the selected victims of poverty
cycle, local money-lenders and delegates of existing MFIs working in the Haor region. The
study has conducted 30 KIIs and 30 IDIs for having in-depth understanding of the credits-trap
and its impact on poverty situation.
2.4 Survey instrument
A structured interview schedule (questionnaire) has been developed and administered for
conducting household survey. The questionnaire contained several sections, viz., profile of
household members, basic household information and possessions of assets, knowledge on
microcredits, profile of micro-credits including expenditure and investment pattern, and impact
of micro-credits on livelihood issues, causes of nonpayment of loan, causes of not overcoming
from poverty etc. The detail interview was conducted with the borrowers about availability of
borrowings, volume of borrowings, sources of borrowings, socioeconomic condition before and
after borrowings, time period of borrowings, repayment of borrowings, cost of borrowings, terms
of reference of borrowings, household’s savings, behavior of lenders etc. Separate Checklists
have been prepared and used to collect the data through IDIs and KIIs. The IDIs have been

48 | P a g e
conducted covering the availability of the micro-credits in the community; interest rate of micro-
credits in the community; purposes receiving micro-credits; causes of not getting formal and
informal micro-credits; heads of utilization heads of micro-credits; attitudes of borrowers on
formal and informal micro-credits programs; causes of ineffectiveness of micro-credits for
poverty reduction perspective; causes of remaining poor after using micro-credits and
suggestions for maximization of benefits from micro-credits.
2.5 Data collection
A well-trained fieldwork team was employed and sent to the project locale for collecting data
and information. The Field Assistants were the graduate level students of Shahjalal University of
Science & Technology. They have been given 5-day long training on different aspects of the
questionnaire and research objectives. It is to be noted that the Field Assistants were selected
considering their competence on project objectives as well as communication with local dialects.
The questionnaire and the checklists were designed in such a way as to cover maximum but
relevant and useful information and data for the survey. The Supervisors was randomly re-
interviewed some sample units to check and validate the already collected data by Field
Assistants.
2.6 Analytical techniques of data
The study has used several descriptive tools and inferential techniques to achieve the project
objectives. Among the descriptive statistical tools, percentage, average, cross-tabulation, Chi-
square test, Z-test, t-test and F-test have been used to analyze the data. On the other hand, the
study used case-control (borrowers vs. non-borrowers) comparison, before-after (2016 vs. 2019
assuming before borrowing and after borrowing) comparison, Diff-in-diff technique, factor
analysis and discriminant analysis as inferential techniques. The brief description of the
analytical techniques is given below:
2.6.1 Before-after comparison
This study would try to explore the productive outcomes of micro-credits programs through
evaluating their explicit performances. Due to lack of baseline data of the study households, this
study intends to assess the productive outcomes in three different ways:

49 | P a g e
i. comparing the socio-economic status of beneficiary (borrower) households with their non-
beneficiary counterparts;
ii. comparing the current socio-economic status of beneficiary (borrower) with their status
before entering the program (before-after comparison);
iii. comparing the current socio-economic status of study households, both beneficiary
(borrower) and non-beneficiary (non-borrower), with their status before 3 years (before-
after comparison).
2.6.2 Difference-in-differences (DID) method
Difference in differences is typically used by project management to evaluate the impact of
program intervention over a specific time gap. It is a quasi-experimental research design using
observational study data, by studying the differential effect of a treatment on a 'treatment group'
versus a 'control group'. In reality, DID makes use of longitudinal data from treatment and
control groups to obtain an appropriate counterfactual to estimate a causal effect.
To estimate the effect of benefits from micro-credits programs, this study employed DID to
compare the changes in outcome variables over time between a population that is enrolled in a
program (the borrower group) and a population that is not (the non-borrower group). Following
steps have been followed:
i. Estimate the difference of the outcome variables related to socio-economic status by
comparing the current status (at survey date) of beneficiary/borrower households
(Treatment group) with their status before entering the program (the study considered
before 3 years);
ii. Estimate the difference of the outcome variables related to socio-economic status by
comparing the current status (at survey date) of non-beneficiary/non-borrower
households (Control group) with their status before 3 years of the survey;
iii. Estimation of the difference of the above two differences [(ii)-(i)] will yield the net
impact of the benefits from micro-credits.

50 | P a g e
2.6.3 Factor analysis
Factor analysis is a multivariate statistical technique that addresses itself to the study of
interrelationships among a total set of observed variables (Manly, 2005; Rencher, 2002). The
technique allows looking at groups of variables that tend to be correlated to one-another and
identify underlying dimensions that explain these correlations. While in multiple regression
model, one variable is explicitly considered as dependent variable and all the other variables as
the predictors; in factor analysis all the variables are considered as dependent variables
simultaneously. In a sense, each of the observed variables is considered as a dependent variable
that is a function of some underlying, latent, and hypothetical set of factors. Conversely, one can
look at each factor as dependent variable that is a function of the observed variables.
If {X1, X2, … Xn} be a set of n observed variables and {F1, F2, …., Fm} be a set of unobservable
variables then the factor analysis model can be expressed as:
+=− LFX
where mnL is the matrix of factor loadings (coefficient ijl is the loading of i-th variable on the j-
th factor) and µ is a vector of the means of Xi.
Several methods are available in literature to estimate factor loadings and factor scores. The
study considers principal component method to estimate the factor loadings and communalities [
=
=m
j
iji lh1
22 ], a measure of the variation of observed variables through factors. Several factor
rotation methods like ‘Varimax’, ‘Equamax’, ‘Quartimax’ are adopted to find better estimates of
factor loadings. Once the factors are identified and factor loading matrix is estimated then the
estimated values of factors, factor scores, are calculated for each individual. The estimated
values of factor scores are often used for diagnostic purposes as well as inputs to a subsequent
analysis.
2.6.4 Discriminant analysis
The two-group discriminant analysis is used to identify the associated factors which are essential
for discriminating the choice of micro-credits benefits from formal and informal source. Besides,

51 | P a g e
the Fisher’s linear discriminant function provides appropriate direction for classifying an
individual who is supposed to receive credits either from formal source or form informal source
having specific individual and household level characteristics.
Fisher’s Linear Discriminant Function:
The discriminant analysis model involves linear combinations of the following form:
D = b0 + b1×X1 + b2×X2 + . . . + bk×Xk
were,
D = Discriminant score
b0, b1, b2, . . ., bk = Discriminant coefficient or weight
X1, X2, . . ., Xk = Predictor or independent variables
The coefficients, or weights of the Fisher’s linear discriminant function are estimated so that the
groups of the dependent variable differ as much as possible on the values of the discriminant
function.
2.7 Conclusion
The present chapter has explained the methodology used in the study the next chapter has
attempted to explore the socio-economic features of the surveyed households in respect of
micro-credits programs.

52 | P a g e
CHAPTER THREE
SOCIO-ECONOMIC FEATURES OF THE SURVEYED HOUSEHOLDS IN
RESPECT OF MICRO-CREDITS PROGRAMS
3.1 Introduction
The analysis of profile of the households is essentail in describing the kind of subjects involved
in the study. Their profile can provide the delimitation of the study so that what ever finidings
brought out of the study can be described within the ambit only of this profile. So, to have
insights into the micro-creditss outcomes, exploration of these characteristics is essential. To
have the in-depth understanding, the profiles of the surveyed households in terms of socio-
demographic characteristics, landholdings and housing conditions, household assets, and
reasons for exclusion from the targeted micro-credits programs are discussed in this chapter. The
major aspects of analysis are as follows:
❖ Socio-demographic characteristics of the households;
❖ Housing conditions and facilities of housing;
❖ landholdings of households;
❖ Possession of Assets by Household;
❖ Knowledge and perception of respondents on micro-credits benefits; and
❖ Reasons of not getting micro-credits from targeted source by eligible non-borrowers.
These aspects are discussed below:
3.2 Socio-demographic characteristics of the households
This section provides the characteristics of respondents and household members, which are
helpful in identifying the socio-economic behavior of the households. The characteristics of
respondents, viz., age, marital status, educational status, occupation, income earning status,
SSNP benefit status, and disability status have been analyzed according to their micro-credits
borrowing status (appendix table 3.1). On the other hand, the characteristics of the household
members have been analyzed according to the gender as shown in appendix table 3.2.

53 | P a g e
3.2.1 Profile of respondents
The analysis of total respondents (2340) indicates that 69% respondents were borrowers and
31% were non-borrowers. The analyses of relationship of respondents with household heads
indicate that about 81% respondents were the household heads. This proportion respondents as
household head were found significantly (p<0.01) higher for non-borrower households (98.1%)
than borrower households (73.8%). About 24% respondents were identified as husbands/wives
for borrower households.
The distribution of respondents according to sex indicates that 76.8% were male and 23.2% were
female. The age of the respondents has been classified into four classes as 16-30, 31-50, 51-60
and above 60. The age distribution of the respondents indicates that about 17% were of ages 16-
30 years, about 62% were of ages 31-50 years, and only about 7% were of ages over 60 years.
There is no significant variation in the age distribution of the respondents between borrower and
non-borrower households.
The average of age of the respondents is estimated at 42.81 years with a standard deviation of
11.46 years. The average of age of the respondents was found slightly lower for borrower group
of households (42.47 years) than that of borrower group of households (43.57 years). The
analysis of marital status of the respondents indicated that 92.2% were married and 5% were
found as widowed.
Data showed that about 27% of the respondents were found to have no education at all and they
must have no ability to read or write too. A little more than half of the respondents attended
primary level education and it can be inferred that they could hardly read or write. Only about
7.2 of the respondents were found who have completed secondary level of education. There is no
significant variation in the education of the respondents according to the borrowing status of the
households.
It is found out that about 20% the respondents were engaged in agriculture, about 23% were
engaged in labor selling, about 13% in off-farm activities, about 19% engaged in
business/service. Another 18.9% of the respondents are found to engage in household work, most
54 | P a g e
of them were women. Regarding the income earning status of the respondents, nearly half are
found as full-time income earner and about 29% were part-time income earner. About 21% of
the respondents were found to have no earning source. Only about 3% of the respondents are
found have any disability.
3.2.2 Profile of the household population
The socio-demographic characteristics of household population in terms of age group, marital
status, educational status, occupation, income earner and disability status is shown in Appendix
Table 3.2. The distribution of household population according to sex indicates that 51.17% were
male and 48.83% were female (Total population was 11628, out of which 5950 male and 5678
female). For clear understanding of the age distribution of the household population, the age of
the population has been classified into five classes. The first class (0 to 15 years) is found to have
35.2% male and 37.9% female population. The second class (16-30 year) is found to have 26.7%
male and 28.3% female population. The third class (31-50 years) included 25.5% male and
25.3% female population. The fourth class was 51-60 age groups where 6.8% are found male and
4.9% female. The last and fifth class (ages above 60 years) were of 5.7% male and 3.7% female.
The average age of the household population was found 27.52 years (with SD ±18.92 years) for
male and 25.38 years (SD ±17.50 years) for female.
In terms of marital status of the population 16 years or more, the findings indicate that the lion
part of population is married (66.4% for male and 73% for female). The proportion of unmarried
people was found significantly low for female population in comparison with that of the male
population, which indirectly indicates that female population is being getting early married than
their male counterpart.
About 19% of the study population aged 7 years or older was found to have no education at all
and they must have no ability to read or write too. Near half of the study population are found to
attend primary level education and it can be inferred that they could hardly read or write. Only
about 2% people were found who have attained/completed graduate level of education. The
differences in educational attainment by sex showed that illiteracy was higher among women
than men (appendix table 3.2). The proportion of attainment of secondary or higher level of

55 | P a g e
education was found higher for men than women, partly due to gender discrimination against girl
children. Parents favor boys’ education than girls’ with the expectation that the former would
support them in the future. The practices of early marriage of girls, another consequence of
discrimination, also contribute to high female illiteracy.
In respect of occupation the population aged in-between 16 years and 60 years, the occupation
has been categorized into seven groups. The percentage of population in each group were found
as farming - 8.9%, day laborer - 13.5%, off-firm activities -8.4%, service/business - 13.7%,
student - 11%, household work - 34.6% and others - 9.9%. It is to be noted that about 71%
women were engaged in household work, which may include vegetable cultivation, poultry
rearing, weaving mattress, stitch khatha, fire-wood collection, feeding cattle, helping in
agricultural work etc. (Kazal et. al, 2017). Therefore, women might have a significant
contribution to household incomes, specially, income from vegetables, fruits, nursery, poultry,
eggs, handicraft etc.
Regarding the distribution of earning of household members aged 16 years or more, it is found
that about 28% were full-time earner and about 22% were part-time earner and about one-
quarter male and three-quarters female are found to no work at the survey point. The disability
status of the male household members aged 16 years and above indicated that about 4% of the
household members (both male and female) were disabled.
3.3 Housing conditions and facilities of housing
The analysis of housing conditions and landholdings of a household plays an important role in
determining its economic condition. The rural households are mostly depending on land for their
livelihoods and it is considered as permanent asset of a household. The analysis of housing
condition may have several implications in addition to assessing the economic ability. For
example, households without proper sanitation facilities have a risk of incidence of diseases like
diarrhea, dysentery and typhoid. The housing condition and related facilities of the study
households is analyzed through Appendix Table 3.3 from different perspectives below:

56 | P a g e
3.3.1 Housing condition
The ownership pattern of the house indicates that about 95% of the households use their own
house for living (appendix table 3.3). The number of sleeping-rooms gives an indication to what
extent the households are crowded. Crowding in one sleeping room increases the risk of
infection. It is found that about 20% of the households use one room for living and about 42% of
the households use 2 rooms for the same purpose. Only about 10% households were identified
who had four or more rooms for living. It is estimated that on average 2.48 persons live in a
room in surveyed households, indicating a moderate congestion rate. The analyses indicate that
there was no remarkable difference in household occupancy between borrowers and non-
borrower households. The most common housing materials were found tin as about 86% houses
were made of tin shed roof with different kinds of fence. Only 4.3% of the houses were made of
straw roof with bamboo/muddy fence. The analysis reveals that the quality of houses was found
inferior for borrower households in comparison to non-borrower households. Indoor pollution
has important implications for the health of the household members. The type of fuel and the
place where cooking is done are related to indoor air quality and the degree to which the
household members are exposed to the risk of respiratory infections and other diseases. About
39% of the households reported that they did not have any separate kitchen room for cooking.
3.3.2 Facilities of housing
The facilities of housing are included sources of drinking water, cooking facilities, sanitation
facilities, electricity coverage in the house, electricity coverage in the village. These are
discussed below:
Sources of drinking water
Access to an improved source of drinking water is almost universal in Bangladesh. Nine-in-ten
of the surveyed households are found to use tube-well as the source of their drinking water
(appendix table 3.3). About 5% of the surveyed households reported that they used drinking
water from pond or well.
Cooking facilities
The main sources of cooking fuel were straw/leaf/husk (43.6%) and wood/kerosene (30.1%) as
near 74% of the households are found to use these ingredients for cooking.

57 | P a g e
Sanitation facilities
Most of the surveyed households (91.6%) reported that they have toilet facility of their own. Of
the surveyed households, about 15% reported that they used hygienic latrines that include water-
preventing capacity, about 28% households used pit latrine without water preventing capacity.
The findings indicated that over half of the households used completely non-hygienic toilet that
include katcha and open field/space
Electricity coverage in the house
The information about the sources of lighting of the households was also collected in the survey.
The results indicated that about 81% of the HHs had improved lighting facility in terms of
electricity and 19% has no access of electricity. The lighting of the rest of the HHs depends
mainly on kerosene.
Electricity coverage in the village
The information about the sources of lighting of the village was also collected in the survey. The
results indicated that about 87% of the community had improved lighting facility in terms of
electricity and 13% has no access of electricity. The lighting of the rest of the community
depends mainly on kerosene.
3.4 Landholdings of households
The landholdings pattern of the study households is presented in appendix table 3.4. The
landholding of a household has been estimated by taking into account all types of land
(homestead, agricultural and pond) that a household owns. Several studies categorized the
landholding size considering its merit in production and income. Households with less than 2000
m2 of land (<50 decimal) are commonly considered as ‘Functionally Landless Households’,
households with 2000 m2 up to 8000 m2 (50-200 decimal) are considered as ‘Marginal
Households’ and households with 8000 m2 up to 30,000 m2 are considered as ‘Medium
Households’ (Hossain and Keus, 2004). In addition, households with only homestead land are
considered as absolute landless (Hossain and Bayes, 2019). In this study households owning
landholdings sized 15 decimals or less are considered as absolute landless.

58 | P a g e
The findings showed that 8.5% of the surveyed households had no homestead land of their own,
79.2% of the households owned homestead land between 1 to 15 decimals, and only 12.3%
households owned homestead land more than 15 decimals. Among the surveyed households,
over two-thirds have no agricultural land at all and about 7% owned agricultural land between 1
to 15 decimals, about 8% owned agricultural land between 16 to 50 decimals, and only about
17% were found to have agricultural land over 50 decimals. Among the land-owning households,
the average cultivable agricultural land has been estimated at 105.85 decimals for non-borrower
households and 96.96 decimals for borrower households. The findings indicate that there is no
considerable variation in case of owning homestead or agricultural land according to the
borrowing status of the surveyed households.
In rural Bangladesh, agricultural land can either be leased-in (not owned but cultivated) or
leased-out (owned but not cultivated). It is found that about 27% of the households had taken
some sort of land through leased-in, mainly as sharecropper. The average size of the leased-in or
sharecropped land is found 102.66 decimals. In the study households, about 94% are found to
have to pond in their possession. The size of the pond land is estimated at 8.65 decimals for the
owning households.
Data regarding the total of all of types of land showed that about 5% households have no land
of their own including homestead. The analysis shows that about 43% households own only 1 to
15 decimals of land; about 18% own land 16 to 50 decimals of land. The overall analysis of
landholding indicates that about two-thirds of the surveyed households are functionally landless.
Table 3.1 (page 56) depicts the household composition by micro-credits receiving status. The
study found that the male-female ratio was 100:104 for borrower group while 100:107 for non-
borrower group. The study revealed that female headed households are significantly (p<0.05)
lower for borrower households (2.6%) than that of non-borrowers (3.5%). The study also found
that the unemployment rate was 2.1% for borrower and 2.8% for non-borrower household. The
study also revealed that the child dependency ratio was 54.35% for borrower households,
whereas 50.86% for non-borrower households. Similar scenario revealed for aged dependency
ratio. The overall dependency ratio was also differed significantly (p<0.01) for borrower (61.3%)

59 | P a g e
and non-borrower (56.5%) households. The average family size was found significantly (p<0.01)
higher for borrower (5.09) and non-borrower (4.71) households.
Table 3.1 Household composition by micro-credits receiving status
Characteristics Borrower
(N = 8172)
Non-borrower
(N = 3451) Z-statistic P-value
Overall
(N = 11623)
Household composition (%)
Sex Ratio (Male per 100 female) 104 107 105
Female-headed household (in %) 2.6 3.5 -2.656 0.012 2.8
Unemployment rate (Age 15-60) 2.1 2.8 -1.816 0.077 2.3
Total household (Age 15-60 years) 5023 2180 7203
Dependency Ratio (%)
Child (0–14) dependency ratio 54.35 50.86 3.446 0.001 53.19
Aged (60+) dependency ratio 6.94 5.63 2.608 0.013 6.55
Dependency ratio 61.29 56.49 4.824 <0.001 59.74
Family size (Mean ± SD) 5.09 ± 1.49 4.71 ± 1.52 5.644 <0.001 4.97 ± 1.51
Note: HH=Households; SD=Standard Deviation.
3.5 Possession of assets by households
The possession of assets by study households has been divided into two parts viz. (i) durable
assets and (ii) productive assets. These two are discussed below:
3.5.1 Possession of durable assets
The details of possession of durable assets have been given in appendix table 3.5. Among the
work-related items, about 14.8% households are found to own boat, about 1.2% owned deep tube
well, 20.6% owned tube well and 8.1% owned bicycle. A number of surveyed households owned
luxury items: 16.2% of the households owned television, 6.2% owned drawing room furniture,
28.5% owned watch, and 69.7% of the households owned electric fan and 89.9% owned mobile
phone. The findings indicate that in most of the cases possession of durable goods was
significantly higher in the formal micro-credits receiving households than that of informal micro-
credits receiving households when the differences between borrower and non-borrower
households is not following any pattern.

60 | P a g e
3.5.2 Possession of productive assets
The average number of productive assets of the study households by micro-credits receiving
status is shown in appendix table 3.6. Among the productive assets, are possessed and livestock
are found to own by most of the study households Table showed that among the borrowers 664
HHs and 311 of non-borrowers HHs possessed cultivating instruments on average 3.27 and 3.05
respectively without any significant difference between the groups while livestock possessed by
694 HHs of borrowers and 287 HHs of non-borrowers on average 2.39 and 2.73 respectively
showing significant difference between the groups(p=.003). On an average, 3.20 cultivating
instruments are used by the households. On the other hand, the average number of livestock were
2.49. The ownership of others productive assets is not notable as a few households have owned
those assets.
3.6 Knowledge and perception of respondents on micro-credits benefits
The study has collected the necessary data and information from 2340 sample households on
perception and experience of micro-credits. The respondents were asked to provide their
knowledge on micro-credits in terms of different aspects as shown in appendix table 3.7. The
analysis revealed that about 95% respondents have the knowledge of micro credits benefits and
about 86% has tried to get micro-credits. Among the credits-receiving households, 55.1% has
tried to get credits from non-government sources (MFI/NGOs/Insurance) and 16% have tried to
get credits from local moneylenders (Mohajan/ Private Samittee) in their first attempt. In
addition, 4.1% has tried to get credits from government sources (banks/ cooperatives) and 2.4%
from non-interest-bearing sources (relatives/friends/neighbors). About 8% credits-receiving
households has mentioned that they tried to get credits from more than one sources. The findings
indicate that 8.6% have succeed to get loan at their second attempt after failing in the first
attempt and most of them received loan from local moneylenders (Mohajan/ Private Samittee).
The data on respondents where/whom they communicated to get micro-credits revealed that a
little more than one-third has reported that they went to UP office, followed by
relatives/neighbors/friends (14.7%), government officers (4.8%), NGOs (3.3%). It is to be
mentioned that about 4% of the respondents were demanded to provide money as bribe for
getting micro-credits benefits. Six-in-ten of the total respondent believed that micro-credits
benefits would help them to come out from poverty.

61 | P a g e
3.7 Reasons of not getting micro-credits from targeted source by eligible non-borrowers
The respondents of the eligible non-borrower households were asked to put their views on the
reasons for exclusion from the targeted micro-credits programs. The literature suggests several
reasons are responsible for exclusion from the targeted micro-credits programs. Total sixteen
causes are listed as in appendix table 3.8 as the causes those are responsible for not getting
micro-credits from targeted organizations by eligible non-borrowers. The descriptive statistics of
the causes is explored under the subsection 3.6.1 and the inferential statistics i.e., Principal
Component Analysis (PCA) is given in section 3.6.2.
3.7.1 Descriptive statistics on reasons for exclusion from the targeted programs
The respondents were asked to put their perception on five-point Likert scale (starting from
strongly disagree=1 to strongly agree=5) on each of the pre-assigned reasons for not getting
micro-credits from the targeted schemes. The percentage in each of the agreement level indicates
that a significant number of respondents did not make any comments regarding all the reasons
(appendix table 3.8). Among the strongly agreed responses, bureaucratic complexity was
endorsed by 13.6% respondents, followed by nepotism (11.2%), non-cooperation from local
lenders (11.2%) and lack of networking or lobbying (9.1%). The highest percentage of response
against ‘agree’ was found for lack of networking or lobbying (29.2%), followed by non-
cooperation from local lenders (28.6%), non-cooperation from public delegate of micro-credits
institution (25.9%), distance of MFIs from villages (21.6%), misappropriation of credits (17.7%),
no political exposure (16.9%). On the other hand, 39.4% of the respondents have put their
response as strongly disagree on ‘non-availability of NID. The findings revealed that the
maximum of the observed respondents put their response on ‘disagree’ for reasons limitation of
budget (according to selector), couldn’t provide bribe or entry fee, didn’t have any idea about
such program, non-availability of NID, distance from micro-credits from the village, no micro-
credits in the area, non-availability of collateral and biasness. On the other hand, majority of the
total respondents respond to ‘agree’ for reasons non-cooperation from public delegate of micro-
credits institution, non-cooperation from local lenders, lack of networking or lobbying,
misappropriation of credits. The respondents had no idea about the reasons like no political
exposure and nepotism for the exclusion from micro-credits program.

62 | P a g e
3.7.2 Factor analysis on reasons for exclusion from the targeted micro-credits programs
The study has employed factor analysis to identify the major dimensional reasons (to reduce a
large number of variables into fewer numbers of factors) for exclusion from the expected micro-
credits programs. The factor analysis has been performed using PCA with Varimax rotation
technique. The summarized results of factor analysis are shown in table 3.2. The scree plot
(Figure 3.1) explored that four factors are mainly responsible for not getting the micro-credits
from the expected credits programs/schemes. That means the 15 reasons can be reduced into four
major dimensional factors.
Thus, the factor analysis extracted four factors as the reasons for not being included in the micro-
credit programs with a cumulative percentage of variance 64% by the 15 variables and the KMO
value as 0.735. The test statistics including chi-square value of Bartlett's test of sphericity, KMO
value indicates that the factor analysis is appropriate technique to explore the major dimensions
of the underlying variables (Table 3.2). Based on the maximum variation of the factors, the study
identified four main factors of reasons for not being included in micro-credits programs. These
factors are:
Figure 3 Choice of the number of factors for reasons of excluded from micro-credits program
3.20
2.94
2.27
1.170.95
0.780.61
0.55
0.53
0.45
0.42 0.37 0.32 0.300.15
0.00
1.00
2.00
3.00
4.00
0 2 4 6 8 10 12 14 16
Var
ian
ces
of
the
co
mp
on
en
ts (
Eige
n v
alu
es)
Number of components (Total 15)

63 | P a g e
Factor-I related to credits misappropriation and biasness and composed of four reasons: (i) no
micro-credits in the area; (ii) non-availability of collateral; (iii) misappropriation of credits and
(iv) biasness. Factor-II related to non-cooperation of local authority and is includes four causes:
(i) non-cooperation from public delegate of micro-credits institution; (ii) non-cooperation from
local lenders (iii) lack of networking or lobbying and (iv) distance from micro-credits from the
village. Factor-III regarding bureaucracy and budget limitation and included four causes :(i)
bureaucratic complexity; (ii) limitation of budget (according to selector); (iii) no political
exposure and (iv) nepotism. Factor-IV associated with ignorance and corruption and is
composed of three causes: (i) couldn’t provide bribe or entry fee; (ii) didn’t have any idea about
such program and (iii) non-availability of NID.
Table 3.2 Major dimensional factors for excluding from the micro-credit benefits
Serial Reasons for
Rotated Factor Loadings
(Varimax Rotation) Communalities
F1 F2 F3 F4
a. Bureaucratic complexity 0.611 0.525
b. Limitation of budget (according to selector) 0.759 0.597
c. Couldn’t provide bribe or entry fee 0.559 0.599
d. No political exposure 0.623 0.680
e. Didn’t have any idea about such program 0.833 0.704
f. Nepotism 0.599 0.608
g. Non-cooperation from public delegate of Micro-
credits institution
0.727 0.567
h. Non-cooperation from local lenders 0.818 0.673
i. Non-availability of NID 0.700 0.517
j. Lack of networking or lobbying 0.775 0.652
k. Distance from Micro-credits from the village 0.635 0.468
l. No Micro-credits in the area 0.620 0.591
m. Non availability of collateral 0.862 0.794
n. Misappropriation of credits 0.896 0.844
o. Biasness 0.863 0.755
Percentage of Variation Explained 21.30 19.61 15.13 7.80
Total Variation explain by the extracted factors 63.84
Kaiser-Meyer-Olkin Measure of Sampling Adequacy 0.735
Bartlett's Test of Sphericity Chi-Square =3261.82; df =105 & P-value <0.001
Extraction Method Principal Component Analysis

64 | P a g e
3.8 Conclusion
The socioeconomic and -demographic profile of respondents has been presented in this chapter
meticulously in the next chapter profile of formal and informal micro-credits will be discussed in
details.

65 | P a g e
CHAPTER FOUR
PROFILE OF FORMAL AND INFORMAL MICRO-CREDITS
4.1 Introduction
The nature and characteristics of both formal and informal micro-credits used in the study area
are explored in this chapter under the following aspects:
❖ Sources and types of micro-credits in Haor region;
❖ Terms and conditions of formal and informal micro-credits;
❖ Volume of over-all loans;
❖ Payment structure of loans;
❖ Purpose of micro- credits;
❖ Expenditure and investment pattern of both formal and informal credits;
❖ Comparative economic performance between borrowers and non-borrowers households;
❖ Causes of non-payment of loans; and
❖ Attitudes of borrowers towards micro-credits.
4.2 Sources and types of micro-credits in Haor region
There sources of micro-credits can be classified into formal and informal. The formal is
regulated by country’s banking and financial services acts/rules or regulation where informal
sources are embracing all financial transactions taking place beyond various countries’
regulations on banking and other financial sectors. The definition of informal finance includes
such schemes as the operations of Savings and Credits Associations (SCA), known all over
Africa, professional moneylenders, part-time moneylenders (estate owners, traders, grain millers,
smallholder farmers, employers, relations and friends) mobile bankers, known as collectors in
West Africa; credits unions; and cooperative societies and these exist in both urban and rural
areas (Ernest, 2011). While savings collectors fall under the first category of deposit mobilizers,
moneylenders - including relations and friends - do not generally accept deposits and may be
assigned to a second category. SCAs (credits unions and credits cooperatives) take in deposits
and also lend in varied forms. Most informal units deal with specific groups of people, ensuring
that only those satisfy distinct selection criteria are able to either deposit with them or borrow

66 | P a g e
from them (Ernest, 2011). In this study the formal sources included government and private
banks and cooperatives, different micro-finance institutions NGOs and insurance companies
which are regulated either by the government directly or by the affiliated body or authority such
as, MRA (Micro-credits Regulatory Authority, Bangladesh Bank, Bureau of NGOs, Bangladesh
Bank, Ministry of Finance or any other authorised body. The informal sources are (i) interest
bearing –includes local money lender, mohajon/private somitee (ii) non–interest bearing includes
relatives, friends/neighbour/land owner. The descriptive statistics are given below in table 4.1
Table 4.1 Sources and types of micro-credits
Characteristics No. of
HH
% of
HH
Average
amount
Total
amount
% of
total
SD amount
Loan Type
Cash 1595 99.3 37651 60053106 99.29 53321
Kinds (food items) 12 0.7 35625 427500 0.71 52938
Total 1607 100.0 60480606
Sources of loan
Formal 1158 72.1 34596 40062504 66.00 40826
Informal 449 27.9 45475 20418100 34.00 76126
Total 1607 100.0 37656 60480606
Formal sources
Government (Banks/Co-
operatives)
88 5.5 52313 4603500 11.50 62822
Nongovernment
(MFI/NGO/Insurance)
1070 66.6 33139 35458998 88.50 38142
Total Formal 1158 72.1 34596 40062504 100.00 40826
Informal sources
Local money lender
(Mohajan/Private Samittee)
393 24.5 46675 18343098 89.84 74777
Non-interest loan
(Relatives/friends/neighbors)
53 3.3 38076 2018000 9.88 87567
More than one sources 3 0.2 19000 57000 0.28 1732
Total Informal 449 27.9 45475 20418100 100.00 76126
Informal by interest
Interest bearing 408 90.9 47696 19460099 95.30 79057
Non- interest bearing 41 9.1 23366 957 1000 4.70 27571
Total 449 100.0 45475 20418100 100.00
Table 4.1 showed that 1595 HHs (99.3) borrowed cash loan and only 12(0.7%) in kinds and in
terms of total amount the percentage is about same (99.29% cash and .71% in kinds). In terms of
sources 1158 HHs (72.1%) borrowed from formal sources and 449 HHs (27.1%) from informal
sources and in terms of amount of loan 66% from formal sources and 34% from informal

67 | P a g e
sources. There are two types of formal sources viz. (i) government (Banks/Co-operatives; and (ii)
nongovernment (MFI/NGO/Insurance) and the data showed that 88 HHs (5.5%) borrowed from
the former and the 1070 HHs (66.6%) from the later. There are three informal sources viz., (i)
Local money lender (Mahajan/Private Samittee); (ii) non-interest loan (Relatives/friends/
neighbors); and (iii) more than one sources and the data revealed that 393 HHs (24.5%) taken
loans from the first, 53 HHs (3.3%) from the second and only 3 HHs (0.2%) from the third and in
terms of amount of loan 89.84% from the first, 9.88% from the second and 0.28% from the third.
Again, the informal sources have been divided into interest bearing and non-interest bearing and
the data revealed that 408 HHs (90.9%) have taken from interest bearing sources and HHs 41
(9.1%) from non-interest bearing and respect of amount loan 95.3% from the former and 4.70
from the latter.
4.3 Terms and conditions of formal and informal micro-credits
Table 4.2 shows the profile of micro-credits benefits for the borrower households in the year
2019. The study found that the maximum average loan was Tk.56536.36 for formal micro-credits
receiver at the rate of interest more than 25% while this amount was Tk.69853.66 for informal
micro-credits receiver at the interest rate of 21-25%. There is highly significant (p<0.01)
difference between formal and informal micro-credits receiver for all kind of interest rate. The
study also found that the annually installment type had the maximum average amount of loan
which was Tk.79105.26 for formal and Tk.64589.04 for informal micro-credits receiver. On the
other hand, biweekly installment type had the minimum average amount of loan which were
Tk.18846.15 and Tk.24657.14 for formal and informal micro-credits receiver respectively. There
are significant (p<0.01) differences between formal and informal micro-credits receiver for
weekly, monthly and annually installment types. The study revealed that the maximum average
amount of loan was Tk.88400.00 for formal micro-credits receiver at installment type ‘one time’
whereas the maximum amount was Tk.52157.40 for informal micro-credits receiver at
installment type ‘up to 12 times. On the other hand, the loan amount was minimum at installment
type ‘more than 24 times’ and ‘one time’ respectively for formal and informal micro-credits
receiver. In addition, there was highly significant (p<0.01) difference between formal and
informal micro-credits receiver for all kind of installment type. The study also revealed that the
maximum average amount of loan was taken in two years of duration for both formal and

68 | P a g e
informal micro-credits receiver though the minimum amount was Tk.33050.64 for formal
receiver in one year of duration and Tk. 18790.48 for informal receiver in six months of
duration.
Table 4.2 Terms and conditions of micro-credits in Haor region in Bangladesh
Profile of
micro-credits
Formal credits
(N = 1158)
Informal credits
(N = 449) P-value
Overall
(N = 1607)
HHs Average HHs Average HHs Average
Interest rate
No interest (0%) - - 041 23365.85 041 23365.85
1% to 10% 141 39539.01 106 25576.42 <0.001 247 33546.96
11% to 15% 525 28456.19 055 25254.55 <0.001 580 28152.59
16% to 20% 211 39123.22 021 65095.24 0.001 232 41474.14
21% to 25% 171 29672.51 041 69853.66 0.001 212 37443.40
More than 25% 110 56536.36 185 60156.76 <0.001 295 58806.78
Installment type
Weekly 619 30378.03 015 31133.33 <0.001 634 30395.90
Biweekly 013 18846.15 007 24657.14 0.258 020 20880.00
Monthly 501 38613.77 180 26580.56 <0.001 681 35433.19
Quarterly 006 27500.00 028 30321.43 0.176 034 29823.53
Annually 019 79105.26 219 64589.04 0.001 238 65747.90
Total installment
One time 015 88400.00 180 37544.44 <0.001 195 41456.41
02 to 12 times 508 35810.04 223 52157.40 <0.001 731 40796.99
13 to 24 times 023 53652.17 030 46566.67 0.001 053 49641.51
More than 24 times 612 31553.92 016 39500.00 <0.001 628 31756.37
Duration of loan
Six months 039 33410.26 021 18790.48 <0.001 060 28293.33
One year 1096 33050.64 317 33285.49 <0.001 1413 33103.33
Two years 023 110260.87 111 85333.33 <0.001 134 89611.94
Collateral type
Collateral 067 56358.21 028 77807.14 0.003 095 62680.00
Non collateral 1091 33259.85 421 43324.23 <0.001 1512 36062.17
Note: HHs=Households;
There had strong evidence that all duration of total installment showed significant (p<0.01)
difference between formal and informal micro-credits receiver. It was also found in the study
that the average amount of received loan was higher in ‘collateral’ type than ‘non collateral’ for
both formal and informal micro-credits receiver and the difference of averages were also
statistically significant (p<0.01) for both formal and informal receiver. The study further found

69 | P a g e
that the formal micro-credits receiver took maximum average loan Tk.20969.69 at the condition
of ‘total paid’ whereas the informal micro-credits receiver took maximum average loan
Tk.20911.05 at the condition of ‘principal’ paid. All type of condition of loan pay between
formal and informal micro-credits receiver was highly significant (p<0.01). The study again
revealed that the total unpaid loan had maximum average for both formal (Tk.25786.90) and
informal (Tk.54035.89) receiver and their differences also statistically significant (p<0.01).
4.4 Volume of over-all loans
Table 4.3 depicted that total formal loan receiver is 1158 and informal receiver is 449. The total
amount of formal loan is about Tk. 40 million and informal loan is about Tk 20 million and in
total is Tk 60 million. The average of formal loan is Tk. 34596 and informal loan is Tk. 45475
and in overall-all average is Tk. 37636.The maximum amount of formal loan is Tk 5.5 lac... and
informal is Tk 11.00 lac and the minimum amount of both formal and informal loan are Tk.
2000. The over-all minimum and maximum amount of loan are Tk. 20000 and 11.00 lac with SD
Tk. 53303.
Table 4.3 Total, minimum, maximum, average, standard deviation, median and inter quartile
range of micro-credits
Statistics Formal
(N=1158)
Informal (N=449) Overall
(N=1607) Interest bearing
(N=408)
No interest bearing
(N=41)
All informal
(N=449)
Minimum 2000 2000 3000 2000 2000.00
Maximum 550000 1100000 150000.00 1100000 1100000
Total 40062504 19460099 958000 20418100 60480602
Mean 34596 47696 233656 45475 37636
SD 40826 79057 27571 76126 53303
Median 25000 30000 15000 25000 25000
IQR 25000 25000 15000 40000 25000
4.5 Payment structure of loans
The payment structure shows that during the period (2016-19) 1113 households of formal credits
borrowers totally paid amounted to Tk. 20969.69 on average out of which principal loan paid by
1108 receivers and interest paid by 1092 receivers on average amount of Tk. 17679.33 and Tk.
3434.59 respectively while the 245 households of informal credits borrowers totally paid

70 | P a g e
amounted to Tk. 20878.61 on average out of which principal loan paid by 144 receivers and
interest paid by 233 receivers on average amount of Tk. 20911.05 and Tk. 9030.34 respectively
(table 4.4). The table showed that there are significant differences between formal and informal
credits in respect of total amount of loan paid, principal paid and interest paid on average. The
unpaid loan analysis showed that 946 households of formal credits borrowers failed to pay
credits amounted to Tk. 25786.90 on average out of which principal unpaid by 944 borrowers
and interest unpaid by 945 receivers on average amount of Tk. 21688.35 and Tk. 4148.79
respectively while the 402 households of informal credits borrowers totally failed to pay
principal amounted to Tk. 54035.89 on average out of which principal loan unpaid by 401
receivers and interest unpaid by 326 receivers on average amount of Tk. 20911.05 and Tk.
9030.34 respectively. The table showed that there are significant differences between formal and
informal credits in respect of total amount of unpaid loan, unpaid principal and interest.
Table 4.4 Total, average, paid and unpaid amount of loan in Haor regions of Bangladesh
Profile of micro-credits
Formal credits
(N = 1158)
Informal credits
(N = 449) P-value
Overall
(N = 1607)
HHs Average HHs Average HHs Average
Paid loan
Total paid 1113 20969.69 245 20878.61 <0.001 1358 20953.26
Principal 1108 17679.33 144 20911.05 <0.001 1252 18051.03
Interest 1092 3434.59 233 9030.34 0.001 1325 4418.60
Unpaid loan
Total unpaid loan 946 25786.90 402 54035.89 <0.001 1348 34211.31
Unpaid principal 944 21688.35 401 43408.75 <0.001 1345 28164.10
Unpaid interest 945 4148.79 326 13237.79 0.001 1271 6480.04
Note: HHs=Households;
4.6 Purpose of micro-credits
The purpose receivers of micro-credits of both formal and informal are analyzed in terms of
descriptive statistics as well as inferential statistics under the subsections 4.6.1 and 4.6.2 below:
4.6.1 Descriptive statistics of purposes of micro-credits
The borrowers borrow money for different purposes and from pilot survey seventeen purposes
of loan are identified and data table 4.5 showed that the top three items of purposes of credits
in both formal and informal credits are purchasing food items (32.1%) for formal and 47.4% for

71 | P a g e
informal credits and in total 36.4% following payment of previous loan 27.5% for formal and
34.1% for informal and in total 29.% and crop production 24.1% for formal and 32.4% for
informal and in total 26.4%. It is found that there are significance differences between formal
and informal sources in all the three purposes. The purpose healthcare expenditure in total is
ranked fourth (19.4%) and also in informal loans 32.3% for formal but in case of formal loans it
is ranked fifth (14.4%) after trade /business purpose (20.2%) showing significant differences
between two types of loans. The fifth purpose is trade/business in total (17.8%) but in case
formal its’ position is fourth and ninth in informal with showing significant difference between
them. In order to find the important purposes PCA analysis is done in subsection 4.5.2.
Table 4.5 Descriptive statistics of purposes of credits receivers
Purpose of taking loan
Formal sources
(N = 1158)
Informal sources
(N = 449) P-
value
Both
sources
(N = 1607)
Yes (%) Yes (%) Yes (%)
Purchasing of food items 32.1 47.4 <0.001 36.4
Crop production 24.1 32.4 0.001 26.4
Rearing cattle/poultry 13.7 9.8 0.043 12.6
Sending family member to abroad 2.8 2.7 0.397 2.8
Trade/business/industry 20.2 11.6 <0.001 17.8
Fish farming/fishing 4.6 2.4 0.052 4.0
Daughter/son’s marriage 2.9 6.5 0.001 3.9
Constructing housing 7.7 14.7 <0.001 9.6
Tackling shocks of natural calamities 4.0 15.4 <0.001 7.2
Tackling shocks of sudden death of HH head 0.9 0.9 0.399 0.9
Purchasing of livelihood equipment 12.8 21.4 <0.001 15.2
Payment of loan 27.5 34.1 0.013 29.3
Repairing cost of houses 12.5 22.7 <0.001 15.4
Healthcare expenditure 14.4 32.3 <0.001 19.4
Education 7.4 17.6 <0.001 10.3
Others 13.3 9.1 0.027 12.1
4.6.2 Inferential statistics of purposes of micro-credits
The study has employed PCA to identify the major dimensional purposes (to reduce a large
number of variables into fewer numbers of factors) of micro credits receivers. The PCA has been
performed using Varimax rotation technique. The summarized results of factor analysis have
shown in figure 4.1 and table 4.6.

72 | P a g e
Figure 4.1 Choice of the number of components for the purposes of micro-credits
The factor analysis extracted seventeen purposes into five factors as the purposes of taking
micro-credits services with a cumulative percentage of variance 53%. The KMO value is 0.823
(table 4.6). The test statistics including chi-square value of Bartlett's test of Sphericity, KMO
value indicates that the factor analysis is appropriate technique to explore the major dimensions
of the underlying variables. Based on the maximum variation of the factors, the study identified
five main factors of taking loan purposes. Factor- I related to daily life and livelihoods and is
composed of more than 50% (nine) listed purposes - (i) purchasing of food items; (ii)
constructing housing; (iii) Tackling shocks of natural calamities (iv)purchasing of livelihood
equipment; (v)payment of loan; (vi) repairing cost of houses; (vii) healthcare expenditure; (viii)
education; and (ix) others. Factor-II associated adaptability of natural shocks and farming and is
included two purposes- (i) fish farming/fishing and (ii) tackling shocks of sudden death of HHs’
head. Factor-III connected to cropping and raring cattle and is formed of two purposes- (i) crop
production; (ii) rearing cattle/poultry. Factor-IV is linked with business and marriage and is
blended with two causes: (i) trade/business/industry; (ii) daughter/son’s marriage. Factor-V is
associated a unique and single purpose and that is (i) sending family member to abroad.
3.53
1.22
1.16
1.07
1.01
0.99
0.95
0.86
0.75
0.72
0.68
0.64
0.58
0.530.34
0.00
1.00
2.00
3.00
4.00
0 2 4 6 8 10 12 14 16
Var
ian
ces
of
the
co
mp
on
en
ts (
Eige
n v
alu
es)
Number of components (total 15)

73 | P a g e
Table 4.6 Major dimensional factors behind the purpose of receiving loan
Serial Reasons for receiving loan Rotated factor loadings (Varimax) Comu
nalities F1 F2 F3 F4 F5
a. Purchasing of food items 0.552 0.478
b. Crop production 0.614 0.478
c. Rearing cattle/poultry 0.623 0.445
d. Sending family member to abroad 0.915 0.866
e. Trade/Business/Industry 0.806 0.675
f. Fish farming/Fishing 0.761 0.610
g. Daughter/son’s marriage 0.613 0.413
h. Constructing housing 0.638 0.447
i. Tackling shocks of natural calamities 0.801 0.699
j. Tackling shocks of sudden death of HH head 0.677 0.489
k. Purchasing of livelihood equipment 0.652 0.435
l. Payment of loan 0.493 0.509
m. Repairing cost of houses 0.691 0.488
n. Healthcare expenditure 0.646 0.454
o. Education 0.675 0.493
p. Others 0.552 0.478
Percentage of variation explained 23.51 8.13 7.71 7.10 6.76
Total Variation explain by the extracted factors 53.20
Kaiser-Meyer-Olkin measure of sampling adequacy 0.823
Bartlett's test of sphericity Chi-square = 3622.224; df = 105 & P-value < 0.001
Extraction method Principal Component Analysis
Note: HHs = Households; df = degrees of freedom.
4.7 Expenditure and investment pattern of both formal and informal micro-credits
The respondents were given a list of 24 expenditures and investments items of their loans and
among those 14 items were marked by them as shown in table 4.7. The study revealed that
formal micro-credits receiver spent 15.05% of total loan in food consumption whereas this
percentage increased to 23.24% for informal micro-credits receiver. There existed significant
(p=0.02) difference in food expenditure between formal and informal micro-credits receiver.
The study found that the expenditure in clothing and essential sector of received loan were
1.55% for formal and 3.36% for informal micro-credits receiver. Formal micro-credits receiver
spent 15.09% of total loan in agricultural inputs. On the other hand, this rate decreased to almost
half (7.70%) for informal micro-credits receiver. About 1.40% of formal and 0.23% of informal
micro-credits receivers expended in purchasing durables. Almost 5% of total loan used in
housing for both formal and informal micro-credits receiver. The study also found that the share

74 | P a g e
of total loan expended in purchasing land was quite similar for both formal (2.23%) and informal
(2.59%) micro-credits receiver. The formal micro-credits receiver spent their loan more than
double in purchasing animals than informal micro-credits receiver. The formal as well as
informal micro-credits receiver shared almost equal amount of received money in payment of
their previous loan. In family enterprise sector, the formal micro-credits receiver spent highest
(15.76%) amount of their loan whereas the informal micro-credits receiver spent 8.02%.
Table 4.7 Expenditure and investment pattern of both formal and informal micro-credits
Expenditure Heads
Formal (N = 1158) Informal (N = 449) P-value
(Share)
Overall (N = 1607)
HHs Average Share
(%) HHs Average
Share
(%) Average
Share
(%)
Food consumption 384 12287.24 15.05 199 13908.04 23.24 0.020 12840.48 17.34
Clothing & essentials 078 6365.38 1.55 058 9965.52 3.36 0.314 7900.74 2.06
Agricultural inputs 285 16686.32 15.09 076 15927.63 7.70 0.098 16526.59 13.03
Purchasing durables 031 13193.55 1.40 003 7666.67 0.23 0.393 12705.88 1.07
Housing 153 12939.22 5.27 064 16968.75 4.89 0.396 14127.65 5.16
Purchasing land 039 18448.72 2.23 018 35333.33 2.59 0.398 23780.70 2.33
Purchasing animals 168 16041.67 9.24 037 18000.00 4.39 0.251 16395.12 7.88
Payment of loan 294 15964.29 12.03 117 21469.23 12.97 0.385 17531.39 12.29
Family enterprises 234 31602.56 15.76 045 47644.44 8.02 0.160 34189.96 13.60
Health care 138 13060.87 4.49 110 24063.64 11.68 0.043 17941.13 6.50
Human capital 039 14989.74 1.34 018 9833.33 1.26 0.399 13361.40 1.32
Going member
abroad
027 112777.8 2.19 004 312500.0 0.83 0.392 138548.4 1.81
Children marriage 037 30270.27 2.63 029 49948.28 5.19 0.344 38916.67 3.35
Others 240 23039.17 13.00 113 27420.35 16.86 0.250 24441.64 14.08
Note: HHs = Households.
Informal micro-credits receiver spent almost three times more money of received loan than
formal micro-credits receiver in health care sector. The study further found that the share of total
loan expended in human capital was quite similar for both formal (1.34%) and informal (1.26%)
micro-credits receiver. To send family member abroad the formal micro-credits receiver spent
more than 2% whereas informal micro-credits receiver spent less than 1% of total loan. Informal
micro-credits receiver spent 5.19% of total loan in children marriage but this rate decreased to
half (2.63%) for informal micro-credits receiver.

75 | P a g e
4.8 Comparative economic performance between borrower and non-borrower households:
The economic performance of micro-credits borrowers and non-borrowers are discussed under
two heads viz., income and expenditures under the sub sections 4.8.1 and 4.8.2 below:
4.8.1 Comparison of income between borrower and non-borrower households
Table 4.8 showed that annual income of borrowers’ majority 1053 (66%) HHs depend on income
from labor sale with average income 57 thousand and in total 60 million (36% of total) with SD
39 thousand following from agriculture 830 (56%) HHs on average 45 thousands in total 40
million (24% of total) with SD 45 thousand, from non-agriculture 83 (52%) HHs on average 43
thousand and in total 36 million (22% of total) with SD with average, from business 400 (25%)
HHs on average 69 thousand and in total 28) million (17% of total with SD 58 thousand and 208
(13%) HHs’ income from donations/begging on average and in total 2 million (1% of total) with
SD 12 thousand.
Table 4.8 Sources and status of income between micro-credits receiving and non-receiving
households in Haor region of Bangladesh
Major income
source
Borrower (N = 1607) Total in
Million
(% of
total)
Non-borrower (N = 733)
t-statistic
HHs % of
HHs
Average
(000)
SD
(000) HHs
% of
HHs
Average
(000)
Total in
millions
(% of
total)
SD
(000)
Agricultural 900 56% 45 325 40 (24) 333 45% 46 15 (20) 42 -0.51
Non-agricultural 830 52% 43 48 36 (22) 331 45% 56 18 (25) 65 -3.63***
Labor sale 1053 66% 57 39 60 (36) 464 63% 54 25 (34) 28 1.06
Business 400 25% 69 58 28 (17) 197 27% 74 15 (20) 60 -1.02
Donation/begging 208 13% 98 12 2 (1) 81 11% 11 0.90 (1) 16 -0.71
Total income
excluding debt
1607 100% 103 59 165 (100) 733 100% 102 74 (100) 64 0.44
Debt 1253 78% 29 36 36 158 22% 12 2 14 5.82***
Total income
including debt
1607 100% 70 49 109 733 100 86 62 53
Note: HHs = Households; SD = Standard Deviation
The table showed that 78% of HHs has debt on average 29 thousand and in total 359 million with
SD 36 thousand. The annual income of majority 464 (63%) non-borrowers comes from business
on average 54 thousands with total income 25millions (34%) income following 333 (45%) HHs’

76 | P a g e
income come from agriculture with 46 thousands in total 15 million (20%) with SD 42
thousands, 331 (45%) HHs’ income from non-agriculture and on average 56 thousands and in
total 18 million (25%), 197(27%) HHs’ come from business on average 74 million and in total
15 (20%) million and 81 (11%) HHs’ income comes from donations/begging on average 11
thousand and in total .90 million (1%) with SD 16 thousand. It is seen that 22% HHs of non-
borrowers under the pressure of debt on average 12 thousand and in total million. Finally, we
observed that there are significant differences between income of borrowers and non-borrowers
in respect of non-agriculture and debt.
4.8.2 Comparison of expenditure between borrowers and non-borrower households:
Table 4.9 (page 74) depicted that both the borrowers and non-borrowers HHs incurred
expenditure for consumption of both food and non-food but borrowers HHs incurred 80% for
food and 20% for non-food while non-borrowers HHs 84% for food and 16% for non-food and
there is significant difference in respect non- food consumption as well as total consumption
between borrowers and non-borrowers HHs. There are twelve items of investment expenditure
and the items above 5% of in terms of percentage of total expenditure of borrowers HHs are
agriculture (20%), healthcare (20%) family business (16%), house repair (9%) and poultry
/livestock (7%) while in respect of non –borrowers the investment items above 5% of in terms
of percentage of total expenditure are healthcare (27%), agriculture (23%), education (18%),
family business 9% and house repair (9%). There is significant difference between borrowers
and non-borrowers in the items of education, healthcare, poultry/livestock, productive assets,
durable goods, house repair, others investment and also in total investment expenditure as well as
total expenditure (consumption plus investment).
4.9 Causes of non–payment of loan
For identifying the reasons behind the non-payment of loans in time the borrowers were given
list of 15 causes. The collected data is measured in terms of percentage of the respondents with
respect to disagree, neutral and agree. The causes are discussed showing descriptive as well as
inferential statistics under the subsections 4.9.1 and 4.9.2 as follows:

77 | P a g e
Table 4.9 Expenditures between borrower and non-borrower households in Haor region
Major expenditure
heads
Borrower (N =1607) Non-borrower (N = 733)
t-statistic HHs
%of
HHs
Average
(000)
Total in
million
(% of
total)
SD
(000) HHs
% of
HHs
Average
(000)
Total (in
millions
(% total)
SD
(000)
1. Food 1607 100 563 90 (80) 24 733 100 55 41 (84) 25 1.25
2. Non-food 1607 100 14 22 (20) 95 733 100 11 8 (16) 83 5.11***
A. Total consumption
(1+2)
1607 100 70 112 (100) 27 733 100 66 49 (100) 28 2.79***
3. Education 1190 74 10 12 (16) 12 481 66 9 4 (18) 12 1.79*
4.Healthcare 1539 96 10 15 (20) 12 686 94 8 6 (27) 10 3.53***
5.Agriculture 811 50 19 15 (20) 12 279 38 19 5 (23) 18 -0.14
6.Poultry-livestock 541 34 10 5 (7) 11 202 28 5 1 (5) 6 5.58***
7.Family business 220 14 25 6 (8) 16 79 11 22 2 (9) 12 1.17
8.Productive asset 233 14 12 3 (4) 14 54 7 6 0 7 2.74***
9.Durable goods 146 9 9 1 (1) 11 84 11 4 0 4 3.78***
10.House repair 574 36 11 7 (9) 21 235 32 7 2 (9) 9 3.11***
11.Land purchase 38 2 30 1 (1) 35 13 2 25 0 23 0.43
12.Others 561 35 16 9 (12) 14 158 22 11 2 (9) 12 4.03***
B. Total investment
(3-12)
1606 100 46 74 (100) 36 730 100 31 22 (100) 29 10.29***
C. Total expenditure
(A+B)
1607 100 116 186 51 733 100 97 71 47 8.50***
Savings 507 32 4 59 4 111 15 19 2 24 -13.59***
Note: HHs = Households; SD = Standard Deviation
4.9.1 Descriptive statistics of causes of non-payment of loan in time
The descriptive statistics of the cause of non-payment of loan timely by formal and informal
borrowers are given in table 4.10. As stated earlier in our study there is 1607 borrowers’
respondents among them 1158 borrowed from formal sources and 449 from informal sources.
Among the causes top five causes are agreed by formal borrowers are installment period is very
short (80.9%) following rate of interest is very high (70.6%), natural calamities (67.9%) medical
treatment/medicine (67.7%), acute food problem (63.7%). On the other hand, the top five causes
agreed by informal borrowers are rate of interest is very high (92.8%) following
misappropriation of loan (82.8%), medical treatment/medicine (80.5%) installment period is very
short (72.2%) and natural calamities (71.1%). In total top five causes of nonpayment of loans in
time are installment period is very short (78.1%), rate of interest is very high (77.8%), medical
treatment/medicine (71.9%), misappropriation of loan (69.2%) and natural calamities (68.9%). It

78 | P a g e
is observed that the top five causes are among the top five causes marked either by formal or by
informal borrowers.
Table 4.10 Descriptive statistics of the cause of non-payment of loan timely
Name of the causes HHs
Formal sources (N = 1158)
HHS
Informal sources (N = 449) Both
Disagree Neutral Agree Disagree Neutral Agree Agree
Acute food problem 726 15.8 20.5 63.6 349 25.2 5.7 69.1 65.4
Medical treatment/medicine 725 7.4 24.8 67.7 349 9.2 10.3 80.5 71.9
Investment loss 731 8.9 30.1 61.0 348 14.1 15.2 70.7 64.1
Natural calamities 733 15.4 16.6 67.9 349 19.5 9.5 71.1 68.9
Insufficient of loan for
investment
721 12.1 25.9 62.0 349 15.8 21.2 63.0 62.3
Duration of loan is short
for return from investment
724 7.5 27.2 65.3 349 14.6 26.4 59.0 63.3
Installment period is very
short
723 5.8 13.3 80.9 349 14.6 13.2 72.2 78.1
Rate of interest is very
high
729 14.4 15.0 70.6 349 5.2 2.0 92.8 77.8
Renewal of loan is
unavailable
721 23.7 39.3 37.0 349 16.6 33.2 50.1 41.3
Misappropriation of loan 722 10.9 26.5 62.6 349 6.6 10.6 82.8 69.2
Crop’s failure 725 20.8 33.4 45.8 349 23.8 13.8 62.5 51.2
Expenditure for marriage
of son/daughter etc.
719 55.1 30.2 14.7 349 74.5 9.2 16.3 15.3
Family problems and
expenditure
721 61.9 31.2 6.9 349 78.1 14.4 7.5 7.1
Unexpected accident 723 39.1 27.2 33.6 349 61.7 10.4 28.0 31.8
Note: HHs = Households
4.9.2 Inferential statistics on causes of non-payment of loans in time
In the previous section the descriptive statistics have been discussed. As there are fifteen causes of
nonpayment of loans and to find out actual causes PCA is done. Based on Eigen value (more than
1.00) among the fourteen causes four factors is significantly mentionable for non-payment of
loans in time as seen in the Scree plot given below in figure 4.2 (page 77).
Through the PCA with Varimax Orthogonal rotation method as in Table 4.11 it is clear that
53.52. % of total variation has been explained by the extracted factors with 0.715 KMO measure
of sampling adequacy. It means the sample size is sufficient to explore the factors. Details of the
factors or causes are given in table 4.11.

79 | P a g e
Figure 4.2 Scree plot of factors for the causes of non-payment of loan
The first factor is composed of six factors with 22.2 (around 41% of 53.52%) percentage of total
variation explained and the causes are associated to food, medicine and natural shocks and is
composed of - (i) acute food problem; (ii) medical treatment/medicine; (iii) investment loss; (iv)
natural calamities; (v) misappropriation of loan and (vi) crops’ failure.
Table 4.11 Major dimensional factors for the causes of scheduled non-payment of loan
Serial Causes of non-payment of loan timely Rotated factor loadings (Varimax) Commu
nalities F1 F2 F3 F4
a. Acute food problem 0.647 0.487
b. Medical treatment/medicine 0.640 0.421
c. Investment loss 0.702 0.526
d. Natural calamities 0.686 0.586
e. Insufficient of loan for investment 0.684 0.553
f. Duration of loan is short for return from investment 0.800 0.666
g. Installment period is very short 0.609 0.650
h. Rate of interest is very high -0.067 0.675 0.468
i. Renewal of loan is unavailable 0.478 0.438
j. Misappropriation of loan 0.454 0.387
k. Crop’s failure 0.641 0.520
l. Expenditure for marriage of son/daughter etc. 0.767 0.616
m. Family legal problems and expenditure 0.794 0.636
n. Unexpected accident 0.673 0.538
Percentage of variation explained 22.01 12.67 11.21 7.63
Total variation explains by the extracted factors 53.52
Kaiser-Meyer-Olkin measure of sampling adequacy 0.715
Bartlett's test of sphericity Chi-square = 2630.829; df = 91 & P-value < 0.001
Extraction method Principal component analysis
3.08
1.771.57
1.070.96
0.860.81
0.710.67
0.640.57
0.510.42 0.36
0.00
1.00
2.00
3.00
4.00
5.00
0 2 4 6 8 10 12 14
Var
ian
ces
of
the
co
mp
on
en
ts
(Eig
en
val
ue
)
Number of components (total 14)

80 | P a g e
The second factor is connected to marriage and legal problems and is composed of three factors
with 12.67 (around 24% of 53.52%) percentage of total variation explained and is included - (i)
expenditure for marriage of son/daughter etc.; (ii) family legal problems and expenditure and (iii)
unexpected accident. The third factor is related to terms of loans and investment loss and is
composed of three factors with 11.21 (around 21% of 53.52%) percentage of total variation
explained and the causes are (i) duration of loan is short for return from investment (ii) rate of
interest is very high; and (iii) insufficient of loan for investment lastly the fourth factor is linked
to cost of loan and is composed of three factors with 7.63% (around 14% of 53.52%) percentage
of total variation explained and the causes are (i) installment period is very short; (ii) rate of
interest is very high and (iii) renewable loan is unavailable.
4.10 Attitude of borrowers towards micro-credits
To measure the attitude of respondents towards micro-credits we have listed 16 variables
measured in term of percentage of the respondents with respect to disagree, neutral and agree.
The collected data is analyzed both in descriptive as well as inferential aspects through the
subsections 4.10.1 and 4.10.2.
4.10.1 Descriptive analysis of attitude of borrowers towards micro-credits
Table 4.12 portrayed that among the sixteen dimensions in case of formal credits the top five
agreed (positive) aspects are :(i) by micro-finance your food security has increased (54.3%); (ii)
micro-finance is helping you in better access to healthcare (53.8%); (iii) micro-finance is helping
you in better financial situation of your family (50.7%); (iv) Due to micro-finance, employment
opportunities have been increased (45.6%) and (v) by micro-finance your income has increased
(44%). In case of informal borrowers, the top five agreed (positive) attitude are :(i Local loans
are easier to get than MFIs (76.8%); (ii) micro-finance is helping you in better access to
healthcare (61.2%); (iii) by micro-finance your food security has increased (56.1%); (iv) micro-
finance is helping you in better financial situation of your family (52.3%); and (v) Operational
assistance received from MFIs was helpful to run the business (49.4%). Therefore, among the
top five positive attitudes both formal and informal borrowers agreed that micro-creditss play
positive roles in food security, healthcare and better financial position of the borrowers. In total
the top five positive attitudes are: by micro-finance your food security has increased (54.3%); (ii)

81 | P a g e
micro-finance is helping you in better access to healthcare (53.8%); (iii) micro-finance is helping
you in better financial situation of your family (50.7%); (iv) Local loans are easier to get than
MFIs (48.7%) and (v) Operational assistance received from MFIs was helpful to run the business
(45.2%). In total top five disagreed (negative) attitudes are (i) cost of local loans is lower than
MFIs (73.6); (ii) local lenders are friendly than MFIs (58.4%); (iii) terms and conditions of local
loans are easier than MFIs (57.9); (iv) duration of credits is sufficient (56.4%); and (v) by micro-
finance your savings has increased (56.1%). To identify the most important aspects of attitude
the PCA is done in the following sub-section.
Table 4.12 Distribution of the attitude of borrowers on micro-credits
Statements of attitudes
Formal sources
(N = 1158)
Informal sources
(N = 449)
Both sources
(N = 2340)
Disagree Neutral Agree Disagree Neutral Agree Disagree Agree
The rate of interest of micro-credits is
reasonable
56.9 12.1 31.0 88.4 4.2 7.3 65.7 24.4
Amount of credits is sufficient 46.5 14.1 39.4 57.2 4.7 38.1 49.5 39.0
Duration of credits is sufficient 55.5 15.0 29.4 58.8 6.7 34.5 56.4 30.9
Terms and conditions are not rigid 41.4 33.4 25.2 63.9 12.7 23.4 47.7 24.7
By micro-finance your food security
has increased
13.9 32.5 53.6 31.8 12.0 56.1 18.9 54.3
By micro-finance your income has
increased
30.3 25.7 44.0 48.3 14.0 37.6 35.3 42.2
By micro-finance your savings has
increased
49.9 22.9 27.2 71.9 13.1 14.9 56.1 23.8
Micro-finance is helping you in better
access to education
25.5 40.2 34.4 38.3 26.7 35.0 29.1 34.5
Micro-finance is helping you in better
access to healthcare
21.8 27.4 50.9 26.3 12.5 61.2 23.0 53.8
Micro-finance is helping you in better
financial situation of your family
24.7 25.3 50.0 33.2 14.5 52.3 27.1 50.7
Operational assistance received from
MFIs was helpful to run the business
21.3 35.1 43.6 28.7 21.8 49.4 23.4 45.2
Due to micro-finance, employment
opportunities have been increased
27.5 26.9 45.6 47.7 16.3 36.1 33.1 42.9
Local loans are easier to get than MFIs 46.6 15.6 37.7 18.9 4.2 76.8 38.9 48.7
Local lenders are friendly than MFIs 63.0 16.6 20.5 46.8 5.6 47.7 58.4 28.1
Cost of local loans is lower than MFIs 74.9 16.8 8.4 70.4 6.0 23.6 73.6 12.6
Terms and conditions of local loans
are easier than MFIs
59.3 17.8 22.9 54.1 8.9 37.0 57.9 26.8
Note: MFIs = Micro-finance institutions.

82 | P a g e
4.10.2 Factor analysis of attitudes towards micro-credits
Through the PCA with Varimax Orthogonal rotation method explained 57.38 % of total variation
by the extracted factors with 0.747 Kaiser-Meyer-Olkin (KMO) measure of sampling adequacy.
It means the sample size is sufficient to explore the factors. The PCA analysis showed that four
attitudes are significant based on Eigen value (1.00 and above) as seen in the scree plot of major
dimensional attitude of borrowers on micro-credits is given in figure 4.3.
The PCA as presented in table 4.13 showed that through the Varimax rotated factor loading
sixteen dimensions converted into four factors explaining 57.38% of total variation through
extraction. The first factor is associated with income and savings and has explained 20.38% of
total variations with six dimensions (i) terms and conditions are not rigid (ii) by micro-finance
your income has increased; (iii) by micro-finance your savings has increased; (iv) micro-finance
is helping you in better financial situation of your family; (iv) operational assistance received
from MFIs was helpful to run the business; (vi) due to micro-finance employment opportunities
have been increased.
Figure 4.3 Choice of the number of components among the attitude of borrowers on micro-
credits programs in Bangladesh
3.26
2.70
1.89
1.33 0.98
0.80
0.75
0.66
0.64
0.57
0.52
0.43
0.41
0.40
0.380.29
0.00
1.00
2.00
3.00
4.00
0 2 4 6 8 10 12 14 16
Var
ian
ces
of
the
co
mp
on
en
ts (
Eige
n v
alu
es)
Number of components (total 16)

83 | P a g e
The second factor connected to terms and conditions of credit with explaining 16.86% of total
variation and is composed of four dimensions: i) local loans are easier to get than MFIs; ii) local
lenders are friendly than MFIs; iii) cost of local loans is lower than MFIs; iv) terms and
conditions of local loans are easier than MFIs. The third factor regarded to cost of credits with
explaining 11.84% of total variation is composed of three dimensions: i) rate of interest of micro-
credits is reasonable; ii) amount of credits is sufficient; and iii) duration of credits is sufficient.
The fourth related to food and health security with explaining 8.29% of total variation is
composed of i) micro-finance your food security has increased; ii) micro-finance is helping you
in better access to education; and iii) micro-finance is helping you in better access to healthcare.
Table 4.13 Major dimensional factors of the attitude of borrowers on micro-credits programs
SL# Attitude of borrowers on micro-credits Rotated Factor Loadings (Varimax) Comuna
lities F1 F2 F3 F4
01. The rate of interest of micro-credits is reasonable 0.694 0.574
02. Amount of credits is sufficient 0.760 0.633
03. Duration of credits is sufficient 0.809 0.658
04. Terms and conditions are not rigid 0.446 0.375
05. By micro-finance your food security has increased 0.716 0.535
06. By micro-finance your income has increased 0.654 0.564
07. By micro-finance your savings has increased 0.734 0.567
08. Micro-finance is helping you in better access to
education
0.621 0.564
09. Micro-finance is helping you in better access to
healthcare
0.804 0.675
10. Micro-finance is helping you in better financial
situation of your family
0.661 0.495
11. Operational assistance received from MFIs was
helpful to run the business
0.657 0.464
12. Due to micro-finance, employment opportunities
have been increased
0.682 0.481
13. Local loans are easier to get than MFIs 0.637 0.493
14. Local lenders are friendly than MFIs 0.857 0.768
15. Cost of local loans is lower than MFIs 0.792 0.667
16. Terms and conditions of local loans are easier than
MFIs
0.808 0.668
Percentage of variation explained 20.38 16.86 11.84 8.29
Total Variation explain by the extracted factors 57.38
Kaiser-Meyer-Olkin measure of sampling adequacy 0.747
Bartlett's test of sphericity Chi-square = 7023.422; df = 120 & P-value < 0.001
Extraction method Principal Component Analysis
Note: F1 to F4 indicates four extracted factors; df = degrees of freedom; MFIs = Micro-finance Institutions.

84 | P a g e
4.11 Conclusion
This chapter has presented the profile of formal and informal micro-credits elaborately and
consequences of micro-credits will be discussed in the following chapter.

85 | P a g e
CHAPTER FIVE
CONSEQUENCES OF MICRO-CREDITS
5.1 Introduction
In this chapter the role of micro-credits on poverty alleviation is analyzed based on the previous
chapters. Specially does micro-credits help to come out from vicious cycle of poverty or not is
tested in this chapter and also how does it help and what percentage of borrowers are coming out
from vicious cycle of poverty through micro-credits are shown by the methods stated in chapter
two. These are discussed below:
5.2 Role of micro-credits on graduation of selected socio-economic status of the borrowers
The role of micro-credit in graduating socio-economic status are- ensuring food security, social
status and investment in education and healthcare.
5.2.1 Ensuring food security
Table 5.1 shows the self-rated food security condition through before-after and case-control
comparison. The impact of micro-credits on the food security condition is administered though
these comparisons.
Table 5.1 Before-after comparison of prevalence of households’ food insecurity status by case-
control analysis in Haor regions of Bangladesh
Status of food insecurity
Non-borrower HHs (%)
(N = 733)
Borrower HHs (%)
(N = 1607)
Both HHs (%)
(N = 2340)
2016 2019 P-value 2016 2019 P-value 2016 2019 P-value
Two meals in a day throughout year
(Moderate food insecurity)
14.5 12.4 0.199 19.0 14.5 0.001 17.6 13.8 0.001
Some periods of hunger
(Normal food insecurity)
14.5 12.6 0.227 16.2 9.3 <0.001 15.7 10.3 <0.001
Three meals a day throughout year
(No food insecurity)
70.5 75.0 0.061 63.3 76.2 <0.001 65.6 75.9 <0.001
Note: HHs = Households.
However, the households of Haor regions who received micro-credits benefit are found to be
more food secure than the non-borrower households. The proportion of households with

86 | P a g e
moderate food insecurity is significantly (p<0.01) reduced to 14.5% from 19.0% due to micro-
credits program. This study also found that the incidence of normal food insecurity also
significantly (p<0.01) reduced to 9.3% from 16.2%. On the other hand, such type of changes is
also observed among non-borrower households but the decrement was found notably lower and
statistically insignificant as well.
5.2.2 Social status
Table 5.2 shows the self-rated socio-economic condition of the study households by before-after
and case-control comparison. The percentage households having extreme poor and moderately
poor condition are estimated lower after receiving micro-credits. It is to be mention that the
proportion also reduces to the non-borrower households but the decrement was statistically
insignificant. However, the micro-credits have significant influence for reducing extreme poverty
condition among credits receiving households.
Table 5.2 Before-after comparison of households’ social status in Haor regions of Bangladesh
Social- status
Non-borrower HHs (%)
(N = 733)
Borrower HHs (%)
(N = 1607)
Both HHs (%)
(N = 2340)
2016 2019 P-value 2016 2019 P-value 2016 2019 P-value
Extremely poor 22.4 16.9 0.012 23.1 13.6 <0.001 22.9 14.6 <0.001
Moderately poor 21.0 20.6 0.392 27.9 22.0 <0.001 25.8 21.5 0.001
Poor 46.5 49.0 0.252 44.4 56.4 <0.001 45.0 54.1 <0.001
Middle class 8.2 11.5 0.042 4.5 8.0 <0.001 5.6 9.1 <0.001
Rich 1.9 2.0 0.395 0.1 0.1 0.399 0.7 0.7 0.399
Note: HHs = Households.
5.2.3 Investment on education and healthcare
Table 5.3 shows the self-rated condition on the changes of education and healthcare expenditure
among the surveyed households. The percentage of households with the increase of educational
expenditure are estimated higher in case of borrower households (63.8%) than that of non-
borrower households (51.0%). This study found that the average educational expenditure
increases significantly to Tk. 9893.7 from Tk. 8417.8 among borrower households and to Tk.
8742.3 from Tk. 7606.6 among non-borrower households.
In addition, the increment of healthcare expenditure also observed both case and control
households. However, the before-after comparison among both type of households indicate that

87 | P a g e
the increment of healthcare expenditure is also obvious in Bangladesh. The case-control
comparison indicates that the healthcare expenditure increases more among borrower household
(70.1%) than non-borrower household (60.3%). Besides, the before-after comparison indicates
that the healthcare expenditures significantly increase to Tk. 9815.2 from Tk. 7730.9 among
borrower households and also insignificantly increases to Tk. 7966.3 from Tk. 7404.2 among
non-borrower households.
Table 5.3 Case-control comparison for the change in education and health expenditure in Haor
regions of Bangladesh
Indicators Non-borrower
(N = 733)
Borrower
(N = 1607) P-value
Overall
(N = 2340)
Education expenditure
Increased (% of HHs) 51.0 63.8 <0.001 59.8
No change (% of HHs) 45.2 32.2 <0.001 36.2
Decreased (% of HHs) 3.8 4.0 0.388 4.0
Mean ± SD (Tk. in 2015) 7606.6 ± 11624.6 8417.8 ± 10917.3 0.216 8181.1 ± 11130.2
Mean ± SD (Tk. in 2018) 8742.3 ± 11653.5 9893.7 ± 12092.6 0.076 9560.2 ± 11974.9
P-value (2015 vs 2018) 0.070 <0.001 <0.001
Health expenditure
Increased (% of HHs) 60.3 70.1 <0.001 67.0
No change (% of HHs) 30.0 20.4 <0.001 23.4
Decreased (% of HHs) 9.7 9.5 0.394 9.6
Mean ± SD (TK. in 2015) 7404.2 ± 15200.8 7730.9 ± 8895.3 0.527 7629.1 ± 11244.1
Mean ± SD (Tk. in 2018) 7966.3 ± 9513.4 9815.2 ± 12145.1 <0.001 9245.1 ± 11428.5
P-value (2015 vs 2018) 0.278 <0.001 <0.001
Note: HHs = Households; SD = Standard Deviation.
5.3 Perceptions on micro-credits of borrowers
The perception of borrowers on micro-credits that means whether the micro-credits are blessings
or burden to the borrowers and if burden how overtake this is discussed below:
5.3.1 Major dimensional factors for not graduating from poverty
Table 5.4 presents the summary statistics of the perception on causes for not graduating from
poverty among both case and control households. The principal cause was found as natural
calamity among non-borrower households (75.3%) and pressure of the payment of loan among
borrower households (83.9%). The second prime reason was loss of investment among non-
borrower households (72%) and high interest rate among borrower households (73.1%).

88 | P a g e
Table 5.4 Causes of not over-coming from vicious cycle of poverty of HHs s of Haor regions
Causes of not overcoming from
vicious cycle of poverty
Non-borrower HHs (%)
(N = 733)
Borrower HHs (%)
(N = 1607)
Both HHs (%)
(N = 2340)
Disagree Neutral Agree Disagree Neutral Agree Disagree Agree
Insufficient loan 22.2 33.2 44.6 23.9 19.2 56.9 23.4 53.1
Duration of loan is insufficient 14.5 37.0 48.6 18.9 17.1 64.0 17.5 59.2
High interest 7.5 26.7 65.8 15.7 11.2 73.1 13.1 70.8
Renewal of loan not get 22.2 42.6 35.2 29.6 31.9 38.6 27.3 37.5
Diversion of loan 4.6 51.2 44.2 10.3 39.6 50.1 8.5 48.2
Loss of investment 5.5 22.5 72.0 8.6 27.2 64.2 7.6 66.7
Natural calamity 4.2 20.5 75.3 8.3 25.8 66.0 7.0 68.9
Not getting loan in time 7.6 24.8 67.5 19.7 18.4 62.0 15.9 63.7
Pressure of loan payment 8.7 26.3 64.9 6.2 9.9 83.9 7.0 77.9
Number of dependent members
are high
11.9 21.1 67.0 12.9 22.0 65.1 12.6 65.7
Income earning member is absent 44.6 14.6 40.8 44.3 17.7 38.0 44.4 38.9
Number of dependent incomes
earning person is low
14.7 24.6 60.7 14.6 24.6 60.7 14.7 60.7
I have not taken loan 24.3 14.6 61.1 84.6 11.0 4.4 65.7 22.1
Note: HHs = Households.
Figure 5.1 illustrates the scree plot of the extraction of key components for not graduating from
poverty. The scree plot is a simple and graphical tool for correctly indicating the choice of the
number components should be extracted under a theme.
Figure 5 Choice of the number of components among the causes of not over-coming from
vicious cycle of poverty in Bangladesh
3.31
1.581.40
1.241.02
0.86
0.71
0.65
0.58
0.53
0.41
0.38
0.34
0.00
1.00
2.00
3.00
4.00
0 2 4 6 8 10 12 14
Var
ian
ces
of
the
co
mp
on
en
ts (
Eige
n
valu
es)
Number of components (total 13)

89 | P a g e
However, there should be five factors for not graduating from poverty. Mainly, first three factors
account for more information than the fourth component however possess important and
essential information. Therefore, the study assembles 13 unstructured reasons for not graduating
from poverty to extract five dimensional factors using absolute magnitudes.
Table 5.5 shows the estimated loadings or contribution for assembling the source causes into five
key factors using principal component analysis. In addition, the summary measure regarding the
factor analysis is also presented for the validation of this procedure. The Bartlett's test of
Sphericity is found highly significant and thus indicates that the determinant of the correlation
matrix is significantly different from zero and thus the factor analysis is able to perform better
for assembling key factors. The Kaiser-Meyer-Olkin measure of sampling adequacy is estimated
at 0.711 which indicates that 71.1% of the variation of the unstructured sources of the cause of
not graduating from poverty. In addition, the study found that about 65.77% of the total variation
original sources or causes are explained by the extracted factors.
The extracted factors were created based on the loadings or the contribution of the original sets
and the study mention the loading as influential if it is found greater than or equal to 0.3. The
study used Varimax rotation for obtaining clear idea about the construction of factors. Using
rotated factor loadings, first component explains 25.45% variation of the original set of causes
and comprises of using i) Insufficient loan, ii) Insufficient duration of loan, iii) Not getting loan
in time, iv) Absent of income earning member. Second component accounts for 12.16% variation
of the original set and includes i) Higher number of dependent members, ii) Lower number of
incomes earning members. In addition, third factor accounts for 10.78% variation and possess
the reason of i) Loss of investment, ii) Natural calamity. Similarly, third factor explains almost
10% variation of the all reasons and includes i) Higher interest, ii) Pressure for loan payment, iii)
Didn’t receive loan. Finally, the last factor accounts for 7.82% variation and includes i) Didn’t
get the facility of loan renewal, ii) Diversion of loan.
Besides, the extracted factors are constructed as per the nature of the original set of reasons.
Therefore, the first component can be named after 1) imbalance between amount and time span
of loan, and the second factor should be termed as 2) imbalance between dependent member and

90 | P a g e
earning member. Similarly, third factor can be defined as 3) incidence of investment loss and
fourth factor can be termed as 4) pressure created by the loan provider and the last factor can be
named after 5) unable to utilize and diverse the loan.
Table 5.5 Major dimensional factors of the causes of not over-coming from vicious cycle of
poverty among the households of the Haor areas in Bangladesh
SL# Causes of not overcoming from
vicious cycle of poverty
Rotated Factor Loadings (Varimax) Comun
alities F1 F2 F3 F4 F5
01. Insufficient loan 0.802 0.656
02. Duration of loan is insufficient 0.773 0.657
03. High interest 0.527 0.552
04. Renewal of loan not get 0.704 0.756
05. Diversion of loan 0.819 0.723
06. Loss of investment 0.828 0.711
07. Natural calamity 0.631 0.616
08. Not getting loan in time 0.505 0.489
09. Pressure of loan payment 0.766 0.700
10. Number of dependent members are high 0.846 0.748
11. Income earning member is absent 0.452 0.480
12. Number of incomes earning person is low 0.871 0.770
13. I have not taken loan -0.716 0.692
Percentage of variation explained 25.45 12.16 10.78 9.57 7.82
Total variation explained by the extracted factors 65.77
Kaiser-Meyer-Olkin measure of sampling adequacy 0.711
Bartlett's test of sphericity Chi-square = 6601.464; df = 78 & P-value < 0.001
Extraction method Principal Component Analysis
Note: F1 to F5 indicates five extracted factors.
5.4 Impacts of micro-credits at the household level
Impacts of micro-credits on poverty of HHs are measured using Difference in Difference (DID)
and before after comparison methods of income, expenditure and assets related indicators. These
are as follows:
5.4.1 Comparison of income related indicators between 2016 and 2019
Appendix table 5.1 depicted that total income of borrowing HHs as well as non-borrowing HHs
has been increased significantly over the period 2016-2019 and the income from agriculture,
non-agriculture and labor sale have imbued this increase in total income in spite of insignificant

91 | P a g e
increase in income from business and donations. Finally, total income of borrowing HHs has
been increased at higher rate than that of non-borrowing HHs over the period 2016-2019
significantly. This is permeated by the significant difference in increase of non-agricultural
income and labor sale though the increase in agricultural income, business and donation are
insignificant.
5.4.2 Comparison of expenditure and investment between 2016 and 2019
Appendix table 5.1 showed that total consumption expenditure with food and non-food
expenditures of both borrowers and non–borrowers has been increased over the period 2016-
2019 significantly. The increase in total consumption of borrowers and non-borrowers did not
significantly differ though non-food expenditure differs significantly. Total investment
expenditure of both borrowers and non –borrowers has been increased over the period 2016-
2019 significantly. All the items of investment have been increased in case of borrowers except
land purchase but in case of non- borrowers only land agriculture, family business, house repair
and others investment are significant. Finally, the increase of total investment expenditure of
borrowers has been significantly increased than that of non-borrowers and in item-wise all the
investment items except education.
5.4.3 Net impact of the micro-credits using difference-in-difference method
The net impact of micro-credits is measured calculating Z-statistic which is found by deducting
change in an economic indicator of borrowing HHs from non-borrowing HHs and multiplied by
100 as shown in appendix table 5.1. The table showed that total income of borrowers has been
increased over non-borrowers (z=6.75) significantly. Among the components of income, non-
agricultural income has been increased significantly on the other hand income from labor sale
has been decreased significantly. The incomes from agriculture, business and donations have
been increased but insignificantly. There are two heads of consumption expenditure viz. food
and non- food and the non-food expenditure has been increased significantly but food
expenditure has been decreased insignificantly while total food consumption has been increased
(z=1.06) significantly of borrowers over non-borrowers. The investment expenditure of
borrowers has been increased over the non-borrowers over the period 2016-2019 significantly.
Among the heads of investment expenditure healthcare, poultry livestock and productive assets

92 | P a g e
have been increased significantly over the period 2016-2019 of borrowers over non-borrowers
while investment on education, agriculture, family business, house repair, land purchase and
others investment have been increased insignificantly. Finally total expenditure, total investment
and savings of borrowers have been increased significantly over the non-borrowers in 2019
based on 2016.
5.5 A comparative impact of formal and informal micro-credits
A comparative impact of formal and informal micro-credits is done in terms income, expenditure
and investment as follows
5.5.1 Comparison of income related indicators in-between 2016 and 2019
Appendix table 5.2 showed that total income and its heads of income from agriculture, non-
agriculture and labor sale have been increased significantly of formal borrowers over the study
period while in case of informal sources total income and its heads of income from agriculture
and labor sale have been increased significantly. The heads of income from business and
donations in case of formal credits and incase of informal credits the heads of income from non-
agriculture, business and donations have been increased but not increased significantly.
5.5.2 Comparison of expenditure and investment on different heads between 2016 and 2019
Appendix table 5.2 showed that total consumption expenditure with its heads of food and non-
food consumption of both formal borrowers and informal borrowers have been increased over
the period 2016-2019 significantly. In case of formal borrowers’ total investment expenditure
and its entire heads except land purchase and house repairing have been increased significantly
over the period 2016-2019.
The increase in total consumption of borrowers and non-borrowers did not significantly differ
though non-food expenditure differs significantly. Total investment expenditure of both
borrowers and non –borrowers has been increased over the period 2016-2019 significantly. All
the items of investment have been increased in case of borrowers except land purchase but in
case of non- borrowers only land agriculture, family business, house repair and others investment

93 | P a g e
are significant. Finally, the increase of total investment expenditure of borrowers has been
significantly increased than that of non-borrowers and in item-wise all the investment items
except education.
5.5.3 Net impact of the micro-credits using difference-in-difference method
The net impact on income and its heads showed that total income and its entire heads do not
differ significantly among the formal and informal sources except donation income which has
been decreased(Z=-20.6) of formal sources over informal sources significantly(p=.001). The data
on total consumption showed that incase of formal borrowers the total consumption has two
heads and total consumption and food consumption did not change significantly over informal
borrowers (z=-13.68) but non-food expenditure has been decreased of formal borrowers than
informal borrowers significantly ((p=<0.01). Total investment has been increased (z=18.53) of
formal borrowers than that of informal significantly (p=<0.01). Among the items of investment,
education, agriculture, poultry –livestock, productive assets and durable goods have been
increased significantly of formal borrowers over informal borrowers won the other hand
investment in health care, family business, house repair, land purchase and others investment
have been decreased significantly. The total expenditure and savings have been increased of
formal borrowers over informal over the period 2016-2019 significantly.
5.6 Conclusion
Consequences of micro-credits on borrowers has been analyzed in this chapter while the impact
of micro-credits on poverty condition and efficiency of the programs will be analyzed in the next
chapter.

94 | P a g e
CHAPTER SIX
IMPACT OF MICRO-CREDITS ON POVERTY CONDITION AND
EFFICIENCY OF THE PROGRAM
6.1 Introduction
In this chapter we have analyzed the efficiency of micro-credit in poverty alleviation and which
program is more efficient i.e., the formal or informal in poverty alleviation. With this aim, the
discriminant analysis between formal and informal group is done.
6.2 Group means and standard deviation of the predictors of the discriminant analysis
Table 6.1 shows the measure of dispersion by groups to identify the variations among the
predictors between formal and informal credits receiving status. In terms of borrowers’ age at
inclusion to micro-credits, credits receivers from informal source are older than the credits
receivers from informal source.
Table 6.1 Group means and standard deviation for group membership of micro-credits receivers
List of predictors Group means Group standard deviation
Formal Informal Formal Informal
Gender of loan receiver 0.64 0.87 0.48 0.34
Age of loan receiver 41.80 44.19 11.28 11.45
Occupation of loan receiver 2.73 2.38 1.20 1.21
Earning status of loan receiver 0.71 0.87 0.45 0.34
Number of earning members 1.59 1.81 1.00 1.05
Dependency ratio 0.75 0.81 0.58 0.73
Regular income source 1.48 1.65 0.50 0.48
Asset index 0.02 -0.13 0.98 0.97
Type of used toilet 0.44 0.35 0.50 0.48
Total amount of land 67.29 80.75 112.39 112.20
Total annual income 105281.49 96233.18 58972.96 59387.91
Amount of received loan 34596.29 45474.61 40825.63 76125.59
Installment type 1.96 3.96 1.07 1.12
Duration of loan 11.86 21.25 3.51 22.80
Interest rate 17.77 26.00 7.55 19.12

95 | P a g e
The average number of earning members is slightly higher in informal credits receiver
households than that of formal credits receivers. It appears from the group standard deviation
that formal and informal credits receiving groups are more widely spreader in case of gender,
earning status, dependency ratio, amount of received loan, duration of loan and interest rate. The
variations between the groups were observed more in case of loan related factors. However, the
average dependency ratio was estimated lower in formal credits receiving households while
standard deviation was estimated higher than that of informal source of credits. The study also
identifies that the mean difference between formal and informal credits groups in case of loan
related characteristics is smaller but the standard deviation of these factors is relatively large.
This finding initially indicates that loan related characteristics will contribute more to
discriminate formal and informal source of loans.
The pooled within group correlation matrix are calculated to identify the linear relationship
among predictors as the initial or descriptive measure of multicollinearity. The correlation the
gender and occupation, gender and earning status, and occupation and earning status have
moderate correlation among the pair of all predators (Table 6.2).
Table 6.2 Pooled within-groups correlation matrix of the predictors
List of covariates 02. 03. 04. 05. 06. 07. 08. 09. 10. 11. 12. 13. 14. 15.
01. Gender 0.18 -0.70 0.68 0.01 0.02 -0.05 0.06 0.01 0.07 0.02 0.04 0.11 0.04 -0.05
02. Age -0.12 0.05 0.22 -0.24 -0.05 0.24 0.02 0.18 0.16 0.07 0.03 0.03 -0.03
03. Occupation -0.62 -0.08 -0.01 0.06 -0.09 -0.01 -0.21 0.02 -0.02 -0.09 -0.08 0.03
04. Earning status 0.25 0.03 -0.10 0.06 -0.06 0.06 -0.01 0.02 0.09 0.05 -0.03
05. No. of earner -0.18 -0.07 0.22 -0.01 0.14 0.20 0.14 0.10 0.25 0.03
06. Dependency
ratio 0.10 -0.22 -0.06 0.00 -0.09 0.00 0.05 0.09 0.04
07. Regular
income source -0.15 -0.15 0.07 -0.08 -0.06 0.11 0.11 -0.05
08. Asset index 0.05 0.25 0.29 0.06 -0.10 -0.10 -0.03
09. Toilet type -0.03 0.09 0.07 0.08 0.10 -0.04
10. Landholding 0.21 0.09 0.08 0.06 -0.07
11. HH income 0.23 -0.04 0.10 -0.07
12. Loan 0.17 0.30 0.17
13. Installment
type 0.23 0.21
14. Duration of
loan 0.16
15. Interest rate

96 | P a g e
However, the correlation matrix indicate very weak correlations among the predictors for rest set
of pair of predictors and the coefficient of correlation is estimated below 0.3 for all set of pairs.
Marginally, the multicollinearity is unlikely to be a problem for estimation as well as making
conclusion for discriminating the formal and informal credits receiving likelihoods.
6.3 Significance of covariates for discriminating formal and informal credits source
In discriminant analysis, Wilk’s lambda provides a test for assessing the null hypothesis that the
vectors of means of the measurements (predictors) are the same in the two groups (formal and
informal). The lambda coefficient is defined as the proportion of the total variance in the
discriminant scores not explained by differences among the groups, here 55.6% (table 6.3).
Table 6.3 Test of significance of function and equality of group means for each individual predictor
Name of the predictor variables Wilks' Lambda a F-statistic P-value
Test of function b 0.556 Chi-sq = 936.525 <0.01
Gender of loan receiver 0.952 81.302 <0.001
Age of loan receiver 0.991 14.409 <0.001
Occupation of loan receiver 0.984 26.473 <0.001
Earning status of loan receiver 0.973 43.798 <0.001
Number of earning members 0.99 15.424 <0.001
Dependency ratio 0.998 2.895 0.089
Regular income source 0.975 41.374 <0.001
Asset index 0.995 8.392 0.004
Type of used toilet 0.994 10.094 0.002
Total amount of land 0.997 4.648 0.031
Total annual income 0.995 7.587 0.006
Amount of received loan 0.992 13.582 <0.001
Installment type 0.592 1105.93 <0.001
Duration of loan 0.897 185.231 <0.001
Interest rate 0.913 153.155 <0.001
Model summary
Eigen value 0.78
Canonical correlation 0.666
R2 from canonical correlation 0.444 a Wilks’ 𝜆 (U-statistic) and univariate F-ratio with 1 and 1605 degrees of freedom b Wilks’ 𝜆 (U-statistic) and chi-square statistic tests the overall significance of function with 15 degrees of freedom

97 | P a g e
The formal test confirms that the sets of fifteen mean measurements differ significantly between
the two sites (Chi-sq (15) = 936.525, p<0.01). The significance of the uni-variate F-ratios
indicates that when the predictors are considered individually, is there any significantly
difference between those who had been credited from formal source and those who had been
credited from informal source. The study found that the mean dependency ratio significantly
differentiates the formal credits and informal credits at 10% level of significance. Besides,
average value of landholding indicate significantly differentiates the formal and informal credits
at 5% level of significance. However, rests of the covariates also significantly differentiate the
formal and informal credits receiving status at 1% or less than 1% level of significance. These
tests provide validity to proceed in the next level of discriminant analysis. Because there are two
groups, only one discriminant function can be estimated using all predictors. The eigenvalue
associated with this function is estimated at .786, which accounts for 100 percent of the
explained variance. The canonical correlation associated with this function is estimated at 0.666.
The square of the canonical correlation in discriminant analysis demonstrates the interesting
finding focusing of model fitting ability. However, the value of 0.444 of the R2 from the
estimated canonical correlation coefficient indicates that 44.4 percent of the variance in the
dependent variable (credits type) is explained or accounted for by this model.
6.4 Estimation and validation of two-group discriminant analysis
The estimate of the coefficients for a certain variable depends on other variables included in the
analysis. The sign of the coefficients indicates the effect of resulting variable on the formal and
informal credits receiving status. The unstandardized coefficients measure absolute magnitude of
the impact of each predictor on the discriminating power of the dependent variable. The larger
estimates of the unstandardized coefficients identified the more powerful or influential predictor
for discriminating the formal and informal credits types. The standardized coefficient is
estimated because some of the predictor variables were in different scale or they are observed in
different units. Besides the standardized coefficients are more prompt possessing the caveat of
multicollinearity problem through implying the relative importance of each predictor for
discriminating formal and informal credits receiving status. In addition, relatively large
standardized coefficient demonstrates more discriminating power of the function as compared to
the smaller standardized coefficients. These imply that the variable with relatively large

98 | P a g e
estimates of the standardized coefficients is more important than the other coefficients. The
coefficients of the model indicates that higher installment type (annual), more duration of loan,
female loan receivers, earner loan receivers, households having regular income source, older
loan receivers, households having more assets are more likely to receive the formal credits than
that of informal credits (Table 6.4). However, smaller number of earning members in the
borrower households, unhygienic toilet type, lower dependency ratio is more likely to receive the
loan from formal source than that of informal source.
In addition, the canonical loadings or discriminant loadings are estimated to identify the
magnitudes of the discriminating power of the predictors. These loadings measure the correlation
between discriminating variables (study predictors) and the canonical discriminating functions
which are presented at the structure matrix column in table 6.4.
Table 6.4 Estimates of two-group discriminant analysis for formal and informal credits
Discriminating variables a Unstandardized
coefficients b
Standardized
coefficients c Structure Matrix d
Installment type 0.802 0.867 0.930
Duration of loan 0.018 0.222 0.380
Interest rate 0.013 0.159 0.346
Gender of loan receiver 0.511 0.227 0.252
Earning status of loan receiver 0.015 0.006 0.185
Regular income source 0.109 0.054 0.180
Occupation of loan receiver 0.087 0.105 -0.144
Number of earning members -0.028 -0.028 0.110
Age of loan receiver 0.005 0.061 0.106
Amount of received loan 0.001 -0.124 0.103
Type of used toilet -0.327 -0.161 -0.089
Asset index 0.051 0.050 -0.081
Total annual income 0.001 -0.036 -0.077
Total amount of land 0.001 -0.015 0.060
Dependency ratio -0.039 -0.024 0.048
Constant -3.167 - - a Discriminating variable (predictors) are ordered by size of correlation within function to identify most contributor b Coefficients are obtained from the original (unstandardized) set of predictors using canonical discriminant function c Coefficients are obtained from the standardized set of predictors using canonical discriminant function d Pooled within-groups correlations between discriminating variables and canonical discriminant functions, therefore
called as canonical loadings or discriminant loadings

99 | P a g e
In short, the discriminating loadings identified the most important predictor among predictors for
discriminating the borrowing source of micro-credits. Similarly, these estimates rank or order the
predictors based on their discriminating power of the dependent variable. More precisely,
installment types are the most important predictors in discriminating between formal and
informal credits groups, followed by duration of loan, followed by interest rate, followed by
gender of the loan receivers, followed by earning status of loan receivers, followed by regular
income source in the households and so on. On the contrary, dependency ratio, household
possession of land, households’ total income is the least contributory predictor, however
significant, for discriminating the borrowing source of micro-credits.
In discriminant analysis, the validation of the model is grabbed using cross-validation
approaches. Generally, the discriminant analysis model splits the whole data sets into two equal
parts in which first one is termed as estimation sample or analysis sample and rest one is termed
as holdout or validation sample.
Table 6.5 Validation of the two-group discriminant analysis model
Prior probabilities based on groups (informal = 0.279, formal = 0.721)
No cross-validation a
Type of credits Predicted
Total Informal Formal
Observed Informal 240 209 449
Formal 24 1134 1158
Leave one out cross-validation b
Type of credits Predicted
Total Informal Formal
Observed Informal 239 210 449
Formal 25 1133 1158 a Hit ratio of 0.855 measure that 85.5% of original grouped cases correctly classified b Hit ratio of 0.854 measure that 85.4% of cross-validated (leave one out) grouped cases correctly classified
On the other hand, leave one out cross-validation approach is also examined to estimate the
accuracy of correct classification rate by splitting the samples equivalent to its size (n-term).
Each time one sample is reserved for validation sample while the rest sample are used as the
estimation sample and this process is repeated n-times holding each sample as validation sample.
It is to be noted that the prior distribution is assumed equivalent to the sample estimate for each
group of the dependent variable rather than 0.5 for each group. Finally, the validation of the

100 | P a g e
discriminant analysis is documented using the percentage of correct classification which is
termed as hit ratio in discriminant analysis. However, there is no substantial improvement in the
leave one out cross-validation approach as compared to the no cross-validation which is
presented in table 6.5. In addition, no cross-validation approach estimates that almost 86% of the
original grouped cases such as formal and informal source of credits are correctly classified by
the discriminant analysis model.
6.5 Estimation of Fisher’s linear discriminant function
Final, this study estimates the parameters of the Fisher’s linear discriminant function for
discriminating the formal and informal source of credits by the study variables. This study
mainly examined three types of predictors for discriminating formal and informal source. These
are: individual level factors or the characteristics of the borrowers (loan receivers), their
household characteristics, and finally micro-credits characteristics. The estimated Fisher’s linear
discrimination function is as follows:
D = -8.12 + 1.02×Sex + 0.01×Age + 0.17×Occupation + 0.03×Earning status - 0.06×Number of
earner - 0.08×Dependency ratio + 0.22×Household’s regular income source + 0.10×Asset
index - 0.65×Toilet type + 0.01×Landholding + 0.01×Annual income + 0.01×Amount of
loan + 1.59×Installment type + 0.04×Duration of loan + 0.03×Interest rate
This function is used to predict or classify a new individual with the respective characteristics
who are supposed to borrow from formal source or informal source. The average of the group
means commonly known as group centroids and the score or value obtain from Fisher’s linear
discriminant function are used and compared to allocate new members into a group. The average
of the functions at group centroid is estimated at 0.44 (Table 6.6). Therefore, it is obvious that
new members with discriminant scores above 0.44 supposed to borrow micro-credits form the
informal sources otherwise he/she would be preferred to borrow from formal source.

101 | P a g e
Table 6.6 Estimates of Fisher’s linear discriminant function by two-group discriminant analysis
Predictors Informal Formal Fisher's discriminant
function coefficients
(Constant) -41.02 -32.90 -8.12
Gender of loan receiver 7.95 6.94 1.02
Age of loan receiver 0.38 0.37 0.01
Occupation of loan receiver 6.33 6.16 0.17
Earning status of loan receiver 10.00 9.97 0.03
Number of earning members 0.41 0.46 -0.06
Dependency ratio 2.97 3.04 -0.08
Regular income source 7.31 7.10 0.22
Asset index -0.35 -0.45 0.10
Type of used toilet 3.05 3.70 -0.65
Total amount of land 0.01 0.01 <0.01
Total annual income <0.01 <0.01 <0.01
Amount of received loan <0.01 <0.01 <0.01
Installment type 2.18 0.58 1.59
Duration of loan 0.01 -0.03 0.04
Interest rate 0.19 0.17 0.03
General classification rule
Functions at group centroids 1.43 -0.56 0.44
6.6 Conclusion
The impact of micro-credits on poverty condition and efficiency of the programs has been
analyzed in this chapter and the next chapter has attempted to present the findings from the
qualitative surveys are presented in the seventh chapter.

102 | P a g e
CHAPTER SEVEN
FINDINGS FROM THE QUALITATIVE SURVEYS
7.1 Introduction
As per the plan of the study, 30 Key Informant Interviews (KIIs) and 30 In-depth Interviews
(IDIs) on the research topic “Vicious Cycle of Poverty in Haor Region of Bangladesh: Impact of
Formal and Informal Credit” were conducted in different locations of the Haor region of
Bangladesh. The aim of these qualitative surveys was to get in-depth understanding of the credit-
trap and its impact on poverty situation of the concerned households.
The key informants were the community leaders (preferably Chairman of Union Parishad),
delegates from civil society, and other stakeholders including the NGO delegates working in
Haor areas. On the other hand, the participants of in-depth interviews were the selected victims
of poverty cycle, local money-lenders and delegates of existing MFIs working in the Haor
region. The principal investigator and co-investigator have mainly conducted the key informant
interviews and in-depth interviews. Besides, some of the in-depth interviews were done by
research assistants. All the interviews were recorded through personal digital assistant (PDA) at
the time of survey. The responses have been transcribed to extract conclusive comments on the
issues. Following strategies have been followed in conducting the KIIs/IDIs:
At first, the consent of the key informants and participants of in-depth interviews were sought by
briefing the objectives of research project and aims of qualitative surveys. The
interviews/discussions were conducted if consent were found duly. If consent was not found in
any case, the interview was postponed for the particular case (key informants/participants). The
key informant interviews and in-depth interviews were performed covering the following issues:
The Issues are as follows
(1) Availability of the micro-credits in the community;
(2) Interest rate of micro-credits in the community;
(3) Purposes receiving micro-credits;
(4) Causes of not getting formal and informal micro-credits;

103 | P a g e
(5) Heads of utilization heads of micro-credits;
(6) Attitudes of borrowers on formal and informal micro-credits programs;
(7) Causes of ineffectiveness of micro-credits for poverty reduction perspective;
(8) Causes of remaining poor after using micro-credits; and
(9) Suggestions for maximization of benefits from micro-credits
7.2 Findings
The key findings of the quantitative household survey have been shared with the key informants
to make the discussion easier as well as to know their views on the quantitative results. Most of
the key informants agreed that the findings are very much consistent with prevailing condition of
micro-credits in Haor region. However, some of them raised question about the impacts of
micro-credits. They argued that there is no straightforward positive impact of micro-credits on
poverty condition of the households. Some of them have mentioned that the increase of income
and food expenditure is not the good indicator of measuring poverty alleviation. They have given
emphasis on qualitative views of the victims/respondents rather than quantitative data
Issue#01: Availability of the micro-credits in the community
The key informants/participants informed that micro-credit is available in each and every corner
of the Haor region. However, the sources of micro-credits, in terms of formal and informal, are
vary in different locations. In the early days, only informal sources (like Mahajan’s loan) of
micro-credits were available in Haor region. However, the pattern has shifted as several
government and non-government organizations have come forward with micro-credit facility in
the Haor region. Now-a-days formal sources of micro-credits are dominating over informal
sources. Most of the formal sources are mainly for SMEs purpose. A loan to meet the family
consumption expenditure is rare from formal sources. The Haor people still depends on
informal sources of micro-credits for covering the emergency situation like treatment of
household members, covering the cost of food items during severe food shortages. The key
informants/participants viewed that the exiting micro-credit system of formal sources is not user
friendly to the credit receivers. The necessary documents along with the provision of collateral
and the loan re-payment system are regarded as the main hindrances for user friendly micro-
credit system from formal sources.

104 | P a g e
Issue#02: Interest rate of micro-credits in the community
The key informants/participants informed that the interest rate of micro-credits vary remarkably
between formal and informal sources. The interest rate of micro-credits is overwhelmingly
higher for informal sources like Mahajan’s credit. Among other terms and conditions, the
duration is very limited for informal sources of micro-credits. The key informants and
participants of IDIs informed that the interest rate of micro-credits from informal sources is
sometimes rise to 60% in some season, particularly before harvesting the crops. On the other
hand, the interest rate of micro-credits is remains constant throughout the year for institutional
sources like banks, NGOs etc.
Issue#03: Purposes of receiving micro-credits
Regarding reasons of receiving micro-credits, the key informants and participants of IDIs
informed that covering the food expenditure, repairmen of living house, investment in agriculture
farming, investment in purchasing livestock, and expenditure for treatment of household
members are the main reasons for receiving micro-credits. Some informants also mentioned
purchasing motorcycle and expenditure of education of children are the reasons for receiving
micro-credits. But repayment of earlier loan is one of the prime reasons of micro-credits. As a
result, most of the credit receivers could not come out from credit cycle. Ultimately, they failed
to come out from poverty status and remain in the vicious cycle of poverty.
Issue#04: Causes of not getting formal and informal micro-credits
The participants said that they do not know about some micro-credits programs, nepotism,
misappropriation of credits, lack of entry fee/bribe and bureaucratic problem are the main causes
of not getting micro-credits from formal sources. The discussant told that high rate of interest,
social status, non-availability collateral, relationship, lobbing, non-cooperation of local members
budget limitation are the main causes of not getting micro-credits from in-formal sources.
Issue#05: Heads of utilization of micro-credits
The key informants and participants have informed that the micro-credits are mostly utilized to
meet-up the food expenditure, repairing the living house, investment in agriculture for harvesting
105 | P a g e
crop along with loan repayment. Due to the threat of losing the collateral, most of the credit-
receivers used to get another loan to pay the earlier credits. A few of the credit-receivers can
come out from this sort of credit-trap unless asset depletion.
Issue#06: Attitudes of borrowers on formal and informal micro-credits programs
The attitudes towards formal and informal micro- credits are explored by the discussants that the
rate of interest is very high, credits period is insufficient and terms are rigid.
Issue#07: Causes of ineffectiveness of micro-credits for poverty reduction perspective
Since most of the micro-credits are utilized in non-productive heads and consequently the credit-
receivers cannot pay the installment in time. When credit-receivers fails to pay the installment in
time, the credit amount becomes bigger and bigger by adding the interest with the principal
amount as time goes. Ultimately, most of the credit-receivers cannot come out from credit cycle
unless sale of any valuable property. The economic condition of the concerned households
becomes poorer due to the asset depletion. The key informants and participants have informed
that lack of household-level policy is the main reason for this sort of asset depletion. In addition,
lack of skills on SMEs to carry out a productive economic activity is also vital reason for
ineffectiveness of micro-credits. Thus, the lack of policy, lack of skills, and investment in non-
productive heads appeared as the hindrances for effectiveness of the micro-credits on the
perspective of poverty reduction.
Issue#08: Causes of remaining poor after using micro-credits
The participants explored the causes of not come out from vicious cycle of poverty in spite of
using loans due to pressure of repayment of loans, loss of investment, not renewal of loans in
need, short duration of loans diversion of loans from main purposes, absent of income earning
member in the family.
Issue#09: Suggestions for maximization of benefits from micro-credits
The analysis of the threadbare discussions of the key informants and participants, following
suggestions could be made for getting maximum benefits from micro-credits:

106 | P a g e
➢ In general, the micro-credits from informal sources should be stopped. Instead, a new
social safety nets program can be introduced for the Haor people to help them during
food shortages.
➢ The most of the participants suggested that for breaking vicious cycle of poverty by
micro-credits the duration of loans should be at least five year and the volume of loans
must be minimum 500,000 and repayment should at not be less than monthly. The rate of
interest should not be more than 5%.
➢ The micro-credits from formal sources should be encouraged for the households whose
members acquired capability of start any economic activity through skill-development
program.
➢ The government should undertake a plan of action to review the existing micro-credit
programs of Haor region to make the programs user friendly in terms of required
documents, interest rate and duration. The zero-interest micro-credit system can be
introduced for vulnerable households.
➢ Skill-development training programs should be strengthening covering different
investment areas for the adult members of credit-receiver households.
➢ The key informants also argued for more research to find out different pathways for
eradication of poverty of Haor people in order to achieve the targets of SDGs.

107 | P a g e
CHAPTER EIGHT
SUMMARY OF FINDINGS AND POLICY IMPLICATIONS
Summary of findings: After analyzing the data the following findings are found:
❖ Socio-demographic characteristics of the respondents and study population;
❖ Housing conditions and facilities of housing;
❖ Landholdings of households;
❖ Possession of assets by households;
❖ Reasons of not getting micro-credit by eligible non-borrowers;
❖ Sources and types of micro-credits;
❖ Purpose of micro-credits;
❖ Volume of both formal and informal micro-credits;
❖ Terms and conditions of micro-credits;
❖ Payment status of loans;
❖ Expenditure and investment pattern of micro-credits;
❖ Income of both borrowers and non-borrower households;
❖ Expenditure of both borrowers and non-borrower households;
❖ Causes of non-payment of loans in time;
❖ Attitude of borrowers towards micro-credits;
❖ Role of micro-credits on graduation of selected socio-economic status;
❖ Major dimensional factors of not graduating from poverty from micro-credit;
❖ Impact of micro-credit at the household level;
❖ Comparative impact between formal and informal micro-credit;
❖ Efficiency of the programs;
❖ Findings from the qualitative surveys.
Socio-economic profile of the respondents and study population: The real data of the
depicted out of total 2340 respondents 69% were borrowers (treatment group) and 31% were
non-borrowers (control group). In terms of relationship of respondents with household heads lion
portion (81%) respondents were the household heads. In respect of gender 76.8% was male and
23.2 was female and in respect of age 62% were between 31 and 50. Among the respondents

108 | P a g e
92.2% was married and 5% was widowed and in regard of literacy level more than half of the
respondent’s attended primary. In respect occupation of respondents 20% engaged in agriculture,
23% in labor selling, 13% in off-farm activities, 19% in business/service and 18.9% in household
work. In respect of income earning nearly half are found as full-time income earner and about
29% were part-time and 21% of the respondents had no earning source. The distribution of
household population in respect of sex 51.17% was male and 48.83% female and in respect of
age 35.2% male and 37.9% female are up to 15 years, 26.7% male and 28.3% female between
16-30 years and 25.5% male 25.3% female are between 31-50 years 6.8% male, 4.9% female are
in between 51-60 age and 5.7% male and 3.7% female are above 60. The marital status of the
population 16 and above showed that the lion part of population is married (66.4% for male and
73% for female) and female population is being getting early married than their male
counterpart. Near half of the study population are found to attend primary level education and
only about 2% completed graduate and the illiteracy rate was higher of women than men. In
respect of occupation male aged between 16 years and 60 years showed that 8.9% farming,
13.5%day laborer, 8.4% off-firm activities 13.7% service/business 11% student, 34.6%
household work and 9.9% others while 71% women in household work including vegetable
cultivation, poultry rearing, weaving mattress, stitch khatha, fire-wood collection, feeding cattle,
helping in agricultural work etc. The distribution of earning of household members aged 16 and
above showed that 28% were full-time earner and about 22% were part-time earner and about
one-quarter male and three-quarters female are found to no work at the survey point.
Housing conditions and facilities of housing: The ownership pattern of housing showed that
about 95% of the households owns house for living and 20% of the households uses one room,
42% of uses 2 rooms and 10% four and more rooms for living. Most of the houses (86%) are
made of made of tin shed roof with different kinds of fence and only 4.3% is made of straw roof
with bamboo/muddy fence. The quality of houses was found inferior for borrower households in
comparison to non-borrower households. About 39% of the households does not own separate
kitchen room for cooking while the main sources of cooking fuel were straw/leaf/husk (43.6%)
and wood/kerosene (30.1%) and 74% of the households used these. In respect of utilities
facilities 87% of the area has electricity connection while 81% of the surveyed households have
access to this electricity and 19% uses lamp of kerosene oil. The data on sanitation facilities

109 | P a g e
revealed that 91.6% owns toilet, 15% used hygienic latrine with water-preventing capacity 28%
used pit latrine without water preventing capacity and over half of the households used
completely non-hygienic toilet that include katcha and open field/space.
Landholdings of households: The study showed that 8.5% of the surveyed households had no
homestead land, 79.2% owned homestead land between 1 to 15 decimals and only 12.3% owned
homestead land more than 15 decimals. Among the surveyed households, over two-thirds have
no agricultural land and 7% owned agricultural land between 1 to 15 decimals, 8% owned
agricultural land between 16 to 50 decimals, and only 17% over 50 decimals. Among the land-
owning households, the average cultivable agricultural land is 105.85 decimals for non-borrower
households and 96.96 decimals for borrower households. It is found that 27% of the households
had some sort of leased land and the average size of this kind of land is 102.66 decimals. About
94% of study households possessed pond and average size of the pond land is 8.65 decimals.
Possession of assets by households: The study revealed that 14.8% household owned boats
1.2% owned deep tube well, 20.6% owned tube well and 8.1% owned bicycle, 16.2% owned
television, 6.2% owned drawing room furniture, 28.5% owned watch 69.7% owned electric fan
and 90% owned mobile phone. The possession of productive assets revealed that 664 borrowers
HHs and 311 of non-borrowers HHs possessed cultivating instruments on average 3.27 and 3.05
respectively while livestock possessed by 694 HHs of borrowers and 287 HHs of non -borrowers
The average possession of cultivating instruments and livestock is 3.20 and 2.49 respectively.
Reasons of not getting micro-credit by eligible non-borrowers: Fifteen causes were given to
the eligible but not receivers of micro-credits and through PCA with Varimax rotation
technique we reduced major four dimensional factors and factor one related to credit
misappropriation and biasness, factor two related to non-cooperation of local authority, factor
three related to bureaucracy and budget limitation and forth factor is related to ignorance and
corruption.
Sources and types of micro-credits: The study revealed that in terms of loan receivers 1595
(99.3%) HHs borrowed cash loan and only 12 (0.7%) in kinds and in respect of sources 1158

110 | P a g e
HHs (72.1%) borrowed from formal sources and 449 HHs (27.1%) from informal sources. There
are two types of formal sources viz. (i) government (Banks/Co-operatives; and (ii)
nongovernment (MFI/NGO/Insurance) and 88 HHs (5.5%) borrowed from the former and the
1070 HHs (66.6%) from the later. There are three informal sources viz., (i) local money lender
(mohajan/private samittee); (ii) non-interest loan (relatives/ friends/ neighbors); and (iii) more
than one sources and the data revealed that 393 HHs (24.5%) taken loans from the first, 53 HHs
(3.3%) from the second and only 3 HHs (0.2%) from the third. Again, the informal sources have
been divided into interest bearing and non-interest bearing and 408 HHs (90.9%) have taken
from the former and HHs 41(9.1%) from the later.
Purpose of micro-credits: To identify the purpose of borrowing seventeen purposes were given
to borrowers through pilot survey and using PCA the seventeen purposes reduced to five factors
as factor- one related to daily life and livelihoods, factor-two related to adaptability of natural
shocks and farming, factor three related to cropping and raring cattle the elements, factor four
related to business and marriage and factor five related to sending family member to abroad.
Volume of both formal and informal micro-credits: The data revealed that minimum amount
of all types of loans is Tk. 2000, maximum amount of formal loan, informal loan, in total are
Tk. 550,000 and Tk. 11, 00,000 and 11, 00,000 respectively and mean is Tk. 34596 for formal
and 45475 for informal and 37636 in total. Among the informal loans maximum amount of
interest bearing and non-interest bearing are Tk. 1100000 and Tk. 150000 respectively. The
mean of interest bearing and non-interest bearing are loans are Tk. 47696 and Tk. 233656
respectively.
Terms and Conditions of micro-credits: In respect of interest rate for formal credits it varies
between 1% and more than 25% and 50% of HHs (525 out of 1158) borrowed at 11% to 15%
and 211HHsat 16% to 20% while in case of in formal loans more than 41% HHs (185) get at
more than at 25%, and 25% HHs (106) borrowed at 1% 10%. Regarding the type of installment
in case of formal credit more than 53% HHs (619) borrowed weekly basis while about 50% of
informal borrowers on monthly basis. In respect of total installment more than 52% more than 24
installments while 50% informal borrowers on 2 to 12 installments. Regarding the duration of

111 | P a g e
loans about 95% (1096) formal borrowers and 71 % (317) informal borrowed for one year and
most of the credits of both formal (94%) and informal (94%) are non-collateral.
Payment status of loans: The payment status of loans showed that 97% (1113) formal and 55%
(245) of informal borrowers paid totally in time in which 1108 paid principal and 1092 paid
interest under formal credit and in case of informal 144 paid principal and 233 paid interests. In
overall 1358 (86%) borrowers paid totally in time in which 1252 principal and 1345 interest.
Expenditure and investment pattern of micro-credits: The respondents were given a list of 24
expenditures and investments items of their loans and among those 14 items were marked by
them. The items marked by 10% or above borrowers in case of formal credits are, family
enterprise (15.76%) followed by agricultural loan (15.09%), food consumption (15.5%), others
(13%) and payment of loan (12%). The investment and expenditure items of formal borrowers
10% and above are food consumption (23.24%), others (16.86%), payment of loan (12.97%) and
health care (11.68%) and in total of both food consumption (17.34%), others (14.08%), family
enterprise (13.60%), agricultural inputs (13.03%) and payment of loan (12.29%).
Income of both borrowers and non-borrower households: The study showed that annual
income of majority borrowers 1053 (66%) depend on income from labor sale following from
agriculture 830 (56%), non-agriculture 83 (52%), business 400 (25%) and donation 208(13%).
Similarly, the annual income of majority non-borrowers 464(63%) comes from labor sale
following agriculture 333(45%), non-agriculture 331 (45%), business 197(27%) and donations
81(11%).
Expenditures of both borrowers and non-borrower households: Data analysis depicted that
both the borrowers and non-borrowers HHs incurred expenditure for consumption in respect of
both food and non-food but borrowers HHs incurred 80% for food and 20% for non-food while
non-borrowers HHs 84% for food and 16% for non-food and there is significant difference in
respect non- food consumption as well as total consumption between borrowers and non-
borrowers HHs. There are twelve items of investment expenditure and the items above 5% of
total expenditure in case of borrowers’ HHs are agriculture (20%), healthcare (20%) family

112 | P a g e
business (16%), house repair (9%) and poultry /livestock (7%) while in respect of non –
borrowers the investment items above 5% of in terms of percentage of total expenditure are
healthcare (27%), agriculture (23%), education (18%), family business 9% and house repair
(9%). There is significant difference between borrowers and non-borrowers in the items of
education, healthcare, poultry/livestock, productive assets, durable goods, house repair, others
investment and also in total investment expenditure as well as total expenditure (consumption
plus investment).
Causes of non-payment of loan in time: The borrowers were given a list of fourteen possible
causes of non- payment of loan in time and PCA reduced the fourteen causes into four factors.
The first factor is related to food and medicine, the second factor is related to marriage and legal
problems of family, the third factor is related to terms of loan and investment lastly the fourth
factor related to cost and unavailability of loan in time.
Attitude of borrowers towards micro-credits: The borrowers were given sixteen dimensions
of attitudes related to micro-credits and after statistical analysis and PCA these dimensions are
reduced into major four factors that micro-credits help in increasing the income and savings
firstly, secondly terms and conditions of loans are rigid, third factor related to cost of loans is
high finally the fourth factor is that micro-credits boost up food and health.
Role of micro-credits on graduation of selected socio-economic status: The role of micro-
credits is measured in terms of food security, socio-economic status and investment on education
and healthcare.
The study showed that the households of Haor regions who received micro-credits benefit are
found in more food security than the non-borrower households. The proportion of households
with moderate food insecurity is significantly (p<0.01) reduced to 14.5% from 19.0% due to
micro-credits program. This study also found that the incidence of normal food insecurity also
significantly (p<0.01) reduced to 9.3% from 16.2%. On the other hand, such type of changes is
also observed among non-borrower households but the decrement was found notably lower and
statistically insignificant as well.

113 | P a g e
The percentage households having extreme poor and moderately poor condition are estimated
lower after receiving micro-credits. It is noticeable that the proportion also reduces to the non-
borrower households but the decrement was statistically insignificant. However, the micro-
credits have significant influence for reducing extreme poverty condition among credits
receiving households.
The data on the percentage of households with the increase of educational expenditure are
estimated higher in case of borrower households (63.8%) than that of non-borrower households
(51.0%). This study found that the average educational expenditure increases significantly
among borrower households as well as among non-borrower households. In addition, the
increment of healthcare expenditure also observed both case and control households. The case-
control comparison indicates that the healthcare expenditure increases more among borrower
household (70.1%) than non-borrower household (60.3%). Besides, the before-after comparison
indicates that the healthcare expenditures among borrower households but insignificant among
non-borrower households.
Major dimensional factors for not graduating from poverty by micro-credits: To find out
the causes of not graduating from poverty in spite of using micro-credits among both case and
control households’ fourteen dimensions were listed to the respondents. The principal cause was
found as natural calamity among non-borrower households (75.3%) and pressure of the payment
of loan among borrower households (83.9%). The second prime reason was loss of investment
among non-borrower households (72%) and high interest rate among borrower households
(73.1%). The PCA reduced these dimensions into five factors- (i) imbalance between amount
and time span of loan; (ii) imbalance between dependent member and earning member; (iii)
incidence of investment loss; (iv) pressure created by the loan provider and (v) unable to utilize
and diverse the loan.
Impact of micro-credit at the household level: Impact of micro-credits at household level is
measured by comparing between 2016 and 2019 that means before and after comparison and
DID method of income related indicators and expenditure and investment. The study showed that
total income of borrowing HHs as well as non-borrowing HHs has been increased significantly
114 | P a g e
and the income from agriculture, non-agriculture and labor sale have imbued this increase in
total income in spite of insignificant increase in income from business and donations. Finally,
total income of borrowing HHs has been increased at higher rate than that of non-borrowing HHs
significantly. This is permeated by the significant difference in increase of non-agricultural
income and labor sale though the increase in agricultural income, business and donation are
insignificant. Analysis of data showed that total consumption expenditure with food and non-
food expenditures of both borrowers and non–borrowers has been increased significantly. The
increase in total consumption of borrowers and non-borrowers did not significantly differ though
non-food expenditure differs significantly. Total investment expenditure of both borrowers and
non –borrowers has been increased significantly. All the items of investment have been increased
in case of borrowers except land purchase but in case of non- borrowers only land agriculture,
family business, house repair and others investment are significant. Finally, the increase of total
investment expenditure of borrowers has been significantly increased than that of non-borrowers
and in item-wise all the investment items except education.
The relevant data showed that total income of borrowers has been increased over non-borrowers
(z=6.75) significantly. Among the components of income, non-agricultural income has been
increased significantly on the other hand income from labor sale has been decreased
significantly. The incomes from agriculture, business and donations have been increased but
insignificantly. The non-food expenditure has been increased significantly but food expenditure
has been decreased insignificantly while total food consumption has been increased (z=1.06)
significantly of borrowers over non-borrowers. The investment expenditure of borrowers has
been increased over the non-borrowers significantly. Among the heads of investment expenditure
healthcare, poultry livestock and productive assets have been increased significantly of the
borrowers over non-borrowers while investment on education, agriculture, family business,
house repair, land purchase and others investment have been increased insignificantly. Finally
total expenditure, total investment and savings of borrowers have been increased significantly
over the non-borrowers.
Comparative impact of formal and informal micro-credits: A comparative impact of formal
and informal micro-credits is done in terms income, expenditure and investment as follows:

115 | P a g e
The data on income related showed that total income and its heads of income from agriculture,
non-agriculture and labor sale have been increased significantly of formal borrowers over the
study period while in case of informal credits total income and its heads of income from
agriculture and labor sale have been increased significantly. The heads of income from business
and donations in case of formal credits and incase of informal credits the heads of income from
non-agriculture, business and donations have been increased insignificantly.
Data showed that total consumption expenditure with its heads of food and non-food
consumption of both formal borrowers and informal borrowers have been increased significantly.
In case of formal borrowers’ total investment expenditure and its entire heads except land
purchase and house repairing have been increased significantly. The increase in total
consumption of borrowers and non-borrowers did not significantly differ though non-food
expenditure differs significantly. Total investment expenditure of both borrowers and non-
borrowers has been increased significantly. All the items of investment have been increased in
case of borrowers except land purchase but in case of non- borrowers only land agriculture,
family business, house repair and others investment are significant. Finally, the increase of total
investment expenditure of borrowers has been significantly increased than that of non-borrowers
and in item-wise all the investment items except education.
The net impact on income and its heads showed that total income and its entire heads do not
differ significantly among the formal and informal sources except donation income which has
been decreased (z=-20.6) of formal sources over informal sources significantly (p=.001).The
data on total consumption showed that incase of formal borrowers the total consumption has two
heads and total consumption and food consumption did not change significantly over informal
borrowers (z=-13.68) but non-food expenditure has been decreased of formal borrowers than
informal borrowers significantly (p=<0.01). Total investment has been increased (z=18.53) of
formal borrowers than that of informal significantly (p=<0.01) among the items of investment,
education, agriculture, poultry–livestock, productive assets and durable goods have been
increased significantly of formal borrowers over informal borrowers on the other hand
investment in health care, family business, house repair, land purchase and others investment

116 | P a g e
have been decreased significantly. The total expenditure and savings have been increased of
formal borrowers over informal significantly.
Efficiency of the programs: The discriminant analysis between formal and informal borrowers
was done in respect of selected fifteen predictors (variables) to assess the efficiency of the
programs. The analysis showed that there is significant discriminant between the two groups of
borrowers in respect all predicators. Based on the estimates of the discriminant analysis such as
un-standardized coefficients, standardized coefficients and structure matrix we found the
magnetite of discriminating power of the predictors. The top most ten magnitude predictors are
types of installments followed by duration of loan, interest rate, gender, earning status, regularity
of income, occupation, number of earning members, age and amount of loan. We have
established the Fisher’s linear discriminant function for discriminating the formal and informal
source of credits by the fifteen stated variables above to predict or classify a new individual with
the respective characteristics who are supposed to borrow from formal source or informal source.
The average of the functions at group centroid is estimated at 0.44. Therefore, it is obvious that
new members with discriminant scores above 0.44 supposed to borrow from the informal
sources, otherwise he/she would be preferred to borrow from formal sources.
Findings from the qualitative surveys: The key informants/participants informed that micro-
credit is available in each and every corner of the Haor region. Though there are numerous
formal sources yet, the Haor people still depends on informal sources of micro-credits for
covering the emergency situation like treatment of household members, covering the cost of food
items during severe food shortages. The interest rate of micro-credits from informal sources is
sometimes rose to 60% in some season, particularly before harvesting the crops. On the other
hand, the interest rate of micro-credits is remains constant throughout the year for institutional
sources like banks, NGOs etc. The main purpose of getting loans is for food expenditure,
repairmen of living house, investment in agriculture farming, investment in purchasing livestock,
and expenditure for treatment of household members are the main reasons for receiving micro-
credits. The causes of not getting formal and informal micro-credits are they do not know about
some micro-credit programs, nepotism, misappropriation of credits, lack of entry fee/bribe and
bureaucratic problem. The heads of utilization of micro-credits are to meet-up the food

117 | P a g e
expenditure, repairing the living house, investment in agriculture for harvesting crop along with
loan repayment. The borrowers said that the rate of interest is very high, credits period is
insufficient and terms are rigid. The causes of ineffectiveness of micro-credits for poverty
reduction perspective are the lack of policy, lack of skills, and investment in non-productive
heads appeared as the hindrances for effectiveness of the micro-credits on the perspective of
poverty reduction. The main suggestions for maximization of benefits from micro-credits are
that in general, the micro-credits from informal sources should be stopped, the volume of loan
should be increased at lower rate, the micro-credits from formal sources should be encouraged
for the households whose members acquired capability of start any economic activity through
skill-development program. The government could undertake a plan of action to review the
existing micro-credit programs. Skill-development training programs should be strengthening
covering different investment areas for the adult members of credit-receiver households and
finally new research may be undertaken to find out different pathways for eradication of poverty
of Haor people in order to achieve the targets of SDGs.

118 | P a g e
REFERENCES
Abdalla, Nagwa Babiker (2009), The Impact of The Sudanese General Women's Union Savings
and Micro-Finance/Credits Projects on Poverty Alleviation at The Household Level with
Special Emphasis on Women's Vulnerability and Empowerment, Unpublished PhD
Thesis, University of South Africa, Promotor: Prof L Cornwell
Adeyemo Comfort Wuraola (2014), Vocational Skill Acquisition and Micro-Credits Loans as
Determinants of Socio-Economic and Psychological Adjustments of Widows in
Southwestern Nigeria, PhD Thesis, University of Ibadan, Nigeria
Ahlin Christian (2009), Matching for Credits: Risk and Diversification in Thai Micro-credits
Groups, Research Paper on Seminar, Boston University, Chicago, Georgia, Michigan
State.
Ahlin Christian and Neville (2005), Can Micro-Credits Bring Development? Department of
Economics Vanderbilt University Nashville, TN 37235 Working Paper No. 05-W19,
Alam Saad (n.d), The Impact of Credits And Non-Credits Aspects on Self-Employment Profit: A
Comparison of Micro-credits Programs And Commercial Lenders In Rural Bangladesh,
Research Paper,University of St Thomas, USA,
Ahmed Salehuddin (2017), Microfinance institutions in Bangladesh: achievements and
challenges, Managerial Finance, Vol. 35 Issue: 12, pp.999-1010, Emerald
Ahmed Ferdoushi, Chamhuri Siwar, Idris Nor Aini Hj. and Begum Rawshan Ara (2011) Impact
of micro-credits on poverty alleviation among rural women: A case study of Panchagarh
District in Bangladesh, African Journal of Business Management Vol. 5(16), pp. 7111-
7119, 18 August, 2011
Afrin Sharmina et, Islam Nazrul& Ahmed Shahid Uddin (2008), A Multivariate Model of
Micro Credits and Rural Women Entrepreneurship Development in Bangladesh,
International Journal of Business and Management, Vol. 3, No.8, pp.169-185.
Alam M. Shahe, Quayum M.A. & Islam M. A. (2010), Crop Production in the Haor Areas of
Bangladesh: Insights from Farm Level Survey, The Agriculturists, A Scientific Journal of
Krishi Foundation, Vol,8, issue,2, pp.88-97,

119 | P a g e
ALAM, M. M., & HOSSAIN, M. K. (2018). Policy options on sustainable resource utilization
and food security in Haor areas of Bangladesh: A theoretical approach. International
Journal of Social, Political and Economic Research, 5(1), 11-28.
Alam, M. M., & Zakaria, A. F. M. (2021). A Probit Estimation of Urban Bases of Environmental
Awareness: Evidence from Sylhet City, Bangladesh. arXiv preprint arXiv:2107.08342.
Angelucci Manuela, Karlan Dean & Zinman Jonathan (2013), Win Some Lose Some? Evidence
from a Randomized Micro-credits Program Placement Experiment by Compartamos
Banco, IZA Discussion Paper No. 7439,
Manuela Angelucci, Dean Karlan, Jonathan Zinman (2015) Micro-credits Impacts: Evidence
from a Randomized Micro-credits Program Placement Experiment by Compartamos
Banco, Working Paper 19827. http://www.nber.org/papers/w19827.
Anthony Denise (2005), Cooperation in Micro Credits Borrowing Group: Identity Sanctions
and Reciprocity in the Production of Collective Goods, American Sociology Review,
Vol.70, PP-496-515.
Asgedom Yacob Ghebretinsaeand &Muturi Dr. Willy (2014), Socio-Economic Determinants of
Eritrea’s Savings and Micro Credits Program Loan Repayment Performance: A Case of
The Dekemhare Suz-Zone, International Journal of Development and Economic
Sustainability Vol.2, No.2, pp. 48-63,
Bangladesh Bureau of Statistics (2016), Household Income and Expenditure Survey -2000, 2005,
2010,2016,
Babajide Abiola (2012), “Effects of Microfinance on Micro and Small Enterprises (MSEs)
Growth in Nigeria” Asian Economic and Financial Review Vol.2, No. 3, pp. 463-477.
Bangladesh Bank (2015), Impact Assessment of Bangladesh Bank's Re-finance Scheme for
Financing Agricultural & Non-farm Rural Borrowers of Bangladesh Krishi Bank and
Rajshahi KrishiUnnayan Bank, Research Department Bangladesh Bank Head Office,
Dhaka.

120 | P a g e
Banerjee Abhijit, Karlan Dean, and Zinman Jonathan (2015), Six Randomized Evaluations of
Microcredits: Introduction and Further Steps, American Economic Journal: Applied
Economics, Vol. 7(1), pp.1–21
Banerjee Abhijit, Duflo Esther, Chattopadhyay Raghabendra and Shapiro Jeremy (2011),
Targeting the Hard-Core Poor: An Impact Assessment, Institute for Financial
Management and Research, Centre for Micro Finance, Working Paper
Barnaud Cécile, Bousquet Francois & Trebuil Guy (2011), Multi-Agent Simulations to Explore
Rules for Rural Credits in a Highland Farming Community of Northern Thailand,
Ecological Economics, Elsevier, 2008, 66, pp.615-627. <hal-00609663>
Bhattacharjee Priyanka (2016), Micro-credits among Slum Women in Sylhet: A Qualitative
Analysis, International Journal of Social Work and Human Services Practice Horizon
Research Publishing Vol.4. No.2 May, 2016, pp. 42-49
Boateng Agyenim& Abdulrahman Muhammad D. (2013), Micro Small-sized Enterprises and
Bank Credits Evidence from West Africa, Journal of Emerging Market Finance, Vol.12,
2, pp. 129–150
Barboza Gustavo A. & Barreto Humberto (2006), Learning by Association: Micro Credits in
Chiapas, Mexico, Contemporary Economic Policy (ISSN 1074-3529) Vol. 24, No. 2,
April 2006, 316-331.
BRAC (2015), Accountability Report-2015. BRAC, Dhaka.
CEGIS (Center for Environment and Geographic Information Services) (2012), Master Plan of
Haor Area, Volume,1, Summary Report, Government of the People’s Republic of
Bangladesh Ministry of Water Resources Bangladesh Haor and Wetland Development
Board. p.1
Bylander Maryann (2014) Borrowing Across Borders: Migration and Micro-credits in Rural
Cambodia, Development and Change 00(0): 1–24. DOI: 10.1111/dech.12080.
Chowdhury M. Jahangir Alam, Ghosh Dipak & Wrigh Robert E. (2002), The Impact of Micro-
credits on Poverty: Evidence from Bangladesh, Centre for Economic Policy Research
(CEPR) 90-98 Goswell Road London, England EC1V 7DB

121 | P a g e
Choudhury Haque Ariful, Das Atanu, Rahman Ashiqur(2017). The Effectiveness of Micro-
credits Programmes Focusing on Household Income, Expenditure and Savings: Evidence
from Bangladesh, Journal of Competitiveness, Vol. 9, Issue 2, pp. 34 - 44, June 2017
Churk Josephine Philip (2015), Contributions of Savings and Credits Cooperative Society on
Improving Rural Livelihood in Makungu ward Iringa, Tanzania, Journal of Emerging
Issues in Economics, Finance and Banking (JEIEFB), An Online International Research
Journal (ISSN: 2306-367X) 2015 Vol: 4 Issue: 2.
Cons Jason & Paprocki Kasia (2010), Contested Credits Landscapes: microcredits, self-help
and self-determination in rural Bangladesh, Third World Quarterly, Routledge, Tailor
Francis Group, Vol. 31, No. 4, 2010, pp 637–654
Diagne Aliou (1999), Determinants Of Household Access to and Participation In Formal And
Informal Credits Markets In Malawi, FCND Discussion Paper No. 67, Food
Consumption and Nutrition Division, International Food Policy Research Institute 2033
K Street, N.W.
Ernest Aryeetey (2011) Informal Finance for Private Sector Development Journal of
Microfinance, Volume 7, Number 1, pp-14-37
Fant Elijah Kombian(2010), Fighting Poverty with Micro-Credits: Experiences from Micro
Finance and Small-Loan Center (MASLOC) in Savelugu/Nanton District of Northern
Ghana, Department of International Environment and Development Studies (Noragric)
Norwegian University of Life Sciences (UMB)
Ferdousi Farhana (2015). Impact of microfinance on sustainable entrepreneurship development,
Development Studies Research, 2015 Vol. 2, No. 1, 51–63, http:// dx.doi.org/10. 1080/
21665095.2015 .1058718
Finance Division. "Climate Fiscal Framework." (2014).
Finance Division. (2014). Bangladesh Climate Fiscal Framework, Ministry of Finance, GPRB
Finance Division, Ministry of Finance, Government of the People’s Republic of
Bangladesh, Dhaka

122 | P a g e
García-Mina, A. & Carrasco Galán, M. J. (2004). Género y desigualdad La feminización de la
pobreza. Madrid: Universidad Pontificia de Comillas. Gehrig, R., Palacios, J., Blesa, B.,
Cobo de Guzman, F., García, M., Muñoz, P., y Rodes, J. (2014). Guía de criterios básicos
de calidad en la investigación cualitativa. Murcia: UCAM
Gomez, R. and Santor, E. (2001). Membership has its privileges: the effect of social capital and
neighbourhood characteristics on the earnings of microfinance borrowers. London: LSE
Research Articles Online.
Gine Xavier & Karlan, Dean S. (2007), Group versus Individual Liability: A Field Experiment
in the Philippines, Center Discussion Paper, No. 940, Yale University, Economic Growth
Center, New Haven, CT.
Gine Xavier & Karlan, Dean (2009), Group versus Individual Liability: Long Term Evidence
from Philippine Micro-credits Lending Groups, Center Discussion Paper, No. 970, Yale
University, Economic Growth Center, New Haven, CT.
Gichuki Jane Anne Wangui, Njeru Dr. Agnes, Tirimba Ondabu Ibrahim (2014), Challenges
Facing Micro and Small Enterprises in Accessing Credits Facilities in Kangemi
Harambee Market in Nairobi City County, Kenya, International Journal of Scientific and
Research Publications, Volume 4, Issue 12.
G. OkaforI., Chijindu Ezeaku Hillary and Sabastine Ugwuegbe (2016), Micro-credits and
Poverty Reduction: A Case of Nigeria, International Journal of Multidisciplinary
Research and information, Vol. 1(1),pp. 13-19
Elahi, Khandakar Q.& Danopoulos Constantine P.(2004) Micro-credits and the Third World:
Perspectives from moral and political philosophy, International Journal of Social
Economics, Vol. 31 Issue: 7, pp.643-654,
Fasoranti M. M. (2010), The influence of micro-credits on poverty alleviation among rural
dwellers: A case study of Akoko North West Local Government Area of Ondo State,
African Journal of Business Management Vol. 4(8), pp. 1438-1446.
Hossain, M. S., & Ahamed, F. (2015). Determinants of bank profitability: A study on the
banking sector of Bangladesh. Journal of Finance and Banking, 13(1), 43-57.

123 | P a g e
Habib and Jubb (2015), Poverty Alleviation with Microfinance: Bangladesh Evidence, Poverty
Reduction Policies and Practices in Developing Asia, Economic Studies in Inequality,
Social Exclusion and Well-Being, DOI 10.1007/978-981-287-420-7_2, Ch.2.
Hossain, M.Z. (2019) “Reducing the Errors in the Measurement of Food Security in Bangladesh
through Development and Implementation of an Innovative Method” An unpublished research
report, Department of Statistics, SUST
Hossain, M.Z. and Erik H.J. Keus, (2004), “Socio-economic Condition and Poverty Situation in Rural
Southern Part of Bangladesh: A Household Level Study”, Journal of Population and Social
Studies, Vol. 12, No. 2, pp. 135-163.
Hossain, M.Z. and Sarker B. (2019) “Application of Stochastic Frontier Model in Evaluating the
Efficiency of Allowance related Public Safety Nets Programmes in Bangladesh, SUST
Journal of Science & Technology, Vol. 29(1), 2019: 39-46.
Hulme David (2000), Impact Assessment Methodologies for Micro®nance: Theory, Experience
and Better Practice, World Development, Vol. 28, No. 1, pp. 79-98, Elsevier Science Ltd.
IFAD (International Fund for Agricultural Development) (2015), IFAD Strategic Framework
2016-2025 Enabling Inclusive and Sustainable Rural Transformation
Islam, M. R., Alam, M., & Afzal, M. N. İ. (2021). Nighttime Light Intensity and Child Health
Outcomes in Bangladesh. arXiv preprint arXiv:2108.00926.
Islam Asadul, Nguyen Chau and Smyth Russell (2014). Does microfinance change informal
lending in village economies? Evidence from Bangladesh, Journal of Banking and
Finance
Khondker Bazlul Haque & Mahzab Moogdho Mim (2015), Lagging Districts Development,
Background Study Paper for Preparation of the Seventh Five-Year Plan, Bangaldesh
Institute of Development Studies, Dhaka.
Karlan Dean S. & Valdivia Martin (2006), Teaching Entrepreneurship: Impact of Business
Training on Microfinance Clients and Institutions, Center Discussion Paper, No.941,
Yale University, Economic Growth Center, New Haven, CT.
Karlan Dean & Zinman Jonathan (2005), Elasticities of Demand for Consumer Credits, Center
Discussion Paper, No.926, Economic Growth CenterYale University.

124 | P a g e
Dean S. Karlan, & Jonathan Zinman (2009), Expanding Microenterprise Credits Access: Using
Randomized Supply Decisions to Estimate the Impacts in Manila, Center Discussion
Paper, No.976, Economic Growth Center Yale University
Dean Karlan & Jonathan Zinman (2011), Micro-credits in Theory and Practice: Using
Randomized Credits Scoring for Impact Evaluation, Science, 332(6035): 1278-1285,
DOI: 10.1126/science.1200138.
Kazal Mohammad Mizanul Haque, Villinueva Charles C., Hossain Md. Zakir & Das Tulsi
Kumer (2010), Food Security Strategies of The People Living in Haor Areas: Status and
Prospects, National Food Policy Capacity Strengthening Programme, Government of
Bangladesh.
Khanom Nilufa A. (2014), Rural Micro Credits (RMC) and Poverty Alleviation: The Case of the
PKSF in Bangladesh, International Review of Business Research Papers Vol. 10. No. 2.
September 2014 Issue. Pp. 115 – 136
Khanam Dilruba , Mohiuddin Muhammad, Hoque Asadul and Weber Olaf (2018).Financing
micro-entrepreneurs for poverty alleviation: a performance analysis of microfinance
services offered by BRAC, ASA, and Proshika from Bangladesh, Journal of Global
Entrepreneurship Research (2018) 8:27 https://doi.org/10.1186/s40497-018-0114-6
Khandker (1998) ‘Fighting Poverty with Microcredits’ Oxford University Press
Khandker Shahidur R et al. (2014), Are Micro-credits Borrowers in Bangladesh Over-indebted?
Institute of Microfinance, Working Paper No. 26.
Khandker Shahidur R. (2003), Micro-Finance and Poverty: Evidence Using Panel Data from
Bangladesh, Policy Research Working Paper #2945, World Bank.
Khandker Shahidur R. (2005), Microfinance and Poverty: Evidence Using Panel Data from
Bangladesh, The World Bank Economic Review, Vol. 19, No. 2, pp.263-286
Khondker Bazlul Haque and Mahzab Moogdho Mim(2012), Lagging Districts Development,
Background Study Paper for Preparation of the Seventh Five-Year Plan.

125 | P a g e
Khan Mohammad Mohaiminuzzaman (2013), An Assessment of the Green Micro-credits
Projects in Bangladesh: Livelihood and Environmental Sustainability, Unpublished
Master thesis, Faculty of Graduate Studies of The University of Manitoba
Kessy S.& Temu S.S.(2010), The Impact of Training on Performance of Micro and Small
Enterprises Served by Microfinance Institutions in Tanzania, Research Journal of
Business Management, Vol.4(2),pp.103-111
Khandakar Shahidur R. (1998), Fighting Poverty with Micro credits –Experience in Bangladesh,
Published for the World Bank,Oxford University Press.
Khalily M. A. Baqui (2004), Quantitative approach to impact analysis of microfinance programs
in Bangladesh-what have we learned? Journal of International Development, vol. 16,
issue 3, pp.331-353
Peter Karubi Nwanesi (2006), Development, Micro-credits and Women’s Empowerment: A
Case Study of Market and Rural Women in Southern Nigeria, PhD Thesis, University of
Canterbury.
Lawrence Peter (2004) Household Credits and Saving: Does Policy Matter? Keele Economics
Research Papers, Department of Economics Keele University,Keele, Staffordshire, UK.
Islam Khan Jahirul (2014), Does Micro-credits Reduce Household Vulnerability to Poverty?
Empirical Evidence from Bangladesh, Journal of Economics and Development Studies,
June 2014, Vol. 2, No. 2, pp. 311-326
Mamun Chowdhury Abdullah Al, Hasan Md. Nazmul & Rana Arif (2013), Micro-credits and
poverty alleviation: The Case of Bangladesh, World Journal of Social Sciences Vol. 3.
No. 1. January 2013 Issue. Pp. 102 – 108
Mamun Md. Al, Sohog Kazi, Akhter Ayesha (2013), A Dynamic Panel Analysis of The
Financial Determinants of Csr In Bangladeshi Banking Industry, Asian Economic and
Financial Review, Vol. 3(5), pp.560-578
Minar, S. J. (2021). Refugees and Host State Security: An Empirical Investigation of Rohingya
Refuge in Bangladesh. arXiv preprint arXiv:2108.11344.

126 | P a g e
Mohamed Fauzia Mtei (2008), Money matters? Micro-credits and poverty reduction among poor
women in Tanzania, PhD Thesis, The London School of Economics and Political Science
Matsuyama Kiminori(2006), Credits Traps and Credits Cycles, Seminar paper, Midwest
Macroeconomic Meeting held at Washington University in St. Louis.
Mazumder Mohummed Shofi Ullah and Wencong Lu (2013), Micro-Credits And Poverty
Reduction: A Case of Bangladesh, Prague Economic Pa,ers, 3, Prague.
Mersland Roy (2011), The governance of non-profit micro finance institutions: lessons from
history, J Manag Gov. Springer, 15:327–348 DOI 10.1007/s10997-009-9116-7
Morduchl Jonathan (1999), The Microfinance Promise, Journal Of Economic Literature
Vol.XXXVII, pp. 1569-1 614
Mwangi Isaac Wachira and Sichei Moses Muse (n.d) Determinants of Access to Credits by
Individuals in Kenya: A Comparative Analysis of the Kenya National Fin Access
Surveys of 2006 and 2009, European Journal of Business and Management, ISSN 2222-
1905 (Paper) ISSN 2222-2839 (Online) Vol. 3, No.3, pp.206-226
MidgleyJames (n.d.) Microenterprise, global poverty and social development, International
Social Work, Sage Publications: Los Angeles, London, New Delhi and Singapore DOI:
10.1177/0020872808090240, Vol. 51(4), pp.467–479
Mwongera Rose K. (2014), Factors Influencing Access to Microfinance Credits by Young
Women Entrepreneurs’ Projects in Athi-River, Machakos County, Kenya, Master Thesis,
University of Nairobi.
Mustafa S, I Ara, D Banu, A Kabir, M Mohsin, A Yusuf and S Jahan (1996) ‘Beacon of Hope:
An Impact Assessment Study of BRAC’s RDP’ Research and Evaluation Division,
BRAC, Dhaka
Manly B.F.J. (2005), “Multivariate Statistical Methods: A Primer”, Third Edition, Chapman &
Hall CRC
Nissanke Machiko (2002), Donors’ Support for Micro-credits as Social Enterprise- A Critical
Reappraisal, WIDER Discussion Paper, No. 2002/127, The United Nations University
World Institute for Development Economics Research (UNUWIDER), Helsinki.

127 | P a g e
Noreen Sara (2011), Role of Microfinance in Empowerment of Female Population of
Bahawalpur District, International Conference on Economics and Finance Research,
vol.4 IACSIT Press, Singapore.
Phan Dinh Khoi (2012), An Empirical Analysis of Accessibility and Impact of Microcredits: the
Rural Credits Market in the Mekong River Delta, Vietnam, PhD Thesis, Lincoln
University New Zealand
Planning Commission (2016), Workshop Outcome Document on Environment and Climate
Change Policy Gap Analysis in Haor Areas, General Economics Division (GED)
Planning Commission, Ministry of Planning, Bangladesh.
Pitt Mark M & Khandker Shahidur R (1996), Household and Intra household Impact of the
Grameen Bank and Similar Targeted Credits Programs in Bangladesh, World Bank
Discussion Papers,320.
Pitt Mark M. and Khandker Shahidur R. (1998), The Impact of Group-Based Credits Programs
on Poor Households in Bangladesh: Does the Gender of Participants Matter? The Journal
of Political Economy, JSTOR, Vol. 106, No. 5. (Oct., 1998), pp. 958-996
CGAP (Consultative Group to Assist the Poor)) (2010), Does Micro-credits Really Help Poor
People? Focus Note, www.cgap.org, Washington
Rabby Talukder Golam (2012), Poverty and Sustainable Livelihoods in The Seasonally
Submerged Haor Area Of Netrokona District, Bangladesh, Unpublished PhD Thesis,
Universitof Malaya, Kualalumpur.
Rankin Katharine N. (2002), Social Capital, Microfinance, And the Politics of Development,
Feminist Economics 8(1), 1–24.
Katharine N. Rankin (2001), Governing Development: Neoliberalism, Microcredits, and
Rational Economic Woman, Economy and Society, Taylor & Francis Ltd ISSN 0308-
5147 print/1469-5766.
Rika Terano, Zainalabidin Mohamed & Jarir Hakimi H. Jusr (2015). Effectiveness of micro-
credits program and determinants of income among small business entrepreneurs in
Malaysia, Journal of Global Entrepreneurship Research (2015) 5:22.

128 | P a g e
Ogaboh1Agba, A. M., Ocheni Stephen& Nkpoyen Festus (2014), Microfinance Credits Scheme
and Poverty Reduction among Low-Income Workers in Nigeria, Journal of Good
Governance and Sustainable Development in Africa, Vol. 2, No 1.
Onyina Paul and Turnell Sean (n.d.), The Impacts of Microfinance Lending on Clients: Evidence
from Ghana, Economics Department, Macquarie University, Sydney Australia.
Omorodion, Francisca Isi (2007), Rural Women’s Experiences of Micro-Credits Schemes in
Nigeria Case Study of Esan Women, Journal of Asian and African Studies, SAGE
Publications, Vol. 42(6) PP. 479–494
Osmani S. R. & Mahmud Wahiduddin (2015), How Does Micro-credits Work? A Review of the
Theories of Microcredits, Institute of Microfinance (InM), Working Paper No. 35.
Rahman Sayma (2007), The Impact of Micro-credits on Poverty and Women’s Empowerment:
A case Study of Bangladesh, Unpublished PhD Thesis, School of Economics and
Finance,College of Law and Business ,University of Western Sydney , Australia.
Rahman Aminur (1998), Rhetoric and Realties of Micro-Credits for Women In Rural
Bangladesh: A Village Study of Grameen Bank Lending, PhD thesis, Winnipeg,
Manitoba, Canada.
Rana Muhammad Sohail Jafar, Safdar Hussain Wasim Ahmed, Sana Ullah Waqas Umar Latif
Peifen Zhuang (2016), Micro-Finance and Its Impacts on People and Societies, Journal of
Poverty, Investment and Development www.iiste.org ISSN 2422-846X. Vol.27, 2016
Rencher A.C. (2002) ‘Methods of Multivariate Analysis’, Second Edition, Wiley-Interscience
Rogaly Ben (1996), Micro-finance evangelism, 'destitute women', and the hard selling of a new
anti-poverty formula, Micro-finance evangelism, Taylor & Francis, Ltd. on behalf of
Oxfam GB
Shahnaz Farhana Rahman Golam Samin and Sadaf Bushra Humaira Sadaf (2018) . Impact of
Microfinance on Informal Employment: The Case of Bangladesh, Journal of Accounting,
Finance and Economics Vol. 8. No,3. September 2018 Issue, pp.88-95
Selinger Evan (2008), Does Micro-credits ‘‘Empower’’? Reflections on the Grameen Bank
Debate, Research Paper Hum Stud 31:27–41 DOI 10.1007/s10746-007-9076-3

129 | P a g e
Schreiner Mark (2001), A Cost-Effectiveness Analysis of the Grameen Bank of Bangladesh,
Microfinance Risk Management, Center for Social Development, Washington University
in St. Louis, USA.
S. Dean Karlan and Zinman Jonathan (2008), Credits Elasticities in Less-Developed Economies:
Implications for Microfinance, American Economic Review, Vol. 98:3, pp.1040–1068
Shoji Masahiro (2008) Does Contingent Repayment in Microfinance Help the Poor during
Natural Disasters? Graduate School of Economics, University of Tokyo.
Simojoki Hanna-Kaisa (2003), Empowering Credits – More Than Just Money; The Socio-
Economic Impact of Micro-Finance on Women in Nairobi, Kenya. Research paper,
University of Jyväskylä, Department of Social Sciences and Philosophy 114 pages, 2
appendices.
Simiyu Robert Silikhe (2004), A Survey of Techniques of Credits Risk Management in Micro-
Finance Institutions in Kenya, Thesis Master of Business Administration, University of
Nairobi.
Turner, AG, RJ Magnani and M, Shuaib, (1996), “A Not Quite as Quick but Much Cleaner
Alternative to the Expanded program on Immunization (EPI) Cluster Survey Design”,
International Journal of Epidemiology, Vol. 25, p. 198.
Uddin Mohammed Salim (2011), Role of Micro-credits and Community Based Organizations in
a Wetland Area in Bangladesh, Unpublished Master thesis, Faculty of Graduate Studies
of The University of Manitoba.
Waliaula Rael Nasimiyu (2013), Relationship Between Micro-credits And The Growth of Small
And Medium Enterprises In Kenya,Master Thesis, University of Nairobi
Zama Hassan (2001), Assessing the Poverty and Vulnerability Impact of Micro-Credits in
Bangladesh: A case study of BRAC, Office of the Chief Economist and Senior Vice-
President (DECVP) The World Bank.
Zaman Hasan (1998). ‘Who benefits and to what extent? An evaluation of BRAC’s micro-credits
program’ University of Sussex, D.Phil thesis, Sussex

130 | P a g e
Annex-1: Survey Questionnaire
Vicious Cycle of Poverty in Haor Region of Bangladesh: Impact of Formal
and Informal Credits
HOUSEHOLD INTERVIEW SCHEDULE
District
Upazila
Union
Mouza/Village
PSU number
Household number
Name of household head
Name of the Father/husband/wife of household head
Mobile number
Status of NGO membership (Yes = 1, No = 2)
Religion [Muslim-1, Hindu-2, Buddhist-3, Christian-4]
Type of Micro-credits:
Government (Banks/ co-operatives) =1,
Nongovernment (MFI/NGO/Insurance) =2,
Local Money Lender (Mohajan/Private Samittee =3,
Non-interest Loan (Relatives/friends/ neighbors/ Land Owner) =4;
More than one sources=5
Household type [Borrower = 1, Non-borrower = 2]
Respondent name
Relation with household head (if the respond is not head)
Interviewer name
Date of interview
Name of data entry operator (DEO)
Household Type (Put√) Borrower Old Beneficiary HH
ID

131 | P a g e
Section-1: Profile of Household Members of the Respondent (for all)
Sl.
No.
1 2 3 4 5 6 7 8 9
Name of household
members
(Write head’s name
first)
Relationship
with HH
(code)2
Age
(in full
years)
sex
(Male = 1,
Female =2)
Main
Occupation
Age>=16)
(Code)5
Education
(Age>7)
code6
Marital
Status
(age≥15)
(Code)7
Borrower
status
(Code)8
Work
Condition
(Age>=16)
(Code)9
01
02
03
04
05
06
07
08
09
10
2. Relationship code: Household head = 1, Husband/Wife = 2, Son/Daughter = 3, Brother/Sister = 4, Father/Mother = 5,
Father-in-law/Mother-in-law = 6, Son-in-law/Daughter-in-law = 7, Grandson/daughter = 8,
Relative = 9, Non-relative = 10, Servant = 11, Other (Specify) ……........
5. Occupation code: Farming (own land or leased land) = 1, Agri-labour = 3, Non-agri-labour (Driver/Rickshaw
/Van puller/boatman)=4,Service/Self Employed/Entrepreneur/Business/Tuition=5,Student=6,
Unable to work (Old person, Disabled)=7, House-wife=8, Unemployed=9, Other(Specify)=10
6. Education Status: Years of schooling (i.e., if class 5 = 5, if class six = 6)
7. Marital status code: Married = 1, Unmarried = 2, Widow = 3, Separated/Divorced = 4.
8. Borrower’s Status: 1 year but less than 2 years=1; 2 years but less than 3 years=2; 3 year but less than 4 year =3;
4 years but less than 5 years = 4; 5 year and above = 5
9. Income Earning Condition: Full time work = 1, Part time work = 2, No Work = 3, Otherwise = 4.
Section-2: Basic Household Information (for all)
2.1. Do you live in your own house? (Yes=1, No= 2)
2.2. How many rooms in your house?
2.3. Does kitchen room is separated from bed room in your own house? (Yes=1, No= 2)
2.4. Do you have regular source of income? (Yes=1, No= 2)
2.5. Housing Information:
1 Type of main house [Straw roof and bamboo wall = 1; Straw roof and muddy wall = 2; Tin shed roof
and muddy wall = 3; Tin shed roof and wall and muddy floor = 4;
Tin shed building =5; Pucca building = 6; Slum =7; Others = 8]
2 Source of cooking fuel of your households [Wood = 1; Gas = 2; Kerosene = 3; Straw/Leaf/Husk = 4;
Electricity =5; Cow dung = 6; Jute stick =7; others = 5]
3 Main source of drinking water of your household [Supply water = 1; Tube-well = 2; Pond = 3;
Well = 3; Rain water = 5; River/Canal = 6]
4 Electricity coverage in the area: (Yes=1 No= 2)
5 Electricity coverage in the household: (Yes=1 No= 2)
6 Ownership of Toilet: (Yes=1 No= 2)
7 Type of Toilet used by HH members: [Pucca toilet (water resistant) = 1; Pucca toilet (not water
resistant) = 2; Katcha toilet = 3; Open field/Others = 4]

132 | P a g e
Section-3: Possessions of Assets (for all)
Sl.
No.
Items Quantity Sl. No. Items Quantity
1 Radio 11 Furniture of drawing room
2 Television 12 Bicycle
3 Mobile Phone 13 Boat
4 Electric Fan 14 Tube-well
5 Almirah 15 Deep tube-well
6 Cookeries 16 Clock
7 Cutleries 17 Shelf
8 Table chair 18 Alna
9 Bed, Cushion 19 Motor cycle
10 Choki (cot) 20 Others (specify)
Section-4. Household Productive Assets (for all)
Sl. No. Productive Assets Yes=1 No=2
1 Cultivable land 1 2 Amount in.............................decimals
2 Cultivable land: leased or cropped share
or in)
1 2 Amount in.............................decimals
3 Homestead land 1 2 Amount in.............................decimals
4 cultivation Instruments 1 2 Amount in.............................decimals
5 Livestock 1 2 Amount in.............................Number
6 Rickshaw/Van 1 2 Amount in.............................Number
7 Auto Rickshaw 1 2 Amount in.............................Number
8 Sprayer 1 2 Amount in.............................Number
9 Fishing Net 1 2 Amount in …........................Number
10 Bee Box 1 2 Amount in.............................Number
11 Sewing Machine 1 2 Amount in …........................Number
12 Motor (Engine) 1 2 Amount in …........................Number
13 Family Business 1 2 Amount in …........................Number
14 Others 1 2 Amount in …........................Number
Others (if any)
16
17

133 | P a g e
Section 5: Knowledge of household about Micro-credits Information (for all)
Question Response
501. Do you or any member of your HHs have/has Knowledge about Micro-credits benefit?
(Yes=1, No= 2)
502. Do you or any member of your HHs have/has try to get micro-credits benefit? (Yes=1, No= 2)
503.For which type of credits do you take first attempt for getting Micro-credits benefit
(use code given below)
Codes of Micro credits Programs:
Government (Banks/ co-operatives) =1,
Nongovernment (MFI/NGO/Insurance) =2,
Local Money Lender (Mohajan/Private Samittee =3,
Non-interest Loan (Relatives/friends/ neighbors/ Land Owner) =4;
More than one sources=5
504. Please specify the level of response on the causes of not including into micro-credits program
(for non-borrowers only)
a. Bureaucratic complexity (Strongly disagree=1; Disagree=2; no comment=3; Neutral =4; Strongly Agree=5.)
b. Limitation of budget (according to selector): (Strongly disagree=1; Disagree=2; no comment=3; Neutral =4;
Strongly Agree=5.)
c. Couldn’t provide bribe or entry fee: (Strongly disagree=1; Disagree=2; no comment=3; Neutral =4;
Strongly Agree=5.)
d. No political exposure: (Strongly disagree=1; Disagree=2; no comment=3; Neutral =4; Strongly Agree=5.)
e. Didn’t have any idea about such program: (Strongly disagree=1; Disagree=2; no comment=3; Neutral =4;
Strongly Agree=5.)
f. Nepotism: (Strongly disagree=1; Disagree=2; no comment=3; Neutral =4; Strongly Agree=5.)
g. Non-cooperation from public delegate of Micro-credits institution: (Strongly disagree=1; Disagree=2; no
comment=3; Neutral =4; Strongly Agree=5.)
h. Non-cooperation from local lenders: (Strongly disagree=1; Disagree=2; no comment=3; Neutral =4;
Strongly Agree=5.)
i. Non-availability of NID: (Strongly disagree=1; Disagree=2; no comment=3; Neutral =4; Strongly Agree=5.)
j. Lack of networking or lobbying: (Strongly disagree=1; Disagree=2; no comment=3; Neutral =4; Strongly
Agree=5.)
k. Distance from Micro-credits from the village: (Strongly disagree=1; Disagree=2; no comment=3; Neutral
=4; Strongly Agree=5.)
l. No Micro-credits in the area: (Strongly disagree=1; Disagree=2; no comment=3; Neutral =4; Strongly
Agree=5.)
m. Non availability of collateral: (Strongly disagree=1; Disagree=2; no comment=3; Neutral =4; Strongly
Agree=5.)
n. Misappropriation of credits: (Strongly disagree=1; Disagree=2; no comment=3; Neutral =4; Strongly
Agree=5.)
o. Biasness: (Strongly disagree=1; Disagree=2; no comment=3; Neutral =4; Strongly Agree=5.)
p. Others: (specify)……………
505. Ask for help to get Micro-credits benefit: (UP Chairman=1; UP Member=2; UP Office=3; NGO=4; Bank officer-5; Relatives/Neighbors/Friends/ others=6)
506. Do you ask for money for giving Micro-credits benefit? (Yes=1, No= 2)
507. Does micro-credits help to remove poverty? (Yes=1, No= 2)

134 | P a g e
Section-6: Profile of micro-credits received (Borrowers only)
1 2 3 4 5 6 7 8
Sl.
No
So
urc
es c
od
e2
Date of
loan A
mo
un
t o
f lo
an
(in
Tak
a)
Ty
pe
of
loan
cod
e5 Terms of loan Payment of loan Unpaid
loan
Yea
r
Mo
nth
Inte
rest
Rat
e
(%)
Inst
allm
ent
typ
e co
de6
To
tal
inst
allm
ents
Du
rati
on
(in
mon
th)
coll
ater
al
cod
e6a
Pri
nci
pal
Inte
rest
tota
l
Pri
nci
pal
Inte
rest
2.Sources of credits: Government (Banks/ co-operatives) =1,
Nongovernment (MFI/NGO/Insurance) =2,
Local Money Lender (Mohajan /Private Samittee =3.
Non-interest Loan (Relatives/friends/ neighbors/ Land Owner) =4
More than one sources =5
5.Type of loan: Cash=1; food items =2; Both cash and food items=3; others=4
6. Installment type: Weekly=1; Biweekly=2; Monthly =3; Quarterly =4; Annually=5
6a. Collateral: If not collateral =0; If collateral =1
609: Expenditure and Investment Pattern of Micro-credits
SL# Expenditure Heads Amount % SL# Expenditure Heads Amount %
1. Consumption on food 13. Boat for rent
2. Clothing and others essentials 14. Payment of loan
3. Purchasing agricultural inputs 15. Family enterprises
4. Purchasing durable goods 16. Health care
5. Housing improvements 17. Human capital (Education, training)
6. Purchasing land/Lease 18. Savings (Bank, MIF, NGO)
7. Purchasing animals 19. Sending son to abroad
8. Natural calamities 20. Release mortgaged land
9. Fishing net 21. Mortgage land
10. Bee box 22. Daughter’s/Son’s marriage
11. Sewing machine 23. Fisheries pond lease
12. Motor (engine) Others:

135 | P a g e
Section- 7: Impact of Micro-credits on the households for both borrower and non-borrower
Indicators
Status
Survey Point
Before loan
or 3 years back
7.1 Food expenditure (annual)
7.2 Non-food consumption expenditure (annual)
7.3 Consumption Expenditure (Annual) (7.1 + 7.2)
7.4 Education (annual)
7.5 Medical (annual)
7.6 Training (annual)
7.7 Agriculture (annual)
7.8 Purchasing productive equipment (annual)
7.9 Purchasing durable assets (annual)
7.10 House repair/development (annual)
7.11 Land purchase (annual)
7.12 Family enterprise (annual)
7.13 Livestock and Poultry rearing (annual)
7.14 Other investment
7.15 Total Investment Expenditure (Annual) (Total of 7.4 to 7.14)
7.16 Savings (annual) (in banks, MFI, etc.)
7.17 Total Expenditure and Savings (Annual) (7.3 + 7.15 + 7.16)
7.18 On-farm (Agricultural) income (annual)
7.19 Off-farm (Non-agricultural) income(annual)
7.20 Labor sale income (annual)
7.21 Business (annual)
7.22 Donation/Begging (annual)
7.23 Debt (annual)
7.24 Total Income and Debt (Total of 7.18 to 7.23)
7.25 Food security status (Some periods of hunger during the year (Normal Food
Insecurity) =1, Two meals a day throughout year (Moderate food insecurity) =2,
Three meals a day throughout year (No Food Insecurity=3))
7.26 Socio-economic status
(Very poor=1, Moderately poor=2, Poor=3, Middle class=4, Rich=5)
7.27 Total Land (Homestead, Cultivable, Pond) in Decimals
7.28
Type of House [Straw roof and bamboo wall = 1; Straw roof and muddy
wall = 2; Tin shed roof and muddy wall = 3; Tin shed roof and wall and
muddy floor = 4; Tin shed building =5; Pucca building = 6; Slum =7;
Others = 8]
7.29 Status of Electricity Connection (Yes=1, No=2)
7.30 Types of Latrines [Pucca toilet (water resistant) = 1; Pucca toilet (not
water resistant) = 2; Katcha toilet = 3; Open field/Others = 4]
7.31 Ownership of Television (Yes=1, No=0)
7.32 Number of Fan
7.33 Number of Mobile Phone
7.34 Status of Education Expenditure (Increased=1, Decreased=2, No Change=0)
7.35 Status of Health Expenditure (Increased=1, Decreased=2, No Change=0)

136 | P a g e
Section -8. Purpose of Loan: Please put tick () mark(s) for which you have taken loan (Borrower only)
SL# Purpose Code SL# Purpose code
a. Purchasing food items 1 k. Purchasing of livelihood equipment 12
b. Crop production 2 l. payment of loan 13
c. Rearing cattle/poultry 3 m. Repairing cost of houses 14
d. Sending family member to abroad 4 n. Health care expenditure 15
e. Trade/Business/Industry 6 o. Education 16
f. Fish farming/ Fishing 7 p. Others: 17
g. Daughter/son’s marriage 8
h. Constructing housing 9
i. Tackling shocks of natural calamities 10
j. Tackling shocks of sudden death of HH head 11
Section -9: Causes of nonpayment of loan timely
SL# Causes of nonpayment of loan timely Strongly
agree=5
Agree
=4
Neutral
=3
Disagree
=2
Strongly
disagree=1
1. Acute food problem
2. Medical treatment/medicine
3. Investment loss
4. Natural calamities
5. Insufficient of loan for investment
6. Duration of loan is short for return from investment
7. Installment period is very short
8. Rate of interest is very high
9. Renewal of loan is unavailable
10. Misappropriation of loan
11. Crop’s failure
12. Expenditure for marriage of son/daughter etc.
13. Family legal problems and expenditure
14. Unexpected accident

137 | P a g e
Section -10. Attitude of Borrowers’ on Micro Credits (Borrower Only)
Sl No. Question Statement Strongly
agree=5
Agree
=4
Neutral
=3
Disagree
=2
Strongly
disagree=1
1 The rate of interest of micro credits is reasonable
2 Amount of credits is sufficient
3 Duration of credits is sufficient
4 Terms and conditions are not rigid
5 By microfinance your food security has increased
6 By microfinance your income has increased
7 By microfinance your savings has increased
8 Microfinance is helping you in better access to education
9 Microfinance is helping you in better access to healthcare
10 Microfinance is helping you in better financial situation of your family
11 Operational assistance received from MFIs was helpful to run the business
12 Due to microfinance, employment opportunities have been increased
13 Local loans are easier to get than MFIs
14 Local lenders are friendly than MFIs
15 Cost of Local loans is lower than MFIs
16 Terms and conditions local loans are easier than MFIs
Section -11. Causes of not over-coming from vicious cycle of poverty (for all)
SL# Causes Strongly
agree=5
Agree
=4
Neutral
=3
Disagree
=2
Strongly
disagree=1
1. Insufficient loan
2. Duration of loan is insufficient
3. High Interest
4. Renewal of loan not get
5. Diversion of loan
6. Loss of investment
7. Natural calamity
8. Not getting loan in time
9. Pressure of loan payment
10. Number of dependent members is high
11. Income earning member is absent
12. No. of income earning member is low in terms of dependent person
13. I have not taken loan
Study Conducting by:
Professor Dr. Md. Nazrul Islam Department of Business Administration
and Member, SUST Research Centre
Shahjalal University of Science & Technology (SUST)
Contact# 01712817424
E-mail: [email protected]

138 | P a g e
Appendices
Table 3.1 Profile of respondent by micro-credits receiving status in the Haor regions
Characteristics Borrower
(N = 1607)
Non-borrower
(N = 733) Z-statistic P-value
Both
(N = 2340)
Relation with household head
Head 73.8 98.1 -14.015 <0.001 81.4
Husband/wife 23.7 1.8 13.130 <0.001 16.8
Son/daughter 1.0 0.0 2.717 0.010 0.7
Father/mother 1.2 0.1 2.680 0.011 0.9
Others 0.3 0.0 1.484 0.133 0.1
Sex of respondent
Male 70.6 90.3 -10.467 <0.001 76.8
Female 29.4 9.7 10.467 <0.001 23.2
Age of respondent
16-30 17.9 14.6 1.977 0.056 16.8
31-50 61.9 62.5 -0.277 0.384 62.1
51-60 13.9 14.7 -0.515 0.349 14.2
Above 60 6.3 8.2 -1.682 0.097 6.9
Mean ± SD (in years) 42.47 ± 11.38 43.57 ± 11.60 -2.140 0.040 42.81 ± 11.46
Marital status
Married 92.7 91.1 1.339 0.163 92.2
Unmarried 2.4 2.9 -0.711 0.310 2.6
Widow 4.7 5.7 -1.028 0.235 5.0
Separated/Divorced 0.1 0.3 -1.114 0.215 0.2
Educational status
No education 27.7 24.3 1.726 0.090 26.6
1-5 years of schooling 53.9 52.3 0.720 0.308 53.4
6-9 years of schooling 12.4 13.6 -0.807 0.288 12.8
SSC / HSC 5.6 8.7 -2.807 0.008 6.6
Graduate and above 0.4 1.1 -2.002 0.054 0.6
Mean ± SD (in years) 3.76 ± 3.13 4.19 ± 3.42 -2.896 0.006 3.89 ± 3.23
Occupation
Farming 19.7 19.8 -0.056 0.398 19.7
Day laborer 22.5 23.3 -0.428 0.364 22.7
Off-farm activities 11.1 17.7 -4.379 <0.001 13.2
Service/business 16.2 24.6 -4.821 <0.001 18.8
Student 0.2 0.0 1.212 0.191 0.2
Household work 24.9 5.7 11.006 <0.001 18.9
Others 5.4 8.9 -3.186 0.002 6.5
Income earner
Full time 47.6 54.7 -3.186 0.002 49.8
Part time 27.9 32.7 -2.364 0.024 29.4
No work 24.5 12.6 6.581 <0.001 20.7
Disability status
Yes 2.9 4.4 -1.865 0.070 3.3
No 97.1 95.6 1.865 0.070 96.7
Note: SSC = Secondary School Certificate; HSC = Higher Secondary Certificate; SD = Standard Deviation

139 | P a g e
Table 3.2 Distribution of household population by gender in the Haor regions of Bangladesh
Characteristics Male (%)
(N = 5950)
Female (%)
(N = 5678) Z-statistic P-value
Both (%)
(N = 11628)
Age group
0-15 35.2 37.9 -3.023 0.004 36.5
16-30 26.7 28.3 -1.932 0.062 27.5
31-50 25.5 25.3 0.248 0.387 25.4
51-60 6.8 4.9 4.356 <0.001 5.9
Above 60 5.7 3.7 5.082 <0.001 4.7
Mean ± SD 27.52 ± 18.92 25.38 ± 17.50 6.335 <0.001 26.47 ± 18.27
Marital status (Age above 15 years)
Married 66.4 73.0 -6.156 <0.001 69.5
Unmarried 31.7 18.4 13.124 <0.001 25.4
Widow 1.8 8.1 -12.637 <0.001 4.8
Separated/divorced 0.1 0.5 -3.187 0.002 0.3
Total (n) 3856 3528 7384
Educational status (Age above 6 years)
No education 17.3 21.1 -4.904 <0.001 19.1
1-5 years schooling 49.8 48.8 1.015 0.238 49.3
6-9 years schooling 19.2 18.5 0.908 0.264 18.9
SSC / HSC 11.4 10.1 2.129 0.041 10.8
Above HSC 2.3 1.5 2.965 0.005 1.9
Mean ± SD 4.91 ± 3.67 4.50 ± 3.56 5.760 <0.001 4.71 ± 3.62
Total (n) 5328 4992 10320
Occupation (Age 16-60 years)
Farming 17.0 0.3 24.245 <0.001 8.9
Day laborer 24.7 1.7 27.783 <0.001 13.6
Off-farm activities 15.8 0.6 22.618 <0.001 8.4
Service/business 23.0 3.8 23.088 <0.001 13.7
Student 10.9 11.2 -0.395 0.369 11.0
Household work 0.5 70.7 -60.976 <0.001 34.6
Others 8.3 11.6 -4.565 <0.001 9.9
Total (n) 3515 3319 6834
Income earner (Age above 15 years)
Full time 45.6 8.6 35.401 <0.001 27.9
Part time 28.7 14.3 14.965 <0.001 21.8
No work 25.4 76.5 -43.867 <0.001 49.8
Otherwise 0.4 0.6 -1.222 0.189 0.5
Total (n) 3856 3528 7384
Disability status
Yes 4.0 4.7 -1.851 0.072 4.4
No 96.0 95.3 95.6
Note: SD=Standard Deviation; SSC=Secondary School Certificate; HSC=Higher Secondary School Certificate

140 | P a g e
Table 3.3 Housing condition and sanitation facilities in the Haor regions of Bangladesh
Household
characteristics
Targeted
variables
Borrowing status (%)
P-value
Household type
by loan (%)
P-value
Non-
borrower
(733)
Borrower
(1607)
Formal
(1158)
Informal
(449)
Overall
(2340)
House
ownership
Yes 94.1 94.8 0.314 94.5 95.5 0.288 94.6
No 5.9 5.2 0.314 5.5 4.5 0.288 5.4
Number of
Rooms
One rooms 22.6 18.2 0.018 17.0 21.4 0.049 19.6
Two rooms 40.5 43.1 0.199 44.0 41.0 0.220 42.3
Three rooms 27.3 28.3 0.352 28.5 27.6 0.374 27.9
Four or more rooms 9.5 10.4 0.319 10.5 10.0 0.382 10.1
Mean person per room 2.38 2.52 0.011 2.48 2.63 0.057 2.48
Separate
Kitchen
Yes 59.5 62.4 0.163 56.7 76.8 <0.001 61.5
No 40.5 37.6 0.163 43.3 23.2 <0.001 38.5
Type of main
house
Straw roof &
Bamboo/muddy
wall
3.8 4.5 0.295 5.8 1.1 <0.001 4.3
Tin shed roof &
Tin/ muddy wall
84.3 87.1 0.076 86.3 89.1 0.129 86.2
Tin shed building 7.1 7.0 0.397 7.3 6.2 0.295 7.1
Pucca building 4.5 1.4 <0.001 0.5 3.6 <0.001 2.4
Others 0.3 0.1 0.215 0.1 0.0 0.319 0.1
Source of
cooking fuel
Wood/kerosene 30.3 30.1 0.397 36.0 14.7 <0.001 30.1
Gas 7.8 3.8 <0.001 3.5 4.5 0.256 5.0
Straw/husk/jute
stick 39.0 45.7 0.004 42.9 53.0 0.001 43.6
Cow dung 22.8 20.2 0.143 17.4 27.4 <0.001 21.0
Others 0.1 0.2 0.344 0.2 0.4 0.310 0.2
Source of
drinking
water
Supply water 0.4 1.3 0.053 1.5 0.9 0.256 1.0
Tube-well 95.8 93.2 0.019 92.0 96.2 0.004 94.0
Others 3.8 5.5 0.085 6.6 2.9 0.006 5.0
Electricity
coverage in
the village
Yes 85.4 86.9 0.246 85.5 90.6 0.010 86.5
No 14.6 13.1 0.246 14.5 9.4 0.010 13.5
Electricity
coverage in
the house
Yes 80.8 80.7 0.398 80.8 80.4 0.392 80.8
No 19.2 19.3 0.398 19.2 19.6 0.392 19.2
Ownership of
Toilet
Yes 91.1 91.8 0.340 92.1 91.3 0.347 91.6
No 8.9 8.2 0.340 7.9 8.7 0.347 8.4
Type of
Sanitation
Pucca toilet (water
seal) 20.5 12.2 <0.001 10.5 16.5 0.002 14.8
Pucca toilet 25.9 29.2 0.103 33.3 18.7 <0.001 28.2
Katcha toilet 52.5 54.7 0.244 52.0 61.7 0.001 54.0
Open field/others 1.1 3.9 <0.001 4.1 3.1 0.257 3.0
Note: Formal source: Govt. bank or Govt. co-operatives, and Nongovernment (MFI/NGO/Insurance).
Informal source: Local Money Lender (Mohajan/Private samitte) & Non-interest Loan (Relatives/Land Owner)

141 | P a g e
Table 3.4 Landholdings pattern of the study households in the Haor regions of Bangladesh
Types
of land
Classification and
statistics
Micro-credits type
P-value
Household type
P-value
Non-
borrower
(733)
Borrower
(1607)
Formal
(1158)
Informal
(449)
Overall
(2340)
Ho
mes
tea
d L
an
d
No land (%) 5.9 9.6 0.005 11.8 4.0 <0.001 8.5
1 to 15 decimals (%) 81.2 78.3 0.110 77.0 81.7 0.049 79.2
16-50 decimals (%) 9.8 9.3 0.371 8.8 10.7 0.200 9.5
50+ decimals (%) 3.1 2.7 0.345 2.3 3.6 0.139 2.8
Mean (in decimal) 10.58 10.83 0.385 10.96 10.52 0.362 10.75
SD (in decimal) 21.96 19.99 21.31 16.48 20.64
Median (in decimal) 5.00 5.00 5.00 5.00 5.00
IQR (in decimal) 7.00 8.00 7.00 9.00 7.00
Cu
ltiv
ab
le o
wn
la
nd
Landless (%) 66.0 68.8 0.161 68.8 68.6 0.398 67.9
1 to 15 decimals (%) 8.2 6.0 0.057 6.5 4.9 0.193 6.7
16-50 decimals (%) 8.0 8.2 0.394 8.3 8.0 0.391 8.2
50+ decimals (%) 17.7 17.0 0.366 16.4 18.5 0.241 17.2
Mean (in decimal) 105.85 96.60 0.148 102.80 80.74 <0.001 99.67
SD (in decimal) 155.49 127.41 139.72 86.86 137.33
Median (in decimal) 56.00 60.00 60.00 60.00 60.0
IQR (in decimal) 103.00 100.00 100.00 65.00 100.00
Cu
ltiv
ab
le l
ease
d-i
n
or
sha
recr
op
ped
la
nd
No land (%) 80.8 70.1 <0.001 71.0 67.7 0.172 73.4
1 to 15 decimals (%) 4.1 3.9 0.389 4.7 1.8 0.010 3.9
16-50 decimals (%) 3.4 7.3 <0.001 8.8 3.6 0.001 6.1
50+ decimals (%) 11.7 18.7 <0.001 15.5 26.9 <0.001 16.5
Mean (in decimal) 98.53 103.88 0.188 88.16 140.29 <0.001 102.66
SD (in decimal) 100.23 92.76 85.03 99.75 94.45
Median (in decimal) 66.00 90.00 60.00 120.00 90.00
IQR (in decimal) 121.00 120.00 95.00 120.00 120.00
Po
nd
la
nd
Don’t have (%) 92.4 94.5 0.058 95.2 92.7 0.057 93.8
1 to 15 decimals (%) 6.8 4.4 0.021 3.7 6.2 0.036 5.2
16-50 decimals (%) 0.8 1.1 0.318 1.0 1.1 0.393 1.0
Mean (in decimal) 6.83 9.79 <0.001 11.19 7.42 <0.001 8.65
SD (in decimal) 7.32 11.11 12.69 7.31 9.89
Median (in decimal) 5.00 5.00 5.00 5.00 5.00
IQR (in decimal) 7.30 7.00 11.80 7.00 7.00
To
tal
lan
d
Don’t have (%) 4.6 5.6 0.241 7.3 1.3 <0.001 5.3
1 to 15 decimals (%) 49.2 40.5 <0.001 40.1 41.6 0.343 43.2
16-50 decimals (%) 17.5 18.6 0.325 19.9 15.1 0.034 18.2
50+ decimals (%) 28.6 35.3 0.002 32.7 41.9 0.001 33.2
Mean (in decimal) 68.58 75.84 0.178 73.14 82.40 0.135 73.55
SD (in decimal) 134.09 114.46 115.17 112.58 121.01
Median (in decimal) 15.00 25.00 25.00 27.00 21.00
IQR (in decimal) 61.00 95.50 87.00 115.00 88.00
Note: SD=Standard Deviation; IQR= Inter Quartile Range

142 | P a g e
Table 3.5 Possession of durable assets by the study households in Haor regions
Name of household assets
Micro-credits type (%)
P-value
Household type (%)
P-value
Non-borrower
(733)
Borrower
(1607)
Formal
(1158)
Informal
(449)
Overall
(2340)
Radio 2.9 1.4 0.052 1.6 0.9 0.225 1.9
Television 18.8 14.9 0.064 18.2 6.5 <0.001 16.2
Mobile phone 85.8 91.7 0.001 91.5 92.2 0.360 89.9
Electric fan 71.2 69.1 0.285 73.4 57.9 <0.001 69.7
Almirah 37.8 34.0 0.143 37.3 25.4 <0.001 35.2
Cookeries 96.3 89.4 <0.001 86.4 96.9 <0.001 91.5
Cutleries 96.3 89.4 <0.001 86.3 97.3 <0.001 91.5
Table/chair 78.9 81.1 0.242 82.1 78.6 0.109 80.4
Bed 92.6 93.5 0.324 94.0 92.0 0.139 93.2
Chauki 94.5 93.5 0.302 92.7 95.8 0.030 93.8
Drawing room furniture 6.0 6.2 0.394 5.0 9.4 0.002 6.2
Bicycle 10.6 7.0 0.023 6.9 7.1 0.395 8.1
Boat 11.6 16.2 0.027 16.8 14.9 0.260 14.8
Shallow tube-well 19.9 20.9 0.361 20.9 20.9 0.399 20.6
Deep tube-well 0.5 1.6 0.086 1.1 2.7 0.026 1.2
Watch 25.5 29.9 0.086 31.1 26.7 0.089 28.5
Shelf 29.6 28.4 0.356 27.9 29.6 0.317 28.8
Alna 58.3 59.9 0.336 59.1 61.9 0.235 59.4
Motorcycle 0.0 0.4 0.162 0.5 0.0 0.129 0.3
Others 4.9 5.4 0.368 6.5 2.4 0.002 5.2
Note: Formal source: Govt. bank or Govt. co-operatives, and Nongovernment (MFI/NGO/Insurance).
Informal source: Local Money Lender (Mohajan/Private samitte) & Non-interest Loan (Relatives/Land Owner)
Table 3.6 Possession of durable assets by the study households in Haor regions of Bangladesh
Name of assets
Borrower
(N = 1607)
Non-borrower
(N = 733) P-value
Overall
(N = 2340)
HHs Mean ± SD HHs Mean ± SD HHs Mean ± SD
Cultivating equipment 664 3.27 ± 2.27 311 3.05 ± 2.05 0.146 975 3.20 ± 2.20
Livestock 694 2.39 ± 1.51 287 2.73 ± 1.82 0.003 981 2.49 ± 1.61
Rickshaw/van 038 1.32 ± 0.66 015 1.40 ± 1.06 0.741 053 1.34 ± 0.78
Auto rickshaw 020 1.10 ± 0.45 016 1.00 ± 0.00 0.382 036 1.06 ± 0.33
Sprayer 029 1.17 ± 0.38 014 1.29 ± 0.61 0.433 043 1.21 ± 0.47
Fishing net 336 1.62 ± 0.94 127 1.74 ± 1.03 0.233 463 1.65 ± 0.96
Bee box 014 1.00 ± 0.00 002 1.50 ± 0.71 0.004 016 1.06 ± 0.25
Sewing machine 089 1.07 ± 0.25 035 1.06 ± 0.24 0.840 124 1.06 ± 0.25
Motor (engine) 041 1.17 ± 0.50 017 1.06 ± 0.24 0.392 058 1.14 ± 0.44
Family business 135 59377.78 057 104000.00 0.023 192 72625.00
Others 024 4.71 ± 8.09 020 2.30 ± 2.70 0.210 044 3.61 ± 6.30
Note: HHs = Households; SD = Standard Deviation

143 | P a g e
Table 3.7 Knowledge and perception on micro-credits benefits of respondents in Haor regions
Statement of knowledge and/or perception Number
(N = 2340)
Percentage of
total
Total in
percentage
Knowledge about micro-credits benefit
Yes 2212 94.5 100
No 128 5.5
Trying for getting micro-credits benefit
Yes 2008 85.8 100
No 332 14.2
First attempt for getting micro-credits benefit with type
Government (Banks/Co-operatives) 96 4.1
85.8
Nongovernment (MFI/NGO/Insurance) 1289 55.1
Local money lender (Mohajan/Private Samittee) 374 16.0
Non-interest loan (Relatives/friends/neighbors) 56 2.4
More than one sources 193 8.2
Second attempt for getting Micro-credits benefit with type
Government (Banks/Co-operatives) 21 0.9
8.6
Nongovernment (MFI/NGO/Insurance) 38 1.6
Local money lender (Mohajan/Private Samittee) 128 5.5
Non-interest loan (Relatives/friends/neighbors) 11 0.5
More than one sources 3 0.1
Communication for getting Micro-credits benefit
UP chairman 12 0.5
58.60
UP member 20 0.9
UP office 804 34.4
Government officer 112 4.8
Relatives/neighbors/friends 343 14.7
NGO 78 3.3
Ask for money for giving Micro-credits benefit
Yes 91 3.9 59.00
No 1290 55.1
Micro-creditss help to remove poverty
Yes 1413 60.4 66.10
No 134 5.7
Note: MFI=Microfinance Institution; NGO=Nongovernment Organization; UP=Union Parishad.

144 | P a g e
Table 3.8 Reasons of not getting micro-credits benefits of eligible borrowers’ of Haor regions
Name of the reasons
Perception of non-borrower households (%)
Household
(N = 733)
Strongly
disagree Disagree
No
comment Agree
Strongly
agree
Bureaucratic complexity 579 2.3 23.6 26.9 12.6 13.6
Limitation of budget (according to selector) 577 11.7 21.8 25.9 11.6 7.6
Couldn’t provide bribe or entry fee 575 12.7 37.8 17.3 6.7 4.0
No political exposure 577 10.6 18.4 24.0 16.9 8.7
Didn’t have any idea about such program 578 19.4 31.9 7.4 15.3 4.9
Nepotism 561 9.0 15.1 25.5 15.7 11.2
Non-cooperation from public delegate 576 2.5 26.3 13.1 25.9 10.8
Non-cooperation from local lenders 571 2.0 18.7 17.3 28.6 11.2
Non-availability of NID 573 39.4 25.4 9.4 2.7 1.2
Lack of networking or lobbying 574 9.4 11.3 19.2 29.2 9.1
Distance from Micro-credits from the village 569 9.0 35.6 6.8 21.6 4.6
No Micro-credits in the area 442 25.5 28.2 3.7 1.1 1.8
Non availability of collateral 388 2.6 19.6 11.9 13.8 5.0
Misappropriation of credits 384 2.3 14.3 12.0 17.7 6.0
Biasness 348 1.5 19.2 22.8 2.0 1.9
Others 207 1.1 1.9 16.4 2.0 4.9
Note: NID = National Identity.

145 | P a g e
Appendix table 5.1 Impact of micro-credits benefits on the households’ of Haor areas by before-after borrowers and non- borrowers as well as case-control.
Indicator of
economic status
Non-borrowing households Borrowing households Diff-
in-diff p-value
2016 2019 t-statistic
(p-value) 𝐱 =
b-a
a×100
2016 2019 t-statistic
(p-value) 𝐲 =
𝐝-c
𝐜×100
HHs (a) HHs (b) HHs (c) HHs (d) Z=y-x (x vs. y)
Income Sources
Agricultural 318 40116.4 333 45803.6 -1.84(0.066) 14.18 813 38105.9 900 44654.2 -4.53(<0.01) 17.18 3.01 0.188
Non-agricultural 295 51237.3 331 55763.8 -0.85(0.394) 8.83 665 37516.6 830 43169.3 -2.42(0.016) 15.07 6.23 0.012
Labor Sale 456 44855.7 464 54409.5 -5.69(<0.01) 21.30 1002 48847.3 1053 56527.9 -4.65(<0.01) 15.72 -5.58 0.014
Business 179 68607.0 197 74070.1 -0.93(0.352) 7.96 344 62094.2 400 68855.3 -1.71(0.088) 10.89 2.93 0.226
Donation/Begging 83 9342.2 81 11041.9 -0.74(0.463) 18.19 156 7854.5 208 9804.3 -1.66(0.098) 24.82 6.63 0.202
Total Income 732 83855.5 733 101558.8 -5.40(<0.01) 21.11 1586 80365.3 1607 102753.4 -11.57(<0.01) 27.86 6.75 0.001
Expenditure heads
Food 733 46479.8 733 54700.3 -6.72(<0.01) 17.69 1607 47632.1 1607 56030.3 -10.85(<0.01) 17.63 -0.05 0.399
Non-food 733 8738.4 733 11470.7 -7.24(<0.01) 31.27 1607 9903.0 1607 13528.0 -12.38(<0.01) 36.61 5.34 0.017
Total consumption 733 55218.6 733 66171.0 -8.01(<0.01) 19.83 1607 57535.1 1607 69558.3 -13.83(<0.01) 20.90 1.06 0.334
Education 407 7917.4 481 9015.2 -1.37(0.171) 13.87 997 8567.5 1190 10193.0 -3.24(0.001) 18.97 5.11 0.030
Healthcare 688 7404.2 686 7966.3 -0.82(0.412) 7.59 1519 7731.0 1539 9815.1 -5.41(<0.01) 26.96 19.37 <0.01
Agriculture 276 16273.6 279 19157.7 -1.99(0.047) 17.72 742 15280.1 811 19016.8 -6.31(<0.01) 24.45 6.73 0.030
Poultry-livestock 201 4380.6 202 5018.3 -1.10(0.273) 14.56 445 4925.1 541 9604.3 -8.10(<0.01) 95.01 80.45 <0.01
Family business 72 18416.7 79 22810.1 -2.29(0.023) 23.86 150 17952.0 220 25086.4 -4.65(<0.01) 39.74 15.89 0.027
Productive asset 41 5682.9 54 6157.4 -0.35(0.724) 8.35 136 7157.4 233 11639.9 -3.30(0.001) 62.63 54.28 <0.01
Durable goods 76 4802.6 84 3756.0 1.07(0.268) -21.79 91 5238.5 146 8630.8 -2.66(0.008) 64.76 86.55 <0.01
House repair 225 9487.1 235 7005.1 2.11(0.035) -26.16 499 8420.4 574 11401.7 -2.84((0.005) 35.41 61.57 0.019
Land purchase 10 15000.0 13 25192.3 -1.26(0.223) 67.95 21 23333.3 38 29710.5 -0.78(0.439) 27.33 -40.62 0.039
Other investment 125 7917.4 158 11063.3 -2.40(0.017) 39.73 356 10411.5 561 16049.2 -6.73(<0.01) 54.15 14.41 0.009
Total investment 727 25864.7 730 30591.2 -3.06(0.002) 18.27 1589 29128.0 1606 46091.0 -15.54(<0.01) 58.24 39.96 <0.01
Total expenditure 733 80871.5 733 96637.0 -6.48(<0.01) 19.49 1606 86325.2 1607 115620.6 -18.21(<0.01) 33.94 14.44 <0.01
Debt 192 13791.7 158 12018.4 1.03(0.303) -12.86 830 20689.2 1253 28671.2 -5.51(<0.01) 38.58 51.44 <0.01
Savings 118 18827.1 111 19438.3 -0.19(0.846) 3.25 308 4440.4 507 3965.4 1.37(0.170) -10.70 -13.94 0.020
Note: HH = Households;
a = Average value of non-beneficiary HHs in 2016; b = Average value of non-beneficiary HHs in 2019; x = Impact of non-borrower HHs from before-after comparison;
c = Average value of beneficiary HHs in 2016; d = Average value of beneficiary HHs in 2019; y = Impact of borrower HHs from before-after comparison;
z = Net impact of micro-creditss through case-control as well as before-after comparison using diff-in-diff method.

146 | P a g e
Appendix table 5.2 A comparative impact of micro-credits benefits of formal and informal borrowers in the Haor regions of Bangladesh by before-after as
well as case-control method
Indicator of
Economic Status
Informal sources Formal sources Diff-
in-
diff
2016 2019 t-statistic
(p-value) 𝐱 =
b-a
a×100
2016 2019 t-statistic
(p-value) 𝐲 =
𝐝-c
𝐜×100
p-value
(x vs y) HHs (a) HHs (b) HHs (c) HHs (d) Z=y-x
Income Sources
Agricultural 221 33511.8 245 40303.7 -2.70(0.007) 20.27 592 39821.0 655 46281.5 -3.71(<0.01) 16.22 -4.04 0.108
Non-agricultural 174 36086.5 216 41351.4 -0.96(0.336) 14.59 491 38023.5 614 43808.9 -2.31(0.021) 15.22 0.63 0.386
Labor Sale 340 47110.3 348 55379.3 -3.80(<0.01) 17.55 662 49739.4 705 57094.9 -3.30(0.001) 14.79 -2.76 0.162
Business 63 56317.5 74 60270.3 -0.67(0.506) 7.02 281 63389.3 326 70804.1 -1.59(0.112) 11.70 4.68 0.096
Donation/Begging 54 6672.2 72 9311.1 -1.80(0.074) 39.55 102 8480.4 136 10065.4 -0.98(0.330) 18.69 -20.86 0.001
Total Income 447 75192.3 449 96233.2 -5.74(<0.01) 27.98 1139 82395.4 1158 105281.5 -10.07(<0.01) 27.78 -0.21 0.397
Expenditure heads
Food 449 46731.9 449 54261.5 -5.14(<0.01) 16.11 1158 47981.2 1158 56716.2 -9.58(<0.01) 18.21 2.09 0.185
Non-food 449 8447.0 449 12418.9 -7.55(<0.01) 47.02 1158 10467.6 1158 13958.0 -10.00(<0.01) 33.34 -13.68 <0.01
Total consumption 449 55178.8 449 66680.4 -7.11(<0.01) 20.84 1158 58448.7 1158 70674.2 -11.89(<0.01) 20.92 0.07 0.399
Education 275 8104.7 298 9283.6 -1.30(0.193) 14.55 722 8743.8 892 10496.9 -2.92(0.004) 20.05 5.50 0.022
Healthcare 438 8379.5 436 10845.2 -3.56(<0.01) 29.43 1081 7468.2 1103 9408.0 -4.20(<0.01) 25.97 -3.45 0.095
Agriculture 221 16156.6 222 18959.9 -2.44(0.015) 17.35 521 14908.3 589 19038.2 -5.99(<0.01) 27.70 10.35 0.001
Poultry-Livestock 194 3996.4 206 5496.1 -2.74(0.006) 37.53 251 5642.8 335 12130.5 -7.52(<0.01) 114.97 77.45 <0.01
Family business 21 14038.1 31 22580.7 -2.53(0.015) 60.85 129 18589.2 189 25497.4 -4.08(<0.01) 37.16 -23.69 0.002
Productive asset 60 5888.3 80 8137.5 -1.36(0.178) 38.20 76 8159.2 153 13471.2 -2.74(0.007) 65.10 26.91 0.004
Durable goods 26 6096.2 40 8975.0 -0.94(0.353) 47.22 65 4895.4 106 8500.9 -2.73(0.007) 73.65 26.43 0.001
House repair 178 7906.7 208 12846.2 -2.45(0.015) 62.47 321 8705.3 366 10580.9 -1.58(0.115) 21.55 -40.93 <0.01
Land purchase 4 12500.0 11 34090.9 -0.93(0.370) 172.73 17 25882.4 27 27925.9 -0.25(0.807) 7.90 -164.8 <0.01
Other investment 99 7681.8 130 13179.2 -3.22(0.001) 71.56 257 11463.0 431 16914.9 -5.71(<0.01) 47.56 -24.00 <0.01
Total investment 445 29658.2 449 42999.2 -6.14(<0.01) 44.98 1144 28921.7 1157 47290.8 -14.60(<0.01) 63.51 18.53 <0.01
Total expenditure 448 84527.2 449 109679.6 -7.76(<0.01) 29.76 1158 87020.8 1158 117924.2 -16.78(<0.01) 35.51 5.76 0.010
Debt 265 20720.8 323 24791.0 -1.66(0.098) 19.64 565 20674.4 930 30018.9 -5.25(<0.01) 45.20 25.56 <0.01
Savings 31 5312.9 29 4372.4 0.82(0.416) -17.70 277 4342.7 478 3940.7 1.10(0.270) -9.26 8.45 0.021
Note: HHs = Households;
a=Average value from informal sources in 2016; b=Average value from informal sources in 2019; x=Impact of credits from informal sources using before-after comparison;
c=Average value from informal sources in 2016; b=Average value from informal sources in 2019; x=Impact of credits from informal sources using before-after comparison;
z=Net impact of formal credits over informal credits through case-control as well as before-after comparison using diff-in-diff method