VACCINE ANNUAL REPORT - YEAR 8 JULY 1, 2016
349
1 VACCINE ANNUAL REPORT - YEAR 8 JULY 1 , 20 16 – JUNE 30, 2017 Cooperative Agreement No. 2009 - ST - 061 - CI0001
-
Upload
khangminh22 -
Category
Documents
-
view
1 -
download
0
Transcript of VACCINE ANNUAL REPORT - YEAR 8 JULY 1, 2016

1
VACCINE ANNUAL REPORT - YEAR 8
JULY 1 , 20 16 –
JUNE 30, 2017
Cooperative Agreement No. 2009 - ST - 061 - CI0001

2
Table of Contents
Executive Summary of the Impact of VACCINE
I. Executive Overview…………………………………………………………… 3
II. Co-Operative Agreement Close-out Report Presentation …….. 13
III. VACCINE Videos……………………………………………………………… 19
a. Overview of VACCINE
b. Education
c. Public Safety
d. Response Planning
IV. Impact of VACCINE Report………………………………………………. 20
Highlights and Significant Achievements
I. Strategic Plan Initiatives……………………………………………….… 33
II. Significant Transition Successes……………………………………… 37
III. Commercialized COE Outputs…………………………………………. 46
IV. Transitions and Pilots ……………………………………………..…….. 49
V. Education Initiatives ……………………………………………..………. 60
VI. Recommendations and Lessons Learned………………………….. 68
VII. Aggregate Metrics for the Award
Annual metrics featuring categories of accomplishments
A. List of All Funded Projects
A detailed list of all projects funded under the award, including dates, amounts
and resulting outputs (published papers, presentations and other knowledge
products)
B. Projects by Thematic Area
A list of all funded projects by thematic area, including resulting output that
contributed to knowledge base or technology market and identification of next
steps for each.
C. Student Successes
A list of funded students for each institution by year and where they are now.
Addendum
A. Significant Research Areas
1. Epidemic Modeling
2. Science of Interaction
3. Spatiotemporal Correlation
4. Spatiotemporal Resource Allocation
5. Trajectory and Human Movement Work

3
B. Most Significant Tools
1. SMART
2. VALET
3. cgSARVA
4. vBOLO
5. GARI
6. Jigsaw
7. FAVA
8. GeoTxt
9. MADIS
10. Symbol Store
11. VASA
12. LAHVA
C. List of All Publications (VACCINE Publications)
D. Example Commercialization Plans
1. SMART
2. VALET
3. cgSARVA
4. GARI
E. Co-Operative Agreement Closeout Presentation

Executive Summary of the Impact of VACCINE
4
I. Executive Overview
a. Introduction
The Visual Analytics for Command, Control, and Interoperability Environments Center (VACCINE) was established on July 1, 2009 to co-lead, with Rutgers University, the Department of Homeland Security’s (DHS) Center for Visualization and Data Analytics (CVADA). VACCINE’s mission is dedicated to creating methods and tools to analyze and manage vast amounts of information for all mission areas of homeland security. VACCINE accomplishes its mission through an integrated program of research, education and outreach, spanning the disciplines of visualization and computer graphics, engineering, computer science, geographic information systems, cognitive psychology, information technology, and emergency management and public safety. Center strengths include:
i. Broad network of schools: partners with 38 universities both domestic and international aimed at turning massive data into actionable knowledge through innovative visual analytics techniques.
ii. Extensive end-user community: possesses strong, collaborative history and experience that helped to guide VACCINE’s tool/technology development. This community of end-users makes it possible for VACCINE’s research to result in the development of robust tools that are helping to make an impact on law enforcement, first responders, and homeland security personnel across the country.
In the paragraphs that follow this introduction, the key successes of VACCINE in the primary focus areas of research, technology/tool development and education initiatives are summarized in this executive overview, and detailed in Sections II and III. Additionally, a hyperlink is provided to SuccessVis below this paragraph. SuccessVis is a time-based visualization of the successful tools/technologies created by VACCINE that depicts the key events for each tool in the form of an “event river.” The width of the “event
river” is based upon the volume of activity produced by the tool/technology and news articles are linked to specific events during the development of the tool/technology. Furthermore, the tools/technologies are categorized by their emphasis area - public safety, resource planning and education.
http://voxel.ecn.purdue.edu/successvis/

Executive Summary of the Impact of VACCINE
5
b. Key VACCINE Successes in Research, Tools and Education Include:
VACCINE employed a broad network of schools to develop an integrated program of research, education and outreach in visualization and visual analytics. Some of the key successes of VACCINE are briefly described below.
i. Created twelve (12) significant tools for the Homeland Security Enterprise in a broad range of functional areas.
1. Emergency Preparedness Tools. A number of Visual
Analytics tools to assist first responders and emergency management planning were developed.
2. Public Health Visual Analytics Tools. VACCINE
researched novel visual analytics tools for Rift Valley Fever using a tool from the FAZD Center, incorporating epidemiological modeling as well as economic modeling and analysis.
3. Interactive Visual Analysis and Decision Making
Environments for Law Enforcement. The creation of tools like VALET, Visual Analytics for Law Enforcement Toolkit, enabled police departments to map crime occurrences and plan patrol distributions.
4. Resource Allocation Visual Analytic Tools. Provided operational support using cgSARVA which was the only tool in COE history produced by one of the DHS Centers of Excellence to be accredited by the USCG.
5. Fraud Detection Financial Visualization Tools. UNCC partner, Dr. William Ribarsky, developed RiskVA which applied risk analytics to large and multi-faceted financial resources.
ii. More than 4,000 students introduced to Visual Analytics knowledge and techniques. (Please see section IV. Achievements in Education for more detailed information. )
iii. Created a Public Safety Consortium. VACCINE formed a multi-agency public safety consortium in Indiana to develop tools for crime analysis, law enforcement planning, and decision making.

Executive Summary of the Impact of VACCINE
6
iv. Provided Intellectual Leadership for the Field of Visual Analytics. VACCINE was a pioneer in the area of VA for eight (8) years, producing hundreds of peer reviewed journal articles and conference publications and presentations, many patent applications filed or awarded, and numerous graduate theses and comprehensive research projects.
v. Led Efforts To Expand Inclusiveness in Visual Analytics. During the life of the Center, Visual Analytics (VA) workshops for faculty members at many colleges/universities were conducted to introduce VA to faculty members and help them incorporate VA into their course curriculum.
vi. Expanded Partnerships to Include European and US Allied Universities. VACCINE expanded the Public Safety Consortium to international universities such as the University of Stuttgart, eight Canadian institutes of higher learning, and from the United Kingdom - Oxford and Swansea University.
vii. Established a Non-Profit and for-Profit Entity. The Purdue Research Foundation, PRF, created VACCINE, LLC, to accept and disburse charitable gifts and a for-profit entity, Davista Technologies LLC, to provide a commercial vehicle to transition VACCINE tools/technologies to the market place.
c. Impact Of The Tools/Technology Created By VACCINE:
VACCINE was strategically focused on the transition of technology and tools out of the research lab to local, regional, and national use with lasting impact on the Homeland Security Enterprise. Some of the most significant tools developed by VACCINE are:
i. SMART (Social Media Analytics and Reporting Toolkit), a social
media analytics tool that provides actionable information, was
deployed at many special events such as the 2017 Presidential
Inauguration by Homeland Security components, and
commercialized by Davista.
ii. VALET (Visual Analytics Law Enforcement Toolkit), an interactive
interface for crime incidents, was deployed to several law

Executive Summary of the Impact of VACCINE
7
enforcement agencies and commercialized by Davista who delivered
a modified version to a commercial customer.
iii. cgSARVA (Coast Guard Search and Rescue Visual Analytics), an interactive system that enables analysts to assess operational efficiencies, was used successfully by the United States Coast Guard to right-size the USCG resources in the Great Lakes region. It was also used to avoid resource relocation costs following Super Storm Sandy along the eastern seaboard. It is the only DHS COE tool accredited for use by the USCG.
iv. GARI (Gang Graffiti Automatic Recognition and Interpretation), a
gang graffiti and tattoo recognition application, won 2nd place in the
2015 NIST- FBI tattoo recognition challenge and it is used by
multiple law enforcement agencies for gang tattoo and graffiti
recognition and interpretation.
v. MERGE (Mobile Emergency Response Guide), an application that
automatically interprets HAZMAT placards, was deployed to several
first responders groups to quickly identify HAZMAT signs and their
meaning.
vi. JIGSAW, which acts like a visual index in a document collection
that highlights connections between entities, has been downloaded
by numerous organizations in the government and industry for
document exploration and discovery.
vii. FAVA (Financial Anomaly Visual Analytics), is designed for
government organizations to explore financial datasets and identify
any potential anomalies with the help of additional data sources that
provide contextual information.

Executive Summary of the Impact of VACCINE
8
viii. MADIS (Multimedia-Aided Disaster Information Integration
System), was tested and used by the Miami-Dade Department of
Emergency Management.
ix. GeoTxt provides a geoparsing service to extract and geolocate place
references from text that other software applications can connect to;
its accuracy compared favorably to other geoparsers in an
independent evaluation by a research team from the Language
Technology Lab at Cambridge (published in Language Resources &
Evaluation).
x. vBOLO (Virtual “Be on the Look-out”), was piloted successfully at
the Cleveland Rapid Transit Authority to detect the re-entry of
persons who had previously committed a crime on the commuter
transit system.
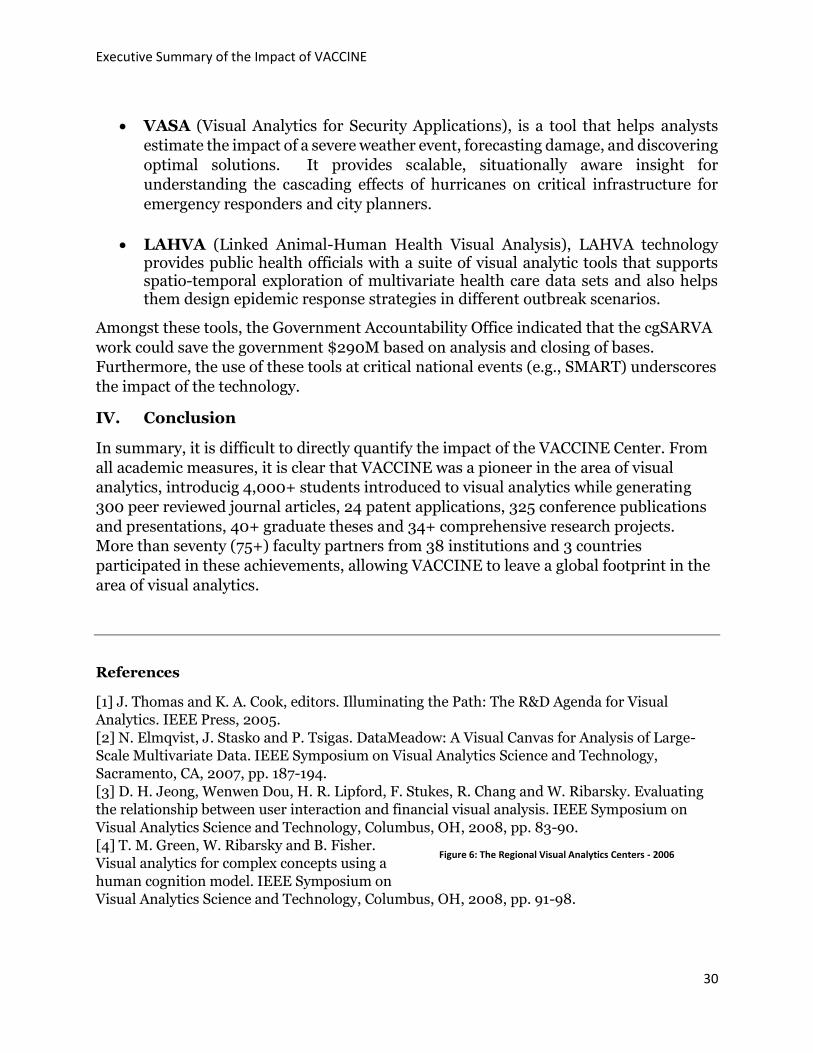
xi. VASA (Visual Analytics for Security Applications), is a tool that
helps analysts estimate the impact of a severe weather event,
forecasting damage, and discovering optimal solutions. It provides
scalable, situationally aware insight for understanding the cascading
effects of hurricanes on critical infrastructure for emergency
responders and city planners.
xii. LAHVA (Linked Animal-Human Health Visual Analysis), LAHVA technology provides public health officials with a suite of visual analytic tools that supports spatio-temporal exploration of multivariate health care data sets and also helps them design epidemic response strategies in different outbreak scenarios.
d. Achievements in Education

Executive Summary of the Impact of VACCINE
9
More than 4,000 students introduced to Visual Analytics
knowledge and techniques.
i. 40+ Summer Undergraduate Research Fellows (SURF)
VACCINE students since 2007. SURF matches undergraduates with
a faculty member and graduate student mentor who introduce them
to the research tools used on the cutting edges of science,
engineering, and technology.
ii. 30+ Minority Serving Institutions (MSI) Undergraduate
participants since 2011. VACCINE hosted HCBU/MSI students
from Morgan State and Jackson State in one-week training events in
which faculty and students led demonstrations of VACCINE tools
and technology, providing an opportunity to gain hands-on
experiences with VACCINE resources.
iii. 90+ total MSI faculty participants since 2013. VACCINE has
continued to support Minority Serving Institution (MSI) initiatives
by providing an education program to expand the teaching of visual
analytics at MSIs. The program focused on preparing MSI faculty to
incorporate visual analytics courses into their programs.
iv. Approximately 14 Air Force Academy & Coast Guard
Academy Faculty in attendance at VACCINE and the U.S.
Air Force Academy training workshop. This workshop created
a network of collaborators at the Service Academies who understand
the need to develop and educate the Department of Defense and
Department of Homeland Security personnel on the value of visual
analytics.
v. 500+ participants registered in VACCINE and American
Military University (AMU) webinar series since 2015. In
collaboration with American Military University, VACCINE pres-
ented a webinar series with a primary focus on topics related to
homeland security technology and research. The webinar series was
a launching platform for discussions about problems, challenges and
solutions related to keeping our country safe.
vi. 22 HS-STEM (Homeland Security – Science, Technology,
Engineering and Math) Career Development Program
recipients. This program is designed to support graduate students
in developing the skills to become preeminent scientists in the

Executive Summary of the Impact of VACCINE
10
homeland security and technical communities. This United States
Department of Homeland Security funded program offers career
development scholarships and fellowships, as well as forgivable
loans with summer research opportunities and one year service
commitments.
vii. 250+ VACCINE student research assistants. VACCINE has
employed a diverse group of research assistants in the VACCINE
labs. Many of these talented graduate students are now employed at
America’s most well-known companies such as Google, Amazon and
Apple.
viii. Developed 31+ related curriculum. We collaborated with
multiple partner universities to deliver various courses in areas
related to visual analytics, including visualization techniques,
geospatial intelligence, data management and data mining.
ix. 200+ students from Lafayette Jefferson High School participate outreach programs. For the past several years, VACCINE engaged with a local high school to provide students with the foundational knowledge in visual and big data analytics necessary to promote and encourage postsecondary schooling.
e. Key Lessons Learned and Recommendations
As VACCINE pursued advancements in visual analytics in the areas of research,
deployment of tools/technologies and education, many lessons were learned.
These lessons learned were shared with the DHS OUP leadership during weekly
program management meetings, periodic conferences and as specific situations
arose.
i. COE project delays and personnel retention issues can be minimized by accurate financial projections and timely funding distribution. We recognize that DHS S&T funding is subject to congressional and internal DHS budget processes, so the purpose of this paragraph in Section II is to document the impact on COEs, while acknowledging that OUP has little ability to change this issue.
ii. Semi-annual conferences/meetings with the COE
leadership leads to greater collaboration. Annual or semi-annual meetings are a great venue to exchange ideas, to build relationships/partnerships and to plan collaborations. Although there is an expense associated with these gatherings, it may be less expensive than redundant or uncoordinated research, education initiatives or technology development.

Executive Summary of the Impact of VACCINE
11
iii. Proposal cohesion and alignment is better maintained when proposals are awarded as a unified group. While the rationale to initiate projects based upon component capability gaps is sound, those capability gaps should be a part of the original RFP. Piece matching the initiatives from several proposals to fine tune an award to a set of capability gaps leads to a lack of overall program cohesion when the direction is applied after a proposal is developed.
iv. Continue project reviews and competitions. VACCINE conducted quarterly reviews of research projects to ensure that projects meet their milestone targets. Projects that could not be transitioned to tools for end-users were discontinued and competitions were conducted to initiate new projects.
v. Encourage the use of Public Safety/Customer forums. Our strong partnership with our stakeholder community has been key to VACCINE’s success because they provided a framework where VACCINE can deploy its tools to the various agency members, and our end-users provide in-field or real world evaluation feedback on their requirements.
vi. A webinar series is a great method to engage a broad range of HSE professionals and students. VACCINE, and our online education partner, American Military University (AMU) have collaborated to present a quarterly webinar series. The webinars are conducted in coordination with The National Conversation on Homeland Security Technology in an effort to get people talking about problems, challenges, and solutions to keep our country safe.
vii. Adopt a user centered approach to transition research into practice. One of the major reasons for our success with transitioning our research into practice has been due to our agile research and development methodology and our efforts in nurturing strategic partnerships with our end-user groups.
viii. Low profit margins on public safety products present a challenge when attempting to commercialize solutions. The main challenges that we have encountered regarding commercializing and licensing these technologies include a relatively small size of the total addressable market segment (especially for the first responder and law enforcement market), difficult sales cycle for this market, and difficult exit market strategies due to the diverse nature of the competition in this market space.

Executive Summary of the Impact of VACCINE
12
f. Summary
VACCINE was a pioneer in the area of VA for eight (8) years, producing; 4,000+
students introduced to VA, 300 peer reviewed journal articles, 24 patent applications
filed or awarded, 325 conference publications and presentations, 40+ graduate theses
and 34+ comprehensive research projects. More than seventy (75+) faculty partners
from 38 institutions and 3 countries accomplished these achievements.
A presentation that summarizes the achievements of VACCINE in the areas of
research, tool/technology development and education can be accessed via the
hyperlink below.

Executive Summary of the Impact of VACCINE
13
II. Co-operative Agreement Closeout Presentation

Executive Summary of the Impact of VACCINE
14

Executive Summary of the Impact of VACCINE
15

Executive Summary of the Impact of VACCINE
16

Executive Summary of the Impact of VACCINE
17

Executive Summary of the Impact of VACCINE
18

Executive Summary of the Impact of VACCINE
19
III. VACCINE Videos
As a component of the 2016-2017 VACCINE Co-operative Agreement SOW, the
following videos were developed to highlight the accomplishments of VACCINE in the
areas of education, public safety and response planning. Each video contains
interviews with the people that were most instrumental in the conduct of research,
delivery of a technology or educational initiative.
a. Overview - An Overview of VACCINE and the
Impact of VACCINE on the Field of
Visual Analytics.
b. Education - VACCINE’s Impact on Education
and the Field of Visual Analytics.
c. Public Safety - VACCINE Supports Public Safety
and Law Enforcement.
d. Response Planning - VACCINE’s Tools are Used
for Emergency Response
Determination, Resource
Allocation Decisions and Critical
Infrastructure Impact Analysis.

Executive Summary of the Impact of VACCINE
20
IV. Impact of VACCINE Report
CLOSE OUT REPORT: A Retrospective Analysis of the Impact of VACCINE on the Field of Visual Analytics
Abstract
In 2004, the US Department of Homeland Security chartered the National Visualization and Analytics Center and charged them with defining the directions and priorities for future research and development programs focused on technology and tools for intelligence analysts and emergency responders [1]. Now, over a decade later, visual analytics is a thriving sub-discipline within computer science focused on the intersection of computer graphics, human-computer interaction, machine learning and cognition. In this report, we discuss the growth of visual analytics as a field, providing a retrospective on the 14-year history of visual analytics. Specifically, we focus on the impacts of DHS funded research through their Center of Excellence program, which established the Visual Analytics for Command, Control, and Interoperability Environments (VACCINE) Center in 2008. Here, we present a retrospective analysis of the impact that VACCINE and DHS has had on the growth and direction of the science of visual analytics. A qualitative impact analysis on the topics and themes in the conference is performed to explore how the publications from VACCINE affiliated scientists have influenced the shape and direction of the community. This report then concludes with a discussion of the educational activities associated with the VACCINE center and describes how these activities have led to the development of the next generation of technology and research scientists in the community.
Keywords: visual analytics, Department of Homeland Security, VACCINE
Figure 1: The Regional Visual Analytics Centers - 2006

Executive Summary of the Impact of VACCINE
21
I. The Outgrowth of Visual Analytics
In 2004, the Department of Homeland Security (DHS) established the National Visual Analytics Center (NVAC) at the Pacific Northwest National Laboratory to provide scientific guidance and coordination for the research and development of new tools and methods that DHS had identified as required for managing, visually representing and analyzing enormous amounts of diverse data and information. The goal was to develop visualization tools and analytic capabilites that can facilitate the application of human judgement to large complex data and enable action. that are designed to enable analysts to more effectively identify signs of terrorist attacks in their earliest stages and ultimately to prevent terrorist plots before they occur.
During the establishment of the NVAC, a panel of research leaders from academia, industry, government, and the national laboratory system developed a five year research and development agenda for the field of visual analytics [1]. From this research agenda, visual analytics is defined as “the science of analytical reasoning supported by interactive visual interfaces.” Where the science of visual analytics is meant to “enable analysts of all types to overcome information overload so that they can detect the expected and discover the unexpected from massive, dynamic, conflicting, and incomplete information while rigorously adhering to privacy and security laws and policies” [1].
To address the proposed visual analytics research agenda, DHS and NVAC began establishing a network of partner universities in order to develop technology to turn data into actionable information for the homeland security enterprise (HSE) and train the next generation of scientists with skills relevant to problems in the homeland security domain. This network of centers (Figure 1) consisted of Stanford Unversity (led by Pat Hanrahan), Purdue University (led by David Ebert),
Pennsylvania State University (led by Alan MacEachren), University of Washington (led by Tom Furness), Georgia Institute of Technology (led by John Stasko), and the University of North Carolina – Charlotte (led by William Ribarsky). As the university research matured, the Department of Homeland Security competed and established a Center of Excellence in Visual and Data Analytics in 2009 as a spin-off of the Regional Visual Analytics Centers begun in 2005.
Established in July of 2009, the Visual Analytics for Command, Control, and Interoperability Environments Center (VACCINE), is the Department of Homeland Security’s (DHS) Center of Excellence in Visual and Data Analytics. VACCINE’s mission
Figure 2: The VACCINE Partner Network (2017)

Executive Summary of the Impact of VACCINE
22
focus is on creating methods, tools, and applications to analyze and manage vast amounts of information for all mission areas of homeland security in the most efficient manner. The center was developed to span the disciplines of visualization and computer graphics, engineering, computer science, geographic information systems, cognitive psychology, information technology, and emergency management and public safety. In order to span such a broad set of disciplines, VACCINE developed a network of partner universities with 27 universities both domestic and international aimed at turning massive data into actionable knowledge through innovative visual analytics techniques (Figure 2). Investment by DHS in the science of visual analytics spurred international funding, and VACCINE was instrumental in the establishment of the United Kingdom Visual Analytics Center (UKVAC) and the Canadian Visual Analytics Center (CANVAC).
To date, the VACCINE center has focused on developing cutting-edge research focused on real-world problems. In this report, we present a retrospective analysis of the impact that VACCINE and DHS has had on the growth and direction of the science of visual analytics. This report provides a detailed analysis of the trends and publications in VACCINE from its inception to present day. Topics and themes in the VAST conference are analyzed, and discussions on technology transition and education are provided to further contextualize the impact of VACCINE.
II. IEEE Visual Analytics Science and Technology Conference (2006 – present)
The IEEE Symposium on Visual Analytics Science and Technology (VAST) was established within what is now IEEE VIS in 2006, and was founded by researchers from VACCINE, NVAC, and their European partners. Since its inception, IEEE VAST has grown from a symposium to one of the three major tracks of IEEE VIS and serves as the premiere venue for visual analytics research papers with over 170 submissions in 2017. The growth of the conference is shown in Figure 3, where we can see that the number of
yearly submissions has nearly tripled over the course of 10 years. In this section, we will describe the evolution of research trends and topics over time, their relevance to the homeland security mission, and the role that VACCINE affiliated researchers have taken in shaping the conference.
II.1 Topics and Trends
In order to explore the prevalent topics in visual analytics, we performed a qualitative
analysis of session topics in IEEE VAST from 2006-2016. Results of this analysis are
presented in Figure 4. Each column in Figure 4 represents one year of the IEEE VAST
conference, where each larger colored box represents a conference session (typically
consisting of 4-5 paper presentations). Since sessions (in general) attempt to group
papers with similar topics, we performed an analysis of session names (provided as text
Figure 3: Submissions to IEEE VAST by Year

Executive Summary of the Impact of VACCINE
23
in each colored box) and their corresponding papers. We grouped sessions with similar
themes together to create our color-coded categorization. Of the 78 conference sessions
from 2006 – 2016, we identified 11 different categories.
Red – Spatial and Temporal Visual Analytics
Spatiotemporal analysis was the only topic found to exist across all years of the
conference. Papers in this topic typically focus on geographic data with underlying
temporal attributes. Sample data has ranged from public health records to criminal
incident reports to taxi trajectory data.
This perennial topic is often a focus of the VAST challenge, where synthetic datasets
tracking users in buildings and amusement parks conceal hidden agendas. This topic
has been further bolstered by emerging technologies and high-resolution geographic
data (e.g., GPS traces) that have become publically available (e.g., the New York City
taxicab data). Recently, emerging trends in smart cities, resiliency and disaster
management have also paved the way for new research in this sub-domain.
Researchers from VACCINE have made a variety of contributions to this field. As we can
see that in the early years of IEEE VAST, researchers from VACCINE continuously
published four papers per session from 2006 to 2008 [18, 19, 20, 21] and two following
publications in 2011 [22, 23]. These publications have a high citation count indicating a
strong impact on the development of future research in spatiotemporal visual analytics.
Figure 4: Classifying VAST Sessions by Topic (2006 - 2016). Each column represents one year of IEEE VAST. Each larger colored box represents one session in the conference. The small black-and-white squares in each session box represent an individual paper in the
session. If a paper box is black, this indicates this paper was the result of direct funding from DHS. Six different paper session categories were identified during the analysis and are described in Section 2.1.

Executive Summary of the Impact of VACCINE
24
Blue – Sensemaking
Sensemaking has been another perennial favorite in VAST, appearing as a topic in all
but one year of the conference. At its core, visual analytics has been heavily focused on
supporting analysts in discovering knowledge, and discussions focus on how to generate
and quantify insights. Topics include modeling users in the loop to identify personality
factors that may influence analysis, methods for priming users to understand
visualizations, and provenance analysis to identify analysis strategies of users. Papers in
these sessions range from user studies describing tool usage, to theoretical models of
sensemaking in visual analytics.
Research from VACCINE has delved into large-scale and multidimensional data analysis
[2], collaborative and cognitive explorations [3, 4, 5], decision-making support [6] and
evaluations for sensemaking assessment [7, 8]. These works covers both fundamental
research that builds conceptual models of sensemaking and also applications of
sensemaking that target domains from financial analysis [24] to geo-historical analysis
[25].
Green – Multivariate Analysis
Multivariate analysis was a consistent topic in VAST from 2006 – 2013, with papers in
this area focusing on multivariate data and methods for representation and analysis.
While this topic has dwindled in popularity in recent years, it has been replaced with the
introduction of machine learning techniques (the yellow category). This is likely due to
the rise of machine learning algorithms becoming widespread via Python and R. In
addition, data boom in recent years actually has forced the analysis in many topics to
embrace multivariate analysis.
While multivariate analysis appears to not be a core topic of VACCINE researchers,
techniques from VACCINE researchers appear in other categories that are related to
multivariate analysis. Multivariate visual analytics from VACCINE has focus on applying
techniques into many other topics, such as textual data analysis and geospatial analysis.
Purple - Graph and Network Analysis and Visualization
Methods for graph analysis and visualization appear frequently throughout the years in
VAST, returning to prominence every few years. This research is often driven by large-
scale social network data and data has been supported through synthetic datasets in the
VAST challenge. It includes analyzing physical networks, for example, road networks
[9], and social networks and integrating with other analysis approaches for pattern
analysis [26].
Research in VACCINE has ranged from traffic network analysis [9] to design principles
on graph visualization [10] to applications on tabular data [11], and VACCINE research
has been present in all of the sessions in the graph and network analysis and
visualization category except for 2015 [9, 10, 11, 27].

Executive Summary of the Impact of VACCINE
25
Orange – Text and Media Analytics
Another popular topic appearing almost yearly, is text and media analytics, which has
surged in popularity due to new research in digital humanities and the digitization of
large repositories of media and short blogs and social media (e.g, Twitter). Digitization
and machine learning models provide researchers with access to automated and
intelligent analysis for exploring text data. Popular models that have been developed
and used in text and media visual analytics include topic modeling, information retrieval
(e.g., document query and entity extraction), anomaly detection, etc. Results from these
models have been visualized for corpus summarization, theme (and sentiment and
attitude) discourse analysis, and storytelling with timeline and annotation.
Research in VACCINE has seven publications in this topic (based on the session
categories). Work from 2007 focused on analyzing news media [12, 13]. In 2012, one
VACCINE paper broke ground in text and media visual analytics by supporting event
identification, considering lags between events and topics for relationship analysis, and
linking media text to geospatial locations [14]. This work influenced the visualization
community, and many text visual analytics researches began including more temporal
analysis through topic models, intervention models, time series models, and other
machine learning algorithms.
Yellow – Machine Learning Methods in Visual Analytics
Visual analytics was defined (partly) as the science of integrating machine intelligence
and human intelligence, and visual analytics methods have focused not only on the
integration of machine learning approaches to improve knowledge discovery, but also
on methods for helping machine learning researchers understand their models. These
topics have seen a larger outgrowth in the visual analytics community as machine
learning methods have become more ubiquitous in the era of big data. Research work in
this topic has more recently focused on machine learning models with the goal of
explaining the model rational, supporting interactive adjustment of the modeling
process, and integrating human efforts and model outputs for decision-making.
Grey – Applications
Visualization has been served as an effective way to bridge data analysis and domain
experts for application-driven problems. These problems could have domain specific
requirements that characterize the implementation of the visual analytics framework.
Visual analytics approaches have contributed to a wide range of applications, such as
healthcare, economics, life science, manufacturing, and education. The conference has

Executive Summary of the Impact of VACCINE
26
seen an increasing amount of application-
based visual analytics works that
demonstrates the importance of visualization
across domains. Research in VACCINE has
also reached out to many application-based
works, especially in emergency response and
security [17]. Key domain applications from
VACCINE have included healthcare [28],
criminal analysis [29], and Coast Guard
search and rescue [16].
II.2 VACCINE Impact in VAST
In order to define the impact of VACCINE on
the field of visual analytics, we have analyzed
the conference with respect to VACCINE
publications per year (Figure 5). The first bar
chart in Figure 5 shows the percentage of
VACCINE associated VAST papers in all
VAST paper publication over 2006 to 2016.
The average percentage is about 35.8%, with 24% being the minimum and 46% being
the maximum. The second stacked bar chart shows the distribution of the number of
VACCINE associated VAST papers (dark purple) and non-VACCINE VAST papers (light
purple). Here, we find that VACCINE research has been one of the major underlying
drivers of the conference, accounting for upwards of 46% of the publications in this
venue in a given year.
II.3 Awards and Recognition
Another measure of impact is the awards and recognitions that VACCINE researchers
have achieved over the years. Of these awards, the most prestigious is the IEEE VGTC
technical achievement award. VACCINE has supported two researchers (whose
technical achievement awards were directly related to their VACCINE research). These
two researchers are David Ebert (VACCINE Director) and John Stasko.
The 2016 Visualization Technical Achievement Award went to David Ebert in
recognition of his foundational work in visual analytics, both through the development
of fundamental predictive techniques and as Director of VACCINE. The 2012
Visualization Technical Achievement Award went to John Stasko in recognition of his
seminal achievements in new visualization techniques and for the Jigsaw system which
allows understanding large document collections [17].
More recently, the visualization community has create a Test of Time Award as an
accolade given to recognize articles published at previous conferences whose contents
are still vibrant and useful today and have had a major impact and influence within and
beyond the visualization community. The 2017 VAST Test of Time Award was again the
Figure 5: (Top) VAST Papers categorize by VACCINE or non-VACCINE publication. (Bottom) Percent of VAST papers associated with VACCINE by year.

Executive Summary of the Impact of VACCINE
27
Jigsaw System. The award described Jigsaw as a visual analytics system, developed by
the Georgia Institute of Technology, for enabling analysts and researchers to explore,
analyze, and make sense of document collections. This 2007 VAST paper, co-authored
by John Stasko, Carsten Görg, Zhicheng Liu, and Kanupriya Singhal, brought Jigsaw to
light for the first time. Since then, the software has been used extensively by
investigators, analysts, and researchers in many fields, including visualization, text
analysis, journalism, law enforcement, finance, and so on According to Google Scholar,
the paper has received over 400 citations. While a number of papers published in IEEE
VAST 2007 have made significant impact because of their novel scientific contributions,
this VAST paper on Jigsaw stands the test of the time with the highest impact.
Along with the technical achievement awards, a variety of VACCINE researchers have
participated in the annual VAST challenge. This is an annual contest with the goal of
advancing the field of visual analytics through competition. The VAST Challenge is
designed to help researchers understand how their software would be used in a novel
analytic task and determine if their data transformations, visualizations, and
interactions would be beneficial for particular analytic tasks. VAST Challenge problems
provide researchers with realistic tasks and data sets for evaluating their software, as
well as an opportunity to advance the field by solving more complex problems.
Researchers and software providers have repeatedly used the data sets from throughout
the life of the VAST Challenge as benchmarks to demonstrate and test the capabilities of
their systems. The ground truth embedded in the data sets has helped researchers
evaluate and strengthen the utility of their visualizations. With over a decade of contest
awards, VACCINE researchers have been involved in over 27 award winning
submissions.
III. VACCINE Education and Outreach
While VACCINE has been a driving force in the field of visual analytics, another broad
impact of the center has been its educational mission. VACCINE's mission is to educate
current homeland security stakeholders and the next generation of talent in effective
development and use of visual analytics systems. The educational initiatives span the
career development pipeline ranging from undergraduate and graduate level work to
professional education and training programs. The goal is to build a diverse, highly
capable, technical workforce for the Department of Homeland Security enterprise by
administering various programs and initiatives at our center, partner research
institutions, and minority-serving institutions.
Education and outreach initiatives from VACCINE have led to the worldwide
development of visual analytic. VACCINE partners/collaborators started the European
Union Visual Analytics Consortium and led visual analytics courses through the
CANVAC summer program and the UKVAC summer program. These collaborations
have led to the creation of the EuroVA symposium, Pacific VAST, and a variety of other
publication venues capitalizing on the success of visual analytics. More recently, the

Executive Summary of the Impact of VACCINE
28
VACCINE consoritum has also begun publishing book series and other initiatives for
education and outreach.
III.1 Next Generation Scientists
From this focus on education, VACCINE has trained a large cadre of next generation
scientists in the field of visual analytics. Previous VACCINE-affiliated graduates are now
faculty members at a variety of Reseach-1 Universities across the country. These
students include:
Carsten Gorg (University of Colorado – Denver)
Anthony Robinson (Pennsylvania State University)
Chris Weaver (University of Oklahoma)
Robert Roth (University of Wisonsin)
Remco Chang (Tufts University)
Ross Maciejewski (Arizona State University)
Wenwen Dou (University of North Carolina – Charlotte)
Sungahn Ko (Ulsan National Institute of Science & Technology, South Korea)
Victor Chen (Purdue University)
Yun Jang (Sejong University, South Korea)
Among these young researchers, there are three NSF Career Award Winners (Chang,
Maciejewski, Weaver), and Ross Maciejewski was recently chosen to lead the newest
Department of Homeland Security Center of Excellence (Center for Accelerating
Operational Efficiency).
Along with young researchers in academia, VACCINE has also focused on
undergraduate education as well. To date, VACCINE has hosted over 40 summer
undergraduate research fellows since 2007 and over 30 minority serving institution
(MSI) undergraduate participants. VACCINE has further supported education by
providing training programs to expand the teaching of visual analytics in MSIs.
III.2 Startups and Companies
Along with success in academia, research from VACCINE has also led to a variety of
startups including Davista Technologies (led by Abish Malik) and Stratifyd Inc. (led by
Derek Wang). Davista Technologies specializes in the field of visual analytics with a
focus on spatiotemporal analytics. This company has spun out of the VACCINE work on
criminal investigative analysis. Stratifyd Inc.’s focus is on a data analytics platform that
allows users to integrate, analyze, and visualize data in a single platform, empowering
analysts through a holistic view of both structured and unstructured data. This company
spun out of the work on social media analytics to help analysts explore unstructured
text.
Some of the most significant tools developed by VACCINE include:
SMART (Social Media Analytics and Reporting Toolkit), a social media analytics
tool that provides actionable information, was deployed at many special events

Executive Summary of the Impact of VACCINE
29
such as the 2017 Presidential Inauguration by Homeland Security components,
and commercialized by Davista.
VALET (Visual Analytics Law Enforcement Toolkit), an interactive interface for
crime incidents, was deployed to several law enforcement agencies and
commercialized by Davista who delivered a modified version to a commercial
customer.
cgSARVA (Coast Guard Search and Rescue Visual Analytics), an interactive system that enables analysts to assess operational efficiencies, was used successfully by the United States Coast Guard to right-size the USCG resources in the Great Lakes region. It was also used to avoid resource relocation costs following Super Storm Sandy along the eastern seaboard. It is the only DHS COE tool accredited for use by the USCG.
GARI (Gang Graffiti Automatic Recognition and Interpretation), a gang graffiti
and tattoo recognition application, won 2nd place in the 2015 NIST- FBI tattoo
recognition challenge and it is used by multiple law enforcement agencies for gang
tattoo and graffiti recognition and interpretation.
MERGE (Mobile Emergency Response Guide), an application that automatically
interprets HAZMAT placards, was deployed to several first responders groups to
quickly identify HAZMAT signs and their meaning.
JIGSAW, which acts like a visual index in a document collection that highlights
connections between entities, has been downloaded by numerous organizations in
the government and industry for document exploration and discovery.
FAVA (Financial Anomaly Visual Analytics), is designed for government
organizations to explore financial datasets and identify any potential anomalies
with the help of additional data sources that provide contextual information.
MADIS (Multimedia-Aided Disaster Information Integration System), was tested
and used by the Miami-Dade Department of Emergency Management.
GeoTxt provides a geoparsing service to extract and geolocate place references
from text that other software applications can connect to; its accuracy compared
favorably to other geoparsers in an independent evaluation by a research team
from the Language Technology Lab at Cambridge (published in Language
Resources & Evaluation).
vBOLO (Virtual “Be on the Look-out”), was piloted successfully at the Cleveland
Rapid Transit Authority to detect the re-entry of persons who had previously
committed a crime on the commuter transit system.
Executive Summary of the Impact of VACCINE
30
VASA (Visual Analytics for Security Applications), is a tool that helps analysts
estimate the impact of a severe weather event, forecasting damage, and discovering
optimal solutions. It provides scalable, situationally aware insight for
understanding the cascading effects of hurricanes on critical infrastructure for
emergency responders and city planners.
LAHVA (Linked Animal-Human Health Visual Analysis), LAHVA technology provides public health officials with a suite of visual analytic tools that supports spatio-temporal exploration of multivariate health care data sets and also helps them design epidemic response strategies in different outbreak scenarios.
Amongst these tools, the Government Accountability Office indicated that the cgSARVA
work could save the government $290M based on analysis and closing of bases.
Furthermore, the use of these tools at critical national events (e.g., SMART) underscores
the impact of the technology.
IV. Conclusion
In summary, it is difficult to directly quantify the impact of the VACCINE Center. From
all academic measures, it is clear that VACCINE was a pioneer in the area of visual
analytics, introducig 4,000+ students introduced to visual analytics while generating
300 peer reviewed journal articles, 24 patent applications, 325 conference publications
and presentations, 40+ graduate theses and 34+ comprehensive research projects.
More than seventy (75+) faculty partners from 38 institutions and 3 countries
participated in these achievements, allowing VACCINE to leave a global footprint in the
area of visual analytics.
References
[1] J. Thomas and K. A. Cook, editors. Illuminating the Path: The R&D Agenda for Visual
Analytics. IEEE Press, 2005.
[2] N. Elmqvist, J. Stasko and P. Tsigas. DataMeadow: A Visual Canvas for Analysis of Large-
Scale Multivariate Data. IEEE Symposium on Visual Analytics Science and Technology,
Sacramento, CA, 2007, pp. 187-194.
[3] D. H. Jeong, Wenwen Dou, H. R. Lipford, F. Stukes, R. Chang and W. Ribarsky. Evaluating
the relationship between user interaction and financial visual analysis. IEEE Symposium on
Visual Analytics Science and Technology, Columbus, OH, 2008, pp. 83-90.
[4] T. M. Green, W. Ribarsky and B. Fisher.
Visual analytics for complex concepts using a
human cognition model. IEEE Symposium on
Visual Analytics Science and Technology, Columbus, OH, 2008, pp. 91-98.
Figure 6: The Regional Visual Analytics Centers - 2006

Executive Summary of the Impact of VACCINE
31
[5] Y. Chen, J. Alsakran, S. Barlowe, J. Yang and Y. Zhao. Supporting effective common ground
construction in Asynchronous Collaborative Visual Analytics. IEEE Conference on Visual
Analytics Science and Technology, Providence, RI, 2011, pp. 101-110.
[6] A. Savikhin, R. Maciejewski and D. S. Ebert. Applied visual analytics for economic decision-
making. IEEE Symposium on Visual Analytics Science and Technology, Columbus, OH, 2008,
pp. 107-114.
[7] B. Tomaszewski and A. M. MacEachren. Geo-historical context support for information
foraging and sensemaking: Conceptual model, implementation, and assessment. IEEE
Symposium on Visual Analytics Science and Technology, Salt Lake City, UT, 2010, pp. 139-146.
[8] Y. a. Kang and J. Stasko. Examining the Use of a Visual Analytics System for Sensemaking
Tasks: Case Studies with Domain Experts. IEEE Transactions on Visualization and Computer
Graphics, vol. 18, no. 12, pp. 2869-2878, Dec. 2012.
[9] L. Xiao, J. Gerth and P. Hanrahan. Enhancing Visual Analysis of Network Traffic Using a
Knowledge Representation. IEEE Symposium On Visual Analytics Science And Technology,
Baltimore, MD, 2006, pp. 107-114.
[10] Y. a. Kang, C. Gorg and J. Stasko. Evaluating visual analytics systems for investigative
analysis: Deriving design principles from a case study. IEEE Symposium on Visual Analytics
Science and Technology, Atlantic City, NJ, 2009, pp. 139-146.
[11] Z. Liu, S. B. Navathe and J. T. Stasko. Network-based visual analysis of tabular data. IEEE
Conference on Visual Analytics Science and Technology, Providence, RI, 2011, pp. 41-50.
[12] H. Luo, J. Fan, J. Yang, W. Ribarsky and S. Satoh. Analyzing Large-Scale News Video
Databases to Support Knowledge Visualization and Intuitive Retrieval. IEEE Symposium on
Visual Analytics Science and Technology, Sacramento, CA, 2007, pp. 107-114.
[13] M. Ghoniem, D. Luo, J. Yang and W. Ribarsky. NewsLab: Exploratory Broadcast News
Video Analysis. IEEE Symposium on Visual Analytics Science and Technology, Sacramento, CA,
2007, pp. 123-130.
[14] W. Dou, X. Wang, D. Skau, W. Ribarsky and M. X. Zhou. LeadLine: Interactive visual
analysis of text data through event identification and exploration. IEEE Conference on Visual
Analytics Science and Technology, Seattle, WA, 2012, pp. 93-102.
[15] W. Dou, L. Yu, X. Wang, Z. Ma and W. Ribarsky. HierarchicalTopics: Visually Exploring
Large Text Collections Using Topic Hierarchies. IEEE Transactions on Visualization and
Computer Graphics, vol. 19, no. 12, pp. 2002-2011, Dec. 2013.
[16] A. Malik, R. Maciejewski, B. Maule and D. S. Ebert. A visual analytics process for maritime
resource allocation and risk assessment. IEEE Conference on Visual Analytics Science and
Technology (VAST), Providence, RI, 2011, pp. 221-230.
[17] J. Stasko, C. Gorg, Z. Liu, and K. Singal. Jigsaw: Supporting investigative analysis through
interactive visualization. Proceedings of the IEEE Symposium on Visual Analytics Science and
Technology, 2007, pp. 131–138.
[18] C. Weaver, D. Fyfe, A. Robinson, D. Holdsworth, D. Peuquet and A. M. MacEachren. Visual
Analysis of Historic Hotel Visitation Patterns. IEEE Symposium On Visual Analytics Science
And Technology, Baltimore, MD, 2006, pp. 35-42.
[19] R. Maciejewski, B. Tyner, Y. Jang, C. Zheng, R. V. Nehme, D. S. Ebert, W. S. Cleveland, M.
Ouzzani, S. J. Grannis and L. T. Glickman. LAHVA: Linked Animal-Human Health Visual
Analytics. IEEE Symposium on Visual Analytics Science and Technology, Sacramento, CA,
2007, pp. 27-34.
[20] R. Maciejewski, S. Rudolph, R. Hafen, A, Abusalah, M. Yakout, M. Ouzzani, W S. Cleveland,
S. J. Grannis, M. Wade and D. S. Ebert. Understanding syndromic hotspots - a visual analytics

Executive Summary of the Impact of VACCINE
32
approach. IEEE Symposium on Visual Analytics Science and Technology, Columbus, OH, 2008,
pp. 35-42.
[21] S. Chan, L. Xiao, J. Gerth and P. Hanrahan. Maintaining interactivity while exploring
massive time series. IEEE Symposium on Visual Analytics Science and Technology, Columbus,
OH, 2008, pp. 59-66.
[22] A. M. MacEachren, A Jaiswal, A. C. Robinson, S Pezanowski, A Savelyev, P. Mitra, X. Zhang
and J. Blanford. SensePlace2: GeoTwitter analytics support for situational awareness. IEEE
Conference on Visual Analytics Science and Technology, Providence, RI, 2011, pp. 181-190.
[23] S. Afzal, R. Maciejewski and D. S. Ebert. Visual analytics decision support environment for
epidemic modeling and response evaluation. IEEE Conference on Visual Analytics Science and
Technology, Providence, RI, 2011, pp. 191-200.
[24] D. H. Jeong, Wenwen Dou, H. R. Lipford, F. Stukes, R. Chang and W. Ribarsky. Evaluating
the relationship between user interaction and financial visual analysis. IEEE Symposium on
Visual Analytics Science and Technology, Columbus, OH, 2008, pp. 83-90.
[25] B. Tomaszewski and A. M. MacEachren. Geo-historical context support for information
foraging and sensemaking: Conceptual model, implementation, and assessment. IEEE
Symposium on Visual Analytics Science and Technology, Salt Lake City, UT, 2010, pp. 139-146.
[26] S. van den Elzen, D. Holten, J. Blaas and J. J. van Wijk. Reducing Snapshots to Points: A
Visual Analytics Approach to Dynamic Network Exploration. IEEE Transactions on
Visualization and Computer Graphics, vol. 22, no. 1, pp. 1-10, Jan. 31 2016.
[27] A. Pattath, B. Bue, Y. Jang, D. Ebert, X. Zhong, A. Ault and E. Coyle. Interactive
Visualization and Analysis of Network and Sensor Data on Mobile Devices. IEEE Symposium On
Visual Analytics Science And Technology, Baltimore, MD, 2006, pp. 83-90.
[28] A. Malik, R. Maciejewski, T. F. Collins and D. S. Ebert. Visual Analytics Law Enforcement
Toolkit. IEEE International Conference on Technologies for Homeland Security, 2010.
[29] R. Maciejewski, S. Rudolph, R. Hafen, A. Abusalah, M. Yakout, M. Ouzzani, W. S.Cleveland,
S. J. Grannis, D. S. Ebert. A Visual Analytics Approach to Understanding Spatiotemporal
Hotspots. IEEE Transactions on Visualization and Computer Graphics, 16(2): 205-220,
March/April 2010.
Ross Maciejewski1 and Yafeng Lu1 and Rolando Garcia1 and Michaela Murray1 and David Ebert2
1Arizona State University, Tempe, AZ, USA 2 Purdue Univeristy, West Lafayette, IN, USA

Highlights and Significant Achievements
33
I. Strategic Plan Initiatives
Overview In the past eight (8) years, VACCINE has developed many strategic initiatives in the pursuit of its mission to create methods and tools to analyze and manage vast amounts of information for all mission areas of homeland security. These initiatives are summarized below:
a. Strategic Initiatives
i. Developed Emergency Preparedness Tools. A number of visual analytics tools to assist first responders and emergency management planning were developed. In collaboration with VACCINE and the Miami-Dade County Department of Emergency Management, Disaster Information Technologies Research Group (DITRG) at Florida International University produced a tool known as the Multimedia Aided Disaster Information Integration System (MADIS). This tool makes it easier for emergency managers to gather relevant information by automatically linking situation reports directly to imagery obtained and uploaded by responders and the public. As a second example of Emergency Preparedness VA tools, VACCINE and UNCC created VASA – Visual Analytics for Security Applications. This system provides a visual analysis and decision-making environment for severe weather and natural disaster planning and response for several critical infrastructures. As a last example, VACCINE developed the Mobile Emergency Response Guide (MERGE). MERGE uses image analysis of HAZMAT placards to automatically obtain information that allows emergency responders to work quickly and safely in volatile environments.
ii. Created Public Health Visual Analytics Tools. Assessing
current and emerging public health threats is important for public health officials in order to make decisions regarding mitigative actions and allocation of resources. It also helps scientists understand the characteristics of syndromic diseases and improve their models. VACCINE has been researching novel visual analytics tools for Rift Valley Fever using a tool from the COE for Zoonotic and Animal Disease Defense (ZADD), incorporating epidemiological modeling as well as economic modeling and analysis. One tool created by VACCINE, Linked Animal-Human Health Visual Analytics (LAHVA) provides public health officials with a suite of visual analytic tools for spatio-temporal exploration of multivariate health care data sets in linked statistical and geospatial-temporal views. These tools provide advanced detection capabilities for adverse chemical and biological occurrences in the general populace.
iii. Created Interactive Visual Analysis and Decision Making Environments for Law Enforcement. The creation of tools like

Highlights and Significant Achievements
34
iv. VALET, Visual Analytics for Law Enforcement Toolkit, enabled police departments to map crime occurrences and plan patrol distributions. Additionally, VALET was used for analysis and presentation of high-risk alcohol behavior in the Purdue campus area. The resulting findings and analysis were integrated into educational and enforcement programs at Purdue.
v. Resource Allocation Visual Analytic Tools Saved the USCG
Millions of Dollars. The US Coast Guard needed a tool to make a credible case to Congress that the number of Coast Guard Stations on the Great Lakes was not optimized. cgSARVA helped them debate the point. VACCINE was awarded the Commander Atlantic Area’s Excellence Coin, a prestigious award presented by the US Coast Guard, in recognition of our work with District 9 in search and rescue/resource allocation. In USCG District 1, VACCINE was recognized for its participation in the PROTECT project along with the Center for Risk and Economic Analysis of Terrorism Events. In a second instance, cgSARVA enabled the USCG LANT Command to analyze the resource requirements along the northeastern seaboard following Super Storm Sandy in October 2012. The result of this analysis was a significantly reduced resource “surge” response that saved the USCG millions of dollars. Not only did cgSARVA provide operational support to the USCG staff, but also it was first time in COE history that a tool produced by one of the DHS Centers of Excellence has been accredited by the USCG.
vi. Developed Fraud Detection Financial Visualization Tools. UNCC partner, Dr. William Ribarsky, developed RiskVA which applied risk analytics to large and multi-faceted financial resources, such as at a major bank or under the jurisdiction of a major government agency. Methods were developed to determine risk and possibility of fraud by examining the data and looking for trends and events in multiple different types of data, including unstructured data. RiskVA was successfully vetted by senior management at Bank of America and is starting to be used by analysts in the bank. It is the first step in a rich set of financial visual analytics tools. Separate from RiskVA, in 2013, VACCINE was awarded a $500,000 grant to explore financial data and predictive financial visual analytics by a U.S. government agency.
vii. Created a Public Safety Consortium. VACCINE formed a multi-agency public safety consortium in Indiana to develop tools for crime analysis, law enforcement planning, and decision making. This consortium expanded to an international network of VA researchers, and helped launch the Canadian VA Center (CANVAC) and the United Kingdom VA Center (UKVAC).

Highlights and Significant Achievements
35
viii. Provided Intellectual Leadership for the Field of Visual Analytics. VACCINE was a pioneer in the area of VA for eight (8) years, producing; 300 peer reviewed journal articles, 24 patent applications filed or awarded, 325 conference publications and presentations, 40+ graduate theses and 34+ comprehensive research projects. More than seventy (75+) faculty partners from 38 institutions and 3 countries accomplished these achievements. Not only did VACCINE create a multitude of VA academic documents, they also created the “gold standard” curriculum/course in VA. Additionally, VACCINE led a series of workshops on VA that highlighted new directions and challenge areas in a range of areas such as personal VA, financial VA, public policy VA, and science of interaction for VA.
ix. Led Efforts To Expand Inclusiveness in Visual Analytics.
During the life of the Center, Visual Analytics (VA) workshops for faculty members were conducted to introduce VA to faculty members and help them incorporate VA into their course curriculum. These workshops were conducted at Minority Serving Institutions (MSIs) and service academies. Additionally, each summer, students from Morgan State University, a HBCU, participated in a one-week “boot camp” in visual analytics to familiarize them with the field of study and create interest in a career in the Homeland Security Enterprise (HSE). As an outreach to Native Americans, VACCINE established a partnership with Navajo Tech College, an organization that experimented with GARI. More broadly, VACCINE participated in the Summer Undergraduate Research Fellowship (SURF). SURF Fellowships attracted a diverse group of undergraduates who were exposed to HSE VA projects.
x. Expanded Partnerships to Include European and US Allied
Universities. As mentioned in paragraph one (1), VACCINE expanded the Public Safety Consortium to international universities such as the University of Stuttgart, eight Canadian institutes of higher learning, and from the United Kingdom - Oxford and Swansea University. Some of these international partners became collaborators for specific VACCINE tools. For example, the Principal Investigator from the University of Stuttgart was integral to the development of SMART.
xi. Established a Non-Profit and for-Profit Entity. The Purdue
Research Foundation, PRF, created VACCINE, LLC, to accept and disburse charitable gifts to further the goals and purposes of PRF and Purdue by supporting the VACCINE Center, and for related purposes. Additionally, a for-profit entity, Davista Technologies LLC, was established by several members of VACCINE to provide a commercial vehicle to transition VACCINE tools/technologies to the

Highlights and Significant Achievements
36
xii. market place. Davista obtained an exclusive license from PRF for two tools that were created in the VACCINE Center, VALET and SMART.
b. Stakeholder Outreach That Influenced the Strategic Plan
VACCINE employed an approach to the development of tools and technologies that focused on meeting HSE end-user requirements. As a result, the stakeholders influenced many decisions regarding our work. Some of the decisions that resulted in changes to the strategic plan are listed below.
i. Creation of a For-Profit Entity. (Strategic Initiative #2) The desire of DHS S&T OUP to transition VACCINE tools and technology to the private marketplace resulted in the creation of a for-profit entity, Davista Technologies, LLC. DHS provided the R&D funding, in the form of an award to VACCINE, so that the technology could benefit the public HSE, but they also wanted the technology to be widely used in the HSE private marketplace to result in the biggest impact on homeland security. Davista was able to purchase an exclusive licensing agreement from the Purdue Research Foundation for SMART and VALET at a very low cost and sell those tools in the private marketplace. To date, Davista has signed one contract with a commercial company to use a derivative of VALET for shopping mall security.
ii. Expanded Interactive Visual Analysis and Decision Making
Environments for Law Enforcement. (Strategic Initiative #8) The Lafayette Police Chief significantly influenced visual analysis and decision making for law enforcement as his patrolmen experimented with VALET. VALET started as a tool to map crime incidents with several interactive filtering features, but with the input of the Lafayette PD, it grew from a desktop tool to iVALET which is a mobile version. The police chief was also interested in the performance of officers resulting in the development of a feature that links officer performance on each crime incident to which they responded.
iii. Resource Allocation Visual Analytic Tools Saved the USCG Millions of Dollars. (Strategic Initiative #9) The development of cgSARVA was greatly influenced by the operational and strategic priorities of the US Coast Guard. The Coast Guard was wasting assets on the Great Lakes, but they did not have a credible tool to analyze and present their argument to Congress. cgSARVA and the features added at the request of the USCG helped them make their case. The success of cgSARVA on the Great Lakes data resulted

Highlights and Significant Achievements
37
in the request to analyze the northeastern seaboard USCG predicted response requirements following super storm Sandy. Following the use of cgSARVA on these two significant Coast Guard issues, the tool was further improved so that it could meet the USCG IT standards and pass the software validation and evaluation requirements.
II. Significant Transition Successes Two technologies created by VACCINE, VALET and SMART, were licensed by Purdue in 2015 to be used exclusively by Davista Technologies, LLC. Davista is a start-up company that was created by members of VACCINE who were integral to the development of the technologies. Another six technologies were delivered to end users, but were not licensed to a private entity. These tools are GARI, Jigsaw, cgSARVA, MERGE, MADIS, and GeoTxt. Each of these tools was deployed to various entities and will be discussed below.
a. Licensed Tools i. Visual Analytics Law Enforcement Toolkit (VALET) The lead
developer was Dr. Ross Maciejewski of Arizona State University while he was working in the VACCINE lab at Purdue University. VALET technology provides law enforcement agencies with a suite of tools that allows for the spatiotemporal exploration of multivariate data sets and police records. These tools provide advanced analytic capabilities that allow officers to develop and test hypotheses about law enforcement activities within various areas of their communities.
VALET was deployed at the Lafayette, Jeffersonville and Evansville Police
Departments. Further, the Indianapolis Police Department, Tippecanoe County
Sheriff’s Office, Ohio State Highway Patrol, Illinois State Police, and New York
Police Department have used VALET. As the predictive analytics component of the
software continues to improve, input and feedback continues to be received to
make adjustments to the technology in order to optimize it for use in the field. One
of those modifications is the development of the Officer Performance/MetricVis

Highlights and Significant Achievements
38
solution that displays the performance of police officers in Lafayette Police
Department. The intention of this feature is to provide a tool for officer
performance comparison and motivating maximized performance. The mobile
version of VALET (iVALET) continues to be a popular option for law enforcement
officers depending upon their roles and responsibilities. VALET has been utilized
to devise novel data guided patrolling strategies and has led to a paradigm
operational shift at several police departments. VALET has also supported
investigative analysis tasks at the departments who utilize the system. For
example, the system played a critical part in the investigation of a string of business
burglaries by the Evansville police department.
In keeping with the goal of transitioning this software, Purdue Research
Foundation has licensed the technology to a startup company, Davista
Technologies, LLC, which was born out of the VACCINE center. Davista is
developing a sustainable transition model in order to continue the development
and commercialization efforts of the technology. The company is also currently
engaged in developing a data driven solution for a large private corporate firm for
optimally allocating their safety and security related resources. Davista is
leveraging the core VALET technology in the development of this solution.
b. Social Media Analytics and Reporting Toolkit (SMART) The lead
developer was Dr. David Ebert of Purdue University. The system provides users
with scalable and interactive social media data (e.g., Twitter, Instagram)
analysis and visualization, which includes real-time monitoring of social media
channels, extraction of trending and abnormal topics, interactive geospatial
and temporal visualizations, and task-tailored message categorization and
dynamic filtering tools. In addition, web and news media sources are
incorporated in the system so that users can search and correlate news articles
of interest with social media posts. The system enables users to perform their
exploration and analysis across a range of data scales from local (e.g., precinct,
neighborhood) to global (e.g., city, state). In addition, SMART incorporates
novel visual analytic techniques to extract and visualize crowd movement
patterns and trajectories using social media data in order to allow users to
detect anomalies and outlier patterns. SMART also provides an email
alert/summary service to automatically send emails related to user defined
topics. The system provides such functionalities through not only a desktop
application, but also a highly interactive and accessible web interface.

Highlights and Significant Achievements
39
SMART has been actively used by several local, state, and federal HSE organizations,
including the US Coast Guard, US Customs and Border Protection (CBP), and US
Citizenship and Immigration Services (USCIS). The US Coast Guard has utilized SMART
to maintain situational awareness during several significant events (e.g. Fleet Week,
Cincinnati Riverfest, Thunder-Over-Louisville, 2017 Presidential Inauguration and
Presidential Address to a Joint Session of Congress). The Purdue University police and
Ohio State Department of Homeland Security have utilized SMART during their home
football games and have been able to obtain actionable information to thwart potential
safety and security related incidents using the system. Additionally, SMART was deployed
at the joint Canadian-US Enhanced Resiliency Experiment (CAUSE) organized by the US
DHS S&T Directorate and the Defence Research and Development Canada’s Centre for
Security Science (DRDC CSS). The system was utilized to provide a shared situational
awareness during the binational exercise. Moreover, SMART has been used to support
the investigative analysis of hoax distress calls by Coast Guard analysts in order to utilize
social media data as another source of information. This analysis was driven by
approximate locational information obtained from the Rescue 21 system. Finally, the
SMART system was utilized by over 12 law enforcement agencies and first responder
groups at the Republican National Convention held in Cleveland in July 2016 in order to
provide actionable intelligence and early warning indicators of potential demonstrations
and acts of violence during the event.
SMART has also been licensed to Davista Technologies. Davista is actively seeking
partnerships with commercial corporations to further refine their market
penetration strategy with the technology.
An example
screenshot of the
SMART
software suite
displaying social
media feeds
during Hurricane
Sandy.

Highlights and Significant Achievements
40
c. Unlicensed Tools Deployed to End-Users
As mentioned in the opening paragraph, six tools/technologies have been delivered to
various end users. These six technologies are listed below.
i. Coast Guard Search and Rescue Visual Analytics
(cgSARVA) The lead developer was Dr. David Ebert of Purdue
University. cgSARVA is a vital component for analyzing and
assessing operational efficiencies of different Coast Guard missions
across the United States. The system aids with the risk assessment of
potential resourcing changes. The analyst is able to understand the
distribution of incidents, the risks, and the benefits involved with the
reallocation or reduction of resources. The cgSARVA system features
include linked calendar and line graph views for analyzing data
patterns and distributions. It also includes interactive filter controls
for assessing case distribution loads and locations, as well as density
estimation for hotspot generation, linked time slider controls for
interactive temporal animation and exploration, and interactive
statistical summary tools for report generation.
cgSARVA is deployed and in use by the United States Coast Guard.
cgSARVA was used successfully by the United States Coast Guard to
right-size the USCG resources in the Great Lakes region, and it was
used to avoid resource relocation costs following Super Storm Sandy
along the eastern seaboard. It is the first DHS COE tool accredited
for use by the USCG.
ii. Gang Graffiti Automatic Recognition and Interpretation
(GARI) The lead developer was Dr. Edward Delp of Purdue
University. GARI is a cell-phone and desktop based tool for gang
graffiti and tattoo analysis and recognition. GARI uses image
analysis techniques to identify, interpret and index gang graffiti and
tattoos. The tool also uses metadata such as geoposition, date and
time. Users can send images, retrieve and browse the database, and

Highlights and Significant Achievements
41
find similar graffiti/tattoos. This tattoo identification system earned a
second place finish in the NIST/FBI TATT-C challenge in 2015.
GARI was deployed to the Indianapolis Metropolitan Police, Indiana Intelligence
Fusion Center Gang Task Force, INGang program, Cook County Sherriff’s
Department, Navajo Nation, and the Illinois State Police. Additionally, a number
of other law enforcement entities (approximately 400) have expressed interest in
using and deploying the tool. A community version is available that functions in
the same way, but only allows the user to report graffiti and does not make any
information visible to the individual uploading and reporting the graffiti image.
The law enforcement version of GARI has servers installed at the Indiana
Intelligence Fusion Center in Indianapolis and the Cook Country Sherriff’s
Department in Chicago. There are currently 227 users of the system in
Indianapolis, and 114 within Cook County and 17 users in Stockton, CA.
iii. Mobile Emergency Response Guide (MERGE) The lead
developer was Dr. Edward Delp of Purdue University. The MERGE
system is an electronic version of the Emergency Response
Guidebook used by public safety personnel throughout the nation.
Hazardous materials can react differently to stimuli and can cause
problems in accidents and emergency situations. This fact makes
them particularly dangerous to civilians and first responders. It is for
this reason that the Emergency Response Guidebook (ERG) was
developed. The ERG is a ready reference to those in an emergency
with the knowledge of how to handle hazardous materials. As one
might expect, the guidebook is large and requires precious time to
search an index to determine the best way to handle a particular
hazardous material. The MERGE system is an electronic version of
the Emergency Response Guidebook with many features and
capabilities. These new capabilities include the use of image analysis
methods to automatically determine the type of hazardous materials

Highlights and Significant Achievements
42
present based on an image taken of the sign/placard. MERGE has an
easy to understand user interface to instruct an emergency responder
or civilian in the proper way to handle a hazardous material
emergency.
MERGE has been deployed to several first responder groups and it has received
very positive responses from our targeted user groups which include the Lafayette,
West Lafayette, Indianapolis, and St. Clair, MI Fire Departments. MERGE was
recently demonstrated to a manufacturer of detection sensors, who is interested in
licensing the MERGE source code.
iv. Jigsaw: Visual Analytics for Exploring and Understanding
Document Collections The lead developer was Dr. John Stasko of
the Georgia Institute of Technology. Jigsaw is a visual analytics
system developed to help investigators who routinely perform
analysis that involves large collections of documents, and in
particular, textual documents such as case reports, news articles, or
suspicious activity reports. Investigators may seek to investigate an
individual or incident, or they may simply be exploring with hopes to
discover stories, narratives, or threats that may be embedded across
the document collection. In one actual case, a fraud investigator in
Kuala Lumpur, Malaysia reported that it was used to help resolve a
$1.5 million fraud case. The system acts like a visual index in a
document collection, highlighting connections between entities and
allowing the investigator to understand the context of events in a
more timely and accurate manner. Jigsaw helps analysts "put the
pieces together" and link initially unconnected activities into a more
coherent story.

Highlights and Significant Achievements
43
Jigsaw has been used by the Indianapolis Police Department, West Lafayette
Police Department, Rock Hill Police Department (SC), and the Lafayette Police
Department. The system is available for free download at
http://www.cc.gatech.edu/gvu/ii/jigsaw. The default baseline version of the
system is a Java-based desktop application. Recently, the research team also
created a web-based version available at http://iilabgt.org/webjigsaw. There have
been approximately 8000 downloads of the Jigsaw system in its history. It is being
used in various university classes on visual analytics and intelligence analysis, and
has been downloaded by a wide variety of organizations in government and
industry. Examples of organizations that have downloaded Jigsaw are Air Force
Intelligence, AFRL Wright Patterson, Army Counterintelligence, Boeing, Deloitte,
Naval Research Lab, National Crime Information Center, PayPal, Thomson
Reuters, United Nations Investigators Office, US Attorney’s Office Organized
Crime Taskforce, as well as numerous newspapers and police departments.
v. Multimedia-Aided Disaster Information Integration
System (MADIS) The lead developer was Dr. Shu-Ching Chen of
Florida International University. Thanks to the availability of mobile
devices, emergency responders, supporting agencies and even
private citizens can capture imagery of disaster events as they unfold.
Once the crisis is contained, however, it’s a daunting task for
emergency managers to collect, organize and integrate disaster event
data from multiple sources into incidence command systems where
situation reports, incidence action plans, etc. are being held. MADIS
uses advanced data integration and visual analysis techniques to

Highlights and Significant Achievements
44
associate temporal, spatial and other textual features of a disaster
event situation report with event images and related text annotations.
This system can greatly help decision makers and emergency
managers in the area to gain insight into the actual disaster situation
and make quick decisions. In 2016-2017, a new component for the
searching and retrieval of disaster videos that enables the system to
retrieve both videos and images relevant to a specific disaster was
added to the MADIS system. Moreover, situation reports which are
uploaded by users will be automatically converted to the PDF format
and highlighted with the defined keywords. Collaborating end-users
are Federal Emergency Management Agency, Transportation Security
Administration, Coast Guard, local law enforcement, and fire.
vi. GeoTxt The lead developer was Dr. Alan MacEachren of
Pennsylvania State University. GeoTxt is a web service that enables
the geolocation of places, people, and organizations described in
common status updates from online social networks, as well as from
other text sources such as news stories, status reports, and blog
posts. It uses techniques from a wide array of research areas –
applied linguistics, natural language, processing, search engine
optimization, and geographic information science – to parse out
places, people, and events explicitly or implicitly mentioned in text
(e.g., in Twitter) and then to analyze and contextualize these entities
to locate them in geographic space. The API is designed to be
integrated into the development of dynamic, map-based, visual
analytical interfaces, specifically in the context of crisis management
and emergency response. GeoTxt also supports an associated visual
web interface that enables users to extract and locate place references

Highlights and Significant Achievements
45
vii. from individual documents submitted to the interface and to provide
feedback to the system on result accuracy. The focus of work has been
on building visual analytics methods and tools that support
geoparsing corpus construction, application of those methods and
tools to building a corpus of geoparsed tweets, and use of that corpus
to train and text GeoTxt capabilities for geoparsing streaming tweets
related to crisis and other events.
GeoTxt partnered with Parus Analytics (http://parusanalytics.com/), can provide
geographic entity recognition, geographic disambiguation, and geo-coordinates
for place references in news stories. Parsus Analytics is developing a new global
event data set (PHOENIX), focused on political and related events (details at:
http://openeventdata.org/datasets/phoenix/Phoenix.documentation.pdf).
GeoTxt has been integrated as the backend geographic entity recognition,
disambiguation, and co-coding systems to support SensePlace 2, our spatial-
temporal twitter analytics environment. The early stages of SensePlace 2 (and its
precursor SensePlace) were funded through VACCINE. Current support comes
from the U.S.Army Corps of Engineers, with a focus on supporting analysis of the
geographic and social components of crises and other events globally. GeoTxt is
now fully integrated into the dataflow pipeline of SensePlace 3 to support space-
time analysis of microblog posts about natural disasters and other events relevant
to security. As noted above, development for SensePlace 2, was initiated with DHS
support, then subsequent work including the next phase as SensePlace 3 was
supported by the U.S. Army Corps of Engineers.

Highlights and Significant Achievements
46
III. Commercialized COE Outputs
Two prominent VACCINE technologies, VALET and SMART, were licensed by Purdue in 2015 for exclusive use by Davista Technologies, LLC, a start-up company created by members of VACCINE who were integral to the development of the technologies.
a. Visual Analytics Law Enforcement Toolkit (VALET) (Figure 1) is actively in use at the following agencies:
Lafayette Police Department (IN)
West Lafayette Police Department (IN)
Purdue University Police Department (IN)
Clark County Office of Emergency Communications (IN)
Evansville Police Departments (IN)
b. Additionally, the following agencies have begun testing or deploying VALET:
Indianapolis Police Department (IN)
Tippecanoe County Sheriff’s Office (IN)
Ohio State Highway Patrol
Illinois State Police
New York Police Department
Jeffersonville Police Department
Figure 7. An example of VALET.

Highlights and Significant Achievements
47
VALET has been utilized to devise novel data guided patrolling strategies, led to operational shifts at police departments, and supported investigative analysis. For example, VALET was crucial in the investigation of business burglaries by the Evansville Police Department.
iVALET, the mobile version, continues to be a popular option for law enforcement officers depending upon their roles and responsibilities. Additionally, a consulting firm was retained to ensure the VALET software is of commercial grade.
Currently, we are continuing to improve the predictive analytics component of VALET through input and feedback from our agency partners. This consistently iterative process optimizes VALET for field use and has led to new emergent technologies. For example, MetricVis (Figure 2) turns VALET’s Record Management System databases into an Officer Experience Identification tool for the Lafayette Police Department (LPD). With MetricVis, the Chief of Police can readily identify each officer’s experience with different incidents across all officers in the squad. In doing so, LPD’s Chief can quickly find officers with particular expertise or skill sets.
Figure 8. An example of MetricVis, an Officer Experience Identification Tool.
To transition VALET to more end users, VACCINE has licensed the technology to Davista Technologies LLC, a startup company born out of the VACCINE COE. Davista is currently developing a transition model to continue the development and commercialization efforts of the technology. These efforts have already resulted in one licensing agreement for the use of VALET in security at commercial shopping centers in the US, and have garnered interest from international police agencies (e.g., Singapore Police Force).

Highlights and Significant Achievements
48
c. Social Media Analytics and Reporting Toolkit (SMART) (Figure 3) provides users with a scalable and interactive framework to analyze and visualize social media data (e.g., Twitter, Instagram). SMART incorporates:
real-time monitoring of social media channels,
extraction of trending and abnormal topics,
interactive geospatial and temporal visualizations,
task-tailored message categorization, and
dynamic filtering tools.
Figure 9. An example of SMART.
SMART enables data exploration and analyses across a range of local (e.g., precinct, neighborhood) to global (e.g., city, state) scales. Novel visual analytic techniques can extract and visualize crowd movement patterns and trajectories using social media data. In doing so, end users can detect anomalous and outlying patterns. SMART also provides an email alert/summary service to update end-users about topics of interest automatically.
The system functions through both a desktop application and a highly interactive and accessible web interface. SMART has been actively used by several local, state, and federal HSE organizations, including the:
US Coast Guard
US Customs and Border Protection (CBP)
US Citizenship and Immigration Services (USCIS) The US Coast Guard has utilized SMART to maintain situational awareness during
several high profile events (e.g., Fleet Week, Cincinnati Riverfest, Thunder-Over-Louisville, 2017 Presidential Inauguration and Presidential Address to a Joint Session of Congress). Moreover, SMART supported the investigative analysis of hoax distress calls by Coast Guard analysts to corroborate information sources by using social media data.

Highlights and Significant Achievements
49
The Purdue University Police and Ohio State Depart of Homeland Security have utilized SMART during their home football games, in which they have obtained actionable information to thwart potential safety and security related incidents.
Additionally, SMART was deployed at the joint Canadian-US Enhanced Resiliency Experiment (CAUSE) organized by the US DHS S&T Directorate and the Defence Research and Development Canada’s Centre for Security Science (DRDC CSS). The system provided situation awareness support during the binational exercise.
Twelve law enforcement agencies and first responder groups used SMART at the Republican National Convention in July 2016 to provide actionable intelligence and early warning indicators of potential demonstrations, acts of violence, and disruptions during the event.
Most recently, VACCINE is communicating with researchers at the Queensland University of Technology in Australia to visualize and analyze social media data related to forest fires from January 2017. The findings from this work will be summarized in a report for the New South Wales Government.
SMART has also been licensed to Davista, who continues to support the existing end-user groups and is actively seeking partnerships with entities to disseminate the technology broadly.
IV. Transitions and Pilots This section provides a narrative of the transition and piloting of VACCINE tools on an
annual basis. It is intended to demonstrate the progression of the tools/technology over
several years.
a. Tools/Technology
i. SMART
While working with the USCG on cgSARVA, VACCINE became aware
of an emerging philosophy to improve situational awareness that was
advocated by VADM Parker who was the Commander, LANTAREA.
He believed that it was important to achieve shared synchronized
situational awareness so that all decision-makers at every level have
access to the same information at the same time. He thought that such
awareness can be made possible by harnessing the tools of the
information age, and social media is a critical part of this new
knowledge network. They view each social media user as a “human
sensor,” in that each public post has the potential to provide vital
information to assist them in anticipating and/or responding to an
event. This led to the development of SMART.
2013-2014
The Social Media Analytics and Reporting Toolkit (SMART) was tested and used by a number of different agencies. The US Coast Guard was one of the bigger proponents for the tool – it was used at Thunder-Over-Louisville to support public safety efforts. Based upon the success of that event, it was used to examine hoax calls for the Coast Guard and to monitor Fleet

Highlights and Significant Achievements
50
Week in San Francisco in October of 2014. SMART was also used by the Maine State Police, the Purdue Police, and the Boy Scouts of America. Additionally, other federal agencies such as CBP expressed interest in using the system.
2014-2015
SMART is used by the Ohio State Highway Patrol and a version of the tool was utilized by US Citizenship and Immigration Services (USCIS) to review the background of asylum seekers.
2015-2016 SMART was used by several local, state, and federal HSE organizations, including the US Coast Guard, US Customs and Border Protection (CBP), and US Citizenship and Immigration Services (USCIS). The US Coast Guard utilized SMART to obtain situational awareness during several of their events (e.g., Fleet Week, Cincinnati Riverfest, Thunder-Over-Louisville). The Purdue University police and Ohio State Department of Homeland Security utilized SMART during their home football games and have been able to obtain actionable information and thwart potential safety and security related incidents using the system.
SMART was deployed at the joint Canadian-US Enhanced Resiliency Experiment (CAUSE) organized by the US DHS S&T Directorate and the Defense Research and Development Canada’s Center for Security Science (DRDC CSS). The system was utilized to provide a shared situational awareness during the binational exercise.
SMART was used to support the investigative analysis of hoax distress calls by Coast Guard analysts in order to utilize social media data as another source of information. This analysis was driven by approximate locational information obtained from the Rescue 21 system.
SMART was utilized by over 12 law enforcement agencies and first responder groups at the Republican National Convention held in Cleveland in July 2016 in order to provide actionable intelligence and early warning indicators of potential demonstrations and acts of violence or disruptions during the event.
SMART was licensed to Davista Technologies.

Highlights and Significant Achievements
51
2016-2017
SMART was used by the Tennessee Homeland Security Intel Unit at Battle at Bristol – a football game between VA Tech and University of Tennessee at the Bristol Motor Speedway, the Oklahoma State Fair by the OK HS Intel Unit and Mira Costa College Police Department. SMART was deployed by the National Capital Region USCG Intel Unit at the Presidential Inauguration in Jan 2017 and the Presidential Address to a Joint Session of Congress in Feb 2017.
ii. VALET
The idea to create VALET sprang from a question asked by the
Tippecanoe County Sherriff, Tracy Brown. Tracy wanted to know
how he could use the integrated county database, that consolidated
police data from all four departments, to determine if they were
accomplishing the goals that were submitted to and approved by the
county commissioners. The Sheriff was familiar with another
VACCINE tool, LAHVA, and he wondered if we could adopt some of
the capabilities of LAHVA to this effort.
2010-2011 Visual Analytics Law Enforcement Toolkit (VALET) was deployed at the Lafayette, West Lafayette, and Purdue Police Departments. We worked with the Lafayette Police Department area crime analyst, Steven Hawthorne, to test, evaluate and provide feedback.
2012-2013 The Indianapolis Police Department, the Tippecanoe County Sheriff’s Office, the Ohio State Highway Patrol, the Illinois State Police, and most recently, the New York Police Department have all begun testing or deploying the tool. As the predictive analytics component of the software continues to improve, we continue to receive input and feedback to make adjustments to the technology in order to optimize it for use in the field.
VALET is used for analysis and presentation of high-risk alcohol behavior in the Purdue campus area. Working with Purdue Student Health, Housing, EMS/Fire, and Purdue Police, a presentation was given to campus representatives at the annual Alcohol Summit held at Purdue University. The VALET output continues to be used annually for a variety of presentations and the resulting findings and analysis were
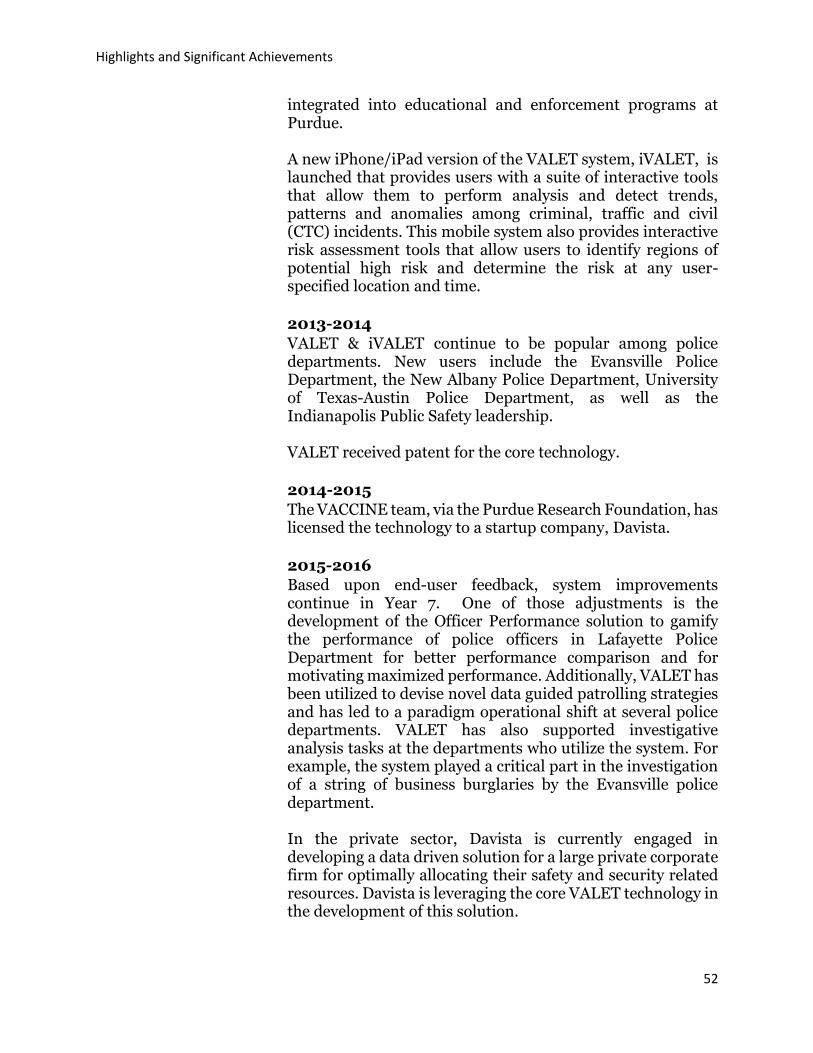
Highlights and Significant Achievements
52
integrated into educational and enforcement programs at Purdue.
A new iPhone/iPad version of the VALET system, iVALET, is launched that provides users with a suite of interactive tools that allow them to perform analysis and detect trends, patterns and anomalies among criminal, traffic and civil (CTC) incidents. This mobile system also provides interactive risk assessment tools that allow users to identify regions of potential high risk and determine the risk at any user- specified location and time.
2013-2014
VALET & iVALET continue to be popular among police departments. New users include the Evansville Police Department, the New Albany Police Department, University of Texas-Austin Police Department, as well as the Indianapolis Public Safety leadership.
VALET received patent for the core technology.
2014-2015
The VACCINE team, via the Purdue Research Foundation, has licensed the technology to a startup company, Davista.
2015-2016
Based upon end-user feedback, system improvements continue in Year 7. One of those adjustments is the development of the Officer Performance solution to gamify the performance of police officers in Lafayette Police Department for better performance comparison and for motivating maximized performance. Additionally, VALET has been utilized to devise novel data guided patrolling strategies and has led to a paradigm operational shift at several police departments. VALET has also supported investigative analysis tasks at the departments who utilize the system. For example, the system played a critical part in the investigation of a string of business burglaries by the Evansville police department.
In the private sector, Davista is currently engaged in developing a data driven solution for a large private corporate firm for optimally allocating their safety and security related resources. Davista is leveraging the core VALET technology in the development of this solution.

Highlights and Significant Achievements
53
2016-2017
Davista signed a contract with Simon Property Group to
provide a data driven solution for allocating their safety and
security resources. This revenue generating contract is a
significant achievement for a VACCINE created technology.
iii. cgSARVA
The concept of cgSARVA was begun when a member of the USCG Research
Development Center staff, Joe DiRenzo, asked if VALET could be adapted
to look at Search and Rescue (SAR) cases. RDML Mike Parks, Commander
of USCG 9th District, wanted to better understand the workload associated
with SAR cases in the Great Lakes. Furthermore, he wanted to analyze the
balance of workload between Coast Guard Auxiliary personnel and USCG
stations in an effort to determine the impact of closing a USCG station.
2010-2011 Developed and deployed the Coast Guard Search and Rescue Visual Analytics (cgSARVA) technology to the Operations and Planning division of the USCG as well as District 9 Headquarters. The cgSARVA technology provides a detailed visual analytics model that allows a thorough assessment and analysis of the Coast Guard’s Search and Rescue mission on the Great Lakes. 2011-2012 The cgSARVA technology was utilized to analyze swimmer deaths and provided information for the Coast Guard swimmer and boating safety public information campaign in 2011. Additionally, the cgSARVA analysis was an input to determine the number of patrols used in 2011, leading to a significant decrease in deaths in 2011.
cgSARVA was used to determine the allocation of resources during Hurricane Irene which occurred along the east coast in the summer of 2011. The Coast Guard initially discussed diverting resources from the Great Lakes area to the east coast, but the data from cgSARVA indicated that there was a demonstrated need to keep the Great Lakes region fully resourced at that time and to draw the resources from another region.
cgSARVA was used to analyze the effects of closing Port Arthur, TX in 2011, including the economic impact and the effectiveness of alternative mitigation strategies.
cgSARVA was also used to avoid resource relocation costs following Super Storm Sandy along the eastern seaboard in

Highlights and Significant Achievements
54
2012. The output from cgSARVA demonstrated that the number of anticipated SAR missions would be low because of colder fall/winter temperatures and the number of private boats damaged during the storm. Although the USCG’s ability to respond was diminished due to the storm damage, the requirement for SAR response was also lower. cgSARVA demonstrated that a lower cost solution was possible instead of a major shift of USCG assets from other regions.
2012-2013
The United States Coast Guard, in collaboration with VACCINE, completed the verification, validation, and accreditation process for the cgSARVA tool. This marks the first time in COE history that a tool produced by one of the Centers of Excellence has been accredited by the USCG. The formal signing was completed at Coast Guard Headquarters by Rear Admiral Lee on April 22nd of 2013.
2013-2014
cgSARVA was featured in the DHS S&T pilot Center of
Excellence Virtual Technology Showcase.
2014-2015
cgSARVA was deployed for official agency-wide use.
iv. GARI
After participating in a MERGE demonstration, the Purdue Police
Chief wanted to know if a tool could be created to recognize gang
graffiti in the same manner that MERGE recognizes HAZMAT
placards
2011-2012
GARI was initially deployed.
GARI was used by the Indianapolis Metropolitan Police, the Indiana Intelligence Fusion Center Gang Task Force and gang detectives across Indiana (fall 2011). During this year, there were currently approximately 30 users and nearly 700 graffiti images within the GARI database.
2012-2013 GARI has been transitioned and deployed for use across Indiana through deployment the Indiana Fusion Center Gang Task Force Network (INGANG). It has also been deployed to the Cook County Illinois Sherriff’s department.

Highlights and Significant Achievements
55
2013-2014 There were 54 users of the system in Indianapolis, and 23 within Cook County. There are an additional 70 or so users testing from our own server and over 1200 images have been collected and uploaded. The tool can also handle tattoo images of gang related content.
2014-2015
There were 222 users of the system in Indianapolis, and 113 within Cook County. There are an additional 70 or so users testing from our own server and over 6,078 images have been collected and uploaded.
2015-2016
GARI system finished second in the NIST/FBI TATT-C challenge in 2015. There are currently 227 users of the system in Indianapolis with 3682 images, and 114 within Cook County with 6332 images and 17 users in Stockton, CA with 568 images.
v. MERGE
After speaking with several first responders groups, it was brought up
that a tool to recognize HAZMAT placards would be very useful.
2011-2012
MERGE (Mobile Emergency Response Guide) was delivered to TSA to be used
in railcar inspections. Our tool allows a first responder to take a picture of the
placard on a railcar or truck containing hazardous materials. It identifies the
materials and provides response instructions quickly and simply. The information
provided is tailored to the expertise level of the user, such as a police officer with
minimal training (e.g., stand back 500 ft and call personnel with hazmat suits)
to a fire fighter hazmat crew (e.g., treatment material, remediation protocols).
MERGE was also used in an exercise with Carroll County Emergency
Management (IN) personnel which demonstrated that first responders could
identify the appropriate response protocol much more quickly using MERGE than
the standard emergency response guidebook.
vi. JIGSAW After participating in some "Solve the crime" exercises at the initial NVAC visual analytics research agenda workshops, John Stasko and others believed that a visual presentation of relevant text documents could help investigators to put the pieces together from many different threads of evidence.
Highlights and Significant Achievements
56
2010-2011 A new release of the system was created and distributed to people and organizations who want to use it. To accompany the system, we created new tutorial videos that illustrate usage of the different components of the system, as well as improved written tutorial documentation. We have a growing and wide-ranging client set now and we continue to work on expanding this.
2011-2012 JIGSAW was deployed at the Indianapolis Police Department, the West Lafayette Police Department and the Lafayette Police Department. We worked with the Lafayette Police Department area crime analyst, Steven Hawthorne, to test, evaluate and provide feedback.
2012-2013 The development and distribution of the Jigsaw visual analytics system was continued. This year, Jigsaw was launched on the web where anyone can download it for free. We support the system with big fixes and new releases, and the project website includes a manual, tutorial videos to help with learning and using it, and example document collections. Over 150 people and organizations downloaded the system, including Air Force Intelligence, AFRL Wright Patterson, Army Counterintelligence, Associated Press, Boeing, Deloitte, DHS-ICE, Naval Research Lab, NCIS, NY Times, PayPal, SIGTARP, Thomson Reuters, United Nations Investigators Office, US Attorney’s Office Organized Crime Taskforce, as well as numerous newspapers and police departments. We worked with police departments in West Lafayette and Lafayette, IN and Rock Hill, SC to use the system in investigations. One fraud investigator in Malaysia reported that it assisted in resolving a 1.5 million dollar fraud case.
2013-2014 We have had about 3000 downloads of the Jigsaw system now. People from the following organizations reported downloading it: DHS, FBI, IBM, Intel, Italian Police Dept., Kansas Attorney General’s Office, MITRE, NYPD, Oak Ridge National Lab, Pfizer, US Army, and US Air Force.
2014-2015 We have had over 5000 downloads of the Jigsaw system now. People from the following organizations downloaded the system over the past year: Autodesk, Center for Disease Control and Prevention, Police Luzern, NSF, Netherlands Defence Academy, Deloitte, Oracle, DC Public Schools, Shreveport Police Dept., Chick-fil-A, Tableau.

Highlights and Significant Achievements
57
2015-2016 We have had approximately 7000 downloads of the JIGSAW system in its history. It is being used in various university classes on visual analytics and intelligence analysis and has been downloaded by a wide variety of organizations in government and industry.
vii. MADIS
After meeting with Miami-Dade County office of Emergency Management, they said that it is a daunting task for emergency managers to collect, organize and integrate disaster event data from multiple sources into incidence command systems where situation reports, incidence action plans, etc. are being held. Therefore, we developed the Multimedia-Aided Disaster information Integration System (MADIS), which uses advanced data integration and visual analysis techniques to associate temporal, spatial and other textual features of a disaster event situation report with event images, videos and related text annotations.
2010-2011
An iPad application based on Florida International‘s ―Integration Framework for Enhancing Emergency Response system has been developed and presented to the personnel at Miami-Dade Emergency Management (MDEM), where an evaluation activity regarding the developed application was successfully conducted. MDEM has expressed interest for FIU to further develop the system into an operational pilot.
2013-2014
In collaboration with VACCINE and the Miami-Dade County Department of Emergency Management, DITRG (Disaster Information Technologies Research Group at Florida International University) has produced a tool known as the Multimedia Aided Disaster Information Integration System (MADIS). This tool, which was successfully demonstrated during VACCINE Annual Meetings as well as through several disaster training scenarios, makes it easier for emergency managers to gather relevant information by automatically linking situation reports directly to imagery obtained and uploaded by responders and the public.
An improved prototype system and iPad application based on Florida International’s Integration Framework for Enhancing Emergency Response system was evaluated by personnel at Miami-Dade Emergency Management (MDEM), and future pilot activities are planned as part of the evaluation process.

Highlights and Significant Achievements
58
2015-2016 This year, a new component for the searching and retrieval of disaster videos was added to the MADIS system, which enables the system to retrieve both videos and images relevant to a specific disaster. Additionally, situation reports which are uploaded by users will be automatically converted to the PDF format and highlighted with the defined keywords.
viii. vBOLO
Video “Be on the Look-out” was suggested by a retired TSA/Secret
Service Senior Executive, Mike Young, based upon a need that he
uncovered while consulting with the Greater Cleveland Regional
Transit Authority.
2013-2014 VACCINE proposed and kicked off a collaborative project with the ALERT (another DHS COE) team to explore an electronic BOLO (be on the lookout – known as EBolo) system. The test bed for the project is Cleveland’s light rail system. As Cleveland will be hosting the next Republican National Convention, having a system in place that can re-identify persons of interest entering a public transportation system could prove quite useful.
Name of project was changed to vBOLO to prevent confusion
with disease, Ebola, that spread to the US in Oct.-Nov. 2014.
2015-2016
The first phase of the project demonstrated the potential effectiveness of computer-vision-based re-identification, but also indicated areas where more research or better physical infrastructure was required. The current vBOLO system can find the correct person in a lineup of 10 automatically-detected candidates 90% of the time for one camera. CVADA-Purdue and ALERT expect to improve performance of vBOLO to find the correct person in a lineup of five candidates 95% of the time. This would involve the addition of high resolution video, facial analysis, motion features, improved body features, and subject attributes.
No additional funds were provided/available to deploy the
system to Cleveland Regional Transit Authority.
ix. VASA
The DHS Program Manager, Joe Kielman, requested VACCINE
develop a tool to enable reasoning and action on the nation’s
integrated infrastructure – how to prevent cascading critical

Highlights and Significant Achievements
59
infrastructure failure. This effort was part of a joint project that was
associated with a treaty signed by the US and Germany.
2009-2010
VASA launched.
2010-2011
VACCINE is finalizing plans for a joint United States-Germany research project to apply visual analytics to disaster prevention and crisis response, with a focus on critical infrastructures in logistics, transportation, food safety, digital networks and power grids at the national levels. This project is in collaboration with several international partners, NVAC, and NCFPD.
2012-2013
The Charlotte Visualization Center created the “VASA Project
Debrief” presentation. These updates included finishing 144
Cascading Simulations using cross-cutting Infrastructures
(pre-food network), completing the first 48 inserting
additional 8 Historical Hurricane Paths for comparative
analysis and initiating R&D on the “Resiliency Index.” Various
visuals displayed the visualization of the interface and a map
of each area.
x. PANVIS The research scientists at VACCINE wanted to know if they could take their syndromic surveillance software and convert it into a tool for a CDC pandemic preparedness grant to train officials and evaluate alternatives.
2009-2010 VACCINE developed an interactive pandemic preparedness, surveillance, and training tool for the Indiana State Department of Health and adapted this tool for use by the State of Washington, New Jersey, and New York. This has been used for all health districts in Indiana and at least two county exercises in the state of Washington.
2010-2011 Expanded public health surveillance activities from Indiana to Pakistan with funding from the Nunn-Lugar act.

Highlights and Significant Achievements
60
xi. Chicago LTE Project
LTE was initiated from DHS S&T.
2015-2016
The goal of this project was to test the viability and performance of the LTE National Public Safety Broadband Network (NPSBN) with respect to transport of video imagery. One cell using the NPSBN was installed in Chicago at the Chicago Police Department District 7. We conducted a test plan to characterize the performance of the network and analyzed the data collected. Based on the analysis of the data collected during our testing it was concluded that a PSBN LTE network provides an unprecedented opportunity to increase the capacity and to meet the needs and requirements of public safety with respect to video delivery. This test concluded that careful analysis should be used for Quality of Service (QoS), prioritization, and Radio Frequency (RF) planning when designing a NPSBN LTE system. It was also noted that adaptive video coding methods, used in many video systems, might not suit public service operational scenarios.
V. Education Initiatives
Overview At the core of VACCINE’s mission is educating current homeland security stakeholders and the next generation of talent. Our educational initiatives begin in high school and continue through professional development. We empower future homeland security professionals to harness the power of visual analytics and advanced computational tools and enable them to make effective decisions from the mass amount of data they will face in their careers. In addition to the broader mission of educating Homeland Security Stakeholders, VACCINE actively engaged Minority Serving Institutions (MSI) in the research and education initiatives. As a result we partnered with Jackson State University, Morgan State University, Florida International University, Bethune-Cookman University, Prairie View A&M University, California State University-Dominguez Hills, University of Houston, Downtown, and Navajo Technical University.
a. Education Programs i. Undergraduate
1. Summer Undergraduate Research Fellowship Program (SURF)
The core of the Purdue SURF program is to provide students across engineering, science and technology disciplines a research experience with real-world applications. On the Purdue campus each summer, SURF brings undergraduate students into state-of-the-art research laboratories, teams them with a faculty

Highlights and Significant Achievements
61
member and graduate student mentor, and introduces them to the research tools used on the cutting edges of science, engineering, and technology. By working closely with other creative and innovative people, students explore, discover and transform ideas into reality to advance society and improve people’s lives. The interdisciplinary nature of discovery allows students to apply the concepts and skills from their own programs, contribute to interdisciplinary projects, and prepare for real-world environments. The campus setting also provides undergraduate students with an avenue to advance research in an academic environ-ment and explore graduate study options in the process. In addition to the overall benefits of the SURF program, working in the VACCINE lab also introduces the students to the opportunities and challenges in homeland security fields. Over the last eight years, there have been 37+ students enrolled in the SURF program. The application process is open to Purdue students and undergraduate students enrolled at U.S. colleges and universities.
2. MSI Partner Morgan State University Undergraduate Workshop on Visual Analytics
As part of a continued effort to support the Minority Serving Institutions/Historically Black Colleges and Universities partnerships, VACCINE hosts undergraduate students from Morgan State University and Jackson State University for a weeklong summer boot camp on visual analytics, including an immersive experience at the VACCINE lab. Faculty and student-led demonstrations of our tools and technology give students an opportunity to gain hands-on experiences with VACCINE resources. There have been over 30 undergrad participants from MSI partner universities.
ii. Graduate 1. HS-STEM Career Development Program
This program is designed to support graduate students in developing the skills to become preeminent scientists in the homeland security and technical communities. Funded by the U.S. Department of Homeland Security, this program offers career development scholarships/fellowships, loans with summer research opportunities and one-year service commitments. Awards are provided to full-time graduate students with a research focus in the

Highlights and Significant Achievements
62
visualization and data sciences and HS-STEM fields. So far, 22 students have been recipients.
Where some of our students have gone on to work:
CDC • Defense Cyber Crime Institute • Department of Energy • Epic Healthcare Systems • MIT Lincoln Lab • RAND Corporation • Trustwave • U.S. Department of Homeland Security
2. Research Assistants
There have been over 82 Purdue research assistants and over 170 at partner universities.
Where our research assistants are working now:
Adobe • Amazon • Apple • Bloomberg • ESRI • Facebook • GE • General Motors • Google • Intel Corporation • Microsoft • NSA • PROGNOS INC • Samsung • Siemens Healthineers • Tableau • Target
iii. Visual Analytic Related Curriculum
The VACCINE Center and Purdue are committed to sharing our gained knowledge with other institutions of higher learning. We collaborated with multiple partner universities to deliver various courses in areas related to visual analytics, including visualization techniques, geospatial intelligence, data management and data mining. There are now over 31 related curriculum between Purdue and partner universities
iv. Educating the Next Generation of Talent through K-12 Outreach Programs
For the past several years, VACCINE engaged with a local high school to provide students with the foundational knowledge in visual and big data analytics necessary to promote and encourage postsecondary schooling. High school students received an up-close look at the global impact our tools and applications can offer first responders and the Department of Homeland Security Enterprise. Two hundred students from Lafayette Jefferson High School have visited VACCINE. Additionally, VACCINE created a Visualization and Data Analysis workshop for over 29 middle school and high school teachers across Indiana, which led to the development and implementation of classroom learning modules that met the guidelines of the Indiana Statewide Testing for Educational Progress (ISTEP) program.
b. Professional Development i. Visual Analytics MSI Faculty Training Workshops

Highlights and Significant Achievements
63
Since 2013, VACCINE has continued to support Minority Serving Institution (MSI) initiatives by providing an education program to expand the teaching of visual analytics at MSIs. The program focuses on preparing MSI faculty to incorporate visual analytics courses into their programs. Topics and activities in the workshops focus on understanding the theory and foundation of visual analytics; integrating visual analytics into course curriculum; developing learning communities for interdisciplinary courses; hands-on instructor-supported tutorials on extracting various forms of big data; and a unique group-designed application learning assignment. There have been 90 plus total MSI faculty participants since the start of the program in 2013. Jackson State University, Morgan State University, Bethune-Cookman University, Florida International University and Prairie View A&M University were all hosts/facilitators of these workshops.
ii. VACCINE and the U.S. Air Force Academy Faculty Training Workshop
This workshop created a network of collaborators who understand the need to develop and educate the Department of Defense and Department of Homeland Security personnel on the value of visual analytics. It is anticipated that analysts and decision-makers will place an increased emphasis on predictive analytics and the visualization of data in the future. Visualization, specifically, will become a more important skill and tool for analysts. In fact, analysts and decision-makers will stop viewing static displays of data in presentations and start interacting with data “live” in a visual format. As a result, there is a need to understand and educate undergraduates on visual analytics.
Approximately 10 Air Force Academy faculty and four U.S. Coast Guard faculty attended the workshop. The workshop included an introduction to visual analytics followed by group discussions that were led by VACCINE researchers with the intent of developing outlines for visual analytic teaching modules. These modules will be designed so an instructor can easily adopt them for a one- or two-lesson sequence in their course. The design of the modules also will be flexible enough to be used in a wide range of disciplines such as mathematics, management, computer science and political science.

Highlights and Significant Achievements
64
iii. VACCINE and American Military University (AMU) Webinar Series
Launched in 2015, and in collaboration with American Military University, VACCINE presents a webinar series with a primary focus on topics related to homeland security tech-nology and research. There have been over 500 participants registered since the start. The webinar series is a launching platform for discussions about problems, challenges and solutions related to keeping our country safe. Eight webinars have been hosted since 2015. The webinars are conducted in coordination with the framework of the National Conversation on Homeland Security Technology, that was created by the Department of Homeland Security Science and Technology Directorate (DHS S&T).
iv. Summer Research Team Program for Minority Serving Institutions
To engage faculty and students from Minority Serving Institutions (MSI) with the science of visual analytics, VACCINE offers summer research opportunities that allow students and faculty to conduct research on campus at our Center of Excellence. The program is designed to provide research opportunities to increase and enhance the scientific leadership at MSIs in research areas that support the mission and goals of the Department of Homeland Security (DHS). VACCINE has hosted students and faculty from Prairie View A&M University, the University of Houston, and Texas A&M University-Kingsville.
v. Summer Research Team Program for Federal Service
Academies
The Department of Homeland Security Science and Technology Directorate and the Department of Defense partnered to create a program that fosters a research environment for future military leaders. The program is exclusive to DOD faculty, rising senior cadets and midshipmen. VACCINE hosted a team of three cadets from the United States Air Force Academy.
c. Impact of VACCINE Education Initiatives
Over the last eight years, VACCINE has utilized innovative programs to
educate current homeland security stakeholders and the next generation of
talent in effective development and use of visual analytics systems. In total,
we’ve reached hundreds of students across key demographics — from high
school to professional development. Through this work, we have built a

Highlights and Significant Achievements
65
diverse, highly capable, and technical workforce for the Department of
Homeland Security enterprise.
VI. Recommendations and Lessons Learned
a. Overview During the eight (8) years that VACCINE was a DHS COE, many lessons were learned regarding the most effective method to develop technologies that could quickly impact DHS components. Some of those lessons are summarized below along with recommendations.
i. COE project delays and personnel retention issues can be minimized by accurate financial projections and timely funding distribution. We recognize that DHS S&T funding is subject to congressional and internal DHS budget processes, so the purpose of this paragraph is to document the impact on COEs, while acknowledging that OUP has little ability to change this issue. As an example of one case in which a lack of funding prevented a technology transition “break-out,” we were unable to enter GARI into the NIST gang tattoo recognition evaluation in the fall of 2017 because resources were not available. The evaluation required the software to be converted to C++, however, due to a lack of funding the graduate students supporting GARI were moved to other projects a year earlier. A satisfactory evaluation by NIST would have led to GARI being placed on list of products cleared for use by the FBI.
ii. Semi-annual conferences/meetings with the COE
leadership leads to greater collaboration. Annual or semi-annual meetings are a great venue to exchange ideas, to build relationships/partnerships and to plan collaborations. Although there is an expense associated with these gatherings, it may be less expensive than redundant or uncoordinated research, education initiatives or technology development. There seems to be a spirit of collaboration that is accelerated by gathering people together that cannot be duplicated by a “University Programs” website or monthly director’s conference call or video teleconferencing.
iii. Proposal cohesion and alignment is better maintained
when proposals are awarded as a unified group. While the rationale to initiate projects based upon component capability gaps is sound, those capability gaps should be a part of the original RFP. Piece matching the initiatives from several proposals to fine tune an award to a set of capability gaps leads to a lack of overall program cohesion when the direction is applied after a proposal is developed. It would be less disruptive to the workflow if the decision was made before the proposal was published.

Highlights and Significant Achievements
66
iv. Continue project competitions. Under the leadership of the VACCINE Director, Dr. David Ebert, the staff conducted quarterly reviews of research projects to ensure that projects meet their milestone targets. Projects that could not be transitioned to tools for end-users were discontinued and competitions were conducted to initiate new projects.
v. Encourage the use of Public Safety/Customer forums. Our
strong partnership with our stakeholder community has been key to VACCINE’s success. In 2010, VACCINE created a Public Safety Consortium with the goal of connecting homeland security researchers with the first responder community. Understanding the requirements of our end-users is key to the research and development of technologies that can be transitioned to the broader public safety community. The Consortium consists of local and regional law enforcement, fire, and emergency management agencies, that allow data to be shared and research conducted furthering the development of next generation homeland security technologies. The Consortium also provides a framework where VACCINE can deploy its tools to the various agency members, and our end-users provide in-field or real world evaluation feedback on their requirements. More importantly, quarterly meetings with the group on developing topics of interest provide the impetus and requirements for new projects and research directions and help establish partnerships and user-engagement from day one. We have taken a similar continual engagement from day one approach with our regional and national level stakeholders, utilizing frequent conference calls and regular visits to enable successful engagement. VACCINE often hosts agency personnel to enable effective work or has VACCINE personnel spend several days to a week working on-site, then continue development remotely with periodic visits.
vi. A Webinar Series is a great method to engage a broad range of HSE professionals and students. The VACCINE Center and American Military University (AMU) have collaborated to present a quarterly webinar series. The webinars are conducted in coordination with The National Conversation on Homeland Security Technology that was created by the Department of Homeland Security Science and Technology Directorate (DHS S&T). Each webinar is co-presented by a VACCINE Center Principle Investigator and AMU faculty member, and focuses on a specific structured dialogue topic related to homeland security technology in an effort to get people talking about problems, challenges, and solutions to keep our country safe.
vii. Adopt a user centered approach to transition research into practice. One of the major reasons for our success with

Highlights and Significant Achievements
67
viii. transitioning our research into practice has been due to our agile research and development methodology and our efforts in nurturing strategic partnerships with our end-user groups. Our R&D efforts for many of our projects at the VACCINE center usually began with discussions with the key leadership of the organization in order to determine both short term and long term strategic goals for the project. This was critical in order to ensure that the problem set identified was not at a small or local scale, but instead could be applicable to a wider domain. The other aspect in our success with transition was developing relationships with the analysts and domain experts in the organization who would use the solution on a regular basis. Our strategy was to identify their pain points and develop a user centered solution that further aligned with the long term strategic vision for the project. We found applying this user centered approach to be effective in the eventual adoption of the technology at the larger organizational level as these end-users would often act as ambassadors for the solution in their specific organization. We adopted an agile R&D strategy that allowed us to be flexible in order to accommodate for any pivots that were necessary in the development process based on the dynamic end-user needs and also helped us establish a rapport with our end-users.
ix. Low profit margins on public safety products present a challenge when attempting to commercialize solutions. Many of the solutions developed at the VACCINE center have been designed to target the needs of the law enforcement and first responder groups (e.g., Jigsaw to support investigative analysis of document collections; VALET to enable visual analysis of criminal, traffic, and civil data; GARI to allow investigators to translate the meaning of gang graffiti; and SMART to investigate dynamic trends from unstructured social media data). In the pursuit of determining sustainable transition strategies for these solutions, our center has engaged in numerous discussions with government and corporate organizations. The main challenges that we have encountered in these discussions for commercializing and licensing these technologies include a relatively small size of the total addressable market segment (especially for the first responder and law enforcement market), difficult sales cycle for this market, and difficult exit market strategies due to the diverse nature of the competition in this market space. However, our market research has shown the potential for these technologies to be of much broader scope that can be extended into other market segments. With this in mind, several VACCINE management personnel have jointly formed a startup company named Davista Technologies and licensed the VALET and SMART technologies in order to explore generalizing the solutions and pursue commercialization efforts for the broader market segments.

Categories of Accomplishments
7/1/2009 through 08/31/2017 :
(Number/Amount; numbers only)
Student Enrollment in COE Programs:Traditional undergraduate and graduate students attending classes 4442Students registered in on-line or other distance learning courses 0Homeland security professionals attending courses 0COE Funded Students 400Papers 1007Software Products Developed 92New Courses Developed 7New Certificates or Degree Programs Developed: 0New Degree Programs 11New Certificates 1New private or public licencees/partners using coursework licensed by the COE 0Patent Applications 7Patents Awarded 14Requests for assistance or advice from DHS (# of different DHS contacts/projects/requests) 96Requests for assistance or advice from Federal, State, Local Government 618Follow-on funding from other sources 13306132Presentations 343Congressional Testimonies 0Projects Completed 33Collaborative Projects 5
Totals - Yrs. 1-8
tbescher
Typewritten Text
VII. Aggregate Metrics for the Award

Categories of Accomplishments
07/01/2009 - 03/31/2010 : (Number/Amount; numbers
only)Student Enrollment in COE Programs:Traditional undergraduate and graduate students attending classesStudents registered in on-line or other distance learning coursesHomeland security professionals attending courses COE Funded Students 28Papers 54Software Products DevelopedNew Courses DevelopedNew Certificates or Degree Programs Developed:New Degree ProgramsNew CertificatesNew private or public licencees/partners using coursework licensed by the COEPatent ApplicationsPatents Awarded 1Requests for assistance or advice from DHS (# of different DHS contacts/projects/requests)Requests for assistance or advice from Federal, State, Local Government Follow-on funding from other sources Presentations 28Congressional Testimonies Projects CompletedCollaborative Projects
Totals - Yr. 1

Categories of Accomplishments
4/1/2011 through 03/31/2011 :
(Number/Amount; numbers only)
Student Enrollment in COE Programs:Traditional undergraduate and graduate students attending classesStudents registered in on-line or other distance learning coursesHomeland security professionals attending courses COE Funded Students 55Papers 113Software Products DevelopedNew Courses DevelopedNew Certificates or Degree Programs Developed:New Degree ProgramsNew CertificatesNew private or public licencees/partners using coursework licensed by the COEPatent ApplicationsPatents Awarded 3Requests for assistance or advice from DHS (# of different DHS contacts/projects/requests)Requests for assistance or advice from Federal, State, Local Government Follow-on funding from other sources 9088825Presentations 63Congressional Testimonies Projects CompletedCollaborative Projects
Totals - Yr. 2

Categories of Accomplishments
Cumulative through 06/30/2016 :
(Number/Amount; numbers only)
Student Enrollment in COE Programs:Traditional undergraduate and graduate students attending classes 254Students registered in on-line or other distance learning coursesHomeland security professionals attending courses COE Funded Students 56Papers 406Software Products Developed 16New Courses Developed 3New Certificates or Degree Programs Developed:New Degree Programs 2New Certificates 0New private or public licencees/partners using coursework licensed by the COEPatent Applications 2Patents Awarded 2Requests for assistance or advice from DHS (# of different DHS contacts/projects/requests) 11Requests for assistance or advice from Federal, State, Local Government 43Follow-on funding from other sources 1288677Presentations 43Congressional Testimonies 0Projects CompletedCollaborative Projects
Totals - Yr. 3

Categories of Accomplishments
4/1/2012 through 06/30/2013 :
(Number/Amount; numbers only)
Student Enrollment in COE Programs:Traditional undergraduate and graduate students attending classes 188Students registered in on-line or other distance learning courses 0Homeland security professionals attending courses 0COE Funded Students 70Papers 294Software Products Developed 16New Courses Developed 0New Certificates or Degree Programs Developed:New Degree Programs 1New Certificates 0New private or public licencees/partners using coursework licensed by the COE 0Patent Applications 1Patents Awarded 0Requests for assistance or advice from DHS (# of different DHS contacts/projects/requests) 24Requests for assistance or advice from Federal, State, Local Government 31Follow-on funding from other sources 611190Presentations 61Congressional Testimonies 0Projects Completed 13Collaborative Projects
Totals - Yr. 4

Categories of Accomplishments
7/1/2013 through 06/30/2014 :
(Number/Amount; numbers only)
Student Enrollment in COE Programs:Traditional undergraduate and graduate students attending classes 2281Students registered in on-line or other distance learning coursesHomeland security professionals attending courses COE Funded Students 66Papers 61Software Products Developed 27New Courses Developed 2New Certificates or Degree Programs Developed:New Degree Programs 7New Certificates 1New private or public licencees/partners using coursework licensed by the COE 0Patent Applications 0Patents Awarded 2Requests for assistance or advice from DHS (# of different DHS contacts/projects/requests) 44Requests for assistance or advice from Federal, State, Local Government 442Follow-on funding from other sources 1418104Presentations 76Congressional Testimonies 0Projects Completed 7Collaborative Projects 3
Totals - Yr. 5

Categories of Accomplishments
7/1/2014 through 06/30/2015 :
(Number/Amount; numbers only)
Student Enrollment in COE Programs:Traditional undergraduate and graduate students attending classes 495Students registered in on-line or other distance learning coursesHomeland security professionals attending courses COE Funded Students 37Papers 41Software Products Developed 17New Courses DevelopedNew Certificates or Degree Programs Developed:New Degree Programs 1New CertificatesNew private or public licencees/partners using coursework licensed by the COEPatent Applications 2Patents Awarded 6Requests for assistance or advice from DHS (# of different DHS contacts/projects/requests) 5Requests for assistance or advice from Federal, State, Local Government 50Follow-on funding from other sources 759336Presentations 34Congressional Testimonies Projects Completed 7Collaborative Projects
Totals - Yr. 6

Categories of Accomplishments
7/1/2015 through 06/30/2016 :
(Number/Amount; numbers only)
Student Enrollment in COE Programs:Traditional undergraduate and graduate students attending classes 612Students registered in on-line or other distance learning courses 0Homeland security professionals attending courses 0COE Funded Students 44Papers 19Software Products Developed 8New Courses Developed 1New Certificates or Degree Programs Developed:New Degree Programs 0New Certificates 0New private or public licencees/partners using coursework licensed by the COE 0Patent Applications 1Patents Awarded 0Requests for assistance or advice from DHS (# of different DHS contacts/projects/requests) 6Requests for assistance or advice from Federal, State, Local Government 26Follow-on funding from other sources 70000Presentations 19Congressional Testimonies 0Projects Completed 3Collaborative Projects 1
Totals - Yr. 7

Categories of Accomplishments
7/1/2009 through 06/30/2017 :
(Number/Amount; numbers only)
Student Enrollment in COE Programs:Traditional undergraduate and graduate students attending classesStudents registered in on-line or other distance learning coursesHomeland security professionals attending courses COE Funded Students 20Papers Software Products DevelopedNew Courses DevelopedNew Certificates or Degree Programs Developed:New Degree ProgramsNew CertificatesNew private or public licencees/partners using coursework licensed by the COEPatent ApplicationsPatents AwardedRequests for assistance or advice from DHS (# of different DHS contacts/projects/requests)Requests for assistance or advice from Federal, State, Local Government Follow-on funding from other sources Presentations Congressional Testimonies Projects CompletedCollaborative Projects
Totals - Yrs. 8

Proj Title (P/R) Theme Start Date Start Year End Date (P/R) End Year Abstract (P/R) Status (R) Theme (P) Proj Type (P/R) Awd Amt (P/R) Awd No. (P) Compliance (R) Data Collection Method Is Deleted Other Project Type Primary End User PI (P/R) PI Organization (P/R) MSIs (P) States (P) Collab COEs (P) Users (P/R) Primary End User Exec Summ (P/R) Prog/Final Rpt Research Areas Completed Challenges Analytic Methods Utilized Academic Disciplines Stages of Transition Resulting Output Type Output Description & Final Report Peer-reviewed Journ Other Publications Student Theses Presentations Invention disclosures and Patents
Plugfest Resource Allocation 2016/09 2016 2017/06 2017 Entered In
Progress
150000 2009-ST-061-
CI001
No FALSE David
Ebert
Purdue University IN Center for Visual
Analytics for
Command,
Control, and
Interoperability
Environments
2016 Modeling Pilot/Field Testing and
Evaluation in an
Operational
Environment
Event Plugfest allows providers of sensors,
analysis, decision support tools, and
information sharing capabilities to show
their products in real time during on-
water simulations of different scenarios.
A booth with DHS S&T was setup,
cgSARVA was demonstrated, a
modified version for VALET and a short
talk on visual analytic systems. Positive
feedback was received and other
vendors with graphical user interfaces
have shown interest in the systems.
VBOLO Law Enforcement 2016/08 2016 2017/06 2017 Entered In
Progress
Visual
Analytics
of
Unstructur
ed and
Streaming
Data
Research 120000 2009-st-061-ci001 No Field Monitors FALSE Edward
Delp;
Edward
Delp
Purdue University;
Purdue University
IN; OH Center for Visual
Analytics for
Command,
Control, and
Interoperability
Environments;
Northeastern
University
State and Local Transportation 2016 Emergency
Preparedness
and Response;
Transportation
Security
Data
Collection/Generation
Qualitative Analysis Engineering - Electrical;
Mathematics
Pilot/Field Testing and
Evaluation in an
Operational
Environment
Tool The vBOLO system had successful
tests. Improvements are expected to be
completed. Additional funds are needed
for system integration and deployment.
4 journal articles - See
Journal Tab for more
detailed information.
4 presentations - See Presentations Tab for more
detailed information.
success visualization
project
Education 2016/07 2016 2017/06 2017 Entered In
Progress
Information-
driven
Visualizatio
n, Modeling
and
Simulation
of Data
0 N/A No FALSE David
Ebert
Purdue University IN Center for Visual
Analytics for
Command,
Control, and
Interoperability
Environments
Other DHS 2016 Basic Research,
Operational Use,
Prototype
Demonstration
Tool SuccessViz was created to show
Visualization of COE success and
impact and will be placed on website as
a timeline. It will include key pieces of
information in presentations, iPad
demos, etc. by VACCINE as well as any
DHS staff when communicating about
the work of the center.
Crisis Informatics Course
Development
Education 2015/12 2015 2016/06 2016 Entered Complete Big Data
Visual
Analytics
Workforce
Development/Ed
ucation
38750 2009-ST-061-
CI001
No Compiling and Sorting
Database
FALSE Louis
Ngamassi
Prairie View A & M
University
Prairie
View A&M
University
TX Academic Community 06/2016 Advanced Data
Analysis and
Visualization;
Emergency
Preparedness
and Response;
Human Factors
Aspects of
Technology
Low Risk Qualitative Analysis Classroom Education;
Exercise; Online
Education; Information
Science; Information
systems; Risk
management/assessme
nt; Security Informatics
Pilot/Field Testing and
Evaluation in an
Operational
Environment
Course The Crisis Informatics Course has been
developed and has been offered once a
year at the graduate level since Fall
2015. The course includes a visual
analytics component which is mainly
constituted of hands-on class activities
involving the use of visual analytic
toolkits (NODEXL, SMART) to explore
crisis related information generated
1 journal article - See
Journal Tab for more
detailed information.
Geographic Network
Analytics Correlations for
VALET
Law Enforcement 2015/11 2015 2017/07 2017 Entered In
Progress
Data-
driven
Decision
Support
Research 50000 2009-ST-061-
CI001
No Data Mining FALSE Ross
Maciejwski
; Ross
Maciejews
ki
Arizona State University;
Arizona State University
AZ; IN Center for Visual
Analytics for
Command,
Control, and
Interoperability
Environments
Academic Community 2016 Advanced Data
Analysis and
Visualization;
Emergency
Preparedness
and Response;
Social,
Behavioral, and
Economic
S i
Case Studies; Statistical
Analysis
Geographic information
sciences; Geography;
Information Science;
Information systems;
Computer Science;
Criminology
Basic Research Deployment An online service for creating network
density estimate models was created.
These features are in the process of
being ported to other systems for
deployment. The expected impact is
improved data analytics for law
enforcement as well as serving as a
basis for improved network based
modeling of crime and crime hotspots.
2 journal articles - See
Journal Tab for more
detailed information.
2 presentations - See Presentations Tab for more
detailed information.
Safety in View: A Public
Safety Visual Analytics
Tool Based on CCTV
Camera Angles of View
Law Enforcement 2015/06 2015 2015/07 2015 Entered Complete Research 0 2009-ST-061-
CI001
No Expert Consultation FALSE David
Ebert
Purdue University IN State and Local First
Responders
Case Studies Computer Science Published Journal articles were created. 2 journal articles - See
Journal Tab for more
detailed information.
Officer Performance
Visualization System
Law Enforcement 2015/05 2015 2017/07 2017 Entered In
Progress
Research 0 2009-ST-061-
CI001
No Compiling and Sorting
Database
FALSE David
Ebert
Purdue University IN State and Local First
Responders
2016 Communications
and
Interoperability;
Social,
Behavioral, and
Economic
Sciences
Modeling; Statistical Analysis Computer Science Pilot/Field Testing and
Evaluation in an
Operational
Environment
Tool MetricVis was created and a prototype
was delivered. To the Lafayette Police
Department in Aug 2016.
1 other publication -
See Other
Publications Tab for
more information.
Chicago LTE Project Law Enforcement 2015/05 2015 2016/02 2016 Entered Complete Research 220293 2009-ST-061-
CI001
No Field Monitors FALSE Edward
Delp;
Edward
Delp
Purdue University;
Purdue University
IN; IL Private Sector Other; State and
Local First Responders
2015 08/2015 Test Report including
Lessons Learned and
recommendations for
future deployments
A subjective assessment of RTVI was
conducted at CPD. This project invoked
investigating the delivery of real-time
video delivery to police vehicles. The
major effort was the work of Motorola in
setting up a Public Service LTE cell site
for the Chicago Police, which was used
for video testing. Chicago LTE Pilot
Project Final Report
1 journal article - See
Journal Tab for more
detailed information.
1 other publication -
See Other
Publications Tab for
more information.
2 presentations - See Presentations Tab for more
detailed information.
Context-Driven Visual
Analytics for Cyber
Defensive Operations -
Oak Ridge N Lab
Social Media Tools 2015/01 2015 2016/07 2016 Entered Complete Information-
driven
Visualizatio
n, Modeling
and
Simulation
of Data
820000 2009-ST-061-
CI001
No Data Mining FALSE Bobby
Bridges
IN; TN Academic Community; DHS
Science and Technology
Directorate; Other Industry
Advanced Data
Analysis and
Visualization
Modeling; Statistical Analysis Mathematical and
Computational Modeling
Basic Research Tool GraphPrints was created, a graph
analytic approach for detecting
anomalies in network flow data. Initial
testing has been completed.
1 other publication -
See Other
Publications Tab for
more information.
SMART: Social Media
Analytics and Reporting
Toolkit
Social Media Tools 2014/07 2014 2017/07 2017 Entered In
Progress
Research 10000 2009-ST-061-
CI001
No Data Mining FALSE David
Ebert
Purdue University IN; TN DHS Federal Emergency
Management Agency; DHS
U.S. Coast Guard; State and
Local First Responders
2016 Case Studies; Modeling;
Sampling; Statistical Analysis
Tool SMART has been licensed by Purdue in
2015 to be used exclusively by Davista
Technologies, LLC. Davista is a start-
up company created by current and
former members of VACCINE who
were integral to the development of the
technology.
10 journal articles -
See Journal Tab for
more detailed
information.
1 other publication -
See Other
Publications Tab for
more information.
Analyzing High-
dimensional Multivariate
Network Links with
Integrated Anomaly
Detection, Highlighting and
Exploration
Resource Allocation 2014/07 2014 2015/06 2015 Entered Complete Research 0 2009-ST-061-
CI001
No Compiling and Sorting
Database
FALSE David
Ebert
Purdue University IN Case Studies; Statistical
Analysis
Published Journal article was created. 1 journal article - See
Journal Tab for more
detailed information.
Social Media and
Healthcare Analytics for
Identification of Emerging
Health Threats
Disease Surveillance 2014/07 2014 2015/06 2015 Entered Complete Research 0 2009-ST-061-
CI001
No Compiling and Sorting
Database
FALSE David
Ebert
Purdue University AZ; IN Modeling; Statistical Analysis Biostatistics and
bioinformatics;
Computer Science
Mobile Application
Communication
Social Media Tools 2014/07 2014 2015/06 2015 Entered Complete Research 504901 2009-ST-061-
CI001
No FALSE VA The constant internet connectivity of
smart devices coupled with their
Explore Impact of
Visualization on Predictive
Analysis
Social Media Tools 2014/07 2014 2017/06 2017 Entered In
Progress
Data-
driven
Decision
Support
Research 193686 2009-ST-061-
CI001
No Bench Tests FALSE Ross
Maciejwski
; Ross
Maciejews
ki
Arizona State University;
Arizona State University
AZ Academic Community 2016 Advanced Data
Analysis and
Visualization;
Human Factors
Aspects of
Technology;
Social,
Behavioral, and
Economic
Sciences
Data
Collection/Generation
Case Studies Laboratory Testing and
Evaluation
Given the conflicting demands of model
accuracy, comprehensibility and
trustworthiness, the question of how
much human knowledge and interaction
is needed or warranted in relation to the
model becomes a critical question for
predictive visual analytics. How much of
the human do we want in the loop of
model prediction? Are humans able to
accurately make predictions or Exascale Data
Visualization: Information-
assisted data analysis and
visualization
Resource Allocation 2014/07 2014 2015/06 2015 Entered Complete Research 0 2009-ST-061-
CI001
No FALSE Kelly
Gaither
University of Texas TX
Critical Infrastructure in
Large Scale Emergencies
Resource Allocation 2014/07 2014 2015/06 2015 Entered Complete 0 2009-ST-061-
CI001
No FALSE William
Ribarsky
University of North
Carolina at Charlotte
NC Department of Energy National
Labs; Private Sector Other
Multimedia Analytics for
Open Source Media
Social Media Tools 2014/07 2014 2016/06 2016 Entered Complete 0 2009-ST-061-
CI001
No FALSE William
Ribarsky;
William
Ribarsky
University of North
Carolina-Charlotte;
University of North
Carolina at Charlotte
NC DHS Labs
Parallelizing Video
Algorithms for Public
Safety Applications
Law Enforcement 2014/07 2014 2015/06 2015 Complete Research 0 2009-ST-061-
CI001
No Compiling and Sorting
Database
FALSE Kelly
Gaither
University of Texas,
Austin
IN; TX Case Studies; Modeling;
Sampling; Statistical Analysis
RISK VA Financial Flows Tools 2014/07 2014 2016/12 2016 Entered Complete Research 0 2009-ST-061-
CI001
No FALSE William
Ribarsky;
William
Ribarsky
University of North
Carolina-Charlotte;
University of North
Carolina at Charlotte
NC Academic Community; Banking
Industry; Insurance Industry;
Policymakers
2016 Case Studies; Statistical
Analysis
Tool/Technology/Deployed Work was with managers at Bank of
America and was made available to
BoA financial analysts. A version can be
made available for government
agencies to assist in the investigation of
financial debt Multimedia Visual Analytics
for News, Blogs, RSS
Feeds and other
Streaming Data
Social Media Tools 2014/07 2014 2016/06 2016 Complete Research 0 2009-ST-061-
CI001
No FALSE William
Ribarsky
University of North
Carolina at Charlotte
NC
SmartGridVis Project Resource Allocation 2014/07 2014 2015/06 2015 Entered Complete Research 0 2009-ST-061-
CI001
No FALSE William
Ribarsky
University of North
Carolina at Charlotte
IN; NC Tool?/Technology Foundation for VASA
SP 14 Task 5: Visual
Analytics for Security
Applications - VASA
Resource Allocation 2014/07 2014 2015/06 2015 Entered Complete Research 25000 2009-ST-061-
CI001
No Compiling and Sorting
Database
FALSE William
Ribarsky;
William
Ribarsky
University of North
Carolina-Charlotte;
University of North
Carolina at Charlotte
NC Case Studies; Modeling;
Sampling; Statistical Analysis
Hypothetical stores in North Carolina
damaged by Hurricane Irene were
looked at. In our visual analytics
environment analysts and decisionWDYTYA: The Uncertainty
of Identity
Law Enforcement 2013/07 2013 2016/12 2016 Entered Complete Research 199006 2009-ST-061-
CI001
No Compiling and Sorting
Database
FALSE Ross
Maciejwski
; Ross
Maciejews
ki
Arizona State University;
Arizona State University
AZ Center for Visual
Analytics for
Command,
Control, and
Interoperability
Environments
Academic Community 2016 Advanced Data
Analysis and
Visualization;
Human Factors
Aspects of
Technology;
Social,
Behavioral, and
Economic
Sciences
Applied Known Sampling; Statistical Analysis Computer Science Basic Research Published & Patents Journal articles and presentations were
created. Patents were awarded.
10 journal articles -
See Journal Tab for
more detailed
information.
9 presentations - See Presentations Tab for more
detailed information.
3 patents - See Patent Tab for more
detailed information.
GIS Implementations Disease Surveillance 2013/07 2013 2014/06 2014 Entered Complete Research 0 2009-ST-061-
CI001
No Compiling and Sorting
Database
FALSE Richard
Aló;
Richard
Alo
University of Houston-
Downtown; Jackson
State University
IN; MS Modeling; Sampling;
Statistical Analysis
Published Journal articles were created. 7 journal articles - See
Journal Tab for more
detailed information.
Flight Delay Data
Exploration System for
Analyzing Spatiotemporal
Multivariate Data
Resource Allocation 2013/07 2013 2014/06 2014 Entered Complete 0 2009-ST-061-
CI001
No FALSE Min Chen,
David
Ebert
SEED 1: Investigation of
the Impacts of
Visualization Literacy on
the Performance of Visual
Analysis; International
Collaborations
Education 2013/07 2013 2014/06 2014 Entered Complete Research 0 2009-ST-061-
CI001
No Survey FALSE David
Ebert
Purdue University IN State and Local First
Responders
2010 Published This project began a collaboration
which resulted in one journal article
during the project and several others
after the project concluded. This line of
inquiry also contributed to a successful
3 year NSERC Strategic Partnership
Project grant proposal "Visual analytics
1 journal article - See
Journal Tab for more
detailed information.
ORAM Resource Allocation 2013/07 2013 2016/06 2016 Entered Complete Research 0 2009-ST-061-
CI001
No FALSE David
Ebert
Purdue University System was developed and provided to
LANT7 (USCG) for evaluation
UKVAC Joint Research
Project
2013/07 2013 2014/06 2014 Entered Complete 0 2009-ST-061-
CI001
No FALSE Min Chen In collaboration with the Purdue team,
we integrated anomaly analysis
capacity (Oxford) with a flight data
visualization system (Purdue)
1 journal article - See
Journal Tab for more
detailed information.
Visual Analytics of
Microblog Data for Public
Response Behavioral
Analysis in Disaster
Events
Social Media Tools 2013/07 2013 2016/06 2016 Entered Complete Research 0 2009-ST-061-
CI001
No Compiling and Sorting
Database
FALSE David
Ebert;
Tom Ertl
Purdue University; IN Modeling; Sampling;
Statistical Analysis
Became SMART
Visual Analytics
Environment for Public
Health Surveillance
Disease Surveillance 2013/07 2013 2014/06 2014 Entered Complete Research 0 2009-ST-061-
CI001
No FALSE David
Ebert
Purdue University AZ; IN Software product that enables analysis
to understand the characteristics of
syndromic diseases and understand
SP 14 Task 2: Public
Safety Consortium
Education 2013/07 2013 2015/06 2015 Entered Complete Seminar/Sympo
sium/Workshop
30804 2009-ST-061-
CI001
No FALSE FL; IN; NC;
OH
State and Local First
Responders
Process to engage First Responders
used by VACCINE.
Mobile 3D Routing and
Emergency Evacuation in
Dense Urban
Environments
Resource Allocation 2013/06 2013 2015/07 2015 Entered Complete Research 0 2009-ST-061-
CI001
No FALSE William
Ribarsky
University of North
Carolina at Charlotte
NC 2011 Tools The University of North Carolina at
Charlotte has delivered an evacuation
decision support system and Urban
Emergency Response search and
command center tools to the UNC
Charlotte Police and Public Safety
Department. The tools have been used
in the Canada-US Experiment
Resiliency Environment demonstration
in Seattle at which DHS managers were
in attendance
tbescher
Typewritten Text
VIII. List of All Funded Projects

UKVAC II Resource Allocation 2012/10 2012 2013/12 2013 Entered Complete Research 0 2009-ST-061-
CI001
No FALSE Min Chen IN 2015 Statistical Analysis Computer Science Pilot/Field Testing and
Evaluation in an
Operational
Environment
Published An information-theoretic framework for
anomaly detection was formulated. A
study on visual representations was
conducted. With the help of Purdue, a
prototype demonstration system for
illustrating the potential us of information
theoretic quantities in the visual
analytics process for handling the FD
data was delivered. And a high-level
visual analytics cycle was formulated by
dividing visual analytics tasks into three
groups, monitoring, analysis and model
refinement.
1 journal article - See
Journal Tab for more
detailed information.
5 presentations - See Presentations Tab for more
detailed information.
(VALET) Developing a
spatial statistics
framework in the visual
analytics for law
enforcement technology
suite
Law Enforcement 2012/07 2012 2017/08 2017 Entered In
Progress
Dynamic,
On-
demand
Data
Analysis
and
Visualizatio
n
Research 190380 2009-ST-061-
CI001
No Data Mining FALSE David
Ebert
Purdue University Morgan
State
University
IL; IN; NY;
OH
State and Local Emergency
Managers; State and Local
First Responders
2015 Emergency
Preparedness
and Response;
Risk and
Decision
Sciences
Case Studies; Risk
Assessment; Statistical
Analysis
Geographic information
sciences; Information
Science; Computer
Science; Criminology;
Biostatistics and
bioinformatics
Pilot/Field Testing and
Evaluation in an
Operational
Environment
Tool The VALET application has been
deployed to several law enforcement
agencies. It is licensed by Purdue in
2015 to be used exclusively by Davista
Technologies, LLC.
3 journal articles - See
Journal Tab for more
detailed information.
4 other publications -
See Other
Publications Tab for
more information.
1 student thesis - See
Theses Tab for more
detailed information.
29 Presentations - See Presentations Tab. 2 patents - See Patent Tab for more
detailed information.
(MADIS) A Data Integration
Framework for Enhancing
Emergency Response
Situation Reports with Multi
Agency, Multi-Partner
Multimedia Data
Resource Allocation 2012/07 2012 2015/07 2015 Entered Complete Research 318125 2009-ST-061-
CI001
No Compiling and Sorting
Database
FALSE Shu-Ching
Chen; Shu-
Ching
Chen
Florida International
University; Florida
International University
FL; IN State and Local Emergency
Managers
2016 Advanced Data
Analysis and
Visualization;
Emergency
Preparedness
and Response;
Risk and
Decision
Sciences
Case Studies; Modeling; Risk
Assessment; Sampling;
Statistical Analysis
Preparedness training;
Computer Science; Risk
management/assessme
nt
Pilot/Field Testing and
Evaluation in an
Operational
Environment
Tool MADIS is in use/tested by Miami-Dade
Department of Emergency
Management.
15 journal articles -
See Journal Tab.
(iLEAPS) iLaw
Enforcement Apps
Assistance Program for
Students
Resource Allocation 2012/07 2012 2014/12 2014 Entered Complete Research 118496 2009-ST-061-
CI001
No Survey FALSE Tim Akers Morgan State University Morgan
State
University
MD State and Local Emergency
Managers; State and Local
First Responders
2015 06/2016 Advanced Data
Analysis and
Visualization;
Emergency
Preparedness
and Response
Case Studies; Risk
Assessment
Computer Science Pilot/Field Testing and
Evaluation in an
Operational
Environment
Tool It was demonstrated to Morgan State
University Police Chief Hatcher, and he
called for meeting to introduce iLEAPS
to the entire police force. Five additional
students have been trained to conduct
mobile, specifically to continue the
development using the Android
Software Development kit, and Xcode
for iOS development. New capabilities
to extend the utility of iLeaps have been
added, including native notifications,
ability to send pictures, and for dispatch
to see the location for all officers on
campus.
3 presentations - See Presentations Tab for more
information
(GARI) Gang Graffiti
Recognition and Analysis
Law Enforcement 2012/07 2012 2017/06 2017 Entered In
Progress
Research 107941 2009-ST-061-
CI001
No Expert Consultation FALSE Edward
Delp; Ed
Delp
Purdue University;
Purdue University
Navajo
Technical
University
IN; CA; AZ;
IL
Center for Visual
Analytics for
Command,
Control, and
Interoperability
Environments
State and Local Emergency
Managers; State and Local
First Responders
2016 Advanced Data
Analysis and
Visualization;
Risk and
Decision
Sciences
Case Studies; Modeling;
Qualitative Analysis; Risk
Assessment; Statistical
Analysis
Geographic information
sciences; Information
systems; Computer
Science; Criminology
Operational Use Tool GARI was deployed to the Indianapolis
Metropolitan Police, Indiana Intelligence
Fusion Center Gang Task Force,
INGang, program, Cook County
Sherriff's Department, Navajo Nation,
and the Illinois State Police. Additionally,
a number of other law enforcement
entities (approximately 400) have
expressed interest in using and
deploying the tool. A community version
was developed, but not deployed due to
privacy reasons.
14 journal articles -
See Journal Tab for
more detailed
information.
2 student theses -
See Theses Tab for
more detailed
information.
5 presentations - See Presentations Tab for more
detailed information.
COAST: Coastal
Operations and Analysis
Suite of Tools
Resource Allocation 2012/07 2012 2014/06 2014 Entered Complete Research 0 2009-ST-061-
CI001
No Data Mining FALSE David
Ebert
Purdue University IN DHS U.S. Coast Guard 2015 Modeling; Sampling;
Statistical Analysis
Computer Science Verification &
Validation
Tool Coast Guard Headquarters (CG-771)
utilizes the COAST software to
generate images used in the reports
used for operations planning
10 presentations - See Presentations Tab for more
detailed information.
Multimedia, Social Media,
Text, and Emergency
Response Analytics
Social Media Tools 2012/07 2012 2016/12 2016 Entered Complete Research 0 2009-ST-061-
CI001
No Compiling and Sorting
Database
FALSE David
Ebert;
William
Ribarsky
Purdue University;
University of North
Carolina at Charlotte
IN; MN;
NC; SC;
TX; MD
Banking Industry; DHS Labs;
State and Local Emergency
Managers; State and Local
First Responders; Other State
or Local
2016 Advanced Data
Analysis and
Visualization;
Social,
Behavioral, and
Economic
Sciences
Case Studies; Modeling;
Statistical Analysis
Computer Science;
Sociology
Adopted by End User,
Operational Use,
Pilot/Field Testing and
Evaluation in an
Operational
Environment
Tool A stand-alone version of the critical
infrastructure modeling system plus the
collection of cascading breakdown
results for a large ensemble of
hurricane paths has been deployed.
The visualization interface is accessible
as a web service by a range of devices
anywhere on the internet. Case studies
are being ran for Charlotte Mecklenburg
EMS and NC Public Health and
Preparedness. The partnership with the
Electric Power Research Institute
(EPRI) continues. A prototype to
respond to the effects of large storms
as they develop is being set up. Funding
from the Department of Energy and
other sources is being sought.
34 journal articles -
See Journal Tab for
more detailed
information.
2 student theses -
See Theses Tab for
more detailed
information.
9 presentations - See Presentations Tab for more
detailed information.
Spatiotemporal Social
Media Analytics for
Abnormal Event Detection
Social Media Tools 2012/07 2012 2013/06 2013 Entered Complete 0 2009-ST-061-
CI001
No FALSE Tom Ertl Abnormal event detection feature added
to SMART.
(GeoTxt) E2E: GeoTxt API Social Media Tools 2012/06 2012 2017/06 2017 Entered In
Progress
Research 155665 2009-ST-061-
CI001
No Data Mining FALSE Alan
MacEachr
en; Alan
MacEachr
en
Pennsylvania State
University; Pennsylvania
State University
PA Academic Community; State
and Local First Responders
2016 Advanced Data
Analysis and
Visualization;
Communications
and
Interoperability
Case Studies; Modeling;
Sampling; Statistical Analysis
Information systems;
Computer Science;
Geography
Laboratory Testing and
Evaluation
Tool The throughput of GeoTxt was
improved substantially by reengineering
the system to take full advantage of
both advanced text indexing methods
and high-performance computing. The
first Gold Standard corpus of
geolocated places in tweets was
produced that can be used to test and
train any geoparsing tools. A geovisual
analytics application has been
developed to support building
geolocation corpra. GeoTxt has been
integrated as the backend geographic
entity recognition, disambiguation, and
co-coding systems to support
SensePlace 2, our spatial-temporal
twitter analytics environment. The early
stages of SensePlace 2 (and its
precursor SensePlace) were funded
through VACCINE. GeoTxt has been
made available to other VACCINE
partners. We have worked actively with
partners at both Purdue and UNCC to
test use of the GeoTxt API from
software applications under
development by those teams.
6 journal articles - See
Journal Tab for more
detailed information.
1 other publication -
See Other
Publications Tab for
more information.
4 student theses -
See Theses Tab for
more detailed
information.
8 presentations - See Presentations Tab for more
detailed information.
Symbology
Standardization Support
Law Enforcement 2012/06 2012 2014/07 2014 Entered Complete Research 972488 2009-ST-061-
CI001
No Expert Consultation FALSE Alan
MacEachr
en
Pennsylvania State
University
PA DHS Federal Emergency
Management Agency; DHS
U.S. Customs and Border
Protection; Food and Drug
Administration; Other Industry
2013 06/2013 Advanced Data
Analysis and
Visualization
Case Studies; Sampling;
Statistical Analysis
Geographic information
sciences; Information
Science;
Communication (risk,
scientific, technical)
Operational Use Tool Development of a revised Symbol
Store, featuring a new interface design,
improved symbol uploading workflow,
new downloadable formats, and
integration with Drupal to support
interactive refinement of user-
contributed symbol sets. Provision of
these improvements in a public-facing
Symbol Store. Presented Symbol Store
to DHS and other Federal Stakeholders
in an in-person workshop and an online
webcast to encourage adoption and
solicit feedback.
4 journal articles - See
Journal Tab for more
detailed information.
5 other publications -
See Other
Publications Tab for
more information.
17 presentations - See Presentations Tab for more
detailed information.
(VASA) – Visual Analytics
for Security Applications
Resource Allocation 2012/06 2012 2014/11 2014 Entered Complete Research 1185816 2009-ST-061-
CI001
Yes Data Mining FALSE Public Safety
Coalition Project
David
Ebert,
Isaac Cho
Purdue University IN; MN;
NC; TX
Food Protection
and Defense
Institute
State and Local Emergency
Managers; State and Local
First Responders
2015 05/2016 Advanced Data
Analysis and
Visualization;
Infrastructure
Protection
Case Studies; Modeling; Risk
Assessment; Sampling;
Statistical Analysis
Engineering; Computer
Science; Risk
management/assessme
nt
Pilot/Field Testing and
Evaluation in an
Operational
Environment
Tool VASA is a visual analytics platform
targeting this setting and consists of a
desktop application, a component
model, and a suite of distributed
simulation components for modeling the
impact of societal threats such as
weather, food contamination, and traffic
on critical infrastructure such as supply
chains, road networks, and power grids.
Each component encapsulates high-
fidelity simulation models that together
form an asynchronous simulation
pipeline: a system of systems of
individual simulations with a common
data and parameter exchange format.
2 journal articles - See
Journal Tab for more
detailed information.
3 presentations - See Presentations Tab for more
information
MDRP 18: COE-Explorer
(Visual Analytics for the
DHS Centers of
Excellence)
Law Enforcement 2012/06 2012 2014/07 2014 Entered Complete Research 32170 2009-ST-061-
CI001
No Compiling and Sorting
Database
FALSE David
Ebert,
Nicklas
Elmqvist
Purdue University CA; GA; IL;
NJ; IN
Center for
Command,
Control, and
Interoperability
Center for
Advanced Data
Analysis
Academic Community; DHS
Labs; DHS Science and
Technology Directorate; Media;
U.S. Department of Commerce
2013 Advanced Data
Analysis and
Visualization
Case Studies; Sampling;
Statistical Analysis
Computer Science Operational Use,
Pilot/Field Testing and
Evaluation in an
Operational
Environment
Tool The COE Explorer project was
delivered and in use. This is not only a
good example of collaboration between
the two DHS CCI centers—VACCINE
and CCICADA—but it has also seen
wide impact for exposing the research
mission of the VACCINE center to the
general public. The tool has been a
"featured project" on the VACCINE
website for several months, and PI
Elmqvist is regularly contacted with
questions about the tool, its capabilities,
and the data it is visualizing.
Furthermore, the tool has also been
highly successful with its intended
audience: investigators, program
officers, and policymakers.
2 journal articles - See
Journal Tab for more
detailed information.
4 other publications -
See Other
Publications Tab for
more information.
1 student thesis - See
Theses Tab for more
detailed information.
6 presentations - See Presentations Tab for more
detailed information.
1 patent - See Patent Tab for more
detailed information.
MDRP 6: Video
Surveillance Visual
Analytics
Resource Allocation 2012/06 2012 2014/07 2014 Entered Complete Research 24874 2009-ST-061-
CI001
No Expert Consultation FALSE Brian
Fisher
IN; NC State and Local Emergency
Managers
2013 Advanced Data
Analysis and
Visualization;
Border Security;
Emergency
Preparedness
and Response
Case Studies; Modeling; Risk
Assessment; Sampling;
Statistical Analysis
Geographic information
sciences; Computer
Science; Sociology
Pilot/Field Testing and
Evaluation in an
Operational
Environment,
Prototype
Demonstration
Research There has been successful work in
translating the work done in the lab to
practices in emergency management in
the City of Richmond. Our researchers
consult on policy decisions with the
Richmond emergency manager.
Approval has been gained for new
financial support from PSTP for our
collaboration with the City of Richmond
and City of Vancouver and have added
the City of Delta as a third municipality.
This will fund both our group and end-
users to work with us on our projects,
enabling us to build effective
participatory design with end users, with
should support buy-in and real-world
success for our VEOC.
21 journal articles -
See Journal Tab for
more detailed
information.
5 other publications -
See Other
Publications Tab for
more information.
1 student thesis - See
Theses Tab for more
detailed information.
2 presentations - See Presentations Tab for more
detailed information.
(Crowdsourcing)
Combining Crowdsourcing
technology with machine
learning to do visual
analytics on big qualitative
data (video datasets).
Law Enforcement 2012/06 2012 2014/07 2014 Entered Complete Research 139700 2009-ST-061-
CI001
No Expert Consultation FALSE David
Kirsh
University of California
San Diego
CA; IN State and Local Emergency
Managers; State and Local
First Responders
2014 Communications
and
Interoperability;
Emergency
Preparedness
and Response;
Human Factors
Aspects of
Technology
Case Studies; Sampling;
Statistical Analysis
Computer Science Laboratory Testing and
Evaluation
Tool A user friendly system that is easy to
manage at the back-end and easy to
work in on the client side was created.
Pilot work has shown that students find
it natural to work in the client. The
system is currently being re-
implemented to increase robustness
and to accommodate user feedback.
More research is needed to better
determent the cost structure of scaling
up to larger video sets and to real-time
analysis and reporting. The practical
value of this system depends on the
reason a group might want it. Police
need to review video to document
reports and provide evidence. Crowd
sourcing can save time in that task. Our
original goal remains to provide real
time assistance for monitoring
thousands of video in real-time. That
application is of value in hundreds of
scenarios, including police surveillance,
search and rescue and border
crossing.

Bristle Maps - A
Multivariate Abstraction
Technique for
Geovisualization
Law Enforcement 2012/06 2012 2014/07 2014 Entered Complete Research 0 2009-ST-061-
CI001
No FALSE David
Ebert
Purdue University AZ; IN Tool Prototyped and evaluated in VALET
system.
1 journal article - See
Journal Tab for more
detailed information.
1 presentation - See Presentations Tab for more detailed
information.
iOPAR - Operational
Performance Assessment
Reports
Resource Allocation 2012/06 2012 2013/07 2013 Entered Complete Research 0 2009-ST-061-
CI001
No Compiling and Sorting
Database
FALSE David
Ebert
Purdue University AK; AZ;
NY; IN
DHS U.S. Coast Guard 2015 Sampling; Statistical Analysis Computer Science Tool Delivered and in use; the prototype is
being evaluated.
1 presentation - See Presentations Tab for more detailed
information.
Mobile 3D Routing,
Emergency Evacuation,
and In-Field Criminal
Investigative Analytics
Law Enforcement 2012/06 2012 2013/09 2013 Entered Complete Research 0 2009-ST-061-
CI001
No FALSE William
Ribarsky;
William
Ribarsky
University of North
Carolina-Charlotte;
University of North
Carolina at Charlotte
NC Tool A mobile application was developed
with graphs for all the academic
buildings on the UNC Charlotte campus
and embedded them in the street
network. We participated in the DHS
Canada-US Experiment (CAUSE-ERE)
based in Seattle for response to a
Northwestern earthquake and will
participate in follow-up activities. We
are also working with the Charlotte-
Mecklenburg Police Department
(CMPD) to develop a training exercises
using this environment. The improved
system will be tested with other police
departments and is being deployed with
UNC Charlotte Police, CMPD, and
others.
Personal Visual Analytics
Workshop
Education 2012/03 2012 2012/06 2012 Complete Seminar/Sympo
sium/Workshop
12000 2009-ST-061-
CI001
No FALSE Melanie
Tory
University of Victoria PA 06/2016 Workshop Created Personal Visual Analytic Workshop
Banff Workshop Education 2011/09 2011 2011/09 2011 Entered Complete Seminar/Sympo
sium/Workshop
30000 2009-ST-061-
CI001
No FALSE 2011 Workshops created
(MERGE) Mobile
Emergency Response
Guide
Law Enforcement 2011/08 2011 2014/08 2014 Entered Complete Research 41643 2009-ST-061-
CI001
No Field Monitors FALSE Edward
Delp; Ed
Delp
Purdue University;
Purdue University
IN; CA; OH State and Local Emergency
Managers; State and Local
First Responders; Other DHS
2014 Emergency
Preparedness
and Response;
Explosives
Detection,
Mitigation and
Response
Data
Collection/Generation
Case Studies; Modeling;
Sampling; Statistical Analysis
Engineering; Computer
Science
Operational Use Tool MERGE has been deployed to several
law first responders groups and it has
received very positive responses from
our targeted user groups which include:
the Lafayette, West Lafayette,
Indianapolis, and St. Clair, MI Fire
Department. MERGE was recently
demonstrated to a manufacturer of
detection sensors, who is interested in
licensing the MERGE source code.
7 journal articles - See
Journal Tab for more
detailed information.
2 student theses -
See Theses Tab for
more detailed
information.
SP 10: Physical Extraction
& Reconstruction of
Evidence from Mobile
Phones Using JTAG Test
Ports
Law Enforcement 2011/07 2011 2012/06 2012 Entered Complete Research 198565 2009-ST-061-
CI001
No FALSE
Coast Guard Swimmer
Deaths
Resource Allocation 2011/07 2011 2012/06 2012 Entered Complete Research 0 2009-ST-061-
CI001
No Compiling and Sorting
Database
FALSE David
Ebert
Purdue University IN; MI 2011 Research Analysis was completed on the
frequency of swimmer deaths, the time-
of-day and location. Analysis was also
completed for boating deaths. The
findings were summarized and the
Coast Guard used these results in their
operational planning for fiscal year 2011
and also in designing the public service
message campaigns. There was a drop
of almost 37% in swimmer deaths in
2011. Finished.
4 presentations - See Presentations Tab for more
detailed information.
LAHVA: Linked Animal-
Human Health Visual
Analytics
Disease Surveillance 2011/07 2011 2012/06 2012 Entered Complete Research 0 2009-ST-061-
CI001
Yes Compiling and Sorting
Database
FALSE David
Ebert
Purdue University NC; IN 2012 Statistical Analysis Basic Research Research Software product that linked animal and
human health records from the state
department of health and veterinary
2 presentations - See Presentations Tab for more
detailed information.
High Risk Alcohol Behavior
Analysis
Law Enforcement 2011/07 2011 2012/06 2012 Entered Complete Research 0 2009-ST-061-
CI001
Yes Compiling and Sorting
Database
FALSE David
Ebert
Purdue University IN State and Local First
Responders
2011 Statistical Analysis Computer Science The output of the analysis was used to
create an awareness presentation for
Purdue students, guide intervention
activities and to develop intervention
policy iVALET - Mobile Visual
Analytics Law
Enforcement Toolkit
Law Enforcement 2011/07 2011 2017/06 2017 Entered Complete Research 0 2009-ST-061-
CI001
No Compiling and Sorting
Database
FALSE David
Ebert
Purdue University Morgan
State
University
IN Center for Visual
Analytics for
Command,
Control, and
Interoperability
Environments
State and Local First
Responders
2016 Modeling; Sampling;
Statistical Analysis
Computer Science Operational Use Tool The mobile version of VALET (iVALET)
continues to be a popular option for law
enforcement officers depending upon
their roles and responsibilities. VALET
has been utilized to devise novel data
guided patrolling strategies and has led
to a paradigm operational shift at
several police departments. VALET has
also supported investigative analysis
tasks at the departments who utilize the
system. In keeping with the goal of
transitioning this software, we have
licensed the technology to a startup
company called Davista Technologies,
LLC that was born out of the VACCINE
center.
5 presentations - See Presentations Tab for more
detailed information.
NHANES Exploration Financial Flows Tools 2011/07 2011 2016/07 2016 Entered Complete Research 0 2009-ST-061-
CI001
No FALSE David
Ebert;
Tom Ertl
Purdue University; Delivered to nutrition researcher.
Visual Analytics Decision
Support Environment for
Epidemic Modeling and
Response Evaluation;
Public Safety Coalition
Projects
Disease Surveillance 2011/07 2011 2012/06 2012 Entered Complete Other (enter
short
description)
0 2009-ST-061-
CI001
No Compiling and Sorting
Database
FALSE David
Ebert
Purdue University AZ; IN 2010 Modeling; Sampling;
Statistical Analysis
Tool There are two software products to date
from this project. The first system
enables visual analytic decision making
and evaluation of interdiction measures
for Rift Valley fever (RVF), a zoonotic
disease that could have a devastating
impact on the US cattle industry. The
second system allows visual analytic
decision making to respond to and
curtail the spread of pandemic
influenza. This project has shown the
potential of integrated simulation, visual
analysis, and linked interactive
spatiotemporal displays with decision
space displays for evaluating and
optimizing multiple interdiction
strategies. RVF: Partnered with DHS
SP 14 Task 1 - Extend
COE Explorer
Education 2011/07 2011 2012/06 2012 Entered Complete Research 62466 2009-ST-061-
CI001
No FALSE Niklas
Elmqvist
Purdue University Multimodal graph visualization is an
ongoing research topic in the visual
Cyber Education Education 2011/06 2011 2014/07 2014 Entered Complete 100000 2009-ST-061-
CI001
No FALSE Niklas
Elmqvist
Purdue University Course A graduate course was created. 1 other publication -
See Other
Publications Tab for
more information
1 presentation - See Presentations Tab for more detailed
information.
Coast Guard PROTECT
Visualization
Resource Allocation 2011/06 2011 2013/07 2013 Entered Complete Research 0 2009-ST-061-
CI001
No Compiling and Sorting
Database
FALSE David
Ebert
Purdue University AZ; IN Center for Risk
and Economic
Analysis of
Terrorism Events
DHS U.S. Coast Guard 2011 Case Studies; Modeling;
Sampling; Statistical Analysis
Geography Prototype
Demonstration
Prototype VACCINE, in conjunction with the
CREATE Center, analyzed the
PROTECT model for security patrols in
Boston and made recommendations for
improvements for deployment in New
York City. Summary of Transition and
Deployment - PROTECT - Port
Resilience Operational / Tactical
Enforcement to Combat Terrorism •
Collaboration with CREATE • Prototype
July 26, 2011. Completed.
1 journal article - See
Journal Tab for more
detailed information.
2 presentations - See Presentations Tab for more
detailed information.
MarketAnalyzer: An
Interactive Visual Analytics
System for Analyzing
Competitive Advantage
Using Point of Sale Data
Financial Flows Tools 2011/06 2011 2013/07 2013 Entered Complete Research 0 2009-ST-061-
CI001
No FALSE David
Ebert
Purdue University IN; AZ Research Delivered to corporate partner. 1 journal article - See
Journal Tab for more
detailed information.
SP 8: Disposable Cell
Phone Analysis
Law Enforcement 2010/10 2010 2012/03 2012 Entered Complete Research 149811 2009-ST-061-
CI001
No FALSE David
Ebert
Purdue University A final report was submitted to DHS
outlining the findings
Justice Institute of British
Columbia and VACCINE
Collaborative Workshops
Education 2010/09 2010 2010/09 2010 Complete Seminar/Sympo
sium/Workshop
46000 2009-ST-061-
CI001
No FALSE Workshops were created
SP 2: CCC Tech Support Law Enforcement 2010/07 2010 2011/06 2011 Entered Complete Research 98660 2009-ST-061-
CI001
No FALSE Alan
MacEachr
en; Alan
MacEachr
en
Pennsylvania State
University; Pennsylvania
State University
PA; IN Tech Support Provided
SP 7: User Adoption
Learning Tool (Ulearning)
Education 2010/07 2010 2011/06 2011 Entered Complete 83829 2009-ST-061-
CI001
No FALSE David
Ebert
IN 2011 Tool Based on availability of funding, the plan
was to target the state of Indiana as a
large pilot project and give those first
responders supported access to the
uLearning Platform in exchange for
feedback to further the development of
the Platform. First responders were
interviewed and their input was
recorded by Captico. However, in the
summer of 2011 the project was
postponed due to lack of funding.
Summary of Transition and
Deployment: Ulearning (Captico)-
Training portal for S&T and COE
Technologies • Deployed for Test &
E l ti F db k M h 2011Analytical Visualization of
the Port Arthur, TX
Economic Impact Study
Resource Allocation 2010/07 2010 2011/06 2011 Entered Complete Research 0 2009-ST-061-
CI001
No Expert Consultation FALSE David
Ebert
Purdue University AZ; IN Center for Risk
and Economic
Analysis of
Terrorism Events
DHS U.S. Coast Guard 2011 Case Studies; Modeling;
Sampling; Statistical Analysis
Operational Use Tool VACCINE personnel have developed a
visual analytics environment for the
analysis, exploration and decision
making of the effects of a port closure in
Port Arthur, TX. The tools created run
on Windows PCs and provide users
with a graphical user interface with
which to explore the economic impact
data by market sector and by mitigation
t t C l t d d d li d t PlumeViz Law Enforcement 2010/07 2010 2011/06 2011 Entered Complete Research 0 2009-ST-061-
CI001
No FALSE David
Ebert
Purdue University IN Completed live demonstration in
fullscale exercise in Pugent Sound with
Symbology Map Transition Resource Allocation 2010/07 2010 2016/07 2016 Entered Complete Research 0 2009-ST-061-
CI001
No Survey FALSE Alan
MacEachr
en; Alan
MacEachr
en
Pennsylvania State
University; Pennsylvania
State University
IN; PA DHS Federal Emergency
Management Agency; DHS
Transportation Security
Administration; DHS U.S.
Coast Guard; State and Local
First Responders; Other
Federal Agency
2014 06/2013 Case Studies Geography Pilot/Field Testing and
Evaluation in an
Operational
Environment
Tool Multiple improvements to the Symbol
Store application have been made due
to feedback from work with users.
Additionally, the Symbol Store API has
been enhanced and simplified to allow a
developer to easily search and access
symbols in the Symbol Store.
3 journal articles - See
Journal Tab for more
detailed information.
1 other publication -
See Other
Publications Tab for
more information.
2 presentations - See Presentations Tab for more
detailed information.
Video Surveillance Project Law Enforcement 2010/07 2010 2011/06 2011 Entered Complete Research 0 2009-ST-061-
CI001
No FALSE David
Ebert
Purdue University IN
Seed 3: Uncertainty in
Video Visual Analytics
Law Enforcement 2010/07 2010 2012/06 2012 Entered Complete 0 2009-ST-061-
CI001
No Field Monitors FALSE David
Ebert
Purdue University IN 2010 Sampling Method? We have developed a real-time method
for transforming video information in
quasi-3D to spatial information in a 2D
planar visualization, which acts as a live
layer on top of a conventional satellite
image-based mapping system. We
have also developed several schemes
for visually mapping information
extracted from videos, including traffic
speed and density, and uncertainty in
illustration. This form of traffic video
visualization can potentially reduce the
need for specialized traffic sensory
devices and infrastructure, and enable
better utilization of the existing video-
based traffic sensory network.
1 journal article - See
Journal Tab for more
detailed information.
SP 15 Task 2: VASA Resource Allocation 2010/07 2010 2011/06 2011 Entered Complete 74918 2009-ST-061-
CI001
No FALSE William
Ribarsky,
Isaac Cho
Office of University
Programs, Science &
Technology Directorate
CA; NC;
PA; SC;
VA
2010 Hypothetical stores in North Carolina
damaged by Hurricane Irene were
looked at In our visual analytics
SP 16 - VASA Resource Allocation 2010/07 2010 2011/06 2011 Entered Complete Research 1085896 2009-ST-061-
CI001
No FALSE William
Ribarsky
Hypothetical stores in North Carolina
damaged by Hurricane Irene were
(CgSARVA) Coast Guard
Search and Rescue Visual
Analytics
Resource Allocation 2010/06 2010 2014/09 2014 Entered Complete Research 87600 2009-ST-061-
CI001
No Expert Consultation FALSE David
Ebert
Purdue University IN DHS U.S. Coast Guard 2013 Advanced Data
Analysis and
Visualization;
Risk and
Decision
Sciences
Case Studies; Modeling; Risk
Assessment; Sampling;
Statistical Analysis
Engineering; Geographic
information sciences;
Computer Science; Risk
management/assessme
nt; Biostatistics and
bioinformatics
Operational Use Tool cgSARVA is deployed and in use by the
United States Coast Guard.
2 journal articles - See
Journal Tab for more
detailed information.
13 presentations - See Presentations Tab for more
detailed information.

Hazmat Placards Law Enforcement 2010/06 2010 2010/08 2010 Entered Complete Research 94139 2009-ST-061-
CI001
No FALSE Edward
Delp
Purdue University IN Research Placards were created for research use
with application
1 presentation - See Presentations Tab for more detailed
information
RECONNECT Workshop
2010 - Extracting and
Visualizing Information
from Natural Language
Text
Education 2010/06 2010 2010/06 2010 Entered Complete Information-
driven
Visualizatio
n, Modeling
and
Simulation
of Data
Seminar/Sympo
sium/Workshop
0 200 No Data Mining FALSE Eduard
Hovy
University of Southern
California
CA; NJ Academic Community; Federal
Bureau of Investigation;
Intelligence Community; U.S.
Department of Defense
2010 06/2010 Advanced Data
Analysis and
Visualization;
Communications
and
Interoperability;
Social,
Behavioral, and
Economic
Sciences
Data
Collection/Generation
Biometrics; Qualitative
Analysis; Sampling
Information Science;
Information systems;
Mathematical and
Computational Modeling;
Rhetoric
Adopted by End User Workshop CCICADA/VACCINE taught the
workshop. The workshop is listed in the
final report in PRS.
TRIP: Trip Response
Investigative Profiler
Law Enforcement 2010/06 2010 2013/07 2013 Entered Complete 0 No FALSE David
Ebert
Purdue University IN; CA Center for Visual
Analytics for
Command,
Control, and
Interoperability
Environments
2007 Tool Collaboration with end-user; Delivered
and in use. Delivered to Indiana
Intelligence Fusion Center.
A Data Integration
Framework for Enhancing
Emergency Response
Situation Reports with Multi
Agency, Multi-Partner
Multimedia Data; Public
Safety Coalition Projects
Resource Allocation 2010/04 2010 2011/03 2011 Entered Complete Research 0 2009-ST-061-
CI001
No Data Mining FALSE Shu-Ching
Chen
Florida International
University
FL; IN DHS Federal Emergency
Management Agency; State
and Local First Responders
2014 Case Studies; Modeling;
Sampling; Statistical Analysis
Computer Science Pilot/Field Testing and
Evaluation in an
Operational
Environment
Tool A Disaster Multimedia Search Engine is
developed as an iPad application and
can be used for retrieving and
visualizing the categorized disaster
multimedia data. The underlying key
techniques include various multimedia
semantic analysis and retrieval
methods developed by our group. We
also develop web-based systems for
storyline generation and disaster
susceptibility comparisons among cities
based on text mining and visualization
techniques. The developed methods will
greatly improve situation awareness
during or after disasters.
12 journal articles -
See Journal Tab for
more detailed
information.
3 presentations - See Presentations Tab for more
information
SP 15-Task 3: Event
Evacuation Planning;
Public Safety Coalition
Projects
Resource Allocation 2010/04 2010 2011/03 2011 Entered Complete Research 23748 2009-ST-061-
CI001
No FALSE William
Ribarsky;
William
Ribarsky
University of North
Carolina-Charlotte;
University of North
Carolina at Charlotte
NC State and Local First
Responders
2010 Operational Use Planning and Exercise Situationally-aware evacuation model
with several building examples and
ability to expand to new buildings. The
model is available for use by DHS S&T
stakeholders, customers, and to
partners such as PNNL. We have
begun to prepare for an evacuation
exercise built around a scenario of a
nuclear emergency at the McGuire
Nuclear Power station, about 15 miles
from the UNC Charlotte campus.
Emergency planners and responders,
including UNCC Police, Charlotte
Mecklenburg Emergency Management,
and FEMA observers, will use the on-
campus field house as an evacuation
site. The exercise will take place in
Summer, 2011, and we will provide a
report of results to DHS.
1 presentation - See Presentations Tab for more detailed
information.
SP 14 Task 3: Technical
Integration into ExPOD at
JIBC
Education 2010/04 2010 2011/03 2011 Entered Complete Research 5000 2009-ST-061-
CI001
No FALSE David
Ebert; Alan
MacEachr
en
Purdue University;
Pennsylvania State
University
PA; IN Completed
Visual Analytics Law
Enforcement Technology;
Public Safety Coalition
Projects
Law Enforcement 2010/01 2010 2017/06 2017 Entered In
Progress
0 2009-ST-061-
CI001
No Compiling and Sorting
Database
FALSE David
Ebert
Purdue University AZ; IN State and Local First
Responders
2016 Modeling; Sampling;
Statistical Analysis
Biostatistics and
bioinformatics;
Computer Science
Operational Use Tool On Friday, September 30, a
demonstration of two new
enhancements to the Visual Analytics
Law Enforcement Toolkit (VALET) was
provided to the Lafayette Police
Department, West Lafayette PD and
others. This presentation showcased
how VALET filters through crime-related
activities within various areas of our
community and selects officers to be
sent to the corresponding locations
based upon their performance ranking.
In general, these luncheons provided a
f t id t l/t h l
2 journal articles - See
Journal Tab for more
detailed information.
3 presentations - See Presentations Tab for more
information
1 patent - See Patent Tab for more
information.
MDRP 3: (GeoViz &
CrimeViz) Situational
Surveillance & In-field
Criminal Investigative
Analytics
Law Enforcement 2009/07 2009 2013/06 2013 Entered Complete Research 229728 2009-ST-061-
CI001
No Data Mining FALSE David
Ebert, Alan
MacEachr
en
Purdue University IN; PA; VA;
NJ
Academic Community; Center
for Disease Control and
Prevention; DHS Labs; DHS
Science and Technology
Directorate; State and Local
First Responders
2013 Advanced Data
Analysis and
Visualization;
Biological Threats
and
Countermeasure
s; Social,
Behavioral, and
Economic
Sciences
Case Studies; Econometrics;
Modeling; Molecular
Biology/Genomics; Risk
Assessment; Sampling;
Statistical Analysis
Preparedness training;
Computer Science; Risk
management/assessme
nt; Geography;
Information Science
Operational Use Tool The research produced a detailed
analysis of the current role of interactive
maps in law enforcement and insights
on impediments to making use of the
latest advances in technology. It also
generated evidence about the relative
success of different representation and
interface strategies. Implementation of
the CrimeViz software in collaboration
with the Harrisburg Bureau of Police
provided a real-world proof of concept
for the web-based interactive query and
mapping methods developed. Parts of
the results have been translated into
general web-based software
components that can take advantage of
a strategy for multi-component
coordination in JavaScript developed
with separate funding (from the US
Army Corps of Engineers).
21 journal articles -
See Journal Tab for
more detailed
information.
2 other publications -
See Other
Publications Tab for
more information.
3 student theses -
See Theses Tab for
more detailed
information.
30 presentations - See Presentations Tab for more
detailed information.
MDRP 5: Cybersecurity
Visual Analytics
Law Enforcement 2009/07 2009 2010/03 2010 Entered Complete 308619 2009-ST-061-
CI001
No Compiling and Sorting
Database
FALSE David
Ebert
Purdue University CA; IN Academic Community; Critical
Infrastructure Owners and
Operators; DHS Labs;
Intelligence Community
2010 Advanced Data
Analysis and
Visualization;
Infrastructure
Protection; Risk
and Decision
Sciences
Case Studies; Modeling;
Statistical Analysis
Biostatistics and
bioinformatics;
Computer Science
Laboratory Testing and
Evaluation
Tool The two principal accomplishments
have been (1) transfer of the Isis
forensic tool to a pilot study with the US-
CERT Enhanced Analytic Database
Capability, and (2) incorporation of our
SSH keystroke detection algorithm into
Argus Release 3.0.4
8 presentations - See Presentations Tab for more
detailed information.
MDRP 7: Introducing
Sustainable Visual
Analytics into Command
Center Environments
Law Enforcement 2009/07 2009 2013/06 2013 Entered Complete Research 5080 2009-ST-061-
CI001
No Expert Consultation FALSE David
Ebert
Purdue University IN; TX; WA Center for Disease Control and
Prevention; Critical
Infrastructure Owners and
Operators; DHS U.S. Coast
Guard; Federal Bureau of
Investigation; State and Local
First Responders
2010 Communications
and
Interoperability;
Emergency
Preparedness
and Response;
Human Factors
Aspects of
Technology
Case Studies; Modeling;
Sampling; Statistical Analysis
Modeling Under an SBIR led by Truestone, Inc.,
we teamed with FAZD (Texas A&M) and
VACCINE (Purdue) to deliver and
assess the second iteration of a next-
generation CCI system. Thanks to our
ongoing collaboration with the Puget
Sound Port Readiness Committee
(PRC), we were able to plan and
conduct a computer supported “worst-
case” table-top exercise in the Fall
using a “Truevue dashboard” to present
the scenario and share information
among the participants. There was
general agreement within the PRC that
there would be significant benefit from
such an exercise, especially
considering that there would be a
change of command within the Army’s
833rd Transportation Battalion during
the summer. Completed.
1 journal article - See
Journal Tab for more
detailed information.
2 other publications -
See Other
Publications Tab for
more information.
1 student thesis - See
Theses Tab for more
detailed information.
4 presentations - See Presentations Tab for more
detailed information.
MDRP 9: (Rosetta Phone)
Mobile Imaging, Rosetta
Phone, and Light-Weight
Visual Analytics for In-Field
Analytics
Resource Allocation 2009/07 2009 2013/06 2013 Entered Complete Research 0 2009-ST-061-
CI001
No Bench Tests FALSE David
Ebert
Purdue University IN Academic Community; Center
for Disease Control and
Prevention; Critical
Infrastructure Owners and
Operators; DHS U.S. Coast
Guard; DHS U.S. Customs and
Border Protection
2012 Advanced Data
Analysis and
Visualization;
Biological Threats
and
Countermeasure
s; Border Security
Biometrics; Case Studies;
Econometrics; Genomic
Testing; Modeling; Molecular
Biology/Genomics; Risk
Assessment; Sampling;
Statistical Analysis
Report The project resulted in the DHS report
we wrote that is available at:
https://www.dhs.gov/publication/chicag
o-lte-video-pilot-report. Completed.
MDRP 11: Financial Fraud
Visual Analytics
Financial Flows Tools 2009/07 2009 2014/06 2014 Entered Complete Research 417775 2009-ST-061-
CI001
No Compiling and Sorting
Database
FALSE William
Ribarsky
University of North
Carolina at Charlotte
IN; NC; MA Academic Community;
Consumers; Critical
Infrastructure Owners and
Operators; Federal Bureau of
Investigation; Intelligence
Community
2010 Advanced Data
Analysis and
Visualization;
Infrastructure
Protection;
Social,
Behavioral, and
Economic
Sciences
Case Studies; Econometrics;
Modeling; Risk Assessment;
Statistical Analysis
Computer Science Tool A procedure for creating simulated bank
transaction datasets has been
developed. The WireVis tool for
analyzing bank transactions over
extended periods of time is available to
DHS partners and customers. We are
expanding its capabilities to analyze the
unstructured text fields that accompany
transactions and that describe the
purpose of a transaction, identify
payees, and give other information.
There are currently no automated
methods to study these fields and
connect them to the transactional
d
4 journal articles - See
Journal Tab for more
detailed information.
2 student theses -
See Theses Tab for
more detailed
information.
2 presentations - See Presentations Tab for more
detailed information.
MDRP 12: Foreign Animal
and Zoonotic Disease
Visual Analytics
Disease Surveillance 2009/07 2009 2013/06 2013 Entered Complete Research 19320 2009-ST-061-
CI001
Yes Compiling and Sorting
Database
FALSE David
Ebert
Purdue University TX; IN; PA Academic Community; Center
for Disease Control and
Prevention; Critical
Infrastructure Owners and
Operators; Food and
Agriculture Industries; State
and Local Transportation
2009 Advanced Data
Analysis and
Visualization;
Biological Threats
and
Countermeasure
s; Risk and
Decision
Sciences
Biometrics; Case Studies;
Econometrics; Genomic
Testing; Modeling; Molecular
Biology/Genomics; Risk
Assessment; Sampling;
Statistical Analysis
Risk
management/assessme
nt
Operational Use Tool The team has developed a new strategy
for visualization coordination through
the combination of several recent
advances in software engineering:
automatic introspection of objects,
software design patterns, and reflective
invocation of methods. This strategy is
called Introspective Observer
Coordination and demonstrates how
this method can allow end users to
create their own visualization toolkits on
the fly, solve challenges associated with
coupling spatial analysis methods to
geovisualization methods, and make
geovisualization applications sharable
between users.
1 journal article - See
Journal Tab for more
detailed information.
10 other publications -
See Other
Publications Tab for
more information.
1 student thesis - See
Theses Tab for more
detailed information.
3 presentations - See Presentations Tab for more
information
MDRP 13: GeoJunction:
Collaborative Visual-
Computational Information
Foraging and
Contextualization to
Support Situation
Awareness
Law Enforcement 2009/07 2009 2013/03 2013 Entered Complete Research 0 2009-ST-061-
CI001
No Compiling and Sorting
Database
FALSE David
Ebert, Alan
MacEachr
en
Purdue University IN; CA; PA Center for
Command,
Control, and
Interoperability
Center for
Advanced Data
Analysis
U.S. Army Corps of Engineers 2011 Case Studies; Sampling;
Statistical Analysis
Computer Science Laboratory Testing and
Evaluation
Tool 1. Scalable visual analytic toolkit
SensePlace2. a. Scalability ensured by
innovative database design, indexing
that allows large-scale storage and
retrieval of social text streams such as
those obtained Twitter. b. Improved
algorithms to geo-code mentions of
location names in social text streams in
the presence of limited contextual
information. 2. Timeline functionality that
allows for range queries for temporal
attributes. 3. Improved user interaction
functionality 4. Clustering of similar
tweets in order to enable improved
examination of topics being tweeted. 5.
With complementary funding from
USACE, we developed methods to
flexibly access geographic information
using the standard Geonames
hierarchy of place names for the world.
7 journal articles - See
Journal Tab for more
detailed information.
7 other publications -
See Other
Publications Tab for
more information.
2 student theses -
See Theses Tab for
more detailed
information.
4 presentations - See Presentations Tab for more
detailed information.
MDRP 14: Multimedia
Visual Analytics for
Investigative Analysis
Law Enforcement 2009/07 2009 2014/06 2014 Entered Complete Research 0 2009-ST-061-
CI001
No Data Mining FALSE David
Ebert
Purdue University IN; NC Academic Community; DHS
Labs; DHS Science and
Technology Directorate;
Federal Bureau of Investigation;
Intelligence Community
2010 Advanced Data
Analysis and
Visualization;
Biological Threats
and
Countermeasure
s; Border Security
Case Studies; Modeling;
Sampling; Statistical Analysis
Computer Science Tool Our image analytics and exploration
tools and source code are released to
users at PNNL. They are available to
customers in DHS S&T, if desired. Our
automatic object detection and
classification tools and source code are
released to Vufind.com. They are
available to customers in DHS S&T, if
desired. Our multimedia analytics tools
including StreamIt, Newdle, and PIWI
are available to DHS S&T stakeholders
and customers. Our systems on
multimedia analytics have been
demonstrated at multiple leading
f d i tit t
29 journal articles -
See Journal Tab for
more detailed
information.
11 other publications -
See Other
Publications Tab for
more information.
6 presentations - See Presentations Tab for more
detailed information.
MDRP 18: Visual Analytics
for the DHS Centers of
Excellence
Resource Allocation 2009/07 2009 2012/06 2012 Entered Complete Research 0 2009-ST-061-
CI001
No Compiling and Sorting
Database
FALSE David
Ebert
Purdue University CA; IL; IN;
GA; NJ
Academic Community 2010 Case Studies; Statistical
Analysis
Research Journal articles and presentations were
completed.
3 journal articles - See
Journal Tab for more
detailed information.
2 presentations - See Presentations Tab for more
detailed information.
1 patent - See Patent Tab for more
detailed information.

MDRP 17: START Center
Visual Analytics
Law Enforcement 2009/07 2009 2010/03 2010 Entered Withdrawn Research 5429 2009-ST-061-
CI001
No Bench Tests FALSE David
Ebert
Purdue University MD; NC;
IN; NJ
National
Consortium for
the Study of
Terrorism and
Responses to
Terrorism
Academic Community; DHS
Labs; DHS Science and
Technology Directorate; DHS
U.S. Customs and Border
Protection; Federal Bureau of
Investigation
2009 Advanced Data
Analysis and
Visualization;
Human Factors
Aspects of
Technology;
Social,
Behavioral, and
Economic
S i
Case Studies; Modeling;
Statistical Analysis
Computer Science Withdrawn Demonstrated collaboration between
COEs. Journal articles were completed.
2 journal articles - See
Journal Tab for more
detailed information.
EP 1: Leadership and
Coordination
Education 2009/07 2009 2014/06 2014 Entered Complete Research 0 2009-ST-061-
CI001
No Bench Tests FALSE David
Ebert
Purdue University NJ; GA; IN;
MS; TX
2009 Advanced Data
Analysis and
Visualization;
Biological Threats
and
Countermeasure
s; Border Security
Biometrics; Case Studies;
Econometrics; Genomic
Testing; Modeling; Molecular
Biology/Genomics; Risk
Assessment; Sampling
Computer Science Groups, Panel? 1. The Project PI and support faculty
member visited Purdue University in
November to work on the Education
Plan. 2. The Project PI and support
faculty member participated in monthly
education conference calls as well as
the collaboration calls with Rutgers
University. 3. The 2010 ADMI/A4RC
conference was held on April 8-11,
2010 in Jackson, MS. VACCINE was
spotlighted in two conference sessions
and the evening Social Networking
E t
5 journal articles - See
Journal Tab for more
detailed information.
1 presentation - See Presentations Tab for more detailed
information.
EP 2: MSI Collaboration Education 2009/07 2009 2016/06 2016 Entered Complete Big Data
Visual
Analytics
Research 264029 2009-ST-061-
CI001
No Compiling and Sorting
Database
FALSE David
Ebert
Purdue University Bethune-
Cookman
College;
Jackson
State
University;
Morgan
State
University
FL; MD;
MS; IN; NJ;
TX; CA
Critical Infrastructure Owners
and Operators; Department of
Energy National Labs; Federal
Bureau of Investigation; Food
and Agriculture Industries;
State and Local First
Responders
2015 Advanced Data
Analysis and
Visualization;
Biological Threats
and
Countermeasure
s; Chemical
Threats and
Countermeasure
s
Biometrics; Case Studies;
Econometrics; Genomic
Testing; Modeling; Molecular
Biology/Genomics; Risk
Assessment; Sampling;
Statistical Analysis
Computer Science Workshop 2015 Visual Analytics Faculty
Workshop - Bethune-Cookman
University - June 18, 2015 - June 19,
2015 - MSI Summer Research
Workshop for Morgan State University
undergrads - July 19, 2015 to July 25,
2015 - VACCINE center was host to six
undergraduate students from MSI
partner Morgan State University (MSU).
The students were housed on-campus
at Purdue University and engaged in
activities and presentations that helped
them to better understand visual
analytics and its real-world applications.
DHS - Summer Research Team (SRT)
for Minority Serving Institutions (MSI). -
May 25, 2015 - July 31, 2015 - Dr. Louis
Ngamassi, a College of Business
professor at Prairie View A&M
University, successfully completed the
SRT Program in the summer of 2015.
With the support of the VACCINE
Center, Ngamassi is incorporating
visual analytics into a new course he is
developing entitled "Crisis Informatics."
7 other publications -
See Other
Publications Tab for
more information.
5 presentations - See Presentations Tab for more
detailed information.
EP 4: SURF Program
(Summer Undergraduate
Research Fellowships)
Education 2009/07 2009 2016/06 2016 Entered Complete Big Data
Visual
Analytics
183686 2009-ST-061-
CI001
No FALSE David
Ebert
Purdue University Jackson
State
University
MS; IN Academic Community 2015 Advanced Data
Analysis and
Visualization
Classroom Education
EP 5: Graduate Programs Education 2009/07 2009 2015/12 2015 Entered Complete Research 0 2009-ST-061-
CI001
No Compiling and Sorting
Database
FALSE David
Ebert
Purdue University GA; IN Academic Community 2009 Advanced Data
Analysis and
Visualization
Case Studies Computer Science
EP 6: HS-STEM Career
Development Program
Education 2009/07 2009 2017/07 2017 Entered In
Progress
Research 431090 2009-ST-061-
CI001
No FALSE David
Ebert
Purdue University IN Center for Visual
Analytics for
Command,
Control, and
Interoperability
Environments
Academic Community 2016 Advanced Data
Analysis and
Visualization;
Biological Threats
and
Countermeasure
s; Border Security
Classroom Education Basic Research Development Development of 26 STEM Students.
Please see Education initiatives and
student successes for more
information.
EP 7: Professional
Development
Education 2009/07 2009 2017/06 2017 Entered In
Progress
Big Data
Visual
Analytics
Research 0 2009-ST-061-
CI001
No Compiling and Sorting
Database
FALSE David
Ebert
Purdue University Jackson
State
University;
University
of Houston-
Downtown;
Bethune-
Cookman
College
IN; NJ; GA State and Local First
Responders; State and Local
Public Health Agencies
2015 Advanced Data
Analysis and
Visualization
Case Studies; Qualitative
Analysis; Risk Assessment
Classroom Education Basic Research Workshop The workshop had over 500 registrants.
EP 8: (VADL) Educational
Materials
Education 2009/07 2009 2010/12 2010 Entered Complete Research 0 2009-ST-061-
CI001
No Compiling and Sorting
Database
FALSE David
Ebert
Purdue University GA; IN Academic Community 2010 Advanced Data
Analysis and
Visualization
Statistical Analysis Classroom Education Education Materials The Visual Analytics Digital Library
(VADL) provided a website that
contained a variety of resources for the
visual analytics education community
including class syllabi, sample exams,
video lectures, lecture notes and so on.
The project helped boot-strap a variety
of educational program efforts across
different universities by providing a
shared resource repository that could
be tapped for assistance. As the area
matured and more information about
visual analytics became prevalent
across the web, the need for the VADL
lessened, and we eventually stopped
updating and supporting the site.
Video Surveillance Visual
Analytics
Law Enforcement 2009/07 2009 2012/06 2012 Entered Complete 0 2009-ST-061-
CI001
No FALSE Ed Delp Purdue University IN
MDRP 1: Geovisual
Analytics
Law Enforcement 2009/07 2009 2010/03 2010 Entered Complete Research 399808 2009-ST-061-
CI001
No Compiling and Sorting
Database
FALSE John
Stasko
Georgia Institute of
Technology
GA; IN; PA;
CA
Advanced Data
Analysis and
Visualization;
Human Factors
Aspects of
Technology
Case Studies; Sampling;
Statistical Analysis
Tool The team developed techniques and
tools for investigative analysis on large
collections of documents including both
unstructured text and structured
documents (e.g., spreadsheets). They
developed systems that use interactive
visualizations to help analysts with
performing exploration, sense-making,
and understanding tasks. If they could
help analysts determine which
documents to read first and to also find
important, connected documents, then
they could help them to make timelier
and accurate assessments of the
situations described within those
documents. The project builds upon the
Jigsaw system, and explores how new
capabilities can be added to it. They
also planned to disseminate the system
for use by real clients, people, and
organizations in various domains.
2 journal articles - See
Journal Tab for more
detailed information.
ISIS - Infovis System for
Investigating Intrusions
Law Enforcement 2009/07 2009 2011/06 2011 Entered Complete Information-
driven
Visualizatio
n, Modeling
and
Simulation
of Data
Research 0 2009-ST-061-
CI001
No FALSE Patrick
Hanrahan;
Pat
Hanrahan
Office of University
Programs, Science &
Technology Directorate
CA 2011 Tool Awaiting deployment to US CERT A
California-based proof of concept
application of the TransNIEMO
modeling approach was prompted by
interest from the California Department
of Transportation in concert with the
National Center for Metropolitan
Transportation Research (METRANS).
VACCINE Affinity
Research Groups
Education 2009/07 2009 2012/06 2012 Entered Complete Research 0 2009-ST-061-
CI001
No Compiling and Sorting
Database
FALSE Richard
Aló;
Richard
Alo
University of Houston-
Downtown; University of
Houston-Downtown
University
of Houston-
Downtown
IN; TX; CA 2011 Statistical Analysis Biostatistics and
bioinformatics;
Computer Science;
Mathematics
Research Groups Twenty-six undergraduate students,
including 14 supported students, from
Univ. of Houston-Downtown, Navajo
Tech and Cal State-Dominguez Hills
participated in the VACCINE Affinity
Research Groups organized by Richard
Alo. These were students from a
combination of statistics, math and
computer science. As a result of
participation in this project, students
gained research and collaboration
experience and submitted posters and
publications for the Student Research
Day Conference at Cal State-
Dominguez Hills.
2 student theses -
See Theses Tab for
more detailed
information.
Developing a Sustainable
Visual Analytics for
Command Center
Environments
Resource Allocation 2009/07 2009 2011/03 2011 Entered Complete Research 0 2009-ST-061-
CI001
No FALSE Mark
Haselkorn;
Mark
Haselkorn
University of
Washington; University
of Washington
WA
Enhancing Interactive
Visual Analysis and
Decision Making
Environments
Resource Allocation 2009/07 2009 2010/06 2010 Entered Complete Research 0 2009-ST-061-
CI001
No Expert Consultation FALSE Mark
Haselkorn
University of
Washington
WA DHS U.S. Coast Guard 2011 Modeling Engineering Tool We have successfully modeled
workflow in a clinical environment and
used that to work with practitioners in
the design and development of a mobile
application that enhances
communication between patients and
healthcare providers. That application,
called Priority Contact, is being piloted
in the sandbox environment of the
Veterans Healthcare Administration.
2 journal articles - See
Journal Tab for more
detailed information.
4 presentations - See Presentations Tab for more
detailed information.
2 patents - See Patent Tab for more
detailed information.
PanViz Disease Surveillance 2009/07 2009 2011/06 2011 Entered Complete Research 0 2009-ST-061-
CI001
No FALSE David
Ebert
Purdue University IN; NC; PA;
WA
2011 VACCINE developed an interactive
pandemic preparedness surveillance
PURVAC RVF Education 2009/07 2009 2011/06 2011 Complete Research 0 2009-ST-061-
CI001
No FALSE David
Ebert
Purdue University
MDRP 2: Integrate
Automated Analytical
Reasoning into Jigsaw
Law Enforcement 2009/07 2009 2010/06 2010 Entered Complete Research 0 2009-ST-061-
CI001
No Compiling and Sorting
Database
FALSE John
Stasko
Georgia Institute of
Technology
GA Academic Community; DHS
Science and Technology
Directorate; Federal Bureau of
Investigation; Intelligence
Community
2009 Advanced Data
Analysis and
Visualization
Case Studies; Sampling Computer Science This project produced a system
prototype that combined the Jigsaw
system with capabilities from the STAB
system. We experimented with this
prototype to learn more about its SP 1: Improving Query
Performance in Large
Scale Analytic Databases
Law Enforcement 2009/07 2009 2011/06 2011 Entered Complete Research 0 2009-ST-061-
CI001
No Compiling and Sorting
Database
FALSE Patrick
Hanrahan;
Pat
Hanrahan
Stanford University;
Stanford University
CA DHS National Protection &
Programs Directorate; DHS
U.S. Coast Guard
2009 Advanced Data
Analysis and
Visualization;
Border Security;
Maritime and Port
Security
Case Studies Computer Science
Situation Surveillance & In-
field Criminal Investigative
Analytics; Public Safety
Coalition Projects
Law Enforcement 2009/07 2009 2010/03 2010 Entered Complete Research 0 2009-ST-061-
CI001
No Compiling and Sorting
Database
FALSE William
Ribarsky
University of North
Carolina at Charlotte
NC; IN; NJ;
PA; VA
State and Local First
Responders
2010 Biometrics; Case Studies;
Econometrics; Modeling;
Molecular Biology/Genomics;
Risk Assessment; Sampling;
Statistical Analysis
Geography; Information
Science
Demonstration The urban routing and emergency
response system was incorporated into
the Canada- US Experiment
Emergency Resiliency Environment
(CAUSE –ERE) scenario set for
demonstration at the end of June. DHS
managers were in attendance for the
experiment. The initial experiment
involved an earthquake in the Pacific
Northwest spanning the U.S.-Canada
border. The system will be used for
mobile emergency routing and
situational awareness in a downtown
S ttl b ildi
1 journal article - See
Journal Tab for more
detailed information.
2 student theses -
See Theses Tab for
more detailed
information.
1 presentation - See Presentations Tab for more detailed
information.

(Jigsaw) Visual Analytics
for Investigative Analysis
on Text Documents
Law Enforcement 2009/06 2009 2017/06 2017 Entered In
Progress
Research 637772 2009-ST-061-
CI001
No Expert Consultation FALSE John
Stasko
Georgia Institute of
Technology
GA; IN; PA Center for Visual
Analytics for
Command,
Control, and
Interoperability
Environments
State and Local First
Responders; Other State or
Local
2016 Advanced Data
Analysis and
Visualization;
Risk and
Decision
Sciences
Case Studies; Sampling;
Statistical Analysis
Information Science;
Communication (risk,
scientific, technical);
Computer Science
Operational Use Tool Jigsaw is a large Java-based desktop
application system. It contains just
under 100,000 lines of code. The
system is available for anyone to
download via
http://www.cc.gatech.edu/gvu/ii/jigsaw.
Jigsaw was used by the Indianapolis
Police Department, West Lafayette
Police Department, Rock Hill Police
Department (SC), and the Lafayette
Police Department. It is being used in
various university classes on visual
analytics and intelligence analysis and
has been downloaded by a wide variety
of organizations in government and
industry. There have been
approximately 8000 downloads of the
Jigsaw system in its history. Examples
of organizations that have downloaded
JIGSAW are; Air Force Intelligence,
AFRL Wright Patterson, Army
Counterintelligence, Boeing Deloitte,
Naval Research Lab, National Crime
Information Center, PayPal, Thomson
Reuters, United Nations Investigators
Office, US Attorney’s Office Organized
Crime Taskforce, as well as numerous
newspapers and police departments.
The research team published 11 full
papers and 5 abstracts about the
project. Additionally, Dr. Stasko
18 journal articles -
See Journal Tab for
more detailed
information.
5 other publications -
See Other
Publications Tab for
more information.
2 student theses -
See Theses Tab for
more detailed
information.
37 presentations - See Presentations Tab for more
detailed information.
MDRP 13: (SensePlace 2)
Collaborative Visual-
Computational Information
Foraging and
Contextualization to
Support Situation
Awareness
Resource Allocation 2009/06 2009 2010/06 2010 Entered Complete Research 100000 2009-ST-061-
CI001
No Data Mining FALSE Alan
MacEachr
en; Alan
MacEachr
en
Pennsylvania State
University; Pennsylvania
State University
PA State and Local First
Responders
2016 Advanced Data
Analysis and
Visualization;
Communications
and
Interoperability;
Emergency
Preparedness
and Response
Case Studies; Risk
Assessment; Statistical
Analysis
Geographic information
sciences; Computer
Science
Pilot/Field Testing and
Evaluation in an
Operational
Environment
Tool GeoTxt has been integrated as the
backend geographic entity recognition,
disambiguation, and co-coding systems
to support SensePlace 2, our spatial-
temporal twitter analytics environment.
The early stages of SensePlace 2 (and
its precursor SensePlace) were funded
through VACCINE.
3 journal articles - See
Journal Tab for more
detailed information.
10 presentations - See Presentations Tab for more
detailed information.
EP 3: K-12 Programs Education 2009/02 2009 2013/09 2013 Entered Complete Research 0 2009-ST-061-
CI001
No FALSE David
Ebert
Purdue University NJ; IN Academic Community;
Consumers; DHS Science and
Technology Directorate; Media
2011 Advanced Data
Analysis and
Visualization
Classroom Education Classroom Education VACCINE limited its interaction in K-12
activities at the suggestion of DHS at
the end of Year 2. Students from the HS-
STEM program visited Principles of
Engineering classes at a local high
school and presented information on
their research, visual analytics and
connections to homeland security. As a
follow-up, 30 students from the school
came to campus for half a day to tour
our visual analytics labs and learn about
the research taking place through
VACCINE. The teacher was very
impressed.
8 presentations - See Presentations Tab for more
detailed information.
Scatterblogs Resource Allocation Research 0 No FALSE Tool Initial prototype deployed in July 2013 to
the Boy Scouts of America for testing at
their Annual Jamboree. Still in testing
and evaluation (developing a web-based
version based on feedback). A number
of agencies are waiting to acquire.
Measuring & Visualizing
Information
Trustworthiness Using
Visual Analytics
Law Enforcement Entered 113750 2009-ST-061-
CI001
No FALSE Generated a report
Malware on Smartphones:
Collection, Analysis and
Defensive Measures
Law Enforcement Entered Research 0 2009-ST-061-
CI001
No FALSE CA; IN
Co-Located Collaborative
Analysis on Large, High-
Resolution Displays using
Multiple Input Devices;
Public Safety Coalition
Projects
Law Enforcement Entered Complete Research 0 2009-ST-061-
CI001
No Survey FALSE Chris
North
Virginia Tech University GA; VA State and Local First
Responders
2011 Case Studies; Statistical
Analysis
Computer Science Research Virginia Tech’s project on ―Collocated Collaborative Visual Analytics involved
two undergraduate female and one
graduate female computer science
students who were involved with the
research on the project. As a result, the
two undergraduates plan to pursue
graduate 27 research opportunities and
the graduate students received an offer
for a summer internship at PNNL to
continue research related to the project.
3 journal articles - See
Journal Tab for more
detailed information.
3 other publications -
See Other
Publications Tab for
more information.
4 presentations - See Presentations Tab for more
detailed information.
Navajo Nation Graffiti
Project
Law Enforcement Entered Withdrawn Research 0 2009-ST-061-
CI001
No Field Monitors FALSE Mark
Trebian
Navajo Technical
University
NM; UT; IN;
AZ
DHS Federal Emergency
Management Agency; DHS
Transportation Security
Administration; DHS U.S.
Coast Guard; State and Local
First Responders
2014 Modeling; Sampling Geography; Computer
Science; Mathematics;
Sociology; Information
systems
Critical Infrastructure
Integration Modeling and
Simulation Project
Resource Allocation Research 0 2009-ST-061-
CI001
No FALSE William
Ribarsky
University of North
Carolina at Charlotte
NC
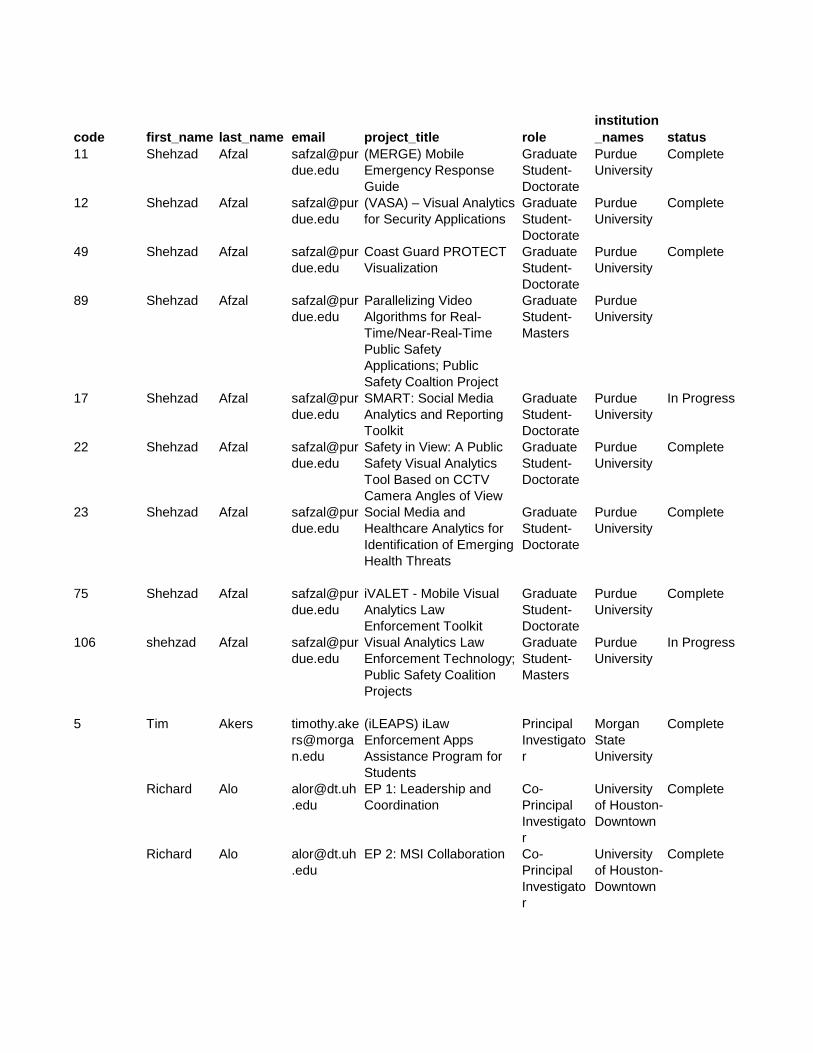
code first_name last_name email project_title role
institution
_names status
11 Shehzad Afzal safzal@pur
due.edu
(MERGE) Mobile
Emergency Response
Guide
Graduate
Student-
Doctorate
Purdue
University
Complete
12 Shehzad Afzal safzal@pur
due.edu
(VASA) – Visual Analytics
for Security Applications
Graduate
Student-
Doctorate
Purdue
University
Complete
49 Shehzad Afzal safzal@pur
due.edu
Coast Guard PROTECT
Visualization
Graduate
Student-
Doctorate
Purdue
University
Complete
89 Shehzad Afzal safzal@pur
due.edu
Parallelizing Video
Algorithms for Real-
Time/Near-Real-Time
Public Safety
Applications; Public
Safety Coaltion Project
Graduate
Student-
Masters
Purdue
University
17 Shehzad Afzal safzal@pur
due.edu
SMART: Social Media
Analytics and Reporting
Toolkit
Graduate
Student-
Doctorate
Purdue
University
In Progress
22 Shehzad Afzal safzal@pur
due.edu
Safety in View: A Public
Safety Visual Analytics
Tool Based on CCTV
Camera Angles of View
Graduate
Student-
Doctorate
Purdue
University
Complete
23 Shehzad Afzal safzal@pur
due.edu
Social Media and
Healthcare Analytics for
Identification of Emerging
Health Threats
Graduate
Student-
Doctorate
Purdue
University
Complete
75 Shehzad Afzal safzal@pur
due.edu
iVALET - Mobile Visual
Analytics Law
Enforcement Toolkit
Graduate
Student-
Doctorate
Purdue
University
Complete
106 shehzad Afzal safzal@pur
due.edu
Visual Analytics Law
Enforcement Technology;
Public Safety Coalition
Projects
Graduate
Student-
Masters
Purdue
University
In Progress
5 Tim Akers timothy.ake
rs@morga
n.edu
(iLEAPS) iLaw
Enforcement Apps
Assistance Program for
Students
Principal
Investigato
r
Morgan
State
University
Complete
Richard Alo [email protected]
.edu
EP 1: Leadership and
Coordination
Co-
Principal
Investigato
r
University
of Houston-
Downtown
Complete
Richard Alo [email protected]
.edu
EP 2: MSI Collaboration Co-
Principal
Investigato
r
University
of Houston-
Downtown
Complete
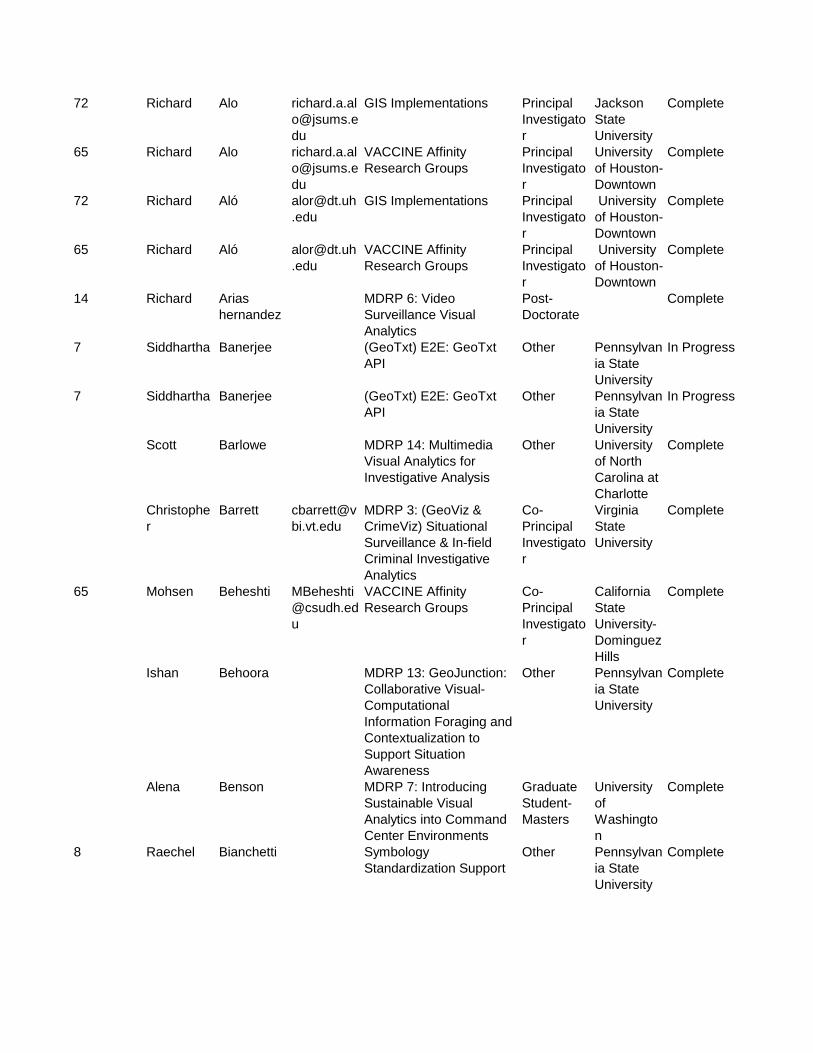
72 Richard Alo richard.a.al
du
GIS Implementations Principal
Investigato
r
Jackson
State
University
Complete
65 Richard Alo richard.a.al
du
VACCINE Affinity
Research Groups
Principal
Investigato
r
University
of Houston-
Downtown
Complete
72 Richard Aló [email protected]
.edu
GIS Implementations Principal
Investigato
r
University
of Houston-
Downtown
Complete
65 Richard Aló [email protected]
.edu
VACCINE Affinity
Research Groups
Principal
Investigato
r
University
of Houston-
Downtown
Complete
14 Richard Arias
hernandez
MDRP 6: Video
Surveillance Visual
Analytics
Post-
Doctorate
Complete
7 Siddhartha Banerjee (GeoTxt) E2E: GeoTxt
API
Other Pennsylvan
ia State
University
In Progress
7 Siddhartha Banerjee (GeoTxt) E2E: GeoTxt
API
Other Pennsylvan
ia State
University
In Progress
Scott Barlowe MDRP 14: Multimedia
Visual Analytics for
Investigative Analysis
Other University
of North
Carolina at
Charlotte
Complete
Christophe
r
Barrett cbarrett@v
bi.vt.edu
MDRP 3: (GeoViz &
CrimeViz) Situational
Surveillance & In-field
Criminal Investigative
Analytics
Co-
Principal
Investigato
r
Virginia
State
University
Complete
65 Mohsen Beheshti MBeheshti
@csudh.ed
u
VACCINE Affinity
Research Groups
Co-
Principal
Investigato
r
California
State
University-
Dominguez
Hills
Complete
Ishan Behoora MDRP 13: GeoJunction:
Collaborative Visual-
Computational
Information Foraging and
Contextualization to
Support Situation
Awareness
Other Pennsylvan
ia State
University
Complete
Alena Benson MDRP 7: Introducing
Sustainable Visual
Analytics into Command
Center Environments
Graduate
Student-
Masters
University
of
Washingto
n
Complete
8 Raechel Bianchetti Symbology
Standardization Support
Other Pennsylvan
ia State
University
Complete

Maureen Biggers biggers@in
diana.edu
EP 1: Leadership and
Coordination
Co-
Principal
Investigato
r
Indiana
University
School of
Medicine
Complete
Maureen Biggers biggers@in
diana.edu
EP 2: MSI Collaboration Co-
Principal
Investigato
r
Indiana
University
School of
Medicine
Complete
100 Ann Blandford UKVAC II Collaborato
r-unpaid
Complete
114 Mimi Boutin mboutin@
purdue.edu
Situation Surveillance &
In-field Criminal
Investigative Analytics;
Public Safety Coalition
Projects
Co-
Principal
Investigato
r
Purdue
University
Complete
Mireille Boutin mboutin@
purdue.edu
MDRP 3: (GeoViz &
CrimeViz) Situational
Surveillance & In-field
Criminal Investigative
Analytics
Co-
Principal
Investigato
r
Purdue
University
Complete
Mireille Boutin mboutin@
purdue.edu
MDRP 9: (Rosetta
Phone) Mobile Imaging,
Rosetta Phone, and Light-
Weight Visual Analytics
for In-Field Analytics
Co-
Principal
Investigato
r
Purdue
University
Complete
77 Lauren Bradel lbradel1@v
t.edu
Co-Located Collaborative
Analysis on Large, High-
Resolution Displays using
Multiple Input Devices;
Public Safety Coalition
Projects
Graduate
Student-
Masters
Virginia
Tech
University
Complete
128 Robert Bridges bridgesra
@ornl.gov
Context-Driven Visual
Analytics for Cyber
Defensive Operations -
Oak Ridge N Lab
Co-
Principal
Investigato
r
Complete
Marti Burns mhburns@
purdue.edu
EP 1: Leadership and
Coordination
Co-
Principal
Investigato
r
Purdue
University
Complete
Marti Burns EP 2: MSI Collaboration Co-
Principal
Investigato
r
Purdue
University
Complete
107 Marti Burns mhburns@
purdue.edu
EP 3: K-12 Programs Co-
Principal
Investigato
r
Purdue
University
Complete

Marti Burns mhburns@
purdue.edu
EP 4: SURF Program
(Summer Undergraduate
Research Fellowships)
Co-
Principal
Investigato
r
Purdue
University
Complete
Marti Burns mhburns@
purdue.edu
EP 7: Professional
Development
Co-
Principal
Investigato
r
Purdue
University
In Progress
Marti Burns mhburns@
purdue.edu
K-12 Programs Co-
Principal
Investigato
r
Purdue
University
In Progress
14 Nadya Calderon
Romero
Alexandra
MDRP 6: Video
Surveillance Visual
Analytics
Graduate
Student-
Doctorate
Complete
80 Winston Cambridge Navajo Nation Graffiti
Project
Undergrad
uate
Student
Navajo
Technical
University
Withdrawn
6 Alice Carron (GARI) Navajo Nation
Graffiti Project
Principal
Investigato
r
Withdrawn
80 Alice Carron alicemcarr
on@gmail.
com
Navajo Nation Graffiti
Project
Co-
Principal
Investigato
r
Navajo
Technical
University
Withdrawn
11 Junghoon Chae jchae@pur
due.edu
(MERGE) Mobile
Emergency Response
Guide
Graduate
Student-
Masters
Purdue
University
Complete
17 Junghoon Chae jchae@pur
due.edu
SMART: Social Media
Analytics and Reporting
Toolkit
Graduate
Student-
Doctorate
Purdue
University
In Progress
29 Junghoon Chae jchae@pur
due.edu
TRIP: Trip Response
Investigative Profiler
Graduate
Student-
Doctorate
Purdue
University
Remco Chang remco@cs.
tufts.edu
MDRP 11: Financial
Fraud Visual Analytics
Co-
Principal
Investigato
r
Tufts
University
Complete
21 Min Chen min.chen@
oerc.ox.ac.
uk
Analyzing High-
dimensional Multivariate
Network Links with
Integrated Anomaly
Detection, Highlighting
and Exploration
Co-
Principal
Investigato
r
In Progress
19 Min Chen min.chen@
oerc.ox.ac.
uk
Analyzing High-
dimensional Multivariate
Network Links with
Integrated Anomaly
Detection, Highlighting
and Exploration
Co-
Principal
Investigato
r
University
of Oxford
Complete
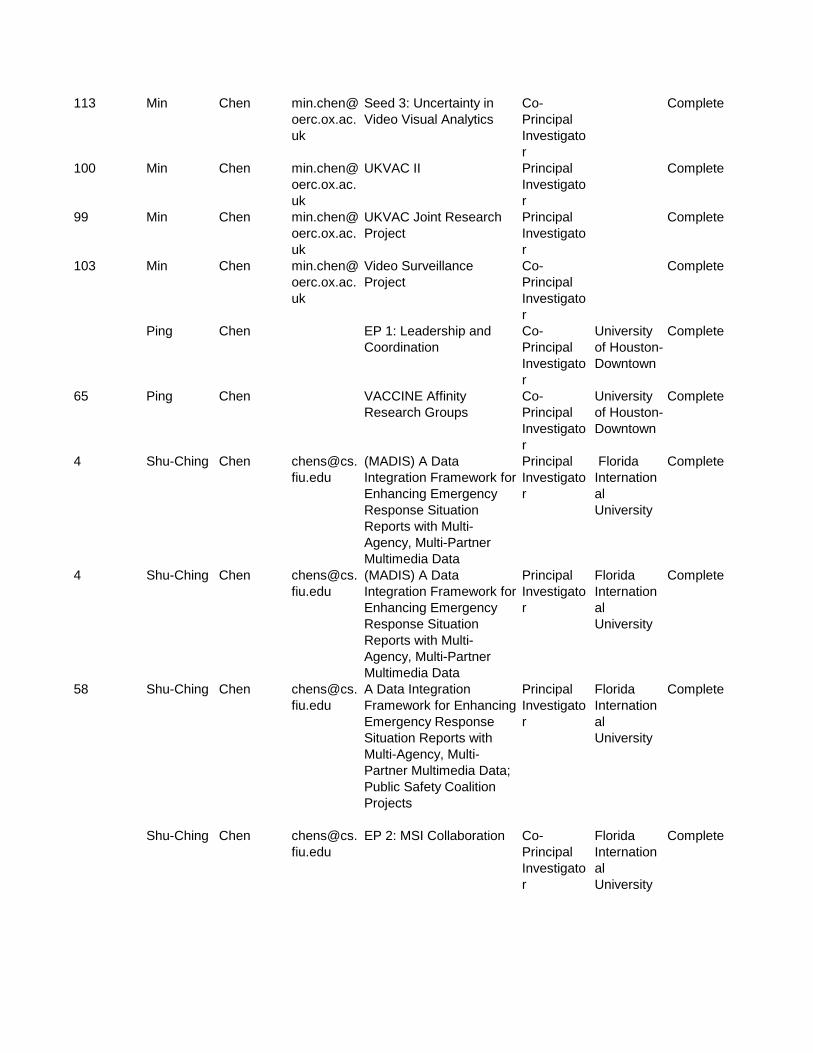
113 Min Chen min.chen@
oerc.ox.ac.
uk
Seed 3: Uncertainty in
Video Visual Analytics
Co-
Principal
Investigato
r
Complete
100 Min Chen min.chen@
oerc.ox.ac.
uk
UKVAC II Principal
Investigato
r
Complete
99 Min Chen min.chen@
oerc.ox.ac.
uk
UKVAC Joint Research
Project
Principal
Investigato
r
Complete
103 Min Chen min.chen@
oerc.ox.ac.
uk
Video Surveillance
Project
Co-
Principal
Investigato
r
Complete
Ping Chen EP 1: Leadership and
Coordination
Co-
Principal
Investigato
r
University
of Houston-
Downtown
Complete
65 Ping Chen VACCINE Affinity
Research Groups
Co-
Principal
Investigato
r
University
of Houston-
Downtown
Complete
4 Shu-Ching Chen chens@cs.
fiu.edu
(MADIS) A Data
Integration Framework for
Enhancing Emergency
Response Situation
Reports with Multi-
Agency, Multi-Partner
Multimedia Data
Principal
Investigato
r
Florida
Internation
al
University
Complete
4 Shu-Ching Chen chens@cs.
fiu.edu
(MADIS) A Data
Integration Framework for
Enhancing Emergency
Response Situation
Reports with Multi-
Agency, Multi-Partner
Multimedia Data
Principal
Investigato
r
Florida
Internation
al
University
Complete
58 Shu-Ching Chen chens@cs.
fiu.edu
A Data Integration
Framework for Enhancing
Emergency Response
Situation Reports with
Multi-Agency, Multi-
Partner Multimedia Data;
Public Safety Coalition
Projects
Principal
Investigato
r
Florida
Internation
al
University
Complete
Shu-Ching Chen chens@cs.
fiu.edu
EP 2: MSI Collaboration Co-
Principal
Investigato
r
Florida
Internation
al
University
Complete

3 Siqiao Chen chen1722
@purdue.e
du
(VALET) Developing a
spatial statistics
framework in the visual
analytics for law
enforcement technology
suite
Graduate
Student-
Masters
Purdue
University
In Progress
Yang Chen MDRP 14: Multimedia
Visual Analytics for
Investigative Analysis
Other University
of North
Carolina at
Charlotte
Complete
24 Yang Chen Multimedia, Social Media,
Text, and Emergency
Response Analytics
Other University
of North
Carolina at
Charlotte
Complete
Ying Chen MDRP 13: GeoJunction:
Collaborative Visual-
Computational
Information Foraging and
Contextualization to
Support Situation
Awareness
Other Pennsylvan
ia State
University
Complete
Jen Christophe
r
christ81@p
urdue.edu
EP 6: HS-STEM Career
Development Program
Staff Purdue
University
In Progress
Newville Clark MDRP 12: Foreign
Animal and Zoonotic
Disease Visual Analytics
Co-
Principal
Investigato
r
Texas A &
M
University
Complete
115 Seth Clark SP 15-Task 3: Event
Evacuation Planning;
Public Safety Coalition
Projects
Graduate
Student-
Masters
University
of North
Carolina at
Charlotte
Complete
William Cleveland wsc@purd
ue.edu
MDRP 12: Foreign
Animal and Zoonotic
Disease Visual Analytics
Co-
Principal
Investigato
r
Purdue
University
Complete
William Cleveland wsc@purd
ue.edu
MDRP 3: (GeoViz &
CrimeViz) Situational
Surveillance & In-field
Criminal Investigative
Analytics
Co-
Principal
Investigato
r
Purdue
University
Complete
William Cleveland wsc@purd
ue.edu
MDRP 5: Cybersecurity
Visual Analytics
Co-
Principal
Investigato
r
Purdue
University
Complete
114 William Cleveland wsc@stat.
purdue.edu
Situation Surveillance &
In-field Criminal
Investigative Analytics;
Public Safety Coalition
Projects
Co-
Principal
Investigato
r
Purdue
University
Complete

61 Tim Collins Analytical Visualization of
the Port Arthur, TX
Economic Impact Study
Co-
Principal
Investigato
r
Purdue
University
Complete
Tim Collins EP 7: Professional
Development
Co-
Principal
Investigato
r
Purdue
University
In Progress
Tim Collins tfcollin@pu
rdue.edu
MDRP 16: (VALET)
Context-aware Mobile
Visual Analytics for
Emergency Response
Co-
Principal
Investigato
r
Purdue
University
Complete
Tim Collins tfcollin@pu
rdue.edu
MDRP 7: Introducing
Sustainable Visual
Analytics into Command
Center Environments
Co-
Principal
Investigato
r
Purdue
University
Complete
118 Tim Collins SP 14 Task 3: Technical
Integration into ExPOD at
JIBC
Co-
Principal
Investigato
r
Purdue
University
Complete
114 Tim Collins Situation Surveillance &
In-field Criminal
Investigative Analytics;
Public Safety Coalition
Projects
Co-
Principal
Investigato
r
Purdue
University
Complete
29 Tim Collins TRIP: Trip Response
Investigative Profiler
Co-
Principal
Investigato
r
Purdue
University
106 Tim Collins tfcollins@p
urdue.edu
Visual Analytics Law
Enforcement Technology;
Public Safety Coalition
Projects
Co-
Principal
Investigato
r
Purdue
University
In Progress
75 Tim Collins iVALET - Mobile Visual
Analytics Law
Enforcement Toolkit
Co-
Principal
Investigato
r
Purdue
University
Complete
Midge Cozzens midge6930
@comcast.
net
EP 1: Leadership and
Coordination
Co-
Principal
Investigato
r
Rutgers
University
Complete
Midge Cozzens midge6930
@comcast.
net
EP 2: MSI Collaboration Co-
Principal
Investigato
r
Rutgers
University
Complete
107 Midge Cozzens midgec@di
macs.rutge
rs.edu
EP 3: K-12 Programs Co-
Principal
Investigato
r
Rutgers
University
Complete

Midge Cozzens midge6930
@comcast.
net
EP 7: Professional
Development
Co-
Principal
Investigato
r
Rutgers
University
In Progress
Midge Cozzens midge6930
@Comcast
.net
K-12 Programs Co-
Principal
Investigato
r
Rutgers
University
In Progress
116 Midge Cozzens midgec@di
macs.rutge
rs.edu
RECONNECT Workshop
2010 - Extracting and
Visualizing Information
from Natural Language
Text
Co-
Principal
Investigato
r
Rutgers
University
Complete
Daniel Dailey [email protected]
ashington.
edu
MDRP 7: Introducing
Sustainable Visual
Analytics into Command
Center Environments
Co-
Principal
Investigato
r
University
of
Washingto
n
Complete
65 Tom Davis tdavis@na
vajotech.ed
u
VACCINE Affinity
Research Groups
Co-
Principal
Investigato
r
Navajo
Technical
University
Complete
118 Murray Day SP 14 Task 3: Technical
Integration into ExPOD at
JIBC
Co-
Principal
Investigato
r
Justice
Institute of
British
Columbia
Complete
24 Jeffrey Delawder Multimedia, Social Media,
Text, and Emergency
Response Analytics
Other University
of North
Carolina at
Charlotte
Complete
15 Ed Delp [email protected]
urdue.edu
(Crowdsourcing)
Combining
Crowdsourcing
technology with machine
learning to do visual
analytics on big
qualitative data (video
datasets).
Co-
Principal
Investigato
r
Purdue
University
Complete
10 Ed Delp [email protected]
urdue.edu
(GARI) Gang Graffiti
Recognition and Analysis
Principal
Investigato
r
Purdue
University
In Progress
11 Ed Delp [email protected]
urdue.edu
(MERGE) Mobile
Emergency Response
Guide
Principal
Investigato
r
Purdue
University
Complete
88 Ed Delp [email protected]
urdue.edu
Parallelizing Video
Algorithms for Public
Safety Applications
Co-
Principal
Investigato
r
Purdue
University
Complete

114 Ed Delp [email protected]
urdue.edu
Situation Surveillance &
In-field Criminal
Investigative Analytics;
Public Safety Coalition
Projects
Co-
Principal
Investigato
r
Purdue
University
Complete
2 Ed Delp Video Surveillance Visual
Analytics
Principal
Investigato
r
Purdue
University
Complete
10 Edward Delp ace@purd
ue.edu
(GARI) Gang Graffiti
Recognition and Analysis
Principal
Investigato
r
Purdue
University
In Progress
11 Edward Delp ace@purd
ue.edu
(MERGE) Mobile
Emergency Response
Guide
Principal
Investigato
r
Purdue
University
Complete
25 Edward Delp [email protected]
urdue.edu
Chicago LTE Project Principal
Investigato
r
Purdue
University
Complete
25 Edward Delp ace@purd
ue.edu
Chicago LTE Project Principal
Investigato
r
Purdue
University
Complete
33 Edward Delp ace@purd
ue.edu
Hazmat Placards Principal
Investigato
r
Purdue
University
Complete
Edward Delp ace@purd
ue.edu
MDRP 14: Multimedia
Visual Analytics for
Investigative Analysis
Co-
Principal
Investigato
r
Purdue
University
Complete
Edward Delp ace@purd
ue.edu
MDRP 16: (VALET)
Context-aware Mobile
Visual Analytics for
Emergency Response
Co-
Principal
Investigato
r
Purdue
University
Complete
Edward Delp ace@purd
ue.edu
MDRP 3: (GeoViz &
CrimeViz) Situational
Surveillance & In-field
Criminal Investigative
Analytics
Co-
Principal
Investigato
r
Purdue
University
Complete
14 Edward Delp [email protected]
urdue.edu
MDRP 6: Video
Surveillance Visual
Analytics
Co-
Principal
Investigato
r
Purdue
University
Complete
Edward Delp ace@purd
ue.edu
MDRP 9: (Rosetta
Phone) Mobile Imaging,
Rosetta Phone, and Light-
Weight Visual Analytics
for In-Field Analytics
Co-
Principal
Investigato
r
Purdue
University
Complete
89 Edward Delp [email protected]
urdue.edu
Parallelizing Video
Algorithms for Real-
Time/Near-Real-Time
Public Safety
Applications; Public
Safety Coaltion Project
Co-
Principal
Investigato
r
Purdue
University

26 Edward Delp [email protected]
urdue.edu
VBOLO Principal
Investigato
r
Purdue
University
In Progress
26 Edward Delp ace@purd
ue.edu
VBOLO Principal
Investigato
r
Purdue
University
In Progress
Edward Delp ace@purd
ue.edu
Video Surveillance Visual
Analytics
Co-
Principal
Investigato
r
Purdue
University
In Progress
12 Khaldoon Dhou (VASA) – Visual Analytics
for Security Applications
Other University
of North
Carolina at
Charlotte
Complete
120 Khaldoon Dhou SP 14 Task 5: Visual
Analytics for Security
Applications - VASA
Other University
of North
Carolina at
Charlotte
Complete
13 John Dill [email protected]
.ca
MDRP 18: COE-Explorer
(Visual Analytics for the
DHS Centers of
Excellence)
Co-
Principal
Investigato
r
Simon
Fraser
University
Complete
John Dill [email protected]
.ca
MDRP 18: Visual
Analytics for the DHS
Centers of Excellence
Co-
Principal
Investigato
r
Simon
Fraser
University
Complete
24 Douglas Dorr ddorr@epri
.com
Multimedia, Social Media,
Text, and Emergency
Response Analytics
Co-
Principal
Investigato
r
Complete
24 Wenwen Dou Multimedia, Social Media,
Text, and Emergency
Response Analytics
Other University
of North
Carolina at
Charlotte
Complete
24 Todd Eaglin Multimedia, Social Media,
Text, and Emergency
Response Analytics
Other University
of North
Carolina at
Charlotte
Complete
16 David Ebert ebertd@ec
n.purdue.e
du
(CgSARVA) Coast Guard
Search and Rescue
Visual Analytics
Principal
Investigato
r
Purdue
University
Complete
3 David Ebert ebertd@ec
n.purdue.e
du
(VALET) Developing a
spatial statistics
framework in the visual
analytics for law
enforcement technology
suite
Principal
Investigato
r
Purdue
University
In Progress
12 David Ebert ebertd@ec
n.purdue.e
du
(VASA) – Visual Analytics
for Security Applications
Principal
Investigato
r
Purdue
University
Complete

61 David Ebert ebertd@ec
n.purdue.e
du
Analytical Visualization of
the Port Arthur, TX
Economic Impact Study
Principal
Investigato
r
Purdue
University
Complete
19 David Ebert ebertd@ec
n.purdue.e
du
Analyzing High-
dimensional Multivariate
Network Links with
Integrated Anomaly
Detection, Highlighting
and Exploration
Principal
Investigato
r
Purdue
University
Complete
60 David Ebert ebertd@ec
n.purdue.e
du
Bristle Maps - A
Multivariate Abstraction
Technique for
Geovisualization
Principal
Investigato
r
Purdue
University
Complete
42 David Ebert ebertd@ec
n.purdue.e
du
CES: Student Travel Principal
Investigato
r
Purdue
University
Complete
18 David Ebert ebertd@ec
n.purdue.e
du
COAST: Coastal
Operations and Analysis
Suite of Tools
Principal
Investigato
r
Purdue
University
Complete
30 David Ebert ebertd@ec
n.purdue.e
du
CVADA Principal
Investigato
r
Purdue
University
49 David Ebert ebertd@ec
n.purdue.e
du
Coast Guard PROTECT
Visualization
Principal
Investigato
r
Purdue
University
Complete
62 David Ebert ebertd@ec
n.purdue.e
du
Coast Guard Swimmer
Deaths
Principal
Investigato
r
Purdue
University
Complete
David Ebert ebertd@ec
n.purdue.e
du
EP 1: Leadership and
Coordination
Principal
Investigato
r
Purdue
University
Complete
David Ebert ebertd@ec
n.purdue.e
du
EP 2: MSI Collaboration Principal
Investigato
r
Purdue
University
Complete
107 David Ebert ebertd@ec
n.purdue.e
du
EP 3: K-12 Programs Principal
Investigato
r
Purdue
University
Complete
David Ebert ebertd@ec
n.purdue.e
du
EP 4: SURF Program
(Summer Undergraduate
Research Fellowships)
Principal
Investigato
r
Purdue
University
Complete
David Ebert ebertd@ec
n.purdue.e
du
EP 5: Graduate Programs Principal
Investigato
r
Purdue
University
Complete
David Ebert ebertd@ec
n.purdue.e
du
EP 6: HS-STEM Career
Development Program
Principal
Investigato
r
Purdue
University
In Progress
David Ebert ebertd@ec
n.purdue.e
du
EP 7: Professional
Development
Principal
Investigato
r
Purdue
University
In Progress
David Ebert ebertd@ec
n.purdue.e
du
EP 8: (VADL) Educational
Materials
Principal
Investigato
r
Purdue
University
Complete

68 David Ebert ebertd@ec
n.purdue.e
du
High Risk Alcohol
Behavior Analysis
Principal
Investigato
r
Purdue
University
Complete
David Ebert ebertd@ec
n.purdue.e
du
K-12 Programs Principal
Investigato
r
Purdue
University
In Progress
67 David Ebert ebertd@ec
n.purdue.e
du
LAHVA: Linked Animal-
Human Health Visual
Analytics
Principal
Investigato
r
Purdue
University
Complete
David Ebert ebertd@ec
n.purdue.e
du
MDRP 12: Foreign
Animal and Zoonotic
Disease Visual Analytics
Principal
Investigato
r
Purdue
University
Complete
David Ebert ebertd@ec
n.purdue.e
du
MDRP 13: GeoJunction:
Collaborative Visual-
Computational
Information Foraging and
Contextualization to
Support Situation
Awareness
Principal
Investigato
r
Purdue
University
Complete
David Ebert ebertd@ec
n.purdue.e
du
MDRP 14: Multimedia
Visual Analytics for
Investigative Analysis
Principal
Investigato
r
Purdue
University
Complete
David Ebert ebertd@ec
n.purdue.e
du
MDRP 16: (VALET)
Context-aware Mobile
Visual Analytics for
Emergency Response
Principal
Investigato
r
Purdue
University
Complete
David Ebert ebertd@ec
n.purdue.e
du
MDRP 17: START Center
Visual Analytics
Principal
Investigato
r
Purdue
University
Withdrawn
13 David Ebert ebertd@ec
n.purdue.e
du
MDRP 18: COE-Explorer
(Visual Analytics for the
DHS Centers of
Excellence)
Principal
Investigato
r
Purdue
University
Complete
David Ebert ebertd@ec
n.purdue.e
du
MDRP 18: Visual
Analytics for the DHS
Centers of Excellence
Principal
Investigato
r
Purdue
University
Complete
David Ebert ebertd@ec
n.purdue.e
du
MDRP 3: (GeoViz &
CrimeViz) Situational
Surveillance & In-field
Criminal Investigative
Analytics
Principal
Investigato
r
Purdue
University
Complete
David Ebert ebertd@ec
n.purdue.e
du
MDRP 5: Cybersecurity
Visual Analytics
Principal
Investigato
r
Purdue
University
Complete
David Ebert ebertd@ec
n.purdue.e
du
MDRP 7: Introducing
Sustainable Visual
Analytics into Command
Center Environments
Principal
Investigato
r
Purdue
University
Complete

David Ebert ebertd@ec
n.purdue.e
du
MDRP 9: (Rosetta
Phone) Mobile Imaging,
Rosetta Phone, and Light-
Weight Visual Analytics
for In-Field Analytics
Principal
Investigato
r
Purdue
University
Complete
66 David Ebert ebertd@ec
n.purdue.e
du
MarketAnalyzer: An
Interactive Visual
Analytics System for
Analyzing Competitive
Advantage Using Point of
Sale Data
Principal
Investigato
r
Purdue
University
Complete
24 David Ebert ebertd@ec
n.purdue.e
du
Multimedia, Social Media,
Text, and Emergency
Response Analytics
Principal
Investigato
r
Purdue
University
Complete
24 David Ebert ebertd@pu
rdue.edu
Multimedia, Social Media,
Text, and Emergency
Response Analytics
Co-
Principal
Investigato
r
Purdue
University
Complete
93 David Ebert ebertd@ec
n.purdue.e
du
NHANES Exploration Principal
Investigato
r
Purdue
University
Complete
90 David Ebert ebertd@ec
n.purdue.e
du
ORAM Principal
Investigato
r
Purdue
University
Complete
20 David Ebert ebertd@ec
n.purdue.e
du
Officer Performance
Visualization System
Principal
Investigato
r
Purdue
University
In Progress
91 David Ebert ebertd@ec
n.purdue.e
du
PURVAC RVF Principal
Investigato
r
Purdue
University
Complete
86 David Ebert ebertd@ec
n.purdue.e
du
PanViz Principal
Investigato
r
Purdue
University
Complete
40 David Ebert ebertd@ec
n.purdue.e
du
Plugfest Principal
Investigato
r
Purdue
University
In Progress
87 David Ebert ebertd@ec
n.purdue.e
du
PlumeViz Principal
Investigato
r
Purdue
University
Complete
84 David Ebert ebertd@ec
n.purdue.e
du
SEED 1: Investigation of
the Impacts of
Visualization Literacy on
the Performance of Visual
Analysis; International
Collaborations
Principal
Investigato
r
Purdue
University
Complete
17 David Ebert ebertd@ec
n.purdue.e
du
SMART: Social Media
Analytics and Reporting
Toolkit
Principal
Investigato
r
Purdue
University
In Progress

118 David Ebert ebertd@ec
n.purdue.e
du
SP 14 Task 3: Technical
Integration into ExPOD at
JIBC
Principal
Investigato
r
Purdue
University
Complete
121 David Ebert ebertd@ec
n.purdue.e
du
SP 15 Task 1: Enterprise
Resiliency Environments
Principal
Investigato
r
Purdue
University
Complete
59 David Ebert ebertd@ec
n.purdue.e
du
SP 17: Distributed
Rendering for Web-
Enabling the Stadium
Evacuation Planning Tool
Principal
Investigato
r
Purdue
University
Complete
54 David Ebert ebertd@ec
n.purdue.e
du
SP 8: Disposable Cell
Phone Analysis
Principal
Investigato
r
Purdue
University
Complete
22 David Ebert ebertd@ec
n.purdue.e
du
Safety in View: A Public
Safety Visual Analytics
Tool Based on CCTV
Camera Angles of View
Principal
Investigato
r
Purdue
University
Complete
113 David Ebert ebertd@ec
n.purdue.e
du
Seed 3: Uncertainty in
Video Visual Analytics
Principal
Investigato
r
Purdue
University
Complete
114 David Ebert ebertd@pu
rdue.edu
Situation Surveillance &
In-field Criminal
Investigative Analytics;
Public Safety Coalition
Projects
Co-
Principal
Investigato
r
Purdue
University
Complete
23 David Ebert ebertd@ec
n.purdue.e
du
Social Media and
Healthcare Analytics for
Identification of Emerging
Health Threats
Principal
Investigato
r
Purdue
University
Complete
29 David Ebert ebertd@ec
n.purdue.e
du
TRIP: Trip Response
Investigative Profiler
Co-
Principal
Investigato
r
Purdue
University
130 David Ebert ebertd@ec
n.purdue.e
du
TRIP: Trip Response
Investigative Profiler
Principal
Investigato
r
Purdue
University
Complete
103 David Ebert ebertd@ec
n.purdue.e
du
Video Surveillance
Project
Principal
Investigato
r
Purdue
University
Complete
David Ebert ebertd@ec
n.purdue.e
du
Video Surveillance Visual
Analytics
Principal
Investigato
r
Purdue
University
In Progress
101 David Ebert ebertd@ec
n.purdue.e
du
Visual Analytics Decision
Support Environment for
Epidemic Modeling and
Response Evaluation;
Public Safety Coalition
Projects
Principal
Investigato
r
Purdue
University
Complete

105 David Ebert ebertd@ec
n.purdue.e
du
Visual Analytics
Environment for Public
Health Surveillance
Principal
Investigato
r
Purdue
University
Complete
106 David Ebert ebertd@ec
n.purdue.e
du
Visual Analytics Law
Enforcement Technology;
Public Safety Coalition
Projects
Principal
Investigato
r
Purdue
University
In Progress
104 David Ebert ebertd@ec
n.purdue.e
du
Visual Analytics of
Microblog Data for Public
Response Behavioral
Analysis in Disaster
Events
Principal
Investigato
r
Purdue
University
Complete
126 David Ebert ebertd@ec
n.purdue.e
du
Visualization and Policy
Making: Theoretical and
Empirical Explorations
Workshop
Principal
Investigato
r
Purdue
University
Complete
64 David Ebert ebertd@ec
n.purdue.e
du
iOPAR - Operational
Performance Assessment
Reports
Principal
Investigato
r
Purdue
University
Complete
75 David Ebert ebertd@ec
n.purdue.e
du
iVALET - Mobile Visual
Analytics Law
Enforcement Toolkit
Principal
Investigato
r
Purdue
University
Complete
131 David Ebert ebertd@ec
n.purdue.e
du
success visualization
project
Principal
Investigato
r
Purdue
University
In Progress
107 Steve Elder EP 3: K-12 Programs Co-
Principal
Investigato
r
Complete
12 Niklas Elmqvist elm@umd.
edu
(VASA) – Visual Analytics
for Security Applications
Co-
Principal
Investigato
r
University
of
Maryland
Complete
34 Niklas Elmqvist elm@purd
ue.edu
Cyber Education Principal
Investigato
r
Purdue
University
Complete
Niklas Elmqvist elm@umd.
edu
MDRP 11: Financial
Fraud Visual Analytics
Co-
Principal
Investigato
r
Purdue
University
Complete
Niklas Elmqvist elm@umd.
edu
MDRP 17: START Center
Visual Analytics
Co-
Principal
Investigato
r
Purdue
University
Withdrawn
13 Niklas Elmqvist elm@umd.
edu
MDRP 18: COE-Explorer
(Visual Analytics for the
DHS Centers of
Excellence)
Co-
Principal
Investigato
r
Purdue
University
Complete
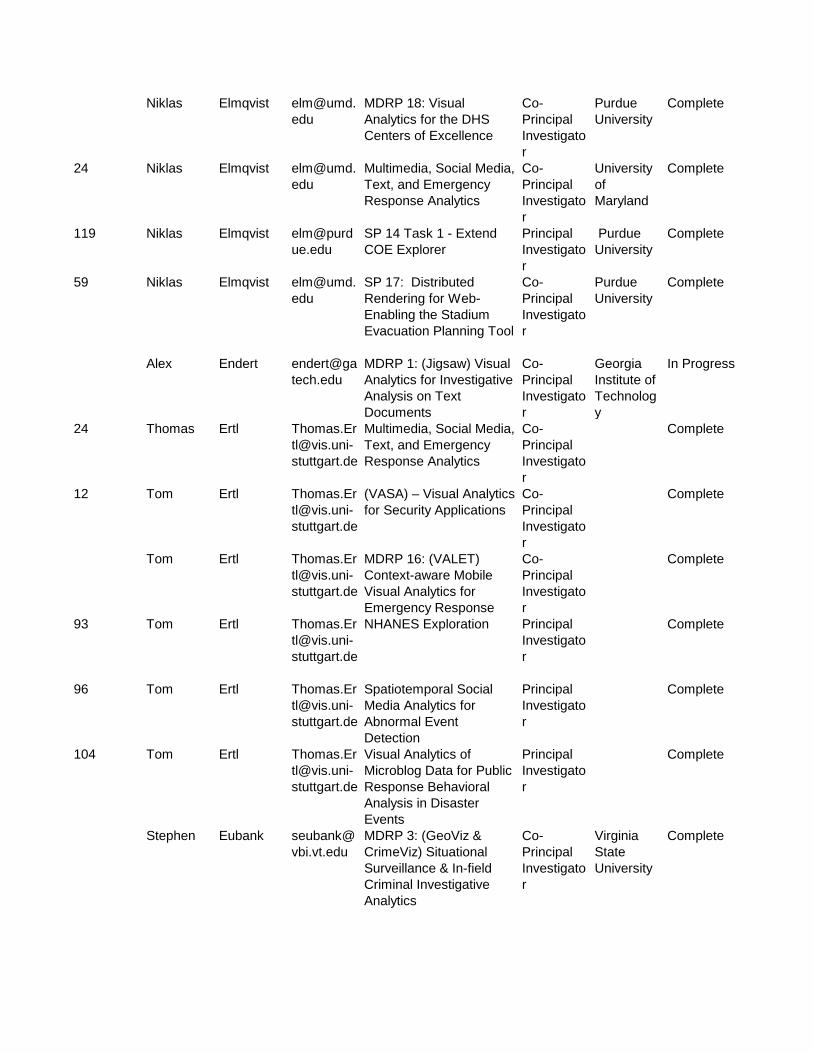
Niklas Elmqvist elm@umd.
edu
MDRP 18: Visual
Analytics for the DHS
Centers of Excellence
Co-
Principal
Investigato
r
Purdue
University
Complete
24 Niklas Elmqvist elm@umd.
edu
Multimedia, Social Media,
Text, and Emergency
Response Analytics
Co-
Principal
Investigato
r
University
of
Maryland
Complete
119 Niklas Elmqvist elm@purd
ue.edu
SP 14 Task 1 - Extend
COE Explorer
Principal
Investigato
r
Purdue
University
Complete
59 Niklas Elmqvist elm@umd.
edu
SP 17: Distributed
Rendering for Web-
Enabling the Stadium
Evacuation Planning Tool
Co-
Principal
Investigato
r
Purdue
University
Complete
Alex Endert endert@ga
tech.edu
MDRP 1: (Jigsaw) Visual
Analytics for Investigative
Analysis on Text
Documents
Co-
Principal
Investigato
r
Georgia
Institute of
Technolog
y
In Progress
24 Thomas Ertl Thomas.Er
stuttgart.de
Multimedia, Social Media,
Text, and Emergency
Response Analytics
Co-
Principal
Investigato
r
Complete
12 Tom Ertl Thomas.Er
stuttgart.de
(VASA) – Visual Analytics
for Security Applications
Co-
Principal
Investigato
r
Complete
Tom Ertl Thomas.Er
stuttgart.de
MDRP 16: (VALET)
Context-aware Mobile
Visual Analytics for
Emergency Response
Co-
Principal
Investigato
r
Complete
93 Tom Ertl Thomas.Er
stuttgart.de
NHANES Exploration Principal
Investigato
r
Complete
96 Tom Ertl Thomas.Er
stuttgart.de
Spatiotemporal Social
Media Analytics for
Abnormal Event
Detection
Principal
Investigato
r
Complete
104 Tom Ertl Thomas.Er
stuttgart.de
Visual Analytics of
Microblog Data for Public
Response Behavioral
Analysis in Disaster
Events
Principal
Investigato
r
Complete
Stephen Eubank seubank@
vbi.vt.edu
MDRP 3: (GeoViz &
CrimeViz) Situational
Surveillance & In-field
Criminal Investigative
Analytics
Co-
Principal
Investigato
r
Virginia
State
University
Complete
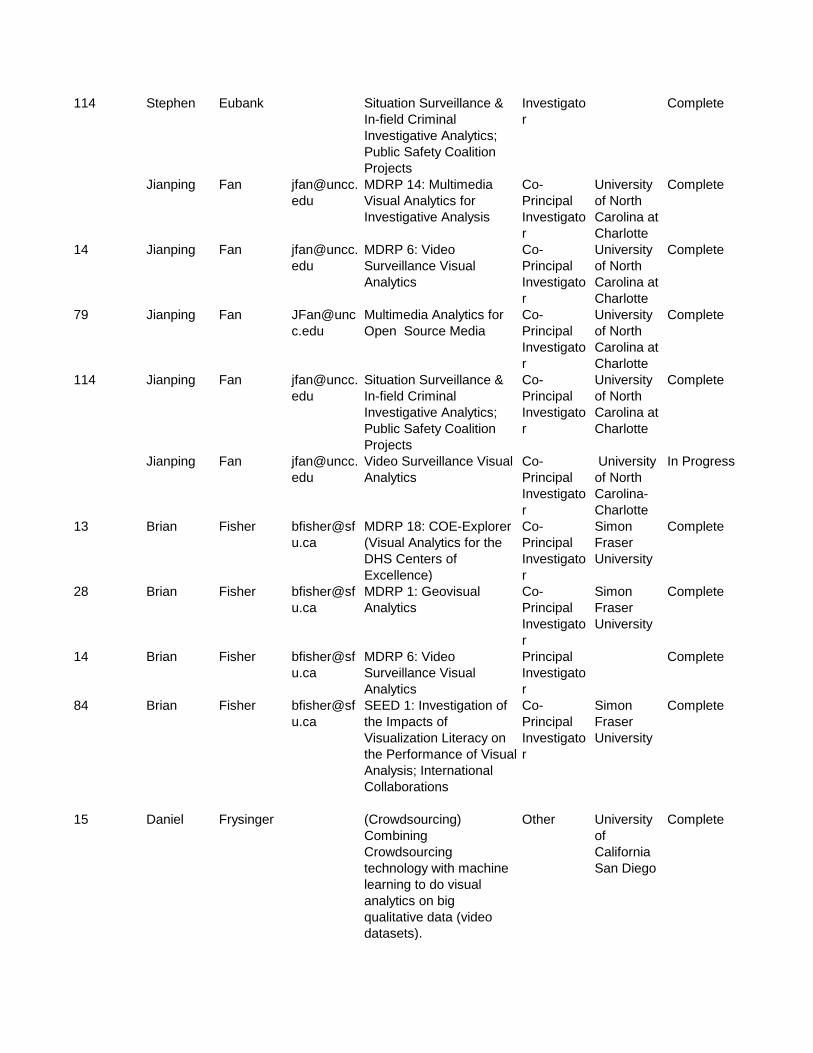
114 Stephen Eubank Situation Surveillance &
In-field Criminal
Investigative Analytics;
Public Safety Coalition
Projects
Investigato
r
Complete
Jianping Fan jfan@uncc.
edu
MDRP 14: Multimedia
Visual Analytics for
Investigative Analysis
Co-
Principal
Investigato
r
University
of North
Carolina at
Charlotte
Complete
14 Jianping Fan jfan@uncc.
edu
MDRP 6: Video
Surveillance Visual
Analytics
Co-
Principal
Investigato
r
University
of North
Carolina at
Charlotte
Complete
79 Jianping Fan JFan@unc
c.edu
Multimedia Analytics for
Open Source Media
Co-
Principal
Investigato
r
University
of North
Carolina at
Charlotte
Complete
114 Jianping Fan jfan@uncc.
edu
Situation Surveillance &
In-field Criminal
Investigative Analytics;
Public Safety Coalition
Projects
Co-
Principal
Investigato
r
University
of North
Carolina at
Charlotte
Complete
Jianping Fan jfan@uncc.
edu
Video Surveillance Visual
Analytics
Co-
Principal
Investigato
r
University
of North
Carolina-
Charlotte
In Progress
13 Brian Fisher bfisher@sf
u.ca
MDRP 18: COE-Explorer
(Visual Analytics for the
DHS Centers of
Excellence)
Co-
Principal
Investigato
r
Simon
Fraser
University
Complete
28 Brian Fisher bfisher@sf
u.ca
MDRP 1: Geovisual
Analytics
Co-
Principal
Investigato
r
Simon
Fraser
University
Complete
14 Brian Fisher bfisher@sf
u.ca
MDRP 6: Video
Surveillance Visual
Analytics
Principal
Investigato
r
Complete
84 Brian Fisher bfisher@sf
u.ca
SEED 1: Investigation of
the Impacts of
Visualization Literacy on
the Performance of Visual
Analysis; International
Collaborations
Co-
Principal
Investigato
r
Simon
Fraser
University
Complete
15 Daniel Frysinger (Crowdsourcing)
Combining
Crowdsourcing
technology with machine
learning to do visual
analytics on big
qualitative data (video
datasets).
Other University
of
California
San Diego
Complete

15 Neeraj Gadgil (Crowdsourcing)
Combining
Crowdsourcing
technology with machine
learning to do visual
analytics on big
qualitative data (video
datasets).
Other Purdue
University
Complete
12 Kelly Gaither kelly@tacc.
utexas.edu
(VASA) – Visual Analytics
for Security Applications
Investigato
r
University
of Texas
Complete
76 Kelly Gaither kelly@tacc.
utexas.edu
Exascale Data
Visualization: Information-
assisted data analysis
and visualization
Principal
Investigato
r
University
of Texas
Complete
24 Kelly Gaither kelly@tacc.
utexas.edu
Multimedia, Social Media,
Text, and Emergency
Response Analytics
Co-
Principal
Investigato
r
University
of Texas,
Austin
Complete
88 Kelly Gaither kelly@tacc.
utexas.edu
Parallelizing Video
Algorithms for Public
Safety Applications
Principal
Investigato
r
University
of Texas,
Austin
Complete
89 Kelly Gaither kelly@tacc.
utexas.edu
Parallelizing Video
Algorithms for Real-
Time/Near-Real-Time
Public Safety
Applications; Public
Safety Coaltion Project
Principal
Investigato
r
University
of Texas,
Austin
John Gerth gerth@sta
nford.edu
MDRP 5: Cybersecurity
Visual Analytics
Co-
Principal
Investigato
r
Stanford
University
Complete
13 Sohaib Ghani MDRP 18: COE-Explorer
(Visual Analytics for the
DHS Centers of
Excellence)
Graduate
Student-
Doctorate
Purdue
University
Complete
Sohaib Ghani MDRP 18: Visual
Analytics for the DHS
Centers of Excellence
Other Purdue
University
Complete
Alex Godwin MDRP 1: (Jigsaw) Visual
Analytics for Investigative
Analysis on Text
Documents
Graduate
Student-
Masters
Georgia
Institute of
Technolog
y
In Progress
111 Ashok Goel MDRP 2: Integrate
Automated Analytical
Reasoning into Jigsaw
Investigato
r
Georgia
Institute of
Technolog
y
Complete

Sujatha Gollapalli MDRP 3: (GeoViz &
CrimeViz) Situational
Surveillance & In-field
Criminal Investigative
Analytics
Other Pennsylvan
ia State
University
Complete
7 Sujatha
Das
Gollapalli (GeoTxt) E2E: GeoTxt
API
Other Pennsylvan
ia State
University
In Progress
Sujatha
Das
Gollapalli MDRP 13: GeoJunction:
Collaborative Visual-
Computational
Information Foraging and
Contextualization to
Support Situation
Awareness
Other Pennsylvan
ia State
University
Complete
128 John Goodall Context-Driven Visual
Analytics for Cyber
Defensive Operations -
Oak Ridge N Lab
Co-
Principal
Investigato
r
Complete
115 Jack Guest SP 15-Task 3: Event
Evacuation Planning;
Public Safety Coalition
Projects
Graduate
Student-
Masters
University
of North
Carolina at
Charlotte
Complete
114 Jack Guest Situation Surveillance &
In-field Criminal
Investigative Analytics;
Public Safety Coalition
Projects
Other University
of North
Carolina at
Charlotte
Complete
8 Elaine Guidero Symbology
Standardization Support
Other Pennsylvan
ia State
University
Complete
11 Andrew Haddad (MERGE) Mobile
Emergency Response
Guide
Other Purdue
University
Complete
100 Chris Hankins UKVAC II Collaborato
r-unpaid
Complete
112 Pat Hanrahan hanrahan
@cs.stanfo
rd.edu
SP 1: Improving Query
Performance in Large
Scale Analytic Databases
Principal
Investigato
r
Stanford
University
Complete
Patrick Hanrahan hanrahan
@cs.stanfo
rd.edu
MDRP 5: Cybersecurity
Visual Analytics
Co-
Principal
Investigato
r
Stanford
University
Complete
112 Patrick Hanrahan hanrahan
@cs.stanfo
rd.edu
SP 1: Improving Query
Performance in Large
Scale Analytic Databases
Principal
Investigato
r
Stanford
University
Complete
Frank Hardisty hardisty@p
su.edu
MDRP 12: Foreign
Animal and Zoonotic
Disease Visual Analytics
Co-
Principal
Investigato
r
Pennsylvan
ia State
University
Complete

Frank Hardisty hardisty@p
su.edu
MDRP 3: (GeoViz &
CrimeViz) Situational
Surveillance & In-field
Criminal Investigative
Analytics
Co-
Principal
Investigato
r
Pennsylvan
ia State
University
Complete
114 Frank Hardisty Situation Surveillance &
In-field Criminal
Investigative Analytics;
Public Safety Coalition
Projects
Co-
Principal
Investigato
r
Purdue
University
Complete
128 Chris Harshaw Context-Driven Visual
Analytics for Cyber
Defensive Operations -
Oak Ridge N Lab
Undergrad
uate
Student
Complete
David Hartley MDRP 12: Foreign
Animal and Zoonotic
Disease Visual Analytics
Co-
Principal
Investigato
r
Texas A &
M
University
Complete
81 Mark Haselkorn markh@u.
washington
.edu
Developing a Sustainable
Visual Analytics for
Command Center
Environments
Principal
Investigato
r
University
of
Washingto
n
Complete
81 Mark Haselkorn markh@u.
washington
.edu
Developing a Sustainable
Visual Analytics for
Command Center
Environments
Principal
Investigato
r
University
of
Washingto
n
Complete
82 Mark Haselkorn markh@u.
washington
.edu
Enhancing Interactive
Visual Analysis and
Decision Making
Environments
Principal
Investigato
r
University
of
Washingto
n
Complete
Mark Haselkorn markh@u.
washington
.edu
MDRP 7: Introducing
Sustainable Visual
Analytics into Command
Center Environments
Co-
Principal
Investigato
r
University
of
Washingto
n
Complete
14 Sabrina Hauser MDRP 6: Video
Surveillance Visual
Analytics
Graduate
Student-
Doctorate
Complete
Matthew Hawkins MDRP 11: Financial
Fraud Visual Analytics
Graduate
Student-
Doctorate
University
of North
Carolina at
Charlotte
Complete
24 Bob Hay hayrw@ep
b.net
Multimedia, Social Media,
Text, and Emergency
Response Analytics
Co-
Principal
Investigato
r
Complete
24 Hossein Hematiala
m
Multimedia, Social Media,
Text, and Emergency
Response Analytics
Other University
of North
Carolina at
Charlotte
Complete
Hooman Hemmati EP 2: MSI Collaboration Investigato
r
University
of Houston-
Downtown
Complete

Erin Hodgess hodgesse
@zeus.dt.u
h.edu
EP 1: Leadership and
Coordination
Co-
Principal
Investigato
r
University
of Houston-
Downtown
Complete
Erin Hodgess hodgesse
@zeus.dt.u
h.edu
MDRP 16: (VALET)
Context-aware Mobile
Visual Analytics for
Emergency Response
Co-
Principal
Investigato
r
University
of Houston-
Downtown
Complete
13 Ed Hovy hovy@cmu
.edu
MDRP 18: COE-Explorer
(Visual Analytics for the
DHS Centers of
Excellence)
Co-
Principal
Investigato
r
University
of
Southern
California
Complete
Eduard Hovy [email protected]
du
MDRP 13: GeoJunction:
Collaborative Visual-
Computational
Information Foraging and
Contextualization to
Support Situation
Awareness
Co-
Principal
Investigato
r
University
of
Southern
California
Complete
Eduard Hovy [email protected]
du
MDRP 18: Visual
Analytics for the DHS
Centers of Excellence
Co-
Principal
Investigato
r
University
of
Southern
California
Complete
28 Eduard Hovy hovy@cmu
.edu
MDRP 1: Geovisual
Analytics
Co-
Principal
Investigato
r
Carnegie
Mellon
University
Complete
116 Eduard Hovy hovy@cmu
.edu
RECONNECT Workshop
2010 - Extracting and
Visualizing Information
from Natural Language
Text
Principal
Investigato
r
University
of
Southern
California
Complete
107 James Howard EP 3: K-12 Programs Co-
Principal
Investigato
r
Complete
Mengdie Hu MDRP 1: (Jigsaw) Visual
Analytics for Investigative
Analysis on Text
Documents
Other Georgia
Institute of
Technolog
y
In Progress
7 Wenyi Huang (GeoTxt) E2E: GeoTxt
API
Other Pennsylvan
ia State
University
In Progress
67 Whitney Huang huang251
@purdue.e
du
LAHVA: Linked Animal-
Human Health Visual
Analytics
Graduate
Student-
Doctorate
Purdue
University
Complete
80 Aaron Huber Navajo Nation Graffiti
Project
Undergrad
uate
Student
Navajo
Technical
University
Withdrawn
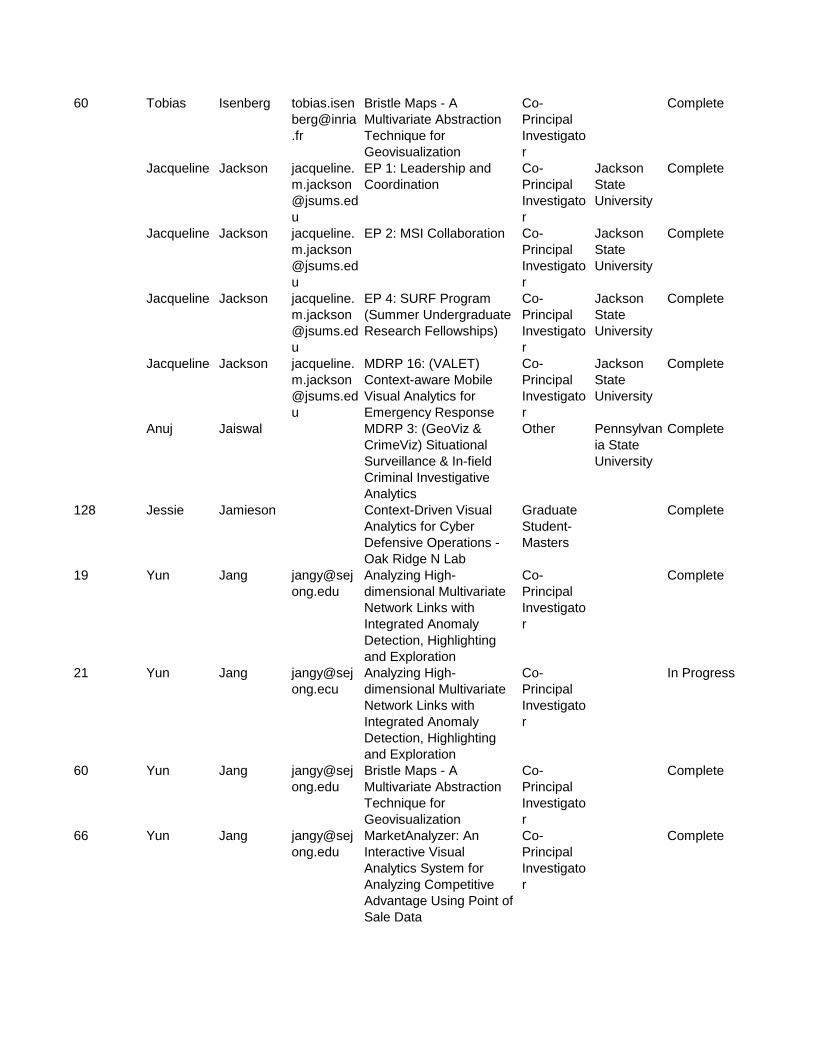
60 Tobias Isenberg tobias.isen
berg@inria
.fr
Bristle Maps - A
Multivariate Abstraction
Technique for
Geovisualization
Co-
Principal
Investigato
r
Complete
Jacqueline Jackson jacqueline.
m.jackson
@jsums.ed
u
EP 1: Leadership and
Coordination
Co-
Principal
Investigato
r
Jackson
State
University
Complete
Jacqueline Jackson jacqueline.
m.jackson
@jsums.ed
u
EP 2: MSI Collaboration Co-
Principal
Investigato
r
Jackson
State
University
Complete
Jacqueline Jackson jacqueline.
m.jackson
@jsums.ed
u
EP 4: SURF Program
(Summer Undergraduate
Research Fellowships)
Co-
Principal
Investigato
r
Jackson
State
University
Complete
Jacqueline Jackson jacqueline.
m.jackson
@jsums.ed
u
MDRP 16: (VALET)
Context-aware Mobile
Visual Analytics for
Emergency Response
Co-
Principal
Investigato
r
Jackson
State
University
Complete
Anuj Jaiswal MDRP 3: (GeoViz &
CrimeViz) Situational
Surveillance & In-field
Criminal Investigative
Analytics
Other Pennsylvan
ia State
University
Complete
128 Jessie Jamieson Context-Driven Visual
Analytics for Cyber
Defensive Operations -
Oak Ridge N Lab
Graduate
Student-
Masters
Complete
19 Yun Jang jangy@sej
ong.edu
Analyzing High-
dimensional Multivariate
Network Links with
Integrated Anomaly
Detection, Highlighting
and Exploration
Co-
Principal
Investigato
r
Complete
21 Yun Jang jangy@sej
ong.ecu
Analyzing High-
dimensional Multivariate
Network Links with
Integrated Anomaly
Detection, Highlighting
and Exploration
Co-
Principal
Investigato
r
In Progress
60 Yun Jang jangy@sej
ong.edu
Bristle Maps - A
Multivariate Abstraction
Technique for
Geovisualization
Co-
Principal
Investigato
r
Complete
66 Yun Jang jangy@sej
ong.edu
MarketAnalyzer: An
Interactive Visual
Analytics System for
Analyzing Competitive
Advantage Using Point of
Sale Data
Co-
Principal
Investigato
r
Complete

Wall Jim MDRP 7: Introducing
Sustainable Visual
Analytics into Command
Center Environments
Graduate
Student-
Masters
University
of
Washingto
n
Complete
59 Jenish Joseph SP 17: Distributed
Rendering for Web-
Enabling the Stadium
Evacuation Planning Tool
Co-
Principal
Investigato
r
Complete
106 Shantanu Joshi Visual Analytics Law
Enforcement Technology;
Public Safety Coalition
Projects
Undergrad
uate
Student
Purdue
University
In Progress
8 Stevens Joshua Symbology
Standardization Support
Other Pennsylvan
ia State
University
Complete
84 Linda Kaastra SEED 1: Investigation of
the Impacts of
Visualization Literacy on
the Performance of Visual
Analysis; International
Collaborations
Co-
Principal
Investigato
r
Simon
Fraser
University
Complete
Youn-ah Kang MDRP 1: (Jigsaw) Visual
Analytics for Investigative
Analysis on Text
Documents
Other Georgia
Institute of
Technolog
y
In Progress
7 Morteza Karimzade
h
(GeoTxt) E2E: GeoTxt
API
Other Pennsylvan
ia State
University
In Progress
7 Morteza Karimzade
h
(GeoTxt) E2E: GeoTxt
API
Other Pennsylvan
ia State
University
In Progress
12 Daniel Keim Daniel.Kei
m@uni-
konstanz.d
e
(VASA) – Visual Analytics
for Security Applications
Co-
Principal
Investigato
r
Complete
24 Daniel Keim keim@uni-
konstanz.d
e
Multimedia, Social Media,
Text, and Emergency
Response Analytics
Co-
Principal
Investigato
r
Complete
12 Shaun Kennedy kenne108
@umn.edu
(VASA) – Visual Analytics
for Security Applications
Co-
Principal
Investigato
r
University
of
Minnesota
Complete
24 Shaun Kennedy Shaun.Ken
nedy@ncfp
d.umn.edu
Multimedia, Social Media,
Text, and Emergency
Response Analytics
Co-
Principal
Investigato
r
University
of
Minnesota
Complete

132 Joe Kielman joseph.kiel
man@dhs.
gov
Crime Maps Principal
Investigato
r
Office of
University
Programs,
Science
&
Technolog
y
Directorate
Complete
63 Joe Kielman joseph.kiel
man@dhs.
gov
ISIS - Infovis System for
Investigating Intrusions
Principal
Investigato
r
Office of
University
Programs,
Science
&
Technolog
y
Directorate
Complete
122 Joe Kielman joseph.kiel
man@dhs.
gov
SP 15 Task 2: VASA Principal
Investigato
r
Office of
University
Programs,
Science
&
Technolog
y
Directorate
Complete
Eun-
Kyeong
Kim MDRP 13: GeoJunction:
Collaborative Visual-
Computational
Information Foraging and
Contextualization to
Support Situation
Awareness
Other Pennsylvan
ia State
University
Complete
8 Eun-
Kyeong
Kim Symbology
Standardization Support
Other Pennsylvan
ia State
University
Complete
10 Joonoo Kim (GARI) Gang Graffiti
Recognition and Analysis
Graduate
Student-
Doctorate
Purdue
University
In Progress
11 Joonoo Kim (MERGE) Mobile
Emergency Response
Guide
Other Purdue
University
Complete
84 Sung-Hee Kim SEED 1: Investigation of
the Impacts of
Visualization Literacy on
the Performance of Visual
Analysis; International
Collaborations
Co-
Principal
Investigato
r
Purdue
University
Complete
60 SungYe Kim Bristle Maps - A
Multivariate Abstraction
Technique for
Geovisualization
Co-
Principal
Investigato
r
Purdue
University
Complete

106 SungYe Kim Visual Analytics Law
Enforcement Technology;
Public Safety Coalition
Projects
Graduate
Student-
Masters
Purdue
University
In Progress
15 David Kirsh kirsh@ucs
d.edu
(Crowdsourcing)
Combining
Crowdsourcing
technology with machine
learning to do visual
analytics on big
qualitative data (video
datasets).
Principal
Investigato
r
University
of
California
San Diego
Complete
11 Sungahn Ko ko@purdu
e.edu
(MERGE) Mobile
Emergency Response
Guide
Graduate
Student-
Doctorate
Purdue
University
Complete
12 Sungahn Ko ko@purdu
e.edu
(VASA) – Visual Analytics
for Security Applications
Graduate
Student-
Doctorate
Purdue
University
Complete
18 Sungahn Ko ko@purdu
e.edu
COAST: Coastal
Operations and Analysis
Suite of Tools
Graduate
Student-
Doctorate
Purdue
University
Complete
66 Sungahn Ko ko@purdu
e.edu
MarketAnalyzer: An
Interactive Visual
Analytics System for
Analyzing Competitive
Advantage Using Point of
Sale Data
Co-
Principal
Investigato
r
Purdue
University
Complete
106 Sungahn Ko ko@purdu
e.edu
Visual Analytics Law
Enforcement Technology;
Public Safety Coalition
Projects
Graduate
Student-
Masters
Purdue
University
In Progress
16 Sunghan Ko ko@purdu
e.edu
(CgSARVA) Coast Guard
Search and Rescue
Visual Analytics
Graduate
Student-
Doctorate
Purdue
University
Complete
8 Peter Koby Symbology
Standardization Support
Other Pennsylvan
ia State
University
Complete
Robert Kosara MDRP 11: Financial
Fraud Visual Analytics
Co-
Principal
Investigato
r
University
of North
Carolina at
Charlotte
Complete
Robert Kosara rkosara@u
ncc.edu
MDRP 17: START Center
Visual Analytics
Co-
Principal
Investigato
r
University
of North
Carolina at
Charlotte
Withdrawn

116 Zornitsa Kozareva kozareva@
isi.edu
RECONNECT Workshop
2010 - Extracting and
Visualizing Information
from Natural Language
Text
Co-
Principal
Investigato
r
University
of
Southern
California
Complete
24 Thomas Kraft Multimedia, Social Media,
Text, and Emergency
Response Analytics
Other University
of North
Carolina at
Charlotte
Complete
84 Bum chul Kwon SEED 1: Investigation of
the Impacts of
Visualization Literacy on
the Performance of Visual
Analysis; International
Collaborations
Investigato
r
Purdue
University
Complete
24 Justin LaRoche Justin.LaR
oche@duk
e-
energy.co
m
Multimedia, Social Media,
Text, and Emergency
Response Analytics
Consultant Complete
128 Michael Lannacone Context-Driven Visual
Analytics for Cyber
Defensive Operations -
Oak Ridge N Lab
Co-
Principal
Investigato
r
Complete
108 Victoria Lemieux v.lemieux
@ubc.ca
Personal Visual Analytics
Workshop
Co-
Principal
Investigato
r
University
of British
Columbia
Complete
106 Jing Li Visual Analytics Law
Enforcement Technology;
Public Safety Coalition
Projects
Undergrad
uate
Student
Purdue
University
In Progress
4 Tao Li (MADIS) A Data
Integration Framework for
Enhancing Emergency
Response Situation
Reports with Multi-
Agency, Multi-Partner
Multimedia Data
Co-
Principal
Investigato
r
Florida
Internation
al
University
Complete
58 Tao Li [email protected]
u.edu
A Data Integration
Framework for Enhancing
Emergency Response
Situation Reports with
Multi-Agency, Multi-
Partner Multimedia Data;
Public Safety Coalition
Projects
Co-
Principal
Investigato
r
Florida
Internation
al
University
Complete

65 Hong Lin VACCINE Affinity
Research Groups
Co-
Principal
Investigato
r
University
of Houston-
Downtown
Complete
108 Evert Lindquist evert.lindq
du.au
Personal Visual Analytics
Workshop
Co-
Principal
Investigato
r
Complete
Dongning Liu MDRP 14: Multimedia
Visual Analytics for
Investigative Analysis
Other University
of North
Carolina at
Charlotte
Complete
Yujie Liu MDRP 14: Multimedia
Visual Analytics for
Investigative Analysis
Other University
of North
Carolina at
Charlotte
Complete
24 Yujie Liu Multimedia, Social Media,
Text, and Emergency
Response Analytics
Other University
of North
Carolina at
Charlotte
Complete
Zhicheng Liu MDRP 1: (Jigsaw) Visual
Analytics for Investigative
Analysis on Text
Documents
Other Georgia
Institute of
Technolog
y
In Progress
27 Yafeng Lu WDYTYA: The
Uncertainty of Identity
Other Arizona
State
University
Complete
4 Steven Luis (MADIS) A Data
Integration Framework for
Enhancing Emergency
Response Situation
Reports with Multi-
Agency, Multi-Partner
Multimedia Data
Investigato
r
Florida
Internation
al
University
Complete
58 Steven Luis [email protected]
u.edu
A Data Integration
Framework for Enhancing
Emergency Response
Situation Reports with
Multi-Agency, Multi-
Partner Multimedia Data;
Public Safety Coalition
Projects
Investigato
r
Florida
Internation
al
University
Complete
7 Alan MacEachre
n
maceachre
(GeoTxt) E2E: GeoTxt
API
Principal
Investigato
r
Pennsylvan
ia State
University
In Progress
7 Alan MacEachre
n
maceachre
(GeoTxt) E2E: GeoTxt
API
Principal
Investigato
r
Pennsylvan
ia State
University
In Progress

Alan MacEachre
n
maceachre
MDRP 12: Foreign
Animal and Zoonotic
Disease Visual Analytics
Co-
Principal
Investigato
r
Pennsylvan
ia State
University
Complete
9 Alan MacEachre
n
maceachre
MDRP 13: (SensePlace
2) Collaborative Visual-
Computational
Information Foraging and
Contextualization to
Support Situation
Awareness
Principal
Investigato
r
Pennsylvan
ia State
University
Complete
9 Alan MacEachre
n
maceachre
MDRP 13: (SensePlace
2) Collaborative Visual-
Computational
Information Foraging and
Contextualization to
Support Situation
Awareness
Principal
Investigato
r
Pennsylvan
ia State
University
Complete
Alan MacEachre
n
maceachre
MDRP 13: GeoJunction:
Collaborative Visual-
Computational
Information Foraging and
Contextualization to
Support Situation
Awareness
Co-
Principal
Investigato
r
Pennsylvan
ia State
University
Complete
Alan MacEachre
n
maceachre
MDRP 1: (Jigsaw) Visual
Analytics for Investigative
Analysis on Text
Documents
Co-
Principal
Investigato
r
Pennsylvan
ia State
University
In Progress
28 Alan MacEachre
n
maceachre
MDRP 1: Geovisual
Analytics
Co-
Principal
Investigato
r
Pennsylvan
ia State
University
Complete
Alan MacEachre
n
maceachre
MDRP 3: (GeoViz &
CrimeViz) Situational
Surveillance & In-field
Criminal Investigative
Analytics
Co-
Principal
Investigato
r
Pennsylvan
ia State
University
Complete
118 Alan MacEachre
n
maceachre
SP 14 Task 3: Technical
Integration into ExPOD at
JIBC
Principal
Investigato
r
Pennsylvan
ia State
University
Complete
46 Alan MacEachre
n
maceachre
SP 2: CCC Tech Support Principal
Investigato
r
Pennsylvan
ia State
University
Complete
46 Alan MacEachre
n
maceachre
SP 2: CCC Tech Support Principal
Investigato
r
Pennsylvan
ia State
University
Complete
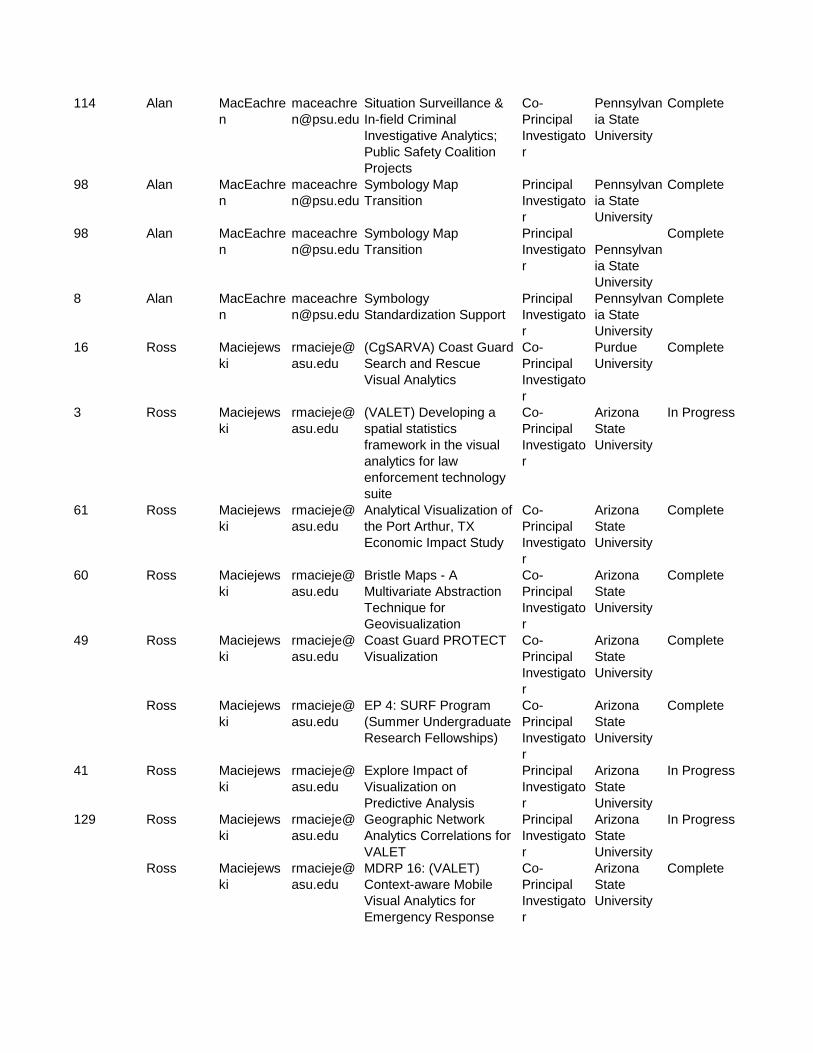
114 Alan MacEachre
n
maceachre
Situation Surveillance &
In-field Criminal
Investigative Analytics;
Public Safety Coalition
Projects
Co-
Principal
Investigato
r
Pennsylvan
ia State
University
Complete
98 Alan MacEachre
n
maceachre
Symbology Map
Transition
Principal
Investigato
r
Pennsylvan
ia State
University
Complete
98 Alan MacEachre
n
maceachre
Symbology Map
Transition
Principal
Investigato
r
Pennsylvan
ia State
University
Complete
8 Alan MacEachre
n
maceachre
Symbology
Standardization Support
Principal
Investigato
r
Pennsylvan
ia State
University
Complete
16 Ross Maciejews
ki
rmacieje@
asu.edu
(CgSARVA) Coast Guard
Search and Rescue
Visual Analytics
Co-
Principal
Investigato
r
Purdue
University
Complete
3 Ross Maciejews
ki
rmacieje@
asu.edu
(VALET) Developing a
spatial statistics
framework in the visual
analytics for law
enforcement technology
suite
Co-
Principal
Investigato
r
Arizona
State
University
In Progress
61 Ross Maciejews
ki
rmacieje@
asu.edu
Analytical Visualization of
the Port Arthur, TX
Economic Impact Study
Co-
Principal
Investigato
r
Arizona
State
University
Complete
60 Ross Maciejews
ki
rmacieje@
asu.edu
Bristle Maps - A
Multivariate Abstraction
Technique for
Geovisualization
Co-
Principal
Investigato
r
Arizona
State
University
Complete
49 Ross Maciejews
ki
rmacieje@
asu.edu
Coast Guard PROTECT
Visualization
Co-
Principal
Investigato
r
Arizona
State
University
Complete
Ross Maciejews
ki
rmacieje@
asu.edu
EP 4: SURF Program
(Summer Undergraduate
Research Fellowships)
Co-
Principal
Investigato
r
Arizona
State
University
Complete
41 Ross Maciejews
ki
rmacieje@
asu.edu
Explore Impact of
Visualization on
Predictive Analysis
Principal
Investigato
r
Arizona
State
University
In Progress
129 Ross Maciejews
ki
rmacieje@
asu.edu
Geographic Network
Analytics Correlations for
VALET
Principal
Investigato
r
Arizona
State
University
In Progress
Ross Maciejews
ki
rmacieje@
asu.edu
MDRP 16: (VALET)
Context-aware Mobile
Visual Analytics for
Emergency Response
Co-
Principal
Investigato
r
Arizona
State
University
Complete

66 Ross Maciejews
ki
rmacieje@
asu.edu
MarketAnalyzer: An
Interactive Visual
Analytics System for
Analyzing Competitive
Advantage Using Point of
Sale Data
Co-
Principal
Investigato
r
Arizona
State
University
Complete
59 Ross Maciejews
ki
rmacieje@
asu.edu
SP 17: Distributed
Rendering for Web-
Enabling the Stadium
Evacuation Planning Tool
Co-
Principal
Investigato
r
Purdue
University
Complete
101 Ross Maciejews
ki
rmacieje@
asu.edu
Visual Analytics Decision
Support Environment for
Epidemic Modeling and
Response Evaluation;
Public Safety Coalition
Projects
Co-
Principal
Investigato
r
Arizona
State
University
Complete
105 Ross Maciejews
ki
rmacieje@
asu.edu
Visual Analytics
Environment for Public
Health Surveillance
Co-
Principal
Investigato
r
Arizona
State
University
Complete
106 Ross Maciejews
ki
rmacieje@
asu.edu
Visual Analytics Law
Enforcement Technology;
Public Safety Coalition
Projects
Co-
Principal
Investigato
r
Arizona
State
University
In Progress
27 Ross Maciejews
ki
rmacieje@
asu.edu
WDYTYA: The
Uncertainty of Identity
Principal
Investigato
r
Arizona
State
University
Complete
41 Ross Maciejwski rmacieje@
asu.edu
Explore Impact of
Visualization on
Predictive Analysis
Principal
Investigato
r
Arizona
State
University
In Progress
129 Ross Maciejwski rmacieje@
asu.edu
Geographic Network
Analytics Correlations for
VALET
Principal
Investigato
r
Arizona
State
University
In Progress
27 Ross Maciejwski rmacieje@
asu.edu
WDYTYA: The
Uncertainty of Identity
Principal
Investigato
r
Arizona
State
University
Complete
16 Abish Malik amalik@pu
rdue.edu
(CgSARVA) Coast Guard
Search and Rescue
Visual Analytics
Graduate
Student-
Doctorate
Purdue
University
Complete
11 Abish Malik amalik@pu
rdue.edu
(MERGE) Mobile
Emergency Response
Guide
Graduate
Student-
Doctorate
Purdue
University
Complete
3 Abish Malik amalik@pu
rdue.edu
(VALET) Developing a
spatial statistics
framework in the visual
analytics for law
enforcement technology
suite
Co-
Principal
Investigato
r
Purdue
University
In Progress

60 Abish Malik amalik@pu
rdue.edu
Bristle Maps - A
Multivariate Abstraction
Technique for
Geovisualization
Co-
Principal
Investigato
r
Purdue
University
Complete
18 Abish Malik amalik@pu
rdue.edu
COAST: Coastal
Operations and Analysis
Suite of Tools
Graduate
Student-
Doctorate
Purdue
University
Complete
68 Abish Malik amalik@pu
rdue.edu
High Risk Alcohol
Behavior Analysis
Graduate
Student-
Doctorate
Purdue
University
Complete
22 Abish Malik amalik@pu
rdue.edu
Safety in View: A Public
Safety Visual Analytics
Tool Based on CCTV
Camera Angles of View
Graduate
Student-
Doctorate
Purdue
University
Complete
106 Abish Malik amalik@pu
rdue.edu
Visual Analytics Law
Enforcement Technology;
Public Safety Coalition
Projects
Graduate
Student-
Masters
Purdue
University
In Progress
75 Abish Malik amalik@pu
rdue.edu
iVALET - Mobile Visual
Analytics Law
Enforcement Toolkit
Graduate
Student-
Doctorate
Purdue
University
Complete
Madhav Marathe mmarathe
@vbi.vt.ed
u
MDRP 3: (GeoViz &
CrimeViz) Situational
Surveillance & In-field
Criminal Investigative
Analytics
Co-
Principal
Investigato
r
Virginia
State
University
Complete
114 Madhav Marathe Situation Surveillance &
In-field Criminal
Investigative Analytics;
Public Safety Coalition
Projects
Investigato
r
Complete
82 Robin Mays Enhancing Interactive
Visual Analysis and
Decision Making
Environments
Graduate
Student-
Doctorate
University
of
Washingto
n
Complete
Robin Mays MDRP 7: Introducing
Sustainable Visual
Analytics into Command
Center Environments
Graduate
Student-
Doctorate
University
of
Washingto
n
Complete
114 John Merritt Situation Surveillance &
In-field Criminal
Investigative Analytics;
Public Safety Coalition
Projects
Other University
of North
Carolina at
Charlotte
Complete
107 Kent Mikel EP 3: K-12 Programs Co-
Principal
Investigato
r
Complete

Prasenjit Mitra pmitra@ist.
psu.edu
MDRP 13: GeoJunction:
Collaborative Visual-
Computational
Information Foraging and
Contextualization to
Support Situation
Awareness
Co-
Principal
Investigato
r
Pennsylvan
ia State
University
Complete
Prasenjit Mitra pmitra@ist.
psu.edu
MDRP 1: (Jigsaw) Visual
Analytics for Investigative
Analysis on Text
Documents
Co-
Principal
Investigato
r
Pennsylvan
ia State
University
In Progress
28 Prasenjit Mitra pmitra@ist.
psu.edu
MDRP 1: Geovisual
Analytics
Co-
Principal
Investigato
r
Pennsylvan
ia State
University
Complete
Prasenjit Mitra pmitra@ist.
psu.edu
MDRP 3: (GeoViz &
CrimeViz) Situational
Surveillance & In-field
Criminal Investigative
Analytics
Co-
Principal
Investigato
r
Pennsylvan
ia State
University
Complete
114 Prasenjit Mitra pmitra@ist.
psu.edu
Situation Surveillance &
In-field Criminal
Investigative Analytics;
Public Safety Coalition
Projects
Co-
Principal
Investigato
r
Pennsylvan
ia State
University
Complete
Loretta Moore loretta.a.m
oore@jsu
ms.edu
EP 1: Leadership and
Coordination
Co-
Principal
Investigato
r
Jackson
State
University
Complete
Loretta Moore loretta.a.m
oore@jsu
ms.edu
EP 2: MSI Collaboration Co-
Principal
Investigato
r
Jackson
State
University
Complete
16 Daudi Muhamed (CgSARVA) Coast Guard
Search and Rescue
Visual Analytics
Undergrad
uate
Student
Purdue
University
Complete
Ryan Mullins MDRP 3: (GeoViz &
CrimeViz) Situational
Surveillance & In-field
Criminal Investigative
Analytics
Other Pennsylvan
ia State
University
Complete
98 Ryan Mullins Symbology Map
Transition
Other Pennsylvan
ia State
University
Complete
8 Ryan Mullins Symbology
Standardization Support
Other Pennsylvan
ia State
University
Complete
14 Ka Ki Ng MDRP 6: Video
Surveillance Visual
Analytics
Graduate
Student-
Masters
Purdue
University
Complete

36 Louis Ngamassi longamassi
@pvamu.e
du
Crisis Informatics Course
Development
Principal
Investigato
r
Prairie
View A &
M
University
Complete
Nathan Nikotan EP 2: MSI Collaboration Investigato
r
California
State
University-
Dominguez
Hills
Complete
77 Chris North [email protected]
t.edu
Co-Located Collaborative
Analysis on Large, High-
Resolution Displays using
Multiple Input Devices;
Public Safety Coalition
Projects
Principal
Investigato
r
Virginia
Tech
University
Complete
69 Chris North [email protected]
t.edu
Collaborative
Sensemaking on Large,
High-Resolution Displays
Complete
5 Kofi Nyarko kofi.nyarko
@morgan.
edu
(iLEAPS) iLaw
Enforcement Apps
Assistance Program for
Students
Co-
Principal
Investigato
r
Morgan
State
University
Complete
114 Onyewuchi Obirieze Situation Surveillance &
In-field Criminal
Investigative Analytics;
Public Safety Coalition
Projects
Other University
of North
Carolina at
Charlotte
Complete
16 Silvia Oliveros solivero@p
urdue.edu
(CgSARVA) Coast Guard
Search and Rescue
Visual Analytics
Graduate
Student-
Doctorate
Purdue
University
Complete
18 Silvia Oliveros-
Torres
solivero@p
urdue.edu
COAST: Coastal
Operations and Analysis
Suite of Tools
Graduate
Student-
Doctorate
Purdue
University
Complete
106 Silvia Oliveros-
Torres
solivero@p
urdue.edu
Visual Analytics Law
Enforcement Technology;
Public Safety Coalition
Projects
Graduate
Student-
Masters
Purdue
University
In Progress
12 Osarieme Omokaro (VASA) – Visual Analytics
for Security Applications
Other University
of North
Carolina at
Charlotte
Complete
120 Osarieme Omokaro SP 14 Task 5: Visual
Analytics for Security
Applications - VASA
Other University
of North
Carolina at
Charlotte
Complete
10 Albert Parra (GARI) Gang Graffiti
Recognition and Analysis
Graduate
Student-
Doctorate
Purdue
University
In Progress

11 Albert Parra Pozo (MERGE) Mobile
Emergency Response
Guide
Graduate
Student-
Doctorate
Purdue
University
Complete
106 Kushal Patel Visual Analytics Law
Enforcement Technology;
Public Safety Coalition
Projects
Undergrad
uate
Student
Purdue
University
In Progress
80 Dustin Perry Navajo Nation Graffiti
Project
Undergrad
uate
Student
Navajo
Technical
University
Withdrawn
80 Myron Peters Navajo Nation Graffiti
Project
Undergrad
uate
Student
Navajo
Technical
University
Withdrawn
Hannah Pileggi MDRP 1: (Jigsaw) Visual
Analytics for Investigative
Analysis on Text
Documents
Other Georgia
Institute of
Technolog
y
In Progress
Bill Pottenger billp@dima
cs.rutgers.
edu
MDRP 17: START Center
Visual Analytics
Co-
Principal
Investigato
r
Rutgers
University
Withdrawn
Sakshi Pratap MDRP 1: (Jigsaw) Visual
Analytics for Investigative
Analysis on Text
Documents
Graduate
Student-
Masters
Georgia
Institute of
Technolog
y
In Progress
68 Ahmad Razip High Risk Alcohol
Behavior Analysis
Graduate
Student-
Doctorate
Purdue
University
Complete
106 Ahmad Razip Visual Analytics Law
Enforcement Technology;
Public Safety Coalition
Projects
Undergrad
uate
Student
Purdue
University
In Progress
75 Ahmad
Mujahid
Mohamme
d
Razip iVALET - Mobile Visual
Analytics Law
Enforcement Toolkit
Graduate
Student-
Doctorate
Purdue
University
Complete
128 Joel Reed Context-Driven Visual
Analytics for Cyber
Defensive Operations -
Oak Ridge N Lab
Co-
Principal
Investigato
r
Complete
12 Bill Ribarsky ribarsky@u
ncc.edu
(VASA) – Visual Analytics
for Security Applications
Co-
Principal
Investigato
r
University
of North
Carolina-
Charlotte
Complete
85 William Ribarsky ribarsky@u
ncc.edu
Critical Infrastructure
Integration Modeling and
Simulation Project
Principal
Investigato
r
University
of North
Carolina at
Charlotte

78 William Ribarsky ribarsky@u
ncc.edu
Critical Infrastructure in
Large Scale Emergencies
Principal
Investigato
r
University
of North
Carolina at
Charlotte
Complete
William Ribarsky ribarsky@u
ncc.edu
MDRP 11: Financial
Fraud Visual Analytics
Principal
Investigato
r
University
of North
Carolina at
Charlotte
Complete
William Ribarsky ribarsky@u
ncc.edu
MDRP 14: Multimedia
Visual Analytics for
Investigative Analysis
Co-
Principal
Investigato
r
University
of North
Carolina at
Charlotte
Complete
14 William Ribarsky ribarsky@u
ncc.edu
MDRP 6: Video
Surveillance Visual
Analytics
Co-
Principal
Investigato
r
University
of North
Carolina at
Charlotte
Complete
71 William Ribarsky ribarsky@u
ncc.edu
Mobile 3D Routing and
Emergency Evacuation in
Dense Urban
Environments
Principal
Investigato
r
University
of North
Carolina at
Charlotte
Complete
70 William Ribarsky ribarsky@u
ncc.edu
Mobile 3D Routing,
Emergency Evacuation,
and In-Field Criminal
Investigative Analytics
Principal
Investigato
r
University
of North
Carolina-
Charlotte
Complete
70 William Ribarsky ribarsky@u
ncc.edu
Mobile 3D Routing,
Emergency Evacuation,
and In-Field Criminal
Investigative Analytics
Principal
Investigato
r
University
of North
Carolina at
Charlotte
Complete
79 William Ribarsky ribarsky@u
ncc.edu
Multimedia Analytics for
Open Source Media
Principal
Investigato
r
University
of North
Carolina-
Charlotte
Complete
79 William Ribarsky ribarsky@u
ncc.edu
Multimedia Analytics for
Open Source Media
Principal
Investigato
r
University
of North
Carolina at
Charlotte
Complete
94 William Ribarsky ribarsky@u
ncc.edu
Multimedia Visual
Analytics for News, Blogs,
RSS Feeds and other
Streaming Data
Principal
Investigato
r
University
of North
Carolina at
Charlotte
Complete
24 William Ribarsky ribarsky@u
ncc.edu
Multimedia, Social Media,
Text, and Emergency
Response Analytics
Principal
Investigato
r
University
of North
Carolina at
Charlotte
Complete
24 William Ribarsky ribarsky@u
ncc.edu
Multimedia, Social Media,
Text, and Emergency
Response Analytics
Co-
Principal
Investigato
r
University
of North
Carolina-
Charlotte
Complete
92 William Ribarsky ribarsky@u
ncc.edu
RISK VA Principal
Investigato
r
University
of North
Carolina-
Charlotte
Complete
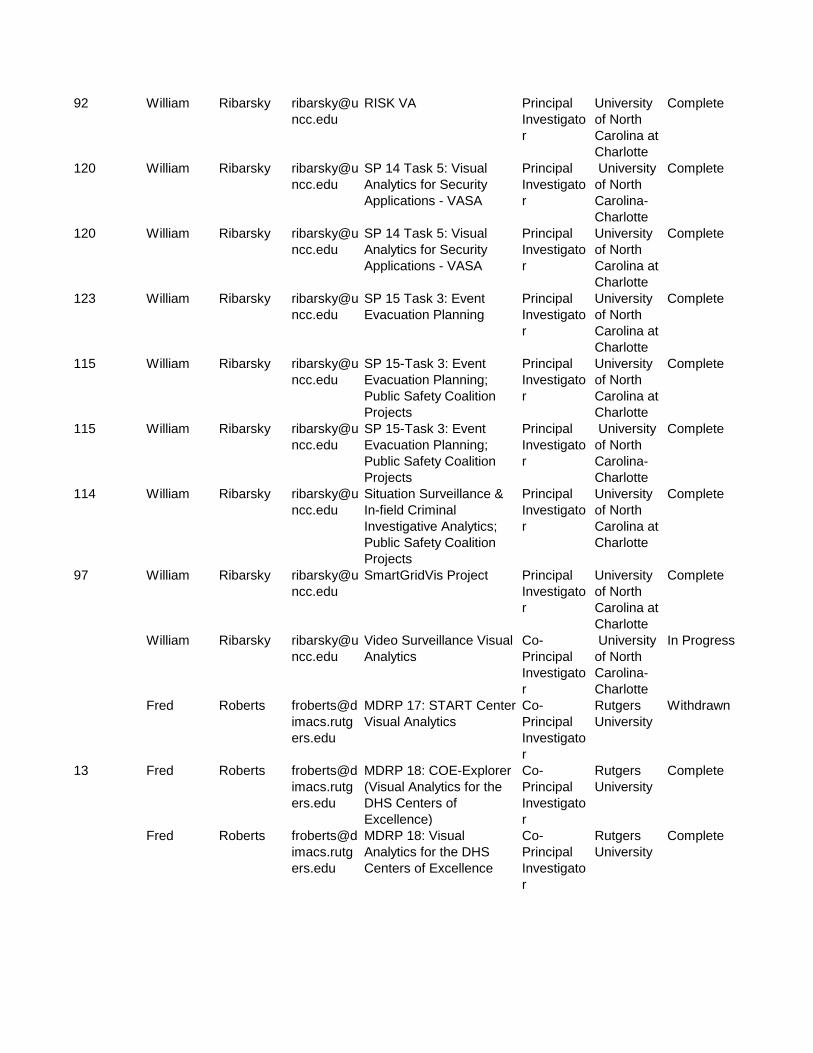
92 William Ribarsky ribarsky@u
ncc.edu
RISK VA Principal
Investigato
r
University
of North
Carolina at
Charlotte
Complete
120 William Ribarsky ribarsky@u
ncc.edu
SP 14 Task 5: Visual
Analytics for Security
Applications - VASA
Principal
Investigato
r
University
of North
Carolina-
Charlotte
Complete
120 William Ribarsky ribarsky@u
ncc.edu
SP 14 Task 5: Visual
Analytics for Security
Applications - VASA
Principal
Investigato
r
University
of North
Carolina at
Charlotte
Complete
123 William Ribarsky ribarsky@u
ncc.edu
SP 15 Task 3: Event
Evacuation Planning
Principal
Investigato
r
University
of North
Carolina at
Charlotte
Complete
115 William Ribarsky ribarsky@u
ncc.edu
SP 15-Task 3: Event
Evacuation Planning;
Public Safety Coalition
Projects
Principal
Investigato
r
University
of North
Carolina at
Charlotte
Complete
115 William Ribarsky ribarsky@u
ncc.edu
SP 15-Task 3: Event
Evacuation Planning;
Public Safety Coalition
Projects
Principal
Investigato
r
University
of North
Carolina-
Charlotte
Complete
114 William Ribarsky ribarsky@u
ncc.edu
Situation Surveillance &
In-field Criminal
Investigative Analytics;
Public Safety Coalition
Projects
Principal
Investigato
r
University
of North
Carolina at
Charlotte
Complete
97 William Ribarsky ribarsky@u
ncc.edu
SmartGridVis Project Principal
Investigato
r
University
of North
Carolina at
Charlotte
Complete
William Ribarsky ribarsky@u
ncc.edu
Video Surveillance Visual
Analytics
Co-
Principal
Investigato
r
University
of North
Carolina-
Charlotte
In Progress
Fred Roberts froberts@d
imacs.rutg
ers.edu
MDRP 17: START Center
Visual Analytics
Co-
Principal
Investigato
r
Rutgers
University
Withdrawn
13 Fred Roberts froberts@d
imacs.rutg
ers.edu
MDRP 18: COE-Explorer
(Visual Analytics for the
DHS Centers of
Excellence)
Co-
Principal
Investigato
r
Rutgers
University
Complete
Fred Roberts froberts@d
imacs.rutg
ers.edu
MDRP 18: Visual
Analytics for the DHS
Centers of Excellence
Co-
Principal
Investigato
r
Rutgers
University
Complete
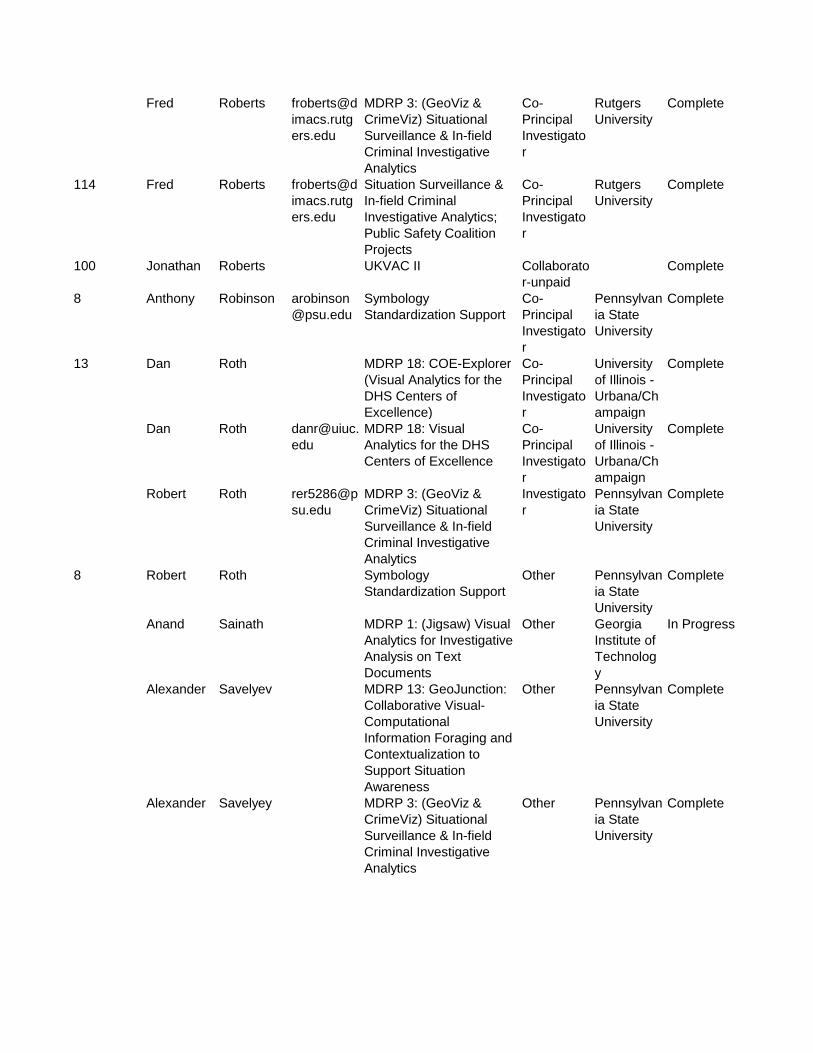
Fred Roberts froberts@d
imacs.rutg
ers.edu
MDRP 3: (GeoViz &
CrimeViz) Situational
Surveillance & In-field
Criminal Investigative
Analytics
Co-
Principal
Investigato
r
Rutgers
University
Complete
114 Fred Roberts froberts@d
imacs.rutg
ers.edu
Situation Surveillance &
In-field Criminal
Investigative Analytics;
Public Safety Coalition
Projects
Co-
Principal
Investigato
r
Rutgers
University
Complete
100 Jonathan Roberts UKVAC II Collaborato
r-unpaid
Complete
8 Anthony Robinson arobinson
@psu.edu
Symbology
Standardization Support
Co-
Principal
Investigato
r
Pennsylvan
ia State
University
Complete
13 Dan Roth MDRP 18: COE-Explorer
(Visual Analytics for the
DHS Centers of
Excellence)
Co-
Principal
Investigato
r
University
of Illinois -
Urbana/Ch
ampaign
Complete
Dan Roth danr@uiuc.
edu
MDRP 18: Visual
Analytics for the DHS
Centers of Excellence
Co-
Principal
Investigato
r
University
of Illinois -
Urbana/Ch
ampaign
Complete
Robert Roth rer5286@p
su.edu
MDRP 3: (GeoViz &
CrimeViz) Situational
Surveillance & In-field
Criminal Investigative
Analytics
Investigato
r
Pennsylvan
ia State
University
Complete
8 Robert Roth Symbology
Standardization Support
Other Pennsylvan
ia State
University
Complete
Anand Sainath MDRP 1: (Jigsaw) Visual
Analytics for Investigative
Analysis on Text
Documents
Other Georgia
Institute of
Technolog
y
In Progress
Alexander Savelyev MDRP 13: GeoJunction:
Collaborative Visual-
Computational
Information Foraging and
Contextualization to
Support Situation
Awareness
Other Pennsylvan
ia State
University
Complete
Alexander Savelyey MDRP 3: (GeoViz &
CrimeViz) Situational
Surveillance & In-field
Criminal Investigative
Analytics
Other Pennsylvan
ia State
University
Complete

24 Chris Sechrest Chris.Sech
rest@duke-
energy.co
m
Multimedia, Social Media,
Text, and Emergency
Response Analytics
Co-
Principal
Investigato
r
Complete
58 Chao Shen A Data Integration
Framework for Enhancing
Emergency Response
Situation Reports with
Multi-Agency, Multi-
Partner Multimedia Data;
Public Safety Coalition
Projects
Graduate
Student-
Doctorate
Florida
Internation
al
University
Complete
Yi Shen MDRP 14: Multimedia
Visual Analytics for
Investigative Analysis
Other University
of North
Carolina at
Charlotte
Complete
24 Yi Shen Multimedia, Social Media,
Text, and Emergency
Response Analytics
Other University
of North
Carolina at
Charlotte
Complete
65 Ongard Sirisaengta
ksin
VACCINE Affinity
Research Groups
Co-
Principal
Investigato
r
University
of Houston-
Downtown
Complete
Kathy Smarick MDRP 17: START Center
Visual Analytics
Co-
Principal
Investigato
r
University
of
Maryland
Withdrawn
8 Jennifer Smith Symbology
Standardization Support
Other Pennsylvan
ia State
University
Complete
John Stasko stasko@cc
.gatech.ed
u
(Jigsaw) Integrate
Automated Analytical
Reasoning into Jigsaw
Co-
Principal
Investigato
r
Georgia
Institute of
Technolog
y
Complete
John Stasko stasko@cc
.gatech.ed
u
(Jigsaw) Integrate
Automated Analytical
Reasoning into Jigsaw
Principal
Investigato
r
Georgia
Institute of
Technolog
y
Complete
77 John Stasko stasko@cc
.gatech.ed
u
Co-Located Collaborative
Analysis on Large, High-
Resolution Displays using
Multiple Input Devices;
Public Safety Coalition
Projects
Co-
Principal
Investigato
r
Georgia
Institute of
Technolog
y
Complete
John Stasko stasko@cc
.gatech.ed
u
EP 1: Leadership and
Coordination
Co-
Principal
Investigato
r
Georgia
Institute of
Technolog
y
Complete

John Stasko stasko@cc
.gatech.ed
u
EP 2: MSI Collaboration Co-
Principal
Investigato
r
Georgia
Institute of
Technolog
y
Complete
John Stasko stasko@cc
.gatech.ed
u
EP 5: Graduate Programs Co-
Principal
Investigato
r
Georgia
Institute of
Technolog
y
Complete
John Stasko stasko@cc
.gatech.ed
u
EP 7: Professional
Development
Co-
Principal
Investigato
r
Georgia
Institute of
Technolog
y
In Progress
John Stasko stasko@cc
.gatech.ed
u
EP 8: (VADL) Educational
Materials
Co-
Principal
Investigato
r
Georgia
Institute of
Technolog
y
Complete
13 John Stasko stasko@cc
.gatech.ed
u
MDRP 18: COE-Explorer
(Visual Analytics for the
DHS Centers of
Excellence)
Co-
Principal
Investigato
r
Georgia
Institute of
Technolog
y
Complete
John Stasko stasko@cc
.gatech.ed
u
MDRP 18: Visual
Analytics for the DHS
Centers of Excellence
Co-
Principal
Investigato
r
Georgia
Institute of
Technolog
y
Complete
John Stasko stasko@cc
.gatech.ed
u
MDRP 1: (Jigsaw) Visual
Analytics for Investigative
Analysis on Text
Documents
Co-
Principal
Investigato
r
Georgia
Institute of
Technolog
y
In Progress
John Stasko stasko@cc
.gatech.ed
u
MDRP 1: (Jigsaw) Visual
Analytics for Investigative
Analysis on Text
Documents
Principal
Investigato
r
Georgia
Institute of
Technolog
y
In Progress
28 John Stasko stasko@cc
.gatech.ed
u
MDRP 1: Geovisual
Analytics
Principal
Investigato
r
Georgia
Institute of
Technolog
y
Complete
111 John Stasko stasko@cc
.gatech.ed
u
MDRP 2: Integrate
Automated Analytical
Reasoning into Jigsaw
Principal
Investigato
r
Georgia
Institute of
Technolog
y
Complete
115 KR Subramani
an
krs@uncc.
edu
SP 15-Task 3: Event
Evacuation Planning;
Public Safety Coalition
Projects
Co-
Principal
Investigato
r
University
of North
Carolina at
Charlotte
Complete
114 KR Subramani
an
krs@uncc.
edu
Situation Surveillance &
In-field Criminal
Investigative Analytics;
Public Safety Coalition
Projects
Co-
Principal
Investigato
r
University
of North
Carolina at
Charlotte
Complete

15 Khalid Tahboub (Crowdsourcing)
Combining
Crowdsourcing
technology with machine
learning to do visual
analytics on big
qualitative data (video
datasets).
Other Purdue
University
Complete
25 Khalid Tahboub ktahboub
@purdue.e
du
Chicago LTE Project Co-
Principal
Investigato
r
Purdue
University
Complete
Justin Talbot MDRP 5: Cybersecurity
Visual Analytics
Graduate
Student-
Masters
Stanford
University
Complete
80 Antwone Temple Navajo Nation Graffiti
Project
Undergrad
uate
Student
Navajo
Technical
University
Withdrawn
24 Ted Thomas Ted.Thom
as@duke-
energy.co
m
Multimedia, Social Media,
Text, and Emergency
Response Analytics
Consultant Complete
12 William Tolone wjtolone@
uncc.edu
(VASA) – Visual Analytics
for Security Applications
Co-
Principal
Investigato
r
University
of North
Carolina-
Charlotte
Complete
78 William Tolone wjtolone@
uncc.edu
Critical Infrastructure in
Large Scale Emergencies
Co-
Principal
Investigato
r
University
of North
Carolina at
Charlotte
Complete
24 William Tolone wjtolone@
uncc.edu
Multimedia, Social Media,
Text, and Emergency
Response Analytics
Co-
Principal
Investigato
r
University
of North
Carolina at
Charlotte
Complete
120 William Tolone wjtolone@
uncc.edu
SP 14 Task 5: Visual
Analytics for Security
Applications - VASA
Co-
Principal
Investigato
r
University
of North
Carolina at
Charlotte
Complete
108 Melanie Tory mtory@cs.
uvic.ca
Personal Visual Analytics
Workshop
Principal
Investigato
r
University
of Victoria
Complete
23 Sherry Towers smtowers
@asu.edu
Social Media and
Healthcare Analytics for
Identification of Emerging
Health Threats
Co-
Principal
Investigato
r
Arizona
State
University
Complete
Mark Trebian mtrebian@
gmail.com
EP 2: MSI Collaboration Co-
Principal
Investigato
r
Navajo
Technical
University
Complete

80 Mark Trebian mtrebian@
gmail.com
Navajo Nation Graffiti
Project
Principal
Investigato
r
Navajo
Technical
University
Withdrawn
114 Praveen Tripathi Situation Surveillance &
In-field Criminal
Investigative Analytics;
Public Safety Coalition
Projects
Other University
of North
Carolina at
Charlotte
Complete
77 Katherine Vogt Co-Located Collaborative
Analysis on Large, High-
Resolution Displays using
Multiple Input Devices;
Public Safety Coalition
Projects
Undergrad
uate
Student
Complete
118 Bob Walker SP 14 Task 3: Technical
Integration into ExPOD at
JIBC
Co-
Principal
Investigato
r
Justice
Institute of
British
Columbia
Complete
19 Simon Walton simon.walt
x.ac.uk
Analyzing High-
dimensional Multivariate
Network Links with
Integrated Anomaly
Detection, Highlighting
and Exploration
Co-
Principal
Investigato
r
University
of Oxford
Complete
21 Simon Walton simon.walt
x.ac.uk
Analyzing High-
dimensional Multivariate
Network Links with
Integrated Anomaly
Detection, Highlighting
and Exploration
Co-
Principal
Investigato
r
In Progress
100 Simon Walton UKVAC II Graduate
Student-
Doctorate
Complete
103 Simon Walton simon.walt
x.ac.uk
Video Surveillance
Project
Co-
Principal
Investigato
r
Complete
129 Feng Wang fwang25@
asu.edu
Geographic Network
Analytics Correlations for
VALET
Investigato
r
Arizona
State
University
In Progress
27 Feng Wang WDYTYA: The
Uncertainty of Identity
Other Arizona
State
University
Complete
3 Guizhen Wang wang1908
@purdue.e
du
(VALET) Developing a
spatial statistics
framework in the visual
analytics for law
enforcement technology
suite
Graduate
Student-
Masters
Purdue
University
In Progress

18 Guizhen Wang wang1908
@purdue.e
du
COAST: Coastal
Operations and Analysis
Suite of Tools
Graduate
Student-
Doctorate
Purdue
University
Complete
12 Xiao Wang (VASA) – Visual Analytics
for Security Applications
Co-
Principal
Investigato
r
University
of North
Carolina at
Charlotte
Complete
Xiaoyu Wang MDRP 11: Financial
Fraud Visual Analytics
Graduate
Student-
Doctorate
University
of North
Carolina at
Charlotte
Complete
24 Xiaoyu Wang Multimedia, Social Media,
Text, and Emergency
Response Analytics
Co-
Principal
Investigato
r
University
of North
Carolina at
Charlotte
Complete
Daniel Weiskopf weiskopf@
visus.uni-
stuttgart.de
MDRP 16: (VALET)
Context-aware Mobile
Visual Analytics for
Emergency Response
Co-
Principal
Investigato
r
Complete
3 David Wiszowaty dwiszowa
@purdue.e
du
(VALET) Developing a
spatial statistics
framework in the visual
analytics for law
enforcement technology
suite
Graduate
Student-
Masters
Purdue
University
In Progress
17 David Wiszowaty dwiszowa
@purdue.e
du
SMART: Social Media
Analytics and Reporting
Toolkit
Graduate
Student-
Masters
Purdue
University
In Progress
100 B.L.
William
Wong UKVAC II Collaborato
r-unpaid
Complete
3 Hanye Xu xu193@pu
rdue.edu
(VALET) Developing a
spatial statistics
framework in the visual
analytics for law
enforcement technology
suite
Graduate
Student-
Masters
Purdue
University
In Progress
22 Hanye Xu xu193@pu
rdue.edu
Safety in View: A Public
Safety Visual Analytics
Tool Based on CCTV
Camera Angles of View
Graduate
Student-
Masters
Purdue
University
Complete
Chunlei Yang MDRP 14: Multimedia
Visual Analytics for
Investigative Analysis
Other University
of North
Carolina at
Charlotte
Complete
Jing Yang jyang13@u
ncc.edu
MDRP 14: Multimedia
Visual Analytics for
Investigative Analysis
Co-
Principal
Investigato
r
University
of North
Carolina at
Charlotte
Complete
79 Jing Yang Jing.Yang
@uncc.edu
Multimedia Analytics for
Open Source Media
Co-
Principal
Investigato
r
University
of North
Carolina at
Charlotte
Complete

3 Calvin Yau yauc@purd
ue.edu
(VALET) Developing a
spatial statistics
framework in the visual
analytics for law
enforcement technology
suite
Graduate
Student-
Masters
Purdue
University
In Progress
20 Calvin Yau yauc@purd
ue.edu
Officer Performance
Visualization System
Graduate
Student-
Doctorate
Purdue
University
In Progress
84 Ji Soo Yi SEED 1: Investigation of
the Impacts of
Visualization Literacy on
the Performance of Visual
Analysis; International
Collaborations
Co-
Principal
Investigato
r
Purdue
University
Complete
17 Jiawei Zhang zhan1486
@purdue.e
du
SMART: Social Media
Analytics and Reporting
Toolkit
Graduate
Student-
Doctorate
Purdue
University
In Progress
Xiao Zhang MDRP 3: (GeoViz &
CrimeViz) Situational
Surveillance & In-field
Criminal Investigative
Analytics
Other Pennsylvan
ia State
University
Complete
129 Yifan Zhang Yifan.Zhan
Geographic Network
Analytics Correlations for
VALET
Graduate
Student-
Doctorate
Arizona
State
University
In Progress
27 Yifan Zhang WDYTYA: The
Uncertainty of Identity
Other Arizona
State
University
Complete
10 Bin Zhao (GARI) Gang Graffiti
Recognition and Analysis
Graduate
Student-
Doctorate
Purdue
University
In Progress
11 Bin Zhao (MERGE) Mobile
Emergency Response
Guide
Other Purdue
University
Complete
12 Jieqiong Zhao jieqiongzha
o@purdue.
edu
(VASA) – Visual Analytics
for Security Applications
Graduate
Student-
Doctorate
Purdue
University
Complete
4 Li Zheng (MADIS) A Data
Integration Framework for
Enhancing Emergency
Response Situation
Reports with Multi-
Agency, Multi-Partner
Multimedia Data
Graduate
Student-
Doctorate
Florida
Internation
al
University
Complete

58 Li Zheng A Data Integration
Framework for Enhancing
Emergency Response
Situation Reports with
Multi-Agency, Multi-
Partner Multimedia Data;
Public Safety Coalition
Projects
Graduate
Student-
Doctorate
Florida
Internation
al
University
Complete
7 Chong Zhou (GeoTxt) E2E: GeoTxt
API
Other Pennsylvan
ia State
University
In Progress
4 Wubai Zhou (MADIS) A Data
Integration Framework for
Enhancing Emergency
Response Situation
Reports with Multi-
Agency, Multi-Partner
Multimedia Data
Graduate
Student-
Masters
Florida
Internation
al
University
Complete
34 david ebert Cyber Education Co-
Principal
Investigato
r
Purdue
University
Complete

Citation Journal Date Project Journal Status Center of Excellence1. Ka Ki Ng and E. J. Delp, “New Models For Real-Time Tracking Using Particle Filtering,” Proceedings of the SPIE/IS&T Conference on Visual Communications and Image Processing(VCIP), San Jose, CA, January 2009. 2. K. K. Ng and E. J. Delp, “Object Tracking Initialization Using Automatic Moving Object Detection,” Proceedings of the SPIE/IS&T Conference on Visual Communications and Image Processing (VCIP), January 2010, San Jose, CA. 3. Z. Li, J. Fan, “Stochastic contour approach for automatic image segmentation”, Journal of Electronic Imaging, vol.18, no.4, 2009. 4. Luo, Qingshan, Xiaodong Kong, Guihua Zeng, Jianping Fan: Human action detection via boosted local motion histograms. Mach. Vis. Appl. 21(3): 377-389 (2010).
Benson, A.L., Biggers, K., Wall, J., and Haselkorn, M.P. (2010) “Adaptive Development of a Common Operating Environment for Crisis Response Management.” In Proceedings of the 2010 International Conference on Information Systems for Crisis Response and Management (ISCRAM2010) [Fully-refereed, blind, 45% acceptance].
5/2010 MDRP 7: Introducing Sustainable Visual Analytics into Command Center Environments
Published Center for Visual Analytics for Command, Control, and Interoperability Environments
Chen, J., MacEachren, A.M. and Peuquet, D. 2009: Constructing overview + detail dendrogram-matrix views. IEEE Transactions on Visualization and Computer Graphics 15, 889-896. {joint research with MDRP 3}
11/2009 MDRP 12: Foreign Animal and Zoonotic Disease Visual Analytics
Published Center for Visual Analytics for Command, Control, and Interoperability Environments
Bezerianos, A., Chevalier, F., Dragicevic, P., Elmqvist, N., Fekete, J.-D. GraphDice: A System for Exploring Multivariate Social Networks. Computer Graphics Forum (IEEE EuroVis 2010 proceedings), to appear, 2010. http://engineering.purdue.edu/~elm/projects/graphdice/graphdice.pdf
7/2010 MDRP 17: START Center Visual Analytics
Published Center for Visual Analytics for Command, Control, and Interoperability Environments
Wenting Lu, Lei Li, Jingxuan Li, Tao Li, Honggang Zhang, and Jun Guo. “A Multimedia Information Fusion Framework for Web Image Categorization”, Multimedia Tools and Applications, in press, 2012.
7/2012 (MADIS) A Data Integration Framework for Enhancing Emergency Response Situation Reports with Multi-Agency, Multi-Partner Multimedia Data
Published Center for Visual Analytics for Command, Control, and Interoperability Environments
A. M. M. Razip, A. Malik, S. Afzal, S. Joshi, R. Maciejewski, Y. Jang, N. Elmqvist, and D. S. Ebert. A Mobile Visual Analytics Approach for Situational Awareness and Risk Assessment. Proceedings of IEEE PacificVis,
3/2014 (VALET) Developing a spatial statistics framework in the visual analytics for law enforcement technology suite
Published Center for Visual Analytics for Command, Control, and Interoperability Environments
Abish Malik, Ross Maciejewski, Sean McCullough, Sherry Towers, David S. Ebert. Proactive Spatiotemporal Resource Allocation and Predictive Visual Analytics for Community Policing and Law Enforcement.
12/2014 (VALET) Developing a spatial statistics framework in the visual analytics for law enforcement technology suite
Published Center for Visual Analytics for Command, Control, and Interoperability Environments
Sungahnn Ko, Jieqiong Zhao, Jing Xia, Shehzad Afzal, Xiaoyu Wang, Greg Abram, Niklas Elmqvist,, Len Kne, David Van Riper, Kelly Gaither, Shaun Kennedy, William Tolone, William Ribarsky, David S. Ebert, "VASA: Interactive Computational Steering of Large Asynchronous Simulation Pipelines for Societal Infrastructure," IEEE Transactions on Visualization and Computer Graphics
12/2014 (VASA) – Visual Analytics for Security Applications
Published Center for Visual Analytics for Command, Control, and Interoperability Environments
Sungahnn Ko, Shehzad Afzal, Simon Walton, Yang Yang, Junghoon Chae, Abish Malik, Yun Jang, Min Chen and David Ebert, "Analyzing High-dimensional Multivariate Network Links with Integrated Anomaly Detection, Highlighting and Exploration," In Proceedings of IEEE Visual Analytics Science and Technology, p83-92
10/2014 Analyzing High-dimensional Multivariate Network Links with Integrated Anomaly Detection, Highlighting and Exploration
Published Center for Visual Analytics for Command, Control, and Interoperability Environments
Zhang, J., Afzal, S., Chae, J., Wang, G., Thom, D., Matei, S., Elmqvist, E., Ebert, D., “Visual Analytics of User influence based Dynamic Social Networks using Twitter Data”, IEEE Visual Analytics Science and Technology (VAST) Conference,
10/2015 SMART: Social Media Analytics and Reporting Toolkit
In Review Center for Visual Analytics for Command, Control, and Interoperability Environments
Chae, J., Cui, Y., Jang, Y., Wang, G., Malik, A., Ebert, D., “Trajectory-based Visual Analytics for Anomalous Human Movement Analysis using Social Media”
5/2015 SMART: Social Media Analytics and Reporting Toolkit
Published Center for Visual Analytics for Command, Control, and Interoperability Environments
Chae, J., Thom, D., Jang, Y., Kim, S., Ertl, T., Ebert, D., "Visual Analytics of Microblog Data for Public Behavior Response Analysis in Disaster Events", extended journal paper, Computers and Graphics,
6/2013 SMART: Social Media Analytics and Reporting Toolkit
Published Center for Visual Analytics for Command, Control, and Interoperability Environments
Chae, J., Thom, D., Jang, Y., Kim, S., Ertl, T., Ebert, D., "Visual Analytics of Microblog Data for Public Behavior Analysis in Disaster Events," Eurovis Workshop on Visual Analytics,
6/2013 SMART: Social Media Analytics and Reporting Toolkit
Published Center for Visual Analytics for Command, Control, and Interoperability Environments
Sungahnn Ko, Shehzad Afzal, Simon Walton, Yang Yang, Junghoon Chae, Abish Malik, Yun Jang, Min Chen and David Ebert, "Analyzing High-dimensional Multivariate Network Links with Integrated Anomaly Detection, Highlighting and Exploration," In Proceedings of IEEE Visual Analytics Science and Technology, p83-92
Published
Hanye Xu; Tay, J.; Malik, A.; Afzal, S.; Ebert, D.S., "Safety in view: A public safety visual analytics tool based on CCTV camera angles of view," in Technologies for Homeland Security (HST), 2015 IEEE International Symposium on, vol., no., pp.1-6, 14-16
4/2015 Safety in View: A Public Safety Visual Analytics Tool Based on CCTV Camera Angles of View
Published Center for Visual Analytics for Command, Control, and Interoperability Environments
Shehzad Afzal, Isaac Cho, Calvin Yau, Junghoon Chae, Sungahn Ko, Abish Malik, Kaethe Beck, William Ribarsky, and David Ebert. Anomaly Exploration and Visual Analytics of Financial Data. Submitted to IEEE VAST
8/2014 Multimedia, Social Media, Text, and Emergency Response Analytics
In Review Center for Visual Analytics for Command, Control, and Interoperability Environments
Todd Eaglin, Xiaoyu Wang, and William Ribarsky. Interactive Visual Analytics in Support of Image-Encoded LIDAR Analysis. Submitted to IEEE Symposium on Large Data Analysis and Visualization (LDAV
8/2015 Multimedia, Social Media, Text, and Emergency Response Analytics
In Review Center for Visual Analytics for Command, Control, and Interoperability Environments
Shehzad Afzal, Isaac Cho, et al. A Survey of Visual Analysis Approaches for Financial Data Exploration. Submitted to IEEE Transaction on Visualization and Computer Graphics.
8/2013 Multimedia, Social Media, Text, and Emergency Response Analytics
In Review Center for Visual Analytics for Command, Control, and Interoperability Environments
Sebastian Mittelstaedt, Xiaoyu Wang, Todd Eaglin, Dennis Thom, Daniel A. Keim, Thomas Ertl, William Tolone, and William Ribarsky. An Integrated In-Situ Approach to Impacts from Natural Disasters on Critical Infrastructures. Submitted to HICSS 2015.
1/2015 Multimedia, Social Media, Text, and Emergency Response Analytics
Published Center for Visual Analytics for Command, Control, and Interoperability Environments
Todd Eaglin, Xiaoyu Wang, William Ribarsky, and William Tolone. Ensemble Visual Analysis Architecture with High Mobility for Large-Scale Critical Infrastructure Simulations. IS&T/SPIE VDA 2015, Vol.9397-3, pp. 1-15.
2/2015 Multimedia, Social Media, Text, and Emergency Response Analytics
Published Center for Visual Analytics for Command, Control, and Interoperability Environments
Wenwen Dou, Li Yu, Thomas Kraft, William Ribarsky, and Xiaoyu Wang. DemographicVis: Analyzing Demographic Information based on User Generated Content. To be published. IEEE VAST 2015.
10/2015 Multimedia, Social Media, Text, and Emergency Response Analytics
Published Center for Visual Analytics for Command, Control, and Interoperability Environments
Sungahn Ko, Jieqiong Zhao, Jing Xia, Xiaoyu Wang, Greg Abram, Niklas Elmqvist, Shaun Kennedy, Kelly Gaither, William Tolone, William Ribarsky, and David S. Ebert. VASA: Interactive Computational Steering of Large Asynchronous Simulation Pipelines for Critical Infrastructure. IEEE Transactions on Visualization and Computer Graphics (IEEE VAST, November, 2014), 20(12), pp. 1853-1862.
11/2014 Multimedia, Social Media, Text, and Emergency Response Analytics
Published Center for Visual Analytics for Command, Control, and Interoperability Environments

J. Ribera, K. Tahboub and E. J. Delp, “Automated crowd flow estimation enhanced by crowdsourcing,” Proceedings of the IEEE National Aerospace and Electronics Conference (NAECON), June 2014, Dayton, OH.
6/2014 (GARI) Gang Graffiti Recognition and Analysis
Published Center for Visual Analytics for Command, Control, and Interoperability Environments
B. Delgado, K. Tahboub and E. J. Delp, “Automatic detection of abnormal human events of train platforms,” Proceedings of the IEEE National Aerospace and Electronics Conference (NAECON), June 2014, Dayton, OH.
6/2014 (GARI) Gang Graffiti Recognition and Analysis
Published Center for Visual Analytics for Command, Control, and Interoperability Environments
B. Zhao and E. J. Delp, “Visual Saliency Models Based on Spectrum Processing,” Proceedings of the IEEE Winter Conference on Applications of Computer Vision, January 2015, Hawaii, pp. 976-981.
1/2015 (GARI) Gang Graffiti Recognition and Analysis
Published Center for Visual Analytics for Command, Control, and Interoperability Environments
K. Tahboub, N. Gadgil, J. Ribera, B. Delgado, and E. J. Delp, "An Intelligent Crowdsourcing System for Forensic Analysis of Surveillance Video," Proceedings of the IS&T/SPIE Conference on Video Surveillance and Transportation Imaging Applications, vol. 9407, San Francisco, February 2015.
2/2015 (GARI) Gang Graffiti Recognition and Analysis
Published Center for Visual Analytics for Command, Control, and Interoperability Environments
J. Kim, A. Parra, H. Li, E. J. Delp, "Efficient Graph-Cut Tattoo Segmentation," Proceedings of the IS&T/SPIE Conference on Visual Information Processing and Communication, vol. 9410, San Francisco, February 2015.
2/2015 (GARI) Gang Graffiti Recognition and Analysis
Published Center for Visual Analytics for Command, Control, and Interoperability Environments
J. Ribera, K. Tahboub, and E. J. Delp, "Characterizing The Uncertainty of Classification Methods and Its Impact on the Performance of Crowdsourcing," Proceedings of the IS&T/SPIE Conference on Imaging and Multimedia Analytics in a Web and Mobile World, vol. 9408, San Francisco, February 2015.
2/2015 (GARI) Gang Graffiti Recognition and Analysis
Published Center for Visual Analytics for Command, Control, and Interoperability Environments
Feng Wang, Shehzad Afzal, Paulo Shakarian, David S. Ebert, Ross Maciejewski. A Variable Edge Bandwidth for Kernel Density Estimation in Geographic Network Space, ACM SIGSPATIAL, 2015.
11/2015 WDYTYA: The Uncertainty of Identity
In Review Center for Visual Analytics for Command, Control, and Interoperability Environments
Abish Malik, Ross Maciejewski, Sean McCullough, Sherry Towers, David S. Ebert. Proactive Spatiotemporal Resource Allocation and Predictive Visual Analytics for Community Policing and Law Enforcement. IEEE Transactions on Visualization and Computer Graphics, 20(12): 1863-1872, 2014
12/2014 WDYTYA: The Uncertainty of Identity
Published Center for Visual Analytics for Command, Control, and Interoperability Environments
Yafeng Lu, Feng Wang, Ross Maciejewski. Business Intelligence from Social Media: A Study from the VAST Box Office Challenge. IEEE Computer Graphics and Applications, 34(5): 58-70, 2014
9/2014 WDYTYA: The Uncertainty of Identity
Published Center for Visual Analytics for Command, Control, and Interoperability Environments
Yafeng Lu, Robert Kruger, Dennis Thom, Feng Wang, Steffen Koch, Thomas Ertl, Ross Maciejewski. Integrating Predictive Analytics and Social Media. Proceedings of the IEEE Conference on Visual Analytics Science and Technology, 2014
10/2014 WDYTYA: The Uncertainty of Identity
Published Center for Visual Analytics for Command, Control, and Interoperability Environments
Carsten Görg, Zhicheng Liu, and John Stasko, "Reflections on the Evolution of the Jigsaw Visual Analytics System", Information Visualization, Vol. 13, No. 4, Oct. 2014, pp. 336-345.
10/2014 MDRP 1: (Jigsaw) Visual Analytics for Investigative Analysis on Text Documents
Published Center for Visual Analytics for Command, Control, and Interoperability Environments
Jaegul Choo, Yi Han, Mengdie Hu, Hannah Kim, James Nugent, Francesco Poggi, Haesun Park, John Stasko, "Exploring Anomalies in GAStech", Proceedings of IEEE VAST '14 (VAST Challenge paper), Paris, France, Nov. 2014, pp. 347-348.
11/2014 MDRP 1: (Jigsaw) Visual Analytics for Investigative Analysis on Text Documents
Published Center for Visual Analytics for Command, Control, and Interoperability Environments
Alex Godwin, Anand Sainath, Sanjay Obla Jayakumar, Vivek Nabhi, Sagar Raut, John Stasko, "Exploring Spatio-Temporal Data as Personal Routes" (Poster), IEEE Information Visualization Conference, Paris, France, Nov. 2014
11/2014 MDRP 1: (Jigsaw) Visual Analytics for Investigative Analysis on Text Documents
Published Center for Visual Analytics for Command, Control, and Interoperability Environments
John Stasko, "Value-Driven Evaluation of Visualizations", Proceedings of BELIV 2014, Paris, France, November 2014, pp. 46-53.
11/2014 MDRP 1: (Jigsaw) Visual Analytics for Investigative Analysis on Text Documents
Published Center for Visual Analytics for Command, Control, and Interoperability Environments
(in progress; to be submitted by Sept. 1, 2015) Wallgrün, J.O., Karimzadeh, M., MacEachren, A.M., Pezanowski, S., Hardisty, F. GeoCorpora: Corpus and Corpus Building tools for the Evaluation and Training of Microblog/Twitter Geoparsers
9/2015 (GeoTxt) E2E: GeoTxt API In Review Center for Visual Analytics for Command, Control, and Interoperability Environments
Wallgrün, J.O., Karimzadeh, M., MacEachren, A.M., Hardisty, F., Pezanowski, S. and Ju, Y. 2014: Construction and First Analysis of a Corpus for the Evaluation and Training of Microblog/Twitter Geoparsers. In Purves, R. and Jones, C., editors, GIR'14: 8th ACM SIGSPATIAL Workshop on Geographic Information Retrieval, Dallas, TX: ACM.
11/2014 (GeoTxt) E2E: GeoTxt API Published Center for Visual Analytics for Command, Control, and Interoperability Environments
Blanford JI, Bernhardt J, Savelyev A, Wong-Parodi G, Carleton AM, Titley DW, MacEachren AM. (2014) Tweeting and Tornadoes. In: 11th International ISCRAM Conference. University Park, Pennsylvania
5/2014 (GeoTxt) E2E: GeoTxt API Published Center for Visual Analytics for Command, Control, and Interoperability Environments
Wang, F., Ibarra, J., Adnan, M., Longley, P., Maciejewski, R., “What’s In a Name? Data Linkage, Demography and Visual Analytics,” Eurovis Workshop on Visual Analytics, 2014.
6/2014 WDYTYA: The Uncertainty of Identity
Published Center for Visual Analytics for Command, Control, and Interoperability Environments
Razip, A. M. M., Malik, A., Afzal, S., Joshi, S., Maciejewski, R., Jang, Y., Elmqvist, N., Ebert, D. S., “A Mobile Visual Analytics Approach for Situational Awareness and Risk Assessment,” IEEE Pacific Visualization Symposium, 2014
3/2014 WDYTYA: The Uncertainty of Identity
Published Center for Visual Analytics for Command, Control, and Interoperability Environments
Malik, A., Maciejewski, R., Jang, Y., Oliveros, S., Yang, Y., Maule, B., White, M., Ebert, D. S., “A Visual Analytics Process for Maritime Response, Resource Allocation and Risk Assessment,” Information Visualization, 13(2): 93-110, 2014.
11/2014 WDYTYA: The Uncertainty of Identity
Published Center for Visual Analytics for Command, Control, and Interoperability Environments
Zhang, Y., Adnan, M., Longley, P., Maciejewski, R., “Exploring Geo-Genealogy Using Internet Surname Search Histories,” Journal of Maps, 9(4):481-485, 2013.
7/2013 WDYTYA: The Uncertainty of Identity
Published Center for Visual Analytics for Command, Control, and Interoperability Environments
Kim, S., Maciejewski, R., Malik, A., Jang, Y., Ebert, D. S., Isenberg, T., “Bristle Maps: A Multivariate Abstraction Technique for Geovisualization,” IEEE Transactions on Visualization and Computer Graphics, 19(9): 1438-1454, 2013.
8/2013 WDYTYA: The Uncertainty of Identity
Published Center for Visual Analytics for Command, Control, and Interoperability Environments
Lu, Y., Wang, F., Maciejewski, R., “VAST 2013 Mini-Challenge 1: Box Office VAST - Team VADER,” IEEE Conference on Visual Analytics Science and Technology, October, 2013.
10/2013 WDYTYA: The Uncertainty of Identity
Published Center for Visual Analytics for Command, Control, and Interoperability Environments
Lei Li, Wenting Lu, Jingxuan Li, Tao Li, Honggang Zhang and Jun Guo, “Exploring Interaction Between Images and Texts for Web Image Categorization,” In Proceedings of The 24th Florida Artificial Intelligence Research Society Conference (FLAIRS-24), 2011.
5/2011 A Data Integration Framework for Enhancing Emergency Response Situation Reports with Multi-Agency, Multi-Partner Multimedia Data; Public Safety Coalition Projects
Published Center for Visual Analytics for Command, Control, and Interoperability Environments
Yimin Yang, Hsin-Yu Ha, Fausto Fleites, Shu-Ching Chen, and Steven Luis, “Hierarchical Disaster Image Classification for Situation Report Enhancement,” accepted by The 12th IEEE International Conference on Information Reuse and Integration (IRI 2011), Las Vegas, Nevada, USA, August 3-5, 2011.
8/2011 A Data Integration Framework for Enhancing Emergency Response Situation Reports with Multi-Agency, Multi-Partner Multimedia Data; Public Safety Coalition Projects
Published Center for Visual Analytics for Command, Control, and Interoperability Environments
SungYe Kim, R. Maciejewski, A. Malik, Yun Jang, D. S. Ebert, T. Isenberg, "Bristle Maps: A Multivariate Abstraction Technique for Geovisualization", IEEE Transactions on Visualization & Computer Graphics, vol.19, no. 9, pp. 1438-1454, Sept. 2013, doi:10.1109/TVCG.2013.66
9/2013 Bristle Maps - A Multivariate Abstraction Technique for Geovisualization
Published Center for Visual Analytics for Command, Control, and Interoperability Environments
Mei-Ling Shyu, Chao Chen and Shu-Ching Chen, "Multi-Class Classification via Subspace Modeling," International Journal of Semantic Computing, Volume 5, Issue 1, pp. 55-78, March 2011.
3/2011 A Data Integration Framework for Enhancing Emergency Response Situation Reports with Multi-Agency, Multi-Partner Multimedia Data; Public Safety Coalition Projects
Published Center for Visual Analytics for Command, Control, and Interoperability Environments

Steven Luis, Fausto C. Fleites, Yimin Yang, Hsin-Yu Ha, and Shu-Ching Chen, "A Visual Analytics Multimedia Mobile System for Emergency Response," IEEE International Symposium on Multimedia (ISM2011), Dana Point, California USA, pp. 337-338, December 5-7, 2011. (Demo paper)
12/2011 A Data Integration Framework for Enhancing Emergency Response Situation Reports with Multi-Agency, Multi-Partner Multimedia Data; Public Safety Coalition Projects
Published Center for Visual Analytics for Command, Control, and Interoperability Environments
Qiusha Zhu, Lin Lin, Mei-Ling Shyu, and Shu-Ching Chen, "Effective Supervised Discretization for Classification based on Correlation Maximization," The 12th IEEE International Conference on Information Reuse and Integration (IRI 2011), Las Vegas, Nevada, USA, pp. 390-395, August 3-5, 2011.
8/2011 A Data Integration Framework for Enhancing Emergency Response Situation Reports with Multi-Agency, Multi-Partner Multimedia Data; Public Safety Coalition Projects
Published Center for Visual Analytics for Command, Control, and Interoperability Environments
Zhicheng Liu, Shamkant B. Navathe, John Stasko, "Network-based Visual Analysis of Tabular Data," Proceedings of IEEE VAST '11, Providence, RI, October 2011, pp. 41-50
10/2011 MDRP 1: (Jigsaw) Visual Analytics for Investigative Analysis on Text Documents
Published Center for Visual Analytics for Command, Control, and Interoperability Environments
Youn-ah Kang and John Stasko, "Characterizing the Intelligence Analysis Process: Informing Visual Analytics Design through a Longitudinal Field Study," Proceedings of IEEE VAST '11, Providence, RI, October 2011, pp. 21-30.
10/2011 MDRP 1: (Jigsaw) Visual Analytics for Investigative Analysis on Text Documents
Published Center for Visual Analytics for Command, Control, and Interoperability Environments
Elizabeth Braunstein, Carsten Görg, Zhicheng Liu, and John Stasko, "Jigsaw to Save Vastopolis - VAST 2011 Mini Challenge 3 Award: 'Good Use of the Analytic Process'", Proceedings of IEEE VAST '11, Providence, RI, Oct. 2011, pp. 323-324.
10/2011 MDRP 1: (Jigsaw) Visual Analytics for Investigative Analysis on Text Documents
Published Center for Visual Analytics for Command, Control, and Interoperability Environments
Pak Chung Wong, Chaomei Chen, Carsten Görg, Ben Shneiderman, John Stasko, Jim Thomas, "Graph Analytics - Lessons Learned and Challenges Ahead," IEEE Computer Graphics and Applications, Vol. 31, No. 5, Sept./Oct. 2011, pp. 18-29.
9/2011 MDRP 1: (Jigsaw) Visual Analytics for Investigative Analysis on Text Documents
Published Center for Visual Analytics for Command, Control, and Interoperability Environments
Youn-ah Kang, Carsten Görg, John Stasko, "How Can Visual Analytics Assist Investigative Analysis? Design Implications from an Evaluation," IEEE Transactions on Visualization and Computer Graphics, Vol. 17, No. 5, May 2011, pp. 570-583.
5/2011 MDRP 1: (Jigsaw) Visual Analytics for Investigative Analysis on Text Documents
Published Center for Visual Analytics for Command, Control, and Interoperability Environments
Ko, S., Jang, Y., Maciejewski, R., Ebert, D., "MarketAnalyzer: An Interactive Visual Analytics System for Analyzing Competitive Advantage Using Point of Sale Data," Computer Graphics Forum (Proceedings of IEEE/Eurographics EuroVis 2012, 2012.
6/2012 MarketAnalyzer: An Interactive Visual Analytics System for Analyzing Competitive Advantage Using Point of Sale Data
Published Center for Visual Analytics for Command, Control, and Interoperability Environments
C. Yang, J. Fan "Image Collection Summarization via Dictionary Learning", IEEE Conf. on Computer Vision and Pattern Recognition (CVPR'12), 2012
6/2012 Multimedia, Social Media, Text, and Emergency Response Analytics
Published Center for Visual Analytics for Command, Control, and Interoperability Environments
N. Zhou, J. Fan, ``Discriminative dictionary learning for large-scale visual recognition, IEEE Conf. on Computer Vision and Pattern Recognition (CVPR'12), 2012
6/2012 Multimedia, Social Media, Text, and Emergency Response Analytics
Published Center for Visual Analytics for Command, Control, and Interoperability Environments
C. Yang, P.Wong, W. Ribarsky, J. Fan "Efficient Graffiti Image Retrieval", ACM International Conference on Multimedia Retrieval (ICMR’12), 2012
6/2012 Multimedia, Social Media, Text, and Emergency Response Analytics
Published Center for Visual Analytics for Command, Control, and Interoperability Environments
J. Fan, N. Zhou, ``Quantitative semantic gap modeling for learning complexity estimation‖, IEEE Trans. on Multimedia, vol.18, no.9, 2012.
5/2012 Multimedia, Social Media, Text, and Emergency Response Analytics
Published Center for Visual Analytics for Command, Control, and Interoperability Environments
W. Zhang, X. Xue, J. Fan, ``Correlative multi-label multi-instance image annotation", IEEE ICCV (IEEE Intl Conf. on Computer Vision), Barcelona, 2011.
11/2011 Multimedia, Social Media, Text, and Emergency Response Analytics
Published Center for Visual Analytics for Command, Control, and Interoperability Environments
W. Zhang, X. Xue, J. Fan, ``Automatic image annotation with weakly labeled dataset", ACM Multimedia, Scottsdale, Arizona, USA, 2011.
11/2011 Multimedia, Social Media, Text, and Emergency Response Analytics
Published Center for Visual Analytics for Command, Control, and Interoperability Environments
C. Yang, J. Fan, ``Effective summarization of large-scale web images", ACM Multimedia, Scottsdale, Arizona, USA, 2011.
11/2011 Multimedia, Social Media, Text, and Emergency Response Analytics
Published Center for Visual Analytics for Command, Control, and Interoperability Environments
N. Zhou, Y. Shen, J. Peng, X. Feng, J. Fan, ``Leveraging auxiliary text terms for automatic image annotation", ACM WWW (Intl World Wide Web Conferences), Hyderabad, India, 2011.
3/2011 Multimedia, Social Media, Text, and Emergency Response Analytics
Published Center for Visual Analytics for Command, Control, and Interoperability Environments
Jamal Alsakran, Yang Chen, Dongning Luo, Ye Zhao, Jing Yang, Wenwen Dou, Shixia Liu: Real-Time Visualization of Streaming Text with a Force-Based Dynamic System. IEEE Computer Graphics and Applications 32(1): 34-45 (2012)
12/2011 Multimedia, Social Media, Text, and Emergency Response Analytics
Published Center for Visual Analytics for Command, Control, and Interoperability Environments
Dongning Luo, Jing Yang, Milos Krstajic, William Ribarsky, Daniel A. Keim: EventRiver: Visually Exploring Text Collections with Temporal References. IEEE Trans. Vis. Comput. Graph. 18(1): 93-105 (2012)
1/2012 Multimedia, Social Media, Text, and Emergency Response Analytics
Published Center for Visual Analytics for Command, Control, and Interoperability Environments
Jamal Alsakran, Ye Zhao, Xiaoke Huang, Alex Midget, and Jing Yang: Using Entropy in Enhancing Visualization of High Dimensional Categorical Data. Submitted to IEEE Conference on Information Visualization 2012
8/2011 Multimedia, Social Media, Text, and Emergency Response Analytics
Published Center for Visual Analytics for Command, Control, and Interoperability Environments
Chen Yang, Hao Wei, Shixia Liu, Jing Yang, and Kun Zhou: TextPioneer: Exploring Topical Lead-Lag Evolution across Corpora. Submitted to IEEE Conference on Information Visualization 2012
5/2014 Multimedia, Social Media, Text, and Emergency Response Analytics
Published Center for Visual Analytics for Command, Control, and Interoperability Environments
Jing Yang, Yujie Liu, Xin Zhang, Xiaoru Yuan, Ye Zhao, Scott Barlowe, and Shixia Liu: PIWI: Interactively Exploring Large Graphs Without Clutter.
1/2007 Multimedia, Social Media, Text, and Emergency Response Analytics
Published Center for Visual Analytics for Command, Control, and Interoperability Environments
Ning Zhou, Yi Shen, William Ribarsky, and Jianping Fan. Automatic Image-Text Alignment for Large-Scale Web Image Indexing and Retrieval. Submitted to IEEE Transactions on Pattern Analysis and Machine Intelligence.
1/2015 Multimedia, Social Media, Text, and Emergency Response Analytics
Published Center for Visual Analytics for Command, Control, and Interoperability Environments
Xiaoyu Wang, Zachary Wartell, Isaac Cho, and William Ribarsky. Towards Utilizing Heterogeneous Displays in Emergency Response. Submitted to IEEE VAST 2012.
3/2012 Multimedia, Social Media, Text, and Emergency Response Analytics
Published Center for Visual Analytics for Command, Control, and Interoperability Environments
Jack Guest, KR Subramanian, and William Ribarsky. Visual Analysis of Situationally Aware Building Evacuations. Submitted to IEEE VAST 2012.
2/2013 Multimedia, Social Media, Text, and Emergency Response Analytics
Published Center for Visual Analytics for Command, Control, and Interoperability Environments
Carsten Görg, Jaeyeon Kihm, Jaegul Choo, Zhicheng Liu, Sivasailam Muthiah, Haesun Park, John Stasko. “Integrating Computational Analysis with Interactive Visualization in Document-Focused Visual Analytics Systems.” Submitted to IEEE VAST 2010.
8/2010 MDRP 1: Geovisual Analytics Published Center for Visual Analytics for Command, Control, and Interoperability Environments
Jaiswal, A., D. J. Miller, et al. (2010). "Un-Interpreted Schema Matching with Embedded Value Mapping under Opaque Column Names and Data Values." IEEE Transactions on Knowledge and Data Engineering 22(2): 291-304. {cross MDRP – 1 & 13}
2/2010 MDRP 1: Geovisual Analytics Published Center for Visual Analytics for Command, Control, and Interoperability Environments
Chen, J., MacEachren, A.M. and Peuquet, D. 2009: Constructing overview + detail dendrogram-matrix views. IEEE Transactions on Visualization and Computer Graphics 15, 889-896. {joint work with MDRP 12}
9/2009 MDRP 3: (GeoViz & CrimeViz) Situational Surveillance & In-field Criminal Investigative Analytics
Published Center for Visual Analytics for Command, Control, and Interoperability Environments
Hardisty, F. and A. Robinson (Accepted). "The GeoViz Toolkit: Using component- oriented coordination methods to aid geovisualization application construction." International Journal of Geographic Information Science. {joint work with MDRP 12}
10/2010 MDRP 3: (GeoViz & CrimeViz) Situational Surveillance & In-field Criminal Investigative Analytics
Published Center for Visual Analytics for Command, Control, and Interoperability Environments
Klippel, A., F. Hardisty and C. Weaver (2009). "Colour Enhanced Star Plot Glyphs – Can Salient Shape Characteristics be Overcome?" Cartographica 44(3): 217-231.
9/2009 MDRP 3: (GeoViz & CrimeViz) Situational Surveillance & In-field Criminal Investigative Analytics
Published Center for Visual Analytics for Command, Control, and Interoperability Environments

Maciejewski, Ross, Rudolph, Stephen, Hafen, Ryan, Abusalah, Ahmad, Yakout, Mohamed, Ouzzani, Mourad, Cleveland, William S., Grannis, Shaun J., Ebert, David S. A Visual Analytics Approach to Understanding Spatiotemporal Hotspots. IEEE Transactions on Visualization and Computer Graphics, 16(2): 205-220, March/April 2010.
8/2009 MDRP 3: (GeoViz & CrimeViz) Situational Surveillance & In-field Criminal Investigative Analytics
Published Center for Visual Analytics for Command, Control, and Interoperability Environments
Roth RE, and Ross KS 2009 Extending the Google Maps API for Event Animation Mashups: Tutorial. Cartographic Perspectives, Special Digital Issue 32-40
9/2009 MDRP 3: (GeoViz & CrimeViz) Situational Surveillance & In-field Criminal Investigative Analytics
Published Center for Visual Analytics for Command, Control, and Interoperability Environments
Ka Ki Ng and E. J. Delp, “New Models For Real-Time Tracking Using Particle Filtering,” Proceedings of the SPIE/IS&T Conference on Visual Communications and Image Processing(VCIP), San Jose, CA, January 2009.
1/2009 MDRP 6: Video Surveillance Visual Analytics
Published Center for Visual Analytics for Command, Control, and Interoperability Environments
K. K. Ng and E. J. Delp, “Object Tracking Initialization Using Automatic Moving Object Detection,” Proceedings of the SPIE/IS&T Conference on Visual Communications and Image Processing (VCIP), January 2010, San Jose, CA.
1/2010 MDRP 6: Video Surveillance Visual Analytics
Published Center for Visual Analytics for Command, Control, and Interoperability Environments
Z. Li, J. Fan, “Stochastic contour approach for automatic image segmentation”, Journal of Electronic Imaging, vol.18, no.4, 2009.
9/2009 MDRP 6: Video Surveillance Visual Analytics
Center for Visual Analytics for Command, Control, and Interoperability Environments
Luo, Qingshan, Xiaodong Kong, Guihua Zeng, Jianping Fan: Human action detection via boosted local motion histogram Mach. Vis. Appl. 21(3): 377-389 (2010).
9/2008 MDRP 6: Video Surveillance Visual Analytics
Published Center for Visual Analytics for Command, Control, and Interoperability Environments
Javed, W., Elmqvist, N. Stack Zooming for Multi-Focus Interaction in Time-Series Data Visualization. In Proceedings of the IEEE Pacific Visualization Symposium 2010, pp. 33-40, 2010.
5/2010 MDRP 11: Financial Fraud Visual Analytics
Published Center for Visual Analytics for Command, Control, and Interoperability Environments
Chang, Remco, Caroline Ziemkiewicz, Roman Pyzh, Joseph Kielman, and William Ribarsky. Learning-based Evaluation of Visual Analytics Systems. ACM BELIV 2010.
5/2010 MDRP 11: Financial Fraud Visual Analytics
Published Center for Visual Analytics for Command, Control, and Interoperability Environments
Chen, Yang, Jing Yang, and William Ribarsky. Toward Effective Insight Management in Visual Analytics Systems. Proc. IEEE Pacific Graphics 2009, pp. 49-56.
4/2009 MDRP 11: Financial Fraud Visual Analytics
Published Center for Visual Analytics for Command, Control, and Interoperability Environments
Dou, Wenwen, William Ribarsky, and Remco Chang. Capturing Reasoning Processes through User Interaction. To be published. IEEE EuroVAST 2010.
5/2010 MDRP 11: Financial Fraud Visual Analytics
Published Center for Visual Analytics for Command, Control, and Interoperability Environments
Yimin Yang, Hsin-Yu Ha, Fausto C. Fleites, and Shu-Ching Chen, "A Multimedia Semantic Retrieval Mobile System Based on Hidden Coherent Feature Groups." accepted for publication, IEEE Multimedia.
1/2014 (MADIS) A Data Integration Framework for Enhancing Emergency Response Situation Reports with Multi-Agency, Multi-Partner Multimedia Data
Published Center for Visual Analytics for Command, Control, and Interoperability Environments
Hsin-Yu Ha, Yimin Yang, Fausto Fleites, and Shu-Ching Chen, "Correlation-Based Feature Analysis and Multi-Modality Fusion Framework for Multimedia Semantic Retrieval," accepted for publication, The 2013 IEEE International Conference on Multimedia and Expo (ICME 2013), "Multimedia for Humanity" Theme Track, San Jose, California, USA, July 15-19, 2013.
7/2013 (MADIS) A Data Integration Framework for Enhancing Emergency Response Situation Reports with Multi-Agency, Multi-Partner Multimedia Data
Published Center for Visual Analytics for Command, Control, and Interoperability Environments
Li Zheng, Chao Shen, Liang Tang, Chunqiu Zeng, Tao Li, Steve Luis, and Shu-Ching Chen, "Data Mining Meets the Needs of Disaster Information Management," conditionally accepted for publication, IEEE Transactions on Human-Machine Systems (THMS).
9/2013 (MADIS) A Data Integration Framework for Enhancing Emergency Response Situation Reports with Multi-Agency, Multi-Partner Multimedia Data
Published Center for Visual Analytics for Command, Control, and Interoperability Environments
Li Zheng, Chao Shen, Liang Tang, Chunqiu Zeng, Tao Li, Steve Luis, Shu-Ching Chen and Jainendra K. Navlakha.” Disaster SitRep - A Vertical Search Engine and Information Analysis Tool in Disaster Management Domain”.The 13th IEEE International Conference on Information Integration and Reuse (IRI 2012).
8/2012 (MADIS) A Data Integration Framework for Enhancing Emergency Response Situation Reports with Multi-Agency, Multi-Partner Multimedia Data
Published Center for Visual Analytics for Command, Control, and Interoperability Environments
Lei Li, and Tao Li. “An Empirical Study of Ontology-based Multi-document Summarization in Disaster Management”. IEEE Transactions SMC: Systems, in press, 2013.
2/2014 (MADIS) A Data Integration Framework for Enhancing Emergency Response Situation Reports with Multi-Agency, Multi-Partner Multimedia Data
Published Center for Visual Analytics for Command, Control, and Interoperability Environments
Wenting Lu, Jingxuan Li, Tao Li, Honggang Zhang, and Jun Guo. “Web Multimedia Object Classification using Cross-Domain Correlation Knowledge”, IEEE Transactions on Multimedia, 2013, in press.
11/2013 (MADIS) A Data Integration Framework for Enhancing Emergency Response Situation Reports with Multi-Agency, Multi-Partner Multimedia Data
Published Center for Visual Analytics for Command, Control, and Interoperability Environments
Auer, T., MacEachren, A.M., McCabe, C. and Pezanowski, S. submitted: HerbariaViz: A web-based client-server interface for mapping and exploring flora observation data. Ecological Informatics. {joint work with MDRP 12}
3/2010 MDRP 3: (GeoViz & CrimeViz) Situational Surveillance & In-field Criminal Investigative Analytics
Published Center for Visual Analytics for Command, Control, and Interoperability Environments
MacEachren, A.M. and Pezanowski, S. (2009). “Geovisualization: Leveraging the Opportunities of Geographic Information.” Adobe Developer Connection Education Developer Center: Articles from educators:
8/2010 MDRP 3: (GeoViz & CrimeViz) Situational Surveillance & In-field Criminal Investigative Analytics
Published Center for Visual Analytics for Command, Control, and Interoperability Environments
Hardisty, F. (2009). "GeoJabber: Enabling Geo-Collaborative Visual Analysis." Cartography and Geographic Information Science 36(2): 267-280. {joint work with MDRP 3}
3/2013 MDRP 13: GeoJunction: Collaborative Visual-Computational Information Foraging and Contextualization to Support Situation Awareness
Published Center for Visual Analytics for Command, Control, and Interoperability Environments
Cai, G. and B. Yu (2009). "Spatial Annotation Technology for Public Deliberation." Transactions in GIS 13: 123-146.
6/2009 MDRP 13: GeoJunction: Collaborative Visual-Computational Information Foraging and Contextualization to Support Situation Awareness
Published Center for Visual Analytics for Command, Control, and Interoperability Environments
Jaiswal, A., D. J. Miller, et al. (2010). "Un-Interpreted Schema Matching with Embedded Value Mapping under Opaque Column Names and Data Values." IEEE Transactions on Knowledge and Data Engineering 22(2): 291-304. {joint work with MDRP 1}
2/2010 MDRP 13: GeoJunction: Collaborative Visual-Computational Information Foraging and Contextualization to Support Situation Awareness
Published Center for Visual Analytics for Command, Control, and Interoperability Environments
Yu, C., A. M. MacEachren, B. Yarnal, and D. J. Peuquet. 2009. Integrating scientific modeling with a GeoAgent-based representation of human-environment interactions for supporting dynamic hazard management: a drought example in Pennsylvania, USA. Environmental Modelling & Software 27 (7):1501-1512. {joint work with NSF-funded Human-Environment Regional Observatory project}
7/2009 MDRP 13: GeoJunction: Collaborative Visual-Computational Information Foraging and Contextualization to Support Situation Awareness
Published Center for Visual Analytics for Command, Control, and Interoperability Environments
Y. Gao, J. Peng, H. Luo, D. Keim, J. Fan, ``An Interactive Approach for Filtering out Junk Images from Keyword-Based Google Search Results", IEEE Trans. on Circuits and Systems for Video Technology, vol. 19, no.10, 2009.
9/2009 MDRP 14: Multimedia Visual Analytics for Investigative Analysis
Published Center for Visual Analytics for Command, Control, and Interoperability Environments
D. Luo, J. Yang, M. Krstajic, J. Fan, W. Ribarsky, and D. Keim. EventRiver: Interactive visual exploration of constantly evolving text collections. To be published. IEEE Trans. On Visualization and Computer Graphics (2010).
10/2010 MDRP 14: Multimedia Visual Analytics for Investigative Analysis
Published Center for Visual Analytics for Command, Control, and Interoperability Environments

Yi, J. S., Elmqvist, N., Lee, S. TimeMatrix: Visualizing Temporal Social Networks Using Interactive Matrix-Based Visualizations. International Journal of Human-Computer Interaction, to appear, 2010. https://engineering.purdue.edu/~elm/projects/timematrix/timematrix.pdf
11/2010 MDRP 17: START Center Visual Analytics
Published Center for Visual Analytics for Command, Control, and Interoperability Environments
Jaiswal, A., D. J. Miller, et al. (2010). "Un-Interpreted Schema Matching with Embedded Value Mapping under Opaque Column Names and Data Values." IEEE Transactions on Knowledge and Data Engineering 22(2): 291-304. {cross MDRP – 1 & 13}
2/2010 MDRP 1: (Jigsaw) Visual Analytics for Investigative Analysis on Text Documents
Published Center for Visual Analytics for Command, Control, and Interoperability Environments
Tomaszewski, B., J. Blanford, K. Ross, S. Pezanowski and A. MacEachren (submitted). "Supporting Rapid Sensemaking in Diverse Web Document Foraging." Computers, Environment and Urban Systems
4/2012 MDRP 1: (Jigsaw) Visual Analytics for Investigative Analysis on Text Documents
Published Center for Visual Analytics for Command, Control, and Interoperability Environments
Carsten Görg, Jaeyeon Kihm, Jaegul Choo, Zhicheng Liu, Sivasailam Muthiah, Haesun Park, and John Stasko, "Combining Computational Analyses and Interactive Visualization to Enhance Information Retrieval”, 2010 Workshop on Human-Computer Interaction and Information Retrieval, New Brunswick, NJ
8/2010 MDRP 1: (Jigsaw) Visual Analytics for Investigative Analysis on Text Documents
Published Center for Visual Analytics for Command, Control, and Interoperability Environments
C. Görg, H. Tipney, K. Verspoor, W.A. Baumgartner Jr, K.B. Cohen, J. Stasko, L.E. Hunter, “Visualization and Language Processing for Supporting Analysis Across the Biomedical Literature”, Proceedings of International Conference on Knowledge-Based and Intelligent Information and Engineering Systems (KES), September 2010, pp 420-429.
9/2010 MDRP 1: (Jigsaw) Visual Analytics for Investigative Analysis on Text Documents
Published Center for Visual Analytics for Command, Control, and Interoperability Environments
Zhicheng Liu, Carsten Görg, Jaeyeon Kihm, Hanseung Lee, Jaegul Choo, Haesun Park, John Stasko, “Data Ingestion and Evidence Marshalling in Jigsaw VAST 2010 Mini Challenge 1 Award: Good Support for Data Ingest", Proceedings of IEEE VAST '10, Salt Lake City, UT, October 2010, pp. 271-272.
10/2010 MDRP 1: (Jigsaw) Visual Analytics for Investigative Analysis on Text Documents
Published Center for Visual Analytics for Command, Control, and Interoperability Environments
Hanseung Lee, Jaegul Choo, Carsten Görg, Jaeeun Shim, Jaeyeon Kihm, Zhicheng Liu, Haesun Park, John Stasko, "GeneTracer: Gene Sequence Analysis of Disease Mutations VAST 2010 Mini Challenge 3 Award: Excellent Process Explanation", Proceedings of IEEE VAST '10, Salt Lake City, UT, October 2010, pp. 291-292.
10/2010 MDRP 1: (Jigsaw) Visual Analytics for Investigative Analysis on Text Documents
Published Center for Visual Analytics for Command, Control, and Interoperability Environments
Zhicheng Liu and John T. Stasko, "Mental Models, Visual Reasoning and Interaction in Information Visualization: A Top-down Perspective", IEEE Transactions on Visualization and Computer Graphics, (Paper presented at InfoVis '10), Vol. 16, No. 6, November/December 2010, pp. 999-1008.
11/2010 MDRP 1: (Jigsaw) Visual Analytics for Investigative Analysis on Text Documents
Published Center for Visual Analytics for Command, Control, and Interoperability Environments
Andris, C. and Hardisty, F. (2011). Extended Abstract: Visualizing Migration Dynamics Using Weighted Radial Variation. GeoViz Hamburg. Hamburg, Germany, March 10-11, 2011.
3/2011 MDRP 3: (GeoViz & CrimeViz) Situational Surveillance & In-field Criminal Investigative Analytics
Published Center for Visual Analytics for Command, Control, and Interoperability Environments
Hardisty, F. and Klippel, A. 2010: Analyzing spatio-temporal autocorrelation with LISTA-Viz. International Journal of Geographical Information Science 24, 1515 - 1526.
10/2010 MDRP 3: (GeoViz & CrimeViz) Situational Surveillance & In-field Criminal Investigative Analytics
Published Center for Visual Analytics for Command, Control, and Interoperability Environments
MacEachren, A.M., Stryker, M.S., Turton, I.J. and Pezanowski, S. 2010: HEALTH GeoJunction: Visual-computationally Enabled Browsing of Health Publications and Their Contents. International Journal of Health Geographics 9.
5/2010 MDRP 3: (GeoViz & CrimeViz) Situational Surveillance & In-field Criminal Investigative Analytics
Published Center for Visual Analytics for Command, Control, and Interoperability Environments
Griffin, A.L. and Robinson, A.C. 2010: Comparing Color and Leader Line Approaches for Highlighting in Geovisualization. In Purves, R. and Weibel, R., editors, Extended Abstracts Volume, GIScience 2010, Zurich, Switzerland: GIScience, 14-17th September, 2010.
9/2010 MDRP 3: (GeoViz & CrimeViz) Situational Surveillance & In-field Criminal Investigative Analytics
Published Center for Visual Analytics for Command, Control, and Interoperability Environments
Robinson, A. 2010: Supporting Synthesis in Geovisualization. International Journal of Geographical Information Science.
10/2009 MDRP 3: (GeoViz & CrimeViz) Situational Surveillance & In-field Criminal Investigative Analytics
Published Center for Visual Analytics for Command, Control, and Interoperability Environments
Roth, R.E., Ross, K.S., Finch, B.G., Luo, W. and MacEachren, A.M. 2010: A user-centered approach for designing and developing spatiotemporal crime analysis tools In Purves, R. and Weibel, R., editors, Extended Abstracts Volume, GIScience 2010, Zurich, Switzerland: GIScience, 14-17th September, 2010.
9/2010 MDRP 3: (GeoViz & CrimeViz) Situational Surveillance & In-field Criminal Investigative Analytics
Published Center for Visual Analytics for Command, Control, and Interoperability Environments
Tomaszewski, B. and MacEachren, A.M. 2010: Geo-Historical Context Support for Information Foraging and Sensemaking: Conceptual Model, Implementation, and Assessment. IEEE Conference on Visual Analytics Science and Technology (IEEE VAST 2010), Salt Lake City, Utah, USA, 139-146, October 24 - 29, 2010.
10/2010 MDRP 3: (GeoViz & CrimeViz) Situational Surveillance & In-field Criminal Investigative Analytics
Published Center for Visual Analytics for Command, Control, and Interoperability Environments
Tomaszewski, B., J. Blanford, K. Ross, S. Pezanowski and A. MacEachren. 2011. "Supporting Rapid Sensemaking in Diverse Web Document Foraging." Computers, Environment and Urban Systems 35: 192-207.
4/2012 MDRP 3: (GeoViz & CrimeViz) Situational Surveillance & In-field Criminal Investigative Analytics
Published Center for Visual Analytics for Command, Control, and Interoperability Environments
Tomaszewski, B. 2011: Situation awareness and virtual globes: Applications for disaster management. Computers & Geosciences 37, 86-92.
1/2011 MDRP 3: (GeoViz & CrimeViz) Situational Surveillance & In-field Criminal Investigative Analytics
Published Center for Visual Analytics for Command, Control, and Interoperability Environments
White J.D.D. and R.E. Roth. 2010. TwitterHitter: Geovisual analytics for harvesting insight from volunteered geographic information. In: Proceedings of GIScience 2010. Zurich, Switzerland, 14-17th September, 2010.
9/2010 MDRP 3: (GeoViz & CrimeViz) Situational Surveillance & In-field Criminal Investigative Analytics
Published Center for Visual Analytics for Command, Control, and Interoperability Environments
MacEachren, A.M., Robinson, A.C., Jaiswal, A., Pezanowski, S., Savelyev, A., Blanford, J. and Mitra, P. in press: Geo-Twitter Analytics: Applications in Crisis Management. 25th International Cartographic Conference, Paris, France, July 3-8, 2011.
7/2011 MDRP 3: (GeoViz & CrimeViz) Situational Surveillance & In-field Criminal Investigative Analytics
Published Center for Visual Analytics for Command, Control, and Interoperability Environments
Caragea, C., McNeese, N., Jaiswal, A., Traylor, G., Kim, H.W., Mitra, P., Wu, D., Tapia, A.H., Giles, L. and Jansen, B.J. 2011: Classifying Text Messages for the Haiti Earthquake. Proceedings of the 8th International Information Systems for Crisis Response and Management (ISCRAM) Conference, Lisbon, Portugal. K. Bajpai, A. Jaiswal, “A Framework for Analyzing Collective Action Events on Twitter”, 8th International Conference on Information Systems for Crisis Response and Management (ISCRAM), 2011
5/2011 MDRP 3: (GeoViz & CrimeViz) Situational Surveillance & In-field Criminal Investigative Analytics
Published Center for Visual Analytics for Command, Control, and Interoperability Environments
S. Ghani, N. Elmqvist. Improving Revisitation in Graphs through Static Spatial Features. In Proceedings of Graphics Interface, to appear, 2011. https://engineering.purdue.edu/~elm/projects/ssgf/ssgf.pdf
5/2011 MDRP 18: Visual Analytics for the DHS Centers of Excellence
Published Center for Visual Analytics for Command, Control, and Interoperability Environments
S. Ghani, N. Henry Riche, N. Elmqvist. Dynamic Insets for Context-Aware Graph Navigation.ComputerGraphics Forum (IEEE EuroVis 2011 proceedings), 30(3):861–870 2011. [54/190, 28% acc. rate] https://engineering.purdue.edu/~elm/projects/dyninsets/dyninsets.pdf
5/2011 MDRP 18: Visual Analytics for the DHS Centers of Excellence
Published Center for Visual Analytics for Command, Control, and Interoperability Environments
K. Kim, S. Ko, N. Elmqvist, D. Ebert. WordBridge: Using Composite Tag Clouds in Node-Link Diagrams for Visualizing Content and Relations in Text Corpora. In Proceedings of the Hawaii International Conference on System Sciences (Visual Analytics Minitrack), 2011. http://engineering.purdue.edu/~elm/projects/wordbridge/wordbridge.pdf
1/2011 MDRP 18: Visual Analytics for the DHS Centers of Excellence
Published Center for Visual Analytics for Command, Control, and Interoperability Environments
Kwon, B. C., Fisher, B., & Yi, J. S. (n.d.). Visual Analytic Roadblocks for Novice Investigators, VAST 2011. (conditionally accepted)
SEED 1: Investigation of the Impacts of Visualization Literacy on the Performance of Visual Analysis; International Collaborations
In Review Center for Visual Analytics for Command, Control, and Interoperability Environments
Simon Walton, Min Chen and David Ebert, LiveLayer - Live Traffic Projection onto Maps, Eurographics 2011 Posters, Llandudno, Wales, April 2011.
4/2011 Seed 3: Uncertainty in Video Visual Analytics
Published Center for Visual Analytics for Command, Control, and Interoperability Environments

Jianfei Liu, Kyle Lyons, Kalpathi Subramanian, William Ribarsky. Semi-Automated Processing and Routing Within Indoor Structures For Emergency Response Applications", Proceedings of SPIE Defense, Security+Sensing, 2010.
4/2010 Situation Surveillance & In-field Criminal Investigative Analytics; Public Safety Coalition Projects
Published Center for Visual Analytics for Command, Control, and Interoperability Environments
J. Yang, D. Luo, Y. Liu: Newdle: Interactive Visual Exploration of Large Online News Collections, IEEE Computer Graphics & Application 30(5): 32-41 (2010).
9/2010 MDRP 14: Multimedia Visual Analytics for Investigative Analysis
Published Center for Visual Analytics for Command, Control, and Interoperability Environments
H. Luo, J. Fan, Y. Zhou, “Multimedia news exploration and retrieval by integrating keywords, relations and visual features", Multimedia Tools and Applications, vol.51, pp. 625-648, 2011.
10/2010 MDRP 14: Multimedia Visual Analytics for Investigative Analysis
Published Center for Visual Analytics for Command, Control, and Interoperability Environments
J. Fan, W. Ribarsky, R. Jain, `Social computing for collaborative image understanding”, IEEE Multimedia, vol. 18, 2011 (invitation submission, to appear).
7/2011 MDRP 14: Multimedia Visual Analytics for Investigative Analysis
Published Center for Visual Analytics for Command, Control, and Interoperability Environments
Y. Guo, X. Lin, Z. Teng, X. Xue, J. Fan, ``A covariance matrix-free iterative algorithm to achieve distributed principal component analysis on vertically partitioned data”, Pattern Recognition, vol. 44, no. 11, 2011 (to appear).
9/2011 MDRP 14: Multimedia Visual Analytics for Investigative Analysis
Published Center for Visual Analytics for Command, Control, and Interoperability Environments
Y. Zhang, C. Yang, Y. Shen, N. Zhou, J. Fan, H. Luo, “A cross model approach to cleansing weakly tagged images”, IEEE Multimedia, vol.17, no.4, pp.18-25, 2010.
7/2010 MDRP 14: Multimedia Visual Analytics for Investigative Analysis
Published Center for Visual Analytics for Command, Control, and Interoperability Environments
Y. Shen, J. Fan, “Multi-task multi-label multiple instance learning", Journal of Zhejiang University SCIENCE C (Computers & Electronics), ISSN 1869-1951, ISSN 1869-196X, 2010 (invitation paper).
9/2010 MDRP 14: Multimedia Visual Analytics for Investigative Analysis
Published Center for Visual Analytics for Command, Control, and Interoperability Environments
J. Peng, N. Babaguchi, H. Luo, Y. Gao, J. Fan, “Constructing distributed hippocratic video databases for privacy-preserving online patient training and counseling”, IEEE Trans. On Information Technology in Biomedicine, vol.14, no.8, 2010.
7/2010 MDRP 14: Multimedia Visual Analytics for Investigative Analysis
Published Center for Visual Analytics for Command, Control, and Interoperability Environments
Z. Li, J. Fan, “Exploit camera metadata for enhancing interesting region detection and photo retrieval”, Multimedia Tools and Applications, vol. 46, no.2-3, pp.207-233, 2010.
8/2009 MDRP 14: Multimedia Visual Analytics for Investigative Analysis
Published Center for Visual Analytics for Command, Control, and Interoperability Environments
Q. Luo, X. Kong, G. Zeng, J. Fan, ``Human action detection via boosted local motion histograms”, Machine Vision Applications, vol.21, no.3, pp.377-389, 2010.
9/2008 MDRP 14: Multimedia Visual Analytics for Investigative Analysis
Published Center for Visual Analytics for Command, Control, and Interoperability Environments
W. Zhang, X. Xue, J. Fan, ``Correlative multi-label multi-instance image annotation", IEEE ICCV (IEEE Intl Conf. on Computer Vision), Barcelona, 2011.
11/2011 MDRP 14: Multimedia Visual Analytics for Investigative Analysis
Published Center for Visual Analytics for Command, Control, and Interoperability Environments
N. Zhou, Y. Shen, J. Peng, X. Feng, J. Fan, `Leveraging auxiliary text terms for automatic image annotation”, ACM WWW (Intl World Wide Web Conferences), Hyderabad, India, 2011.
3/2011 MDRP 14: Multimedia Visual Analytics for Investigative Analysis
Published Center for Visual Analytics for Command, Control, and Interoperability Environments
W. Zhang, X. Xue, J. Fan, ``Multi-kernel multi-label learning with max-margin concept network”, IJCAI (22th Intl. Joint Conf. on Artificial Intelligence), Barcelona, 2011.
7/2011 MDRP 14: Multimedia Visual Analytics for Investigative Analysis
Published Center for Visual Analytics for Command, Control, and Interoperability Environments
Y. Zhang, C. Jin, L. Cen, X. Xue, J. Fan, “Fusion of multiple features and supervised learning for Chinese OOV term detection and POS guessing", IJCAI (22th Intl. Joint Conf. on Artificial Intelligence), Barcelona, 2011.
7/2011 MDRP 14: Multimedia Visual Analytics for Investigative Analysis
Published Center for Visual Analytics for Command, Control, and Interoperability Environments
Y. Zhang, C. Jin, L. Cen, X. Xue, J. Fan, `Learning inter-related statistical query translation models for English-Chinese bi-directional CLIR", IJCAI (22th Intl. Joint Conf. on Artificial Intelligence), Barcelona, 2011.
7/2011 MDRP 14: Multimedia Visual Analytics for Investigative Analysis
Published Center for Visual Analytics for Command, Control, and Interoperability Environments
Y. Nakashima, N. Babaguchi, J. Fan, “Automatic generation of privacy-protected videos using background estimation", IEEE ICME (IEEE Intl. Conf. on Multimedia and Expo), Barcelona, 2011.
7/2011 MDRP 14: Multimedia Visual Analytics for Investigative Analysis
Published Center for Visual Analytics for Command, Control, and Interoperability Environments
C. Yang, X. Feng, J. Peng, J. Fan, “Efficient large-scale image data set exploration: Visual concept network and image summarization", MMM'11 (Intl. Conf. on Multimedia Modeling), pp. 111-121, 2011.
7/2011 MDRP 14: Multimedia Visual Analytics for Investigative Analysis
Published Center for Visual Analytics for Command, Control, and Interoperability Environments
N. Zhou, J. Peng, X. Feng, J. Fan, “Towards more precise social image-tag alignment”, MMM’11, (Intl. Conf. on Multimedia Modeling), pp. 46-56, 2011.
7/2011 MDRP 14: Multimedia Visual Analytics for Investigative Analysis
Published Center for Visual Analytics for Command, Control, and Interoperability Environments
Y. Shen, J. Fan, “Leveraging loosely-tagged images and inter-object correlations for tag recommendation”, ACM Multimedia, 2010.
10/2009 MDRP 14: Multimedia Visual Analytics for Investigative Analysis
Published Center for Visual Analytics for Command, Control, and Interoperability Environments
Y. Nakashima, N. Babaguchi, J. Fan, “Automatically protecting privacy in consumer generated videos using intended human object detector”, ACM Multimedia, 2010.
10/2010 MDRP 14: Multimedia Visual Analytics for Investigative Analysis
Published Center for Visual Analytics for Command, Control, and Interoperability Environments
J. Fan, Y. Shen, N. Zhu, Y. Gao, ``Leveraging large-scale weakly-tagged images from Internet”, IEEE CVPR (IEEE Conf. on Computer Vision and Pattern Recognition), 2010.
10/2009 MDRP 14: Multimedia Visual Analytics for Investigative Analysis
Published Center for Visual Analytics for Command, Control, and Interoperability Environments
X. Xue, H. Luo, J. Fan, “Structured learning for automatic image annotation", ACM CIVR’10 (ACM Conf. on Image and Video Retrieval), 2010.
7/2010 MDRP 14: Multimedia Visual Analytics for Investigative Analysis
Published Center for Visual Analytics for Command, Control, and Interoperability Environments
C. Yang, J. Fan, “Speed up duplicate/near-duplicate image detection", ICIMCS'10 (The Second International Conference on Internet Multimedia Computing and Service), 2010.
3/2013 MDRP 14: Multimedia Visual Analytics for Investigative Analysis
Published Center for Visual Analytics for Command, Control, and Interoperability Environments
Y. Shen, N. Zhou, J. Fan, “Integrating bilingual searches for junk image filtering”, ICIMCS’10 (The Second International Conference on Internet Multimedia Computing and Service), 2010.
3/2012 MDRP 14: Multimedia Visual Analytics for Investigative Analysis
Published Center for Visual Analytics for Command, Control, and Interoperability Environments
N. Zhou, Y. Shen, J. Fan, ``Automatic image annotation by using relevant keywords extracted from auxiliary text documents", ACM Multimedia Workshop on Large-Scale Image Retrieval, 2010.
10/2010 MDRP 14: Multimedia Visual Analytics for Investigative Analysis
Published Center for Visual Analytics for Command, Control, and Interoperability Environments
J. Alsakran, Y. Chen, Y. Zhao, J. Yang, and D. Luo: STREAMIT: dynamic visualization and interactive exploration of text streams. Proc. IEEE Pacific Visualization Symposium 2011, pages 131-138
3/2011 MDRP 14: Multimedia Visual Analytics for Investigative Analysis
Published Center for Visual Analytics for Command, Control, and Interoperability Environments
J. Alsakran, Y. Zhao, D. Luo, and J. Yang: Visual Analysis of Stream Texts with Keyword Significance. Poster of InfoVis 2010.
10/2010 MDRP 14: Multimedia Visual Analytics for Investigative Analysis
Published Center for Visual Analytics for Command, Control, and Interoperability Environments
Y. Chen, J. Alsakran, S. Barlowe, J. Yang, and Y. Zhao: Supporting Effective Common Ground Construction in Asynchronous Collaborative Visual Analytics. Proc IEEE Conference on Visual Analytics Science and Technology 2011, conditionally accepted.
10/2011 MDRP 14: Multimedia Visual Analytics for Investigative Analysis
Published Center for Visual Analytics for Command, Control, and Interoperability Environments
Vogt, K., Bradel, L., Andrews, C., North, C., Endert, A., Hutchings, D. “Co-located Collaborative Sensemaking on a Large High-Resolution Display with Multiple Input Devices.” Conference on Human-Computer Interaction (INTERACT '11). Lisbon, Portugal, September 2011, 17 pages.
9/2011 Co-Located Collaborative Analysis on Large, High-Resolution Displays using Multiple Input Devices; Public Safety Coalition Projects
Published Center for Visual Analytics for Command, Control, and Interoperability Environments
Satyam Srivastava, Ka Ki Ng, and Edward J. Delp, “Crowd Flow Estimation Using Multiple Visual Features for Scenes with Changing Crowd Densities,” Proceedings of the IEEE International Conference on Advanced Video and Signal Based Surveillance, Klagenfurt, Austria, August-September 2011
8/2011 MDRP 6: Video Surveillance Visual Analytics
Published Center for Visual Analytics for Command, Control, and Interoperability Environments
Satyam Srivastava, Ka Ki Ng, and Edward J. Delp, “Co-Ordinate Mapping and Analysis of Vehicle Trajectory for Anomaly Detection,” Proceedings of the IEEE International Conference on Multimedia and Expo, Barcelona,Spain, July 2011
7/2011 MDRP 6: Video Surveillance Visual Analytics
Published Center for Visual Analytics for Command, Control, and Interoperability Environments

Satyam Srivastava, Ka Ki Ng, and Edward J. Delp, “Color Correction for Object Tracking Across Multiple Cameras,” Proceedings of the IEEE International Conference on Acoustics, Speech and Signal Processing, Prague, Czech Republic, May 2011
5/2011 MDRP 6: Video Surveillance Visual Analytics
Published Center for Visual Analytics for Command, Control, and Interoperability Environments
Ka Ki Ng and Edward J. Delp, “Background Subtraction Using A Pixel-Wise Adaptive Learning Rate For Object Tracking Initialization,” Proceedings of the IS&T/SPIE Conference on Visual Information Processing and Communication, San Francisco, California, January 2011
1/2011 MDRP 6: Video Surveillance Visual Analytics
Published Center for Visual Analytics for Command, Control, and Interoperability Environments
Satyam Srivastava and Edward J. Delp, “Standoff Video Analysis for the Detection of Security Anomalies in Vehicles,” Proceedings of the IEEE Applied Imagery Pattern Recognition Workshop, Washington, D.C., October 2010
10/2011 MDRP 6: Video Surveillance Visual Analytics
Published Center for Visual Analytics for Command, Control, and Interoperability Environments
Abish Malik, Ross Maciejewski, Timothy F. Collins and David S. Ebert, “Visual Analytics Law Enforcement Toolkit,” IEEE International Conference on Technologies for Homeland Security, 2010.
11/2010 Visual Analytics Law Enforcement Technology; Public Safety Coalition Projects
Published Center for Visual Analytics for Command, Control, and Interoperability Environments
Malik, A., Maciejewski, R., Maule, B., Ebert, D., “A Visual Analytics Process for Maritime Resource Allocation and Risk Assessment,” conditionally accepted pending minor revisions, Proceedings of the IEEE Conference on Visual Analytics Science and Technology (VAST), 2011.
12/2010 (CgSARVA) Coast Guard Search and Rescue Visual Analytics
Published Center for Visual Analytics for Command, Control, and Interoperability Environments
Afzal, S., Maciejewski, R., Ebert, D., “Visual Analytics Decision Support Environment for Epidemic Modeling and Response Evaluation,” conditionally accepted pending minor revision to Proceedings of the IEEE Conference on Visual Analytics Science and Technology (VAST), 2011.
10/2011 Published
MacEachren AM, Robinson AC, Jaiswal A, Pezanowski S, Savelyev A, Blanford J, Mitra P. Geo-Twitter Analytics: Applications in Crisis Management. Proceedings, 25th International Cartographic Conference. Paris, France; 2011
7/2011 MDRP 13: GeoJunction: Collaborative Visual-Computational Information Foraging and Contextualization to Support Situation Awareness
Published Center for Visual Analytics for Command, Control, and Interoperability Environments
MacEachren AM, Jaiswal A, Robinson AC, Pezanowski S, Savelyev A, Mitra P, Zhang X, Blanford J. SensePlace2: GeoTwitter Analytics Support for Situational Awareness. IEEE Conference on Visual Analytics Science and Technology. 2011, 181-190.
10/2011 MDRP 13: GeoJunction: Collaborative Visual-Computational Information Foraging and Contextualization to Support Situation Awareness
Published Center for Visual Analytics for Command, Control, and Interoperability Environments
Tomaszewski, B., Blanford, J., Ross, K., Pezanowski, S. and MacEachren, A.M. 2011: Supporting geographically-aware web document foraging and sensemaking. Computers Environment and Urban Systems 35, 192-207.
5/2011 MDRP 13: GeoJunction: Collaborative Visual-Computational Information Foraging and Contextualization to Support Situation Awareness
Published Center for Visual Analytics for Command, Control, and Interoperability Environments
Malik, A., Maciejewski, R., Jang, Y., Oliveros, S., Yang, Y., Maule, B., White, M., Ebert, D. S., ―A Visual Analytics Process for Maritime Response, Resource Allocation and Risk Assessment,‖ Information Visualization
12/2010 (CgSARVA) Coast Guard Search and Rescue Visual Analytics
Published Center for Visual Analytics for Command, Control, and Interoperability Environments
Malik, A., Maciejewski, R., Yang, Y., Huang, W., Elmqvist, N., Ebert, D., ―A Correlative Analysis Process in a Visual Analytics Environment‖, IEEE Conference on Visual Analytics Science and Technology, October 2012
10/2012 Visual Analytics Law Enforcement Technology; Public Safety Coalition Projects
In Review Center for Visual Analytics for Command, Control, and Interoperability Environments
S. Ghani, N. Elmqvist, J. S. Yi. Perception of Animated Node-Link Diagrams for Dynamic Graphs. Computer Graphics Forum (IEEE EuroVis 2012 proceedings),
6/2012 MDRP 18: COE-Explorer (Visual Analytics for the DHS Centers of Excellence)
Published Center for Visual Analytics for Command, Control, and Interoperability Environments
S. Ghani, N. Elmqvist, D. S. Ebert. MultiNode-Explorer: A Visual Analytics Framework for Generating Web-based Multimodal Graph Visualizations. Workshop paper presented at the EuroVis Workshop on Visual Analytics (EuroVA 2012),
6/2012 MDRP 18: COE-Explorer (Visual Analytics for the DHS Centers of Excellence)
Published Center for Visual Analytics for Command, Control, and Interoperability Environments
Fisher,B., Green, T.M., Arias-Hernández, R. (2011) "Visual Analytics as a Translational Cognitive Science," Topics in Cognitive Science 3,3 609–625.
10/2010 MDRP 6: Video Surveillance Visual Analytics
Published Center for Visual Analytics for Command, Control, and Interoperability Environments
Kwon, B.C., Fisher, B. Yi, J.S. (2011) Visual Analytic Roadblocks for Novice Investigators. IEEE Conference on Visual Analytics Science and Technology. Providence RI, (Full paper, 8 pages)
10/2011 MDRP 6: Video Surveillance Visual Analytics
Published Center for Visual Analytics for Command, Control, and Interoperability Environments
Nobarany, S., Haraty, M., & Fisher, B. (2011) Facilitating the Reuse Process in Distributed Collaboration: A Distributed Cognition Approach. Proceedings of CSCW.
2/2012 MDRP 6: Video Surveillance Visual Analytics
Published Center for Visual Analytics for Command, Control, and Interoperability Environments
Arias-Hernandez, R, Kaastra, L.T., and Fisher, B. (2011) Joint Action Theory and Pair Analytics: In-vivo Studies of Cognition and Social Interaction in Collaborative Visual Analytics. In L. Carlson, C. Hoelscher, and T. Shipley (Eds.), Proceedings of the 33rd Annual Conference of the Cognitive Science Society (pp. 3244-3249). Austin TX: Cognitive Science Society.
7/2011 MDRP 6: Video Surveillance Visual Analytics
Published Center for Visual Analytics for Command, Control, and Interoperability Environments
Haraty, M., Nobarany, S., Fels, S.S. & Fisher, B. D. (2011) Leveraging trust relationships in digital backchannel communications. CHI EA '11: Proceedings of the 2011 annual conference extended abstracts on Human factors in computing systems.
5/2011 MDRP 6: Video Surveillance Visual Analytics
Published Center for Visual Analytics for Command, Control, and Interoperability Environments
Savikhin, A., Lam, H.C., Fisher, B., Ebert, D. (2011) Experimental Study of Financial Portfolio Selection with Visual Analytics for Decision Support (full paper). Proceedings of the 44th Annual Hawaii International Conference on System Sciences. IEEE Digital Library
1/2011 MDRP 6: Video Surveillance Visual Analytics
Published Center for Visual Analytics for Command, Control, and Interoperability Environments
Lindquist, E., Ebert, D., Fisher, B., & Jędrzejek, C, (2011) Visualization and Policy Development: Implications for Theory-Building (Visweek Panel) . IEEE Conference on Visual Analytics Science and Technology, Providence RI
10/2011 MDRP 6: Video Surveillance Visual Analytics
Published Center for Visual Analytics for Command, Control, and Interoperability Environments
Arias-Hernández, Green, T.M., Fisher, B. (2011) From cognitive amplifiers to cognitive prostheses: understandings of the material basis of cognition in visual analytics. Visualisation in the Age of Computerisation. Said Business School, Oxford University Oxford UK.
3/2012 MDRP 6: Video Surveillance Visual Analytics
Published Center for Visual Analytics for Command, Control, and Interoperability Environments
Arias-Hernández, R., Green, T.M., Fisher,B.(2011) Pair Analytics: Capturing Reasoning Processes in Collaborative Visual Analytics (full paper). Proceedings of the 44th Annual Hawaii International Conference on System Sciences. IEEE Digital Library
1/2011 MDRP 6: Video Surveillance Visual Analytics
Published Center for Visual Analytics for Command, Control, and Interoperability Environments
Ebert, D., Fisher, B, & Gaither, K. (2011) Symposium on Fundamentals and Applications of Visual Analytics. Proceedings of the 44th Annual Hawaii International Conference on System Sciences. IEEE Digital Library
1/2012 MDRP 6: Video Surveillance Visual Analytics
Published Center for Visual Analytics for Command, Control, and Interoperability Environments
Fisher, B. (2011) Visualisation Network-of-Experts 11th Workshop: Visual Analytics and Network Operations and Health. NATO Research and Technology Organization Research Study Group IST-85 (Keynote address)
1/2012 MDRP 6: Video Surveillance Visual Analytics
Published Center for Visual Analytics for Command, Control, and Interoperability Environments
Fisher, B. (2011) Visual Analytics as a Cognitive Science. EuroVA, Bergen Norway. (Keynote address
5/2011 MDRP 6: Video Surveillance Visual Analytics
Published Center for Visual Analytics for Command, Control, and Interoperability Environments
Singh A, Bradel L, Endert A, Kincaid R, Andrews C, North C. Supporting the cyber analytic process using visual history on large displays. In: Proceedings of the 8th International Symposium on Visualization for Cyber Security. Proceedings of the 8th International Symposium on Visualization for Cyber Security. New York, NY, USA; 2011. p. 3:1–3:8.
7/2011 Co-Located Collaborative Analysis on Large, High-Resolution Displays using Multiple Input Devices; Public Safety Coalition Projects
Published Center for Visual Analytics for Command, Control, and Interoperability Environments

Endert, A., Andrews, C., Bradel, L., Zeitz, J., North, C., “Designing Large High-Resolution Display Workspaces”, ACM Advanced Visual Interfaces (AVI), 2012.
5/2012 Co-Located Collaborative Analysis on Large, High-Resolution Displays using Multiple Input Devices; Public Safety Coalition Projects
Published Center for Visual Analytics for Command, Control, and Interoperability Environments
Walton, Rebecca W.; Mays, Robin E.; Haselkorn, Mark P. (2011) “Defining 'Fast': Factors Affecting the Experience of Speed in Humanitarian Logistics, “ In Proceedings of the 2011 International Conference on Information Systems for Crisis Response and Management (ISCRAM2011) [Fully-refereed, blind, 45% acceptance] Winner, ISCRAM Best Paper Award, May 2011.
5/2011 Enhancing Interactive Visual Analysis and Decision Making Environments
Published Center for Visual Analytics for Command, Control, and Interoperability Environments
Mays, Robin E.; Zachry, Mark; Garrison-Laney, Carolyn; Murat, Alper; Haselkorn, Mark P. (2011) “Aligning Border Security Workflow and Decision Making with Support Information and Communications Systems.” In Proceedings of the 2011 International Conference on Information Systems for Crisis Response and Management (ISCRAM2011) [Fully-refereed, blind, 45% acceptance].
5/2011 Enhancing Interactive Visual Analysis and Decision Making Environments
Published Center for Visual Analytics for Command, Control, and Interoperability Environments
Malik, A., Maciejewski, R., Maule, B., Ebert, D., "A Visual Analytics Process for Maritime Resource Allocation and Risk Assessment," IEEE Conference on Visual Analytics Science and Technology (VAST),2011.
10/2011 Coast Guard PROTECT Visualization
Published Center for Visual Analytics for Command, Control, and Interoperability Environments
Fan Yang, Xuan Li, Qianmu Li, and Tao Li. "Exploring the diversity in cluster ensemble generation: Random sampling and random projection." Expert Systems with Applications 41, no. 10 (2014): 4844-4866.
8/2014 A Data Integration Framework for Enhancing Emergency Response Situation Reports with Multi-Agency, Multi-Partner Multimedia Data; Public Safety Coalition Projects
Published Center for Visual Analytics for Command, Control, and Interoperability Environments
Jingxuan Li, Wei Peng, Tao Li, Tong Sun, Qianmu Li, and Jian Xu. "Social network user influence sense-making and dynamics prediction." Expert Systems with Applications 41, no. 11 (2014): 5115-5124.
3/2014 A Data Integration Framework for Enhancing Emergency Response Situation Reports with Multi-Agency, Multi-Partner Multimedia Data; Public Safety Coalition Projects
Published Center for Visual Analytics for Command, Control, and Interoperability Environments
Wubai Zhou, Chao Shen, Tao Li, Shu-Ching Chen, Ning Xie, and Jinpeng Wei "A Bipartite-Graph Based Approach for Disaster Susceptibility Comparisons among Cities," accepted for publication, The 15th IEEE International Conference on Inforamtion Reuse and Integration (IRI 2014), San Francisco, USA, August 13- 15, 2014.
8/2014 A Data Integration Framework for Enhancing Emergency Response Situation Reports with Multi-Agency, Multi-Partner Multimedia Data; Public Safety Coalition Projects
Published Center for Visual Analytics for Command, Control, and Interoperability Environments
Wubai Zhou, Chao Shen, Tao Li, Shu-Ching Chen, and Ning Xie. "Generating Textual Storyline to Improve Situation Awareness in Disaster Management," accepted for publication, The 15th IEEE International Conference on Inforamtion Reuse and Integration (IRI 2014), San Francisco, USA, August 13-15, 2014.
8/2014 A Data Integration Framework for Enhancing Emergency Response Situation Reports with Multi-Agency, Multi-Partner Multimedia Data; Public Safety Coalition Projects
Published Center for Visual Analytics for Command, Control, and Interoperability Environments
Hsin-Yu Ha, Fausto C. Fleites, Shu-Ching Chen, and Min Chen, "Correlation-based Re-ranking for Semantic Concept Detection," accepted for publication, The 15th IEEE International Conference on Inforamtion Reuse and Integration (IRI 2014), San Francisco, USA, August 13-15, 2014.
8/2014 A Data Integration Framework for Enhancing Emergency Response Situation Reports with Multi-Agency, Multi-Partner Multimedia Data; Public Safety Coalition Projects
Published Center for Visual Analytics for Command, Control, and Interoperability Environments
Hsin-Yu Ha, Fausto C. Fleites, and Shu-Ching Chen, "Building Multi-model Collaboration in Detecting Multimedia Semantic Concepts," 9th IEEE International Conference on Collaborative Computing: Networking, Applications and Worksharing, October 20-23, 2013, Austin, Texas, USA.
10/2013 A Data Integration Framework for Enhancing Emergency Response Situation Reports with Multi-Agency, Multi-Partner Multimedia Data; Public Safety Coalition Projects
Published Center for Visual Analytics for Command, Control, and Interoperability Environments
Hsin-Yu Ha, Fausto C. Fleites, and Shu-Ching Chen, "Content-Based Multimedia Retrieval Using Feature Correlation Clustering and Fusion," International Journal of Multimedia Data Engineering and Management (IJMDEM), Volume 4, No. 2, pp. 46-64, 2013.
4/2013 A Data Integration Framework for Enhancing Emergency Response Situation Reports with Multi-Agency, Multi-Partner Multimedia Data; Public Safety Coalition Projects
Published Center for Visual Analytics for Command, Control, and Interoperability Environments
Yerramilli, Sudha. "Potential Impact of Climate Changes on the Inundation Risk Levels in a Dam Break Scenario." ISPRS International Journal of Geo-Information 2.1 (2013): 110-134.
GIS Implementations Published Center for Visual Analytics for Command, Control, and Interoperability Environments
Dodla, Venkata B., and Sudha Yerramilli. "A Geographic Information System Model for Hurricane Track Prediction." American Journal of Geographic Information System 3.2 (2014): 75-87.
GIS Implementations Published Center for Visual Analytics for Command, Control, and Interoperability Environments
Yerramilli, Sudha., Fonesca, Duber Gomez "Assessing Geographical Inaccessibility to Health Care: Using GIS Network Based Methods." Public Health Research (Accepted, 2014)
GIS Implementations Published Center for Visual Analytics for Command, Control, and Interoperability Environments
Yerramilli, Sudha., Fonesca, Duber Gomez "Assessing Geographical Inaccessibility to Health Care: Using GIS Network Based Methods." Public Health Research (Accepted, 2014)
GIS Implementations Published Center for Visual Analytics for Command, Control, and Interoperability Environments
Invited Book Chapter: Yerramilli, Sudha. “GIS in monitoring of Hurricanes and Cyclones”, Encyclopedia of Natural Hazards”, Taylor and Francis Publication (Submitted and in review, 2014)
GIS Implementations Published Center for Visual Analytics for Command, Control, and Interoperability Environments
Prepared for MSDH : Geospatial Resource Guide for vulnerable and At-Risk populations and Presented at MSDH state level Risk population workgroup meeting (March 2014)
GIS Implementations Published Center for Visual Analytics for Command, Control, and Interoperability Environments
Prepared Report for Central Mississippi Area Health Education Center (CMAHEC) with Tugaloo College on “Statewide Spatial Analysis of Health Trends in MS” (Sep 2013)
9/2013 GIS Implementations Published Center for Visual Analytics for Command, Control, and Interoperability Environments
Karimzadeh, M., Huang, W., Banerjee, S., Wallgrün, J, Hardisty, F., Pezanowski, S., Mitra, P., and MacEachren, A.M. (2013) GeoTxt: A Web API to Leverage Place References in Text. ACM SIGSPATIAL International Conference on Advances in Geographic Information Systems, Orlando, FL, November 5-8, 2013.
11/2013 (GeoTxt) E2E: GeoTxt API Published Center for Visual Analytics for Command, Control, and Interoperability Environments
McClendon, S., and Robinson, A.C. (2013) Leveraging Geospatially-Oriented Social Media Communications in Disaster Response. International Journal of Information Systems for Crisis Response and Management. 5(1): 22-40.
4/2012 (GeoTxt) E2E: GeoTxt API Published Center for Visual Analytics for Command, Control, and Interoperability Environments
Robinson AC, Pezanowski S, Troedson S, Bianchetti RA, Blanford JI, Stevens J, Guidero E, Roth RE, MacEachren AM. (2013) SymbolStore.org: A Web-based Platform for Sharing Map Symbols. Cartography & Geographic Information Science, 40(5): 415-426. *published June 2013, but reported last year as In Press
6/2013 Symbology Map Transition Published Center for Visual Analytics for Command, Control, and Interoperability Environments
Robinson, A., Pezanowski, S., Stevens, J., Mullins, R., Blanford, J., Bianchetti, R. and MacEachren, A.M. 2013: Sharing and Discovering Map Symbols with SymbolStore.org. Proceedings of the International Cartographic Conference, Dresden, Germany, August 25-30, 2013.
8/2013 Symbology Map Transition Published Center for Visual Analytics for Command, Control, and Interoperability Environments

Stevens JE, Robinson AC, MacEachren AM. (2013) Designing Map Symbols for Mobile Devices: Challenges, Best Practices, and the Utilization of Skeuomorphism. In: Proceedings of the International Cartographic Conference. Proceedings of the International Cartographic Conference. Dresden, Germany.
8/2013 Symbology Map Transition Published Center for Visual Analytics for Command, Control, and Interoperability Environments
A. Parra, B. Zhao, J. Kim, Joonsoo, E. J. Delp, “Recognition, segmentation and retrieval of gang graffiti images on a mobile device,” Proceedings of the IEEE International Conference on Technologies for Homeland Security, pp. 178 – 183, November 2013, Waltham, MA.
11/2013 (GARI) Gang Graffiti Recognition and Analysis
Published Center for Visual Analytics for Command, Control, and Interoperability Environments
A. Parra Pozo, B. Zhao, A. Haddad, M. Boutin, E. Delp, “Hazardous Material Sign Detection And Recognition,” Proceedings of the IEEE International Conference on Image Processing, September 2013, Melbourne, Australia.
9/2013 (MERGE) Mobile Emergency Response Guide
Published Center for Visual Analytics for Command, Control, and Interoperability Environments
B. Zhao, A. Parra, E. Delp, “Mobile-Based Hazmat Sign Detection And Recognition,” Proceedings of the IEEE Global Conference on Signal and Information Processing, December 2013, Austin, TX.
12/2013 (MERGE) Mobile Emergency Response Guide
Published Center for Visual Analytics for Command, Control, and Interoperability Environments
Sungahnn Ko, Shehzad Afzal, Yang Yang, Junghoon Chae, Abish Malik, Yun Jang David Ebert, "Analyzing High- dimensional Multivariate Network Links with Integrated Anomaly Detection, Highlighting and Exploration", IEEE Conference on Visual Analytics Sciences and Technology, 2014
10/2014 (MERGE) Mobile Emergency Response Guide
Published Center for Visual Analytics for Command, Control, and Interoperability Environments
Todd Eaglin, William Tolone, William Ribarsky, and Xiaoyu Wang. Mobile Ensemble Visual Analysis Architecture for Large-Scale Critical Infrastructure Simulations. Submitted to IS&T/SPIE VDA 2015.
2/2015 Multimedia, Social Media, Text, and Emergency Response Analytics
Published Center for Visual Analytics for Command, Control, and Interoperability Environments
Dominik Jäckle, Florian Stoffel, Bum Chul Kwon, Xiaoyu Wang, Dominik Sacha, Todd Eaglin, Andreas Stoffel, William Ribarsky, and Daniel A. Keim. ClusterRim: Maintaining Context-Awareness via Aggregated Off-Screen Visualization. Submitted to the Information Visualization Journal.
8/2013 Multimedia, Social Media, Text, and Emergency Response Analytics
Published Center for Visual Analytics for Command, Control, and Interoperability Environments
Wenwen Dou, Li Yu, Xiaoyu Wang, Zhiqiang Ma, and William Ribarsky. Hierarchical Topics: Visually Exploring Large Text Collections Using Topic Hierarchies. IEEE Transactions on Visualization and Computer Graphics 19(12), pp. 2002-2011 (VAST 2013).
12/2013 Multimedia, Social Media, Text, and Emergency Response Analytics
Published Center for Visual Analytics for Command, Control, and Interoperability Environments
Jack Guest, Todd Eaglin, KR Subramanian, and William Ribarsky. Interactive Analysis and Visualization of Situationally Aware Building Evacuations. Information Visualization Journal. doi: 10.1177/1473871613516292.
1/2014 Multimedia, Social Media, Text, and Emergency Response Analytics
Published Center for Visual Analytics for Command, Control, and Interoperability Environments
William Tolone, Xiaoyu Wang, and William Ribarsky. Making Sense of the Operational Environment through Interactive, Exploratory Visual Analysis. NATO/OTAN Symposium on Visual Analytics. IST- 116/RSY-028.
3/2014 Multimedia, Social Media, Text, and Emergency Response Analytics
Published Center for Visual Analytics for Command, Control, and Interoperability Environments
William Ribarsky, Xiaoyu Wang, and Wenwen Dou. Social Media Analytics for Competitive Advantage Invited paper. Computers & Graphics 38C (2014), pp. 328-331 (Special Issue on EuroVA 2013)
10/2013 Multimedia, Social Media, Text, and Emergency Response Analytics
Published Center for Visual Analytics for Command, Control, and Interoperability Environments
William Ribarsky, Xiaoyu Wang, Wenwen Dou, and William Tolone. Towards a Visual Analytics Framework for Handling Complex Business Processes. HICSS 2014. pp. 1374 – 1383. DOI 10.1109/HICSS.2014.177.
1/2014 Multimedia, Social Media, Text, and Emergency Response Analytics
Published Center for Visual Analytics for Command, Control, and Interoperability Environments
Sungahn Ko, Shehzad Afzal, Simon Walton, Yang Yang, Junghoon Chae, Abish Malik, Yun Jang, Min Chen, David Ebert, “Analyzing High-dimensional Multivariate Network Links with Integrated Anomaly Detection, Highlighting and Exploration,”, to appear in Proc. IEEE VAST 2014, Paris, November 2014.
11/2014 UKVAC II Published Center for Visual Analytics for Command, Control, and Interoperability Environments
Youn-ah Kang and John Stasko, "Examining the Use of a Visual Analytics System for Sensemaking Tasks: Case Studies with Domain Experts", IEEE Transactions on Visualization and Computer Graphics, (Paper presented at VAST '12), Vol. 18, No. 12, December 2012, pp. 2869-2878.
12/2012 MDRP 1: (Jigsaw) Visual Analytics for Investigative Analysis on Text Documents
Published Center for Visual Analytics for Command, Control, and Interoperability Environments
Murdock, M.J., Maziekas, N.V. and Roth, R.E. 2012: The Basic Ordnance Observational Management System: Geovisual exploration and analysis of improvised explosive device incidents. Journal of Maps 8, 120-124.
8/2013 MDRP 3: (GeoViz & CrimeViz) Situational Surveillance & In-field Criminal Investigative Analytics
Published Center for Visual Analytics for Command, Control, and Interoperability Environments
Roth, R.E., Ross, K.S., Finch, B.G., Luo, W. and MacEachren, A.M. 2013: Spatiotemporal Crime Analysis in U.S. Law Enforcement Agencies: Current Practices and Unmet Needs. Government Information Quarterly 30, 226-240.
7/2013 MDRP 3: (GeoViz & CrimeViz) Situational Surveillance & In-field Criminal Investigative Analytics
Published Center for Visual Analytics for Command, Control, and Interoperability Environments
A. Parra, M. Boutin, and E. J. Delp, “Location-Aware Gang Graffiti Acquisition and Browsing on a Mobile Device”, Proceedings of the IS&T/SPIE Electronic Imaging on Multimedia on Mobile Devices, San Francisco, CA, January 2012
1/2012 (GARI) Gang Graffiti Recognition and Analysis
Published Center for Visual Analytics for Command, Control, and Interoperability Environments
A. W. Haddad, S. Huang, M. Boutin, E. J. Delp, “Detection of Symmetric Shapes on a Mobile Device with Applications to Automatic Sign Interpretation”, Proceedings of the IS&T/SPIE Electronic Imaging on Multimedia on Mobile Devices, San Francisco, CA, USA, January 2012
1/2012 (GARI) Gang Graffiti Recognition and Analysis
Published Center for Visual Analytics for Command, Control, and Interoperability Environments
Xiaoyu Wang, Dong Jeong, Remco Chang, Arun Pinto, and William Ribarsky. RiskVA: A Visual Analytics System for Consumer Credit Risk Analysis. Tsinghua Science and Technology: Special Issue on Visualization and Computer Graphics, Vol. 17(4), pp. 440-451 (2012).
10/2013 Multimedia, Social Media, Text, and Emergency Response Analytics
Published Center for Visual Analytics for Command, Control, and Interoperability Environments
Jack Guest, KR Subramanian, and William Ribarsky. Large Scale Situationally Aware Building Evacuation. To be published. Information Visualization Journal.
8/2013 Multimedia, Social Media, Text, and Emergency Response Analytics
In Review Center for Visual Analytics for Command, Control, and Interoperability Environments
Xiaoyu Wang, Zhiqiang Ma, Wenwen Dou, and William Ribarsky. Discover Diamonds-in-the-Rough using Interactive Visual Analytics System: Tweets as a Collective Diary of the Occupy Movement. Accepted for publication. .
7/2013 Multimedia, Social Media, Text, and Emergency Response Analytics
Published Center for Visual Analytics for Command, Control, and Interoperability Environments
Wenwen Dou, Xiaoyu Wang, Drew Skau, and William Ribarsky. LeadLine: Interactive Visual Analysis of Text Data through Event Identification and Exploration. Proceeding of IEEE VAST 2012, pp. 93-102.
10/2012 Multimedia, Social Media, Text, and Emergency Response Analytics
Published Center for Visual Analytics for Command, Control, and Interoperability Environments
Robinson, A.C., Roth, R.E., and A.M. MacEachren (in press) Understanding User Needs for Map Symbol Standards in Emergency Management. Journal of Homeland Security and Emergency Management 4.
7/2011 Symbology Standardization Support
Published Center for Visual Analytics for Command, Control, and Interoperability Environments
Stevens JE, Robinson AC, MacEachren AM. (In Press) Designing Map Symbols for Mobile Devices: Challenges, Best Practices, and the Utilization of Skeuomorphism. In: Proceedings of the International Cartographic Conference. Proceedings of the International Cartographic Conference. Dresden, Germany.
5/2013 Symbology Standardization Support
Published Center for Visual Analytics for Command, Control, and Interoperability Environments
Roth, R.E., Finch, B.G., Blanford, J.I., Klippel, A. Robinson, A.C. and MacEachren, A.M. (in press) Card sorting for cartographic research and practice. Cartography and Geographic Information Science 38(2).
3/2013 Symbology Standardization Support
Published Center for Visual Analytics for Command, Control, and Interoperability Environments
Robinson, A.C., Roth, R.E., Blanford, J., Pezanowski, S., and A.M. MacEachren. (2011) A Collaborative Process for Developing Map Symbol Standards. Spatial Thinking and Geographic Information Sciences. Tokyo, Japan, September 14-16, 2011.
9/2011 Symbology Standardization Support
Published Center for Visual Analytics for Command, Control, and Interoperability Environments

Designing a Web Service to Geo-Locate Subjects of Volunteered, Textual Geographic Information. (in press) Ryan Mullins, Frank Hardisty, Scott Pezanowski, Sujatha Das, Alexander Savelyev, Alan MacEachren, Prasenjit Mitra, Anuj Jaiswal, August 29th 2013, ICC, Dresden, Germany.
8/2013 MDRP 13: (SensePlace 2) Collaborative Visual-Computational Information Foraging and Contextualization to Support Situation Awareness
In Press Center for Visual Analytics for Command, Control, and Interoperability Environments
Robinson, A.C., Savelyev, A., Pezanowski, S. and MacEachren, A.M. 2013: Understanding the Utility of Geospatial Information in Social Media. In 2013, M., Comes, T., Fiedrich, F., Fortier, S., Geldermann, J. and Yang, L., editors, Proceedings of the 10th International ISCRAM Conference, Baden-Baden, Germany: ISCRAM.
5/2013 MDRP 13: (SensePlace 2) Collaborative Visual-Computational Information Foraging and Contextualization to Support Situation Awareness
Published Center for Visual Analytics for Command, Control, and Interoperability Environments
Tomaszewski, B. and MacEachren, A.M. 2012: Geovisual Analytics to Support Crisis Management: Information Foraging for Geo-Historical Context. Information Visualization {invited extension of paper originally published in Proceedings of IEEE VAST 2010} 11, 339-359.
9/2012 MDRP 13: (SensePlace 2) Collaborative Visual-Computational Information Foraging and Contextualization to Support Situation Awareness
Published Center for Visual Analytics for Command, Control, and Interoperability Environments
P. Chen, A. Barrera, C. Rhodes, “Semantic Analysis of Free Text and its Application on Automatically Assigning ICD‐9‐CM Codes to Patient Records”, The 9th IEEE International Conference on Cognitive Informatics, July 7‐9, 2010, Beijing, China. (Acceptance rate: 29%).
7/2010 EP 1: Leadership and Coordination Published Center for Visual Analytics for Command, Control, and Interoperability Environments
A. Tran, C. Bowes, D. Brown, P. Chen, M. Choly, W. Ding, ʺTreeMatch: A Fully Unsupervised WSD System Using Dependency Knowledge on a Specific Domainʺ, SemEval 2010 Workshop with the 48th Annual Meeting of the Association for Computational Linguistics (ACL), July, 2010. Uppsala, Sweden.
7/2010 EP 1: Leadership and Coordination Published Center for Visual Analytics for Command, Control, and Interoperability Environments
P. Chen, R. Alo’, J. Rundell, “From Language to Vision: A Case Study of Text Animation”, The 9th International Conference on Artificial Intelligence, Knowledge Engineering and Databases, Cambridge, UK, Feb., 2010
2/2010 EP 1: Leadership and Coordination Published Center for Visual Analytics for Command, Control, and Interoperability Environments
P. Chen, N. Ozoka, R. Ortiz, A. Tran, D. Brown, “Word Sense Distribution in a Web Corpus,” The 9th IEEE International Conference on Cognitive Informatics, July 7‐9, 2010, Beijing, China. (Poster, acceptance rate: 32%).
7/2010 EP 1: Leadership and Coordination Published Center for Visual Analytics for Command, Control, and Interoperability Environments
P. Chen, W. Garcia, “Hypothesis Generation and Data Quality Assessment through Association Mining”, The 9th IEEE International Conference on Cognitive Informatics, July 7‐9, 2010, Beijing, China. (Acceptance rate: 29%).
7/2010 EP 1: Leadership and Coordination Published Center for Visual Analytics for Command, Control, and Interoperability Environments
Visualizing the Impact of Geographical Variations on Multivariate Clustering, Y Zhang, W Luo, EA Mack, R Maciejewski, Computer Graphics Forum 35 (3), 101-110
1/2015 Geographic Network Analytics Correlations for VALET
Published Center for Visual Analytics for Command, Control, and Interoperability Environments
Michael Steptoe, Robert Krueger, Yifan Zhang, Xing Liang, Wei Luo, Rolando Garcia, Sagarika Kadambi, Thomas Ertl, Ross Maciejewski. VADER/VIS VAST 2015 Grand Challenge Entry. Proceedings of the IEEE Visual Analytics Science and Technology Challenge Workshop, 2015.
9/2015 Geographic Network Analytics Correlations for VALET
Published Center for Visual Analytics for Command, Control, and Interoperability Environments
Wei Xue, Tao Li, Naphtali Rishe. Aspect Identification and ratings inference for hotel reviews. World Wide Web Journal, 2016, in press.
1/2016 (MADIS) A Data Integration Framework for Enhancing Emergency Response Situation Reports with Multi-Agency, Multi-Partner Multimedia Data
In Press Center for Visual Analytics for Command, Control, and Interoperability Environments
Liang Tang, Yexi Jiang, Lei Li, Chunqiu Zeng, and Tao Li. 2015. Personalized Recommendation via Parameter-Free Contextual Bandits. In Proceedings of the 38th International ACM SIGIR Conference on Research and Development in Information Retrieval (SIGIR '15).
10/2015 (MADIS) A Data Integration Framework for Enhancing Emergency Response Situation Reports with Multi-Agency, Multi-Partner Multimedia Data
Published Center for Visual Analytics for Command, Control, and Interoperability Environments
Wei Xue, Tao Li, Naphtali Rishe: Aspect and Ratings Inference with Aspect Ratings: Supervised Generative Models for Mining Hotel Reviews. WISE (2) 2015: 17-31
1/2015 (MADIS) A Data Integration Framework for Enhancing Emergency Response Situation Reports with Multi-Agency, Multi-Partner Multimedia Data
Published Center for Visual Analytics for Command, Control, and Interoperability Environments
Mingjin Zhang, Huibo Wang, Yun Lu, Tao Li, Yudong Guang, Chang Liu, Erik Edrosa, Hongtai Li, Naphtali Rishe: TerraFly GeoCloud: An Online Spatial Data Analysis and Visualization System. ACM TIST 6(3): 34 (2015)
1/2015 (MADIS) A Data Integration Framework for Enhancing Emergency Response Situation Reports with Multi-Agency, Multi-Partner Multimedia Data
Published Center for Visual Analytics for Command, Control, and Interoperability Environments
Yilin Yan, Min Chen, Mei-Ling Shyu, and Shu-Ching Chen, "Deep Learning for Imbalanced Multimedia Data Classification," IEEE International Conference on Multimedia (ISM 2015), Miami, FL, pp. 483-488, December 14-16, 2015.
12/2015 (MADIS) A Data Integration Framework for Enhancing Emergency Response Situation Reports with Multi-Agency, Multi-Partner Multimedia Data
Published Center for Visual Analytics for Command, Control, and Interoperability Environments
Hsin-Yu Ha, Yimin Yang, Samira Pouyanfar, Haiman Tian, and Shu-Ching Chen, "Correlation-based Deep Learning for Multimedia Semantic Concept Detection," The 16th International Conference on Web Information System Engineering (WISE 2015), Miami, FL, pp. 473-487, November 1-3, 2015.
11/2015 (MADIS) A Data Integration Framework for Enhancing Emergency Response Situation Reports with Multi-Agency, Multi-Partner Multimedia Data
Published Center for Visual Analytics for Command, Control, and Interoperability Environments
Hsin-Yu Ha, Shu-Ching Chen, and Mei-Ling Shyu, "Negative-based Sampling for Multimedia Retrieval," The 16th IEEE International Conference on Information Reuse and Integration (IRI 2015), San Francisco, USA, pp. 64-71, August 13-15, 2015. 3.
8/2015 (MADIS) A Data Integration Framework for Enhancing Emergency Response Situation Reports with Multi-Agency, Multi-Partner Multimedia Data
Published Center for Visual Analytics for Command, Control, and Interoperability Environments
Yimin Yang and Shu-Ching Chen, "Ensemble Learning from Imbalanced Data Set for Video Event Detection," The 16th IEEE International Conference on Information Reuse and Integration (IRI 2015), San Francisco, USA, pp. 82-89, August 13-15, 2015
8/2015 (MADIS) A Data Integration Framework for Enhancing Emergency Response Situation Reports with Multi-Agency, Multi-Partner Multimedia Data
Published Center for Visual Analytics for Command, Control, and Interoperability Environments
Applied Curriculum Integration Overview - Crisis Informatics with NodeXL 5/2016 Crisis Informatics Course Development
Published Center for Visual Analytics for Command, Control, and Interoperability Environments
GeoCorpora: Building a Corpus to Test and Train Microblog Geoparsers (submitted) International Journal of Geographical Information Science
1/2016 (GeoTxt) E2E: GeoTxt API In Review Center for Visual Analytics for Command, Control, and Interoperability Environments
J. Kim, L. Huffman, H. Li, J. Yue, J. Ribera, E. Delp, " Automatic and Manual Tattoo Localization,” Proceedings of the IEEE International Symposium on Technologies for Homeland Security, Waltham, MA, May 2016.
5/2016 (GARI) Gang Graffiti Recognition and Analysis
Published Center for Visual Analytics for Command, Control, and Interoperability Environments
J. Kim, H. Li, J, Yue, E, Delp, "Tattoo Image Retrieval for Region of Interest,"Proceedings of the IEEE International Symposium on Technologies for Homeland Security, Waltham, MA, May 2016.
5/2016 (GARI) Gang Graffiti Recognition and Analysis
Published Center for Visual Analytics for Command, Control, and Interoperability Environments
Chicago LTE Video Pilot Lessons Learned Test Report 10/2015 Chicago LTE Project Published Center for Visual Analytics for Command, Control, and Interoperability Environments
Y. Koh, A. Mohan, G. Wang, H. Xu, A. Malik, Y. Lu, and D. S. Ebert. Improve Safety using Public Network Cameras. IEEE Symposium on Technologies for Homeland Security 2016.
Safety in View: A Public Safety Visual Analytics Tool Based on CCTV Camera Angles of View
Published Center for Visual Analytics for Command, Control, and Interoperability Environments

Chae, J., Zhang, J., Jeong, S., Jang, Y., Malik, A., Ebert, D., “Forecasting the Flow of Human Crowds”, IEEE Visual Analytics Science and Technology (VAST) Conference, 2016
10/2016 SMART: Social Media Analytics and Reporting Toolkit
In Review Center for Visual Analytics for Command, Control, and Interoperability Environments
Zhang, J., Ahlbrand, B., Malik, A., Chae, J., Min, Z., Ko, S. and Ebert, D., “A Visual Analytics Framework for Microblog Data Analysis at Multiple Scales of Aggregation”, Computer Graphics Forum, 35: 441–450, 2016.
8/2016 SMART: Social Media Analytics and Reporting Toolkit
Published Center for Visual Analytics for Command, Control, and Interoperability Environments
Chae, J., Zhang, J., Ko, S., Malik, A., Connell, H., Ebert, D., “Visual Analytics for Investigative Analysis of Hoax Distress Calls using Social Media”, IEEE International Conference on Technologies for Homeland Security, 2016
5/2016 SMART: Social Media Analytics and Reporting Toolkit
Published Center for Visual Analytics for Command, Control, and Interoperability Environments
Chae, J., Zhang, J., Jeong, S., Jang, Y., Malik, A., Ebert, D., “Forecasting the Flow of Human Crowds”, IEEE Visual Analytics Science and Technology (VAST) Conference, 2016
SMART: Social Media Analytics and Reporting Toolkit
In Review Center for Visual Analytics for Command, Control, and Interoperability Environments
Zhang, J., Ahlbrand, B., Malik, A., Chae, J., Min, Z., Ko, S. and Ebert, D., “A Visual Analytics Framework for Microblog Data Analysis at Multiple Scales of Aggregation”, Computer Graphics Forum, 35: 441–450, 2016.
SMART: Social Media Analytics and Reporting Toolkit
Published Center for Visual Analytics for Command, Control, and Interoperability Environments
Chae, J., Zhang, J., Ko, S., Malik, A., Connell, H., Ebert, D., “Visual Analytics for Investigative Analysis of Hoax Distress Calls using Social Media”, IEEE International Conference on Technologies for Homeland Security, 2016
SMART: Social Media Analytics and Reporting Toolkit
Published Center for Visual Analytics for Command, Control, and Interoperability Environments
G. Wang, A. Malik, S. Chen, S. Afzal, D. S. Ebert. A Client-based Visual Analytics Framework for Large Spatiotemporal Data under Architectural Constraints. IEEE Symposium on Large Data Analysis and Visualization.
10/2015 (VALET) Developing a spatial statistics framework in the visual analytics for law enforcement technology suite
Published Center for Visual Analytics for Command, Control, and Interoperability Environments
Delgado, K. Tahboub and E. J. Delp, "Superpixels shape analysis for carried object detection,” Proceedings of the IEEE Winter Applications of Computer Vision Workshops, Lake Placid, NY, 2016, pp. 1-6.
1/2016 VBOLO Published Center for Visual Analytics for Command, Control, and Interoperability Environments
K. Tahboub, B. Delgado, and E. J. Delp, “Person re-identification using a patch-based appearance model," Proceedings of the IEEE Conference on Image Processing, pp. 764-768, September 2016, Phoenix, AZ.
9/2016 VBOLO Published Center for Visual Analytics for Command, Control, and Interoperability Environments
K. Tahboub, A. R. Reibman, and E. J. Delp, "Accuracy prediction for pedestrian detection," To appear, Proceedings of the IEEE International Conference on Image Processing, September 2017, Beijing, China.
9/2017 VBOLO Published Center for Visual Analytics for Command, Control, and Interoperability Environments
K. Tahboub, D. Guera, A. R. Reibman, and E. J. Delp, "Quality-adaptive deep learning for pedestrian detection," To appear, Proceedings of the IEEE International Conference on Image Processing, September 2017, Beijing, China
9/2017 VBOLO Published Center for Visual Analytics for Command, Control, and Interoperability Environments
N. Gadgil, K. Tahboub, D. Kirsh, and E. J. Delp, "A web-based video annotation system for crowdsourcing surveillance videos," Proceedings of the IS&T/SPIE Electronic Imaging: Imaging and Multimedia Analytics in a Web and Mobile World, vol. 9027, pp. 90270A: 1-12, February 2014, San Francisco, CA.
2/2014 (GARI) Gang Graffiti Recognition and Analysis
Published Center for Visual Analytics for Command, Control, and Interoperability Environments
S. Ko, S. Afzal, S. Walton, Y. Yang, J. Chae, A. Malik, Y. Jang, M. Chen, and D. Ebert. Analyzing high-dimensional multivariate network links with integrated anomaly detection, highlighting and exploration. Proc. IEEE VAST 2014, pp.83-92, 2014.
12/2014 UKVAC Joint Research Project Published Center for Visual Analytics for Command, Control, and Interoperability Environments
"Emergency Pocket Placard: Providing Emergency Response Information via Mobile Application" Chicora Chandler, Jotham Greer, Loretta A. Moore, Jacqueline M. Jackson, Nitin Khanna, Edward J. Delp Sept. 2016
9/2016 (MERGE) Mobile Emergency Response Guide
Published Center for Visual Analytics for Command, Control, and Interoperability Environments
K. Thongkor, A. Parra, B. Zhao, T. Amornraksa, E. J. Delp, " Hazmat Sign Location Detection Based on Fourier Shape Descriptors," Proceedings of the IS&T International Symposium on Electronic Imaging, pp. 1-5, February 2016, San Francisco, CA. 02/2016
2/2016 (MERGE) Mobile Emergency Response Guide
Published Center for Visual Analytics for Command, Control, and Interoperability Environments
Albert Parra Pozo, August 2014, “Integrated Mobile Systems Using Image Analysis With Applications In Public Safety”
8/2014 (MERGE) Mobile Emergency Response Guide
Published Center for Visual Analytics for Command, Control, and Interoperability Environments
Bin Zhao, December 2014, "Image Analysis Using Visual Saliency with Applications in Hazmat Sign Detection and Recognition."
12/2014 (MERGE) Mobile Emergency Response Guide
Published Center for Visual Analytics for Command, Control, and Interoperability Environments
Albert Parra Pozo, August 2014, “Integrated Mobile Systems Using Image Analysis With Applications In Public Safety”
8/2014 (GARI) Gang Graffiti Recognition and Analysis
Published Center for Visual Analytics for Command, Control, and Interoperability Environments
Bin Zhao, December 2014, "Image Analysis Using Visual Saliency with Applications in Hazmat Sign Detection and Recognition."
12/2014 (GARI) Gang Graffiti Recognition and Analysis
Published Center for Visual Analytics for Command, Control, and Interoperability Environments

Citation Other project date Project Center of ExcellenceRobinson, A. (2009). Visual Highlighting Methods for Geovisualization. 24th International Cartographic Conference. Santiago, Chile (conference CD, no page #s) {paper introduces a visual display method relevant to Penn State tool development in MDRP 1, 3, 12, and 13}
11/2009 MDRP 12: Foreign Animal and Zoonotic Disease Visual Analytics
Center for Visual Analytics for Command, Control, and Interoperability Environments
Robinson, A. (2009). Needs Assessment for the Design of Information Synthesis Visual Analytics Tools. IEEE International Conference on Information Visualization. Barcelona, Spain, 353-360. {joint work with MDRP 1}
7/2009 MDRP 13: GeoJunction: Collaborative Visual-Computational Information Foraging and Contextualization to Support Situation Awareness
Center for Visual Analytics for Command, Control, and Interoperability Environments
Xue, X., H. Luo, J. Fan, ``Structured Max-margin Learning for Multi-Label Image Annotation", ACM Conf. on Image and Video Retrieval (CIVR'10), 2010.
3/2011 MDRP 14: Multimedia Visual Analytics for Investigative Analysis
Center for Visual Analytics for Command, Control, and Interoperability Environments
Liu, Jianfei, Kyle Lyons, Kalpathi Subramanian, William Ribarsky. Semi-Automated Processing and Routing Within Indoor Structures For Emergency Response Applications", Proceedings of SPIE Defense, Security+Sensing, 2010.
4/2010 (VALET) Developing a spatial statistics framework in the visual analytics for law enforcement technology suite
Center for Visual Analytics for Command, Control, and Interoperability Environments
P. Chen, I. Chen, R. Verma, A. Tran*, “An Undergraduate Data Mining Course Integrated with Research and Industry Projects”, SIGCSE 2010, Poster session, March, 2010.
3/2010 EP 2: MSI Collaboration
Center for Visual Analytics for Command, Control, and Interoperability Environments
Kim, S., Maciejewski, R., Malik, A., Jang, Y., Ebert, D. S., Isenberg, T., “Bristle Maps: A Multivariate Abstraction Technique for Geovisualization,” IEEE Transactions on Visualization and Computer Graphics
9/2013 (VALET) Developing a spatial statistics framework in the visual analytics for law enforcement technology suite
Center for Visual Analytics for Command, Control, and Interoperability Environments
S. Ghani, B. Kwon, S. Lee, J. S. Yi, N. Elmqvist. Visual Analytics for Multimodal Social Network Analysis: A Design Study with Social Scientists. IEEE Transactions on Visualization and Computer Graphics
12/2013 MDRP 18: COE-Explorer (Visual Analytics for the DHS Centers of Excellence)
Center for Visual Analytics for Command, Control, and Interoperability Environments
Arias-Hernández, R. , Green, T.M., Fisher,B. (2012) From Cognitive Amplifiers to Cognitive Prostheses: Understandings of the Material Basis of Cognition in Visual Analytics."Computational Picturing," a special issue for Interdisciplinary Science Reviews 37(1). (paper attached)
3/2012 MDRP 6: Video Surveillance Visual Analytics
Center for Visual Analytics for Command, Control, and Interoperability Environments

Zhang, Jiawei; Chae, Junghoon; Afzal, Shehzad; Malik, Abish; Thom, Dennis; Jang, Yun; Ertl, Thomas; Matei, Sorin A.; Ebert, David S.: Visual Analytics of User Influence and Location-Based Social Networks. In: Sorin Matei, Martha Russell, Elisa Bertino: Transparancy in Social Media. Heidelberg: Springer
12/2014 SMART: Social Media Analytics and Reporting Toolkit
Center for Visual Analytics for Command, Control, and Interoperability Environments
Chicago LTE Pilot Project Final Report DHS Center For Visual Analytics for Command, Control, and Interoperability Environments (VACCINE) Video and Image Processing Laboratory (VIPER) Purdue University West Lafayette, Indiana Khalid Tahboub and Edward J. Delp Version 1.4
8/2015 Chicago LTE Project
Center for Visual Analytics for Command, Control, and Interoperability Environments
Not funded by, but derived from GeoTxt research: MacEachren, A.M. 2014: Place Reference in Text as a Radial Category: A Challenge to Spatial Search, Retrieval, and Geographical. Position paper for the 2014 Specialist Meeting — Spatial Search, Santa Barbara, CA: UCSB Center for Spatial Studies. Page 48- 51 in: http://spatial.ucsb.edu/wp-content/uploads/smss2014-All_Position_Papers.pdf
2/2014 (GeoTxt) E2E: GeoTxt API
Center for Visual Analytics for Command, Control, and Interoperability Environments
Ross Maciejewski, Phillip Livengood, Stephen Rudolph, Timothy F. Collins, David S. Ebert, Robert T. Brigantic, Courtney D. Corley, George A. Muller, and Stephen W. Sanders. A Pandemic Modeling and Visualization Tool. Journal of Visual Languages and Computing, 22(4):268-278 2011
1/2011 MDRP 12: Foreign Animal and Zoonotic Disease Visual Analytics
Center for Visual Analytics for Command, Control, and Interoperability Environments
Ross Maciejewski, Ryan Hafen, Stephen Rudolph, Stephen G. Larew, Michael A. Mitchell, William S. Cleveland, David S. Ebert. Forecasting Hotspots - A Predictive Analytics Approach. IEEE Transactions on Visualization and Computer Graphics, 17(4): 440-453, May/June 2011.
5/2011 MDRP 12: Foreign Animal and Zoonotic Disease Visual Analytics
Center for Visual Analytics for Command, Control, and Interoperability Environments
Afzal, S., Maciejewski, R., Ebert, D. S. Visual Analytics Decision Support Environment for Epidemic Modeling and Response Evaluation. In IEEE Conference on Visual Analytics Science and Technology (IEEE VAST), pages 1-10, October 2011.
10/2011 MDRP 12: Foreign Animal and Zoonotic Disease Visual Analytics
Center for Visual Analytics for Command, Control, and Interoperability Environments
Auer, T., MacEachren, A.M., McCabe, C. and Pezanowski, S. submitted: HerbariaViz: A web-based client-server interface for mapping and exploring flora observation data. Ecological Informatics. {joint work with MDRP 3}
9/2010 MDRP 12: Foreign Animal and Zoonotic Disease Visual Analytics
Center for Visual Analytics for Command, Control, and Interoperability Environments
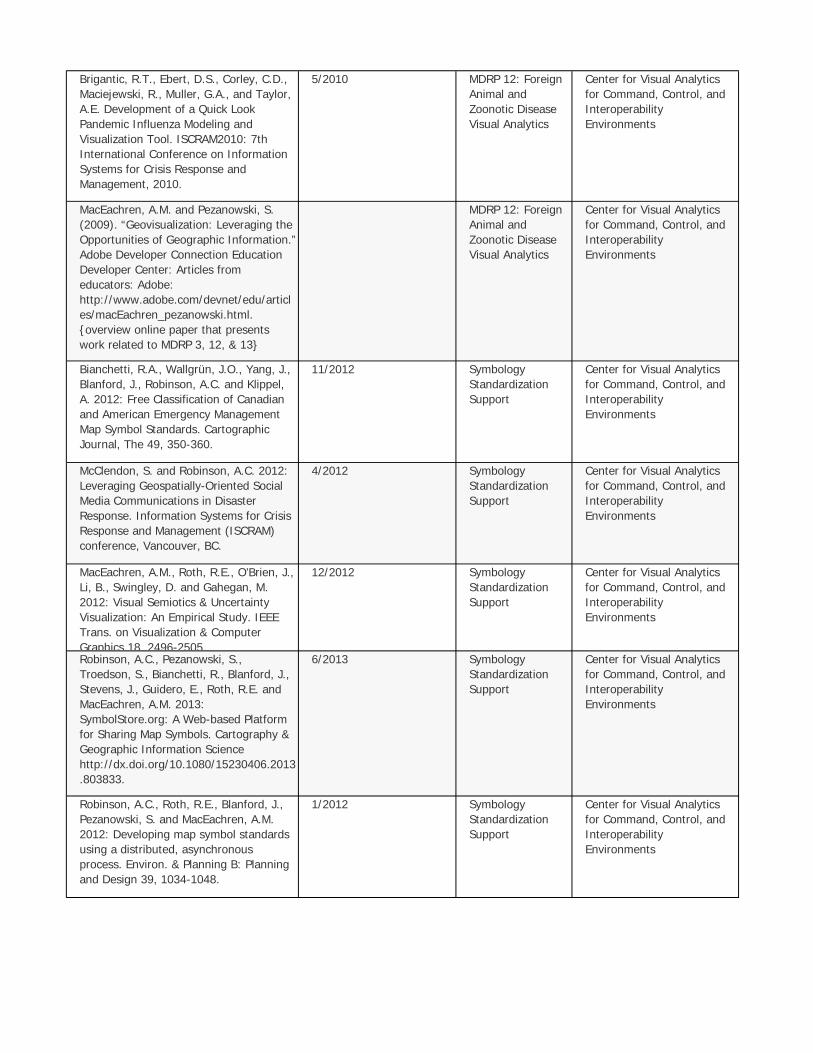
Brigantic, R.T., Ebert, D.S., Corley, C.D., Maciejewski, R., Muller, G.A., and Taylor, A.E. Development of a Quick Look Pandemic Influenza Modeling and Visualization Tool. ISCRAM2010: 7th International Conference on Information Systems for Crisis Response and Management, 2010.
5/2010 MDRP 12: Foreign Animal and Zoonotic Disease Visual Analytics
Center for Visual Analytics for Command, Control, and Interoperability Environments
MacEachren, A.M. and Pezanowski, S. (2009). “Geovisualization: Leveraging the Opportunities of Geographic Information.” Adobe Developer Connection Education Developer Center: Articles from educators: Adobe: http://www.adobe.com/devnet/edu/articles/macEachren_pezanowski.html. {overview online paper that presents work related to MDRP 3, 12, & 13}
MDRP 12: Foreign Animal and Zoonotic Disease Visual Analytics
Center for Visual Analytics for Command, Control, and Interoperability Environments
Bianchetti, R.A., Wallgrün, J.O., Yang, J., Blanford, J., Robinson, A.C. and Klippel, A. 2012: Free Classification of Canadian and American Emergency Management Map Symbol Standards. Cartographic Journal, The 49, 350-360.
11/2012 Symbology Standardization Support
Center for Visual Analytics for Command, Control, and Interoperability Environments
McClendon, S. and Robinson, A.C. 2012: Leveraging Geospatially-Oriented Social Media Communications in Disaster Response. Information Systems for Crisis Response and Management (ISCRAM) conference, Vancouver, BC.
4/2012 Symbology Standardization Support
Center for Visual Analytics for Command, Control, and Interoperability Environments
MacEachren, A.M., Roth, R.E., O’Brien, J., Li, B., Swingley, D. and Gahegan, M. 2012: Visual Semiotics & Uncertainty Visualization: An Empirical Study. IEEE Trans. on Visualization & Computer Graphics 18, 2496-2505.
12/2012 Symbology Standardization Support
Center for Visual Analytics for Command, Control, and Interoperability Environments
Robinson, A.C., Pezanowski, S., Troedson, S., Bianchetti, R., Blanford, J., Stevens, J., Guidero, E., Roth, R.E. and MacEachren, A.M. 2013: SymbolStore.org: A Web-based Platform for Sharing Map Symbols. Cartography & Geographic Information Science http://dx.doi.org/10.1080/15230406.2013.803833.
6/2013 Symbology Standardization Support
Center for Visual Analytics for Command, Control, and Interoperability Environments
Robinson, A.C., Roth, R.E., Blanford, J., Pezanowski, S. and MacEachren, A.M. 2012: Developing map symbol standards using a distributed, asynchronous process. Environ. & Planning B: Planning and Design 39, 1034-1048.
1/2012 Symbology Standardization Support
Center for Visual Analytics for Command, Control, and Interoperability Environments

Kaastra, L.T., Arias-Hernandez, R., Fisher, B. (2012) Evaluating Analytic Performance. BELIV 2012: Beyond Time and Errors - Novel Evaluation Methods for Visualization. 2012, Seattle WA
12/2011 MDRP 6: Video Surveillance Visual Analytics
Center for Visual Analytics for Command, Control, and Interoperability Environments
Al-Hajj, S. I. Pike and B. Fisher “Visual Analytics to Support Medical Decision Making Process”. Short communication, XXIV Conference of the European Federation for Medical Information: Quality of life through Quality of Information. Pisa, ITALY (2012). (paper attached)
8/2011 MDRP 6: Video Surveillance Visual Analytics
Center for Visual Analytics for Command, Control, and Interoperability Environments
MacEachren, A.M., Stryker, M.S., Turton, I.J. and Pezanowski, S. 2010: HEALTH GeoJunction: Visual-computationally Enabled Browsing of Health Publications and Their Contents. International Journal of Health Geographics 9(23). http://www.ijhealthgeographics. com/content/pdf/1476-072X-9-23.pdf
5/2010 MDRP 13: GeoJunction: Collaborative Visual-Computational Information Foraging and Contextualization to Support Situation Awareness
Center for Visual Analytics for Command, Control, and Interoperability Environments
MacEachren, A.M. and Pezanowski, S. (2009). “Geovisualization: Leveraging the Opportunities of Geographic Information.” Adobe Developer Connection Education Developer Center: Articles from educators: Adobe: http://www.adobe.com/devnet/edu/articles/macEachren_pezanowski.html {this online overview highlighted Penn State work from MDRP 3, 12, and 13}
8/2010 MDRP 13: GeoJunction: Collaborative Visual-Computational Information Foraging and Contextualization to Support Situation Awareness
Center for Visual Analytics for Command, Control, and Interoperability Environments
Yu, B. and G. Cai (2009). Facilitating Participatory Decision-Making in Local Communities through Map-Based Online Discussion. The Fourth International Conference on Communities and Technologies (C&T 2009). J. M. Carroll. University Park, PA, ACM.
6/2009 MDRP 13: GeoJunction: Collaborative Visual-Computational Information Foraging and Contextualization to Support Situation Awareness
Center for Visual Analytics for Command, Control, and Interoperability Environments
Robinson, A. (2009). Visual Highlighting Methods for Geovisualization. 24th International Cartographic Conference. Santiago, Chile (conference CD, no page #s) {paper introduces a visual display method relevant to Penn State tool development in MDRP 1, 3, 12, and 13}
11/2009 MDRP 13: GeoJunction: Collaborative Visual-Computational Information Foraging and Contextualization to Support Situation Awareness
Center for Visual Analytics for Command, Control, and Interoperability Environments

Fan, J. D. Keim, Y. Gao, H. Luo, Z. Li, “JustClick: Personalized Image Recommendation via Exploratory Search from Large-Scale Flickr Images”, IEEE Trans. on Circuits and Systems for Video Technology, vol. 19, no.2, pp.273-288 2009
2/2009 MDRP 14: Multimedia Visual Analytics for Investigative Analysis
Center for Visual Analytics for Command, Control, and Interoperability Environments
J. Fan, Y. Shen, N. Zhou, Y. Gao, ``Harvesting Large-ScaleWeakly-Tagged Image Databases from the Web", IEEE Conf. on Computer Vision and Pattern Recognition (CVPR'10), 2010.
6/2010 MDRP 14: Multimedia Visual Analytics for Investigative Analysis
Center for Visual Analytics for Command, Control, and Interoperability Environments
J. Fan, H. Luo, Y. Shen, C. Yang, ``Integrating Visual and Semantic Contexts for Topic Network Generation and Word Sense Disambiguation", ACM Conf. on Image and Video Retrieval (CIVR'09), 2009.
7/2009 MDRP 14: Multimedia Visual Analytics for Investigative Analysis
Center for Visual Analytics for Command, Control, and Interoperability Environments
Li, H. Luo, J. Fan, ``Incorporating Camera Metadata for Attended Region Detection and Consumer Photo Classification", ACM Multimedia (MM'09), Beijing, 2009.
10/2009 MDRP 14: Multimedia Visual Analytics for Investigative Analysis
Center for Visual Analytics for Command, Control, and Interoperability Environments
W. Gong, H. Luo, J. Fan, ``Extracting Informative Images from Web News Pages via Imbalanced Classification", ACM Multimedia (MM'09) Grand Challenge Competition, Beijing, 2009.
10/2009 MDRP 14: Multimedia Visual Analytics for Investigative Analysis
Center for Visual Analytics for Command, Control, and Interoperability Environments
Zhang, Y., L. Cen, X. Xue, N. Zhou, ``Bilingual query translation for multimedia retrieval", ACM Multimedia, 2010.
10/2010 MDRP 14: Multimedia Visual Analytics for Investigative Analysis
Center for Visual Analytics for Command, Control, and Interoperability Environments
Y. Chen, J. Yang, and S. Barlowe. Click2Annotate: Automated Insight Externalization with Rich Semantics. Submitted to IEEE VAST 2010.
10/2010 MDRP 14: Multimedia Visual Analytics for Investigative Analysis
Center for Visual Analytics for Command, Control, and Interoperability Environments
Shen, Y., J. Fan, ``Leverage loosely-labeled images and inter-object correlation for classifier training and multi-label image annotation", ACM Multimedia, 2010.
10/2010 MDRP 14: Multimedia Visual Analytics for Investigative Analysis
Center for Visual Analytics for Command, Control, and Interoperability Environments
Y. Chen, J. Yang, S. Barlowe, and D. Jeong: Touch2Annotate - Generating better annotations with less human effort on multi-touch interfaces. ACM CHI 2010 Extended Abstracts: 3703-3708.
4/2010 MDRP 14: Multimedia Visual Analytics for Investigative Analysis
Center for Visual Analytics for Command, Control, and Interoperability Environments
Malik, A., Maciejewski, R., Collins, T., Ebert, D., Visual Analytics Law Enforcement Toolkit, IEEE Conference on Technologies for Homeland Security, 2010 (submitted)
11/2010 (VALET) Developing a spatial statistics framework in the visual analytics for law enforcement technology suite
Center for Visual Analytics for Command, Control, and Interoperability Environments

Aló, Richard A., Diane Baxter, Karl Barnes, Al Kuslikis, Geoffrey Fox, Alex Ramirez; Advancing Computational Science, Visualization and Homeland Security Research/ Education at Minority Serving Institutions National Model Promoted/ Implemented by MSI-CIEC (Minority Serving Institutions-CyberInfrastructure Empowerment Coalition); International Conference on Computational Science, ICCS, 2010. Amsterdam June 2010
6/2010 EP 2: MSI Collaboration
Center for Visual Analytics for Command, Control, and Interoperability Environments
Aló, Richard A., Diane Baxter, Karl Barnes, Al Kuslikis, Geoffrey Fox, Alex Ramirez; A Model for LACCEI: Minority Serving Institutions and CyberInfrastructure Research/ Education Minority Serving Institutions-CyberInfrastructure Empowerment Coalition- MSI-CIEC; Latin American and Caribbean Consortium for Engineering Institutions, International Conference, LACCEI 2010, Arequipa, Peru, June, 2010
6/2010 EP 2: MSI Collaboration
Center for Visual Analytics for Command, Control, and Interoperability Environments
A. Tran, C. Bowes, D. Brown, P. Chen, M. Choly, W. Ding, ‘TreeMatch: A Fully Unsupervised WSD System Using Dependency Knowledge on a Specific Domain’, SemEval 2010 Workshop with the 48th Annual Meeting of the Association for Computational Linguistics (ACL), July, 2010. Uppsala, Sweden.
7/2010 EP 2: MSI Collaboration
Center for Visual Analytics for Command, Control, and Interoperability Environments
P. Chen, A. Barrera, C. Rhodes, “Semantic Analysis of Free Text and its Application on Automatically Assigning ICD?9?CM Codes to Patient Records”, The 9th IEEE International Conference on Cognitive Informatics, July 7?9, 2010, Beijing, China. (Acceptance rate: 29%).
7/2010 EP 2: MSI Collaboration
Center for Visual Analytics for Command, Control, and Interoperability Environments
P. Chen, N. Ozoka, R. Ortiz, A. Tran, D. Brown, “Word Sense Distribution in a Web Corpus,” The 9th IEEE International Conference on Cognitive Informatics, July 7-9, 2010, Beijing, China. (Poster, acceptance rate: 32%).
7/2010 EP 2: MSI Collaboration
Center for Visual Analytics for Command, Control, and Interoperability Environments
P. Chen, W. Garcia, “Hypothesis Generation and Data Quality Assessment through Association Mining”, The 9th IEEE International Conference on Cognitive Informatics, July 7-9, 2010, Beijing, China. (Acceptance rate: 29%).
7/2010 EP 2: MSI Collaboration
Center for Visual Analytics for Command, Control, and Interoperability Environments
Zhou, N., J. Fan, ``Integrating bilingual query results for junk image filtering", ACM Multimedia, 2010.
4/2012 MDRP 14: Multimedia Visual Analytics for Investigative Analysis
Center for Visual Analytics for Command, Control, and Interoperability Environments

Robinson, A. (2009). Needs Assessment for the Design of Information Synthesis Visual Analytics Tools. IEEE International Conference on Information Visualization. Barcelona, Spain, 353-360. {cross MDRP – 1 & 13}
7/2009 MDRP 1: (Jigsaw) Visual Analytics for Investigative Analysis on Text Documents
Center for Visual Analytics for Command, Control, and Interoperability Environments
Robinson, A. (2009). Visual Highlighting Methods for Geovisualization. 24th International Cartographic Conference. Santiago, Chile (CD only) {cross MDRP – 1, 3, 12 & 13}
11/2009 MDRP 1: (Jigsaw) Visual Analytics for Investigative Analysis on Text Documents
Center for Visual Analytics for Command, Control, and Interoperability Environments
Youn-ah Kang, Carsten Görg, John Stasko, "Evaluating Visual Analytics Systems for Investigative Analysis: Deriving Design Principles from a Case Study", Proceedings of IEEE VAST '09, Atlantic City, NJ, October 2009, pp. 139-146.
10/2009 MDRP 1: (Jigsaw) Visual Analytics for Investigative Analysis on Text Documents
Center for Visual Analytics for Command, Control, and Interoperability Environments
Ross Maciejewski, Stephen Rudolph, Travis Drake, Abish Malik, David S. Ebert. Data Aggregation and Analysis for Cancer Care Statistics - A Visual Analytics Approach. Hawai'i International Conference on System Sciences, 2010.
1/2010 MDRP 3: (GeoViz & CrimeViz) Situational Surveillance & In-field Criminal Investigative Analytics
Center for Visual Analytics for Command, Control, and Interoperability Environments
Robinson, A. (2009). Visual Highlighting Methods for Geovisualization. 24th International Cartographic Conference. Santiago, Chile (CD only) {paper introduces a visual display method relevant to Penn State tool development in MDRP 1, 3, 12, and 13}
11/2009 MDRP 3: (GeoViz & CrimeViz) Situational Surveillance & In-field Criminal Investigative Analytics
Center for Visual Analytics for Command, Control, and Interoperability Environments
X. Xue, H. Luo, J. Fan, ``Structured Max-Nargin Learning for Multi-Label Image Annotation", ACM Conf. on Image and Video Retrieval (CIVR'10), 2010.
7/2010 MDRP 6: Video Surveillance Visual Analytics
Center for Visual Analytics for Command, Control, and Interoperability Environments
J. Fan et al. ``Automatically Protecting Privacy in Consumer Generated Videos using Intended Human Object Detection”, IEEE CVPR workshop, 2010.
10/2010 MDRP 6: Video Surveillance Visual Analytics
Center for Visual Analytics for Command, Control, and Interoperability Environments
Walton, R., Mays, R., & Haselkorn, M. (2011, May). Defining fast: factors affecting the experience of speed in humanitarian logistics. Proceedings of the 2011 international conference on international systems in crisis response and management.
5/2011 MDRP 7: Introducing Sustainable Visual Analytics into Command Center Environments
Center for Visual Analytics for Command, Control, and Interoperability Environments
Hardisty, F. and A. C. Robinson (In Press). "The GeoViz Toolkit: Using component-oriented coordination methods to aid geovisualization application construction." International Journal of Geographic Information Science. {joint work with MDRP 3}
MDRP 12: Foreign Animal and Zoonotic Disease Visual Analytics
Center for Visual Analytics for Command, Control, and Interoperability Environments

Auer, T., MacEachren, A.M., McCabe, C. and Pezanowski, S. submitted: HerbariaViz: A web-based client-server interface for mapping and exploring flora observation data. Ecological Informatics. {joint work with MDRP 3}
9/2010 MDRP 12: Foreign Animal and Zoonotic Disease Visual Analytics
Center for Visual Analytics for Command, Control, and Interoperability Environments
MacEachren, A.M. and Pezanowski, S. (2009). “Geovisualization: Leveraging the Opportunities of Geographic Information.” Adobe Developer Connection Education Developer Center: Articles from educators: Adobe: http://www.adobe.com/devnet/edu/articles/macEachren_pezanowski.html. {overview online paper that presents work related to MDRP 3, 12, & 13}
MDRP 12: Foreign Animal and Zoonotic Disease Visual Analytics
Center for Visual Analytics for Command, Control, and Interoperability Environments
S. Ghani, N. Elmqvist. Improving Revisitation in Graphs through Static Spatial Features. In Proceedings of Graphics Interface, to appear, 2011.
5/2011 MDRP 18: COE-Explorer (Visual Analytics for the DHS Centers of Excellence)
Center for Visual Analytics for Command, Control, and Interoperability Environments
S. Ghani, N. Henry Riche, N. Elmqvist. Dynamic Insets for Context-Aware Graph Navigation.ComputerGraphics Forum (IEEE EuroVis 2011 proceedings), 30(3):861–870 2011.
6/2011 MDRP 18: COE-Explorer (Visual Analytics for the DHS Centers of Excellence)
Center for Visual Analytics for Command, Control, and Interoperability Environments
K. Kim, S. Ko, N. Elmqvist, D. Ebert. WordBridge: Using Composite Tag Clouds in Node-Link Diagrams for Visualizing Content and Relations in Text Corpora. In Proceedings of the Hawaii International Conference on System Sciences (Visual Analytics Minitrack), 2011. http://engineering.purdue.edu/~elm/projects/wordbridge/wordbridge.pdf
1/2011 MDRP 18: COE-Explorer (Visual Analytics for the DHS Centers of Excellence)
Center for Visual Analytics for Command, Control, and Interoperability Environments
Mays, R., Zachary, M., Murat, A., Haselkorn, M. (2011, May). Aligning Border Security Workflow and Decision Making with Supporting Information and Communication Systems, Proceedings of the 2011 international conference on international systems in crisis response and management
5/2011 MDRP 7: Introducing Sustainable Visual Analytics into Command Center Environments
Center for Visual Analytics for Command, Control, and Interoperability Environments
Bradel, L., Endert, A., North, C. “Benefits of Co-located Collaboration on Large, High-Resolution Displays.” Grace Hopper Conference 2011. Portland, Oregon. November, 2011
11/2011 Co-Located Collaborative Analysis on Large, High-Resolution Displays using Multiple Input Devices; Public Safety Coalition Projects
Center for Visual Analytics for Command, Control, and Interoperability Environments

Bradel, L., Andrews, C., Endert, A., Vogt, K., Hutchings, D., North, C. “Space for Two to Think: Large, High-Resolution Displays for Co-located Collaborative Sensemaking.” Technical Report TR-11-08. Computer Science, Virginia Tech
1/2011 Co-Located Collaborative Analysis on Large, High-Resolution Displays using Multiple Input Devices; Public Safety Coalition Projects
Center for Visual Analytics for Command, Control, and Interoperability Environments
Officer Performance Flyer 9/2015 Officer Performance Visualization System
Center for Visual Analytics for Command, Control, and Interoperability Environments
Caragea C, McNeese M, Jaiswal A, Traylor G, Kim H, Mitra P, Wu D, Tapia A, Giles CL, Jansen J, et al. Classifying Text Messages for the Haiti Earthquake. Proceedings, 8th International Conference on Information Systems for Crisis Response and Management (ISCRAM). Lisbon, Portugal; 2011
5/2011 MDRP 13: GeoJunction: Collaborative Visual-Computational Information Foraging and Contextualization to Support Situation Awareness
Center for Visual Analytics for Command, Control, and Interoperability Environments
Bajpal K, Jaiswal A. A Framework for Analyzing Collective Action Events on Twitter. Proceedings, 8th International Conference on Information Systems for Crisis Response and Management (ISCRAM). Lisbon, Portugal; 2011
5/2011 MDRP 13: GeoJunction: Collaborative Visual-Computational Information Foraging and Contextualization to Support Situation Awareness
Center for Visual Analytics for Command, Control, and Interoperability Environments
Bradel L, Andrews C, North C, Endert A, Koch, K. Large High-Resolution Displays for Co-located Collaborative Intelligence Analysis: Display Usage and Territoriality. Submitted to Intl Journal of Human-Computer Studies.
10/2013 Co-Located Collaborative Analysis on Large, High-Resolution Displays using Multiple Input Devices; Public Safety Coalition Projects
Center for Visual Analytics for Command, Control, and Interoperability Environments
Maciejewski, R., Pattath, A., Ko, S., Hafen, R., Cleveland, W., Ebert, D., "Automated Box-Cox Transformations for Improved Visual Encoding,"IEEE Transactions on Visualization and Computer Graphics, to appear, 2012.
(VALET) Developing a spatial statistics framework in the visual analytics for law enforcement technology suite
Center for Visual Analytics for Command, Control, and Interoperability Environments
Elmqvist, N., Ebert, D., "Leveraging Multidisciplinarity in a Visual Analytics Graduate Course," IEEE Computer Graphics and Applications, May/June 2012
5/2012 Cyber Education Center for Visual Analytics for Command, Control, and Interoperability Environments
Carsten Görg, Youn-ah Kang, Zhicheng Liu, and John Stasko, "Visual Analytics Support for Intelligence Analysis", IEEE Computer, Vol. 46, No. 7, July 2013, pp. 30-38.
7/2013 MDRP 1: (Jigsaw) Visual Analytics for Investigative Analysis on Text Documents
Center for Visual Analytics for Command, Control, and Interoperability Environments

Zhicheng Liu, Sham Navathe, and John Stasko, "Ploceus: Modeling, Visualizing and Analyzing Tabular Data as Networks", Information Visualization, Vol. 13, No. 1, January 2014, pp. 59-89.
1/2014 MDRP 1: (Jigsaw) Visual Analytics for Investigative Analysis on Text Documents
Center for Visual Analytics for Command, Control, and Interoperability Environments
Pezanowski, S. and MacEachren, A. M. (2014) Symbol Reviewer Design and Features, report on Symbology Transition, submitted to DHS VACCINE Center of Excellence.
7/2014 Symbology Map Transition
Center for Visual Analytics for Command, Control, and Interoperability Environments
Harshaw, Christopher R., et al. "Graphprints: towards a graph analytic method for network anomaly detection." Proceedings of the 11th Annual Cyber and Information Security Research Conference. ACM, 2016.
5/2016 Context-Driven Visual Analytics for Cyber Defensive Operations - Oak Ridge N Lab
Center for Visual Analytics for Command, Control, and Interoperability Environments

Citation Thesis date Project Center of ExcellenceAlbert Parra Pozo, August 2014, “Integrated Mobile Systems Using Image Analysis With Applications In Public Safety
8/2014 (GARI) Gang Graffiti Recognition and Analysis
Center for Visual Analytics for Command, Control, and Interoperability Environments
Bin Zhao, December 2014, "Image Analysis Using Visual Saliency with Applications in Hazmat Sign Detection and Recognition."
12/2014 (GARI) Gang Graffiti Recognition and Analysis
Center for Visual Analytics for Command, Control, and Interoperability Environments
Raechel Anne Bianchetti, LOOKING BACK TO INFORM THE FUTURE: THE ROLE OF COGNITION IN FOREST DISTURBANCE CHARACTERIZATION FROM REMOTE SENSING IMAGERY, The Pennsylvania State University, Department of Geography, PhD, December, 2014.
12/2014 (GeoTxt) E2E: GeoTxt API Center for Visual Analytics for Command, Control, and Interoperability Environments
Ryan S. Mullins, INTERPRETIVE UNCERTAINTY AND THE EVALUATION OF SYMBOLS AND A TAXONOMY OF SYMBOL EVALUATION METHODS AND MOBILE EVALUATION TOOL, The Pennsylvania State University, Department of Geography, MS, December, 2014.
12/2014 (GeoTxt) E2E: GeoTxt API Center for Visual Analytics for Command, Control, and Interoperability Environments
Terrorism Information Analyzer, Antoine Williams-Baisy, 5/2011 VACCINE Affinity Research Groups Center for Visual Analytics for Command, Control, and Interoperability Environments
Using search engine auto suggested data to build a knowledge base for an unsupervised Word Sense Disambiguation system, Adetomiwa Oguntuga,
5/2011 VACCINE Affinity Research Groups Center for Visual Analytics for Command, Control, and Interoperability Environments
Wenwen Dou Understanding the Bi-Directional Relationship Between Analytical Processes and Visualization Systems Computer Science Ph.D. May, 2012
5/2012 Multimedia, Social Media, Text, and Emergency Response Analytics
Center for Visual Analytics for Command, Control, and Interoperability Environments
Todd Eaglin Mobile Situational Awareness for Emergency Response M.S. June, 2013
6/2013 Multimedia, Social Media, Text, and Emergency Response Analytics
Center for Visual Analytics for Command, Control, and Interoperability Environments
Ross Maciejewski, PhD, Purdue, Electrical and Computer Engineering, ECE
(VALET) Developing a spatial statistics framework in the visual analytics for law enforcement technology suite
Center for Visual Analytics for Command, Control, and Interoperability Environments
Tom Auer, Explicitly representing geographic change in map animations with bivariate symbolization, the Pennsylvania State University, Department of Geography, M.S., August 2009
8/2009 MDRP 3: (GeoViz & CrimeViz) Situational Surveillance & In-field Criminal Investigative Analytics
Center for Visual Analytics for Command, Control, and Interoperability Environments
Tom Auer, Explicitly representing geographic change in map animations with bivariate symbolization, the Pennsylvania State University, Department of Geography, M.S., August 2009 http://etda.libraries.psu.edu/theses/approved/WorldWideIndex/ETD-4217/index.html {Auer’s thesis research was not supported by DHS funds directly, but he was supported as a Graduate Assistant working on VACCINE research during his degree program working on MDRP 3 & 12}
8/2009 MDRP 12: Foreign Animal and Zoonotic Disease Visual Analytics
Center for Visual Analytics for Command, Control, and Interoperability Environments
Chen, J. 2010: Exploratory Learning From Space-Attribute Aggregated Data – A Geovisual Analytics Approach. Penn State University Department of Geography, Ph.D., Jan. 2010.
1/2010 MDRP 3: (GeoViz & CrimeViz) Situational Surveillance & In-field Criminal Investigative Analytics
Center for Visual Analytics for Command, Control, and Interoperability Environments
Kevin Ross, SQSynC: Spatial Queries In Synchronous Collaboration, Penn State, Geography, MS, August, 2010
8/2010 MDRP 3: (GeoViz & CrimeViz) Situational Surveillance & In-field Criminal Investigative Analytics
Center for Visual Analytics for Command, Control, and Interoperability Environments
Dong Jeong, Ph.D., Computer Science, “Knowledge Visualization: From Theory to Practice”
MDRP 11: Financial Fraud Visual Analytics Center for Visual Analytics for Command, Control, and Interoperability Environments
Remco Chang, Ph.D., Computer Science, “Thinking Interactively with Visualization
MDRP 11: Financial Fraud Visual Analytics Center for Visual Analytics for Command, Control, and Interoperability Environments
Brian LeBlanc, Information School, Masters Senior Project: Information Sharing in the Seattle Emergency Operations Center
MDRP 7: Introducing Sustainable Visual Analytics into Command Center Environments
Center for Visual Analytics for Command, Control, and Interoperability Environments
Albert Parra Pozo , “An Integrated Mobile System for Gang Graffiti Image Acquisition and Recognition”, Purdue, ECE, M.S., December 2011
12/2011 (MERGE) Mobile Emergency Response Guide
Center for Visual Analytics for Command, Control, and Interoperability Environments
Andrew Wade: Visual Analytics for Aviation Safety: A Collaborative Approach to Sensemaking. SFU School of Interactive Arts and Technology August 22, 2011
8/2011 MDRP 6: Video Surveillance Visual Analytics Center for Visual Analytics for Command, Control, and Interoperability Environments
Sungahn Ko, AIDED DECISION-MAKING THROUGH VISUAL ANALYTICS SYSTEMS FOR LARGE MULTIVARIATE, SPATIOTEMPORAL, HIERARCHICAL AND NETWORK DATA, Purdue University, Electrical and Computer Engineering, PhD, 6 Aug 2013
8/2013 (MERGE) Mobile Emergency Response Guide
Center for Visual Analytics for Command, Control, and Interoperability Environments
Zhicheng Liu, Network-based visual analysis of tabular data, Ph.D. Dissertation, Georgia Institute of Technology, School of Interactive Computing, April 2012.
4/2012 MDRP 1: (Jigsaw) Visual Analytics for Investigative Analysis on Text Documents
Center for Visual Analytics for Command, Control, and Interoperability Environments
Youn-ah Kang, Informing design of visual analytics systems for intelligence analysis: understanding users, user tasks, and tool usage, Ph.D. Dissertation, Georgia Institute of Technology, School of Interactive Computing, July 2012.
7/2012 MDRP 1: (Jigsaw) Visual Analytics for Investigative Analysis on Text Documents
Center for Visual Analytics for Command, Control, and Interoperability Environments
Anuj Rattan Jaiswal, On statistical schema matching with embedded value mappings, The Pennsylvania S tate University, College of Information Sciences and Engineering, Ph.D. in IST, June 7, 2012.
6/2012 (GeoTxt) E2E: GeoTxt API Center for Visual Analytics for Command, Control, and Interoperability Environments

Sujatha Das Gollapalli, Semi-supervised approaches for Identifying and Annotating Researcher Homepages. The Pennsylvania State University, Department of Computer Science, and Enginnering, Ph.D., August 31, 2013.
8/2013 (GeoTxt) E2E: GeoTxt API Center for Visual Analytics for Command, Control, and Interoperability Environments
Anuj Rattan Jaiswal, On statistical schema matching with embedded value mappings, The Pennsylvania S tate University, College of Information Sciences and Engineering, Ph.D. in IST, June 7, 2012.
6/2012 MDRP 13: GeoJunction: Collaborative Visual-Computational Information Foraging and Contextualization to Support Situation Awareness
Center for Visual Analytics for Command, Control, and Interoperability Environments
Sujatha Das Gollapalli, Semi-supervised approaches for Identifying and Annotating Researcher Homepages. The Pennsylvania State University, Department of Computer Science, and Enginnering, Ph.D., August 31, 2013.
8/2013 MDRP 13: GeoJunction: Collaborative Visual-Computational Information Foraging and Contextualization to Support Situation Awareness
Center for Visual Analytics for Command, Control, and Interoperability Environments
Sohaib Ghani (Ph.D. 2013), Advanced Visualization, Navigation, and Interaction in Graphs: Theory, Design, and Evaluation, School of Electrical and Computer Engineering, Purdue University, June 2013
6/2013 MDRP 18: COE-Explorer (Visual Analytics for the DHS Centers of Excellence)
Center for Visual Analytics for Command, Control, and Interoperability Environments
Chen, J. 2010: Exploratory Learning From Space-Attribute Aggregated Data – A Geovisual Analytics Approach. Penn State University Department of Geography, Ph.D., Jan. 2010.
1/2010 Situation Surveillance & In-field Criminal Investigative Analytics; Public Safety Coalition Projects
Center for Visual Analytics for Command, Control, and Interoperability Environments
Kevin Ross, SQSynC: Spatial Queries In Synchronous Collaboration, Penn State, Geography, MS, August, 2010
8/2010 Situation Surveillance & In-field Criminal Investigative Analytics; Public Safety Coalition Projects
Center for Visual Analytics for Command, Control, and Interoperability Environments

Title Program Sponsor Presentation Date Project Presented Paper Type Center of Excellence“Interactive Computational Steering of Large Asynchronous Simulation Pipelines for Societal Infrastructure” Dr. Niklas Elmqvist and Dr. David Ebert. IEEE VIS 2014 conference paper presentation session
IEEE 11/2014 (VASA) – Visual Analytics for Security Applications
Presented Paper Center for Visual Analytics for Command, Control, and Interoperability Environments
“Interactive Computational Steering of Large Asynchronous Simulation Pipelines for Societal Infrastructure” Dr. Niklas Elmqvist and Dr. David Ebert. IEEE VIS 2014 conference paper presentation session
IEEE 11/2014 (VASA) – Visual Analytics for Security Applications
Presented Paper Center for Visual Analytics for Command, Control, and Interoperability Environments
Invited speaker, “Solved Problems in Visualization,” Panel.
IEEE VIS 2015 10/2015 Multimedia, Social Media, Text, and Emergency Response Analytics
Other Center for Visual Analytics for Command, Control, and Interoperability Environments
Presentation at the Indiana State Police InGang training
Indiana State Police
8/2014 (GARI) Gang Graffiti Recognition and Analysis
Power Point Center for Visual Analytics for Command, Control, and Interoperability Environments
GARI Tutorial Training at the Cook County Sheriff Department, Chicago, Il.
Cook Co. Sheriff Dept.
2/2014 (GARI) Gang Graffiti Recognition and Analysis
Power Point Center for Visual Analytics for Command, Control, and Interoperability Environments
Participation in the NIST/FBI Tattoo contest – Tatt-C –report and presentation at NIST June 2015 workshop
NIST/FBI Tattoo Contest
6/2015 (GARI) Gang Graffiti Recognition and Analysis
Power Point Center for Visual Analytics for Command, Control, and Interoperability Environments
Maciejewski, R., “Integrating a Visual Analytics Curriculum Into Your Own Classroom,” Bethune Cookman University, Florida, June 2015.
Bethune-Cookman University
6/2015 WDYTYA: The Uncertainty of Identity
Presented Paper Center for Visual Analytics for Command, Control, and Interoperability Environments
“Visual Analytics for Investigative Analysis and Exploration of Documents and Data”, John Stasko, July 2014, Keynote lecture at Canadian Visual Analytics School (CANVAS) at VIVA Center, Vancouver, B.C.
Canadian Visual Analytics School (CANVAS)
7/2014 MDRP 1: (Jigsaw) Visual Analytics for Investigative Analysis on Text Documents
Power Point Center for Visual Analytics for Command, Control, and Interoperability Environments
“The Value of Visualization for Exploring and Understanding Data”, John Stasko, August 2014, Boeing Data Analytics Community of Excellence, Web forum.
Boeing Data Analytics Community of Excellence
8/2014 MDRP 1: (Jigsaw) Visual Analytics for Investigative Analysis on Text Documents
Power Point Center for Visual Analytics for Command, Control, and Interoperability Environments
“The Value of Visualization for Understanding Data and Making Decisions”, John Stasko, September 2014, Keynote lecture at the IEEE Joint Intelligence & Security Informatics Conference (JISIC 14), The Hague, Netherlands.
IEEE joint Intelligence & Seucrity Informatics Conference (JISIC)
9/2014 MDRP 1: (Jigsaw) Visual Analytics for Investigative Analysis on Text Documents
Power Point Center for Visual Analytics for Command, Control, and Interoperability Environments
“Value-Driven Evaluations of Visualizations”, John Stasko, October 2014, Paper presented at the ACM BELIV ’14 Workshop, Paris, France.
ACM BeLIV '14 Workshop
10/2014 MDRP 1: (Jigsaw) Visual Analytics for Investigative Analysis on Text Documents
Power Point Center for Visual Analytics for Command, Control, and Interoperability Environments
“Data Visualization Principles (Some Things I’ve Le ” , John Stasko, March 2015, Keynote lecture at the Visualizing Biological Data Conference (VIZBI '15), Boston, MA.
Visualizing Biological Data Conference (VIZBI '15)
3/2015 MDRP 1: (Jigsaw) Visual Analytics for Investigative Analysis on Text Documents
Power Point Center for Visual Analytics for Command, Control, and Interoperability Environments
Title: Native Code Development for the iLaw Enforcement App for Students Present: Leonardo Ferreira Date: 6/30 Meeting: Summer Research Symposium Location: Morgan State University
Morgan State University
6/2015 (iLEAPS) iLaw Enforcement Apps Assistance Program for Students
Power Point Center for Visual Analytics for Command, Control, and Interoperability Environments
(presented by Karimzadeh) Wallgrün, J.O., Karimzadeh, M., MacEachren, A.M., Hardisty, F., Pezanowski, S. and Ju, Y. 2014: Construction and First Analysis of a Corpus for the Evaluation and Training of Microblog/Twitter Geoparsers. In Purves, R. and Jones, C., editors, GIR'14: 8th ACM SIGSPATIAL Workshop on Geographic Information Retrieval, Dallas, TX: ACM.
GIR '14: 8th ACM SIGSPATIAL Workshop on Geographic Information Retrieval
11/2014 (GeoTxt) E2E: GeoTxt API Power Point Center for Visual Analytics for Command, Control, and Interoperability Environments
Maciejewski, R., “What’s in a Name? Data Linkage, Demography and Visual Analytics,” EuroVA, June, 2014.
EuroVA 6/2014 WDYTYA: The Uncertainty of Identity
Power Point Center for Visual Analytics for Command, Control, and Interoperability Environments
Maciejewski, R., “Enabling Predictive Analytics Through Visualization,” University of Arizona, January, 2014
University of Arizona
1/2014 WDYTYA: The Uncertainty of Identity
Power Point Center for Visual Analytics for Command, Control, and Interoperability Environments
Maciejewski, R., “Abstracting Attribute Space for Transfer Function Exploration and Design,” IEEE VIS, October, 2013.
IEEE VIS 10/2013 WDYTYA: The Uncertainty of Identity
Power Point Center for Visual Analytics for Command, Control, and Interoperability Environments
Maciejewski, R., “Bristle Maps: A Multivariate Abstraction Technique for Geovisualization,” IEEE VIS, October, 2013.
IEEE VIS 10/2013 WDYTYA: The Uncertainty of Identity
Power Point Center for Visual Analytics for Command, Control, and Interoperability Environments
Lu, Y., “Box Office VAST – VADER,” IEEE VIS, October, 2013.
IEEE VIS 10/2013 WDYTYA: The Uncertainty of Identity
Power Point Center for Visual Analytics for Command, Control, and Interoperability Environments
Maciejewski, R., “Analytical Brushing for Spatiotemporal Analysis,” University College of London, United Kingdom, July, 2013.
University College of London
7/2013 WDYTYA: The Uncertainty of Identity
Power Point Center for Visual Analytics for Command, Control, and Interoperability Environments
Maciejewski, R., “Analytical Brushing for Spatiotemporal Analysis,” City College of London, United Kingdom, July, 2013.
City College of London
7/2013 WDYTYA: The Uncertainty of Identity
Power Point Center for Visual Analytics for Command, Control, and Interoperability Environments
Maciejewski, R., “An Introduction to Concepts in Visual Analytics,” Visual Analytics Summer School at Middlesex University, United Kingdom, July 2013.
Middlesex University
7/2013 WDYTYA: The Uncertainty of Identity
Power Point Center for Visual Analytics for Command, Control, and Interoperability Environments

Combining Computational Analyses and Interactive Visualization for Document Exploration and Sensemaking in Jigsaw, Carsten Görg, Oct. 2014, IEEE VIS Conference, Atlanta, GA.
IEEE VIS Conference
10/2014 MDRP 1: (Jigsaw) Visual Analytics for Investigative Analysis on Text Documents
Power Point Center for Visual Analytics for Command, Control, and Interoperability Environments
The Value of Visualization for Exploring and Understanding Data, John Stasko, April 2014, Invited talk, Exploratory Data Analysis Workshop at SIAM Intl. Conference on Data Mining, Philadelphia, PA.
SIAM Intl. 4/2014 MDRP 1: (Jigsaw) Visual Analytics for Investigative Analysis on Text Documents
Power Point Center for Visual Analytics for Command, Control, and Interoperability Environments
The Value of Visualization…and Why Interaction Matters, John Stasko, June 2014, Capstone Lecture at the 2014 EuroVis Conference, Swansea, Wales.
EuroVis Conference
6/2014 MDRP 1: (Jigsaw) Visual Analytics for Investigative Analysis on Text Documents
Power Point Center for Visual Analytics for Command, Control, and Interoperability Environments
Keynote Address, “Visual Analytics for Competitive Advantage,” EG EuroVA 2013 (June, 2013).
EG EuroVA 6/2013 Multimedia, Social Media, Text, and Emergency Response Analytics
Other Center for Visual Analytics for Command, Control, and Interoperability Environments
Invited Workshop organizer, “Thinking with Visual Information Systems,” Association for Psychological Science Annual Conference (May, 2014)
Association for Psychological Science Annual Conference
5/2014 Multimedia, Social Media, Text, and Emergency Response Analytics
Center for Visual Analytics for Command, Control, and Interoperability Environments
Invited Speaker, “Harnessing Knowledge Tools for Competitive Advantage,” Harnessing the Power of Data Conference (Charlotte, May, 2014).
UNCC 5/2014 Multimedia, Social Media, Text, and Emergency Response Analytics
Other Center for Visual Analytics for Command, Control, and Interoperability Environments
Emergency Pocket Placard: Image Processing of HazMat Placards Using MatLab
3/2009 Hazmat Placards Poster Center for Visual Analytics for Command, Control, and Interoperability Environments
2/22/2010, Jason Allen, “Enhancing Situation Documents with Disaster Related Images,” Overview of Prototype System at Miami-Dade County Department of Emergency Management
Miami-Dade County Dept. of Emergency Management
2/2010 A Data Integration Framework for Enhancing Emergency Response Situation Reports with Multi-Agency, Multi-Partner Multimedia Data; Public Safety Coalition Projects
Power Point Center for Visual Analytics for Command, Control, and Interoperability Environments
3/9/2011, Jason Allen, “Enhancing Situation Documents with Disaster Related Images,” Public Safety Consortium Meeting at Purdue University. 4/11/2011, Jason Allen, “Enhancing Situation Documents with Disaster Related Images,” Evaluation Activity at Miami-Dade County Department of Emergency Management.
Miami-Dade County Dept. of Emergency Management
4/2011 A Data Integration Framework for Enhancing Emergency Response Situation Reports with Multi-Agency, Multi-Partner Multimedia Data; Public Safety Coalition Projects
Power Point Center for Visual Analytics for Command, Control, and Interoperability Environments
Bristle Maps: a Mutlivariate Abstraction Technique for Geovisualization
InfoVis 10/2013 Bristle Maps - A Multivariate Abstraction Technique for Geovisualization
Power Point Center for Visual Analytics for Command, Control, and Interoperability Environments
iOPAR - Operational Performance Assessment Reports
9/2012 iOPAR - Operational Performance Assessment Reports
Poster Center for Visual Analytics for Command, Control, and Interoperability Environments
“Visual Analytics”, John Stasko, National Academies Board on Science, Technology, and Economic Policy, Workshop on Measuring the Impacts of Federal Investments in Research, Session on Emerging Metrics and Models for Assessing Research Impacts, Washington D.C., April 2011
National Academies Board on Science, Technology, and Economic Policy
4/2011 MDRP 1: (Jigsaw) Visual Analytics for Investigative Analysis on Text Documents
Presented Paper Center for Visual Analytics for Command, Control, and Interoperability Environments
William Ribarsky, Invited panel organizer, ―Analytics & Awareness‖, NC Defense Opportunities Workshop (April, 2012).
NC Defense Opportunities Workshop
4/2012 Multimedia, Social Media, Text, and Emergency Response Analytics
Other Center for Visual Analytics for Command, Control, and Interoperability Environments
William Ribarsky, Invited panel organizer, ―The Future of Big Data Analytics,‖ Charlotte Informatics 2012 (May, 2012).
Charlotte Informatics
5/2012 Multimedia, Social Media, Text, and Emergency Response Analytics
Power Point Center for Visual Analytics for Command, Control, and Interoperability Environments
SensePlace was demonstrated at the 2010 Technologies for Critical Incident Preparedness Conference and Exposition in Philadelphia, PA.
2010 Technologies for Critical Incident Preparedness Conference and Exposition
2/2010 MDRP 1: (Jigsaw) Visual Analytics for Investigative Analysis on Text Documents
Other Center for Visual Analytics for Command, Control, and Interoperability Environments
SensePlace was demonstrated at the NATO IST-085 Workshop on Visualizing Networks, University Park, PA, Oct. 7, 2009
NATO IST-085 Workshop on Visualizing Networks
10/2009 MDRP 1: (Jigsaw) Visual Analytics for Investigative Analysis on Text Documents
Other Center for Visual Analytics for Command, Control, and Interoperability Environments
MacEachren, A. M. 2009. Grounding Geovisualization & ESDA Tool Design in Cartographic Theory, Practice, and Empirical Research, invited presentation at Joint Statistical Meeting, Washington, DC, Aug. 4-9, 2009
Joint Statistical Meeting
8/2009 MDRP 1: (Jigsaw) Visual Analytics for Investigative Analysis on Text Documents
Other Center for Visual Analytics for Command, Control, and Interoperability Environments
MacEachren, A.M., Hardisty, F., and Stryker, M. 2009. GeoVISTA Center Exploratory Geovisualization & Visual Analytics Research & Development, invited presentation at NATO IST-085 Workshop on Visualizing Networks, University Park, PA, Oct. 7, 2009.
NATO IST-085 Workshop on Visualizing Networks
10/2009 MDRP 1: (Jigsaw) Visual Analytics for Investigative Analysis on Text Documents
Other Center for Visual Analytics for Command, Control, and Interoperability Environments
MacEachren, A. M. Geovisual Analytics: Supporting visual reasoning with complex information, Annual Meeting of the AAG, April 14-18, 2010 – Washington, DC.
Annual Meeting of the AAG
4/2010 MDRP 1: (Jigsaw) Visual Analytics for Investigative Analysis on Text Documents
Other Center for Visual Analytics for Command, Control, and Interoperability Environments

P. Chen, I. Chen, R. Verma, A. Tran*, “An Undergraduate Data Mining Course Integrated with Research and Industry Projects”, SIGCSE 2010, Poster session, March, 2010.
SIGCSE 2010 3/2010 EP 1: Leadership and Coordination
Poster Center for Visual Analytics for Command, Control, and Interoperability Environments
Chicora Chandler, “Mobile Visual Analytics: Droid vs Iphone”, ADMI/A4RC 2010, Jackson, MS, April 8-11, 2010.
ADMI/A4RC 4/2011 EP 2: MSI Collaboration Poster Center for Visual Analytics for Command, Control, and Interoperability Environments
Jotham Greer, “Mobile Visual Analytics: Translation of Text and Symbols”, ADMI/A4RC 2010, Jackson, MS, April 8-11, 2010.
ADMI/A4RC 4/2011 EP 2: MSI Collaboration Poster Center for Visual Analytics for Command, Control, and Interoperability Environments
One Day Visualization and Data Analysis Workshop Exploring the science of data analysis through interactive maps, charts and graphs
Discovery Learning Research Center - Purdue University
6/2010 EP 3: K-12 Programs Poster Center for Visual Analytics for Command, Control, and Interoperability Environments
Capital Forum Indiana – January 31, 2010 Indianapolis. Capital Forum Indiana is a civic engagement and international education program that focuses on current global issues and U.S Foreign Policy. This program is intended for high school teachers and students across Indiana, and is part of a larger, multi-state initiative of The Choices Program at Brown University.
Capital Forum Indiana
1/2010 EP 3: K-12 Programs Other Center for Visual Analytics for Command, Control, and Interoperability Environments
Hoosier Science Teachers Association Conference – February 3&4, 2010, Indianapolis. VACCINE participated in the Discovery Park booth at the conference.
Hoosier Science Teachers Association
2/2010 EP 3: K-12 Programs Other Center for Visual Analytics for Command, Control, and Interoperability Environments
Indiana Department of Homeland Security Higher Education Consortium Annual Conference – October 14, 2010, Indianapolis. Tim Collins, Marti Burns. General VACCINE and Education presentation.
Indiana Department of Homeland Security
10/2010 EP 3: K-12 Programs Other Center for Visual Analytics for Command, Control, and Interoperability Environments
Regenstrief Center for Healthcare Engineering – Marti Burns, Purdue University. General VACCINE and Education presentation, March 1, 2010
Regenstrief Center for Healthcare Engineering
3/2010 EP 3: K-12 Programs Power Point Center for Visual Analytics for Command, Control, and Interoperability Environments
Discovery Park Engagement Group – Marti Burns, Purdue University. General VACCINE and Education presentation, February 2, 2010.
Discovery Park Engagement Group
2/2010 EP 3: K-12 Programs Power Point Center for Visual Analytics for Command, Control, and Interoperability Environments
Triton Central High School: Marti Burns, Shawn McKay, Karla Combs October 19, 2010. General VACCINE presentation and HS STEM research.
Triton Central High School
10/2010 EP 3: K-12 Programs Other Center for Visual Analytics for Command, Control, and Interoperability Environments
West Lafayette Junior High School: Marti Burns, Bryan Sims November 24, 2010. General VACCINE presentation and HS STEM research.
West Lafayette Junior High School
11/2010 EP 3: K-12 Programs Other Center for Visual Analytics for Command, Control, and Interoperability Environments
FODAVA Annual Meeting, December 2009, “Developing Visual Analytics Applications: Lessons Learned from the Trenches”
FODAVA 12/2009 MDRP 1: (Jigsaw) Visual Analytics for Investigative Analysis on Text Documents
Power Point Center for Visual Analytics for Command, Control, and Interoperability Environments
Emory University, November 2009, "Information Exploration and Analysis through Interactive Visualization“
Emory University 11/2009 MDRP 1: (Jigsaw) Visual Analytics for Investigative Analysis on Text Documents
Power Point Center for Visual Analytics for Command, Control, and Interoperability Environments
VAST '09, October 2009, “Evaluating Visual Analytics Systems for Investigative Analysis: Deriving Design Principles from a Case Study”
VAST 10/2009 MDRP 1: (Jigsaw) Visual Analytics for Investigative Analysis on Text Documents
Power Point Center for Visual Analytics for Command, Control, and Interoperability Environments
M.I.T., September 2009, “Visual Analytics for Investigative Analysis and Exploration of Document Collections”
M.I.T. 9/2009 MDRP 1: (Jigsaw) Visual Analytics for Investigative Analysis on Text Documents
Power Point Center for Visual Analytics for Command, Control, and Interoperability Environments
Ebert, D., Maciejewski, R., "Data Modeling and Exploration Using Visual Analytics," National Defense University, October, 2009.
10/2009 MDRP 3: (GeoViz & CrimeViz) Situational Surveillance & In-field Criminal Investigative Analytics
Center for Visual Analytics for Command, Control, and Interoperability Environments
Ebert, D., Maciejewski, R., "Public Health Data Exploration, Analysis, Modeling, and Prediction Using Visual Analytics," U. S. Department of Health and Human Services, January 2010.
U. S. Department of Health and Human Services
1/2010 MDRP 3: (GeoViz & CrimeViz) Situational Surveillance & In-field Criminal Investigative Analytics
Other Center for Visual Analytics for Command, Control, and Interoperability Environments
CrimeViz was demonstrated at the 2010 Technologies for Critical Incident Preparedness Conference and Exposition in Philadelphia, PA (by Robert Roth)
2010 Technologies for Critical Incident Preparedness Conference and Expositio
MDRP 3: (GeoViz & CrimeViz) Situational Surveillance & In-field Criminal Investigative Analytics
Other Center for Visual Analytics for Command, Control, and Interoperability Environments
Kevin Ross was on invited participant in a panel at the DHS University Summit focused on further development of research that had been presented in winning posters from 2009
DHS University Summit
MDRP 3: (GeoViz & CrimeViz) Situational Surveillance & In-field Criminal Investigative Analytics
Other Center for Visual Analytics for Command, Control, and Interoperability Environments
Hardisty, F. (2009). The GeoViz Toolkit: An easy-to-use approach to ESDA. URISA Public Health, Providence, RI (Invited Plenary Presentation).
URISA Public Health
MDRP 3: (GeoViz & CrimeViz) Situational Surveillance & In-field Criminal Investigative Analytics
Other Center for Visual Analytics for Command, Control, and Interoperability Environments

Hardisty, F. (2009). GeoViz Toolkit Tutorial. Workshop at URISA Public Health. Providence, RI.
URISA Public Health
MDRP 3: (GeoViz & CrimeViz) Situational Surveillance & In-field Criminal Investigative Analytics
Other Center for Visual Analytics for Command, Control, and Interoperability Environments
MacEachren, A. M. 2009. Grounding Geovisualization & ESDA Tool Design in Cartographic Theory, Practice, and Empirical Research, invited presentation at Joint Statistical Meeting, Washington, DC, Aug. 4-9, 2009
Joint Statistical Meeting
8/2009 MDRP 3: (GeoViz & CrimeViz) Situational Surveillance & In-field Criminal Investigative Analytics
Other Center for Visual Analytics for Command, Control, and Interoperability Environments
11 Aug 2009,Gerth,Visualization for Network Cybersecurity, Stanford MediaX Visualizaton Course
Gerth 8/2009 MDRP 5: Cybersecurity Visual Analytics
Power Point Center for Visual Analytics for Command, Control, and Interoperability Environments
25 Aug 2009,Gerth, Stanford Network Cybersecurity, Palantir, Inc., Palo Alto, CA
Gerth 8/2009 MDRP 5: Cybersecurity Visual Analytics
Power Point Center for Visual Analytics for Command, Control, and Interoperability Environments
8 Oct 2009,Cleveland, RBSA for Keystroke Detection, NSA invited lecture, Ft. Meade. MD
NSA 10/2009 MDRP 5: Cybersecurity Visual Analytics
Power Point Center for Visual Analytics for Command, Control, and Interoperability Environments
8 Mar 2010,Gerth, Stanford/PNNL tools, US-CERT/DHS S+T EADB meeting, Arlington, VA
DHS 3/2010 MDRP 5: Cybersecurity Visual Analytics
Power Point Center for Visual Analytics for Command, Control, and Interoperability Environments
8 Mar 2010,Gerth, Isis, US-CERT analyst training, Arlington VA
Gerth 3/2010 MDRP 5: Cybersecurity Visual Analytics
Power Point Center for Visual Analytics for Command, Control, and Interoperability Environments
9 Mar 2010,Gerth, Visualization for Network Cybersecurity, DHS S+T PI meeting, Rosslyn, VA
Gerth 3/2010 MDRP 5: Cybersecurity Visual Analytics
Power Point Center for Visual Analytics for Command, Control, and Interoperability Environments
10 Mar 2010,Gerth,Cybersecurity Analytics, DHS UP Summit, Washington, DC
Gerth 3/2010 MDRP 5: Cybersecurity Visual Analytics
Power Point Center for Visual Analytics for Command, Control, and Interoperability Environments
24 Mar 2010 ,Barthur,CERIAS Information Security Symposium, Purdue Univ., W. Lafayette, IN
Barthur - CERIAS 3/2010 MDRP 5: Cybersecurity Visual Analytics
Center for Visual Analytics for Command, Control, and Interoperability Environments
“Adaptive Development of a Common Operating Environment for Crisis Response and Management,” ISCRAM 2010, Seattle, May 4, 2010.
ISCRAM 5/2010 MDRP 7: Introducing Sustainable Visual Analytics into Command Center Environments
Power Point Center for Visual Analytics for Command, Control, and Interoperability Environments
MacEachren, A. M. 2009. Grounding Geovisualization & ESDA Tool Design in Cartographic Theory, Practice, and Empirical Research, invited presentation at Joint Statistical Meeting, Washington, DC, Aug. 4-9, 2009
Joint Statstical Meeting
8/2009 MDRP 12: Foreign Animal and Zoonotic Disease Visual Analytics
Other Center for Visual Analytics for Command, Control, and Interoperability Environments
Hardisty, F. and A. MacEachren (2009). Research to Reality: Supporting Public Health Research, Surveillance, and Practice with Geovisual Analytics The Third Annual DHS University Network Summit. Washington, D.C.
DHS 3/2009 MDRP 12: Foreign Animal and Zoonotic Disease Visual Analytics
Other Center for Visual Analytics for Command, Control, and Interoperability Environments
Hardisty, F. and A. Klippel (2010). Analysing Spatio-Temporal Autocorrelation with LISTA-Viz. GeoVA(t) - Geospatial Visual Analytics: Focus on Time. Guimarães, Portugal, ICA Commission on GeoVisualization.
ICA Commission 10/2013 MDRP 12: Foreign Animal and Zoonotic Disease Visual Analytics
Power Point Center for Visual Analytics for Command, Control, and Interoperability Environments
Ribarsky, W. Invited speaker, “Exploratory Multimedia Analysis Applied to Video Analytics”, Video Analytics Workshop, IEEE VisWeek 2009 (Atlantic City, NJ).
IEEE 1/2011 MDRP 14: Multimedia Visual Analytics for Investigative Analysis
Center for Visual Analytics for Command, Control, and Interoperability Environments
Ribarsky, W. Distinguished Lecturer, “Developing a Visual Analytics Approach to Analytic Problem-Solving,” School of Computational Science and Engineering, Georgia Tech, February, 2010.
2/2010 MDRP 14: Multimedia Visual Analytics for Investigative Analysis
Center for Visual Analytics for Command, Control, and Interoperability Environments
March 2010, Jean-Daniel Fekete, “Stack Zooming for Multi-Focus Interaction in Time-Series Data Visualization”, IEEE Pacific Visualization Symposium.
IEEE Pacific Visualization Symposium.
3/2010 MDRP 11: Financial Fraud Visual Analytics
Power Point Center for Visual Analytics for Command, Control, and Interoperability Environments
Elmqvist, N. CoE Explorer: Visualizing the DHS Centers of Excellence. Presented at the C2I panel at the U.S. DHS University Network Summit 2010, Washington, D.C. (March 2010).
DHS 3/2010 MDRP 18: COE-Explorer (Visual Analytics for the DHS Centers of Excellence)
Presented Paper Center for Visual Analytics for Command, Control, and Interoperability Environments
NSF III Program Annual Review Meeting, Arlington, VA, April 2010 “Visual Analytics”, John Stasko
NSF 4/2010 MDRP 1: (Jigsaw) Visual Analytics for Investigative Analysis on Text Documents
Power Point Center for Visual Analytics for Command, Control, and Interoperability Environments
AAAS Symposium on Novel Methods for the Evaluation of Federal Research Programs, Washington, D.C., April 2010
AAA 4/2010 MDRP 1: (Jigsaw) Visual Analytics for Investigative Analysis on Text Documents
Power Point Center for Visual Analytics for Command, Control, and Interoperability Environments
Visual Analytics for Exploring and Investigating Research Programs”, John Stasko NSF, Arlington, VA, August 2010
NSF 8/2010 MDRP 1: (Jigsaw) Visual Analytics for Investigative Analysis on Text Documents
Power Point Center for Visual Analytics for Command, Control, and Interoperability Environments
Justice Institute of British Columbia, Vancouver, B.C., September 2010 “Investigative Analysis of Document Collections with Jigsaw”, John Stasko
JIBC 9/2010 MDRP 1: (Jigsaw) Visual Analytics for Investigative Analysis on Text Documents
Power Point Center for Visual Analytics for Command, Control, and Interoperability Environments
SUNY Stony Brook, Computer Science Distinguished Lecture Series, February 2011
SUNY Stony Brook 2/2011 MDRP 1: (Jigsaw) Visual Analytics for Investigative Analysis on Text Documents
Power Point Center for Visual Analytics for Command, Control, and Interoperability Environments

Investigative Reporters and Editors, Computer-Assisted Reporting Conference, Raleigh, NC, February 2011
Investigative Reporters and Editors
2/2011 MDRP 1: (Jigsaw) Visual Analytics for Investigative Analysis on Text Documents
Power Point Center for Visual Analytics for Command, Control, and Interoperability Environments
“Jigsaw”, John Stasko CNN, Atlanta, GA, March 2011 “Investigative Analysis of Document”
CNN 3/2011 MDRP 1: (Jigsaw) Visual Analytics for Investigative Analysis on Text Documents
Power Point Center for Visual Analytics for Command, Control, and Interoperability Environments
UHD Student Research Conference 2011, Specialized Data Analysis, Aggregation & Visualization Tool Packages for R", (Hooman Hemmati, Duber Gomez-Fonseca & Sarah Jennisca)
UHD 12/2011 EP 2: MSI Collaboration Poster Center for Visual Analytics for Command, Control, and Interoperability Environments
Hooman Hemmati, Duber Gomez-Fonseca and Sarah Jennisca; "Visual Analysis of Large-scale Infornation by Aggregation and Numerical Techniques", presented at TeraGrid 2010, Pittsburg, PA 2010
TeraGrid 8/2010 EP 2: MSI Collaboration Poster Center for Visual Analytics for Command, Control, and Interoperability Environments
Hooman Hemmati, Duber Gomez-Fonseca, Sarah Jennisca, Lilian Antunes and Tia Pilaroscia;"Specialized Data Analysis, Aggregation & Visualization Tool Packages for R", CAHSI Annual Meeting, San Juan, PR 2011
CAHSI 10/2011 EP 2: MSI Collaboration Poster Center for Visual Analytics for Command, Control, and Interoperability Environments
Robinson, A.C., Pezanowski, S., Hardisty, F., Roth, R.E., Blanford, J., and A.M. MacEachren. “A Web-Based Symbol Store for Sharing Map Symbology” Presentation at the annual meeting of the North American Cartographic Information Society in St. Petersburg, FL. October 13-15, 2010
North American Cartographic Information Society
10/2010 Symbology Standardization Support
Power Point Center for Visual Analytics for Command, Control, and Interoperability Environments
Robinson, A.C. “Challenges to Standardizing Map Symbology” Presentation at the annual meeting of the Association of American Geographers in Washington, DC. April 14-18, 2010.
Association of American Geographers
4/2010 Symbology Standardization Support
Power Point Center for Visual Analytics for Command, Control, and Interoperability Environments
Bianchetti, R.A., J. Blanford , A. Klippel, A.C. Robinson, and A.M. MacEachren. 2011. Critical Evaluation of International Emergency Management Symbology. The 107th Annual Meeting of the Association of American Geographers. Seattle, WA: April 15, 2011.
American Geographers
4/2011 Symbology Standardization Support
Power Point Center for Visual Analytics for Command, Control, and Interoperability Environments
Guidero E, F Hardisty, RE Roth, A Klippel, AC Robinson, and AM MacEachren. 2011. Representing change using point symbols. The 107th Annual Meeting of the Association of American Geographers. Seattle, WA: April 15, 2011.
American Geographers
4/2011 Symbology Standardization Support
Power Point Center for Visual Analytics for Command, Control, and Interoperability Environments
Pezanowski S, AC Robinson, E Guidero, R Bianchetti, F Hardisty, J Blanford, RE Roth, and AM MacEachren. 2011. An interactive, web-based tool for discovering and sharing map symbols. The 107th Annual Meeting of the Association of American Geographers. Seattle, WA: April 15, 2011
American Geographers
4/2011 Symbology Standardization Support
Power Point Center for Visual Analytics for Command, Control, and Interoperability Environments
4/11/2011, Jason Allen, “Enhancing Situation Documents with Disaster Related Images,” Evaluation Activity at Miami-Dade County Department of Emergency Management.
Miami-Dade County Department of Emergency Management.
4/2011 A Data Integration Framework for Enhancing Emergency Response Situation Reports with Multi-Agency, Multi-Partner Multimedia Data; Public Safety Coalition Projects
Power Point Center for Visual Analytics for Command, Control, and Interoperability Environments
Hardisty, F. 2010a. Interactive Syndromic Surveillance of Influenza Rates using the Geo Viz Toolkit. Analysis, Visualization and Reporting (AVR) Webinar CDC.
MDRP 3: (GeoViz & CrimeViz) Situational Surveillance & In-field Criminal Investigative Analytics
Center for Visual Analytics for Command, Control, and Interoperability Environments
Hardisty, F. 2010b. Open Source Geovisual Analytics. GIS-Pro. Orlando, FL, URISA.
MDRP 3: (GeoViz & CrimeViz) Situational Surveillance & In-field Criminal Investigative Analytics
Center for Visual Analytics for Command, Control, and Interoperability Environments
Hardisty, F. 2010c. Using text analytics with spatial statistics to characterize H1N1 flu outbreaks. The 106th Annual Meeting of the Association of American Geographers. Washington, DC.
MDRP 3: (GeoViz & CrimeViz) Situational Surveillance & In-field Criminal Investigative Analytics
Center for Visual Analytics for Command, Control, and Interoperability Environments
Hardisty, F. and Klippel, A. (2010). Analyzing Spatio-Temporal Autocorrelation with LISTA-Viz. GeoVA(t) – Geospatial Visual Analytics: Focus on Time. Guimarães, Portugal, ICA Commission on GeoVisualization.
MDRP 3: (GeoViz & CrimeViz) Situational Surveillance & In-field Criminal Investigative Analytics
Center for Visual Analytics for Command, Control, and Interoperability Environments
Hardisty, F. (2011). Exploring Geospatial Data with the GeoVizToolkit. North Carolina GIS User’s Group Meeting.
MDRP 3: (GeoViz & CrimeViz) Situational Surveillance & In-field Criminal Investigative Analytics
Center for Visual Analytics for Command, Control, and Interoperability Environments
Hardisty, F. and Kroon, J. (2011). Cloud-Enabled Space-Time Clustering. AAG Annual Meeting. Seattle.
MDRP 3: (GeoViz & CrimeViz) Situational Surveillance & In-field Criminal Investigative Analytics
Center for Visual Analytics for Command, Control, and Interoperability Environments

Hardisty, F., Peuquet, D., Xu, S. and Robinson, A.C. (2011). Methods for Ad-hoc Delineation and Analysis of Categories of Spatio-Temporal Events. COM.Geo. Washington, D.C., ACM Digital Library.
MDRP 3: (GeoViz & CrimeViz) Situational Surveillance & In-field Criminal Investigative Analytics
Center for Visual Analytics for Command, Control, and Interoperability Environments
MacEachren, A.M. Geovisual Analytics: Supporting visual reasoning with complex information, Annual Meeting of the AAG, April 14-18, 2010 – Washington, DC.
MDRP 3: (GeoViz & CrimeViz) Situational Surveillance & In-field Criminal Investigative Analytics
Center for Visual Analytics for Command, Control, and Interoperability Environments
MacEachren, A.M. 2010. Geovisual Analytics for Crisis Management: Moving Beyond GIS. Invited keynote at Information Systems for Crisis Response and Management (ISCRAM) 2010, May 2-5, 2010, Seattle, WA.
MDRP 3: (GeoViz & CrimeViz) Situational Surveillance & In-field Criminal Investigative Analytics
Center for Visual Analytics for Command, Control, and Interoperability Environments
MacEachren, A.M. 2010. Geovisual Analytics for Health, panel presentation at the Visual Analytics Community (VAC) Consortium Conference, Aug. 31 – Sept. 1, 2010, University of Maryland, College Park MD.
MDRP 3: (GeoViz & CrimeViz) Situational Surveillance & In-field Criminal Investigative Analytics
Center for Visual Analytics for Command, Control, and Interoperability Environments
Murdock, M.J., Maziekas N.V., and R.E. Roth. 2011. Geovisual analytics of improvised explosive device incidents. The 107th Annual Meeting of the Association of the Association of American Geographers. Seattle, WA: April 12-16.
MDRP 3: (GeoViz & CrimeViz) Situational Surveillance & In-field Criminal Investigative Analytics
Center for Visual Analytics for Command, Control, and Interoperability Environments
Mitra, P., “Information Extraction for Geospatial Visual Analytics.” University of Houston Downtown, Computer Science Seminar, Houston, 2010.
MDRP 3: (GeoViz & CrimeViz) Situational Surveillance & In-field Criminal Investigative Analytics
Center for Visual Analytics for Command, Control, and Interoperability Environments
Murdock M, B.G. Finch, N. Maziekas, and R.E. Roth 2010. The basic ordinance observational management system: Geovisual analytics of improvised explosive device incidents. The Association of American Geographers, Middle States Division 2010 Meeting. West Point, NY: October 22-23
10/2010 MDRP 3: (GeoViz & CrimeViz) Situational Surveillance & In-field Criminal Investigative Analytics
Center for Visual Analytics for Command, Control, and Interoperability Environments
Roth R.E., KS Ross, W Luo, BJ Finch, and AM MacEachren. 2010. A user-centered approach to extending spatiotemporal crime analysis tools. The 106th Annual Meeting of the Association of American Geographers. Washington, DC: April 15.
4/2010 MDRP 3: (GeoViz & CrimeViz) Situational Surveillance & In-field Criminal Investigative Analytics
Center for Visual Analytics for Command, Control, and Interoperability Environments
Roth R.E. 2010. Geovisual analytics for crime analysis and homeland security VACCINE Consortium Technology Demo Day. West Lafayette, IN: July 14.
7/2010 MDRP 3: (GeoViz & CrimeViz) Situational Surveillance & In-field Criminal Investigative Analytics
Center for Visual Analytics for Command, Control, and Interoperability Environments
Roth R.E. 2011. Useful and usable geovisualization for crime analysis. The Penn State Department of Geography Coffee Hour Colloquium Series. University Park, PA: March 18.
3/2011 MDRP 3: (GeoViz & CrimeViz) Situational Surveillance & In-field Criminal Investigative Analytics
Center for Visual Analytics for Command, Control, and Interoperability Environments
Roth R.E. 2010. Harrisburg Crime Viz: Geovisual analytics for crime analysis. City of Harrisburg Bureau of Polce. Harrisburg, PA: April 27.
4/2011 MDRP 3: (GeoViz & CrimeViz) Situational Surveillance & In-field Criminal Investigative Analytics
Center for Visual Analytics for Command, Control, and Interoperability Environments
KyungTae Kim. WordBridge: Using Composite Tag Clouds in Node-Link Diagrams for Visualizing Content and Relations in Text Corpora. Presented at the Hawaii International Conference on System Sciences (Visual Analytics Minitrack), Kauai, Hawaii, January 2011.
Hawaii International Conference
1/2011 MDRP 18: COE-Explorer (Visual Analytics for the DHS Centers of Excellence)
Power Point Center for Visual Analytics for Command, Control, and Interoperability Environments
Niklas Elmqvist. Dynamic Insets for Context-Aware Graph Navigation. Presented at IEEE EuroVis 2011, Bergen, Norway, June 2011.
IEEE EuroVis 6/2011 MDRP 18: COE-Explorer (Visual Analytics for the DHS Centers of Excellence)
Power Point Center for Visual Analytics for Command, Control, and Interoperability Environments
KyungTae Kim. WordBridge: Using Composite Tag Clouds in Node-Link Diagrams for Visualizing Content and Relations in Text Corpora. Presented at the Hawaii International Conference on System Sciences (Visual Analytics Minitrack), Kauai, Hawaii, January 2011.
Hawaii International Conference
1/2011 MDRP 18: COE-Explorer (Visual Analytics for the DHS Centers of Excellence)
Presented Paper Center for Visual Analytics for Command, Control, and Interoperability Environments
KyungTae Kim. WordBridge: Using Composite Tag Clouds in Node-Link Diagrams for Visualizing Content and Relations in Text Corpora. Presented at the Hawaii International Conference on System Sciences (Visual Analytics Minitrack), Kauai, Hawaii, January 2011
Visual Analytics Minitrack
1/2011 MDRP 18: Visual Analytics for the DHS Centers of Excellence
Presented Paper Center for Visual Analytics for Command, Control, and Interoperability Environments
Niklas Elmqvist. Dynamic Insets for Context-Aware Graph Navigation. Presented at IEEE EuroVis 2011, Bergen, Norway, June 2011. http://www.slideshare.net/NickElm/dynamic-insets-for-contextaware-graph-navigation
IEEE EuroVis 2011 6/2011 MDRP 18: Visual Analytics for the DHS Centers of Excellence
Power Point Center for Visual Analytics for Command, Control, and Interoperability Environments

W. Ribarsky, Invited speaker, “Mobile Application for First Response and Emergency Evacuation in Urban Settings.” ACM Com.Geo 2010 (Washington, DC, June 2010).
ACM 6/2010 Situation Surveillance & In-field Criminal Investigative Analytics; Public Safety Coalition Projects
Power Point Center for Visual Analytics for Command, Control, and Interoperability Environments
W. Ribarsky, Invited presentation, “Financial Visual Analytics,” INFORMS 2010 (Austin, November, 2010).
INFORMS 11/2010 MDRP 11: Financial Fraud Visual Analytics
Power Point Center for Visual Analytics for Command, Control, and Interoperability Environments
W. Ribarsky, Invited Speaker, “A Mixed-Initiative Visual Analytics Approach to Topic Modeling in Research Collections,” AAAS-NSF Workshop on Science Policy (October, 2010).
NSF 10/2010 MDRP 14: Multimedia Visual Analytics for Investigative Analysis
Center for Visual Analytics for Command, Control, and Interoperability Environments
J. Fan. WOCC'10: The 19th Annual Wireless and Optical Communications Conference (WOCC'10), Shanghai, China, 2010. Speech Title: A visual analytics framework for supporting human-centered multimedia computing
19th Annual Wireless and Optical Communications Conference
5/2010 MDRP 14: Multimedia Visual Analytics for Investigative Analysis
Center for Visual Analytics for Command, Control, and Interoperability Environments
J. Fan. ICMR’10: International Workshop on Multimedia Retrieval (ICMR'10), Amsterdam, 2010. Speech Title: Interactive exploration of large-scale image/video collections
ICMR 8/2010 MDRP 14: Multimedia Visual Analytics for Investigative Analysis
Center for Visual Analytics for Command, Control, and Interoperability Environments
J. Fan. SMLCMR’11: Intl. Conf. on Statistical Machine Learning and Cross-Media Retrieval (SMLCMR’11), Hangzhou, 2011. Speech Title: Cross-modal cleaning and exploration of large-scale social images.
5/2011 MDRP 14: Multimedia Visual Analytics for Investigative Analysis
Other Center for Visual Analytics for Command, Control, and Interoperability Environments
W. Ribarsky, Invited Participant, U.S. - German Workshop on Visual Analytics for Security Applications (Berlin, February, 2010)
U.S.-German Workshop on Visual Analytics for Security Applications
2/2010 (VASA) – Visual Analytics for Security Applications
Center for Visual Analytics for Command, Control, and Interoperability Environments
W. Ribarsky, Invited speaker, “Mobile Application for First Response and Emergency Evacuation in Urban Settings.” ACM Com.Geo 2010 (Washington, DC, June 2010
ACM Com. Geo 6/2010 SP 15-Task 3: Event Evacuation Planning; Public Safety Coalition Projects
Center for Visual Analytics for Command, Control, and Interoperability Environments
Military Outload Exercise After Action Review, Puget Sound Port Readiness Committee, October 14, 2010, presented by Prof. Mark Haselkorn.
Puget Sound Port Readiness Committee
10/2010 MDRP 7: Introducing Sustainable Visual Analytics into Command Center Environments
Center for Visual Analytics for Command, Control, and Interoperability Environments
Aligning Border Security Workflow and Decision Making with Supporting Information and Communication Systems, 2011 ISCRAM Conference – Lisbon, Portugal, May 9, 2011, presented by Prof. Mark Haselkorn.
ISCRAM 5/2011 MDRP 7: Introducing Sustainable Visual Analytics into Command Center Environments
Power Point Center for Visual Analytics for Command, Control, and Interoperability Environments
Defining “Fast”: Factors Affecting the Experience of Speed in Humanitarian Logistics, 2011 ISCRAM Conference – Lisbon, Portugal, May 11, 2011, presented by Robin Mays
ISCRAM 5/2011 MDRP 7: Introducing Sustainable Visual Analytics into Command Center Environments
Power Point Center for Visual Analytics for Command, Control, and Interoperability Environments
July 2010, Katherine Vogt, “Co-located Collaboration on a Large, High-Resolution Display,” REU Symposium
REU 7/2010 Co-Located Collaborative Analysis on Large, High-Resolution Displays using Multiple Input Devices; Public Safety Coalition Projects
Poster Center for Visual Analytics for Command, Control, and Interoperability Environments
September 2011, Lauren Bradel, “Co-located Collaborative Sensemaking on a Large High-Resolution Display with Multiple Input Devices,” INTERACT ’11 (Paper presentation)
INTERACT 9/2011 Co-Located Collaborative Analysis on Large, High-Resolution Displays using Multiple Input Devices; Public Safety Coalition Projects
Presented Paper Center for Visual Analytics for Command, Control, and Interoperability Environments
November 2011, Lauren Bradel, “Benefits of Co-located Collaboration on Large, High-Resolution Displays,” Grace Hopper Celebration of Women in Computing
Grace Hopper Celebration of Women in Computing
11/2011 Co-Located Collaborative Analysis on Large, High-Resolution Displays using Multiple Input Devices; Public Safety Coalition Projects
Poster Center for Visual Analytics for Command, Control, and Interoperability Environments
2010 – Timothy Collins, Visual Analytics Law Enforcement Toolkit, IEEE International Conference on Technologies for Homeland Security
11/2010 Visual Analytics Law Enforcement Technology; Public Safety Coalition Projects
Presented Paper Center for Visual Analytics for Command, Control, and Interoperability Environments
January 2011- Ross Maciejewski, Describing Temporal Correlation Spatially in a Visual Analytics Environmnet, Hawaii International Conference System Sciences
Hawaii International Conference System Sciences
1/2011 Visual Analytics Law Enforcement Technology; Public Safety Coalition Projects
Presented Paper Center for Visual Analytics for Command, Control, and Interoperability Environments
March 2011 – Ahmad Razip, A Mobile Visual Analytics System For Crime Data, DHS University Programs Summit
DHS 3/2011 Visual Analytics Law Enforcement Technology; Public Safety Coalition Projects
Poster Center for Visual Analytics for Command, Control, and Interoperability Environments
Abish Malik, Coast Guard Search and Rescue Visual Analytics, DHS University Programs Summit
DHS 3/2011 (CgSARVA) Coast Guard Search and Rescue Visual Analytics
Power Point Center for Visual Analytics for Command, Control, and Interoperability Environments
March 2011 – Shehzad Afzal, Visual Analytics Decision Support Environment for Epidemic Modeling and Response Evaluation, DHS University Programs Summit
DHS 3/2011 Power Point
Visual Analytics for Investigative Analysis and Exploration of Documents and Data”, John Stasko, Dalhousie University, Halifax, Nova Scotia, Canada, November 2011, Dorothy J. Killam Memorial Lecture Series
Dalhousie University
11/2011 MDRP 1: (Jigsaw) Visual Analytics for Investigative Analysis on Text Documents
Power Point Center for Visual Analytics for Command, Control, and Interoperability Environments

Bianchetti, R.A., A.M. MacEachren, A. Klippel, A.C. Robinson, F. Hardisty, J.Blanford, R. Li and J. Yang. (2011) Comparing Cartographic Point Symbol Design with Card Sorting Methods. North American Cartographic Information Society (NACIS) 2011. Madison, WI: October 12-14.
North America Cartographic Information
10/2011 Symbology Standardization Support
Power Point Center for Visual Analytics for Command, Control, and Interoperability Environments
Troedson, S. and A.C. Robinson. (2011) Using Web-Based Tools to Share Symbology: A Case Study with Mapmakers from the California Department of Water Resources. North American Cartographic Information Society (NACIS) 2011. Madison, WI: October 12-14.
North American Cartographic Information Society
10/2011 Symbology Standardization Support
Power Point Center for Visual Analytics for Command, Control, and Interoperability Environments
Luo, W., Yin, P., Hardisty, F., Blanford, J., MacEachren, A.M. (2011). Spatial social network visual analytic tool. The 107th Annual Meeting of the Association of American Geographers. Seattle, WA: April 12-16, 2011.
The 107th Annual Meeting of the Association of American Geographers
4/2011 MDRP 13: GeoJunction: Collaborative Visual-Computational Information Foraging and Contextualization to Support Situation Awareness
Power Point Center for Visual Analytics for Command, Control, and Interoperability Environments
Savelyev, A. Robinson, A.C., MacEachren, A.M. (2012) Analysis of Methods for Representing and Interacting with Qualitative Geographic Information. The 108th Annual Meeting of the Association of American Geographers. New York: Feb 24-28, 2012
The 108th Annual Meeting of the Association of American Geographers
2/2012 MDRP 13: GeoJunction: Collaborative Visual-Computational Information Foraging and Contextualization to Support Situation Awareness
Power Point Center for Visual Analytics for Command, Control, and Interoperability Environments
Luo W, Yin PF, Hardisty F, MacEachren AM. 2012. Understanding How Dynamic Social Interaction Shapes the Space: A Geovisual Analytic Approach The 108th Annual Meeting of the Association of American Geographers. New York: Feb 24-28, 2012.
The 108th Annual Meeting of the Association of American Geographers
2/2012 MDRP 13: GeoJunction: Collaborative Visual-Computational Information Foraging and Contextualization to Support Situation Awareness
Center for Visual Analytics for Command, Control, and Interoperability Environments
MacEachren, A.M. (2011). Geovisual Analytics: Leveraging Geographic Information, invited presentation at Data Science & Epidemiology Workshop, Penn State University, Oct. 6-7.
Pennsylvania State University
10/2012 MDRP 13: GeoJunction: Collaborative Visual-Computational Information Foraging and Contextualization to Support Situation Awareness
Power Point Center for Visual Analytics for Command, Control, and Interoperability Environments
Abish Malik, Coast Guard Search and Rescue Visual Analytics, IEEE Visual Analytics Science and Technology Conference
IEEE Visual Analytics Science and Technology Conference
10/2011 (CgSARVA) Coast Guard Search and Rescue Visual Analytics
Power Point Center for Visual Analytics for Command, Control, and Interoperability Environments
iVALET, Ahmad Razip, 12/13/2012, VACCINE Public Safety Consortium Meeting, Purdue University
VACCINE 12/2012 iVALET - Mobile Visual Analytics Law Enforcement Toolkit
Other Center for Visual Analytics for Command, Control, and Interoperability Environments
Fast Track presentations at the National Fusion Center Training Event in Phoenix, Arizona, April 2-5, 2012 presented by Indiana Intelligence Fusion Center
National Fusion Center - Phoenix, AZ
4/2012 Other
S. Ghani. Perception of Animated Node-Link Diagrams for Dynamic Graphs. IEEE EuroVis 2012, June 7, Vienna, Austria.
IEEE 6/2012 MDRP 18: COE-Explorer (Visual Analytics for the DHS Centers of Excellence)
Presented Paper Center for Visual Analytics for Command, Control, and Interoperability Environments
S. Ghani. MultiNode-Explorer: A Visual Analytics Framework for Generating Web-based Multimodal Graph Visualizations. IEEE EuroVA 2012, June 5, Vienna, Austria.
IEEE 6/2012 MDRP 18: COE-Explorer (Visual Analytics for the DHS Centers of Excellence)
Presented Paper Center for Visual Analytics for Command, Control, and Interoperability Environments
Lauren Bradel, “Co-located Collaborative Sensemaking in Visual Analytics”, Poster presented at Grace Hopper Women in Computing Conference, Nov 2011.
Grace Hopper Women in Computing Conference
11/2011 Co-Located Collaborative Analysis on Large, High-Resolution Displays using Multiple Input Devices; Public Safety Coalition Projects
Poster Center for Visual Analytics for Command, Control, and Interoperability Environments
“The Role of Usability, Workflow, and Patient-Centered Cognitive Support in Improving Health Information Technology,” AMIA 2011, Washington, D.C., October 24, 2011.
AMIA 10/2011 Enhancing Interactive Visual Analysis and Decision Making Environments
Power Point Center for Visual Analytics for Command, Control, and Interoperability Environments
“Introducing the MATH Method and Toolsuite for Evidence-based HIT.” AMA-IEEE Medical Technology Conference,” Boston, October 18, 2011.
AMA-IEEE 10/2011 Enhancing Interactive Visual Analysis and Decision Making Environments
Power Point Center for Visual Analytics for Command, Control, and Interoperability Environments
“Defining 'Fast': Factors Affecting the Experience of Speed in Humanitarian Logistics, ” ISCRAM 2011, Lisbon, Portugal, May 2011.
ISCRAM 5/2011 Enhancing Interactive Visual Analysis and Decision Making Environments
Power Point Center for Visual Analytics for Command, Control, and Interoperability Environments
“Aligning Border Security Workflow and Decision Making with Support Information and Communications Systems,” ISCRAM 2011, Lisbon, Portugal, May 2011.
ISCRAM 5/2011 Enhancing Interactive Visual Analysis and Decision Making Environments
Power Point Center for Visual Analytics for Command, Control, and Interoperability Environments
Ebert, D., "Teaching Visual Analytics: Leveraging Multidisciplinarity," Eurographics 2012 Panel, Cagliari, Italy, May 2012.
Eurographics 5/2012 Cyber Education Power Point Center for Visual Analytics for Command, Control, and Interoperability Environments
Ebert, D., "Visual Analytics: From Situational Awareness to Risk-Based Decision Making," Financial Risk Visual Analytics Workshop, Banff, CA, May 2012.
Financial Risk Visual Analytics Workshop
5/2012 COAST: Coastal Operations and Analysis Suite of Tools
Power Point Center for Visual Analytics for Command, Control, and Interoperability Environments

Ebert, D., "Visual Analytics: Powering Discovery, Innovation, and Decision Making (Much more than Big Data Analytics plus Visualization), Keynote talk, ISCRAM 2012, Information Systems for Crisis Response and Management, Vancouver, BC, April 2012.
ISCRAM 4/2012 COAST: Coastal Operations and Analysis Suite of Tools
Power Point Center for Visual Analytics for Command, Control, and Interoperability Environments
Ebert, D., "Visual Analytics: Powering Discovery, Innovation, and Decision Making (Much more than Big Data Analytics plus Visualization)," Keynote talk, BRAVA 2012, 1st Brazilian Visual Analytics Workshop, Sao Paulo, Brazil, March 2012.
BRAVA 3/2012 COAST: Coastal Operations and Analysis Suite of Tools
Power Point Center for Visual Analytics for Command, Control, and Interoperability Environments
Ebert, D., “Risk-Based Visual Analytics for Maritime Resource Allocation,” 2nd USCG Maritime Risk Symposium, Piscataway, NJ, November 2011.
U.S. Coast Guard 11/2011 COAST: Coastal Operations and Analysis Suite of Tools
Power Point Center for Visual Analytics for Command, Control, and Interoperability Environments
Ebert, D., “Predictive and Proactive Visual Analytics,” US Coast Guard Atlantic Area Command, Portsmouth, VA September 2011.
U.S. Coast Guard 9/2011 COAST: Coastal Operations and Analysis Suite of Tools
Power Point Center for Visual Analytics for Command, Control, and Interoperability Environments
Ebert, D., "Visual Analytics: From Situational Awareness to Risk-Based Decision Making," Financial Risk Visual Analytics Workshop, Banff, CA, May 2012.
Financial Risk Visual Analytics Workshop
5/2012 COAST: Coastal Operations and Analysis Suite of Tools
Power Point Center for Visual Analytics for Command, Control, and Interoperability Environments
Ebert, D., "Visual Analytics: Powering Discovery, Innovation, and Decision Making (Much more than Big Data Analytics plus Visualization), Keynote talk, ISCRAM 2012, Information Systems for Crisis Response and Management, Vancouver, BC, April 2012.
ISCRAM 4/2012 COAST: Coastal Operations and Analysis Suite of Tools
Power Point Center for Visual Analytics for Command, Control, and Interoperability Environments
Ebert, D., "Visual Analytics: Powering Discovery, Innovation, and Decision Making (Much more than Big Data Analytics plus Visualization)," Keynote talk, BRAVA 2012, 1st Brazilian Visual Analytics Workshop, Sao Paulo, Brazil, March 2012.
BRAVA 3/2012 COAST: Coastal Operations and Analysis Suite of Tools
Power Point Center for Visual Analytics for Command, Control, and Interoperability Environments
Ebert, D., “Risk-Based Visual Analytics for Maritime Resource Allocation,” 2nd USCG Maritime Risk Symposium, Piscataway, NJ, November 2011.
U.S. Coast Guard 11/2011 COAST: Coastal Operations and Analysis Suite of Tools
Power Point Center for Visual Analytics for Command, Control, and Interoperability Environments
Ebert, D., “Predictive and Proactive Visual Analytics,” US Coast Guard Atlantic Area Command, Portsmouth, VA September 2011.
U.S. Coast Guard 9/2011 COAST: Coastal Operations and Analysis Suite of Tools
Power Point Center for Visual Analytics for Command, Control, and Interoperability Environments
Ebert, D., "Visual Analytics: Powering Discovery, Innovation, and Decision Making (Much more than Big Data Analytics plus Visualization), Keynote talk, ISCRAM 2012, Information Systems for Crisis Response and Management, Vancouver, BC, April 2012.
ISCRAM 4/2012 (VALET) Developing a spatial statistics framework in the visual analytics for law enforcement technology suite
Power Point Center for Visual Analytics for Command, Control, and Interoperability Environments
Ebert, D., "Visual Analytics: Powering Discovery, Innovation, and Decision Making (Much more than Big Data Analytics plus Visualization)," Keynote talk, BRAVA 2012, 1st Brazilian Visual Analytics Workshop, Sao Paulo, Brazil, March 2012.
BRAVA 3/2012 (VALET) Developing a spatial statistics framework in the visual analytics for law enforcement technology suite
Power Point Center for Visual Analytics for Command, Control, and Interoperability Environments
Ebert, D., "Visualization and Analytics For Geospatial and Temporal Data," Ohio State Highway Patrol, Columbus, OH, March 2012.
Ohio State Patrol 3/2012 (VALET) Developing a spatial statistics framework in the visual analytics for law enforcement technology suite
Power Point Center for Visual Analytics for Command, Control, and Interoperability Environments
Ebert, D., "Visual Analytics for Command Control and Interoperability Environment, U.S. Department of Homeland Security Science and Technology All Hands Meeting, Washington, DC, March 2012.
DHS 3/2012 (VALET) Developing a spatial statistics framework in the visual analytics for law enforcement technology suite
Power Point Center for Visual Analytics for Command, Control, and Interoperability Environments
Ebert, D., “Predictive Visual Analytics for Discovery and Decision Making,” Keynote Talk, Eli Lilly Corporate Research Symposium, Indianapolis, IN, January 2012.
Eli Lilly 1/2012 (VALET) Developing a spatial statistics framework in the visual analytics for law enforcement technology suite
Power Point Center for Visual Analytics for Command, Control, and Interoperability Environments
Ebert, D., “Visual Analytics for Decision Making,” HICSS Tutorial on Visual Analytics, HICSS 2012, Maui, HI, January 2012.
HICSS 1/2012 (VALET) Developing a spatial statistics framework in the visual analytics for law enforcement technology suite
Power Point Center for Visual Analytics for Command, Control, and Interoperability Environments
Ebert, D., “Visual Analytics Applications for Decision Making: From Research to End-User,” Keynote Talk, NSF FODAVA Meeting, Atlanta, GA, December 2011.
FODAVA 12/2011 (VALET) Developing a spatial statistics framework in the visual analytics for law enforcement technology suite
Power Point Center for Visual Analytics for Command, Control, and Interoperability Environments
Ebert, D., “Visual Analytics for Transportation Security,” U.S. Transportation Security Agency Headquarters, Washington, DC, December 2011.
TSA 12/2011 (VALET) Developing a spatial statistics framework in the visual analytics for law enforcement technology suite
Power Point Center for Visual Analytics for Command, Control, and Interoperability Environments
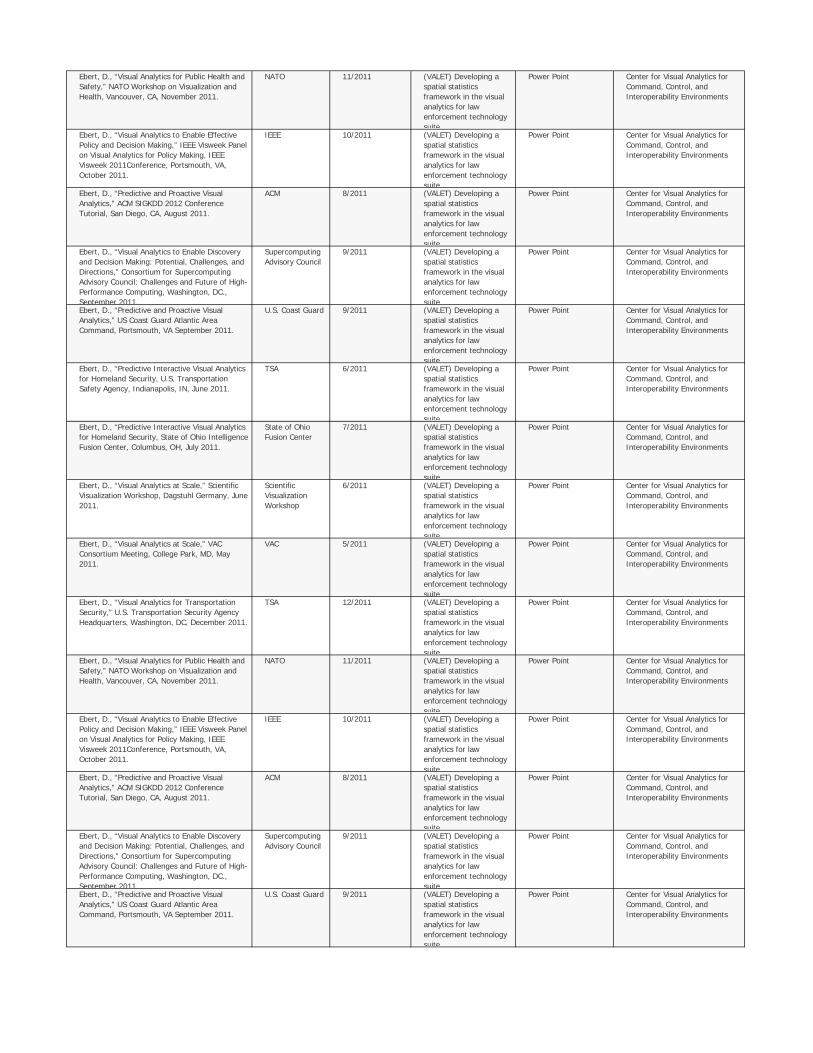
Ebert, D., “Visual Analytics for Public Health and Safety,” NATO Workshop on Visualization and Health, Vancouver, CA, November 2011.
NATO 11/2011 (VALET) Developing a spatial statistics framework in the visual analytics for law enforcement technology suite
Power Point Center for Visual Analytics for Command, Control, and Interoperability Environments
Ebert, D., “Visual Analytics to Enable Effective Policy and Decision Making,” IEEE Visweek Panel on Visual Analytics for Policy Making, IEEE Visweek 2011Conference, Portsmouth, VA, October 2011.
IEEE 10/2011 (VALET) Developing a spatial statistics framework in the visual analytics for law enforcement technology suite
Power Point Center for Visual Analytics for Command, Control, and Interoperability Environments
Ebert, D., “Predictive and Proactive Visual Analytics,” ACM SIGKDD 2012 Conference Tutorial, San Diego, CA, August 2011.
ACM 8/2011 (VALET) Developing a spatial statistics framework in the visual analytics for law enforcement technology suite
Power Point Center for Visual Analytics for Command, Control, and Interoperability Environments
Ebert, D., “Visual Analytics to Enable Discovery and Decision Making: Potential, Challenges, and Directions,” Consortium for Supercomputing Advisory Council: Challenges and Future of High-Performance Computing, Washington, DC., September 2011.
Supercomputing Advisory Council
9/2011 (VALET) Developing a spatial statistics framework in the visual analytics for law enforcement technology suite
Power Point Center for Visual Analytics for Command, Control, and Interoperability Environments
Ebert, D., “Predictive and Proactive Visual Analytics,” US Coast Guard Atlantic Area Command, Portsmouth, VA September 2011.
U.S. Coast Guard 9/2011 (VALET) Developing a spatial statistics framework in the visual analytics for law enforcement technology suite
Power Point Center for Visual Analytics for Command, Control, and Interoperability Environments
Ebert, D., “Predictive Interactive Visual Analytics for Homeland Security, U.S. Transportation Safety Agency, Indianapolis, IN, June 2011.
TSA 6/2011 (VALET) Developing a spatial statistics framework in the visual analytics for law enforcement technology suite
Power Point Center for Visual Analytics for Command, Control, and Interoperability Environments
Ebert, D., “Predictive Interactive Visual Analytics for Homeland Security, State of Ohio Intelligence Fusion Center, Columbus, OH, July 2011.
State of Ohio Fusion Center
7/2011 (VALET) Developing a spatial statistics framework in the visual analytics for law enforcement technology suite
Power Point Center for Visual Analytics for Command, Control, and Interoperability Environments
Ebert, D., “Visual Analytics at Scale,” Scientific Visualization Workshop, Dagstuhl Germany, June 2011.
Scientific Visualization Workshop
6/2011 (VALET) Developing a spatial statistics framework in the visual analytics for law enforcement technology suite
Power Point Center for Visual Analytics for Command, Control, and Interoperability Environments
Ebert, D., “Visual Analytics at Scale,” VAC Consortium Meeting, College Park, MD, May 2011.
VAC 5/2011 (VALET) Developing a spatial statistics framework in the visual analytics for law enforcement technology suite
Power Point Center for Visual Analytics for Command, Control, and Interoperability Environments
Ebert, D., “Visual Analytics for Transportation Security,” U.S. Transportation Security Agency Headquarters, Washington, DC, December 2011.
TSA 12/2011 (VALET) Developing a spatial statistics framework in the visual analytics for law enforcement technology suite
Power Point Center for Visual Analytics for Command, Control, and Interoperability Environments
Ebert, D., “Visual Analytics for Public Health and Safety,” NATO Workshop on Visualization and Health, Vancouver, CA, November 2011.
NATO 11/2011 (VALET) Developing a spatial statistics framework in the visual analytics for law enforcement technology suite
Power Point Center for Visual Analytics for Command, Control, and Interoperability Environments
Ebert, D., “Visual Analytics to Enable Effective Policy and Decision Making,” IEEE Visweek Panel on Visual Analytics for Policy Making, IEEE Visweek 2011Conference, Portsmouth, VA, October 2011.
IEEE 10/2011 (VALET) Developing a spatial statistics framework in the visual analytics for law enforcement technology suite
Power Point Center for Visual Analytics for Command, Control, and Interoperability Environments
Ebert, D., “Predictive and Proactive Visual Analytics,” ACM SIGKDD 2012 Conference Tutorial, San Diego, CA, August 2011.
ACM 8/2011 (VALET) Developing a spatial statistics framework in the visual analytics for law enforcement technology suite
Power Point Center for Visual Analytics for Command, Control, and Interoperability Environments
Ebert, D., “Visual Analytics to Enable Discovery and Decision Making: Potential, Challenges, and Directions,” Consortium for Supercomputing Advisory Council: Challenges and Future of High-Performance Computing, Washington, DC., September 2011.
Supercomputing Advisory Council
9/2011 (VALET) Developing a spatial statistics framework in the visual analytics for law enforcement technology suite
Power Point Center for Visual Analytics for Command, Control, and Interoperability Environments
Ebert, D., “Predictive and Proactive Visual Analytics,” US Coast Guard Atlantic Area Command, Portsmouth, VA September 2011.
U.S. Coast Guard 9/2011 (VALET) Developing a spatial statistics framework in the visual analytics for law enforcement technology suite
Power Point Center for Visual Analytics for Command, Control, and Interoperability Environments

Ebert, D., “Predictive Interactive Visual Analytics for Homeland Security, U.S. Transportation Safety Agency, Indianapolis, IN, June 2011.
TSA 6/2011 (VALET) Developing a spatial statistics framework in the visual analytics for law enforcement technology suite
Power Point Center for Visual Analytics for Command, Control, and Interoperability Environments
Ebert, D., “Predictive Interactive Visual Analytics for Homeland Security, State of Ohio Intelligence Fusion Center, Columbus, OH, July 2011.
State of Ohio Fusion Center
7/2011 (VALET) Developing a spatial statistics framework in the visual analytics for law enforcement technology suite
Power Point Center for Visual Analytics for Command, Control, and Interoperability Environments
Ebert, D., “Visual Analytics at Scale,” Scientific Visualization Workshop, Dagstuhl Germany, June 2011.
Scientific Visualization Workshop
6/2011 (VALET) Developing a spatial statistics framework in the visual analytics for law enforcement technology suite
Power Point Center for Visual Analytics for Command, Control, and Interoperability Environments
Ebert, D., “Visual Analytics at Scale,” VAC Consortium Meeting, College Park, MD, May 2011.
VAC 5/2011 (VALET) Developing a spatial statistics framework in the visual analytics for law enforcement technology suite
Power Point Center for Visual Analytics for Command, Control, and Interoperability Environments
Ebert, D., “Interactive Visual Analytics for Crisis Management,” US/Sweden Visual Analytics for Floods and Pandemics Workshop, Norrkoping, Sweden, April 2011.
US/Sweden 4/2011 LAHVA: Linked Animal-Human Health Visual Analytics
Power Point Center for Visual Analytics for Command, Control, and Interoperability Environments
Ebert, D., “Visual Analytics for Public Health and Safety,” NATO Workshop on Visualization and Health, Vancouver, CA, November 2011.
NATO 11/2011 LAHVA: Linked Animal-Human Health Visual Analytics
Power Point Center for Visual Analytics for Command, Control, and Interoperability Environments
Ebert, D., "Visual Analytics for Command Control and Interoperability Environment, U.S. Department of Homeland Security Science and Technology All Hands Meeting, Washington, DC, March 2012.
DHS 3/2012 (CgSARVA) Coast Guard Search and Rescue Visual Analytics
Power Point Center for Visual Analytics for Command, Control, and Interoperability Environments
Ebert, D., “Visual Analytics for Decision Making,” HICSS Tutorial on Visual Analytics, HICSS 2012, Maui, HI, January 2012.
HICSS 1/2012 (CgSARVA) Coast Guard Search and Rescue Visual Analytics
Power Point Center for Visual Analytics for Command, Control, and Interoperability Environments
Ebert, D., “Visual Analytics Applications for Decision Making: From Research to End-User,” Keynote Talk, NSF FODAVA Meeting, Atlanta, GA, December 2011.
FODAVA 12/2011 (CgSARVA) Coast Guard Search and Rescue Visual Analytics
Power Point Center for Visual Analytics for Command, Control, and Interoperability Environments
Ebert, D., “Visual Analytics for Transportation Security,” U.S. Transportation Security Agency Headquarters, Washington, DC, December 2011.
TSA 12/2011 (CgSARVA) Coast Guard Search and Rescue Visual Analytics
Power Point Center for Visual Analytics for Command, Control, and Interoperability Environments
Ebert, D., “Risk-Based Visual Analytics for Maritime Resource Allocation,” 2nd USCG Maritime Risk Symposium, Piscataway, NJ, November 2011.
U.S. Coast Guard 11/2011 (CgSARVA) Coast Guard Search and Rescue Visual Analytics
Power Point Center for Visual Analytics for Command, Control, and Interoperability Environments
Ebert, D., “Visual Analytics to Enable Discovery and Decision Making: Potential, Challenges, and Directions,” Consortium for Supercomputing Advisory Council: Challenges and Future of High-Performance Computing, Washington, DC., September 2011.
Consortium for Supercomputing
9/2011 (CgSARVA) Coast Guard Search and Rescue Visual Analytics
Power Point Center for Visual Analytics for Command, Control, and Interoperability Environments
Ebert, D., “Predictive and Proactive Visual Analytics,” US Coast Guard Atlantic Area Command, Portsmouth, VA September 2011.
U.S. Coast Guard 9/2011 (CgSARVA) Coast Guard Search and Rescue Visual Analytics
Power Point Center for Visual Analytics for Command, Control, and Interoperability Environments
Ebert, D., “Predictive and Proactive Visual Analytics,” ACM SIGKDD 2012 Conference Tutorial, San Diego, CA, August 2011.
ACM 8/2011 (CgSARVA) Coast Guard Search and Rescue Visual Analytics
Power Point Center for Visual Analytics for Command, Control, and Interoperability Environments
Ebert, D., “Predictive Interactive Visual Analytics for Homeland Security, U.S. Transportation Safety Agency, Indianapolis, IN, June 2011.
TSA 6/2011 (CgSARVA) Coast Guard Search and Rescue Visual Analytics
Power Point Center for Visual Analytics for Command, Control, and Interoperability Environments
Ebert, D., “Visual Analytics at Scale,” Scientific Visualization Workshop, Dagstuhl Germany, June 2011.
Science Visualization Workshop
6/2011 (CgSARVA) Coast Guard Search and Rescue Visual Analytics
Power Point Center for Visual Analytics for Command, Control, and Interoperability Environments
Ebert, D., “Visual Analytics at Scale,” VAC Consortium Meeting, College Park, MD, May 2011.
VAC 5/2011 (CgSARVA) Coast Guard Search and Rescue Visual Analytics
Presented Paper Center for Visual Analytics for Command, Control, and Interoperability Environments
Ebert, D., “Predictive Interactive Visual Analytics for Homeland Security, State of Ohio Intelligence Fusion Center, Columbus, OH, July 2011.
State of Ohio Fusion Center
7/2011 iVALET - Mobile Visual Analytics Law Enforcement Toolkit
Power Point Center for Visual Analytics for Command, Control, and Interoperability Environments
Ebert, D., “Visual Analytics for Decision Making,” HICSS Tutorial on Visual Analytics, HICSS 2012, Maui, HI, January 2012.
HICSS 1/2012 iVALET - Mobile Visual Analytics Law Enforcement Toolkit
Power Point Center for Visual Analytics for Command, Control, and Interoperability Environments
Ebert, D., “Visual Analytics Applications for Decision Making: From Research to End-User,” Keynote Talk, NSF FODAVA Meeting, Atlanta, GA, December 2011.
FODAVA 12/2011 iVALET - Mobile Visual Analytics Law Enforcement Toolkit
Power Point Center for Visual Analytics for Command, Control, and Interoperability Environments
Ebert, D., "Visual Analytics for Command Control and Interoperability Environment, U.S. Department of Homeland Security Science and Technology All Hands Meeting, Washington, DC, March 2012.
DHS 3/2012 iVALET - Mobile Visual Analytics Law Enforcement Toolkit
Power Point Center for Visual Analytics for Command, Control, and Interoperability Environments

Ebert, D., "Visual Analytics for Command Control and Interoperability Environment, U.S. Department of Homeland Security Science and Technology All Hands Meeting, Washington, DC, March 2012.
DHS 3/2012 Coast Guard PROTECT Visualization
Power Point Center for Visual Analytics for Command, Control, and Interoperability Environments
Ebert, D., “Predictive and Proactive Visual Analytics,” US Coast Guard Atlantic Area Command, Portsmouth, VA September 2011.
U.S. Coast Guard 9/2011 Coast Guard PROTECT Visualization
Power Point Center for Visual Analytics for Command, Control, and Interoperability Environments
Ebert, D., "Visual Analytics for Command Control and Interoperability Environment, U.S. Department of Homeland Security Science and Technology All Hands Meeting, Washington, DC, March 2012.
DHS 3/2012 Coast Guard Swimmer Deaths
Power Point Center for Visual Analytics for Command, Control, and Interoperability Environments
Ebert, D., “Visual Analytics Applications for Decision Making: From Research to End-User,” Keynote Talk, NSF FODAVA Meeting, Atlanta, GA, December 2011.
FODAVA 12/2011 Coast Guard Swimmer Deaths
Power Point Center for Visual Analytics for Command, Control, and Interoperability Environments
Ebert, D., “Risk-Based Visual Analytics for Maritime Resource Allocation,” 2nd USCG Maritime Risk Symposium, Piscataway, NJ, November 2011.
U.S. Coast Guard 11/2011 Coast Guard Swimmer Deaths
Power Point Center for Visual Analytics for Command, Control, and Interoperability Environments
Ebert, D., “Predictive and Proactive Visual Analytics,” US Coast Guard Atlantic Area Command, Portsmouth, VA September 2011.
U.S. Coast Guard 9/2011 Coast Guard Swimmer Deaths
Power Point Center for Visual Analytics for Command, Control, and Interoperability Environments
The Value of Visualization for Exploring and Understanding Data, John Stasko, Nov. 2013, Distinguished Lecture Series , Univ. of Arizona Computer Science Dept., Tucson, AZ.
U of Arizona 11/2013 MDRP 1: (Jigsaw) Visual Analytics for Investigative Analysis on Text Documents
Power Point Center for Visual Analytics for Command, Control, and Interoperability Environments
Hardisty, Frank, and Alexander Savelyev. 2013. “Coordinating Views within Interactive Web Geovisualization.” In 26th International Cartographic Conference. Dresden, Germany.
ICC 8/2013 (GeoTxt) E2E: GeoTxt API Power Point Center for Visual Analytics for Command, Control, and Interoperability Environments
Karimzadeh, M. (2014). Geospatial Cyberinfrastructure to Support Sustained Polar and Environmental Sciences. The 110th Annual Meeting of the Association of American Geographers. Tampa: April 8-12, 2014. http://meridian.aag.org/callforpapers/program/AbstractDetail cfm?AbstractID=60308
AAG 4/2014 (GeoTxt) E2E: GeoTxt API Power Point Center for Visual Analytics for Command, Control, and Interoperability Environments
MacEachren, AM (2013) Moving forward: Reasoning about movement and other things dynamic. Keynote address at the European Cooperation in Science and Technology MOVE conference, Vienna, Austria, October 1, 2013.
European Cooperation in Science and Technology MOVE
10/2013 (GeoTxt) E2E: GeoTxt API Power Point Center for Visual Analytics for Command, Control, and Interoperability Environments
MacEachren, Alan M. (2013) Geo-Visual Analytics & ‘Big’ Data: Leveraging Geo-Information in Unstructured Data, Dept. of Geography Coffee Hour, Penn State, Dec. 6, 2013
Penn State University
12/2013 (GeoTxt) E2E: GeoTxt API Power Point Center for Visual Analytics for Command, Control, and Interoperability Environments
Mullins R., Hardisty F., Pezanowski S., Sujatha Das, Savelyev A., MacEachren AM, Mitra P., Jaiswal A. (2013) Designing a Web Service to Geo-Locate Subjects of Volunteered, Textual Geographic Information. August 29th 2013, International Cartographic Conference, Dresden, Germany
8/2013 (GeoTxt) E2E: GeoTxt API Presented Paper Center for Visual Analytics for Command, Control, and Interoperability Environments
Hulsey, S. (2013) Symbol Sharing Tools for Cartographers at NASA. North American Cartographic Information Society (NACIS) annual meeting 2013, Greenville, SC, October 9-11, 2013.
NACIS 10/2013 Symbology Map Transition
Power Point Center for Visual Analytics for Command, Control, and Interoperability Environments
Mullins, R. (2013) Questions Facing Map Design in the Age of Mobility and Siri. North American Cartographic Information Society (NACIS) annual meeting 2013, Greenville, SC, October 9-11, 2013.
NACIS 10/2013 Symbology Map Transition
Power Point Center for Visual Analytics for Command, Control, and Interoperability Environments
Title: iLEAPS Presenters: Benjamin Hall, Nathan Scott, Kendric Squire, Alfred Shoetan, Vladimir Celestin Date: February 28, 2013 Meeting: Morgan Innovation Day 2013 Location: Annapolis, Maryland
Morgan Innovation Day
2/2013 (iLEAPS) iLaw Enforcement Apps Assistance Program for Students
Power Point Center for Visual Analytics for Command, Control, and Interoperability Environments
Title: iLEAPS Radio Interview Interviewees: Dr. Kofi Nyarko, Benjamin Hall Date: March 19, 2013 Station: WEAA 88.9 FM Location: Baltimore, MD
WEAA 88.9fm 3/2013 (iLEAPS) iLaw Enforcement Apps Assistance Program for Students
Other Center for Visual Analytics for Command, Control, and Interoperability Environments
Presentation 1: Survey, problem statement and technical plan. 11 January 2013 (presenter: Min Chen)
1/2013 UKVAC II Center for Visual Analytics for Command, Control, and Interoperability Environments
Presentation 2: Formulation of the QCAT technique. 31 May 2013 (presenter: Min Chen)
5/2013 UKVAC II Center for Visual Analytics for Command, Control, and Interoperability Environments
Presentation 3: Implementation of the QCAT technique. 6 September 2013 (Presenter: Simon Walton)
9/2013 UKVAC II Center for Visual Analytics for Command, Control, and Interoperability Environments
Presentation 4a: Overview. 13 December 2013 (Presenter: Min Chen)
12/2013 UKVAC II Center for Visual Analytics for Command, Control, and Interoperability Environments
Presentation 4b: Technical Report. 13 December 2013 (Presenter: Simon Walton)
12/2013 UKVAC II Center for Visual Analytics for Command, Control, and Interoperability Environments

Maciejewski, R., “Applied Visual Analytics for Exploring the National Health and Nutrition Examination Survey,” School of Nutrition and Health Promotion, Arizona State University, January, 2013.
Arizona State University
1/2013 (VALET) Developing a spatial statistics framework in the visual analytics for law enforcement technology suite
Power Point Center for Visual Analytics for Command, Control, and Interoperability Environments
Maciejewski, R., “Analytical Brushing for Spatiotemporal Analysis,” Computer Graphics and Visualization Summit, King Abdullah University of Science and Technology (KAUST), Saudi Arabia, April, 2013
KAUST 4/2013 (VALET) Developing a spatial statistics framework in the visual analytics for law enforcement technology suite
Power Point Center for Visual Analytics for Command, Control, and Interoperability Environments
The Value of Visualization for Exploring and Understanding Data, John Stasko, Feb. 2013, Distinguished Seminar Series , Purdue University Industrial Engineering Dept. , West Lafayette, IN.
Purdue University 2/2013 MDRP 1: (Jigsaw) Visual Analytics for Investigative Analysis on Text Documents
Power Point Center for Visual Analytics for Command, Control, and Interoperability Environments
The Value of Visualization for Exploring and Understanding Data, John Stasko, May 2013, Keynote Lecture, Graphics Interface Conference, Regina, Saskatchewan, Canada
GIC 5/2013 MDRP 1: (Jigsaw) Visual Analytics for Investigative Analysis on Text Documents
Power Point Center for Visual Analytics for Command, Control, and Interoperability Environments
Examining the Use of a Visual Analytics System for Sensemaking Tasks: Case Studies with Domain Experts, Youn-ah Kang, Oct. 2012, IEEE VAST Conference, Seattle, WA.
IEEE VAST 10/2012 MDRP 1: (Jigsaw) Visual Analytics for Investigative Analysis on Text Documents
Power Point Center for Visual Analytics for Command, Control, and Interoperability Environments
Roth, R.E. and MacEachren, A.M. (2013) Design and Use Guidelines for Interactive Maps: A Case Study, The 109th Annual Meeting of the Association of American Geographers. Los Angeles: April 9-13, 2013
4/2013 MDRP 3: (GeoViz & CrimeViz) Situational Surveillance & In-field Criminal Investigative Analytics
Power Point Center for Visual Analytics for Command, Control, and Interoperability Environments
Roth, R.E. (2013) The New Cartography: Current states of science & technology in interactive cartography & geovisualization, Workshop on Advances in Geospatial Technologies and National/Homeland Security Implications, Argonne National laboratory, May 21-22, 2013.
Argonne National Laboratory
5/2013 MDRP 3: (GeoViz & CrimeViz) Situational Surveillance & In-field Criminal Investigative Analytics
Power Point Center for Visual Analytics for Command, Control, and Interoperability Environments
Frank Hardisty, Visualizing Spatial, Temporal, and Social Graph Phenomena with the GeoViz Toolkit, May 23rd 2013, FOSS4G-NA, Minneapolis, MN.
FOSS4G-NA 5/2013 (GeoTxt) E2E: GeoTxt API Power Point Center for Visual Analytics for Command, Control, and Interoperability Environments
Morteza Karimzadeh, GeoTxt: Current Status, Progress Report, Future Directions, June 6, 2013, PSU Site Visit by US Army Corps of Engineers, GeoVISTA Center, Penn State.
U.S. Army Corps of Engineers
6/2013 (GeoTxt) E2E: GeoTxt API Power Point Center for Visual Analytics for Command, Control, and Interoperability Environments
Bianchetti, R.A., Roth, R.E., Blanford, J., Robinson, A., MacEachren, A. Defining the Typical Department of Homeland Security Map. North American Cartographic Information Society Annual Meeting, Portland, OR: October 15-17, 2012.
North American Cartographic Information Society
10/2012 Symbology Standardization Support
Power Point Center for Visual Analytics for Command, Control, and Interoperability Environments
Mullins R, Pezanowski S, Robinson AC, MacEachren AM (2013). The SymbolStore: A Social Forum for the Creation, Sharing, and Evaluation of Symbols. The 109th Annual Meeting of the Association of American Geographers. Los Angeles: April 9-13, 2013.
AAG 4/2013 Symbology Standardization Support
Power Point Center for Visual Analytics for Command, Control, and Interoperability Environments
Robinson, A., Pezanowski, S., Bianchetti, R.A., Guidero, E., Stevens, J., Blanford, J., MacEachren, A. Sharing Map Symbology for Emergency Management. GeoCart’2012, New Zealand, August 2012.
GeoCart 8/2012 Symbology Standardization Support
Power Point Center for Visual Analytics for Command, Control, and Interoperability Environments
Robinson AC, Pezanowski S, Bianchetti R, Stevens JE, Guidero E, Blanford J and MacEachren AM. SymbolStore.org–An Open Resource for Map Symbols North American Cartographic Information Society Annual Meeting, Portland, OR: October 15-17, 2012
NACIS 10/2012 Symbology Standardization Support
Power Point Center for Visual Analytics for Command, Control, and Interoperability Environments

Stevens JE, Pezanowski S, Guidero E, Robinson AC and MacEachren AM. (2012) Map Symbol Design and Event Reporting for Mobile Devices: A Preview of a Mobile Application and Developer API Based on an Online Symbol Repository. North American Cartographic Information Society Annual Meeting, Portland, OR: Oct. 15-17, 2012.
NACIS 10/2012 Symbology Standardization Support
Power Point Center for Visual Analytics for Command, Control, and Interoperability Environments
Bianchetti, R.A., Roth, R.E., Blanford, J., Robinson, A., MacEachren, A. Defining the Typical Department of Homeland Security Map. North American Cartographic Information Society Annual Meeting, Portland, OR: October 15-17, 2012.
North American Cartographic Information Society
10/2012 Symbology Standardization Support
Power Point Center for Visual Analytics for Command, Control, and Interoperability Environments
Mullins R, Pezanowski S, Robinson AC, MacEachren AM (2013). The SymbolStore: A Social Forum for the Creation, Sharing, and Evaluation of Symbols. The 109th Annual Meeting of the Association of American Geographers. Los Angeles: April 9-13, 2013.
AAG 4/2013 Symbology Standardization Support
Power Point Center for Visual Analytics for Command, Control, and Interoperability Environments
Robinson, A., Pezanowski, S., Bianchetti, R.A., Guidero, E., Stevens, J., Blanford, J., MacEachren, A. Sharing Map Symbology for Emergency Management. GeoCart’2012, New Zealand, August 2012.
GeoCart 8/2012 Symbology Standardization Support
Power Point Center for Visual Analytics for Command, Control, and Interoperability Environments
Robinson AC, Pezanowski S, Bianchetti R, Stevens JE, Guidero E, Blanford J and MacEachren AM. SymbolStore.org–An Open Resource for Map Symbols North American Cartographic Information Society Annual Meeting, Portland, OR: October 15-17, 2012
NACIS 10/2012 Symbology Standardization Support
Power Point Center for Visual Analytics for Command, Control, and Interoperability Environments
Stevens JE, Pezanowski S, Guidero E, Robinson AC and MacEachren AM. (2012) Map Symbol Design and Event Reporting for Mobile Devices: A Preview of a Mobile Application and Developer API Based on an Online Symbol Repository. North American Cartographic Information Society Annual Meeting, Portland, OR: Oct. 15-17, 2012.
NACIS 10/2012 Symbology Standardization Support
Power Point Center for Visual Analytics for Command, Control, and Interoperability Environments
Luo W, Yin PF, Hardisty F, MacEachren AM. (2012). Understanding How Dynamic Social Interaction Shapes the Space: A Geovisual Analytic Approach. The 108th Annual Meeting of the Association of American Geographers. New York: Feb 24-28, 2012.
AAG 2/2012 MDRP 13: (SensePlace 2) Collaborative Visual-Computational Information Foraging and Contextualization to Support Situation Awareness
Power Point Center for Visual Analytics for Command, Control, and Interoperability Environments
Luo, W. (2012) Geo-Social Visual Analytics with Applications to Catastrophic Risk Management. Invited Speaker at the Global Catastrophic Risk Institute. October 25, 2012
Global Catastrophic Risk Institute
10/2012 MDRP 13: (SensePlace 2) Collaborative Visual-Computational Information Foraging and Contextualization to Support Situation Awareness
Power Point Center for Visual Analytics for Command, Control, and Interoperability Environments
MacEachren, Alan M. (2012) Geovisualization to Geovisual Analytics: Visual Reasoning with Big & Messy Data GI Forum, Invited Keynote at Salzburg, Austria, July 5, 2012.
7/2012 MDRP 13: (SensePlace 2) Collaborative Visual-Computational Information Foraging and Contextualization to Support Situation Awareness
Power Point Center for Visual Analytics for Command, Control, and Interoperability Environments
MacEachren, AM (2013) Visualizing Uncertainty and Decision-Making. Invited Speaker, Workshop on Uncertainty in Decision Making in a Changing Climate, University of Zurich, March 21, 2013
University of Zurich
3/2013 MDRP 13: (SensePlace 2) Collaborative Visual-Computational Information Foraging and Contextualization to Support Situation Awareness
Power Point Center for Visual Analytics for Command, Control, and Interoperability Environments
Frank Hardisty, Visualizing Spatial, Temporal, and Social Graph Phenomena with the GeoViz Toolkit, May 23rd 2013, FOSS4G-NA, Minneapolis, MN
FOSS4G-NA 5/2013 MDRP 13: (SensePlace 2) Collaborative Visual-Computational Information Foraging and Contextualization to Support Situation Awareness
Power Point Center for Visual Analytics for Command, Control, and Interoperability Environments
Luo W, Yin PF, Hardisty F, MacEachren AM. (2012). Understanding How Dynamic Social Interaction Shapes the Space: A Geovisual Analytic Approach. The 108th Annual Meeting of the Association of American Geographers. New York: Feb 24-28, 2012.
AAG 2/2012 MDRP 13: (SensePlace 2) Collaborative Visual-Computational Information Foraging and Contextualization to Support Situation Awareness
Power Point Center for Visual Analytics for Command, Control, and Interoperability Environments
Luo, W. (2012) Geo-Social Visual Analytics with Applications to Catastrophic Risk Management. Invited Speaker at the Global Catastrophic Risk Institute. October 25, 2012
Global Catastrophic Risk Institute
10/2012 MDRP 13: (SensePlace 2) Collaborative Visual-Computational Information Foraging and Contextualization to Support Situation Awareness
Power Point Center for Visual Analytics for Command, Control, and Interoperability Environments

MacEachren, Alan M. (2012) Geovisualization to Geovisual Analytics: Visual Reasoning with Big & Messy Data GI Forum, Invited Keynote at Salzburg, Austria, July 5, 2012.
7/2012 MDRP 13: (SensePlace 2) Collaborative Visual-Computational Information Foraging and Contextualization to Support Situation Awareness
Power Point Center for Visual Analytics for Command, Control, and Interoperability Environments
MacEachren, AM (2013) Visualizing Uncertainty and Decision-Making. Invited Speaker, Workshop on Uncertainty in Decision Making in a Changing Climate, University of Zurich, March 21, 2013
University of Zurich
3/2013 MDRP 13: (SensePlace 2) Collaborative Visual-Computational Information Foraging and Contextualization to Support Situation Awareness
Power Point Center for Visual Analytics for Command, Control, and Interoperability Environments
Frank Hardisty, Visualizing Spatial, Temporal, and Social Graph Phenomena with the GeoViz Toolkit, May 23rd 2013, FOSS4G-NA, Minneapolis, MN
FOSS4G-NA 5/2013 MDRP 13: (SensePlace 2) Collaborative Visual-Computational Information Foraging and Contextualization to Support Situation Awareness
Power Point Center for Visual Analytics for Command, Control, and Interoperability Environments
Fisher, B (2012) Visual Analytics as a Cognitive Science. Dagstuhl Seminar No. 12081 on Information Visualization, Visual Data Mining and Machine Learning.
Dagstuhl 2/2012 MDRP 6: Video Surveillance Visual Analytics
Power Point Center for Visual Analytics for Command, Control, and Interoperability Environments
Fisher, B (2012) Opportunities in Data Visualization and Visual Analytics for Behavioral and Social Science Research. National Institutes of Health (NIH) Office of Behavioral and Social Science Research (OBSSR), National Cancer Institute, and National Institute of Drug Abuse. Bethesda, MD. (video online at http://videocast.nih.gov/summary.asp?Live=10949 )
OBSSR 1/2012 MDRP 6: Video Surveillance Visual Analytics
Power Point Center for Visual Analytics for Command, Control, and Interoperability Environments
William Ribarsky, Keynote Speaker, “Analytics and the Textual World,” Workshop on Interactive Visual Text Analytics, IEEE VisWeek 2012 (October, 2012).
IEEE 10/2012 Multimedia, Social Media, Text, and Emergency Response Analytics
Presented Paper Center for Visual Analytics for Command, Control, and Interoperability Environments
William Ribarsky, Invited Speaker, “Texts and Big Data Analytics,” Clemson University (November, 2012)
Clemson University
11/2012 Multimedia, Social Media, Text, and Emergency Response Analytics
Power Point Center for Visual Analytics for Command, Control, and Interoperability Environments
William Ribarsky, Invited Speaker, “Social Media Analysis as Social History,” University of Indiana (April, 2013)
4/2013 Multimedia, Social Media, Text, and Emergency Response Analytics
Center for Visual Analytics for Command, Control, and Interoperability Environments
VADER/VIS VAST 2015 Grand Challenge Entry VAST 10/2015 Geographic Network Analytics Correlations for VALET
Power Point Center for Visual Analytics for Command, Control, and Interoperability Environments
Visualizing the Impact of Geographical Variations on Multivariate Clustering
EuroVis 6/2016 Geographic Network Analytics Correlations for VALET
Power Point Center for Visual Analytics for Command, Control, and Interoperability Environments
"The Value of Visualization for Exploring and Understanding Data”, John Stasko, October 2015, Invited lecture at Emory University, Atlanta, GA.
Emory University 10/2015 MDRP 1: (Jigsaw) Visual Analytics for Investigative Analysis on Text Documents
Power Point Center for Visual Analytics for Command, Control, and Interoperability Environments
“The Value of Visualization for Exploring and Understanding Data”, John Stasko, November 2015, Invited lecture at Lehigh University, Bethlehem, PA.
Lehigh University 11/2015 MDRP 1: (Jigsaw) Visual Analytics for Investigative Analysis on Text Documents
Power Point Center for Visual Analytics for Command, Control, and Interoperability Environments
“New Approaches for Information Visualization: Rethinking Existing Notions”, John Stasko, Jaunary 2016, Invited lecture at Oak Ridge National Lab, Oak Ridge, TN.
Oak Ridge National Lab
1/2016 MDRP 1: (Jigsaw) Visual Analytics for Investigative Analysis on Text Documents
Power Point Center for Visual Analytics for Command, Control, and Interoperability Environments
“Introduction to Visual Analytics”, Alex Endert, March 2016, Presented at Visual Analytics Spring School at Middlesex University, London, UK.
Middlesex University
3/2016 MDRP 1: (Jigsaw) Visual Analytics for Investigative Analysis on Text Documents
Power Point Center for Visual Analytics for Command, Control, and Interoperability Environments
“Putting User Interaction First: The Importance of User Interaction for Visual Analytics”, Alex Endert, April 2016, Invited lecture at Oak Ridge National Laboratory, Oak Ridge, TN.
Oak Ridge National Laboratory
4/2016 MDRP 1: (Jigsaw) Visual Analytics for Investigative Analysis on Text Documents
Power Point Center for Visual Analytics for Command, Control, and Interoperability Environments
“The Value of Visualization for Exploring and Understanding Data”, John Stasko, April 2016, Invited lecture at Bentley University, Waltham, MA.
Bentley University 4/2016 MDRP 1: (Jigsaw) Visual Analytics for Investigative Analysis on Text Documents
Power Point Center for Visual Analytics for Command, Control, and Interoperability Environments
The Value of Visualization for Exploring, Presenting, and Understanding Data”, John Stasko, May 2016, Invited lecture at Nokia Corp., San Jose, CA.
Nokia Corp. 5/2016 MDRP 1: (Jigsaw) Visual Analytics for Investigative Analysis on Text Documents
Power Point Center for Visual Analytics for Command, Control, and Interoperability Environments
City of Chicago Long-Term Evolution (LTE) Broadband Pilot
IACP 10/2015 Chicago LTE Project Power Point Center for Visual Analytics for Command, Control, and Interoperability Environments
Superpixels Shape Analysis for Carried Object Detection
WACVW 3/2016 Chicago LTE Project Power Point Center for Visual Analytics for Command, Control, and Interoperability Environments
Tattoo Image Retrieval for Region of Interest 5/2016 (GARI) Gang Graffiti Recognition and Analysis
Power Point Center for Visual Analytics for Command, Control, and Interoperability Environments
Automatic and Manual Tattoo Localization Mitre Corporation 5/2016 (GARI) Gang Graffiti Recognition and Analysis
Power Point Center for Visual Analytics for Command, Control, and Interoperability Environments

Superpixels Shape Analysis For Carried Object Detection
IEEE 3/2016 VBOLO Power Point Center for Visual Analytics for Command, Control, and Interoperability Environments
Person re-identification using a patch-based appearance model
IEEE 9/2016 VBOLO Power Point Center for Visual Analytics for Command, Control, and Interoperability Environments
Accuracy Prediction for Pedestrian Detection IEEE 9/2017 VBOLO Power Point Center for Visual Analytics for Command, Control, and Interoperability Environments
Quality-Adaptive Deep Learning for Pedestrian Detection
IEEE 9/2017 VBOLO Power Point Center for Visual Analytics for Command, Control, and Interoperability Environments

Title Patent number Patent status Patent date Project Center of ExcellenceVisual Analytics Law Enforcement Tools
U.S. 8,849,728 Patent Awarded 9/2014 (VALET) Developing a spatial statistics framework in the visual analytics for law enforcement technology suite
Center for Visual Analytics for Command, Control, and Interoperability Environments
Proactive Spatiotemporal Resource Allocation and Predictive Visual Analytics
Patent Applied 11/2014 (VALET) Developing a spatial statistics framework in the visual analytics for law enforcement technology suite
Center for Visual Analytics for Command, Control, and Interoperability Environments
Maciejewski, R., Hafen, R., Rudolph, S., Cleveland, W., Ebert, D., “Forecasting hotspots using predictive visual analytics approach,” U. S. Patent 8,924,332 B2 issued on Dec 30 2014
U. S. Patent 8,924,332 B2
Patent Awarded 12/2013 WDYTYA: The Uncertainty of Identity
Center for Visual Analytics for Command, Control, and Interoperability Environments
Ebert, D. S., Maciejewski, R., Tyner, B., Jang, Y., Cleveland, W., Amass, S., “Animal Symptom Visual Analytics,” U. S. Patent 8,882,664 B2 issued on November 11, 2014.
U. S. Patent 8,882,664 B2
Patent Awarded 11/2014 WDYTYA: The Uncertainty of Identity
Center for Visual Analytics for Command, Control, and Interoperability Environments
Ebert, D. S., Collins, T., Maciejewski, R., Malik, A., “Visual Analytics Law Enforcement Tools,” U. S. Patent 8,849,728 B2 issued on September 30, 2014.
U. S. Patent 8,849,728 B2
Patent Awarded 9/2014 WDYTYA: The Uncertainty of Identity
Center for Visual Analytics for Command, Control, and Interoperability Environments
M. Boutin, S. Biddanda, N. Elmqvist, D. Ebert. Method for Visualizing the Results of an Electronic Search. Provisional patent 61/348,542, May 2010.
Provisional patent 61/348,542
Patent Awarded 5/2010 MDRP 18: COE-Explorer (Visual Analytics for the DHS Centers of Excellence)
Center for Visual Analytics for Command, Control, and Interoperability Environments
M. Boutin, S. Biddanda, N. Elmqvist, D. Ebert. Method for Visualizing the Results of an Electronic Search. Provisional patent 61/348,542, May 2010.
Provisional patent 61/348,542
Patent Awarded 5/2010 MDRP 18: Visual Analytics for the DHS Centers of Excellence
Center for Visual Analytics for Command, Control, and Interoperability Environments
U.S. 13/291,761 Patent Applied Visual Analytics Law Enforcement Technology; Public Safety Coalition Projects
Center for Visual Analytics for Command, Control, and Interoperability Environments
U.S. Provisional Patent, “Modeling & Analysis Tool for Healthcare Processes (MATH),” filed on January 13, 2012, serial number 61/586,227.
serial number 61/586,227.
1/2013 Enhancing Interactive Visual Analysis and Decision Making Environments
Center for Visual Analytics for Command, Control, and Interoperability Environments
U.S. Provisional Patent, “Methods and Systems for Improving Clinical Workflow by Enabling Remote Clinician-Patient Interaction,” filed on May 27, 2011, serial number 61/490,840.
serial number 61/490,840.
5/2011 Enhancing Interactive Visual Analysis and Decision Making Environments
Center for Visual Analytics for Command, Control, and Interoperability Environments

Code Theme Proj Title (P/R) Start Date End Date ( Abstract (P/R) Output Description Next Step Status (R) Theme (P) Proj Type (P/R) Awd Amt (P/R) Awd No. (P) Compliance (R) Data Collection Method Is Deleted Other Project Type Primary End User PI (P/R) PI Organization (P/R) MSIs (P) States (P) Collab COEs (P) Users (P/R) Primary End User Exec Summ (P/R) Prog/Final Research ACompleted Analytic Me Academic Stages of Transition
2 Resource
Allocation
Plugfest 2016/09 2017/06 Plugfest is an Annual Event where different solution
providers of sensors, analysis and decisions support tools
and information sharing capabilities integrated their
products in real time during on-water simulations of different
scenarios.
Plugfest took place during the Maritime Security 2016 West Annual
Conference, from Sept.20-22, 2016 in Everett, WA. Plugfest is a DHS
exercise that allows different solution providers of sensors, analysis and
decisions support tools, and information sharing capabilities integrated
their products in real time during on-water simulations of different
scenarios. Multiple radar and tracking devices were setup around
Possession Sound by DHS and other vendors, and data were uploaded to
a web service our system was able to collect and display. We shared a
booth with DHS S&T, demonstrated cgSARVA , a modified version of
VALET for displaying these collected data and calculated clusters and
anomalies, and gave a short talk on what role our visual analytics
systems could play in different hypothetical scenarios mentioned. Some
other vendors with graphical user interfaces have shown interest to our
systems, and we have received positive feedback from other attendees
and the DHS S&T group.
DHS S&T plans to shft Plugfest participation to a broader DoD
PlugFest. VACCINE will participate as requested.
In
Progress
150000 2009-ST-
061-CI001
No FALSE David
Ebert
Purdue University IN Center for Visual
Analytics for
Command,
Control, and
Interoperability
Environments
2016 Modeling Pilot/Field
Testing
and
Evaluation
in an
Operation
al
Environme
nt
1 Law
Enforcem
ent
VBOLO 2016/08 2017/06 The goal of this project is to investigate methods for re-
identifying subjects as they appear in surveillance video at
the Greater Cleveland Regional Transit Authority (GCRTA).
The GCRTA has expressed interest in tools that will allow
them to identify subjects as they re-appear in their
surveillance system. In many cases a subject who has
previously committed a crime will re-enter the system hours
or days later and appear in GCRTA surveillance video. The
GCRTA would like to re-identify (re-id) that subject so they
can be apprehended after their re-entry to the system. In
some sense, what the GCRTA would like to create is an
automatic or electronic be on the lookout (BOLO) system.
We call this system EBOLO. We envision the EBOLO
system would be one where the subject to be added to a
BOLO would be manually highlighted by the GCRTA from
surveillance video of an incident. The system would then
use computer vision and image processing techniques to
create features of the subject from the surveillance video.
One could think of these features as the subjects EBOLO
fingerprint.We then use these features to continuously
monitor the video surveillance system to determine when
that subject reappeared in the video. The systems would
then flag or alarm that the subject has reappeared and
where they are located.
We are continuing to refine the vbolo system and working closely with our
project partners and law enforcement. The current vBOLO system can
currently find the correct person in a lineup of 10 automatically-detected
candidates 90% of the time for one camera. CVADA-Purdue and ALERT
expect to improve performance of vBOLO to find the correct person in a
lineup of five candidates 95% of the time. This would involve the addition
of high resolution video, facial analysis, motion features, improved body
features, and subject attributes. Additional funds are needed for system
integration and deployment Collaboration with end-user;
Additional funds are needed for system integration and
deployment. We want to integrate person detection, body
matching techniques, dynamics (gait analysis) and facial
recognition methods in one framework and investigate the
degradation of performance that might result from the operational
settings, such as video compression and packet losses.
In
Progress
Visual
Analytics
of
Unstructur
ed and
Streaming
Data
Research 120000 2009-st-061-
ci001
No Field Monitors FALSE Edward
Delp;
Edward
Delp
Purdue University;
Purdue University
IN; OH Center for Visual
Analytics for
Command,
Control, and
Interoperability
Environments;
Northeastern
University
State and
Local
Transportati
on
2016 Emergenc
y
Preparedn
ess and
Response;
Transporta
tion
Security
Data
Collection/
Generatio
n
Qualitative
Analysis
Engineerin
g -
Electrical;
Mathemati
cs
Pilot/Field
Testing
and
Evaluation
in an
Operation
al
Environme
nt
E Educatio
n
success visualization
project
2016/07 2017/06 VACCINE recognizes the importance of showing the impact
and successes of the Center for the work it will have
performed in its 8-year history. Action will occur in Year 8
to produce materials for DHS that demonstrate the positive
impact that their financial investments have made.
VACCINE plans to accomplish this through allocating the
time of an existing VACCINE student (pulling from the
Center's own expertise in visual analytics) in order to
develop visualization of the Center's historical success and
impact over the eight year period. The Center will create an
interactive "event river" visualization tool of our COE
success and impact that will be placed on our website in
the form of a "timeline." Key pieces of information about
each project that will be able to be accessed from this
visualization through time including the project reports and
videos, links to news stories, one-page fact sheets about
each technology, etc. Such a visualization tool will aid in
easy and lasting sharing of information in presentations,
iPad demos, etc. by VACCINE as well as any DHS staff
when communicating about the work of the Center.
We have started the development of a visualization of the Center’s
historical success and impact over the eight year period. The Center will
create an interactive “event river” visualization tool of our COE success
and impact that will be placed on our website in the form of a “timeline.”
Key pieces of information about each project that will be able to be
accessed from this visualization through time include the project reports
and videos, links to news stories, one-page fact sheets about each
technology, etc. Such a visualization tool will aid in easy and lasting
sharing of information in presentations, iPad demos, etc. by VACCINE as
well as any DHS staff when communicating about the work of the Center.
We plan to complete this visualization tool in 2017. In
Progress
Informatio
n-driven
Visualizati
on,
Modeling
and
Simulation
of Data
0 N/A No FALSE David
Ebert
Purdue University IN Center for Visual
Analytics for
Command,
Control, and
Interoperability
Environments
Other DHS 2016 Basic
Research,
Operation
al Use,
Prototype
Demonstra
tion
E Educatio
n
Crisis Informatics Course
Development
2015/12 2016/06 The goal of this proposal is to enhance and grow a newly
developed course entitled Crisis Informatics. Crisis
Informatics explores the use of information and
communication technologies in crisis management. In
particular, it examines how information generated through
social media is collected, organized, processed, and used
for crisis management.
The Crisis Informatics Course has been developed and has been offered
once a year at the graduate level since Fall 2015. The course includes a
visual analytics component which is mainly constituted of hands-on
class activities involving the use of visual analytic toolkits (NODEXL,
SMART) to explore crisis related information generated through social
media.
1. Enhance the Visual Analytics component of the course by
adding more elaborated hands-on exercises ;
2. Develop the undergraduate level of the course ;
3. Make both the graduate and the undergraduate levels of the
course a model that could be adopted and taught in other
Institutions.
Complete Big Data
Visual
Analytics
Workforce
Development/Ed
ucation
38750 2009-ST-
061-CI001
No Compiling and Sorting
Database
FALSE Louis
Ngamassi
Prairie View A & M
University
Prairie
View A&M
University
TX Academic
Community
06/2016 Advanced
Data
Analysis
and
Visualizati
on;
Emergenc
y
Preparedn
ess and
Response;
Human
Factors
Aspects of
Technolog
y
Low Risk Qualitative
Analysis
Classroom
Education;
Exercise;
Online
Education;
Informatio
n Science;
Informatio
n systems;
Risk
manageme
nt/assess
ment;
Security
Informatics
Pilot/Field
Testing
and
Evaluation
in an
Operation
al
Environme
nt
1 Law
Enforcem
ent
Geographic Network
Analytics Correlations for
VALET
2015/11 2017/07 In the field of security, the exploration of criminal incident
reports for detecting trends, discovering anomalies and
evaluating resource usage is an ever expanding issue for
law enforcement agencies. An especially useful tool would
be an analyzer program to reveal the relationship between
infrastructure and crimes so as to make inferences about
how to best deploy officials to enable smarter cities.
Previous work on VALET in collaboration with ASU and PU
has seen the deployment of geographical network analytics
to create novel hotspot maps. In this work, we propose the
use of the network data to form the basis of a predictive
analytics method to capture correlations between
infrastructure (locations in the town such as grocery stores,
bus stops, etc.) and crimes. The first part of this task
involves developing the methodology of automatically
extracting city infrastructure using publically available data
sources. Once this information is extracted, we will fuse
this as a layer in VALET and enable the exploration of
correlations of spatiotemporal hotspots to regional
locations (businesses, parks, etc.). In this way, analysts
can explore relationships on the geographic network. Using
the spatial and temporal autocorrelations, we will then
develop a novel method of criminal incident prediction along
the geographic network. The second component of this
project is to integrate these features into a visual analytics
environment for law enforcement agencies and learn
various design principles for Human-Computer Interaction
and data visualization. This would involve working directly
with VACCINE and PU and for this task we propose a
graduate student exchange with PU (as done in the summer
of 2015) to engage in the addition of these techniques to
the current VALET system This will enable the final
Currently, ASU has developed a network based density estimate model to
explore geographical boundaries of gang territories as well as improve
hotspot analysis and detection. This work has resulted in an online
service for creating network density estimate models and we are in the
process of porting these features to other systems for further deployment.
The expected impact is improved data analytics for law enforcement as
well as serving as a basis for improved network based modeling of crime
and crime hotspots.
The next step is a mathematical evaluation of the network model to determine the predictive capability and define the guidelines for use. We will compare this to the standard kernel density estimate as a projection on to a map for error comparison to determine under what conditions the simplified version will be effective.
In
Progress
Data-
driven
Decision
Support
Research 50000 2009-ST-
061-CI001
No Data Mining FALSE Ross
Maciejwski
; Ross
Maciejews
ki
Arizona State
University; Arizona
State University
AZ; IN Center for Visual
Analytics for
Command,
Control, and
Interoperability
Environments
Academic
Community
2016 Advanced
Data
Analysis
and
Visualizati
on;
Emergenc
y
Preparedn
ess and
Response;
Social,
Behavioral
, and
Economic
Sciences
Case
Studies;
Statistical
Analysis
Geographi
c
information
sciences;
Geography
;
Informatio
n Science;
Informatio
n systems;
Computer
Science;
Criminolog
y
Basic
Research
1 Law
Enforcem
ent
Safety in View: A Public
Safety Visual Analytics Tool
Based on CCTV Camera
Angles of View
2015/06 2015/07 Campus security and police departments have implemented
a multitude of safety precautions, including CCTV cameras.
This is a Public Safety Visual Analytics Tool Based on
CCTV Camera Angles of View. The efficiency and
effectiveness of using CCTV camera resources for
preventing crimes result in higher demand. We implemented
a visual analytics tool to analyze the existing CCTV camera
resources and suggest improved allocation schemas based
on blind spots and crime data. Our tool provides the user
with an interactive safe path calculation method for walking
purpose on the basis of the maximum monitoring area.
Additionally, avoiding buildings in the calculated path is an
optional control factor. Our tool also provides functions for
crime data analysis. The camera-alarming function
highlights the cameras that a specific crime occurred in
their visible range. The camera-ranking function highlights
the camera that records the largest number of crime
incidents. Based on the historical crime data, we suggest
locations for future camera installation.
Journal article was created. The next step is to further refine the user study and system in order to evaluate the underlying designs and begin developing guidelines for how to promote user exploration for predictive analytics.
Complete Research 0 2009-ST-
061-CI001
No Expert Consultation FALSE David
Ebert
Purdue University IN State and
Local First
Responders
Case
Studies
Computer
Science
1 Law
Enforcem
ent
Officer Performance
Visualization System
2015/05 2017/07 Collaborating with Chief Patrick Flannelly, we propose the
Officer Performance project to gamify the performance of
police officers in Lafayette Police Department for better
performance comparison and for motivating maximized
performance. Prototype delivered in Aug 2016.
Prototype delivered to the Lafayette Police Department in Aug 2016. The next step is to formalize the name profiler toolkit and evaluate its effectiveness in providing probability estimates for online identities.
In
Progress
Research 0 2009-ST-
061-CI001
No Compiling and Sorting
Database
FALSE David
Ebert
Purdue University IN State and
Local First
Responders
2016 Communic
ations and
Interopera
bility;
Social,
Behavioral
, and
Economic
Sciences
Modeling;
Statistical
Analysis
Computer
Science
Pilot/Field
Testing
and
Evaluation
in an
Operation
al
Environme
nt1 Law
Enforcem
ent
Chicago LTE Project 2015/05 2016/02 The Chicago LTE Project was a wireless LTE mobile video
transmission test and analysis for police and urban
environments. The goals of this project were to test the
viability and performance of the LTE National Public Safety
Broadband Network (NPSBN) with respect to transport of
video imagery. One cell using the NPSBN was installed in
Chicago at the Chicago Police Department District 7. We
conducted a test plan to characterize the performance of
the network and analyzed the data collected. The test plan
consisted of three parts: First, objective perceptual video
quality tests designed to measure the video quality when
video is streamed in real-time over the LTE network were
conducted. Second, subjective measurements were
conducted to characterize the performance of applications
of interest under various test conditions. Third, network
performance metrics were obtained to test the key
performance indicators associated with the network. Based
on the analysis of the data collected during our testing it
was concluded that a PSBN LTE network provides an
unprecedented opportunity to increase the capacity and to
meet the needs and requirements of public safety with
respect to video delivery. Careful analysis should be used
for Quality of Service (QoS), prioritization and Radio
Frequency (RF) planning when designing a NPSBN LTE
system. It was also noted that adaptive video coding
methods, used in many video systems, might not suit public
service operational scenarios. System designer should
also take into consideration video usage in a task-based
approach.
Our initial test plan intended to conduct subjective assessments of non-
video applications used by the CPD such as RTVI, CAD, VidSys and
Shotspotter. However, due to operational issues and requirements by the
CPD, only subjective assessment of RTVI was conducted. This project
invoked investigating the delivery of real time video delivery to police
vehicles. The project was sponsored DHS with the project partners being
Purdue, Motorola, and the Chicago Police. The major effort here was the
work of Motorola in setting up a Public Service LTE cell site for the
Chicago Police. We used this cell site for doing our video testing.
In the future, we want to design an objective video quality metric
based on advanced image and video processing techniques
combined with machine learning strategies to estimate video
quality in dynamic scenes.
This metric would indicate to the law enforcement officer which
video analytic might be useful to him/here given the video quality.
The Chicago LTE pilot project also demonstrates that the 700MHz
National Public Safety Broadband Network (NPSBN) will provide
unprecedented resources in terms of network capacity and
communication speeds. However, Quality of Service (QoS) and
prioritization should still be taken into consideration while
scheduling network resources. Mission critical users or
emergency responders should be allocated resources according
to a well-defined QoS and prioritization model.
In the future, we want to characterize the performance of the
NPSBN when a Priority and QoS framework is implemented within
the network.
Complete Research 220293 2009-ST-
061-CI001
No Field Monitors FALSE Edward
Delp;
Edward
Delp
Purdue University;
Purdue University
IN; IL Private
Sector
Other; State
and Local
First
Responders
2015 08/2015
3 Social
Media
Tools
Context-Driven Visual
Analytics for Cyber
Defensive Operations - Oak
Ridge N Lab
2015/01 2016/07 We've developed a novel graph-analytic approach for
detecting anomalies in network flow data called
GraphPrints. Building on foundational network-mining
techniques, our method represents time slices of traffic as
a graph, then counts graphlets--small induced subgraphs
that describe local topology. By performing outlier detection
on the sequence of graphlet counts, anomalous intervals of
traffic are identified, and furthermore, individual IPs
experiencing abnormal behavior are singled-out. Initial
testing of GraphPrints is performed on real network data
with an implanted anomaly. Evaluation shows false positive
rates bounded by 2.84\% at the time-interval level, and
0.05\% at the IP-level with 100\% true positive rates at
both
GraphPrints was created, a graph analytic approach for detecting
anomalies in network flow data. Initial testing has been completed.
Research will continue as funded along with attendance to
workshops.
Complete Informatio
n-driven
Visualizati
on,
Modeling
and
Simulation
of Data
820000 2009-ST-
061-CI001
No Data Mining FALSE Bobby
Bridges
IN; TN Academic
Community;
DHS
Science and
Technology
Directorate;
Other
Industry
Advanced
Data
Analysis
and
Visualizati
on
Modeling;
Statistical
Analysis
Mathemati
cal and
Computati
onal
Modeling
Basic
Research
tbescher
Typewritten Text
IX. Projects by Thematic Area

3 Social
Media
Tools
SMART: Social Media
Analytics and Reporting
Toolkit
2014/07 2017/07 Recent advances in technology have enabled social media
services to support space-time indexed data. Such
spatiotemporal data has immense value for increasing
situational awareness of local events, providing insights for
investigations and understanding the extent of incidents.
However, the large volume of unstructured social media
data hinders effective exploration and examination.
Analysts require new methods for monitoring their topics of
interest, identifying trends and anomalies, and dealing with
the data volume and its dynamic nature. Our system
provides users with scalable and interactive social media
data (e.g., Twitter, Facebook) analysis and visualization
including the exploration and the examination of abnormal
topics and events. We have developed a new approach to
let analysts build task-tailored message filters (classifiers)
in an interactive and visual manner. The created filter
methods can be orchestrated and adapted afterwards for
interactive, visual real-time monitoring and analysis. In
addition, web and news media sources (i.e., Google and
CNN trends) are incorporated in the system. Our system
also provide an email alert service to automatically send
emails if the number of incoming tweets containing specific
keywords exceeds a threshold. We provide such
functionalities through not only desktop application, but also
highly interactive and accessible Web interfaces.
The Initial Prototype was deployed in July 2013 to the Boy Scouts of
America for testing at their Annual Jamboree. The USCG tested SMART
at the Thunder Over Louisville event. This is a day-long air show and
fireworks display held on and along the Ohio River in Louisville, Kentucky.
Thunder Over Louisville serves as the kickoff event for the annual
Kentucky Derby Festival, culminating with the Kentucky Derby on the first
Saturday in May. The 2014 event drew an estimated 650,000 spectators
to the Kentucky and Indiana sides of the Ohio River, as well as
approximately 120 recreational boats that anchored in the river. SMART
is still in testing and evaluating with a number of police and federal
agencies.
The Red Cross is interested in testing SMART for its application
and use in disaster preparedness and response initiatives.
In
Progress
Research 10000 2009-ST-
061-CI001
No Data Mining FALSE David
Ebert
Purdue University IN; TN DHS
Federal
Emergency
Managemen
t Agency;
DHS U.S.
Coast
Guard;
State and
Local First
Responders
2016 Case
Studies;
Modeling;
Sampling;
Statistical
Analysis
2 Resource
Allocation
Analyzing High-dimensional
Multivariate Network Links
with Integrated Anomaly
Detection, Highlighting and
Exploration
2014/07 2015/06 This research focuses on the integration of a family of
visual analytics techniques for analyzing high- dimensional,
multivariate network data that features spatial and temporal
information, network connections, and a variety of other
categorical and numerical data types. Such data types are
commonly encountered in transportation, shipping, and
logistics industries. Due to the scale and complexity of the
data, it is essential to integrate techniques for data
analysis, visualization, and exploration. We present new
visual representations, Petal and Thread, to effectively
present many-to-many network data including multi-attribute
vectors. In addition, we deploy an information-theoretic
model for anomaly detection across varying dimensions,
displaying highlighted anomalies in a visually consistent
manner, as well as supporting a managed process of
exploration. Lastly, we evaluate the proposed methodology
through data exploration and an empirical study.
Initial work focused on airport data for TSA. N/A Complete Research 0 2009-ST-
061-CI001
No Compiling and Sorting
Database
FALSE David
Ebert
Purdue University IN Case
Studies;
Statistical
Analysis
4 Disease
Surveillan
ce
Social Media and
Healthcare Analytics for
Identification of Emerging
Health Threats
2014/07 2015/06 Assessing current and emerging health threats is important
for public health officials in order to make timely decisions
about mitigative measures and allocation of resources
required under different scenarios. Syndromic surveillance
systems often rely on analyzing data received from a
specific domain such as chief complaints data collected
through hospitals, social media streams, aggregated web
searches, news stories, etc. Information collected through
multiple data sources could provide better understanding of
extent and severity of emerging health threats and also
reduces dependence on a single data source. It also helps
scientists understand the characteristics of syndromic
diseases, discover correlations among different factors and
understand contributing factors in disease outbreak
scenarios. This project focusses on providing a visual
analytics environment that enables analysts combine chief
complaints data collected through hospitals, social media
data from Twitters API and weather data to make
comprehensive assessments about disease outbreaks.
Presentations have been done. N/A Complete Research 0 2009-ST-
061-CI001
No Compiling and Sorting
Database
FALSE David
Ebert
Purdue University AZ; IN Modeling;
Statistical
Analysis
Biostatisti
cs and
bioinformat
ics;
Computer
Science
3 Social
Media
Tools
Mobile Application
Communication
2014/07 2015/06 Note: George Mason U. Task 1: Extend the monitoring to
hundreds of thousands of applications and include all
official and 3rd party markets. Going beyond the pilot, we
plan to extend our coverage to hundreds of thousands of
applications. Currently each market has more than
1,000,000 applications that can hide a lot of badly designed
and malicious apps. In this task we plan to build: Appliance-
based repository of over 1M apps from across major
platforms (iOS, Android, Microsoft). Extract and perform
open source analysis of meta-data. Instantiate and monitor
network traffic of all apps. Maintain data set of over 1M
apps and 10,000+ updates per month, running 24x7 in cloud-
based infrastructure. Task 2: Transition the technology to
DHS This task will prepare an appliance that will be
engineered to be deployed within DHS and other DoD
entities. Kryptowire will provide the necessary engineering
support and documentation required to setup and operate
the portal and will train any government personnel to be
able to use the portal to perform analytics and to share
information between DHS and other agencies.
The constant internet connectivity of smart devices coupled with their
pervasive use and the desire of users to try new mobile applications
make it a remarkable exploitation target. Malware can easily pose as
innocuous, must have applications, all the while causing damage ranging
from losing contact information to locking of the device. Current research
indicates an increasing threat of malware for mobile platforms even in the
presence of anti-malware checks: Android Bouncer has been employed in
Google Play market to identify malicious applications. However, it seems
that the attackers have found ways to evade detections, adapting to
many of the current standards. To make matters worse, there are other,
third-party markets that are available for downloading Android applications
that can easily purvey malicious applications. Another challenge is that
not all applications reveal their malicious behavior when they are installed
or even run on the device. Instead, the malicious behavior can be
triggered based on different conditions. However, most software testing is
performed towards checking the quality of software or apps but recently
security testing has gained popularity and has proved its importance.
Testing mobile application is not an easy task due to variety of inputs and
heterogeneity of the technologies.
N/A Complete Research 504901 2009-ST-
061-CI001
No FALSE VA
3 Social
Media
Tools
Explore Impact of
Visualization on Predictive
Analysis
2014/07 2017/06 Data science is an interdisciplinary field that focuses on the
process and systems used to extract knowledge from large
data sets. The primary goal is to determine trends and
patterns that can be used to generate models and predict
behaviors of interest. This type of analysis occurs across
all areas of science as data is collected and mined to
assess the likelihood that a similar trend, pattern or
behavior may occur across similar samples. While visual
analytics can serve to enable the human-in-the-loop as part
of data science, a variety of challenges still remain, and
perhaps the most challenging is how much human should be
in the data science process? This project will explore visual
analytics methods for predictive analytics, focusing on
social media for forecasting. The platform developed will
then be used for experiments in exploring at what level of
predictive accuracy does a human-in-the-loop help or
hinder analysis. 5 of our 7 subjects were able to best a
movie prediction website (BoxOffice.com) and only two
subjects erred on the far low end of the spectrum for this
movie (subjects 3 and 5). These results demonstrate that
such tools can quickly bring novice users up to speed in
predictive modeling when compared with experts.
Given the conflicting demands of model accuracy, comprehensibility and trustworthiness, the question of how much human knowledge and interaction is needed or warranted in relation to the model becomes a critical question for predictive visual analytics. How much of the human do we want in the loop of model prediction? Are humans able to accurately make predictions or outperform models with the aid of visual analytics? The goal of this study is to explore these questions. This work presents the results from the user study, an analysis of user interactions within the system, and serves as a starting point to discuss how much human-in-the-loop is useful for predictive visual analytics.
The next step is to further refine the user study and system in order to evaluate the underlying designs and begin developing guidelines for how to promote user exploration for predictive analytics.
In
Progress
Data-
driven
Decision
Support
Research 193686 2009-ST-
061-CI001
No Bench Tests FALSE Ross
Maciejwski
; Ross
Maciejews
ki
Arizona State
University; Arizona
State University
AZ Academic
Community
2016 Advanced
Data
Analysis
and
Visualizati
on; Human
Factors
Aspects of
Technolog
y; Social,
Behavioral
, and
Economic
Sciences
Data
Collection/
Generatio
n
Case
Studies
Laboratory
Testing
and
Evaluation
2 Resource
Allocation
Exascale Data
Visualization: Information-
assisted data analysis and
visualization
2014/07 2015/06 Exascale Data Visualization: Information-assisted data
analysis and visualization
N/A Complete Research 0 2009-ST-
061-CI001
No FALSE Kelly
Gaither
University of Texas TX
2 Resource
Allocation
Critical Infrastructure in
Large Scale Emergencies
2014/07 2015/06 The goal of this project, part of the Visual Analytics for
Security Applications (VASA) project, is to apply visual
analytics to disaster prevention and crisis response, with a
focus on critical infrastructures in logistics, transportation,
food safety, digital networks and power grids at the national
levels. The connectedness and dependency of these
critical infrastructures make the problem of monitoring and
understanding their functioning and dependencies one of
the most complex analytical tasks faced by our societies.
Their proper functioning is crucial for the well-being of the
population, economic viability, and most of all to prevent
loss of life
Tool created works on iPad. More funding needed. Complete 0 2009-ST-
061-CI001
No FALSE William
Ribarsky
University of North
Carolina at Charlotte
NC Department
of Energy
National
Labs;
Private
Sector
Other
3 Social
Media
Tools
Multimedia Analytics for
Open Source Media
2014/07 2016/06 In this project, we are developing a novel visual analytics
framework to support automatic understanding, exploration,
and more effective analysis of large-scale online multimedia
documents for homeland security applications.
Investigators in many areas often use multiple public
information sources. More and more, these sources have
multimedia content. The analysts are greatly hampered and
sometimes stymied by the fact that there are no automated
tools for intelligent categorization and analysis of the
copious amounts of information that flow from these
sources. For example, there are few tools to understand
the content of unannotated images and video. There is
hardly anything to extract and relate themes or stories from
multimedia content (for example, from broadcast video or
multimedia Web pages) and organize them for exploratory
analysis. Thus analyzing online news over days or weeks
from multiple sources in several languages is untenable
because trained analysts would have to actually watch the
many thousands of hours of video. These general
techniques are also being applied to document collections
and to online sources such as blogs and Twitter feeds.
N/A Complete 0 2009-ST-
061-CI001
No FALSE William
Ribarsky;
William
Ribarsky
University of North
Carolina-Charlotte;
University of North
Carolina at Charlotte
NC DHS Labs
1 Law
Enforcem
ent
Parallelizing Video
Algorithms for Public Safety
Applications
2014/07 2015/06 N/A Complete Research 0 2009-ST-
061-CI001
No Compiling and Sorting
Database
FALSE Kelly
Gaither
University of Texas,
Austin
IN; TX Case
Studies;
Modeling;
Sampling;
Statistical
Analysis
5 Financial
Flows
Tools
RISK VA 2014/07 2016/12 This work focuses on using visual analytics methods to
discover and investigate emerging risks in financials and
banking. Consumer credit risk analysis plays a significant
role in stabilizing a bank's investments and in maximizing its
profits. Finding and assessing unforeseen risk is now a big
topic for the government and the financial industry. Due to
the size and complexity of the data involved in risk analysis,
risk analysts are facing challenges in monitoring these
data, comparing their geospatial and temporal patterns, and
developing appropriate management strategies based on
the correlation from multiple analysis perspectives. In
response to this challenge, we are developing exploratory
methods to support analyst reasoning about and discovery
of emerging risk. RiskVA supports looking at stability
factors over time for business and customer transaction in
particular geographic areas and comparing results. RiskVA
further looks at trends in both secured and unsecured (e.g.,
credit card) debt. It helps identify emerging risks as
economic conditions change.
This work was done with managers at Bank of America and was made
available to BoA financial analysts. A version can be made available to
government agencies to assist in the investigation of financial debt.
RiskVA has also been extended to perform consumer analytics. Both
geospatial and temporal visualizations were employed to effectively
examine the market impacts from diverse consumer groups.
Potential licensing to a government contractor. Complete Research 0 2009-ST-
061-CI001
No FALSE William
Ribarsky;
William
Ribarsky
University of North
Carolina-Charlotte;
University of North
Carolina at Charlotte
NC Academic
Community;
Banking
Industry;
Insurance
Industry;
Policymaker
s
2016 Case
Studies;
Statistical
Analysis
3 Social
Media
Tools
Multimedia Visual Analytics
for News, Blogs, RSS
Feeds and other Streaming
Data
2014/07 2016/06 Research paper was created. N/A Complete Research 0 2009-ST-
061-CI001
No FALSE William
Ribarsky
University of North
Carolina at Charlotte
NC
2 Resource
Allocation
SmartGridVis Project 2014/07 2015/06 Foundation for VASA Complete Research 0 2009-ST-
061-CI001
No FALSE William
Ribarsky
University of North
Carolina at Charlotte
IN; NC

2 Resource
Allocation
SP 14 Task 5: Visual
Analytics for Security
Applications - VASA
2014/07 2015/06 Effective analysis for emergency situations caused by
severe weather conditions and natural disasters requires
understanding of a comprehensive set of data, including
weather, critical infrastructures, and transportation network
logistics. However, both civic and business analysts often
encounter difficulty in estimating the impact of an event,
forecasting damage, and discovering optimal solutions from
various resources due to incomplete sets of data, lack of
reliable simulation models, and no existing environments for
decision-making. We are designing and developing a visual
analytics system that provides this environment for
analysts and decision-makers. In order to provide
awareness of current and forecasted impact caused by the
natural events, our system presents historical and
simulated events (e.g., hurricanes, tornadoes, blizzards)
where users can instantly consider various scenarios,
alternative and operational and simulation attributes. Based
on these decisions and parameters, new simulations may
be run to explore the effects on multiple critical
infrastructures (e.g., power, computer networks, water,
transportation, sewer) and the effectiveness of contingency
plans and mitigation strategies. One example is a franchise
food network where food delivery routes need to be
changed based on store and infrastructure damage. In our
visual analytics environment, analysts and decision-makers
can effectively monitor the situation, understand the impact
of these storms on critical infrastructure, and evaluate
potential re-routed road paths for the food network with
adjusted parameters.
Hypothetical stores in North Carolina damaged by Hurricane Irene were
looked at. In our visual analytics environment, analysts and decision-
makers can effectively monitor the situation, understand the impact of
these storms on critical infrastructure, and evaluate potential re-routed
road paths for the food network with adjusted parameters.
Complete Research 25000 2009-ST-
061-CI001
No Compiling and Sorting
Database
FALSE William
Ribarsky;
William
Ribarsky
University of North
Carolina-Charlotte;
University of North
Carolina at Charlotte
NC Case
Studies;
Modeling;
Sampling;
Statistical
Analysis
1 Law
Enforcem
ent
WDYTYA: The Uncertainty
of Identity
2013/07 2016/12 Our goal is to link information pertaining to real and virtual
worlds in order to better manage the uncertainties inherent
in establishing human identity. Our basic premise is that
uncertainty in identifying and characterising individuals may
be managed and understood by: (a) exploring and analysing
spatio-temporal profiles of lifestyles and activity patterns;
(b) concatenating and conflating detailed but under-
exploited datasets in the virtual and real domains; and,
more speculatively (c) seeking and analysing crowd
sourced volunteered data that link physical and virtual
identities. Through these actions it will be possible to
improve our ability to characterize and validate an
individual's identity, to devise improved profiles of
individuals and groups that bridge the real and virtual
domains, and to document and manage the uncertainties
inherent in these tasks.
Within social network data, there exist communities of users that grow
and shrink over time. These communities share information and their
network links and shared information can provide additional information
about the spread of topics and information exchange in both the real and
virtual world. These connections can provide direct clues as to the nature
of an individual’s identity and their role within both online and offline
communities, allowing for the creation of cyber-geodemographic profiles.
In order to extract such information, the “Who Do You Think You Are?”
(WDYTYA) Spatiotemporal Network Dynamics for Community Detection
(WDYTYA: SNDCD) project has explored the overall characterization of
social network structure with respect to its relationship with geographic
places. Key questions include the definition of new metrics for quantifying
the influence and correlation of geographic locations on the formation of
relationships and the degree of similarity of individuals and the
quantitative analysis of these relationships over time. Such information
can be directly used for outlier detection, as well as for profiling groups of
people and/or entire urban areas or regions. With respect to Twitter,
tweets can be generated using computers or mobile phones to which a
geographic location might be associated. In particular, mobile devices are
embedded in the physical world and are carried by people in their
everyday lives. Therefore, these can be considered as links between
physical and virtual worlds: in other words, it is possible to link information
about physical and virtual users' behavior by analyzing their movement
and their activity on online social networks and other websites. The
characterization of the correlation and interdependency between virtual
and physical networks will be an essential contribution of the proposed
research work. Furthermore, location over time can be studied in terms of
trajectories in a physical space. WDYTYA: SNDCD plans to quantify the
similarity of users not only with respect to their locations at certain times
but also with respect to their relationships in geographic space (locally
and globally). The project team has developed visual analytics tools for
describing average characteristics of individuals and communities in
The next step is to formalize the name profiler toolkit and evaluate its effectiveness in providing probability estimates for online identities.
Complete Research 199006 2009-ST-
061-CI001
No Compiling and Sorting
Database
FALSE Ross
Maciejwski
; Ross
Maciejews
ki
Arizona State
University; Arizona
State University
AZ Center for Visual
Analytics for
Command,
Control, and
Interoperability
Environments
Academic
Community
2016 Advanced
Data
Analysis
and
Visualizati
on; Human
Factors
Aspects of
Technolog
y; Social,
Behavioral
, and
Economic
Sciences
Applied
Known
Sampling;
Statistical
Analysis
Computer
Science
Basic
Research
4 Disease
Surveillan
ce
GIS Implementations 2013/07 2014/06 Abstract Disparities in the geographic accessibility to
health care may be due to the location/distribution of the
population and the characteristics of the transportation
infrastructure relative to spatial arrangement of the health
care delivery system within a region. Access to health care
is a complicated concept and is largely dependent on the
characteristics of the population in need of services. The
most significant features affecting the health status and
health outcomes involve distance between the populations
geographic regions and health care facilities and the travel
time taken to reach the health care delivery system.
Because of Mississippi's rural nature and uneven
distribution of physicians, geographic disparities exist in
access to primary care services leaving women, children,
elderly and general populations in underserved health care
regions. The purpose of the research is to identify hot
spots of vulnerable population burdened due to
geographical accessibility to right kind of health services.
This research investigates these features by using network-
based GIS methods in ten counties with urban-rural
settings. The methodology assesses the geographic
accessibility of three types of critical health care facilities:
obstetrician/gynaecology (Women in child bearing age);
paediatrics (children) and Trauma/Burn Centers (general
population). To examine, using network analyst GIS
functionalities, these facilities are geocoded, and optimal
travel-time based service areas were generated and
pertinent vulnerable population data layers were developed.
The results identified hot spots of vulnerable populations
residing outside the optimal service areas, with rural
regions and pregnant women bearing most of the health
burden due to geographic inaccessibility This GIS
Journal articles were created. N/A Complete Research 0 2009-ST-
061-CI001
No Compiling and Sorting
Database
FALSE Richard
Aló;
Richard
Alo
University of Houston-
Downtown; Jackson
State University
IN; MS Modeling;
Sampling;
Statistical
Analysis
2 Resource
Allocation
Flight Delay Data
Exploration System for
Analyzing Spatiotemporal
Multivariate Data
2013/07 2014/06 Complex data with combinations of these characteristics:
temporal, spatial, network-based, and multi-variate makes
analysis more difficult. Example data sets showing such
complexity include data from transportation, shipping, and
logistics industries that have many connected operational
places (e.g., origin and destination pairs) with multiple
variables describing the operations in the places based on
time, transactions, or incidents. In this work, we focus a
visual analytics system that enables effective analysis
through a suite of linked views that include networked
geographical map, pixel-oriented network matrices,
calendar, and clock views. In addition, we have designed
new visual representations, Petal and Threads, to provide
features of multiple variables among operational locations
with minimized visual clutter.
Initial work focused on airport data for TSA. N/A Complete 0 2009-ST-
061-CI001
No FALSE Min Chen,
David
Ebert
E Educatio
n
SEED 1: Investigation of
the Impacts of Visualization
Literacy on the
Performance of Visual
Analysis; International
Collaborations
2013/07 2014/06 The rapid evolution of visual analytics (VA) has created
many innovative visualization techniques. These novel
visualizations provide some visual analysts with additional
capabilities and insights, but others perceive them
unfamiliar and difficult to use due to their novelty. One
factor that could explain individual differences would be the
level of prior knowledge about visualizations, which we
called visualization literacy. For example, one who knows
parallel coordinates may easily find an interesting
multidimensional pattern from a parallel coordinate view, but
others without the knowledge will fail to gain the same
insight. In spite of this obviousness, visualization literacy
remains as one of uncharted areas in visual analytics
research. We have not clearly understood how low or high
visualization literacy impact on visualization performance, in
what situations low visualization literacy becomes a more
limiting factor than other innate individual differences (e.g.,
cognitive style and personal traits), and how to measure
visualization literacy. This lack of understanding of
visualization literacy increases the unidentifiable variances
in evaluation studies and slows down development of
systematic methods to educate visual analytics users.
Thus, the aim of this proposed study is to better understand
the influences of visualization literacy on the performance
of visual analysts (visualization performance, henceforth)
and develop initial cognitive model to predict the
performance of visual analysts. Eventually, the results of
the current project could be incorporated into a
comprehensive mathematical/computational cognitive
model and a measurement tool of visualization literacy. This
is a collaborative project between two institutes: Purdue
University and Simon Fraser University The former will
This project began a collaboration which resulted in one journal article
during the project and several others after the project concluded. This line
of inquiry also contributed to a successful 3 year NSERC Strategic
Partnership Project grant proposal "Visual analytics for emergany
management"
N/A Complete Research 0 2009-ST-
061-CI001
No Survey FALSE David
Ebert
Purdue University IN State and
Local First
Responders
2010
2 Resource
Allocation
ORAM 2013/07 2016/06 The Coast Guard Atlantic Area Command developed the
Operational Risk Assessment Model (ORAM) to support
mission planning and analysis of the 11 Coast Guard
missions at the operational level. The model calculates and
compares risk among Coast Guard missions and
geographical areas and produces a calculated risk index
number (RIN) that allows for a common measurement
across different areas. VACCINE improved the cgSARVA
framework to create geographical visualizations to support
the trade off decisions that the model is aimed to address.
An interactive visual analytics system can help derive
insights from large amounts of data and facilitate the risk
management process thereby providing a suitable solution.
An interactive visual analytics system can also assist
analysts and decision makers in long term planning and
assessment of mitigation strategies. Our system provides
multiple linked views to perform spatiotemporal analysis of
risk, integrated techniques and components to visualize and
identify risk priority areas, spatial distribution of RIN values,
and perform coverage efficiency analysis. All of these
components are integrated to provide a complete risk
picture to the analyst.
System was developed and provided to LANT7 (USCG) for evaluation. N/A Complete Research 0 2009-ST-
061-CI001
No FALSE David
Ebert
Purdue University
2 Resource
UKVAC Joint Research
Project
2013/07 2014/06 In this WP, we researched into the big data problem
exemplified by the ASA Flight Dataset. We developed an
information-theoretic anomaly detection method called
QCAT (Query with Conditional Attributes), and reported its
implementation, performance characteristics, and an
example application for aiding query design.
In collaboration with the Purdue team, we integrated anomaly analysis
capacity (Oxford) with a flight data visualization system (Purdue). Thus
resulted in a research paper: S. Ko, S. Afzal, S. Walton, Y. Yang, J.
Chae, A. Malik, Y. Jang, M. Chen, and D. Ebert. Analyzing high-
dimensional multivariate network links with integrated anomaly detection,
highlighting and exploration. Proc. IEEE VAST 2014, pp.83-92, 2014.
The information-theoretic framework for anomaly analysis was
further applied to cybersecurity in a CPNI-funded project
Corporate Insider Threat Detection. CPNI stands for Centre for
Protection of National Infrastructure (UK).
Complete 0 2009-ST-
061-CI001
No FALSE Min Chen

3 Social
Media
Tools
Visual Analytics of
Microblog Data for Public
Response Behavioral
Analysis in Disaster Events
2013/07 2016/06 Public Behavior Response Analysis in Disaster Events
Utilizing Visual Analytics of Microblog Data Junghoon Chae,
Dennis Thomb, Yun Jang , SungYe Kim, Thomas Ertl, David
S. Ebert Analysis of public behavior plays an important role
in crisis management, disaster response, and evacuation
planning. Unfortunately, collecting relevant data can be
costly and finding meaningful information for analysis is
challenging. A growing number of Location-based Social
Network services provides time-stamped, geo-located data
that opens new opportunities and solutions to a wide range
of challenges. Such spatiotemporal data has substantial
potential to increase situational awareness of local events
and improve both planning and investigation. However, the
large volume of unstructured social media data hinders
exploration and examination. To analyze such social media
data, our system provides the analysts with an interactive
visual spatiotemporal analysis and spatial decision support
environment that assists in evacuation planning and
disaster management. We demonstrate how to improve
investigation by analyzing the extracted public behavior
responses from social media before, during and after
natural disasters, such as hurricanes and tornadoes.
Became SMART Complete Research 0 2009-ST-
061-CI001
No Compiling and Sorting
Database
FALSE David
Ebert; Tom
Ertl
Purdue University; IN Modeling;
Sampling;
Statistical
Analysis
4 Disease
Surveillan
ce
Visual Analytics
Environment for Public
Health Surveillance
2013/07 2014/06 Assessing current and emerging public health threats is
important for public health officials in order to make
decisions regarding mitigative actions and allocation of
resources. It also helps scientists understand the
characteristics of syndromic diseases and improve their
models. Patient hospital admittance records are first
classified into 7 syndromes (Botulinic, Constitutional,
Gastrointestinal, Hemorrhagic, Neurological, Rash,
Respiratory), then the categorized data is passed to
different linked components of the system. In the time
series plots, EWMA control charts with a 99% confidence
interval upper bound are used to identify anomalies in the
data represented by red dots in the temporal plots. Hospital
admittance data is also geocoded and can be used to
identify any spatiotemporal patterns. Our system also
allows the analyst to explore different epidemic models and
visualize the spread of an epidemic in any geographical
region using spatiotemporal view under certain conditions.
Software product that enables analysis to understand the characteristics
of syndromic diseases and understand their models. It consists of linked
spatial and temporal components that provides overview of current
spread status, and helps study different aspects of syndromic
surveillance.
Integrate social media data and other pre-diagnosis information
for improved surveillance and response. After that, begin
exploring models and comparing to ground truth in order to
demonstrate the efficacy of the tool for potential clients.
Complete Research 0 2009-ST-
061-CI001
No FALSE David
Ebert
Purdue University AZ; IN
E Educatio
n
SP 14 Task 2: Public
Safety Consortium
2013/07 2015/06 The role of developing detailed operational requirements is
critical for the successful transition of technologies into the
various homeland security fields. The VACCINE Center of
Excellence recognizes the need for significant end-user-in-
the-loop involvement in the entire life cycle development
process. The VACCINE team has refined our business
model (Figure 4) with the goal of connecting homeland
security researchers with the first responder community.
Understanding the requirements of our end-users is key to
the research and development of technologies that can be
transitioned to the broader public safety community. Our
Public Safety Consortium consists of a number of law
enforcement, fire, and emergency management agencies
that allow data to be shared and research conducted,
furthering the development of next generation homeland
security technologies. The Consortium provides a
framework where VACCINE can deploy its tools to the
various agency members, and our end-users provide in-
field or real world evaluation feedback on their
requirements. The group meets regularly to discuss ongoing
requirements to technology being developed, improvements
to technologies that have been deployed and are being
evaluated, as well as to brainstorm tools that are needed.
VACCINE sees this Consortium as a resource that can be
utilized by not only VACCINE but also DHS S&T. The Public
Safety Consortium continues to grow, and VACCINE has
recently reached out to other states outside the State of
Indiana to engage their public safety professionals in our
discussion of new technologies. Our ultimate goal is to
develop technologies that have been vetted and verified by
having end-users in the development process.
Technologies that have been designed in this fashion will
Process to engage First Responders used by VACCINE None Complete Seminar/Sympo
sium/Workshop
30804 2009-ST-
061-CI001
No FALSE FL; IN;
NC; OH
State and
Local First
Responders
2 Resource
Allocation
Mobile 3D Routing and
Emergency Evacuation in
Dense Urban Environments
2013/06 2015/07 Mobile 3D Routing and Emergency Evacuation in Dense
Urban Environments We have developed a mobile
application for situationally aware emergency response in
dense urban environments that have tall and large buildings.
Using an iPhone or other mobile device, an emergency
responder can transmit or receive location information , plot
30 routes between locations, and find alternate routes if
there are blocked paths. All this can be done, shared
among other responders, and received instantaneously.
Thus the emergency responders and the command center
all have situational awareness and comprehensive,
personalized routing. Routing can also be extended from
inside the building to the surrounding environment, enabling
the system to handle larger scale evacuation along multiple
routes in an efficient manner. As a prototype application,
we have generated 30 graphs for all the academic buildings
on the UNC Charlotte campus and embedded them in the
street network. This environment can be used to stand in
for a dense urban neighborhood. We are also working with
the Charlotte-Mecklenburg Police Department (CMPD) to
develop a tabletop exercise using this environment. This
exercise will permit us to test our system, our routing
capabilities, and our mobile interfaces with real police
officers. We will gain valuable feedback and evaluations of
our system, which will be used to improve it. Eventually our
improved system will be tested with other police
departments and will be deployed with CMPD and others.
The University of North Carolina at Charlotte has delivered an evacuation
decision support system and Urban Emergency Response search and
command center tools to the UNC Charlotte Police and Public Safety
Department. The tools have been used in the Canada-US Experiment
Resiliency Environment demonstration in Seattle at which DHS managers
were in attendance.
Project was completed. Complete Research 0 2009-ST-
061-CI001
No FALSE William
Ribarsky
University of North
Carolina at Charlotte
NC 2011
2 Resource
Allocation
UKVAC II 2012/10 2013/12 The overall aim of the UKVAC project was to investigate
into two grand challenge problems, namely the Nobel
Laureates (NL) and the Flight Data (FD) problems. Five
universities (Middlesex (lead partner), Bangor, Imperial,
Oxford and UCL) tackled these two challenges from
different angles. Oxford led work package 1, which focused
on the FD Problem that is described below: The flight data
problem is about wanting answers to questions that could
be contained in or constructed from the interrogation of 120
million records covering all commercial flights in the US
from October 1987 to April 2008, about 12Gb of
uncompressed data. Questions that could be asked include;
when is the best time to fly to minimise delays? Can you
detect cascading failures as delays in one airport create
delays in others? Are there critical links in the system? The
objective for WP1 includes the following sub-objectives: (a)
To formulate an information-theoretic framework for visual
analytics processes in a context exemplified by these two
problems. (b) To develop visual representations that depict
information contained in a dataset as well as the
uncertainty quantities and other probabilistically-derived
qualities such as importance and value. (c) To develop a
prototype demonstration system for illustrating the potential
use of information theoretic quantities in the process of
hypothesis generation and evaluation. (d) To compare the
information-theoretic framework with captured user study
data (WP4) and to offer an explanation about any
correlation and inconsistency. (e) To explore the
application of the information-theoretic framework in
interaction exploration (WP2), data management and data
analysis (Objective 3), hierarchical decision models (WP5)
We have completed the WP1 of the project with a number of concrete
achievements. (a) We have formulated an information-theoretic
framework for anomaly detection. A relatively comprehensive literature
study showed that the idea of using information theory for anomaly
detection has been examined by many since the 1980s. No existing
scheme was found to be identical as our proposal. It suggests a number
of possibilities, including (i) our scheme is novel; (ii) the same scheme
was proposed earlier but was not disclosed; (iii) the same scheme was
proposed earlier but was discarded due to the lack of big data or a
practical implementation (e.g., using visual analytics). (b) We have
conducted a study on the visual representations. We have identified the
requirements for an effective visual design, including consistent visual
cues across multiple views, and supporting both visualization and
exploration. The current visual design was formulated based on an
existing system that introduces many constraints such as the use of
colours. We believe that the visual designs can be improved further if
there is a flexibility to redesign the visual representations in different
views. (c) With the help of Purdue, we have delivered a prototype
demonstration system for illustrating the potential use of information
theoretic quantities in the visual analytics process for handling the FD
data. This is partly one of the original objectives that were removed due
to the budget reduction. (d) We have formulated a high-level visual
analytics cycle by dividing visual analytics tasks into three groups,
monitoring, analysis and model refinement. This proposed cycle allows us
to create, deploy, use, evaluate and improve automated detection
techniques (e.g., information-theoretic anomaly detection) in different
operational modes, by users at different skill-levels and in different
numbers, and through different computational processes with different
demands for database access and preprocessing. This high-level thinking
was partly supported by the empirical studies carried at UCL (WP4).
The UKVAC II provided University of Oxford with the first funded
visual analytics project, which serves as a springboard to other
visual analytics projects in the coming years, including in areas of
cybersecurity, digital humanities, seismology, and bioinformatics.
The interaction between theoretical research in information
theory and practical application enabled Oxford to make
significant advances in visual analytics theories. The 2016 VAST
Best Paper exemplifies the continuing impact of the UKVAC II
project. When Joseph Kielman retired in 2016, Min Chen wrote to
him "those visionary colleagues, such as Joe Kielman and Jim
Thomas, were right more than a decade ago. Now we can
mathematically show the value of visual analytics in data
intelligence."
Complete Research 0 2009-ST-
061-CI001
No FALSE Min Chen IN 2015 Statistical
Analysis
Computer
Science
Pilot/Field
Testing
and
Evaluation
in an
Operation
al
Environme
nt
1 Law Enforcement
(VALET) Developing a spatial statistics framework in the visual analytics for law enforcement technology suite
2012/07 2017/08 VALET technology provides law enforcement agencies with a suite of tools that allows for the spatiotemporal exploration of multivariate data sets and police records. These tools provide advanced analytic capabilities that allow officers to develop and test hypotheses about law enforcement activities within various areas of their communities.Analyzing high volume criminal, traffic and civil (CTC) incident data is a crucial component for preventing crimes and judiciously allocating resources for the law enforcement community. However, with data sets increasing in size and complexity, and as budgets shrink and departments scale back, the ability of local law enforcement agencies to effectively analyze the data being collected becomes increasingly strained. Valet explores and analyzes multivariate, spatial, and temporal law enforcement data to enable advanced data exploration and analysis of CTC incidence reports. Current work focuses on the early detection of unusual criminal occurrences, as well as predictive analytics.
VALET was deployed at the Lafayette, Jeffersonville and Evansville Police Departments. Further, the Indianapolis Police Department, Tippecanoe County Sheriff’s Office, Ohio State Highway Patrol, Illinois State Police, and New York Police Department have used VALET. As the predictive analytics component of the software continues to improve, input and feedback continues to be received to make adjustments to the technology in order to optimize it for use in the field. One of those adjustments is the development of the Officer Performance/MetricVis solution to display the performance of police officers in Lafayette Police Department for better performance comparison and for motivating maximized performance. VALET has been utilized to devise novel data guided patrolling strategies and has led to a paradigm operational shift at several police departments. VALET has also supported investigative analysis tasks at the departments who utilize the system. For example, the system played a critical part in the investigation of a string of business burglaries by the Evansville police department. In keeping with the goal of transitioning this software, Purdue Research Foundation has licensed the technology to a startup company, Davista Technologies, LLC, which was born out of the VACCINE center.
Davista is developing a sustainable transition model in order to continue the development and commercialization efforts of the technology. The company is also currently engaged in developing a data driven solution for a large private corporate firm for optimally allocating their safety and security related resources. Davista is leveraging the core VALET technology in the development of this solution.
In Progress
Dynamic, On-demand Data Analysis and Visualization
Research 190380 2009-ST-061-CI001
No Data Mining FALSE David Ebert
Purdue University Morgan State University
IL; IN; NY; OH
State and Local Emergency Managers; State and Local First Responders
2015 Emergency Preparedness and Response; Risk and Decision Sciences
Case Studies; Risk Assessment; Statistical Analysis
Geographic information sciences; Information Science; Computer Science; Criminology; Biostatistics and bioinformatics
Pilot/Field Testing and Evaluation in an Operational Environment

2 Resource
Allocation
(MADIS) A Data Integration
Framework for Enhancing
Emergency Response
Situation Reports with Multi-
Agency, Multi-Partner
Multimedia Data
2012/07 2015/07 Thanks to the availability of mobile devices, emergency
responders, supporting agencies and even private citizens
can capture imagery of disaster events as they unfold.
Once the crisis is contained, however, it's a daunting task
for emergency managers to collect, organize and integrate
disaster event data from multiple sources into incidence
command systems where situation reports, incidence
action plans, etc are being held. Therefore, we have
developed a semi-autonomous system Multimedia-Aided
Disaster information Integration System (MADIS), which
uses advanced data integration and visual analysis
techniques to associate temporal, spatial and other textual
features of a disaster event situation report with event
images and related text annotations. Our prototype
consists of a preprocessing component that catalogs
disaster event related images and identifies relevant
subject text in posted situation reports, training modules
that establish the systems cataloging and text analysis
capabilities, and a web-based database system with
RESTful APIs that allow for support of both web or mobile
device client applications. Direct Search Engine (DSE) is
an extended function of MADIS developed to quickly
explore three different data sources: general web pages,
latest news and blogs, and tweets, which are crawled by
different tools and stored in different formats. To access
the data for users, one method is to use the keyword based
search, the other is based on data integration, and the
results are presented as maps.
We have several research papers published in archival journals including
ACM Transactions on Information System and Technology (2015) and
World Wide Web Journal (2016, to appear), and in various conference
venues including ACM SIGIR International Conference, IEEE International
Conference on Information Reuse and Integration (IRI), and International
Conference on Web Information and System Engineering (WISE). • A
new component for the searching and retrieval of disaster videos was
added to the MADIS system, which enables the system to retrieve both
videos and images relevant to a specific disaster. Moreover, situation
reports which are uploaded by users will be automatically converted to
the PDF format and highlighted with the defined keywords.
Build up an automatic workflow that integrates the processes
starting from the feature extraction to semantic concept detection
into the complete MADIS system; Define an event-based
response trigger monitor for periodically model re-training; Utilize
the reports that are available on the website (FIUDRT)
https://fiudrt.org/ as one of the information resources.
Complete Research 318125 2009-ST-
061-CI001
No Compiling and Sorting
Database
FALSE Shu-Ching
Chen; Shu-
Ching
Chen
Florida International
University; Florida
International University
FL; IN State and
Local
Emergency
Managers
2016 Advanced
Data
Analysis
and
Visualizati
on;
Emergenc
y
Preparedn
ess and
Response;
Risk and
Decision
Sciences
Case
Studies;
Modeling;
Risk
Assessme
nt;
Sampling;
Statistical
Analysis
Preparedn
ess
training;
Computer
Science;
Risk
manageme
nt/assess
ment
Pilot/Field
Testing
and
Evaluation
in an
Operation
al
Environme
nt
2 Resource
Allocation
(iLEAPS) iLaw Enforcement
Apps Assistance Program
for Students
2012/07 2014/12 On most college and university campuses, students, faculty
and staff are not aware of the telephone number for the
campus police and often resort to dialing 911 when an
incident occurs on campus. When the police dispatch
receives these calls, they often redirect them to campus
police, since the city's police forces are unfamiliar with the
physical layout of college campuses. Valuable time can be
lost due to lack of geographic familiarity and communication
delays. To address this problem, MSU has created a
campus security system, comprising of mobile apps and a
web service that provides students, staff, and faculty with a
means to easily contact campus police and dispatch when
help is needed. Dispatch and police are then able to
efficiently coordinate a response. The use of this system
will expedite responses to potential threat areas on a
college campus with the added benefit of mitigating
additional harm due to late responses by police. Moreover,
the commercialization potential for other college campuses
to utilize this system is significant, as it has the potential to
be easily replicated to other academic venues by simply
incorporating their campus maps and dispatch telephone
call-in-numbers and operational procedures.
Five additional students (1 graduate and 4 undergraduate) have been
trained to conduct mobile development. Specifically, the students have
learned to continue the development of iLEAPS using the Android
Software Development Kit, and XCode for iOS development. Students
have also learned how to great hybrid apps that use HTML 5, CSS,
JavaScript, JQuery , PHP and MySQL to great the web content that is
wrapped in native code for GPS, notification and camera support.
Students have added new capabilities to extend the utility of iLEAPS.
These capabilities include native notifications (which enable students and
police to receive notifications when incidents are sent or resolved even
when the phone is off), ability to send pictures, and for dispatch to see
the location of all officers on campus. After a demonstration, Police Chief
Hatcher called for a meeting in August where the entire police force was
introduced to iLEAPS at a meeting where President Wilson was in
attendance as well.
We discovered this year that a majority of the police officers on
campus utilize iPhones as their primary work phones. As such,
we are currently in the process of finalizing the iOS
implementation of the app. Furthemore, MSU Police Chief
Hatcher also requested that we add geo-fencing functionality so
that any requests generated through the app are restricted to
indivdiuals currently on or around the vicinity of the campus.
Lastly, computing equipment has been secured for the dispatch
office so that when the system is fully deployed there is a
dedicated station where incoming alerts can be actively
monitored.
Complete Research 118496 2009-ST-
061-CI001
No Survey FALSE Tim Akers Morgan State
University
Morgan
State
University
MD State and
Local
Emergency
Managers;
State and
Local First
Responders
2015 06/2016 Advanced
Data
Analysis
and
Visualizati
on;
Emergenc
y
Preparedn
ess and
Response
Case
Studies;
Risk
Assessme
nt
Computer
Science
Pilot/Field
Testing
and
Evaluation
in an
Operation
al
Environme
nt
1 Law
Enforcem
ent
(GARI) Gang Graffiti
Recognition and Analysis
2012/07 2017/06 A mobile application that enables a picture taken of graffiti
to be analyzed and compared to the other images in a
database. The app can connect to the cloud to pull down
this data and that geodata is also included. Users can
compare the graffiti to similar tags in the area, thus aiding
interpretation, and access all previously taken images from
the database based on search criteria. The GARI system
provides a gang expert's intelligence when it comes to gang
graffiti symbols and identification, without having that expert
on staff. With the GARI tool, users can quickly and easily
capture an image, compare it to the database for similar
images, and see what the graffiti signifies. In addition, the
user can also report other information for the abatement
crew. The goal is to use image analysis techniques to
identify, interpret, and index gang graffiti and gang tattoo
images. The tool can be used to track gang movements
based on the geography of the graffiti images recorded.
GARI allows the user to upload an image from their phone
or computer to a server where it runs an algorithm to do an
image match and determine what other image in the
database this symbol most resembles. It then brings up the
images that match most closely-which will have annotation
describing what they mean-for example, if a particular gang
uses a particular color or sign.
GARI was deployed to the Indianapolis Metropolitan Police, Indiana
Intelligence Fusion Center Gang Task Force, INGang program, Cook
County Sherriff’s Department, Navajo Nation, and the Illinois State Police.
Additionally, a number of other law enforcement entities (approximately
400) have expressed interest in using and deploying the tool. A
community version was developed for release that runs in a similar
manner, but only allows for the reporting of graffiti with no information
visible to the individual uploading/reporting the graffiti image.
Unfortunately, the community version was never deployed as a result of
privacy concerns. The law enforcement version of GARI has servers
installed at the Indiana Intelligence Fusion Center in Indianapolis and the
Cook Country Sherriff’s Department in Chicago; a long term plan for
maintenance and support is being explored. There are currently 227 users
of the system in Indianapolis, and 114 within Cook County and 17 users
in Stockton, CA.
Currently, discussions are underway with the Purdue Foundry
regarding commercialization efforts of GARI.
In
Progress
Research 107941 2009-ST-
061-CI001
No Expert Consultation FALSE Edward
Delp; Ed
Delp
Purdue University;
Purdue University
Navajo
Technical
University
IN; CA;
AZ; IL
Center for Visual
Analytics for
Command,
Control, and
Interoperability
Environments
State and
Local
Emergency
Managers;
State and
Local First
Responders
2016 Advanced
Data
Analysis
and
Visualizati
on; Risk
and
Decision
Sciences
Case
Studies;
Modeling;
Qualitative
Analysis;
Risk
Assessme
nt;
Statistical
Analysis
Geographi
c
information
sciences;
Informatio
n systems;
Computer
Science;
Criminolog
y
Operation
al Use
2 Resource
Allocation
COAST: Coastal
Operations and Analysis
Suite of Tools
2012/07 2014/06 Coastal Operations and Analysis Suite of Tools (COAST)
aims to analyze all the Coast Guard operations across all
districts in the United States. VACCINE has developed a
visual analytics component that includes a GIS visualization
and a coverage module. The visual analytics system
includes linked views and interactive displays that allow the
interactive analysis of trends, patterns and anomalies
among the U.S. Coast Guard operations. The most recent
improvements include the optimization of the computation to
assign cases to nearest stations measured by the
coastline avoidant distances instead of the straight
distances. Finding the nearest station for every case is a
time consuming process. The optimization algorithm
proposes a spatial structure to organize cases so that
cases that are close to each other will share the same
nearest station finding process. The optimization also
propose a spatial structure to organize stations to speed up
the nearest station finding process. Some recent
improvements include the calculation of five different
metrics that analyze all the stations with one or multiple
districts. The metrics provide an understanding about which
stations have the greatest load and what will the impact be
if the number of assets are reduced in the station. The
metrics also take into account the multiple air facilities the
Coast Guard operates. Other recent developments include
the detailed analysis of the Coast Guard Air Station
coverage. Based on the type of aircraft available the
system calculates the coverage assuming that the aircraft
can land at any point along the coast line instead of having
to return to base, such calculation can improve the
searching times and coverage of the air stations. Finally,
the Rescue 21 dataset was added to the framework
The most recent improvements include the optimization of the
computation to assign cases to nearest stations measured by the
coastline avoidant distances instead of the straight distances. Finding the
nearest station for every case is a time consuming process. The
optimization algorithm proposes a spatial structure to organize cases so
that cases that are close to each other will share the same nearest
station finding process. The optimization also propose a spatial structure
to organize stations to speed up the nearest station finding process.
Some recent improvements include the calculation of five different metrics
that analyze all the stations with one or multiple districts. The metrics
provide an understanding about which stations have the greatest load and
what will the impact be if the number of assets are reduced in the station.
The metrics also take into account the multiple air facilities the Coast
Guard operates. Other recent developments include the detailed analysis
of the Coast Guard Air Station coverage. Based on the type of aircraft
available the system calculates the coverage assuming that the aircraft
can land at any point along the coast line instead of having to return to
base, such calculation can improve the searching times and coverage of
the air stations. Finally, the Rescue 21 dataset was added to the
framework, allowing the analyst to visualize the towers and their coverage
and using the information available to think and test different hypotheses
as well as optimize resources based on the use of the towers.
Transitioned to LANT& & USCG 7-72
USCG to take responsibility to maintain system. Complete Research 0 2009-ST-
061-CI001
No Data Mining FALSE David
Ebert
Purdue University IN DHS U.S.
Coast
Guard
2015 Modeling;
Sampling;
Statistical
Analysis
Computer
Science
Verificatio
n &
Validation
3 Social
Media
Tools
Multimedia, Social Media,
Text, and Emergency
Response Analytics
2012/07 2016/12 The project applies visual analytics methods to a range of
problems of significance to DHS. In each case one or more
tools or products are produced. In several instances, the
tools are deployed to stakeholders. Capabilities produced
include: Mobile emergency response and emergency
evacuation tools for urban environments have been
developed and deployed. These tools are situationally
aware; they can be updated immediately based on blocked
exits, blocked paths, unexpected distribution of people, etc.
Search, apprehension, and rescue tasks can be carried out
where the command center and deployed officers are in full
communication as to position and actions. This year new
capabilities have been developed to build 3D routing
networks for large buildings on the fly without CAD data or
architectural plans. A novel capability has been developed
to provide decision support to commanders in complex
emergency response situations as they evolve. A system
of systems model has been set up for investigating an
urban electric smart grid infrastructure under duress from
natural or man-made disasters. This system can investigate
weak points and cascading effects due to failures in an
overall infrastructure including electrical, water,
transportation, food distribution, and other components. A
Web service was set up so that onsite managers could
access the results of these large scale simulations on
mobile devices such as a laptop or tablet computer,
providing the capability to determine what will happen, when
and where it will occur, and who and what infrastructures
will be affected so that immediate, appropriate action can
be taken. Work is being done with European partners and
VACCINE colleagues.
A stand-alone version of our critical infrastructure modeling system plus
our collection of cascading breakdown results for a large ensemble of
hurricane paths has been deployed. The visualization interface is
accessible as a Web service by a range of devices anywhere on the
Internet. A robust Web server connects the interface in a secure fashion
to a compute and data intensive back-end. The ensemble results are
organized on the back-end for interactive recall and immediate display in
the visual interface. Visual interfaces in use include desktop, laptop, and
mobile (iPad). We are running case studies for Charlotte Mecklenburg
EMS and NC Public Health and Preparedness. The goal is improved
delivery of critical public health services in the face of a wide spread
weather disaster. The partnership with the Electric Power Research
Institute (EPRI) continues. We have now developed a prototype
situationally aware control and analysis system for the distribution system
of the future (DSOF). The DSOF will be very sensor-rich with new
opportunities to analyze and control at all levels (including at the home or
business site). Our critical infrastructure work contributes to this work.
We are setting up the prototype to respond to the effects of large storms
as they develop. The new sensor data is giving us results to extend our
critical infrastructure model deep into the distribution system and to
prepare for response under the DSOF. Stand-alone, modular modeling
system for time-dependent, cascading critical infrastructure outages at
the front of large scale weather events (e.g., hurricanes). This system
can also be inserted into a comprehensive system such as the VASA
workbench. Urban Emergency Response search and command
capabilities developed based on discussions with UNC Charlotte Police
and Public Safety Department. Consultation on tools with Charlotte
Mecklenburg EMS. A set of social media visual analytics tools to
investigate the narrative arc of social movements by following relevant
topics, events, and social networks.
Funding from the Department of Energy and other sources is
being sought.
Complete Research 0 2009-ST-
061-CI001
No Compiling and Sorting
Database
FALSE David
Ebert;
William
Ribarsky
Purdue University;
University of North
Carolina at Charlotte
IN; MN;
NC; SC;
TX; MD
Banking
Industry;
DHS Labs;
State and
Local
Emergency
Managers;
State and
Local First
Responders
; Other
State or
Local
2016 Advanced
Data
Analysis
and
Visualizati
on; Social,
Behavioral
, and
Economic
Sciences
Case
Studies;
Modeling;
Statistical
Analysis
Computer
Science;
Sociology
Adopted
by End
User,
Operation
al Use,
Pilot/Field
Testing
and
Evaluation
in an
Operation
al
Environme
nt
3 Social
Media
Tools
Spatiotemporal Social
Media Analytics for
Abnormal Event Detection
2012/07 2013/06 Part of SMART Recent advances in technology have
enabled social media services to support space-time
indexed data, and internet users from all over the world
have created a large volume of time-stamped, geo-located
data. Such spatiotemporal data has immense value for
increasing situational awareness of local events, providing
insights for investigations and understanding the extent of
incidents, their severity, and consequences, as well as
their time-evolving nature. In analyzing social media data,
researchers have mainly focused on finding temporal trends
according to volume-based importance. Hence, a relatively
small volume of relevant messages may easily be obscured
by a huge data set indicating normal situations. In this
paper, we present a visual analytics approach that provides
users with scalable and interactive social media data
analysis and visualization including the exploration and
examination of abnormal topics and events within various
social media data sources, such as Twitter, Flickr and
YouTube. In order to find and understand abnormal events,
the analyst can first extract major topics from a set of
selected messages and rank them probabilistically using
Latent Dirichlet Allocation. He can then apply seasonal
trend decomposition together with traditional control chart
methods to find unusual peaks and outliers within topic time
series. Our case studies show that situational awareness
can be improved by incorporating the anomaly and trend
examination techniques into a highly interactive visual
analysis process
Complete 0 2009-ST-
061-CI001
No FALSE Tom Ertl

3 Social
Media
Tools
(GeoTxt) E2E: GeoTxt API 2012/06 2017/06 In recent years, the amount of publicly available spatial
data has grown tremendously, due in large part to the
proliferation of GPS technologies and the location
information integrated into web applications, especially
social networking services. Networks like Twitter, Four-
Square, and Facebook allow users to provide insights into
current events in real time via short form textual updates or
statuses. Many modern social networks provide a means to
locate the contributor of status updates. The location of a
contributor is typically given as geographic coordinates,
latitude and longitude, but only a small proportion of users
choose to turn "geolocation" on. With Twitter, for example,
98.5% of tweets lack explicit location information. But,
there is a wealth of place-relevant information in text that is
not explicitly geolocated; that information comes in the form
of linguistic references to named places and place-specific
features. This spatial information, along with the temporal
information inherent to status updates, enables spatial and
temporal analysis of contributor patterns. GeoTxt.org is a
web service that enables the geolocation of places, people,
and organizations described in common status updates
from online social networks, as well as from other text
sources such as news stories, status reports, and blog
posts. It uses techniques from a wide array of research
areas - applied linguistics, natural language processing,
search engine optimization, and geographic information
science - to parse out places, people, and events explicitly
or implicitly mentioned in text (e.g., in Twitter Tweets) and
then to analyze and contextualize these entities to locate
them in geographic space. The API is designed to be
integrated into the development of dynamic, map-based,
visual analytical interfaces specifically in the context of
We have improved the throughput of GeoTxt substantially by
reengineering the system to take full advantage of both advanced text
indexing methods and high-performance computing. We have produced
the first Gold Standard corpus of geolocated places in tweets that can be
used to test and train any geoparsing tools. This corpus will be made
available to other researchers (on publication of the submitted paper
documenting creation of the corpus). We have developed a flexible
geovisual analytics application to support building geolocation corpra.
This application could be easily extended to support other corpus building
activities for testing and training text processing tools. In the process of
building the Gold Standard corpus cited above, we have generated a
range of insights (detailed in our submitted paper) concerning how
“places” are referred to in informal text such as microblogs. These
insights have the potential to substantially increase the accuracy with
which references to places can be captured from unstructured text,
something with direct implications for threat assessment, criminal
investigations, and crisis response. GeoTxt has been integrated as the
backend geographic entity recognition, disambiguation, and co-coding
systems to support SensePlace 2, our spatial-temporal twitter analytics
environment. The early stages of SensePlace 2 (and its precursor
SensePlace) were funded through VACCINE. GeoTxt has been made
available to other VACCINE partners. We have worked actively with
partners at both Purdue and UNCC to test use of the GeoTxt API from
software applications under development by those teams.
A proposal to do subsquent research to build on top of this project
will be submitted. Two papers are being written.
In
Progress
Research 155665 2009-ST-
061-CI001
No Data Mining FALSE Alan
MacEachr
en; Alan
MacEachr
en
Pennsylvania State
University;
Pennsylvania State
University
PA Academic
Community;
State and
Local First
Responders
2016 Advanced
Data
Analysis
and
Visualizati
on;
Communic
ations and
Interopera
bility
Case
Studies;
Modeling;
Sampling;
Statistical
Analysis
Informatio
n systems;
Computer
Science;
Geography
Laboratory
Testing
and
Evaluation
1 Law
Enforcem
ent
Symbology Standardization
Support
2012/06 2014/07 A number of agencies within DHS employ maps as part of
their daily operations. To facilitate inter-agency
communication, cooperation, and consistency with map-
based information and tools, DHS has supported research
on map symbol standardization by Penn State's GeoVISTA
Center since 2009. The goals of this research include:
Investigating the use and usability of the ANSI INCITS 415-
2006 standard Developing a process to refine mission-
specific symbol standards Enabling the sharing of symbols
through a feature-rich online "Store" Determining
appropriate map symbology for mobile use within DHS The
Symbol Store supports map symbol interoperability by
allowing users to search, choose, and download symbols
from a growing collection that currently exceeds 2,400 map
symbols. Each symbol in the database is enriched with
detailed metadata that includes category, agency,
organization and set, rating, symbol description and user-
submitted tags. Once a search is returned, users can
browse through results and can add the desired symbols to
their carts. The map preview function allows users to see
their chosen symbols on a variety of map types before
downloading. For convenient use in other mapping projects,
symbols are uploaded and downloaded in the Esri style
Format. A wider variety of symbol formats, including SVG
and PNG images, will be supported in updates in the near
future. The web services that make the Symbol Store
possible are also open to other developers, enabling a
multitude of cross-platform mapping applications. Most DHS
mission areas used separate in-house symbol sets for
internal standards. With the e-Symbology Portal, a web-
based environment where topics can be polled and
discussed by remote participants asynchronously those
Development of a revised Symbol Store, featuring a new interface design,
improved symbol uploading workflow, new downloadable formats (SVG
and PNG), and integration with Drupal to support iterative refinement of
user-contributed symbol sets. Provision of these improvements in a public-
facing Symbol Store, accessible at www.SymbolStore.org Presented the
Symbol Store to DHS and other Federal Stakeholders in an in-person
workshop and an online webcast to encourage adoption and solicit
feedback. Developed a set of Map Symbols designed for mobile devices
and a Mobile Mapping Experiment to assess those symbols.
More funding is needed for software to be converted from Flash
to Java Script.
Complete Research 972488 2009-ST-
061-CI001
No Expert Consultation FALSE Alan
MacEachr
en
Pennsylvania State
University
PA DHS
Federal
Emergency
Managemen
t Agency;
DHS U.S.
Customs
and Border
Protection;
Food and
Drug
Administrati
on; Other
Industry
2013 06/2013 Advanced
Data
Analysis
and
Visualizati
on
Case
Studies;
Sampling;
Statistical
Analysis
Geographi
c
information
sciences;
Informatio
n Science;
Communic
ation (risk,
scientific,
technical)
Operation
al Use
2 Resource
Allocation
(VASA) – Visual Analytics
for Security Applications
2012/06 2014/11 This system provides a visual analysis and decision making
environment for severe weather and natural disaster
planning and response for several critical infrastructures
(e.g., power, computer networks, food distribution).
Business officials and local officials can use this tool to
evaluate continuity of operation plans, plan for
contingencies, prepare for, and respond to a severe
weather event or natural disaster. Rerouting suggestions
for food distribution centers impacted by a severe weather
occurrence to facilitate decisionmaking in emergency
situations. The goal is to effectively analyze emergency
situations caused by severe weather conditions and natural
disasters. Our system presents historical and simulated
events where users can instantly consider various
scenarios, alternative, operational and simulation
attributes. Based on these decisions and parameters, new
simulations may be run to explore the effects on multiple
critical infrastructures (e.g., power, computer networks,
water, transportation, sewer) and the effectiveness of
contingency plans and mitigation strategies. One example
is a franchise food network where food delivery routes
need to be changed based on store and infrastructure
damage. In our visual analytics environment, analysts and
decision-makers can effectively monitor the situation,
understand the impact of these storms on critical
infrastructure, and evaluate potential re-routed road paths
for the food network with adjusted parameters.
Effective analysis for emergency situations caused by severe weather
conditions and natural disasters requires understanding of a
comprehensive set of data, including weather, critical infrastructures, and
transportation network logistics. However, both civic and business
analysts often encounter difficulty in estimating the impact of an event,
forecasting damage, and discovering optimal solutions from various
resources due to incomplete sets of data, lack of reliable simulation
models, and no exiting environments for decision-making. VASA is a
visual analytics platform targeting this setting and consists of a desktop
application, a component model, and a suite of distributed simulation
components for modeling the impact of societal threats such as weather,
food contamination, and traffic on critical infrastructure such as supply
chains, road networks, and power grids. Each component encapsulates
high-fidelity simulation models that together form an asynchronous
simulation pipeline: a system of systems of individual simulations with a
common data and parameter exchange format.
Ready to be tailored to specific systems. Complete Research 1185816 2009-ST-
061-CI001
Yes Data Mining FALSE Public Safety
Coalition Project
David
Ebert,
Isaac Cho
Purdue University IN; MN;
NC; TX
Food Protection
and Defense
Institute
State and
Local
Emergency
Managers;
State and
Local First
Responders
2015 05/2016 Advanced
Data
Analysis
and
Visualizati
on;
Infrastruct
ure
Protection
Case
Studies;
Modeling;
Risk
Assessme
nt;
Sampling;
Statistical
Analysis
Engineerin
g;
Computer
Science;
Risk
manageme
nt/assess
ment
Pilot/Field
Testing
and
Evaluation
in an
Operation
al
Environme
nt
1 Law
Enforcem
ent
MDRP 18: COE-Explorer
(Visual Analytics for the
DHS Centers of Excellence)
2012/06 2014/07 The DHS Centers of Excellence has produced a wealth of
research, education materials, and projects over the years,
and this material will continue to grow as the activities of
the various centers expand. The ability for reflection,
analysis, and investigation of this material is vital, and may
yield both new and old connections, ideas, and insights.
Furthermore, exposing the material to the scientific
community and other government agencies, as well as the
general public, is an important goal of our center. In this
project, we leverage visual analytics methods for
interacting and exploring this large knowledge resource in
an interactive visual form that is easy to access for quick
browsing, yet powerful enough to support advanced
analysis and review. More specifically, this project
develops table-based, graph-based, and timeline-based
visualizations of the DHS Centers of Excellence program in
an easily accessible format, but which also supports
faceted browsing and querying on the multiple dimensions
associated with the data. In other words, the idea is to
allow users investigators, students, and program officers
alike the ability to understand the entire activities of the
DHS Centers of Excellence program from many different
viewpoints, such as research topics, collaborations, funding
portfolios, investigator social networks, and project
trajectories over time.
The COE Explorer project was delivered and in use. This is not only a
good example of collaboration between the two DHS CCI
centers—VACCINE and CCICADA—but it has also seen wide impact for
exposing the research mission of the VACCINE center to the general
public. The tool has been a "featured project" on the VACCINE website for
several months, and PI Elmqvist is regularly contacted with questions
about the tool, its capabilities, and the data it is visualizing (a total of
some 15 such emails have been received). Furthermore, as evidenced by
the below success story, the tool has also been highly successful with its
intended audience: investigators, program officers, and policymakers.
Multimodal graph visualization is an ongoing research topic in the
visual analytics community. Our work on this is regularly cited and
has become a standardized resource for other researchers to
build on.
Complete Research 32170 2009-ST-
061-CI001
No Compiling and Sorting
Database
FALSE David
Ebert,
Nicklas
Elmqvist
Purdue University CA; GA;
IL; NJ; IN
Center for
Command,
Control, and
Interoperability
Center for
Advanced Data
Analysis
Academic
Community;
DHS Labs;
DHS
Science and
Technology
Directorate;
Media; U.S.
Department
of
Commerce
2013 Advanced
Data
Analysis
and
Visualizati
on
Case
Studies;
Sampling;
Statistical
Analysis
Computer
Science
Operation
al Use,
Pilot/Field
Testing
and
Evaluation
in an
Operation
al
Environme
nt
2 Resource
Allocation
MDRP 6: Video
Surveillance Visual
Analytics
2012/06 2014/07 Work bridging US and Canadian emergency preparedness,
response, and recovery. Our role is to support cross-border
coordination through work with emergency managers at the
City of Richmond and City of Vancouver, in coordination
with the Canadian Federal Public Security Technical
Program (Ministry of Public Safety and Ministry of
Defence). We coordinate with PSTP projects in Command,
Control, and Interoperability and GIS (MASAS). as well as
technology providers SMART, Macdonald Dettwiler,
EmerGeo, SMT, and Solace Systems. We begin by training
as emergency managers at JIBC, taking the same courses
and meeting the same criteria as EOC personnel. We then
train at a city EOC with their staff. In collaboration with
EOC staff we then design interactive technologies that
realize new standards (MASAS, System-of-Systems,
Capability-Based Planning) in EOC operations. These
include multitouch displays, coordinated use of multiple form-
factor displays in the EOC, extending to mobile computing
for first responders, stakeholders, and citizens. Other
deliverables include training EOC planners and staff on
techniques for incorporating citizen input from cell phones
etc. into emergency response. Funding for this work comes
from Canadian sources (NSERC, PSTP).
We have been successful in translating the work done in our laboratory to
practices in emergency management in the City of Richmond. Our
researchers consult on policy decisions (e.g. for social media) with
Richmond emergency manager Deborah Procter. Our VEOC lab setup
works with real data and software, integrating multitouch capabilities with
state-of-the-art Common Operating Picture MASAS standards, supporting
commercial providers MDA and EmerGeo in building products for use in
the field.
We have succeeded in gaining approval for new financial support
from PSTP for our collaboration with the City of Richmond and
City of Vancouver and have added the city of Delta as a third
municipality. This will fund both our group and end-users them to
work with us on our projects, enabling us to build effective
participatory design with end users, which should support buy-in
and real-world success for our VEOC.
Complete Research 24874 2009-ST-
061-CI001
No Expert Consultation FALSE Brian
Fisher
IN; NC State and
Local
Emergency
Managers
2013 Advanced
Data
Analysis
and
Visualizati
on; Border
Security;
Emergenc
y
Preparedn
ess and
Response
Case
Studies;
Modeling;
Risk
Assessme
nt;
Sampling;
Statistical
Analysis
Geographi
c
information
sciences;
Computer
Science;
Sociology
Pilot/Field
Testing
and
Evaluation
in an
Operation
al
Environme
nt,
Prototype
Demonstra
tion
1 Law
Enforcem
ent
(Crowdsourcing) Combining
Crowdsourcing technology
with machine learning to do
visual analytics on big
qualitative data (video
datasets).
2012/06 2014/07 Our goal is to test and develop a system that will allow us
to evaluate how well crowdsourcing and machine learning
can be used to increase the accuracy and lower the cost of
detecting suspicious and illegal acts in police surveillance
camera feeds. Our system must scale up to thousands of
cameras and also help track suspects across multiple
cameras. We are building a web based crowd sourcing
system that efficiently sends video to hundreds of users,
making it easy for them to identify possible incidents, such
as vandalism, sexual offenses, drug related actions, theft,
assault, abnormal social behavior in crowds, and many
others. Our scientific objectives are 1) to determine the
viability of using crowds instead of experts to identify
incidents quickly and accurately, 2) to determine how
effectively machine learning can be used to reduce the
amount of crowd power needed for successful incident
discovery, and 3) to analyze mixed systems of
crowdsourcing and machine learning to determine optimal
divisions of labor, assigning to humans the jobs that they do
comparatively better than machines, and vice versa for
machines. If we are successful we should be able to
identify illegal and suspicious acts in real time, and at a
small cost per video camera hour. If turkers are trained
further they could look for suspects or for suspicious
actions specially defined (such as leaving a paper bag or
other container in a crowded place, exchanging defined
items etc). Visualizations that help track complicated events
from camera to camera will also be developed.
The project to date has been distributed between Prof Delp at Purdue and
Prof Kirsh at UCSD. Prof Kirsh’s role has been on the design of a user
friendly system that is easy to manage at the back-end and easy to work
in on the client side. Our pilot work has shown that students find it natural
to work in the client. Annotation of intervals of interest – the main output
of turkers - is possible and not effortful. We are currently re-implementing
the system to increase robustness and to accommodate user feedback.
We have also found that small teams of turkers can produce better quality
results than single turkers, but the team size needed for adequate
reliability varies with the complexity of the targets and turker
training/rating. This means that Turker expertise can not always be
compensated for by increasing turker team size, as is often assumed. It
also means that better tracking of turker expertise is required and more
attention to turker team composition is needed. We have also found that
small teams of turkers can produce better quality results than single
turkers, but the team size needed for adequate reliability varies with the
complexity of the targets and turker training/rating. This means that Turker
expertise can not always be compensated for by increasing turker team
size, as is often assumed. It also means that better tracking of turker
expertise is required and more attention to turker team composition is
needed. The impact of the project is that a crowd sourcing based system
for identifying regions and intervals of interest in video is a viable method
for handling large videosets. More research is needed to better determine
the cost structure of scaling up to larger video sets and to real-time
analysis and reporting. The practical value of this system depends on the
reason a group might want it. Police need to review video to document
reports and provide evidence. Crowd sourcing can save time in that task.
Our original goal remains to provide real time assistance for monitoring
thousands of video in real-time. That application is of value in hundreds of
scenarios, including police surveillance, search and rescue and border
crossing.
More research is needed to better determine the cost structure of
scaling up to larger video sets and to real-time analysis and
reporting.
Complete Research 139700 2009-ST-
061-CI001
No Expert Consultation FALSE David
Kirsh
University of California
San Diego
CA; IN State and
Local
Emergency
Managers;
State and
Local First
Responders
2014 Communic
ations and
Interopera
bility;
Emergenc
y
Preparedn
ess and
Response;
Human
Factors
Aspects of
Technolog
y
Case
Studies;
Sampling;
Statistical
Analysis
Computer
Science
Laboratory
Testing
and
Evaluation

1 Law
Enforcem
ent
Bristle Maps - A
Multivariate Abstraction
Technique for
Geovisualization
2012/06 2014/07 We present Bristle Maps, a novel method for the
aggregation, abstraction, and stylization of spatio-temporal
data that enables multi-attribute visualization, exploration,
and analysis. This visualization technique supports the
display of multidimensional data by providing users with a
multi-parameter encoding scheme within a single visual
encoding paradigm. Given a set of geographically located
spatio-temporal events, we approximate the data as a
continuous function using kernel density estimation. The
density estimation encodes the probability that an event will
occur within the space over a given temporal aggregation.
These probability values, for one or more set of events, are
then encoded into a bristle map. A bristle map consists of a
series of straight lines that extend from, and are connected
to, linear map elements such as roads, train, subway lines,
etc. These lines vary in length, density, color, orientation,
and transparency-creating the multivariate attribute
encoding scheme where event magnitude, change, and
uncertainty can be mapped as various bristle parameters.
This approach increases the amount of information
displayed in a single plot and allows for unique designs for
various information schemes. We show the application of
our bristle map encoding scheme using categorical spatio-
temporal police reports. Our examples demonstrate the use
of our technique for visualizing data magnitude, variable
comparisons, and a variety of multivariate attribute
combinations. To evaluate the effectiveness of our bristle
map, we have conducted quantitative and qualitative
evaluations in which we compare our bristle map to
conventional geovisualization techniques. Our results show
that bristle maps are competitive in completion time and
accuracy of tasks with various levels of complexity
Prototyped and evaluated in VALTET system. N/A Complete Research 0 2009-ST-
061-CI001
No FALSE David
Ebert
Purdue University AZ; IN
2 Resource
Allocation
iOPAR - Operational
Performance Assessment
Reports
2012/06 2013/07 The iOPAR system has been designed to assist U.S. Coast
Guard decision makers and analysts in understanding and
assessing the operational efficiencies of different Coast
Guard missions at several different organizational levels.
iOPAR has been designed to provide senior level decision
makers an interactive mobile display of the Operational
Performance Assessment Reports (OPAR) for an
interactive assessment of the resource expenditures and
performance of different Coast Guard missions across the
U.S. This mobile system enables interactive filtering of data
by different parameters including resource, mission and
region. This system has been developed utilizing a user-
centered approach where the expertise of several different
Coast Guard analysts and decision makers has been
leveraged in the design process of the systems.
Delivered and in use; the prototype is being evaluated. USCG to take ownership of tool. Complete Research 0 2009-ST-
061-CI001
No Compiling and Sorting
Database
FALSE David
Ebert
Purdue University AK; AZ;
NY; IN
DHS U.S.
Coast
Guard
2015 Sampling;
Statistical
Analysis
Computer
Science
1 Law
Enforcem
ent
Mobile 3D Routing,
Emergency Evacuation,
and In-Field Criminal
Investigative Analytics
2012/06 2013/09 Mobile 3D Routing, Emergency Evacuation, and In-Field
Criminal Investigative Analytics We have developed a
mobile application for situationally aware emergency
response in dense urban environments that have tall and
large buildings. Using an iPhone or other mobile device, an
emergency responder can transmit or receive location
information, plot 3D routes between locations, and find
alternate routes if there are blocked paths. All this can be
done, shared among other responders, and received
instantaneously. Thus the emergency responders and the
command center all have situational awareness and
comprehensive, personalized routing. Routing can also be
extended from inside the building to the surrounding
environment, enabling the system to handle larger scale
evacuation along multiple routes in an efficient manner. As
a first application, we have generated 3D graphs for all the
academic buildings on the UNC Charlotte campus and
embedded them in the street network. This environment can
also be used to stand in for a dense urban neighborhood.
We participated in the DHS Canada-US Experiment
(CAUSE-ERE) based in Seattle for response to a
Northwestern earthquake and will participate in follow-up
activities. We are also working with the Charlotte-
Mecklenburg Police Department (CMPD) to develop a
training exercises using this environment. This exercise will
permit us to test our system, our routing capabilities, and
our mobile interfaces with real police officers. We will gain
valuable feedback and evaluations of our system, which will
be used to improve it. We have also run an on-campus
shooter/emergency evacuation exercise with the UNC
Charlotte Public Safety Department. The improved system
will be tested with other police departments and is being
Tool was developed. N/A Complete Research 0 2009-ST-
061-CI001
No FALSE William
Ribarsky;
William
Ribarsky
University of North
Carolina-Charlotte;
University of North
Carolina at Charlotte
NC
E Educatio
n
Personal Visual Analytics
Workshop
2012/03 2012/06 Personal Visual Analytic Workshop Created Complete Seminar/Sympo
sium/Workshop
12000 2009-ST-
061-CI001
No FALSE Melanie
Tory
University of Victoria PA 06/2016
E Educatio
n
Banff Workshop 2011/09 2011/09 In September 2011, we hosted a workshop in Banff,
Canada, for the purpose of further developing interest in
visual analytics within Canadian institutions and
organizations. We worked closely with a number of
Canadian universities and VIVA (Vancouver Institute for
Visual Analytics) to organize the agenda around topics of
specific interest to Canadian organizations, and 40
participants attended the workshop. As a result, three seed
grant awards were given to fund follow-on workshops and
networking efforts. The titles of the three
workshops/networking events selected are Visualization
and Policy Making: Theoretical and Empirical Explorations,
Univ. of British Columbia and Simon Fraser University;
Financial Systemic Risk Analysis, Univ. of British Columbia;
and Personal Visual Analytics, Univ. of Victoria, Univ. of
Calgary and Dalhousie University
Workshops created None Complete Seminar/Sympo
sium/Workshop
30000 2009-ST-
061-CI001
No FALSE 2011
1 Law
Enforcem
ent
(MERGE) Mobile
Emergency Response
Guide
2011/08 2014/08 MERGE technology allows for an easy reference for first
responders- it's essentially a mobile look-up table with
some additional, useful features.This provides an automatic
interpretation, response, and evacuation protocols of
hazmat placards in the DOT Emergency Response
Guidebook. The tool pulls in real-time weather information
and the latest census data to provide a plume model and
estimate for areas that may need to be evacuated in the
case of a HAZMAT accident, based on the placard read
into the system. Along with imaging the placard (capturing a
photo and having the software automatically read the
numbers), a user can also enter the HAZMAT number to
look up the chemical. The goal is to develop a mobile
system that uses location-based services and image
analysis methods to automatically interpret HAZMAT signs
and quickly provide safety information to users. The
MERGE tool provides the same information contained in
the Emergency Response Guidebook published by the
Department of Transportation, but, in a highly-portable, tech-
friendly manner. Hazardous materials can cause serious
accidents, emergency situations and therefore can make
them dangerous to society and the environment. A federal
law in the US requires vehicles transporting hazardous
materials to be marked with a standard sign (hazmat sign)
identifying the type of hazardous material the vehicle is
carrying. Hazmat signs help identify the material and
determine what special equipment, procedures and
precautions should be taken in the event of an emergency.
This information is contained in the Emergency Response
Guidebook (ERG) published by the US Department of
Transportation (DOT). The MERGE system is an integrated
mobile-based system that makes use of location-based
A professional analyst from an industry-leading company that deals with
flight delay data evaluated our system and our approaches used in this
work. The analyst mentioned that, at this company, they do not have such
visual tools that can enable visual analysis of multiple variables at
different locations and different times. Therefore, our system is excellent
for dealing with challenging data in the flight delay domain, and it is cutting-
edge work for the industry. In particular, the information theory based
anomaly detection approach is very intriguing, and it has not been applied
to analyses in the industry as of today. MERGE has been deployed to
several law first responders groups and it has received very positive
responses from our targeted user groups which include: the Lafayette,
West Lafayette, Indianapolis, and St. Clair, MI Fire Department.
MERGE was recently demonstrated to a manufacturer of
detection sensors, who is interested in licensing the MERGE
source code.
Complete Research 41643 2009-ST-
061-CI001
No Field Monitors FALSE Edward
Delp; Ed
Delp
Purdue University;
Purdue University
IN; CA; OH State and
Local
Emergency
Managers;
State and
Local First
Responders
; Other DHS
2014 Emergenc
y
Preparedn
ess and
Response;
Explosives
Detection,
Mitigation
and
Response
Data
Collection/
Generatio
n
Case
Studies;
Modeling;
Sampling;
Statistical
Analysis
Engineerin
g;
Computer
Science
Operation
al Use
1 Law
Enforcem
ent
SP 10: Physical Extraction
& Reconstruction of
Evidence from Mobile
Phones Using JTAG Test
Ports
2011/07 2012/06 Note: Tulsa Cell phones and BlackBerry devices are
indispensable to the planning, coordination and execution of
criminal acts. As such, they often contain vital evidence,
including subscriber and caller information, call times,
locations, text messages, email, images and audio and
video recordings. But Law Enforcement (LE) investigators
are often unable to use this evidence in investigating and
prosecuting crimes. The problem is that most mobile phone
forensic tools used by law enforcement perform "logical
extractions" of evidence, where a tool queries the operating
system of a phone for data. Clearly, the mobile phone being
examined must be undamaged and unlocked (i.e., not
password protected). However, even when the phone is
fully operational, a "logical tool" cannot retrieve hidden and
deleted data. The solution is the "physical" extraction and
subsequent reconstruction of evidence: (i) acquire the
entire contents of mobile phone memory; and (ii)
reconstruct the binary data to produce evidence in human-
understandable form such as text, images, audio and video.
This project will engineer forensically-sound physical
evidence extraction and reconstruction solutions for cell
phones and BlackBerry devices of interest to the U.S.
Secret Service and its partner federal, state and local law
enforcement agencies. The physical evidence extraction
solution will leverage JTAG test access ports in mobile
phones that enable electronics engineers to test and debug
the devices. These ports will be used as entry points to
extract the entire memory contents rapidly and in a
forensically sound manner. The evidence reconstruction
solution will convert the raw extracted data to human
understandable evidence in the form of text, image, audio
and video files It will carve relevant raw data parse the
Complete Research 198565 2009-ST-
061-CI001
No FALSE

2 Resource
Allocation
Coast Guard Swimmer
Deaths
2011/07 2012/06 Number of deaths involving swimming and boating in great
lakes rose from 90 in 2009 to 164 in 2010, an 82%
increase. This projects aims at analyzing the data related to
swimmer deaths in District 9 for year 2010 and help provide
an explanation or identify the major factors contributing to
this increase in swimmer deaths. This analysis was used in
planning and public service campaigns aimed at reducing
swimmer deaths for the summer of 2011 season. During
analysis, time-of-day, day-of-week and monthly swimmer
death patterns were studied. In addition, the geographic
distribution of such incidents was also studied. Hotspot
maps were created for each of the summer months for
2010 and were compared to previous years. In our
analysis, we found that august has the highest frequency of
swimmer deaths and if you consider time-of-day then late
afternoon was the time when most of these incidents
happened. The highest concentration of such incidents was
located in Lake Michigan (south and west shore). For
boating deaths, mid-July to mid-August was the time when
highest frequency of such incidents happened and there
was one week where such incidents were significantly high.
Friday, Saturday and Sunday accounted for almost all
deaths related to boating incidents. We summarized and
reported our results to Coast Guard to help inform
operational planning for fiscal year 2011. Later on, it was
reported that drowning and boating related incidents
decreased to 104 in 2011 which was almost a 37 percent
decrease.
In our analysis, we found that august has the highest frequency of
swimmer deaths and if you consider time-of-day then late afternoon was
the time when most of these incidents happened. The highest
concentration of such incidents was located in Lake Michigan (south and
west shore). For boating deaths, mid-July to mid-August was the time
when highest frequency of such incidents happened and there was one
week where such incidents were significantly high. Friday, Saturday and
Sunday accounted for almost all deaths related to boating incidents. We
also found that there is an early and late season increase. We
summarized our findings and Coast Guard used these results in their
operational planning for fiscal year 2011 and also in designing the public
service message campaigns. There was a drop of almost 37% in
swimmer deaths in 2011. Finished.
N/A Complete Research 0 2009-ST-
061-CI001
No Compiling and Sorting
Database
FALSE David
Ebert
Purdue University IN; MI 2011
4 Disease
Surveillan
ce
LAHVA: Linked Animal-
Human Health Visual
Analytics
2011/07 2012/06 The role of public health surveillance is to collect, analyze
and interpret data about biological agents, diseases, risk
factors and other health events in order to provide timely
dissemination of collected information to decision makers.
Unfortunately, data sources vary widely in accuracy and
reliability, and it is often the case that unusual health
trends, such as outbreaks or poisonings, have an incidence
profile (signal) that is obscured by the statistical noise. In
order to help investigators overcome these issues, we
have developed a suite of statistical and visual analytical
tools that couple novel data sources with human health
data. Our primary data sources include emergency room
data from the Indiana State Department of Health, general
visits of pets to Banfield the Pet Hospitals, Indiana Board of
Animal Health data, and data from public health news feeds,
such as ProMed. These analytical tools and datasets are
brought together in a visual analytics environment called
LAHVA. The LAHVA application provides investigators with
the ability to visually search the data for clusters in both a
statistical model view and a spatio-temporal view. By
providing linked graphical and statistical analysis views for
public health officials, we will improve event detection and
response, while reducing false positives.
Software product that linked animal and human health records from the
state department of health and veterinary clinics. Features of this tool led
to statistical analysis of critical livestock diseases and presentations to a
variety of stakeholders were performed.
Partnerships with industry need to be further established for the
veterinary clinic data, and and analysis of public records (such as
state governance animal health board data) needs to be
evaluated for use.
Complete Research 0 2009-ST-
061-CI001
Yes Compiling and Sorting
Database
FALSE David
Ebert
Purdue University NC; IN 2012 Statistical
Analysis
Basic
Research
1 Law
Enforcem
ent
High Risk Alcohol Behavior
Analysis
2011/07 2012/06 This project involves geographic information system (GIS)
mapping of the Purdue University, West Lafayette, campus
and surrounding areas to identify the environments
(housing, locations) where alcohol-related incidents
(arrests, transports, vandalism, calls) occur which can be
targeted for interventions. Mapping of the spatiotemporal
locations (specifically addresses/times/dates) has helped
identify the hot spots for potential interventions by the
university authorities. Multiple datasets including law
enforcement, university events and emergency medical
services datasets were analyzed and explored to profile
high risk drinking behaviors.
The output of the analysis was used to create an awareness presentation
for Purdue students, guide intervention activities and to develop
intervention policy.
Update analysis periodically. Complete Research 0 2009-ST-
061-CI001
Yes Compiling and Sorting
Database
FALSE David
Ebert
Purdue University IN State and
Local First
Responders
2011 Statistical
Analysis
Computer
Science
1 Law
Enforcem
ent
iVALET - Mobile Visual
Analytics Law Enforcement
Toolkit
2011/07 2017/06 The Visual Analytics Law Enforcement Toolkit (VALET)
integrates large volumes of criminal, traffic and civil incident
data into a single, interactive user interface to help law
enforcement decision makers, analysts and officers identify
crime trends and patterns, discover crime anomalies, and
perform predictive crime analytics in order to assist in
allocating law enforcement resources. With the increasing
magnitude and complexity of modern datasets, it is
becoming more difficult for analysts to efficiently extract
relevant information, specifically in the mobile domain. The
goal of this technology is to develop a mobile visual
analytics law enforcement toolkit designed to equip law
enforcement agencies and citizens with effective situational
awareness and risk assessment tools. The system
provides users with a suite of interactive tools that allow
them to perform analysis and detect trends, patterns and
anomalies among criminal, traffic and civil (CTC) incidents.
The system provides dynamically linked views that enable
the exploration of spatiotemporal CTC incidents data as
well as interactive risk assessment tools that allow users to
identify regions of potential high risk and determine the risk
at any user-specified location and time. With a chemical
plume dispersal modeling tool, the system also allows law
enforcement officers and first responders to have better
awareness in emergency chemical release situations. The
system has been designed for the iPhone/iPad environment
and is currently being used and evaluated by a consortium
of law enforcement agencies.
Our Visual Analytic Law Enforcement Toolkit (VALET) is actively being
used at the Lafayette, West Lafayette, Purdue University, and Evansville
Police Departments. Further, the Indianapolis Police Department, the
Tippecanoe County Sheriff’s Office, the Ohio State Highway Patrol, the
Illinois State Police, and the New York Police Department have all begun
testing or deploying the tool. As the predictive analytics component of the
software continues to improve, we continue to receive input and feedback
to make adjustments to the technology in order to optimize it for use in the
field. One of those adjustments is the development of the Officer
Performance solution to gamify the performance of police officers in
Lafayette Police Department for better performance comparison and for
motivating maximized performance. Additionally, we have contracted with
a consulting firm to ensure the software is commercial grade. The mobile
version of VALET (iVALET) continues to be a popular option for law
enforcement officers depending upon their roles and responsibilities.
VALET has been utilized to devise novel data guided patrolling strategies
and has led to a paradigm operational shift at several police departments.
VALET has also supported investigative analysis tasks at the
departments who utilize the system. For example, the system played a
critical part in the investigation of a string of business burglaries by the
Evansville police department. In keeping with the goal of transitioning this
software, we have licensed the technology to a startup company called
Davista Technologies, LLC that was born out of the VACCINE center.
Davista is developing a sustainable transition model in order to
continue the development and commercialization efforts of the
technology. The company is also currently engaged in developing
a data driven solution for a large private corporate firm for
optimally allocating their safety and security related resources.
Davista is leveraging the core VALET technology in the
development of this solution.
Complete Research 0 2009-ST-
061-CI001
No Compiling and Sorting
Database
FALSE David
Ebert
Purdue University Morgan
State
University
IN Center for Visual
Analytics for
Command,
Control, and
Interoperability
Environments
State and
Local First
Responders
2016 Modeling;
Sampling;
Statistical
Analysis
Computer
Science
Operation
al Use
5 Financial
Flows
Tools
NHANES Exploration 2011/07 2016/07 NHANES Exploration Applied visual analytics for exploring
the National Health And Nutrition Examination Survey The
United States health sector has deployed many survey
programs that produce large datasets with increasing
complexity and dimensionality. One such survey program is
the National Health and Nutrition Examination Survey
(NHANES), which is a population-based survey designed to
collect information on the health and nutrition of the U.S.
household population. NHANES collects data from physical
examinations along with surveys where they ask the
responder to recall their ingestion of food for the past 48
hours. The 2-day food recollection survey includes
demographic questions such as gender, age and
race/ethnicity. In conjunction with the Department of Foods
and Nutrition at Purdue we have developed a visual
analytics system designed to help researchers explore
patterns and form hypotheses within the NHANES dataset.
The visualization component of the environment is an
extension of traditional scatterplot matrices. Since the
upper portion of the scatterplot matrix is a redundant
encoding, we utilize this space, to show the projected N-
dimensional clustering of points. The rows and columns of
the matrix are automatically ordered using information
about the cluster projection in each space as a means of
showing the most meaningful dimensions. A comparison
module has also been included that allows the user to
compare groupings of people to the 2010 Dietary
Guidelines for Americans. This tool enhances the analysis
work by aiding discovery and hypothesis formation.
Delivered to nutrition researcher. N/A Complete Research 0 2009-ST-
061-CI001
No FALSE David
Ebert; Tom
Ertl
Purdue University;
4 Disease
Surveillan
ce
Visual Analytics Decision
Support Environment for
Epidemic Modeling and
Response Evaluation;
Public Safety Coalition
Projects
2011/07 2012/06 In modeling infectious diseases, scientists are studying the
mechanisms by which diseases spread, predicting the
future course of the outbreak, and evaluating strategies
applied to control an epidemic. While recent work has
focused on accurately modeling disease spread, little work
has been performed in developing interactive decision
support tools for analyzing the epidemic catastrophes and
evaluating potential disease mitigation strategies. The
absence of such tools makes it difficult for researchers,
analysts and public health officials to evaluate response
measures within outbreak scenarios. As such, our research
focuses on the development of an interactive decision
support environment in which users can explore epidemic
models, mitigation strategies and the impact of both. This
environment provides a spatiotemporal view where users
can interactively utilize mitigative response measures, such
as quarantine and transportation controls and observe the
impact of their decision over time. Our system also
provides users with doubly linked decision history
visualization and navigation tools that support the
simultaneous comparison of mortality and infection rates
corresponding to different response measures at different
points in time. The architecture of our system is flexible
enough to model variety of epidemic catastrophes by
integrating corresponding epidemiological models. We use
hypothetical scenarios and dataset to perform our case
studies. As the user inserts decisions points, scrolls
through time, and revisits other scenarios, these
interactions are tracked and displayed in the decision
history view. Our case studies are the following: Pandemic
Influenza with airline transportation and Rift Valley Fever, a
mosquito-borne zoonotic disease The results demonstrate
There are two software products to date from this project. The first
system enables visual analytic decision making and evaluation of
interdiction measures for Rift Valley fever (RVF), a zoonotic disease that
could have a devastating impact on the US cattle industry. The second
system allows visual analytic decision making to respond to and curtail
the spread of pandemic influenza. This project has shown the potential of
integrated simulation, visual analysis, and linked interactive
spatiotemporal displays with decision space displays for evaluating and
optimizing multiple interdiction strategies. RVF: Partnered with DHS FAZD
Center and delivered to them. PanVis delivered to health departments
across U.S.
N/A Complete Other (enter
short
description)
0 2009-ST-
061-CI001
No Compiling and Sorting
Database
FALSE David
Ebert
Purdue University AZ; IN 2010 Modeling;
Sampling;
Statistical
Analysis
E Educatio
n
SP 14 Task 1 - Extend COE
Explorer
2011/07 2012/06 The DHS Centers of Excellence has produced a wealth of
research, education materials, and projects over the years,
and this material will continue to grow as the activities of
the various centers expand. The ability for reflection,
analysis, and investigation of this material is vital, and may
yield both new and old connections, ideas, and insights.
Furthermore, exposing the material to the scientific
community and other government agencies, as well as the
general public, is an important goal of our center. In this
project, we leverage visual analytics methods for
interacting and exploring this large knowledge resource in
an interactive visual form that is easy to access for quick
browsing, yet powerful enough to support advanced
analysis and review. More specifically, this project
develops table-based, graph-based, and timeline-based
visualizations of the DHS Centers of Excellence program in
an easily accessible format, but which also supports
faceted browsing and querying on the multiple dimensions
associated with the data. In other words, the idea is to
allow users-investigators, students, and program officers
alike-the ability to understand the entire activities of the
DHS Centers of Excellence program from many different
viewpoints, such as research topics, collaborations, funding
portfolios, investigator social networks, and project
trajectories over time.
The COE Explorer was extended to use live data and was deployed on
the VACCINE website and was used for portfolio management of the
ongoing research program.
Multimodal graph visualization is an ongoing research topic in the
visual analytics community. Our work on this is regularly cited and
has become a standardized resource for other researchers to
build on.
Complete Research 62466 2009-ST-
061-CI001
No FALSE Niklas
Elmqvist
Purdue University

E Educatio
n
Cyber Education 2011/06 2014/07 Leveraging Multidisciplinarity in a Visual Analytics Graduate
Course Issue No.03 - May-June (2012 vol.32) pp: 84-87
Niklas Elmqvist , Purdue University David S. Ebert , Purdue
University DOI Bookmark:
http://doi.ieeecomputersociety.org/10.1109/MCG.2012.55
ABSTRACT Demand is growing in engineering, business,
science, research, and industry for students with visual
analytics expertise. However, teaching VA is challenging
owing to the multidisciplinary nature of the topic, students'
diverse backgrounds, and the corresponding requirements
for instructors. This article reports best practices from a VA
graduate course at Purdue University, where instructors
leveraged these challenges to their advantage instead of
trying to mitigate them
A graduate course was created. Visual analytics education is an ongoing project. PI Elmqvist has
created a new masters-level course at UMD's iSchool on visual
analytics that is even more targeted at practical data analysis.
Complete 100000 2009-ST-
061-CI001
No FALSE Niklas
Elmqvist
Purdue University
2 Resource
Allocation
Coast Guard PROTECT
Visualization
2011/06 2013/07 This is a contract under our Basic Ordering Agreement.
Using the previous two years of patrol routes, we are
developing statistical models for loiter point visits.
Predictions of the loiter point visits will be computed and
sent to the Coastguard to compare against actual visits
during a time period in which the visits were unknown to the
analysts. The predictive efficacy of this model will then be
addressed, and determination on the ability of hostiles to
predict patrol routes based on current patterns will be
assessed. Sparse data will be handled by predicting the
number of days between visits. Similarly in utilizing the
PROTECT model, two years worth of patrol routes will be
generated from the PROTECT model. Similar statistical
models will be created and a predictive model will be
adapted to the PROTECT routes. Predictions of future loiter
point regions will be generated from PROTECT and sent to
us and our model will now assess the ability of hostiles to
predict patrol routes based on potential PROTECT routes.
An interactive visual analytics environment was created
that overlays patrol routes and potential RIN numbers for
targets. This environment is developed for both desktop the
first generation tool looking at historical patrol route logs
and critical infrastructure overlays. The first generation tool
was deployed to a provisional set of members for analysis
and feedback.
VACCINE, in conjunction with the CREATE Center, analyzed the
PROTECT model for security patrols in Boston and made
recommendations for improvements for deployment in New York City.
Summary of Transition and Deployment - PROTECT - Port Resilience
Operational / Tactical Enforcement to Combat Terrorism • Collaboration
with CREATE • Prototype July 26, 2011. Completed.
N/A Complete Research 0 2009-ST-
061-CI001
No Compiling and Sorting
Database
FALSE David
Ebert
Purdue University AZ; IN Center for Risk
and Economic
Analysis of
Terrorism Events
DHS U.S.
Coast
Guard
2011 Case
Studies;
Modeling;
Sampling;
Statistical
Analysis
Geography Prototype
Demonstra
tion
5 Financial
Flows
Tools
MarketAnalyzer: An
Interactive Visual Analytics
System for Analyzing
Competitive Advantage
Using Point of Sale Data
2011/06 2013/07 Competitive intelligence is a systematic approach for
gathering, analyzing, and managing information to make
informed business decisions. Many companies use
competitive intelligence to identify risks and opportunities
within markets. Point of sale data that retailers share with
vendors is of critical importance in developing competitive
intelligence. However, existing tools do not easily enable
the analysis of such large and complex data. therefore, new
approaches are needed in order to facilitate better analysis
and decision making. In this paper, we present
MarketAnalyzer, an interactive visual analytics system
designed to allow vendors to increase their competitive
intelligence. MarketAnalyzer utilizes pixel-based matrices to
present sale data, trends, and market share growths of
products of the entire market within a single display. These
matrices are augmented by advanced underlying analytical
methods to enable the quick evaluation of growth and risk
within market sectors. Furthermore, our system enables the
aggregation of point of sale data in geographical views that
provide analysts with the ability to explore the impact of
regional demographics and trends. Additionally, overview
and detailed information is provided through a series of
coordinated multiple views. In order to demonstrate the
effectiveness of our system, we provide two use-case
scenarios as well as feedback from market analysts.
Delivered to corporate partner. N/A Complete Research 0 2009-ST-
061-CI001
No FALSE David
Ebert
Purdue University IN; AZ
1 Law
Enforcem
ent
SP 8: Disposable Cell
Phone Analysis
2010/10 2012/03 Note: Marcus Rogers A final report was submitted to DHS outlining the findings No next steps at this point. Complete Research 149811 2009-ST-
061-CI001
No FALSE David
Ebert
Purdue University
E Educatio
n
Justice Institute of British
Columbia and VACCINE
Collaborative Workshops
2010/09 2010/09 Workshops were created None Complete Seminar/Sympo
sium/Workshop
46000 2009-ST-
061-CI001
No FALSE
1 Law
Enforcem
ent
SP 2: CCC Tech Support 2010/07 2011/06 Task Statement - Department of Homeland Security (DHS)
Command, Control and Interoperability (CCI) Division
Technical Suppo1t Tasks: 1. Programmatic, management,
and technical support for: l .a. Multi-band radio pilot and
demonstration efforts l.b. Regional information sharing
demonstrations (e.g., Virtual USA demonstrations) 1.c.
Development of novel anomaly detection techniques 1.d.
Command, Control and Interoperability Division Support
Narrative: Provide programmatic, management, and
technical support to the newly established virtual USA
(vUSA) program. Specific projects and tasks include, but
would not be limited to, multi-band radio pilot and
demonstration efforts, coordination of various multi-level
interoperability and compatibility activities, regional
information sharing demonstrations, and development of
novel anomaly detection techniques. Cross-jurisdictional
cooperation requirements, encompassing local, state,
regional, and national, as well as intemational partners, and
integration of multiple, diverse, and distributed information
sources are to be especially addressed throughout the
work. Likewise, enabling multi-disciplinary research
collaboration on difficult scientific and technical challenges
in threat awareness, understanding, and dissemination is a
desired aspect of the support activity. Deliverables include
input to plans and development of planning templates;
technical reviews and reports; coordination and facilitation
of multiple program activities within DHS (including
outreach, collection and validation of user requirements,
and technical meetings); and leadership of technical
collaboration eff011s with domestic and foreign partners. All
information will be provided in at least one interim report
and one final rep01i Deliverables: 1 Interim Task Report
Complete Research 98660 2009-ST-
061-CI001
No FALSE Alan
MacEachr
en; Alan
MacEachr
en
Pennsylvania State
University;
Pennsylvania State
University
PA; IN
E Educatio
n
SP 7: User Adoption
Learning Tool (Ulearning)
2010/07 2011/06 Note: Captico
Objective
Develop an initial uLearning (user learning) platform that
incorporates video, text, images, or audio of new
technologies and how new technologies can be used in
operational scenarios by members of the first responder
community.
Mission
The uLearning Platform allows users to:"Capture once,
share [content] with many";
Assign, manage, and monitor their teams training program
online;
Repurpose, present and share educational materials in real
time;
Share Subject Matter Expertise (SME) from conferences
and events;
Access training content easily and affordably; and Share
best practices and lessons learned.
Findings
In addition to formal training materials, first responders
regularly create in-house videos, documents, and
presentations to educate themselves and their fellow team
members. Some counties use private file sharing services
to trade materials across departments. Others mail CDs
with videos on them back and forth due to privacy
concerns. Others upload content to YouTube and hope for
the best. There is an astounding amount of educational
content that is created and then wasted by limits on
interoperability and a lack of an easy-to-use approved
The Department of Homeland Security Science and Technology
Directorate (DHS/S&T/CCI) focuses on the development of education and
training tools, as well as collaboration space, for the emergency response
community. During the early part of Year 3, Captico, a Maryland-based
company specializing in internet marketing using web technology,
partnered with VACCINE at Purdue University to develop a web-based
uLearning prototype for DHS/S&T/CCI to serve the emergency response
community. The prototype leveraged content such as videos,
presentations, narratives and links to share expert and practitioner-
defined content across the emergency response community. The
objective of this effort was to develop an initial short, uLearning (user
Return 29 learning) tool that incorporates video, text, images, or audio of
new technologies and how new technologies can be used in operational
scenarios. Deliverables planned in the original proposal included a
prototype of a ULearning Tool; assessment of the ULearning tool with a
small set of managers/users; and plans/approach for broader uLearning
applications (e.g., other technologies and end-users). Captico and Purdue
have identified and prioritized learning needs within the emergency
response community that may be best supported via the uLearning tool.
By gathering input from first responders utilizing various methods, the
uLearning tool prototype was developed to incorporate specific features
and capabilities found most useful by the emergency response
community. Based on availability of funding, the plan was to target the
state of Indiana as a large pilot project and give those first responders
supported access to the uLearning Platform in exchange for feedback to
further the development of the Platform. First responders were
interviewed and their input was recorded by Captico. However, in the
summer of 2011 the project was postponed due to lack of funding.
Summary of Transition and Deployment: Ulearning (Captico)- Training
portal for S&T and COE Technologies • Deployed for Test & Evaluation
Feedback - March 2011
Need more funds Complete 83829 2009-ST-
061-CI001
No FALSE IN 2011
2 Resource
Allocation
Analytical Visualization of
the Port Arthur, TX
Economic Impact Study
2010/07 2011/06 The mission of the USCG Marine Safety Program is to
ensure environmentally safe operations of all vessels
operating in U.S. waters. Disruption of services at
individual seaports will have local, regional, and national
economic impacts. It is worth noting that according to the
2008 "Maritime Safety Performance Plan", US deep-draft
seaports and supporting firms employed more than 8 million
people and contributed approximately $2 trillion to the U.S.
economy. The USCG Maritime Safety program executes
daily activities designed to reduce the likelihood that a
catastrophic incident will occur and, should one occur,
respond in order to minimize the impact and restore full
operations. One question is: How does the cost of Maritime
Safety compare with the economic impact due to disruptive
incidents occurring in deep-draft seaports and the overall
function of the Maritime Transportation System? Therefore,
the Maritime Economic Impact Study project examples the
economic impact locally and nationally for port closures in
the area of Port Arthur Texas. This project has generated a
large volume of market sector data for the impact of
closures of different durations. It has also explored the
impact of mitigation strategies. This large series of tables
and numbers is difficult to use by decision makers in
analysis consequence and response scenarios and making
decisions with trade-offs. Interactive visual analytics can
alleviate these problems and provide a powerful tool since
the results are more easily interpreted visually. This
requires visualization utilizing spatial and temporal analytics
(and visualization) blended with a multivariate correlative
analysis to form an interactive tool that facilitates
interactive display of economic impact by choosing type of
vessel types of inspection programs The user can explore
VACCINE personnel have developed a visual analytics environment for
the analysis, exploration and decision making of the effects of a port
closure in Port Arthur, TX. The tools created run on Windows PCs and
provide users with a graphical user interface with which to explore the
economic impact data by market sector and by mitigation strategy.
Completed and delivered to USCG.
N/A Complete Research 0 2009-ST-
061-CI001
No Expert Consultation FALSE David
Ebert
Purdue University AZ; IN Center for Risk
and Economic
Analysis of
Terrorism Events
DHS U.S.
Coast
Guard
2011 Case
Studies;
Modeling;
Sampling;
Statistical
Analysis
Operation
al Use
1 Law
Enforcem
ent
PlumeViz 2010/07 2011/06 Mission Need As the threat of explosive devices has
become more prevalent, the need for in-field analysis of the
release of potential nuclear, chemcial and biological threats
is critical. Our work in PlumeViz provides users with the
means to interactively explore the impact of wind speed
and direction in terms of plume releases and dispersal. Our
interactive environment allows users to explore the impact
of these varying plumes in terms of economic loss, death,
injury, etc. These overlays are combined in a command and
control environment, where data sources are integrated
with potential decision points, allowing analysts to quickly
determine best and worst case scenarios. Users are
interactively able to analyze the loss of life, illness and
economic impact across census tracts affected by the
plume. Linked statistical views provide insight into the
impact over time and provide future predictions in terms of
potential impact.
Completed live demonstration in fullscale exercise in Pugent Sound with
USCG and DNDO.
N/A Complete Research 0 2009-ST-
061-CI001
No FALSE David
Ebert
Purdue University IN

2 Resource
Allocation
Symbology Map Transition 2010/07 2016/07 A number of agencies within DHS employ maps as part of
their daily operations. To facilitate inter-agency
communication, cooperation, and consistency with map-
based information and tools, DHS has directed attention to
standardization of map symbology. With the support of
DHS, Penn State has been researching map symbol
standardization since 2009. The goals of this research
include: (a) Investigating the use and usability of the ANSI
INCITS 415-2006 standard; (b) Developing a process to
refine mission-specific symbol standards; (c) Enabling the
sharing of symbols through a feature-rich online store; (d)
Determining appropriate map symbology for mobile use
within DHS. The results of this work, in addition to a
comprehensive understanding of DHS mapping needs and
the many roles for map symbols to meet those needs, is a
pair of integrated web applications (Symbol Store and
Symbol Reviewer) that this transition project has focused
on adapting to work within the Federal Geographic Data
Committee managed GeoPlatform: https://geoplatform.gov/.
A working system with web-based guides on strategies for
using map symbols provided in both web and mobile maps
has been completed for implementation in GeoPlatform.
Multiple improvements to the Symbol Store application have been made
due to feedback from work with users. Additionally, the Symbol Store API
has been enhanced and simplified to allow a developer to easily search
and access symbols in the Symbol Store. A set of fully documented
examples have been produced of web map (both Esri and an alternative)
and mobile map applications that can connect directly to Symbol Store
through the extended API along with documentation on the process for
implementing the functionality (all posted on Github for wide access).
Symbol Store serves hundreds of symbols. To make them accessible, we
added query expansion functionality that allows users to find map symbols
even if they do not know the official symbol name (e.g., entering “boat”
will retrieve not only the symbols with “boat” in their name but also
symbols associated with marine incidents and ferries). This was
implemented using the concept of semantic distance, and the WordNet
database of all English words and their relations. Since computing
semantic distance is computationally expensive, we pre-compiled indexes
of the best symbol match for every noun in the English language and
applied computational strategies that cut the index creation time by a
factor of 30. Symbol Store is working on the GeoPlatform.gov Server. We
continue to work with the FGDC staff to prepare the system prior to public
access; the latter is anticipated within 1 month of this report date. Symbol
Reviewer is operational on the www.symbolstore.org web site and will be
installed in the GeoPlatform at the convenience of GeoPlatform staff.
Software is built but needs to be converted from Flash to Java. Complete Research 0 2009-ST-
061-CI001
No Survey FALSE Alan
MacEachr
en; Alan
MacEachr
en
Pennsylvania State
University;
Pennsylvania State
University
IN; PA DHS
Federal
Emergency
Managemen
t Agency;
DHS
Transportati
on Security
Administrati
on; DHS
U.S. Coast
Guard;
State and
Local First
Responders
; Other
Federal
Agency
2014 06/2013 Case
Studies
Geography Pilot/Field
Testing
and
Evaluation
in an
Operation
al
Environme
nt
1 Law
Enforcem
ent
Video Surveillance Project 2010/07 2011/06 Video Surveillance Project Complete Research 0 2009-ST-
061-CI001
No FALSE David
Ebert
Purdue University IN
1 Law
Enforcem
ent
Seed 3: Uncertainty in
Video Visual Analytics
2010/07 2012/06 This seed project addresses the problem of uncertainty
visualization in Video Visual Analysis (VVA). A VVA pipeline
differs from a traditional automated video analysis (AVA)
pipeline in several ways: (i) VVA focuses on the depiction
of important information in the videos, whilst AVA focuses
on making analytical decisions using machine intelligence;
(ii) VVA provides an integrated analysis and visualization
pipeline with feedback loops; whilst AVA usually does not
rely on visualization, or provides only primitive visual
annotation of videos. In both VVA and AVA pipelines, there
are a large number of video processing components, such
as filters for morphological operations, convolution,
segmentation and recognition. In addition to typical
imagery, geometrical and annotative results, these filters
also result in a huge amount of information about the
uncertainty levels (and processing errors). While some of
such information may be part of the decision mechanism
(typically through coarse quantization), most information
would be discarded at various stages of the pipeline.
Without such information, adjusting various parameters for
video processing components is almost a black art. Raw
uncertainty information can be pixel-based, object based
and frame-based, and typically of a time-varying nature. It
is thus desirable to make the uncertainty information
available to the viewers visually. However, video
visualization components in a VVA pipeline usually lack in
both information bandwidth and distinguishable visual
channels. The former refers to the limited screen resolution
to handle a large amount of temporal data. The latter refers
to the factor that most effective visual channels usually
have already been used by the traditional video
visualization without uncertainty information For example
We have developed a real-time method for transforming video information
in quasi-3D to spatial information in a 2D planar visualization, which acts
as a live layer on top of a conventional satellite image-based mapping
system. To facilitate rapid and reliable camera-map calibration, we make
use of a semi-automatic calibration scheme. The scheme allows users to
pre-define essential projection attributes for each camera in a set-up
stage, and map these video streams onto a live layer of the map. We
have also developed several schemes for visually mapping information
extracted from videos, including traffic speed and density, and uncertainty
in illustration. This form of traffic video visualization can potentially reduce
the need for specialized traffic sensory devices and infrastructure, and
enable better utilization of the existing video-based traffic sensory
network.
N/A Complete 0 2009-ST-
061-CI001
No Field Monitors FALSE David
Ebert
Purdue University IN 2010 Sampling
2 Resource
Allocation
SP 15 Task 2: VASA 2010/07 2011/06 Effective analysis for emergency situations caused by
severe weather conditions and natural disasters requires
understanding of a comprehensive set of data, including
weather, critical infrastructures, and transportation network
logistics. However, both civic and business analysts often
encounter difficulty in estimating the impact of an event,
forecasting damage, and discovering optimal solutions from
various resources due to incomplete sets of data, lack of
reliable simulation models, and no existing environments for
decision-making. We are designing and developing a visual
analytics system that provides this environment for
analysts and decision-makers. In order to provide
awareness of current and forecasted impact caused by the
natural events, our system presents historical and
simulated events (e.g., hurricanes, tornadoes, blizzards)
where users can instantly consider various scenarios,
alternative and operational and simulation attributes. Based
on these decisions and parameters, new simulations may
be run to explore the effects on multiple critical
infrastructures (e.g., power, computer networks, water,
transportation, sewer) and the effectiveness of contingency
plans and mitigation strategies. One example is a franchise
food network where food delivery routes need to be
changed based on store and infrastructure damage. In our
visual analytics environment, analysts and decision-makers
can effectively monitor the situation, understand the impact
of these storms on critical infrastructure, and evaluate
potential re-routed road paths for the food network with
adjusted parameters
Hypothetical stores in North Carolina damaged by Hurricane Irene were
looked at. In our visual analytics environment, analysts and decision-
makers can effectively monitor the situation, understand the impact of
these storms on critical infrastructure, and evaluate potential re-routed
road paths for the food network with adjusted parameters.
N/A Complete 74918 2009-ST-
061-CI001
No FALSE William
Ribarsky,
Isaac Cho,
Kelly
Gaither,
David
Ebert
Office of University
Programs, Science &
Technology
Directorate
CA; NC;
PA; SC;
VA
2010
2 Resource
Allocation
SP 16 - VASA 2010/07 2011/06 The goal of VASA (Visual Analytics for Security
Applications) is to apply visual analytics to disaster
prevention and crisis response, with a focus on critical
infrastructures in logistics, transportation, food safety,
digital networks and power grids at the national levels. The
connectedness and dependency of these critical
infrastructures make the problem of monitoring and
understanding their functioning and dependencies one of
the most complex analytical tasks faced by our societies.
Their proper functioning is crucial for the well-being of the
population, economic viability, and most of all to prevent
loss of life. The VASA project proposes the application of
visual analytics to the problems of monitoring and
understanding critical infrastructures, cascading
infrastructure effects, and to the management of crisis
response. While, for example, there exist detailed models
for individual types of infrastructures such as electric power
grids, these do not encompass the various
interconnections and interdependencies one needs to be
aware of to make risk estimation decisions and for
performing operational risk management. What is therefore
required is a mechanism for conjoining the information
available for individual infrastructure sectors and providing
unified views and analytical tools for planning and decision
support. VASA is conceived as a three-year German-US
collaboration project from science through prototypes and
demonstrations to evaluations for transitions into practice
which leverage other investments from both countries. The
VACCINE team will continue requirements analysis and
project definition for deliverables as well as begin
acquisition of appropriate datasets and models for the
project Deliverables - Based on the submitted proposal
Hypothetical stores in North Carolina damaged by Hurricane Irene were
looked at. In our visual analytics environment, analysts and decision-
makers can effectively monitor the situation, understand the impact of
these storms on critical infrastructure, and evaluate potential re-routed
road paths for the food network with adjusted parameters.
N/A Complete Research 1085896 2009-ST-
061-CI001
No FALSE William
Ribarsky,
Isaac Cho,
Kelly
Gaither,
David
Ebert
2 Resource
Allocation
(CgSARVA) Coast Guard
Search and Rescue Visual
Analytics
2010/06 2014/09 cgSARVA is a vital component for analyzing and assessing
operational efficiencies of different Coast Guard missions
across the United States. The system aids with the risk
assessment of potential staffing changes by using visual
analytics to help understand networks and currently
demonstrates relationships within the DHS Centers of
Excellence (Centers, People, Institutions, Projects). The
analyst will be able to understand the distribution of
incidents, the risk, and the benefits involved with the
reallocation or reduction of resources. The goal is to aid in
a more effective decision making process by looking at the
current resources allocated across mission areas and
geographic locations for the U.S. Coast Guard. This is
accomplished by analyzing trends, patterns and anomalies
associated with distributing the cases in both space and
time conducted by the USCG. Additionally, this assessment
tool enables the determination of potential increase or
decrease in risk with a reallocation of resource; as well as
known increases or decreases in response time. The
system has been developed utilizing a user-centered
approach where the expertise of several different Coast
Guard analysts and decision makers has been leveraged in
the design process of the system.
cgSARVA is deployed and in use by the United States Coast Guard. USCG to take maintenance responsibility for system. Complete Research 87600 2009-ST-
061-CI001
No Expert Consultation FALSE David
Ebert
Purdue University IN DHS U.S.
Coast
Guard
2013 Advanced
Data
Analysis
and
Visualizati
on; Risk
and
Decision
Sciences
Case
Studies;
Modeling;
Risk
Assessme
nt;
Sampling;
Statistical
Analysis
Engineerin
g;
Geographi
c
information
sciences;
Computer
Science;
Risk
manageme
nt/assess
ment;
Biostatisti
cs and
bioinformat
ics
Operation
al Use
1 Law
Enforcem
ent
Hazmat Placards 2010/06 2010/08 Rolled into MERGE Introduction: Over the past ten years
there have been thousands of incidents involving
hazardous material carrier that have caused or had the
potential to cause human injury and property damage. A
substantial portion of these damages and anxieties may be
prevented by having a quick and accurate representation of
response information available to first responders. In
MatLab, we use the Image Processing Toolkit to process
our images through detection, filtering, etc. We are
currently still developing the algorithm to accept various
input from the user and in the future the feature of using the
camera to perform image processing will be added.
Initiative: We are developing an algorithm that detects a
placard by its color, symbol, and ID/class number. Methods
involved in this process are edge detection, morphology,
filtering, which are featured in the MatLab Image
Processing Toolkit. First, we will have to detect the edges
around the placard. By detecting these edges, one the
purposes of image processing is to get rid of the any
background images. Inside the placard, we detect the color
of the sign by using basic morphological algorithms for
connected components and hole filing. Our next approach
will be detecting the placard's symbol and ID/class number.
Results: The application is still in development, however,
once it is completed we expect the application to be
capable of receiving user input about the HazMat placards
such as class number, ID number, and symbol displaying
images of placards matching the user's specifications, and
displaying emergency response information on a selected
placard. Conclusions From the work that we have done so
far, we believe that in the future this application could help
first responders shorten their response time which could
Placards were created for research use with application. As the next step of this project, MERGE (Mobile Emergency
Response Guide) system was developed. The MERGE system is
an integrated mobile-based system that makes use of location-
based services and image analysis methods to automatically
interpret the hazmat sign and quickly provide guide information to
users. The MERGE mobile application is capable of detecting
hazmat signs from an image and querying an internal database to
provide accurate information to first responders in real time.
Complete Research 94139 2009-ST-
061-CI001
No FALSE Edward
Delp
Purdue University IN

E Educatio
n
RECONNECT Workshop
2010 - Extracting and
Visualizing Information from
Natural Language Text
2010/06 2010/06 Automatic identification and extraction of desired
information from natural language text is increasingly used
as a way to improve general purpose search and has a
range of applications in medical informatics, business
applications, and for the intelligence community. The input
is one or more texts in the domain in question, and the
output is a database containing just the desired fields of
information, extracted from the source material and
formatted appropriately. Information extraction (IE)
techniques have been developed since the early 1980s,
and include finite state technology, pattern-based
extraction, and appropriate machine learning methods. This
week-long workshop will take participants from the early,
simpler, methods through the modern ones, and will include
theoretical and practical topics as well as hands-on
exercises using software packages. The material is very
relevant to the undergraduate classroom and to many
applications. The lecturers are renowned experts in the
various aspects of IE and its visualization, and have a long
history of giving informative, engaging, and fun lectures.
CCICADA/VACCINE Summer Reconnect Workshops exposed faculty
teaching undergraduates to the role of the mathematical sciences in
homeland security and provided an opportunity to researchers in
government or industry to learn about recent techniques in data analytics.
John Stasko participated in teaching RECONNECT 2009 that was held at
Rutgers University. RECONNECT 2010 was held at USC. Midge Cozzens
and John Stasko taught at RECONNECT during the summer 2010.
Planning is currently underway for a workshop with public safety
professionals to be hosted by VACCINE and the Justice Institute of
British Columbia in September 2010. Planning is underway for a
September workshop on visual analytics for public safety professionals.
The workshop will be held at the Justice Institute of British Columbia.
Participants will include first responders from Canada and the US as well
as VACCINE partners. The purpose of the workshop is to define the
requirements that will lead to developing academic programs and relevant
technology utilizing visual analytics in the public safety environment.
VACCINE has had several meetings with FLETC to discuss
training needs and ways that FLETC and VACCINE can work
together. Some initial discussions include: FLETC faculty
partnering with VACCINE faculty for research, developing a basic
course on visual analytics and how it can be an essential tool for
law enforcement, and continuing development of mobile
applications.
Complete Informatio
n-driven
Visualizati
on,
Modeling
and
Simulation
of Data
Seminar/Sympo
sium/Workshop
0 200 No Data Mining FALSE Eduard
Hovy
University of Southern
California
CA; NJ Academic
Community;
Federal
Bureau of
Investigatio
n;
Intelligence
Community;
U.S.
Department
of Defense
2010 06/2010 Advanced
Data
Analysis
and
Visualizati
on;
Communic
ations and
Interopera
bility;
Social,
Behavioral
, and
Economic
Sciences
Data
Collection/
Generatio
n
Biometrics
;
Qualitative
Analysis;
Sampling
Informatio
n Science;
Informatio
n systems;
Mathemati
cal and
Computati
onal
Modeling;
Rhetoric
Adopted
by End
User
1 Law
Enforcem
ent
TRIP: Trip Response
Investigative Profiler
2010/06 2013/07 Technology allows law enforcement personnel to
geospatially and temporally visualize and analyze
residential location patterns for individuals who are required
to provide law enforcement with their places of residence.
As individuals' movements could have correlations with
social and/or geo-temporal factors, it is critical to
understand the movement behaviors and spatio-temporal
patterns of individuals. Moreover, needs for integrated
visualization and analysis of the spatio-temporal movement
history motivated the development of our tool. TRIP
enables spatio-temporal visualization, exploration and
analysis among individual movements as well as individual
movement and infrastructures. Given individual movement
history, various geo-spatial and temporal cues are
visualized. As geo-spatial cues, locations markers including
newest/oldest indicators, driving routes, reachable areas
along the routes and county boundary are overlayed on the
map. The routes and reachable areas are also used to
present possible relationships and shared areas among
individuals' movement as well as individuals and
infrastructures. As temporal cues, each location is
numbered in temporal order. Route connecting locations
changes its thickness to show that an individual moved
towards the direction increasing the thickness.
Furthermore, the duration of stay at each location is
highlighted using ring shaped glyphs.
Collaboration with end-user; Delivered and in use. N/A Complete 0 No FALSE David
Ebert
Purdue University IN; CA Center for Visual
Analytics for
Command,
Control, and
Interoperability
Environments
2007
2 Resource
Allocation
A Data Integration
Framework for Enhancing
Emergency Response
Situation Reports with Multi-
Agency, Multi-Partner
Multimedia Data; Public
Safety Coalition Projects
2010/04 2011/03 In this project, we propose to use advanced data
integration and visual analytics techniques to
systematically augment situation reports which include
pictures and text with relevant multimedia content obtained
in the field. Our proposed framework implements the offline
Multimedia Analysis Framework (MAF) to associate
situation reports with relevant multimedia content. The MAF
framework includes a Hierarchical image classification
component developed based on multi-source data fusion
and some data mining techniques, such as multiple
correspondence analyses (MCA). The situation report is
pre-processed by using the GATE system and WordNet to
associate location-subject pairs. We also provide the
prototype with applications to emergency response.
Specifically, an iPad application based on the proposed
framework has been developed using the pre-defined
ontology with the incorporation of domain knowledge.
Furthermore, a system improvement mechanism based on
user feedback is designed to refine the association
between situation report and multimedia data. Finally, the
proposed system was evaluated by collaborating with EOC
department of Miami-Dade, where the personnel have
expressed interest in the application and encouraged us to
further develop the system into an operational pilot.
A Disaster Multimedia Search Engine is developed as an iPad application
and can be used for retrieving and visualizing the categorized disaster
multimedia data. The underlying key techniques include various
multimedia semantic analysis and retrieval methods developed by our
group. We also develop web-based systems for storyline generation and
disaster susceptibility comparisons among cities based on text mining
and visualization techniques. The developed methods will greatly improve
situation awareness during or after disasters.
Build up an automatic workflow that integrates the processes
starting from the feature extraction to semantic concept detection
into the complete MADIS system; Define an event-based
response trigger monitor for periodically model re-training; Utilize
the reports that are available on the website (FIUDRT)
https://fiudrt.org/ as one of the information resources.
Complete Research 0 2009-ST-
061-CI001
No Data Mining FALSE Shu-Ching
Chen
Florida International
University
FL; IN DHS
Federal
Emergency
Managemen
t Agency;
State and
Local First
Responders
2014 Case
Studies;
Modeling;
Sampling;
Statistical
Analysis
Computer
Science
Pilot/Field
Testing
and
Evaluation
in an
Operation
al
Environme
nt
2 Resource
Allocation
SP 15-Task 3: Event
Evacuation Planning; Public
Safety Coalition Projects
2010/04 2011/03 In collaboration with the Department of Justice, and several
police departments, we have created a situationally-aware
evacuation modeling and decision-making capability. This
capability is developed in conjunction with the mobile 3D
routing client-server system described in our report for
MDRP 3. The evacuation model gives optimal evacuation
routes based on number and distribution of building
occupants. It can be applied to multiple urban buildings and
the surrounding street network. The evacuation plan can be
updated based on new events such as blocked exits or
unexpected evacuee traffic. Since the thousands of times
steps produced in a typical model run will be of limited
immediate use to emergency responders, we are
developing a method to automatically extract the key
events in the evacuation model results (e.g., where and
when key points of congestion occur around stairwells and
exits) so that they can clearly see where to deploy
responders and what to do. Through the command post of
the client/server system multiple first responders can send
location, search, images, evacuation status, and other
information. Thus the system provides a detailed,
comprehensive view of a large evacuation as it unfolds.
Our goal is to show the constantly evolving, large scale first
response and emergency evacuation scenario in an
understandable way with key events identifiable. We are
developing models for large arenas, conference facilities,
and stadia that will be embedded in urban models.
Situationally-aware evacuation model with several building examples and
ability to expand to new buildings. The model is available for use by DHS
S&T stakeholders, customers, and to partners such as PNNL. We have
begun to prepare for an evacuation exercise built around a scenario of a
nuclear emergency at the McGuire Nuclear Power station, about 15 miles
from the UNC Charlotte campus. Emergency planners and responders,
including UNCC Police, Charlotte Mecklenburg Emergency Management,
and FEMA observers, will use the on-campus field house as an
evacuation site. The exercise will take place in Summer, 2011, and we
will provide a report of results to DHS.
N/A Complete Research 23748 2009-ST-
061-CI001
No FALSE William
Ribarsky;
William
Ribarsky
University of North
Carolina-Charlotte;
University of North
Carolina at Charlotte
NC State and
Local First
Responders
2010 Operation
al Use
E Educatio
n
SP 14 Task 3: Technical
Integration into ExPOD at
JIBC
2010/04 2011/03 The JIBC has been developing and conducting simulations
for more than 30 years. Introduced by the JIBC, ExPod
(Exercise Point of Delivery) is a virtual simulation-based
learning tool that can be used to enhance any training or
exercise program. And with its web-based format, ExPod
can deliver immersive, interactive scenario-based training
exercises anywhere, anytime. Over the past six years, the
JIBC's computer simulations have become an integral and
key delivery method for provincial, national, and
international organizations
ExPod can be integrated into any course, exercise or
training program across the learning spectrum. This allows
public safety teams participating in exercises to practice,
test and critique operational plans and procedures as well
as promoting interagency cooperation and group dynamics.
ExPod works in the following manner:
1. Participants are divided into small pod groups and
receive information via video/audio clips and computer
communications.
2. Subject Matter Experts control exercises through web
chat and video conferencing.
3. Pod groups work through scenarios by completing tasks
and making decisions.
4. Individual pods can interact with each other or work
independently, depending on the design and objectives of
the exercise.
5. Key decisions are shared and discussed through virtual
plenary sessions.
6. All activities are monitored and decisions/rationales are
stored for future review.
Completed. N/A Complete Research 5000 2009-ST-
061-CI001
No FALSE David
Ebert; Alan
MacEachr
en
Purdue University;
Pennsylvania State
University
PA; IN
1 Law
Enforcem
ent
Visual Analytics Law
Enforcement Technology;
Public Safety Coalition
Projects
2010/01 2017/06 The exploration of criminal incident reports for detecting
trends, discovering anomalies and evaluating resource
usage is an ever-expanding issue for law enforcement
agencies. As such, tools need to be developed that assist
law enforcement officials in their analysis in order to take
preventive measures and judiciously allocate available
resources. In order to better facilitate crime incident
analysis, we have developed a comprehensive visual
analytics system for both PCs and mobile devices which
provides police officials with access to their data on the fly.
The application was developed for both the Windows PC
environment and the Apples iOS platform and can run on
any compatible devices including the iPhone, iPod, and
iPad. Our system allows users to visualize data geo-
spatially on a map and provides filtering tools that filter
crime by the type of offense committed. The crime being
visualized can additionally be filtered by time to analyze the
correlation of different crimes with time. These set of tools
enable the users to analyze data more efficiently and
accurately wherever they are with limitations only to places
without mobile signal coverage. Our system enables users
to view a history of previous crime incidents and forecast a
pattern of crime using automated algorithms. Moreover, the
users have the ability to receive immediate feed of events.
This is especially beneficial to first responders and allows
them to better deal with any catastrophic situation.
On Friday, September 30, a demonstration of two new enhancements to
the Visual Analytics Law Enforcement Toolkit (VALET) was provided to
the Lafayette Police Department, West Lafayette PD and others. This
presentation showcased how VALET filters through crime-related
activities within various areas of our community and selects officers to be
sent to the corresponding locations based upon their performance
ranking. In general, these luncheons provided a forum to provide
tool/technology updates and they were an opportuntiy to learn about the
challenges of public safety officials.
N/A In
Progress
0 2009-ST-
061-CI001
No Compiling and Sorting
Database
FALSE David
Ebert
Purdue University AZ; IN State and
Local First
Responders
2016 Modeling;
Sampling;
Statistical
Analysis
Biostatisti
cs and
bioinformat
ics;
Computer
Science
Operation
al Use

1 Law
Enforcem
ent
MDRP 3: (GeoViz &
CrimeViz) Situational
Surveillance & In-field
Criminal Investigative
Analytics
2009/07 2013/06 GeoVISTA CrimeViz (Geovisual Analytics for
Spatiotemporal Crime Analysis) is a web-based map
application that supports exploration and analysis of
criminal activity in space and time. The over-arching goal
for the first year was to develop methods for combining
syndromic surveillance data with detailed synthetic social
network based epidemic simulations for improved state
assessment, support of insight building and consequence
analysis for decision makers. VACCINE developed novel
methods for enabling event animation in map mashups and
for more efficient web-map client server interaction. In
addition, advances in spatio-temporal analysis methods
have been achieved and integrated into the GeoViz Toolkit.
Discussions have been initiated with the Harrisburg
Department of Police about transitioning our CrimeViz web
mapping tool for representation and tracking of crime
incidents. Work in this project focused on development and
application of new exploratory visual analytic (EVA)
mapping methods to support criminal investigative
analytics. The team developed situational surveillance
visual analytics tools to process large volumes of
geographically referenced data searching for events of
interest. This work will integrate the Visualization Sciences
teams work into the Data Analytic teams work for the Port
Authority of New York/New Jersey (PA NY/NJ). Emphasis
was on methods and tools for making sense of and
analyzing numerical and categorical data that contain
geographic and temporal references, thus on understanding
and visualizing the space-time dynamics on the phenomena
investigated and on identifying and tracking change over
time. Methods developed will be implemented in component-
based software that support the mixing and matching of the
The research produced a detailed analysis of the current role of
interactive maps in law enforcement and insights on impediments to
making use of the latest advances in technology. It also generated
evidence about the relative success of different representation and
interface strategies. Implementation of the CrimeViz software in
collaboration with the Harrisburg Bureau of Police provided a real-world
proof of concept for the web-based interactive query and mapping
methods developed. Parts of the results have been translated into
general web-based software components that can take advantage of a
strategy for multi-component coordination in JavaScript developed with
separate funding (from the US Army Corps of Engineers).
N/A Complete Research 229728 2009-ST-
061-CI001
No Data Mining FALSE David
Ebert, Alan
MacEachr
en
Purdue University IN; PA; VA;
NJ
Academic
Community;
Center for
Disease
Control and
Prevention;
DHS Labs;
DHS
Science and
Technology
Directorate;
State and
Local First
Responders
2013 Advanced
Data
Analysis
and
Visualizati
on;
Biological
Threats
and
Counterme
asures;
Social,
Behavioral
, and
Economic
Sciences
Case
Studies;
Econometr
ics;
Modeling;
Molecular
Biology/Ge
nomics;
Risk
Assessme
nt;
Sampling;
Statistical
Analysis
Preparedn
ess
training;
Computer
Science;
Risk
manageme
nt/assess
ment;
Geography
;
Informatio
n Science
Operation
al Use
1 Law
Enforcem
ent
MDRP 5: Cybersecurity
Visual Analytics
2009/07 2010/03 While the frontline of cybersecurity is likely to always be
computer-driven -- leveraging pattern recognition, machine
learning, and other highly automated techniques, these
approaches are not sufficient. The adversaries in network
security are intelligent and highly-motivated humans who
continuously evolve new attack techniques to avoid any
fixed defense. Network security analysts play a key role in
proactively identifying and designing responses to new
attacks or exposed weaknesses. Here, engaging the
powerful pattern recognition abilities of the human visual
system is essential in the analysis of the massive amounts
of data involved. Thus, a focus of this project has been on
developing tools for the frontline analysts. However, the
complexity and scope of cybersecurity analytics requires
the development of tools which move beyond simply
visualizing the network traffic data. Successful tools must
also provide a framework for developing higher-level
semantic models to provide a simplifying level of
abstraction, enabling greater analytic sophistication. To
that end, VACCINE is coupling our tools to insights gained
from basic research on network traffic data elements.
There are two major results for this year. First, VACCINE has made
substantial progress in
deploying one of their tools, Isis, at US-CERT Operations by convincing
the group to acquire the
necessary database infrastructure for interactive visual analytics (details
below). The team has
acquired independent funding for much of this transfer work, and hopes to
have it completed
within another year’s time. If this effort is successful, they hope not only
to have transferred
technology to a DHS frontline unit, but also, and perhaps more
importantly, to have learned what
is involved in making such a transition from research to operations.
The second result is the first fruit of our effort to understand the
fundamentals of network traffic.
The team has been able to use visual analytics and statistics to develop
a principled
understanding of SSH traffic. From that understanding, they have been
able to develop an
algorithm, which identifies packets carrying SSH keystrokes even though
all SSH traffic is
encrypted. This algorithm operates on the packet dynamics of any TCP
connection. It has been
constructed in a streaming fashion in order to make it practical for use on
high-speed links.
N/A Complete 308619 2009-ST-
061-CI001
No Compiling and Sorting
Database
FALSE David
Ebert
Purdue University CA; IN Academic
Community;
Critical
Infrastructur
e Owners
and
Operators;
DHS Labs;
Intelligence
Community
2010 Advanced
Data
Analysis
and
Visualizati
on;
Infrastruct
ure
Protection;
Risk and
Decision
Sciences
Case
Studies;
Modeling;
Statistical
Analysis
Biostatisti
cs and
bioinformat
ics;
Computer
Science
Laboratory
Testing
and
Evaluation
1 Law
Enforcem
ent
MDRP 7: Introducing
Sustainable Visual Analytics
into Command Center
Environments
2009/07 2013/06 MDRP7 focuses on the development, fielding and
maintenance of next-generation command and control
environments. In their current stages of development, DHS
command and control system initiatives such as Virtual
USA and Watchkeeper focus primarily on delivering a
common operating picture, a common communication
platform and, occasionally, analytic support for key
decisions. MDRP7 develops strategies and field
demonstrations that extend these evolving capabilities by
placing them in the context of two additional capabilities: (1)
support for the ways the multi-stakeholder security
community has chosen to work together (in the case of
DHS systems, the NIMS Incident Command System) and
(2) the sustainability of these systems based on
stakeholder ownership, trust and, most importantly, the
ability to achieve continuous improvement through actual
use. The critical strength of NIMS/ICS is that it supports the
integrated efforts of a community of diverse stakeholders
managing a complex, evolving situation from diverse
perspectives involving many different roles, responsibilities,
decisions and actions. While NIMS/ICS provides a
blueprint, the necessary level of coordination and
communication can be difficult to achieve, especially given
the many different agencies, organizations and units
involved, each with its own mission, jurisdiction, processes,
databases, systems and cultures. MDRP7 is working on
next-generation CCI systems (what some call Precision
Information Environments) that will provide critical
information and communication capabilities within an
environment that supports the unique, yet coordinated
efforts of the diverse safety and security community. To
support the many perspectives and roles within the security
Under an SBIR led by Truestone, Inc., we teamed with FAZD (Texas
A&M) and VACCINE (Purdue) to deliver and assess the second iteration
of a next-generation CCI system. Thanks to our ongoing collaboration
with the Puget Sound Port Readiness Committee (PRC), we were able to
plan and conduct a computer supported “worst-case” table-top exercise in
the Fall using a “Truevue dashboard” to present the scenario and share
information among the participants. There was general agreement within
the PRC that there would be significant benefit from such an exercise,
especially considering that there would be a change of command within
the Army’s 833rd Transportation Battalion during the summer. Completed.
N/A Complete Research 5080 2009-ST-
061-CI001
No Expert Consultation FALSE David
Ebert
Purdue University IN; TX;
WA
Center for
Disease
Control and
Prevention;
Critical
Infrastructur
e Owners
and
Operators;
DHS U.S.
Coast
Guard;
Federal
Bureau of
Investigatio
n; State and
Local First
Responders
2010 Communic
ations and
Interopera
bility;
Emergenc
y
Preparedn
ess and
Response;
Human
Factors
Aspects of
Technolog
y
Case
Studies;
Modeling;
Sampling;
Statistical
Analysis
2 Resource
Allocation
MDRP 9: (Rosetta Phone)
Mobile Imaging, Rosetta
Phone, and Light-Weight
Visual Analytics for In-Field
Analytics
2009/07 2013/06 The Rosetta Phone is a hand-held translation device for
foreign text currently being developed by Purdue in
collaboration with Next Wave Systems, LLC. The goal of
this device is to enable an individual with little or no prior
knowledge of foreign languages to recognize and translate
foreign text in real time and without the use of a network
connection. This particular project focuses on developing
the methodology and software needed to enable the
Rosetta Phone to automatically read and translate Spanish
documents.
The project resulted in the DHS report we wrote that is available at:
https://www.dhs.gov/publication/chicago-lte-video-pilot-report. Completed.
N/A Complete Research 0 2009-ST-
061-CI001
No Bench Tests FALSE David
Ebert
Purdue University IN Academic
Community;
Center for
Disease
Control and
Prevention;
Critical
Infrastructur
e Owners
and
Operators;
DHS U.S.
Coast
Guard; DHS
U.S.
Customs
and Border
Protection
2012 Advanced
Data
Analysis
and
Visualizati
on;
Biological
Threats
and
Counterme
asures;
Border
Security
Biometrics
; Case
Studies;
Econometr
ics;
Genomic
Testing;
Modeling;
Molecular
Biology/Ge
nomics;
Risk
Assessme
nt;
Sampling;
Statistical
Analysis
5 Financial
Flows
Tools
MDRP 11: Financial Fraud
Visual Analytics
2009/07 2014/06 This projects goal is to develop and evaluate new visual
analytics tools to explore and discover behaviors
(suspicious behavior, emerging risk behavior) in financial
transaction data. To uncover suspicious behavior, we are
developing a set of tools based on a hierarchical data
model for interactive exploration even with millions of
transactions over up to a years time period. This approach
uses multiple views of the transactional data to pinpoint
suspicious behavior that would not be apparent with just
one view. The analyst can then drill down to the particular
account or related accounts (having the same keyword
signatures) for detailed investigation. Emerging risk
analysis is a much broader area that seeks to uncover
emerging risk in the banks transactional, credit card, and
loan portfolios that may not be adequately accounted for.
The effect of the economic downturn and job losses in
specific industries on unsecured loans for specific groups
of customers is an example of such emerging risks. Tools
such as those used for fraud analysis, geographic analysis
tools, and tools to include and correlate multiple dimensions
of behaviors and ratings are being developed or applied to
this analysis. Emerging risks are important factors for
resilience of financial institutions and the financial system.
A procedure for creating simulated bank transaction datasets has been
developed. The WireVis tool for analyzing bank transactions over
extended periods of time is available to DHS partners and customers. We
are expanding its capabilities to analyze the unstructured text fields that
accompany transactions and that describe the purpose of a transaction,
identify payees, and give other information. There are currently no
automated methods to study these fields and connect them to the
transactional records.
Potential licensing to a government contractor. Complete Research 417775 2009-ST-
061-CI001
No Compiling and Sorting
Database
FALSE William
Ribarsky
University of North
Carolina at Charlotte
IN; NC; MA Academic
Community;
Consumers;
Critical
Infrastructur
e Owners
and
Operators;
Federal
Bureau of
Investigatio
n;
Intelligence
Community
2010 Advanced
Data
Analysis
and
Visualizati
on;
Infrastruct
ure
Protection;
Social,
Behavioral
, and
Economic
Sciences
Case
Studies;
Econometr
ics;
Modeling;
Risk
Assessme
nt;
Statistical
Analysis
Computer
Science
4 Disease
Surveillan
ce
MDRP 12: Foreign Animal
and Zoonotic Disease
Visual Analytics
2009/07 2013/06 This work focuses on developing and applying new
exploratory visual analytics (EVA) methods for spatial and
space-time foreign animal and zoonotic disease data (e.g.,
data related to avian influenza, rift valley fever, swine flu,
West Nile virus). The VACCINE team will extend their
methods for spatial cluster and pattern analysis and their
implementation. A key goal is to provide tools that help
analysts clarify the spatial (and spatio-temporal) structure
of foreign animal and zoonotic disease phenomena, thus
leading to better disease outbreak prediction. In
complementary work they will explore use of geographic
information systems (GIS) to integrate disease,
environmental, demographic, and other geographic data
necessary to understand disease-environment and disease-
human relationships. Initial work will focus on creating an
initial prototype visual analytic system for Rift Valley Fever
(RVF) tailored to two user groups: epidemiological modelers
and decision makers. VACCINE efforts resulted in a suite of
spatial analysis methods implemented in the GeoViz Toolkit
that will lead to better understanding of diseases of
zoonotic origin. These methods include interactive cluster
detection, interactive spatial structure exploration (using
Morans I), and space-time spatial structure exploration
(using LISTA-Viz). These methods will be applied against
the West Nile virus dataset to investigate virus distribution
over space and time. Grant activities also included sorting
and aggregating Pennsylvania mosquito data to allow for
efficient data viewing through web-based application at
weekly/monthly/yearly intervals. This has also been done
for daily climate information. The year with the worst WNV-
positive mosquitoes as well as the most number of reported
human cases was used for preliminary testing of a web
The team has developed a new strategy for visualization coordination
through the combination of several recent advances in software
engineering: automatic introspection of objects, software design patterns,
and reflective invocation of methods. This strategy is called Introspective
Observer Coordination and demonstrates how this method can allow end
users to create their own visualization toolkits on the fly, solve challenges
associated with coupling spatial analysis methods to geovisualization
methods, and make geovisualization applications sharable between
users.
Complete Research 19320 2009-ST-
061-CI001
Yes Compiling and Sorting
Database
FALSE David
Ebert
Purdue University TX; IN; PA Academic
Community;
Center for
Disease
Control and
Prevention;
Critical
Infrastructur
e Owners
and
Operators;
Food and
Agriculture
Industries;
State and
Local
Transportati
on
2009 Advanced
Data
Analysis
and
Visualizati
on;
Biological
Threats
and
Counterme
asures;
Risk and
Decision
Sciences
Biometrics
; Case
Studies;
Econometr
ics;
Genomic
Testing;
Modeling;
Molecular
Biology/Ge
nomics;
Risk
Assessme
nt;
Sampling;
Statistical
Analysis
Risk
manageme
nt/assess
ment
Operation
al Use
1 Law
Enforcem
ent
MDRP 13: GeoJunction:
Collaborative Visual-
Computational Information
Foraging and
Contextualization to Support
Situation Awareness
2009/07 2013/03 This project focuses on developing, implementing,
assessing, and transitioning methods and tools to (a) help
analysts, crisis managers, and policy makers find and
contextualize relevant multimodal information quickly and (b)
to support the situation awareness (SA) that is required to
interpret evidence and make decisions in a continually
changing environment. Specifically, GeoJunction is
conceived as a knowledge-enabled, place-time aware, and
computationally enhanced web-based environment that
supports visually-enabled: (a) document query filtered by
place, time, person/organization, and concept, (b)
collaborative information foraging, entity and relation
extraction, and contextualization, (c) exploration of
connections between social and geographic networks, and
(d) situation assessment and monitoring with continually
updating information
1. Scalable visual analytic toolkit SensePlace2. a. Scalability ensured by
innovative database design, indexing that allows large-scale storage and
retrieval of social text streams such as those obtained Twitter. b.
Improved algorithms to geo-code mentions of location names in social
text streams in the presence of limited contextual information. 2. Timeline
functionality that allows for range queries for temporal attributes. 3.
Improved user interaction functionality 4. Clustering of similar tweets in
order to enable improved examination of topics being tweeted. 5. With
complementary funding from USACE, we developed methods to flexibly
access geographic information using the standard Geonames hierarchy
of place names for the world.
N/A Complete Research 0 2009-ST-
061-CI001
No Compiling and Sorting
Database
FALSE David
Ebert, Alan
MacEachr
en
Purdue University IN; CA; PA Center for
Command,
Control, and
Interoperability
Center for
Advanced Data
Analysis
U.S. Army
Corps of
Engineers
2011 Case
Studies;
Sampling;
Statistical
Analysis
Computer
Science
Laboratory
Testing
and
Evaluation

1 Law
Enforcem
ent
MDRP 14: Multimedia
Visual Analytics for
Investigative Analysis
2009/07 2014/06 The project applies visual analytics methods to a range of
problems of significance to DHS. In each case one or more
tools or products are produced. In several instances, the
tools are deployed to stakeholders. Capabilities produced
include: Multimedia analytics methods applied to
unstructured collections of images, video, and text. In some
cases, a full multimedia fusion is attained. Texts in any
language can be handled. Topic streams are identified and
events within the stream of text or other media are
indicated. Narratives can be constructed. Tens of
thousands of documents can be organized and their
interrelations and trends understood in this way. The
methods have been applied to document collections, media
streams, online news, social media, blogs, and other
content. Mobile emergency response and emergency
evacuation tools for urban environments have been
developed and deployed. These tools are situationally
aware; they can be updated immediately based on blocked
exits, blocked paths, unexpected distribution of people, etc.
Search, apprehension, and rescue tasks can be carried out
where the command center and deployed officers are in full
communication as to position and actions. A novel
capability has been developed to provide decision support
to commanders in complex emergency response situations
as they evolve. Risk analytics capabilities have been
applied to large and multi-faceted financial resources, such
as at a major bank or under the jurisdiction of a major
government agency. A fast access data structure has been
set up for exploratory risk analysis involving several
financial and geographic attributes of the users choosing. A
system of systems model has been set up for
understanding an urban electric smart grid infrastructure
Our image analytics and exploration tools and source code are released
to users at PNNL. They are available to customers in DHS S&T, if
desired. Our automatic object detection and classification tools and
source code are released to Vufind.com. They are available to customers
in DHS S&T, if desired. Our multimedia analytics tools including StreamIt,
Newdle, and PIWI are available to DHS S&T stakeholders and customers.
Our systems on multimedia analytics have been demonstrated at multiple
leading conferences and institutes.
Complete Research 0 2009-ST-
061-CI001
No Data Mining FALSE David
Ebert
Purdue University IN; NC Academic
Community;
DHS Labs;
DHS
Science and
Technology
Directorate;
Federal
Bureau of
Investigatio
n;
Intelligence
Community
2010 Advanced
Data
Analysis
and
Visualizati
on;
Biological
Threats
and
Counterme
asures;
Border
Security
Case
Studies;
Modeling;
Sampling;
Statistical
Analysis
Computer
Science
2 Resource
Allocation
MDRP 18: Visual Analytics
for the DHS Centers of
Excellence
2009/07 2012/06 The DHS Centers of Excellence has produced a wealth of
research, education materials, and projects over the years,
and this material will continue to grow as the activities of
the various centers expand. The ability for reflection,
analysis, and investigation of this material is vital, and may
yield both new and old connections, ideas, and thoughts.
Furthermore, exposing the material to the scientific
community and other government agencies, as well as the
general public, is an important goal of our Center. The
VACCINE team will leverage visual analytics methods for
interacting and exploring this large knowledge resource in
an interactive visual form that is easy to access for quick
browsing, yet powerful enough to support advanced
analysis and review. This project will develop table-based,
graph-based, and timeline-based visualizations of the DHS
Centers of Excellence program in an easily accessible
format, but which also supports faceted browsing and
querying on the multiple dimensions associated with the
data. These visualizations will be easy to expand with
future data without requiring redesign or rebuilding.
Journal articles and presentations were completed. N/A Complete Research 0 2009-ST-
061-CI001
No Compiling and Sorting
Database
FALSE David
Ebert
Purdue University CA; IL; IN;
GA; NJ
Academic
Community
2010 Case
Studies;
Statistical
Analysis
1 Law
Enforcem
ent
MDRP 17: START Center
Visual Analytics
2009/07 2010/03 The START Center of Excellence at the University of
Maryland has collected large amounts of data on terrorism
and terrorism response, such as incident event timelines,
social networks of terrorist organizations, and studies on
international terrorism and preparedness, but these
datasets can be difficult to overview and analyze
effectively. This complexity and scale pose a barrier when
exposing these datasets to the intelligence and defense
communities, as well as the general public. In this project,
the VACCINE team collaborated with START members in
applying visual analytics techniques to their data in a user-
centered design methodology intended to elicit their
particular needs and requirements for visualizing this data.
Particular objectives included entity resolution for detecting
duplicates in the Global Terrorism Database (GTD), as well
as spatiotemporal visualization for the Minorities at Risk
database
Journal articles were completed. Demonstrated collaboration between
COEs.
N/A Withdrawn Research 5429 2009-ST-
061-CI001
No Bench Tests FALSE David
Ebert
Purdue University MD; NC;
IN; NJ
National
Consortium for
the Study of
Terrorism and
Responses to
Terrorism
Academic
Community;
DHS Labs;
DHS
Science and
Technology
Directorate;
DHS U.S.
Customs
and Border
Protection;
Federal
Bureau of
Investigatio
n
2009 Advanced
Data
Analysis
and
Visualizati
on; Human
Factors
Aspects of
Technolog
y; Social,
Behavioral
, and
Economic
Sciences
Case
Studies;
Modeling;
Statistical
Analysis
Computer
Science
E Educatio
n
EP 1: Leadership and
Coordination
2009/07 2014/06 This project has been intentionally closed because it is
considered an umbrella project that encompasses the
general education program. The other education projects in
progress reflect the current status of the education
program**** The main objective during the initial period was
to develop an innovative and coherent education plan that
spans across the individual members schools of the
VACCINE center that also work in coordination with the
Rutgers-led Data Analysis Center. The team sought to
develop curricula and courses for visual analytics that could
be used as examples and templates at different schools.
Working together with colleagues at Purdue, Dr. Stasko
oversaw the strategic mission and efforts in the educational
programs of the VACCINE Center. He was involved with all
of the educational programs and missions, and represents
the Center at various activities. His particular
responsibilities during the period included participating and
teaching in the RECONNECT summer school session led
by the CICCADA Center, oversaw the Affinity Education
Research Groups, maintained the Visual Analytics Digital
Library, and participated at the education meeting of the
DHS University Summit
1. The Project PI and support faculty member visited Purdue University in
November to work on the Education Plan. 2. The Project PI and support
faculty member participated in monthly education conference calls as well
as the collaboration calls with Rutgers University. 3. The 2010
ADMI/A4RC conference was held on April 8-11, 2010 in Jackson, MS.
VACCINE was spotlighted in two conference sessions and the evening
Social Networking Event.
N/A Complete Research 0 2009-ST-
061-CI001
No Bench Tests FALSE David
Ebert
Purdue University NJ; GA;
IN; MS; TX
2009 Advanced
Data
Analysis
and
Visualizati
on;
Biological
Threats
and
Counterme
asures;
Border
Security
Biometrics
; Case
Studies;
Econometr
ics;
Genomic
Testing;
Modeling;
Molecular
Biology/Ge
nomics;
Risk
Assessme
nt;
Sampling
Computer
Science
E Educatio
n
EP 2: MSI Collaboration 2009/07 2016/06 The VACCINE Center is deeply engaged in developing
several successful programs for Minority Serving
Institutions (MSI). VACCINE fosters an education program
to expand the teaching of visual analytics at Minority
Serving Institutions (MSI). The program focuses on
preparing MSI faculty to incorporate visual analytics
courses into their programs. Learning topics and activities
in the workshops focus on: understanding the theory and
foundation of visual analytics, integrating visual analytics
into course curriculum, developing learning communities for
interdisciplinary courses, hands-on instructor-supported
tutorials on extracting various forms of big data, and a
unique group-designed application learning assignment. In
an effort to engage faculty and students from minority
serving institutions with the science of visual analytics,
VACCINE also participates in the DHS sponsored Summer
Research Team (SRT) program which offers summer
research opportunities that allows a faculty/student team to
conduct research on campus at the VACCINE research lab.
VACCINE also provides a 1-2 week visual analytics boot
camp for a group of undergraduate students from our
partner school Morgan State University. VACCINE student-
led demonstrations of our tools and technology gave the
MSU students the opportunity to get hands-on with
VACCINE resources and the ability to ask questions about
the center's research.
2015 Visual Analytics Faculty Workshop - Bethune-Cookman University -
June 18, 2015 - June 19, 2015 - MSI Summer Research Workshop for
Morgan State University undergrads - July 19, 2015 to July 25, 2015 -
VACCINE center was host to six undergraduate students from MSI
partner Morgan State University (MSU). The students were housed on-
campus at Purdue University and engaged in activities and presentations
that helped them to better understand visual analytics and its real-world
applications. DHS - Summer Research Team (SRT) for Minority Serving
Institutions (MSI). - May 25, 2015 - July 31, 2015 - Dr. Louis Ngamassi, a
College of Business professor at Prairie View A&M University,
successfully completed the SRT Program in the summer of 2015.
With the support of the VACCINE Center, Ngamassi is
incorporating visual analytics into a new course he is developing
entitled "Crisis Informatics."
Complete Big Data
Visual
Analytics
Research 264029 2009-ST-
061-CI001
No Compiling and Sorting
Database
FALSE David
Ebert
Purdue University Bethune-
Cookman
College;
Jackson
State
University;
Morgan
State
University
FL; MD;
MS; IN;
NJ; TX; CA
Critical
Infrastructur
e Owners
and
Operators;
Department
of Energy
National
Labs;
Federal
Bureau of
Investigatio
n; Food and
Agriculture
Industries;
State and
Local First
Responders
2015 Advanced
Data
Analysis
and
Visualizati
on;
Biological
Threats
and
Counterme
asures;
Chemical
Threats
and
Counterme
asures
Biometrics
; Case
Studies;
Econometr
ics;
Genomic
Testing;
Modeling;
Molecular
Biology/Ge
nomics;
Risk
Assessme
nt;
Sampling;
Statistical
Analysis
Computer
Science
E Educatio
n
EP 4: SURF Program
(Summer Undergraduate
Research Fellowships)
2009/07 2016/06 VACCINE hosts a group of students every summer as a
part of Purdue University's SURF Program. This program
helps undergrad students across the various disciplines of
science, technology, engineering and math discover once
in a lifetime opportunities available through research. The
program allows students to conduct their research and work
closely with our graduate students and research assistants
in the VACCINE research laboratory, and it gives them the
ability to explore, discover, and transform ideas into reality.
The selected students go through an in-depth application
process in which once accepted, are then actively engaged
during the 10 week program, which not only offers them
hands on research experience, but prepares them in other
areas such as professional development, research
seminars, and how to present their findings in a
professional manner. The SURF program has produced
invaluable assets to our lab and its research. Once the
program reached completion, several outstanding students
throughout the years have stayed on as research
assistants, winning awards and even becoming a VACCINE
Center Research Scientist.
VACCINE was host to 5 undergraduate students for the Purdue led SURF
program which ran from May 26, 2015 - August 7, 2015. Since the time
the summer program began, the students’ understanding of visual
analytics was greatly enhanced, and the students were able to learn
about the vast uses and applications of the field. The SURF students
were given the opportunity to immerse themselves in the VACCINE
laboratory and research environment and work closely with other
VACCINE HS-STEM and research assistants. Students worked on
VACCINE projects and technology throughout their summer fellowship,
which concluded with a poster presentation of their summer’s research at
the annual SURF Symposium on August 6th. For Mahesh Babu Gorantla,
this poster presentation proved rewarding, as his poster was selected
among the top ten posters of all the Purdue SURF research projects.
Gorantla worked closely with other students in the VACCINE lab to come
up with a solution for the VAST Challenge, a competition that involves
finding visual analytic approaches to solve to hypothetical, real-world
problems. Once the program was complete, two of the SURF students
stayed on as RA's continuing to work in the VACCINE lab.
N/A Complete Big Data
Visual
Analytics
183686 2009-ST-
061-CI001
No FALSE David
Ebert
Purdue University Jackson
State
University
MS; IN Academic
Community
2015 Advanced
Data
Analysis
and
Visualizati
on
Classroom
Education
E Educatio
n
EP 5: Graduate Programs 2009/07 2015/12 For reporting purposes, this work is reflected in and has
been combined with the HS STEM project.**** This
component of the education mission involves graduate
programs and education at the VACCINE Center. One
specific goal of this project was to promote and coordinate
graduate courses and programs at the VACCINE member
universities and beyond. The Center gathered and
maintained a list of related courses already being taught at
our universities. Also, together with colleagues from the
FODAVA Center and NVAC, the team created and
publicized a Body of Knowledge for visual analytics.
The team gathered an initial list of courses and education programs at our
member universities, but they have not made this into web pages for the
VACCINE website yet. In the current educational climate of limited
budgets and expansion, the team decided not to spend time developing a
new visual analytics course or Masters degree. We created the body-of-
knowledge and posted it on a website at Georgia Institute of Technology
for members of the visual analytics community to comment on. It is
unclear what next steps this project will take. We are planning to hold a
one-day workshop on visual analytics courses and curricula in
conjunction with the NVAC Consortium Meeting on August 30, 2010.
Complete Research 0 2009-ST-
061-CI001
No Compiling and Sorting
Database
FALSE David
Ebert
Purdue University GA; IN Academic
Community
2009 Advanced
Data
Analysis
and
Visualizati
on
Case
Studies
Computer
Science
E Educatio
n
EP 6: HS-STEM Career
Development Program
2009/07 2017/07 The HS-STEM Career Development program is a
competitive program funded through DHS that was
established at Purdue in 2007. This program is designed to
support graduate students in developing the skills to
become preeminent scientists in the homeland security and
technical communities. This United States Department of
Homeland Security funded program offers career
development scholarships and fellowships, as well as
forgivable loans with summer research opportunities and
one year service commitments. The goal is to aid students
in professional development by offering assistance in grant
writing, resume prepardness, poster presentations, and
leadership skills. We also encourage our students to
participate in internship opportunities within the DHS
Components.
HS-STEM Career Development Program The HS-STEM Career
Development program is a competitive program funded through DHS that
was established at Purdue in 2007 under Dr. David Ebert. Monthly HS
STEM lunches are provided in order to offer learning and networking
opportunities for students with various disciplines, but who all share an
interest in Homeland Security. This is a time for students to discuss their
career aspirations and status, and determine if their plans are consistent
with a career in homeland security. Additionally, students are required to
submit semester reports and updates on their research and any service
in which they are participating. The VACCINE team, encourages the HS
STEM Fellows to serve as research assistants in the VACCINE lab if they
are qualified. This initiative began in the fall of 2014, and it is expected
they will have a more direct understanding of Homeland Security as a
result of their participation on VACCINE projects. The following is a brief
description of each HS STEM Fellow: Phillip Forsberg successfully
completed the program and graduated in August of 2016. His year of
service was fulfilled by working full-time at Pacific Northwest National
Laboratory (PNNL) at the Department of Energy in Washington DC. He
worked within NA-14, the Office of Decision Support, within Defense
Programs (NA-10). They are responsible for directing the safe, secure,
and effective operation of nation’s nuclear stockpile. At the end of his
year of service, he was offered a permanent position as a federal
employee at the Department of Energy. Scott Carr passed his preliminary
exams. He is currently working on his thesis, and Scott is on track to
graduate in December 2016. His accomplishments include a paper
accepted to Network and Distributed Systems Security Symposium, a top
tier cybersecurity conference, and he submitted a paper to Computer and
Communications Security Symposium 2016. Scott was awarded the
Network and Distributed Systems Security Symposium Travel Grant.
During the spring semester, Scott interned at Mozilla in San Francisco,
CA where he worked on the Rust programming language compiler. Rust is
a system programming language designed to increase the security and
None. Last HS-STEM student funding has been transferred. In
Progress
Research 431090 2009-ST-
061-CI001
No FALSE David
Ebert
Purdue University IN Center for Visual
Analytics for
Command,
Control, and
Interoperability
Environments
Academic
Community
2016 Advanced
Data
Analysis
and
Visualizati
on;
Biological
Threats
and
Counterme
asures;
Border
Security
Classroom
Education
Basic
Research

E Educatio
n
EP 7: Professional
Development
2009/07 2017/06 VACCINE continues to work on professional training
strategies for local, state, tribal and federal emergency
responders and officials by providing on-line training
programs, workshops and short courses on data and visual
analytics. VACCINE and American Military University
collaborate to present a bi-monthly webinar series which
are in coordination with the framework of The National
Conversation on Homeland Security Technology created by
DHS S&T. Webinars will focus on a specific structured
dialogue topic related to homeland security technology in
an effort to get people talking about problems, challenges,
and solutions to keep our country safe. VACCINE also
fosters an education program to expand the teaching of
visual analytics at Minority Serving Institutions (MSI) which
prepares MSI faculty to incorporate visual analytics
courses into their programs. Learning topics and activities
in the workshops focus on: understanding the theory and
foundation of visual analytics, integrating visual analytics
into course curriculum, developing learning communities for
interdisciplinary courses, hands-on instructor-supported
tutorials on extracting various forms of big data, and a
unique group-designed application learning assignment.
VACCINE continues to support the DHS MSI SRT program
which offers summer research opportunities for an MSI
faculty/student team to conduct their research at the
VACCINE lab. VACCINE and the United States Air Force
Academy (USAFA) are working together to develop a
workshop to create scientific visual analytics learning
modules that can be integrating into core curriculum at
USAFA with the intent to expand to the United States Coast
Guard Academy as well. VACCINE and its scientific
researchers will work closely with faculty from USAFA and
VACCINE Center/American Military University Bi- Monthly Webinar Series
The webinar series launched July 31, 2015 and we currently have over
500 Registrants. Previous webinar topics include: 1. Decision Making and
Counter Terrorism: How the Visual Analytics of Data Can Help Save
Lives, presented by VACCINE Center PI Dennis Thom, Ph.D., The
Institute for Visualization & Interactive Systems, University of Stuttgart, &
James Hess, Ph.D., Faculty Director & Associate Professor, School of
Security & Global Studies, AMU. 2. Visual Analytics: A Case for Ethical
Decision Making, presented by Abish Malik, Ph.D., Research Scientist,
VACCINE Center, & Charles M. Russo, Intelligence Analyst & Certified
Adjunct Faculty Member, FBI, AMU. 3. Maritime Smuggling: How
Technology Can Disrupt the Network, presented by Dr. Edward Delp,
Professor of Electrical and Computer Engineering, Purdue University, &
Dr. Joe DiRenzo, Professor of Intelligence Studies, AMU. MSI Visual
Analytics Faculty Workshop The 2015 MSI Faculty Workshop was hosted
at Bethune-Cookman University in Daytona Beach Florida on June 17th
and 18th with 24 faculty in attendance. A welcome reception was held the
night before on the 17th. The workshop was also attended by Stephanie
Willett from DHS. The 2016 MSI Faculty Workshop will be hosted at
Florida International University in May with planning in progress. DHS MSI
Summer Research Team Program (SRT) Dr. Louis Ngamassi, a College
of Business professor at Prairie View A&M University, successfully
completed the SRT Program in the summer of 2015. With the support of
the VACCINE Center.
Ngamassi is incorporating visual analytics into a new course he
is developing entitled "Crisis Informatics."
In
Progress
Big Data
Visual
Analytics
Research 0 2009-ST-
061-CI001
No Compiling and Sorting
Database
FALSE David
Ebert
Purdue University Jackson
State
University;
University
of
Houston-
Downtown
; Bethune-
Cookman
College
IN; NJ; GA State and
Local First
Responders
; State and
Local Public
Health
Agencies
2015 Advanced
Data
Analysis
and
Visualizati
on
Case
Studies;
Qualitative
Analysis;
Risk
Assessme
nt
Classroom
Education
Basic
Research
E Educatio
n
EP 8: (VADL) Educational
Materials
2009/07 2010/12 The project status has been changed to "complete." It is no
longer an active project. Please see executive summary for
details.**** Georgia Institute of Technology presently
maintains the Visual Analytics Digital Library (VADL) for
storing and presenting educational materials in visual
analytics. The VADL includes a wide variety of materials
including lectures, lecture notes, lecture slides, related
papers, exams, exercises, course outlines, etc. In this
project, the team will continue to maintain and enhance the
VADL and the materials contained within.
http://vadl cc gatech edu
The Visual Analytics Digital Library (VADL) provided a website that
contained a variety of resources for the visual analytics education
community including class syllabi, sample exams, video lectures, lecture
notes and so on. The project helped boot-strap a variety of educational
program efforts across different universities by providing a shared
resource repository that could be tapped for assistance. As the area
matured and more information about visual analytics became prevalent
across the web, the need for the VADL lessened, and we eventually
stopped updating and supporting the site.
N/A Complete Research 0 2009-ST-
061-CI001
No Compiling and Sorting
Database
FALSE David
Ebert
Purdue University GA; IN Academic
Community
2010 Advanced
Data
Analysis
and
Visualizati
on
Statistical
Analysis
Classroom
Education
1 Law
Enforcem
ent
Video Surveillance Visual
Analytics
2009/07 2012/06 The goal of this project is to automatically determine the
threat behavior exhibited by individuals or groups of people
by observing them via surveillance video. We will
accomplish this by extending some of our previous work in
real-time object tracking. We will first track the individual(s)
and observe how they move in the scene. For example are
they walking patterns such as circling a particular position?
Are they trying to minimize their cross sectional area by
squatting? Are they turning their heads a lot to see if
someone is looking at them? We will catalog a group of
these types of behavior patterns to be used to analyze the
video. One other issue that needs to be addressed is the
determination of the quality and type of the video
surveillance system that is required to be able to do this
type of analysis
This project was concluded. Complete 0 2009-ST-
061-CI001
No FALSE Ed Delp Purdue University IN
1 Law
Enforcem
ent
MDRP 1: Geovisual
Analytics
2009/07 2010/03 The goal of Pennsylvania State University with this work
was to enable analysts to forage for and make sense of
place-relevant information extracted from text documents
linked to formal geographic information. The visual analytic
system developed can retrieve and process text
documents, identify information of interest, present the
information via an interactive visual interface, interactively
record analyst-provided information and update the visually
presented information to assist the analyst. Applications
include monitoring the news media to track mass movement
of people in response to events and monitoring Twitter
feeds as input to investigative analysis. One component of
the research has resulted in a prototype web application,
SensePlace. The scientific goal of SensePlace is to
visually and computationally support analyst sensemaking
with text artifacts that have potential place, time, and
thematic relevance to an analytical problem through
identification and visual highlighting of named entities
(people, places, times, and organizations) in documents,
automated inference to determine document relevance
using stored knowledge, and a visual interface with tightly
coupled geographic map, timeline, and concept graph
displays used to contextualize potentially relevant
documents. The team developed techniques and tools for
investigative analysis on large collections of documents
including both unstructured text and structured documents
(e.g., spreadsheets). They developed systems that use
interactive visualizations to help analysts with performing
exploration, sense-making, and understanding tasks. If they
could help analysts determine which documents to read first
and to also find important, connected documents, then they
could help them to make timelier and accurate assessments
The team developed techniques and tools for investigative analysis on
large collections of documents including both unstructured text and
structured documents (e.g., spreadsheets). They developed systems that
use interactive visualizations to help analysts with performing exploration,
sense-making, and understanding tasks. If they could help analysts
determine which documents to read first and to also find important,
connected documents, then they could help them to make timelier and
accurate assessments of the situations described within those
documents. The project builds upon the Jigsaw system, and explores how
new capabilities can be added to it. They also planned to disseminate the
system for use by real clients, people, and organizations in various
domains.
N/A Complete Research 399808 2009-ST-
061-CI001
No Compiling and Sorting
Database
FALSE John
Stasko
Georgia Institute of
Technology
GA; IN;
PA; CA
Advanced
Data
Analysis
and
Visualizati
on; Human
Factors
Aspects of
Technolog
y
Case
Studies;
Sampling;
Statistical
Analysis
1 Law
Enforcem
ent
ISIS - Infovis System for
Investigating Intrusions
2009/07 2011/06 ISIS - Infovis System for Investigating Intrusions represents
new interactive visualization techniques for analyzing,
organizing, and presenting network event data at multiple
levels of detail for the purpose of forensic analysis -
tracking down causal sequences of importance. Isis allows
analysts conducting network security investigations to
construct narratives of an incident.
Summary of Transition and Deployment: ISIS - Infovis System for
Investigating Intrusions (Stanford) • Awaiting deployment to US CERT A
California-based proof of concept application of the TransNIEMO
modeling approach was prompted by interest from the California
Department of Transportation in concert with the National Center for
Metropolitan Transportation Research (METRANS).
N/A Complete Informatio
n-driven
Visualizati
on,
Modeling
and
Simulation
of Data
Research 0 2009-ST-
061-CI001
No FALSE Patrick
Hanrahan;
Pat
Hanrahan
Office of University
Programs, Science &
Technology
Directorate
CA 2011
E Educatio
n
VACCINE Affinity Research
Groups
2009/07 2012/06 VACCINE Affinity Research Groups Twenty-six undergraduate students, including 14 supported students, from
Univ. of Houston-Downtown, Navajo Tech and Cal State-Dominguez Hills
participated in the VACCINE Affinity Research Groups organized by
Richard Alo. These were students from a combination of statistics, math
and computer science. As a result of participation in this project, students
gained research and collaboration experience and submitted posters and
publications for the Student Research Day Conference at Cal State-
Dominguez Hills.
N/A Complete Research 0 2009-ST-
061-CI001
No Compiling and Sorting
Database
FALSE Richard
Aló;
Richard
Alo
University of Houston-
Downtown; University
of Houston-Downtown
University
of
Houston-
Downtown
IN; TX; CA 2011 Statistical
Analysis
Biostatisti
cs and
bioinformat
ics;
Computer
Science;
Mathemati
cs2 Resource
Allocation
Developing a Sustainable
Visual Analytics for
Command Center
Environments
2009/07 2011/03 Mark Haselkorn, University of Washington MDRP7 focuses
on the development, fielding and maintenance of next-
generation command and control environments. In their
current stages of development, DHS command and control
system initiatives such as Virtual USA and Watchkeeper
focus primarily on delivering a common operating picture, a
common communication platform and, occasionally, analytic
support for key decisions. MDRP7 develops strategies and
field demonstrations that extend these evolving capabilities
by placing them in the context of two additional capabilities:
(1) support for the ways the multi-stakeholder security
community has chosen to work together (in the case of
DHS systems, the NIMS Incident Command System) and
(2) the sustainability of these systems based on
stakeholder ownership, trust and, most importantly, the
ability to achieve continuous improvement through actual
use. The critical strength of NIMS/ICS is that it supports the
integrated efforts of a community of diverse stakeholders
managing a complex, evolving situation from diverse
perspectives involving many different roles, responsibilities,
decisions and actions. While NIMS/ICS provides a
blueprint, the necessary level of coordination and
communication can be difficult to achieve, especially given
the many different agencies, organizations and units
involved, each with its own mission, jurisdiction, processes,
databases, systems and cultures. MDRP7 is working on
next-generation CCI systems (what some call "Precision
Information Environments") that will provide critical
information and communication capabilities within an
environment that supports the unique yet coordinated
efforts of the diverse safety and security community. To
support the many perspectives and roles within the security
N/A Complete Research 0 2009-ST-
061-CI001
No FALSE Mark
Haselkorn;
Mark
Haselkorn
University of
Washington;
University of
Washington
WA
2 Resource
Allocation
Enhancing Interactive
Visual Analysis and
Decision Making
Environments
2009/07 2010/06 Visual analytic and decision making environments can best
be enhanced by placing the work and information flow at the
center of design and development. We worked with the
U.S. Coast Guard, Sector Puget Sound, to understand and
model their emergency response workflow and apply that to
the design and development of visual analytic tools to
support that workflow. With only $5K of funding during this
period, we could only begin the trust building and knowledge
acquisition phases of this work. There have been no
expenditures of VACCINE funding since June of 2011. We
leveraged our role in VACCINE to establish our role with the
National Center for Cognitive Informatics and Decision
Making in Healthcare, under the DHHS SMART Program.
Therefore, our effort during this period focused on workflow
modeling and decision making in healthcare environments.
We have gained significant understanding of Coast Guard workflow and
decision making and have established a trust relationship with Coast
Guard Sector Puget Sound Leadership. We are positioned to engage in a
visual analytic demonstration project should funding be available. Under
separate, leveraged, funding, our current focus is in the area of
healthcare. We have successfully modeled workflow in a clinical
environment and used that to work with practitioners in the design and
development of a mobile application that enhances communication
between patients and healthcare providers. That application, called
Priority Contact, is being piloted in the sandbox environment of the
Veterans Healthcare Administration. Under separate, leveraged, funding,
our current focus is in the area of healthcare. We have successfully
modeled workflow in a clinical environment and used that to work with
practitioners in the design and development of a mobile application that
enhances communication between patients and healthcare providers.
That application, called Priority Contact, is being piloted in the sandbox
environment of the Veterans Healthcare Administration.
More funding is needed. Complete Research 0 2009-ST-
061-CI001
No Expert Consultation FALSE Mark
Haselkorn
University of
Washington
WA DHS U.S.
Coast
Guard
2011 Modeling Engineerin
g
4 Disease
Surveillan
ce
PanViz 2009/07 2011/06 PanViz provides public health officials with a suite of visual
analytic tools for analyzing the spread of a pandemic
influenza. Mission Need On November 1st, 2005 the
National Strategy for Pandemic Influenza was issued as a
guide for our nation's preparedness and response to an
influenza pandemic with the intent of (1) stopping, slowing
or otherwise limiting the spread of a pandemic to the United
States; (2) limiting the domestic spread of a pandemic, and
mitigating disease, suffering and death; and (3) sustaining
infrastructure and mitigating impact to the economy and the
functioning of society. In order to help public health officials
better understand these charges, we have developed the
PanViz toolkit. Through the application of the Indiana State
Pandemic Influenza Planning Tool developed by partners at
the Pacific Northwest National Laboratory, we simulate a
pandemic outbreak originating in Chicago, IL with attack
and mortality rates similar to the 1918 pandemic. Our
PanViz tool allows officials to track the spread of influenza
across the state of Indiana and implement various decision
measures at any time during the pandemic. These decision
measures can be toggled on and off to allow users to better
understand their effects on different county populations.
Demographic filtering is also available for various age
ranges, and interactive manipulation of model parameters
allow users to create various levels of pandemic severity in
order to assess various situations. By using this tool,
officials can analyze resources and decision outcomes in
order to prepare more effective measures for potential
pandemics.
VACCINE developed an interactive pandemic preparedness, surveillance,
and training tool for the Indiana State Department of Health and adapted
this tool for use by the State of Washington, New Jersey, and New York.
This has been used for all health districts in Indiana and at least two
county exercises in the state of Washington.
N/A Complete Research 0 2009-ST-
061-CI001
No FALSE David
Ebert
Purdue University IN; NC;
PA; WA
2011
E Educatio
n
PURVAC RVF 2009/07 2011/06 Complete Research 0 2009-ST-
061-CI001
No FALSE David
Ebert
Purdue University

1 Law
Enforcem
ent
MDRP 2: Integrate
Automated Analytical
Reasoning into Jigsaw
2009/07 2010/06 The objective of this project is to develop and integrate
more automated analysis and reasoning capabilities into
the Jigsaw system. Presently, as a visual analytics system,
Jigsaw is heavy on the visualization aspect and the analyst
explores the document collection manually. While VACCINE
believes there is much value in this, the team would like to
integrate more automated reasoning and analysis
capabilities into the system as well. So, for instance, the
system might suggest hypotheses about the documents, it
might help the analysts confirm/refute hypotheses they
have developed, or it might simply suggest avenues to
explore more. The team will explore how Jigsaw can be
combined with the STAB system also created at Georgia
Institute of Technology, which provides these types of
automated analysis capabilities. Such a task will be
challenging, because the two systems were implemented in
completely different environments and with very different
data models. Here, the team plans to see if these two
approaches can be combined, and then will use an example
document collection as a case study.
This project produced a system prototype that combined the Jigsaw
system with capabilities from the STAB system. We experimented with
this prototype to learn more about its possibilities. Unfortunately, the
prototpye system never reached a level of quality in terms of its
automated analysis suggestions for us to consider releasing it with the
regular Jigsaw system.
N/A Complete Research 0 2009-ST-
061-CI001
No Compiling and Sorting
Database
FALSE John
Stasko
Georgia Institute of
Technology
GA Academic
Community;
DHS
Science and
Technology
Directorate;
Federal
Bureau of
Investigatio
n;
Intelligence
Community
2009 Advanced
Data
Analysis
and
Visualizati
on
Case
Studies;
Sampling
Computer
Science
1 Law
Enforcem
ent
SP 1: Improving Query
Performance in Large Scale
Analytic Databases
2009/07 2011/06 United States Customs and Border Patrol need to cope with
an ever-increasing volume of cargo data. This data was
derived from sources such as shipping manifests and
United States Coast Guard Notice of Arrival documents,
which contain details on the who, what, when, and where of
shipments and are stored in a large Oracle database. This
database was and is used by intelligence analysts to detect
suspicious cargoes. As the size of the database continues
to grow rapidly, the queries which are used to extract the
data have slowed down. Since the analysts need timely
responses in order to be effective, our projects goal is to
improve this query performance by applying visual analytic
techniques to illuminate its causes and then developing
remedies
N/A Complete Research 0 2009-ST-
061-CI001
No Compiling and Sorting
Database
FALSE Patrick
Hanrahan;
Pat
Hanrahan
Stanford University;
Stanford University
CA DHS
National
Protection &
Programs
Directorate;
DHS U.S.
Coast
Guard
2009 Advanced
Data
Analysis
and
Visualizati
on; Border
Security;
Maritime
and Port
Security
Case
Studies
Computer
Science
1 Law
Enforcem
ent
Situation Surveillance & In-
field Criminal Investigative
Analytics; Public Safety
Coalition Projects
2009/07 2010/03 In collaboration with the Department of Justice, PNNL,
David Ebert and his group, and several police departments,
we have been building new capabilities on a mobile
application that is being used for urban routing (taking into
account blockages), remote data gathering, communication
between emergency responders, and emergency
evacuation. A complete GIS-based, client-server system
has been developed with a command center interface and
multiple mobile devices. A situationally aware evacuation
model has also been developed that can be updated based
on new obstacles and current conditions. We have
developed semi-automated methods to derive routing
graphs for large buildings from CAD files, and have now
built 3D routing graphs for the entire UNC Charlotte campus
(and other buildings with our collaborators). We have
developed evaluations of the mobile routing system in
action and are now working on multiple testbed exercises
with Police partners, nuclear evacuation planners, and
PNNL. We have developed a first version of a visual
analytics tool for management, understanding, and action
for collections of surveillance videos. As with our other
visual analytics methods, this tool is a tight integration of
automated methods and interactive displays. It identifies
boundary frames at the beginning or end of events,
provides a level of understanding of events, and permits
tracking of moving individuals or objects. We are building
towards better automation and better ways of inserting
human understanding and direction so that an operator act
upon large surveillance video collections. We will share
these tools with and get feedback from DHS managers and
law enforcement personnel.
We worked on incorporating our urban routing and emergency response
system into the Canada- US Experiment Emergency Resiliency
Environment (CAUSE –ERE) scenario set for demonstration at the end of
June. Joe Kielman and other DHS managers will be in attendance for the
experiment. The initial experiment involves an earthquake in the Pacific
Northwest spanning the U.S.-Canada border. Our system will be used for
mobile emergency routing and situational awareness in a downtown
Seattle building. We prepared a shooter exercise for a campus building.
In this exercise, a person with a gun takes hostages in a campus building.
Ultimately, the person is cornered and barricaded in the building. A
campus lockdown results from the incident. This is a re-running of a
similar exercise that took place 1.5 years ago in which UNCC Police,
Charlotte Police, emergency medical responders, hostage negotiators,
and the university executive team took part. One objective of the current
exercise is to use the new capabilities of the mobile urban emergency
response and evacuation system to address some of the shortcomings
uncovered in the previous exercise. Among the issues uncovered were
the lack of situational awareness by the executive team (which must
make campus-wide decisions) and the lack of a process to manage lifting
of the campus-wide lockdown. The UNCC Police will participate in the
current exercise and Charlotte Police will be invited as observers.
N/A Complete Research 0 2009-ST-
061-CI001
No Compiling and Sorting
Database
FALSE William
Ribarsky
University of North
Carolina at Charlotte
NC; IN;
NJ; PA; VA
State and
Local First
Responders
2010 Biometrics
; Case
Studies;
Econometr
ics;
Modeling;
Molecular
Biology/Ge
nomics;
Risk
Assessme
nt;
Sampling;
Statistical
Analysis
Geography
;
Informatio
n Science
1 Law
Enforcem
ent
(Jigsaw) Visual Analytics
for Investigative Analysis
on Text Documents
2009/06 2017/06 The goal of this project was to develop techniques and
tools for investigative analysis on large collections of
documents including both unstructured text and structured
documents (e.g., spreadsheets). The research team
developed systems that use interactive visualizations to
help analysts with performing exploration, sense-making,
and understanding tasks. By helping analysts determine
which documents to read first and to also find important,
connected documents, then it would be possible to help
them make timelier and more accurate assessments of the
situations described within those documents. The project
builds upon the Jigsaw system, and explores how new
capabilities can be added to it. The researchers intended to
disseminate the system for use by real clients, people, and
organizations in various domains.
Jigsaw is a large Java-based desktop application system. It contains just
under 100,000 lines of code. The system is available for anyone to
download via http://www.cc.gatech.edu/gvu/ii/jigsaw. Jigsaw was used by
the Indianapolis Police Department, West Lafayette Police Department,
Rock Hill Police Department (SC), and the Lafayette Police Department. It
is being used in various university classes on visual analytics and
intelligence analysis and has been downloaded by a wide variety of
organizations in government and industry. There have been
approximately 8000 downloads of the Jigsaw system in its history.
Examples of organizations that have downloaded JIGSAW are; Air Force
Intelligence, AFRL Wright Patterson, Army Counterintelligence, Boeing
Deloitte, Naval Research Lab, National Crime Information Center,
PayPal, Thomson Reuters, United Nations Investigators Office, US
Attorney’s Office Organized Crime Taskforce, as well as numerous
newspapers and police departments. The research team published 11 full
papers and 5 abstracts about the project. Additionally, Dr. Stasko
presented numerous invited lectures at universities, companies, and
government research labs throughout the project. This grant also has
supported research of a PhD student exploring geospatial visual analytics
including pen- and touch-based interaction. In particular, we have created
a system that allows police officials to sketch on a visualization showing
crime hotspots, as a way to assist with planning and patrols. We
presented a paper about this work at the HICSS 2017 Conference.
Jigsaw was very influential in the field of visual analytics on text
documents. We continue to distribute the system and make it
available to analysts and researchers in the public, government,
education, and private sectors. We recently have made available
a new version of the system that runs directly through a web
browser. We will gather feedback about this system and enhance
its capabilities based upon the things that we learn from the
deployment.
In
Progress
Research 637772 2009-ST-
061-CI001
No Expert Consultation FALSE John
Stasko
Georgia Institute of
Technology
GA; IN; PA Center for Visual
Analytics for
Command,
Control, and
Interoperability
Environments
State and
Local First
Responders
; Other
State or
Local
2016 Advanced
Data
Analysis
and
Visualizati
on; Risk
and
Decision
Sciences
Case
Studies;
Sampling;
Statistical
Analysis
Informatio
n Science;
Communic
ation (risk,
scientific,
technical);
Computer
Science
Operation
al Use
2 Resource
Allocation
MDRP 13: (SensePlace 2)
Collaborative Visual-
Computational Information
Foraging and
Contextualization to Support
Situation Awareness
2009/06 2010/06 This project focuses on developing, implementing,
assessing, and transitioning methods and tools to (a) help
analysts, crisis managers, and policy makers find and
contextualize relevant multimodal information quickly and (b)
to support the situation awareness (SA) that is required to
interpret evidence and make decisions in a continually
changing environment. Specifically, GeoJunction is
conceived as a knowledge-enabled, place-time aware, and
computationally enhanced web-based environment that
supports visually-enabled: (a) document query filtered by
place, time, person/organization, and concept, (b)
collaborative information foraging, entity and relation
extraction, and contextualization, (c) exploration of
connections between social and geographic networks, and
(d) situation assessment and monitoring with continually
updating information
GeoTxt has been integrated as the backend geographic entity
recognition, disambiguation, and co-coding systems to support
SensePlace 2, our spatial-temporal twitter analytics environment. The
early stages of SensePlace 2 (and its precursor SensePlace) were
funded through VACCINE.
N/A Complete Research 100000 2009-ST-
061-CI001
No Data Mining FALSE Alan
MacEachr
en; Alan
MacEachr
en
Pennsylvania State
University;
Pennsylvania State
University
PA State and
Local First
Responders
2016 Advanced
Data
Analysis
and
Visualizati
on;
Communic
ations and
Interopera
bility;
Emergenc
y
Preparedn
ess and
Response
Case
Studies;
Risk
Assessme
nt;
Statistical
Analysis
Geographi
c
information
sciences;
Computer
Science
Pilot/Field
Testing
and
Evaluation
in an
Operation
al
Environme
nt
E Educatio
n
EP 3: K-12 Programs 2009/02 2013/09 Discovery Middle School - VACCINE's mission is to
educate the next generation of talent through the VACCINE
K-12 programs which include; the development of middle
school and high school teacher workshops, a high school
teacher tutorial for the high school visual analytic module,
and the development of middle school modules. In addition,
outreach for the K-12 programs included; the attendance at
conferences and events, as well as classroom and
organization presentations.
VACCINE limited its interaction in K-12 activities at the suggestion of
DHS at the end of Year 2. Students from the HS-STEM program visited
Principles of Engineering classes at a local high school and presented
information on their research, visual analytics and connections to
homeland security. As a follow-up, 30 students from the school came to
campus for half a day to tour our visual analytics labs and learn about the
research taking place through VACCINE. The teacher was very
impressed.
N/A Complete Research 0 2009-ST-
061-CI001
No FALSE David
Ebert
Purdue University NJ; IN Academic
Community;
Consumers;
DHS
Science and
Technology
Directorate;
Media
2011 Advanced
Data
Analysis
and
Visualizati
on
Classroom
Education
2 Resource
Allocation
Scatterblogs Initial prototype deployed in July 2013 to the Boy Scouts of America for
testing at their Annual Jamboree. Still in testing and evaluation
(developing a web-based version based on feedback). A number of
agencies are waiting to acquire.
N/A Research 0 No FALSE David
Ebert
1 Law
Enforcem
ent
Measuring & Visualizing
Information Trustworthiness
Using Visual Analytics
Note: Oxford U. A paper was written. N/A 113750 2009-ST-
061-CI001
No FALSE
1 Law
Enforcem
ent
Malware on Smartphones:
Collection, Analysis and
Defensive Measures
The U.S. Department of Homeland Security (DHS) is
committed to using cutting-edge technologies and scientific
talent in its quest to make America safer. The DHS
Directorate of Science and Technology (S&T) is tasked
with researching and organizing the scientific, engineering
and technological resources of the United States and
leveraging these existing resources into technological tools
to help protect the homeland. VACCINE will work with the
University of California Santa Barbara to pursue the
Malware on Smartphones: Collection, Analysis and
Defensive Measures project. VACCINE is strategically
positioned to support the homeland security community in
confronting the challenges of safeguarding our nation by
providing advanced visual analytic capabilities in areas
such as criminal investigations, health surveillance, fraud
detection, cyber security, emergency response and
management, intelligence analysis, and border and
infrastructure security. VACCINE'Ss primary goal is to
enable homeland security personnel, specifically the public
safety community, to make sense of the sea of text,
sensor, audio, and video data by developing powerful
analytical tools and interactive visual decision making
environments that enable quick, effective decisions as well
as effective action and response based on available
resources. To do this, VACCINE integrates data and
analysis into interactive visual displays that allow users to
make discoveries, decisions, and plan actions.
Research 0 2009-ST-
061-CI001
No FALSE CA; IN
1 Law
Enforcem
ent
Co-Located Collaborative
Analysis on Large, High-
Resolution Displays using
Multiple Input Devices;
Public Safety Coalition
Projects
We set out to study how co-located collaborative analysis
is conducted on large, high-resolution displays in order to
evaluate how current visualization tools can be used by
outside institutions in a collaborative manner. We
conducted a user study to evaluate Jigsaw, a visualization
tool developed at Georgia Tech, benchmarked against
analytical tools. The study set-up included a large, high-
resolution display (108.5 in. x 35 in.; 10,240 x 3200 pixels)
with two users seated in front of it with their own mouse
and keyboard that could interact independently and
simultaneously with the display. We collected data from the
study through solution reports, semi-structured interviews,
mouse-log data, and screenshots taken in 15-second
intervals. After analyzing this data, we found that analytical
tools greatly affect collaboration styles as well as how they
interact with the space. We also investigated the display
space usage, user roles, territoriality, and the effectiveness
of multiple input devices. Using these findings, we made
recommendations for improvement to the Jigsaw team.
Virginia Tech’s project on ―Collocated Collaborative Visual Analytics involved two undergraduate female and one graduate female computer
science students who were involved with the research on the project. As
a result, the two undergraduates plan to pursue graduate 27 research
opportunities and the graduate students received an offer for a summer
internship at PNNL to continue research related to the project
Technology transitioned to NSA, where further research on the
methods is being conducted. Graduate student on the project is
now employed at NSA to continue this research.
Complete Research 0 2009-ST-
061-CI001
No Survey FALSE Chris
North
Virginia Tech
University
GA; VA State and
Local First
Responders
2011 Case
Studies;
Statistical
Analysis
Computer
Science
1 Law
Enforcem
ent
Navajo Nation Graffiti
Project
The Navajo Nation lies in Arizona, New Mexico, and Utah.
It covers more than 25,000 square miles, making it bigger
than the State of West Virginia. 50% of the population is
under age 21; 41% are under age 18; and 25% are under
age 9. The purpose of this project is to begin documenting
locations of recent gang-related activity by monitoring gang
graffiti in various reservation communities. NTU students
will learn programming, applications, data collection, and
mapping, as they map gang-related activity throughout their
communities. Working with local law enforcement we plan
to develop curriculum so that we can develop and
successfully maintain effective intervention and prevention
initiatives.
Withdrawn N/A Withdrawn Research 0 2009-ST-
061-CI001
No Field Monitors FALSE Mark
Trebian
Navajo Technical
University
NM; UT;
IN; AZ
DHS
Federal
Emergency
Managemen
t Agency;
DHS
Transportati
on Security
Administrati
on; DHS
U.S. Coast
Guard;
State and
Local First
Responders
2014 Modeling;
Sampling
Geography
; Computer
Science;
Mathemati
cs;
Sociology;
Informatio
n systems

2 Resource
Allocation
Critical Infrastructure
Integration Modeling and
Simulation Project
N/A Research 0 2009-ST-
061-CI001
No FALSE William
Ribarsky
University of North
Carolina at Charlotte
NC

Category Codes
1 Law Enforcement
2 Resource Allocation
3 Social Media Tools
4 Disease Surveillance
5 Financial Flows Tools
E Education

GEORGIA INSTITUTE OF TECHNOLOGY STUDENT NAME WHERE ARE THEY NOW?
YEAR 1 - JULY 1, 2009 - MARCH 31, 2010
Graduates funded - 2 Adity Dokania, Georgia Tech, School of Interactive Computing unknownZhicheng Liu, Georgia Tech, School of Interactive Computing Adobe Research
Undergraduates funded - 0
YEAR 2 - APRIL 1, 2010 - MARCH 31, 2011
Graduates funded - 2 Zhicheng Liu, Georgia Tech, School of Interactive Computing Adobe ResearchYoun-ah Kang, Georgia Tech, School of Interactive Computing Yonsei Univ., Korea
Undergraduates funded - 0
YEAR 3 - APRIL 1, 2011 - MARCH 31, 2012
Graduates funded - 2 Zhicheng Liu, Georgia Tech, School of Interactive Computing Adobe ResearchMengdie Hu, Georgia Tech, School of Interactive Computing Facebook
Undergraduates funded - 0
YEAR 4 - APRIL 1, 2012 - JUNE 30, 2013
Graduates funded - 1 Hannah Pileggi, Georgia Tech, School of Interactive Computing AirBnB
Undergraduates funded - 0
YEAR 5 - JULY 1, 2013 - JUNE 30, 2014
Graduates funded - 1 Anand Sainath, Georgia Tech, School of Interactive Computing Tableau
Undergraduates funded - 0
YEAR 6 - JULY 1, 2014 - JUNE 30, 2015
Graduates funded - 2 Alex Godwin, Georgia Tech, School of Interactive Computing Georgia Instititue of Technology Anand Sainath, Georgia Tech, School of Interactive Computing Tableau
Undergraduates funded - 0
YEAR 7 - JULY 1, 2015 - JUNE 30, 2016
Graduates funded - 2 Alex Godwin, Georgia Tech, School of Interactive Computing Georgia Institute of TechnologySakshi Pratap, Georgia Tech, School of Interactive Computing Georgia Instititue of Technology
Undergraduates funded - 0
YEAR 8 - JULY 1, 2016 - JUNE 30, 2017
Graduates funded - ?
Undergraduates funded - ?
tbescher
Typewritten Text
X. Student Successes

VIRGINA TECH STUDENT NAME WHERE ARE THEY NOW?
YEAR 1 - JULY 1, 2009 - MARCH 31, 2010
Graduates funded - 0 NA
Undergraduates funded - 0 NA
YEAR 2 - APRIL 1, 2010 - MARCH 31, 2011
Graduates funded - 1 Lauren Bradel (Virginia Tech, Computer Science) NSA
Undergraduates funded - 1 Katherine Vogt (Elon University, Computer Science) Carnegie Mellon
YEAR 3 - APRIL 1, 2011 - MARCH 31, 2012
Graduates funded - 1 Lauren Bradel (Virginia Tech, Computer Science) NSA
Undergraduates funded - 1 Kristen Koch (Tulane University, Computer Science) Cornell
YEAR 4 - APRIL 1, 2012 - JUNE 30, 2013
Graduates funded - 0 NA
Undergraduates funded - 0 NA
YEAR 5 - JULY 1, 2013 - JUNE 30, 2014
Graduates funded - 0 NA
Undergraduates funded - 0 NA
YEAR 6 - JULY 1, 2014 - JUNE 30, 2015
Graduates funded - 0 NA
Undergraduates funded - 0 NA
YEAR 7 - JULY 1, 2015 - JUNE 30, 2016
Graduates funded - 0 NA
Undergraduates funded - 0 NA
YEAR 8 - JULY 1, 2016 - JUNE 30, 2017
Graduates funded - 0 NA
Undergraduates funded - 0 NA
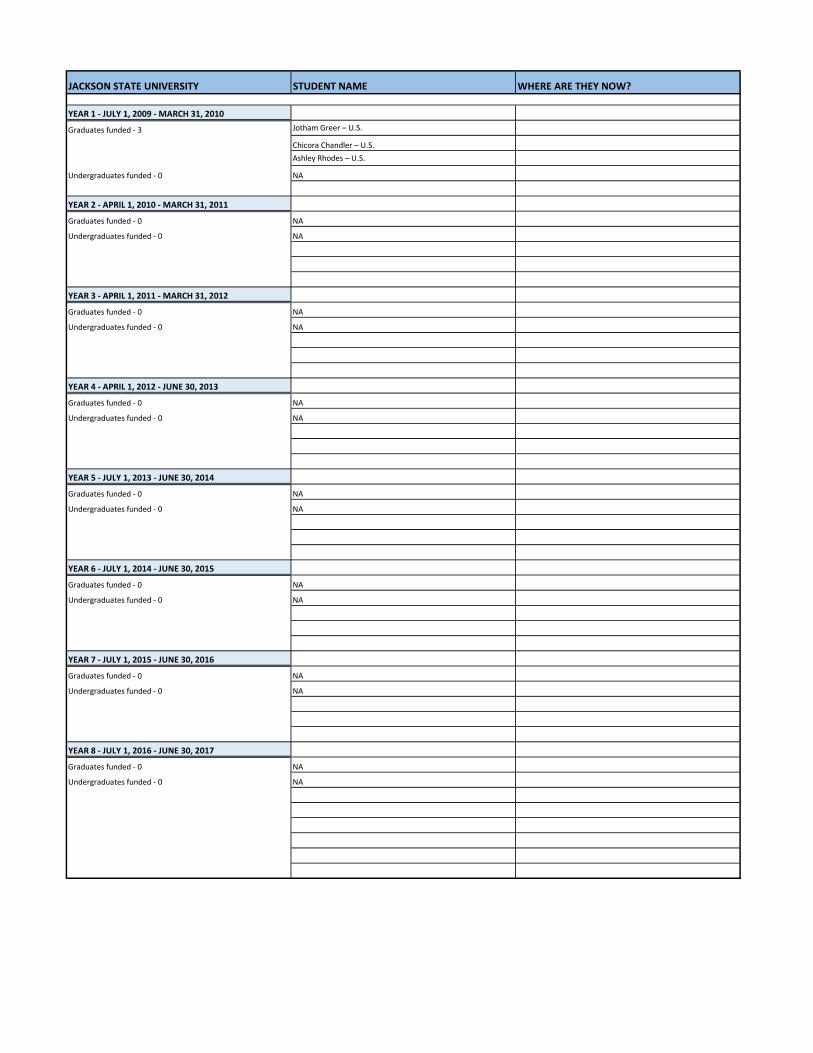
JACKSON STATE UNIVERSITY STUDENT NAME WHERE ARE THEY NOW?
YEAR 1 - JULY 1, 2009 - MARCH 31, 2010
Graduates funded - 3 Jotham Greer – U.S.
Chicora Chandler – U.S.Ashley Rhodes – U.S.
Undergraduates funded - 0 NA
YEAR 2 - APRIL 1, 2010 - MARCH 31, 2011
Graduates funded - 0 NA
Undergraduates funded - 0 NA
YEAR 3 - APRIL 1, 2011 - MARCH 31, 2012
Graduates funded - 0 NA
Undergraduates funded - 0 NA
YEAR 4 - APRIL 1, 2012 - JUNE 30, 2013
Graduates funded - 0 NA
Undergraduates funded - 0 NA
YEAR 5 - JULY 1, 2013 - JUNE 30, 2014
Graduates funded - 0 NA
Undergraduates funded - 0 NA
YEAR 6 - JULY 1, 2014 - JUNE 30, 2015
Graduates funded - 0 NA
Undergraduates funded - 0 NA
YEAR 7 - JULY 1, 2015 - JUNE 30, 2016
Graduates funded - 0 NA
Undergraduates funded - 0 NA
YEAR 8 - JULY 1, 2016 - JUNE 30, 2017
Graduates funded - 0 NA
Undergraduates funded - 0 NA

PENNSYLVANIA STATE UNIVERSITY STUDENT NAME WHERE ARE THEY NOW?
YEAR 1 - JULY 1, 2009 - MARCH 31, 2010
Graduates funded - 1 Thomas Auer – U.S
Undergraduates funded - 0 NA
YEAR 2 - APRIL 1, 2010 - MARCH 31, 2011
Graduates funded -6 Robert Roth, Penn State, Geography
Raechel Bianchetti, Penn State, Geography
Elaine Guidero, Penn State, Geography
Alexander Savelyev, Penn State, Geography
Xiao Zhang, Penn State, Computer Science
Anuj Jaiswal, Penn State, Information Sciences and Technology
Undergraduates funded - 3 Benjamin Finch, Penn State, Geography Matthew Murdock, Penn State, Geography
Nicholas Maziekas, Penn State, Geography
YEAR 3 - APRIL 1, 2011 - MARCH 31, 2012
Graduates funded - 4 Robert Roth, Penn State University, Dept. of Geography
Ying Chen, Department of Computer Science and Engineering
Ishan Behoora, Department of Computer Science and Engineering
Alexander Savelyev, The Pennsylvania State University, Geography
Undergraduates funded - 2
YEAR 4 - APRIL 1, 2012 - JUNE 30, 2013
Graduates funded - 13 Alexander Savelyev, Penn State, Geography
Sujatha Gollapalli, Penn State, Information Sciences & Technology
Ryan Mullins, Penn State, Geography
Wenyi Huang, Penn State, Information Sciences and Technology
Morteza Karimzadeh, Penn State, Geography
Siddhartha Banerjee, Penn State, Information Sciences and Technology
Jennifer Smith, Penn State, Geography
Joshua Stevens, Penn State, Geography
Raechel Bianchetti, Penn State, Geography
Eun-Kyeong Kim, Penn State, Geography
Peter Koby, Penn State, Geography
Ying Chen, Penn State, Computer Science and Engineering
Ishan Behoora, Penn State, Information Sciences and Technology
Undergraduates funded - 0 NA
YEAR 5 - JULY 1, 2013 - JUNE 30, 2014
Graduate - 4 Morteza Karimzadeh, GeographyChong Zhou, Computer Science
Siddhartha Banerjee, Information Sciences and Technology
Ryan Mullins, Geography Software Engineer at Aptima, Inc.
Undergraduate - 0 NA
YEAR 6 - JULY 1, 2014 - JUNE 30, 2015
Graduates funded - 1 Morteza Karimzadeh (Penn State, PhD candidate, Geography)
Undergraduates funded - 0 NA
YEAR 7 - JULY 1, 2015 - JUNE 30, 2016
Graduates funded - 1 Morteza Karimzadeh (Penn State, PhD candidate, Geography)
Undergraduates funded - 2
YEAR 8 - JULY 1, 2016 - JUNE 30, 2017
Graduates funded -
Undergraduates funded -

STANFORD UNIVERSITY STUDENT NAME WHERE ARE THEY NOW?
YEAR 1 - JULY 1, 2009 - MARCH 31, 2010
Graduates funded - 3 Justin Talbot – U.S.
Leslie Wu – U.S.
Sharon Lin – U.S
Undergraduates funded - 0 NA
YEAR 2 - APRIL 1, 2010 - MARCH 31, 2011
Graduates funded - 1 Justin Talbot – U.S.
Undergraduate funded - 0 NA
YEAR 3 - APRIL 1, 2011 - MARCH 31, 2012
Graduates funded - 0 NA
Undergraduates funded - 0 NA
YEAR 4 - APRIL 1, 2012 - JUNE 30, 2013
Graduates funded - 0 NA
Undergraduates funded - 0 NA
YEAR 5 - JULY 1, 2013 - JUNE 30, 2014
Graduates funded - 0 NA
Undergraduates funded - 0 NA
YEAR 6 - JULY 1, 2014 - JUNE 30, 2015
Graduates funded - 0 NA
Undergraduates funded - 0 NA
YEAR 7 - JULY 1, 2015 - JUNE 30, 2016
Graduates funded - 0 NA
Undergraduates funded - 0 NA
YEAR 8 - JULY 1, 2016 - JUNE 30, 2017
Graduates funded - 0 NA
Undergraduates funded - 0 NA

UNIVERSITY OF WASHINGTON STUDENT NAME WHERE ARE THEY NOW?
YEAR 1 - JULY 1, 2009 - MARCH 31, 2010
Graduates funded - 2 Alena Benson – U.S. Product Manager at Gini GmbHBruce Campbell – U.S. Brown & Rhode Island School of Design
Undergraduates funded - 0 NA
YEAR 2 - APRIL 1, 2010 - MARCH 31, 2011
Graduates funded - 2 Robin Mays, HCDE Masters Program PhD Candidate, U of Washington
Alena Benson, HCDE M.S. Product Manager at Gini GmbH
Undergraduates funded - 0 NA
YEAR 3 - APRIL 1, 2011 - MARCH 31, 2012
Graduates funded - 1 Robin Mays, HCDE Masters Program PhD Candidate, U of Washington
Undergraduates funded - 0 NA
YEAR 4 - APRIL 1, 2012 - JUNE 30, 2013
Graduates funded - 0 NA
Undergraduates funded - 0 NA
YEAR 5 - JULY 1, 2013 - JUNE 30, 2014
Graduates funded - 0 NA
Undergraduates funded - 0 NA
YEAR 6 - JULY 1, 2014 - JUNE 30, 2015
Graduates funded - 0 NA
Undergraduates funded - 0 NA
YEAR 7 - JULY 1, 2015 - JUNE 30, 2016
Graduates funded - 0 NA
Undergraduates funded - 0 NA
YEAR 8 - JULY 1, 2016 - JUNE 30, 2017
Graduates funded - 0 NA
Undergraduates funded - 0 NA

FLORIDA INTERNATIONAL UNIVERSITY STUDENT NAME WHERE ARE THEY NOW?
YEAR 1 - JULY 1, 2009 - MARCH 31, 2010
Graduates - 0 NA
Undergraduates - 0 NA
YEAR 2 - APRIL 1, 2010 - MARCH 31, 2011
Graduates funded - 0 NA
Undergraduates funded - 0 NA
YEAR 3 - APRIL 1, 2011 - MARCH 31, 2012
Graduates funded - 0 NA
Undergraduates funded - 0 NA
YEAR 4 - APRIL 1, 2012 - JUNE 30, 2013
Graduates funded - 0 NA
Undergraduates funded - 1 Jesse Domack, School of Computing and Information Sciences State Farm
YEAR 5 - JULY 1, 2013 - JUNE 30, 2014
Graduates funded - 2 Li Zheng, School of Computing and Information Sciences self-employment
Chao Shen, School of Computing and Information Sciences Google
Undergraduates funded - 0 NA
YEAR 6 - JULY 1, 2014 - JUNE 30, 2015
Graduates funded - ? Li Zheng, School of Computing and Information Sciences self-employment
Undergraduates funded - ? Chao Shen, School of Computing and Information Sciences Google
NA
YEAR 7 - JULY 1, 2015 - JUNE 30, 2016
Graduates funded - 1 Wubai Zhou, School of Computing and Information Sciences Ph.D. student
Undergraduates funded - 3 NA
YEAR 8 - JULY 1, 2016 - JUNE 30, 2017

SWANSEA UNIVERSITY STUDENT NAME WHERE ARE THEY NOW?
YEAR 1 - JULY 1, 2009 - MARCH 31, 2010
Graduates funded - 0 NA
Undergraduates funded - 0 NA
YEAR 2 - APRIL 1, 2010 - MARCH 31, 2011
Graduates funded - 0 NA
Undergraduates funded - 0 NA
YEAR 3 - APRIL 1, 2011 - MARCH 31, 2012
Graduates funded - 0 NA
Undergraduates funded - 0 NA
YEAR 4 - APRIL 1, 2012 - JUNE 30, 2013
Graduates funded - 0 NA
Undergraduates funded - 0 NA
YEAR 5 - JULY 1, 2013 - JUNE 30, 2014
Graduates funded - 0 NA
Undergraduates funded - 0 NA
YEAR 6 - JULY 1, 2014 - JUNE 30, 2015
Graduates funded - 0 NA
Undergraduates funded - 0 NA
YEAR 7 - JULY 1, 2015 - JUNE 30, 2016
Graduates funded - 0 NA
Undergraduates funded - 0 NA
YEAR 8 - JULY 1, 2016 - JUNE 30, 2017
Graduates funded - 0 NA
Undergraduates funded - 0 NA

UNVIERSITY OF HOUSTON DOWNTOWN STUDENT NAME WHERE ARE THEY NOW?
YEAR 1 - JULY 1, 2009 - MARCH 31, 2010
Graduates funded - 0 NA
Undergraduates funded - 0 NA
YEAR 2 - APRIL 1, 2010 - MARCH 31, 2011
Graduates funded - 2 Nathan Nikotan, California State University Domiguez HillsHooman Hemmati, University of Houston Downtown, Post Baccalaureate
Undergraduates funded - 11 Duber Gomez Fonseca
Lilian Antunes
Tia Pilaroccia
sarah Jannisca
melissa greenlee
Brian Holtkamp
William Holtkamp
Antoine Wiliams-Baisy
Vanessa Hernandez
joseph Jonson
YEAR 3 - APRIL 1, 2011 - MARCH 31, 2012
Graduates funded - 13 Antoine Williams- Baisy
Adetomiwa Oguntuga
Sarah Jannisca
Lilian Antunes
Hooman Hemmati
Duber Gomez- Fonseca
Tia Pilaroscia
Melissa Greenlee
Jessie Uchendo
Joseph Jonson
Maxwell Goedjen
Brian Holtkamp
Vanessa Hernandez
Undergraduates funded - 4 Paola Martinez
Deepika Dhadral
Kartik Gopavaram
Yesenia Salazar Tamez
YEAR 4 - APRIL 1, 2012 - JUNE 30, 2013
Graduates funded - 0 NA
Undergraduates funded - 0 NA
YEAR 5 - JULY 1, 2013 - JUNE 30, 2014
Graduates funded - 0 NA
Undergraduates funded - 0 NA
YEAR 6 - JULY 1, 2014 - JUNE 30, 2015
Graduates funded - 0 NA
Undergraduates funded - 0 NA
YEAR 7 - JULY 1, 2015 - JUNE 30, 2016
Graduates funded - 0 NA
Undergraduates funded - 0 NA
YEAR 8 - JULY 1, 2016 - JUNE 30, 2017
Graduates funded - 0 NA
Undergraduates funded - 0 NA

UNIVERSITY OF NORTH CAROLINA @ CHARLOTTE STUDENT NAME WHERE ARE THEY NOW?
YEAR 1 - JULY 1, 2009 - MARCH 31, 2010
Graduate funded - 0 NA
Undergraduates funded - 0 NA
YEAR 2 - APRIL 1, 2010 - MARCH 31, 2011
Graduates funded - 16 John Merritt, Ph.D., Computer Science, UNCC
Onyewuchi Obirieze, Ph.D., Earth and Geographic Sciences, UNCC
Jack Guest, M.S., Computer Science, UNCC
Praveen Tripathi, Ph.D., Computer Science, UNCC
Xiaoyu Wang, Ph.D., Computer Science
Matthew Hawkins, M.S., Computer Science
Chunlei Yang, Ph.D., Computer Science
Yi Shen, Ph.D., Computer Science
Yang Chen, Ph.D. Computer Science
Yujie Liu, Ph.D., Computer Science
Dongning Liu, Ph.D., Computer Science
Scott Barlowe, Ph.D., Computer Science
Khaldoon Dhou, Ph.D. student, UNCC
Osarieme Omokaro, Ph.D. student, UNCC
Jack Guest, M.S. student, UNCC
Seth Clark, M.S. student, UNCC
Undergraduates funded - 0 NA
YEAR 3 - APRIL 1, 2011 - MARCH 31, 2012
Graduates funded - 4 Wenwen Dou
Yi Shen
Yujie Liu
Yang Chen
Undergraduates funded - 3
YEAR 4 - APRIL 1, 2012 - JUNE 30, 2013
Graduates funded - 2 Todd Eaglin UNCC Computer Science
Thomas Kraft UNCC Computer Science
Undergraduates funded - 2
YEAR 5 - JULY 1, 2013 - JUNE 30, 2014
Graduates funded - 4 Todd Eaglin UNCC Computer Science
Thomas Kraft UNCC Computer Science
Jeffrey Delawder UNCC Computer Science
Hossein Hematialam UNCC Computer Science
Undergraduates funded - 1
YEAR 6 - JULY 1, 2014 - JUNE 30, 2015
Graduates funded - 3 Todd Eaglin UNCC Computer Science
Thomas Kraft UNCC Computer Science David Burlinson, UNC Charlotte, Computer Science
Undergraduates funded - 1
YEAR 7 - JULY 1, 2015 - JUNE 30, 2016
Graduates funded - 1 Todd Eaglin UNCC Computer Science
Undergraduates funded - 0 NA
YEAR 8 - JULY 1, 2016 - JUNE 30, 2017
Graduates funded - ?
Undergraduates funded - ?

UNIVERSITY OF TEXAS AT AUSTIN STUDENT NAME WHERE ARE THEY NOW?
YEAR 1 - JULY 1, 2009 - MARCH 31, 2010
Graduates funded - 0 NA
Undergraduates funded - 0 NA
YEAR 2 - APRIL 1, 2010 - MARCH 31, 2011
Graduates funded - 0 NA
Undergraduates funded - 0 NA
YEAR 3 - APRIL 1, 2011 - MARCH 31, 2012
Graduates funded - 0 NA
Undergraduates funded - 0 NA
YEAR 4 - APRIL 1, 2012 - JUNE 30, 2013
Graduates funded - 0 NA
Undergraduates funded - 0 NA
YEAR 5 - JULY 1, 2013 - JUNE 30, 2014
Graduates funded - 0 NA
Undergraduates funded - 0 NA
YEAR 6 - JULY 1, 2014 - JUNE 30, 2015
Graduates funded - 0 NA
Undergraduates funded - 0 NA
YEAR 7 - JULY 1, 2015 - JUNE 30, 2016
Graduates funded - 0 NA
Undergraduates funded - 0 NA
YEAR 8 - JULY 1, 2016 - JUNE 30, 2017
Graduates funded - 0 NA
Undergraduates funded - 0 NA

SIMON FRASIER STUDENT NAME WHERE ARE THEY NOW?
YEAR 1 - JULY 1, 2009 - MARCH 31, 2010
Grauated funded - 0 NA
Undergraduates funded - 0 NA
YEAR 2 - APRIL 1, 2010 - MARCH 31, 2011
Grauated funded - 0 NA
Undergraduates funded - 0 NA
YEAR 3 - APRIL 1, 2011 - MARCH 31, 2012
Grauated funded - 3 RIchard Arias Hernández,School of Interactive Arts and Technology (postdoc)
Nadya Calderon Romero Alexandra, School of Interactive Arts and Technology
Sabrina Hauser, School of Interactive Arts and Technology
Undergraduates funded - 0 NA
YEAR 4 - APRIL 1, 2012 - JUNE 30, 2013
Grauated funded - 0 NA
Undergraduates funded - 0 NA
YEAR 5 - JULY 1, 2013 - JUNE 30, 2014
Grauated funded - 0 NA
Undergraduates funded - 0 NA
YEAR 6 - JULY 1, 2014 - JUNE 30, 2015
Grauated funded - 0 NA
Undergraduates funded - 0 NA
YEAR 7 - JULY 1, 2015 - JUNE 30, 2016
Grauated funded - 0 NA
Undergraduates funded - 0 NA
YEAR 8 - JULY 1, 2016 - JUNE 30, 2017
Grauated funded - 0 NA
Undergraduates funded - 0 NA

ARIZONA STATE UNIVERSITY STUDENT NAME WHERE ARE THEY NOW?
YEAR 1 - JULY 1, 2009 - MARCH 31, 2010
Graduates funded - 0 NA
Undergraduates funded - 0 NA
YEAR 2 - APRIL 1, 2010 - MARCH 31, 2011
Graduates funded - 0 NA
Undergraduates funded - 0 NA
YEAR 3 - APRIL 1, 2011 - MARCH 31, 2012
Graduates funded - 0 NA
Undergraduates funded - 0 NA
YEAR 4 - APRIL 1, 2012 - JUNE 30, 2013
Graduates funded - 2 Yifan Zhang, Computer Science ESRI
Feng Wang, Computer Science GE Research
Undergraduates funded - 0
YEAR 5 - JULY 1, 2013 - JUNE 30, 2014
Graduates funded - 3 Yifan Zhang, Computer Science ESRI
Feng Wang, Computer Science GE ResearchYafeng Lu, Computer Science ASU Postdoc
Undergraduates funded - 4 Adam Fairfield Microsoft
Jose Ibarra General Motors
Daniel Martin ASU
Alexandra Porter Stanford Graduate School
YEAR 6 - JULY 1, 2014 - JUNE 30, 2015
Graduates funded - 1 Yafeng Lu, Computer Science ASU Postdoc
Undergraduates funded - 4 Jose Ibarra General Motors
Sagarika Kadambi Intel
Brett Hansen ASU Postdoc
Rolando Garcia Berkeley Graduate School
YEAR 7 - JULY 1, 2015 - JUNE 30, 2016
Graduates funded - 2 Yifan Zhang, Computer Science ESRI
Feng Wang, Computer Science GE Research
Undergraduates funded - 2 Rolando Garcia Berkeley Graduate School
Brett Hansen ASU
YEAR 8 - JULY 1, 2016 - JUNE 30, 2017
Graduates funded - 0 NA
Undergraduates funded - 0 NA

MORGAN STATE UNIVERSITY STUDENT NAME Summer Training at VACCINE WHERE ARE THEY NOW?
YEAR 1 - JULY 1, 2009 - MARCH 31, 2010
Graduates funded - 0 NA
Undergraduates funded - 0 NA
YEAR 2 - APRIL 1, 2010 - MARCH 31, 2011
Graduates funded - 0 NA
Undergraduates funded - 0
YEAR 3 - APRIL 1, 2011 - MARCH 31, 2012
Graduates funded - 0 NA
Undergraduates funded - 15 Dalyn Allen Summer VACCINE Training at Purdue Received Masters Degree (Psychology/Counseling)
Chance Brown Summer VACCINE Training at Purdue Applying to Medical School. Methodone clinician for urinalysis and training in phlebotomy
Vladimir Celestin Summer VACCINE Training at Purdue Pharmaceutical company (clinical services for drug addicts)
Raechelle Floyd Summer VACCINE Training at Purdue Unable to Contact at this time
Jeffrey Haley Summer VACCINE Training at Purdue Matriculating MSU Student/Time off Re-Admission, Summer Session 2017
Corey Harper Summer VACCINE Training at Purdue PhD, Civil Engineering : Carnegie Mellon University, Pittsburgh, PA
Ashley A. Jones Summer VACCINE Training at Purdue Grad Sch: Sch of Architecture & Planning/Landscape Architecture
Eliane Quintana Summer VACCINE Training at Purdue Elecrical Engineer at Naval Air Systems Compound Grad School JHU M.S. computer Science
Anthony A. Davis Summer VACCINE Training at Purdue Working toward M.S. degree in History
Nathan T. Scott Summer VACCINE Training at Purdue Classified Agency
Travis Clement Summer VACCINE Training at Purdue Pharmacy Student at University of Mayland
Kendric Squire Summer VACCINE Training at Purdue Matriculating MSU Student
Emmanuel Onafeko Summer VACCINE Training at Purdue Systems Engineering Newport News Ship Building
Kristen Seals Summer VACCINE Training at Purdue Unable to Contact at this time
Lauren Williams Summer VACCINE Training at Purdue Human Resources in Connecticut
YEAR 4 - APRIL 1, 2012 - JUNE 30, 2013
Graduates funded - 0 NA
Undergraduates funded - 8 Alfred Shoetan Unable to Contact at this time
Vladimir Celestin Pharmaceutical company (clinical services for drug addicts)
Nathan Scott Classified Agency
Benjamin Hall Matriculating MSU Student
Kendric Squire Matriculating MSU Student
Lashaunda Johnson Summer VACCINE Training at Purdue Graduate MSU May 2015: Medical Scribe at Bon Secours & JHU Hospitals. She has been accepted Meharry Medical College MS Program
Derek Riley Summer VACCINE Training at Purdue Graduate MSU May 2015: State of MD Engineer and Grad Sch MSU, Engineering Program
Benjamin Hall Summer VACCINE Training at Purdue Matriculating MSU Student
Astrid Garrison Summer VACCINE Training at Purdue Matriculating MSU Student
YEAR 5 - JULY 1, 2013 - JUNE 30, 2014
Graduates funded - 0 NA
Undergraduates funded - 5 Alfred Shoetan Unable to Contact at this time
Vladimir Celestin Graduate MSU May 2015
Nathan Scott Classified Agency
Benjamin Hall Matriculating MSU Student
Kendric Squire Matriculating MSU Student
YEAR 6 - JULY 1, 2014 - JUNE 30, 2015
Graduates funded - 0Undergraduates funded - 2 Benjamin Hall Matriculating MSU Student
Kendric Squire Matriculating MSU StudentYEAR 7 - JULY 1, 2015 - JUNE 30, 2016 Matriculating MSU StudentGraduates funded - 1 Roberta Virgil Unable to Contact at this timeUndergraduate funded - 8 Benjamin Hall Summer VACCINE Training at Purdue Matriculating MSU Student
Leonardo Pimentel Unable to Contact at this timeChinedu Ilobinso Summer VACCINE Training at Purdue Grad 12/2016: Employed at JP Morgan Chase Co.Cherif Haidara Summer VACCINE Training at Purdue Matriculating MSU Student Simphiwe Denalane Summer VACCINE Training at Purdue Matriculating MSU Student Bridgit Kioko Summer VACCINE Training at Purdue Grad 5/2017: Grad Sch MSU 2017Alvin Ilechie Summer VACCINE Training at Purdue Matriculating MSU Student Christian Young Summer VACCINE Training at Purdue Matriculating MSU Student (working on NASA projects)
YEAR 8 - JULY 1, 2016 - JUNE 30, 2017Graduates funded - 0 NAUndergraduates funded - 7 Julian Faulkner Summer VACCINE Training at Purdue Matriculating MSU Student
Mosopefoluwa Ayantola Summer VACCINE Training at Purdue Matriculating MSU Student Marcia Shepperson Summer VACCINE Training at Purdue Potential VAST Intern (Fall 2017)Krystal Alston Summer VACCINE Training at Purdue Potential VAST Intern (Fall 2017)Ginikachi Eburuoh Summer VACCINE Training at Purdue Potential VAST Intern (Fall 2017)Ta'Kesihia Barnes Summer VACCINE Training at Purdue Potential VAST Intern (Fall 2017)Olanza Badger Summer VACCINE Training at Purdue Potential VAST Intern (Fall 2017)
Work on iLEAPS APP and participally support by VACCINEAttended VACCINE Summer Training as studentsNote: some names appear multiple times due to cross training and projects

NAVAJO TECHNICAL COLLEGE STUDENT NAME WHERE ARE THEY NOW?
YEAR 1 - JULY 1, 2009 - MARCH 31, 2010
Graduates funded - 0 NA
Undergraduates - 0 NA
YEAR 2 - APRIL 1, 2010 - MARCH 31, 2011
Graduates funded - 0 NA
Undergraduates - 0 NA
YEAR 3 - APRIL 1, 2011 - MARCH 31, 2012
Graduates funded - 0 NA
Undergraduates - 0 NA
YEAR 4 - APRIL 1, 2012 - JUNE 30, 2013
Graduates funded - 5 Winston Cambridge, Navajo Technical College, Computer Science
Aaron Huber, Navajo Technical College, Computer Science
Dustin Perry, Navajo Technical College, Computer Science
Myron Peters, Navajo Technical College, Computer Science
Antawane Temple, Navajo Technical College, Computer Science
Undergraduates funded - 5
YEAR 5 - JULY 1, 2013 - JUNE 30, 2014
Graduates funded - 5 Winston Cambridge, Navajo Technical College, Computer Science
Aaron Huber, Navajo Technical College, Computer Science
Dustin Perry, Navajo Technical College, Computer Science
Myron Peters, Navajo Technical College, Computer Science
Antawane Temple, Navajo Technical College, Computer Science
Undergraduates funded - 5
YEAR 6 - JULY 1, 2014 - JUNE 30, 2015
Graduates funded - 0 NA
Undergraduates - 0 NA
YEAR 7 - JULY 1, 2015 - JUNE 30, 2016
Graduates funded - 0 NA
Undergraduates - 0 NA
YEAR 8 - JULY 1, 2016 - JUNE 30, 2017
Graduates funded - 0 NA
Undergraduates - 0 NA

UNIVERSITY OF CALIFORNIA - SAN DIEGO STUDENT NAME WHERE ARE THEY NOW?
YEAR 1 - JULY 1, 2009 - MARCH 31, 2010
Graduates funded - 0 NA
Undergraduates funded - 0 NA
YEAR 2 - APRIL 1, 2010 - MARCH 31, 2011
Graduates funded - 0 NA
Undergraduates funded - 0 NA
YEAR 3 - APRIL 1, 2011 - MARCH 31, 2012
Graduates funded - 0 NA
Undergraduates funded - 0 NA
YEAR 4 - APRIL 1, 2012 - JUNE 30, 2013
Graduates funded - 3 Daniel Frysinger, UCSD, Cognitive Science
Khalid Tahboub , Purdue, Computer Science
Neeraj Gadgil, Purdue, Computer Science
Undergraduates funded - 0 NA
YEAR 5 - JULY 1, 2013 - JUNE 30, 2014
Graduates funded - 0 NA
Undergraduates funded - 9
YEAR 6 - JULY 1, 2014 - JUNE 30, 2015
Graduates funded - 0 NA
Undergraduates funded - 0 NA
YEAR 7 - JULY 1, 2015 - JUNE 30, 2016
Graduates funded - 0 NA
Undergraduates funded - 0 NA
YEAR 8 - JULY 1, 2016 - JUNE 30, 2017
Graduates funded - 0 NA
Undergraduates funded - 0 NA

UNIVERSITY OF OXFORD STUDENT NAME WHERE ARE THEY NOW?
YEAR 1 - JULY 1, 2009 - MARCH 31, 2010
Graduates funded - 0 NA
Undergraduates funded - 0 NA
YEAR 2 - APRIL 1, 2010 - MARCH 31, 2011
Graduates funded - 0 NA
Undergraduates funded - 0 NA
YEAR 3 - APRIL 1, 2011 - MARCH 31, 2012
Graduates funded - 0 NA
Undergraduates funded - 0 NA
YEAR 4 - APRIL 1, 2012 - JUNE 30, 2013
Graduates funded - 0 NA
Undergraduates funded - 0 NA
YEAR 5 - JULY 1, 2013 - JUNE 30, 2014
Graduates funded - 0 Dr. Simon Walton, University of Oxford, Oxford e-Research Centre
Undergraduates funded - 0 NA
YEAR 6 - JULY 1, 2014 - JUNE 30, 2015
Graduates funded - 0 NA
Undergraduates funded - 0 NA
YEAR 7 - JULY 1, 2015 - JUNE 30, 2016
Graduates funded - 0 Dr. Simon Walton, University of Oxford, Oxford e-Research Centre
Undergraduates funded - 0 NA
YEAR 8 - JULY 1, 2016 - JUNE 30, 2017
Graduates funded - 0 NA
Undergraduates funded - 0 NA

OAK RIDGE NATIONAL LABS STUDENT NAME WHERE ARE THEY NOW?
YEAR 1 - JULY 1, 2009 - MARCH 31, 2010
Graduates funded - 0 NA
Undergraduates funded - 0 NA
YEAR 2 - APRIL 1, 2010 - MARCH 31, 2011
Graduates funded - 0 NA
Undergraduates funded - 0 NA
YEAR 3 - APRIL 1, 2011 - MARCH 31, 2012
Graduates funded - 0 NA
Undergraduates funded - 0 NA
YEAR 4 - APRIL 1, 2012 - JUNE 30, 2013
Graduates funded - 0 NA
Undergraduates funded - 0 NA
YEAR 5 - JULY 1, 2013 - JUNE 30, 2014
Graduates funded - 0 NA
Undergraduates funded - 0 NA
YEAR 6 - JULY 1, 2014 - JUNE 30, 2015
Graduates funded - 0 NA
Undergraduates funded - 0 NA
YEAR 7 - JULY 1, 2015 - JUNE 30, 2016
Graduates funded - ? 1/2 summer Jessie Jamieson UNL Graduate School and ORNL Intern
Undergraduates funded - ? 1/2 summer Chris Harshaw Yale Graduate School
YEAR 8 - JULY 1, 2016 - JUNE 30, 2017
Graduates funded - 0 NA
Undergraduates funded - 0 NA
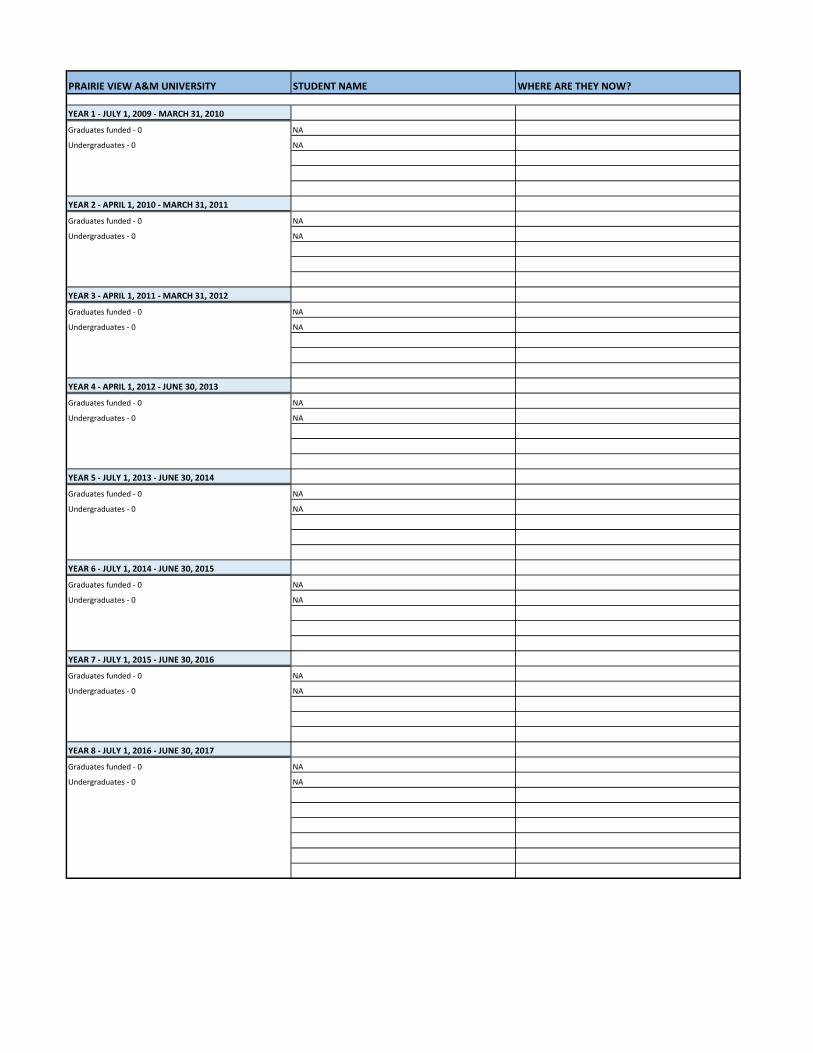
PRAIRIE VIEW A&M UNIVERSITY STUDENT NAME WHERE ARE THEY NOW?
YEAR 1 - JULY 1, 2009 - MARCH 31, 2010
Graduates funded - 0 NA
Undergraduates - 0 NA
YEAR 2 - APRIL 1, 2010 - MARCH 31, 2011
Graduates funded - 0 NA
Undergraduates - 0 NA
YEAR 3 - APRIL 1, 2011 - MARCH 31, 2012
Graduates funded - 0 NA
Undergraduates - 0 NA
YEAR 4 - APRIL 1, 2012 - JUNE 30, 2013
Graduates funded - 0 NA
Undergraduates - 0 NA
YEAR 5 - JULY 1, 2013 - JUNE 30, 2014
Graduates funded - 0 NA
Undergraduates - 0 NA
YEAR 6 - JULY 1, 2014 - JUNE 30, 2015
Graduates funded - 0 NA
Undergraduates - 0 NA
YEAR 7 - JULY 1, 2015 - JUNE 30, 2016
Graduates funded - 0 NA
Undergraduates - 0 NA
YEAR 8 - JULY 1, 2016 - JUNE 30, 2017
Graduates funded - 0 NA
Undergraduates - 0 NA

What it DoesWith the potential for a large loss of life from health outbreaks, public health officials must prepare, exercise and evaluate complex mitigation plans. That planning relies on knowledge gained from training or information provided through com-plex modeling. The plans are developed with a few specific scenarios in mind and can ignore that the solutions dealing with an outbreak depend on the disease’s underlying traits and characteristics, which may not be known a priori.
Using a visual analytics health surveillance tool developed through VACCINE, health officials are prepared to better identify, analyze and respond to emerging health threats in a geographic area using data collected by health officials and hospitals. The goal: to mitigate the spread of a public health emergency and to assist in reallocating resources to combat the crisis.
Why it is UsefulThis computer software system can detect anomalies in temporal patterns of health surveillance data. Users also can interactively explore different models and corresponding spread data in a spatiotemporal map view. It also helps scientists understand the characteristics of syndromic diseases and improve their models.
Patient hospital admittance records are classified into 7 syndromes (botulinic, constitutional, gastrointestinal, hemorrhag-ic, neurological, rash and respiratory). Data is passed to different linked components of the system. Control charts help identify anomalies in the data represented by red dots in the temporal plots. Hospital admittance data is geocoded to identify any spatiotemporal patterns.
continued . . .
PRODUCT
VISUAL ANALYTICS FOR COMMAND, CONTROL, AND INTEROPERABILITY ENVIRONMENTSA U.S. Department of Homeland Security Center of Excellence VACCINEDisease Surveillance/Epidemic ModelingDecision-making tool for mitigation actions, resource allocation
(Upper Right) Line graph view showing health alerts for selected condition and region. Alerts shown fall within the 99% confidence level. Stacked graph view shows the contribution of each type of syndrome. (Right) Summary statistics view provides details about illnesses with respect to age, gender and chief complaint. (Left) Map view with time slider links all views.
(Left) The spatiotemporal model view. Users can watch the spread of the model over space and time and introduce changes to the simulation as well as incorporate mitigative response. (Right) The decision history tree view. As users interact in the model view, the different paths the sim-ulation can take are calculated and visualized, showing the effect of user action in disease spread. The decision paths are plotted over time on the X-axis, with the Y-axis representing the cumulative deviation from the baseline simulation.
tbescher
Typewritten Text
tbescher
Typewritten Text
tbescher
Typewritten Text
tbescher
Typewritten Text
Addendum - Significant Research Areas

Case Study 1 – Pandemic InfluenzaThis case uses the Gaussian mixture model, which simulates the spread of a pandemic influenza across the United States starting from a user-defined point source location and incorporating airport traffic models. With this tool, analysts can choose from three global decision measures: school closures, media alerts and strategic national stockpile deployment (SNS). All decision measures are designed to mitigate the spread, and each response measure can be deployed only once. Applying these decision measures in different combinatorial order can yield different mortality and infection rates.
Case Study 2 – Rift Valley Fever (RVF)This case study utilizes a differential equation model that simulates the spread of Rift Valley Fever through a simulated mosquito and cattle population in Texas. Users can choose from two mitigative response measures: pesticides and quarantine. Users can interactively apply a quarantine or pesticide spray to any individual county or multiple counties at once during the simulation. Analysts can combine Aedes and Culex mosquito pesticides for a combined spray.
Here, the user has introduced a variety of different decision mea-sures at various points in time and in different order. We explore the result and simulation spaces in the geographical space with the maps surrounding the central image. Each map corresponds to a different decision tree branch as denoted by the corresponding label.
In this Rift Valley Fever case study, the user has introduced a variety of different deci-sion measures at various points in time and in different order. Each map corresponds to a different decision tree branch as denoted by the corresponding label.
VISUAL ANALYTICS FOR COMMAND, CONTROL, AND INTEROPERABILITY ENVIRONMENTSA U.S. Department of Homeland Security Center of Excellence
Contact UsWant to find out how VACCINE’s research can help your organization? Email [email protected] or visit www.visualanalytics-CCI.org.
EA/EOU Produced by Purdue Marketing and Media EVPRP-17-8983
VACCINE
Collaborators• Distributed Multimedia Systems Laboratory,
Purdue University• King Edwards Medical University, Lahore, Pakistan• University of Engineering and Technology,
Lahore, Pakistan• VADER Lab, Arizona State University• Foreign Animal and Zoonotic Disease Defense Center• Georgetown Medical Center

The ResearchInformation visualization, or Infovis, systems have two main components: representation and interaction. The interaction component involves the dialog between the user and the system as the user explores the dataset to uncover insights. Since very little attention from the Infovis community has focused on the interaction of users with systems, VACCINE has support-ed several projects establishing discussion parameters with which to explore the Science of Interaction.
One study uncovered seven different types of interaction: Select, Explore, Reconfigure, Encode, Abstract/Elaborate, Filter and Connect. Identifying these helps novel user intent-based categorization to discuss and characterize interaction tech-niques in Infovis. Another study specifically focused on whether a prototype could be created for mobile devices, which would maximize the size of each visualization while minimizing the occlusion of visualizations by tools or fingers.
What the Science of Interaction DoesThe Science of Interaction is concerned with the study of methods by which humans create knowledge through the manipulation of an interface. A true Science of Interaction must include theories and testable premises about the most appropriate mechanisms for human-information interaction. The research and prototype development in this area seeks to explore the relationship between interaction and cognition.
continued . . .
Science of Interaction Studying a User’s Interaction with Programs RESEARCH
VISUAL ANALYTICS FOR COMMAND, CONTROL, AND INTEROPERABILITY ENVIRONMENTSA U.S. Department of Homeland Security Center of Excellence VACCINE
Multiple Coordinated Visualizations for Tablets prototype.

VISUAL ANALYTICS FOR COMMAND, CONTROL, AND INTEROPERABILITY ENVIRONMENTSA U.S. Department of Homeland Security Center of Excellence
Contact UsWant to find out how VACCINE’s research can help your organization? Email [email protected] or visit www.visualanalytics-CCI.org.
EA/EOU Produced by Purdue Marketing and Media EVPRP-17-8983
VACCINE
Why it is UsefulInteraction is an essential part of Infovis and decision making with computer assistance. Without it, an Infovis tech-nique or system becomes a static image – which users tend to interact with anyway by looking closer, rotating it or jotting down notes. Seeking to better understand interaction, therefore, will ultimately answer the question: What does interaction contribute to the analytic process? By learning the answer, researchers can develop applications and tools that will more effectively contribute to the way users research and learn.
Action trails in the HARVEST system allow users to preserve their inquiry paths.

The Research
Spatiotemporal research involves the analyses of space and time information, often producing datasets that are complex due to the high-volume, detailed information pieces used to create them. VACCINE has created a suite of spatiotemporal tools to enable users to more effectively understand such datasets and use them outside typical research environments.
One subset of this suite of tools focuses on using spatiotemporal research to find patterns or other indicators that may be used to predict future behaviors or outcomes. Visual analytics — or the use of graphical or interactive visual analysis of the data — typically are employed to help users better see the interaction of data in various spaces and at different levels.
Why it is Useful
Both novice and advanced spatiotemporal data consumers are often faced with the difficult task of trying to sort through the complex and high-volume datasets. Without clear ways to interpret and understand the datasets, users may feel the research results are of little value.
VACCINE’s predictive/correlative and other analytics research within its spatiotemporal suite of tools enables users to better:
• Explore and understand complex datasets.• Understand potential patterns at different scales and in different spaces/environments.• Employ the outcomes from the datasets for effective decision-making.
How it is Used
Law Enforcement VACCINE developed risk profile tools to give time and location in-formation using law enforcement data. The mobile visual analytics suite of tools allows police departments and other agencies to de-tect trends and patterns among criminal, traffic and civil incidents. The system also provides interactive risk assessment tools to allow users to identify regions of potential high risk and determine the risk at any user-specified location and time. One goal is to eventu-ally modify the system for use by the general public.
VACCINE also created a forecasting tech-nique using research methods to predict criminal activity in specified times and geographic areas. The technique uses data patterns to help law enforcement agencies increase patrols in areas and times that have historically seen higher rates of crime. Such information provides more effective decision-making through this hot spot policing and resource allocation strategies.
Spatiotemporal Correlation RESEARCH
The mobile visual analytics law enforcement system plots incidents as color-coded map points to help users analyze trends.
The forecasting tool shows spatiotemporal distribution of historical crime incidents to help detect patterns.
VISUAL ANALYTICS FOR COMMAND, CONTROL, AND INTEROPERABILITY ENVIRONMENTSA U.S. Department of Homeland Security Center of Excellence VACCINE

Healthcare
VACCINE created a predictive visual analytics toolkit for users to discover regions of space and time with unusually high incidences of events (hot spots) such as specific medical issues. For instance, Indiana health officials can use the tools to analyze respiratory ailments (e.g. influenza) across the state. Users can predict how hot spot regions may grow in order to plan resource allo-cation and preventative measures. Users can also study the data to predict where future hot spots may occur.
The University also developed a suite of tools to allow health officials to combine datasets from hospitals across the state to pinpoint public health emergencies. The tools use time and space data to detect small deviations in patient cases to indicate public health emergencies before such an event is confirmed by diagnoses or overt activity.
Population
VACCINE created a system to allow decision-makers to use geographical datasets and apply them to popula-tion growth. Users can pinpoint areas of growth and decline to understand the reasons behind the changes and how to predict future opportunities.
VISUAL ANALYTICS FOR COMMAND, CONTROL, AND INTEROPERABILITY ENVIRONMENTS
The predictive visual analytics toolkit can map various data, such as respiratory syndrome counts across Indiana.
The mapping tool allows users to pinpoint areas of population growth and decline to predict future outcomes.
The suite of healthcare tools includes heatmaps to indicate potential hot spots of patient activity.
EA/EOU Produced by Purdue Marketing and Media EVPRP-16-8486
Contact UsWant to find out how VACCINE’s research can help your organization or group? Email [email protected] or visit www.visualanalytics-CCI.org.
VISUAL ANALYTICS FOR COMMAND, CONTROL, AND INTEROPERABILITY ENVIRONMENTSA U.S. Department of Homeland Security Center of Excellence VACCINE
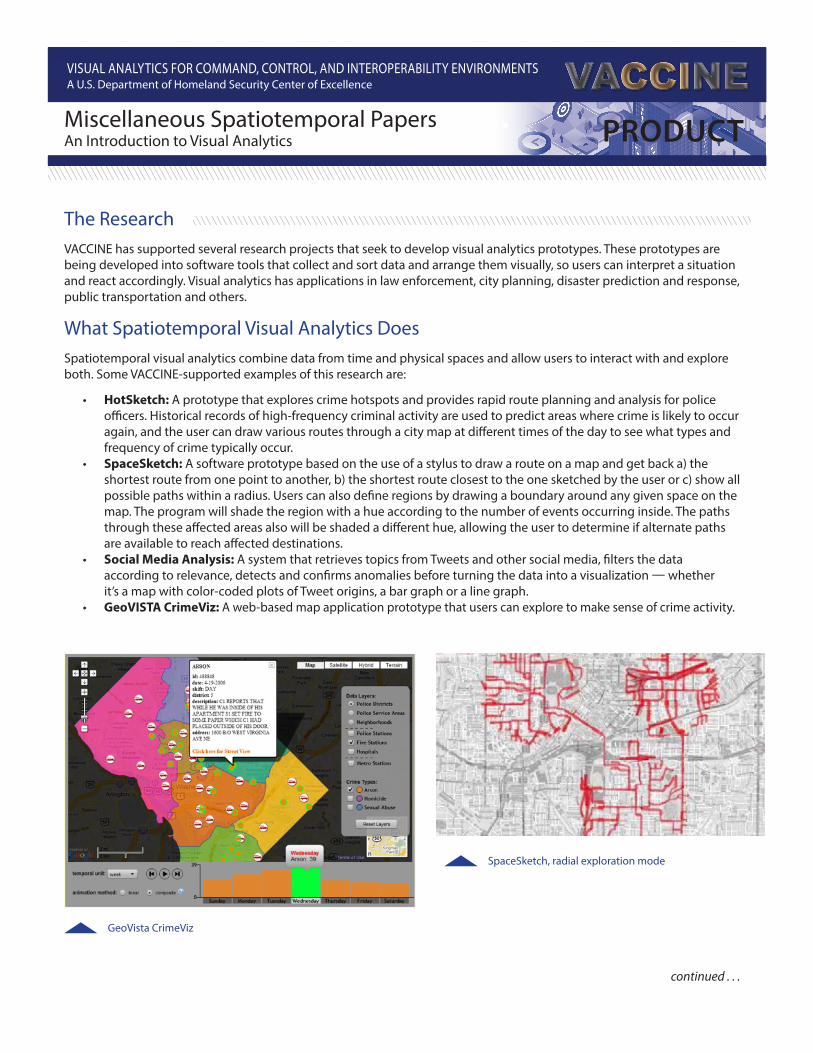
The ResearchVACCINE has supported several research projects that seek to develop visual analytics prototypes. These prototypes are being developed into software tools that collect and sort data and arrange them visually, so users can interpret a situation and react accordingly. Visual analytics has applications in law enforcement, city planning, disaster prediction and response, public transportation and others.
What Spatiotemporal Visual Analytics DoesSpatiotemporal visual analytics combine data from time and physical spaces and allow users to interact with and explore both. Some VACCINE-supported examples of this research are:
• HotSketch: A prototype that explores crime hotspots and provides rapid route planning and analysis for policeofficers. Historical records of high-frequency criminal activity are used to predict areas where crime is likely to occuragain, and the user can draw various routes through a city map at different times of the day to see what types andfrequency of crime typically occur.
• SpaceSketch: A software prototype based on the use of a stylus to draw a route on a map and get back a) theshortest route from one point to another, b) the shortest route closest to the one sketched by the user or c) show allpossible paths within a radius. Users can also define regions by drawing a boundary around any given space on themap. The program will shade the region with a hue according to the number of events occurring inside. The pathsthrough these affected areas also will be shaded a different hue, allowing the user to determine if alternate pathsare available to reach affected destinations.
• Social Media Analysis: A system that retrieves topics from Tweets and other social media, filters the dataaccording to relevance, detects and confirms anomalies before turning the data into a visualization — whetherit’s a map with color-coded plots of Tweet origins, a bar graph or a line graph.
• GeoVISTA CrimeViz: A web-based map application prototype that users can explore to make sense of crime activity.
continued . . .
Miscellaneous Spatiotemporal PapersAn Introduction to Visual Analytics PRODUCT
VISUAL ANALYTICS FOR COMMAND, CONTROL, AND INTEROPERABILITY ENVIRONMENTSA U.S. Department of Homeland Security Center of Excellence VACCINE
SpaceSketch, radial exploration mode
GeoVista CrimeViz

VISUAL ANALYTICS FOR COMMAND, CONTROL, AND INTEROPERABILITY ENVIRONMENTSA U.S. Department of Homeland Security Center of Excellence
Contact UsWant to find out how VACCINE’s research can help your organization? Email [email protected] or visit www.visualanalytics-CCI.org.
EA/EOU Produced by Purdue Marketing and Media EVPRP-17-8983
VACCINE
Why it is UsefulThe immense amounts of data that come through on social media or other news sources creates a bottleneck of information that becomes impossible to interpret or act on when dealt with manually. Visual analytical programs sort all that information and display it in an easy-to-interpret format, which makes the vast store of minute-by-minute information into a usable source.
• HotSketch: Many police officers will spend a large portion of their day responding to 911 calls, pulling them off their beat. A predictive crime system like HotSketch can help reduce the response time for these calls by attempting to position officers in close proximity to areas that receive calls.
• SpaceSketch: Anyone stuck in traffic due to a collision — citizens and police officers alike — can use SpaceSketch to view the event with touch controls and view possible alternate routes with a stylus.
• Social Media Analysis: By plotting points of relevant Twitter messages on a map, one group was able to calculate the epicenter of an earthquake by analyzing the delays of the first messages reporting the shock.
• GeoVISTA CrimeViz: Despite the potential to identify and explain clusters and trends in crime, many police departments lack adequate analytical tools and training to explore and make sense of their crime incident datasets. This is particularly problematic in medium to small municipalities that are unlikely to have crime analysts on staff. CrimeViz provides understaffed departments with an easy-to-use tool for conducting spatiotemporal crime analysis and mapping.
HotSketch
Social Media Analysis

The Research
Spatiotemporal research involves the analyses of space and time information, often producing datasets that are complex due to the high-volume, detailed information pieces used to create them. VACCINE has created a suite of spatiotemporal tools to enable users to more effectively understand such datasets and use them outside typical research environments.
One subset of this suite of tools focuses on using spatiotemporal research to find patterns or other indicators that may be used to predict future behaviors or outcomes. Visual analytics — or the use of graphical or other visual representations of the data — typically are employed to help users better see the interaction of data in various spaces and at different levels.
Why it is Useful
Both novice and advanced users of spatiotemporal research are often faced with the difficult task of trying to understand the operations and usefulness of complex and high-volume datasets. Without clear ways to interpret and understand the datasets, users may feel the research results are of little value.
Purdue’s resource allocation research within its spatiotemporal suite of tools enables users to better:
• Explore and understand complex datasets.• Understand potential patterns at different scales and in different spaces/environments.• Employ the outcomes from the datasets to more effectively allocate limited resources.
How it is Used
Societal InfrastructureVACCINE designed a novel visual analytics platform for modeling the im-pact of natural and human-made societal threats such as weather, food contamination, traffic, crime and terrorist attacks on critical infrastructure such as supply chains, road networks and power grids. This type of big data simulation allows users to compare the interaction of large datasets with space and time components to determine the potential effects of the reallocation of resources related to critical infrastructure. Our plat-form helps answer two important societal questions: How can society protect its critical infrastructure against a diverse range of threats? How can we design for resilience and preparedness when a change in one seemingly minor aspect of our infrastructure may have vast and far-reaching impacts on society as a whole?
VACCINE devised a unique visual analytics control room system to help us-ers monitor critical societal infrastructures, detect cascading effects among multiple infrastructures, perform root cause analyses and manage the crisis response with the most effective resource allocation. Our system uses datasets of time and space information to model the various interconnec-tions and interdependencies of critical infrastructures to other networks.
Spatiotemporal Resource Allocation RESEARCH
VACCINE’s novel visual analytics platform allows users to perform big data simulations related to critical infrastructure.
The unique visual analytics control room setup developed by Purdue consists of three displays and a touch table.
VISUAL ANALYTICS FOR COMMAND, CONTROL, AND INTEROPERABILITY ENVIRONMENTSA U.S. Department of Homeland Security Center of Excellence VACCINE

Maritime OperationsVACCINE collaborated with the U.S. Coast Guard to develop a visual analytics system to analyze historical response operations and assess the potential risks associated with the hypothetical allocation of Coast Guard resources. The system uses datasets to allow users to discover trends and patterns among search and rescue operations and determine the change in risks associated with certain resource reallocations, such as closing certain mari-time stations.
VACCINE created several visual analytics components to assist the Coast Guard with risk-based decision-making. The components are interactive tools that use graphical depictions to allow users to visualize and identify areas of high risk based on time and space historical data. The tools use heatmaps to help users iden-tify risk priority areas, understand possible safety changes based on moving resources, and analyze the potential need for resource reallocation or assets upgrades.
Public SafetyVACCINE developed an analytics system to improve public safety by utilizing the visual data from network cameras. The public cameras are discovered from heterogeneous sources. Data such as camera locations and viewing angles are determined using the vi-sual content from the cameras. The system allows users to analyze space and time data for crime trend analysis, and the cameras can then be used to increase public safety through integration with current surveillance systems.
Users can interact with the risk assessment visual analytics system to discover trends and potential risks associated with the hypothetical allocation of resources such as Coast Guard stations.
Purdue’s visual analytics system assists users with risk-based decision-making, based on time and space historical data.
The analytics system created by Purdue uses visual data from network cameras to improve public safety.
EA/EOU Produced by Purdue Marketing and Media EVPRP-16-8486
Contact UsWant to find out how VACCINE’s research can help your organization or group? Email [email protected] or visit www.visualanalytics-CCI.org.
VISUAL ANALYTICS FOR COMMAND, CONTROL, AND INTEROPERABILITY ENVIRONMENTSA U.S. Department of Homeland Security Center of Excellence VACCINE

The ResearchResearch on human movement patterns using location-based social networks has largely focused on daily activities. But during crisis events, people move from place to place in unusual patterns. This research focuses on those anomalous patterns and proposes a new trajectory-based approach for tracking and analyzing human movement data.
What Trajectory and Human Movement DoesSince it is an option on social media for the user to reveal location, these check-ins can serve as useful data, but it’s an over-whelming amount of data. The Trajectory and Human Movement system creates a visualization for easy observation and analyzing. It generates two different sets of trajectories: target (unusual) and normal trajectories. Then it finds subtrajectories by clustering common paths. Finally, it detects abnormal movement and produces a visualization of the anomaly.
continued . . .
Trajectory and Human MovementA Visualization System of Abnormal Movements PRODUCT
VISUAL ANALYTICS FOR COMMAND, CONTROL, AND INTEROPERABILITY ENVIRONMENTSA U.S. Department of Homeland Security Center of Excellence VACCINE
The trajectories (red and orange) show the human movement patterns around the finish line at the 2013 Boston Marathon during the two hours after the explosions. The blue trajectories represent the movements for the normal situation (the same time period of the same event in 2014). The two markers indicate the locations of the two explosions.

VISUAL ANALYTICS FOR COMMAND, CONTROL, AND INTEROPERABILITY ENVIRONMENTSA U.S. Department of Homeland Security Center of Excellence
Contact UsWant to find out how VACCINE’s research can help your organization? Email [email protected] or visit www.visualanalytics-CCI.org.
EA/EOU Produced by Purdue Marketing and Media EVPRP-17-8983
VACCINE
Why it is UsefulA study commissioned by the American Red Cross found that roughly half of the respondents would mention emergencies and events on their social media channels, and more than two-thirds agree that response agencies should regularly monitor postings on their websites. Moreover, a growing number of people are using loca-tion-based social network services such as microblogs, where they create time-stamped, geo-located data, and share this information about their immediate surroundings using smartphones with GPS capabilities.
This data of human mobility patterns is important for evacuation planning, urban planning, traffic management and understanding the pandemic spread of diseases. Unfortunately, the extraction of such a massive amount of data can be costly and will bottleneck without an efficient system for filtering, sorting and visualizing.
The trajectory approach system generates easy-to-read map visualizations, which makes the overwhelming amount of data useable.
Twitter user distribution on the coast of New Jersey before (left) and after (right) Hurricane Sandy hit the area in October 2012.

What cgSARVA DoesThe Coast Guard Search and Rescue Visual Analytics, cgSARVA, is an interactive system designed to assist U.S. Coast Guard decision-makers and analysts in understanding and assessing operational efficiencies of different Coast Guard missions at different organizational levels.
A computer software tool, cgSARVA provides a user interface and a suite of tools. The system allows the consideration of station closures through an analysis of the potential risks to the maritime environment related to response time as well as the potential for lives lost and property damage. The cgSARVA tool also provides optimal direction to the nearest available station in case of station closures.
In addition, cgSARVA enables the analysis of trends, patterns, and anomalies associated with the distribution of cases in both space and time conducted by the Coast Guard throughout the United States. The system has been developed with a user-cen-tered approach, tapping the expertise of several different Coast Guard analysts and decision-makers in the design process.
continued . . .
cgSARVA (Coast Guard Search and Rescue Visual Analytics) PRODUCT
VISUAL ANALYTICS FOR COMMAND, CONTROL, AND INTEROPERABILITY ENVIRONMENTSA U.S. Department of Homeland Security Center of Excellence VACCINE
Screen shot of cgSARVA showing analysis of the Great Lakes region.
tbescher
Typewritten Text
Adendum - Most Significant Tools

VISUAL ANALYTICS FOR COMMAND, CONTROL, AND INTEROPERABILITY ENVIRONMENTSA U.S. Department of Homeland Security Center of Excellence
Contact UsWant to find out how VACCINE’s research can help your organization? Email [email protected] or visit www.visualanalytics-CCI.org.
EA/EOU Produced by Purdue Marketing and Media EVPRP-17-8983
VACCINE
Why it is UsefulThe cgSARVA tool enables analysts to better see and understand where incidents are occurring and how resources can be reallocated when stations are forced to close because of inclement weather. The tool also allows analysts to see the risks involved in each scenario.
Consensus“The cgSARVA model formulation proved to be tremendously insightful for the Coast Guard as it began to prioritize the repair of its stations. Even upon receiving full funding for all damages, the Coast Guard is unable to execute all repairs at the same time, and the outputs from cgSARVA have been instrumental in assisting senior leadership in prioritizing work.”
— Commander Kevin Hanson, analysis team leader
“The accreditation is the first time anything produced by a DHS Center of Excellence has been verified and validated for use by the Coast Guard. The cgSARVA tool can help DHS agencies and law enforcement agencies across the country.”
— David Ebert, VACCINE Director and Silicon Valley Professor of Electrical and Computer Engineering at Purdue University
“The cgSARVA tool is especially helpful in guiding operations and resource decisions by carefully analyzing data in a way that ensures the best return on investment. This project serves as a great example of positive partnerships that are being forged between the Coast Guard, the DHS Center of Excellence and academia.”
— Retired Vice-Admiral Robert C. Parker, Commander U.S. Coast Guard Atlantic Area (LANTAREA)
Image of cgSARVA analyz-ing Superstorm Sandy, and assessing how to reallocate resources in light of damage to stations in New Jersey.

What FAVA DoesFinancial Anomaly Visual Analytics (FAVA) is a visual analytics system that detects and explores financial anomalies and compares it to news media context. Financial analysts responsible for monitoring abnormal financial market behaviors can use FAVA to quickly find and extract relevant information, which would otherwise be a time-intensive task.
Why it is UsefulAnomalies in financial trends need current news context to be properly understood because not all of them are relevant or require action. Conversely, not all context is relevant either, which makes the information even more difficult to sift through. Additionally, line graphs that get cluttered and difficult to read are typically used to chart all data. Analysts need easy-to-read tools to probe these anomalies and to identify, explore, and understand their causes and behaviors.
Using input collected from focus groups of different types of analysts, FAVA was designed with an automated anomaly detector with different types of graphs that represent data and provide users with different approaches to analyze it. This eliminates the need for significant time spent researching and building hypotheses.
Case StudiesFAVA has been used to analyze:
• The airline sector (October 2015-March 2016)• The oil sector (October 2015-March 2016)• The technology sector (August-October 2011)
continued . . .
FAVA (Visual Analytics System for Exploring Financial Data) PRODUCT
VISUAL ANALYTICS FOR COMMAND, CONTROL, AND INTEROPERABILITY ENVIRONMENTSA U.S. Department of Homeland Security Center of Excellence VACCINE
FAVA’s Polarity Distribution Stacked Bar Graph with green being positive sentiment, gray being neutral and red being negative.

VISUAL ANALYTICS FOR COMMAND, CONTROL, AND INTEROPERABILITY ENVIRONMENTSA U.S. Department of Homeland Security Center of Excellence
Contact UsWant to find out how VACCINE’s research can help your organization? Email [email protected] or visit www.visualanalytics-CCI.org.
EA/EOU Produced by Purdue Marketing and Media EVPRP-17-8983
VACCINE
FAVA’s various views — showing line graph, Stacked Zoom Graph, Horizon Graph, Calendar, Topic Stream and News Events Timeline.
Main Components of FAVAOne of the major advantages of FAVA is its multiple representations of financial data, making it useful for different types of analysts and helping them put their information into context. The main components are:
Time Series View: Presents ticker prices and anomalies over time and provides users with display and configuration options.
Horizon Graph View: Presents ticker prices, anomalies and trends for individual stocks, market/sector indices and the overview trends.
Calendar View: Presents count of anomalies in the format of a calendar in order to explore seasonal and cyclical trends.
Stacked Zoom View: Presents ticker prices over time in detail and its relation to the overview.
Topic Stream View: Presents related news stories for each topic/ticker over time.
News Events Timeline View: Presents potential contextual evidences of financial anomalies from news articles.

What GARI DoesGARI, which stands for Gang Graffiti Automatic Recognition and Interpretation, is a mobile application and cloud-based system that allows law enforcement and criminal justice personnel to capture, input, and search images of gang graffiti and tattoos using an Android or iOS (iPhone) device.
The images are analyzed, stored and indexed by time, location (GPS coordinates) and content. Users can browse images up to a 20-mile radius of their current location as well as search the database for similar images.
How it WorksThe image analysis includes obtaining the user’s geoposition, date and time, and extracting relevant features (e.g., color, shape) from the gang graffiti image. The information is sent to a cloud-based server and compared against the graffiti image database. The matched results are sent back to the device where the user then can review the results and provide extra inputs to refine information. Once the graffiti is completely decoded and interpreted, it is labeled and added to the database.
Why it is UsefulIn many communities, criminal gangs commit as much as 80% of the crime, according to law enforcement officials throughout the nation. Street gangs most commonly communicate through graffiti — including challenges, warnings or intimidation to rival gangs. Through GARI, officials can track gang affiliation and growth or even obtain membership information.
GARI also helps users determine when a new gang moves into an area and identify what gangs are active in an area. From that information, the tool can assist in predicting potential outbreaks of gang violence. GARI also can assist users in con-necting with youth at risk of gang recruitment.
continued . . .
GARI (Gang Graffiti Automatic Recognition and Interpretation) PRODUCT
VISUAL ANALYTICS FOR COMMAND, CONTROL, AND INTEROPERABILITY ENVIRONMENTSA U.S. Department of Homeland Security Center of Excellence VACCINE
The user can take images which the application will analyze and filter. Images also can be added to the database.

VISUAL ANALYTICS FOR COMMAND, CONTROL, AND INTEROPERABILITY ENVIRONMENTSA U.S. Department of Homeland Security Center of Excellence
Contact UsWant to find out how VACCINE’s research can help your organization? Email [email protected] or visit www.visualanalytics-CCI.org.
EA/EOU Produced by Purdue Marketing and Media EVPRP-17-8983
VACCINE
Used By• Indianapolis Metropolitan Police• Indiana Intelligence Fusion Center Gang Task Force• INGangNetwork• Cook County Sheriff’s Department• Illinois State Police• Navajo Nation• Approximately 400 additional law enforcement entities have expressed interest
AwardsSecond place in the 2015 Tatt Challenge, sponsored by the National Institute of Standards and Technology (NIST) and the Federal Bureau of Investigation (FBI).
Use for CitizensA community version is available that functions in the same way, but only allows the user to report graffiti and does not make any information visible to the individual uploading and reporting the graffiti image.

continued . . .
GeoTxt (Web Service to Geolocate Places Mentioned in Microblogs and News Text) PRODUCT
VISUAL ANALYTICS FOR COMMAND, CONTROL, AND INTEROPERABILITY ENVIRONMENTSA U.S. Department of Homeland Security Center of Excellence VACCINE
The architecture of GeoTxt’s application programming interface.
The ResearchPlace is critical to homeland security; crisis events happen in place, resources need to be moved from place to place, vulnerable people and infrastructure are at particular places. Place references found in text documents (ranging from news stories and intelligence reports to social media feeds) provide an important complement to formal place-based data al-ready encoded in geospatial databases — if those place references can be recognized, extracted and turned into geospa-tial data. That capability is what the GeoTxt web service provides, with a specific emphasis on informal text in social media.
What GeoTxt DoesGeoTxt uses techniques from a wide array of research areas — applied linguistics, natural language processing, search engine optimization and geographic information science — to parse out places, people and events explicitly or implicitly mentioned in text (e.g. tweets), and then analyze and contextualize in order to locate them in geographic space.

Why it is UsefulGeoTxt detects locations, people and organizations mentioned in text and assigns geographic coordinates to those locations. This enables references to geographic locations that appear in public posts on social networks, newspapers and other text sources to be harnessed for a variety of analytical tasks.
Accurate geoparsing must address a range of challenges, particularly with Twitter, because users often abbreviate, use nonstandard syntax (e.g. don’t capitalize proper nouns) or simply make grammatical mistakes. Additionally, most place names can refer to more than one location (the mean for place names globally is over 100 different locations/names); thus determining the intended location is a challenge.
GeoTxt is specialized to cope with challenges like these. For instance, a tweet that reads “Finally landing in London. I love Canada!” would be geolocated to London, Ontario, instead of London, UK, based on the two locations mentioned in the text — not based upon location population or ranking in GeoNames.
VISUAL ANALYTICS FOR COMMAND, CONTROL, AND INTEROPERABILITY ENVIRONMENTSA U.S. Department of Homeland Security Center of Excellence
Contact UsWant to find out how VACCINE’s research can help your organization? Email [email protected] or visit www.visualanalytics-CCI.org.
EA/EOU Produced by Purdue Marketing and Media EVPRP-17-8983
VACCINE
GeoTxt web user interface.

What Jigsaw DoesJigsaw helps investigative analysts explore, analyze and make sense of unstructured and structured document collections, from articles and reports to spreadsheets, XML documents and blogs. By identifying and highlighting connections between entities — such as people, organizations and places — within the large set of data, Jigsaw provides a visual index to help guide the analyst toward relevant reports.
The process takes four steps:
1. Import document2. Identify entities3. Analyze computational text4. Explore visualizations
Jigsaw has an easy-to-use, human-centered approach that puts the analyst in charge of the analysis instead of relying on algorithmic, automated techniques. Through visual representations of the information within textual documents, Jigsaw helps analysts better search, review and understand the reports.
With its rich interactive user interface, Jigsaw offers computational text analysis that includes document summarization, senti-ment, similarity and clustering. It also supports the discovery of hidden and embedded relationships across the documents.
Why it is UsefulWhile reading reports, analysts inherently form mental models of the people, places and events discussed in the information. But as these reports grow, it is increasingly more challenging to cipher through the relevant information, follow the connections between data and interpret the information. This is where Jigsaw comes in.
This system helps analysts reach more timely and accurate understandings of the larger stories and important concepts embedded throughout textual reports. Jigsaw is valuable for a variety of uses and fields, including:
• Law enforcement and intelligence community• Fraud (finance, accounting, banking) • Academic research• Journalism and reporting• Consumer research
History/BackgroundThe Jigsaw project began at Georgia Institute of Technology’s School of Interactive Computing in 2005. In the summer of 2008, Jigsaw was made available via private URL and provided upon request with easy-to-track downloads. It was put online in August 2012 as a Java application for anyone to download.
Since its inception, Jigsaw has been downloaded 5,000 times. Organizations recently downloading the system include CDC, NSF, Deloitte, Netherlands Defence Academy, Washington, D.C., Public Schools, Oracle and Chick-fil-A. A team of researchers from Georgia Tech used the Jigsaw system to win the 2007 VAST (Visual Analytics Science and Technology) Contest.
Jigsaw — A Visual Analytics System that Puts the Pieces Together PRODUCT
VISUAL ANALYTICS FOR COMMAND, CONTROL, AND INTEROPERABILITY ENVIRONMENTSA U.S. Department of Homeland Security Center of Excellence VACCINE

“Without the use of Jigsaw, examining reports would have been tedious and time consuming, and connections between entities may not have been seen. The local police department was very impressed with Jigsaw and stated that the program will become very useful in tracking criminal activity. Jigsaw is also used to analyze inci-dents relating to the security of the Washington State Ferry System, providing a searchable database and quick analytical tool for tracking potential threats to the largest ferry transportation system in the U.S.”
— Chad R. Melton, Criminal Intelligence Analyst, Washington Joint Analytical Center WAJAC/FBI-FIG
“I think Jigsaw’s strength is its visual and investigative support. Analyzing our reports would have been impossi-ble without that support. When I showed the results and connections to my colleagues, it was easy for them to understand how a certain person is connected to others.”
— Damien Williams, Criminal Intelligence Analyst, Rock Hill, South Carolina, Police Department
EA/EOU Produced by Purdue Marketing and Media EVPRP-16-8486
Contact UsWant to find out how VACCINE’s research can help your organization or group? Email [email protected] or visit www.visualanalytics-CCI.org.
VISUAL ANALYTICS FOR COMMAND, CONTROL, AND INTEROPERABILITY ENVIRONMENTSA U.S. Department of Homeland Security Center of Excellence VACCINE

What LAHVA DoesLAHVA, which stands for Linked Animal-Human Health Visual Analysis, is a software application that visually shows the correlation between animal and human disease and provides a framework for public health officials to uncover potential threats and respond quickly to health crises. Also, it visually links data collected at human emergency rooms and vet-erinary hospitals according to geographic region, tracks changes and abnormalities, and provides advanced statistical analysis of those links.
Why it is UsefulLAHVA’s additional monitoring of animal symptoms can provide an early alert system, saves time required for manual anal-ysis and enables a quick response time. Also, since many current systems for mining human disease and location data are limited by privacy concerns, LAHVA’s ability to extract more precise details in animal cases significantly increases accuracy of event detection and decreases false alarms.
Not Just for OutbreaksAnimal companions often reflect environmental events. Above is LAHVA’s representation of veterinary visits in the sur-rounding area of a chemical spill during the same week.
LAHVA (Linked Animal-Human Health Visual Analysis) PRODUCT
VISUAL ANALYTICS FOR COMMAND, CONTROL, AND INTEROPERABILITY ENVIRONMENTSA U.S. Department of Homeland Security Center of Excellence VACCINE
Red point as location of chemical spill, representa-tion of veterinary visits in the surrounding area.

The LAHVA Technology DifferenceLAHVA uses data entered into national databases in real time — by the Banfield Pet Hospital and Indiana Network for Patient Care (INPC) — enabling public health officials to respond quickly to events.
• Components• Filtering for exploration of potential causes and spread patterns• Map view for spatial data visualization• Stacked graph view analyzing links between patient visits and deaths• Statistical summary window with details on illnesses by age, gender and chief complaint• Interactive time slider for animation, exploration and analysis• Tape measure tool for use on the line graph view to measure parameters of pandemic
VISUAL ANALYTICS FOR COMMAND, CONTROL, AND INTEROPERABILITY ENVIRONMENTSA U.S. Department of Homeland Security Center of Excellence
Contact UsWant to find out how VACCINE’s research can help your organization or group? Email [email protected] or visit www.visualanalytics-CCI.org.
EA/EOU Produced by Purdue Marketing and Media EVPRP-17-8983
VACCINE
Tape measure tool and stacked graph view of patient visits and deaths.
Support for Future Detection AwardVAST 2010 Mini Challenge 2

What MADIS DoesMADIS, which stands for Multimedia-Aided Disaster Information Integration System, is an information integration framework designed and developed on an iOS platform for enhancing situation reports with photos and video and enabling quick emergency response.
Through a preprocessing component, the tool can catalog disaster-related images and identify relevant subject text in posted situation reports, training modules that establish the systems cataloging and text-analysis capabilities, and a web-based database system with a RESTful application program interface (API) that provides support for web or mobile-device client appli-cations. MADIS has been developed for primary use on an iPad by responders in need of an interactive solution for efficient disaster situation assessment.
Direct Search Engine (DSE)DSE is an extended function of MADIS that integrates multiple publicly sourced disaster information, providing versatile search functions such as keyword-based search and vertical search with mapping.
Through DSE, the user is able to quickly explore three different data sources: general web pages, latest news, and blogs and tweets. To access the data for users, one method relies on a keyword search while another method is based on data integration, with the results presented on maps.
continued . . .
MADIS (Multimedia-Aided Disaster information Integration System) PRODUCT
VISUAL ANALYTICS FOR COMMAND, CONTROL, AND INTEROPERABILITY ENVIRONMENTSA U.S. Department of Homeland Security Center of Excellence VACCINE
Model of the MADIS overview.
Screen shot of DSE’s map-based search results.

VISUAL ANALYTICS FOR COMMAND, CONTROL, AND INTEROPERABILITY ENVIRONMENTSA U.S. Department of Homeland Security Center of Excellence
Contact UsWant to find out how VACCINE’s research can help your organization? Email [email protected] or visit www.visualanalytics-CCI.org.
EA/EOU Produced by Purdue Marketing and Media EVPRP-17-8983
VACCINE
Why it is UsefulCurrently, responders are relying on solely textual reports to assess disaster damage. Enhancing these reports with photos and video provides more detail and allows for a more effective response.
Additionally, the need for portability has made mobile devices a must-have in disaster response. MADIS provides emergency personnel with free, fast interaction in communicating between both the command centers and actual disaster sites.
An improved response time improves survival rates, but it also benefits businesses in the long term. Studies have shown that when a business is closed because of a disaster, even for a short time, it becomes highly likely that the business will fail. A quicker recovery improves the likelihood of higher survival rates of people and businesses success — a quicker recovery that MADIS enables.
Screen shots of 1) main report list with thumbnail-sized images and 2) an open situation report with highlighted keywords and related images identified by the system.

What SMART DoesSMART software organizes large, unwieldy, uncoordinated social media datasets and displays them in ways that make them useful in decision making. SMART users can map, explore and navigate data from social media sites such as Facebook, Twit-ter, YouTube and others. Users also can customize the software’s message/keyword filters and modes of display based on their needs. And as social media data changes and users’ information needs evolve, SMART customizations also evolve.
Why it is UsefulSMART enables data-driven decision making. It turns disorganized social media data — essentially noise — into useful information. With SMART software tools, information about topics in social media and trends in human behavior on social media become discernible and understandable, and can become the basis for sound decision making.
How it is UsedSMART enables users to look at data that’s presented in a map or viewable by topic. It also allows a “filter” view that shows things such as traffic, weather and safety information — or other classifiers that the user can create and modify.
SMART (Social Media Analytics and Reporting Toolkit) PRODUCT
The SMART map includes a variety of view options that users can choose from. The “classifier” view loads traffic, severe weather and safety classifiers, and allows users to make their own classifiers or change those being used. When clicking a classifier, other corresponding data is refreshed and automatically appears. The map also shows prominent keywords taken from tweets that are relevant to a user’s classifiers.
VISUAL ANALYTICS FOR COMMAND, CONTROL, AND INTEROPERABILITY ENVIRONMENTSA U.S. Department of Homeland Security Center of Excellence VACCINE

Contact UsWant to find out how VACCINE’s research can help your organization or group? Email [email protected] or visit www.visualanalytics-CCI.org.
EA/EOU Produced by Purdue Marketing and Media EVPRP-16-8486
An extension of SMART, named TopoGroups, visualizes multiple levels of spatial aggregation of social media posts at a specific region. TopoGroups supports effective comparison, correlation and analysis of multiscale aggregates by combining them into the same display, thereby helping users to understand the spatial distribution as well as identify trends and anomalies at different granularity levels.
SMART gets smarter to uncover deception SMART has been enhanced to help investigate possible hoaxes. It provides a set of deception-related keyword collections through automatic expansion and human verification. It also resolves the lack of social media data by using user networks. This framework enables investigators to identify suspicious Twitter users and provides a visual-analytics environment that’s designed to examine geo-tagged tweets and Instagram messages in the context of hoax distress calls.
More SMART info = more SMART power SMART’s extension, called TopoGroups, provides visualizations of multiple levels of spatial aggregation of social media posts in a specific area. It also supports comparison, correlation and analysis of multiscale aggregates by showing them in the same display. This helps users understand the spatial distribution and identify trends and anomalies at different granularity levels.
SMART has been extended to support the inves-tigation for hoax distress calls. SMART provides a set of hoax-related keyword collections through automatic expansion and human verification, and resolves the lack of social media data by utilizing user networks. The framework allows investigators to identify suspicious Twitter users and provides a visual analytics environment designed to examine geo-tagged tweets and Instagram messages in the context of hoax distress calls.
VISUAL ANALYTICS FOR COMMAND, CONTROL, AND INTEROPERABILITY ENVIRONMENTSA U.S. Department of Homeland Security Center of Excellence VACCINE

The ResearchThe focus of Symbol Store research is to share point symbols for maps, particularly those used commonly in emergency management tasks. These tasks can include disaster mitigation and response planning activities as well as direct response and situational assessment mapping in the immediate aftermath of a disaster. Additionally, they can include remediation mapping efforts as communities engage in recovery efforts.
What Symbol Store DoesSymbol Store is a web-based prototype tool that holds map symbols collected from U.S. government and public domain symbol sets designed by independent cartographers. Users can use keyword-based searches on www.symbolstore.org, and they also can search using time (most recent uploads), contributor and symbol categories. As Symbol Store’s user base grows, the popularity of certain symbols also can be a search criteria.
continued . . .
Symbol Store (Searchable Store for Map Symbols) PRODUCT
VISUAL ANALYTICS FOR COMMAND, CONTROL, AND INTEROPERABILITY ENVIRONMENTSA U.S. Department of Homeland Security Center of Excellence VACCINE
Symbol Store’s initial prototype interface with symbols contributed from Infrastructure Information Collection Division.

Why it is UsefulSeveral agencies within the U.S. Department of Homeland Security use maps as part of their daily operations, and those agencies need consistency to communicate and cooperate with one another. One clear need is that since emergencies are time-sensitive in terms of response, the rate at which responders and officials can read and interpret a map can make the difference between life and death and property saved or lost.
The need for Symbol Store was based on a comprehensive analysis of map symbol use by DHS and collaborating emergency management organizations at the state and local level. This analysis identified a substantial mismatch between some prior efforts to develop map symbol standards and the wide range of application cases for which DHS has primary responsibility. This mismatch resulted in duplication of map symbol sets and sometimes conflicting map symbols that could lead to confusion on the part of map users in a rapidly evolving crisis. Further systematic work with emergency map producers and users guided the development of Symbol Store and map symbol choices.
So far, a great deal of effort has gone into developing new symbol standards to support map interoperability in de-fense, crisis management and humanitarian mapping domains, however much less progress has been made toward making symbols easy to discover and share.
Symbol Store has over 2,400 map symbols that can be previewed on various map designs before downloading, includ-ing mobile symbols. This can improve the capacity for cartographers to design easily legible maps, and for users to read maps easily and respond quickly. Qualified users also can share their own images for others to search.
VISUAL ANALYTICS FOR COMMAND, CONTROL, AND INTEROPERABILITY ENVIRONMENTSA U.S. Department of Homeland Security Center of Excellence
Contact UsWant to find out how VACCINE’s research can help your organization? Email [email protected] or visit www.visualanalytics-CCI.org.
EA/EOU Produced by Purdue Marketing and Media EVPRP-17-8983
VACCINE
Symbol Store’s upload interface. The map preview function.

What VALET DoesThe Visual Analytics Law Enforcement Toolkit, or VALET, developed at Purdue’s Homeland Security Center of Excellence, assists law enforcement officers and first responders in reducing crime and ensuring public safety. By providing real-time data, law enforcement officials can be more strategic in how they allocate resources in their communities.
As a computer software program, VALET analyzes high-volume criminal, traffic and civil incident data as well as related emergency management and disaster preparedness events.
The technology creates a picture of what is happening at any given time and what could happen in an hour or a day or a week, enabling law enforcement agencies to interactively visualize and analyze their datasets in linked geospatial or mapping and temporal views of time graphs, calendars and clock views. It can layer in weather information, zoning tracks, census and demographic data — even the moon phase.
VALET can be used on most computers, and its companion software, called iVALET, has been designed specifically for the iPhone and iPad.
“One of my sayings is, ‘We need to work smarter, not harder,’ and the VALET toolkit allows us to pull data so we are in a better position to put officers in the right place at the right time when a situation arises. Providing this type of situational awareness gives us the higher level of assessment so we can better cover high-crime areas or give officers context of what is happening so they know what they are walking into when on patrol or responding to a call.”
— John K. Cox, Purdue University Police Chief
Why it is UsefulLaw enforcement relies on data for analyzing high-volume criminal, traffic and civil (CTC) incidents for assistance in pre-venting crimes and judiciously allocate resources for the law enforcement community. Datasets, however, are increasing in size and complexity. And as budgets shrink and departments scale back, local law enforcement agencies are strained to effectively analyze the helpful data being collected.
VALET explores and analyzes multivariate, spatial and temporal law enforcement data to enable advanced data explora-tion and analysis of CTC incidence reports. VALET includes temporal prediction algorithms to forecast future criminal, traf-fic and civil incident levels within a 95% confidence interval. That means estimates of the collected data could be reliably repeated and used to predict future behaviors or actions.
Examples:• At police department headquarters, officials can plan regular routes based on crime rates and the times of the day
or week crimes are most likely to occur.• Factoring in weather forecasts or scheduled major events that could clog vehicular traffic on main roads. • Statistical analysis of historical data and temporal prediction algorithms can forecast future criminal, traffic and civil
incident levels with 95% confidence.• Available to officers in patrol cars, who can access it via their onboard laptops. The mobile version, iVALET, works
with iPhones and iPads for officers who are on foot.
VALET (Visual Analytics Law Enforcement Toolkit) PRODUCT
VISUAL ANALYTICS FOR COMMAND, CONTROL, AND INTEROPERABILITY ENVIRONMENTSA U.S. Department of Homeland Security Center of Excellence VACCINE

Data Layers: • Criminal, Traffic, Civil • Calendar Events • Weather • Census & Demographic • Geographic Information Systems • Moon Phase
“We are doing more than providing law enforcement officers with specific data covering their areas, because we’ve devel-oped a portal for potential other issues such as prominent calendar dates, zoning tracts and even weather reports to help officers in their daily routines to protect the public.”
— Abish Malik, research scientist
What’s NextIMPACTAnalyzing high-volume criminal, traffic and civil (CTC) incident data is a crucial component for building and maintaining situation awareness of these incidents to ensure effective policing for maintaining public safety. Additionally, systems that are portable are desired because law enforcement officers are often on the road for duty. Police departments from South Carolina and Virginia to Indiana and Ohio have been tapping into predictive analytics as a crime-solving and -prevention tool — with success and positive results.
By developing a mobile visual analytics toolkit, Purdue-led researchers are able to assist law enforcement in the exploration and analysis of the multivariate spatiotemporal CTC data in detecting unusual criminal occurrences. Other work includes in-tegration with the GARI technology to show gang tags, chemical plume modeling based on current weather conditions, and risk profiling based on the user’s current time and location.
COLLABORATORS• Illinois State Police Department • Lafayette (Ind.) Police Department • New York State Police Department • Ohio State Highway Patrol • Purdue University Police Department • Tippecanoe County (Ind.) Sheriff ’s Department • West Lafayette (Ind.) Police Department
VISUAL ANALYTICS FOR COMMAND, CONTROL, AND INTEROPERABILITY ENVIRONMENTSA U.S. Department of Homeland Security Center of Excellence
This image developed through the VALET tool highlights a map of a selected location surrounded by a line graph, calendar view, clock view and crime history, with a time slider that ties the data together so crime reports, for example, can be viewed over a selected time. The screen also includes a Twitter widget to help detect unusual activity, such as a protest or riot.
Contact UsWant to find out how VACCINE’s research can help your organization or group? Email [email protected] or visit www.visualanalytics-CCI.org.
EA/EOU Produced by Purdue Marketing and Media EVPRP-16-8486
VACCINE

What VASA DoesVASA, which stands for Visual Analytics for Security Applications, is a visual analytics platform for simulating the impact of societal threats such as weather, food contamination and traffic on critical infrastructure. It consists of a desktop applica-tion, a component model and a suite of distributed simulation components.
Why it is UsefulBoth civic and business analysts often struggle to estimate the impact of an event, forecast damage and discover opti-mal solutions, because they lack complete sets of data, reliable simulation models and existing environments for deci-sion-making.
VASA is a visual analytics system currently in development that provides this environment for analysts and decision-mak-ers, and it provides a model for investigating a disaster-stressed, regional smart grid infrastructure. VASA also can investi-gate weak points and cascading effects due to failures in an overall infrastructure including electrical, water, transporta-tion, food distribution and others.
Additionally, it provides a web service for onsite managers to access the results of simulations. This offers the unique capability to determine what will happen, when and where, and who and what infrastructures will be affected. Immediate, appropriate action can be taken, and analysts can evaluate the risk vs. return of different alternatives.
continued . . .
VASA (Visual Analytics for Security Applications) PRODUCT
VISUAL ANALYTICS FOR COMMAND, CONTROL, AND INTEROPERABILITY ENVIRONMENTSA U.S. Department of Homeland Security Center of Excellence VACCINE
Visualization of stores in North Carolina damaged by Hurricane Irene (August 2011).

Layers of DataVASA juxtaposes various data to provide an accurate evaluation and context of the scenario. The layers are:
• Infrastructure geolocations• Distribution routes• Economic and business models• Weather event data
VISUAL ANALYTICS FOR COMMAND, CONTROL, AND INTEROPERABILITY ENVIRONMENTSA U.S. Department of Homeland Security Center of Excellence
Contact UsWant to find out how VACCINE’s research can help your organization? Email [email protected] or visit www.visualanalytics-CCI.org.
EA/EOU Produced by Purdue Marketing and Media EVPRP-17-8983
VACCINE
Power transmission grid for simulation.
Transportation network for simulation.

What vBOLO DoesvBOLO, which stands for Video Be on the Lookout, is a video detection technology that enhances current video surveil-lance by identifying features of a person committing a crime. The tool then uses those features to create a lineup of sub-jects matching those identifying features. Ultimately, it can re-identify persons of interest who reappear in the surveillance system, in a lineup of 10, at 90% accuracy.
How it WorksThe method uses computer vision and image processing techniques to create features of the subject. Humans are contin-uously detected and monitored to determine when the subject reappears in the video. This is done by extracting features, which include color, texture, face and motion information, from each candidate and matching it to the subject. The result of the matching process is a constantly updated list of likely matches to the subjects.
Why it is UsefulIn many cases, a subject will return to the scene of his/her crime days or hours later, at which point there is an opportunity to re-identify the person of interest, sound an alarm and apprehend the individual.
vBOLO provides that opportunity by re-identifying persons of interest, flags that the subject has reappeared and where they are located. Developers hope to improve the accuracy rate to 95% in a lineup of five by adding high-resolution video, motion features, improved body features, facial analysis and subject attributes (items carried or specific type of clothing worn, such as a backpack or a skateboard).
continued . . .
vBOLO (Video Be on the Lookout) PRODUCT
VISUAL ANALYTICS FOR COMMAND, CONTROL, AND INTEROPERABILITY ENVIRONMENTSA U.S. Department of Homeland Security Center of Excellence VACCINE
Screen shot of vBOLO selecting a target, pulling a lineup and matching the subject.

VISUAL ANALYTICS FOR COMMAND, CONTROL, AND INTEROPERABILITY ENVIRONMENTSA U.S. Department of Homeland Security Center of Excellence
Contact UsWant to find out how VACCINE’s research can help your organization? Email [email protected] or visit www.visualanalytics-CCI.org.
EA/EOU Produced by Purdue Marketing and Media EVPRP-17-8983
VACCINE
Where it is Being UsedvBOLO was developed for the Greater Cleveland Regional Transit Authority, where it has been tested.
“The results to date have been very impressive and I feel that continuing the development of these techniques will have real impact in how we are able to use our surveillance system. This could be easily extended to other transit systems and law enforcement applications throughout the country.”
— John P. Joyce, Chief of Police, Director of Security Greater Cleveland Regional Transit Authority

Publications
2004
“IN-SPIRE InfoVis 2004 Contest Entry,” Pak Chung Wong, Beth Hetzler, Christian Posse, Mark Whiting, Susan Havre, Nick Cramer, Anuj Shah, Mudita Singhal, Alan Turner, Jim Thomas; IEEE Symposium on Information Visualization. InfoViz 2004.
“Visual Analytics,” Pak Chung Wong, Jim Thomas; IEEE Computer Graphics and Applications, September/October 2004; pp 20-21.
“Value and Relation Display: Interactive Visual Exploration of Large Datasets with Hundreds of Dimensions,” Jing Yang, Daniel Hubball, Matthew Ward, Elke Rundensteiner, William Ribarsky Oct. 2004
2005
“Dynamic Visualization of Graphs with Extended Labels,” Pak Chung Wong, Patrick Mackey, Ken Perrine, James Eagan, Harlan Foote, Jim Thomas; 2005 IEEE Symposium on Information Visualization, October 2005.
“Flow Map Layout,” Doantam Phan, Ling Xiao, Ron Yeh, Pat Hanrahan, Terry Winograd; Proceedings of IEEE Information Visualization 2005 pp. 219-224.
“Building a Human Information Discourse Interface to Uncover Scenario Content,” Sanfilippo, B. Baddeley, A. J. Cowell, M. L. Gregory, R. Hohimer, S. Tratz; 2005 International Conference on Intelligence Analysis, McLean, VA, Mitre Website.
“InfoStar: An Adaptive Visual Analytics Platform for Mobile Devices,” Antonio Sanfilippo, Richard May, Gary Danielson, Bob Baddeley, Rick Riensche, Skip Kirby, Sharon Collins, Susan Thornton, Kenneth Washington, Matt Schrager, Jamie Van Randwyk, Bob Borchers, Doug Gatchell; MCMP '05 First International Workshop on Managing Context Information in Mobile and Pervasive Environments held in Ayia Napa, Cyprus, May 9, 2005, AachenGermany.
“Visual Analytics and Storytelling Through Video,” Pak Chung Wong, Ken Perrine, Patrick Mackey, Harlan Foote, Jim Thomas; InfoVis05 Proceedings: IEEE Symposium on Information Visualization, October 23-25, 2005 - Video Track.
“Illuminating the Path: The Research and Development Agenda for Visual Analytics”, James J. Thomas, Kristin A. Cook; Los Alamitos, CA, IEEE Computer Society. 2005
“Punctuated Simplification of Man-made Objects,” Justin Jang, Peter Wonka, William Ribarsky, Christopher D. Shaw. Nov. 2005
“Towards a Unified Approach to Information Integration—A Review Paper on Data/Information Fusion,” P. D. Whitney, C. Posse, X. C. Lei. Oct. 2005
tbescher
Typewritten Text
Addendum - List of Publications (VACCINE Publications)

2006
“Access Control Enforcement for Conversation-based Web Services,” Massimo Mecella, Mourad Ouzzani, Federica Paci, Elisa Bertino; Proc. of the 15th International World Wide Web Conference, Edinburgh, UK, May 2006.
“An Educational Digital Library for Human-Centered Computing,” Edward Clarkson, James D. Foley, Jason A. Day; CHI 2006 Extended Abstracts on Human Factors in Computing Systems, ACM, New York, NY, pp. 646-651.
“Beyond Usability: Evaluation Aspects of Visual Analytic Environments,” Jean Scholtz; 2006 IEEE Symposium On Visual Analytics And Technology, Oct 31, 2006 - Nov 02, 2006, Baltimore, MD, United States, Piscataway, NJ, IEEE.
“Browsing Affordance Designs for the Human-Centered Computing Education Digital Library,” Edward Clarkson, James D. Foley; ACM/IEEE Joint Conference on Digital Libraries '06, p. 361.
“Visual Inquiry of Spatio-Temporal Multivariate Patterns,” Jin Chen; IEEE Symposium on Visual Analytics Science and Technology (VAST 2006), Baltimore, MD.
“Visual Inquiry Toolkit—An Integrated Approach for Exploring and Interpreting Space-Time, Multivariate Patterns,” Jin Chen, Alan M. MacEachren, Diansheng Guo; AutoCarto 2006, Vancouver, WA.
“Interactive Visualization and Analysis of Network and Sensor Data on Mobile Devices,” Avin Pattath, Brian Bue, Yun Jang, David Ebert, Xuan Zhong, Aaron Ault, Edward Coyle; IEEE Symposium on Visual Analytics Science and Technology (VAST) 2006, pp. 83-90, 2006.
“Visual Analysis of Conflicting Opinions,” Chaomei Chen, Fidelia Ibekwe-SanJuan, Eric SanJuan, Chris Weaver; IEEE Symposium on Visual Analytics Science and Technology (VAST 2006), Baltimore, MD.
“Visual Analytics Education,” James Foley, Stu Card, David Ebert, A. MacEachren, Bill Ribarsky; VAST ,pp.209-211, 2006 IEEE Symposium On Visual Analytics Science And Technology, 2006.
“Enhancing Visual Analysis of Network Traffic Using a Knowledge Representation,” Ling Xiao, John Gerth Pat Hanrahan; IEEE VAST 2006 pp. 107-114.
“Resource- and Task-Driven Visualization Adaptation,” Ahmed Elmagarmid, Alok Chaturvedi, Mourad Ouzzani, David S. Ebert, Yung-Hsiang Lu, Edward J. Delp, William Cleveland; CHI'06 Workshop: Information Visualization and Interaction Techniques for Collaboration across Multiple Displays, pp. 113-116, 2006.

“VAC Views” Issue 1, July 2006
“VAST 2006 Contest—A Tale of Alderwood,” Georges Grinstein, Theresa O’Connell, Sharon Laskowski, Catherine Plaisant, Jean Scholtz, Mark Whiting; IEEE Symposium on Visual Analytics Science and Technology 2006, Baltimore, MD, IEEE.
“Re-Visualization: Interactive Visualization of the Process of Visual Analysis,” Anthony C. Robinson, Chris Weaver; GIScience 2006, Visualization, Analytics & Spatial Decision Support Workshop, Muenster, Germany.
“A Visual Analytics Agenda,” James J.Thomas, Kristin A. Cook; IEEE Computer Graphics and Applications 26(1): 10-13. Jan. 2006
“Walking The Path: A New Journey to Explore and Discover Through Visual Analytics,” Pak Chung Wong, Stuart J Rose, George Chin Jr., Deborah A Frincke, Richard May, Christian Posse, Antonio Sanfilippo, Jim Thomas; Information Visualization 5(4): 237-249. Dec. 2006
“Arrows in Comprehending and Producing Mechanical Diagrams,” Julie Heiser, Barbara Tversky; Cognitive Science, 30, 581-592. May 2006
“Cognitive Design Principles: from Cognitive Models to Computer Models,” Barbara Tversky, Maneesh Agrawala, Julie Heiser, Paul Lee, Pat Hanrahan, Doantam Phan, Chris Stolte, Marie-Paule Daniel; In L. Magnani (Editor) Model-based reasoning in science and engineering. pp. 1-20. London: King’s College. 2006
“Exploring Large-Scale Video News via Interactive Visualization,” Hangzai Luo, Jianping Fan, Jing Yang, William Ribarsky, Shin’ichi Satoh. Nov. 2006
“Generating Graphs for Visual Analytics Through Interactive Sketching,” Pak Chung Wong, Harlan Foote, Patrick Mackey, Ken Perrine, George Chin Jr.; IEEE Transactions on Visualization and Computer Graphics Volume 12, Number 6. Nov. 2006
“Graph Signatures for Visual Analytics,” Pak Chung Wong, Harlan Foote, George Chin Jr., Patrick Mackey, Ken Perrine; Transactions on Visualization and Computer Graphics 12(6). Sept. 2006
“Have Green—A Visual Analytics Framework for Large Semantic Graphs,” Pak Chung Wong, George Chin Jr., Harlan Foote, Patrick Mackey, Jim Thomas; IEEE Symposium on Visual Analytics Science and Technology, Baltimore, Maryland USA. Nov. 2006
“Hierarchical Simplification of City Models to Maintain Urban Legibility,” Remco Chang, Thomas Butkiewicz, Caroline Ziemkiewicz, Zachary Wartell, Nancy Pollard, William Ribarsky. July 2006
“Improvisational Geovisualization of the 2000 United States Census,” Chris Weaver. 2006

“Integrating Semantic Video Understanding and Knowledge Visualization for Large-Scale News Video Exploration,” Hangzai Luo, Jianping Fan, Shin’ichi Satoh, Jing Yang, William Ribarsky. Dec. 2006
“Interactive Wormhole Detection in Large Scale Wireless Networks,” Weichao Wang, Aidong Lu. Nov. 2006
“Isn’t It About Time?,” Olga A. Kuchar, Thomas J. Hoeft, Susan Havre, Kenneth A. Perrine; IEEE Computer Graphics and Applications 26(3): 80-83. 2006
“Parallel Sets: Interactive Exploration and Visual Analysis of Categorical Data,” Robert Kosara, Fabian Bendix, Helwig Hauser. June 2006
“Resource-Driven Content Adaptation,” Yung-Hsiang Lu, David S. Ebert, Edward J. Delp. 2006
“Semantic Image Browser: Bridging Information Visualization with Automated Intelligent Image Analysis,” Jing Yang, Jianping Fan, Daniel Hubball, Yuli Gao, Hangzai Luo William Ribarsky, Matthew Ward. Nov. 2006
“Spatial Ordering and Encoding for Geographic Data Mining and Visualization,” Diansheng Guo, Mark Gahegan; Journal of Intelligent Information Systems 27(3): 243-266. Nov. 2006
“Threat Stream Data Generator: Creating the Known Unknowns for Test and Evaluation of Visual Analytics Tools,” Mark A. Whiting, Wendy Cowley, Jereme Haack, Doug Love, Stephen Tratz, Caroline Varley, Kim Wiessner. May 2006
“Towards an Extendable Software System for Information Integration,” Paul Whitney, Christian Posse, Xingye Lei. 2006
“Visual Analysis of Historic Hotel Visitation Patterns,” Chris Weaver, David Fyfe, Anthony Robinson, Deryck Holdsworth, Donna Peuquet, Alan M. MacEachren; Information Visualization 6: 89-103. Sept. 2006
2007
“TextPlorer: An Application Supporting Text Analysis,” Chi-Chun Pan, Anuj R. Jaiswal, Junyan Luo, Anthony Robinson; IEEE Symposium on Visual Analytics Science and Technology (VAST 2007). Sacramento, CA.
“Jigsaw Meets Blue Iguanodon - The VAST 2007 Contest,” Carsten G org, Zhicheng Liu, Neel Parekh, Kanupriya Singhal, John Stasko; Proceedings of IEEE VAST '07, pp. 235-236.
“Visual Analytics: Why Now?,” James J. Thomas; Information Visualization 6(1): 104-106. 2007

“Visual Exploration And Analysis of Historic Hotel Visits,” Chris Weaver, David Fyfe, Anthony Robinson, Deryck Holdsworth, Donna Peuquet, Alan M. MacEachren. March 2007
“LAHVA: Linked Animal-Human Health Visual Analytics,” Ross Maciejewski, Benjamin Tyner, Yun Jang, Cheng Zheng, Rimma V. Nehme, David S. Ebert, William S. Cleveland, Mourad Ouzzani, Shaun J. Grannis, Lawrence T. Glickman; IEEE Symposium on Visual Analytics Science and Technology (VAST), pp27-34, 2007.
“Augmenting Digital Library Search Interfaces with Visual Analysis Tools,” Edward Clarkson, James D. Foley; IEEE Visualization Doctoral Colloquium (IEEE Vis 2007).
“Duplicate Elimination in Space-partitioning Tree Indexes,” M. Y. Eltabakh, Mourad Ouzzani, Walid G. Aref; Proc. of the 19th International Conference on Scientific and Statistical Database Management (SSDBM 2007), Banff, Canada, July 2007.
“Duplicate Record Detection: A Survey,” Ahmed K. Elmagarmid, Panagiotis G. Ipeirotis, Vassilios S. Verykios; IEEE Trans. Knowl. Data Eng. 19(1): 1-16 (2007).
“Visualization of Heterogeneous Data,” Mike Cammarano, Xin (Luna) Dong, Bryan Chan, Jeff Klingner, Justin Talbot, Alon Halevy, Pat Hanrahan; Proceedings of IEEE Information Visualization 2007 pp. 1200-1207.
“Volume Illustration Using Wang Cubes,” Aidong Lu, David S. Ebert, Wei Xiao, Martin Kraus, Benjamin Mora; ACM Transactions on Graphics, Vol. 26, No. 2, 2007.
“Visual Analytics on Mobile Devices for Emergency Response,” SungYe Kim, Yun Jang, Angela Mellema, David S. Ebert, Timothy Collins; IEEE Symposium on Visual Analytics Science and Technology (VAST), pp.35-42, 2007.
“Visual Analytics Science and Technology,” Pak Chung Wong (Guest Editor); Information Visualization 2007(6): 1-2.
“Visual Analytics with Jigsaw,” Carsten Görg, Zhicheng Liu, Neel Parekh, Kanupriya Singhal, John Stasko; Proceedings of IEEE VAST '07, pp. 201-202.
“Conservative Voxelization,” Long Zhang, Wei Chen, David S. Ebert, Qunsheng Peng; The Visual Computer, selected paper from Computer Graphics International 2007.
“Tracing Conceptual and Geospatial Diffusion of Knowledge,” Chaomei Chen, Weizhong Zhu, Brian Tomaszewski, Alan MacEachren; HCI International 2007, Lecture Notes in Computer Science (LNCS 4564), Beijing, P.R. China.
“Facilitating Situation Assessment Through GIR with Multi-scale Open Source Web Documents,” Brian M. Tomaszewski, Chi-Chun Pan, Prasenjit Mitra, Alan M. MacEachren; 4th Workshop on Geographic Information Retrieval, held at CIKM 2007. Lisbon, Portugal.

“FemaRepViz: Automatic Extraction and Geo-Temporal Visualization of FEMA National Situation Updates,” Chi-Chun Pan, Prasenjit Mitrat; IEEE Symposium on Visual Analytics Science and Technology (VAST 2007). Sacramento, CA.
“Geographic Information Retrieval from Disparate Data Sources,” Ian Turton, Mark Gahegan, Anuj Jaiswal; GeoComputation 2007, Maynooth, Ireland.
“TIBOR: A Resource-bounded Information Foraging Agent for Visual Analytics,” Dingxiang Liu, Anita Raja, Jayasri Vaidyanath; Proc. 2007 IEEE/ WIC/ ACM International Conference on Intelligent Agent Technology (IAT 2007), pp. 349-355.
“Toward a Deeper Understanding of the Role of Interaction in Information Visualization,” Ji Soo Yi, Youn ah Kang, John T. Stasko, Julie A. Jacko; IEEE Transactions on Visualization and Computer Graphics, InfoVis '07, 13(6) pp. 1224-1231.
“Evaluating Visual Analytics at the 2007 VAST Symposium Contest,” Catherine Plaisant, Georges Grinstein, Jean Scholtz, Mark Whiting, Theresa O’Connell, Sharon Laskowski, Lynn Chien, Annie Tat, William Wright, Carsten Görg, Zhicheng Liu, Neel Parekh, Kanupriya Singhal, John Stasko; IEEE Computer Graphics and Applications, Vol. 28, No. 2, pp. 12-21.
“Interactive Illustrative Rendering on Mobile Devices,” Jingshu Huang, Brian Bue, Avin Pattath, David S. Ebert, Krystal M. Thomas; IEEE Computer Graphics and Applications, Vol. 27, No. 3, pp. 48-56, 2007.
“Local Model Semantics, Categories, and External Representation: Towards a Model for Geo-historical Context,” Brian Tomaszewski; Doctoral Consortium Proceedings, Sixth International and Interdisciplinary Conference on Modeling and Using Context (CONTEXT'07), Roskilde University, Denmark.
“Visual Analysis of Network Flow Data with Timelines and Event Plots,” Doantam Phan, John Gerth, Marcia Lee, Andreas Paepcke, Terry Winograd; Proceedings of Visualization for Security 2007 pp. 85-99.
“Scalable Visual Reasoning: Supporting Collaboration through Distributed Analysis,” William A. Pike, Richard May, Bob Baddeley, Roderick Riensche, Joe Bruce, Katarina Younkin; 2007 International Symposium on Collaborative Technologies and Systems, New York, NY, IEEE Press.
“Shape-aware Volume Illustration,” Wei Chen, Aidong Lu, David S. Ebert; Computer Graphics Forum, Vol. 26, Issue 3, Eurographics 2007.
“Privacy Preserving Schema and Data Matching,” Monica Scannapieco, Ilya Figotin, Elisa Bertino, Ahmed Elmagarmid; SIGMOD Conference 2007: 653-664.
“Progressive Multiples for Communication-Minded Visualization,” Doantam Phan, Andreas Paepcke, Terry Winograd; Proceedings of Graphics Interface 2007 pp. 225-232.

“ResultMaps: Search Result Visualization for Hierarchical Information Spaces,” Edward C. Clarkson, James D. Foley; Proceedings of ACM CHI '07 Workshop on Exploratory Search and HCI, pp. 32-39.
“VAC Views” Issue 2, February 2007
“VAC Views” Issue 3, November 2007
“VAST 2007 Contest—Blue Iguanodon,” Georges Grinstein, Catherine Plaisant, Sharon Laskowski, Theresa O’Connell, Jean Scholtz, Mark Whiting; IEEE Symposium on Visual Analytics, Science and Technology, Piscataway, NJ, IEEE.
“VAST 2007 Contest—TexPlorer,” Chi-Chun Pan, Anuj R. Jaiswal, Junyan Luo, Anthony Robinson, Prasenjit Mitra, Alan M. MacEachren, Ian Turton; Visual Analytics Science and Technology, 2007. VAST 2007. IEEE Symposium.
“STL and Local Regression for Modeling Disease Surveillance Counts,” David E. Anderson, Cheng Zheng, Ross Maciejewski, Ryan Hafen, William S. Cleveland, David S. Ebert, Mourad Ouzzani, Shaun J. Grannis; 2007 Conference of the International Society for Disease Surveillance: Evaluation and Performance, Vol 4, 2007.
“Supporting Knowledge Transfer through Decomposable Reasoning Artifacts,” William Pike, Richard May, Alan Turner; 40th Annual Hawaii International Conference on System Sciences (HICSS '07), January 3-6, 2007, Waikoloa, Hawaii.
“A Query-Aware Document Ranking Method for Geographic Information Retrieval,” Bo Yu, Guoray Cai; Proceedings of the 4th ACM workshop on Geographical information retrieval, Lisbon, Portugal, ACM. Nov. 2007
“A Robust Incremental Learning Framework for Accurate Skin Region Segmentation in Color Images,” Bin Li, Xiangyang Xue, Jianping Fan. Dec. 2007
“A STAB at Making Sense of VAST Data,” Summer Adams, Ashok K. Goel. May 2007
Jing Yang, Yujie Liu, Xin Zhang, Xiaoru Yuan, Ye Zhao, Scott Barlowe, and Shixia Liu: PIWI: Interactively Exploring Large Graphs Without Clutter. 01/2007 Multimedia, Social Media, Text, and Emergency Response Analytics; Published
“WireVis: Visualization of Categorical, Time-Varying Data From Financial Transactions,” Remco Chang, Mohammad Ghoniem, Robert Kosara, William Ribarsky, Jing Yang, Evan Sumak, Caroline Ziemkiewicz, Daniel Kern, Agus Sudjiant. Nov. 2007
“From Visualization to Visually Enabled Reasoning,” Joerg Meyer, Jim Thomas, Stephan Diehl, Brian Fisher, Daniel Keim, David Laidlaw, Silvia Misch, Klaus Mueller, William Ribarsky, Bernhard Preim, and Anders Ymmerman; Proceedings of Dagstuhl Seminar No. 07291 on Scientific Visualization. July 2007
“An Open GeoSpatial Standards-Enabled Google Earth Application to Support Crisis Management,” Scott Pezanowski, Brian Tomaszewski, Alan M. MacEachren; The 3rd
International Symposium on Geo-information for Disaster Management, Toronto, Ontario. 2007
“Analyzing Large-Scale News Video Databases to Support Knowledge Visualization and Intuitive Retrieval,” Hangzai Luo, Jianping Fan, Jing Yang, William Ribarsky, Shin’ichi Satoh. Nov. 2007
“Analyzing Sampled Terrain Volumetrically with Regard to Error and Geologic Variation,” Thomas Butkiewicz, Remco Chang, Zachary Wartell, William Ribarsky. Jan. 2007
“Benchmark Analysis for Quantifying Urban Vulnerability to Terrorist Incidents,” Walter W. Piegorsch, Susan L. Cutter, Frank Hardisty; Risk Analysis 27(6): 1411-1425. Dec. 2007
“Beyond Ontologies: Toward Situated Representations of Scientific Knowledge,” William Pike, Mark Gahegan; Journal of Human-Computer Studies 65(7): 674-688. March 2007
“Developing Geo-temporal Context from Implicit Sources with Geovisual Analytics,” Brian Tomaszewski; ICA Commission on Visualization and Virtual Environments, Helsinki, Finland. Aug. 2007
“Discovering the Unexpected,” Kris Cook, Rae Earnshaw, John Stasko. Oct. 2007
“Exploiting the User: Adapting Personas for Use in Security Visualization Design,” Jennifer Stoll, David McColgin, Michelle Gregory, Vern Crow, W. Keith Edwards; VizSec: Workshop on Visualization for Computer Security, New York, NY, Springer. Jan. 2007
“Geovisual Analytics and Crisis Management,” Brian M. Tomaszewski, Anthony C. Robinson, Chris Weaver, Michael Stryker, Alan M. MacEchren. Jan. 2007
“Geovisual Analytics for Spatial Decision Support: Setting the Research Agenda,” G. Andrienko, N. Andrienko, P. Jankowski, D. Keim, M.-J. Kraak, A. MacEachren, S. Wrobel. July 2007
“Gestalts of Thought,” Barbara Tversky; In L. Albertazzi (Editor), Visual thought, pp. 155-163. Amsterdam: Benjamins. Jan. 2007
“Incorporating Concept Ontology for Hierarchical Video Classification, Annotation, and Visualization,” Jianping Fan, Hangzai Luo, Yuli Gao, Ramesh Jain. July 2007
“Introspective Self-Explanation in Analytical Agents,” Anita Raja, Ashok Goel. May 2007
“Legible Cities: Focus-Dependent Multi-Resolution Visualization of Urban Relationships,” Remco Chang, Ginette Wessel, Robert Kosara, Eric Sauda, William Ribarsky. Nov. 2007

“Leveraging the Potential of Geospatial Annotations for Collaboration: A Communication Theory Perspective,” S. Hopper, A.M. MacEachren; International Journal of Geographical Information Science 21(8): 921 - 934. July 2007
“Making Sense of VAST Data,” Summer Adams, Ashok K. Goel. May 2007
“NewsLab: Exploratory Broadcast News Video Analysis,” Mohammad Ghoniem, Dongning Luo, Jing Yang, William Ribarsky. Nov. 2007
“Patterns of Coordination in Improvise Visualizations,” Chris Weaver. Jan. 2007
“Spatio-Temporal Analysis on FEMA Situation Updates with Automated Information Extraction,” Chi-Chun Pan, Prasenjit Mitra, Auroop R. Ganguly; ACM Workshop on Knowledge Discovery from Sensor Data, collocated with The Thirteenth ACM SIGKDD International Conference on Knowledge Discovery and Data Mining (KDD). San Jose, CA. 2007
“Synthesizing Geovisual Analytic Results,” Anthony C. Robinson; Proceedings of the IEEE Visual Analytics, Science and Technology Conference Doctoral Colloquium, Sacramento, CA. 2007
“Temporal and Information Flow Based Event Detection From Social Text Streams,” Qiankun Zhao, Prasenjit Mitra, Bi Chen. July 2007
2008
Drexel University
“An Information-Theoretic View of Visual Analytics,” Chaomei Chen; IEEE Computer Graphics & Applications 28(1): 18-23. Jan. 2008
Georgia Tech
“Sensemaking across Text Documents: Human-Centered, Visual Exploration with Jigsaw,” John Stasko, Carsten Görg, Zhicheng Liu; CHI '08 Workshop on Sensemaking, Florence, Italy, April 2008.
“Understanding and Characterizing Insights: How Do People Gain Insights Using Information Visualization?,” Ji Soo Yi, Youn-ah Kang, John T. Stasko, Julie A. Jacko; Proceedings of BELIV '08, Florence, Italy.
“Visualization for Information Exploration and Analysis,” John Stasko; Proceedings of the 2008 IEEE Symposium on Visual Languages and Human-Centric Computing, Herrsching am Ammersee, Germany, September 2008, pp. 7-8.
“Distributed Cognition as a Theoretical Framework for Information Visualization,” Zhicheng Liu, Nancy J. Nersessian, John T. Stasko; IEEE Transactions on Visualization and Computer Graphics, InfoVis '08, Vol. 14, No. 6, pp. 1173-1180.

“Jigsaw: Supporting Investigative Analysis through Interactive Visualization,” John Stasko, Carsten Görg, Zhicheng Liu, Kanupriya Singhal; Information Visualization, Vol. 7, No. 2, pp. 118- 2008
“Augmenting Faceted Exploration with ResultMaps,” Edward C. Clarkson, James D. Foley; Second Workshop on Human-computer Interaction and Information Retrieval (HCIR 2008).
“Multidimensional Visual Analysis Using Cross-Filtered Views,” Chris Weaver; AST 2008. Columbus, OH, 163-170.
Pacific Northwest National Laboratory
“A Dynamic Multiscale Magnifying Tool for Exploring Large Sparse Graphs,” Pak Chung Wong, Harlan Foote, Patrick Mackey, George Chin, Heidi Sofia, Jim Thomas; Information Visualization 7: 105-117. April 2008
“Creating Realistic, Scenario-Based Synthetic Data for Test and Evaluation of Information Analytics Software,” Mark A. Whiting, Jereme Haack, Carrie Varley. April 2008
“From Desktop to Field: Deploying Visual Incident Analysis for Law Enforcement,” Bob Baddeley, Katarina Younkin, Rick Riensche, Daniel Best, William A. Pike, Richard May; IEEE Conference on Technologies for Homeland Security, pp. 209-214. May 2008
“The Scalable Reasoning System: Lightweight Visualization for Distributed Analytics,” William A. Pike, Joe Bruce, Bob Baddeley, Daniel Best, Lyndsey Franklin, Richard May, Douglas M. Rice, Rick Riensche, Katarina Younkin; IEEE Symposium on Visual Analytics Science and Technology (VAST), pp. 131-138.Oct. 2008
Microsoft Corp.
“Using Visualization to Support Network and Application Management in a Data Center,” Danyel Fisher, David A. Maltz, Albert Greenberg, Xiaoyu Wang, Heather Warncke, George Robertson, Mary Czerwinski. Oct. 2008
Penn State
“Health Geojunction: Geovisualization of News and Scientific Publications to Support Situation Awareness,” Michael Stryker, Ian Turton, Alan M. MacEachren; GIScience 2008. Park City, Utah.
“GeoDialogue: A Software Agent Enabling Collaborative Dialogues between a User and a Conversational GIS,” Hongmei Wang, Guoray Cai, Alan M. MacEachren; 20th IEEE Int'l Conference on Tools with Artificial Intelligence (ICTAI 2008), Dayton, Ohio.
“Grand Challenge Award: Data Integration,” Donald Pellegrino, Chi-Chun Pan, Anthony Robinson, Michael Stryker, Junyan Luo, Chris Weaver, Prasenjit Mitra, Chaomei Chen, Ian Turton, Alan MacEachren; IEEE Visual Analytics, Science Technology Conference (VAST 2008), Columbus, OH.

“Visualizing Unstructured Text Documents Using Trees and Maps,” Ian Turton, Alan M. MacEachren; Workshop on Geospatial Visual Analytics at GIScience '08. Park City, Utah.
“Visual Analytics of Spatial Scan Statistic Results,” Jin Chen, Alan MacEachren, Eugene Lengerich; GIScience 2008. Park City, Utah.
“Cross-dimensional Visual Queries for Interactive+Animated Analysis of Movement,” Chris Weaver. Sept. 2008
“Collaborative Synthesis of Visual Analytic Results,” Anthony C. Robinson; IEEE Visual Analytics, Science Technology Conference (VAST 2008). Columbus, OH.
“Web-based Geovisualization and Geocollaboration: Applications to Public Health,” Robert E. Roth, Anthony Robinson, Michael Stryker, Alan M. MacEachren, Eugene J. Lengerich, Etien Koua; JSM Proceedings, Statistical Computing Section, Denver, CO, Alexandria, VA: American Statistical Association. 2008
“Design for Synthesis in Geovisualization,” Anthony Christian Robinson. May 2008
“Resolution Control for Balancing Overview and Detail in Multivariate Spatial Analysis,” Jin Chen, Alan M. MacEachren; Cartographic Journal. Nov. 2008
“Supporting the Process of Exploring and Interpreting Space—Time Multivariate Patterns: The Visual Inquiry Toolkit,” Jin Chen, Alan M. MacEachren, Diansheng Guo; Cartography and Geographic Information Science 35(1): 33-50. Jan. 2008
“A Web Based Tool for the Detection and Analysis of Avian Influenza Outbreaks From Internet News Sources,” Ian Turton, Andrew Murdoch; AutoCarto 2008: Poster Abstracts, Shepherdstown, West Virginia.
“VAST 2008 Wiki Editors Mini Challenge—Identifying Social Networks using Wiki.viz,” Chi-Chun Pan, Donald Pellegrino, Chris Weaver, Prasenjit Mitra; IEEE Visual Analytics, Science Technology Conference (VAST 2008). Columbus, OH.
“A System for the Automatic Comparison of Machine and Human Geocoded Documents,” Ian Turton; Proceedings of the 2nd international workshop on Geographic information retrieval, Napa Valley, California, USA, ACM. Oct. 2008
“Understanding Government Contexts in GeoCollaborative Crisis Management,” Guoray Cai, Brian Tomaszewski. 2008
Purdue - Ebert
“The Day-of-the-Week Effect: A Study Across the Indiana Public Health Emergency Surveillance System,” Ross Maciejewski, Stephen Rudolph, Shaun J. Grannis, David S. Ebert; Conference of the International Society for Disease Surveillance, December 2008.

“A Visual Analytics Toolkit for Evaluating Potential Syndromic Outbreaks,” Ross Maciejewski, Stephen Rudolph, Shaun J. Grannis, David S. Ebert; 2008 Conference of the International Society for Disease Surveillance, December 2008.
“Abstractive Representation and Exploration of Hierarchically Clustered Diffusion Tensor Fiber Tracts,” Weri Chen, Song Zhang, Stephfan Correia, David S. Ebert; Computer Graphics Forum, Proceedings of EuroVis 2008.
“Applied Visual Analytics for Economic Decision-Making,” Anya Savikhin, Ross Maciejewski, David S. Ebert; IEEE Symposium on Visual Analytics Science and Technology (VAST), 2008.
“Companion Animals as Sentinels for Community Exposure to Industrial Chemicals: The Fairburn, GA, Propyl Mercaptan Case Study,” Ross Maciejewski, Nita Glickman, George Moore, Cheng Zheng, Benjamin Tyner, William Cleveland, David Ebert, Larry Glickman; The Fairburn, GA Propyl Mercaptan Case-Study, Public Health Reports, 123(3), May/June 2008.
“Volume Composition and Evaluation Using Eye Tracking Data,” Aidong Lu, Ross Maciejewski, David S. Ebert; ACM Transactions on Applied Perception, 2008.
“Understanding Syndromic Hotspots—A Visual Analytics Approach,” Ross Maciejewski, Stephen Rudolph, Ryan Hafen, Ahmad Abusalah, Mohamed Yakout, Mourad Ouzzani, William S. Cleveland, Shaun J. Grannis, Michael Wade; IEEE Symposium on Visual Analytics Science and Technology (VAST), 2008.
“Situational Awareness and Visual Analytics for Emergency Response and Training,” Ross Maciejewski, SungYe Kim, Deen King-Smith, Karl Ostmo, Nicholas Klosterman, Aravind K. Mikkilineni, David S. Ebert, Edward J. Delp, Timothy F. Collins; IEEE International Conference on Technologies for Homeland Security, 2008.
“Visualization and Computer Graphics on Isotropically Emissive Volumetric Displays,” Benjamin Mora, Ross Maciejewski, Min Chen, David S. Ebert; IEEE Transactions on Visualization and Computer Graphics, 2008.
“Mobile Analytics for Emergency Response and Training,” SungYe Kim, Ross Maciejewski, Karl Ostmo, Edward J. Delp, Timothy F. Collins, David S. Ebert; Information Visualization (2008), 7, pp.77-88, 2008.
“Real Time Scalable Visual Analysis on Mobile Devices,” Avin Pattath, David S. Ebert, Richard A. May, Timothy F. Collins, William Pike; Conference on Multimedia on Mobile Devices 2008, part of the 20th Annual IS&T/SPIE Symposium on Electronic Imaging, Vol. 6821, Feb. 2008.
“Measuring Stipple Aesthetics in Hand-Drawn and Computer-Generated Images,” Ross Maciejewski, Tobias Isenberg, William M. Andrews, David S. Ebert, Mario Costa Sousa, Wei Chen; IEEE Computer Graphics and Applications, 28(2), 2008.

“Haptic Identification of Stiffness and Force Magnitude,” Steven A. Cholewiak, Hong Z. Tan, David S. Ebert; Proceedings of the Symposium on Haptic Interfaces for Virtual Environment and Teleoperator Systems, 87-91. April 2008
“Community-Cyberinfrastructure-Enabled Discovery in Science and Engineering,” Ahmed K. Elmagarmid, Arjmand Samuel, Mourad Ouzzani; Computing in Science & Engineering , September/October 2008, Vol,. 10, No. 5, pp. 46-53.
“Usage-Based Schema Matching,” Hazem Elmeleegy, Mourad Ouzzani, Ahmed Elmagarmid; 24th Int. Conf. on Data Engineering (ICDE), Cancun, Mexico, April 2008.
VAC Views” Issue 5, November 2008
“Verification of Access Control Requirements in Web Services Choreography,” Federica Paci, Mourad Ouzzani, Massimo Mecella; IEEE International Conference on Services Computing (SCC 2008), Honolulu, Hawaii, USA, July 8-11, 2008.
Simon Fraser University
“Evidence against a speed limit in multiple-object tracking,” S. L. Franconeri, J. Y. Lin, Z. W. Pylyshyn, B. Fisher, J. T. Enns; Psychonomic Bulletin & Review. Feb. 2008
“Lecture Notes in Computer Science: Smart graphics 9th international symposium,” Butz, B. Fisher, A. Kruger, P. Oliver; Srpinger-Verlag, Berlin, Heidelberg, New York. August 2008
Stanford University
“Improving the Accuracy of Gaze Input for Interaction,” Manu Kumar, Jeff Klingner, Rohan Puranik, Terry Winograd, Andreas Paepcke; Proceedings of the 2008 symposium on Eye Tracking Research and Applications. ACM New York, NY. March 2008, pp. 65-68.
“Measuring the Task-Evoked Pupillary Response with a Remote Eye Tracker,” Jeff Klingner, Rakshit Kumar, Pat Hanrahan; Proceedings of the 2008 symposium on Eye Tracking Research and Applications, ACM New York, NY. March 2008, pp. 69-72.
“Maintaining Interactivity While Exploring Massive Time Series,” Sye-Min Chan, Ling Xiao, John Gerth, Pat Hanrahan; Proceedings of IEEE VAST 2008 pp. 59-66.

“Vispedia: Interactive Visual Exploration of Wikipedia Data via Search-Based Integration,” Bryan Chan, Leslie Wu, Justin Talbot, Mike Cammarano, Pat Hanrahan; Proceedings of IEEE Information Visualization 2008 pp. 1213-1220.
“Cognitive Methods for Visualizing Space, Time, and Agents,” Angela M. Kessell, Barbara Tversky; Theory and application of diagrams. Dordrecht. 2008
“Making Thought Visible,” Barbara Tversky; In J. Gero (Editor), Studying design creativity. Dordrecth, Netherlands: Springer. Jan. 2008
“PhotoSpread: A Spreadsheet for Managing Photos,” Sean Kandel, Eric Abelson, Hector Garcia-Molina, Andreas Paepcke, Martin Theobald. 2008
University of Maryland
“VAST 2008 Challenge: Introducing Mini-Challenges,” Georges Grinstein, Catherine Plaisant, Sharon Laskowski, Theresa O’Connell, Jean Scholtz, Mark Whiting.
University of North Carolina at Charlotte
“A Novel Approach to Enable Semantic and Visual Image Summarization for Exploratory Image Search,” Jianping Fan, Yuli Gao, Hangzai Luo, Daniel A. Keim, Zongmin Li. Oct. 2008
Visual Analytics for Complex Concepts Using a Human Cognition Model,” Tera Marie Green, William Ribarsky Brian Fisher.Oct. 2008
“Visualizing Uncertainty for Geographical Information in the Global Terrorism Database,” Josh Jones, Remco Chang, Thomas Butkiewicz, William Ribarsky. April 2008
“Incorporating Feature Hierarchy and Boosting to Achieve More Effective Classifier Training and Concept-Oriented Video Summarization and Skimming,” Hangzai Luo, Yuli Gao, Xiangyang Xue, Jinye Peng, Jianping Fan. Jan. 2008
“Integrating Concept Ontology and Multitask Learning to Achieve More Effective Classifier Training for Multilevel Image Annotation,” Jianping Fan, Yuli Gao, Hangzai Luo. Feb. 2008
“Integrating Multi-Modal Content Analysis and Hyperbolic Visualization for Large-Scale News Video Retrieval and Exploration,” H. Luo, J. Fan, S. Satoh, J. Yang, W. Ribarsky. Aug. 2008
“Integrating Visual Analysis with Ontological Knowledge Structure,” Xiaoyu Wang, Wenwen Dou, Seok-won Lee, William Ribarsky, Remco Chang. 2008
“Evaluating the Relationship Between User Interaction and Financial Visual Analysis,” Dong Hyun Jeong, Wenwen Dou, Felesia Stukes, William Ribarsky. Oct. 2008

“GeoJabber: Finding Significant Analytic Events in Collaborative Visual Analysis Sessions,” Frank Hardisty; In Geospatial Visual Analytics Workshop at GIScience, Salt Lake City, Utah. Sept. 2008
“Investigative Visual Analysis of Global Terrorism,” Xiaoyu Wang, Erin Miller, Kathleen Smarick, William Ribarsky, Remco Chang. May 2008
“Legible Simplification of Textured Urban Models,” Remco Chang, Thomas Butkiewicz, Caroline Ziemkiewicz, Zachary Wartell, Nancy Pollard, William Ribarsky. April 2008
“Multi-Focused Geospatial Analysis Using Probes,” Thomas Butkiewicz, Wenwen Dou, Zachary Wartell, William Ribarsky, Remco Chang. Nov. 2008
“Scalable and Interactive Visual Analysis of Financial Wire Transactions for Fraud Detection,” Remco Chang, Alvin Lee, Mohammad Ghoniem, Robert Kosara, William Ribarsky, Jing Yang, Evan Suma, Caroline Ziemkiewicz, Daniel Kern, Agus Sudjianto. Feb. 2008
“The Role of Blackboard-based Reasoning and Visual Analytics in RESIN’s Predictive Analysis,” Dingxiang Liu, Jia Yue, Xiaoyu Wang, Anita Raja, William Ribarsky. Dec. 2008
“Visual Analysis and Semantic Exploration of Error Aware Urban Change Detection,” T Butkiewicz, R Chang, Z Wartell, W Ribarsky. 2008
“Visual Analysis for Live LIDAR Battlefield Change Detection,” Thomas Butkiewicz, Remco Chang, Zachary Wartell, William Ribarsky.April 2008
“Visually Exploring Worldwide Incidents Tracking System Data,” Shree D. Chhatwal, Stuart J. Rose; Visualization and Data Analysis, 28-29 January 2008. Proceedings of SPIE, Bellingham, WA, SPIE Publications.
“Visualization Criticism—The Missing Link Between Information Visualization and Art,” Robert Kosara; IEEE Computer Graphics and Applications, Vol. 28(3), pp. 13-15, 2008.
“A Sketch-Based Approach for Detecting Common Human Actions,” Evan Suma, Justin Babbs, Richard Souvenir. 2008
“Multivariate Visual Explanation for High Dimensional Datasets,” Scott Barlowe, Tianyi Zhang, Yujie Liu, Jing Yang, Donald Jacobs. Oct. 2008
“The Shaping of Information by Visual Metaphors,” Caroline Ziemkiewicz, Robert Kosara. Nov. 2008
Interactive Visual Analysis of Time-series Microarray Data,” Dong Hyun Jeong, Alireza Darvish, Kayvan Najarian, Jing Yang, William Ribarsky. Dec. 2008
University of Washington

“Optimization of Enterprises Modeled by Rules,” Huseyin Onur Mete, Zelda B. Zabinsky, Wolf Kohn; Proceedings of the 2008 Industrial Engineering Research Conference.
“Emergency Response Planning and Training Through Interactive Simulation and Visualization with Decision Support,” Bruce Donald Campbell, Huseyin Onur Mete, Tom Furness, Suzanne Weghorst, Zelda Zabinsky. May 2008
“Medical Interface Research at the HIT Lab,” Suzanne Weghorst, Eric Seibel, Peter Oppenheimer, Hunter Hoffman, Brian Schowengerdt, Thomas A. Furness III. 2008
2009
Drexel University
“Towards an Explanatory and Computational Theory of Scientific Discovery,” Chaomei Chen, Yue Chen, Mark Horowitz, Haiyan Hou, Zeyuan Liu, Donald Pellegrino; Journal of Informetrics. July 2009
Georgia Tech
Youn-ah Kang, Carsten Görg, John Stasko, "Evaluating Visual Analytics Systems for Investigative Analysis: Deriving Design Principles from a Case Study", Proceedings of IEEE VAST '09, Atlantic City, NJ, October 2009, pp. 139-146. 10/2009 MDRP 1: (Jigsaw) Visual Analytics for Investigative Analysis on Text Documents
“Introspective Self-Explanations for Report Generation in Intelligence Analysis,” Ashok Goel, Emile Morse, Anita Raja, Jean Scholtz and John Stasko; Proc. IJCAI-09 Workshop on Explanation-Aware Computing, July 11-12, Pasadena, California.
“Using AI for Sensemaking in Investigative Analysis,” Summer Adams, Ashok K. Goel, Neha Sugandh; Georgia Tech GVU Technical Report (# GIT-GVU-09-09-03), January 2009.
“ResultMaps: Visualization for Search Interfaces,” E. Clarkson, J. Foley, K. Desai; IEEE InfoVis 2009.
Pacific Northwest National Laboratories
“A Novel Visualization Technique for Electric Power Grid Analytics,” Pak Chung Wong, Kevin Schneider, Patrick Mackey, Harlan Foote, George Chin Jr., Ross Guttromson, Jim Thomas; IEEE Transactions on Visualization and Computer Graphics 15(3):410-423. March 2009

Penn State
Chen, J., MacEachren, A.M. and Peuquet, D. 2009: Constructing overview + detail dendrogram-matrix views. IEEE Transactions on Visualization and Computer Graphics 15, 889-896. {joint work with MDRP 12} 09/2009 MDRP 3: (GeoViz & CrimeViz) Situational Surveillance & In-field Criminal Investigative Analytics; Published
Maciejewski, Ross, Rudolph, Stephen, Hafen, Ryan, Abusalah, Ahmad, Yakout, Mohamed, Ouzzani, Mourad, Cleveland, William S., Grannis, Shaun J., Ebert, David S. A Visual Analytics Approach to Understanding Spatiotemporal Hotspots. IEEE Transactions on Visualization and Computer Graphics,
16(2): 205-220,08/2009 MDRP 3: (GeoViz & CrimeViz) Situational Surveillance & In-field Criminal Investigative Analytics; Published
Yu, C., A. M. MacEachren, B. Yarnal, and D. J. Peuquet. 2009. Integrating scientific modeling with a GeoAgent-based representation of human-environment interactions for supporting dynamic hazard management: a drought example in Pennsylvania, USA. Environmental Modelling & Software 27 (7):1501-1512. {joint work with NSF-funded Human-Environment Regional Observatory project} 07/2009
Robinson, A. (2009). Needs Assessment for the Design of Information Synthesis Visual Analytics Tools. IEEE International Conference on Information Visualization. Barcelona, Spain, 353-360. {joint work with MDRP 1} 07/2009 MDRP 13: GeoJunction: Collaborative Visual-Computational Information Foraging and Contextualization to Support Situation Awareness
Roth RE, and Ross KS 2009 Extending the Google Maps API for Event Animation Mashups: Tutorial. Cartographic Perspectives, Special Digital Issue 32-40 09/2009 MDRP 3: (GeoViz & CrimeViz) Situational Surveillance & In-field Criminal Investigative Analytics; Published
Yu, B. and G. Cai (2009). Facilitating Participatory Decision-Making in Local Communities through Map-Based Online Discussion. The Fourth International Conference on Communities and Technologies (C&T 2009). J. M. Carroll. University Park, PA, ACM. 06/2009 MDRP 13: GeoJunction: Collaborative Visual-Computational Information Foraging and Contextualization to Support Situation Awareness
Hardisty, F. (2009). "GeoJabber: Enabling Geo-Collaborative Visual Analysis." Cartography and Geographic Information Science 36(2): 267-280. {joint work with MDRP 3} 03/2013 MDRP 13: GeoJunction: Collaborative Visual-Computational Information Foraging and Contextualization to Support Situation Awareness; Published
Klippel, A., F. Hardisty and C. Weaver (2009). "Colour Enhanced Star Plot Glyphs – Can Salient Shape Characteristics be Overcome?" Cartographica 44(3): 217-231. 09/2009 MDRP 3: (GeoViz & CrimeViz) Situational Surveillance & In-field Criminal Investigative Analytics; Published

Robinson, A. (2009). Visual Highlighting Methods for Geovisualization. 24th International Cartographic Conference. Santiago, Chile (conference CD, no page #s) {paper introduces a visual display method relevant to Penn State tool development in MDRP 1, 3, 12, and 13} 11/2009 MDRP 12: Foreign Animal and Zoonotic Disease Visual Analytics
“Beyond our borders: contextualization humanitarian crisis situations,” B. Tomaszewski; Student Research in Visual Analytics For A Safer National panel, Third Annual DHS University Network Summit on Research and Education 2009, Washington D.C.
“Facilitating Participation Decision-Making in Local Communities through Map-Based Online Discussion,” B. Yu, G. Cai; Fourth International Conference on Communities And Technologies 2009.
“Integrating scientific modeling and supporting dynamic hazard management with a GeoAgent-based representation of human environment interactions: a drought example In Central Pennsylvania, USA,” C. Yu, A. M. MacEachren, B. Yarnal, Environmental Modeling & Software 2009.
Robinson, A. 2010: Supporting Synthesis in Geovisualization. International Journal of Geographical Information Science. 10/2009 MDRP 3: (GeoViz & CrimeViz) Situational Surveillance & In-field Criminal Investigative Analytics; Published
Cai, G. and B. Yu (2009). "Spatial Annotation Technology for Public Deliberation." Transactions in GIS 13: 123-146. 06/2009 MDRP 13: GeoJunction: Collaborative Visual-Computational Information Foraging and Contextualization to Support Situation Awareness; Published
“Wayfinding Choremes 2.0—Conceptual Primitives as a Basis for Translating Natural into Formal Language,” Alexander Klippel, Alan MacEachren, Prasenjit Mitra, Ian Turton, Anuj Jaiswal, Kean Soon, Xiao Zhang. 2009
Purdue - Delp
Ka Ki Ng and E. J. Delp, “New Models For Real-Time Tracking Using Particle Filtering,” Proceedings of the SPIE/IS&T Conference on Visual Communications and Image Processing(VCIP), San Jose, CA, January 2009. 01/2009 MDRP 6: Video Surveillance Visual Analytics; Published
Purdue - Ebert

“Motion Pointing: Target Selection using Elliptical Motions,” Jean-Daniel Fekete, NiklasElmqvist, Yves Guiard; Proceeding of the ACM CHI 2009 Conference on Human Factors in Computing Systems 2009, pp. 289-298.
“Melange: Space Folding for Visual Exploration,” Niklas Elmqvist, Jean-Daniel Fekete, Yann Riche, Nathalie Henry; IEEE Transactions on Visualization and Computer Graphics 2009.
“Hierarchical Aggregation for Information Visualization: Overview, Techniques and Design Guidelines,” Niklas Elmqvist, Jean-Daniel Fekete; IEEE Transactions on Visualization and Computer Graphics 2009.
“Towards Utilizing GPUs in Information Visualization: A Model and Implementation of Image-Space Operations,” Bryan McDonnel, Niklas Elmqvist; IEEE Transactions on Visualization and Computer Graphics (Proc. InfoVis 2009).
“Contextual Interaction for Geospatial Visual Analytics on Mobile Devices,” Avin Pattath, David S. Ebert, William Pike, Richard A. May; Multimedia on Mobile Devices 2009, part of the 20th Annual IS&T/SPIE Symposium on Electronic Imaging, 2009.
“Vision of Cyberinfrastructure for End-to-End Environmental Explorations (C4E4),” R. S. Govindaraju, B. Engel, D. Ebert, B. Fossum, M. Huber, C. Jafvert, S. Kumar, V. Merwade, D. Niyogi, L. Oliver, S. Prabhakar, G. Rochon, C. Song, L. Zhao; J. Hydrologic Engrg., Vol. 14, No. 1, pp. 53-64, 2009.
“An Affordable Wearable Video System for Emergency Response Training,” Deen King-Smith, Aravind Mikkilineni, David Ebert, Timothy Collins, Edward J. Delp Jan. 2009
Simon Fraser University
“Epistemically Active Adaptive User Interfaces,” S. Nobarany, M. Haraty, B. Fisher, S. DiPaola; UIST 2009 Oct. 4-7, Victoria BC.
“AdWil: Adaptive Windows Layout Manager,” M. Haraty, S. Nobarany, S. DiPaola, B. Fisher; CHI 2009 Works –in-progress.
“Symposium on Visual Analytics,” B. Fisher, J. Kielman, W.B. Paley, M. Rester; Cognitive Science Society meeting, Amsterdam 2009.
“Science and Smart Graphics,” B. Fisher; Information Technology. 2009
“Capturing and Supporting the Analysis Process,” Nazanin Kadivar, Victor Chen,Dunsmuir, Eric Lee, Cheryl Qian, John Dill, Christopher Shaw, Robert Woodbury.Oct. 2009

Stanford University
“A Probabilistic Model of the Categorical Association Between Colors,” Jason Chuang, Maureen Stone, Pat Hanrahan; Proceedings of the 16th Color Imaging Conference Portland, OR, November 10 to 15, 2009, pp. 6-11.
“Thinking with Sketches,” Barbara Tversky, Masaki Suwa; In A. Markman (Editor), Tools for innovation. Oxford: Oxford University Press. Nov. 2009
“Statistically identifying basic color terms,” Jason Chuang, Pat Hanrahan; The 31st Annual Meeting of the Cognitive Science Society. 2009
University of North Carolina at Charlotte
Fan, J. D. Keim, Y. Gao, H. Luo, Z. Li, “JustClick: Personalized Image Recommendation via Exploratory Search from Large-Scale Flickr Images”, IEEE Trans. on Circuits and Systems for Video Technology, vol. 19, no.2, pp.273-288 2009 02/2009 MDRP 14: Multimedia Visual Analytics for Investigative Analysis
Y. Shen, J. Fan, “Leveraging loosely-tagged images and inter-object correlations for tag recommendation”, ACM Multimedia, 2010. 10/2009 MDRP 14: Multimedia Visual Analytics for Investigative Analysis; Published
W. Gong, H. Luo, J. Fan, “Extracting Informative Images from Web News Pages via Imbalanced Classification", ACM Multimedia (MM'09) Grand Challenge Competition, Beijing, 2009. 10/2009 MDRP 14: Multimedia Visual Analytics for Investigative Analysis
Li, H. Luo, J. Fan, “Incorporating Camera Metadata for Attended Region Detection and Consumer Photo Classification", ACM Multimedia (MM'09), Beijing, 2009. 10/2009 MDRP 14: Multimedia Visual Analytics for Investigative Analysis
“iPCA: An Interactive System for PCA-based Visual Analytics,” D. H. Jeong, C. Ziemkiewicz, Z. Zhang, B. Fisher, W. Ribarsky, R. Chang; IEEE-VGTC Symposium on Visualization 2009, Berlin, Germany.
Y. Gao, J. Peng, H. Luo, D. Keim, J. Fan, “An Interactive Approach for Filtering out Junk Images from Keyword-Based Google Search Results", IEEE Trans. on Circuits and Systems for Video Technology, vol. 19, no.10, 2009. 09/2009 MDRP 14: Multimedia Visual Analytics for Investigative Analysis; Published
J. Fan, H. Luo, Y. Shen, C. Yang, “Integrating Visual and Semantic Contexts for Topic Network Generation and Word Sense Disambiguation", ACM Conf. on Image and Video Retrieval (CIVR'09), 2009. 07/2009 MDRP 14: Multimedia Visual Analytics for Investigative Analysis

“Human-Computer Interaction for Large-Scale Image Retrieval,” Y. Gao, C. Yang, Y. Shen, J. Fan; IEEE Conference on Multimedia Expo 2009.
“Defining and Applying Knowledge Conversion Processes to a Visual Analytics System,” Xiaoyu Wang, Dong Jeong, Wenwen Dou, Seok-won Lee, William Ribarsky, and Remco Chang; Computers and Graphics (Special Issue on Knowledge-Assisted Visualization) 2009.
“Hierarchical Multi-touch Selection Techniques for Collaborative Geospatial Analysis,” Thomas Butkiewicz, Dong Hyun Jeong, Zachary Wartell, William Ribarsky, and Remco Chang; SPIE (Defense & Security Conference 200) Vol. 2346, 2009.
“Data, Information, and Knowledge in Visualization,” Min Chen, David Ebert, Hans Hagen, Robert S. Laramee, Robert van Liere, Kwan-Liu Ma, William Ribarsky, Gerik Scheuermann, Deborah Silver; IEEE Computer Graphics and Applications, Visualization Viewpoints, Jan-Feb, 2009, pp. 4-11, 2009.
Chen, Yang, Jing Yang, and William Ribarsky. Toward Effective Insight Management in Visual Analytics Systems. Proc. IEEE Pacific Graphics 2009, pp. 49-56. 04/2009 MDRP 11: Financial Fraud Visual Analytics; Published
“Color Enhanced Star Plot Glyphs—Can Salient Shape Characteristics be Overcome?,” Alexander Klippela, Frank Hardistya, Rui Li, Chris Weaver. Sept. 2009
“A Blackboard-based Approach Towards Predictive Analytics,” Jia Yue, Anita Raja, Dingxiang Liu, Xiaoyu Wang, William Ribarsky. Jan. 2009
“Building and Applying a Human Cognition Model for Visual Analytics,” Tera Marie Green, William Ribarsky, Brian Fisher. Jan. 2009
“The Science of Analytical Reasoning,” William Ribarsky, Brian Fisher, and William Pottenger; Information Visualization Journal. Dec. 2009
“Understanding Principal Component Analysis Using a Visual Analytics Tool,” Dong Hyun Jeong, Caroline Ziemkiewicz, William Ribarsky and Remco Chang. 2009
“Defining Insight for Visual Analytics,” Remco Chang, Caroline Ziemkiewicz, Tera Marie Green, William Ribarsky. March 2009
“Recovering Reasoning Process From User Interactions,” Wenwen Dou, Dong Huyn Jeong, Felesia Stukes, William Ribarsky, Heather Richter Lipford, Remco Chang; IEEE Computer Graphics & Applications. May 2009
“Personalized News Video Recommendation,” H. Luo, J. Fan, D. Keim, and S. Satoh; Proceedings of the 15th Internation Multimedia Modeling Conference (January, 2009).
“Incorporate Visual Analytics to Design a Human-Centered Computing Framework for Personalized Classifier Training and Image Retrieval,” Y. Gao, C. Yang, Yi Shen, and J. Fan; LNCS (Springer, 2009)

“Preconceptions and Individual Differences in Understanding Visual Metaphors,” Caroline Ziemkiewicz and Robert Kosara; Proc. EG/IEEE EuroVis 2009, pp. 911-918.
2010
Georgia Tech
Carsten Görg, Jaeyeon Kihm, Jaegul Choo, Zhicheng Liu, Sivasailam Muthiah, Haesun Park, John Stasko. “in Document-Focused Visual Analytics Systems.” Submitted to IEEE VAST 2010. 08/2010 MDRP 1: Geovisual Analytics; Published
Carsten Görg, Jaeyeon Kihm, Jaegul Choo, Zhicheng Liu, Sivasailam Muthiah, Haesun Park, and John Stasko, "Combining Computational Analyses and Interactive Visualization to Enhance Information Retrieval”, 2010 Workshop on Human-Computer Interaction and Information Retrieval, New Brunswick, NJ 08/2010 MDRP 1: (Jigsaw) Visual Analytics for Investigative Analysis on Text Documents; Published
Zhicheng Liu, Carsten Görg, Jaeyeon Kihm, Hanseung Lee, Jaegul Choo, Haesun Park, John Stasko, “Data Ingestion and Evidence Marshalling in Jigsaw VAST 2010 Mini Challenge 1 Award: Good Support for Data Ingest", Proceedings of IEEE VAST '10, Salt Lake City, UT, October 2010, pp. 271-272. 10/2010 MDRP 1: (Jigsaw) Visual Analytics for Investigative Analysis on Text Documents; Published
Hanseung Lee, Jaegul Choo, Carsten Görg, Jaeeun Shim, Jaeyeon Kihm, Zhicheng Liu, Haesun Park, John Stasko, "GeneTracer: Gene Sequence Analysis of Disease Mutations VAST 2010 Mini Challenge 3 Award: Excellent Process Explanation", Proceedings of IEEE VAST '10, Salt Lake City, UT, October 2010, pp. 291-292. 10/2010 MDRP 1: (Jigsaw) Visual Analytics for Investigative Analysis on Text Documents; Published
Zhicheng Liu and John T. Stasko, "Mental Models, Visual Reasoning and Interaction in Information Visualization: A Top-down Perspective", IEEE Transactions on Visualization and Computer Graphics, (Paper presented at InfoVis '10), Vol. 16, No. 6, November/December 2010, pp. 999-1008. 11/2010 MDRP 1: (Jigsaw) Visual Analytics for Investigative Analysis on Text Documents; Published
C. Görg, H. Tipney, K. Verspoor, W.A. Baumgartner Jr, K.B. Cohen, J. Stasko, L.E. Hunter, “Visualization and Language Processing for Supporting Analysis Across the Biomedical Literature”, Proceedings of International Conference on Knowledge-Based and Intelligent Information and Engineering Systems (KES), September 2010, pp 420-429. 09/2010 MDRP 1: (Jigsaw) Visual Analytics for Investigative Analysis on Text Documents; Published

Penn State
MacEachren, A.M. and Pezanowski, S. (2009). “Geovisualization: Leveraging the Opportunities of Geographic Information.” Adobe Developer Connection Education Developer Center: Articles from educators: Adobe: http://www.adobe.com/devnet/edu/articles/macEachren_pezanowski.html {this online overview highlighted Penn State work from MDRP 3, 12, and 13} 08/2010 MDRP 13: GeoJunction: Collaborative Visual-Computational Information Foraging and Contextualization to Support Situation Awareness
Hardisty, F. and Klippel, A. 2010: Analyzing spatio-temporal autocorrelation with LISTA-Viz. International Journal of Geographical Information Science 24, 1515 - 1526. 10/2010 MDRP 3: (GeoViz & CrimeViz) Situational Surveillance & In-field Criminal Investigative Analytics; Published
MacEachren, A.M., Stryker, M.S., Turton, I.J. and Pezanowski, S. 2010: HEALTH GeoJunction: Visual-computationally Enabled Browsing of Health Publications and Their Contents. International Journal of Health Geographics 9. 05/2010 MDRP 3: (GeoViz & CrimeViz) Situational Surveillance & In-field Criminal Investigative Analytics; Published
Griffin, A.L. and Robinson, A.C. 2010: Comparing Color and Leader Line Approaches for Highlighting in Geovisualization. In Purves, R. and Weibel, R., editors, Extended Abstracts Volume, GIScience 2010, Zurich, Switzerland: GIScience, 14-17th September, 2010. 09/2010 MDRP 3: (GeoViz & CrimeViz) Situational Surveillance & In-field Criminal Investigative Analytics; Published
Roth, R.E., Ross, K.S., Finch, B.G., Luo, W. and MacEachren, A.M. 2010: A user-centered approach for designing and developing spatiotemporal crime analysis tools In Purves, R. and Weibel, R., editors, Extended Abstracts Volume, GIScience 2010, Zurich, Switzerland: GIScience, 14-17th September, 2010. 09/2010 MDRP 3: (GeoViz & CrimeViz) Situational Surveillance & In-field Criminal Investigative Analytics; Published
Tomaszewski, B. and MacEachren, A.M. 2010: Geo-Historical Context Support for Information Foraging and Sensemaking: Conceptual Model, Implementation, and Assessment. IEEE Conference on Visual Analytics Science and Technology (IEEE VAST 2010), Salt Lake City, Utah, USA, 139-146, October 24 - 29, 2010. 10/2010 MDRP 3: (GeoViz & CrimeViz) Situational Surveillance & In-field Criminal Investigative Analytics; Published
White J.D.D. and R.E. Roth. 2010. TwitterHitter: Geovisual analytics for harvesting insight from volunteered geographic information. In: Proceedings of GIScience 2010. Zurich, Switzerland, 14-17th September, 2010. 09/2010 MDRP 3: (GeoViz & CrimeViz) Situational Surveillance & In-field Criminal Investigative Analytics; Published

Auer, T., MacEachren, A.M., McCabe, C. and Pezanowski, S. submitted: HerbariaViz: A web-based client-server interface for mapping and exploring flora observation data. Ecological Informatics. {joint work with MDRP 3} 09/2010 MDRP 12: Foreign Animal and Zoonotic Disease Visual Analytics
Hardisty, F. and A. Robinson (Accepted). "The GeoViz Toolkit: Using component- oriented coordination methods to aid geovisualization application construction." International Journal of Geographic Information Science. {joint work with MDRP 12} 10/2010 MDRP 3: (GeoViz & CrimeViz) Situational Surveillance & In-field Criminal Investigative Analytics; Published
Purdue – Delp
K. K. Ng and E. J. Delp, “Object Tracking Initialization Using Automatic Moving Object Detection,” Proceedings of the SPIE/IS&T Conference on Visual Communications and Image Processing (VCIP), January 2010, San Jose, CA. 01/2010 MDRP 6: Video Surveillance Visual Analytics; Published
Satyam Srivastava and Edward J. Delp, “Standoff Video Analysis for the Detection of Security Anomalies in Vehicles,” Proceedings of the IEEE Applied Imagery Pattern Recognition Workshop, Washington, D.C., October 2010 10/2011 MDRP 6: Video Surveillance Visual Analytics; Published
Purdue - Ebert
Bezerianos, A., Chevalier, F., Dragicevic, P., Elmqvist, N., Fekete, J.-D. GraphDice: A System for Exploring Multivariate Social Networks. Computer Graphics Forum (IEEE EuroVis 2010 proceedings), 2010. http://engineering.purdue.edu/~elm/projects/graphdice/graphdice.pdf, 07/2010 Project: MDRP 17: START Center Visual Analytics; Published
Yi, J. S., Elmqvist, N., Lee, S. TimeMatrix: Visualizing Temporal Social Networks Using Interactive Matrix-Based Visualizations. International Journal of Human-Computer Interaction, 2010. https://engineering.purdue.edu/~elm/projects/timematrix/timematrix.pdf 11/2010 MDRP 17: START Center Visual Analytics; Published
Brigantic, R.T., Ebert, D.S., Corley, C.D., Maciejewski, R., Muller, G.A., and Taylor, A.E. Development of a Quick Look Pandemic Influenza Modeling and Visualization Tool. ISCRAM2010: 7th International Conference on Information Systems for Crisis Response and Management, 2010. 05/2010 MDRP 12: Foreign Animal and Zoonotic Disease Visual Analytics

Malik, A., Maciejewski, R., Collins, T., Ebert, D., Visual Analytics Law Enforcement Toolkit, IEEE Conference on Technologies for Homeland Security, 2010 11/2010 MDRP 16: (VALET) Context-aware Mobile Visual Analytics for Emergency Response
Jaiswal, A., D. J. Miller, et al. (2010). "Un-Interpreted Schema Matching with Embedded Value Mapping under Opaque Column Names and Data Values." IEEE Transactions on Knowledge and Data Engineering 22(2): 291-304. {cross MDRP – 1 & 13} 02/2010 MDRP 1: Geovisual Analytics; Published
"ALIDA: Using Maching Learning for Intent Discernment in Visual Analytics Interfaces" Tera Marie Green, Ross Maciejewski, Steve DiPaola Oct. 2010
"Evaluating the Effectiveness of Illustrative Visualization of Schematic Diagrams for Maintenance Tasks" Sungye Kim, Insoo Woo, Ross Maciejewski, David S. Ebert, Timothy D. Ropp, Krystal Thomas 2010
"Spatial Scan Statistics on the GPGPU" Stephen G. Larew, Ross Maciejewski, Insoo Woo, David S. Ebert 2010
"VACCINATED - Visual Analytics for Characterizing a Pandemic Spread" Abish Malik, Shehzad Afzal, Erin Hodgess, David S. Ebert, Ross Maciejewski Oct. 2010
Javed, W., Elmqvist, N. Stack Zooming for Multi-Focus Interaction in Time-Series Data Visualization. In Proceedings of the IEEE Pacific Visualization Symposium 2010, pp. 33-40, 2010. 05/2010 MDRP 11: Financial Fraud Visual Analytics; Published
Ross Maciejewski, Stephen Rudolph, Travis Drake, Abish Malik, David S. Ebert. Data Aggregation and Analysis for Cancer Care Statistics - A Visual Analytics Approach. Hawai'i International Conference on System Sciences, 2010. 01/2010 MDRP 3: (GeoViz & CrimeViz) Situational Surveillance & In-fieldCriminal Investigative Analytics
Simon Fraser University
X. Xue, H. Luo, J. Fan, “Structured Max-Nargin Learning for Multi-Label Image Annotation", ACM Conf. on Image and Video Retrieval (CIVR'10), 2010. 07/2010 MDRP 6: Video Surveillance Visual Analytics
“Using Personality Factors to Predict Interface Learning Performance,” T.M. Green, D. H. Jeong, B. Fisher; Proceedings of the 43rd Annual Hawaii International Conference on System Sciences 2010.
"ExplorationMap: Supporting Collaborative Exploratory Information Seeking" Mona Haraty, Syavash Nobarany, Brian Fisher 2010
University of Houston - Downtown

A. Tran, C. Bowes, D. Brown, P. Chen, M. Choly, W. Ding, ‘TreeMatch: A Fully Unsupervised WSD System Using Dependency Knowledge on a Specific Domain’, SemEval 2010 Workshop with the 48th Annual Meeting of the Association for Computational Linguistics (ACL), July, 2010. Uppsala, Sweden. 07/2010 EP 2: MSI Collaboration
P. Chen, R. Alo’, J. Rundell, “From Language to Vision: A Case Study of Text Animation”, The 9th International Conference on Artificial Intelligence, Knowledge Engineering and Databases, Cambridge, UK, Feb., 2010 02/2010 EP 1: Leadership and Coordination; Published
P. Chen, I. Chen, R. Verma, A. Tran*, “An Undergraduate Data Mining Course Integrated with Research and Industry Projects”, SIGCSE 2010, Poster session, March, 2010. 03/2010 EP 2: MSI Collaboration
Aló, Richard A., Diane Baxter, Karl Barnes, Al Kuslikis, Geoffrey Fox, Alex Ramirez;, Visualization and Homeland Security Research/ Education at Minority Serving Institutions National Model Promoted/ Implemented by MSI-CIEC (Minority Serving Institutions-CyberInfrastructure Empowerment Coalition); International Conference on Computational Science, ICCS, 2010. Amsterdam, June, 2010. 06/2010 EP 2: MSI Collaboration
Aló, Richard A., Diane Baxter, Karl Barnes, Al Kuslikis, Geoffrey Fox, Alex Ramirez; A Model for LACCEI: Minority Serving Institutions and CyberInfrastructure Research/ Education Minority Serving Institutions-CyberInfrastructure Empowerment Coalition- MSI-CIEC; Latin American and Caribbean Consortium for Engineering Institutions, International Conference, LACCEI 2010, Arequipa, Peru, June, 2010. 06/2010EP 2: MSI Collaboration
P. Chen, W. Garcia, “Hypothesis Generation and Data Quality Assessment through Association Mining”, The 9th IEEE International Conference on Cognitive Informatics, July 7‐9, 2010, Beijing, China. (Acceptance rate: 29%). 07/2010 EP 1: Leadership and Coordination; Published
P. Chen, A. Barrera, C. Rhodes, “Semantic Analysis of Free Text and its Application on Automatically Assigning ICD‐9‐CM Codes to Patient Records”, The 9th IEEE International Conference on Cognitive Informatics, July 7‐9, 2010, Beijing, China. (Acceptance rate: 29%). 07/2010 EP 1: Leadership and Coordination; Published
P. Chen, N. Ozoka, R. Ortiz, A. Tran, D. Brown, “Word Sense Distribution in a Web Corpus,” The 9th IEEE International Conference on Cognitive Informatics, July 7‐9, 2010, Beijing, China. (Poster, acceptance rate: 32%). 07/2010 EP 1: Leadership and Coordination; Published
University of North Carolina at Charlotte

J. Fan, Y. Shen, N. Zhou, Y. Gao, “Harvesting Large-Scale Weakly-Tagged Image Databases from the Web", IEEE Conf. on Computer Vision and Pattern Recognition (CVPR'10), 2010. 06/2010 MDRP 14: Multimedia Visual Analytics for Investigative Analysis
J. Alsakran, Y. Zhao, D. Luo, and J. Yang: Visual Analysis of Stream Texts with Keyword Significance. Poster of InfoVis 2010. 10/2010 MDRP 14: Multimedia Visual Analytics for Investigative Analysis; Published
Liu, Jianfei, Kyle Lyons, Kalpathi Subramanian, William Ribarsky. Semi-Automated Processing and Routing Within Indoor Structures For Emergency Response Applications", Proceedings of SPIE Defense, Security+Sensing, 2010. 04/2010 MDRP 16: (VALET) Context-aware Mobile Visual Analytics for Emergency Response
Z. Li, J. Fan, “Stochastic contour approach for automatic image segmentation”, Journal of Electronic Imaging, vol.18, no.4, 2009. 4. Luo, Qingshan, Xiaodong Kong, Guihua Zeng, Jianping Fan: Human action detection via boosted local motion histograms. Mach. Vis. Appl. 21(3): 377-389 (2010).
Y. Shen, J. Fan, “Multi-task multi-label multiple instance learning", Journal of Zhejiang University SCIENCE C (Computers & Electronics), ISSN 1869-1951, ISSN 1869-196X, 2010 (invitation paper).
Chang, Remco, Caroline Ziemkiewicz, Roman Pyzh, Joseph Kielman, and William Ribarsky. Learning-based Evaluation of Visual Analytics Systems. ACM BELIV 2010. 05/2010 MDRP 11: Financial Fraud Visual Analytics; Published
Dou, Wenwen, William Ribarsky, and Remco Chang. Capturing Reasoning Processes through User Interaction. IEEE EuroVAST 2010. 05/2010 MDRP 11: Financial Fraud Visual Analytics; Published
J. Yang, D. Luo, Y. Liu: Newdle: Interactive Visual Exploration of Large Online News Collections, IEEE Computer Graphics & Application 30(5): 32-41 (2010). 09/2010 MDRP 14: Multimedia Visual Analytics for Investigative Analysis; Published
H. Luo, J. Fan, Y. Zhou, “Multimedia news exploration and retrieval by integrating keywords, relations and visual features", Multimedia Tools and Applications, vol.51, pp. 625-648, 2011. 10/2010 MDRP 14: Multimedia Visual Analytics for Investigative Analysis; Published
Y. Zhang, C. Yang, Y. Shen, N. Zhou, J. Fan, H. Luo, “A cross model approach to cleansing weakly tagged images”, IEEE Multimedia, vol.17, no.4, pp.18-25, 2010. 07/2010 MDRP 14: Multimedia Visual Analytics for Investigative Analysis; Published
J. Peng, N. Babaguchi, H. Luo, Y. Gao, J. Fan, “Constructing distributed hippocratic video databases for privacy-preserving online patient training and counseling”, IEEE Trans. On Information Technology in Biomedicine, vol.14, no.8, 2010. 07/2010 MDRP 14: Multimedia Visual Analytics for Investigative Analysis; Published

Z. Li, J. Fan, “Exploit camera metadata for enhancing interesting region detection and photo retrieval”, Multimedia Tools and Applications, vol. 46, no.2-3, pp.207-233, 2010. 08/2009 MDRP 14: Multimedia Visual Analytics for Investigative Analysis; Published
Q. Luo, X. Kong, G. Zeng, J. Fan, “Human action detection via boosted local motion histograms”, Machine Vision Applications, vol.21, no.3, pp.377-389, 2010. 09/2008 MDRP 14: Multimedia Visual Analytics for Investigative Analysis; Published
J. Fan, Y. Shen, N. Zhu, Y. Gao, “Leveraging large-scale weakly-tagged images from Internet”, IEEE CVPR (IEEE Conf. on Computer Vision and Pattern Recognition), 2010. 10/2009 MDRP 14: Multimedia Visual Analytics for Investigative Analysis; Published
X. Xue, H. Luo, J. Fan, “Structured learning for automatic image annotation", ACM CIVR’10 (ACM Conf. on Image and Video Retrieval), 2010. 07/2010 MDRP 14: Multimedia Visual Analytics for Investigative Analysis; Published
N. Zhou, Y. Shen, J. Fan, “Automatic image annotation by using relevant keywords extracted from auxiliary text documents", ACM Multimedia Workshop on Large-Scale Image Retrieval, 2010. 10/2010 MDRP 14: Multimedia Visual Analytics for Investigative Analysis; Published
Zhang, Y., L. Cen, X. Xue, N. Zhou, “Bilingual query translation for multimedia retrieval", ACM Multimedia, 2010. 10/2010 MDRP 14: Multimedia Visual Analytics for Investigative Analysis
Y. Chen, J. Yang, and S. Barlowe. Click2Annotate: Automated Insight Externalization with Rich Semantics. Submitted to IEEE VAST 2010. 10/2010 MDRP 14: Multimedia Visual Analytics for Investigative Analysis
Shen, Y., J. Fan, “Leverage loosely-labeled images and inter-object correlation for classifier training and multi-label image annotation", ACM Multimedia, 2010. 10/2010 MDRP 14: Multimedia Visual Analytics for Investigative Analysis
Zhou, N., J. Fan, “Integrating bilingual query results for junk image filtering", ACM Multimedia, 2010. 04/2012 MDRP 14: Multimedia Visual Analytics for Investigative Analysis
Y. Chen, J. Yang, S. Barlowe, and D. Jeong: Touch2Annotate - Generating better annotations with less human effort on multi-touch interfaces. ACM CHI 2010 Extended Abstracts: 3703-3708. 04/2010 MDRP 14: Multimedia Visual Analytics for Investigative Analysis
Luo, Qingshan, Xiaodong Kong, Guihua Zeng, Jianping Fan: Human action detection via boosted local motion histogram Mach. Vis. Appl. 21(3): 377-389 (2010). 09/2008 MDRP 6: Video Surveillance Visual Analytics; Published
Y. Nakashima, N. Babaguchi, J. Fan, “Automatically protecting privacy in consumer generated videos using intended human object detector”, ACM Multimedia, 2010. 10/2010 MDRP 14: Multimedia Visual Analytics for Investigative Analysis; Published

D. Luo, J. Yang, M. Krstajic, J. Fan, W. Ribarsky, and D. Keim. EventRiver: Interactive visual exploration of constantly evolving text collections. To be published. IEEE Trans. On Visualization and Computer Graphics (2010). 10/2010 MDRP 14: Multimedia Visual Analytics for Investigative Analysis; Published
University of Washington
Benson, A.L., Biggers, K., Wall, J., and Haselkorn, M.P. (2010) “Adaptive Development of a Common Operating Environment for Crisis Response Management.” In Proceedings of the 2010 International Conference on Information Systems for Crisis Response and Management (ISCRAM2010) [Fully-refereed, blind, 45% acceptance]. 05/2010 Project: MDRP 7: Introducing Sustainable Visual Analytics into Command Center Environments; Published
2011
Florida International University
Yimin Yang, Hsin-Yu Ha, Fausto Fleites, Shu-Ching Chen, and Steven Luis, “Hierarchical Disaster Image Classification for Situation Report Enhancement,” The 12th IEEE International Conference on Information Reuse and Integration (IRI 2011), Las Vegas, Nevada, USA, pp. 181-186, August 3-5, 2011.
Mei-Ling Shyu, Chao Chen and Shu-Ching Chen, "Multi-Class Classification via Subspace Modeling," International Journal of Semantic Computing, Volume 5, Issue 1, pp. 55-78, March 2011.
Steven Luis, Fausto C. Fleites, Yimin Yang, Hsin-Yu Ha, and Shu-Ching Chen, "A Visual Analytics Multimedia Mobile System for Emergency Response," IEEE International Symposium on Multimedia (ISM2011), Dana Point, California USA, pp. 337-338, December 5-7, 2011. (Demo paper)
Qiusha Zhu, Lin Lin, Mei-Ling Shyu, and Shu-Ching Chen, "Effective Supervised Discretization for Classification based on Correlation Maximization," The 12th IEEE International Conference on Information Reuse and Integration (IRI 2011), Las Vegas, Nevada, USA, pp. 390-395, August 3-5, 2011.
Lei Li, Wenting Lu, Jingxuan Li, Tao Li, Honggang Zhang and Jun Guo, “Exploring Interaction Between Images and Texts for Web Image Categorization,” In Proceedings of The 24th Florida Artificial Intelligence Research Society Conference (FLAIRS-24), Palm Beach, Florida, pp. 45-50, May 18-20, 2011.
Georgia Tech
Zhicheng Liu, Shamkant B. Navathe, John Stasko, "Network-based Visual Analysis of Tabular Data," Proceedings of IEEE VAST '11, Providence, RI, October 2011, pp. 41-50

10/2011 MDRP 1: (Jigsaw) Visual Analytics for Investigative Analysis on Text Documents; Published
Youn-ah Kang and John Stasko, "Characterizing the Intelligence Analysis Process: Informing Visual Analytics Design through a Longitudinal Field Study," Proceedings of IEEE VAST '11, Providence, RI, October 2011, pp. 21-30. 10/2011 MDRP 1: (Jigsaw) Visual Analytics for Investigative Analysis on Text Documents; Published
Elizabeth Braunstein, Carsten Görg, Zhicheng Liu, and John Stasko, "Jigsaw to Save Vastopolis - VAST 2011 Mini Challenge 3 Award: 'Good Use of the Analytic Process'", Proceedings of IEEE VAST '11, Providence, RI, Oct. 2011, pp. 323-324. 10/2011 MDRP 1: (Jigsaw) Visual Analytics for Investigative Analysis on Text Documents; Published
Pak Chung Wong, Chaomei Chen, Carsten Görg, Ben Shneiderman, John Stasko, Jim Thomas, "Graph Analytics - Lessons Learned and Challenges Ahead," IEEE Computer Graphics and Applications, Vol. 31, No. 5, Sept./Oct. 2011, pp. 18-29. 09/2011 MDRP 1: (Jigsaw) Visual Analytics for Investigative Analysis on Text Documents; Published
Youn-ah Kang, Carsten Görg, John Stasko, "How Can Visual Analytics Assist Investigative Analysis? Design Implications from an Evaluation," IEEE Transactions on Visualization and Computer Graphics, Vol. 17, No. 5, May 2011, pp. 570-583. 05/2011 MDRP 1: (Jigsaw) Visual Analytics for Investigative Analysis on Text Documents; Published
Oxford University
Simon Walton, Min Chen and David Ebert, LiveLayer - Live Traffic Projection onto Maps, Eurographics 2011 Posters, Llandudno, Wales, April 2011. 04/2011 Seed 3: Uncertainty in Video Visual Analytics; Published
Penn State
Robinson, A.C., Roth, R.E., Blanford, J., Pezanowski, S., and A.M. MacEachren. (2011) A Collaborative Process for Developing Map Symbol Standards. Spatial Thinking and Geographic Information Sciences. Tokyo, Japan, September 14-16, 2011. 09/2011 Symbology Standardization Support; Published
Robinson, A.C., Roth, R.E., and A.M. MacEachren Understanding User Needs for Map Symbol Standards in Emergency Management. Journal of Homeland Security and Emergency Management 4. 8(1): Article 33.07/2011 Symbology Standardization Support; Published
Caragea C, McNeese M, Jaiswal A, Traylor G, Kim H, Mitra P, Wu D, Tapia A, Giles CL, Jansen J, et al. Classifying Text Messages for the Haiti Earthquake. Proceedings, 8th International Conference on Information Systems for Crisis Response and Management (ISCRAM). Lisbon, Portugal; 2011 05/2011 MDRP 13: GeoJunction: Collaborative

Visual-Computational Information Foraging and Contextualization to Support Situation Awareness
K. Bajpai, A. Jaiswal, “A Framework for Analyzing Collective Action Events on Twitter”, 8th International Conference on Information Systems for Crisis Response and Management (ISCRAM), 2011 05/2011 MDRP 3: (GeoViz & CrimeViz) Situational Surveillance & In-field Criminal Investigative Analytics; Published
MacEachren, A.M., Robinson, A.C., Jaiswal, A., Pezanowski, S., Savelyev, A., Blanford, J. and Mitra, P. in press: Geo-Twitter Analytics: Applications in Crisis Management. 25th International Cartographic Conference, Paris, France, July 3-8, 2011. 07/2011 MDRP 3: (GeoViz & CrimeViz) Situational Surveillance & In-field Criminal Investigative Analytics; Published
MacEachren AM, Jaiswal A, Robinson AC, Pezanowski S, Savelyev A, Mitra P, Zhang X, Blanford J. SensePlace2: GeoTwitter Analytics Support for Situational Awareness. IEEE Conference on Visual Analytics Science and Technology. 2011, 181-190. 10/2011 MDRP 13: GeoJunction: Collaborative Visual-Computational Information Foraging and Contextualization to Support Situation Awareness; Published
Tomaszewski, B., Blanford, J., Ross, K., Pezanowski, S. and MacEachren, A.M. 2011: Supporting geographically-aware web document foraging and sensemaking. Computers Environment and Urban Systems 35, 192-207. 05/2011 MDRP 13: GeoJunction: Collaborative Visual-Computational Information Foraging and Contextualization to Support Situation Awareness; Published
Tomaszewski, B. 2011: Situation awareness and virtual globes: Applications for disaster management. Computers & Geosciences 37, 86-92. 01/2011 MDRP 3: (GeoViz & CrimeViz) Situational Surveillance & In-field Criminal Investigative Analytics; Published
Tomaszewski, B., J. Blanford, K. Ross, S. Pezanowski and A. MacEachren. 2011. "Supporting Rapid Sensemaking in Diverse Web Document Foraging." Computers, Environment and Urban Systems 35: 192-207. 04/2012 MDRP 3: (GeoViz & CrimeViz) Situational Surveillance & In-field Criminal Investigative Analytics; Published
“Event Detection Using Spatial Latent Dirchlet Allocation,” C. Pan, P. Mitra; 21st International Joint Conference on Artificial Intelligence, Pasadena, California. June 2011
Andris, C. and Hardisty, F. (2011). Extended Abstract: Visualizing Migration Dynamics Using Weighted Radial Variation. GeoViz Hamburg. Hamburg, Germany, March 10-11, 2011. 03/2011 MDRP 3: (GeoViz & CrimeViz) Situational Surveillance & In-field Criminal Investigative Analytics; Published
Purdue – Delp

Ka Ki Ng and Edward J. Delp, “Background Subtraction Using A Pixel-Wise Adaptive Learning Rate For Object Tracking Initialization,” Proceedings of the IS&T/SPIE Conference on Visual Information Processing and Communication, San Francisco, California, January 2011 01/2011 MDRP 6: Video Surveillance Visual Analytics; Published
Satyam Srivastava, Ka Ki Ng, and Edward J. Delp, “Color Correction for Object Tracking Across Multiple Cameras,” Proceedings of the IEEE International Conference on Acoustics, Speech and Signal Processing, Prague, Czech Republic, May 2011 05/2011 MDRP 6: Video Surveillance Visual Analytics; Published
Satyam Srivastava, Ka Ki Ng, and Edward J. Delp, “Co-Ordinate Mapping and Analysis of Vehicle Trajectory for Anomaly Detection,” Proceedings of the IEEE International Conference on Multimedia and Expo, Barcelona,Spain, July 2011 07/2011 MDRP 6: Video Surveillance Visual Analytics; Published
Satyam Srivastava, Ka Ki Ng, and Edward J. Delp, “Crowd Flow Estimation Using Multiple Visual Features for Scenes with Changing Crowd Densities,” Proceedings of the IEEE International Conference on Advanced Video and Signal Based Surveillance, Klagenfurt, Austria, August-September 2011 08/2011 MDRP 6: Video Surveillance Visual Analytics; Published
"Fast and Robust Object Detection and Tracking for Lightweight Visual Surveillance Systems" Ka Ki Ng, Edward J. Delp June 2011
"Foreground Segmentation with Sudden Illumination Changes Using A Shading Model and A Guassianity Test" Ka Ki Nh, Satyam Srivastava, Edward J. Delp Sept. 2011
"Visual Surveillance of Vehicles for the Detection of Anomalies" Satyam Srivastava, Edward J. Delp April 2011
Purdue - Ebert
Ross Maciejewski, Phillip Livengood, Stephen Rudolph, Timothy F. Collins, David S. Ebert, Robert T. Brigantic, Courtney D. Corley, George A. Muller, and Stephen W. Sanders. A Pandemic Modeling and Visualization Tool. Journal of Visual Languages and Computing, 22(4):268-278, 2011. 01/2011 MDRP 12: Foreign Animal and Zoonotic Disease Visual Analytics
Ross Maciejewski, Ryan Hafen, Stephen Rudolph, Stephen G. Larew, Michael A. Mitchell, William S. Cleveland, David S. Ebert. Forecasting Hotspots - A Predictive Analytics Approach. IEEE Transactions on Visualization and Computer Graphics, 17(4): 440-453, May/June 2011. 05/2011 MDRP 12: Foreign Animal and Zoonotic Disease Visual Analytics
Afzal, S., Maciejewski, R., Ebert, D. S. Visual Analytics Decision Support Environment for Epidemic Modeling and Response Evaluation. In IEEE Conference on Visual

Analytics Science and Technology (IEEE VAST), pages 1-10, October 2011. 10/2011 MDRP 12: Foreign Animal and Zoonotic Disease Visual Analytics
Malik, A., Maciejewski, R., Maule, B., Ebert, D., “A Visual Analytics Process for Maritime Resource Allocation and Risk Assessment,” Proceedings of the IEEE Conference on Visual Analytics Science and Technology (VAST), 2011. 12/2010 (CgSARVA) Coast Guard Search and Rescue Visual Analytics; Published
Ross Maciejewski, Stephen Rudolph, Travis Drake, Abish Malik, David S. Ebert. Data Aggregation and Analysis for Cancer Care Statistics - A Visual Analytics Approach. Hawai'i International Conference on System Sciences, 2010. 01/2010 MDRP 3: (GeoViz & CrimeViz) Situational Surveillance & In-fieldCriminal Investigative Analytics
Livengood, P., Chen, W., Maciejewski, R., Ebert, D., "A Visual Analysis System for Metabolomics Data," IEEE Symposium on Biological Data Visualization (Biovis 2011),
K. Kim, S. Ko, N. Elmqvist, D. Ebert. WordBridge: Using Composite Tag Clouds in Node-Link Diagrams for Visualizing Content and Relations in Text Corpora. In Proceedings of the Hawaii International Conference on System Sciences (Visual Analytics Minitrack), 2011. http://engineering.purdue.edu/~elm/projects/wordbridge/wordbridge.pdf 01/2011 MDRP 18: Visual Analytics for the DHS Centers of Excellence; Published
S. Ghani, N. Elmqvist. Improving Revisitation in Graphs through Static Spatial Features. In Proceedings of Graphics Interface, 2011. 05/2011 MDRP 18: COE-Explorer (Visual Analytics for the DHS Centers of Excellence)
S. Ghani, N. Henry Riche, N. Elmqvist. Dynamic Insets for Context-Aware Graph Navigation. Computer Graphics Forum (IEEE EuroVis 2011 proceedings), 30(3):861–870 2011. [54/190, 28% acc. rate] https://engineering.purdue.edu/~elm/projects/dyninsets/dyninsets.pdf 05/2011 MDRP 18: Visual Analytics for the DHS Centers of Excellence; Published
Jang, Y., Gaither, K., Ebert, D., "Time-Varying Data Visualization Using Functional Representations," IEEE Transactions on Visualization and Computer Graphics, 10, March 2011
"A Pandemic Influenza Modeling and Visualization Tool" Ross Maciejewski, Philip Livengood, Stephen Rudolph, Timothy F. Collins, David S. Ebert, Robert T. Brigantic, Courtney D. Corley, George A. Muller, Stephen W. Sanders May 2011
"Describing Temporal Correlation Spaially in a Visual Analytics Environment" Abish Malik, Ross Maciejewski, Erin Hodgess, David S. Ebert Jan. 2011
Simon Fraser University

Fisher, B. (2011) Visual Analytics as a Cognitive Science. EuroVA, Bergen Norway. (Keynote address 05/2011 MDRP 6: Video Surveillance Visual Analytics; Published
Fisher,B., Green, T.M., Arias-Hernández, R. (2011) "Visual Analytics as a Translational Cognitive Science," Topics in Cognitive Science 3,3 609–625. 10/2010; MDRP 6: Video Surveillance Visual Analytics; Published
Kwon, B.C., Fisher, B. Yi, J.S. (2011) Visual Analytic Roadblocks for Novice Investigators. IEEE Conference on Visual Analytics Science and Technology. Providence RI, (Full paper, 8 pages) 10/2011 MDRP 6: Video Surveillance Visual Analytics; Published
Nobarany, S., Haraty, M., & Fisher, B. (2011) Facilitating the Reuse Process in Distributed Collaboration: A Distributed Cognition Approach. Proceedings of CSCW. 02/2012 MDRP 6: Video Surveillance Visual Analytics; Published
Arias-Hernandez, R, Kaastra, L.T., and Fisher, B. (2011) Joint Action Theory and Pair Analytics: In-vivo Studies of Cognition and Social Interaction in Collaborative Visual Analytics. In L. Carlson, C. Hoelscher, and T. Shipley (Eds.), Proceedings of the 33rd Annual Conference of the Cognitive Science Society (pp. 3244-3249). Austin TX: Cognitive Science Society. 07/2011 MDRP 6: Video Surveillance Visual Analytics; Published
Haraty, M., Nobarany, S., Fels, S.S. & Fisher, B. D. (2011) Leveraging trust relationships in digital backchannel communications. CHI EA '11: Proceedings of the 2011 annual conference extended abstracts on Human factors in computing systems. 05/2011 MDRP 6: Video Surveillance Visual Analytics; Published
Savikhin, A., Lam, H.C., Fisher, B., Ebert, D. (2011) Experimental Study of Financial Portfolio Selection with Visual Analytics for Decision Support (full paper). Proceedings of the 44th Annual Hawaii International Conference on System Sciences. IEEE Digital Library 01/2011 MDRP 6: Video Surveillance Visual Analytics; Published
Lindquist, E., Ebert, D., Fisher, B., & Jędrzejek, C, (2011) Visualization and Policy Development: Implications for Theory-Building (Visweek Panel) IEEE Conference on Visual Analytics Science and Technology, Providence RI 10/2011 MDRP 6: Video Surveillance Visual Analytics; Published
Arias-Hernández, Green, T.M., Fisher, B. (2011) From cognitive amplifiers to cognitive prostheses: understandings of the material basis of cognition in visual analytics. Visualisation in the Age of Computerisation. Said Business School, Oxford University Oxford UK. 03/2012 MDRP 6: Video Surveillance Visual Analytics; Published
Arias-Hernández, R., Green, T.M., Fisher,B.(2011) Pair Analytics: Capturing Reasoning Processes in Collaborative Visual Analytics (full paper). Proceedings of the 44th Annual Hawaii International Conference on System Sciences. IEEE Digital Library 01/2011 MDRP 6: Video Surveillance Visual Analytics; Published

"Visual Analytics and Human Computer Interaction" Richard Arias-Hernández, John Dill, Brian Fisher, Tera Marie Green February 2011
University of Houston – Downtown
Chen, W. Ding, W. Garcia*, “Adaptive Study Design through Semantic Association Rule Analysis”, International Journal of Software Science and Computational Intelligence, Vol. 2, No. 3., 2011, page 34-48.
Hinote*, C. Ramirez*, and Ping Chen, “A Comparative Study of Co-reference Resolution in Clinical Text (poster)”, The Fifth i2b2/VA/Cincinnati Workshop on Challenges in Natural Language Processing for Clinical Data, Washington DC, Oct. 2011
TeraGrid 2010 (Presenters: Hooman Hemmati & Duber Gomez-Fonseca) CAHSI Annual Meeting - March 27-29 2011: San Huan, Puerto Rico (Presenters: Tia Pilaroscia, Lilian Antunes, Duber Gomez-Fonseca & Sarah Jennisca) UHD SRC 2011(Hooman Hemmati, Duber Gomez-Fonseca & Sarah Jennisca)
University of North Carolina at Charlotte
Y. Guo, X. Lin, Z. Teng, X. Xue, J. Fan, “A covariance matrix-free iterative algorithm to achieve distributed principal component analysis on vertically partitioned data”, Pattern Recognition, vol. 44, no. 11, 2011 (to appear). 09/2011 MDRP 14: Multimedia Visual Analytics for Investigative Analysis; Published
W. Zhang, X. Xue, J. Fan, “Multi-kernel multi-label learning with max-margin concept network”, IJCAI (22th Intl. Joint Conf. on Artificial Intelligence), Barcelona, 2011. 07/2011 MDRP 14: Multimedia Visual Analytics for Investigative Analysis; Published
Y. Nakashima, N. Babaguchi, J. Fan, “Automatic generation of privacy-protected videos using background estimation", IEEE ICME (IEEE Intl. Conf. on Multimedia and Expo), Barcelona, 2011. 07/2011 MDRP 14: Multimedia Visual Analytics for Investigative Analysis; Published
Y. Zhang, C. Jin, L. Cen, X. Xue, J. Fan, “Fusion of multiple features and supervised learning for Chinese OOV term detection and POS guessing", IJCAI (22th Intl. Joint Conf. on Artificial Intelligence), Barcelona, 2011. 07/2011 MDRP 14: Multimedia Visual Analytics for Investigative Analysis; Published
Y. Zhang, C. Jin, L. Cen, X. Xue, J. Fan, `Learning inter-related statistical query translation models for English-Chinese bi-directional CLIR", IJCAI (22th Intl. Joint Conf. on Artificial Intelligence), Barcelona, 2011. 07/2011 MDRP 14: Multimedia Visual Analytics for Investigative Analysis; Published
C. Yang, X. Feng, J. Peng, J. Fan, “Efficient large-scale image data set exploration: Visual concept network and image summarization", MMM'11 (Intl. Conf. on Multimedia

Modeling), pp. 111-121, 2011. 07/2011 MDRP 14: Multimedia Visual Analytics for Investigative Analysis; Published
N. Zhou, J. Peng, X. Feng, J. Fan, “Towards more precise social image-tag alignment”, MMM’11, (Intl. Conf. on Multimedia Modeling), pp. 46-56, 2011. 07/2011 MDRP 14: Multimedia Visual Analytics for Investigative Analysis; Published
J. Fan, W. Ribarsky, R. Jain, `Social computing for collaborative image understanding”, IEEE Multimedia, vol. 18, 2011 (invitation submission, to appear). 07/2011 MDRP 14: Multimedia Visual Analytics for Investigative Analysis; Published
Xue, X., H. Luo, J. Fan, “Structured Max-margin Learning for Multi-Label Image Annotation", ACM Conf. on Image and Video Retrieval (CIVR'10), 2010. 03/2011 MDRP 14: Multimedia Visual Analytics for Investigative Analysis
W. Zhang, X. Xue, J. Fan, “Correlative multi-label multi-instance image annotation", IEEE ICCV (IEEE Intl Conf. on Computer Vision), Barcelona, 2011. 11/2011 MDRP 14: Multimedia Visual Analytics for Investigative Analysis; Published
W. Zhang, X. Xue, J. Fan, “Automatic image annotation with weakly labeled dataset", ACM Multimedia, Scottsdale, Arizona, USA, 2011. 11/2011 Multimedia, Social Media, Text, and Emergency Response Analytics; Published
C. Yang, J. Fan, “Effective summarization of large-scale web images", ACM Multimedia, Scottsdale, Arizona, USA, 2011. 11/2011 Multimedia, Social Media, Text, and Emergency Response Analytics; Published
N. Zhou, Y. Shen, J. Peng, X. Feng, J. Fan, “Leveraging auxiliary text terms for automatic image annotation", ACM WWW (Intl World Wide Web Conferences), Hyderabad, India, 2011. 03/2011 Multimedia, Social Media, Text, and Emergency Response Analytics; Published
Jamal Alsakran, Yang Chen, Dongning Luo, Ye Zhao, Jing Yang, Wenwen Dou, Shixia Liu: Real-Time Visualization of Streaming Text with a Force-Based Dynamic System. IEEE Computer Graphics and Applications 32(1): 34-45 (2012) 12/2011 Multimedia, Social Media, Text, and Emergency Response Analytics; Published
J. Alsakran, Y. Chen, Y. Zhao, J. Yang, and D. Luo: STREAMIT: dynamic visualization and interactive exploration of text streams. Proc. IEEE Pacific Visualization Symposium 2011, pages 131-138 03/2011 MDRP 14: Multimedia Visual Analytics for Investigative Analysis; Published
Y. Chen, J. Alsakran, S. Barlowe, J. Yang, and Y. Zhao: Supporting Effective Common Ground Construction in Asynchronous Collaborative Visual Analytics. Proc IEEE Conference on Visual Analytics Science and Technology 2011, conditionally accepted. 10/2011 MDRP 14: Multimedia Visual Analytics for Investigative Analysis; Published
Jamal Alsakran, Ye Zhao, Xiaoke Huang, Alex Midget, and Jing Yang: Using Entropy in Enhancing Visualization of High Dimensional Categorical Data. Submitted to IEEE

Conference on Information Visualization 2012 08/2011 Multimedia, Social Media, Text, and Emergency Response Analytics; Published
University of Washington
Walton, R., Mays, R., & Haselkorn, M. (2011, May). Defining fast: factors affecting the experience of speed in humanitarian logistics. Proceedings of the 2011 international conference on international systems in crisis response and management. 05/2011 MDRP 7: Introducing Sustainable Visual Analytics into Command Center Environments
Walton, Rebecca W.; Mays, Robin E.; Haselkorn, Mark P. (2011) “Defining 'Fast': Factors Affecting the Experience of Speed in Humanitarian Logistics, “ In Proceedings of the 2011 International Conference on Information Systems for Crisis Response and Management (ISCRAM2011) [Fully-refereed, blind, 45% acceptance] Winner, ISCRAM Best Paper Award, May 2011. 05/2011 Enhancing Interactive Visual Analysis and Decision Making Environments; Published
Mays, Robin E.; Zachry, Mark; Garrison-Laney, Carolyn; Murat, Alper; Haselkorn, Mark P. (2011) “Aligning Border Security Workflow and Decision Making with Support Information and Communications Systems.” In Proceedings of the 2011 International Conference on Information Systems for Crisis Response and Management (ISCRAM2011) [Fully-refereed, blind, 45% acceptance]. 05/2011 Enhancing Interactive Visual Analysis and Decision Making Environments; Published
"Defining "Fast"Factors Affecting the Experience of Speed in Humanitarian Logistics" Rebecca Walton, Robin Mays, Mark Haselkorn May 2011
Virginia Tech
Bradel, L., Endert, A., North, C. “Benefits of Co-located Collaboration on Large, High-Resolution Displays.” Grace Hopper Conference 2011. Portland, Oregon. November, 2011 11/2011 Co-Located Collaborative Analysis on Large, High-Resolution Displays using Multiple Input Devices; Public Safety Coalition Projects
Vogt, K., Bradel, L., Andrews, C., North, C., Endert, A., Hutchings, D. “Co-located Collaborative Sensemaking on a Large High-Resolution Display with Multiple Input Devices.” Conference on Human-Computer Interaction (INTERACT '11). Lisbon, Portugal, September 2011, 17 pages. 09/2011 Co-Located Collaborative Analysis on Large, High-Resolution Displays using Multiple Input Devices; Public Safety Coalition Projects; Published
Bradel, L., Andrews, C., Endert, A., Vogt, K., Hutchings, D., North, C. “Space for Two to Think: Large, High-Resolution Displays for Co-located Collaborative Sensemaking.” Technical Report TR-11-08. Computer Science, Virginia Tech 01/2011 Co-Located

Collaborative Analysis on Large, High-Resolution Displays using Multiple Input Devices; Public Safety Coalition Projects
Singh A, Bradel L, Endert A, Kincaid R, Andrews C, North C. Supporting the cyber analytic process using visual history on large displays. In: Proceedings of the 8th International Symposium on Visualization for Cyber Security. Proceedings of the 8th International Symposium on Visualization for Cyber Security. New York, NY, USA; 2011. p. 3:1–3:8. 07/2011 Co-Located Collaborative Analysis on Large, High-Resolution Displays using Multiple Input Devices; Public Safety Coalition Projects; Published
2012
Arizona State University
Maciejewski, R., Jang, Y., Leitte, H., Woo, I., Gaither, K., Ebert, D., "Abstracting Attribute Space for Transfer Function Design," IEEE Transactions on Visualization and Computer Graphics, 2012.
Florida International University
Li Zheng, Chao Shen, Liang Tang, Chunqiu Zeng, Tao Li, Steve Luis, Shu-Ching Chen and Jainendra K. Navlakha. “Disaster SitRep - A Vertical Search Engine and Information Analysis Tool in Disaster Management Domain”.The 13th IEEE International Conference on Information Integration and Reuse (IRI 2012), Las Vegas, Nevada, USA, pp.457-465, August 8-10, 2012.
A Data Intergration Framework for Enhancing Emergency Response Situation Reports with Multi-Agency, Multi-Partner Data" Dr. Shu-Ching Chen, Dr. Tao Li, Steven Luis, Li Zheng, Yimin Yang, Fausto Fleites, Hsin-yu Ha, Yi Zhang, Jesse Domack, Mark Oleson, Jason Allen Dec. 2012
Georgia Tech
Youn-ah Kang and John Stasko, "Examining the Use of a Visual Analytics System for Sensemaking Tasks: Case Studies with Domain Experts", IEEE Transactions on Visualization and Computer Graphics, (Paper presented at VAST '12), Vol. 18, No. 12, December 2012, pp. 2869-2878. 12/2012 MDRP 1: (Jigsaw) Visual Analytics for Investigative Analysis on Text Documents; Published
Penn State
Robinson, A.C., Roth, R.E., Blanford, J., Pezanowski, S. and MacEachren, A.M. 2012: Developing map symbol standards using a distributed, asynchronous process. Environ.

& Planning B: Planning and Design 39, 1034-1048. 01/2012 Symbology Standardization Support
Tomaszewski, B. and MacEachren, A.M. 2012: Geovisual Analytics to Support Crisis Management: Information Foraging for Geo-Historical Context. Information Visualization {invited extension of paper originally published in Proceedings of IEEE VAST 2010} 11, 339-359. 09/2012 MDRP 13: (SensePlace 2) Collaborative Visual-Computational Information Foraging and Contextualization to Support Situation Awareness; Published
Bianchetti, R.A., Wallgrün, J.O., Yang, J., Blanford, J., Robinson, A.C. and Klippel, A. 2012: Free Classification of Canadian and American Emergency Management Map Symbol Standards. Cartographic Journal, The 49, 350-360. 11/2012 Symbology Standardization Support
McClendon, S. and Robinson, A.C. 2012: Leveraging Geospatially-Oriented Social Media Communications in Disaster Response. Information Systems for Crisis Response and Management (ISCRAM) conference, Vancouver, BC. 04/2012 Symbology Standardization Support
MacEachren, A.M., Roth, R.E., O’Brien, J., Li, B., Swingley, D. and Gahegan, M. 2012: Visual Semiotics & Uncertainty Visualization: An Empirical Study. IEEE Trans. on Visualization & Computer Graphics 18, 2496-2505. 12/2012 Symbology Standardization Support
Purdue - Delp
A. Parra, M. Boutin, and E. J. Delp, “Location-Aware Gang Graffiti Acquisition and Browsing on a Mobile Device”, Proceedings of the IS&T/SPIE Electronic Imaging on Multimedia on Mobile Devices, San Francisco, CA, January 2012 01/2012 (GARI) Gang Graffiti Recognition and Analysis; Published
A. W. Haddad, S. Huang, M. Boutin, E. J. Delp, “Detection of Symmetric Shapes on a Mobile Device with Applications to Automatic Sign Interpretation”, Proceedings of the IS&T/SPIE Electronic Imaging on Multimedia on Mobile Devices, San Francisco, CA, USA, January 2012 01/2012 (GARI) Gang Graffiti Recognition and Analysis
Purdue - Ebert
Ebert, D., Fisher, B, & Gaither, K. (2011) Symposium on Fundamentals and Applications of Visual Analytics. Proceedings of the 44th Annual Hawaii International Conference on System Sciences. IEEE Digital Library 01/2012 MDRP 6: Video Surveillance Visual Analytics; Published

S. Afzal, R. Maciejewski, Y. Jang, N. Elmqvist, D.S. Ebert. Spatial Text Visualization Using Automatic Typographic Maps. IEEE Transactions on Visualization and Computer Graphics (Proc. IEEE SciVis/InfoVis 2012), 18(12):2556–2564, 2012
Malik, A., Maciejewski, R., Yang, Y., Huang, W., Elmqvist, N., Ebert, D., ―A Correlative Analysis Process in a Visual Analytics Environment‖, IEEE Conference on Visual Analytics Science and Technology, October 2012 10/2012 Visual Analytics Law Enforcement Technology; Public Safety Coalition Projects
Chae, J., Thom, D., Bosch, H., Jang, Y., Maciejewski, R., Ebert, D., Ertl, T., "Spatiotemporal Social Media Analytics for Abnormal Event Detection using Seasonal-Trend Decomposition," IEEE Visual Analytics Science and Technology (VAST) Conference, 2012.
Ko, S., Jang, Y., Maciejewski, R., Ebert, D.," Computer Graphics Forum (Proceedings of IEEE/Eurographics EuroVis 2012, 2012. 06/2012 MarketAnalyzer: An Interactive Visual Analytics System for Analyzing Competitive Advantage Using Point of Sale Data; Published
Daugherty, B. Schap, T., Ettienne-Gittens, R., Zhu, F., Bosch, M., Delp, E., Ebert, D., Kerr, D., Boushey, C., "Novel technologies for assessing dietary intake: Evaluating the usability of a mobile telephone food record among adults and adolescents," Journal of Medical Internet Research, 2012.
Livengood, P., Maciejewski, R., Chen, W., Ebert, D., "OmicsVis: An Interactive Tool for Visually Analyzing Metabolomics Data," BMC Bioinformatics 2012.
B. Kwon, W. Javed, S. Ghani, N. Elmqvist, J. S. Yi, D. Ebert. Evaluating the Role of Time in Investigative Analysis of Document Collections. IEEE Transactions on Visualization and Computer Graphics, 18(11):1992–2004, 2012.
Elmqvist, N., Ebert, D., "Leveraging Multidisciplinarity in a Visual Analytics Graduate Course," IEEE Computer Graphics and Applications, May/June 2012 05/2012 Cyber Education
Lee, C., Chae, J., Schap, T., Kerr, D., Delp, E., Ebert, D., Boushey, C., "Comparison of Known Food Weights With Image-Based Portion Size Automated Estimation And Adolescents' Self-Reported Portion Size," Journal of Diabetes Science and Technology, Vol. 6, No.2, March 2012.
Maciejewski, R., Pattath, A., Ko, S., Hafen, R., Cleveland, W., Ebert, D., "Automated Box-Cox Transformations for Improved Visual Encoding,"IEEE Transactions on Visualization and Computer Graphics, 2012. MDRP 16: (VALET) Context-aware Mobile Visual Analytics for Emergency Response
Woo, I., Maciejewski, R., Gaither, K. and Ebert, D., "Feature-driven Data Exploration for Volumetric Rendering," IEEE Transactions on Visualization and Computer Graphics, to appear, 2012.

Oliveros, S., Eich-Miller, H., Boushey, C., Ebert, D., and Maciejewski, R., "Applied Visual Analytics for Exploring the National Health and Nutrition Examination Survey," Hawaii International Conference on System Sciences, 2012.
Maciejewski, R., Afzal, R., Fairfield, A., Ghafoor,A., Ebert, D., Ahmed, M., and Ayyaz, N. "Enabling Syndromic Surveillance in Pakistan," Refereed Abstract, Abstracts from the 2012 Conference of the International Society of Disease Surveillance, December 2012.
Chen, V., Razip, A., Ko, S., Qian, C., Ebert, D., "SemanticPrism: A multi-aspect view of large high-dimensional data," Refereed Short Paper (2 pages), IEEE Visual Analytics Science and Technology (VAST) 2012, VAST 2012 Mini Challenge 1 award: Outstanding integrated analysis and visualization, 2012.
S. Ghani, N. Elmqvist, J. S. Yi. Perception of Animated Node-Link Diagrams for Dynamic Graphs. Computer Graphics Forum (IEEE EuroVis 2012 proceedings), 06/2012 MDRP 18: COE-Explorer (Visual Analytics for the DHS Centers of Excellence); Published
S. Ghani, N. Elmqvist, D. S. Ebert. MultiNode-Explorer: A Visual Analytics Framework for Generating Web-based Multimodal Graph Visualizations. Workshop paper presented at the EuroVis Workshop on Visual Analytics (EuroVA 2012), 06/2012 MDRP 18: COE-Explorer (Visual Analytics for the DHS Centers of Excellence); Published
Simon Fraser University
Fisher, B. (2011) Visualisation Network-of-Experts 11th Workshop: Visual Analytics and Network Operations and Health. NATO Research and Technology Organization Research Study Group IST-85 (Keynote address) 01/2012 MDRP 6: Video Surveillance Visual Analytics; Published
Al-Hajj, S. I. Pike and B. Fisher “Visual Analytics to Support Medical Decision Making Process”. Short communication, XXIV Conference of the European Federation for Medical Information: Quality of life through Quality of Information. Pisa, ITALY (2012). 08/2011 MDRP 6: Video Surveillance Visual Analytics
Kaastra, L.T., Arias-Hernandez, R., Fisher, B. (2012) Evaluating Analytic Performance. BELIV 2012: Beyond Time and Errors - Novel Evaluation Methods for Visualization. 2012, Seattle WA 12/2011 MDRP 6: Video Surveillance Visual Analytics
University of Houston - Downtown
Hinote*, C. Ramirez*, and Ping Chen, “Effective Co-reference Resolution in Clinical Text”, The 25th International Conference on Industrial, Engineering & Other Applications of Applied Intelligent Systems , Dalian, China, June 9, 2012

Johnathan Kuskos, Manuel Palma, Byron Jackson, Advisor: Hong Lin, A Program for Brain State Analysis using Electroencephalographic Data, Consortium for Computing Sciences in Colleges South Central Region (CCSC:SC 2012), West Texas A&M University, Canyon, Texas, April 20-21, 2012; 2012 CCSC:SC Student E-Journal for Computing Sciences in Colleges Authors listed on all publications (w/ exception of TeraGrid due to team member additions).
Facilitating Agile Software Development with Lean Architecture in the DCI Paradigm, with Tomohiro Hayata and Jianchao Han, ITNG 2012
The Design and Implementation of an Antivirus Software Advising System with Eugene Chamorro and Jianchao Han, ITNG2012
University of North Carolina at Charlotte
N. Zhou, J. Fan, “Discriminative dictionary learning for large-scale visual recognition, IEEE Conf. on Computer Vision and Pattern Recognition (CVPR'12), 2012 06/2012 Multimedia, Social Media, Text, and Emergency Response Analytics; Published
Chen Yang, Hao Wei, Shixia Liu, Jing Yang, and Kun Zhou: TextPioneer: Exploring Topical Lead-Lag Evolution across Corpora. Submitted to IEEE Conference on Information Visualization 2012 05/2014 Multimedia, Social Media, Text, and Emergency Response Analytics; Published
Y. Shen, N. Zhou, J. Fan, “Integrating bilingual searches for junk image filtering”, ICIMCS’10 (The Second International Conference on Internet Multimedia Computing and Service), 2010. 03/2012 MDRP 14: Multimedia Visual Analytics for Investigative Analysis; Published
Xiaoyu Wang, Zachary Wartell, Isaac Cho, and William Ribarsky. Towards Utilizing Heterogeneous Displays in Emergency Response. Submitted to IEEE VAST 2012. 03/2012 Multimedia, Social Media, Text, and Emergency Response Analytics; Published
Wenwen Dou, Xiaoyu Wang, Drew Skau, and William Ribarsky. LeadLine: Interactive Visual Analysis of Text Data through Event Identification and Exploration. Proceeding of IEEE VAST 2012, pp. 93-102. 10/2012 Multimedia, Social Media, Text, and Emergency Response Analytics; Published
C. Yang, J. Fan "Image Collection Summarization via Dictionary Learning", IEEE Conf. on Computer Vision and Pattern Recognition (CVPR'12), 2012 06/2012 Multimedia, Social Media, Text, and Emergency Response Analytics; Published
C. Yang, P.Wong, W. Ribarsky, J. Fan "Efficient Graffiti Image Retrieval", ACM International Conference on Multimedia Retrieval (ICMR’12), 2012 06/2012 Multimedia, Social Media, Text, and Emergency Response Analytics; Published.

J. Fan, N. Zhou, “Quantitative semantic gap modeling for learning complexity estimation‖, IEEE Trans. on Multimedia, vol.18, no.9, 2012. 05/2012 Multimedia, Social Media, Text, and Emergency Response Analytics; Published
Dongning Luo, Jing Yang, Milos Krstajic, William Ribarsky, Daniel A. Keim: EventRiver: Visually Exploring Text Collections with Temporal References. IEEE Trans. Vis. Comput. Graph. 18(1): 93-105 (2012) 01/2012 Multimedia, Social Media, Text, and Emergency Response Analytics; Published
William Ribarsky, Wenwen Dou, and Zachary Wartell. Event Structuring as a General Approach to Building Knowledge in Time-Based Collections. Advances in Visual Analytics: in Memory of Jim Thomas. (Springer, 2012).
"EventRiver: An Event-Based Visual Analytics Approach to Exploring Large Text Collections with a Temporal Focus" Dongning Luo, Jing Yang, Milos Krstajic, William Ribarsky, Daniel Keim 2012
Wenwen Dou, Xiaoyu Wang, Drew Skau, and William Ribarsky. LeadLine: Interactive Visual Analysis of Text Data through Event Identification and Exploration. Proceeding of IEEE VAST 2012, pp. 93-102. 10/2012 Multimedia, Social Media, Text, and Emergency Response Analytics; Published
C. Yang, J. Fan "Image Collection Summarization via Dictionary Learning", IEEE Conf. on Computer Vision and Pattern Recognition (CVPR'12), 2012 06/2012 Multimedia, Social Media, Text, and Emergency Response Analytics; Published
C. Yang, P.Wong, W. Ribarsky, J. Fan "Efficient Graffiti Image Retrieval", ACM International Conference on Multimedia Retrieval (ICMR’12), 2012 06/2012 Multimedia, Social Media, Text, and Emergency Response Analytics; Published.
J. Fan, N. Zhou, “Quantitative semantic gap modeling for learning complexity estimation‖, IEEE Trans. on Multimedia, vol.18, no.9, 2012. 05/2012 Multimedia, Social Media, Text, and Emergency Response Analytics; Published
Dongning Luo, Jing Yang, Milos Krstajic, William Ribarsky, Daniel A. Keim: EventRiver: Visually Exploring Text Collections with Temporal References. IEEE Trans. Vis. Comput. Graph. 18(1): 93-105 (2012) 01/2012 Multimedia, Social Media, Text, and Emergency Response Analytics; Published
William Ribarsky, Wenwen Dou, and Zachary Wartell. Event Structuring as a General Approach to Building Knowledge in Time-Based Collections. Advances in Visual Analytics: in Memory of Jim Thomas. (Springer, 2012).
"EventRiver: An Event-Based Visual Analytics Approach to Exploring Large Text Collections with a Temporal Focus" Dongning Luo, Jing Yang, Milos Krstajic, William Ribarsky, Daniel Keim 2012

Virginia Tech
Endert A, Bradel L, Zeitz J, Andrews C, North C. Designing large high-resolution display workspaces. In: Proceedings of the International Working Conference on Advanced Visual Interfaces. Proceedings of the International Working Conference on Advanced Visual Interfaces. New York, NY, USA; 2012. p. 58–65. Co-Located Collaborative Analysis on Large, High-Resolution Displays using Multiple Input Devices; Public Safety Coalition Projects; Published
2013
Arizona State University
Zhang, Y., Adnan, M., Longley, P., Maciejewski, R., “Exploring Geo-Genealogy Using Internet Surname Search Histories,” Journal of Maps, 9(4):481-485, 07/2013 WDYTYA: The Uncertainty of Identity; Published
KSungYe Kim, R. Maciejewski, A. Malik, Yun Jang, D. S. Ebert, T. Isenberg, "Bristle Maps: A Multivariate Abstraction Technique for Geovisualization", IEEE Transactions on Visualization & Computer Graphics, vol.19, no. 9, pp. 1438-1454, Sept. 2013, doi:10.1109/TVCG.2013.66 09/2013 Bristle Maps - A Multivariate Abstraction Technique for Geovisualization; Published
Lu, Y., Wang, F., Maciejewski, R., “VAST 2013 Mini-Challenge 1: Box Office VAST - Team VADER,” IEEE Conference on Visual Analytics Science and Technology, 10/2013 WDYTYA: The Uncertainty of Identity; Published
Florida International University
Li Zheng, Chao Shen, Liang Tang, Chunqiu Zeng, Tao Li, Steve Luis, and Shu-Ching Chen, "Data Mining Meets the Needs of Disaster Information Management," conditionally accepted for publication, IEEE Transactions on Human-Machine Systems (THMS), Volume 43, No. 5, pp. 451-464, 2013.
Hsin-Yu Ha, Fausto C. Fleites, and Shu-Ching Chen, "Building Multi-model Collaboration in Detecting Multimedia Semantic Concepts," 9th IEEE International Conference on Collaborative Computing: Networking, Applications and Worksharing, Austin, Texas, USA, pp. 205-212, October 20-23, 2013.
Hsin-Yu Ha, Fausto C. Fleites, and Shu-Ching Chen, "Content-Based Multimedia Retrieval Using Feature Correlation Clustering and Fusion," International Journal of Multimedia Data Engineering and Management (IJMDEM), Volume 4, No. 2, pp. 46-64, 2013.
Hsin-Yu Ha, Yimin Yang, Fausto Fleites, and Shu-Ching Chen, "Correlation-Based Feature Analysis and Multi-Modality Fusion Framework for Multimedia Semantic

Retrieval," The 2013 IEEE International Conference on Multimedia and Expo (ICME 2013), "Multimedia for Humanity" Theme Track, San Jose, California, USA, pp. 1-6, July 15-19, 2013.
Wenting Lu, Jingxuan Li, Tao Li, Honggang Zhang, and Jun Guo. “Web Multimedia Object Classification using Cross-Domain Correlation Knowledge”, IEEE Transactions on Multimedia, Volume 15, No. 8, pp. 1920-1929, 2013.
Georgia Tech
Carsten Görg, Youn-ah Kang, Zhicheng Liu, and John Stasko, "Visual Analytics Support for Intelligence Analysis", IEEE Computer, Vol. 46, No. 7, July 2013, pp. 30-38. 07/2013 MDRP 1: (Jigsaw) Visual Analytics for Investigative Analysis on Text Documents
Carsten Görg, Zhicheng Liu, Jaeyeon Kihm, Jaegul Choo, Haesun Park, John T. Stasko, "Combining Computational Analyses and Interactive Visualization for Document Exploration and Sensemaking in Jigsaw", IEEE Transactions on Visualization and Computer Graphics, Vol. 19, No. 10, October 2013, pp. 1646-1663.
Jackson State University
Prepared Report for Central Mississippi Area Health Education Center (CMAHEC) with Tugaloo College on “Statewide Spatial Analysis of Health Trends in MS” (Sep 2013) 09/2013 GIS Implementations; Published
Yerramilli, Sudha. "Potential Impact of Climate Changes on the Inundation Risk Levels in a Dam Break Scenario." ISPRS International Journal of Geo-Information 2.1 (2013): 110-134. GIS Implementations; Published
Penn State
Robinson, A.C., Pezanowski, S., Troedson, S., Bianchetti, R., Blanford, J., Stevens, J., Guidero, E., Roth, R.E. and MacEachren, A.M. 2013: SymbolStore.org: A Web-based Platform for Sharing Map Symbols. Cartography & Geographic Information Science http://dx.doi.org/10.1080/15230406.2013.803833.06/2013 Symbology Standardization Support
Karimzadeh, M., Huang, W., Banerjee, S., Wallgrün, J, Hardisty, F., Pezanowski, S., Mitra, P., and MacEachren, A.M. (2013) GeoTxt: A Web API to Leverage Place References in Text. ACM SIGSPATIAL International Conference on Advances in Geographic Information Systems, Orlando, FL, November 5-8, 2013. 11/2013 (GeoTxt) E2E: GeoTxt API; Published
Robinson, A., Pezanowski, S., Stevens, J., Mullins, R., Blanford, J., Bianchetti, R. and MacEachren, A.M. 2013: Sharing and Discovering Map Symbols with SymbolStore.org. Proceedings of the International Cartographic Conference, Dresden, Germany, August 25-30, 2013. 08/2013 Symbology Map Transition; Published

Stevens JE, Robinson AC, MacEachren AM. (2013) Designing Map Symbols for Mobile Devices: Challenges, Best Practices, and the Utilization of Skeuomorphism. In: Proceedings of the International Cartographic Conference. Proceedings of the International Cartographic Conference. Dresden, Germany. 08/2013 Symbology Map Transition; Published
Murdock, M.J., Maziekas, N.V. and Roth, R.E. 2012: The Basic Ordnance Observational Management System: Geovisual exploration and analysis of improvised explosive device incidents. Journal of Maps 8, 120-124. 08/2013 MDRP 3: (GeoViz & CrimeViz) Situational Surveillance & In-field Criminal Investigative Analytics; Published
Roth, R.E., Ross, K.S., Finch, B.G., Luo, W. and MacEachren, A.M. 2013: Spatiotemporal Crime Analysis in U.S. Law Enforcement Agencies: Current Practices and Unmet Needs. Government Information Quarterly 30, 226-240. 07/2013 MDRP 3: (GeoViz & CrimeViz) Situational Surveillance & In-field Criminal Investigative Analytics; Published
Robinson, A.C., Savelyev, A., Pezanowski, S. and MacEachren, A.M. 2013: Understanding the Utility of Geospatial Information in Social Media. In 2013, M., Comes, T., Fiedrich, F., Fortier, S., Geldermann, J. and Yang, L., editors, Proceedings of the 10th International ISCRAM Conference, Baden-Baden, Germany: ISCRAM. 05/2013 MDRP 13: (SensePlace 2) Collaborative Visual-Computational Information Foraging and Contextualization to Support Situation Awareness; Published
Designing a Web Service to Geo-Locate Subjects of Volunteered, Textual Geographic Information. (in press) Ryan Mullins, Frank Hardisty, Scott Pezanowski, Sujatha Das, Alexander Savelyev, Alan MacEachren, Prasenjit Mitra, Anuj Jaiswal, August 29th 2013, ICC, Dresden, Germany. 08/2013 MDRP 13: (SensePlace 2) Collaborative Visual-Computational Information Foraging and Contextualization to Support Situation Awareness
“Producing Geo-historical Context from Implicit Sources: A Geovisual Analytics Approach,” Brian Tomaszewski; The Cartographic Journal 45(3): 165-181. July 2013
“Star Plots - How Shape Characteristics Influence Classification Tasks,” Alexander Klippel, Frank Hardisty, Chris Weaver. March 2013
Roth, R.E., Finch, B.G., Blanford, J.I., Klippel, A. Robinson, A.C. and MacEachren, A.M. (in press) Card sorting for cartographic research and practice. Cartography and Geographic Information Science 38(2). 03/2013 Symbology Standardization Support; Published
Purdue – Delp
A. Parra, B. Zhao, J. Kim, Joonsoo, E. J. Delp, “Recognition, segmentation and retrieval of gang graffiti images on a mobile device,” Proceedings of the IEEE International

Conference on Technologies for Homeland Security, pp. 178 – 183, November 2013, Waltham, MA. 11/2013 (GARI) Gang Graffiti Recognition and Analysis; Published
A. Parra Pozo, B. Zhao, A. Haddad, M. Boutin, E. Delp, “Hazardous Material Sign Detection And Recognition,” Proceedings of the IEEE International Conference on Image Processing, September 2013, Melbourne, Australia. 09/2013 (MERGE) Mobile Emergency Response Guide; Published
B. Zhao, A. Parra, E. Delp, “Mobile-Based Hazmat Sign Detection And Recognition,” Proceedings of the IEEE Global Conference on Signal and Information Processing, December 2013, Austin, TX. 12/2013 (MERGE) Mobile Emergency Response Guide; Published
Purdue – Ebert
S. Ghani, B. Kwon, S. Lee, J. S. Yi, N. Elmqvist. Visual Analytics for Multimodal Social Network Analysis: A Design Study with Social Scientists. IEEE Transactions on Visualization and Computer Graphics 12/2013 MDRP 18: COE-Explorer (Visual Analytics for the DHS Centers of Excellence)
Chae, J., Thom, D., Jang, Y., Kim, S., Ertl, T., Ebert, D., "Visual Analytics of Microblog Data for Public Behavior Analysis in Disaster Events," Eurovis Workshop on Visual Analytics, 06/2013 SMART: Social Media Analytics and Reporting Toolkit; Published
Lu, A., Ebert, D., Gao, J., Zhang, S., Joshi, A., "Guest Editorial: Special Issue on Visualization and Visual Analytics," Tsinghua Science and Technology, Vol. 18, No. 2, April 2013.
Owen, G. S., Domik, G., Ebert, D., Kohlhammer, J., Rushmeier, H., Sousa Santos, B., Weiskopf, D., "How Visualization Courses Have Changed over the Past 10 Years," IEEE Computer Graphics and Applications, 2013.
Chen, V., Razip, A., Ko, S., Qian, C., Ebert, D., "Multi-aspect Visual Analytics on Large-scale High-dimensional Cyber Security Data," Information Visualization, 2013.
University of Houston – Downtown
Hong Lin, Johnathan Kuskos, Manuel Palma, Byron Jackson, Towards a Meditation Brain State Model for Scientific Study of Chan, International Journal of Art, Culture and Design Technologies (IJACDT).2013
University of North Carolina at Charlotte
C. Yang, J. Fan, “Speed up duplicate/near-duplicate image detection", ICIMCS'10 (The Second International Conference on Internet Multimedia Computing and Service),

2010. 03/2013 MDRP 14: Multimedia Visual Analytics for Investigative Analysis; Published
William Ribarsky, Xiaoyu Wang, and Wenwen Dou. Social Media Analytics for Competitive Advantage Invited paper. Computers & Graphics 38C (2014), pp. 328-331 (Special Issue on EuroVA 2013) 10/2013 Multimedia, Social Media, Text, and Emergency Response Analytics; Published
Jack Guest, KR Subramanian, and William Ribarsky. Large Scale Situationally Aware Building Evacuation. Information Visualization Journal. 08/2013 Multimedia, Social Media, Text, and Emergency Response Analytics
Shehzad Afzal, Isaac Cho, et al. A Survey of Visual Analysis Approaches for Financial Data Exploration. Submitted to IEEE Transaction on Visualization and Computer Graphics. 08/2013 Multimedia, Social Media, Text, and Emergency Response Analytics
Dominik Jäckle, Florian Stoffel, Bum Chul Kwon, Xiaoyu Wang, Dominik Sacha, Todd Eaglin, Andreas Stoffel, William Ribarsky, and Daniel A. Keim. ClusterRim: Maintaining Context-Awareness via Aggregated Off-Screen Visualization. Submitted to the Information Visualization Journal. 08/2013 Multimedia, Social Media, Text, and Emergency Response Analytics; Published
Wenwen Dou, Li Yu, Xiaoyu Wang, Zhiqiang Ma, and William Ribarsky. Hierarchical Topics: Visually Exploring Large Text Collections Using Topic Hierarchies. IEEE Transactions on Visualization and Computer Graphics 19(12), pp. 2002-2011 (VAST 2013). 12/2013 Multimedia, Social Media, Text, and Emergency Response Analytics; Published
Xiaoyu Wang, Dong Jeong, Remco Chang, Arun Pinto, and William Ribarsky. RiskVA: A Visual Analytics System for Consumer Credit Risk Analysis. Tsinghua Science and Technology: Special Issue on Visualization and Computer Graphics, Vol. 17(4), pp. 440-451 (2012). 10/2013 Multimedia, Social Media, Text, and Emergency Response Analytics; Published
Xiaoyu Wang, Zhiqiang Ma, Wenwen Dou, and William Ribarsky. Discover Diamonds-in-the-Rough using Interactive Visual Analytics System: Tweets as a Collective Diary of the Occupy Movement. Accepted for publication. 07/2013 Multimedia, Social Media, Text, and Emergency Response Analytics; Published
Jack Guest, KR Subramanian, and William Ribarsky. Visual Analysis of Situationally Aware Building Evacuations. Submitted to IEEE VAST 2012. 02/2013 Multimedia, Social Media, Text, and Emergency Response Analytics; Published
Virginia Tech
Bradel L, Endert A, Koch K, Andrews C, North C. Large High Resolution Displays for Co-Located Collaborative Sensemaking: Display Usage and Territoriality. International

Journal of Human-Computer Studies. 2013;71(11):1078-1088. Co-Located Collaborative Analysis on Large, High-Resolution Displays using Multiple Input Devices; Public Safety Coalition Projects
Bradel L, Self JZ, Endert A, Hossain SM, North C, Ramakrishnan N. How analysts cognitively “connect the dots”. In: 2013 IEEE International Conference on Intelligence and Security Informatics (ISI). 2013 IEEE International Conference on Intelligence and Security Informatics (ISI). Seattle, WA, USA; 2013. p. 24 - 26. Co-Located Collaborative Analysis on Large, High-Resolution Displays using Multiple Input Devices; Public Safety Coalition Projects
2014
Arizona State University
Abish Malik, Ross Maciejewski, Sean McCullough, Sherry Towers, David S. Ebert. Proactive Spatiotemporal Resource Allocation and Predictive Visual Analytics for Community Policing and Law Enforcement. IEEE Transactions on Visualization and Computer Graphics, 20(12): 1863-1872, 2014 12/2014 WDYTYA: The Uncertainty of Identity; Published
Yafeng Lu, Feng Wang, Ross Maciejewski. Business Intelligence from Social Media: A Study from the VAST Box Office Challenge. IEEE Computer Graphics and Applications, 34(5): 58-70, 09/2014 WDYTYA: The Uncertainty of Identity; Published
Yafeng Lu, Robert Kruger, Dennis Thom, Feng Wang, Steffen Koch, Thomas Ertl, Ross Maciejewski. Integrating Predictive Analytics and Social Media. Proceedings of the IEEE Conference on Visual Analytics Science and Technology, 10/2014 WDYTYA: The Uncertainty of Identity; Published
Wang, F., Ibarra, J., Adnan, M., ongley, P., Maciejewski, R., “What’s In a Name? Data Linkage, Demography and Visual Analytics,” Eurovis Workshop on Visual Analytics, 06/2014 WDYTYA: The Uncertainty of Identity; Published
Lu, Y., Wang, F., Maciejewski, R., “Business Intelligence from Social Media: A Study from the VAST Box-Office Challenge,” IEEE Computer Graphics and Applications, 2014
A. M. M. Razip, A. Malik, S. Afzal, S. Joshi, R. Maciejewski, Y. Jang, N. Elmqvist, and D. S. Ebert. A Mobile Visual Analytics Approach for Situational Awareness and Risk Assessment. Proceedings of IEEE PacificVis, 03/2014 (VALET) Developing a spatial statistics framework in the visual analytics for law enforcement technology suite; Published
Malik, A., Maciejewski, R., Jang, Y., Oliveros, S., Yang, Y., Maule, B., White, M., Ebert, D. S., “A Visual Analytics Process for Maritime Response, Resource Allocation and Risk Assessment,” Information Visualization, 13(2): 93-110, 11/2014 WDYTYA: The Uncertainty of Identity; Published

Florida International University
Wenting Lu, Lei Li, Jingxuan Li, Tao Li, Honggang Zhang, and Jun Guo. “A Multimedia Information Fusion Framework for Web Image Categorization”, Multimedia Tools and Applications, Volume 70, No. 3, pp. 1453-1486, 2014.
Yimin Yang, Hsin-Yu Ha, Fausto C. Fleites, and Shu-Ching Chen, "A Multimedia Semantic Retrieval Mobile System Based on Hidden Coherent Feature Groups." IEEE Multimedia, Volume 21, No. 1, pp. 36-46, 2014.
Lei Li, and Tao Li. “An Empirical Study of Ontology-based Multi-document Summarization in Disaster Management”. IEEE Transactions on SMC: Systems, Volume 44, No. 2, pp. 162-171, 2014.
Yexi Jiang, Chunqiu Zeng, Jian Xu, Tao Li. “Real time contextual collective anomaly detection over multiple data streams,” ACM SIGKDD Workshop Outlier Detection & Description under Data Diversity (SIGKDD Workshop ODD^2), pp. 23-30, 2014.
Li Zheng, Tao Li and Chris Ding, “A Framework for Hierarchical Ensemble Clustering,” ACM Transactions on Knowledge Discovery from Data (ACM TKDD), Volume 9, No. 2, pp. 9, 2014.
Liang Tang, Yexi Jiang, Lei Li, Tao Li, “Ensemble Contextual Bandits for Personalized Recommendation,” the 8th ACM Conference on Recommender Systems (RecSys), pp. 73-80, 2014.
Chunqiu Zeng, Hongtai Li, Huibo Wang, Yudong Guang, Chang Liu, Tao Li, Mingjin Zhang, Shu-Ching Chen, Naphtali Rishe, “Optimizing Online Spatial Data Analysis with Sequential Query Patterns,” The 15th IEEE international Conference on Information Integration and Reuse(IRI 2014), San Francisco, USA, pp. 253-260, August 13- 15, 2014.
Jingxuan Li, Wei Peng, Tao Li, Tong Sun, Qianmu Li, and Jian Xu. "Social network user influence sense-making and dynamics prediction." Expert Systems with Applications, Volume 41, No. 11, pp. 5115-5124, 2014.
Fan Yang, Xuan Li, Qianmu Li, and Tao Li. "Exploring the diversity in cluster ensemble generation: Random sampling and random projection." Expert Systems with Applications, Volume 41, No. 10, pp. 4844-4866, 2014.
Jingxuan Li, Wei Peng, Tao Li, Tong Sun, Qianmu Li, and Jian Xu. "Social network user influence sense- making and dynamics prediction." Expert Systems with Applications, Volume 41, No. 11, pp. 5115-5124, 2014.
Wubai Zhou, Chao Shen, Tao Li, Shu-Ching Chen, Ning Xie, and Jinpeng Wei "A Bipartite-Graph Based Approach for Disaster Susceptibility Comparisons among Cities," accepted for publication, The 15th IEEE International Conference on Inforamtion Reuse and Integration (IRI 2014), San Francisco, USA, pp. 593-599, August 13- 15, 2014.

Wubai Zhou, Chao Shen, Tao Li, Shu-Ching Chen, and Ning Xie. "Generating Textual Storyline to Improve Situation Awareness in Disaster Management," accepted for publication, The 15th IEEE International Conference on Information Reuse and Integration (IRI 2014), San Francisco, USA, pp. 585-592, August 13-15, 2014.
Hsin-Yu Ha, Fausto C. Fleites, Shu-Ching Chen, and Min Chen, "Correlation-based Re-ranking for Semantic Concept Detection," accepted for publication, The 15th IEEE International Conference on Inforamtion Reuse and Integration (IRI 2014), San Francisco, USA, pp. 765-770, August 13-15, 2014.
Georgia Tech
Carsten Görg, Zhicheng Liu, and John Stasko, "Reflections on the Evolution of the Jigsaw Visual Analytics System", Information Visualization, Vol. 13, No. 4, Oct. 2014, pp. 336-345. 10/2014 MDRP 1: (Jigsaw) Visual Analytics for Investigative Analysis on Text Documents; Published
Jaegul Choo, Yi Han, Mengdie Hu, Hannah Kim, James Nugent, Francesco Poggi, Haesun Park, John Stasko, "Exploring Anomalies in GAStech", Proceedings of IEEE VAST '14 (VAST Challenge paper), Paris, France, Nov. 2014, pp. 347-348. 11/2014 MDRP 1: (Jigsaw) Visual Analytics for Investigative Analysis on Text Documents; Published
Alex Godwin, Anand Sainath, Sanjay Obla Jayakumar, Vivek Nabhi, Sagar Raut, John Stasko, " (Poster), IEEE Information Visualization Conference, Paris, France, 11/2014 MDRP 1: (Jigsaw) Visual Analytics for Investigative Analysis on Text Documents; Published
John Stasko, "Value-Driven Evaluation of Visualizations", Proceedings of BELIV 2014, Paris, France, pp. 46-53. 11/2014 MDRP 1: (Jigsaw) Visual Analytics for Investigative Analysis on Text Documents; Published
Zhicheng Liu, Sham Navathe, and John Stasko, "Ploceus: Modeling, Visualizing and Analyzing Tabular Data as Networks", Information Visualization, Vol. 13, No. 1, January 2014, pp. 59-89. 01/2014 MDRP 1: (Jigsaw) Visual Analytics for Investigative Analysis on Text Documents
Youn-ah Kang and John Stasko, "Characterizing the intelligence analysis process through a longitudinal field study: Implications for visual analytics", Information Visualization, Vol. 13, No. 2, April 2014, pp. 134-158.
Jackson State University
Invited Book Chapter: Yerramilli, Sudha. “GIS in monitoring of Hurricanes and Cyclones”, Encyclopedia of Natural Hazards”, Taylor and Francis Publication (Submitted and in review, 2014) GIS Implementations; Published

Prepared for MSDH : Geospatial Resource Guide for vulnerable and At-Risk populations and Presented at MSDH state level Risk population workgroup meeting (March 2014) GIS Implementations; Published
Yerramilli, Sudha., Fonesca, Duber Gomez "Assessing Geographical Inaccessibility to Health Care: Using GIS75-87. Network Based Methods." Public Health Research (Accepted, 2014)
Dodla, Venkata B., and Sudha Yerramilli. "A Geographic Information System Model for Hurricane Track Prediction." American Journal of Geographic Information System 3.2 (2014): 75-87. GIS Implementations; Published
Yerramilli, Sudha., Fonesca, Duber Gomez "Assessing Geographical Inaccessibility to Health Care: Using GIS Network Based Methods." Public Health Research (Accepted, 2014) GIS Implementations; Published
Penn State
Pezanowski, S. and MacEachren, A. M. (2014) Symbol Reviewer Design and Features, report on Symbology Transition, submitted to DHS VACCINE Center of Excellence. 07/2014 Symbology Map Transition
Wallgrün, J.O., Karimzadeh, M., MacEachren, A.M., Hardisty, F., Pezanowski, S. and Ju, Y. 2014: Construction and First Analysis of a Corpus for the Evaluation and Training of Microblog/Twitter Geoparsers. In Purves, R. and Jones, C., editors, GIR'14: 8th ACM SIGSPATIAL Workshop on Geographic Information Retrieval, Dallas, TX: ACM. 11/2014 (GeoTxt) E2E: GeoTxt API; Published
MacEachren, A.M. 2014: Place Reference in Text as a Radial Category: A Challenge to Spatial Search, Retrieval, and Geographical. Position paper for the 2014 Specialist Meeting — Spatial Search, Santa Barbara, CA: UCSB Center for Spatial Studies. Page 48- 51 in: http://spatial.ucsb.edu/wp-content/uploads/smss2014-All_Position_Papers.pdf 02/2014(GeoTxt) E2E: GeoTxt API
Blanford JI, Bernhardt J, Savelyev A, Wong-Parodi G, Carleton AM, Titley DW, MacEachren AM. (2014) Tweeting and Tornadoes. In: 11th International ISCRAM Conference. University Park, Pennsylvania 05/2014 (GeoTxt) E2E: GeoTxt API; Published
Purdue University – Delp
Albert Parra Pozo, August 2014, “Integrated Mobile Systems Using Image Analysis With Applications In Public Safety”
Bin Zhao, December 2014, "Image Analysis Using Visual Saliency with Applications in Hazmat Sign Detection and Recognition."

J. Ribera, K. Tahboub and E. J. Delp, “Automated crowd flow estimation enhanced by crowdsourcing,” Proceedings of the IEEE National Aerospace and Electronics Conference (NAECON), Dayton, OH., 06/2014 (GARI) Gang Graffiti Recognition and Analysis; Published
B. Delgado, K. Tahboub and E. J. Delp, “Automatic detection of abnormal human events of train platforms,” Proceedings of the IEEE National Aerospace and Electronics Conference (NAECON), Dayton, OH. 06/2014 (GARI) Gang Graffiti Recognition and Analysis; Published
N. Gadgil, K. Tahboub, D. Kirsh, and E. J. Delp, "A web-based video annotation system for crowdsourcing surveillance videos," Proceedings of the IS&T/SPIE Electronic Imaging: Imaging and Multimedia Analytics in a Web and Mobile World, vol. 9027, pp. 90270A: 1-12, February 2014, San Francisco, CA. (GARI) Gang Graffiti Recognition and Analysis
Purdue University - Ebert
Sungahn Ko, Jieqiong Zhao, Jing Xia, Xiaoyu Wang, Greg Abram, Niklas Elmqvist, Shaun Kennedy, Kelly Gaither, William Tolone, William Ribarsky, and David S. Ebert. VASA: Interactive Computational Steering of Large Asynchronous Simulation Pipelines for Critical Infrastructure. IEEE Transactions on Visualization and Computer Graphics (IEEE VAST, November, 2014), 20(12), pp. 1853-1862.
Zhang, Jiawei; Chae, Junghoon; Afzal, Shehzad; Malik, Abish; Thom, Dennis; Jang, Yun; Ertl, Thomas; Matei, Sorin A.; Ebert, David S.: Visual Analytics of User Influence and Location-Based Social Networks. 12/2014 SMART: Social Media Analytics and Reporting Toolkit
Sungahnn Ko, Shehzad Afzal, Yang Yang, Junghoon Chae, Abish Malik, Yun Jang David Ebert, "Analyzing High- dimensional Multivariate Network Links with Integrated Anomaly Detection, Highlighting and Exploration", IEEE Conference on Visual Analytics Sciences and Technology, 2014 10/2014 (MERGE) Mobile Emergency Response Guide; Published
Zhan, J., Afzal, S., Chase, J., Wang, G., Thom, D., Matie, S., Elmqvist, E., Ebert, D., “Visual Analytics of User- influence based Dynamic Social Networks using Twitter Data”, IEEE Visual Analytics Science and Technology (VAST)Conference, 2014
Chae, J., Thom, D., Jang, Y., Kim, S., Ertl, T., Ebert, D., "Visual Analytics of Microblog Data for Public Behavior Response Analysis in Disaster Events", extended journal paper, Computers and Graphics, 2014.
Sungahnn Ko, Shehzad Afzal, Simon Walton, Yang Yang, Junghoon Chae, Abish Malik, Yun Jang, Min Chen and David Ebert, "Analyzing High-dimensional Multivariate

Network Links with Integrated Anomaly Detection, Highlighting and Exploration," In Proceedings of IEEE Visual Analytics Science and Technology, p83-92, 10/2014; Published
University of North Carolina at Charlotte
Jack Guest, Todd Eaglin, KR Subramanian, and William Ribarsky. Interactive Analysis and Visualization of Situationally Aware Building Evacuations. Information Visualization Journal. doi: 10.1177/1473871613516292. 01/2014 Multimedia, Social Media, Text, and Emergency Response Analytics; Published
William Tolone, Xiaoyu Wang, and William Ribarsky. Making Sense of the Operational Environment through Interactive, Exploratory Visual Analysis. NATO/OTAN Symposium on Visual Analytics. IST- 116/RSY-028. 03/2014 Multimedia, Social Media, Text, and Emergency Response Analytics; Published
William Ribarsky, Xiaoyu Wang, Wenwen Dou, and William Tolone. Towards a Visual Analytics Framework for Handling Complex Business Processes. HICSS 2014. pp. 1374 – 1383. DOI 10.1109/HICSS.2014.177. 01/2014 Multimedia, Social Media, Text, and Emergency Response Analytics; Published
Sungahn Ko, Jieqiong Zhao, Jing Xia, Xiaoyu Wang, Greg Abram, Niklas Elmqvist, Shaun Kennedy, Kelly Gaither, William Tolone, William Ribarsky, and David S. Ebert. VASA: Interactive Computational Steering of Large Asynchronous Simulation Pipelines for Critical Infrastructure. IEEE Transactions on Visualization and Computer Graphics (IEEE VAST, November, 2014), 20(12), pp. 1853-1862.
2015
Arizona State University
Visualizing the Impact of Geographical Variations on Multivariate Clustering, Y Zhang, W Luo, EA Mack, R Maciejewski, Computer Graphics Forum 35 (3), 101-110 01/2015 Geographic Network Analytics Correlations for VALET; Published
Michael Steptoe, Robert Krueger, Yifan Zhang, Xing Liang, Wei Luo, Rolando Garcia, Sagarika Kadambi, Thomas Ertl, Ross Maciejewski. VADER/VIS VAST 2015 Grand Challenge Entry. Proceedings of the IEEE Visual Analytics Science and Technology Challenge Workshop, 2015. 09/2015 Geographic Network Analytics Correlations for VALET; Published
Feng Wang, Shehzad Afzal, Paulo Shakarian, David S. Ebert, Ross Maciejewski. A Variable Edge Bandwidth for Kernel Density Estimation in Geographic Network Space, ACM SIGSPATIAL, 11/2015 WDYTYA: The Uncertainty of Identity
Florida International University

Liang Tang, Yexi Jiang, Lei Li, Chunqiu Zeng, and Tao Li, “Personalized Recommendation via Parameter-Free Contextual Bandits,” The 38th International ACM SIGIR Conference on Research and Development in Information Retrieval (SIGIR '15), pp. 323-332, 2015.
Wei Xue, Tao Li, Naphtali Rishe, “Aspect and Ratings Inference with Aspect Ratings: Supervised Generative Models for Mining Hotel Reviews” International Conference on Web Information Systems Engineering, pp. 17-31, 2015.
Mingjin Zhang, Huibo Wang, Yun Lu, Tao Li, Yudong Guang, Chang Liu, Erik Edrosa, Hongtai Li, Naphtali Rishe: TerraFly GeoCloud, “An Online Spatial Data Analysis and Visualization System.” ACM TIST 6(3): 34 (2015)
Yilin Yan, Min Chen, Mei-Ling Shyu, and Shu-Ching Chen, "Deep Learning for Imbalanced Multimedia Data Classification," IEEE International Conference on Multimedia (ISM 2015), Miami, FL, pp. 483-488, December 14-16, 2015.
Hsin-Yu Ha, Yimin Yang, Samira Pouyanfar, Haiman Tian, and Shu-Ching Chen, "Correlation-based Deep Learning for Multimedia Semantic Concept Detection," The 16th International Conference on Web Information System Engineering (WISE 2015), Miami, FL, pp. 473-487, November 1-3, 2015.
Hsin-Yu Ha, Shu-Ching Chen, and Mei-Ling Shyu, "Negative-based Sampling for Multimedia Retrieval," The 16th IEEE International Conference on Information Reuse and Integration (IRI 2015), San Francisco, USA, pp. 64-71, August 13-15, 2015.
Yimin Yang and Shu-Ching Chen, "Ensemble Learning from Imbalanced Data Set for Video Event Detection," The 16th IEEE International Conference on Information Reuse and Integration (IRI 2015), San Francisco, USA, pp. 82-89, August 13-15, 2015
Hsin-Yu Ha, Shu-Ching Chen and Min Chen, “FC-MST: Feature Correlation Maximum Spanning Tree for Multimedia Concept Classification,” Ninth IEEE International Conference on Semantic Computing (IEEE ICSC2015), Anaheim, California, USA, pp. 276-283, February 7-9, 2015
Georgia Tech
Alex Godwin and John Stasko, "Drawing Data on Maps: Sketch-Based Spatiotemporal Visualization", (Poster), IEEE Information Visualization Conference, Chicago, IL, Oct. 2015.
Penn State
Wallgrün, J.O., Karimzadeh, M., MacEachren, A.M., Pezanowski, S., Hardisty, F. GeoCorpora: Corpus and Corpus Building tools for the Evaluation and Training of Microblog/Twitter Geoparsers, 09/2015 (GeoTxt) E2E: GeoTxt API

Purdue - Delp
Chicago LTE Video Pilot Lessons Learned Test Report 10/2015 Chicago LTE Project; Published
Chicago LTE Pilot Project Final Report DHS Center For Visual Analytics for Command, Control, and Interoperability Environments (VACCINE) Video and Image Processing Laboratory (VIPER) Purdue University West Lafayette, Indiana Khalid Tahboub and Edward J. Delp Version 1.4 08/2015 Chicago LTE Project
J. Kim, A. Parra, H. Li, E. J. Delp, "Efficient Graph-Cut Tattoo Segmentation," Proceedings of the IS&T/SPIE Conference on Visual Information Processing and Communication, vol. 9410, San Francisco, 02/2015 (GARI) Gang Graffiti Recognition and Analysis; Published
B. Zhao and E. J. Delp, “Visual Saliency Models Based on Spectrum Processing,” Proceedings of the IEEE Winter Conference on Applications of Computer Vision, January 2015, Hawaii, pp. 976-981. 01/2015 (GARI) Gang Graffiti Recognition and Analysis; Published
K. Tahboub, N. Gadgil, J. Ribera, B. Delgado, and E. J. Delp, "An Intelligent Crowdsourcing System for Forensic Analysis of Surveillance Video," Proceedings of the IS&T/SPIE Conference on Video Surveillance and Transportation Imaging Applications, vol. 9407, San Francisco, 02/2015 (GARI) Gang Graffiti Recognition and Analysis; Published
J. Ribera, K. Tahboub, and E. J. Delp, "Characterizing The Uncertainty of Classification Methods and Its Impact on the Performance of Crowdsourcing," Proceedings of the IS&T/SPIE Conference on Imaging and Multimedia Analytics in a Web and Mobile World, vol. 9408, San Francisco, February 2015. 02/2015(GARI) Gang Graffiti Recognition and Analysis; Published
J. Kim, A. Parra, J. Yue, H. Li, and E. J. Delp, “Robust Local and Global Context for Tattoo Image Matching”, Proceedings of the IEEE International Conference on Image Processing, pp. 2194-2198, October 2015, Quebec, Canada, 10/2015 (GARI) Gang Graffiti Recognition and Analysis; Published
Purdue - Ebert
Zhang, J., Afzal, S., Chae, J., Wang, G., Thom, D., Matei, S., Elmqvist, E., Ebert, D., “Visual Analytics of User influence based Dynamic Social Networks using Twitter Data”, IEEE Visual Analytics Science and Technology (VAST) Conference, 10/2015, SMART: Social Media Analytics and Reporting Toolkit.
Chae, J., Cui, Y., Jang, Y., Wang, G., Malik, A., Ebert, D., “Trajectory-based Visual Analytics for Anomalous Human Movement Analysis using Social Media”, 05/2015 SMART: Social Media Analytics and Reporting Toolkit; Published
Hanye Xu; Tay, J.; Malik, A.; Afzal, S.; Ebert, D.S., "Safety in view: A public safety visual analytics tool based on CCTV camera angles of view," in Technologies for Homeland Security (HST), 2015 IEEE International Symposium on, vol., no., pp.1-6, 14-16, 04/2015 Safety in View: A Public Safety Visual Analytics Tool Based on CCTV Camera Angles of View; Published
G. Wang, A. Malik, S. Chen, S. Afzal, D. S. Ebert. A Client-based Visual Analytics Framework for Large Spatiotemporal Data under Architectural Constraints. IEEE Symposium on Large Data Analysis and Visualization. 10/2015 (VALET) Developing a spatial statistics framework in the visual analytics for law enforcement technology suite; Published
Zhao, J., Wang, G., Chae, J., Xu, H., Chen, S., Hatton, W.,& Malik, A. (2015, October). ParkAnalyzer: Characterizing the movement patterns of visitors VAST 2015 Mini-Challenge 1. InVisual Analytics Science and Technology (VAST), 2015 IEEE Conference on (pp. 179-180). IEEE.
Chae, J., Wang, G., Ahlbrand, B., Gorantla, M. B., Zhang, J., Chen, S., & Ko, S. (2015, October). Visual analytics of heterogeneous data for criminal event analysis VAST challenge 2015: Grand challenge. InVisual Analytics Science and Technology (VAST), 2015 IEEE Conference on (pp. 149-150). IEEE.
Hatton, W., Zhao, J., Gorantla, M. B., Chae, J., Ahlbrand, B., Xu, H., ... & Ko, S. (2015, October). Visual analytics for detecting communication patterns. InVisual Analytics Science and Technology (VAST), 2015 IEEE Conference on (pp. 137-138). IEEE.
Archambault, D., Bunte, K., Carreira-Perpiñán, M. Á., Ebert, D., Ertl, T., & Zupan, B. (2015). 4.2 Machine Learning Meets Visualization: A Roadmap for Scalable Data Analytics.Bridging Information Visualization with Machine Learning, 7.
University of North Carolina at Charlotte
Ning Zhou, Yi Shen, William Ribarsky, and Jianping Fan. Automatic Image-Text Alignment for Large-Scale Web Image Indexing and Retrieval. Submitted to IEEE Transactions on Pattern Analysis and Machine Intelligence. 01/2015 Multimedia, Social Media, Text, and Emergency Response Analytics; Published
Todd Eaglin, William Tolone, William Ribarsky, and Xiaoyu Wang. Mobile Ensemble Visual Analysis Architecture for Large-Scale Critical Infrastructure Simulations. Submitted to IS&T/SPIE VDA 2015. 02/2015 Multimedia, Social Media, Text, and Emergency Response Analytics; Published

Todd Eaglin, Xiaoyu Wang, and William Ribarsky. Interactive Visual Analytics in Support of Image-Encoded LIDAR Analysis. Submitted to IEEE Symposium on Large Data Analysis and Visualization (LDAV08/2015 Multimedia, Social Media, Text, and Emergency Response Analytics
Sebastian Mittelstaedt, Xiaoyu Wang, Todd Eaglin, Dennis Thom, Daniel A. Keim, Thomas Ertl, William Tolone, and William Ribarsky. An Integrated In-Situ Approach to Impacts from Natural Disasters on Critical Infrastructures. Submitted to HICSS 2015. 01/2015 Multimedia, Social Media, Text, and Emergency Response Analytics; Published
Todd Eaglin, Xiaoyu Wang, William Ribarsky, and William Tolone. Ensemble Visual Analysis Architecture with High Mobility for Large-Scale Critical Infrastructure Simulations. IS&T/SPIE VDA 2015, Vol.9397-3, pp. 1-15. 02/2015 Multimedia, Social Media, Text, and Emergency Response Analytics; Published
Wenwen Dou, Li Yu, Thomas Kraft, William Ribarsky, and Xiaoyu Wang. DemographicVis: Analyzing Demographic Information based on User Generated Content. IEEE VAST 2015. 10/2015 Multimedia, Social Media, Text, and Emergency Response Analytics; Published
“Visual Analysis of Urban Terrain Dynamics,” Thomas Butkiewicz, Remco Chang, William Ribarsky, Zachary Wartell. March 2015
Shehzad Afzal, Isaac Cho, Calvin Yau, Junghoon Chae, Sungahn Ko, Abish Malik, Kaethe Beck, William Ribarsky, and David Ebert. Anomaly Exploration and Visual Analytics of Financial Data. Submitted to IEEE VAST 2015.
2016
Florida International University
Wei Xue, Tao Li, Naphtali Rishe. Aspect Identification and ratings inference for hotel reviews. World Wide Web Journal, pp. 1-15, 2016
Georgia Tech
Kwon, Bum Chul, Kim, Hannah, Choo, Jaegul, Park, Haesun, and Endert, Alex, "AxiSketcher: Interactive Nonlinear Axis Mapping through User’s Drawing on Visualization” IEEE TVCG 2017 (to appear at IEEE VAST 2016).
Oxford University

K. L. Tam, V. Kothari, and M. Chen. An analysis of machine- and human-analytics in classification. To appear in IEEE Transactions on Visualization and Computer Graphics, 23(1), 2017. (To be presented in IEEE VIS 2016.)
Penn State
GeoCorpora: Building a Corpus to Test and Train Microblog Geoparsers (submitted) International Journal of Geographical Information Science 01/2016 (GeoTxt) E2E: GeoTxt API
“Visualizing movement statements in text with GeoTermTree,” A.M. MacEachren, I. Turton, Alex Klippel, Sen Xu. 2016
Purdue - Delp
Delgado, K. Tahboub and E. J. Delp, "Superpixels shape analysis for carried object detection,” Proceedings of the IEEE Winter Applications of Computer Vision Workshops, Lake Placid, NY, 2016, pp. 1-6.
J. Kim, L. Huffman, H. Li, J. Yue, J. Ribera, E. Delp, " Automatic and Manual Tattoo Localization,” Proceedings of the IEEE International Symposium on Technologies for Homeland Security, Waltham, MA, May 2016. 05/2016 (GARI) Gang Graffiti Recognition and Analysis; Published
J. Kim, H. Li, J, Yue, E, Delp, "Tattoo Image Retrieval for Region of Interest,"Proceedings of the IEEE International Symposium on Technologies for Homeland Security, Waltham, MA, May 2016. 05/2016 (GARI) Gang Graffiti Recognition and Analysis
"Emergency Pocket Placard: Providing Emergency Response Information via Mobile Application" Chicora Chandler, Jotham Greer, Loretta A. Moore, Jacqueline M. Jackson, Nitin Khanna, Edward J. Delp Sept. 2016
K. Thongkor, A. Parra, B. Zhao, T. Amornraksa, E. J. Delp, " Hazmat Sign Location Detection Based on Fourier Shape Descriptors," Proceedings of the IS&T International Symposium on Electronic Imaging, pp. 1-5, February 2016, San Francisco, CA. 02/2016 (MERGE) Mobile Emergency Response Guide; Published
K. Tahboub, B. Delgado, and E. J. Delp, “Person re-identification using a patch-based appearance model," Proceedings of the IEEE Conference on Image Processing, pp. 764-768, September 2016, Phoenix, AZ. (VBOLO)
Purdue – Ebert

Xia, J., Hou, Y., Chen, V., Qian, C., Ebert, D., Chen, W., “Visualizing Rank Time Series of Wikipedia Top Viewed Pages,” IEEE Computer Graphics and Applications,2016.
Zhang, J., Ahlbrand, B., Malik, A., Chae, J., Min, Z., Ko, S. and Ebert, D., “A Visual Analytics Framework for Microblog Data Analysis at Multiple Scales of Aggregation”, Computer Graphics Forum, 35: 441–450, 2016. 08/2016 SMART: Social Media Analytics and Reporting Toolkit; Published
Xia, J., Chen, W., Hou, Y., Hu, W., Huang, X., H., Ebert, D., “DimScanner: A Relation-based Visual Exploration Approach Towards Data Dimension Inspection,” IEEE Visual Analytics Science and Technology (VAST) Conference, 2016.
Y. Koh, A. Mohan, G. Wang, H. Xu, A. Malik, Y. Lu, and D. S. Ebert. Improve Safety using Public Network Cameras. IEEE Symposium on Technologies for Homeland Security 2016. Safety in View: A Public Safety Visual Analytics Tool Based on CCTV Camera Angles of View; Published
Chae, J., Zhang, J., Ko, S., Malik, A., Connell, H., Ebert, D., “Visual Analytics for Investigative Analysis of Hoax Distress Calls using Social Media”, IEEE International Conference on Technologies for Homeland Security, 2016 05/2016 SMART: Social Media Analytics and Reporting Toolkit; Published
Chae, J., Zhang, J., Jeong, S., Jang, Y., Malik, A., Ebert, D., “Forecasting the Flow of Human Crowds”, IEEE Visual Analytics Science and Technology (VAST) Conference, 2016 10/2016 SMART: Social Media Analytics and Reporting Toolkit
Ebert, D., Fisher, B., Gaither, K., “Introduction to the Minitrack on Interactive Visual Decision Analytics,” 2016 49th IEEE Hawaii International Conference on System Sciences (HICSS), 2016.
Badam, S. K., Zhao, J., Sen, S., Elmqvist, N., & Ebert, D. (2016, May). TimeFork: Interactive Prediction of Time Series. In Proceedings of the 2016 CHI Conference on Human Factors in Computing Systems (pp. 5409-5420). ACM.
Ko, S., Cho, I., Afzal, S., Yau, C., Chae, J., Malik, A., & Ebert, D. S. (2016, June). A Survey on Visual Analysis Approaches for Financial Data. In Computer Graphics Forum(Vol. 35, No. 3, pp. 599-617). 2016
University of Maryland
Applied Curriculum Integration Overview - Crisis Informatics with NodeXL 05/2016 Crisis Informatics Course Development; Published

University of North Carolina at Charlotte
“Using a Human Cognition Model in the Creation of Collaborative Knowledge Visualizations,” Tera Marie Green, William Ribarsky. Sept. 2016
“Visual Analysis of Entity Relationships in Global Terrorism Database,” Alex Godwin, Remco Chang, Robert Kosara, William Ribarsky. Oct. 2016
“Understanding Information Visualization in the Context of Visual Communication,” Caroline Ziemkiewicz, Robert Kosara. Sept. 2016
Ribarsky, W. & Fisher, B. (2016) The Human-Computer System: Towards an Operational Model for Problem Solving (paper) Proceedings of the 49th Annual Hawaii International Conference on System Sciences. IEEE Digital Library
University of Washington
“Preparing for Disasters: Medical Supply Location and Distribution,” Huseyin Onur Mete, Zelda B. Zabinsky. Sept. 2016
2017
Georgia Tech
Alex Godwin and John Stasko, “HotSketch: Drawing Police Patrol Routes among Spatiotemporal Crime Hotspots”, submitted to the Hawaii International Conference on System Sciences, January 2017.
Penn State
“Synthesizing Results in Geovisualization,” Anthony C. Robinson; Proceedings of the 23rd International Cartographic Conference, Moscow, Russia.
“Research to Reality: Supporting Public Health Research, Surveillance, and Practice with Geovisual Analytics,” F. Hardisty, A. MacEachren; The Third Annual DHS University Network Summit, Washington D.C.
“Individual differences in the conceptualization of movement patterns,” A. Klippel, C. Weaver, F. Hardisty.
Purdue – Delp

K. Tahboub, A. R. Reibman, and E. J. Delp, "Accuracy prediction for pedestrian detection," To appear, Proceedings of the IEEE International Conference on Image Processing, September 2017, Beijing, China. (VBOLO)
K. Tahboub, D. Guera, A. R. Reibman, and E. J. Delp, "Quality-adaptive deep learning for pedestrian detection," To appear, Proceedings of the IEEE International Conference on Image Processing, September 2017, Beijing, China (VBOLO)
J. Kim, K. Tahboub and E. J. Delp, “Spatial Pyramid Alignment For Sparse Coding Based Object Classification,” To appear, Proceedings of the IEEE International Conference on Image Processing, September 2017, Beijing, China (GARI) Gang Graffiti Recognition and Analysis
Purdue – Ebert
“Contextualizing Syndromic Hotspots—A Visual Analytics Approach,” Ross Maciejewski, Stephen Rudolph, George Tebbetts, David S. Ebert.
Ebert, D., Fisher, B., Hagen,H., Shneiderman, B. & Ynnerman, A. (2017) Apply or Die: On the Role and Assessment of Application Papers in Visualization. IEEE Computer Graphics & Applications. May/June.
J. Zhang, A. Malik, B. Ahlbrand, N. Elmqvist, R. Maciejewski, D. S. Ebert. TopoGroups: Context-Preserving Visual Illustration of Multi-Scale Spatial Aggregates. In Proceedings of the ACM Conference on Human Factors in Computing Systems, pp. 2940–2951, 2017.
Simon Fraser University
Weber, G.H.. & Fisher, B. (2016) Application Papers: What are they and how should they be evaluated? IEEE VIS Panel. IEEE VIS 2016, Baltimore MD.
Gadiraju, U. Möller, S. Nöllenburg, M, Saupe, D. Egger, S., Archambault, D, Fisher, B.(in press) Crowdsourcing Versus the Laboratory: Towards Human-centered Experiments Using the Crowd. in Crowdsourcing and Human-Centred Experiments. Archambault, D. Hoßfeld, T. & Purchase, H. Eds. Springer LNCS
Edwards, D.J., Kaastra, L.T. Fisher, B., Chang, R. & Chen, M. (in press) Cognitive Information Theories of Psychology and Applications with Visualization and HCI through Crowdsourcing Platform. in Crowdsourcing and Human-Centred Experiments. Archambault, D. Hoßfeld, T. & Purchase, H. Eds. Springer LNCS
University of Houston – Downtown

Secrets of Software Development and Project Management: Success or Failure P. Chen, W. Ding, M. Choly*, C. Bowes*, “Word Sense Disambiguation with Automatically Acquired Knowledge “, to appear in IEEE Intelligent System.
"Visual Analytics for Effective Interdisciplinary Collaboration" Richard A. Aló, Erin Hodgess, Hooman Hemmati, Duber Gomez-Fonseca, Sarah Jennisca, Lilian Antunes, Tia Pilaroscia
University of North Carolina at Charlotte
Todd Eaglin, William Ribarsky, and Isaac Cho. Space-Time Kernel Density Estimation for Real-Time Interactive Visual Analytics. Submitted to Hawaii International Conference on Systems Science (HICSS 2017).
Isaac Cho, Wenwen Dou, and William Ribarsky. CrystalBall: A Visual Analytic System for Future Event Discovery and Analysis from Social Media Data. Submitted to IEEE Trans. on Visualization and Computer Graphics.
Alex Endert, William Ribarsky, Cagatay Turkay, Ignacio Blanco, and Fabrice Rossi. The State of the Art in Coupling Machine Learning with Visual Analytics. Submitted to Computer Graphics Forum.

Example Commercialization Plans
tbescher
Typewritten Text
tbescher
Typewritten Text
Addendum - Example Commercialization Plans


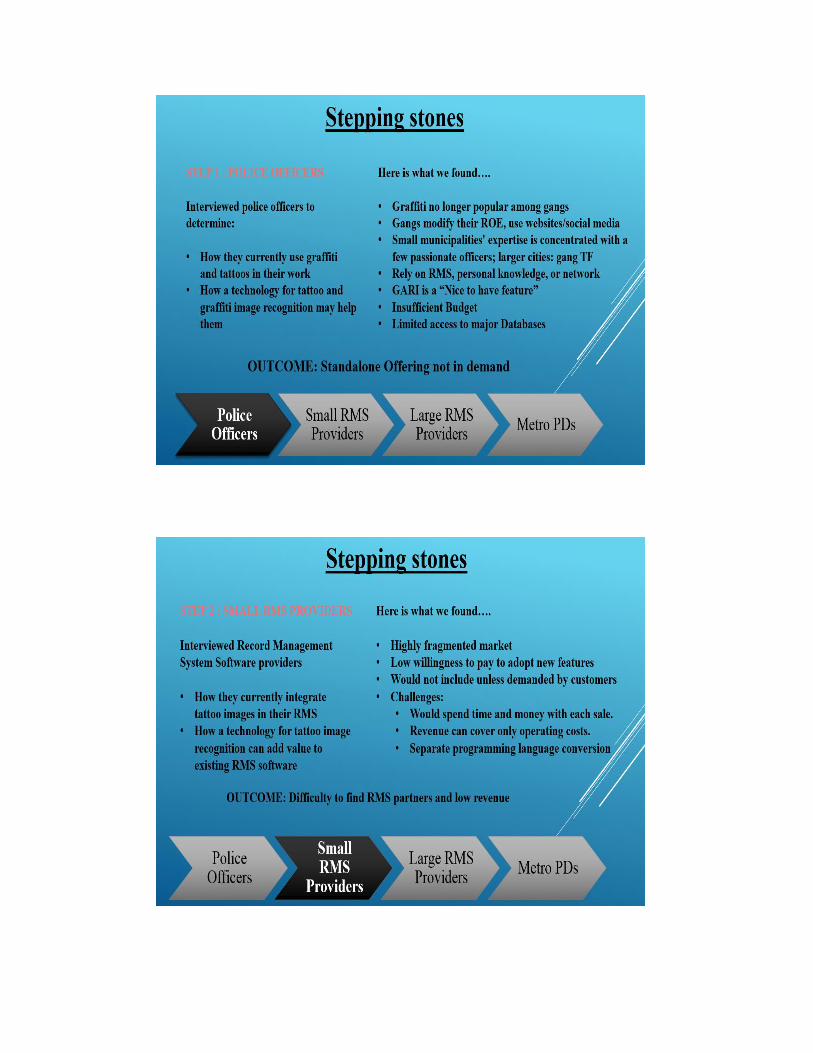
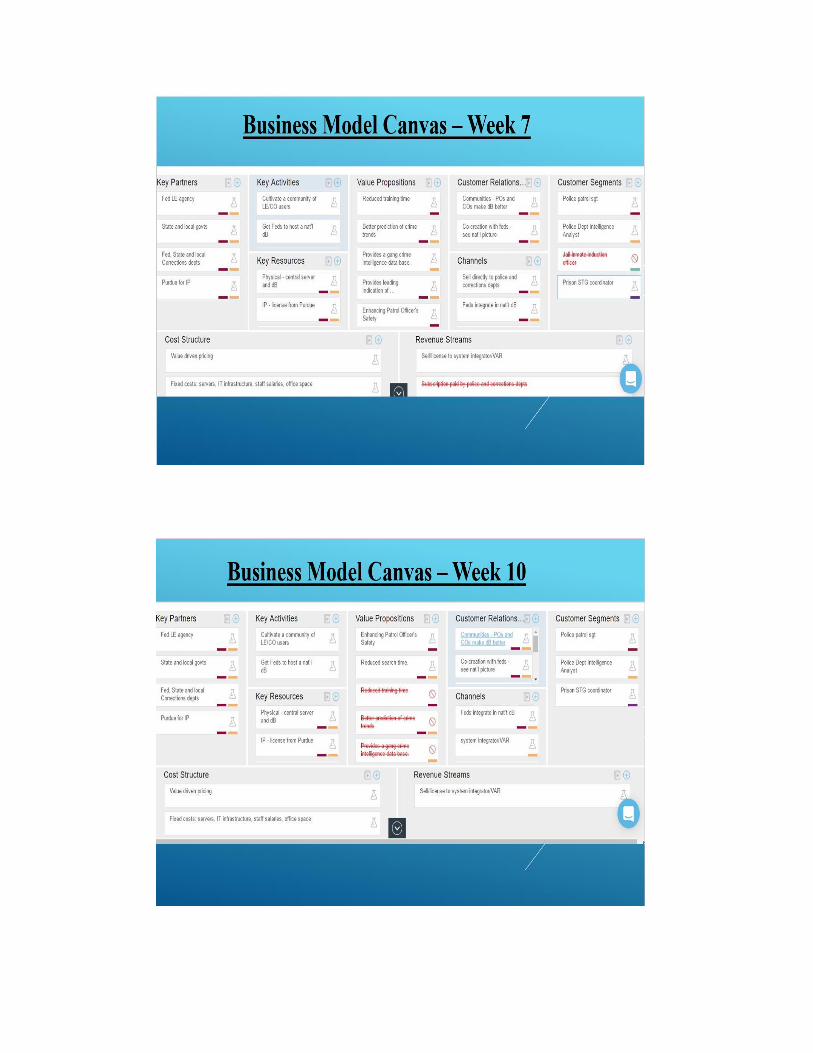


August 2017
Co-operative Agreement Close-out
Report Overview
David S. Ebert
tbescher
Typewritten Text
Addendum - Co-Operative Agreement Closeout Presentation
tbescher
Typewritten Text
tbescher
Typewritten Text
tbescher
Typewritten Text

August 2017
Overview
• History
• Executive Summary
• Key Successes
• Research
• Tools
• Education
• Recommendations and Lessons Learned
• Summary
2

August 2017
CVADA-VACCINE History
Mission Statement: Explore and implement new science and
technology to identify, analyze, and understand massive amounts of complex
and dynamic information; disseminate, share, and secure such information in
support of real-time decision-making by the homeland security enterprise
History:• Established 2009
• Incorporates prior work under RVACS and IDS-UACs
Co-Leads:• Purdue University – Visual Analytics for Command, Control
and Interoperability Environments (VACCINE)
• Rutgers University – Command, Control and Interoperability
Center for Advanced Data Analysis (CCICADA)
3

August 2017
Why was CVADA-VACCINE Established? -
Importance to Homeland Security
Problem: To solve today’s and tomorrow’s homeland
security problems requires exploring, analyzing, and
reasoning with massive, multi-source, multi-scale,
heterogeneous, streaming data –BIG DATA
• Cuts across entire spectrum of DHS needs
We provide tools to enable end users to get the
relevant information they need during any situation
and in the time to make a decision or take action

August 2017
Executive Summary – Impact of VACCINE
• Developed 33 tools; some used at
significant national events.
• 2nd place in national competition - GARI
• Funded > 350 students
• Produced > 1000 papers
• 14 Patents awarded
• Grant value > $25,000,000
• More than 4000 students trained in VA
• Start-up company launched
• Only COE with a USCG accredited tool
5
Overview
Video

August 2017
Key Successes: Research
• Provided Intellectual Leadership for VA
field
• 300 peer reviewed journal articles, 325 conference
publications and presentations, 40+ graduate theses,
34+ research projects
• Led Efforts to Expand Inclusiveness
• MSIs/HBCUs
• Expanded International Partnerships
• Created tools and conducted research
6
Link to
SuccessVis

August 2017
Key Successes: Tools
• VALET
• Licensed to DAVISTA
• Deployed to several law enforcement agencies
• GARI
• Finished 2nd in the NIST/FBI TATT-C Challenge
• Used by multiple law enforcement agencies
• vBOLO
• Piloted successfully at the Cleveland Rapid
Transit Authority
• JIGSAW
• Approximately 7,000 downloads
7
Public Safety
Video

August 2017
Key Successes: Tools
• cgSARVA
• Rescource allocation tools for USCG saved
millions
• Only DHS COE tool accredited for use by USCG
• MADIS
• Tested and used by Miami-Dade Department of
Emergency Management
• LAHVA
• Advanced detection capabilities for adverse
chemical and biological occurrences in the
general populace
• FAVA
• Designed to explore financial datasets and
identify potential anomalies
8
Response
Planning Video

August 2017
Key Successes: Tools
• SMART• Licensed to DAVISTA
• Used at Republican National
Convention
• Deployed at Presidential
Inauguration 2017
9
An example screenshot of the SMART software suite displaying social media feeds during Hurricane Sandy.

August 2017
Key Successes: Education
> 4000 students impacted
• Enabled student research
• 40+ SURF VACCINE students since 2007
• 250+ VACCINE student research assistants
• Funded education in HSE disciplines
• 22 total HS-STEM recipients
• 30+ MSI Undergrad participants since 2011
• Enhanced VA knowledge of university faculty
• 90+ MSI faculty VA workshop participants since 2013
• 31+ related curriculum developed by VACCINE universities
• Developed pathways to reach working professionals
• With VACCINE partner, AMU, 500+ participants participated in webinar series since
2015
• Outreach to next generation of VA students
• 200+ students from Lafayette Jefferson HS were participants in K-12 outreach program
10
Education
Video
2016 SURF Students

August 2017
Key Lessons Learned and Recommendations
• The uncertainty of funding leads to
project delays and retention issues
• COE leadership meetings result in
greater collaboration
• Combining projects from disparate
proposals reduces cohesion
• Continue project competitions
• Encourage the use of Public Safety
forums
• Use of webinars is an effective tool to
reach a broad range of HSE personnel
• User centered approach was successful
• Low profit margins present a challenge
to commercialization.
11
Hands-on training in the VACCINE lab
2016 Annual Meeting

August 2017
Summary
• Take some notes from the Impact Report
• VACCINE was a pioneer in VA for eight (8) years.
• More than 75 faculty partners from 38 institutions
• Hundreds of peer reviewed journal articles
• Created tools that made an impact on end-users
effectiveness
• New role as an Emeritus COE
• Funded projects through task orders
• CINA - video analytics
12