Using SGPs to Measure Student Growth: Context, Characteristics, and Cautions New Requirements for...
18
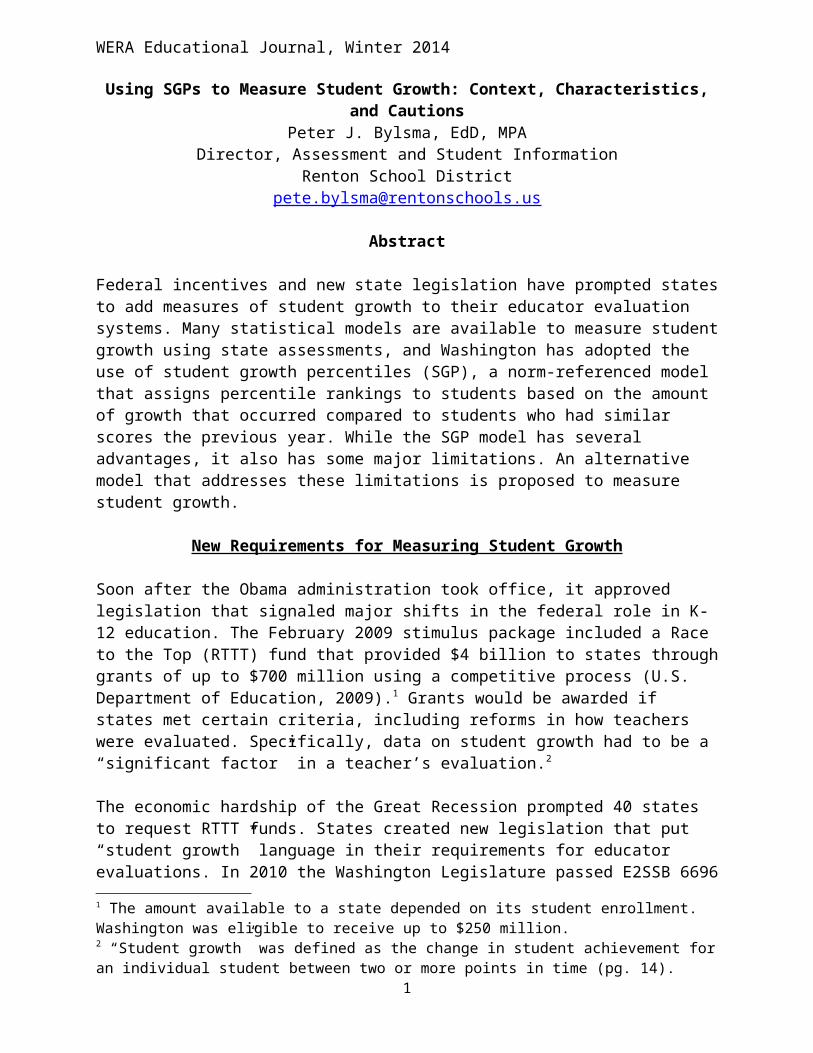
WERA Educational Journal, Winter 2014 Using SGPs to Measure Student Growth: Context, Characteristics, and Cautions Peter J. Bylsma, EdD, MPA Director, Assessment and Student Information Renton School District [email protected] Abstract Federal incentives and new state legislation have prompted states to add measures of student growth to their educator evaluation systems. Many statistical models are available to measure student growth using state assessments, and Washington has adopted the use of student growth percentiles (SGP), a norm-referenced model that assigns percentile rankings to students based on the amount of growth that occurred compared to students who had similar scores the previous year. While the SGP model has several advantages, it also has some major limitations. An alternative model that addresses these limitations is proposed to measure student growth. New Requirements for Measuring Student Growth Soon after the Obama administration took office, it approved legislation that signaled major shifts in the federal role in K- 12 education. The February 2009 stimulus package included a Race to the Top (RTTT) fund that provided $4 billion to states through grants of up to $700 million using a competitive process (U.S. Department of Education, 2009). 1 Grants would be awarded if states met certain criteria, including reforms in how teachers were evaluated. Specifically, data on student growth had to be a “significant factor” in a teacher’s evaluation. 2 The economic hardship of the Great Recession prompted 40 states to request RTTT funds. States created new legislation that put “student growth” language in their requirements for educator evaluations. In 2010 the Washington Legislature passed E2SSB 6696 1 The amount available to a state depended on its student enrollment. Washington was eligible to receive up to $250 million. 2 “Student growth” was defined as the change in student achievement for an individual student between two or more points in time (pg. 14). 1
-
Upload
independent -
Category
Documents
-
view
3 -
download
0
Transcript of Using SGPs to Measure Student Growth: Context, Characteristics, and Cautions New Requirements for...
WERA Educational Journal, Winter 2014
Using SGPs to Measure Student Growth: Context, Characteristics,and Cautions
Peter J. Bylsma, EdD, MPADirector, Assessment and Student Information
Renton School [email protected]
Abstract
Federal incentives and new state legislation have prompted statesto add measures of student growth to their educator evaluation systems. Many statistical models are available to measure studentgrowth using state assessments, and Washington has adopted the use of student growth percentiles (SGP), a norm-referenced model that assigns percentile rankings to students based on the amount of growth that occurred compared to students who had similar scores the previous year. While the SGP model has several advantages, it also has some major limitations. An alternative model that addresses these limitations is proposed to measure student growth.
New Requirements for Measuring Student Growth
Soon after the Obama administration took office, it approved legislation that signaled major shifts in the federal role in K-12 education. The February 2009 stimulus package included a Race to the Top (RTTT) fund that provided $4 billion to states throughgrants of up to $700 million using a competitive process (U.S. Department of Education, 2009).1 Grants would be awarded if states met certain criteria, including reforms in how teachers were evaluated. Specifically, data on student growth had to be a “significant factor” in a teacher’s evaluation.2
The economic hardship of the Great Recession prompted 40 states to request RTTT funds. States created new legislation that put “student growth” language in their requirements for educator evaluations. In 2010 the Washington Legislature passed E2SSB 66961 The amount available to a state depended on its student enrollment. Washington was eligible to receive up to $250 million.2 “Student growth” was defined as the change in student achievement foran individual student between two or more points in time (pg. 14).
1

WERA Educational Journal, Winter 2014
which created the Teacher and Principal Evaluation Project (TPEP).3 Washington’s application for RTTT funds was not approved, but the change in how educators are evaluated gained momentum nationwide.
The role of student growth data in the educator evaluation process got another boost in 2011 when the Obama administration decided to grant waivers to the No Child Left Behind Act (NCLB) accountability requirements. Despite “almost universal frustration” with NCLB, Congress had not reauthorized the Elementary and Secondary Education Act (ESEA) after it expired in2007, so NCLB rules continued as the federal accountability system (OSPI, 2012). Waivers allowed states to have more flexibility in the use of Title I funds and changed the NCLB sanctions. States could get a waiver if their revised accountability system met certain criteria, including how studentgrowth was included in school and educator evaluation systems.
Washington was one of 42 states approved for this ESEA flexibility, and a new set of accountability metrics—Annual Measurable Objectives (AMOs)—replaced the Adequate Yearly Progress (AYP) system starting with state test results from spring 2012. However, Washington’s waiver was only approved for two years (2011-12 and 2012-13). To get a permanent waiver, the state needs to (1) refine its accountability index to meet new federal requirements, and (2) adopt a method for “including student growth as a significant factor in its teacher and principal evaluation and support systems” and “ensure that student growth be a factor in ‘focused evaluations’ …” (Duncan, 2012, emphasis added). Washington’s Office of Superintendent of Public Instruction (OSPI) was required to amend its waiver request to meet these requirements. Secretary of Education Duncan’s letter to OSPI said:
If Washington’s amended request … fails to demonstrate that its final method for determining a teacher or principal’s summative evaluation rating includes student growth as a significant factor,fails to demonstrate that it has secured the necessary legislativechange to require that focused evaluations include student growth,
3 Additional legislation, Engrossed Senate Substitute Bill (ESSB) 5895,was signed in spring 2012 and added specificity to the statutes in E2SSB 6696.
2
WERA Educational Journal, Winter 2014
… the waivers being granted to Washington through ESEA flexibilitywill expire at the end of the 2012–2013 school year, and Washington and its districts will be required to immediately resume complying with all ESEA requirements.
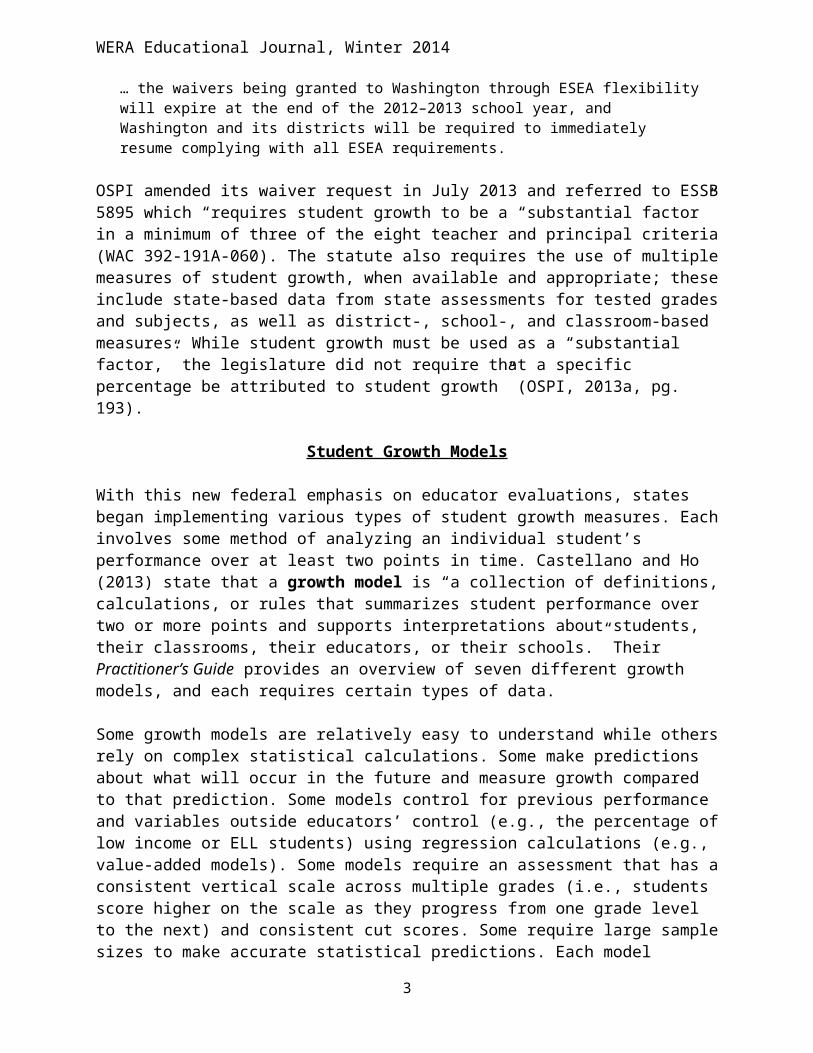
OSPI amended its waiver request in July 2013 and referred to ESSB5895 which “requires student growth to be a “substantial factor” in a minimum of three of the eight teacher and principal criteria(WAC 392-191A-060). The statute also requires the use of multiplemeasures of student growth, when available and appropriate; theseinclude state-based data from state assessments for tested gradesand subjects, as well as district-, school-, and classroom-based measures. While student growth must be used as a “substantial factor,” the legislature did not require that a specific percentage be attributed to student growth” (OSPI, 2013a, pg. 193).
Student Growth Models
With this new federal emphasis on educator evaluations, states began implementing various types of student growth measures. Eachinvolves some method of analyzing an individual student’s performance over at least two points in time. Castellano and Ho (2013) state that a growth model is “a collection of definitions,calculations, or rules that summarizes student performance over two or more points and supports interpretations about students, their classrooms, their educators, or their schools.” Their Practitioner’s Guide provides an overview of seven different growth models, and each requires certain types of data.
Some growth models are relatively easy to understand while othersrely on complex statistical calculations. Some make predictions about what will occur in the future and measure growth compared to that prediction. Some models control for previous performance and variables outside educators’ control (e.g., the percentage oflow income or ELL students) using regression calculations (e.g., value-added models). Some models require an assessment that has aconsistent vertical scale across multiple grades (i.e., students score higher on the scale as they progress from one grade level to the next) and consistent cut scores. Some require large samplesizes to make accurate statistical predictions. Each model
3
WERA Educational Journal, Winter 2014
requires further subjective judgments about what level of growth is acceptable or adequate. Finally, individual results are usually combined to provide group-level results (e.g., classroom,grade, school, district, student subgroup).
Measuring student growth is not easy. Besides having a statistical model, creating an accurate growth measure assumes that the material taught to students is aligned with the assessment and the assessment can capture a wide range of studentskills and abilities. If students are taught material that is notassessed or only grade-level content, then the growth measure maynot be precise. State summative assessments usually do not cover material above grade level or much content below grade level. Since some students already perform well above grade level and others are not ready to learn grade-level material, grade-level assessments will not provide accurate measures of student growth,regardless of the growth model chosen.
The lack of a comprehensive statewide system to assess growth of students in all grades in all content areas also complicates measures of student growth. For the vast majority of teachers, there are no state standardized assessment data available to measure progress. NCLB required annual testing in reading and mathematics in grades 3-8 and once in high school, so there are no student growth data for students in grades K-3 or in the othersubjects at any grade. High school students are assessed in reading only in grade 10, so there are no growth data for students in grades 9, 11, or 12. States have developed many otherways to measure student growth when state assessment results are not available.
The Student Growth Percentile (SGP) Model
Washington has identified one growth model—student growth percentiles (SGP)—as the tool to measure student growth. The SGP model is sometimes called the “Colorado Growth Model” because it was initially developed for Colorado (Betebenner, 2009a, 2009b). The state has proposed using SGPs in two main ways, school accountability and teacher evaluation.1. OSPI and State Board of Education decided to use SGP as the
model to meet the federal accountability requirements of the 4

WERA Educational Journal, Winter 2014
NCLB waiver application. SGPs are now part of the revised Achievement Index.
2. The state’s waiver request said that “beginning in the 2014–15school year, OSPI will make available Student Growth Percentiles (SGPs) for students who have taken the state assessment …. OSPI will provide guidance to districts on attribution policies and practices during the 2013–14 school year, so (districts) may use these data in their evaluation systems in the 2014–15 school year and beyond” (OSPI, 2013a, pg. 194). OSPI’s December 2013 press release said, “Districts may eventually use SGPs as one component of teacher evaluations. With the transition to new assessments in 2014–15, OSPI recommends waiting until 2016–17 before incorporatingSGPs into teacher evaluations” (OSPI, 2013d, emphasis added).
Confidential SGP results from school years 2010-11 and 2011-12 were reported to districts in March 2013. The public release of school and district SGPs from 2012-13 occurred in December 2013, a year earlier than noted in the waiver request (OSPI, 2013b). Individual student reports in PDF format are available to districts to print for optional distribution to parents.
Characteristics of the SGP Model
SGPs are normative rankings of the amount of growth attained by students who had the same or similar scale score in the previous year (their achievement peers). While the specific method to calculate SGPs is complex,4 “simplistically, SGPs describe the relative location of a student’s current score compared to the current scores of students with similar score histories… For example, a student earning an SGP of 80 performed as well or better than 80 percent of her academic peers” (Castellano & Ho, 2013, pg. 89). The score does not control for a student’s demographic characteristics (e.g., race/ethnicity, gender, incomelevel) or program involvement (e.g., special education or Englishlanguage learner).4 The SGP model relies on a statistical tool called “quantile regression” and does not actually divide students into groups with an identical previous score. See Chapter 6 of Castellano & Ho’s Practitioner’sGuide for a more complete explanation of the calculations used in the SGP model.
5

WERA Educational Journal, Winter 2014
Another part of the SGP model is the “percentile growth trajectory” that predicts how a student will perform in the future, assuming a student maintains their previous percentile rank in the future. It does not assume linear growth like other trajectory growth models, and predictions for 2 or more years “borrow” information from “nearby peers” (an “academic neighborhood”) to compensate for a decreasing sample size of the actual academic peers (Castellano & Ho, 2013).
Washington computes SGPs only when there are at least two data points in a content area in consecutive years5 and only for reading/English Language Arts and math. The state then divides all students into three groups to define the level of growth attained:6
High Growth Top third 67th to 99th percentileTypical Growth Middle third 34th to 66th
percentileLow Growth Bottom third 1st to 33rd percentile
One advantage of a SGP measure is that the model does not requirean assessment system to have a vertical scale (grade level test scales that combine to have a consistent “yardstick” that increases in equal increments as students progress from one gradelevel to the next) or be vertically aligned (having cut scores ofthe same difficulty from grade to grade). When the challenge of meeting standard on an assessment is not the same from one grade to another, or when content standards change and the assessment is adjusted, scale scores can shift, sometimes dramatically.7 Butany set of data points can be ranked and given percentiles.
Another advantage of using SGPs is that educators and parents arefamiliar with the idea of percentiles. The “normal” or bell-shaped curve is understood as a typical distribution of a population, and percentile ranks accompany this curve. We 5 SGPs are calculated for 10th graders based on MSP results in grade 8, a 2-year period, because there is no assessment in grade 9.6 Colorado uses the same labels and almost identical cut scores7 When graduation requirements include passing a high school exam, the score needed to pass is often lower in difficulty than the score needed to pass a test in an earlier grade.
6

WERA Educational Journal, Winter 2014
understand, for example, that when a child is in the 95th percentile of height or weight, they are in the top 5 percent of all children of the same age. Percentiles can be generated based on local, state, and national data, and they give a sense of whatis “average” or “normal” (50th percentile) for a given population.Although the state moved to a criterion-referenced assessment system after education reform legislation passed in 1993 (Butts, 2007), districts often use norm-referenced tests to identify students for program or school eligibility (e.g., gifted, specialeducation, college entry). Knowing how students compare to each other is helpful for other reasons as well (e.g., differentiatinginstruction, identifying at-risk students/RTI, creating urgency when a student is “behind” his/her peers).
SGPs can be “averaged” across a classroom, grade, school, and district to provide an overall snapshot of a group’s growth. In Washington, the “median growth percentile” is computed and reflects the middle score in a set of SGPs. The median SGP is nowthe proposed measure of growth in the state’s revised AchievementIndex.
7
WERA Educational Journal, Winter 2014
Limitations of the SGP Model
The SGP growth model has a number of limitations. It uses a specific type of norm-referenced measure that can be misleading, does not measure adequate growth toward a desired goal, does not provide timely or useful results, may not produce valid results, and is a new measure that can be difficult to understand. Each ofthese limitations is discussed below.
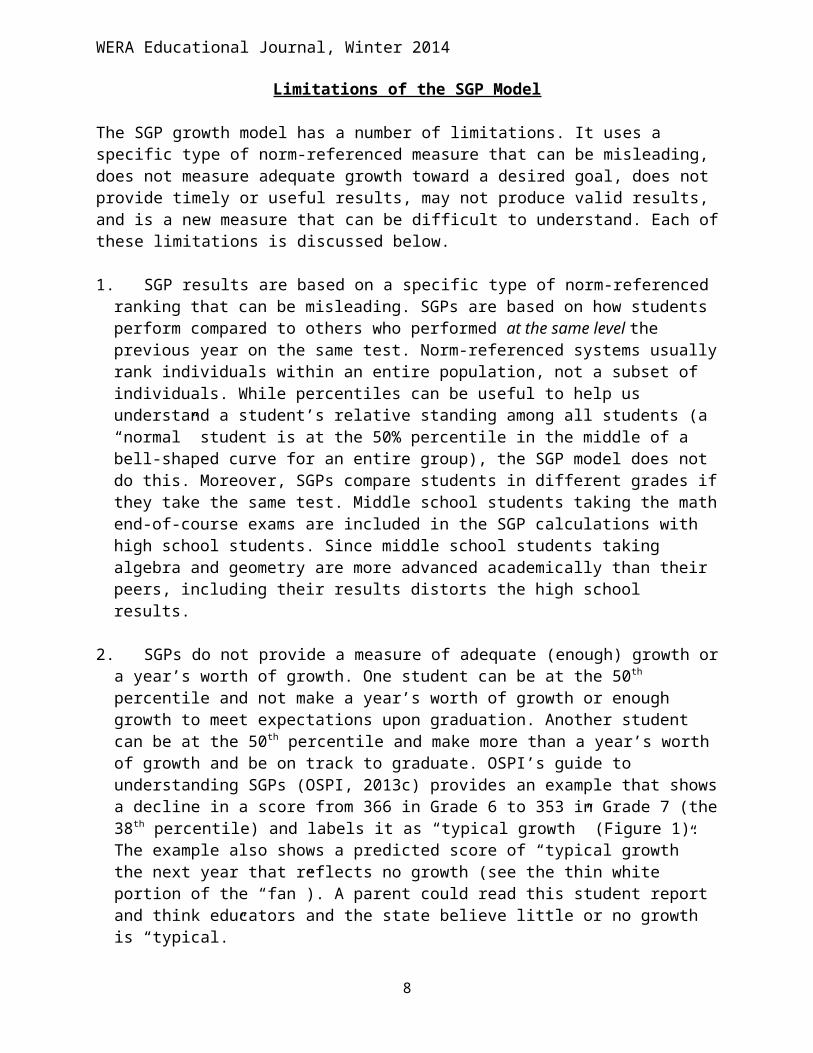
1. SGP results are based on a specific type of norm-referenced ranking that can be misleading. SGPs are based on how students perform compared to others who performed at the same level the previous year on the same test. Norm-referenced systems usuallyrank individuals within an entire population, not a subset of individuals. While percentiles can be useful to help us understand a student’s relative standing among all students (a “normal” student is at the 50% percentile in the middle of a bell-shaped curve for an entire group), the SGP model does not do this. Moreover, SGPs compare students in different grades ifthey take the same test. Middle school students taking the mathend-of-course exams are included in the SGP calculations with high school students. Since middle school students taking algebra and geometry are more advanced academically than their peers, including their results distorts the high school results.
2. SGPs do not provide a measure of adequate (enough) growth ora year’s worth of growth. One student can be at the 50th percentile and not make a year’s worth of growth or enough growth to meet expectations upon graduation. Another student can be at the 50th percentile and make more than a year’s worth of growth and be on track to graduate. OSPI’s guide to understanding SGPs (OSPI, 2013c) provides an example that showsa decline in a score from 366 in Grade 6 to 353 in Grade 7 (the38th percentile) and labels it as “typical growth” (Figure 1). The example also shows a predicted score of “typical growth” the next year that reflects no growth (see the thin white portion of the “fan”). A parent could read this student report and think educators and the state believe little or no growth is “typical.”
8

WERA Educational Journal, Winter 2014
Figure 1: Guide to Understanding a Student Growth Percentile Report (OSPI, 2013c)
Confusing labels also occur for students with high scores. Figure2 shows the results for a student scoring in Level 4 (Advanced) in both years but with a much lower score the second year. However, the SGP of 80 was labeled High growth. Again, a parent will likely be confused by this label when a lower score occurs.
Figure 2: Student Report of Growth
9
WERA Educational Journal, Winter 2014
The above two issues are illustrated in the following hypothetical scenario. Imagine a group of seven students that must travel 10 miles in 10 days. Figure 3 shows how far the students traveled. Two sets of students are compared to each other because they had the same starting point after traveling five days. This is the type of norm-referenced system used in theSGP calculation—students are compared to others who are at the same point in their journey (peers), not how far they have progressed or how fast they need to go to get to their destination.
10

WERA Educational Journal, Winter 2014
Figure 3
1
0.9
1
0.7
1.25
1.2
1
1
0.9
1
0.8
1.25
1.1
1.2
1
0.9
0.9
0.9
1.25
1
1.3
1
0.9
0.8
1
1.25
0.9
1.35
1
0.9
0.8
1.1
1.25
0.75
1.4
1
0.9
0.8
1.1
1.25
0.75
1.35
1
0.9
0.8
1.1
1.25
0.75
1.3
1
0.9
0.8
1.1
1.25
0.75
1.1
1
0.9
0.8
1.1
0.75
1
0.9
0.8
1.1
0.75
0 1 2 3 4 5 6 7 8 9 10
Alice
Brian
Carlos
David
Eddie
Fiona
George
M iles Traveled
Start Day 1 Day 2 Day 3 Day 4 Day 5 Day 6 Day 7 Day 8 Day 9 Day 10
Alice is a normal student (50th percentile) and travels 1 mile a day, ending the trip in 10 days.
Brian, Carlos, and David all had traveled 4.5 miles in 5 days, which is not fast enough to make the destination in 10 days. They are compared to each other the next day because they all had traveled the same distance in 5 days. On day 6:
Brian is at the 50th percentile but is not traveling fast enough to finish in 10 days.
Carlos did not travel as far as Brian and is at the 30th percentile.
David travels faster than Brian and finishes in 10 days. He is at the 70th percentile.
Eddie, Fiona, and George all traveled 6.25 miles in 5 days, so they are compared to each other. On day 6:
Eddie is at the 50th percentile. Fiona started with a 1.3 mile advantage but made slower progress. Her travel rate from day 5 to 6 puts her at the 30th percentile.
11
50th
70th
70th
50th
30th
30th

WERA Educational Journal, Winter 2014
George starts to slow down but his rate from day 5 to 6 is still faster than Eddie, so he is at the 70th percentile.
Alice, Brian and Eddie are all at the 50th percentile, even though the distance traveled on day 6 is not the same. Brian willnot make the destination in time and Eddie will make it two days early. Similarly, Carlos and Fiona are both at the 30th percentile level but their travel rates and destination times aredifferent; David and George are both at the 70th percentile levelbut their travel rates and destination times are different. Percentile information in this scenario provides no insights about whether a student will reach the final destination. In fact, the percentile information can mislead a person to believe their rate of speed is enough to finish on time.
3. SGP results may not be valid. SGPs are “highly unstable” and“problematic” for students with very high and low scores because there are relatively few students with those scores to obtain stable rankings (Castellano & Ho, 2013), and there are no standard errors reported for SGPs. Baker and Oluwole (2013) raise serious concerns about the use of SGPs for teacher evaluations because there are no controls for differences in the student population. These issues could produce inaccurate measures of educator effectiveness. Moreover, the widespread use of Smarter Balanced field tests in spring 2014 instead of the state’s Measure of Student Progress (MSP) may limit the validity of SGPs because the schools participating in the fieldtest were not selected randomly. OSPI reported that about 33% of Washington students in grades 3-8 are participating in the field test. The schools serving these students will have no MSPdata that are used to compute SGPs, and the sample size for computing SGPs will decrease significantly.
4. Schools and districts cannot access SGP data in a timely anduseful way. A statewide norm-referenced system requires data for all students, and the suggested minimum sample size needed to calculate accurate SGP results is 5,000 students (Castellano& Ho, 2013). Since districts do not have access to student-level results statewide, they cannot compute SGP results on their own. Instead, the state must compute and report the results. This takes considerable time. In 2013 OSPI published
12

WERA Educational Journal, Winter 2014
school and district SGP results in December, more than three months after school began. The same type of time lag applied tothe availability of individual student results. This long time lag limits the usefulness of the data.
5. Finally, SGPs use a measure of growth that is new to Washington which makes it more difficult to grasp than a model that uses existing, more familiar metrics. During the State Board’s discussions about how to measure student growth, the explanation of SGPs used Colorado examples that were not adapted to Washington’s assessment system. As a result, the stakeholders providing advice to the Board had a hard time understanding how the system worked. Efforts to explain the model have relied on simple analogies that do not fully explainthe results and limitations of the model.
An Alternative Approach to Measure Student Growth
Given the above limitations, an alternative criterion-referenced approach for measuring student growth is available for educator use if state assessment results must be used for educator and school accountability. This alternative method has three main advantages over the norm-referenced SGP approach.
It can be computed quickly and easily for a class, grade, school, or district because it does not require a minimum number of students and it does not depend on how other students perform (students are compared to their own growth, not the growth rate of others).
It uses familiar data and concepts which make the model intuitive and easy to understand.
It encourages cooperation among educators because the measuredoes not depend on how other students perform (there is less incentive to compete to achieve better rankings).
The alternative is illustrated below in Figure 4. In this example, actual data are shown for all students in a district with grade 3 results in 2012 and grade 4 results in 2013. Each dot represents a student (or cluster of students). The scale score for 2013 is shown on the Y-axis (similar to the SGP graph), and the change in scale score from the previous year is shown on the X-axis (2013 MSP score – 2012 MSP score). Adjustments are made for
13

WERA Educational Journal, Winter 2014
students with extreme scale scores that have large standard errors (below 300 and above 500) to reduce inaccuracies in the change scores. This approach puts students in one of four quadrants (Leading, Slipping, Lagging, Gaining) based on their achievement and change in their own score (scores of other students do not affect the results). Students with the same scalescore in both years are assumed to have made a year’s worth of growth (no change on the X-axis). Students with a higher scale score in 2013 (positive change on the X-axis) made more than a year’s worth of growth. In this example, the average scale score improved 6.5 points and 56% of the students made a least one yearof academic growth. (OSPI reported the median SGP was the 50th percentile.)Figure 4
Separate analyses can be computed for each subgroup and compared to each other. In addition, it is relatively easy to determine how fast a student must grow to meet standard in future years. And it doesn’t matter how other students perform – students are compared to themselves and what they need to achieve based on
14

WERA Educational Journal, Winter 2014
fixed criteria. A rating scale for school accountability and educator evaluations can be created based on the percentage of students making at least a year of growth (e.g., less than 30% could be “unsatisfactory”, more than 70% could be “distinguished”).
A limitation of this approach is that the proficiency cut scores vary slightly from grade to grade and there is no vertical scale to measure absolute growth. It is harder to meet standard in somegrades compared to others (like having an easy teacher one year and a hard teacher the next). The lack of a vertical scale and vertical alignment is the major reason given for using SGPs as the state’s measure of student growth. However, cut scores for passing the state reading and math assessments are roughly equivalent in difficulty in grades 3-8, and a scale score of 400 means a student met standard each year, implying a student with that score each year experienced a year’s worth of growth.8 As Table 1 shows, the average scale score achieved statewide in reading and mathematics in grades 3-8 in 2012 is about the same, with a few minor exceptions. The current cut scores were developed and adjusted over many years using teacher input, so they are very similar in different grades. Adjustments can be made to account for differences in the scale scores needed to reach Level 4 across the grades.
Table 1: Statewide MSP Scale Scores and Passing Rates, Spring 2012
Average Scale Score Percent Meeting StandardGrade Reading Mathematics Reading Mathematics
3 410.0 410.9 68.8% 65.3%4 408.3 412.7 71.5% 59.4%5 410.9 412.9 71.1% 63.8%6 407.3 409.6 70.7% 61.5%7 411.1 411.5 71.3% 59.2%8 409.2 402.8 67.3% 55.5%
Source: Educational Testing Service (2013)
8 The 10th grade reading and writing assessments are easier to pass thanthose in grades 3-8.
15

WERA Educational Journal, Winter 2014
While not perfect, this alternative method is “good enough” givenits other advantages. It helps educators get familiar with the idea of comparing students’ scale scores from one year to the next, which will be how Smarter Balanced assessments results are used in the near future. When there is empirical evidence that a scale score in one grade is harder to achieve than in another grade, the “change score” in the alternative model can be adjusted to account for the differences. Like SGPs, the results from the alternative method can be “averaged” across a classroom,grade, school, and district to provide an overall snapshot of a group’s growth and can show growth, even when a student is above or below standard. And the state can still compute percentiles toshow how a student’s scale score compares to the entire population in each grade.
Conclusion
Measuring student growth is a complicated process and there is nosingle best way to do it. Norm-referenced measures provide data points to give context to the results, but rankings provide little useful information in a standards-based system. The SGP model has additional limitations because it is based on a different type of norm-based ranking. While SGPs can be computed for any large set of data, even when there is no vertical scale or alignment, rankings based on a narrow subset of data can produce results that can be misleading and have limited value. Washington stopped using norm-referenced assessments 15 years agowhen it moved to a standards-based, criterion-referenced WASL in 1997. To many, rankings and other norm-referenced metrics are things of the past.
Measuring student growth is best accomplished using a criterion-based set of measures that are based on a vertically aligned system. The Smarter Balanced assessments that will be used in spring 2015 will have a vertical scale and be criterion-referenced. In the meantime, the alternative approach to measuring student growth is more useful, more timely, and easier to understand. Parents and educators are mainly concerned with how far students need to progress to meet a destination, not how students compare to others who started in the same place.
16

WERA Educational Journal, Winter 2014
The use of student growth measures in educator evaluations is an important but controversial step, so it is important to have transparent measures that provide useful information on a timely basis. Educators need to understand the limitations of SGPs before using them to measure student growth in 2015.
REFERENCES
Baker, B. and Oluwole, J. (2013). Deconstructing Disinformation on Student Growth Percentiles & Teacher Evaluation in New Jersey. New Jersey Education Policy Forum, May 3.http://njedpolicy.files.wordpress.com/2013/05/sgp_disinformation_bakeroluwole1.pdf
Betebenner, D. (2009a). Growth, Standards and Accountability. Dover, NH:Center for Assessment. http://www.nciea.org/publications/growthandStandard_DB09.pdf
Betebenner, D. (2009b). Norm- and Criterion-Referenced Student Growth. Educational Measurement: Issues and Practice, 28(4):42-51.
Butts, R. (2007). House Bill 1209: Education Reform in Washington. Presentation to the Basic Education Task Force, October 22.http://www.leg.wa.gov/JointCommittees/BEF/Documents/Mtg10-22-07/3EdReformOverview.pdf
Castellano, K. and Ho, A. (2013). A Practitioner’s Guide to Growth Models. Washington, DC: Council of Chief State School Officers.
Duncan, A. (2012). Secretary’s Approval Letter, July 6. Washington, DC: U.S. Department of Education. http://www2.ed.gov/policy/elsec/guid/esea-flexibility/map/wa.html
Educational Testing Service (2013). Washington Comprehensive Assessment Program: Grades 3-8, High School, Spring 2012, Technical Report. Olympia, WA: OSPIhttp://www.k12.wa.us/assessment/pubdocs/WCAP2012SpringAdministrationTechnicalReport.pdf
OSPI (2012). ESEA Flexibility Request Summary. Olympia, WA.http://www.k12.wa.us/ESEA/pubdocs/ESEAFlexibilityRequestSummary.pdf
17
WERA Educational Journal, Winter 2014
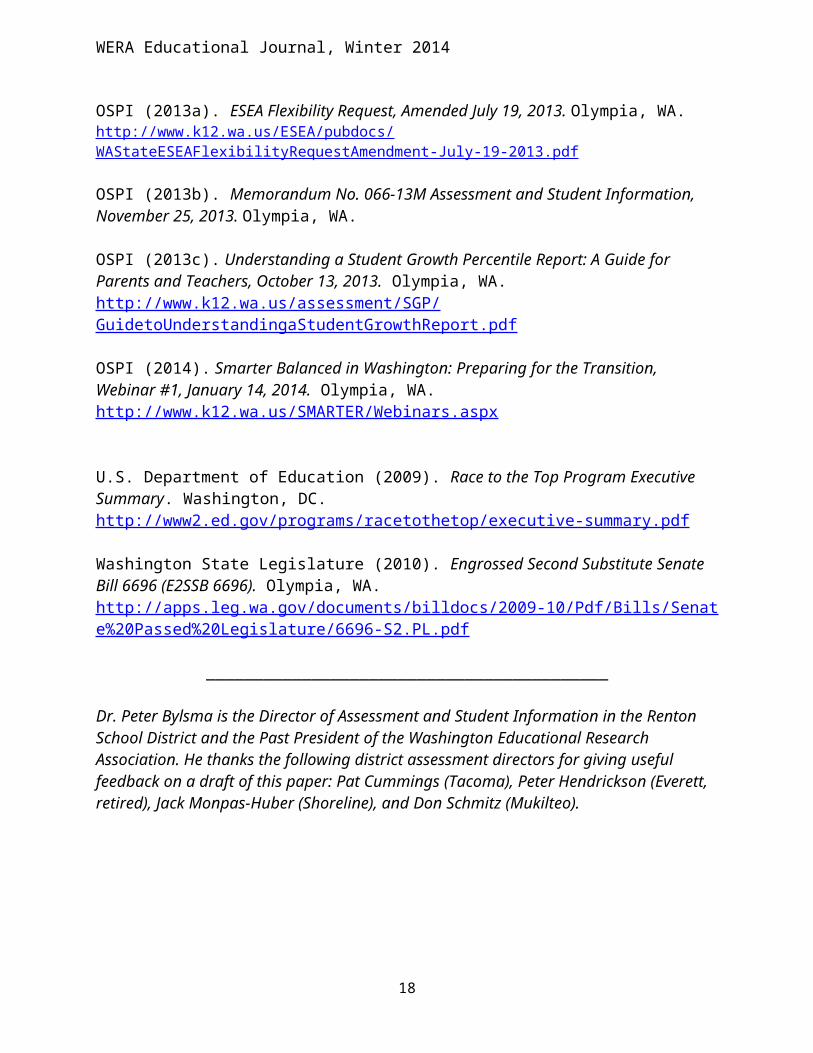
OSPI (2013a). ESEA Flexibility Request, Amended July 19, 2013. Olympia, WA.http://www.k12.wa.us/ESEA/pubdocs/WAStateESEAFlexibilityRequestAmendment-July-19-2013.pdf
OSPI (2013b). Memorandum No. 066-13M Assessment and Student Information, November 25, 2013. Olympia, WA.
OSPI (2013c). Understanding a Student Growth Percentile Report: A Guide for Parents and Teachers, October 13, 2013. Olympia, WA.http://www.k12.wa.us/assessment/SGP/GuidetoUnderstandingaStudentGrowthReport.pdf
OSPI (2014). Smarter Balanced in Washington: Preparing for the Transition, Webinar #1, January 14, 2014. Olympia, WA. http://www.k12.wa.us/SMARTER/Webinars.aspx
U.S. Department of Education (2009). Race to the Top Program Executive Summary. Washington, DC. http://www2.ed.gov/programs/racetothetop/executive-summary.pdf
Washington State Legislature (2010). Engrossed Second Substitute Senate Bill 6696 (E2SSB 6696). Olympia, WA. http://apps.leg.wa.gov/documents/billdocs/2009-10/Pdf/Bills/Senate%20Passed%20Legislature/6696-S2.PL.pdf
__________________________________________
Dr. Peter Bylsma is the Director of Assessment and Student Information in the Renton School District and the Past President of the Washington Educational Research Association. He thanks the following district assessment directors for giving useful feedback on a draft of this paper: Pat Cummings (Tacoma), Peter Hendrickson (Everett, retired), Jack Monpas-Huber (Shoreline), and Don Schmitz (Mukilteo).
18