Using information and communication technology in lower ...
221
Using information and communication technology in lower secondary science teaching in Iceland Svava Pétursdóttir Submitted in accordance with the requirements for the degree of Doctor of Education The University of Leeds School of Education August, 2012
-
Upload
khangminh22 -
Category
Documents
-
view
4 -
download
0
Transcript of Using information and communication technology in lower ...

Using information and communication technology in
lower secondary science teaching in Iceland
Svava Pétursdóttir
Submitted in accordance with the requirements for the degree of
Doctor of Education
The University of Leeds
School of Education
August, 2012

ii
The candidate confirms that the work submitted is his/her own and that
appropriate credit has been given where reference has been made to the work
of others.
This copy has been supplied on the understanding that it is copyright material
and that no quotation from the thesis may be published without proper
acknowledgement.
© 2012 The University of Leeds and Svava Pétursdóttir
iii
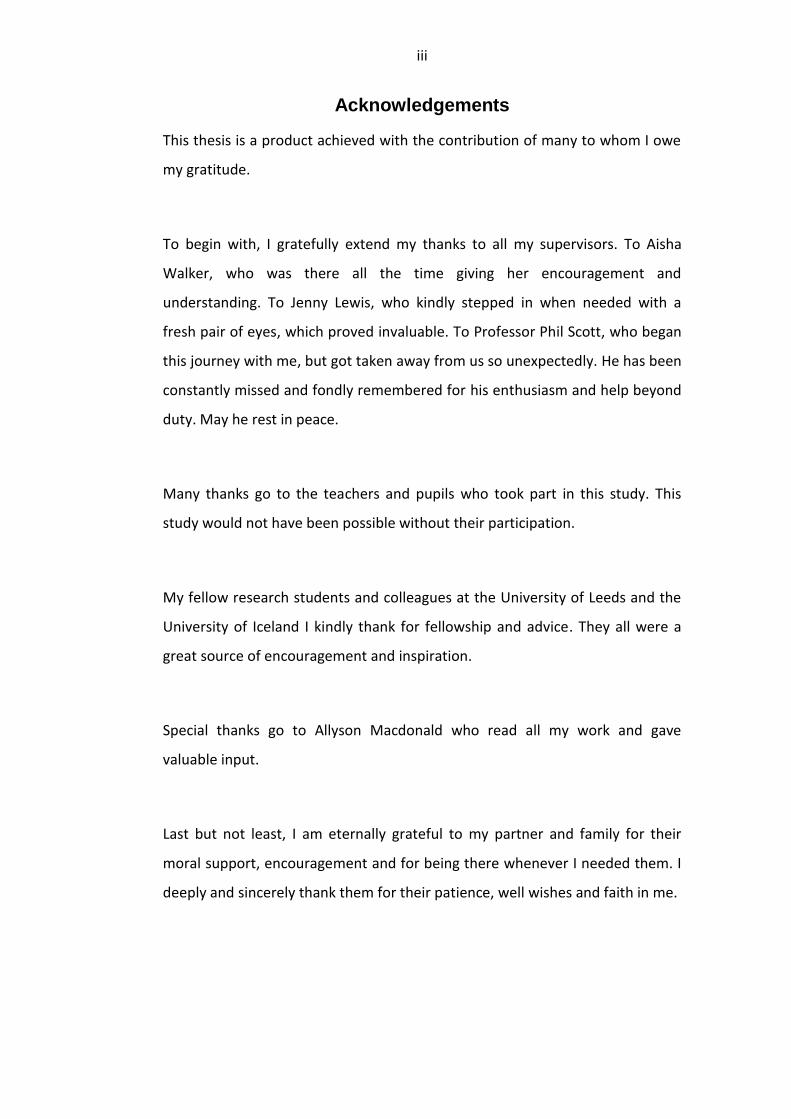
Acknowledgements
This thesis is a product achieved with the contribution of many to whom I owe
my gratitude.
To begin with, I gratefully extend my thanks to all my supervisors. To Aisha
Walker, who was there all the time giving her encouragement and
understanding. To Jenny Lewis, who kindly stepped in when needed with a
fresh pair of eyes, which proved invaluable. To Professor Phil Scott, who began
this journey with me, but got taken away from us so unexpectedly. He has been
constantly missed and fondly remembered for his enthusiasm and help beyond
duty. May he rest in peace.
Many thanks go to the teachers and pupils who took part in this study. This
study would not have been possible without their participation.
My fellow research students and colleagues at the University of Leeds and the
University of Iceland I kindly thank for fellowship and advice. They all were a
great source of encouragement and inspiration.
Special thanks go to Allyson Macdonald who read all my work and gave
valuable input.
Last but not least, I am eternally grateful to my partner and family for their
moral support, encouragement and for being there whenever I needed them. I
deeply and sincerely thank them for their patience, well wishes and faith in me.
iv
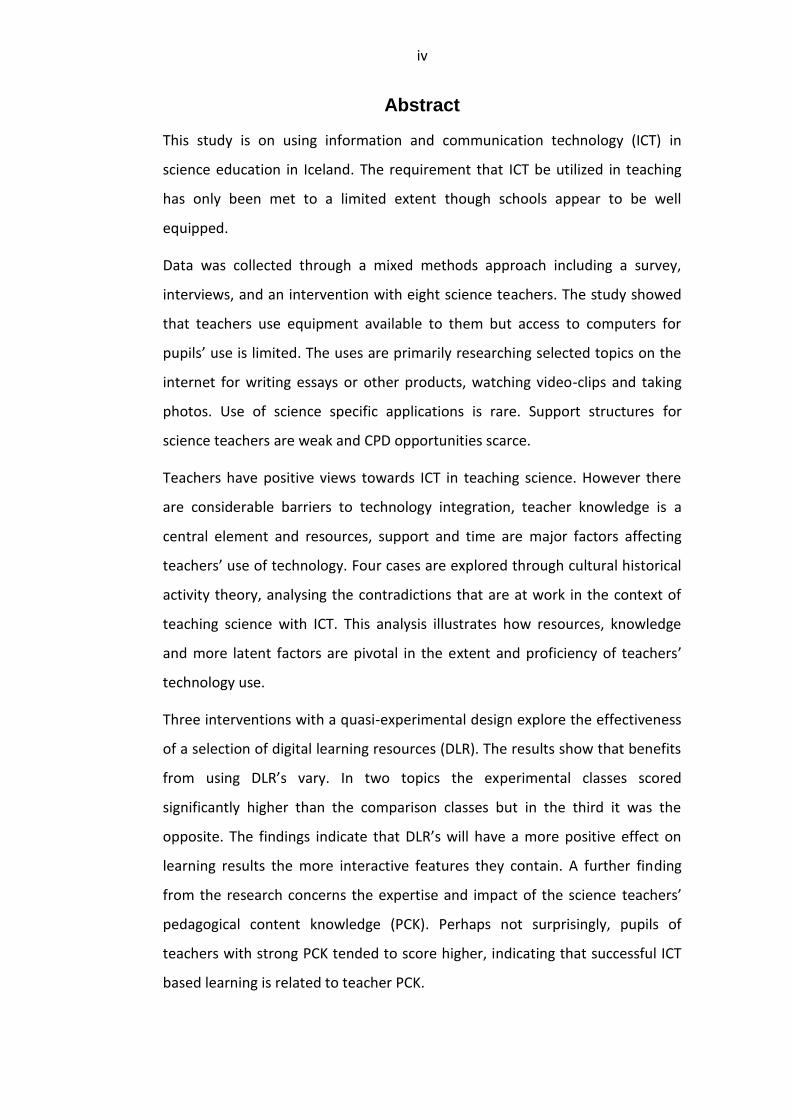
Abstract
This study is on using information and communication technology (ICT) in
science education in Iceland. The requirement that ICT be utilized in teaching
has only been met to a limited extent though schools appear to be well
equipped.
Data was collected through a mixed methods approach including a survey,
interviews, and an intervention with eight science teachers. The study showed
that teachers use equipment available to them but access to computers for
pupils’ use is limited. The uses are primarily researching selected topics on the
internet for writing essays or other products, watching video-clips and taking
photos. Use of science specific applications is rare. Support structures for
science teachers are weak and CPD opportunities scarce.
Teachers have positive views towards ICT in teaching science. However there
are considerable barriers to technology integration, teacher knowledge is a
central element and resources, support and time are major factors affecting
teachers’ use of technology. Four cases are explored through cultural historical
activity theory, analysing the contradictions that are at work in the context of
teaching science with ICT. This analysis illustrates how resources, knowledge
and more latent factors are pivotal in the extent and proficiency of teachers’
technology use.
Three interventions with a quasi-experimental design explore the effectiveness
of a selection of digital learning resources (DLR). The results show that benefits
from using DLR’s vary. In two topics the experimental classes scored
significantly higher than the comparison classes but in the third it was the
opposite. The findings indicate that DLR’s will have a more positive effect on
learning results the more interactive features they contain. A further finding
from the research concerns the expertise and impact of the science teachers’
pedagogical content knowledge (PCK). Perhaps not surprisingly, pupils of
teachers with strong PCK tended to score higher, indicating that successful ICT
based learning is related to teacher PCK.
v
Table of Contents
Acknowledgements ...............................................................................................iii
Abstract iv
Table of Contents .................................................................................................. v
List of Tables .......................................................................................................... ix
List of figures ......................................................................................................... xi
Definitions ............................................................................................................. 1
Information and communication technologies ............................................ 1
Digital learning resources.............................................................................. 1
1. Introduction and background ................................................................. 2
1.1. Framing the study ........................................................................ 2
1.2. Icelandic context ......................................................................... 3
2. ICT in science education ......................................................................... 8
2.1. Range of ICT use in science education ........................................ 9
2.2. Affordances and benefits .......................................................... 10
2.2.1. Reported impact of interventions with simulations ..................... 11
2.2.2. The internet in science education ................................................. 14
2.3. Extent of ICT use in science education ...................................... 17
2.3.1. Internationally ............................................................................... 17
2.3.2. Iceland ........................................................................................... 18
2.4. Factors affecting ICT use by teachers ........................................ 19
2.4.1. Resources ...................................................................................... 23
2.4.2. Support .......................................................................................... 24
2.4.3. Subject culture .............................................................................. 25
2.4.4. Teacher knowledge ....................................................................... 25
2.4.5. Teacher attitudes .......................................................................... 27
2.4.6. Pupils ............................................................................................. 28
2.5. Strategies to overcome barriers ................................................ 28
3. Methods ................................................................................................ 30
3.1. Aims and research questions .................................................... 30
vi
3.2. Frameworks for data collection ................................................ 31
3.3. Phase I: Survey .......................................................................... 34
3.3.1. Participants ................................................................................... 35
3.3.2. Data collection .............................................................................. 35
3.3.3. Analysis .......................................................................................... 36
3.4. Phase II: Qualitative exploration .............................................. 36
3.4.1. Sampling ........................................................................................ 37
3.4.2. Interviews ...................................................................................... 40
3.4.3. Teacher focus groups .................................................................... 41
3.4.4. Pupil focus groups ......................................................................... 42
3.4.5. Analysis .......................................................................................... 42
3.5. Phase III: Interventions ............................................................. 43
3.5.1. Participants ................................................................................... 44
3.5.2. Choice of topics and digital learning resources ............................ 47
3.5.3. Tests .............................................................................................. 54
3.5.4. Pupil questionnaires ...................................................................... 58
3.5.5. Data collection .............................................................................. 58
3.5.6. Analysis .......................................................................................... 61
3.6. Triangulation ............................................................................. 64
3.7. Ethical considerations ............................................................... 65
4. Mapping of ICT use in science education ............................................. 67
4.1. Potential for using ICT ............................................................... 67
4.1.1. Availability and use of equipment ................................................ 67
4.1.2. Use and knowledge of applications .............................................. 68
4.2. Self reported use of ICT in the classroom ................................. 69
4.2.1. Described lessons .......................................................................... 69
4.2.2. Tools, tasks and applications ........................................................ 72
4.3. What teachers think of ICT in science teaching ........................ 79
4.4. Pupils’ views and experiences of ICT ......................................... 82
4.5. Summary .................................................................................... 87
5. Conditions that affect teachers ............................................................ 88
5.1. Factors that Icelandic teachers say affect their ICT use ............ 88
5.1.1. Availability and access to equipment ........................................... 90
5.1.2. Pedagogical factors ....................................................................... 90
5.1.3. Training.......................................................................................... 92
vii
5.1.4. Support .......................................................................................... 93
5.1.5. Time and workload issues ............................................................. 97
5.1.6. Teacher knowledge ....................................................................... 98
5.2. Illustrative cases ...................................................................... 103
5.2.1. Analytical framework: activity theory ......................................... 104
5.2.2. Conditions that apply to all the cases ......................................... 110
5.2.3. Olga ............................................................................................. 116
5.2.4. Anna ............................................................................................ 118
5.2.5. Ellen ............................................................................................. 119
5.2.6. Eva 121
5.3. Summary .................................................................................. 123
6. Interventions ....................................................................................... 124
6.1. Genetics ................................................................................... 124
6.1.1. Observed lessons ........................................................................ 125
6.1.2. Genetics test scores .................................................................... 127
6.1.3. What pupils thought of Erfðavísir and Bug Lab .......................... 130
6.1.4. Summary of genetics intervention .............................................. 132
6.2. Chemistry ................................................................................. 134
6.2.1. Observed lessons ........................................................................ 134
6.2.2. Chemistry test scores .................................................................. 135
6.2.3. What pupils thought of Chembalancer ....................................... 140
6.2.4. Summary of chemistry intervention ........................................... 141
6.3. Ecology ..................................................................................... 143
6.3.1. Observed lessons ........................................................................ 143
6.3.2. Test scores ................................................................................... 144
6.3.3. What pupils thought of Sunny Meadows .................................... 146
6.3.4. Summary of ecology intervention ............................................... 148
6.4. Effects of participation on teachers ........................................ 150
6.5. Summary .................................................................................. 151
7. Towards an understanding of ICT use in science education in
Iceland ................................................................................................. 152
7.1. How Icelandic teachers are using ICT in science education .... 152
7.2. A model of the factors that affect teachers ............................ 154
7.2.1. Summary ..................................................................................... 166
7.3. Factors that influenced the impact of the interventions ........ 166

viii
7.3.1. Resources and roles .................................................................... 167
7.3.2. Effects of testing and relevance .................................................. 170
7.3.3. Effect of teachers’ pedagogical content knowledge ................... 171
7.4. Limitations and methodological comments ............................ 173
7.5. Summary .................................................................................. 174
8. Conclusions and recommendations .................................................... 175
8.1. Recommendations for practice ............................................... 175
8.1.1. Physical tools – resources and DLRs ........................................... 177
8.1.2. Conceptual tools ......................................................................... 178
8.1.3. Collaboration and CPD ................................................................ 178
8.2. Recommendations for further research.................................. 181
8.3. Contributions ........................................................................... 182
8.4. Concluding remarks ................................................................. 183
Bibliography ...................................................................................................... 185
List of abbreviations .......................................................................................... 196
Appendices ........................................................................................................ 197
A. Questionnaire .......................................................................... 198
B. ANCOVA tables ........................................................................ 208
ix
List of Tables
Table 1-1 Science websites from NCEM. .............................................................. 4
Table 3-1 Overview of research questions and data collection .......................... 33
Table 3-2 Responses to the survey ..................................................................... 36
Table 3-3 Participation in teacher focus groups ................................................. 38
Table 3-4 Participation in Phase II and III. ......................................................... 39
Table 3-5 Outline of intervention data ............................................................... 46
Table 3-6 Overview of topics and applications in intervention .......................... 48
Table 3-7 Statistical tests used in this study ....................................................... 63
Table 4-1 Organisation of described lessons ...................................................... 69
Table 4-2 Pupils activities in described science lessons with ICT. ...................... 70
Table 4-3 Topics of described lessons ................................................................. 70
Table 4-4 Equipment and software in use in described lessons ......................... 71
Table 4-5 Teacher activity in described lessons .................................................. 72
Table 4-6 ICT Teacher practice from phase II – before intervention ................. 74
Table 4-7 Pupil views of ICT use and extent ....................................................... 84
Table 5-1 Factors that teachers think inhibit them in employing ICT with pupils
............................................................................................................................. 89
Table 5-2 Factors that teachers think make it easy or encouraging to employ ICT
with pupils ........................................................................................................... 89
Table 5-3 Types of training teachers had in using ICT in teaching...................... 92
Table 5-4 Support available to teachers ............................................................. 93
Table 5-5 Difficult topics of science .................................................................... 99
Table 5-6 Education of science teachers........................................................... 100
Table 5-7 Overview of contradictions ............................................................... 107
Table 5-8 Cases profiles - deterring factors ...................................................... 114
Table 6-1 Classroom activities during intervention .......................................... 124
Table 6-2 Genetics test results .......................................................................... 127
Table 6-3 Pupils’ views of websites used in genetics ........................................ 130
Table 6-4 Resources used to study for the test in genetics .............................. 131
Table 6-5 Summary of genetics intervention ................................................... 133
Table 6-6 Chemistry test results ....................................................................... 136

x
Table 6-7 Pupils’ views of websites used in intervention ................................. 140
Table 6-8 Resources used to study for the test in chemistry ........................... 141
Table 6-9 Summary of chemistry intervention ................................................. 142
Table 6-10 Ecology test results ......................................................................... 144
Table 6-11 Pupils views of websites used in ecology intervention................... 147
Table 6-12 Resources used to study for the test in ecology ............................. 147
Table 6-13 Summary of ecology intervention ................................................... 149
xi
List of figures
Figure 2-1 A model showing the relationship among the various barriers ........ 21
Figure 2-2 Technological Pedagogical content knowledge ................................. 26
Figure 3-1 Outline of study ................................................................................. 32
Figure 3-2 Screenshot from Erfðavísir ................................................................ 49
Figure 3-3 Screenshot from Bug Lab ................................................................... 50
Figure 3-4 Screenshot from Chembalancer ........................................................ 51
Figure 3-5 A screenshot from Sunny Meadows .................................................. 52
Figure 3-6 A screen shot from EcoKids................................................................ 53
Figure 3-7 A screen shot from The mysteries of life ........................................... 54
Figure 4-1 Availability of equipment ................................................................... 68
Figure 4-2 Applications used with pupils ............................................................ 75
Figure 4-3 Internet use with students in class .................................................... 75
Figure 5-1 General model of an activity system ............................................... 105
Figure 5-2 The expansive learning cycle ........................................................... 108
Figure 5-3 Contradictions all teachers face ...................................................... 110
Figure 5-4 Olga Type A, B, C and D .................................................................... 117
Figure 5-5 Anna Type C, D, E and constraints from teaching two subjects ...... 118
Figure 5-6 Ellen Type C, E and isolation in practice. ......................................... 120
Figure 5-7 Eva, Type C, D, E and contradictions between professional role and
personal life ....................................................................................................... 122
Figure 6-1 Genetics test results with error bars ............................................... 128
Figure 6-2 Chemistry test results with error bars ............................................. 137
Figure 6-3 Balancing chemical equations - with error bars .............................. 139
Figure 6-4 Ecology test results with error bars ................................................. 145
Figure 7-1 Frequency of different uses of ICT ................................................... 153
Figure 7-2 Adapted model, factors that affect technology integration ........... 156
Figure 7-3 Overview of all test scores ............................................................... 172
Figure 8-1 Development of conceptual tools ................................................... 176
1
Definitions
Information and communication technologies
When referring to information and communication technologies (ICT) in this
study it is done so in the widest context. It includes the physical equipment;
computers, interactive whiteboards, as well as digital resources and
information systems, such as the internet.
Digital learning resources
For the purpose of this study I choose to adopt the definition from OECD
(OECD/CERI, 2007) that digital learning resources (DLR) are: any digital resource
that is actually used by teachers and learners for the purpose of learning. This
would include all digital resources, web-pages, videos, photos, e-books, audio
files and more, no matter what the purpose of their design, as long as they are
used for learning.
2
1. Introduction and background
This thesis is about the uses of ICT in science teaching in Iceland. In the first part
of this introduction I describe why this subject caught my interest and how the
study is outlined. The second part outlines the Icelandic context, the school
system and relevant research.
1.1. Framing the study
Before commencing on the journey of educational research I had been a
teacher in compulsory schools in Iceland for 15 years. In my practice I had
always been exploring, learning and trying out new things, then came the time
when I could apply for paid leave to go and study for a whole year. I had mainly
been teaching science but had a constant affinity for all things computer
related and tried my best to apply technology as much as I could in my
teaching. When the time came to choose a subject for this thesis the choice
was easy or maybe not because I wanted to do everything at the same time: To
know what my colleagues were doing, to know if ICT is helpful for learning and
not just fun, to know why everyone was not as excited about the possibilities
ICT seemed to hold. This thesis is a record of this journey where some of these
areas were answered, but many other questions rose.
The first question I felt needed answering was whether it is a correct
assumption that teachers are not using ICT to any great extent. If the
assumption was right it should cause some concern both in that the potential of
available technologies is not being utilized, and in that pupils used to
computers may consider school science old fashioned and boring. This is a
highly relevant issue in the context of diminishing student interest in science
studies (Osborne et al., 2003).
From there the next question that arose was ‘what are the factors that affect
ICT use of Icelandic science teachers?’ Has it to do with the teachers’ own
3
motivation, and their pedagogy or external factors such as availability of
equipment, software and support? I knew what factors I felt were hindering me
personally but not the whole teacher population, and so I felt that needed
answering as well.
Last but not least is the issue of whether using ICT is more beneficial to pupil
learning than conventional teaching methods. In my own teaching I had made
efforts to use as much ICT as possible due to my own interest and seeing my
students’ enthusiasm when they were working with computers. When teaching
I never measured effects and computer use was often restricted to optional
courses or content that was not the core content of the curriculum. My
rationale when designing this study went somewhere along the lines of:
research has shown that usefulness has stronger links to usage than was ease
of use (Davis, 1989) so exploring usefulness was what I wanted to do.
1.2. Icelandic context
In Iceland compulsory schools for 6-15 year old pupils are run by the
municipalities. This study focuses on science teaching in the three last years, of
13-15 year old pupils (lower secondary). Research has shown Icelandic schools
to be homogenous in terms of social, economic factors and that the schools
have weak links to pupil achievement (Halldórsson et al., 2010). At the time of
data collection there were 170 schools in Iceland. A common school has around
3-400 pupils with two classes of around 20 pupils of mixed abilities in each year
group. This does not allow for much specialisation of teachers, often there is
only one science teacher sometimes two in each school, teaching all the
sciences. This sometimes leads to professional isolation of teachers. A recent
survey showed that 44% of science teachers have little or very little
cooperation with other science teachers and 36% say they participate in no
cooperation (Bjarnadóttir et al., 2007).
Two universities educate teachers to teach in compulsory schools. Students
choose one or two electives for one sixth of the three years it takes to finish a
BEd. degree. After which they were qualified to teach compulsory schools until
recently. From 2011 students have to finish a master’s degree to become a
4
qualified teacher. Another route to become a qualified teacher is to take a BS
or BA degree, and then a post graduate teaching certificate. This has meant
that it is not necessary to have any training in certain subjects to be qualified to
teach it, and those teaching science often have little or no training in science. A
survey of teachers in 2006 showed that of those teaching science at the time
40% had a BEd. degree with at least one of the sciences as an elective and 9%
had a BS degree and a teaching certificate(Meyvant Þórólfsson, 2006).
The National Centre for Educational Materials (NCEM) is responsible for
publishing teaching materials for schools and there are also small publishers
producing teaching materials but so far they have not published anything for
science teaching in compulsory schools. NCEM has published a series of
textbooks, booklets and guides around themes. Usually there is no choice of
textbooks. Teaching has been very textbook oriented and traditional in general
(Sigurgeirsson, 1992) as well as in science teaching (Vilji og veruleiki, 2008).
Almost all lower secondary science teachers use lecture form and discussions
that are prevalent with younger pupils which diminishes the older the pupils
get (Bjarnadóttir et al., 2007). Furthermore PISA 2006 showed that practical
work and pupil exploration are far less common in Iceland than the OECD
average and there is little interaction between pupils (Halldórsson et al., 2010).
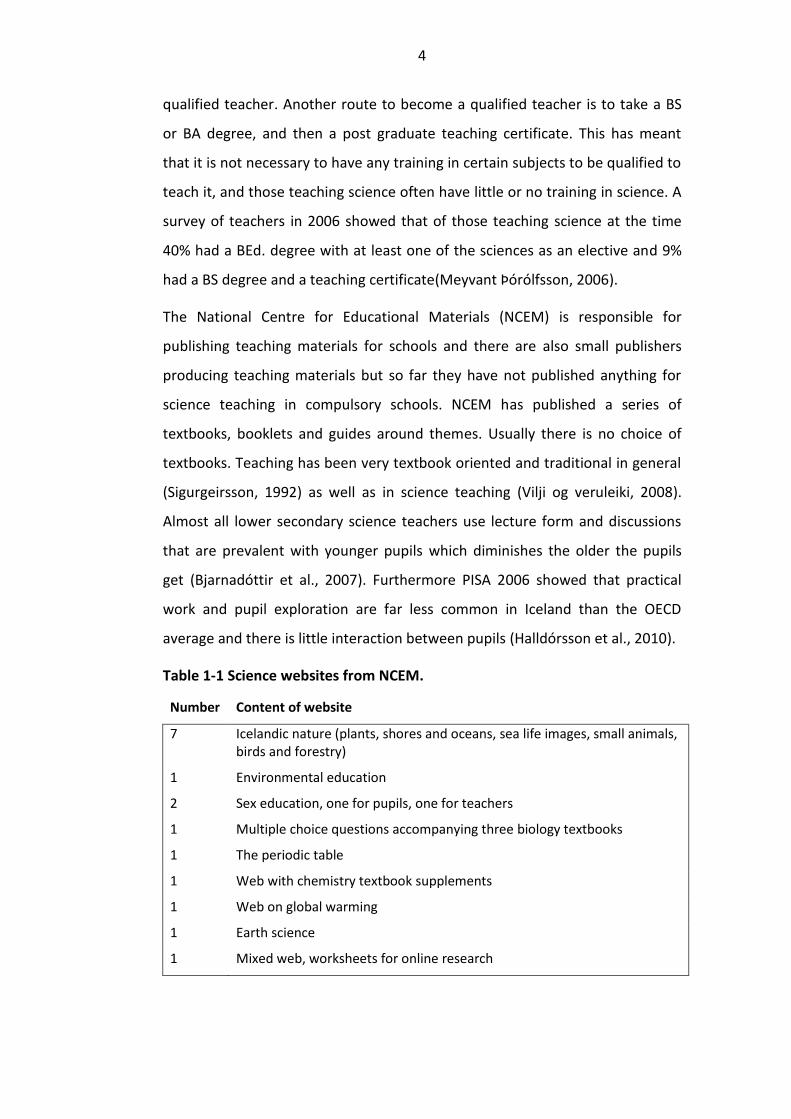
Table 1-1 Science websites from NCEM.
Number Content of website
7 Icelandic nature (plants, shores and oceans, sea life images, small animals, birds and forestry)
1 Environmental education
2 Sex education, one for pupils, one for teachers
1 Multiple choice questions accompanying three biology textbooks
1 The periodic table
1 Web with chemistry textbook supplements
1 Web on global warming
1 Earth science
1 Mixed web, worksheets for online research
5
In June 2012 there were sixteen websites available from the NCEM suitable for
lower secondary pupils as shown in Table 1-1. On the website there is also a
good selection of videos as well as teacher guides and printable worksheets
accompanying textbooks.
Similarly there are a variety of websites published by institutions and private
companies designed for educational purposes, on Icelandic nature, energy and
genetics. This selection is much skewed, biology gets more attention, energy
(electricity) gets a fair amount but there is close to nothing on other areas of
physics or chemistry.
In the Icelandic school system there are three major factors that should
influence school development. First is the curriculum, published at national
level from which schools write their own more detailed document. Secondly
schools are responsible for their own self evaluation. The law states that self
evaluation should increase the quality of learning and school activities and
facilitate school development (Lög um grunnskóla, 2008). Official guidelines
suggest that schools describe and analyse the status of all major aspects of
schools and make developmental plans, including the third factor, continuous
professional development (CPD) -plans. It has been pointed out that even
though these three factors should work in harmony, that has not been the case
(Ágústsdóttir and Pálsdóttir, 2011). A recent study explored hindrances to
school development in Iceland. As expected less funding caused by the financial
situation was a hindrance, but Iceland has suffered from a financial crisis from
2008 resulting in severe budget costs in schools. Arrangements of funding to
CPD and clauses in union agreements affecting the organisation of CPD were
deemed just as important (Ágústsdóttir and Pálsdóttir, 2011). The
arrangements in regard to funding are so that schools can apply for competitive
funds and individual teachers can get funds that are then used at their own
discretion but not necessarily in line with CPD plans of the schools. The union
agreement and employers expect teachers to participate in 120-150 hours per
year of CPD mostly out of term time. Indications are from the TALIS study that
Icelandic teachers participate less in CPD than in other participating countries
6
(Ólafsson and Björnsson, 2009). Independent study and informal collaboration
though were more frequent.
When ICT was first introduced to the school system teachers were trained in
using common applications such as email, internet, word-processing and
spreadsheets; courses on subject specific usage, however, with a pedagogic
focus have been in short supply.
There have been numerous policy papers for bringing ICT into teaching and
learning, the first one emphasising teaching training and publication of
educational materials (Menntamálaráðuneytið, 1996). ICT skills were part of
teacher training from the 1980s when computers also entered schools. The
national curriculum guide from 1989 has a chapter on computer skills but
computers are not mentioned in the science section. However the curriculum
guide from 1999 expected computers to be used in the teaching of every
subject and ICT skills to be taught across subjects which carried on to the
present curriculum guide from 2007. Although the policy seems clear, its
implementation is not as visible. In 2007 a report on the implementation of
policy documents from 2004 -2007 reported less funding for ICT from the
Ministry of Education, Science and Culture (MESC). Stagnation could be seen,
aims that had been set regarding teacher education, (including CPD) were met
only by a fourth, with insufficient dissemination and support, but aims to re-
evaluate the policy were considered met (Capacent, 2007). Policy makers
counted on initiative from teachers and schools in designing DLRs by funding
with grants (OECD/CERI, 2008). The newest policy paper aims to strengthen the
use of ICT in teaching by introducing ICT leaders in compulsory schools and
increasing the publication of DLRs (Forsætisráðuneytið, 2008).
This thesis was developed in this context. It outlines the relevant literature
regarding ICT use in science education specifically how and why ICT may be
used in teaching science and the conditions that impact teachers in their use of
ICT. Section three outlines the methods employed, in sections four through six
the findings are presented, leading towards an understanding of ICT use in

7
science education set out in sections seven. Lastly some conclusions and
recommendations for furthering ICT use are set out in section eight.
8
2. ICT in science education
This literature review has three strands in accordance with the underlying
research questions. First, I introduce models useful to explore different
applications and then I discuss the affordances of ICT for science education that
is, in what way ICT may be used for teaching and learning science. Then there is
a brief overview of intervention studies exploring the possible benefits different
affordances have been found to have or not. Next an overview is provided as to
what reports and research has to say about the extent to which ICT is used in
science teaching. Lastly, an overview of the literature on the factors affecting
teachers in using ICT is presented.
The Computer Practice Framework (CPF) (Twining, 2002) can be used to
describe the key facets of educational practice surrounding computer use. The
framework includes three ‘modes’ of computer use where computers are said
to support, extend or transform learning. When computers support learning
both the process and the content of the learning stays the same. When
computers extend learning either the content or the process is changed but
could have been achieved without a computer. When the learning is
transformed either the process or the content is different and the activity
requires a computer. Twining states that the framework is value free, that it
does not indicate whether the changes to practice are an improvement or not
or how significant they are. But it seems to me that there is a built in value.
Exploring levels of change indicates that change is valued. Within the context of
talking about computers in education the agenda of wanting computers to
make a positive impact on learning whether in content or process is always
present.
Another way of exploring digital learning resources is the framework of Newton
and Rogers (2003) who make a distinction between properties and benefits.
They recognise properties as something that ICT allows you to do and the
possible benefits are those that derive from the modes of learning activities in
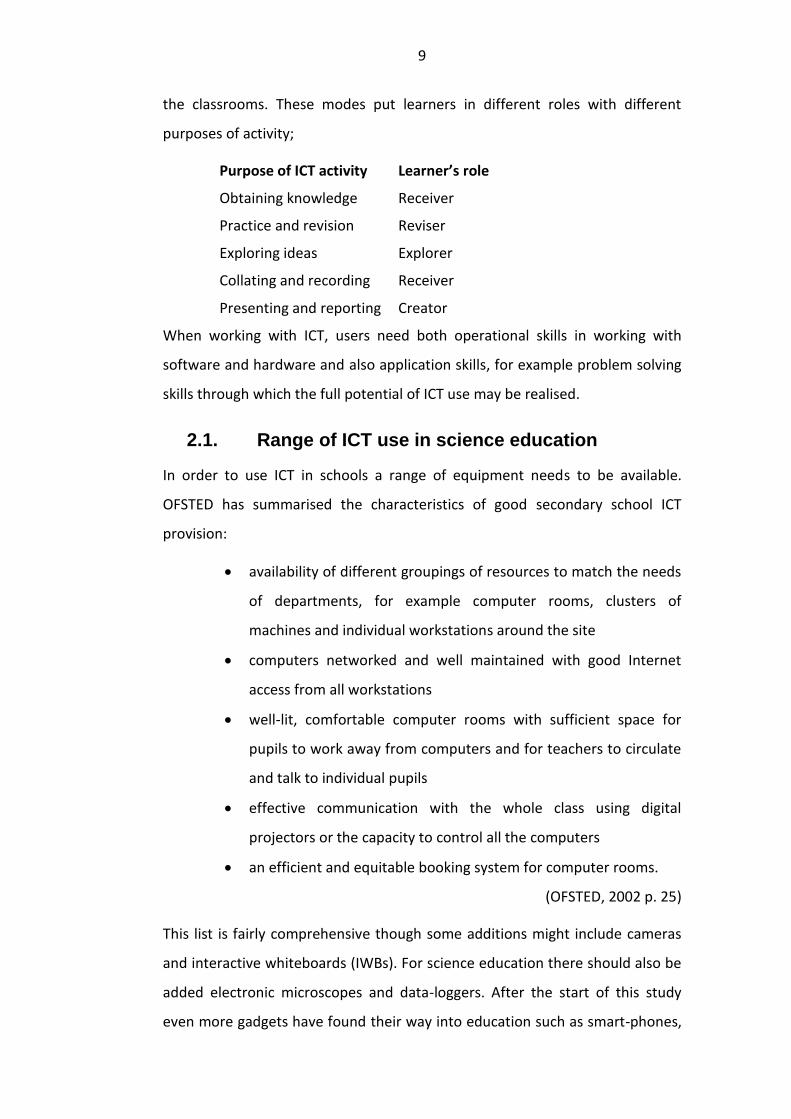
9
the classrooms. These modes put learners in different roles with different
purposes of activity;
Purpose of ICT activity Learner’s role
Obtaining knowledge Receiver
Practice and revision Reviser
Exploring ideas Explorer
Collating and recording Receiver
Presenting and reporting Creator
When working with ICT, users need both operational skills in working with
software and hardware and also application skills, for example problem solving
skills through which the full potential of ICT use may be realised.
2.1. Range of ICT use in science education
In order to use ICT in schools a range of equipment needs to be available.
OFSTED has summarised the characteristics of good secondary school ICT
provision:
availability of different groupings of resources to match the needs
of departments, for example computer rooms, clusters of
machines and individual workstations around the site
computers networked and well maintained with good Internet
access from all workstations
well-lit, comfortable computer rooms with sufficient space for
pupils to work away from computers and for teachers to circulate
and talk to individual pupils
effective communication with the whole class using digital
projectors or the capacity to control all the computers
an efficient and equitable booking system for computer rooms.
(OFSTED, 2002 p. 25)
This list is fairly comprehensive though some additions might include cameras
and interactive whiteboards (IWBs). For science education there should also be
added electronic microscopes and data-loggers. After the start of this study
even more gadgets have found their way into education such as smart-phones,

10
tablets, e-readers, social media such as Facebook, and online digital storage.
These are not a part of this work, however frustrating that may be, for the race
of keeping up with technology is perhaps one of eternal consternation for
educational research.
Most ICT applications in one way or another can be employed in teaching and
learning science and ICT clearly expands the pedagogical resources available to
science teachers. Wellington (2004) lists word processing and searching the
internet for information, databases and spreadsheets for example in pattern
searching; hypothesizing; recording and presenting data; accessing and
organizing data, controlling experiments; controlling external devices, using
simulations and models; using sensors for gathering and recording data; and
graphics for presenting data. All the items on this list can be seen in the
Icelandic science curriculum, where the emphasis is much placed on handling
and gathering data and information However equipment and computer
programmes are also expected to open new opportunities for practical work.
New equipment is coming along quite rapidly now. In recent years mobile
phones, tablets, e-readers and other gadgets have found their way into schools.
That had not started in Iceland when this study was planned and thus play no
part in it.
2.2. Affordances and benefits
Computers and technology have many reported affordances in science
teaching, the following list comes from Osborne and Hennessy (2003 p. 4)
expediting and enhancing work production; offering release from
laborious manual processes and giving more time for thinking,
discussion and interpretation
increasing currency and scope of relevant phenomena by linking
school science to contemporary science and providing access to
experiences not otherwise feasible
supporting exploration and experimentation by providing
immediate, visual feedback

11
focusing attention on over-arching issues, increasing salience of
underlying abstract concepts
fostering self-regulated and collaborative learning
improving motivation and engagement
Wellington (2004) has a similar list including motivation, excitement and
pleasure; an improvement in pupils’ self-esteem and perseverance; neater
work and that ICT can be used to simulate practical work that is too fast, slow
or dangerous for the classroom.
Research into the uses of ICT in science education is growing and knowledge
slowly accumulating on how best to employ it. Here I only include simulations
and web based resources as these kinds of applications were used in the
intervention.
2.2.1. Reported impact of interventions with simulations
Though the most obvious advantage of using simulations is that they can depict
and model phenomena that are too big, small, costly, dangerous, or lengthy for
the classroom, some effort has been put into studying other affordances such
as benefits to conceptual change and student engagement. Baggott (1998)
stated that pedagogy based on simulations did not exist and that the little
research that had then been carried out on their effect on learning or teaching
did not give firm conclusions. That seems to still be the case, but some
promising results have been reported on student conceptual change (Hennessy
et al., 1995; Zacharia and Anderson, 2003; Marbach-Ad et al., 2008) and a
better ability to predict and explain (Zacharia and Anderson, 2003). Simulations
have been found to help pupils articulate a better understanding of concepts
(Marbach-Ad et al., 2008). How the resource is used is important and the
guidance that students received was the deciding factor for understanding
boiling points and not the simulation use (Ardac and Sezen, 2002) where
computer groups showed significant gains in recognizing variables but the
regularly taught group did not.
Other interventions with large samples of university students (Steinberg, 2000;
Hsu and Thomas, 2002) have failed to show significant difference from control
12
groups on tests. Steinberg concludes that simulations are an excellent tool for
conceptual change, and Hsu and Thomas detect a positive impact through
interviews. Both Ardac and Sezen (2002) and Steinberg (2000) suggest that the
failure might be due to the level of interaction with the simulation, and that to
actively manipulate it and infer knowledge is more likely to provide better
results. Hsu and Thomas (2003) seemed to blame lack of explanation by the
teachers to the students on the simulation before its use, which agrees with
Ardac and Sezen’s (2002) study.
The general conclusions show that simulations have some potential in
promoting conceptual change and understanding of scientific processes but
both the nature and quality of the simulations and how they are used play a
role in getting the best out of them. There are indications that using simulations
in conjunction with practical work gives good results (Zacharia, 2007). Teachers
would rather see them as an extension than a replacement of practical work
(Baggott La Velle et al., 2004; Kennewell et al., 2007).
Students’ views and motivation
Though it is rarely the main focus of studies, many papers comment on how
students engage with simulations. An exception is a study of 21 volunteers,
aged 14-15 (Rodrigues, 2007) on what guides and influences pupil engagement
with chemical simulations. She used two online simulations and screen
activities and recorded conversations. From retrospective interviews she
identified three aspects that influence the students’ engagement with the
simulations:
Distraction and vividness: students were drawn towards eye catching
elements on the screen
Logic and information: the students did not follow the instructions on the
screen. They correctly said the instructions were not in a linear order on
the page. It seems that these students did not get any instructions before
using the simulations, so they were fumbling along by themselves trying
to make sense of them.

13
Prior knowledge: students drew on prior practical knowledge in their
interactions.
Zacharia (2007) has found that a combination of methods may be more fruitful
which has some resonance with the last point. Perhaps this is because that
gives students increased opportunities of drawing from experience from
different sources.
Another factor affecting engagement is the ‘edutainment’ element, of a
simulation evaluated by Baggott and Watson (1997, cited in Baggott and Nichol,
1998). A simulated microscope experiment and the same work on a microscope
revealed that it was important for the students to have a ‘hands on’ experience,
in order to gain a positive view of the simulated experiment. Similarly in
Kennewell, et al. (2007) pupils preferred traditional practical work to
simulations in science because they enjoyed the physical manipulation of
science equipment. The pupils recognised that it is what ‘real’ scientists do and
were cognitively engaged by the relative unpredictability of the setting.
Interestingly in another study Hennessy et al. (1995) found the novelty of using
computers soon wore off. The authors point out that the activities were very
similarly structured and the pupils soon learned what to expect, so they
recommend more variety and fun. Contrary findings are reported by Wellington
(2004) where both students and teachers thought the material was motivating,
engaging, and that it gave the students a sense of achievement. The pupils
appreciated repeating activities as often as they liked until they understood.
Concerns of teachers have also been reported (Baggott La Velle et al., 2004).
Teachers expressed the view that recent changes in technology were less
‘educationally focused’ and more ‘edutainment’ focused and this led to the
core of science being lost. It must be an ongoing challenge for designers of
educational material to keep up with very vivid material, designed only for
entertainment purposes, and at the same time to deliver good content and
sound pedagogical strategies. None of the above studies mention that the
simulations used may not be the most exciting. I tried those that Roderigues
14
(2007) used1 and found some of them confusing and rather unattractive when
compared to computer games that teenagers play that are very life-like. Still
factors identified by Rodrigues give good indications both for teachers and
designers on how to design and plan for the successful use of simulations.
Although enjoyment may be an important factor in learning, recognition of
previously discussed affordances are just as important.
2.2.2. The internet in science education
This section focuses on the internet as a resource for information, mainly text,
but also diagrams, videos, and photos. Referring to the internet as a simple
entity is simplistic; the internet includes so many applications.
Being able to search, interpret and question sources of information from the
internet is an important part of scientific literacy (McFarlane and Sakellariou,
2002), so ICT therefore plays a vital role in developing those skills. MacFarlane
and Sakellariou argue that ICT has potential to further both scientific reasoning
and analytical approaches that are both needed for the education of
scientifically literate students.
Clinch and Richards (2002) advise that using the internet is a good option to
make a topic more interesting, particularly those concepts that students find
difficult. As an incentive for discussions their suggestions include graphics for
things that are not easily seen otherwise. Interestingly they also recommend
websites for fun, albeit educational sites with good science content.
There is now a wealth of science materials on the internet designed for
education, professional and commercial use. Wellington and Britto (2004) have
discussed the material available for science, also the difficulties and issues such
as security, lack of control and the variety of quality. Clinch and Richards (2002)
found that good activities that match curricular needs are rare. A slight
1
http://www.chem.iastate.edu/group/Greenbowe/sections/projectfolder/animationsindex.htmhttp://www.chem.iastate.edu/group/Greenbowe/sections/projectfolder/animationsindex.htm

15
mismatch in content can make large parts of a website or activity useless to
teachers’ needs.
There are several issues regarding internet use in teaching. First of all, the vast
quantity of websites and diverse quality makes it difficult to leave pupils to
work on their own. In schools students need to be guided in evaluating the
information they come across. Teachers can also control where students go,
with intranets or a list of pre-approved and appropriate websites. Using the
internet as a resource in research, for essays and project is a common activity.
With that activity comes the issue of how students use the information they
find. Teachers are concerned about how much of what students produce is
their own work or if it is just a question of ‘copy/-paste’.
Wallace et al. (2000) conducted a study with sixth graders, giving them the task
of looking for specific information. Pupils interpreted the task differently, and
worked on the goal of finding the answer in as few hits on web-pages as
possible. They were busy and engaged during the activity but not successful in
finding useful information, showing that information seeking is a complicated
process. That study ended with more questions than answers, with no
suggestions on how the task could have been framed better to get the students
to find and read relevant information. Clinch and Richards (2000) however
make it their main point that aimless surfing of the web is useless and they give
examples through their own work of websites that direct students to
appropriate material chosen for them. They also introduce the possibility for
teachers to create and upload their own quizzes and tests.
Teachers are concerned with how students can be swamped with information
when using the internet, (Baggott La Velle et al., 2004) exposing the need for
them to judge the information found. Furthermore, students sometimes gather
information and do not use it to learn, even trying to circumvent the task, using
only lower order thinking skills (Baggott La Velle et al., 2004). Still the internet is
seen as a valuable source by teachers, and they recommend well defined tasks
and time limits.
16
Indications are that the use of ICT leads to higher levels of student involvement
and that the uses are motivating for students (for example (Cox, 2000;
Wellington, 2004). Cox (2000) has argued that ICT use may keep the school up
to date, introducing students to methods of industrial science.
When reading through the literature it soon becomes evident that in order to
achieve the reported affordances, an important aspect is not what is used but
how it is used (McFarlane and Sakellariou, 2002). The role of the teacher is
central in choosing, planning, managing and facilitating productive discussions.
Furthermore, after computer use was negatively associated with achievement
in a number of countries in TIMSS, Papanastasiou et al. (2003) went back to the
data and controlled for social economic factors like computer use at home and
comfort with using computers, especially word processing. They found that the
greater the home use and comfort, the more likely the students were to have
higher levels of scientific literacy. She suggests that it is the lower achievers
who get to use the computers most in schools. This might well be. At least in
Iceland the availability of educational software for special education seemed to
be better than for mainstream students with special educational needs
teachers using ICT more than classroom teachers (Guðmundsdóttir, 1999).)
Papanastasiou (2003) concludes that: ‘The relationship between computer use
and achievement is much more complicated than it might initially appear.’ (p.
331) and also that how computers are used is most important:
it must be challenging, focused on higher-order thinking skills, the teachers must be capable of using and teaching it and have the appropriate support. In other words, examining computer use or technology, by itself is not enough to determine its effects on student achievement. What seems to be important, however, is the way in which technology is used. While a number of factors may need to be addressed to improve science education, the appropriate use of computers and other technologies is an important way to upgrade science teaching and learning. (Papanastasiou, 2003 p. 326)
The Impact2 study involved 60 schools, (Harrison et al., 2002) and investigated
the relationship between attainment and ICT use. It showed a trend towards
higher gains with more use though there were notable variations, leading the
17
authors to suggest that further study of the practice within the schools is
needed.
Still there is not as yet a saturated pool of knowledge on how new technologies
can best be employed (Baggott La Velle et al., 2003; Livingstone, 2011). Cox
(2000) states that ‘ICT use in science education should evolve from the needs of
science and not vice versa’ (p.194). This is something that I think teachers will
agree with, that technology should not be employed because it is there but
because it can benefit the subject and the students in some way. From the
above mentioned studies on the extent of ICT use, it seems that teachers are
still not fully convinced that ICT use should be an integral factor in teaching
science. Teachers’ choices are contingent on their perception of usefulness
(Cox, 2000) so adding to the growing evidence that ICT use is beneficial to
learning and by conducting an intervention in an Icelandic context will hopefully
prove to be a worthy undertaking. Nothing similar to the proposed intervention
has been carried out in Iceland.
2.3. Extent of ICT use in science education
2.3.1. Internationally
It seems to be a concern in most countries that ICT is not used enough or not in
the ways that educators or policy makers would like to see. This concern can be
seen both in governmental reports and research papers, as reported below.
The extent of the uses of ICT is still relatively low in the Nordic countries, but as
these countries have a comparable society and education system it is likely that
the situation will be similar in Iceland. A Nordic report shows over 50% of pupils
in Finland, Iceland and Ålands Islands are using computers weekly or less in
school but other countries slightly more (Guðmundsdóttir et al., 2010). Two
recent studies with samples of 782 and 516 pupils showed that ICT is seldom
used in Norway (Lund et al., 2008 ). A Danish study also showed low levels of
use in science education (Brandt and Johansen, 2008). In a sample of 399
teachers in Finland only 7% used ICT occasionally (Aksela et al. 1999 in Lavonen
et al., 2003). A Finnish project (Lavonen et al., 2006) involving 25 teachers
18
changed teachers use of ICT over a range of applications from ‘never or
seldom’, to ‘seldom to occasionally’ meaning once or twice a week. Another
Finnish study showed that students were using ICT less in science than in
foreign language studies, Finnish language and humanities (Hakkarainen et al.,
2000). This same finding has been reported in the UK as well (Harrison et al.,
2002). McFarlane and Sakellariou (2002) however found a jump in the use of
ICT in science between 1998/9 to 1999/2000, stating it would be interesting to
know what kind of use was involved.
In the USA, Songer (2007) talks of the underuse of ICT in science teaching but
blames it on limited availability of software that fits the curriculum and
promotes thinking.
2.3.2. Iceland
Previous research on ICT use in Iceland is rather sparse, especially in science
education. Currently there are listed2 42 masters and doctoral theses on ICT
and only one from 2011 on the use of cameras is science related. Another one
from 2007 is maybe aptly named ‘This is just something on the side’. Iceland
participated in the SITES study (Pelgrum, 2001) which showed that Icelandic
schools seem to be very well equipped in terms of quantity of hardware. They
had the sixth best ratio out of 24 countries with 12 pupils to every computer
and 100% of schools had an internet connection. Furthermore 64% of schools
indicated that the internet was used with pupils for instructional purposes. The
study also showed that schools had high goals in regard to staff training but
poor realisation of those goals. Despite these positive numbers Jakobsdottir
(2001) describes how little computers had changed teaching practices .
In the context of science Stefánsson (2006) asked 15 year old students about
the role of ICT in their science lessons. The only reported use of ICT in science
lessons was finding references for essays. More evidence of ICT use can be
found from a large scale research project on science teaching in several districts
2 http://skrif.hi.is/rannum/rannsoknir/doktors-og-meistaraprofsritgerdir/ Website of The
Centre for Educational Research on ICT and Media at the University of Iceland
19
in Iceland (Macdonald, 2008b) where there was a focus on what ICT resources
were available and what role they played. The main findings include
Few classrooms have more than one computer though an increasing number have access to a data projector. There are some mainly content oriented web-based science materials in Icelandic developed by the NCEM and the School Web. (p.6).
A survey of 127 science teachers in compulsory schools showed that a third
used web-based learning resources, mostly the ones from NCEM as much or
very much, and 20 use it little or very little (Bjarnadóttir et al., 2007).
Sigþórsson (2008) observed and interviewed 23 teachers including seven
science teachers and reported that apart from finding references for essays the
use of ICT seems negligible. He also found that none of the teachers mentioned
the use of internet in their teaching. Only one incident of ICT use was observed
but there was some indication of the use of slideshows among the teachers.
Þórólfsson et al. (2009) carried out case studies of five teachers who all used
ICT in teaching but science specific uses were found to be weak or vague. One
school has been a lead school on the use of data loggers (Bjarnadóttir, 2007)
and there has been little evidence on that programme being disseminated to
more schools.
2.4. Factors affecting ICT use by teachers
Writing this review has felt like carrying coals to Newcastle as numerous studies
have explored this issue in both the context of science and other school
subjects. The studies reviewed here are either general ones (e.g. Ertmer, 1999;
Ertmer, 2005), in the context of innovative uses of ICT (Drent and Meelissen,
2008), a meta-analysis or reviews of a wide selection of studies (Hew and
Brush, 2007; Mumtaz, 2000; Bingimlas, 2009) an international comparison
study (Pelgrum, 2001) and then studies specifically in the context of science
(Rodrigues, 2006; Cox et al., 1999). The studies show a vast array of factors
affecting teachers´ technology integration. This review provides a background
for exploring what the factors are that affect Icelandic teachers.
20
The discourse on factors and conditions that affect teachers in technology
integration is often in terms of barriers and what factors impede teachers in
using ICT in teaching. Other studies focus more on what factors have been
found to facilitate ICT use.
The literature reviewed before the design of the research tools in this study
were all in the context of science teachers. The one that most influenced this
study is by Susan Rodrigues (2006, p.179) who puts forward
that informed integration and changes in pedagogical practice were due to six key factors: Relevance, Recognition, Resource, Reflection, Readiness and Risk.
More specifically the relevance of resources to teachers current teaching, the
recognition of peer expertise, readiness as in actively seeking change; risk, as in
the willingness to go outside the comfort zone and try new things.
In the context of science education Cox (2000) lists barriers detailed in official
reports and from school inspectors:
the generic software provided with the school´s network is all that
is needed for using ICT within school subjects
the ICT lessons should be independent of other science lessons
all pupils must be using the computer all the time during the
lesson
if the system does not work as anticipated, a whole lesson is
wasted
ICT is not relevant to the science curriculum
ICT does not contribute much to pupil´s learning of science
Casting the net further afield to include literature of teacher technology
integration irrespective of subject provides a plethora of models and
frameworks summarizing the many factors at play. The most extensive one is a
review of 48 empirical studies (Hew and Brush, 2007), in which 123 barriers
were found and categorized:
21
The lack of resources may include one or more of the following:
(a) technology, (b) access to available technology, (c) time, and (d)
technical support.
The lack of specific technology knowledge and skills, technology-
supported pedagogical knowledge and skills, and technology-
related-classroom management knowledge and skills.
Institutional barriers may include: (a) leadership, (b) school time-
tabling structure, and (c) school planning.
Attitudes and beliefs about the educational purpose of using
technology in the teaching and learning process
High stakes testing, leaving little time for new methods and failure
to recognise what role technology might play in preparing pupils
for testing.
Subject culture, not wanting to adopt new methods seen to be
incompatible with accepted methods.
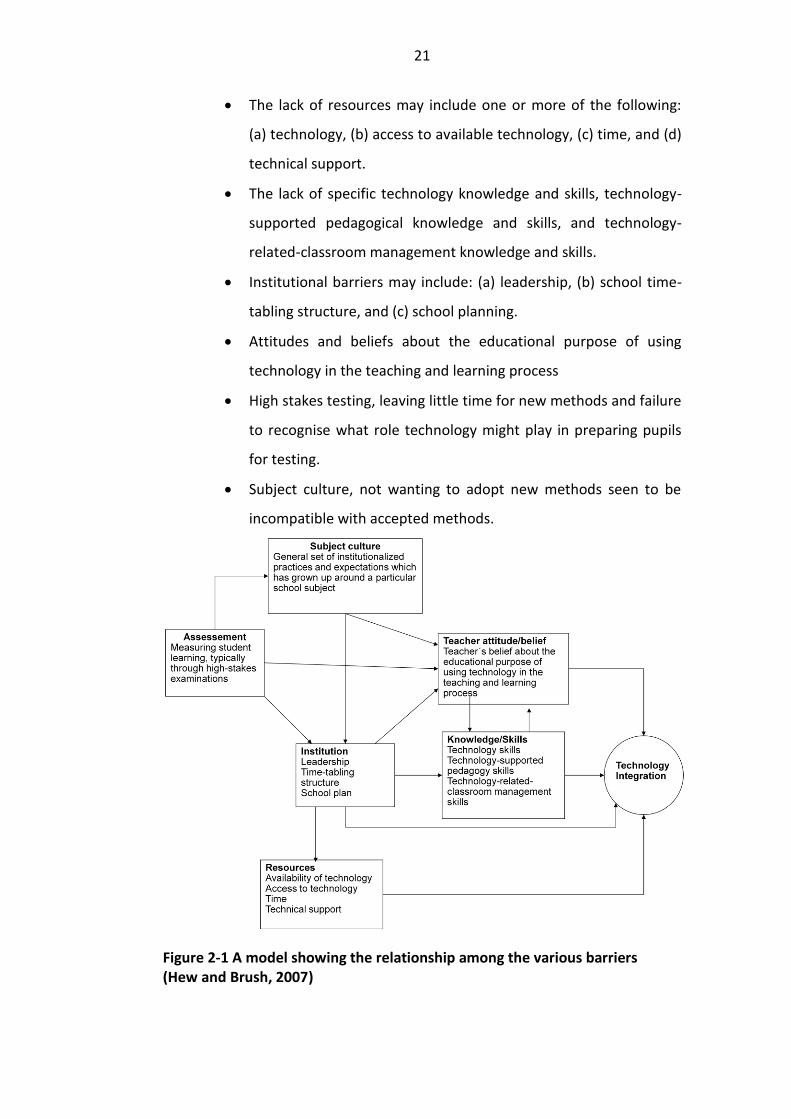
Figure 2-1 A model showing the relationship among the various barriers (Hew and Brush, 2007)
22
The factors that Hew and Brush (2007) found can be seen in Figure 2-1. In their
model (hereafter called HB model) technology integration is said to be directly
affected by the available resources, the institution, teacher attitude/belief, and
by knowledge and skills which in turn affect attitudes and beliefs. Teacher
attitudes are furthermore believed to be influenced by the subject culture,
assessment and the institution. The institution is in the model affected by
assessment; typically high stakes examinations. In addition the institution
directly affects the provision of resources and affects teacher knowledge and
skills through provision of professional development. Lastly, the subject culture
is said to affect the institution and is affected by assessment.
This review is roughly structured around this model with the exception of
assessment. As there are no high stakes testing in Iceland in science, there is
little likelihood of them having much effect. Factors assigned to the institution
are split into support and resources dependent on the context.
After a survey and case studies, Drent and Meelissen (2008) presented a model
showing the relationships of teacher level factors stimulating or limiting teacher
educators in innovative use of ICT. The four main factors in their model are:
ICT attitudes;
ICT competence – a small indirect effect ;
Pedagogical approach – where they found a direct but weak
relationship between student oriented approaches and innovative
ICT use;
Personal entrepreneurship - a key factor, ´ operationalized as the
number of contacts a teacher educator has (both inside and
outside the school) for professional development in the use of
ICT.´ (p. 195).
Through the use of case studies the importance of a reflective, active and
research-oriented attitude was revealed along with the practice of
experimenting with different ICT applications exploring their value for teaching.
School level factors were not found to have a direct effect on innovative
practices but rather influence them. The relationships are compared to a
23
cogwheel where a movement in one part of the system nudges it on to other
parts.
The following sections cover the aspects that proved to be relevant to the
Icelandic context, resources, subject culture, teacher knowledge and attitudes
from the HB model but also support separately and pupils as a separate factor.
2.4.1. Resources
In the HB model resources are identified as one of the four aspects that directly
affect technology integration. It almost goes without saying that schools need
to be provided with adequate equipment for the kind of computer use that the
curriculum suggests. Meelissen (2008) argues that in many developed countries
access to equipment is no longer a relevant issue. A recent Icelandic survey of
schools (in currently unpublished research) however revealed a similar trend
where 26.1% of teachers ranked better access to computers highest as the
factor that would encourage them to use more ICT in teaching. Other
equipment also scored high (Starfshættir í grunnskólum, nd)3. Having
equipment that works faultlessly is important. Science teachers have
complained of the time it takes to set up, put back and calibrate equipment and
of not having enough computers These complaints were all factors that
deterred the teachers from using computers (Tan et al., 2006). The availability
of relevant resources have been found to influence teachers classroom practice
(Rodrigues, 2006).
Time is a frequently cited factor affecting technology integration (Ertmer, 1999;
Hew and Brush, 2007; Rodrigues, 2007; Granger et al., 2002; Karasavvidis,
2009). Rodrigues (2006) found that teachers need time to practice and reflect,
and at the same time to have access to expertise and equipment as well as
opportunities for reflection through systematic follow up. A study by Haydn and
Barton (2008) showed time to be crucial factor during a CPD project where
teachers were given time to work collectively. Another time related issue is that
3 This is from a report made available to participants and published on the website of the
project Research on Practices in Compulsory schools. The researchers do not recommend referring to it as it is unanalysed data, but I will still do so where the numbers agree with and support the findings of the current study.
24
teachers feel they have limited time in the classroom because of an overfull
curriculum that does not allow time for flexibility (Karasavvidis, 2009; Baggott
La Velle et al., 2004).
2.4.2. Support
Many different kinds of support are needed for successful integration of
technology. Support in this context is a broad category including support both
in terms of where it originates and different kinds of support; administrative,
professional, technological and peer. In the SITES study (Pelgrum, 2001)
headteachers and technology experts believed that the most noteworthy were
not enough supervision staff, lack of technical assistance, insufficient teacher
time and insufficient technical support. When working with science specific
equipment technical training and assistance are specially important (Tan et al.,
2006).
When comparing how well schools managed an internet initiative Lawson and
Comber (1999) found that schools that had the most success had among other
things a whole hearted management support. Similarly Somekh (2008) reports
the vision and motivation of the principal to be of high importance. In the SITES
research, headteachers were more active in stimulating use of ICT in high ICT
using countries than in low using (Pelgrum and Voogt, 2009). The abilities to
build relationships and team spirit, to solve internal conflicts and improve
communication between staff have been found important characteristics of
headteachers in regard to ICT (Charalambous et al., 2011).
Peer support and collaboration were considered to be a crucial factor to
successful integration of ICT in a large UK initiative (Galanouli et al., 2004).
Various modes of peer support such as linking online, reflecting on practice,
sharing best practice and debating ideas are suggested by BECTA as ways to
help teachers use ICT (Scrimshaw, 2004). Lavonen et al. (2006) conducted a
project involving varied support for teachers. Their suggestions for a successful
project for teachers in the uses of ICT should include:
(i) empowerment (co-planning of the project and its activities, and dissemination, allocation of resources, and authentic evaluation); (ii)

25
communication (ensuring a flow of ideas and creativity, allowing communication and reflection in small groups and in optimal locations); and (iii) context (integration of ICT into teaching methods and cumulative development of competencies in the teachers who use it). (p. 159)
A master’s thesis showed that Icelandic headteachers held very positive views
of ICT and believed that technical integration is more developed than classroom
teachers belived. The author concludes that headteachers views will not
provide a barrier to further technology integration (Elfarsdóttir, 2005).
2.4.3. Subject culture
Hew and Brush (2007) identified subject culture as a barrier, defining it as:
‘General set of institutionalized practices and expectations which has grown up
around a particular school subject’. Ertmer and Ottenbreit-Leftwich (2010) take
that discussion further and point out the influence of peers, especially veteran
teachers that do not see the value of new ways´. This influence permeates not
only subject culture but also school culture. That is especially true for ICT that
often changes the traditional way of teaching. One of the barriers discussed by
Cox (2000) is the change to the teacher’s role from being in the leading role to
becoming a classroom manager and facilitator. Then again schools may have a
culture that embraces innovation. Nonetheless Ertmer and Ottenbreit-Leftwich
(2010) conclude that for the most part schools have not defined a way of
practicing and thinking about teaching that includes technology as an integral
tool for learning.
2.4.4. Teacher knowledge
To use technology in teaching, teachers need to broaden their knowledge and
skills. To change teacher practice teachers need to be approached both in
teacher training and in CPD (Ertmer and Ottenbreit-Leftwich, 2010).
Newton and Rogers (2003) talk about two sets of skills needed when working
with ICT. First teachers need an operational skill; that is knowing how to
operate computers and software. They also require application skills, what
teachers have to do and plan before working with pupils using ICT, identifying
the learning aims and objectives, organising lessons and tasks and then

26
supervising or teaching them. The authors include as application skills
knowledge and skills such as procedural understanding and problem solving
skills. They do not expand on other conditions that need to be in place, such as
teacher content knowledge or availability of equipment. A more detailed model
of teacher knowledge is the model of teacher technical pedagogical content
knowledge (TPCK) (Mishra and Koehler, 2006), expanding on the concept of
pedagogical content knowledge (Shulman, 1987). The TPCK model combines
the three areas of knowledge that are needed for technology integration.
Content knowledge (C), is about the actual subject matter that is to be learned
or taught. Pedagogical knowledge (P) is the deep knowledge about the
processes and practices or methods of teaching and learning and how it
encompasses, among other things, overall educational purposes, values, and
aims. Lastly technology knowledge (T) is about all technologies used in teaching
from books and blackboards, to software and hardware. This includes
knowledge that such things exist and how to operate them. Three sets of
knowledge result from their interaction (see Figure 2-2). PCK is pedagogical
content knowledge (Shulman, 1987) i.e. that is applicable to the teaching of
specific content, of pupils, strategies and preconceptions. Plainly speaking, it is
the knowledge of content and how to teach it.
Figure 2-2 Technological Pedagogical content knowledge (Mishra and Koehler, 2006)
Technological Content knowledge, (TCK) is knowledge about the manner in
which technology and content act upon each other ‘the manner in which the
27
subject matter can be changed by the application of technology’ (p.1028). This
in many ways corresponds to what Newton and Rogers call application
knowledge or knowing of the possible benefits and affordances that ICT may
hold for that content.
Technological Pedagogical Knowledge (TPK) is:
knowledge of the existence, components, and capabilities of various technologies as they are used in teaching and learning settings, and conversely, knowing how teaching might change as the result of using particular technologies. (Mishra and Koehler, 2006 p. 1028).
This matches the intrinsic properties that ICT may hold such as time saving or
automated responses.
Together these three form technological pedagogical content knowledge (TPCK)
which is different for every course, every teacher and working theory. It
involves a deep understanding of technology, content and pedagogy in order to
choose the appropriate suitable applications for the intended content for a
given group of pupils. This is though where the shoe does not fit as in other
research teacher knowledge is seen as a barrier to using ICT in schools (Hew
and Brush, 2007). Research has shown teachers to be far more concerned with
external factors, than their own knowledge on how to use ICT in teaching
(Thompson and Parrott, 2003).
The only Icelandic research I could find looking at factors affecting Icelandic
teachers was a master’s thesis (Jóhannsson, 2008). This thesis involving seven
teachers found that they were responsible for their own leaning and learnt
things as needed, both how to use computers and how they could be used in
teaching.
2.4.5. Teacher attitudes
Teachers’ attitudes and choices in regard to using ICT in science teaching and
their views have a central role in implementing new technologies (Hew and
Brush, 2007; Olson, 2000). Cox (1999) found that teachers’ use of ICT was
linked to their perception of its usefulness. Studies dealing with science
teachers and ICT shed light on teachers’ views of ICT. Teachers mentioned in
interviews how ICT can motivate and help students learn, especially about the

28
nature of science as well as providing a rich science learning environment and
the ability to make abstract concepts more understandable (Thompson and
Parrott, 2003). Teachers also value the quality of ICT work and efficiency, and
how it makes knowledge more accessible (Rogers and Finlayson, 2004). In
Baggot et al. (2004) teachers viewed ICT in science as a powerful tool to
facilitate learning.
2.4.6. Pupils
Pupils are not often mentioned directly as an influencing factor though their
education and well-being is one of the main reasons for developing better
schools. Cox, et al. (1999) suggest that pupils may influence teachers in their
use of ICT. Research suggests that pupils can be a powerful influence for either
preserving the status quo or promoting instructional change (Spillane &
Jennings 1997; in Spillane, 1999; McLaughlin & Talbert 1993).
2.5. Strategies to overcome barriers
Hew and Brush (2007) also review strategies to overcome the barriers: (a)
having a shared vision and technology integration plan, (b) overcoming the
scarcity of resources (equipment, access, time and support), (c) changing
attitudes and beliefs, (d) conducting professional development, and (e)
reconsidering assessments.
Programmes offering professional development are important as it changes
teachers and their practice (Borko, 2004). However is not enough to provide
equipment and training for integrating ICT into teaching but constant support
and opportunities to plan are just as important (Bennett, 2003).
A UK project where teachers were freed to explore ICT with other teachers
suggest that just giving teachers these means is a more successful way of
developing teachers and their practice than pre-described courses (Haydn and
Barton, 2008).
Bingimlas (2009) focuses on school and teacher level barriers in his review and
gives possible implications for schools and teachers for the integration of ICT
into education. His implementation suggestions include ’being open minded
29
towards new ways of teaching’ (p. 243) which he mentions after counting the
many barriers to technology integration. He goes on to suggest that ‘where
training is absent, teachers can prepare themselves by enrolling in private
sessions or by self training’ (p.243). These kinds of suggestions are hardly likely
to lead to large scale implementation of technology. Experience and research
has shown that individual efforts often peter out (Jóhannsdóttir, 1999). Large
scale top down implementation has proved to have limited effects or at least
not the revolutionary effects that were expected (Cuban, 2001; Lim and Chai,
2004). A group of Dutch scholars have developed the Four in Balance model
suggesting that both these elements are necessary:
The findings in this study show that most of the identified causal chains on the implementation of computer use involve both ‘top-down’ and ‘bottom-up’ elements. This means that for a successful implementation elements of both strategies are necessary. It can be concluded that both strategies are interrelated and can strengthen the outcome of the implementation process (ten Brummelhuis, 1995 p. 94).
The four in the name of the model refers to: vision, expertise, digital learning
materials and ICT infrastructure. Of these they claim ICT initiatives must begin
with the vision and expertise, the human factor. The objective must be taken
into consideration and then what equipment is needed. The Dutch group point
out what many have said before them, that technology driven initiatives have
had a high failure rate. The human factor includes facilities that match the
teachers, that teachers know how to use them, teachers believe in the added
value of the applications for education and that there is active leadership
(Kennisnet Foundation, 2011). They propose four items for more effective ICT
use in schools: leadership to involve followers; formal ICT training in teacher
education; linking pupils and teachers in digital learning environments and that
teachers need to find out and know what works in teaching. This knowledge
needs constant renewal with new technologies.
This section has set forth the relevant the different ways ICT may be used in
science education and relevant frameworks to. It has presented the literature
on factors affecting teachers technology integrations The next section presents
the methods employed in this study.
- 30 -
3. Methods
This chapter is in seven sections. First the aims and research questions are
outlined. Then frameworks for data collection are presented, the framework
includes three phases described in the next three sections and a section on
triangulation of the data of this study. The chapter ends with ethical
considerations.
3.1. Aims and research questions
As could be gauged in the introduction to this study, indications are that ICT is
not being used to its full potential in Iceland but no detailed research has been
done in the context of science. Nor is it known what it is that governs teachers’
decisions regarding their choice of teaching materials. The general aim of this
study is to explore the uses and advantages of ICT in science teaching and the
factors affecting its implementation in Iceland.
In the light of the general aims for this study the particular research questions
are:
1. How and to what extent is ICT used in lower secondary science teaching in
Iceland?
2. Within the Icelandic context what are the conditions that impact upon ICT
use in secondary science education?
3. After a technology supported science teaching intervention will there be
measurable differences in pupil achievement on school tests, between an
intervention group using digital learning resources and a comparison group
being taught in the usual way?
4. Will participation in such an evidence-based science teaching intervention
involving ICT have an impact upon science teachers’ practice?

- 31 -
3.2. Frameworks for data collection
The research programme for this study is planned in three interlinking phases:
survey of ICT use in science education in Iceland;
qualitative exploration of ICT use in science education in Iceland
(Interviews, focus groups, case studies);
intervention, exploring affordances and effectiveness of a
selection of DLR´s in science teaching.
Even though this study was planned and reported in three separate phases,
these phases are interlinked, complement each other and at the same time
answer different research questions. (Figure 3-1 and Table 3-1 provide an
overview of research questions and data collection). Some of the teachers
participated in all three phases, and insights from all data collection exercises
came together in the end to form integrated results. The initial plan was for the
intervention phase to be the main aspect of this study. However, it became
apparent early in the intervention that pupil scores on the tests would not be
linked mainly to effects from using ICT but that the teachers are also a very
influential factor in pupil achievement. This drew even more attention to the
teachers and though Phase II was planned more to complement the survey,
which it did, it also provided a basis for following a small number of teachers all
the way through the project. Piloting of the survey and participation in the
intervention with numerous interviews and observations gave rich data. Using
the lens of cultural historical activity theory (CHAT) the factors that affect
teachers´ use of ICT in science teaching were explored on a deeper level.
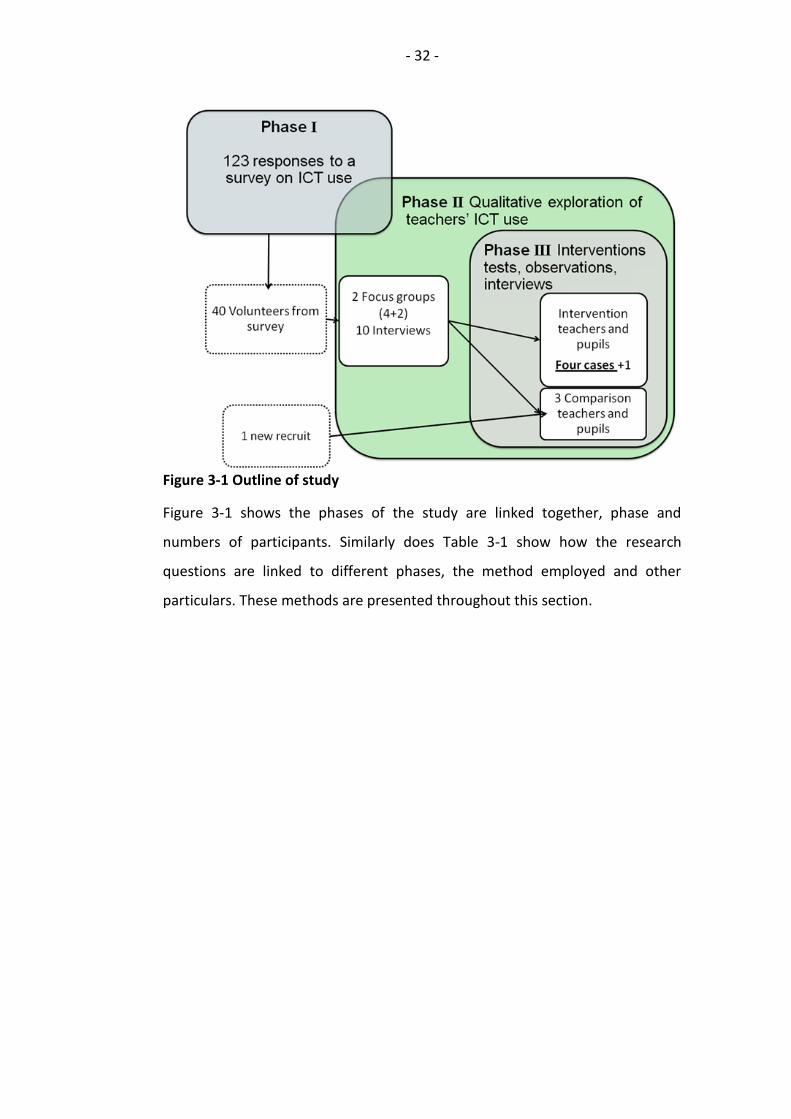
- 32 -
Figure 3-1 Outline of study
Figure 3-1 shows the phases of the study are linked together, phase and
numbers of participants. Similarly does Table 3-1 show how the research
questions are linked to different phases, the method employed and other
particulars. These methods are presented throughout this section.

- 33 -
- 33
-
Table 3-1 Overview of research questions and data collection
Research question Phase Data collection
method When Where and who Analysis
How and to what extent is ICT used in secondary science teaching in Iceland?
Survey
Phase 1 Questionnaire March 2009
Online- sent to all compulsory schools in Iceland
Produce tables and graphs
Use SPSS to explore relationships between available resources and attitudes to reported use.
Within the Icelandic context what are the conditions that impact upon ICT use in secondary science education?
Phase 2 Interviews and
focus groups
May- August
2009
Teachers identified from survey, their students
Link to questionnaire, code – opinions and experiences
After a technology supported science teaching intervention will there be measurable differences in pupil achievement on school tests, between an intervention group using digital learning resources and a comparison group being taught in the usual way?
Intervention
Phase 3
Pre- post test:
Observations: videos
Interviews:
Questionnaire: student attitudes.
Sept 2009 -May 2010
Iceland – teachers identified from survey, experimental group and comparison group for each intervention
Compare results from pre and post tests from both groups.
Compare responses to pre and post attitude questionnaire.
Will participating in such an evidence-based science teaching intervention involving ICT have an impact upon science teachers practice?
Delayed interviews May-June 2010
Compare uses and attitudes before and after intervention,
- 34 -
3.3. Phase I: Survey
A questionnaire was designed to give an overview and explore the existing
practises of ICT use in science education in Iceland addressing the first research
question (to what extent ICT is available and used in science teaching in
Iceland).
The online questionnaire was piloted with the researcher present by ten
science teachers in December 2008 resulting in some revisions before its final
administration (see Appendix A).
Background information was collected on the following variables: age; teaching
experience (both all teaching and science teaching specifically); education; and
school size. Teachers were asked in a matrix form what equipment was
available to them and how often they used it. The section ‘computer usage’
explored the extent of use of generic software and applications; what
applications; teachers knew and used both in their personal life, work and
teaching. The section ‘Internet use in science teaching’ asked teachers about
how frequently they used science specific software and applications but also
included the option ‘I do not know what this is’, because it was suspected that
teachers were not familiar with the different ways of using ICT for teaching
science. In order to get examples of how teachers use ICT they were asked to
describe a lesson involving ICT and science. The section ‘Recent use of ICT’
prompted teachers to describe a recent lesson where they had used some ICT
to teach science, this form of question was chosen to give more detailed
information about how teachers were applying ICT in their teaching than
multiple choice questions about access and frequency could provide. To make
sure that the descriptions were as similar as could be, the question was split
into eight parts: what the pupils were doing; the topic; what task; what
equipment and software was in use; what the teacher’s role was; and whether
the teachers thought the pupils had been engaged and whether the teacher
thought the pupils had learned anything. It was also intended that this question
would lead me to teachers that had developed successful ways of
implementing ICT into their teaching and could therefore provide insights for
- 35 -
design of the intervention part of this study. Next were two open questions
asking teachers what factors they believed hindered or facilitated their ICT use
in teaching science. To further explore factors that are believed to affect
teachers in using technology in teaching there was a question about what
support was available to them and what kind of training or CPD they had
received in using ICT in teaching both generally and science specifically. Next
were sections that explored teachers’ approaches and attitudes towards ICT
use. A list of 15 statements was provided asking teachers to agree or disagree
with on a five point Likert-scale.
The design and rationale for item format was found to be appropriate for the
information needed.4
3.3.1. Participants
Teachers of science to 12- 16 year olds in Iceland were asked to answer this
questionnaire. The target age group of 12-16 year olds was chosen because at
that age science is most often taught by a subject teacher, whereas younger
students are taught by the class teacher who teaches many subjects. It is
difficult to estimate the size of the population as no numbers are available on
how many science teachers teach the target group. A rough estimate, based on
experience and an exploration of school websites, would be 200-230 teachers.
Usually only one person teaches science in each school and it is only in the
larger schools that two to three teachers teach science.
3.3.2. Data collection
The survey was administered using the website http://surveymonkey.com in
March 2009. A web-link in an email was sent to 170 of the 176 compulsory
schools in Iceland, asking the recipients (headteachers or school secretaries) to
forward it to science teachers of 12–16 year olds. Those schools excluded did
not teach the target age group. A reminder was sent out two weeks later. The
4 This was discussed in my assignment titled: Questionnaires and Interviews: Two ways to look at the same thing , in 2009.

- 36 -
same message was also sent to the mailing list of FNG (Society of Science
Teachers in Compulsory schools). 137 people started to answer the
questionnaire and 123 completed it answering the majority of the questions.
Table 3-2 Responses to the survey
Collector Completed Begun
First email 84 93
Reminder email 26 31
FNG list 13 13
The main concern before the administration of the questionnaire was that only
ICT enthusiasts would respond but the high response rate has eradicated that
threat of bias.
3.3.3. Analysis
Answers from the survey website were downloaded to Microsoft Excel and SPSS
and analysed to answer the relevant research questions. Questions about
current conditions and practice give descriptive data presented mostly through
graphs and tables in section 4. Open questions such as ‘what factors do you
believe hinder you in applying more ICT in your teaching?’ were coded and
categorised into themes. The analysis of this question is presented in section
5.1 along with other data pertaining to the second research question about the
conditions that affect teachers in using ICT in science teaching.
3.4. Phase II: Qualitative exploration
The aim of Phase II was to follow up and get a more detailed picture of the
issues regarding ICT use in science teaching than survey data could produce. A
further aim was to put the findings from the survey into clearer perspective, as
well as to discuss issues in more depth than an online questionnaire allows. The
combination of data from multiple sources may be called triangulation, where
two methods complement each other or simply ‘two ways of looking at the
same thing’, the subtitle of my assignment. It seems that the bottom-line in
research is that methods should be chosen to fit the purpose (Gorard and
- 37 -
Taylor, 2004; Cohen et al., 2007). With that in mind this project was planned; so
the survey would provide an overall view and set the scene. Interviews and
focus groups would allow closer scrutiny of details. The purpose of talking to
teachers both individually and in groups was to identify the conditions which
affect teachers’ use of ICT in science teaching and to draw on their expertise in
successful ways of employing ICT. Talking to pupils would both draw out their
views as important players in this context and corroborate or put a different
perspective on teachers’ testimonies.
3.4.1. Sampling
As phases II and III overlap in terms of sampling, the whole sampling
procedure is presented here (see Figure 3-1). All participants in phase II and III
were found through the survey. At the end of the survey teachers were asked
to volunteer to participate in further stages of this project. A total of 41
teachers from all over Iceland volunteered.
The first interviews were meant to have a twofold purpose. The initial plan had
been to identify exemplary cases from the questionnaire, so as to draw on their
expertise in successful ways of employing ICT to inform the design and
implementation of the intervention phase. Secondly the intent was to identify
the conditions which affect teachers’ use of ICT in science teaching and for that
purpose a range of users was meant to be chosen. As it turned out, the level of
use did not vary to a great extent. The 22 volunteers from within 170 km of the
Great Reykjavik area (a trip manageable within one day) were approached
either for interviews or focus groups. The interviewees were chosen out of the
41 volunteers from the questionnaire to represent different genders, school
sizes, age and teaching experience. Thirteen teachers were approached and a
mutually convenient time could be arranged with ten of them.
The interviews and focus groups were conducted in late May 2009. This is a
very busy time for teachers, but teachers were quite happy to have me visit
them and it was relatively easy to organise the interviews for times that were
mutually convenient. On the other hand it was obviously much more time
consuming and difficult asking them to come to a set time for focus groups in
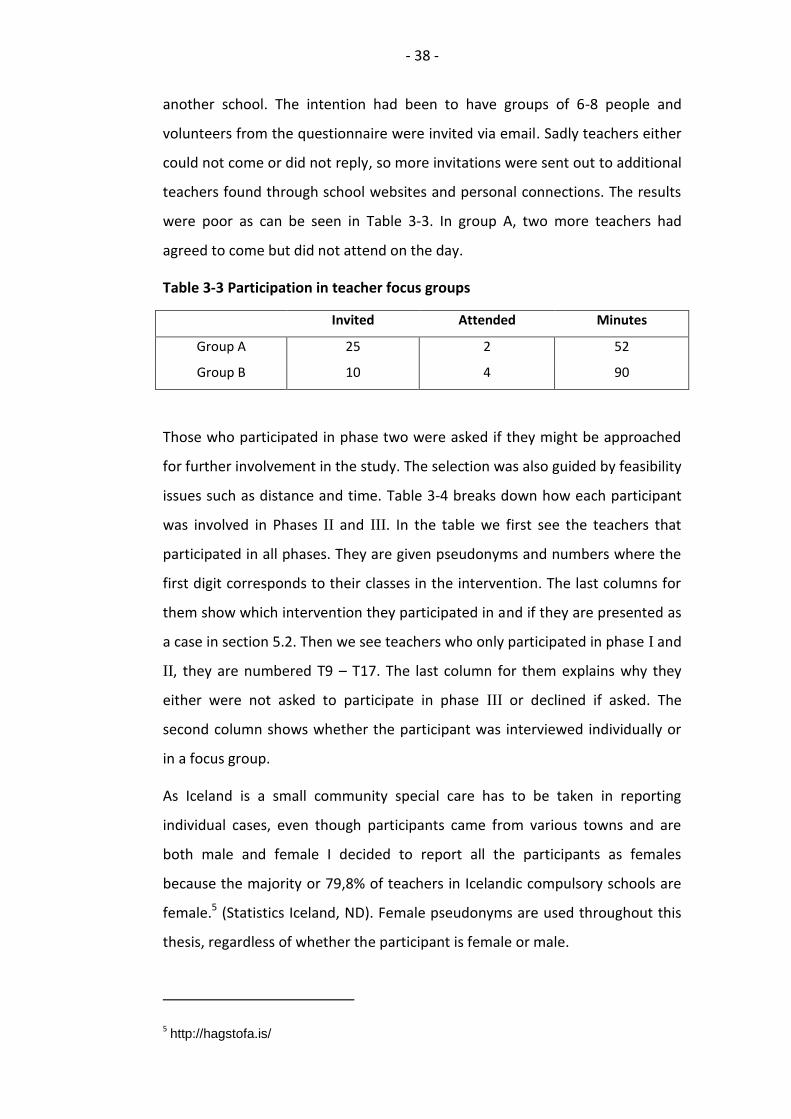
- 38 -
another school. The intention had been to have groups of 6-8 people and
volunteers from the questionnaire were invited via email. Sadly teachers either
could not come or did not reply, so more invitations were sent out to additional
teachers found through school websites and personal connections. The results
were poor as can be seen in Table 3-3. In group A, two more teachers had
agreed to come but did not attend on the day.
Table 3-3 Participation in teacher focus groups
Invited Attended Minutes
Group A 25 2 52
Group B 10 4 90
Those who participated in phase two were asked if they might be approached
for further involvement in the study. The selection was also guided by feasibility
issues such as distance and time. Table 3-4 breaks down how each participant
was involved in Phases II and III. In the table we first see the teachers that
participated in all phases. They are given pseudonyms and numbers where the
first digit corresponds to their classes in the intervention. The last columns for
them show which intervention they participated in and if they are presented as
a case in section 5.2. Then we see teachers who only participated in phase I and
II, they are numbered T9 – T17. The last column for them explains why they
either were not asked to participate in phase III or declined if asked. The
second column shows whether the participant was interviewed individually or
in a focus group.
As Iceland is a small community special care has to be taken in reporting
individual cases, even though participants came from various towns and are
both male and female I decided to report all the participants as females
because the majority or 79,8% of teachers in Icelandic compulsory schools are
female.5 (Statistics Iceland, ND). Female pseudonyms are used throughout this
thesis, regardless of whether the participant is female or male.
5 http://hagstofa.is/
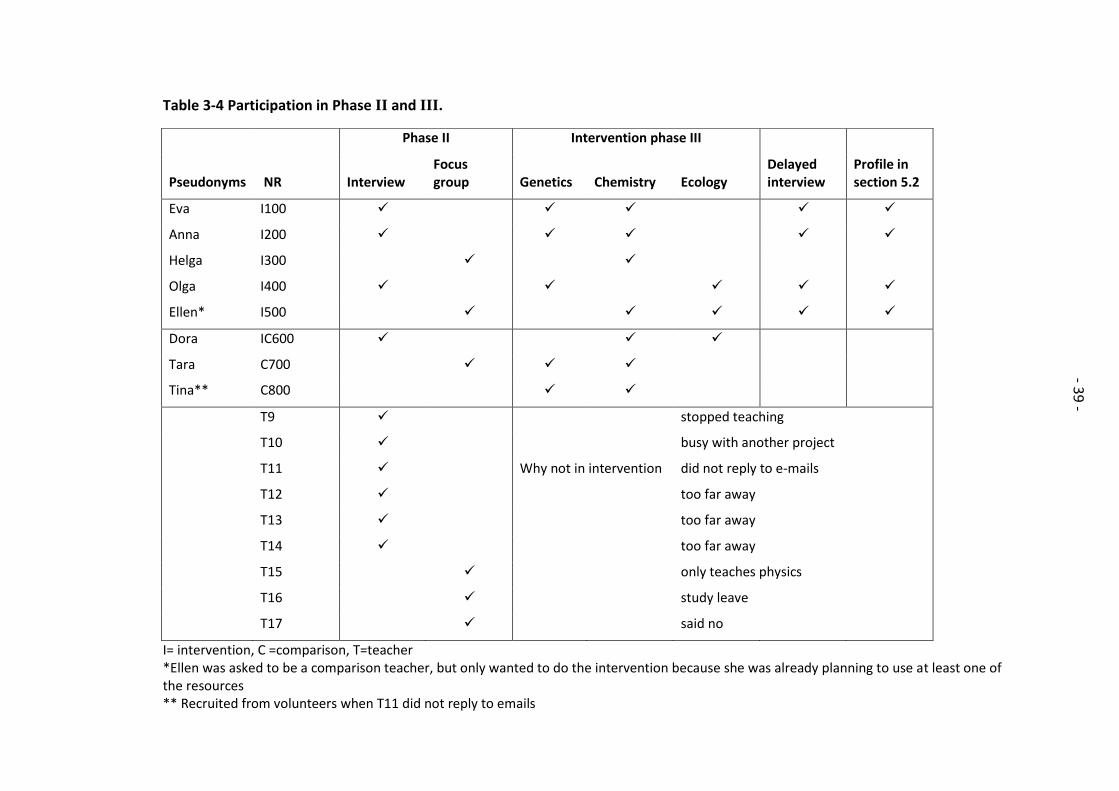
- 39 -
Table 3-4 Participation in Phase II and III.
I= intervention, C =comparison, T=teacher *Ellen was asked to be a comparison teacher, but only wanted to do the intervention because she was already planning to use at least one of the resources ** Recruited from volunteers when T11 did not reply to emails
Phase II Intervention phase III
Delayed interview
Profile in section 5.2 Pseudonyms NR Interview
Focus group Genetics Chemistry Ecology
Eva I100
Anna I200
Helga I300
Olga I400
Ellen* I500
Dora IC600
Tara C700
Tina** C800
T9
stopped teaching
T10
busy with another project
T11
Why not in intervention did not reply to e-mails
T12
too far away
T13
too far away
T14
too far away
T15
only teaches physics
T16
study leave
T17
said no
- 39
-
- 40 -
The group of volunteers might be considered skewed in two aspects. First that
perhaps their willingness to participate in a study about ICT use might stem
from their interest in the use of ICT. Secondly in the sense that nine of these
sixteen teachers (ten from interviews and six from focus groups) had some
form of further education, of which four were in science education.
3.4.2. Interviews
An interview schedule was prepared to address the aforementioned aims of
learning how they use ICT in their teaching and the conditions that affect them.
The interviews were semi structured; this approach was chosen for its flexible
nature as interviews are believed to be useful for many purposes to both gather
information and opinions, and explore experience, motivation and reasoning
(Drever, 2003). The items raised in the interviews were:
Teachers’ use of ICT in their science teaching: what; how; and,
why
knowledge of and availability of equipment and DLRs
knowledge and use of science simulations and data loggers
strategies and methods when using ICT
perceived level of personal technical expertise
perceived level of personal content knowledge
what factors most affected teachers’ decisions about ICT usage
role and availability of support
These items were not raised in any specific order. All interviews began by
asking them to describe their use of ICT. Different issues were then raised for
each teacher based on their responses to the questionnaire. As ICT use proved
rare and generic I tried to probe mostly what factors they believed were
hindering them by asking what they thought it would take for them to try out
more ICT based teaching and learning resources
Ten interviews were conducted (see sampling p. 37). The interviews lasted from
22 minutes to 49 minutes and took place in the participants’ classrooms which
also provided information about the availability of resources and access to
equipment. All interviews were audio recorded and transcribed.
- 41 -
These interviews also provided a more detailed background for the choice of
participants for the upcoming intervention. At the end of each interview
teachers were asked whether they would be willing and able to participate in
an intervention as either an experimental or a comparison teacher.
3.4.3. Teacher focus groups
Two focus groups with teachers were planned to further explore the same
issues as the interviews. Whereas the interviews provide rich data on
individuals, a focus group provides the opportunity for exchange of ideas and
opinions on top of ‘illustrating and confirming’ (Wolff et al., 1993 p.124) data
from the survey. The intention was not only to confirm findings from the
interview but also to unearth any contrasting views. Handbooks on focus group
discussion (see for example, Krueger and Casey, 2000) advise one that to get
participants talking, dichotomous questions should be avoided and teachers
should be encouraged to talk to each other to facilitate an exchange of
opinions. The composition of the group should be homogenous but with
enough variation for difference of opinion to be possible. With this in mind I
made sure to invite veteran teachers, newly qualified teachers, both genders,
and older and younger aged teachers.
A list of prompts was devised to get the groups talking about their experience
of using ICT. These prompts asked them to share their experience of using ICT
in teaching, to express their concerns regarding ICT use, what they thought
about the current extent and the future of ICT use in science teaching.
Both focus group interviews were held in science classrooms (see sampling p.
37). The sessions were audio-recorded and transcribed. I found that it was quite
easy to get Group B (which consisted of four people) talking but harder to keep
them on topic. Nevertheless a good discussion developed covering all kinds of
issues regarding the topic. The two people ‘group’ never had the elements
required to be a focus group, rather it functioned as an interview where they
quickly responded to the prompts for the focus groups. I also used items from
the interview schedule to keep them talking.
- 42 -
3.4.4. Pupil focus groups
Focus groups with pupils were also conducted in two schools. One from a
teacher who from the questionnaire appeared to be a high level ICT user and
another who seemed to be an average user.
The purpose of these focus groups was to collect pupils’ views on what kinds of
activities are perceived as useful or useless, engaging or boring, and also to
validate the questionnaire and interview data from their teachers. A list of
topics was compiled for the sessions to meet those aims. The teachers were
asked to nominate five to six pupils of mixed abilities and preferably those who
find it easy to articulate their opinions. In both schools I first asked the
headteachers for permission. The teachers then provided me with a list of
parents and phone numbers. I obtained verbal permission from the parents and
the pupils then brought written consent forms to the sessions. In school A we
were invited to use the library for the focus group. Eight pupils participated
from year 10 and the session lasted for 35 minutes. The teacher nominated
more pupils not trusting them to show up as the session was to take place at a
time they were free to go home. However all invited pupils attended. In school
B we were assigned a classroom. Six pupils participated, two from each year
group and the session lasted 34 minutes. In this school pupils were excused
from lessons to participate. Both sessions were audio-recorded and
transcribed. Excerpts from them were chosen to reflect the general views of the
groups and are presented in section 4.4. on pupils previous of experience ICT.
3.4.5. Analysis
All teacher interviews and focus groups were transcribed and then analysed
using NVivo by coding in recurrent themes what participants said. These
themes were largely pre-formed from the literature in section 2 but others
emerged from the data. This approach to analysing data has similarities to
grounded theory (Strauss and Corbin, 1990). This procedure has been
described, for example by Böhm (2004) and is similar to the one I followed. I
first looked at what issues were being addressed and categorised these. I then
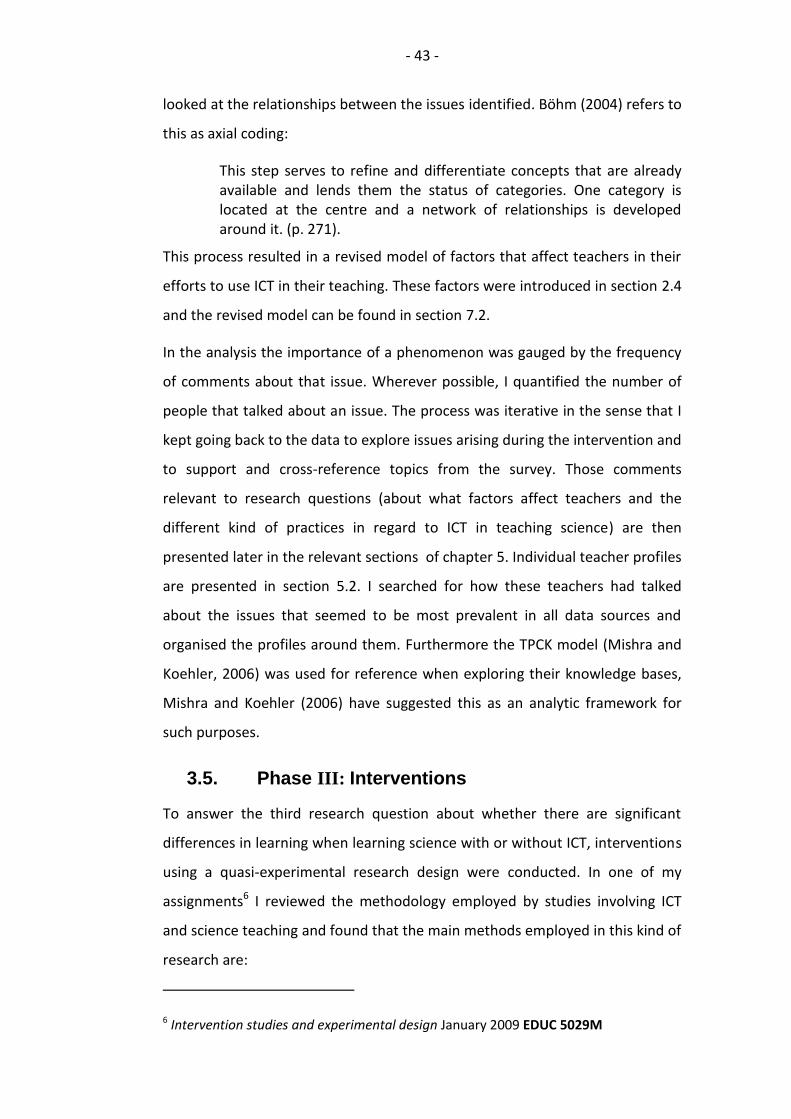
- 43 -
looked at the relationships between the issues identified. Böhm (2004) refers to
this as axial coding:
This step serves to refine and differentiate concepts that are already available and lends them the status of categories. One category is located at the centre and a network of relationships is developed around it. (p. 271).
This process resulted in a revised model of factors that affect teachers in their
efforts to use ICT in their teaching. These factors were introduced in section 2.4
and the revised model can be found in section 7.2.
In the analysis the importance of a phenomenon was gauged by the frequency
of comments about that issue. Wherever possible, I quantified the number of
people that talked about an issue. The process was iterative in the sense that I
kept going back to the data to explore issues arising during the intervention and
to support and cross-reference topics from the survey. Those comments
relevant to research questions (about what factors affect teachers and the
different kind of practices in regard to ICT in teaching science) are then
presented later in the relevant sections of chapter 5. Individual teacher profiles
are presented in section 5.2. I searched for how these teachers had talked
about the issues that seemed to be most prevalent in all data sources and
organised the profiles around them. Furthermore the TPCK model (Mishra and
Koehler, 2006) was used for reference when exploring their knowledge bases,
Mishra and Koehler (2006) have suggested this as an analytic framework for
such purposes.
3.5. Phase III: Interventions
To answer the third research question about whether there are significant
differences in learning when learning science with or without ICT, interventions
using a quasi-experimental research design were conducted. In one of my
assignments6 I reviewed the methodology employed by studies involving ICT
and science teaching and found that the main methods employed in this kind of
research are:
6 Intervention studies and experimental design January 2009 EDUC 5029M

- 44 -
Experiments; which are hardly ever used in educational research
due to difficulties in randomly assigning students to experimental
and control groups.
Pre-experiments; which are often used but have no comparison
group and usually a focus on designing software or applications.
Quasi-experiments; which are often used, with
control/comparison groups consisting of intact classes, data
collection is done with pre- and post-tests and most often
combined with interviews and/or observations.
So for the intended purpose a quasi-experimental design was deemed
appropriate and doable with intact classes, using pre- and post tests as
measuring tools. As the intention was to explore how existing applications can
be integrated into current practice, an important aspect was getting the
teachers’ views on the exercise through interviews. Furthermore
questionnaires were administered to students which investigated their
attitudes to whether learning with ICT affects their views on learning in science
and their views on learning using the websites.
Instead of one larger intervention this phase consists of a series of micro
interventions. A number of reasons were behind this decision. In a short, well
focused intervention it seemed more likely that the ICT use would be the
deciding factor on achievement than in a longer one where many other factors
might interfere. It was thought easier to get teachers to participate in short
interventions which would not really disturb their coverage of the syllabus. As
the intention was not to design a new application and my main interest lies in
the overall usefulness of using ICT in teaching a series of smaller interventions
using a selection of DLRs would give a broader picture of benefits. Bearing in
mind that students tend to find new things exciting to begin with, a short
intervention might capitalise on that effect.
3.5.1. Participants
Of the 16 participants in Phase II, all nine suitable candidates were asked to
participate in the intervention. Table 3-4 (p. 39) shows all the participants and

- 45 -
the reasons for those not chosen. All but one of them (T17) agreed to
participate. A teacher (T11) then later dropped out as she did not reply to
emails. She was then replaced by one of the initial volunteers (C800) from the
same area and age group as the dropout. Helga (I300) and Ellen (I500) were
both initially approached to be in the comparison group but as they had both
previously used the websites planned for the intervention they were moved to
the experimental group. Three lived too far away for me to go there frequently
for observations of lessons; two were not teaching at all that winter; one only
taught physics; and one was planning another project that promised to take up
much of her time. The interventions the teachers participated in depended on
whether they were teaching the chosen topics in the school year 2009-2010.
The aim when assigning teachers to conditions was to have in both groups
teachers with long and short experience of teaching science, both genders and
similar experience of using ICT in their teaching. As is turned out the group was
too small to fulfil these criteria so they were only used as an approximation.
Table 3-5 outlines the participants in the intervention and the data collected for
each participant. In the numbering system the first number refers to the
teacher the second to the topic and the last to separate classes from the same
teacher. For example class 320 and 321 and both taught by Inga teacher 300,
they participated in the second intervention and the last number distinguishes
between the two classes. INT refers to an intervention class whereas COMP
refers to a comparison class.
- 46 -
- 46
-
Table 3-5 Outline of intervention data
Genetics Chemistry Ecology
Teacher
Class
Pre and post test
Pupil questionnaire
Pupil interviews
Obser-vations Class
Pre and post test
Pupil questionnaire
Pupil interviews
Obser-vations Class
Pre and post test
Pupil questionnaire
Pupil interviews
Obser-vations
Interven
tion
(INT)
Eva 110 3x40 min 120 3x40 min
Anna 210 2x80 1x40 220 * 2x40 min
Inga 320 2x40 min
321 2x40 min
Olga 410 3x40 min 430 3x40 min
411 3x40 min 431 ** 1x40 min
Ellen 520 2x80 min 530 *** 1x80 min
Dora 620 1x40 min
Co
mp
arison
(CO
MP
)
Dora 621 1x40 min 630 1x40 min
631 1x40 min
Tara 710 1x40 min 720 1x40 min
Tina 810 1x80 min 820 2x80 min
811 2x40 min
* no post-test ** no pre-test *** pupil interviews could not be arranged same pupils as I520
- 47 -
3.5.2. Choice of topics and digital learning resources
For this intervention a selection of websites were chosen. The criteria behind
their choice were that they had to be readily available, without cost to
teachers, and preferably in Icelandic or involving little use of language. They
should target different topics from the National Curriculum and age groups that
would make it possible for a teacher to participate in more than one topic. The
websites should have a different focus and preferably demonstrate one of the
reported affordances from the literature. I also considered that they could be
taught early in the school year so my timing and the teacher’s planning would
coincide, but that did not happen as teachers themselves decide when to cover
different topics and there were all kinds of variations. I also wanted
applications that from my experience are not widely used and the survey shows
are not popular. Though data loggers are a very science specific application
they were ruled out due to them not being available in schools. Besides this
point, there is an ongoing project in Árbæjarskóli in Iceland (Bjarnadóttir 2007)
where the use of data loggers is being piloted. Although the questionnaire only
gave some examples, but still the indication is quite strong that teachers are
not using interactive simulations, quizzes or learning websites so the chosen
applications are of this ilk and available free online. It became apparent to me
that using one application is not effective in terms of exposing teachers to
many possible uses of ICT in science education. I therefore suggested several
websites for each topic, but for each topic there was one website that all were
required to use. The websites used are outlined in Table 3-6 but a detailed
description of them and the reasons behind their choice follows in the next
sections.
Five of these resources are in English and one is written in Icelandic. The survey
has already shown that 60% of teachers agreed or strongly agreed with the
statement ‘Most of my pupils can use software in English’, 23% were not sure
and 15% disagreed. The websites in English do not rely on language and all
relevant instructions were translated on worksheets to make sure everyone
could use the websites.
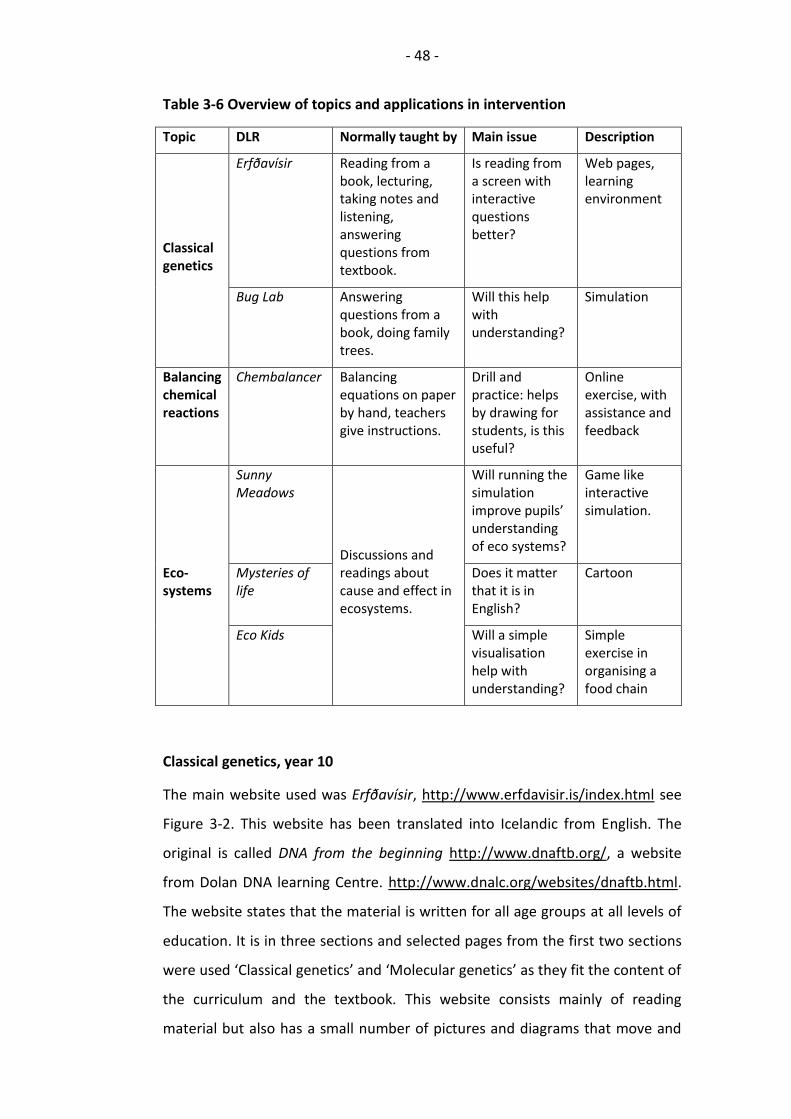
- 48 -
Table 3-6 Overview of topics and applications in intervention
Topic DLR Normally taught by Main issue Description
Classical genetics
Erfðavísir Reading from a book, lecturing, taking notes and listening, answering questions from textbook.
Is reading from a screen with interactive questions better?
Web pages, learning environment
Bug Lab Answering questions from a book, doing family trees.
Will this help with understanding?
Simulation
Balancing chemical reactions
Chembalancer Balancing equations on paper by hand, teachers give instructions.
Drill and practice: helps by drawing for students, is this useful?
Online exercise, with assistance and feedback
Eco-systems
Sunny Meadows
Discussions and readings about cause and effect in ecosystems.
Will running the simulation improve pupils’ understanding of eco systems?
Game like interactive simulation.
Mysteries of life
Does it matter that it is in English?
Cartoon
Eco Kids Will a simple visualisation help with understanding?
Simple exercise in organising a food chain
Classical genetics, year 10
The main website used was Erfðavísir, http://www.erfdavisir.is/index.html see
Figure 3-2. This website has been translated into Icelandic from English. The
original is called DNA from the beginning http://www.dnaftb.org/, a website
from Dolan DNA learning Centre. http://www.dnalc.org/websites/dnaftb.html.
The website states that the material is written for all age groups at all levels of
education. It is in three sections and selected pages from the first two sections
were used ‘Classical genetics’ and ‘Molecular genetics’ as they fit the content of
the curriculum and the textbook. This website consists mainly of reading
material but also has a small number of pictures and diagrams that move and

- 49 -
multiple choice questions where the text turns red if the response is wrong or
the user is taken to a response page with more reading material if he/she
answers correctly. A worksheet was written to help pupils navigate the web,
give the lesson a purpose and keep the pupils on task7.
Baggott and Nichol (1998) criticized many CD-ROMs for being little more than
books on a screen and this website has little to offer beyond books. My interest
in including this resource in the study was to explore whether reading the
subject material from a website on a computer screen beside the small
interactive features this website has, is in any way better than the normal way
of lecturing, and reading and answering questions from a book.
Figure 3-2 Screenshot from Erfðavísir
Teachers were also introduced to the simulation Bug Lab
http://www.channel4.com/learning/microsites/G/genetics/activities/shockwav
e-bug.html an interactive simulation with built in tasks or experiments for
pupils to solve. The simulation is in English and the user can manipulate the
bugs’ environment, choose bugs to see their genotype and see phenotype ratio
as the simulation runs (see Figure 3-3). A worksheet was written to help pupils
navigate the simulation and give translations of the more difficult concepts.
7 Supplementary materials can be found at http://svavap.wordpress.com/edd-thesis/
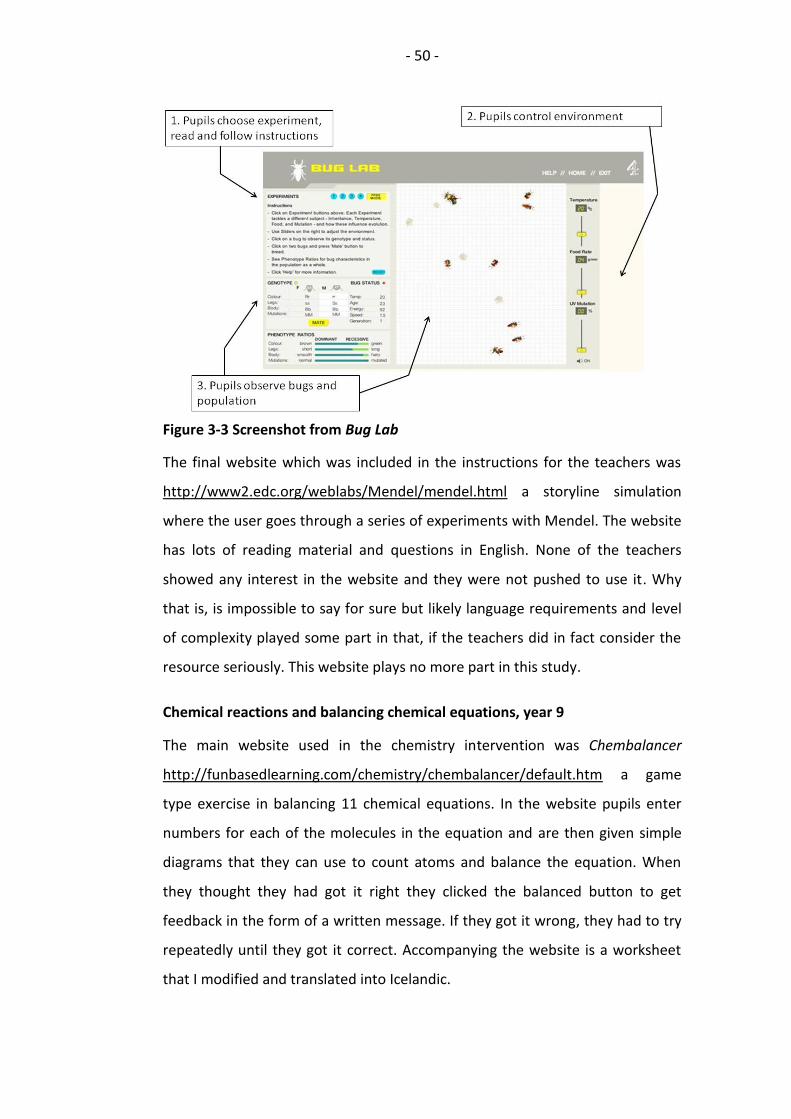
- 50 -
Figure 3-3 Screenshot from Bug Lab
The final website which was included in the instructions for the teachers was
http://www2.edc.org/weblabs/Mendel/mendel.html a storyline simulation
where the user goes through a series of experiments with Mendel. The website
has lots of reading material and questions in English. None of the teachers
showed any interest in the website and they were not pushed to use it. Why
that is, is impossible to say for sure but likely language requirements and level
of complexity played some part in that, if the teachers did in fact consider the
resource seriously. This website plays no more part in this study.
Chemical reactions and balancing chemical equations, year 9
The main website used in the chemistry intervention was Chembalancer
http://funbasedlearning.com/chemistry/chembalancer/default.htm a game
type exercise in balancing 11 chemical equations. In the website pupils enter
numbers for each of the molecules in the equation and are then given simple
diagrams that they can use to count atoms and balance the equation. When
they thought they had got it right they clicked the balanced button to get
feedback in the form of a written message. If they got it wrong, they had to try
repeatedly until they got it correct. Accompanying the website is a worksheet
that I modified and translated into Icelandic.
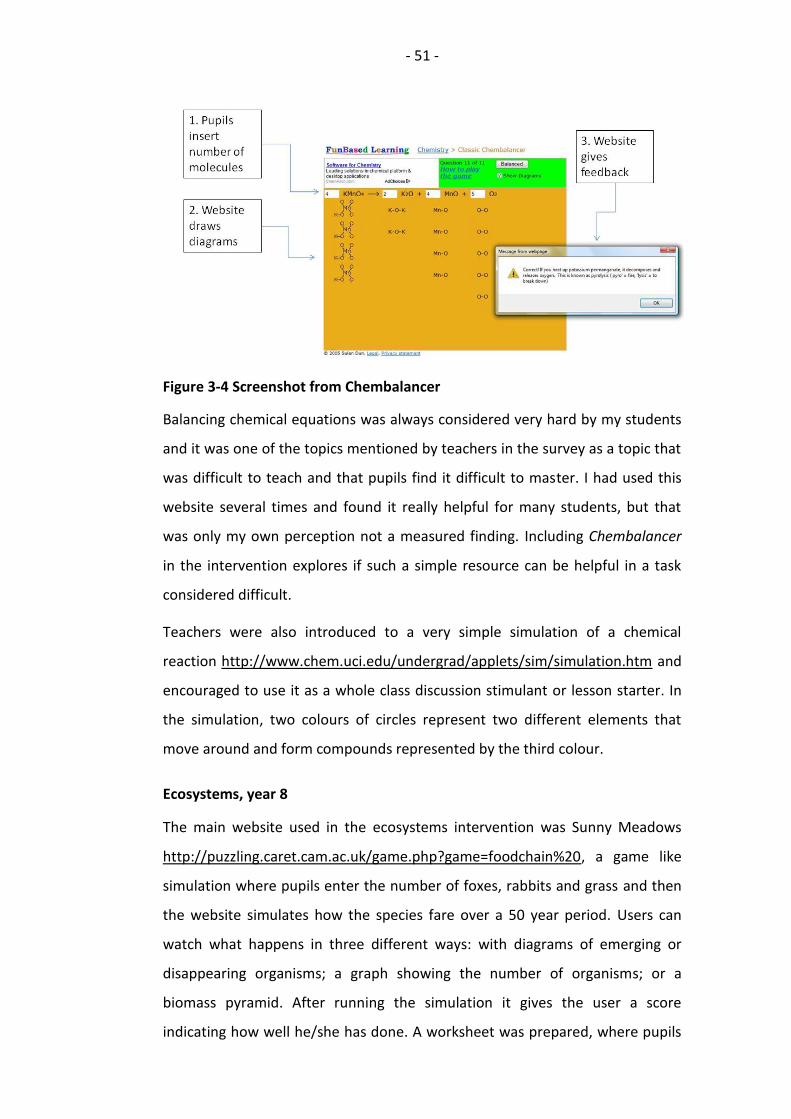
- 51 -
Figure 3-4 Screenshot from Chembalancer
Balancing chemical equations was always considered very hard by my students
and it was one of the topics mentioned by teachers in the survey as a topic that
was difficult to teach and that pupils find it difficult to master. I had used this
website several times and found it really helpful for many students, but that
was only my own perception not a measured finding. Including Chembalancer
in the intervention explores if such a simple resource can be helpful in a task
considered difficult.
Teachers were also introduced to a very simple simulation of a chemical
reaction http://www.chem.uci.edu/undergrad/applets/sim/simulation.htm and
encouraged to use it as a whole class discussion stimulant or lesson starter. In
the simulation, two colours of circles represent two different elements that
move around and form compounds represented by the third colour.
Ecosystems, year 8
The main website used in the ecosystems intervention was Sunny Meadows
http://puzzling.caret.cam.ac.uk/game.php?game=foodchain%20, a game like
simulation where pupils enter the number of foxes, rabbits and grass and then
the website simulates how the species fare over a 50 year period. Users can
watch what happens in three different ways: with diagrams of emerging or
disappearing organisms; a graph showing the number of organisms; or a
biomass pyramid. After running the simulation it gives the user a score
indicating how well he/she has done. A worksheet was prepared, where pupils
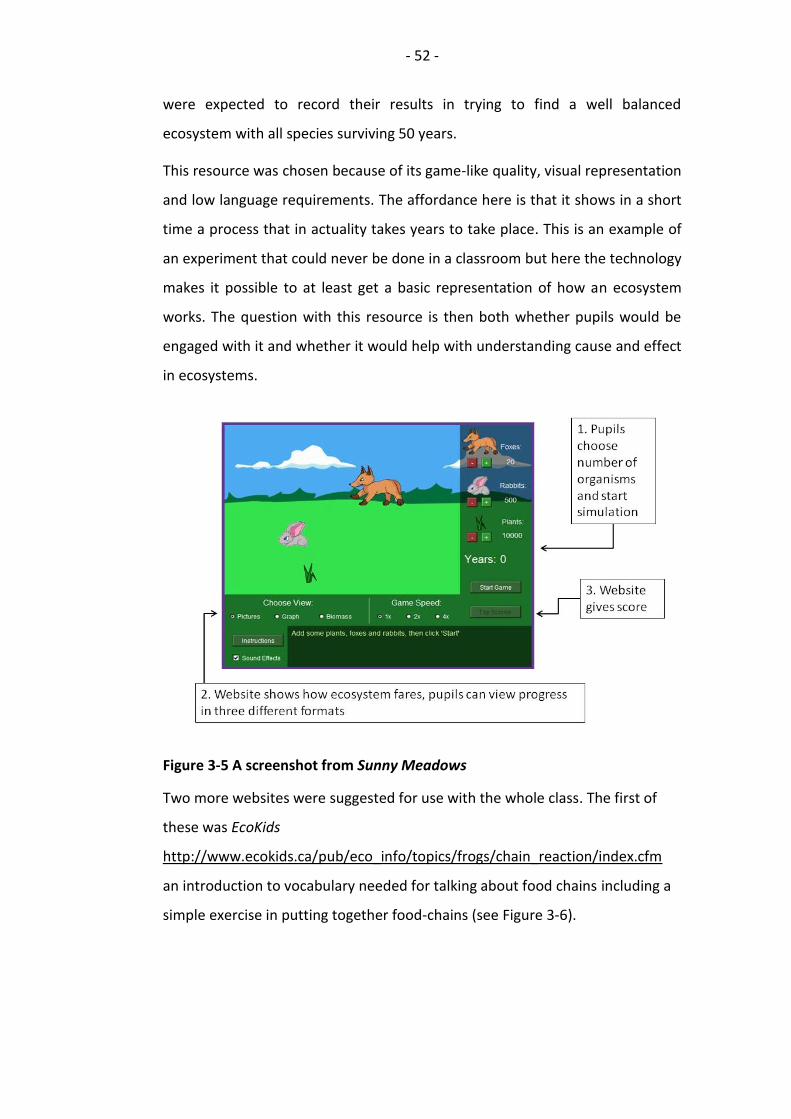
- 52 -
were expected to record their results in trying to find a well balanced
ecosystem with all species surviving 50 years.
This resource was chosen because of its game-like quality, visual representation
and low language requirements. The affordance here is that it shows in a short
time a process that in actuality takes years to take place. This is an example of
an experiment that could never be done in a classroom but here the technology
makes it possible to at least get a basic representation of how an ecosystem
works. The question with this resource is then both whether pupils would be
engaged with it and whether it would help with understanding cause and effect
in ecosystems.
Figure 3-5 A screenshot from Sunny Meadows
Two more websites were suggested for use with the whole class. The first of
these was EcoKids
http://www.ecokids.ca/pub/eco_info/topics/frogs/chain_reaction/index.cfm
an introduction to vocabulary needed for talking about food chains including a
simple exercise in putting together food-chains (see Figure 3-6).
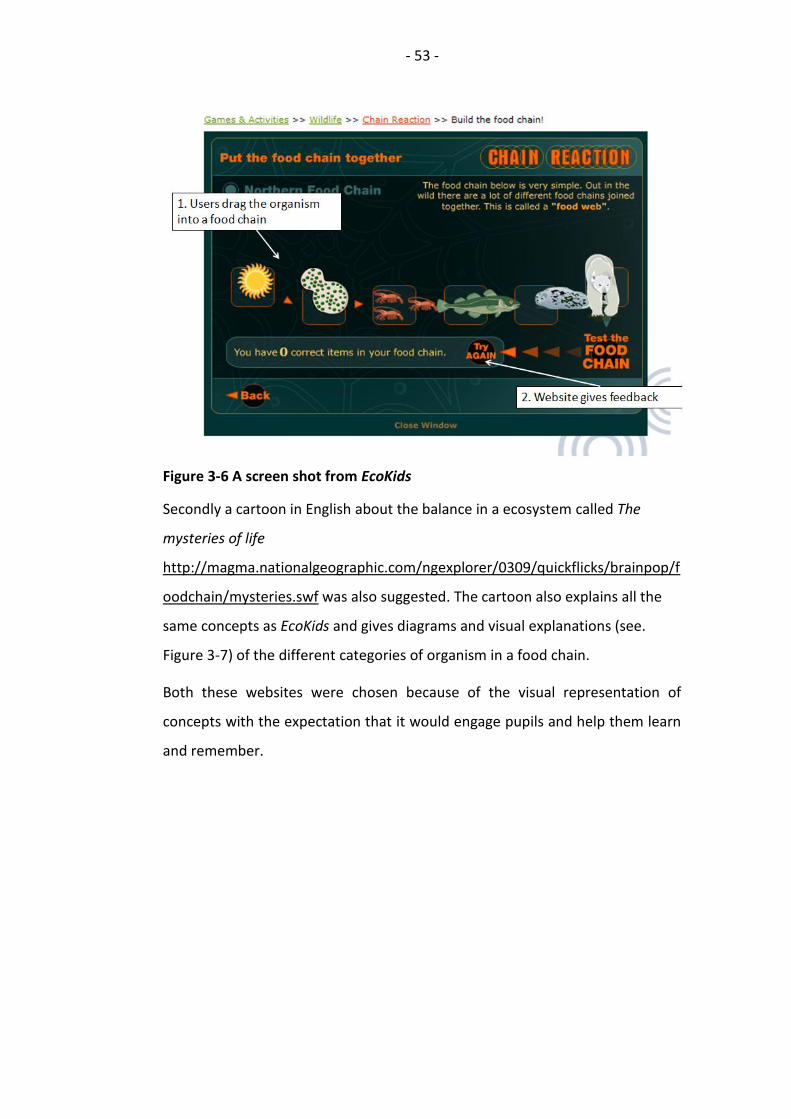
- 53 -
Figure 3-6 A screen shot from EcoKids
Secondly a cartoon in English about the balance in a ecosystem called The
mysteries of life
http://magma.nationalgeographic.com/ngexplorer/0309/quickflicks/brainpop/f
oodchain/mysteries.swf was also suggested. The cartoon also explains all the
same concepts as EcoKids and gives diagrams and visual explanations (see.
Figure 3-7) of the different categories of organism in a food chain.
Both these websites were chosen because of the visual representation of
concepts with the expectation that it would engage pupils and help them learn
and remember.
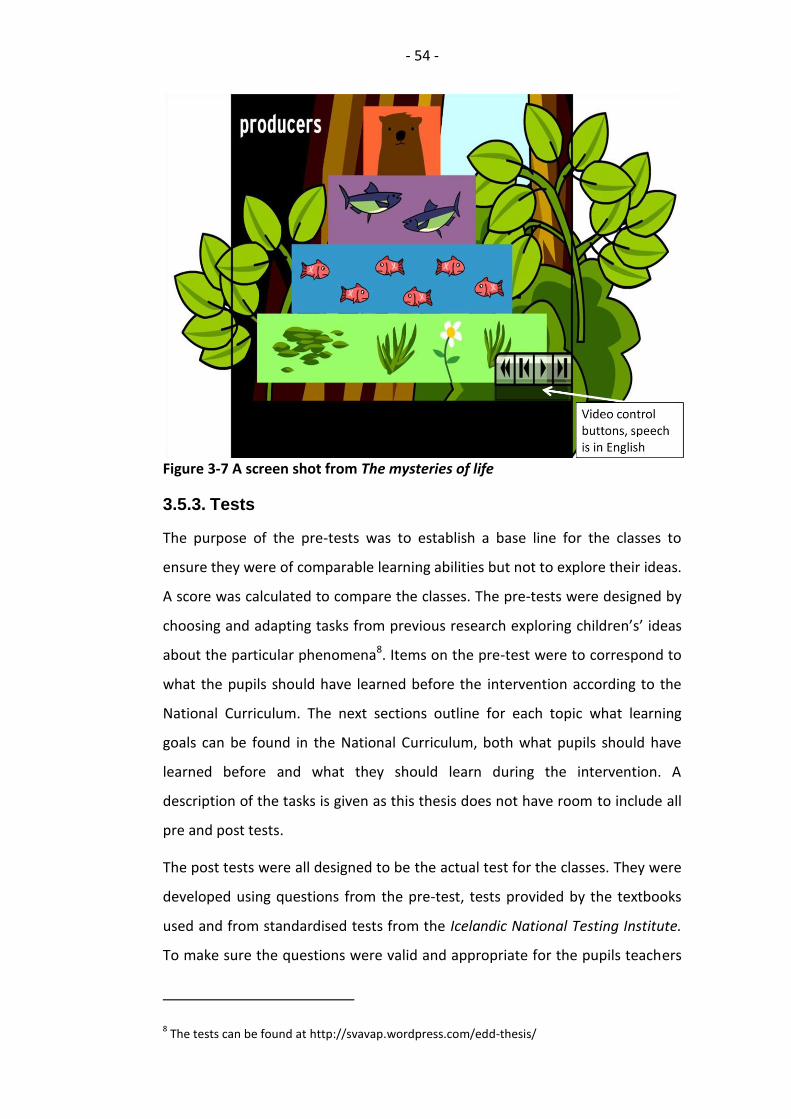
- 54 -
Figure 3-7 A screen shot from The mysteries of life
3.5.3. Tests
The purpose of the pre-tests was to establish a base line for the classes to
ensure they were of comparable learning abilities but not to explore their ideas.
A score was calculated to compare the classes. The pre-tests were designed by
choosing and adapting tasks from previous research exploring children’s’ ideas
about the particular phenomena8. Items on the pre-test were to correspond to
what the pupils should have learned before the intervention according to the
National Curriculum. The next sections outline for each topic what learning
goals can be found in the National Curriculum, both what pupils should have
learned before and what they should learn during the intervention. A
description of the tasks is given as this thesis does not have room to include all
pre and post tests.
The post tests were all designed to be the actual test for the classes. They were
developed using questions from the pre-test, tests provided by the textbooks
used and from standardised tests from the Icelandic National Testing Institute.
To make sure the questions were valid and appropriate for the pupils teachers
8 The tests can be found at http://svavap.wordpress.com/edd-thesis/

- 55 -
were asked for comments about content and the length of the tests. For all the
tests an answer sheet was prepared. For open ended tasks a system was
worked out for each item so the score would be higher the more understanding
pupils showed in their responses. For example:
0 points = no answer or wrong answer
1 point = partial understanding
2 correct answer
3 or more points if the question asked for explanation or asked for
more than one item.
Multiple choice questions or selections from lists were scored 1 point for a
correct answer. The points were then added up, divided by the total number of
possible points and multiplied by 10 so the test scores were on a scale of 1-10.
As the tasks on the tests differed this in reality gives an ordinal scale where
there is no certainty that the intervals between numbers represent equal
difference in pupil achievement. Still for this kind of study it is the best that can
be done. The scale was used to make the different test-scores as comparable as
possible. An added benefit was that this scale is the most common one used in
Icelandic schools so all parties involved knew what they represent, that is the
proportion of right answers.
Genetics: The subject of genetics is taught in year 10 of compulsory education
but pupils should have been introduced to some basic ideas of inheritance
before that. Pupils after year 7 should know that offspring inherit
characteristics from their parents (Menntamálaráðuneytið, 2007). In middle
school (years 4-7) pupils should learn that characteristics are determined by
genes that are inside cells and realise that DNA (erfðaefni) controls genetics of
organisms.
In research on children’s ideas in genetics, data collection is most often done by
interviews trying to elicit the pupils’ understanding of the phenomena (Venville
et al., 2005). This provided some difficulties in compiling a written pre-test with
the purpose of comparing quantitatively children’s ideas about basic genetics.
- 56 -
Questions were either adapted to the written format or new tasks were
composed to meet the above aims. The test had five sections:
can pupils differentiate between a collection of organisms
(containing DNA) and material things (not containing DNA) (nine
items)?
can pupils differentiate between genetically inherited traits and
socially and culturally acquired traits, four items (based on
Venville et al., 2005; Solomon et al., 1996)?
do pupils know how cell, gene, chromosome, DNA look and their
location? One task making diagrams and another ordering these
things by size (based on Lewis and Wood-Robinson, 2000; Saka et
al., 2006).
do pupils know the role and importance of DNA and genes, four
items (based on Lewis and Wood-Robinson, 2000)?
do pupils have an idea about gender decision, inheritance and
chance (two items)?
The post-test included most of the same questions in addition to typical
multiple choice questions both from the teaching guide that accompanies the
textbook and some questions from standardized tests of science from previous
years.
Chemistry: Middle school pupils are supposed to have learned about changes
of chemical state and that mixing two chemicals may result in a new chemical
with new properties (Menntamálaráðuneytið, 2007). Chemical change and
chemical equations are to be taught in year 8-10. The pre-test consists of two
sections. First a task from Stavridou and Solomonidou (1998) where pupils are
asked to categorise 19 instances of everyday phenomena, ten of which
represent chemical change and nine physical changes. Before taking the pre-
test the pupils have already studied changes of state of matter and 2–3 years
earlier they have studied solutions so it was expected that they would
recognise these phenomena. Pupils were marked for recognising a minimum of
instances, placing these into categories and naming the categories correctly.
The second section was a collection of multiple choice questions about
- 57 -
conservation of matter (Holding, 1985). The third task involved pupils
recognising a diagram of a chemical reaction (Agung and Schwartz, 2007).
Post-test: As the web page used in this intervention only helped pupils
balancing chemical equation it would have been sufficient to have pupils solve
a few equations to determine their ability to successfully solve them. However
in order to increase the likelihood of the pupils taking the task seriously the
teachers were provided with a test which included the categorisation task from
the pre-test, some of the questions on conservation of matter and other
questions about chemical change mostly from standardized tests in science.
Also included were four chemical equations to be solved. Most of the teachers
administered the test without any changes but all included enough of the same
questions to provide comparable grades for all the groups. A grade was
calculated for the questions that all teachers included and also a grade for
solving the four chemical equations.
Ecology: The National Curriculum expects that pupils should learn about food
chains and food webs in middle school and that species interact with each
other. The concept of ecosystem is to be introduced in years 8-10 along with
the effects of disruptions to food chains and webs (Menntamálaráðuneytið,
2007).
The pre-test was about choosing species for an ecosystem. In the original task
(Leach, 1995) pupils were asked to choose six organisms, and asked ‘what does
it need?’ and ‘where do they get it from?’. This was not included as the point of
the pre-test was only to establish a baseline for the classes. Pupils were asked
to choose six organisms and the choices scored were a food chain, including a
producer – a herbivore – a carnivore, which gave full marks. Fewer categories
were given lower scores. Three open questions were also included probing
pupils’ understandings about the workings of ecosystems.
On the post-test the same task was given but pupils were also asked to form a
food chain and answer collection of multiple choice questions from the
teaching guide that accompanies the textbook. In addition they were asked two
- 58 -
questions from standardized tests of science from previous years and two
questions related to disruptions in an ecosystem.
3.5.4. Pupil questionnaires
Pupils completed questionnaires at the beginning of the intervention about the
extent of ICT use and their views on ICT use before the intervention. These
were administered along with the pre-test.
After the intervention they completed a questionnaire with open questions
about the tasks they had done during the intervention. These questions
differed for the experimental classes and the comparison classes. The
comparison classes were asked about how they liked the topic, what they
thought of answering questions from the textbook, lectures and discussions in
class and whether they had done anything else while working on the topic. The
experimental classes were asked also about the topic, lectures and discussions,
but then about each ICT website they had used. The questions were very open
encouraging pupils to express their opinions. Lastly all classes were asked what
resources they had used to study for the test to gauge their trust in the
resources.
3.5.5. Data collection
After the teachers had agreed to participate in the intervention their
headteachers were approached by e-mail and in some cases also in person or
by telephone. All head teachers gave permission readily. In one council was it
necessary to notify school authorities more formally. The Icelandic Data
Protection Agency was notified of the study. Before data collection, pupils took
home consent forms for parents to sign, which the teachers then collected.
As this study has a quasi-experimental design where the use of ICT resources is
the independent variable it was important that guidance and counselling to the
teachers was controlled and as similar as possible. For this purpose a guide was
written for each intervention, which detailed learning goals as stated by the
curriculum, a rough outline of possible lessons, links to the websites they were
to use with accompanying worksheets and a further list of links to other useful
- 59 -
websites. I visited the teachers once before each intervention to go through the
instructions and how the intervention would proceed. Otherwise
communication with them was mostly through email but also by phone. A
website was set up where both comparison and experimental group of teachers
had access to all materials they were to use. Teachers were asked to administer
the pre-test and the attitude questionnaires before they started work on the
topic. By having such limited contact with the teachers and not having them
meeting as group made the circumstances more realistic as science teachers
usually work alone, thus reducing the effects of being in an experiment (Shadish
et al., 2002).
During each intervention I strived to visit and interview both intervention and
comparison teachers at least twice to observe and videotape key lessons (see
Table 3-5, p. 46 ). Firstly to observe a regular lesson and secondly to observe
lessons where ICT resources were in use. Regular lessons were observed to see
the teacher’s pedagogical styles, to gauge their grasp of the topic and to
observe pupil work and engagement. The same purpose applied to observing
the ICT lessons plus keeping a special eye out for pedagogic strategies the
teachers might employ and pupil interaction with the websites.
The observed lessons were videotaped in whole or part. The purpose of the
videotaping was to have a record of the lessons for later reference. As so many
factors were under observation taking only field notes did not promise to catch
all aspects and would not allow later comparison. The camera used was a Nikon
E90 ab, which can only take 20 minute clips at a time. This was sufficient but
required monitoring to restart it after the 20 minutes. It rarely mattered as in
the middle of the lesson the pace seldom changed but it was most important to
see transitions, that is when the class was given new instructions and how a
task was started and wound off.
During and after each observation I made notes, focusing on things like:
how the lesson was structured;
had the teacher prepared for the lesson and thought it through;
how comfortable the teacher was with the technology;
- 60 -
how proficient the teacher was with the lesson content basing my
opinion on how and if they used science vocabulary and concepts,
did they use examples not from the textbook, did they answer the
pupils’ questions correctly, did they understand pupils’ questions
and seem to have an idea about what misconceptions they were
dealing with;
what tasks the teacher gave the pupils, and how the tasks were
presented;
what the pupils were doing, were they working on the tasks, did
they ask questions;
in ICT based lessons especially, I tried to hear whether the pupils
were using science concepts and if they seemed to be engaged in
the task and stayed on the website.
All the time I had in mind, that if significant difference between the groups
were found, what might explain these differences apart from different teaching
materials.
To collect information about other lessons not observed the teachers were
asked to make a record of the number of lessons used for the topics and what
learning resources were used. Only two teachers did so but as the intervention
progressed I relied more on gathering this information from interviews during
the last visit to collect tests and administer questionnaires.
Post interviews: After each lesson I asked the teachers some questions. To the
comparison teachers I mostly asked if this was a typical lesson, if these were
typical tasks given to pupils, and if they used any other resources. To the
experimental teachers I usually asked what they thought of the lesson, what
went well and what would they do differently next time. Experimental teachers
were also asked if they would use this website again. Did they think the
worksheet helped and if they planned to do anything more on this topic? If
something had caught my attention during observation I also asked them for
clarification on something they or their pupils had done during the lesson.

- 61 -
Post-tests: The teachers administered the post-tests. All the teachers used the
whole test that I provided and all except one used it as part of their
assessment. This teacher only told the pupils as they were starting the test that
is was not part of their assessment.
The post attitude questionnaires were administrated by me whenever
possible. I explained to pupils that their opinions were valuable for my study
and asked them to explain in detail what they thought. By being present I
hoped they would more freely express their opinions as I collected the sheets
and not their teacher. I also interviewed a group of pupils asking them to
expand on the open questions from the attitude questionnaire, as well as
discussing with them their views of computers both for learning and fun. Here
the teachers were asked to nominate five pupils of mixed abilities who were
likely to express themselves freely. Talking to pupils in person gave the
opportunity to probe their opinions further as it was suspected that they would
not give very detailed opinions and observations in writing. I could not meet
Ellen´s pupils, a second visit was not possible as the school year was drawing to
an end (for overview of interviews see Table 3-5, p.46). Instead I talked to some
of them during the last observation, but as I was starting to hear the same
things again data saturation seemed to have been reached so I most likely did I
not miss any new information.
3.5.6. Analysis
Analysis- pupil questionnaire
Pupils answered open questions about the DLRs used in the interventions and
for comparison, about other learning resources or teaching methods used.
Open ended questions were thematically coded and categorised by how
positive pupils were towards the learning resource or teaching method being
used. The questions were phrased ‘*name of resource*. What did you think of
it? Why?’. Pupils were asked to be as specific in their answers as they could be.
Many gave explicit answers but still a large number did not refer to specifics,
rather giving responses such as ‘it was fine’ or ‘it was boring’. The responses
were categorised by how positive or negative they were:

- 62 -
Very positive replies: pupils liked the resource AND thought it had
in some ways been helpful for learning.
Positive responses: pupils liked the resource OR thought it had in
some ways been helpful for learning
Mixed feelings: had both positive and negative factors, for
example, ‘I liked the task though I did not really understand it, it
was so difficult’ or ‘it was boring but I got it’.
Rather negative replies gave a specific reason, often that the topic
was difficult.
Very negative replies: negative without saying why, replies such as
‘boring’ ‘I don’t like science’.
Statistical treatment of test scores
All test scores were entered into Microsoft excel and SPSS statistical software.
Table 3-7 gives an overview of the statistical tests used in this study. Pre-test
mean scores were compared with an independent t-test between conditions.
This ascertained the extent to which the groups were comparable at the
beginning of the intervention, in terms of having similar knowledge of
prerequisites or similar pre-conceptions. To further explore if there were any
significant differences between the classes, a one way analysis of variance
(ANOVA) with a Games Howell post-hoc procedure was conducted. The Games
Howell procedure does not assume equal variance between samples and is
appropriate for this sample where variance was not equal in all cases. Post-test
scores were similarly explored with independent t-tests conducted to compare
mean test scores between conditions. Furthermore the classes were compared
by one-way analyses of variance. The size of the effect of the independent
variable, if any, is determined by Cohen´s d. For the purposes of this analysis, a
Cohen´s d value between 0-0.20 is a weak effect, a value of 0.21-0.50 is
considered a modest effect, 0.50-1.00 a moderate effect and all values over
1.00 a strong effect (Cohen et al., 2007 p. 520).
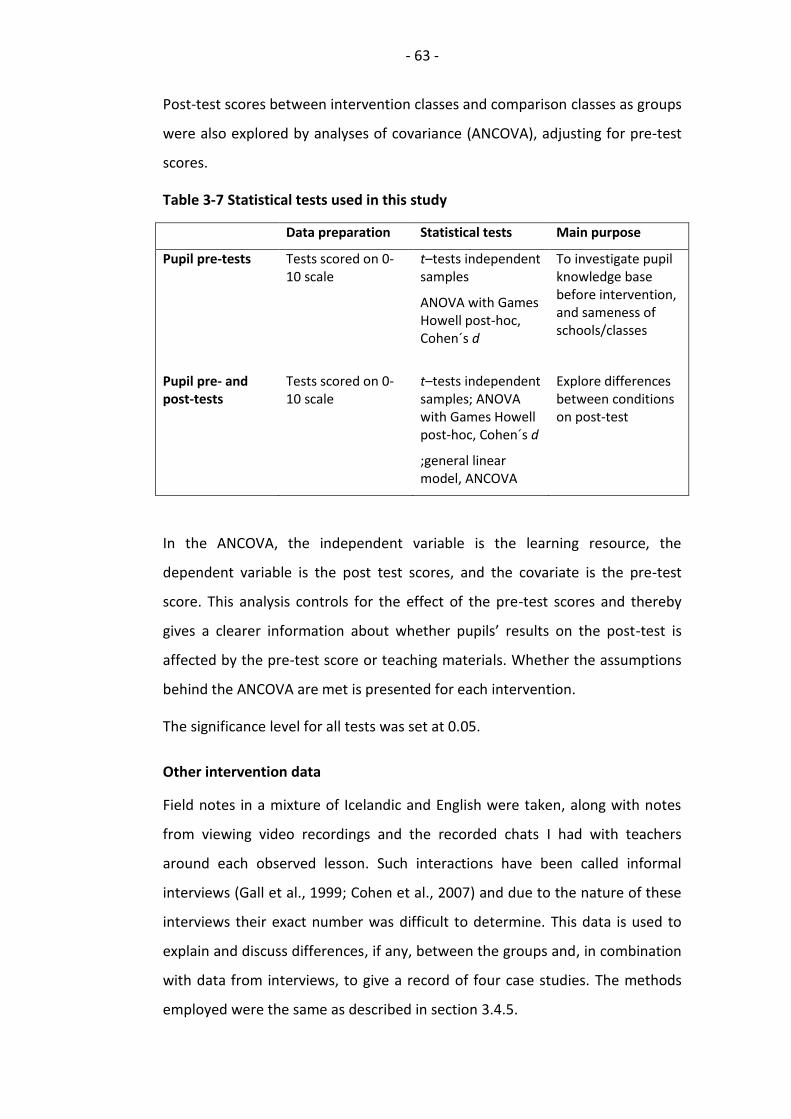
- 63 -
Post-test scores between intervention classes and comparison classes as groups
were also explored by analyses of covariance (ANCOVA), adjusting for pre-test
scores.
Table 3-7 Statistical tests used in this study
Data preparation Statistical tests Main purpose
Pupil pre-tests Tests scored on 0-10 scale
t–tests independent samples
ANOVA with Games Howell post-hoc, Cohen´s d
To investigate pupil knowledge base before intervention, and sameness of schools/classes
Pupil pre- and post-tests
Tests scored on 0-10 scale
t–tests independent samples; ANOVA with Games Howell post-hoc, Cohen´s d
;general linear model, ANCOVA
Explore differences between conditions on post-test
In the ANCOVA, the independent variable is the learning resource, the
dependent variable is the post test scores, and the covariate is the pre-test
score. This analysis controls for the effect of the pre-test scores and thereby
gives a clearer information about whether pupils’ results on the post-test is
affected by the pre-test score or teaching materials. Whether the assumptions
behind the ANCOVA are met is presented for each intervention.
The significance level for all tests was set at 0.05.
Other intervention data
Field notes in a mixture of Icelandic and English were taken, along with notes
from viewing video recordings and the recorded chats I had with teachers
around each observed lesson. Such interactions have been called informal
interviews (Gall et al., 1999; Cohen et al., 2007) and due to the nature of these
interviews their exact number was difficult to determine. This data is used to
explain and discuss differences, if any, between the groups and, in combination
with data from interviews, to give a record of four case studies. The methods
employed were the same as described in section 3.4.5.
- 64 -
3.6. Triangulation
This study draws upon many different data sources and methods which are
meant to support each other or triangulate with each other. Bloor et al. (2001)
declare triangulation a buzzword; with an uncertain definition, nonetheless it is
omnipresent in research handbooks. Cohen, Manion and Morrison (2007) say:
Triangulation may be defined as the use of two or more aspects of data collection in the study of some aspect of human behaviour. .....By analogy, triangular techniques in the social sciences attempt to map out, or explain more fully, the richness and complexity of human behaviour by studying it from more than one standpoint and, in so doing, by making use of both quantitative and qualitative data. (p. 141)
They go on declaring it to be a powerful way of demonstrating validity but Bloor
et al. disagree here:
Research methods are not readily substitutable: in any given research setting one particular method will be more suitable for the particular research topic than any other (this is, after all, why research texts are read). Why then should we reject the findings that are the product of a superior method simply because they have not been confirmed (triangulated) by an inferior method? (2003, p. 13).
However they do agree that triangulation has its merits, namely that by
corroborating findings from one method with findings from another method
reduces the likelihood of measurement bias.
In the design of this study a guiding principle has been to look at one problem
from all angles, to have findings from quantitative methods supported by
qualitative methods and vice versa. Data from interviews are used in this study
to support and triangulate findings from the survey. Data from pupil focus
groups support findings from tests, which yet again are made clearer with data
from observations and interviews. The methods all support and extend each
other. The conclusions of my essay on questionnaires and interviews was that
in both Gorard (2004), Gorard (2007) and in Cohen et al. (2007), the idea that
research methods should be selected to fit the purpose is a main idea (p. 153,
354, 408, 413). From that perspective, the confluence of data from a
questionnaire, with a quantitative approach and from semi-structured
interviews with a significant qualitative element was chosen as a doable and
sensible undertaking. Though now I would add, having seen firsthand how all
- 65 -
the different actors in educational research affect each other, that pure
statistical data have a poor chance of answering complex questions about a
complex reality.
3.7. Ethical considerations
In all research with people there are bound to be ethical issues to consider. In
this study there are many participants and every possible precaution has been
taken to interact with them in a fair and ethical way. Ethical approval was
gained from AREA Faculty Research Ethics Committee University of Leeds
(Ref:AREA 11-074) and the Icelandic Data Protection Agency was notified of my
project with a detailed description and was accepted without comments.
The issues I considered in regard to teachers were mostly how to preserve their
anonymity as was discussed previously in this chapter but also to not make
unfair demands on their time and commitment. The latter proved a strange
dilemma. Finding the right balance was at times difficult when trying to get
teachers to fully commit to the project, in terms of familiarising themselves to
the resources and being fully prepared to use them in teaching. Regular
procedures such as those described in most research handbooks (see for
example Cohen et al., 2007), were observed. Teachers were informed about the
purpose of the study and how data will be handled. They signed a written
consent form that informed them of their right to withdraw at any given
moment.
The ethical issues considered in regard to the students were that their studies
would not be disrupted in any way. The topics covered in the intervention
would have been taught anyway and are part of the National Curriculum.
Another consideration was that the experimental group might be getting a
preferential treatment, assuming beforehand that the intervention was better
than the traditional way of teaching. Furthermore the experimental group and
the comparison group came from different schools to avoid the comparison
group becoming de-motivated as computer use is still considered fun by
teenagers. Parental consent was acquired in writing for all pupil participation

- 66 -
and school administrators were asked for permission to work with the pupils
through email and sometimes in person.
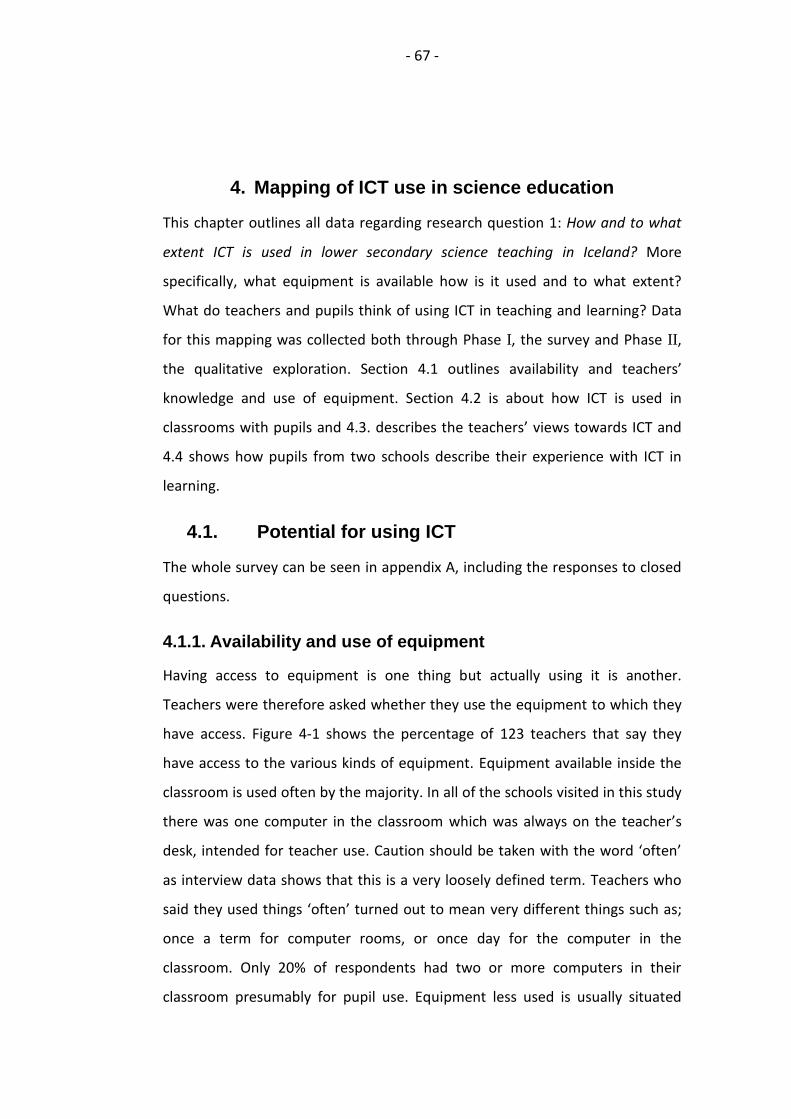
- 67 -
4. Mapping of ICT use in science education
This chapter outlines all data regarding research question 1: How and to what
extent ICT is used in lower secondary science teaching in Iceland? More
specifically, what equipment is available how is it used and to what extent?
What do teachers and pupils think of using ICT in teaching and learning? Data
for this mapping was collected both through Phase I, the survey and Phase II,
the qualitative exploration. Section 4.1 outlines availability and teachers’
knowledge and use of equipment. Section 4.2 is about how ICT is used in
classrooms with pupils and 4.3. describes the teachers’ views towards ICT and
4.4 shows how pupils from two schools describe their experience with ICT in
learning.
4.1. Potential for using ICT
The whole survey can be seen in appendix A, including the responses to closed
questions.
4.1.1. Availability and use of equipment
Having access to equipment is one thing but actually using it is another.
Teachers were therefore asked whether they use the equipment to which they
have access. Figure 4-1 shows the percentage of 123 teachers that say they
have access to the various kinds of equipment. Equipment available inside the
classroom is used often by the majority. In all of the schools visited in this study
there was one computer in the classroom which was always on the teacher’s
desk, intended for teacher use. Caution should be taken with the word ‘often’
as interview data shows that this is a very loosely defined term. Teachers who
said they used things ‘often’ turned out to mean very different things such as;
once a term for computer rooms, or once day for the computer in the
classroom. Only 20% of respondents had two or more computers in their
classroom presumably for pupil use. Equipment less used is usually situated
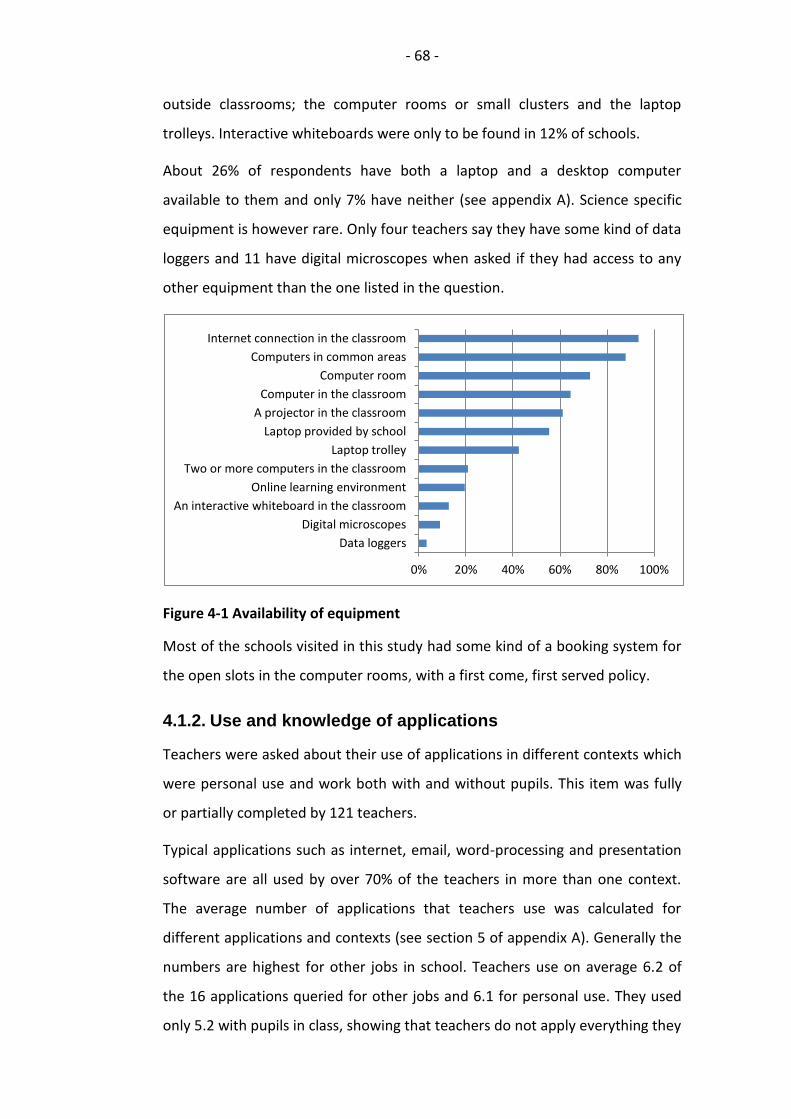
- 68 -
outside classrooms; the computer rooms or small clusters and the laptop
trolleys. Interactive whiteboards were only to be found in 12% of schools.
About 26% of respondents have both a laptop and a desktop computer
available to them and only 7% have neither (see appendix A). Science specific
equipment is however rare. Only four teachers say they have some kind of data
loggers and 11 have digital microscopes when asked if they had access to any
other equipment than the one listed in the question.
Figure 4-1 Availability of equipment
Most of the schools visited in this study had some kind of a booking system for
the open slots in the computer rooms, with a first come, first served policy.
4.1.2. Use and knowledge of applications
Teachers were asked about their use of applications in different contexts which
were personal use and work both with and without pupils. This item was fully
or partially completed by 121 teachers.
Typical applications such as internet, email, word-processing and presentation
software are all used by over 70% of the teachers in more than one context.
The average number of applications that teachers use was calculated for
different applications and contexts (see section 5 of appendix A). Generally the
numbers are highest for other jobs in school. Teachers use on average 6.2 of
the 16 applications queried for other jobs and 6.1 for personal use. They used
only 5.2 with pupils in class, showing that teachers do not apply everything they
0% 20% 40% 60% 80% 100%
Data loggers
Digital microscopes
An interactive whiteboard in the classroom
Online learning environment
Two or more computers in the classroom
Laptop trolley
Laptop provided by school
A projector in the classroom
Computer in the classroom
Computer room
Computers in common areas
Internet connection in the classroom
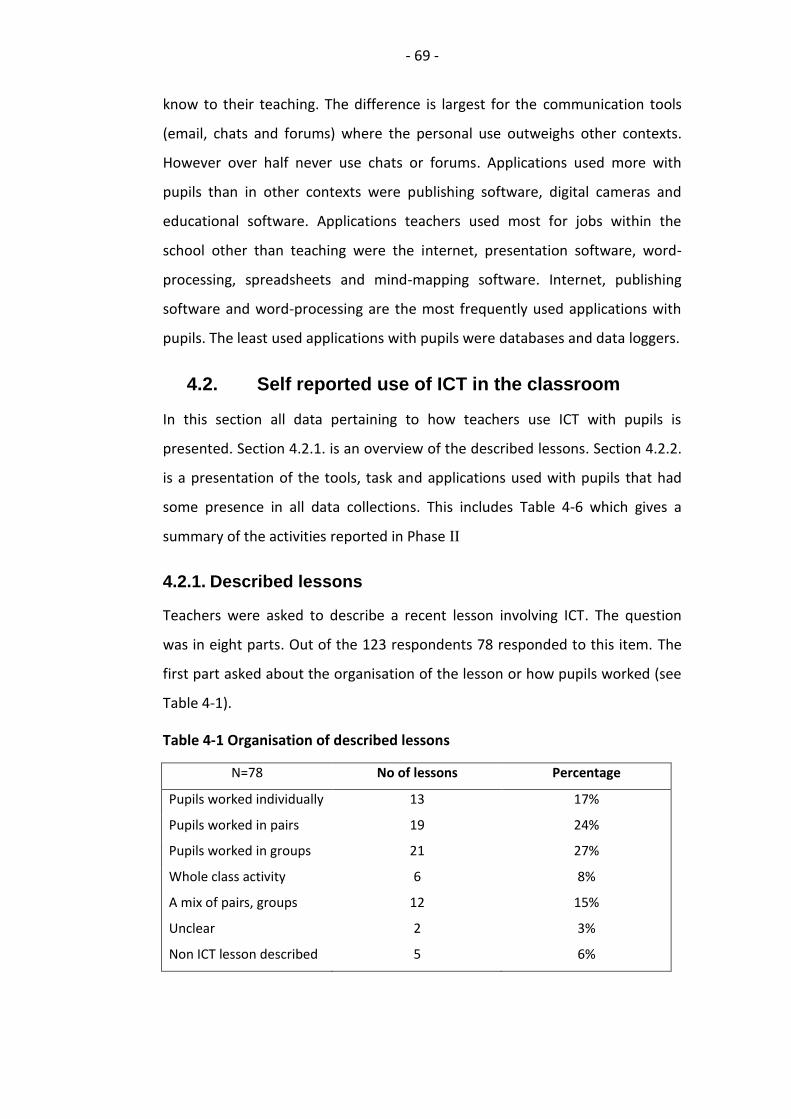
- 69 -
know to their teaching. The difference is largest for the communication tools
(email, chats and forums) where the personal use outweighs other contexts.
However over half never use chats or forums. Applications used more with
pupils than in other contexts were publishing software, digital cameras and
educational software. Applications teachers used most for jobs within the
school other than teaching were the internet, presentation software, word-
processing, spreadsheets and mind-mapping software. Internet, publishing
software and word-processing are the most frequently used applications with
pupils. The least used applications with pupils were databases and data loggers.
4.2. Self reported use of ICT in the classroom
In this section all data pertaining to how teachers use ICT with pupils is
presented. Section 4.2.1. is an overview of the described lessons. Section 4.2.2.
is a presentation of the tools, task and applications used with pupils that had
some presence in all data collections. This includes Table 4-6 which gives a
summary of the activities reported in Phase II
4.2.1. Described lessons
Teachers were asked to describe a recent lesson involving ICT. The question
was in eight parts. Out of the 123 respondents 78 responded to this item. The
first part asked about the organisation of the lesson or how pupils worked (see
Table 4-1).
Table 4-1 Organisation of described lessons
N=78 No of lessons Percentage
Pupils worked individually 13 17%
Pupils worked in pairs 19 24%
Pupils worked in groups 21 27%
Whole class activity 6 8%
A mix of pairs, groups 12 15%
Unclear 2 3%
Non ICT lesson described 5 6%
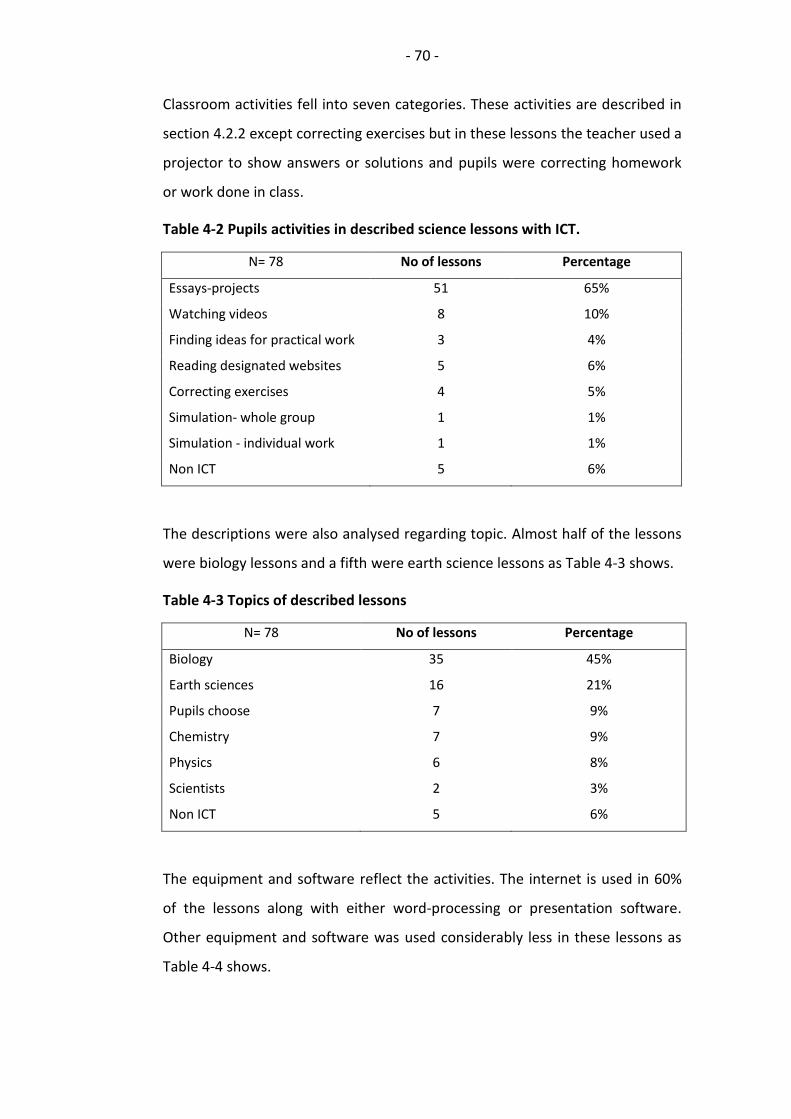
- 70 -
Classroom activities fell into seven categories. These activities are described in
section 4.2.2 except correcting exercises but in these lessons the teacher used a
projector to show answers or solutions and pupils were correcting homework
or work done in class.
Table 4-2 Pupils activities in described science lessons with ICT.
N= 78 No of lessons Percentage
Essays-projects 51 65%
Watching videos 8 10%
Finding ideas for practical work 3 4%
Reading designated websites 5 6%
Correcting exercises 4 5%
Simulation- whole group 1 1%
Simulation - individual work 1 1%
Non ICT 5 6%
The descriptions were also analysed regarding topic. Almost half of the lessons
were biology lessons and a fifth were earth science lessons as Table 4-3 shows.
Table 4-3 Topics of described lessons
N= 78 No of lessons Percentage
Biology 35 45%
Earth sciences 16 21%
Pupils choose 7 9%
Chemistry 7 9%
Physics 6 8%
Scientists 2 3%
Non ICT 5 6%
The equipment and software reflect the activities. The internet is used in 60%
of the lessons along with either word-processing or presentation software.
Other equipment and software was used considerably less in these lessons as
Table 4-4 shows.
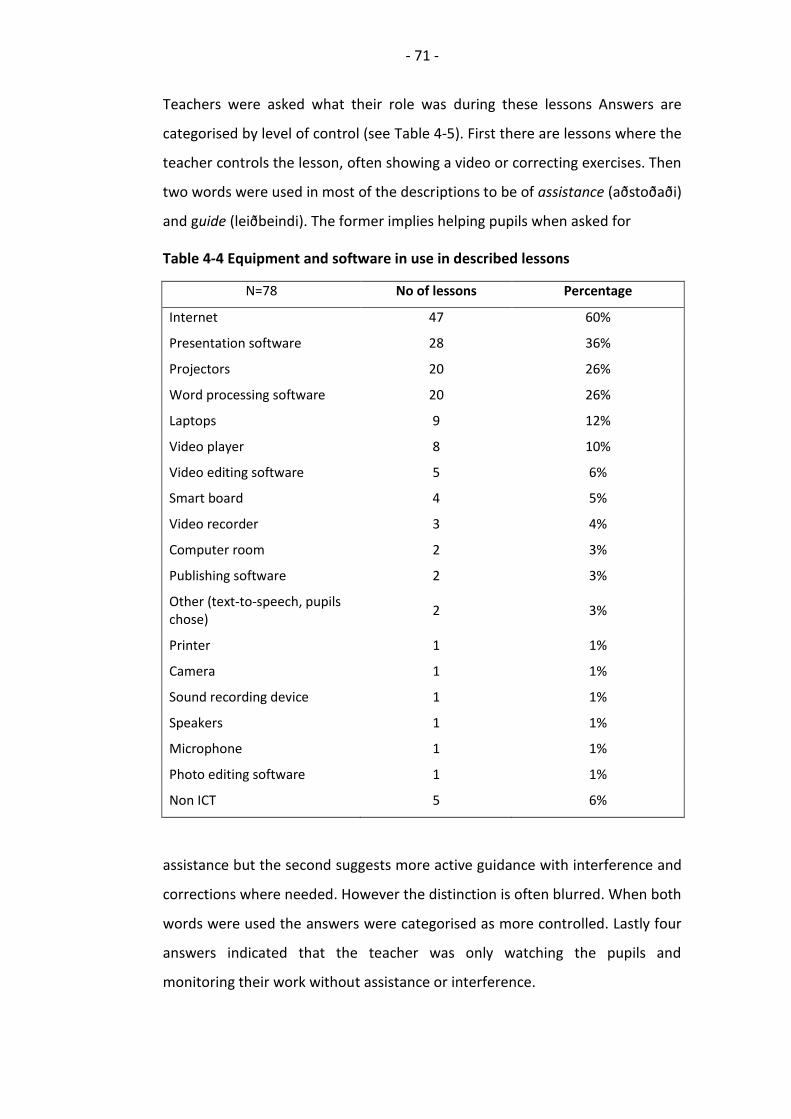
- 71 -
Teachers were asked what their role was during these lessons Answers are
categorised by level of control (see Table 4-5). First there are lessons where the
teacher controls the lesson, often showing a video or correcting exercises. Then
two words were used in most of the descriptions to be of assistance (aðstoðaði)
and guide (leiðbeindi). The former implies helping pupils when asked for
Table 4-4 Equipment and software in use in described lessons
N=78 No of lessons Percentage
Internet 47 60%
Presentation software 28 36%
Projectors 20 26%
Word processing software 20 26%
Laptops 9 12%
Video player 8 10%
Video editing software 5 6%
Smart board 4 5%
Video recorder 3 4%
Computer room 2 3%
Publishing software 2 3%
Other (text-to-speech, pupils chose)
2 3%
Printer 1 1%
Camera 1 1%
Sound recording device 1 1%
Speakers 1 1%
Microphone 1 1%
Photo editing software 1 1%
Non ICT 5 6%
assistance but the second suggests more active guidance with interference and
corrections where needed. However the distinction is often blurred. When both
words were used the answers were categorised as more controlled. Lastly four
answers indicated that the teacher was only watching the pupils and
monitoring their work without assistance or interference.
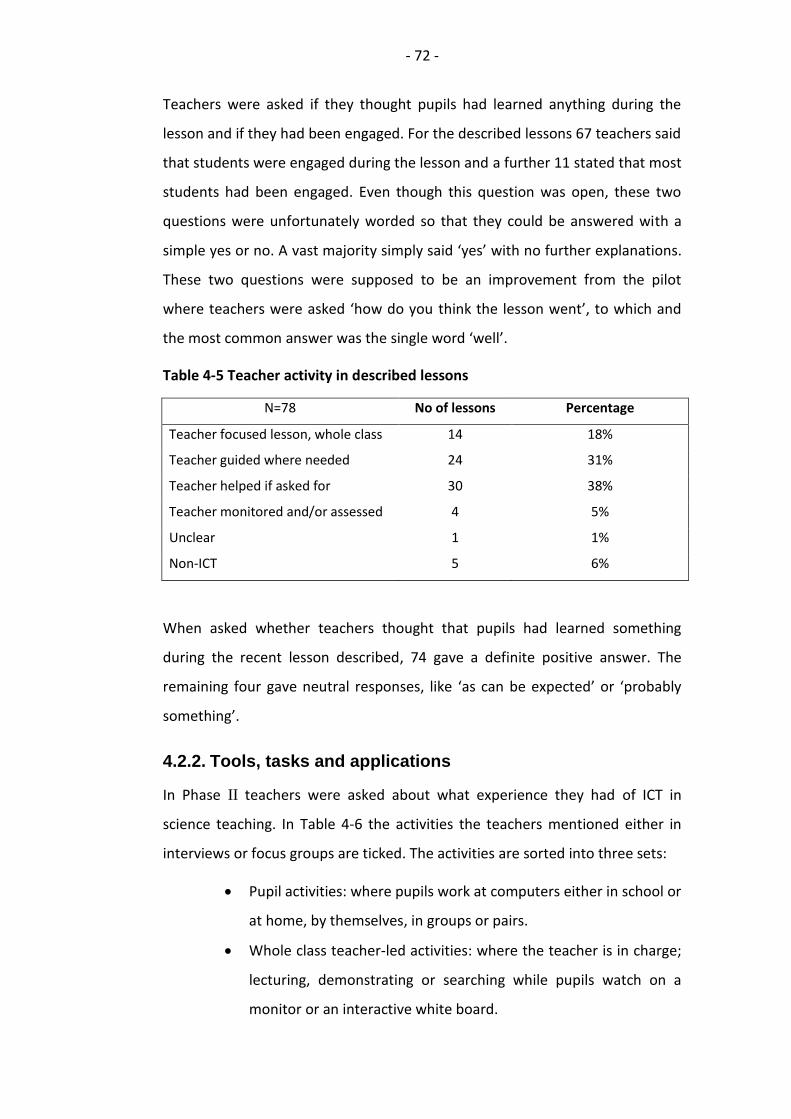
- 72 -
Teachers were asked if they thought pupils had learned anything during the
lesson and if they had been engaged. For the described lessons 67 teachers said
that students were engaged during the lesson and a further 11 stated that most
students had been engaged. Even though this question was open, these two
questions were unfortunately worded so that they could be answered with a
simple yes or no. A vast majority simply said ‘yes’ with no further explanations.
These two questions were supposed to be an improvement from the pilot
where teachers were asked ‘how do you think the lesson went’, to which and
the most common answer was the single word ‘well’.
Table 4-5 Teacher activity in described lessons
N=78 No of lessons Percentage
Teacher focused lesson, whole class 14 18%
Teacher guided where needed 24 31%
Teacher helped if asked for 30 38%
Teacher monitored and/or assessed 4 5%
Unclear 1 1%
Non-ICT 5 6%
When asked whether teachers thought that pupils had learned something
during the recent lesson described, 74 gave a definite positive answer. The
remaining four gave neutral responses, like ‘as can be expected’ or ‘probably
something’.
4.2.2. Tools, tasks and applications
In Phase II teachers were asked about what experience they had of ICT in
science teaching. In Table 4-6 the activities the teachers mentioned either in
interviews or focus groups are ticked. The activities are sorted into three sets:
Pupil activities: where pupils work at computers either in school or
at home, by themselves, in groups or pairs.
Whole class teacher-led activities: where the teacher is in charge;
lecturing, demonstrating or searching while pupils watch on a
monitor or an interactive white board.
- 73 -
Teacher activities where pupils are not present.
In the following section evidence of these practices is presented from the
survey and qualitative exploration.
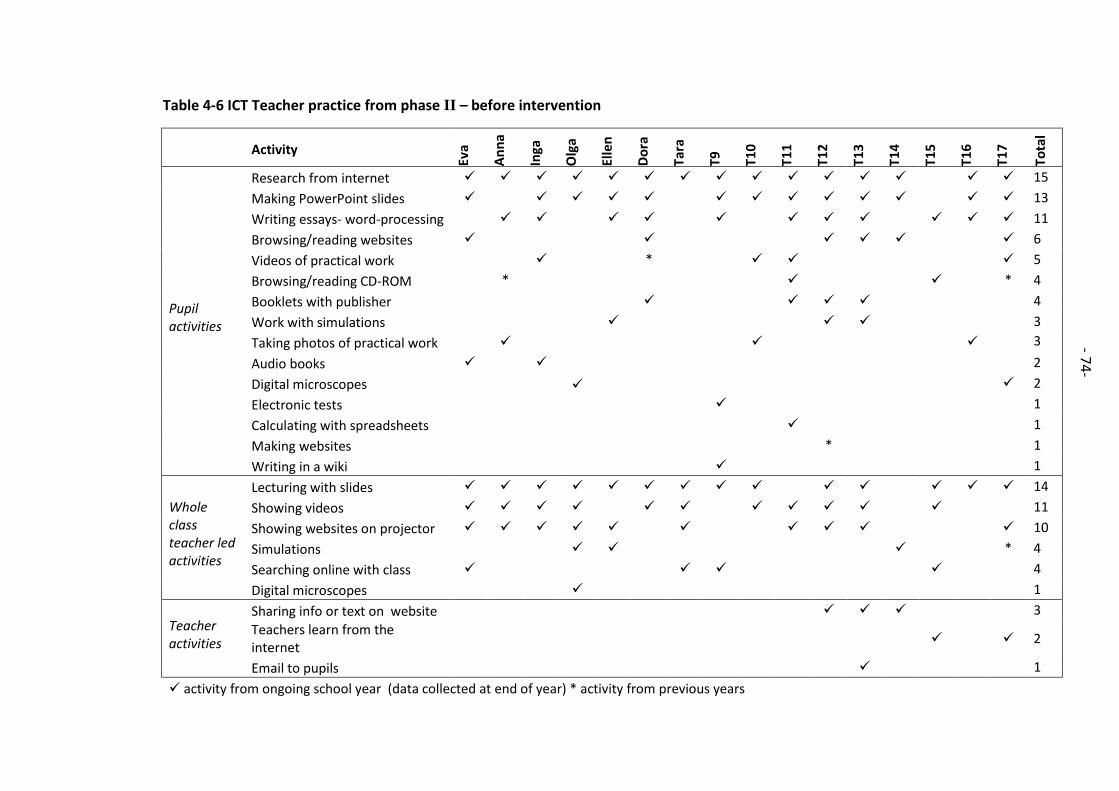
- 74 -
- 74-
Table 4-6 ICT Teacher practice from phase II – before intervention
Activity
Eva
An
na
Inga
Olg
a
Elle
n
Do
ra
Tara
T9
T10
T11
T12
T13
T14
T15
T16
T17
Tota
l
Pupil activities
Research from internet
15
Making PowerPoint slides
13
Writing essays- word-processing
11
Browsing/reading websites
6
Videos of practical work
*
5
Browsing/reading CD-ROM
*
* 4
Booklets with publisher
4
Work with simulations
3
Taking photos of practical work
3
Audio books
2
Digital microscopes
2
Electronic tests
1
Calculating with spreadsheets
1
Making websites
*
1
Writing in a wiki
1
Whole class teacher led activities
Lecturing with slides
14
Showing videos
11
Showing websites on projector
10
Simulations
* 4
Searching online with class
4
Digital microscopes
1
Teacher activities
Sharing info or text on website
3 Teachers learn from the internet
2
Email to pupils
1
activity from ongoing school year (data collected at end of year) * activity from previous years
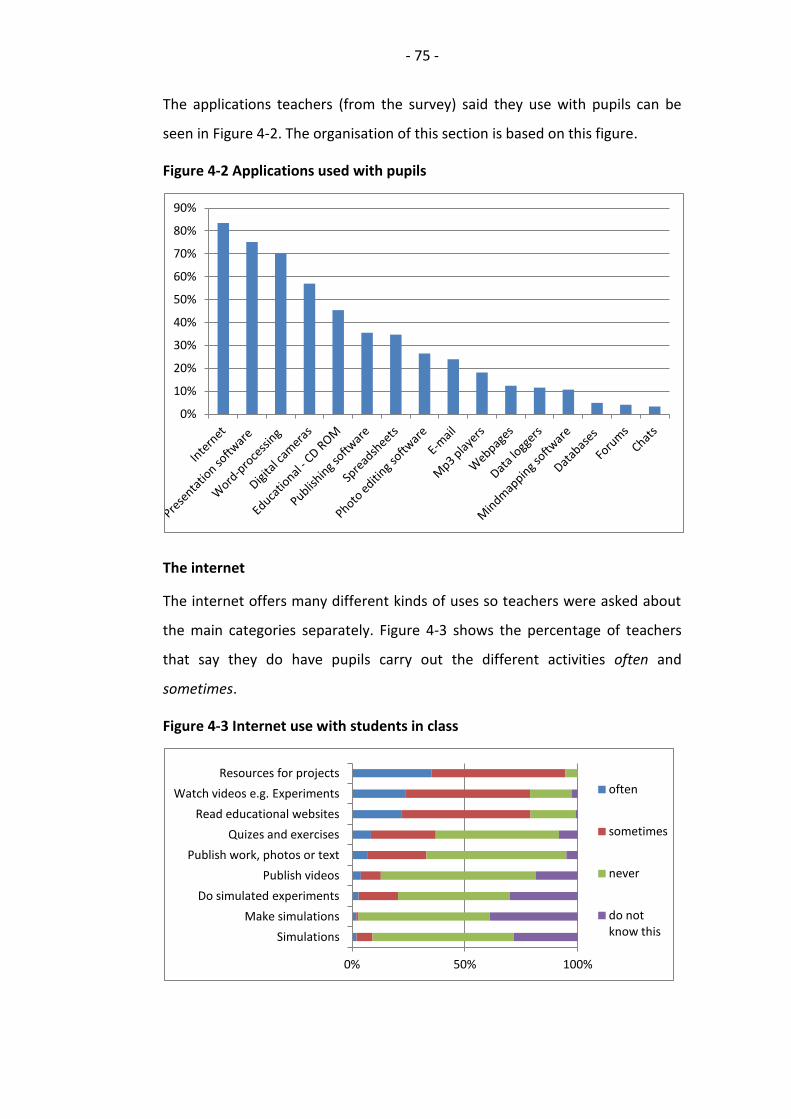
- 75 -
The applications teachers (from the survey) said they use with pupils can be
seen in Figure 4-2. The organisation of this section is based on this figure.
Figure 4-2 Applications used with pupils
The internet
The internet offers many different kinds of uses so teachers were asked about
the main categories separately. Figure 4-3 shows the percentage of teachers
that say they do have pupils carry out the different activities often and
sometimes.
Figure 4-3 Internet use with students in class
0%
10%
20%
30%
40%
50%
60%
70%
80%
90%
0% 50% 100%
Simulations
Make simulations
Do simulated experiments
Publish videos
Publish work, photos or text
Quizes and exercises
Read educational websites
Watch videos e.g. Experiments
Resources for projects often
sometimes
never
do not know this

- 76 -
Though 80% of teachers (see Figure 4-3) say they had pupils read educational
websites less than a third of Phase II teachers told of such activities that were
not for project work (Table 4-6). Eva had her pupils read a sex education
website9 because she thought they would appreciate reading that kind of
material in private. T17 said she had prepared worksheets to accompany
reading from several websites. Dora had pupils explore The energy game10 in
conjunction with building a model of a power plant. T12 and T13 had had pupils
read a variety of websites in carousels. Teachers also used the internet with the
whole class showing pupils photos, diagrams or videos on websites and
discussing specific topics. For example: ‘I show them a little, go to the
astronomy web and show them photos of stars and such’ (Anna) and ‘I am now
always turning on the eagle’ [a live webcam monitoring an eagles nest]).
A further use emerged in Phase II where four teachers spoke of how they use
the internet spontaneously in class to answer questions that arise or explore
issues with pupils. This practice was well described by T9 : ‘I can say that when
any questions arise in class then I just pop to the computer, have the projector
on and we just google whatever, chemical or phenomena, well we do that and
spend some time on it.’
Watching videos, either short clips from websites such as Youtube or longer
ones from NCEM appeared in all data collection methods. They were described
in a tenth of the lessons (Table 4-2), 80% of survey respondents (Figure 4-3) and
11 of the 17 teachers from phase II spoke of such practices (Table 4-6).
Teachers expressed how convenient it is to show videos with projectors than
having to wheel televisions with much smaller screens into the classrooms.
Many used the videos from NCEM, nonetheless, Youtube was the most
frequent resource for videos. Some teachers talked of using short clips as a
starter to a lesson or a topic but also showing long videos sometimes with
question sheets afterwards. T12: ‘I always begin lessons by showing them some
news, either from the internet or even a video from Youtube’.
9 http://www1.nams.is/kyn/index.php
10 http://eyjan.lv.is/popup.htm
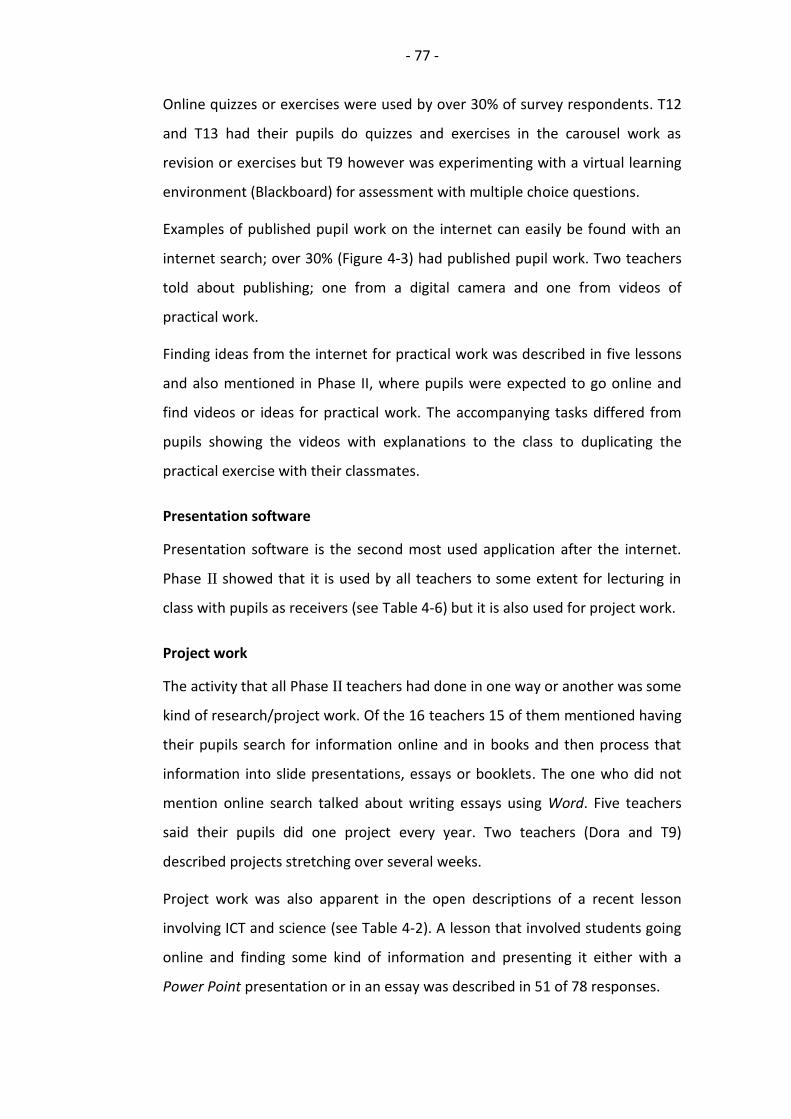
- 77 -
Online quizzes or exercises were used by over 30% of survey respondents. T12
and T13 had their pupils do quizzes and exercises in the carousel work as
revision or exercises but T9 however was experimenting with a virtual learning
environment (Blackboard) for assessment with multiple choice questions.
Examples of published pupil work on the internet can easily be found with an
internet search; over 30% (Figure 4-3) had published pupil work. Two teachers
told about publishing; one from a digital camera and one from videos of
practical work.
Finding ideas from the internet for practical work was described in five lessons
and also mentioned in Phase II, where pupils were expected to go online and
find videos or ideas for practical work. The accompanying tasks differed from
pupils showing the videos with explanations to the class to duplicating the
practical exercise with their classmates.
Presentation software
Presentation software is the second most used application after the internet.
Phase II showed that it is used by all teachers to some extent for lecturing in
class with pupils as receivers (see Table 4-6) but it is also used for project work.
Project work
The activity that all Phase II teachers had done in one way or another was some
kind of research/project work. Of the 16 teachers 15 of them mentioned having
their pupils search for information online and in books and then process that
information into slide presentations, essays or booklets. The one who did not
mention online search talked about writing essays using Word. Five teachers
said their pupils did one project every year. Two teachers (Dora and T9)
described projects stretching over several weeks.
Project work was also apparent in the open descriptions of a recent lesson
involving ICT and science (see Table 4-2). A lesson that involved students going
online and finding some kind of information and presenting it either with a
Power Point presentation or in an essay was described in 51 of 78 responses.
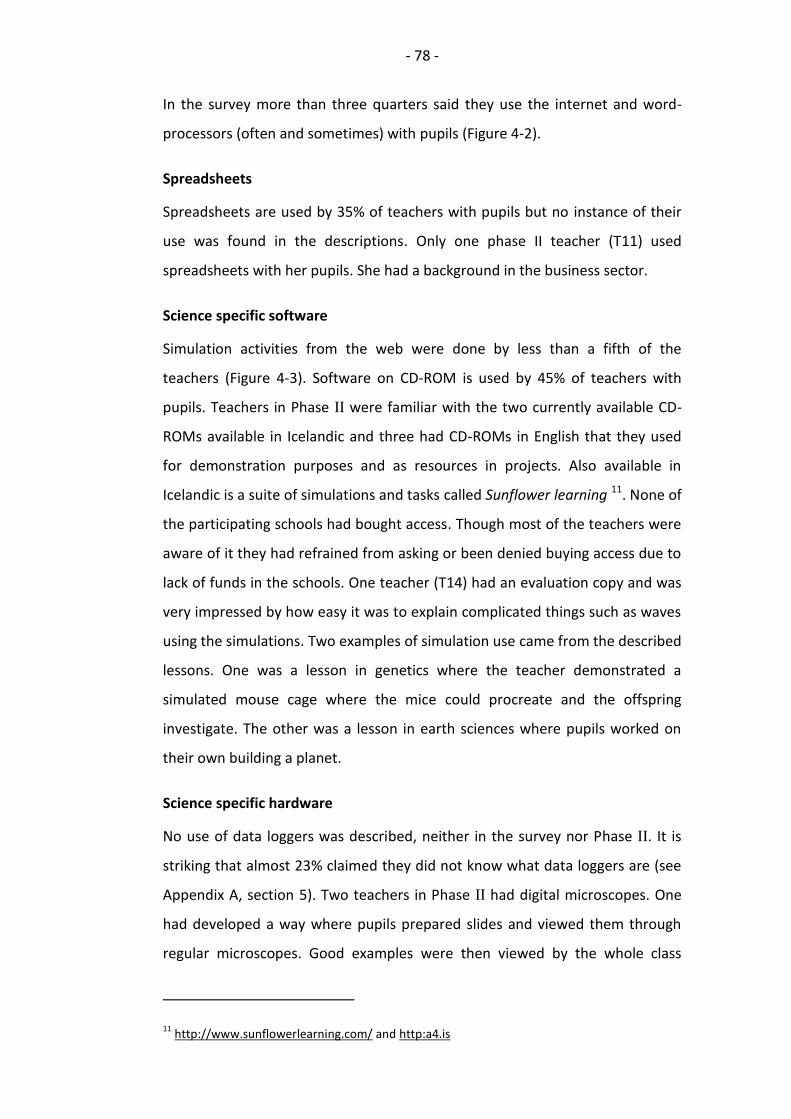
- 78 -
In the survey more than three quarters said they use the internet and word-
processors (often and sometimes) with pupils (Figure 4-2).
Spreadsheets
Spreadsheets are used by 35% of teachers with pupils but no instance of their
use was found in the descriptions. Only one phase II teacher (T11) used
spreadsheets with her pupils. She had a background in the business sector.
Science specific software
Simulation activities from the web were done by less than a fifth of the
teachers (Figure 4-3). Software on CD-ROM is used by 45% of teachers with
pupils. Teachers in Phase II were familiar with the two currently available CD-
ROMs available in Icelandic and three had CD-ROMs in English that they used
for demonstration purposes and as resources in projects. Also available in
Icelandic is a suite of simulations and tasks called Sunflower learning 11. None of
the participating schools had bought access. Though most of the teachers were
aware of it they had refrained from asking or been denied buying access due to
lack of funds in the schools. One teacher (T14) had an evaluation copy and was
very impressed by how easy it was to explain complicated things such as waves
using the simulations. Two examples of simulation use came from the described
lessons. One was a lesson in genetics where the teacher demonstrated a
simulated mouse cage where the mice could procreate and the offspring
investigate. The other was a lesson in earth sciences where pupils worked on
their own building a planet.
Science specific hardware
No use of data loggers was described, neither in the survey nor Phase II. It is
striking that almost 23% claimed they did not know what data loggers are (see
Appendix A, section 5). Two teachers in Phase II had digital microscopes. One
had developed a way where pupils prepared slides and viewed them through
regular microscopes. Good examples were then viewed by the whole class
11 http://www.sunflowerlearning.com/ and http:a4.is
- 79 -
and/or photographed with the digital one. The other teacher had only used it
for demonstration purposes.
Photo and video
Digital cameras were used by 57% of teachers. Three teachers in Phase II said
they had had pupils take photographs. Two of these were of plants and talked
about pupils making videos and two of which were of practical work. Five of the
described lessons clearly involved pupils working with photo or video. In one of
these descriptions the teachers stated ‘They were working with a browser,
power-point, and some video editing software that I do not recognise’. Teacher
10 also described how she just sent the pupils off to work on their own in the
computer room and she also neither knew how to work the video editing
software nor what it is called.
Other uses
Email was said to be used by 24% of teachers in the survey. Only T13 gave an
account of using email with pupils. When she sent pupils to a computer cluster
she sent instructions in an email what websites to visit and what to do there.
4.3. What teachers think of ICT in science teaching
The respondents to the survey had very positive views toward ICT in science
teaching as a large majority of them either agreed or strongly agreed to a
collection of statements (see appendix A, item 12). A collection of quotes from
Phase II also give indications of what teachers think of using it in with pupils.
The reasons teachers mentioned in this study as to why they use ICT were as
follows:
to add variety to teaching methods;
helpful for learning;
clearer representation;
visual aid;
easy access to information;
pupils like ICT;
pupils know ICT.
- 80 -
One of the most common reason teachers in Phase II gave as to why they try to
use ICT in their teaching, was that they want to add variety to their teaching
and that ICT has many opportunities to do just that, by providing alternatives to
traditional book learning with research, group-work and more vivid
presentation.
Teachers in the survey felt ICT is helpful for pupil learning with 91% agreeing or
highly agreeing to the statement ‘I think students learning will benefit from ICT
use’ and 89 agreed or highly agreed that ICT might have a positive impact on
the way we teach.
When asking Phase II and III teachers about their ICT use it was overall the
same. The ICT they had tried had rarely been with the purpose of teaching
science concepts or content for tests, so almost no opinions about the
effectiveness of teaching science concepts with ICT could be found. One of the
rare occasions was from T14, who had tried several simulations and felt that
they helped with pupil understanding. T9 had done a big ICT based project with
her class. When I asked her if it had been effective her response was:
Do you mean, will they score higher on a end of year written test?... No, not after this, but they are probably more ready for self study and to find out things on their own.
That ICT had the potential to make science more visible and therefore help with
understanding of concepts and phenomena was mentioned often. Statements
about how ICT makes science more visible include: ‘it has the potential to give
clearer representations of phenomena through graphic means’ (T14) and, ‘it
gives helpful visual aid, for difficult things, forces and cells’ (T12) and six
comments specially mentioned this affordance. Ellen also mentioned that
pupils took more notice of explanations with visual features: ‘yes, if it just
moves then suddenly everybody wakes up.’
Another affordance mentioned by 15 teachers was mentioned by Olga who said
‘it (the internet) is such a vast sea of information’. This is related to having that
vast sea just a fingertip away and searching for it with the class when needed.
Teachers felt this both taught pupils how they themselves could find out things
in science and also that it often sparked interesting discussions in class.
- 81 -
The fact that teenagers use ICT to a great extent in their lives for recreation and
socializing was the second most stated reason for using ICT in science teaching.
‘It is just teenagers today, they live and breathe in computers and they just
flourish more with them and the lower achiever can take advantage’ (T12). ‘It is
everywhere in the pupils environment’, ‘it is the future’ (T13), ‘it’s the current
thing and the future’ (Eva). T14 also added ‘it is their reality, what they know,
you got to keep up with them, may kindle interest in science’. Olga agreed with
this. When talking about a previous lesson where pupils were researching a
specific topic, she said:
well, I mean, there are many pupils that dug pretty deep, at least they then became interested enough to go home and continue exploring the topic, came back with printouts of what they had found, I am not saying they were many, but it kindled interest in some….
Generally it was also the teachers’ perception that pupils enjoy working with
computers, ‘there is simply more joy’ (T13) and
It is like, if I say to the kids: physics, then I get a general ohhhhhhhhhhh, you know it is just the word physics, it is something difficult and negative, and if I say to the kids: botany then just ohhhhhhhh, but if I say let’s go outside and make a video, you know (T10).
This notion that pupils enjoy ICT work more than traditional lecturing is closely
linked to why teachers choose to use ICT in their teaching, T10 goes on and
says: ‘we are always trying to find ways to make the learning more easier and
more fun’. T17 described in a focus group, and the others agreed, how when
pupils are given the choice to use books or internet for research, none of them
will choose books. Ellen also talked about it being easier to manage discipline in
the lessons involving ICT because pupils were preoccupied. Dora talked
extensively about fun, that she wanted the teaching to be fun, and that she
wanted the pupils to have fun in the lessons. When asked why fun was
important it emerged that she and T13 believed that if the lessons were fun the
probabilities of pupils gaining an active interest in science were increased. As
the interviews where semi-structured it is highly likely that other teachers also
have this view though it did not arise in all of them.
- 82 -
Other reasons for using ICT include that pupils work faster and they produce
neater work (T17, T14, T9), and others added that using word-processing had
benefits for those who are not good at handwriting. Only one (T9) mentioned
that pupils will need to be familiar with computers when they join the
workforce.
The teachers themselves are also interested in ICT. Many Phase II teachers had
many tried some ICT applications in their teaching and had generally positive
views towards ICT. When they had tried something they usually did it again.
Maybe it is an indication of the willingness of teachers that 123 took the time to
answer the survey and a further 40 volunteered for further participation,
perhaps in the hope that there would be opportunities to learning ways of
using ICT in their teaching. At least in informal chats during the intervention
some teachers said that was one reason for volunteering.
Even though 85% agreed to a statement about believing that ICT may make
teaching easier that view did only occur once in the interviews where Ellen
expressed that she thought using educational software made the work easier
given that you had good software to work with.
I also asked teachers a utopian question about what they would ask for in an
ideal world. Even though they knew that the interview was in the context of ICT
use and I would have expected them to talk about wanting more computers or
training, many of them talked about resources for practical work and out-door
teaching. It seems that teachers feel very pressed to engage in elaborate
practical work as questions about ICT use also often led the teachers to tell me
about practical work. This was especially so for the questions about data
loggers and availability of equipment.
4.4. Pupils’ views and experiences of ICT
The attitudes pupils have towards using ICT for learning and life were explored
both through focus groups in Phase II as was described in section 3.4.4. and in a
questionnaire before the intervention (see section 3.5.4)
- 83 -
Previous experience of ICT work
Pupils were asked to describe what ICT they had used in science in that school
year (the focus groups were conducted in May). One group was from a teacher
who came out of the survey as a high level user (T9, group A) and the other
(Dora, group B) as medium level user. These pupils should therefore have some
experience to talk about. Teacher and pupil descriptions concurred. Both
teachers had spent a considerable amount of time with pupils on project work
covering only a small topic, or one chapter from the textbook.
These two teachers had organised the work quite differently. Group A rarely
used computers in school. They organised and discussed what was to be done
in school but the actual computer work was supposed to take place at home.
The groups had different tasks covering one chapter, using different media.
Group B on the other hand said they had rarely spent time in the classroom and
that it would be better to have a more equal balance between project work and
classroom work.
In group A pupils thought they had not learned as much from the project work
as they would have from regular teaching. Group B talked more about not
having read anything, having had mostly projects and few tests: ‘this has been a
strange winter, lots of group work and essays but only one test, working in
Word or PowerPoint, finding information online…..’ Both groups however
agreed that more ICT work sounded pleasing but it had to be better organised,
better monitored, and more to the point, as one boy (group A) put it ‘if the
right method would be found, you see, one that would perfect the way she used
it would be much more fun’. The teacher in this case had also realised that the
project had gone out of bounds and said that if she were to do it again she
would scale it down and mentioned the same things the pupils had (that she
had lost an overview and had intended to do too much in a first time attempt).
Both groups talked about difficulties associated with group work. Group B was
concerned that the assessment of work was not fair. Group A was more
concerned about unfair division of labour, where pupils were given different
roles.
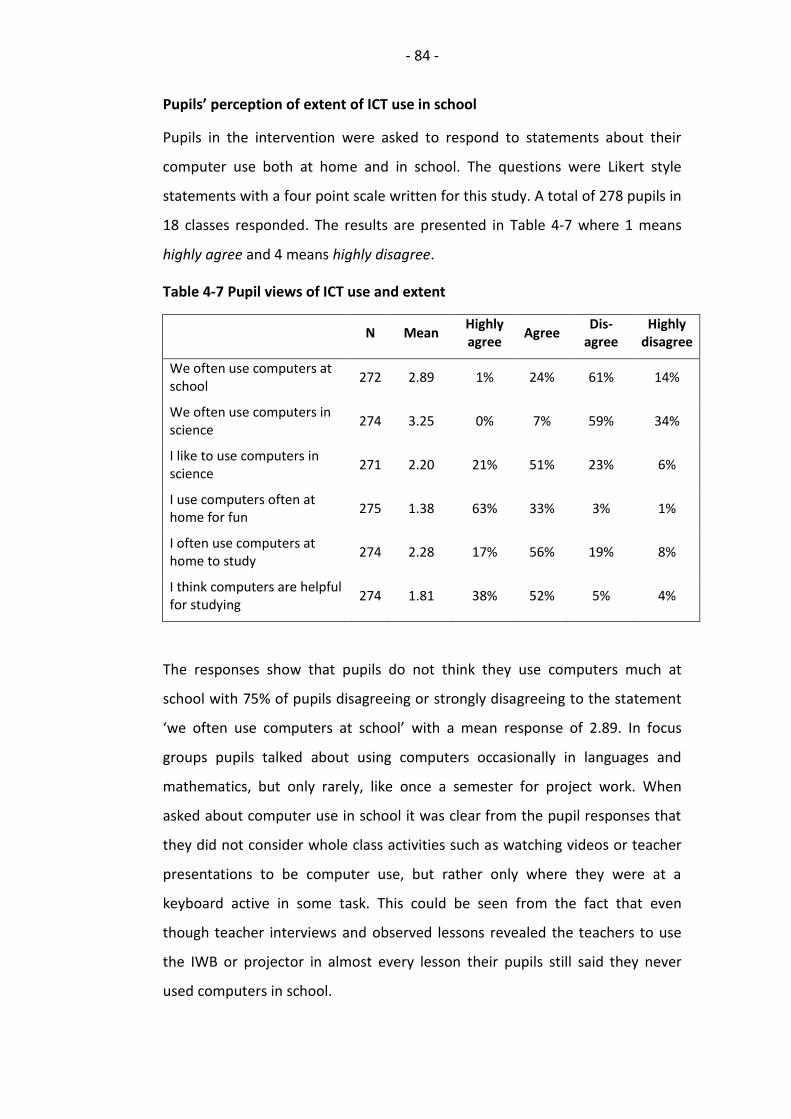
- 84 -
Pupils’ perception of extent of ICT use in school
Pupils in the intervention were asked to respond to statements about their
computer use both at home and in school. The questions were Likert style
statements with a four point scale written for this study. A total of 278 pupils in
18 classes responded. The results are presented in Table 4-7 where 1 means
highly agree and 4 means highly disagree.
Table 4-7 Pupil views of ICT use and extent
N Mean
Highly agree
Agree Dis-
agree Highly
disagree
We often use computers at school
272 2.89 1% 24% 61% 14%
We often use computers in science
274 3.25 0% 7% 59% 34%
I like to use computers in science
271 2.20 21% 51% 23% 6%
I use computers often at home for fun
275 1.38 63% 33% 3% 1%
I often use computers at home to study
274 2.28 17% 56% 19% 8%
I think computers are helpful for studying
274 1.81 38% 52% 5% 4%
The responses show that pupils do not think they use computers much at
school with 75% of pupils disagreeing or strongly disagreeing to the statement
‘we often use computers at school’ with a mean response of 2.89. In focus
groups pupils talked about using computers occasionally in languages and
mathematics, but only rarely, like once a semester for project work. When
asked about computer use in school it was clear from the pupil responses that
they did not consider whole class activities such as watching videos or teacher
presentations to be computer use, but rather only where they were at a
keyboard active in some task. This could be seen from the fact that even
though teacher interviews and observed lessons revealed the teachers to use
the IWB or projector in almost every lesson their pupils still said they never
used computers in school.
- 85 -
For the statement ´We often use computers in science’ 86% of pupils disagreed
with an average of 2.89. The average is even higher for the statement ‘We
often use computers in science’ (3.25) indicating that pupils believe that they
use computers even less in science than in school in general. In group
interviews after the interventions, pupils gave no descriptions of previous
computer use in science lessons, with the exception of two who mentioned
looking for resources for essays. In three schools pupils said that the
intervention was the first time they had used computers in science.
I was present when pupils answered the questionnaires and they frequently
complained that they missed having a middle option saying their views were
not very clear. For the statement about liking using computers in science they
really wanted a middle option, with one pupil saying in a focus group ´how am I
supposed to know if I like it or not ! We never do it´. Still 68% of pupils agreed to
the statement with an average of 2.20, indicating perhaps beliefs rather than
experience. In focus groups those who had received the intervention generally
agreed that they had enjoyed the experience not considering the different DLR
used (their views on different DLRs are presented in section 6.1.3, 6.2.3 and
6.3.3). What the pupils seemed to like most was the break from routine; ‘it was
fun, doing something different’ and also compared to usual activities ‘it is more
fun than sitting on your arse and writing stuff’, ‘it is better than always doing
the same thing’.
Home use
94% of pupils agree to the statement ‘I use computers often at home for fun’.
In focus groups they were also asked about how much time they spent on the
computer. The responses ranged from ‘it is always on’ to ‘hardly ever’ with
most of them estimating the time spent on computers to 2-4 hours a day. The
uses they mostly mentioned were games, Facebook, MSN chat, and
downloading websites. They also watched movies and Youtube videos with
such diverse subjects as cosmetics, religion, politics, thunder and lightning
being mentioned. All pupils said they had a computer in their bedrooms or
good access to them at home.

- 86 -
Pupils were also asked if they used computers at home for studying and 94%
agreed that they used them often. In group interviews, few pupils said they
never used computers for studying but most that they did it occasionally; for
essays, for looking online for notes from other schools, to look for answers to
textbook questions, to use dictionaries, calculator and some to write their own
notes. When asked to compare how they used computers at home and in
school this was a typical response:
Pupil: At home I use it for games and in school for learning, sometimes a
bit the same.
Interviewer: But do you all use them as much in both places?
*General laughter*
Pupil: no much more at home!
To get pupils to talk more about how they used computers at home I asked
some groups what they did when they wanted to know something or needed
information. The unanimous answer was ‘we google it’. Some also asked their
parents. When the question was phrased more along the lines if you do not
know something or need help with homework, parents were named first, then
the textbook (‘we know it is in there’) and the internet last. So the bottom line
seems to be that pupils regard the internet as a source of information but trust
the textbook and parents to give quicker and better tailored answers; ‘it is more
pleasant to get help from a person, and sometimes it is not correct what the
computer says if you go on google, some websites are just rubbish’, ‘the tests
and tasks are only from the textbook, so you should not need to search
elsewhere’. Despite this, the statement about the usefulness of computers for
studying showed that 85% of pupils believed them to be useful (Table 4-7). No
questions for the focus groups were about usefulness of computers generally
for studying. What mainly came out in the discussion, apart from the internet
being a good source of information, was that many felt that it was easier to
write with computers and present work neatly.
- 87 -
4.5. Summary
A survey revealed that there are not enough resources for technology to have
yet made a big impact on science teaching in Iceland. The use of science specific
applications is especially low. Teachers are experimenting with ICT though and
the most common uses involve using the information for resources, writing
essays and giving presentations. Use of photo and videos are also widespread.
Teachers value ICT for giving, fast up to date information. There is a big gap
between the extent that pupils use ICT in schools and at home.
- 88 -
5. Conditions that affect teachers
The second research question is about the factors that affect teachers in their
use of ICT. Section 5.1presents one part from the survey where teachers were
asked what factors on the one hand inhibit their ICT use and on the other hand
what encourages them. The most prevalent factors are outlined in this section,
based on what teachers said in the survey and combined with quotes and
opinions from Phase II and III. In section 5.2 four cases are presented,
illuminating how different factors manifest in the stories of these teachers. The
cases are explored through cultural historical activity theory, introduced in
section5.2.
5.1. Factors that Icelandic teachers say affect their
ICT use
The question in the survey was open, asking teachers ‘What factors do you
think inhibit you from employing ICT with pupils?’ When responding to this
question teachers often gave long answers commenting on more than one
issue. These responses were split into comments and then categorised. The
categories that emerged can be seen in Table 5-1. Equipment was the factor
that most teachers mentioned as a deterrent. Next were pedagogical issues and
teacher knowledge followed by DLRs, time and professional support.
The survey did not ask teachers directly why they use or should use ICT in their
teaching, but the question ‘What factors do you think make it easy for you and
encourage you to employ ICT with pupils?’ provided 75 responses. These
responses could be split into a total of 86 comments. The comments mainly
described what affordances and possibilities teachers could see in ICT use. The
comments are categorized in Table 5-2.
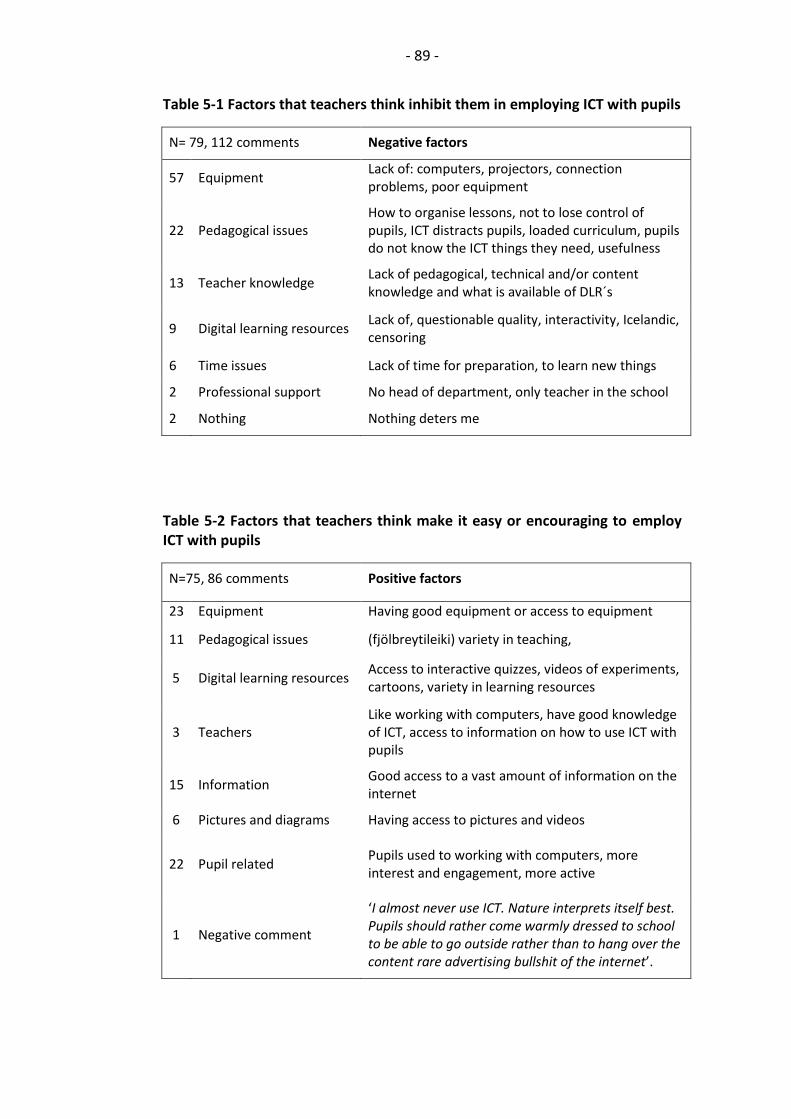
- 89 -
Table 5-1 Factors that teachers think inhibit them in employing ICT with pupils
N= 79, 112 comments Negative factors
57 Equipment Lack of: computers, projectors, connection problems, poor equipment
22 Pedagogical issues How to organise lessons, not to lose control of pupils, ICT distracts pupils, loaded curriculum, pupils do not know the ICT things they need, usefulness
13 Teacher knowledge Lack of pedagogical, technical and/or content knowledge and what is available of DLR´s
9 Digital learning resources Lack of, questionable quality, interactivity, Icelandic, censoring
6 Time issues Lack of time for preparation, to learn new things
2 Professional support No head of department, only teacher in the school
2 Nothing Nothing deters me
Table 5-2 Factors that teachers think make it easy or encouraging to employ ICT with pupils
N=75, 86 comments Positive factors
23 Equipment Having good equipment or access to equipment
11 Pedagogical issues (fjölbreytileiki) variety in teaching,
5 Digital learning resources Access to interactive quizzes, videos of experiments, cartoons, variety in learning resources
3 Teachers Like working with computers, have good knowledge of ICT, access to information on how to use ICT with pupils
15 Information Good access to a vast amount of information on the internet
6 Pictures and diagrams Having access to pictures and videos
22 Pupil related Pupils used to working with computers, more interest and engagement, more active
1 Negative comment
‘I almost never use ICT. Nature interprets itself best. Pupils should rather come warmly dressed to school to be able to go outside rather than to hang over the content rare advertising bullshit of the internet’.
- 90 -
5.1.1. Availability and access to equipment
Availability and access was at the top of the list both as an encouraging factor
and a barrier. Teachers appreciate ‘having the equipment always at hand a
computer, projector and internet connection in the classroom’ and ‘good access
to computers and other equipment’ was said to be encouraging.
The other side of the coin is that not having this access was the most frequent
barrier in the survey (see Table 5-1). Teachers talked about not enough
equipment, or dated or faulty equipment:
The kids here do not have access to computers, there are three bad ones at the library, 10 bad ones in a study room which you cannot even use unless a teacher accompanies pupils, which is an contradiction because that is not possible, I can never take my class to the study room because it only has 10 computers that actually are unusable (T9).
Some complained; ‘the internet connection here is so awful that if I took the
laptops in to the classroom, then it would not work’ (T11). The availability of
equipment and teachers views of it was also the subject of chapter 0.
5.1.2. Pedagogical factors
Pedagogical factors in the sense ‘the effect that ICT has on teaching, learning
and pupils’ were categorised together in Table 5-2 where teachers gave these
kind of reasons either as barriers or facilitating factors.
Teachers often gave similar or the same reasons as to why they feel they should
use ICT (see section 4.3) and as a factor that encourages them to use ICT.
Teachers believe that computers add variety to what goes on in the classroom
and mention that as a factor that encourages them to use ICT, ‘Makes the
teaching more varied and easy to show how things work.’ They are also
encouraged when they find tasks that fit with the topic at hand, ‘What we are
working on at the moment’. The visual element was also mentioned ‘to be able
to show instantly photos of amoebas or other things related to the topic’. In
addition, a further reason expressed frequently was pupil interest in
computers; ‘Pupils show more interest when working on computers’ and ‘Pupils
are used to working with computers.’
- 91 -
Even though pupils’ interest and enjoyment was one of the prevalent factors in
why teachers decide to use ICT, some also thought it deterred them from using
it. Things like pupils get distracted by the internet and they do not have the ICT
skills needed were mentioned, T14 talked about these contradictory views:
Yes, I think it can kindle their interest, and to say, this is their world,… actually it always surprises one a little how these computer-guys that spend their whole time on the computer how little they actually know, they are just submerged in their own world, the world of computer games.
When asked about the girls she and other teachers said they used social
applications such as Facebook and MSN more, but often had few practical skills.
Common complaints of pupils included losing their own work, not knowing
where they had saved it, forgetting their logon names, not knowing basic word-
processing skills and not being able to work independently.
Issues about digital learning resources were mentioned only seven times. These
included: the lack of them; that the resources sometimes are of a questionable
quality; that they lack interactivity; few are available in Icelandic; and that
popular websites such as Youtube are often closed in schools.
On the other hand teachers did talk about how the internet is helpful; ‘Access
to a huge amount of interesting information’, ‘It is so easy to use the internet to
find good information in science’.
Other pedagogical factors that teachers mentioned were things like difficulties
in organising the teaching around the available equipment, often related to
them having to send groups from the classroom to work on computers and
thereby losing control and not knowing what they were up to. This is closely
related to the knowledge teachers need to successfully implement ICT
discussed in section 2.4.4.
Three comments were made about there not being enough time to use ICT as
the curriculum was overloaded as it is. Other time issues are outlined in section
5.1.5
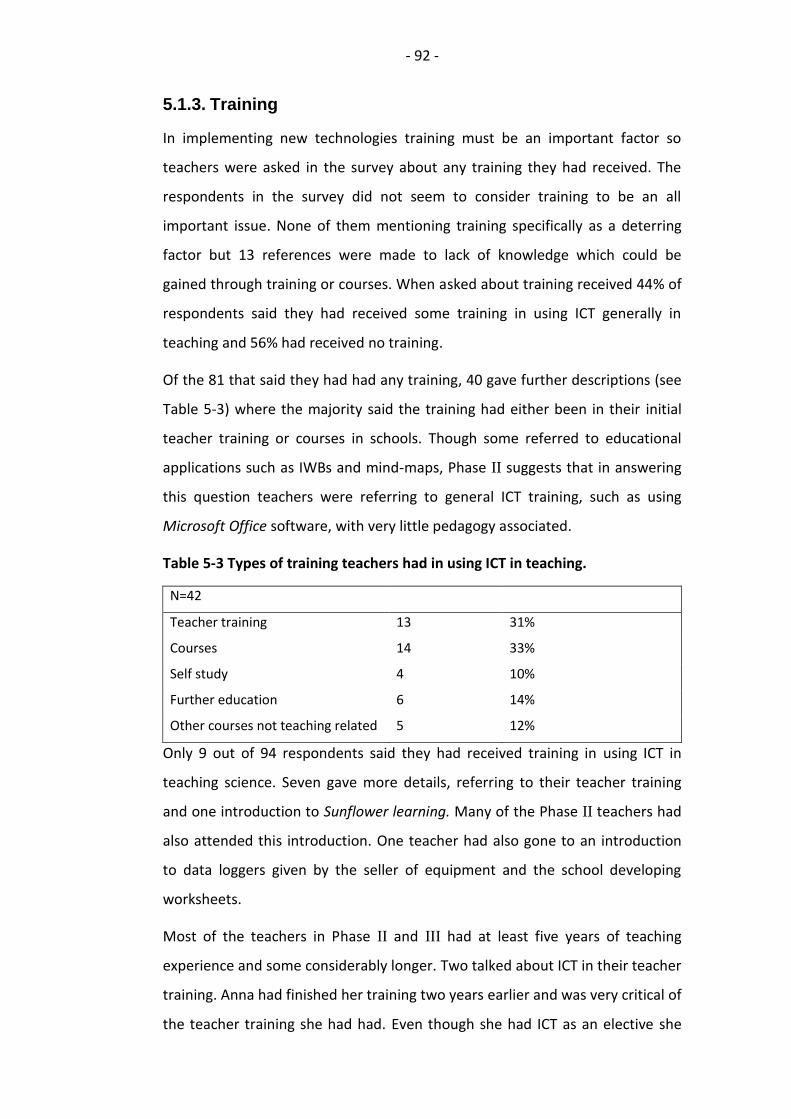
- 92 -
5.1.3. Training
In implementing new technologies training must be an important factor so
teachers were asked in the survey about any training they had received. The
respondents in the survey did not seem to consider training to be an all
important issue. None of them mentioning training specifically as a deterring
factor but 13 references were made to lack of knowledge which could be
gained through training or courses. When asked about training received 44% of
respondents said they had received some training in using ICT generally in
teaching and 56% had received no training.
Of the 81 that said they had had any training, 40 gave further descriptions (see
Table 5-3) where the majority said the training had either been in their initial
teacher training or courses in schools. Though some referred to educational
applications such as IWBs and mind-maps, Phase II suggests that in answering
this question teachers were referring to general ICT training, such as using
Microsoft Office software, with very little pedagogy associated.
Table 5-3 Types of training teachers had in using ICT in teaching.
N=42
Teacher training 13 31%
Courses 14 33%
Self study 4 10%
Further education 6 14%
Other courses not teaching related 5 12%
Only 9 out of 94 respondents said they had received training in using ICT in
teaching science. Seven gave more details, referring to their teacher training
and one introduction to Sunflower learning. Many of the Phase II teachers had
also attended this introduction. One teacher had also gone to an introduction
to data loggers given by the seller of equipment and the school developing
worksheets.
Most of the teachers in Phase II and III had at least five years of teaching
experience and some considerably longer. Two talked about ICT in their teacher
training. Anna had finished her training two years earlier and was very critical of
the teacher training she had had. Even though she had ICT as an elective she
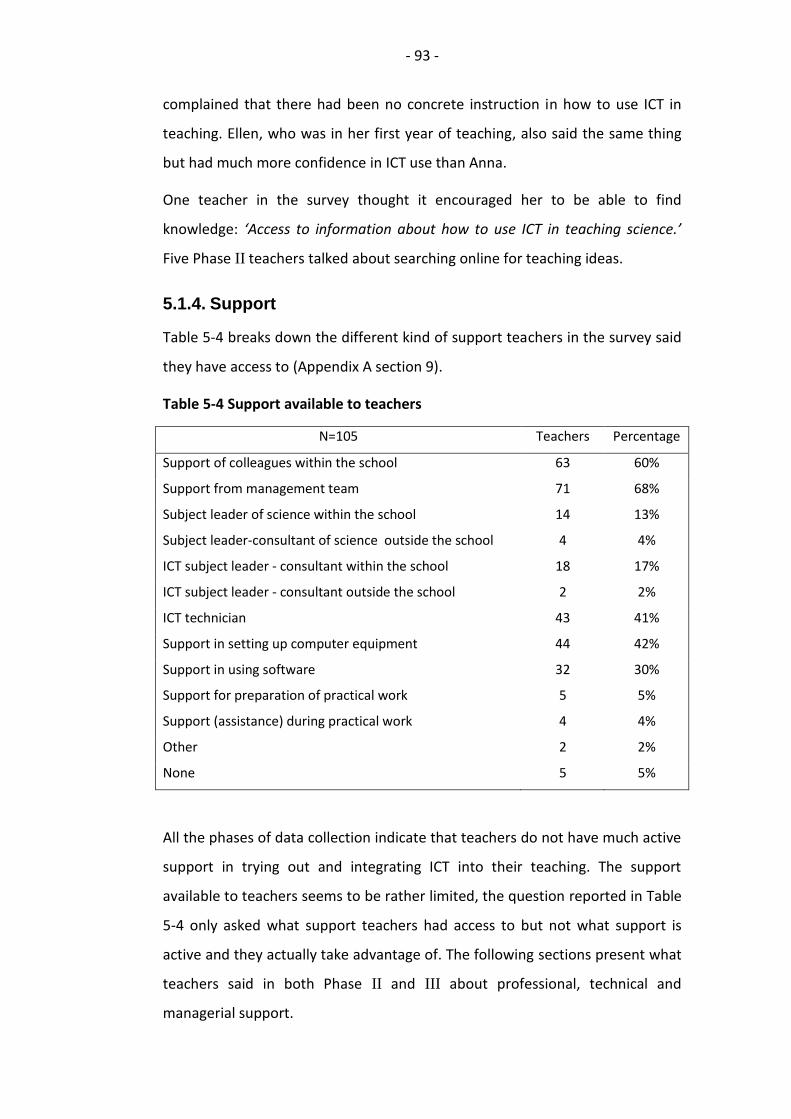
- 93 -
complained that there had been no concrete instruction in how to use ICT in
teaching. Ellen, who was in her first year of teaching, also said the same thing
but had much more confidence in ICT use than Anna.
One teacher in the survey thought it encouraged her to be able to find
knowledge: ‘Access to information about how to use ICT in teaching science.’
Five Phase II teachers talked about searching online for teaching ideas.
5.1.4. Support
Table 5-4 breaks down the different kind of support teachers in the survey said
they have access to (Appendix A section 9).
Table 5-4 Support available to teachers
N=105 Teachers Percentage
Support of colleagues within the school 63 60%
Support from management team 71 68%
Subject leader of science within the school 14 13%
Subject leader-consultant of science outside the school 4 4%
ICT subject leader - consultant within the school 18 17%
ICT subject leader - consultant outside the school 2 2%
ICT technician 43 41%
Support in setting up computer equipment 44 42%
Support in using software 32 30%
Support for preparation of practical work 5 5%
Support (assistance) during practical work 4 4%
Other 2 2%
None 5 5%
All the phases of data collection indicate that teachers do not have much active
support in trying out and integrating ICT into their teaching. The support
available to teachers seems to be rather limited, the question reported in Table
5-4 only asked what support teachers had access to but not what support is
active and they actually take advantage of. The following sections present what
teachers said in both Phase II and III about professional, technical and
managerial support.
- 94 -
The two items about support with practical work is a little bit outside the
Icelandic context. Technicians like English science teachers have are unheard of
and teachers are expected to handle all their preparation, often from
purchasing the equipment to setting up and clearing up themselves. From
comments to this question, it was clear that the few teachers that say they
have some support with practical work are referring to classroom assistants
who usually follow special educational needs children and can sometimes be
asked to assist with the whole class (for example in splitting it into groups).
Professional support
The issue of isolation and lack of cooperation often came up in Phase II.
Teachers feel they are too alone and need contact with others to find out what
is available and what others are trying out ‘it is often not till you meet people
that you find out about these things’ (T10), meaning information about
teaching materials and methods. T9 was very critical of the system, not having a
subject leader and this was her first and last year teaching in compulsory
schools. ‘I do not understand why no one is organising this, Why don´t I have
anybody to talk to who is subject leader in science,... Why are we all doing the
same thing in our own corner?’. Only 13% of teachers have a subject leader and
4% say they have access to subject leader or a consultant outside the school. In
two areas, the teachers meet occasionally and share ideas on teaching science.
Three teachers spoke of having a subject leader: T16 ‘it usually falls on me to be
subject leader’, Dora: ‘I am supposed to be subject leader’ and T10 said her
school had a subject leader who was on maternity leave. No references were
made to active support from heads of departments.
It surprised me when working with one of two teachers in a school on the
intervention, how little cooperation there is between them. In phase II there
were two references to active support of peers. In at least four of the schools
there were two science teachers. Only in one of them was there active
cooperation between the two teachers (T12 and T13) and they had developed
inventive ways of integrating various methods of ICT use into their teaching.
The cooperation between them seems to be one of the deciding factors in the
- 95 -
very successful and innovative teaching of science in that school. In the second
school there seemed to be some cooperation between the teachers. In regard
to ICT issues the interviewee (Olga) said they had discussed some things like a
collection of web-links for pupils but nothing had been put into practice. In the
other two schools the teachers taught different year groups and had no active
cooperation between them.
Technical support
In Table 5-4 it can be seen that technical support for teachers seems rather
limited with 41% having access to a technician. ICT subject leaders (consultants)
in Iceland may be educational staff within or outside the school which teachers
could go to for advice either on how to use specific applications themselves or
how to use them in teaching. These advisers would in some cases also be those
that would coordinate the teaching of ICT within the school and or even teach
ICT themselves. Only 17% say they have access to such support within the
school and 2% have access outside the school. T17 talked about this need for
support within the school:
There is no one that has the role of leading us in ICT implementation,……. It is my dream that there is somebody in the school that knows more than you, which you can learn from, it has happened on occasion and then you learn a lot, I think that is the best ICT learning that I have had, not in the university or in some courses, but when you are working with people that know more than you do.
The support with the equipment is more common with 41% saying they have
access to an ICT technician (somebody teachers can go to when some hardware
or software is not working or they need purely technical assistance). Similarly
support in setting up computer equipment is available to 42% of respondents
and support in using software to 30%. Several teachers (T17, T9, T16, Olga)
talked about the technical management and policy not being suited to schools.
T9 who taught in a large area with many schools and an outside IT department
said:
The focus here is wrong, the IT department is trying to force tools and gadgets on the teachers and they choose the things for us, but of course it should be me that tells the IT department what I need, you see the focus is just wrong.
- 96 -
Similarly Olga in an area with just a few schools was unhappy with not being
able to update software for the IWB or get the software for the digital
microscope installed when she moved rooms:
We have had some problems, the IT technician has been dragging his feet in updating this, this is not his area of interest so it is not at the top of his list of things to do.
Though Olga had the technical expertise to do these things herself the teachers
did not have access to install software or make changes. Other teachers had
similar complaints and felt restricted by the fact that the same filters applied to
them as pupils so they could not access material they felt was useful for them.
This experience though was not unanimous and some (T11, T16, T15) spoke
highly of the technical assistance ‘we have a computer guy that does everything
for us’ (T11).
Managerial support
In Phase II and III there were few references to support from management. No
references were made to active support from headteachers but albeit teachers
were not prompted about this. That is not to say that headmasters seem
unsupportive in teacher accounts, just that the initiative rarely comes from
them:
We have really good headmasters, they follow us totally, that is just great, we get what we want, uhm but not the equipment, heheh the big things, but then again we have not really asked for them either.
This is T12 talking and it is obvious who is in charge: the teachers come with the
ideas, ask for what they want and are granted their polite wishes. Dora also
mentioned management in the context of getting new equipment;
well there has been talk of it and somebody said it would be great to get them [IWB’s] but not by the management, especially not now, you know how everything is, we are not going to get new boards in the near future, that is for sure.
T9 was not so happy with her headteachers. She was amazed that there was no
policy within the school on computer-based communications (Facebook, MSN
etc) with pupils and even more amazed when she found out that the school had
access to Blackboard and that the management team was not aware of it. This
- 97 -
lack of policy and vision was one of the reasons that this was T9’s only and last
year of teaching in lower secondary schools.
In the last interview with the intervention teachers, I asked them whether their
co-workers or headteachers had shown any interest in what they were trying
out. Only one of them said so and that person was a personal acquaintance of
mine. It was never mentioned in any way that teachers felt any pressure or
even encouragement from headteachers or co-workers to use ICT in their
teaching.
5.1.5. Time and workload issues
Time and workload issues seem to be a hindrance to teachers exploring how
they can use ICT in teaching, to learn about new things and search for new
possibilities. The time issue is somehow connected to how teachers approach
their work, one said grumpily ‘I think that many of these teacher that really use
ICT, they do it in their own time out of their own interest’ while another said ‘I
find it all so exciting, I just sit at home with the laptop’. Another (T14) stated
that he was not going to use time as an excuse (‘You can always use that as an
excuse’) meaning that there are always many demands on teachers’ time and
that it is more a question of prioritisation. Most teachers also said something
along the lines that they had been meaning to look into what was available on
the internet but that they simply have not given themselves the time. Some
were aware of the possibility that ICT also holds ways of saving time with, for
example, online tests. Only one was experimenting with such tests and two
others said it would be time consuming to begin with, though it might pay off in
the long run. The time issue was especially mentioned by those who had
recently started teaching science, like T11 said, ‘It has taken so much time to
simply learn the topic material that I have barely had a life’.
It may also be mentioned here that even though it is not the subject of this
study issues regarding practical work raised frequently in Phase II. Teachers felt
they were not doing enough practical work. They expressed similar views
regarding practical work as ICT, explaining that they lacked knowledge, both in
terms of resources and subject content knowledge, to meet the demands they
- 98 -
felt from pupils and the curriculum for more practical work. Such demands
were not mentioned with regards to using ICT use in their teaching.
Time and workload issues are also explored in the four cases in section 5.2.
5.1.6. Teacher knowledge
Teacher knowledge turned out to be a salient theme through all data collection
exercises. Teachers mostly talked about what they did not know and less about
what they did know. The concept of knowledge here is treated loosely to mean
both knowledge and skills. The model of TPCK (Mishra and Koehler, 2006) (see
section 2.4.4) frames the following section. The TPCK model argues that
teachers need pedagogical, content- and technical knowledge for successful
technology integration.
Technical knowledge
From the literature the issues of teacher confidence in working with computers
seemed more prominent. The survey contained a list of statements regarding
teacher confidence rather than knowledge. Three were about teacher
confidence when using ICT in class (see Appendix A item 11). Over 83% of
teachers agreed or strongly agreed with all of these statements, which were
about not being afraid to make mistakes in front of a class, feeling confident
using ICT in front of pupils and managing a class using ICT.
Phase II and III showed that teachers generally know how to use computers and
generic software but are different in how competent they feel. Two said their
competence was a hindrance to them and they really had to struggle to keep up
with technology. ‘You need to learn them [programmes] so well.....when you are
figuring them out you somehow always hit a wall’ (T10), ‘I am always learning
something new and fiddling around with them’ (T11).
Four teachers talked about their willingness to take risks and let the pupils help
them when they know better. They agree with the 83% that said they were not
afraid to make mistakes in front of pupils. Some also are not bothered by pupils
knowing more than they
- 99 -
Well maybe [it is bad] when they have more skills than you do, but I, you know, well still, maybe I am a little less confident, but it is anyway they may just as well have more skills than me. (Dora).
Two of the teachers (T9 and Olga) are ICT specialists and clearly had more
knowledge than they actually use in their teaching. This can probably be said
for many of the respondents to the survey as section 4.1.2 showed that
teachers generally use a higher number of applications in their out of class work
and personal life than with pupils.
In the survey (see Table 5-2 ) two teachers mentioned their knowledge or skills
as an encouraging factor; ‘I like working with computers and use the projector
to show notes, photos and videos’ and ‘My knowledge of the possibilities of ICT
and the internet’.
Subject content knowledge
Indications of teacher subject content knowledge come from all sources of data
collection but have no specific measure. The education of teachers gives an
indication of what they may know but also their own opinions and views of
what they find difficult to teach (see Appendix A, section 13).
Table 5-5 Difficult topics of science
N=66 Difficult to teach Difficult to learn
Physics 24 36% Physics 30 45%
Chemistry 15 23% Chemistry 24 36%
Biology 18 27% Biology 14 21%
Other 14 21% Other 12 18%
Practical work 5 8% Practical work 0 0%
Earth sciences 5 8% Earth sciences 6 9%
Nothing 3 5% Nothing 1 2%
Lack of resources 2 3% Invisible things 8 12%
Number of comments 86 130% 95 144%
In order to help choose topics for the intervention teachers were asked what
topics they thought they found difficult to teach and pupils found difficult to
learn, and which ICT might help with. The question was answered by 66
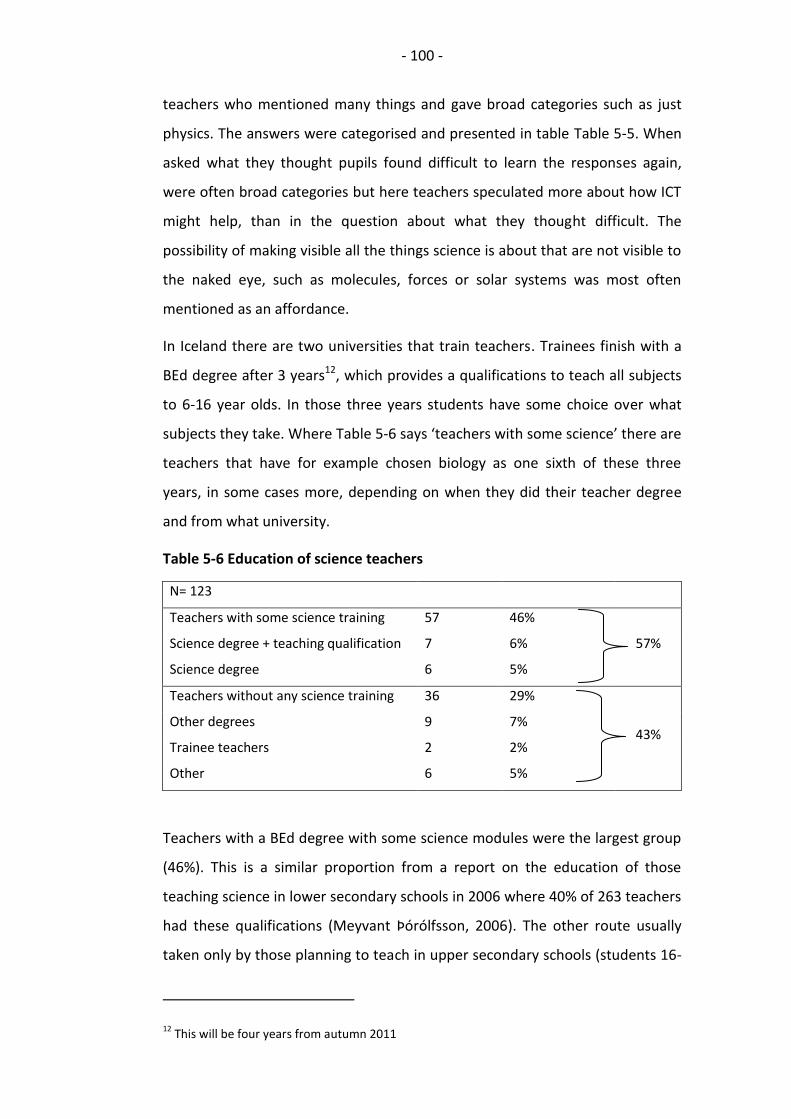
- 100 -
teachers who mentioned many things and gave broad categories such as just
physics. The answers were categorised and presented in table Table 5-5. When
asked what they thought pupils found difficult to learn the responses again,
were often broad categories but here teachers speculated more about how ICT
might help, than in the question about what they thought difficult. The
possibility of making visible all the things science is about that are not visible to
the naked eye, such as molecules, forces or solar systems was most often
mentioned as an affordance.
In Iceland there are two universities that train teachers. Trainees finish with a
BEd degree after 3 years12, which provides a qualifications to teach all subjects
to 6-16 year olds. In those three years students have some choice over what
subjects they take. Where Table 5-6 says ‘teachers with some science’ there are
teachers that have for example chosen biology as one sixth of these three
years, in some cases more, depending on when they did their teacher degree
and from what university.
Table 5-6 Education of science teachers
N= 123
Teachers with some science training 57 46%
57% Science degree + teaching qualification 7 6%
Science degree 6 5%
Teachers without any science training 36 29%
43% Other degrees 9 7%
Trainee teachers 2 2%
Other 6 5%
Teachers with a BEd degree with some science modules were the largest group
(46%). This is a similar proportion from a report on the education of those
teaching science in lower secondary schools in 2006 where 40% of 263 teachers
had these qualifications (Meyvant Þórólfsson, 2006). The other route usually
taken only by those planning to teach in upper secondary schools (students 16-
12 This will be four years from autumn 2011
- 101 -
20 year old) is to do a science degree and then a teaching qualification (PGCE).
In the survey of 123 respondents only 13 had a degree in a science related area
and seven of those also had teaching qualifications. One sixth of three years is
not much, still those participating in Phase II and III who had that training felt
fairly confident in their chosen subjects (chemistry, physics or biology). All but
one of them still had to teach all three science subjects and frequently
expressed their limitations in other areas: ‘I for example did more physics
before I graduated, needed more biology and have been studying a lot’ (Ellen)
and ‘I on the other hand did biology and have after that just been studying
myself, physics, astronomy..’ (T16).
Those that had no science in their teacher training also expressed their
limitations:
I begin by having them make a dictionary, hehe I had to do it myself when I started to teach them, I mean there were so many new concepts that I had never seen so I had to connect with them myself to be able to mediate them to the pupils (T10).
When asked about what hindered her in using more ICT Anna said:
well, it is my own lack of knowledge, I do not lack the will, I would like to do more, but I am for example not a qualified science teacher, I am and Icelandic teacher
She later stated that it was difficult and that she felt unsecure teaching science.
Pedagogical knowledge
From talking to the teachers it seemed that they had not given it serious
thought how to have pupils use ICT as an integral part of their science learning.
Only 66% of teachers agreed that they were aware what role ICT should play
according to the National Curriculum and 26% were not sure. None of the
Phase II teachers mentioned curricular demands for the ICT uses they had tried
out.
A statement from the survey; ‘I feel confident managing a class using ICT’ that
86% agreed to, could both give indications about technical confidence or
pedagogical confidence. Technical confidence meaning that they had enough
technical knowledge to help pupils with the software or hardware and
- 102 -
pedagogical in that they felt confident monitoring the pupils around the
computers. Either way it gives indications that the respondents have
confidence with classes working with ICT. Issues with managing pupils and
equipment were mentioned though. This included sending pupils to work in
different places in the school where the computers might be located, thereby
making it more difficult for teachers to monitor their work. Other organisational
aspects that hindered the teachers was monitoring the work of big classes
(Ellen, class of 28 pupils) or wanting to split the class between computer work
and other tasks but not being able to be in two places at a time, nor get
assistance (Olga, T13). Despite these issues the feeling is more that teachers are
willing and able to teach in different arrangements. This can be seen from the
statement ‘I only use ICT when students can work individually on a computer’
which only 8% disagreed to, indicating that at least teachers do not believe that
they need one computer for every pupil and can organise different
arrangements. That could also be seen in the lessons described (see Table 4-1
p. 69), where the most common organisation are group and pair-work and the
least is individual work.
The knowledge that teachers thought really hindered them, was not knowing
what resources were available to teach science. Thirteen of 111 comments
about factors that hinder teachers in using ICT in their teaching were about
lacking knowledge (Table 5-1). Seven comments were about general lack of
knowledge ‘I just do not know’ or more specific as ‘I do not know where to look
for such things online’. Teachers also provided other reasons like ‘There is little
time to look into what possibilities there are and I do not know them’, or ‘my
knowledge in these matters is limited, it is mostly Word and PowerPoint, but I
am interested in learning more to be able to increase the chances of more
varied tasks’. This was repeated in one way or another by all participants in
Phase II. It turned out that for all of them there was at least one way of using
ICT in teaching science that they were not aware of. The only exception to this
was Ellen who was in her first year of teaching and really interested in ICT, but
still regretted not having any experience in using data loggers, though she knew
of them. Still it was striking that teachers, even newly qualified teachers (Anna),

- 103 -
did not know what data loggers were, ‘hang on, data loggers, what are those?’.
When asked about virtual experiments/simulations replies like ‘what is that ?’,
‘well I have never heard of this’ and ‘I did not even know such thing existed’
were common and as was said before that 23% were not aware of them. Tara
pointed out that teacher guides with Icelandic science textbooks do not give
much guidance on how to use ICT in teaching.
On the other end it seemed to encourage Ellen in her attempts to integrate ICT
into her teaching as she knew from her teacher training about the positive
affordances and effects from using ICT.
The factors affecting teachers as they appear in Icelandic context are discussed
and combined into an amended model in section 7.2.
5.2. Illustrative cases
Four of the five teachers in the intervention group participated in all phases of
the study and in two of the three micro interventions so the data collected on
them is rich and varied. The data includes their responses to the survey,
numerous interviews, observations and informal conversations from a whole
school year. This gives the study a longitudinal aspect with a considerable
amount of data (see Table 3-4 Participation in Phase II and III.). The intention
had been to use the phase II interviews to complement the findings from the
survey but the individual cases proved to give interesting stories as the study
progressed.
The purpose of this section is to illustrate how the factors and issues outlined in
section 5.1 manifest themselves in individual cases in context. Some of these
factors are common to all of the teachers but are still nested in different ways,
in each case in a complex interplay of factors from their background and
current situation in both personal and professional lives. The issues from each
teacher that stands out are highlighted, taking into account that what affects
human decisions and actions is always a combination of a plethora of dynamic
aspects.
- 104 -
The stories of these teachers are presented and analysed as cases seen through
the perspective of cultural historical activity theory. References are made to the
survey data where appropriate. The next sections see a brief introduction of the
analytical framework applied and then the cases are presented.
5.2.1. Analytical framework: activity theory
I became aware of Cultural Historical Activity Theory (CHAT) late in the data
analysis process trying to make sense of what it is that affects teachers in
learning to use and implement new technologies. That is why the theory and
how it used is introduces so far into this thesis.
The genesis of activity theory may be traced back to the beginning of 20th
century to cultural psychologists in Russia and Marxist ideas. The most
prominent of these psychologists, Lev Vygotsky introduced the notion of unit of
analysis and psychological tools along with their role in human activity. Aleksey
Leontiev summarized ideas around activity into framework of activity theory
that grew out of their studies of the development of the mind (Kaptelinin and
Nardi, 2006). Many schools of activity theory have emerged comprising many
concepts and main ideas. Among them ideas about the hierarchical structure of
an activity, the object orientedness and the social nature of the human mind.
Following is a brief introduction of the concepts and ideas that were used in
this thesis. The approach influencing this thesis is the one developed by
Engeström (Engeström, 1987; Engeström, 2001)though not all aspects such as
learning phases are represented.
CHAT has the promise (Watson, 2006; Engeström, 2001) to be a useful tool
when considering something as complex as the implementation of new
technology into teaching. CHAT has been used to investigate changes in
institutions and how work develops through the use of new tools. The basic
unit of activity theory is the interplay between subject and object mediated by
tools. The theory also takes into consideration the social situations that
activities take place in, the rules within the situation, the society, and the
division of labour. All the features of the system affect each other as seen in

- 105 -
Figure 5-1 which shows that all the elements of an activity system are
interlinked (Engeström, 1987, p. 78).
Figure 5-1 General model of an activity system (Engeström, 2001)
The theory includes the five principles of activity theory (Engeström, 2001)
which are recounted below along with how activity theory can help with
analysing aspects of this study.
The first principle is that ‘a collective, artefact mediated and object oriented
activity system seen in its network relations to other activity systems, is taken
as the prime unit of analysis’ (Engeström, 2001, p. 136). Individual or group
actions can also be seen as the unit of analysis but only understood in relation
to the activity system as a whole. This principle guides the analysis of the
teacher profiles in the next section where teaching science mediated by ICT is
the activity within the social structure of the schools where it takes place.
The second principle is about multi-voicedness of activity systems (Engeström,
2001), that in communities there are many points of views created by the
division of labour, different histories and multiple layers visible through
artefacts, rules and traditions. This multi-voicedness ‘is a source of trouble and
a source of innovation, demanding actions of translation and negotiation.’
(Engeström, 2001 p. 137). When looking at innovations such as the integration
of ICT in schools there are certainly many points of views to consider. This
principle drew attention to factors affecting the teachers in this study which

- 106 -
otherwise might have been overlooked or interpreted differently. All these
voices surface in the presentation of the cases.
The third principle, that of historicity, to understand problems and potentials of
an activity system and its history is a reminder in this study that the
implementation of ICT into science teaching is just one aspect in the long
process of school evolution. This aspect needs to be considered as is done in
the introduction of this study.
Contradictions can drive change and development in practice such as schools.
‘Contradictions are not the same as problems or conflicts.’ (Engeström, 2001
p.137), but something that causes disturbances to the activity and does not
quite work.
When an activity system adopts a new element from the outside (for example, a new technology or a new object), it often leads to an aggravated secondary contradiction where some old element..... collides with the new one.(Engeström, 2001 p. 137).
Dealing with the contradictions may lead to innovative solutions and
development of activity.
The fifth principle is about expansive transformations, that activity systems
gradually overcome contradictions towards expansive transformations. They
move through the zone of proximal development of an activity, redefining the
object and the purpose of the activity, learning how to work in new and
improved ways (if not they become stagnant). Contradictions can occur at
different situations outlined in Table 5-7 Overview of contradictions.
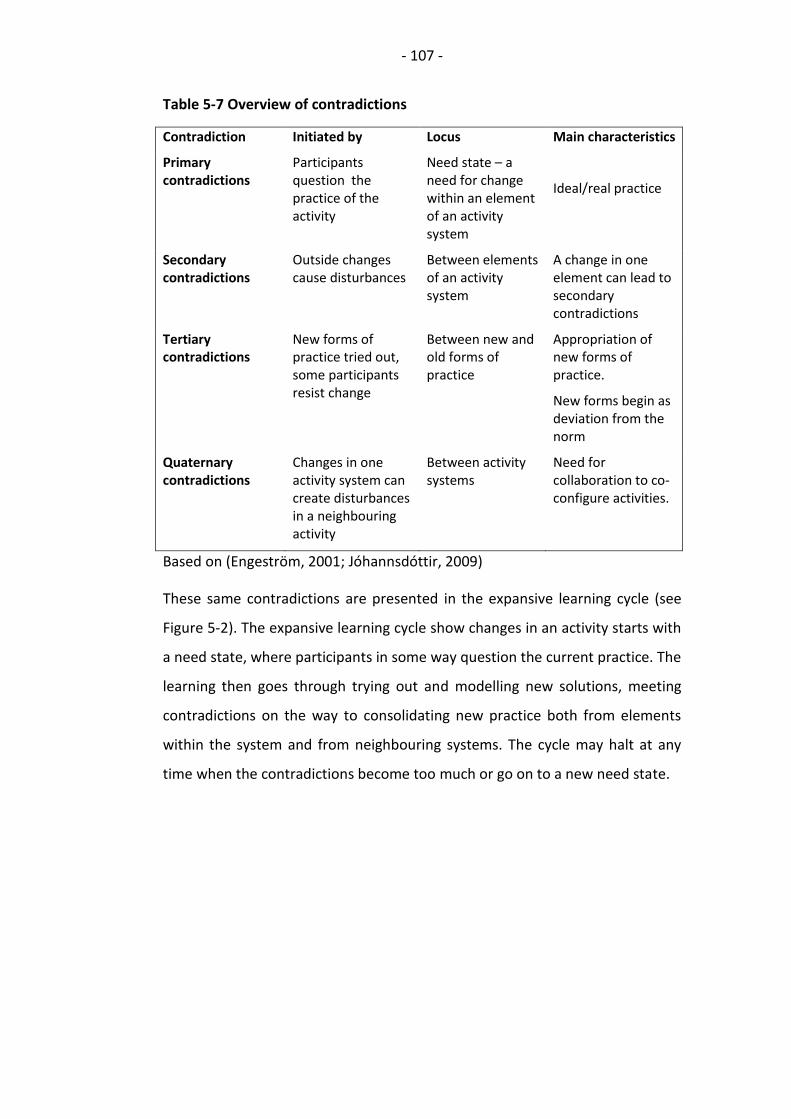
- 107 -
Table 5-7 Overview of contradictions
Contradiction Initiated by Locus Main characteristics
Primary contradictions
Participants question the practice of the activity
Need state – a need for change within an element of an activity system
Ideal/real practice
Secondary contradictions
Outside changes cause disturbances
Between elements of an activity system
A change in one element can lead to secondary contradictions
Tertiary contradictions
New forms of practice tried out, some participants resist change
Between new and old forms of practice
Appropriation of new forms of practice.
New forms begin as deviation from the norm
Quaternary contradictions
Changes in one activity system can create disturbances in a neighbouring activity
Between activity systems
Need for collaboration to co-configure activities.
Based on (Engeström, 2001; Jóhannsdóttir, 2009)
These same contradictions are presented in the expansive learning cycle (see
Figure 5-2). The expansive learning cycle show changes in an activity starts with
a need state, where participants in some way question the current practice. The
learning then goes through trying out and modelling new solutions, meeting
contradictions on the way to consolidating new practice both from elements
within the system and from neighbouring systems. The cycle may halt at any
time when the contradictions become too much or go on to a new need state.
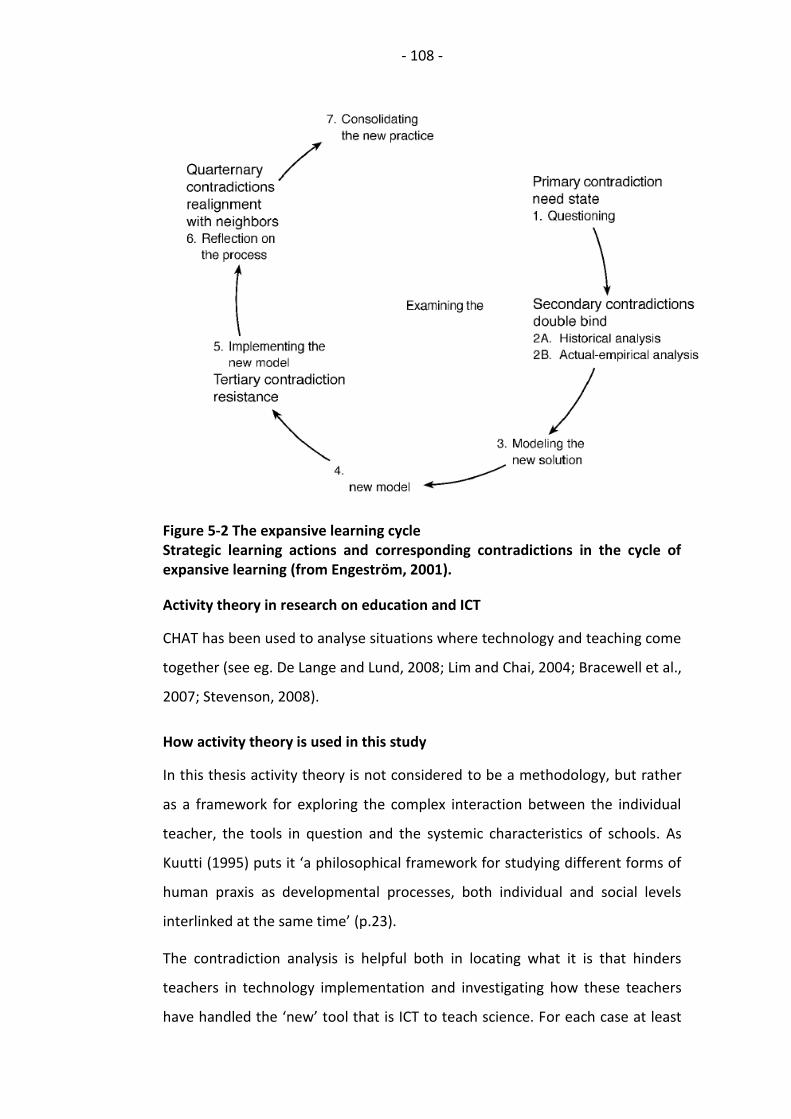
- 108 -
Figure 5-2 The expansive learning cycle Strategic learning actions and corresponding contradictions in the cycle of expansive learning (from Engeström, 2001).
Activity theory in research on education and ICT
CHAT has been used to analyse situations where technology and teaching come
together (see eg. De Lange and Lund, 2008; Lim and Chai, 2004; Bracewell et al.,
2007; Stevenson, 2008).
How activity theory is used in this study
In this thesis activity theory is not considered to be a methodology, but rather
as a framework for exploring the complex interaction between the individual
teacher, the tools in question and the systemic characteristics of schools. As
Kuutti (1995) puts it ‘a philosophical framework for studying different forms of
human praxis as developmental processes, both individual and social levels
interlinked at the same time’ (p.23).
The contradiction analysis is helpful both in locating what it is that hinders
teachers in technology implementation and investigating how these teachers
have handled the ‘new’ tool that is ICT to teach science. For each case at least
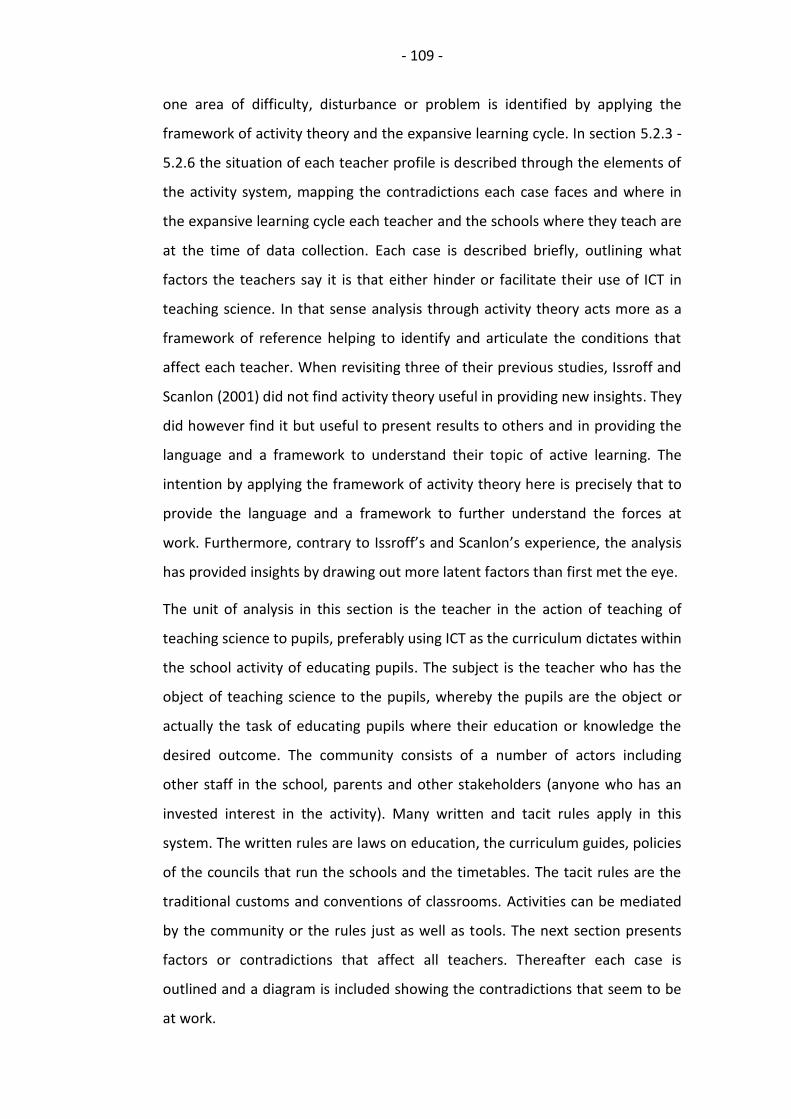
- 109 -
one area of difficulty, disturbance or problem is identified by applying the
framework of activity theory and the expansive learning cycle. In section 5.2.3 -
5.2.6 the situation of each teacher profile is described through the elements of
the activity system, mapping the contradictions each case faces and where in
the expansive learning cycle each teacher and the schools where they teach are
at the time of data collection. Each case is described briefly, outlining what
factors the teachers say it is that either hinder or facilitate their use of ICT in
teaching science. In that sense analysis through activity theory acts more as a
framework of reference helping to identify and articulate the conditions that
affect each teacher. When revisiting three of their previous studies, Issroff and
Scanlon (2001) did not find activity theory useful in providing new insights. They
did however find it but useful to present results to others and in providing the
language and a framework to understand their topic of active learning. The
intention by applying the framework of activity theory here is precisely that to
provide the language and a framework to further understand the forces at
work. Furthermore, contrary to Issroff’s and Scanlon’s experience, the analysis
has provided insights by drawing out more latent factors than first met the eye.
The unit of analysis in this section is the teacher in the action of teaching of
teaching science to pupils, preferably using ICT as the curriculum dictates within
the school activity of educating pupils. The subject is the teacher who has the
object of teaching science to the pupils, whereby the pupils are the object or
actually the task of educating pupils where their education or knowledge the
desired outcome. The community consists of a number of actors including
other staff in the school, parents and other stakeholders (anyone who has an
invested interest in the activity). Many written and tacit rules apply in this
system. The written rules are laws on education, the curriculum guides, policies
of the councils that run the schools and the timetables. The tacit rules are the
traditional customs and conventions of classrooms. Activities can be mediated
by the community or the rules just as well as tools. The next section presents
factors or contradictions that affect all teachers. Thereafter each case is
outlined and a diagram is included showing the contradictions that seem to be
at work.
- 110 -
5.2.2. Conditions that apply to all the cases
Some of the contradictions that the cases face are common to them all and are
the same factors that act as barriers to technology integration as seen in
section 5.1. These contradictions or barriers (see Figure 5-3) are listed next with
the letters A- E, as found in Figures 5-3 through 5-7. These contradictions are
described first instead of repeating them for all cases, but they are further
outlined where appropriate how they appear in each case.
Figure 5-3 Contradictions all teachers face
A. Primary contradiction within the tool
ICT not only has the potential of bringing to pupils new and useful information
but also a range of distractions especially on devices with an internet
connection. Some teachers in this study complained that pupils got distracted
and wanted more to play games or go on Facebook. This is a contradiction
between the use value, the educational potential and the exchange value so
there is also potential for the set learning goals to be interrupted by the tool
but not in exchange for possible use value. This can lead to disruptions in the
system, manifesting themselves in secondary contradictions, with a need to
evaluate and adapt this tool to practice or the practice to the tool. That is when
- 111 -
using computers teachers need to change their practice and learn new skills to
reap the benefits of their use.
B. Secondary contradiction – tools and rules
The first contradiction that schools stand against is that ICT often disrupts the
classical set up of one teacher talking and one class sitting quietly and listening
in a classroom. Firstly, pupils in some cases will have to move to other rooms,
sometimes work in groups and then even manage the pace of their work
themselves. This requires that the rules about how to manage a class around
the technology need to be adapted to fit the tool. This problem is related to
teacher knowledge in the sense that they need new or adapted pedagogical
knowledge to work with the tool.
C. Secondary contradictions between the subject and the community
Access to equipment: This is a secondary contradiction between elements of
the activity system. The elements are the subject (teacher) and the community
(teachers and headteachers in this case) mediated by the rules (timetables,
booking systems) about how access to the clusters is distributed and who gets
to use them. The input of new tools into an activity system often requires the
rules to be changed. Schools do not seem to have accommodated for the
technology by changing the structure of timetables, nor allowed for adequate
access. There is also a mismatch in the way ICT is supposed to be used
according to policy papers and the National Curriculum on the one hand and
the provision of equipment on the other hand.
D. Secondary contradictions between subject and management.
Lack of support: Stevenson (2008) calls the division of labour element
‘management’ in a pedagogical context. A barrier or tension that was observed
with all the cases, though they did not articulate it themselves in so many
words, is that they all lack the support of a community in using ICT in their
teaching. I choose to put this down as a secondary contradiction between what
is expected of teachers (the subject) in the curriculum (which act as outside
rules) and the conditions in which they carry out these expectations. Organising
these conditions is a role of management. In this instance the headteachers
- 112 -
that organise the timetables and decide who is going to teach what, which also
includes if a teacher is teaching the subject alone or part of a team. This is
mediated by the rules, the school organisation and Union agreements that map
out the working environment, allocating time for preparation and teaching
hours. However time to find resources, learn and prepare was one of major
barriers mentioned in the survey (see section 5.1.5).
Rules for outcome guarantee are missing in this system, though none of the
teachers articulated it. There is limited inspection or follow up to see if the
curriculum or policy is being followed in anyway. An incentive to change
practice does not come through that channel but rather through teachers’ own
initiative. In that way the teachers have little motive to change the activity as
their true motive is to educate pupils which has usually worked with the
traditional tools.
E. Lack of knowledge - instrumentality
All the cases to some extent face the problem that using is ICT a relatively new
practice and their TPCK is limited. In some cases the knowledge lacking is
knowing what resources are available and often how to use generic and specific
software in teaching. TPCK has a resonance with the concept of instrumentality:
The notion of an instrumentality refers to the entire toolkit used in an activity, understood as a multi-layered constellation, which includes both material and conceptual elements (Engeström and Toiviainen, 2011, p. 35).
Here the knowledge of ICT and associated pedagogy can be conceived as
conceptual elements which need to be developed further. This is a problem in
that teachers know they could or should be using the tool, but lack the
knowledge to really utilize it to find a solution. There is a mismatch between
the actual practice and the ideal type of practice.
Another facet is that the management provides professional development
opportunities. Here there is also a mismatch between written expectations and
the CPD on offer. The tool making activity that needs to take place in the sense
of developing teaching methods to fit the equipment is not being supported.
- 113 -
For the individual cases only the labels (A, B, C, D and E) are included in the
diagrams to refer back to this section. Table 5-8 provides an overview of the
factors affecting the cases presented. The deterring factors for each case were
decided either if the teacher herself talked of them as hindering her ICT use in
any way or if these factors were observed as hindering either their execution or
organisation of the observed lessons.
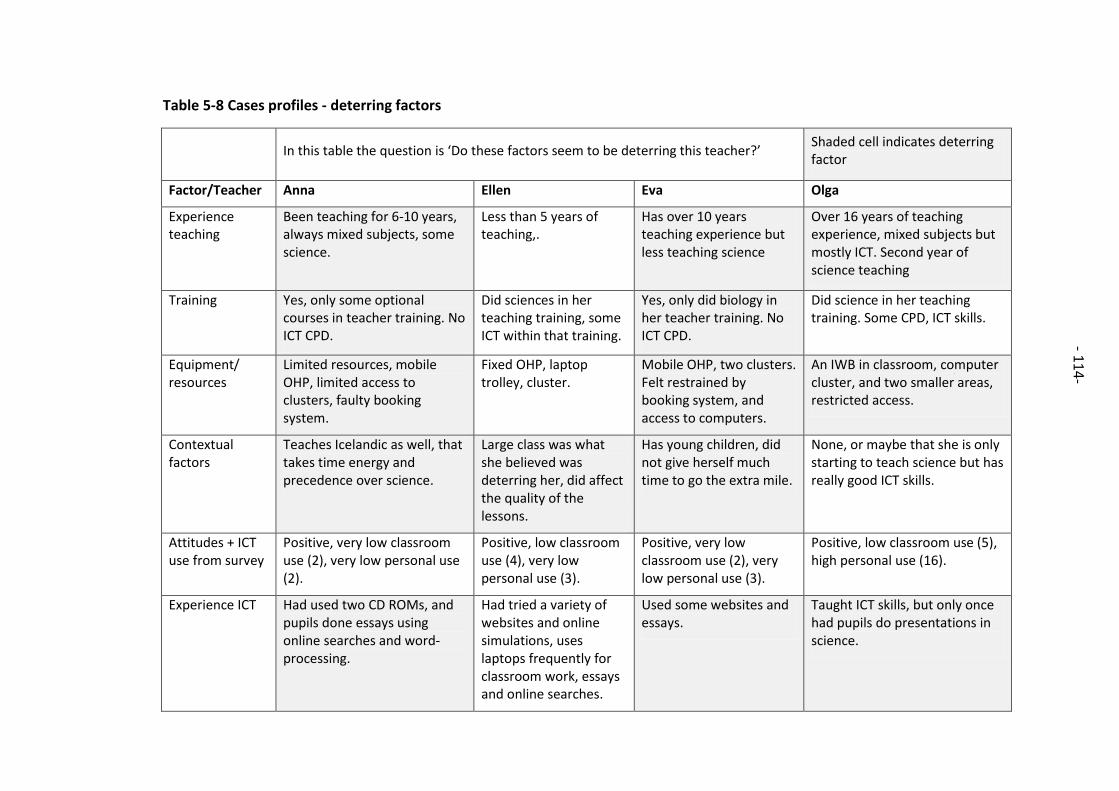
- 114 -
- 11
0-
Table 5-8 Cases profiles - deterring factors
In this table the question is ‘Do these factors seem to be deterring this teacher?’
Shaded cell indicates deterring factor
Factor/Teacher Anna Ellen Eva Olga
Experience teaching
Been teaching for 6-10 years, always mixed subjects, some science.
Less than 5 years of teaching,.
Has over 10 years teaching experience but less teaching science
Over 16 years of teaching experience, mixed subjects but mostly ICT. Second year of science teaching
Training Yes, only some optional courses in teacher training. No ICT CPD.
Did sciences in her teaching training, some ICT within that training.
Yes, only did biology in her teacher training. No ICT CPD.
Did science in her teaching training. Some CPD, ICT skills.
Equipment/ resources
Limited resources, mobile OHP, limited access to clusters, faulty booking system.
Fixed OHP, laptop trolley, cluster.
Mobile OHP, two clusters. Felt restrained by booking system, and access to computers.
An IWB in classroom, computer cluster, and two smaller areas, restricted access.
Contextual factors
Teaches Icelandic as well, that takes time energy and precedence over science.
Large class was what she believed was deterring her, did affect the quality of the lessons.
Has young children, did not give herself much time to go the extra mile.
None, or maybe that she is only starting to teach science but has really good ICT skills.
Attitudes + ICT use from survey
Positive, very low classroom use (2), very low personal use (2).
Positive, low classroom use (4), very low personal use (3).
Positive, very low classroom use (2), very low personal use (3).
Positive, low classroom use (5), high personal use (16).
Experience ICT Had used two CD ROMs, and pupils done essays using online searches and word-processing.
Had tried a variety of websites and online simulations, uses laptops frequently for classroom work, essays and online searches.
Used some websites and essays.
Taught ICT skills, but only once had pupils do presentations in science.
- 11
4-
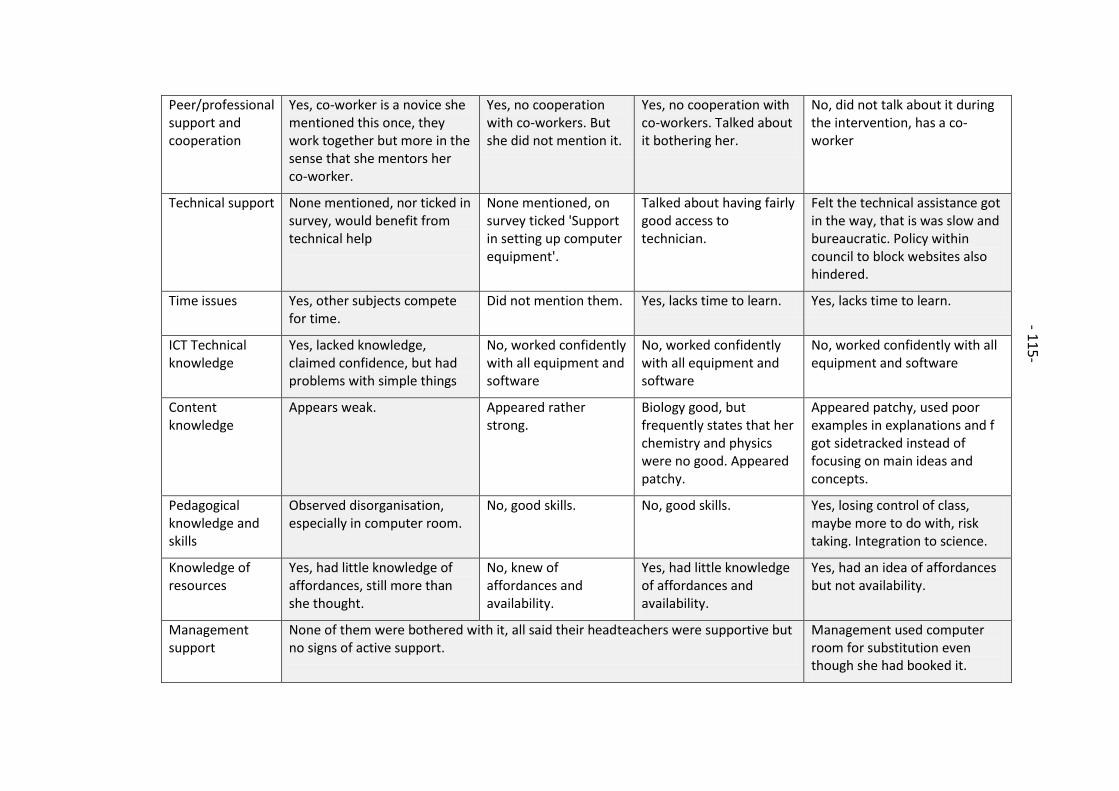
- 115 -
- 11
5-
Peer/professional support and cooperation
Yes, co-worker is a novice she mentioned this once, they work together but more in the sense that she mentors her co-worker.
Yes, no cooperation with co-workers. But she did not mention it.
Yes, no cooperation with co-workers. Talked about it bothering her.
No, did not talk about it during the intervention, has a co-worker
Technical support None mentioned, nor ticked in survey, would benefit from technical help
None mentioned, on survey ticked 'Support in setting up computer equipment'.
Talked about having fairly good access to technician.
Felt the technical assistance got in the way, that is was slow and bureaucratic. Policy within council to block websites also hindered.
Time issues Yes, other subjects compete for time.
Did not mention them. Yes, lacks time to learn. Yes, lacks time to learn.
ICT Technical knowledge
Yes, lacked knowledge, claimed confidence, but had problems with simple things
No, worked confidently with all equipment and software
No, worked confidently with all equipment and software
No, worked confidently with all equipment and software
Content knowledge
Appears weak. Appeared rather strong.
Biology good, but frequently states that her chemistry and physics were no good. Appeared patchy.
Appeared patchy, used poor examples in explanations and f got sidetracked instead of focusing on main ideas and concepts.
Pedagogical knowledge and skills
Observed disorganisation, especially in computer room.
No, good skills. No, good skills. Yes, losing control of class, maybe more to do with, risk taking. Integration to science.
Knowledge of resources
Yes, had little knowledge of affordances, still more than she thought.
No, knew of affordances and availability.
Yes, had little knowledge of affordances and availability.
Yes, had an idea of affordances but not availability.
Management support
None of them were bothered with it, all said their headteachers were supportive but no signs of active support.
Management used computer room for substitution even though she had booked it.

- 116 -
5.2.3. Olga
Olga did science and geography in teacher training but has mostly taught ICT.
This was her first year teaching science full time. She had a computer and an
IWB in her classroom and which she used to show videos, presentations and
project from a digital microscope. Pupils had only once worked on posters using
information off the internet. Her responses to the questionnaire showed that
even though she knew every application and used them in her private life and
other jobs than teaching in school, pupils rarely got to use ICT. When asked
about this discrepancy she said:
Well one does not know why that is, I guess it is because you do not quite trust the kids, or….. to put it differently, I probably do not trust myself to get started, am too afraid to lose control, …….. that everything will go wrong, I have just recently began to teach science (Type B)
Later after talking about the lack of a science lab and access to computers (Type
C) she says:
The main obstacle is really just me, one is just not flexible enough in just letting go, just try it, like I did in that project, then I let go a little bit and sent them to the cluster, there were problems, disciplinary, and of course some of them were just playing games instead of working, but it worked fine, most of the groups finished with a decent product, so I think I will do it again (Type A).
When asked about online simulations she again says ‘I freely admit that I am
not efficient enough in [taking the time to find out what is available] …… it is
just there are too many distractions/tasks’ (Type D).
Her subject knowledge seems to be patchy and she easily goes off on a tangent
when talking to pupils. There were silences when she was reading from the
book to get information. Working with pupils on an ecosystem simulation in a
cluster was easy for her. She came well prepared and introduced the lesson in
the classroom on the IWB before going to the computer room. In the computer
room, the focus of the lesson soon shifted from the science concepts to the
scores the simulation gives for finding a balance in the system.
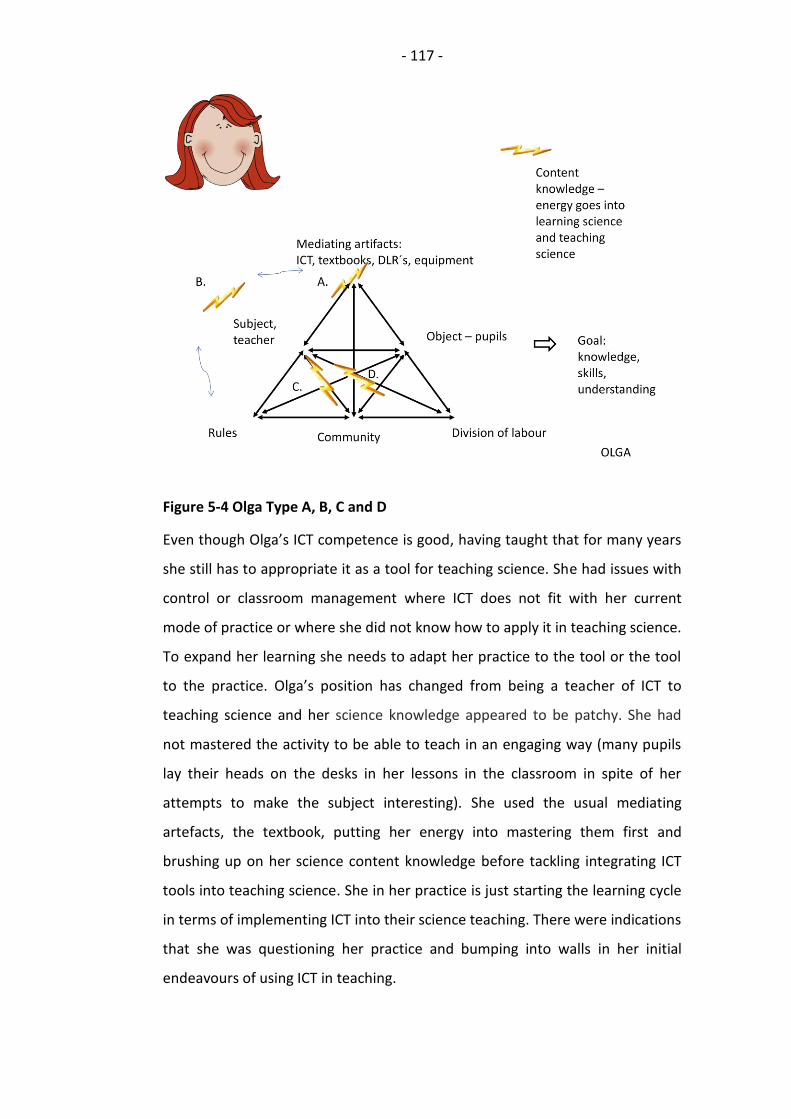
- 117 -
Figure 5-4 Olga Type A, B, C and D
Even though Olga’s ICT competence is good, having taught that for many years
she still has to appropriate it as a tool for teaching science. She had issues with
control or classroom management where ICT does not fit with her current
mode of practice or where she did not know how to apply it in teaching science.
To expand her learning she needs to adapt her practice to the tool or the tool
to the practice. Olga’s position has changed from being a teacher of ICT to
teaching science and her science knowledge appeared to be patchy. She had
not mastered the activity to be able to teach in an engaging way (many pupils
lay their heads on the desks in her lessons in the classroom in spite of her
attempts to make the subject interesting). She used the usual mediating
artefacts, the textbook, putting her energy into mastering them first and
brushing up on her science content knowledge before tackling integrating ICT
tools into teaching science. She in her practice is just starting the learning cycle
in terms of implementing ICT into their science teaching. There were indications
that she was questioning her practice and bumping into walls in her initial
endeavours of using ICT in teaching.
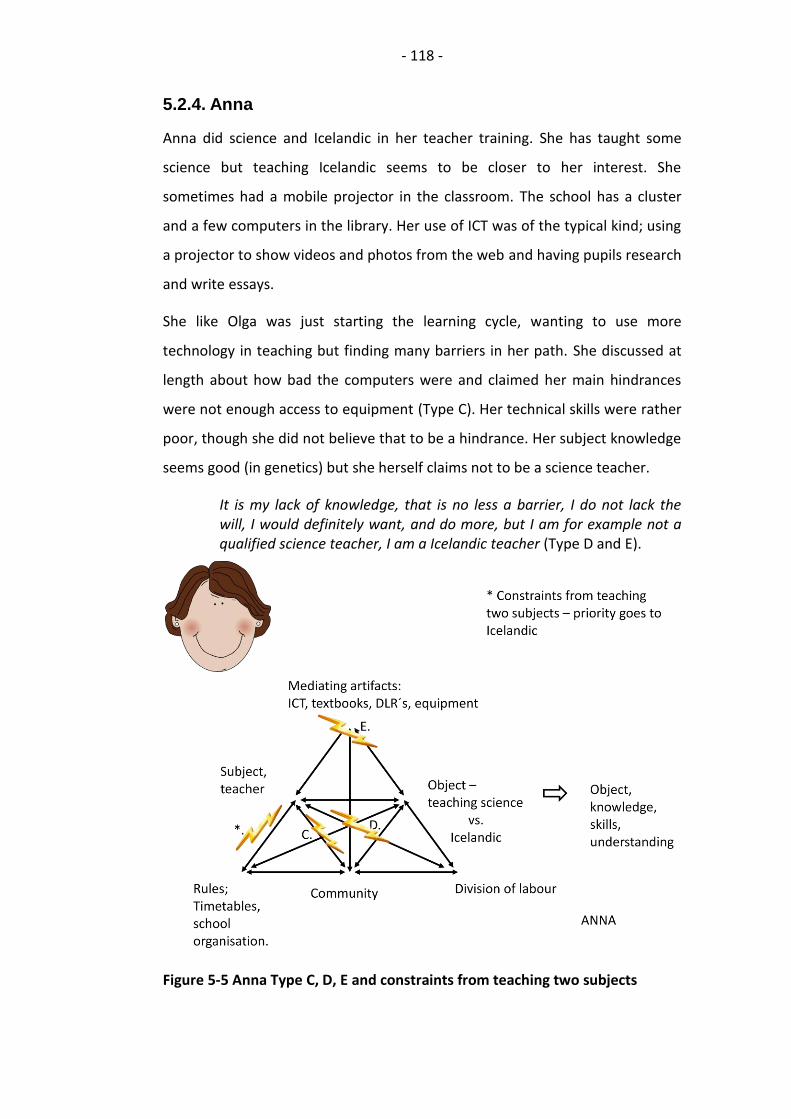
- 118 -
5.2.4. Anna
Anna did science and Icelandic in her teacher training. She has taught some
science but teaching Icelandic seems to be closer to her interest. She
sometimes had a mobile projector in the classroom. The school has a cluster
and a few computers in the library. Her use of ICT was of the typical kind; using
a projector to show videos and photos from the web and having pupils research
and write essays.
She like Olga was just starting the learning cycle, wanting to use more
technology in teaching but finding many barriers in her path. She discussed at
length about how bad the computers were and claimed her main hindrances
were not enough access to equipment (Type C). Her technical skills were rather
poor, though she did not believe that to be a hindrance. Her subject knowledge
seems good (in genetics) but she herself claims not to be a science teacher.
It is my lack of knowledge, that is no less a barrier, I do not lack the will, I would definitely want, and do more, but I am for example not a qualified science teacher, I am a Icelandic teacher (Type D and E).
Figure 5-5 Anna Type C, D, E and constraints from teaching two subjects
- 119 -
Her classroom management was good but some insecurity was noticed when
working with computers.
In this case there is tension created by the fact that Anna is teaching two school
subjects (science and Icelandic). This secondary contradiction is between the
subject and the rules mediated by division of labour (1).
Anna is a teacher who wants to do well in her job and is open to new things
that improve her teaching. It became more apparent through working with her
that in spite of her proclaimed reasons for not trying out more ICT, these were
not the main reasons. She teaches both Icelandic and science; more than half of
her lessons are Icelandic. During the intervention she frequently arrived poorly
prepared to the lessons and claimed not to have had time to properly go
through the websites or properly plan the lesson.
No, I have just not found the time, as you see here I just received 60 essays and the Icelandic teaching swallows the time a bit, it is so difficult to teach both science and Icelandic, it is so much work’.
Teaching is a demanding job and teachers often have to prioritise the tasks at
hand. I am not aware of any research on how Icelandic teachers regard
different subjects, but traditionally Icelandic and mathematics have been
considered the most important. The Icelandic language is highly regarded and
Icelanders put an effort preserving it (Holmarsdottir, 2001). It seems that when
teachers have to choose where to put their efforts Icelandic comes first.
5.2.5. Ellen
Ellen is young and in her second year of teaching. She did science in her
teaching training. She has a ceiling mounted projector in her classroom which
she uses a lot, displaying PowerPoint presentations, websites and videos. The
school also has a large cluster. She has a laptop trolley in her classroom,
supposedly for all teachers to use but she said she had it pretty much to herself.
This trolley was in the room in six of the seven occasions that her lessons were
observed.
She has a positive attitude towards ICT and had used a variety of ICT with
pupils. Her only challenge seemed to be that she teaches in a really small
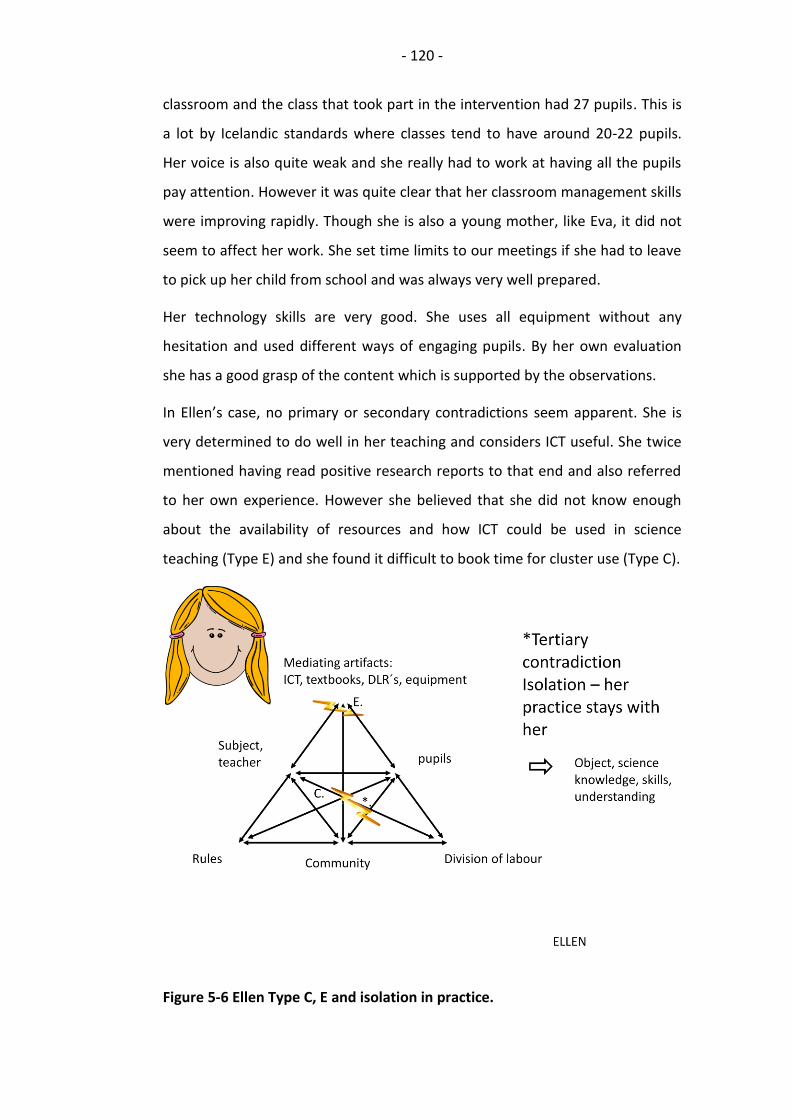
- 120 -
classroom and the class that took part in the intervention had 27 pupils. This is
a lot by Icelandic standards where classes tend to have around 20-22 pupils.
Her voice is also quite weak and she really had to work at having all the pupils
pay attention. However it was quite clear that her classroom management skills
were improving rapidly. Though she is also a young mother, like Eva, it did not
seem to affect her work. She set time limits to our meetings if she had to leave
to pick up her child from school and was always very well prepared.
Her technology skills are very good. She uses all equipment without any
hesitation and used different ways of engaging pupils. By her own evaluation
she has a good grasp of the content which is supported by the observations.
In Ellen’s case, no primary or secondary contradictions seem apparent. She is
very determined to do well in her teaching and considers ICT useful. She twice
mentioned having read positive research reports to that end and also referred
to her own experience. However she believed that she did not know enough
about the availability of resources and how ICT could be used in science
teaching (Type E) and she found it difficult to book time for cluster use (Type C).
Figure 5-6 Ellen Type C, E and isolation in practice.
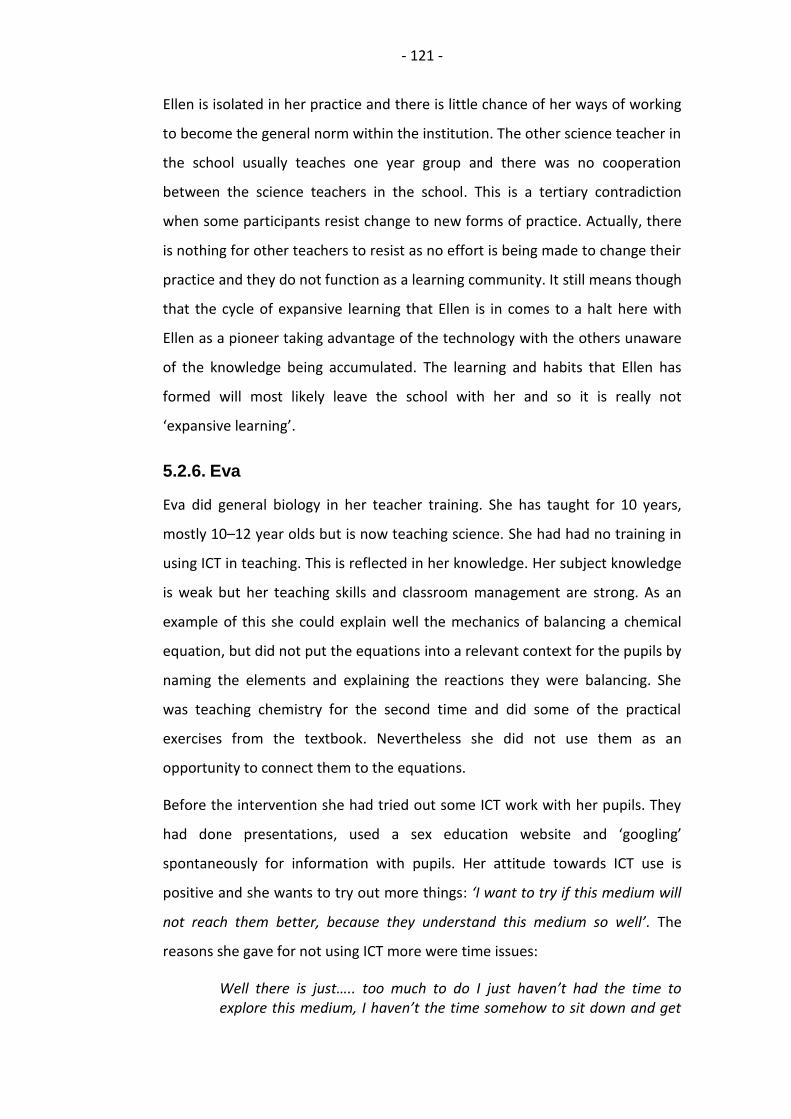
- 121 -
Ellen is isolated in her practice and there is little chance of her ways of working
to become the general norm within the institution. The other science teacher in
the school usually teaches one year group and there was no cooperation
between the science teachers in the school. This is a tertiary contradiction
when some participants resist change to new forms of practice. Actually, there
is nothing for other teachers to resist as no effort is being made to change their
practice and they do not function as a learning community. It still means though
that the cycle of expansive learning that Ellen is in comes to a halt here with
Ellen as a pioneer taking advantage of the technology with the others unaware
of the knowledge being accumulated. The learning and habits that Ellen has
formed will most likely leave the school with her and so it is really not
‘expansive learning’.
5.2.6. Eva
Eva did general biology in her teacher training. She has taught for 10 years,
mostly 10–12 year olds but is now teaching science. She had had no training in
using ICT in teaching. This is reflected in her knowledge. Her subject knowledge
is weak but her teaching skills and classroom management are strong. As an
example of this she could explain well the mechanics of balancing a chemical
equation, but did not put the equations into a relevant context for the pupils by
naming the elements and explaining the reactions they were balancing. She
was teaching chemistry for the second time and did some of the practical
exercises from the textbook. Nevertheless she did not use them as an
opportunity to connect them to the equations.
Before the intervention she had tried out some ICT work with her pupils. They
had done presentations, used a sex education website and ‘googling’
spontaneously for information with pupils. Her attitude towards ICT use is
positive and she wants to try out more things: ‘I want to try if this medium will
not reach them better, because they understand this medium so well’. The
reasons she gave for not using ICT more were time issues:
Well there is just….. too much to do I just haven’t had the time to explore this medium, I haven’t the time somehow to sit down and get
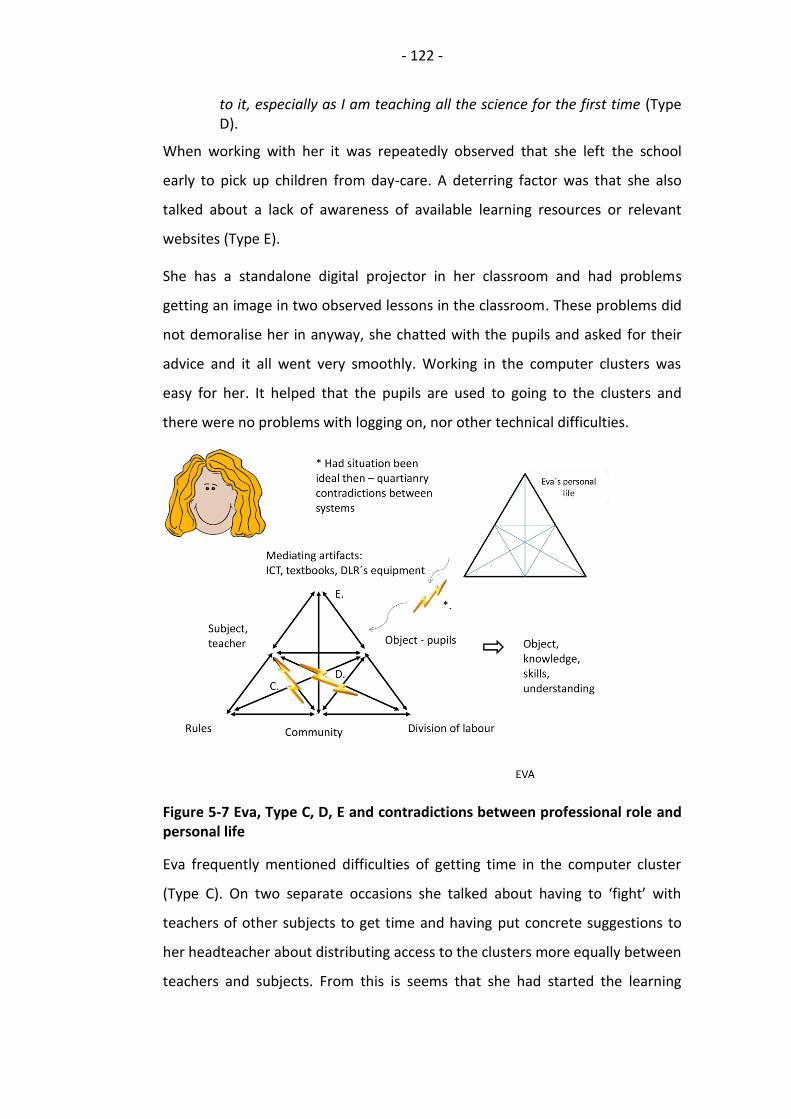
- 122 -
to it, especially as I am teaching all the science for the first time (Type D).
When working with her it was repeatedly observed that she left the school
early to pick up children from day-care. A deterring factor was that she also
talked about a lack of awareness of available learning resources or relevant
websites (Type E).
She has a standalone digital projector in her classroom and had problems
getting an image in two observed lessons in the classroom. These problems did
not demoralise her in anyway, she chatted with the pupils and asked for their
advice and it all went very smoothly. Working in the computer clusters was
easy for her. It helped that the pupils are used to going to the clusters and
there were no problems with logging on, nor other technical difficulties.
Figure 5-7 Eva, Type C, D, E and contradictions between professional role and personal life
Eva frequently mentioned difficulties of getting time in the computer cluster
(Type C). On two separate occasions she talked about having to ‘fight’ with
teachers of other subjects to get time and having put concrete suggestions to
her headteacher about distributing access to the clusters more equally between
teachers and subjects. From this is seems that she had started the learning

- 123 -
cycle in terms of using ICT in her teaching and was facing secondary
contradictions.
The problem that stood out when working with Eva was that she was obviously
torn between two roles. There is tension between the central activity (teaching)
and its interacting neighbouring activity system (home). The tension is between
her roles as a young mother and a science teacher with little experience, the
time needed to do something extra, and the time demands of being a young
mother. This tension could be called a quaternary contradiction (Engeström,
2001) in the sense that they are between two activity systems, the school and
the home where Eva is the subject in both of them. Strictly speaking, it is
incorrect to talk about quaternary contradictions when the subject is in reality
facing primary and secondary contradictions but this is a real problem
nonetheless. This problem manifest itself in the fact that even though Eva is
willing and able in a sense to experiment more with ICT in her teaching, the
time needed to find and familiarise herself with new teaching materials is
limited because of her role as a mother of young children.
5.3. Summary
A qualitative exploration including four cases saw teachers recite a number of
factors affecting their technology use; the most prominent ones are access to
technology and teacher knowledge. Other factors also prevalent are lack of
training, a weak support system and policy. On the more positive side there are
technically competent teachers with positive attitudes towards ICT in science
teaching. Teachers are aware of their limited knowledge of the possibilities,
their feelings can be summarised as feelings of frustration. Some of them have
a weak science background and their energies are aimed at coping with
teaching the content and managing practical work so there is little time or
energy left to familiarise themselves with innovative teaching methods such as
ICT.
- 124 -
6. Interventions
This chapter presents the findings from the three interventions. The data
includes test results, attitudes of teachers and pupils plus a description of the
characteristics of successful teachers and their lessons in the intervention.
These are contrasted against the less successful. The chapter is in three
sections, one for each intervention.
For all the tests a score was calculated on a scale from 0-10 as was explained in
section 3.5.3. (p. 54). For each intervention results for the treatment conditions
are presented and for the separate classes. A large variance is found among the
classes in all the interventions. This is to be expected in a quasi-experiment. In
subsequent analyses the classes are combined into conditions to look for
general tendencies that may occur despite the variation between the classes.
Table 6-1 recaps the classroom activities during the interventions.
Table 6-1 Classroom activities during intervention
Intervention classes Comparison classes
Textbook, lecturing, exercises, note taking
Yes Yes
Digital learning resources with worksheets
Yes No
Pre- and post-tests Yes Yes
The sections have tables with pupil views from a questionnaire with open
questions on the resources used. The numbers are from the pupils that actually
used the websites and gave an opinion. Examples are given of what pupils said
about these resources both in the post-questionnaire and in group interviews.
6.1. Genetics
Five teachers teaching seven classes (see Table 3-5 p. 46) participated in the
genetics intervention that involved reading from a website and answering
- 125 -
questions from a worksheet for at least two lessons. The experimental classes,
with one exception, also spent one lesson manipulating bugs in a simulation.
The website Erfðavísir covers more material than is in the curriculum so the
worksheets were designed to lead pupils to the relevant sections and leave out
the advanced ones. The intervention teachers were told to try to let the
website replace the textbook as much as possible. Four classes used Erfðavísir
and were all observed while doing so. The teachers were Eva, Anna and Olga
and the comparison teachers were Tara and Tina.
6.1.1. Observed lessons
Anna took her class twice to the computer room to read through this resource.
The second time around she also used the worksheet. Pupils either worked on
their own or in pairs. All except three pupils worked well, (one checked
Facebook regularly and two at the back doing various things). Most pupils
managed to finish the worksheet and the teacher collected these with the
intention of marking them. The intention In the next visit was to try Bug Lab but
the computer room was busy. The third time she had reconsidered using Bug
Lab and decided against it, saying she had not really looked at it and that it
seemed to be complicated. Instead the class was to work on interactive quizzes.
This time she had not booked the computer room expecting it to be vacant but
another class was working there. Some computers could be used though. The
rest of the class used computers in the library and worked on the quizzes in
really large groups so only some pupils were actually active. The lessons
observed in the classroom included lecturing, reviewing homework and
worksheets accompanying the textbook. Pupils seemed moderately engaged
with the tasks at hand. Anna had not prepared pupils for what they were
supposed to do in the computer rooms and considerable time went into guiding
pupils to start the tasks.
Eva used Erfðavísir twice. Where the second lesson was observed, considerable
off task behaviour occurred, but no more than in a classroom lesson previously
observed. In the beginning of the intervention Eva said she was going to try to
replace the textbook completely but soon said she would use it and in the end

- 126 -
she ended up relying on it. When asked if she would use the website again she
said:
Yes in combination with the book, to connect them to the fact that this (the webpage) is something that matters, it is like they always need to have a book that tells them that it matters, but of course I could give them an outline to begin with, saying, we are going to learn genetics and you have to learn, this, this and that, this will be on the test.
Her rationale was also that the pupils did not read the webpage well enough
but only looked for the answers. However this happens with books as well,
indeed the lesson had all the same characteristics of pupils answering questions
from a book (they browse for the answers, ask each other and the teacher
‘where can I find the answer to this question?’) Eva also mentioned that the
pupils did not take the website seriously enough.
Eva used Bug Lab in one lesson with pupils working in pairs. A good amount of
chatter could be heard but this was related to what they were doing.
Both Olga’s classes were observed using Bug Lab and Erfðavísir. There was a
marked difference in pupil activity where they paid little attention to lectures
and discussions in the classroom with lots of off task behaviour, but worked
very well the whole time on Erfðavísir. Pupils were again disengaged back in the
classroom where the teacher reviewed the answers, expecting them to correct
them if needed. In another period working with Bug Lab, pupils could be heard
having fun and using genetic concepts when working together. Olga in both
cases had prepared pupils for what they were supposed to do in the computer
room, showing them both the DLRs and worksheets on the interactive white
board.
Tina is a very efficient teacher and she used worksheets with questions
developed over some years alongside the textbook that all the teachers used.
Her lessons were very well prepared, organised and productive. Her grasp of
the subject was excellent and the way she explained phenomena and gave
realistic examples was highly effective. There was some note taking, practical
exercises and answering questions both from the textbook and worksheets
from the teacher, along with some extra exercises on Punnett squares.
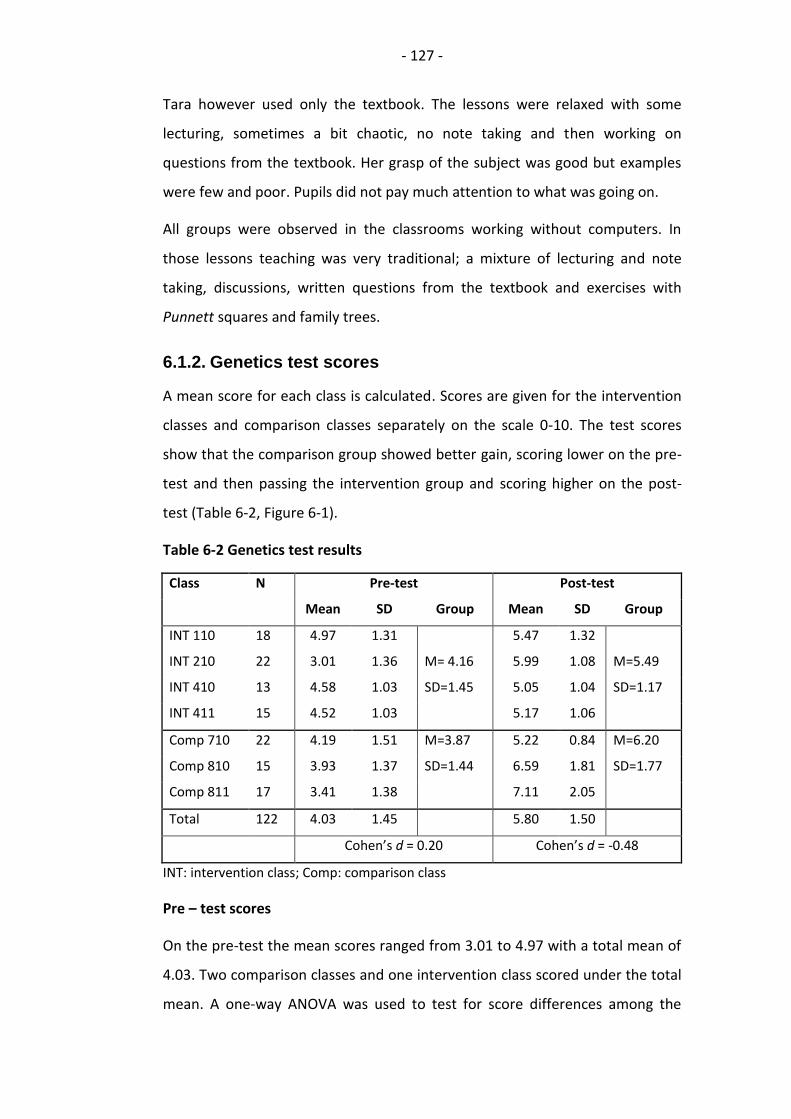
- 127 -
Tara however used only the textbook. The lessons were relaxed with some
lecturing, sometimes a bit chaotic, no note taking and then working on
questions from the textbook. Her grasp of the subject was good but examples
were few and poor. Pupils did not pay much attention to what was going on.
All groups were observed in the classrooms working without computers. In
those lessons teaching was very traditional; a mixture of lecturing and note
taking, discussions, written questions from the textbook and exercises with
Punnett squares and family trees.
6.1.2. Genetics test scores
A mean score for each class is calculated. Scores are given for the intervention
classes and comparison classes separately on the scale 0-10. The test scores
show that the comparison group showed better gain, scoring lower on the pre-
test and then passing the intervention group and scoring higher on the post-
test (Table 6-2, Figure 6-1).
Table 6-2 Genetics test results
Class N Pre-test Post-test
Mean SD Group Mean SD Group
INT 110 18 4.97 1.31 5.47 1.32
INT 210 22 3.01 1.36 M= 4.16 5.99 1.08 M=5.49
INT 410 13 4.58 1.03 SD=1.45 5.05 1.04 SD=1.17
INT 411 15 4.52 1.03 5.17 1.06
Comp 710 22 4.19 1.51 M=3.87 5.22 0.84 M=6.20
Comp 810 15 3.93 1.37 SD=1.44 6.59 1.81 SD=1.77
Comp 811 17 3.41 1.38 7.11 2.05
Total 122 4.03 1.45 5.80 1.50
Cohen’s d = 0.20 Cohen’s d = -0.48
INT: intervention class; Comp: comparison class
Pre – test scores
On the pre-test the mean scores ranged from 3.01 to 4.97 with a total mean of
4.03. Two comparison classes and one intervention class scored under the total
mean. A one-way ANOVA was used to test for score differences among the
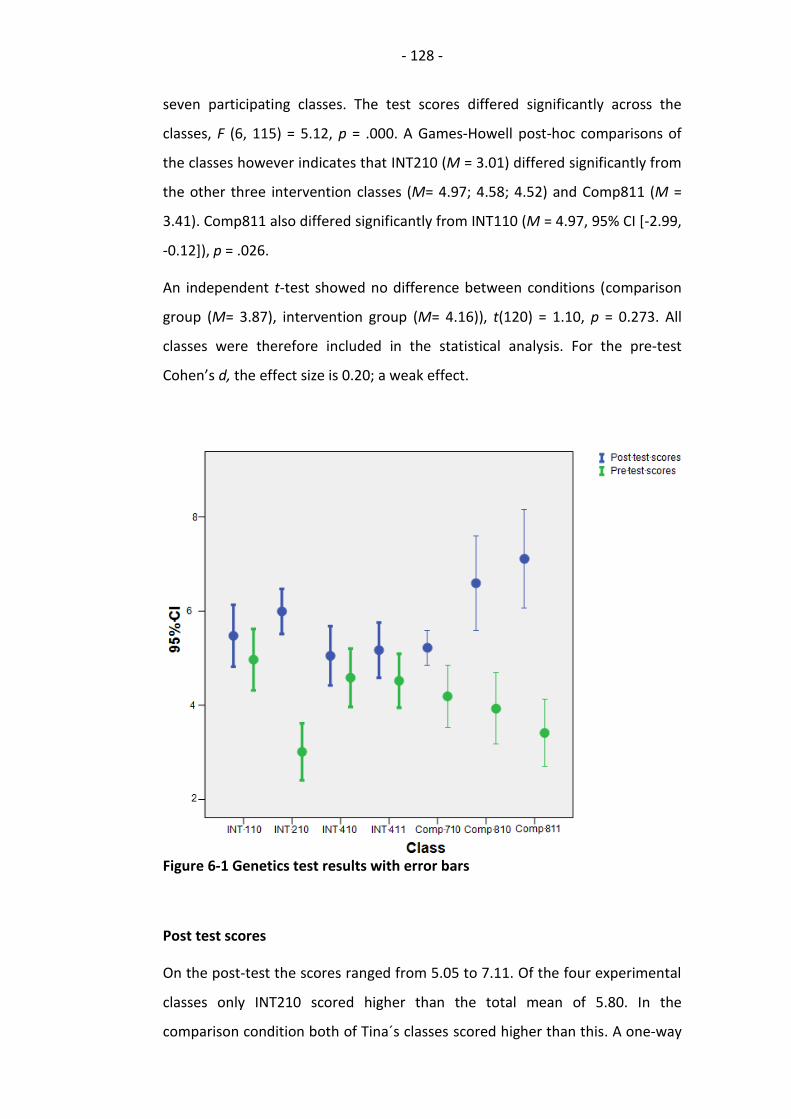
- 128 -
seven participating classes. The test scores differed significantly across the
classes, F (6, 115) = 5.12, p = .000. A Games-Howell post-hoc comparisons of
the classes however indicates that INT210 (M = 3.01) differed significantly from
the other three intervention classes (M= 4.97; 4.58; 4.52) and Comp811 (M =
3.41). Comp811 also differed significantly from INT110 (M = 4.97, 95% CI [-2.99,
-0.12]), p = .026.
An independent t-test showed no difference between conditions (comparison
group (M= 3.87), intervention group (M= 4.16)), t(120) = 1.10, p = 0.273. All
classes were therefore included in the statistical analysis. For the pre-test
Cohen’s d, the effect size is 0.20; a weak effect.
Figure 6-1 Genetics test results with error bars
Post test scores
On the post-test the scores ranged from 5.05 to 7.11. Of the four experimental
classes only INT210 scored higher than the total mean of 5.80. In the
comparison condition both of Tina´s classes scored higher than this. A one-way
- 129 -
ANOVA was used to test for score differences among the seven participating
classes. The test scores did differ significantly across the classes, F (6, 115) =
5.65, p = .000. A Games-Howell post-hoc comparisons of the classes however
indicates that Comp811 (M = 7.11) differed significantly from the three lowest
scoring classes, (M = 5.05; 5.17; 5.22). Comparisons between the other classes
were not statistically significant at p <.05.
An independent t-test between conditions did not show a statistically
significant difference. The intervention group scored lower (M = 5.49) than the
comparison classes (M = 6.20), t(85.38) = 0.78, p = 0.437. For the post-test
Cohen’s d, the effect size is -0.48, a modest negative effect.
All variables in one model
A one-way analysis of covariance (ANCOVA) was conducted, exploring
differences in post-test scores by condition controlling for the pre-test scores.
The independent variable, learning resource, involved two levels: intervention
and comparison. The dependent variable was the post-test score and the
covariate was the pre-test score. The assumptions for ANCOVA were not met so
the outcomes have to be treated with caution. In particular, the homogeneity
of the regression effect was not evident for the covariate, and the covariate
was poorly linearly related to the dependent measure (see Appendix B).
When controlling for the pre-test scores, the results of the post-test were
significantly affected by the condition F (1,119) = 10.761, p = .001. The strength
of the relationship between learning resource and post-test was weak, as
assessed by η2, with learning resource accounting for 8.3% of the variance in
dependent measure holding constant the pre-test scores. The intervention
group had a lower adjusted mean (M = 5.44) and the comparison group had a
larger adjusted mean (M = 6.26). In the ANCOVA, the adjusted R2 was 0.181
indicating that 18% of the variation in post test scores was accounted for in the
model (i.e. by pre-test + group).
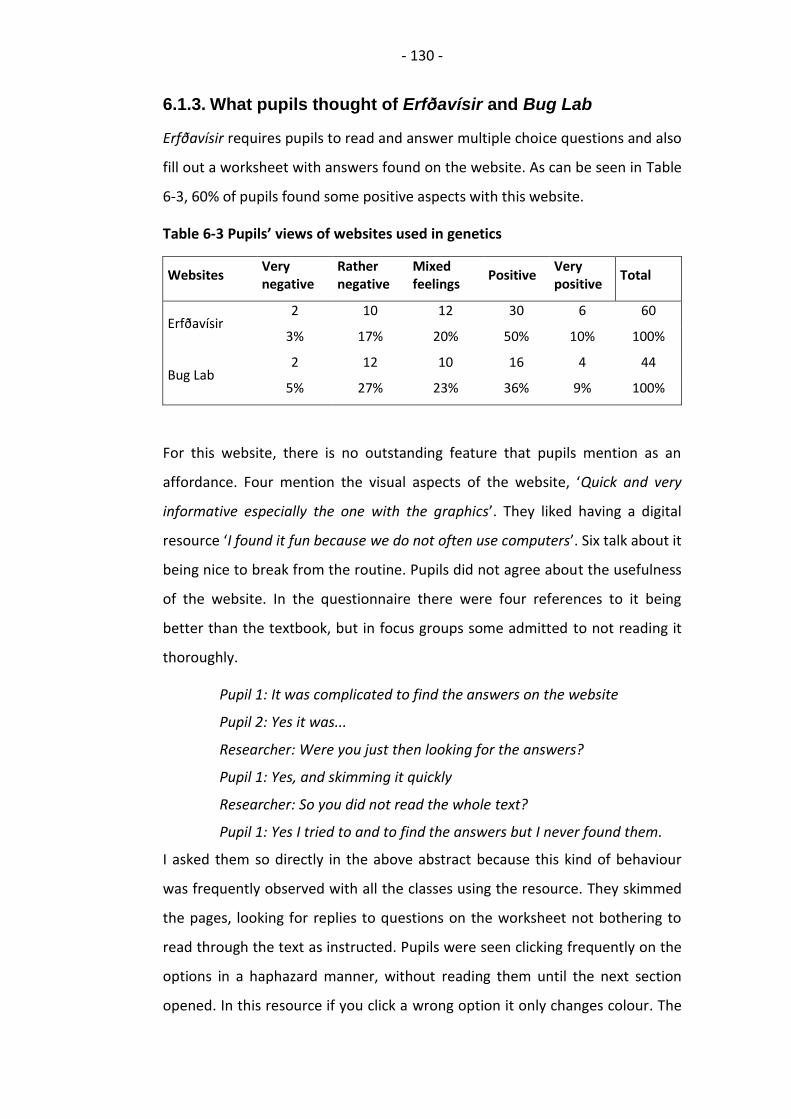
- 130 -
6.1.3. What pupils thought of Erfðavísir and Bug Lab
Erfðavísir requires pupils to read and answer multiple choice questions and also
fill out a worksheet with answers found on the website. As can be seen in Table
6-3, 60% of pupils found some positive aspects with this website.
Table 6-3 Pupils’ views of websites used in genetics
Websites Very negative
Rather negative
Mixed feelings
Positive Very positive
Total
Erfðavísir 2 10 12 30 6 60
3% 17% 20% 50% 10% 100%
Bug Lab 2 12 10 16 4 44
5% 27% 23% 36% 9% 100%
For this website, there is no outstanding feature that pupils mention as an
affordance. Four mention the visual aspects of the website, ‘Quick and very
informative especially the one with the graphics’. They liked having a digital
resource ‘I found it fun because we do not often use computers’. Six talk about it
being nice to break from the routine. Pupils did not agree about the usefulness
of the website. In the questionnaire there were four references to it being
better than the textbook, but in focus groups some admitted to not reading it
thoroughly.
Pupil 1: It was complicated to find the answers on the website
Pupil 2: Yes it was...
Researcher: Were you just then looking for the answers?
Pupil 1: Yes, and skimming it quickly
Researcher: So you did not read the whole text?
Pupil 1: Yes I tried to and to find the answers but I never found them.
I asked them so directly in the above abstract because this kind of behaviour
was frequently observed with all the classes using the resource. They skimmed
the pages, looking for replies to questions on the worksheet not bothering to
read through the text as instructed. Pupils were seen clicking frequently on the
options in a haphazard manner, without reading them until the next section
opened. In this resource if you click a wrong option it only changes colour. The
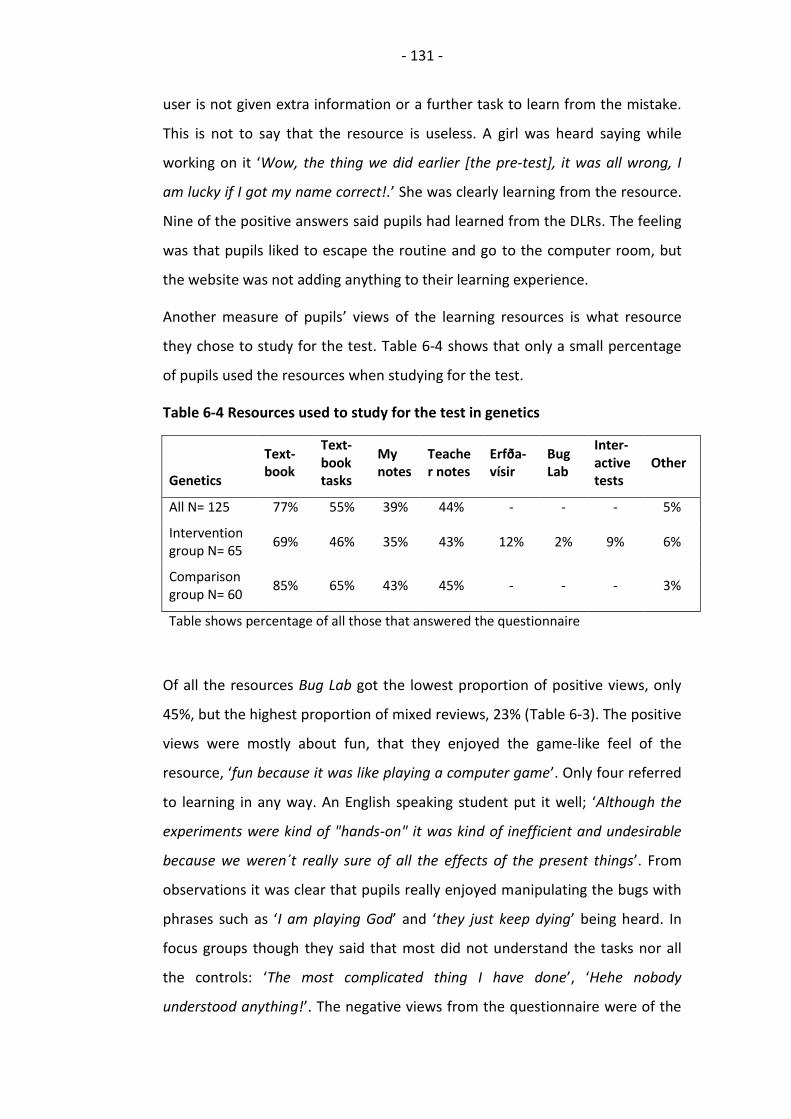
- 131 -
user is not given extra information or a further task to learn from the mistake.
This is not to say that the resource is useless. A girl was heard saying while
working on it ‘Wow, the thing we did earlier [the pre-test], it was all wrong, I
am lucky if I got my name correct!.’ She was clearly learning from the resource.
Nine of the positive answers said pupils had learned from the DLRs. The feeling
was that pupils liked to escape the routine and go to the computer room, but
the website was not adding anything to their learning experience.
Another measure of pupils’ views of the learning resources is what resource
they chose to study for the test. Table 6-4 shows that only a small percentage
of pupils used the resources when studying for the test.
Table 6-4 Resources used to study for the test in genetics
Genetics
Text-book
Text-book tasks
My notes
Teacher notes
Erfða-vísir
Bug Lab
Inter-active tests
Other
All N= 125 77% 55% 39% 44% - - - 5%
Intervention group N= 65
69% 46% 35% 43% 12% 2% 9% 6%
Comparison group N= 60
85% 65% 43% 45% - - - 3%
Table shows percentage of all those that answered the questionnaire
Of all the resources Bug Lab got the lowest proportion of positive views, only
45%, but the highest proportion of mixed reviews, 23% (Table 6-3). The positive
views were mostly about fun, that they enjoyed the game-like feel of the
resource, ‘fun because it was like playing a computer game’. Only four referred
to learning in any way. An English speaking student put it well; ‘Although the
experiments were kind of "hands-on" it was kind of inefficient and undesirable
because we weren´t really sure of all the effects of the present things’. From
observations it was clear that pupils really enjoyed manipulating the bugs with
phrases such as ‘I am playing God’ and ‘they just keep dying’ being heard. In
focus groups though they said that most did not understand the tasks nor all
the controls: ‘The most complicated thing I have done’, ‘Hehe nobody
understood anything!’. The negative views from the questionnaire were of the
- 132 -
same ilk, with three mentioning that they did not learning anything from it. So
the bottom line is that Bug Lab is too complicated for pupils to learn from using
it, at least for a single lesson with little preparation.
6.1.4. Summary of genetics intervention
Table 6-5 provides a summary of the genetics intervention. The main result is
that the classes using the websites made less progress and scored lower than
the classes not using the websites. Pupils had fairly negative views of the
resource and were observed using them in a haphazard manner. These are
tentative indications of negative effects that the websites may not have helped
pupils learn basic genetics.
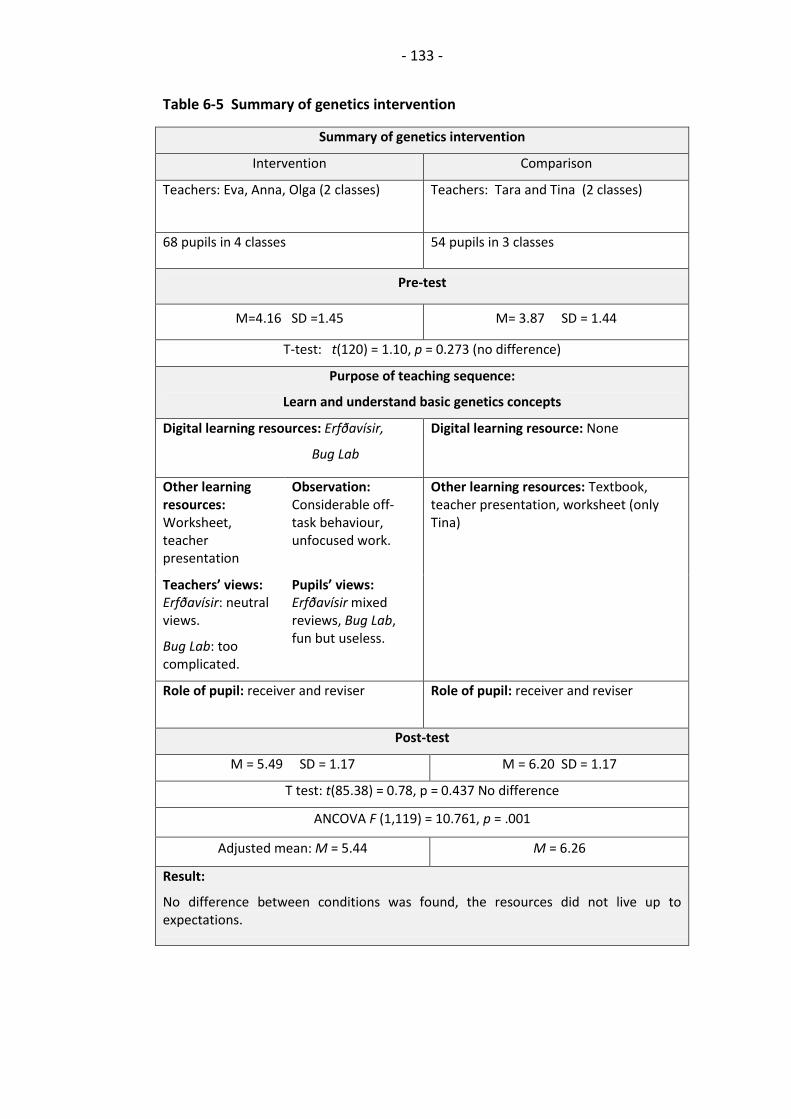
- 133 -
Table 6-5 Summary of genetics intervention
Summary of genetics intervention
Intervention Comparison
Teachers: Eva, Anna, Olga (2 classes) Teachers: Tara and Tina (2 classes)
68 pupils in 4 classes 54 pupils in 3 classes
Pre-test
M=4.16 SD =1.45 M= 3.87 SD = 1.44
T-test: t(120) = 1.10, p = 0.273 (no difference)
Purpose of teaching sequence:
Learn and understand basic genetics concepts
Digital learning resources: Erfðavísir,
Bug Lab
Digital learning resource: None
Other learning resources: Worksheet, teacher presentation
Observation: Considerable off-task behaviour, unfocused work.
Other learning resources: Textbook, teacher presentation, worksheet (only Tina)
Teachers’ views: Erfðavísir: neutral views.
Bug Lab: too complicated.
Pupils’ views: Erfðavísir mixed reviews, Bug Lab, fun but useless.
Role of pupil: receiver and reviser Role of pupil: receiver and reviser
Post-test
M = 5.49 SD = 1.17 M = 6.20 SD = 1.17
T test: t(85.38) = 0.78, p = 0.437 No difference
ANCOVA F (1,119) = 10.761, p = .001
Adjusted mean: M = 5.44 M = 6.26
Result:
No difference between conditions was found, the resources did not live up to expectations.
- 134 -
6.2. Chemistry
Six teachers with eight classes participated in the chemistry intervention: Eva,
Inga (2 classes), Ellen as intervention teachers, Dora (one intervention class and
one comparison), Tara and Tina in comparison (see also Table 3-5).
6.2.1. Observed lessons
Five classes used Chembalancer, all using the worksheet for one lesson. All
lessons were observed here. In all of the schools, pupils took some time to
realise how to use the website keeping the teachers quite busy going between
them and explaining. Ellen, who had a large class of 27 stopped the pupils and
used an overhead projector to explain again how the balancer worked. Hers
was the only class that showed off task behaviour, being both a larger and
younger class than the others. They also seemed to take advantage of them
being too many for her to monitor. This was also the case in lessons observed
with these classes in the classrooms. All pupils who stayed on task finished
balancing the 13 equations on time, many with time to spare. Having
worksheets when using this website did not seem to make much difference to
their engagement or learning. In some instances pupils had not filled out the
worksheet but when asked to repeat the task they found this quite easy and
fast.
Teachers were also introduced to a very simple simulation of a chemical
reaction13 and encouraged to use it as a whole class discussion stimulant. Two
of the teachers chose to do so.
In Anna’s class pupils worked for one lesson on a selection of interactive
multiple choice questions and matching exercises. The lesson was very
disorganised with some pupils in the computer cluster and some next door in
the library. Pupils worked in groups or pairs with varying levels of
concentration.
The comparison classes learned to balance equations from a teacher
demonstration and then balanced the equations in the textbook. Tina also used
13 http://www.chem.uci.edu/undergrad/applets/sim/simulation.htm
- 135 -
a worksheet with similar equations as the intervention group. This lesson was
observed and pupils needed help frequently when learning the method. Lots of
pupil interaction was observed with them helping each other. The lesson Tara
had planned to teach balancing equations was observed. She talked them
through the method but no pupil work took place in that lesson.
All the classes used the same textbook Efnisheimurinn. Teaching in all groups
was very traditional; a mixture of lecturing and note taking, discussions, written
questions and practical work from the textbook.
6.2.2. Chemistry test scores
For the chemical intervention three sets of scores are presented: a score from
the pre-test, post-test and balancing chemical equations (Table 6-6). All are on
the scale 0-10. For the post-test a score was calculated for the whole test, that
is, all questions that were comparable between classes. On the post-test there
were four items specifically on balancing chemical equations. The ICT tool
Chembalancer was designed to be used for that task so a separate score was
calculated for those items. Pre- and post-test results can be seen in Figure 6-2
and pre-test and balancing chemical equation in Figure 6-3. Both show the
intervention group to have made better gain than the comparison group.
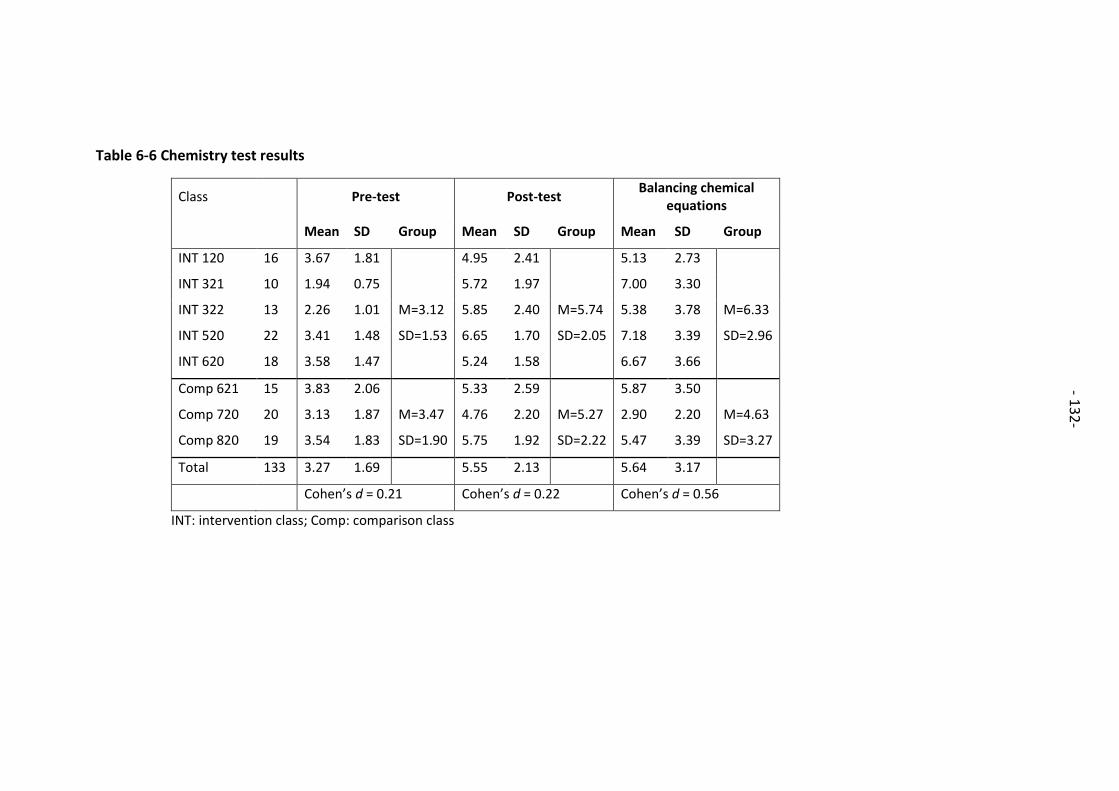
- 136 -
Table 6-6 Chemistry test results
Class Pre-test Post-test Balancing chemical
equations
Mean SD Group Mean SD Group Mean SD Group
INT 120 16 3.67 1.81 4.95 2.41 5.13 2.73
INT 321 10 1.94 0.75 5.72 1.97 7.00 3.30
INT 322 13 2.26 1.01 M=3.12 5.85 2.40 M=5.74 5.38 3.78 M=6.33
INT 520 22 3.41 1.48 SD=1.53 6.65 1.70 SD=2.05 7.18 3.39 SD=2.96
INT 620 18 3.58 1.47 5.24 1.58 6.67 3.66
Comp 621 15 3.83 2.06 5.33 2.59 5.87 3.50
Comp 720 20 3.13 1.87 M=3.47 4.76 2.20 M=5.27 2.90 2.20 M=4.63
Comp 820 19 3.54 1.83 SD=1.90 5.75 1.92 SD=2.22 5.47 3.39 SD=3.27
Total 133 3.27 1.69 5.55 2.13 5.64 3.17
Cohen’s d = 0.21 Cohen’s d = 0.22 Cohen’s d = 0.56
INT: intervention class; Comp: comparison class
- 13
2-
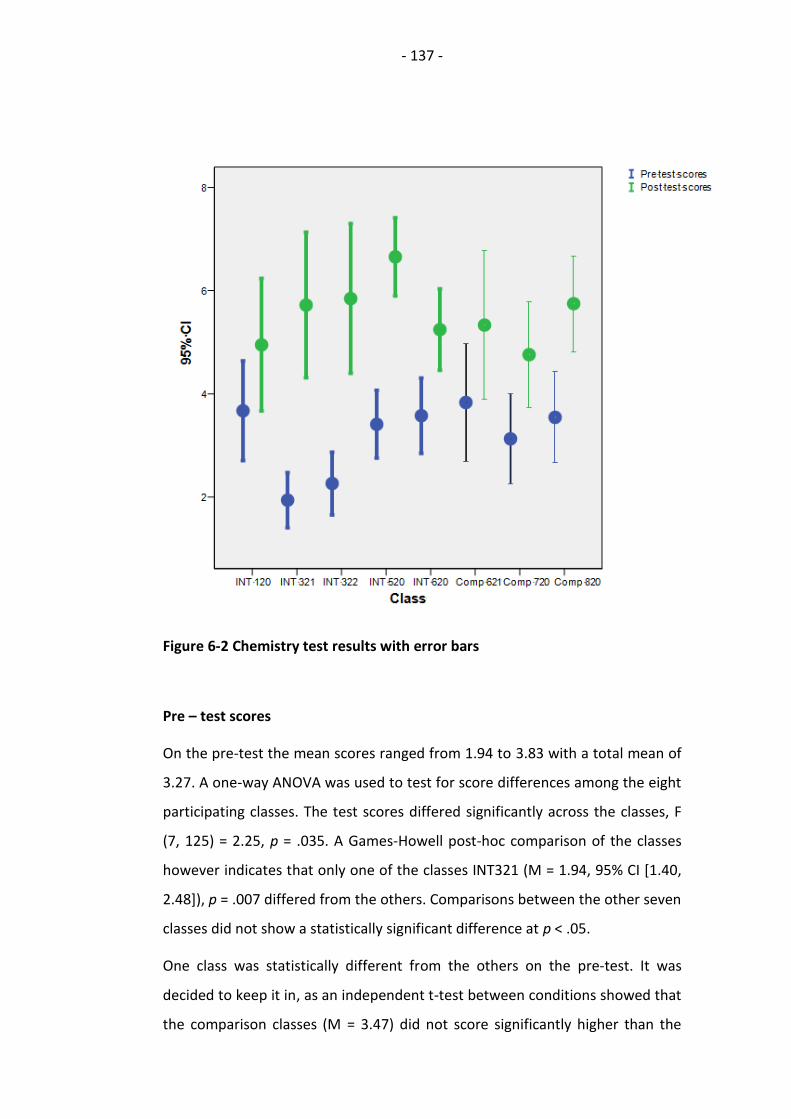
- 137 -
Figure 6-2 Chemistry test results with error bars
Pre – test scores
On the pre-test the mean scores ranged from 1.94 to 3.83 with a total mean of
3.27. A one-way ANOVA was used to test for score differences among the eight
participating classes. The test scores differed significantly across the classes, F
(7, 125) = 2.25, p = .035. A Games-Howell post-hoc comparison of the classes
however indicates that only one of the classes INT321 (M = 1.94, 95% CI [1.40,
2.48]), p = .007 differed from the others. Comparisons between the other seven
classes did not show a statistically significant difference at p < .05.
One class was statistically different from the others on the pre-test. It was
decided to keep it in, as an independent t-test between conditions showed that
the comparison classes (M = 3.47) did not score significantly higher than the

- 138 -
experimental classes (M= 3.13), t(97.56) = - 1.11, p = 0.269. For the pre-test
Cohen’s d, the effect size is 0.21; a borderline modest effect.
Post test scores
The post-test scores ranged from 4.76 to 6.65. A one-way ANOVA was used to
test for score differences among the eight participating classes. The test scores
did not differ significantly across the classes, F (7, 125) = 1.62, p = 0.135. A
Games-Howell post-hoc comparison of the classes indicated the mean scores of
all eight classes were not statistically significant at p < .05.
An independent t-test between conditions also did not show a statistically
significant difference. The experimental group (M= 5.74) did not score
significantly higher than the experimental classes (M= 5.27), t(107.76) = 1.24, p
= 0.219.
Balancing chemical equations scores
The mean of the classes ranged from 2.9 – 7.18, with three of the experimental
classes and one comparison class scoring higher than the total mean of 5.64
(see Table 6-6). When the two conditions are compared using an independent
t-test, the experimental classes scored significantly higher (M= 6.32) than the
comparison classes (M= 4.63), t(105.42) = 3.07, p = 0.003.
A one-way ANOVA was also used to test for score differences among the eight
participating classes. The test scores differed significantly across the classes, F
(7, 125) = 4.08, p < .000. A Games-Howell post-hoc comparisons of the classes
indicated that only one of the classes, Comp720 (M = 2.90, 95% CI [1.87, 3.93]),
differed significantly from two others INT520 p = .007 and INT620 p = .001.
Comparisons between the other seven classes were not statistically significant
at p < .05.
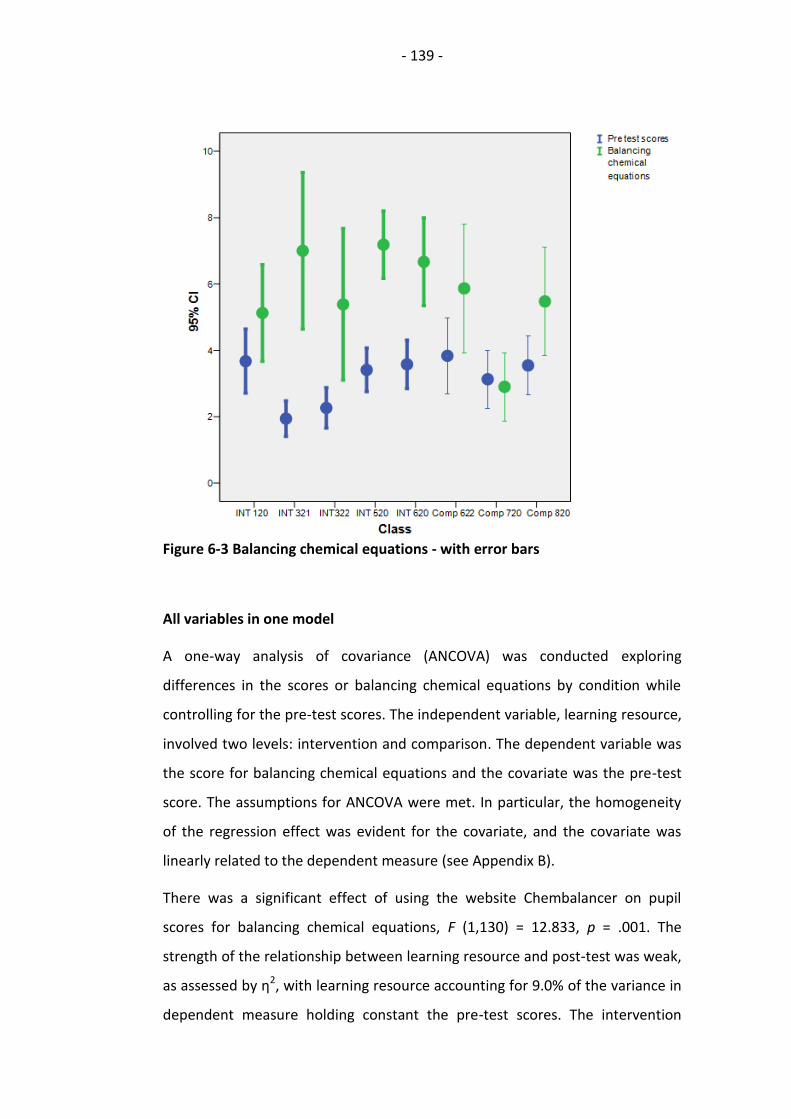
- 139 -
Figure 6-3 Balancing chemical equations - with error bars
All variables in one model
A one-way analysis of covariance (ANCOVA) was conducted exploring
differences in the scores or balancing chemical equations by condition while
controlling for the pre-test scores. The independent variable, learning resource,
involved two levels: intervention and comparison. The dependent variable was
the score for balancing chemical equations and the covariate was the pre-test
score. The assumptions for ANCOVA were met. In particular, the homogeneity
of the regression effect was evident for the covariate, and the covariate was
linearly related to the dependent measure (see Appendix B).
There was a significant effect of using the website Chembalancer on pupil
scores for balancing chemical equations, F (1,130) = 12.833, p = .001. The
strength of the relationship between learning resource and post-test was weak,
as assessed by η2, with learning resource accounting for 9.0% of the variance in
dependent measure holding constant the pre-test scores. The intervention
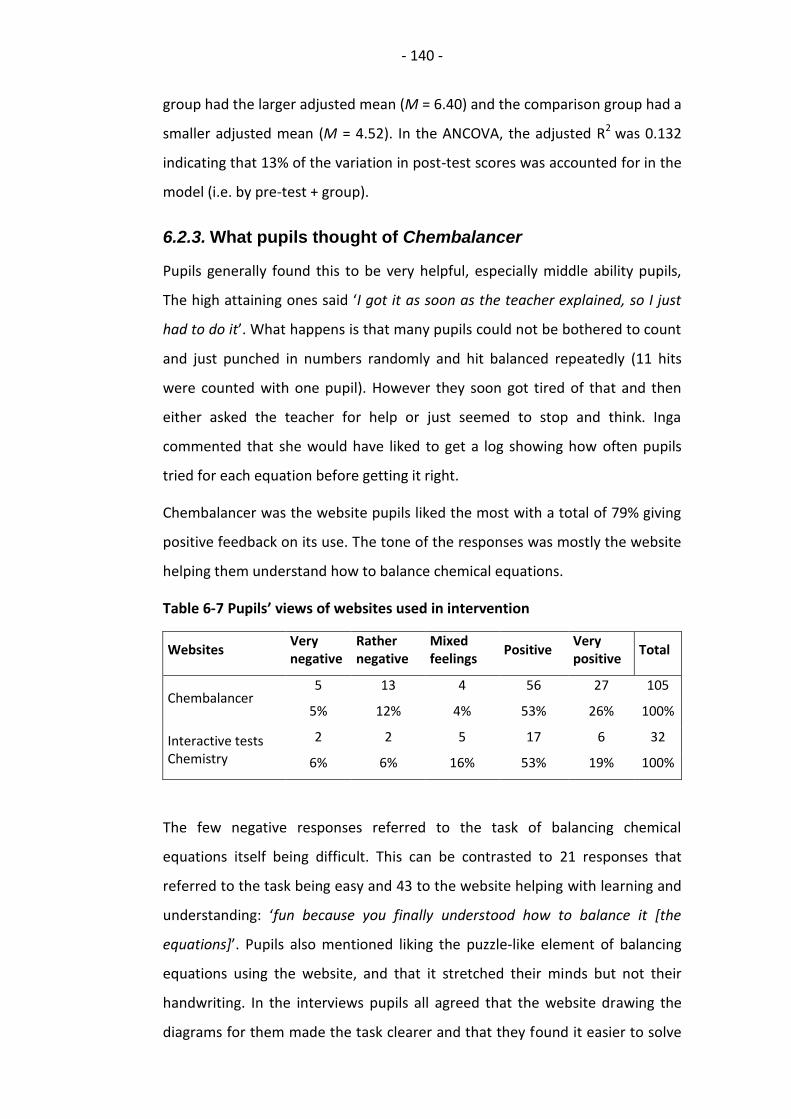
- 140 -
group had the larger adjusted mean (M = 6.40) and the comparison group had a
smaller adjusted mean (M = 4.52). In the ANCOVA, the adjusted R2 was 0.132
indicating that 13% of the variation in post-test scores was accounted for in the
model (i.e. by pre-test + group).
6.2.3. What pupils thought of Chembalancer
Pupils generally found this to be very helpful, especially middle ability pupils,
The high attaining ones said ‘I got it as soon as the teacher explained, so I just
had to do it’. What happens is that many pupils could not be bothered to count
and just punched in numbers randomly and hit balanced repeatedly (11 hits
were counted with one pupil). However they soon got tired of that and then
either asked the teacher for help or just seemed to stop and think. Inga
commented that she would have liked to get a log showing how often pupils
tried for each equation before getting it right.
Chembalancer was the website pupils liked the most with a total of 79% giving
positive feedback on its use. The tone of the responses was mostly the website
helping them understand how to balance chemical equations.
Table 6-7 Pupils’ views of websites used in intervention
Websites Very negative
Rather negative
Mixed feelings
Positive Very positive
Total
Chembalancer 5 13 4 56 27 105
5% 12% 4% 53% 26% 100%
Interactive tests Chemistry
2 2 5 17 6 32
6% 6% 16% 53% 19% 100%
The few negative responses referred to the task of balancing chemical
equations itself being difficult. This can be contrasted to 21 responses that
referred to the task being easy and 43 to the website helping with learning and
understanding: ‘fun because you finally understood how to balance it [the
equations]’. Pupils also mentioned liking the puzzle-like element of balancing
equations using the website, and that it stretched their minds but not their
handwriting. In the interviews pupils all agreed that the website drawing the
diagrams for them made the task clearer and that they found it easier to solve
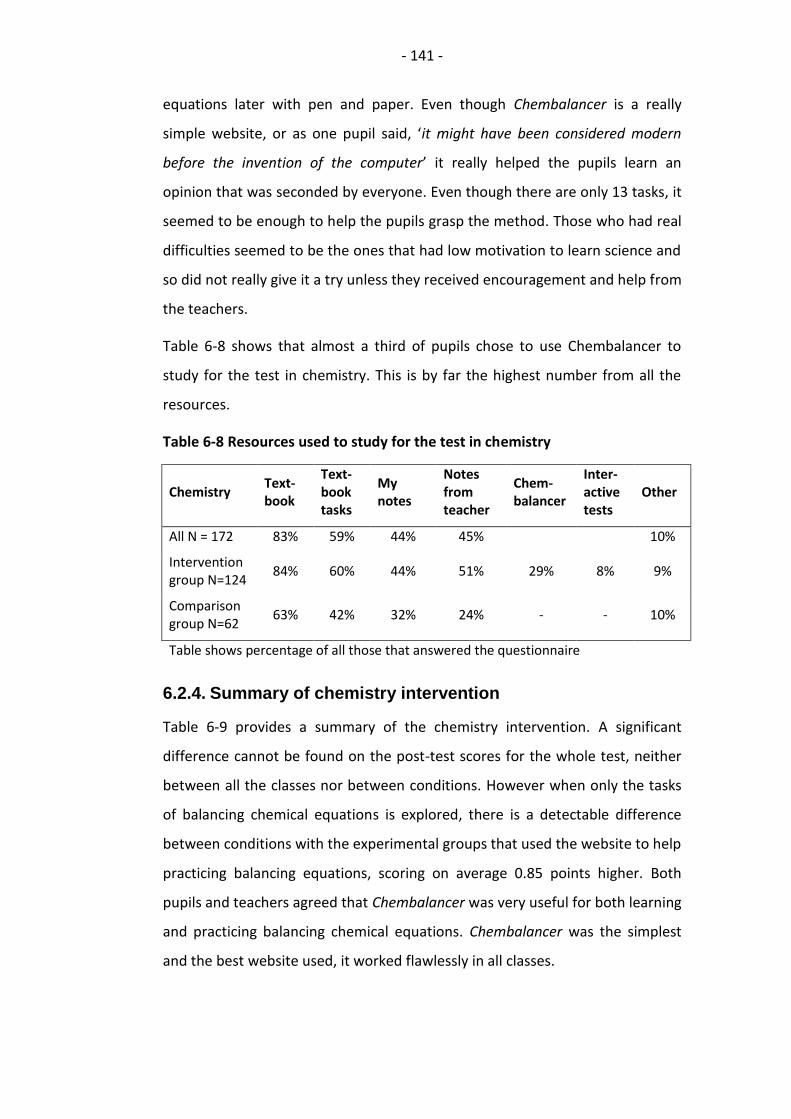
- 141 -
equations later with pen and paper. Even though Chembalancer is a really
simple website, or as one pupil said, ‘it might have been considered modern
before the invention of the computer’ it really helped the pupils learn an
opinion that was seconded by everyone. Even though there are only 13 tasks, it
seemed to be enough to help the pupils grasp the method. Those who had real
difficulties seemed to be the ones that had low motivation to learn science and
so did not really give it a try unless they received encouragement and help from
the teachers.
Table 6-8 shows that almost a third of pupils chose to use Chembalancer to
study for the test in chemistry. This is by far the highest number from all the
resources.
Table 6-8 Resources used to study for the test in chemistry
Chemistry Text-book
Text-book tasks
My notes
Notes from teacher
Chem-balancer
Inter-active tests
Other
All N = 172 83% 59% 44% 45%
10%
Intervention group N=124
84% 60% 44% 51% 29% 8% 9%
Comparison group N=62
63% 42% 32% 24% - - 10%
Table shows percentage of all those that answered the questionnaire
6.2.4. Summary of chemistry intervention
Table 6-9 provides a summary of the chemistry intervention. A significant
difference cannot be found on the post-test scores for the whole test, neither
between all the classes nor between conditions. However when only the tasks
of balancing chemical equations is explored, there is a detectable difference
between conditions with the experimental groups that used the website to help
practicing balancing equations, scoring on average 0.85 points higher. Both
pupils and teachers agreed that Chembalancer was very useful for both learning
and practicing balancing chemical equations. Chembalancer was the simplest
and the best website used, it worked flawlessly in all classes.
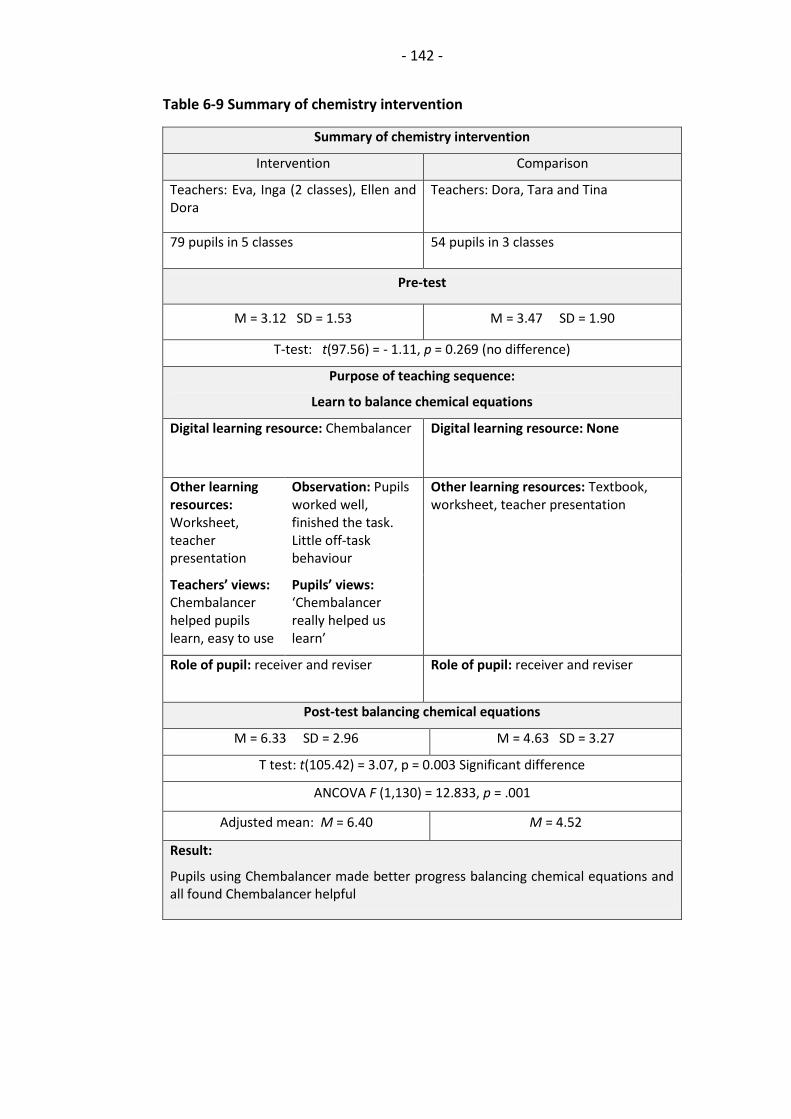
- 142 -
Table 6-9 Summary of chemistry intervention
Summary of chemistry intervention
Intervention Comparison
Teachers: Eva, Inga (2 classes), Ellen and Dora
Teachers: Dora, Tara and Tina
79 pupils in 5 classes 54 pupils in 3 classes
Pre-test
M = 3.12 SD = 1.53 M = 3.47 SD = 1.90
T-test: t(97.56) = - 1.11, p = 0.269 (no difference)
Purpose of teaching sequence:
Learn to balance chemical equations
Digital learning resource: Chembalancer Digital learning resource: None
Other learning resources: Worksheet, teacher presentation
Observation: Pupils worked well, finished the task. Little off-task behaviour
Other learning resources: Textbook, worksheet, teacher presentation
Teachers’ views: Chembalancer helped pupils learn, easy to use
Pupils’ views: ‘Chembalancer really helped us learn’
Role of pupil: receiver and reviser Role of pupil: receiver and reviser
Post-test balancing chemical equations
M = 6.33 SD = 2.96 M = 4.63 SD = 3.27
T test: t(105.42) = 3.07, p = 0.003 Significant difference
ANCOVA F (1,130) = 12.833, p = .001
Adjusted mean: M = 6.40 M = 4.52
Result:
Pupils using Chembalancer made better progress balancing chemical equations and all found Chembalancer helpful
- 143 -
6.3. Ecology
Three classes in two schools participated in this part; Ellen with one
experimental class, Olga with two experimental classes (one did not take the
pre-test) and two comparison classes from Dora (see Table 3-5 p.46). Both
intervention teachers said they had used all three suggested resources. Sunny
Meadows was the main website used in this intervention. In it pupils decide
how many foxes and rabbits and how much grass they start with and then run
the simulation which simulates 50 years.
6.3.1. Observed lessons
It was only possible to observe one of Ellen’s lessons in the classroom, one in
which pupils were working on laptops on a task from the teacher. Both Olga’s
classes were observed in the computer room working with Sunny Meadows and
a further lesson was observed in the classroom. She first demonstrated on an
IWB before going to the computer room. Pupils stayed on task and really
enjoyed it. Even when the teacher said they could have the last few minutes for
free activities many continued running the simulation. A contributing factor to
the fun they had was that the website gives out scores depending on how well
the ecosystem does. The teacher took down the scores and wrote them on the
blackboard so they had a competition trying to get the highest score. The
game-like quality seemed to encourage pupils to really try their best. Both
classes used worksheets where they were supposed to record the ratio
between the species. Pupils in the observed class, especially the boys, soon
found out that the simulation keeps track of their five highest scores and did
not see the point in using the worksheet.
These classes were also observed watching the cartoon Mysteries of life. Both
teachers wrote down the ecology concepts with Icelandic translations and then
showed the cartoon, stopping to explain further and translate. It is difficult to
determine, even when watching the video recording from the lesson, how well
pupils were paying attention.
The lessons observed with the comparison classes consisted of note taking,
class discussion and reading and answering questions from the textbook. From
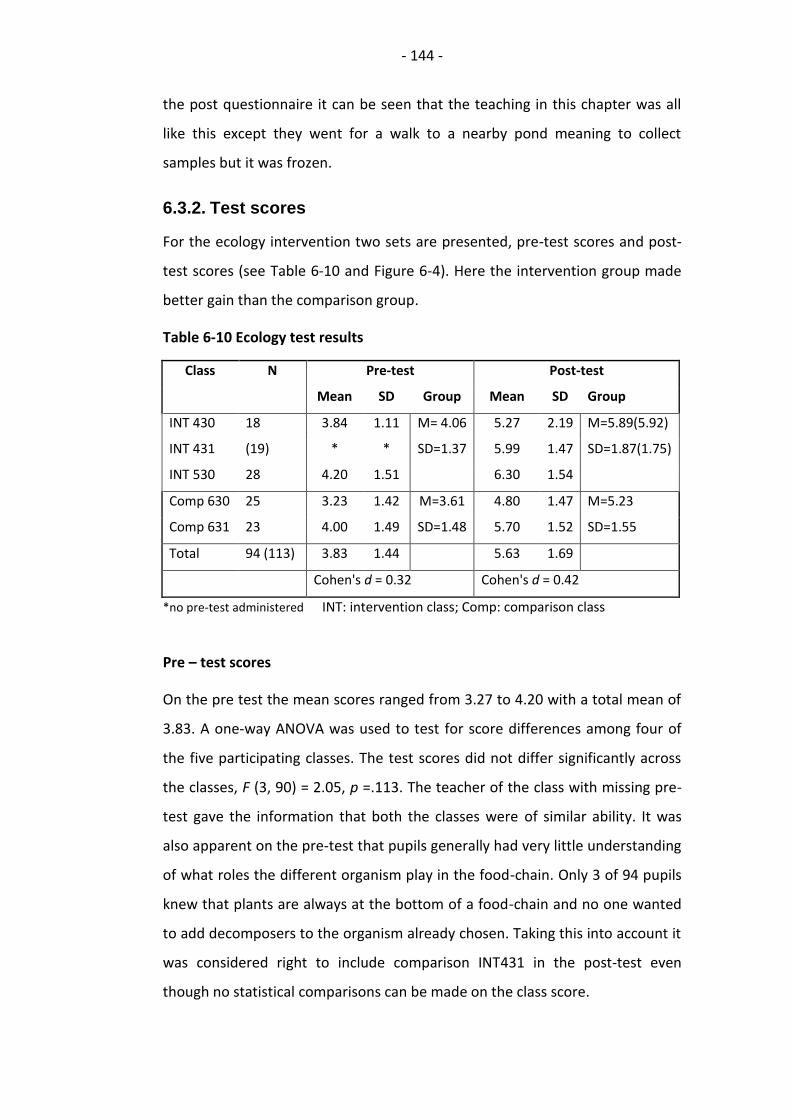
- 144 -
the post questionnaire it can be seen that the teaching in this chapter was all
like this except they went for a walk to a nearby pond meaning to collect
samples but it was frozen.
6.3.2. Test scores
For the ecology intervention two sets are presented, pre-test scores and post-
test scores (see Table 6-10 and Figure 6-4). Here the intervention group made
better gain than the comparison group.
Table 6-10 Ecology test results
Class N Pre-test Post-test
Mean SD Group Mean SD Group
INT 430 18 3.84 1.11 M= 4.06 5.27 2.19 M=5.89(5.92)
INT 431 (19) * * SD=1.37 5.99 1.47 SD=1.87(1.75)
INT 530 28 4.20 1.51 6.30 1.54
Comp 630 25 3.23 1.42 M=3.61 4.80 1.47 M=5.23
Comp 631 23 4.00 1.49 SD=1.48 5.70 1.52 SD=1.55
Total 94 (113) 3.83 1.44 5.63 1.69
Cohen's d = 0.32 Cohen's d = 0.42
*no pre-test administered INT: intervention class; Comp: comparison class
Pre – test scores
On the pre test the mean scores ranged from 3.27 to 4.20 with a total mean of
3.83. A one-way ANOVA was used to test for score differences among four of
the five participating classes. The test scores did not differ significantly across
the classes, F (3, 90) = 2.05, p =.113. The teacher of the class with missing pre-
test gave the information that both the classes were of similar ability. It was
also apparent on the pre-test that pupils generally had very little understanding
of what roles the different organism play in the food-chain. Only 3 of 94 pupils
knew that plants are always at the bottom of a food-chain and no one wanted
to add decomposers to the organism already chosen. Taking this into account it
was considered right to include comparison INT431 in the post-test even
though no statistical comparisons can be made on the class score.
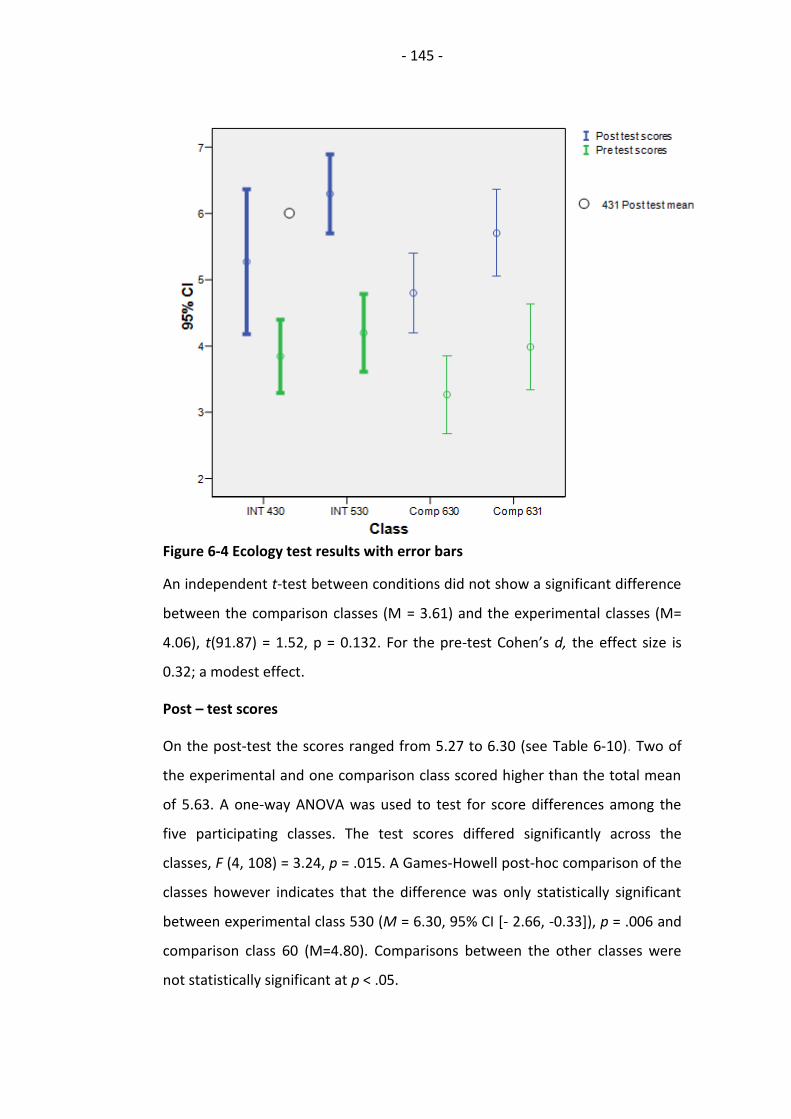
- 145 -
Figure 6-4 Ecology test results with error bars
An independent t-test between conditions did not show a significant difference
between the comparison classes (M = 3.61) and the experimental classes (M=
4.06), t(91.87) = 1.52, p = 0.132. For the pre-test Cohen’s d, the effect size is
0.32; a modest effect.
Post – test scores
On the post-test the scores ranged from 5.27 to 6.30 (see Table 6-10). Two of
the experimental and one comparison class scored higher than the total mean
of 5.63. A one-way ANOVA was used to test for score differences among the
five participating classes. The test scores differed significantly across the
classes, F (4, 108) = 3.24, p = .015. A Games-Howell post-hoc comparison of the
classes however indicates that the difference was only statistically significant
between experimental class 530 (M = 6.30, 95% CI [- 2.66, -0.33]), p = .006 and
comparison class 60 (M=4.80). Comparisons between the other classes were
not statistically significant at p < .05.
- 146 -
An independent t-test between conditions did show a statistically significant
difference. The experimental group (M= 5.92) did score significantly higher than
the comparison group (M= 5.23), t(107.448) = 2.21, p = 0.029.
All variables in one model
A one-way analysis of covariance (ANCOVA) was conducted exploring
differences in the post-test by condition while controlling for the pre-test
scores. The independent variable, learning resource, involved two levels:
intervention and comparison. The dependent variable was the post-test score
and the covariate was the pre-test score. The assumptions for ANCOVA were
not met (Sig=0.22) so results have to be treated with caution. The homogeneity
of the regression effect was not evident for the covariate, and the covariate
was poorly linearly related to the dependent measure (see Appendix B for
ANCOVA table).
The ANCOVA did not show a significant effect from using websites, F (1,91) =
1.69, p = .197. The strength of the relationship between learning resource and
post-test was weak, as assessed by η2, with learning resource accounting for
only 1.8% of the variance in dependent measure holding constant the pre-test
scores. The intervention group had a larger adjusted mean (M = 5.77), than the
comparison group (M = 5.35). In the ANCOVA, the adjusted R2 was 0.227
indicating that 23% of the variation in post-test scores was accounted for in the
model (i.e. by pre-test + group).
6.3.3. What pupils thought of Sunny Meadows
In the questionnaire the largest proportion of the pupils gave the website
Sunny Meadows positive comments (see Table 6-11), saying it was fun whilst
also recognising that they had learnt from using it. Typical positive answers
included ‘It was loads of fun and fascinating’ and ‘I learned a lot about
equilibrium in the environment and learned a lot about all of this’.
This exchange from a group interview shows pupils both remembering what
they were doing and why:
Researcher: What was this website all about, what were you really doing?

- 147 -
Pupil 1: Keeping everything alive
*other pupils nod and agree*
Pupil 2: Increasing understanding and such things.
The negative comments ranged from the task being difficult to unnecessary as
the respondent already knew this topic. Overall both pupils and teachers liked
this website and thought it was useful. Both teachers planned to use it again.
Table 6-11 Pupils views of websites used in ecology intervention
Websites Very
negative Rather
negative Mixed
feelings Positive
Very positive
Total
Sunny Meadows 5 5 7 18 24 59
8% 8% 12% 31% 41% 100%
Mysteries of life 2 5 7 11 9 34
6% 15% 21% 32% 26% 100%
Eco kids 3 3 7 20 16 49
6% 6% 14% 41% 33% 100%
Another measure of pupils’ views of the resource comes from where they were
asked what they used to study for the test. Table 6-12 shows that pupils did not
use the digital resources when studying for the test.
Table 6-12 Resources used to study for the test in ecology
Text-book
Text-book tasks
My notes
Notes from teacher
Sunny Meadows
Mysteries of life
Eco Kids
Other
All N= 108 85% 69% 47% 47% - - - 12%
Experimental group N= 62
79% 61% 55% 47% 2% 0% 2% 11%
Comparison group N= 47
91% 77% 36% 47% - - - 13%
Table shows percentage of all those that answered the questionnaire
The Mysteries of life, the short cartoon explaining what food chains are all
about, was shown by the teachers to the whole class (Olga showed it two
times). The cartoon was chosen because it seemed fun and might explain food-
chains in a more thought provoking manner than a teacher could. The pupils
- 148 -
that remembered seeing the cartoon gave it mostly positive views, ‘fun one
shows more interest because it is new‘, some of the negative comments were
about the cartoon being about something they already knew and one thought it
was too childish.
Pupil 1: See, it did not help me a lot.
Pupil 2: No when, because it was so complicated to understand because science has difficult words and you do not understand completely, in you know, English.
Pupil 3: Well he stopped to tell us what the words meant but is was still really difficult.
Pupil 4: Bear? What bear? what cartoon was that?
Pupil 5: I understood everything but decomposers.
In the excerpt one pupil appears not to remember seeing the cartoon. This was
the case for many of them, claiming in their responses that they had been sick
or that the class had not seen it. In some cases it may be that they were not
paying enough attention for the 2 minutes and 40 seconds that it lasted. The
commentator in the cartoon speaks fast in English and some thought the words
had been difficult and that it would have been better in Icelandic. Still Icelandic
pupils are exposed to English quite a lot and one pupil knew all the concepts
from playing the computer game Spore. Ideally, pupils should be able to use
resources in their own language but as pupils could effectively use these
resources in English this suggest that using low language intensive resources
may be a better option than not.
6.3.4. Summary of ecology intervention
Table 6-13 provides a summary of the ecology intervention. The intervention
classes scored higher than the comparison classes. A t- test showed that
difference to be significant and an ANCOVA showed the same direction of
effect, but this was not significant and very small. These findings do not give a
clear answer to the usefulness of these resources, though they indicate that the
websites used benefited the pupils. Teachers and pupils thought the main
resource Sunny Meadows to be both interesting and engaging.
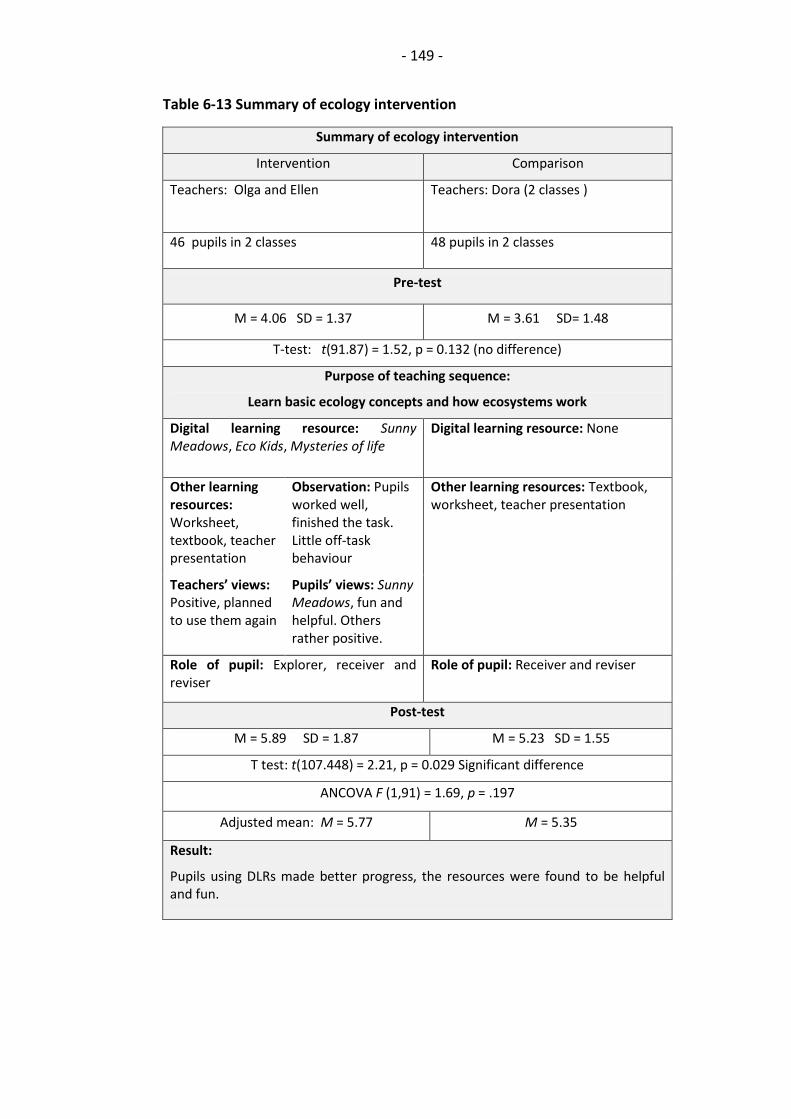
- 149 -
Table 6-13 Summary of ecology intervention
Summary of ecology intervention
Intervention Comparison
Teachers: Olga and Ellen Teachers: Dora (2 classes )
46 pupils in 2 classes 48 pupils in 2 classes
Pre-test
M = 4.06 SD = 1.37 M = 3.61 SD= 1.48
T-test: t(91.87) = 1.52, p = 0.132 (no difference)
Purpose of teaching sequence:
Learn basic ecology concepts and how ecosystems work
Digital learning resource: Sunny Meadows, Eco Kids, Mysteries of life
Digital learning resource: None
Other learning resources: Worksheet, textbook, teacher presentation
Observation: Pupils worked well, finished the task. Little off-task behaviour
Other learning resources: Textbook, worksheet, teacher presentation
Teachers’ views: Positive, planned to use them again
Pupils’ views: Sunny Meadows, fun and helpful. Others rather positive.
Role of pupil: Explorer, receiver and reviser
Role of pupil: Receiver and reviser
Post-test
M = 5.89 SD = 1.87 M = 5.23 SD = 1.55
T test: t(107.448) = 2.21, p = 0.029 Significant difference
ANCOVA F (1,91) = 1.69, p = .197
Adjusted mean: M = 5.77 M = 5.35
Result:
Pupils using DLRs made better progress, the resources were found to be helpful and fun.

- 150 -
6.4. Effects of participation on teachers
Four of the teachers were interviewed towards the end of the intervention with
the aim of accessing what effects, if any, their participation in the intervention
had had.
Eva had not tried out any other ICT applications during the intervention.
However she talked about an eye-opening experience and expressed a
willingness to learn more and to use online videos more often. When asked if
she thought if she has learned anything by participating she said:
Yes, yes. To me the possibility opened up how to connect science more to tasks in computers and to use technology better. Also to give more consideration to what content I should be teaching but not just what textbook.
When Anna was asked about what she had learned, she talked about finding
the resources fascinating and that pupils had learned from them. She had asked
for resources to use while teaching electricity and used them but that was it
regarding experimenting with ICT during that winter.
Olga said she had not tried out any other ICT applications or learning resources
during that school year. When asked why she had volunteered to participate in
the intervention she said:
I have always wanted to connect the two [science and ICT] but have not seen the angle, you have to be so organised for it to function completely, maybe I will feel confident enough to implement more ICT in teaching science next school year.
Ellen had been using ICT to some extent before participating in the intervention
and continued to do so, looking for new resources. When asked if she had
learned anything during the intervention she said:
Well I do not know how to say precisely what I have learned, but I feel it has helped a lot, me just starting to teach, especially ecology, I thought when I was explaining food=chains to them, I thought it hard to understand what they [the pupils] found hard. It is complicated, because I think it is so simple, so I think it helped me understanding their understanding.
To sum up, three of the intervention teachers had found the resources
interesting and participation had stoked their intentions to try to integrate ICT
- 151 -
into their teaching. Despite their increased interest to use more ICT it has not as
yet influenced their practice. Ellen used a variety of resources both before and
during participation in the intervention. Inga was not asked about her use or
learning since she only participated in one part.
6.5. Summary
Introducing teachers to a selection of DLR´s in a series of small scale
interventions resulted in varying results in terms of pupil learning. In balancing
chemical equations and in the ecology intervention the intervention classes
scored significantly higher than the comparison classes but in basic genetics this
was not the case, the difference was slight and not statistically significant.
This variance could to some degree be traced to features of the DLR´s but
teacher effects seemed to play a bigger part. Participation in the interventions
did not change teachers’ practice but opened their minds to the possibilities
that ICT holds for teaching and learning science.
- 152 -
7. Towards an understanding of ICT use in science
education in Iceland
This chapter discusses the three main aspects of this study. First how ICT is used
in science education in Iceland, secondly what factors affect teachers, thirdly
what the interventions revealed. This study confirmed what was suspected that
the extent of ICT use is not great as outlined in section 4 but the study gave an
insight into how it is used, therefore more attention is paid in section 7.1 to
how ICT is used rather than to what extent it is used. Section 7.2 then addresses
the conditions that impact upon ICT use or rather the factors that affect
teachers’ technology integration. Concerning the interventions the question
was if there would be measureable differences between groups using DLR’s and
not. The three interventions all gave different results and section 7.3 discusses
those and the lessons learned from them. Finally the last question was if
participation in the interventions would impact upon science teachers’ practice.
That did by and large not turn out to be the case as presented in section 6.4
and does not merit a separate discussion other than to stress that changing
teacher practice is not a simple thing.
7.1. How Icelandic teachers are using ICT in science
education
Regarding the availability of equipment the survey confirmed what previous
studies had shown, that generic equipment is readily available with, on average
one computer per classroom and an internet connection (Vilji og veruleiki,
2008; Pelgrum, 2001). Equipment for pupils however, especially for whole class
use, is limited and pupils stated they seldom use computers in school.
What we know now is how this equipment is used and the small effect ICT is
having on teaching and learning science. How ICT is used in science teaching is
described in chapter 4.2. This is summed up in Figure 7-1 along with the
associated roles (Newton and Rogers, 2003) these uses put pupils in. The uses

- 153 -
found in the study (see section 4 and Table 4-6) are labelled either as activities
done ‘often’ those are the ones that all teachers seem to practice to some
extent. The ‘seldom’ are those activities that only limited evidence was found of
and the of the ‘close to never’ activities almost no evidence was found of.
Figure 7-1 Frequency of different uses of ICT
Rodrigues (2007) found that teachers first integrate ICT into their current
practice which is teacher oriented before trying out other modes of pedagogy.
Teacher presentations and watching videos put pupils in the role of receiver
which has been the prevalent role of pupils so this kind of ICT use has done
little to change teaching practices. The ‘often’ chosen ICT activities are the ones
that fit with teachers’ current pedagogy. The contradiction analysis showed
that one possible reason for this is that bringing technology into the classroom
requires managing the class around the technology. Instead of disrupting the
comfortable way of practice, teachers are trying to use the technology in a way
that fits their usual way of teaching.
Writing papers, giving presentations and photo taking put pupils in the role of
explorer and creator (Newton and Rogers, 2003). Drent and Meelissen (2008)
considered such uses innovative but not word processing. In the current study
word processing, finding information and presenting it, go hand in hand. Such
activities are innovative in the sense that pupils adapt the work to their own
needs and interests, usually choose the topic and have a large influence over
how extensively they explore the topic. They also have some say over
presentation. In that sense these projects are emphasising and enhancing pupil
centred pedagogy. However at the same time the topics tend not to be around

- 154 -
the central ideas of science, but around less important matters. Teachers stated
as a reason to use ICT that they want to add variety to their teaching and do so
with papers and presentations that can also be done with other learning
resources, the use value is in extending practice but not transforming it
(Twining, 2002). Jakobsdóttir (2001) has found that schools using more non-
traditional teaching methods the internet was used more than in schools with
traditional teaching methods. This indicates that increased use of ICT may lead
to less reliance on textbooks and more on other learning resources and perhaps
other modes of learning transforming teaching and learning.
7.2. A model of the factors that affect teachers
In this section I will discuss the conditions that affect teachers in their
technology integration into science teaching. It is a little disturbing that the
factors and issues that teachers in Iceland are bothered with are factors that
were prominent in the discussion elsewhere over a decade ago (Cox et al.,
1999). When analysing the data I could well relate the Icelandic situation to
Ertmer’s observation from 12 years ago:
Having to deal with numerous first-order barriers simultaneously may frustrate teachers who feel pressured to overcome every barrier before beginning the integration process. When asked to describe the barriers that most significantly impacts integration they may quickly recite a whole range of problems, apparently regarding every barrier as significant. These “laundry lists” of concerns illustrate the frustration teachers feel, often at the start of the process, when the existence of so many first-order barriers seems overwhelming. In addition, these types of responses may suggest that underlying second-order barriers are also at work (Ertmer 1999, p.51).
Such ‘laundry lists’ emerged from this study, however Ertmer suggests that
beneath the first-order barriers there are second-order barriers that seem to
have a stronger effect which seems to be the case in the Icelandic context. It
could be seen that there was not always a correspondence between how
teachers described their access and how their observed circumstances were.
One even went so far as to say first order barriers such as time and equipment
were an excuse. The centrality of second-order factors is evident in a model
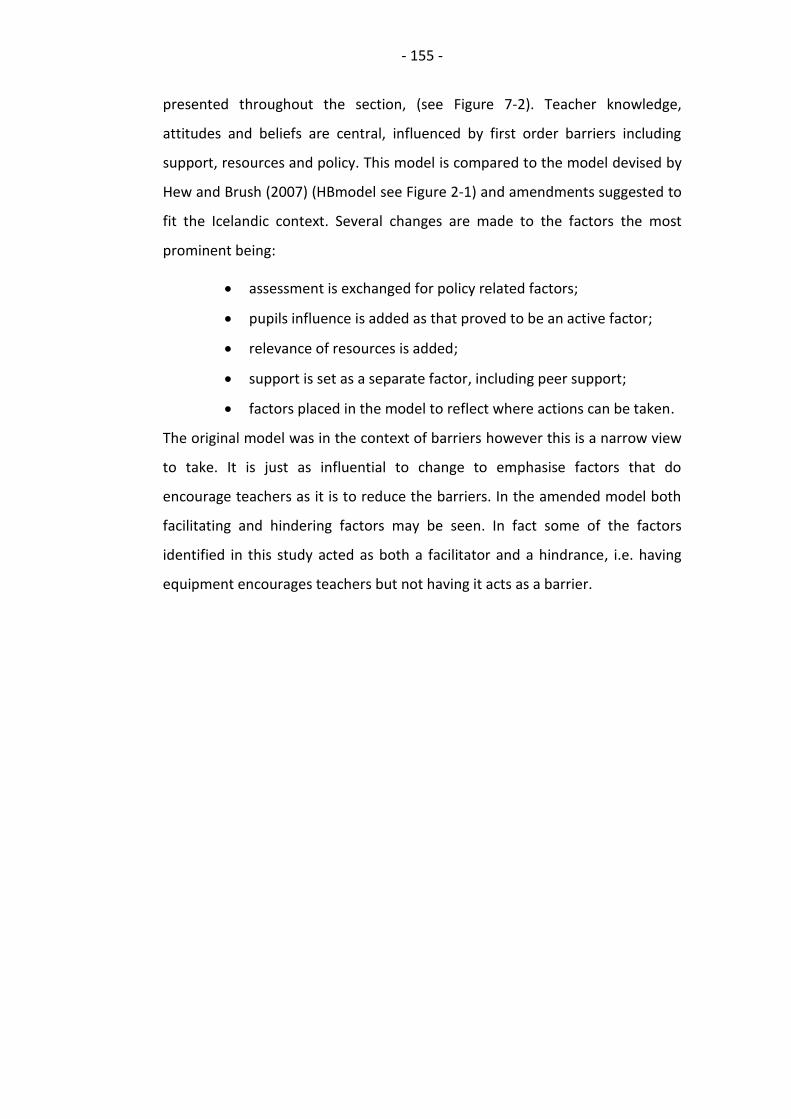
- 155 -
presented throughout the section, (see Figure 7-2). Teacher knowledge,
attitudes and beliefs are central, influenced by first order barriers including
support, resources and policy. This model is compared to the model devised by
Hew and Brush (2007) (HBmodel see Figure 2-1) and amendments suggested to
fit the Icelandic context. Several changes are made to the factors the most
prominent being:
assessment is exchanged for policy related factors;
pupils influence is added as that proved to be an active factor;
relevance of resources is added;
support is set as a separate factor, including peer support;
factors placed in the model to reflect where actions can be taken.
The original model was in the context of barriers however this is a narrow view
to take. It is just as influential to change to emphasise factors that do
encourage teachers as it is to reduce the barriers. In the amended model both
facilitating and hindering factors may be seen. In fact some of the factors
identified in this study acted as both a facilitator and a hindrance, i.e. having
equipment encourages teachers but not having it acts as a barrier.
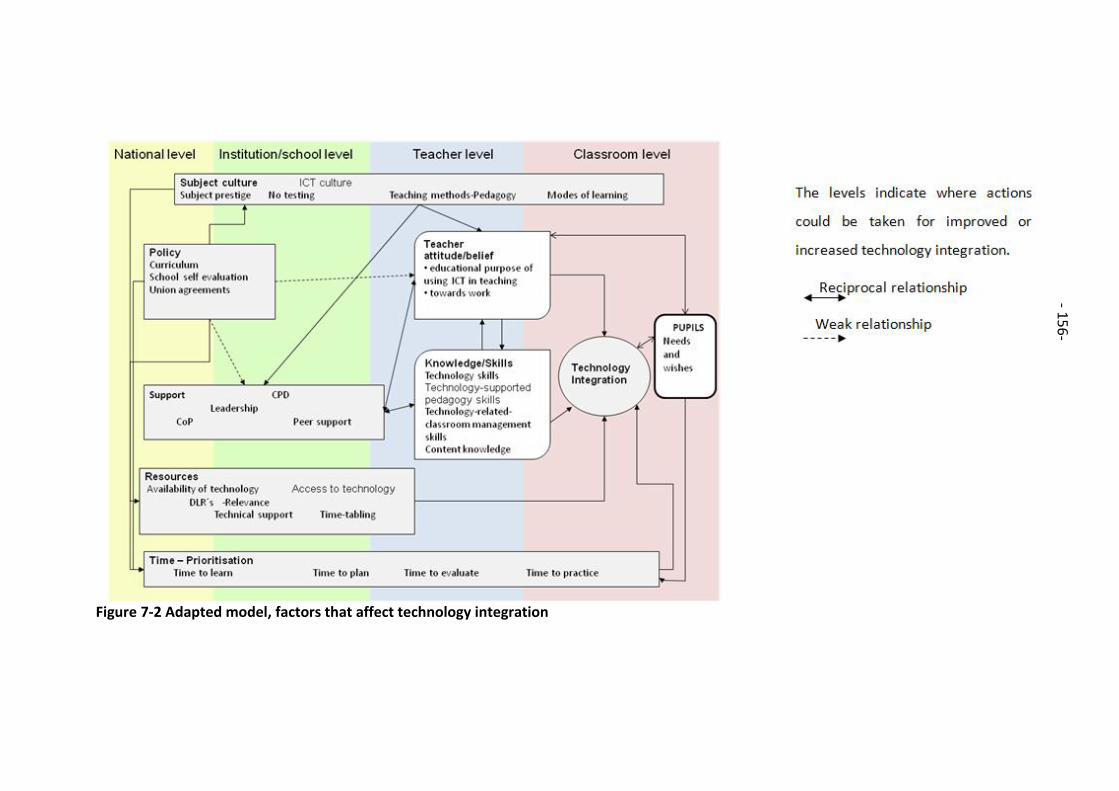
- 156 -
Figure 7-2 Adapted model, factors that affect technology integration
- 15
6-
- 157 -
In the amended model the factors are placed to reflect where in the school
system each of them is most noticeable, and where actions and strategies could
possibly be taken against the barriers, or to support facilitating factors. This
change is influenced by the global conceptual framework of the Comped study
(Pelgrum and Plomp, 1988; ten Brummelhuis, 1995) where the factors are
outlined at micro-meso-macro level and the work of a research group on
collective teacher efficacy (Macdonald A. (project leader), May 2011;
Macdonald et al., 2010). The levels presented are ‘National level’ i.e. laws,
regulations, curriculum and union agreements. ‘Institutional/school level’;
which depending on management structure in the municipality, would be
individual schools or schools within the same district office. ‘Teacher level’ are
the teachers, as individuals or groups, and classroom level is what happens in
the classrooms. As a result the aspect ‘institution’ and ‘resources’ as presented
in HB model are split into ‘resources’, ‘support’ and ‘time’, but the HB model
presented ‘institution’ as a factor providing support, time and resources.
Resources are an important factor affecting teachers as it was seen in this study
that, in one way or another, it affected all the participating teachers. For
successful use of ICT, there needs to be adequate equipment and access to it.
The same goes for DLRs, especially considering their relevance to the
curriculum (Rodrigues, 2006). This study showed that the availability of DLRs for
science in schools is scarce and their direct relevance to the curriculum is weak
(contradiction C section 5.2.2). There was little mention of teachers using the
websites from NCEM but as mentioned in the introduction (section 1.2) most of
the resources have a weak relevance to the curriculum as they focused mostly
on biology and Icelandic nature. Relevance is not present in the HB model but is
added to the amended model as an important aspect of DLRs.
Though lack of support does not rank high in this study, I maintain that teachers
need more support than they realise. ICT use in schools is not supported in a
systematic way. Support, in the form of CPD and training teachers in using ICT,
has been very limited (see 5.1.3). This is worrying because relevant training,
providing knowledge and skills that can instantly be implemented in the
- 158 -
classroom, is one of the more important aspects of successful ICT
implementation (Rodrigues, 2006).
It was striking how little the teachers talked about support from management.
The teachers did not seem to consider such support to be important, either as a
barrier or a facilitating factor, and it can even be said that they did not seem to
expect much support or guidance at all. The cases indicate that not having
active support is a hindrance to teachers (see contradiction D. Section 5.2.2.)
This was mostly seen in the way teachers did not talk about headteachers in the
context of factors that affected them. This is quite different from other studies
where support is considered a highly important factor for development of ICT
use(Ertmer, 2001). Professional isolation and lack of peer support seems to be
holding teachers back (see 5.1.4). In the studies reviewed by Hew and Brush
(2007) peer support is nowhere to be found but is suggested as a strategy to
overcome barriers. Rodrigues (2006)on the other hand listed recognition of
peer expertise as an influencing factor. In the amended model peer support is
added as a sub-factor of CPD, with a connecting arrow going both ways. This
indicates that not only does the support affect the teachers but teachers may,
and preferably should also contribute to their community of practice. It is
important for teachers to feel that they belong to a community (Charalambous
et al., 2011) and that they share their worries about different issues such as ICT
integration.
Time for experimentation and collaboration with peers is essential (Haydn and
Barton, 2008; Rodrigues, 2006). If teachers had more support from
management, training and peers, it is likely that the task of implementing ICT
into their teaching would not seem as overwhelming. The main
recommendations from this study therefore are regarding support.
Research carried out during the years that standardised tests were held showed
that science teachers felt time restrictions in covering the material (Sigþórsson,
2008). However in the current study this was not an issue. In fact this was
found to be quite the contrary as many felt they had time to really explore
topics as the pressure from standardized tests had been lifted.
- 159 -
Most often, not having time means that teachers need time for themselves
outside the classroom to learn, experiment, plan and prepare. Time issues are
thus more connected to knowledge issues and organisation than the
curriculum. Ertmer (1999) categorises time as an extrinsic factor but in this
study time might be considered an intrinsic factor, or at least highly influenced
by intrinsic factors (such as teacher beliefs on what is most important and
pressing at any given time). In the amended model time is stretched across the
continuum as issues related to time and prioritisation can be addressed at all
levels.
Working hours and time for professional development of teachers are decided
through work agreements at the national level and implemented at
institutional level. Providing time for training and planning in schools is
essential. Even if pioneering teachers prioritize time to learn, experiment and
plan ICT into their lessons, this does not apply to all teachers. However as
Bennett has pointed out;
It is clear that in-service training for teachers will not, in itself, lead to a significant increase in the purposeful use of ICT in science lessons: creating time for planning is essential if ICT is to be used appropriately and effectively as part of good teaching. (Bennett, 2003, p. 143).
This means that generally the impetus has to come from policy and
management.
Through the analysis, time came to mean prioritisation at the teacher level.
When the teacher said ‘I do not have time’ or ‘I have not taken the time’ it
invariably meant that they prioritised some other task or activity either in their
work or personal lives higher. For the majority of teachers not having time
meant that other demands of the job were more imperative and when they
were done, time and energy for studying new things was limited. To recap the
cases, Eva talked about not having time. In her case it meant she used the time
at school to do her usual tasks that come with being a diligent good teacher,
but did not place any of the day to day jobs aside to explore using ICT more in
her teaching. She also did not have time at home being the mother of young
children. For Anna not having time meant prioritising tasks regarding teaching
- 160 -
two demanding subjects higher than learning new skills. For Olga it meant
prioritising learning and brushing up on content knowledge. No energy was left
to develop pedagogy involving ICT and she relied on teaching in traditional
ways, despite having good technology skills. For Ellen time was not an issue.
She was developing her teaching practices for the first time and incorporating
ICT as much as she could. This was mostly because of her own interest and the
knowledge that ICT could be beneficial to pupil learning.
These time issues are bound to be strongly linked to teacher beliefs about what
is important because they inevitably affect choices and priorities.
The HBmodel includes teachers’ beliefs about the educational purpose of ICT in
education. Attitudes of teachers towards ICT were outlined in section 4.3 which
drew a very positive picture, with a large majority agreeing to all statements in
the survey. These positive beliefs do not correspond to the limited use reported
as not all beliefs are reflected in practice (Mansour, 2009; Ertmer, 2000).
My study did not reveal strong beliefs about why or how ICT should be used.
Fishbein and Ajzen (1975) argue that attitude formation needs to be looked at
in conjunction with its informational base. Teachers beliefs that computers are
supposed to be helpful for learning and motivating probably comes from other
sources. In all likelihood teachers have not bought the discourse though they
can speak it. An exception to this might be the younger teachers who have
information from more trustworthy sources, as seen in Ellen who spoke about
reading research showing the affordances and benefits of ICT.
Cavas et al. (2009) found in a survey of 1,071 science teachers that computer
ownership and experience affected attitudes towards ICT use in schools. This
may begin to explain the professed positive attitudes of Icelandic teachers
which were seen in this study. All teachers in Iceland use computers in their
work, and Icelandic homes have one of the highest ratio of high speed
connections in the world. These positive attitudes are still not sufficient to drive
technology integration. Other factors at work seem to have a stronger
influence.
- 161 -
Though there is currently a discrepancy between the stated beliefs of science
teachers and their actions, these beliefs are the first steps towards future
actions (Fishbein and Ajzen, 1975). There is still a lot left here to explore.
Research has shown that readiness for change and the willingness to go outside
your comfort zone and try out new things, is a factor in teachers’ CPD in regard
to ICT implementation (Rodrigues, 2006). Early in this study two quotes showed
two completely different attitudes towards exploring new things (see p. 97).
These statements raised questions like: what is it that influences teachers’
attitudes towards work and change? These questions drew my attention to
literature about the attitude of teachers, however such research was too vast
for this study. It seems that teacher attitudes are important and have a central
place in technology integration. However, how and why that is, is outside the
scope of this study and will need further exploration in the Icelandic context.
There were several indications that pupils’ needs and opinions affect teachers
in their technology integration. Teachers talked about engaging pupils with a
variety of teaching methods. ICT was prevalent in that discourse (see section
4.3) where the use of ICT was believed to be a reason unto itself because
technology appeals to pupils. This opinion of the teachers is supported in
research where varying learning tasks and learning activities is suggested as a
means to increase pupils´ interest and motivation (Pintrich, 2003). The belief
that computers can affect pupil learning has led some governments to pour
money into integration schemes (eg. Singapore, the first Master plan for
Information Technology in Educationwas launched in April 1997.) In Icelandic
policy documents ICT is perceived as a way to meet pupils current and future
needs ‘The Internet will play a key role in enabling students to engage in studies
in many schools at once and shape the curriculum to their own needs’ (Ministry
of Education Science and Culture, 2001). As a result of this pupils have been
added to the model. Their absence was noticeable in the HB model, where
pupils and their views did not seem to play any role in affecting technology
integration. Drent and Meelissen (2008) found links between innovative ICT use
and teachers’ pedagogical approaches. They argue that experiences with the
use of ICT support student oriented approaches. This relationship seems to be
- 162 -
reciprocal, teachers use ICT with pupils which again puts more emphasis on
pupil centred learning.
Indications of subject culture as barriers in the Icelandic context were not
obvious at first glance. Extrinsic factors were much more noticeable. Subject
culture incorporates expectations of all stakeholders and traditions about how
and why we teach science. In the model the subject culture is stretched across
the continuum involving several aspects. Cuban (2001) suggested that the
actual reasons for little technology integration are teachers’ core values and
beliefs about teaching. Core beliefs about teaching and learning could be seen
in this study. Science is supposed to be about experiments and nature. Even the
word in Icelandic náttúrufræði means ´the study of nature’. This understanding
of science could be seen in teacher responses where they were more
concerned with lack of practical work and field trips, than their limited use of
ICT. In the interviews, when asked about ICT, teachers started talking about
practical work, showing they perceived that as a much more pressing problem.
The culture of science teaching dictated that the subject should be taught
through practical work. The case of Anna also pointed to the low prestige of
science versus other schools subjects.
I removed testing as separate factor from the amended model. However it is
part of the subject culture of science that there are no standardised tests.
Previous research had shown that during the years standardised tests were
given teachers felt pressured by them (Þórólfsson et al., 2007; Sigþórsson,
2008). Having no tests is a double edged sword. Without that pressure teachers
are not pushed on in developing more efficient ways of teaching. At the same
time not having tests gives time and leeway for those that want to do develop
their pedagogy. The TALIS study showed that more value is placed on good
relations with pupils, parents and colleagues than on high test scores (Ólafsson
and Björnsson, 2009). That kind of stance obviously encouraged some of the
teachers to use ICT as doing so pleased pupils.
From the cases one can see how the whole culture of the school is rigid. Though
the teachers verbalize their interest in new teaching methods, they revert and
- 163 -
stick to the methods they know and are comfortable with. There has been
evidence from other sources that teachers hold on to the methods they are
used to and when faced with new technology use it only use it to support their
current practice. Saye (1997) found that a majority of both pupils and teachers
wanted to use ICT to support traditional ways of practice. However a minority
valued the fact that it opened ways to more individualised learning. This
minority had a higher tolerance for uncertainty. Teachers are themselves also
conservative and teaching is a ‘conservative practice’ (Tobin and McRobbie,
1996). This ‘conservative practice’ applies to science teaching just as to any
other subject where the accepted culture is that pupils sit quietly, facing the
front, learning from the teacher. Computers change that. The teacher is no
longer the focus of the pupil as pupils will have to move to the computers
focusing their attentions on the screen. Most often they will move to another
space in the school, perhaps to many different spaces. There were some
indications that this was hindering teachers (see section 6.1.2, pedagogical
factors). It bothered them to ´lose control´, not being able to see all students at
the same time. It is clear that bringing technology into the classroom has some
effect. It has been said that the first priority for a majority of teachers is to
maintain order in the classroom and to have a controlled learning environment
(Cox et al., 1999). Changing the environment is a threat to the teachers’ control.
Another tradition that is hindering teachers seems to be an overreliance on
textbooks. A seminal study (Sigurgeirsson, 1992) illustrated that teaching in
Iceland is more governed by the textbooks than the curriculum. Science is no
exception here. Talk among teachers about what they were teaching generally
revolves around what book to cover for each year group, rather than what the
curriculum guide suggests and certainly not to give the textbooks a break and
use DLRs as a main learning resource. There also seemed to be a big difference
there between teachers. Those that are confident generally could organise all
kinds of different activities, but those less confident seemed more hesitant to
let go.
The ICT culture within the school also affects teachers in their decisions. It is
daunting when the culture is so that a teacher always has to start from the
- 164 -
beginning; bringing pupils and technology together, the computers are turned
off, pupils use them seldom, and there are often no set ways of saving and
retrieving work. Issues such as these stemming from school and subject culture
push technology integration far down the list of priorities.
A large spectrum of knowledge issues turned out to be a major barrier for
teachers (see 5.1.6). Even active users of computers assign their reluctance to
use computers to lack of knowledge.
The TPCK model reminds us that a different set of knowledge is needed to
teach with computers than just knowing how to use them. TPCK includes
‘knowledge of the existence, components, and capabilities of various
technologies as they are used in teaching and learning settings’ (Mishra and
Koehler, 2006, p.1028). These were all weak for a large majority of participants
in this study. Lacking knowledge on how to use ICT in teaching is not a problem
isolated to science; 58.6% of Icelandic lower secondary teachers say they need
more training in using ICT in teaching (Ólafsson and Björnsson, 2009).
The survey indicates that teacher knowledge of equipment and applications is
hardly a limiting factor. Teachers use applications more in other situations than
in the classroom. A similar trend could be seen when teachers’ competence in
ICT use did not affect their innovative uses of technology (Drent and Meelissen,
2008). This suggests that teachers are more lacking in technological
pedagogical knowledge than technical knowledge. A frequent complaint was
not knowing where to look for DLRs and not knowing about science specific
applications. Knowledge of the science curriculum and educational aims are
considered part of science teachers’ PCK (Abell, 2007). Teachers realised what
the curriculum guide expected but not how to get there.
Content knowledge seems to be a barrier to technology integration as could be
seen from the case of Olga. Previous evidence of teachers’ content knowledge
come from the TALIS study (Ólafsson and Björnsson, 2009) where teachers are
said to have positive efficacy beliefs in terms of knowing the content, and
45,4% claim they need training in their teaching subject. This might be higher
for science teachers since only 46% of them are qualified science teachers
- 165 -
(Ministry of Education Science and Culture, 2005). Not having solid knowledge
of the subject you are teaching must mean that first of all that your time which
should be spent organising ways for successful teaching must go into
familiarising yourself with the topic. This leads to overreliance on textbooks and
teaching by the book, not recognising the main big ideas and getting caught up
in details because you do not know better. In this situation it is unlikely that
teachers will really try much innovation in their teaching.
In the HB model assessment is a separate factor. In the amended model I
removed assessment as there are no standardised tests in science. No evidence
was seen of internal assessment in schools playing any part. One would assume
though that curriculum and policy should affect practice. The teachers in the
current study were not asked to articulate their views on external pressures.
Nevertheless the views they expressed have similar characteristics as the
expressed in Sugar, Crawley and Fine (2004) that “everyone” would approve of
ICT use in schools, and “No one” would disapprove. That social support of ICT
use had not been explicitly communicated, but rather felt as an indirect
assumption. Still it is noticeable in this study how little mention there is of
external pressure or expectations that teachers should use ICT in their teaching.
Despite policy papers and a curriculum that states in several places that ICT
should be used teachers did not mention this as a reason to do so. It is a long
running thread in school development that the impetus should come from the
‘grass-root’ or from ‘above’. The research team at Kennisnet (see e.g. (ten
Brummelhuis and van Amerongen, 2011; ten Brummelhuis, 1995) argue that a
movement that starts with leadership and vision all under the umbrella of
cooperation is way forward. Still, too much pressure from ‘above’ may have the
opposite effect. Hennessy et al. (2005), for example, reported teachers that felt
they had to use technology just for the sake of it and not because of its
usefulness. This caused them feelings of disempowerment.
Seeing the world as black or white can never be fruitful and saying innovation
has to come from above or from the grassroots is not a helpful distinction. This
is followed up later in the recommendations.
- 166 -
7.2.1. Summary
Not one factor can be said to be the main cause for limited technology
integration. Looking at the factors separately isolates them when in fact they in
most instances are interwoven and connected in intricate ways. The working of
the factors has been compared to a cog wheel that in a complex manner affect
each other (Drent and Meelissen, 2008). Practical and technical factors such as
equipment and support seem the most obvious barriers, but with them out of
the way teachers must still find impetus and ways to integrate the technology
into their teaching. Hew and Brush (2007) argue from their review that
knowledge and skills are more important than tools or support from peers, but
also recommend that further work is needed to examine that claim. This
recommendation is repeated here as in the context of the current study all
those factors appear to be weak so determining their rank of importance is not
possible here though lack of knowledge and peer support seems most pressing.
7.3. Factors that influenced the impact of the
interventions
The intervention part of this study was meant to answer the question would
pupils using a selection of DLRs show more progress than pupils being taught
using only textbooks. In all the interventions the impact from using digital
learning resources was small, often borderline significant and in one case
negative. The views of pupils and teachers on the resource effectiveness
though largely correspond to the statistical results. Results from comparing the
conditions give tentative grounds to assume that the differences found may be
due to effects from the treatment. However other aspects are suspected to
have influenced the impact of the interventions.
Three of these aspects are worth discussing. First, the results indicate that
benefits from using DLRs vary between resources, drawing attention to
different affordances or properties they may hold, and possible benefits that
may accompany them.
Secondly, the influence of the relevance of the resources to the perceived
importance of the learning aims and testing.
- 167 -
Lastly, the results from the classes indicate that the biggest effect was not from
the resources themselves but from the teachers. The differences between
classes across conditions are in some instances rather large and a pattern
emerged putting the focus on the teachers more than the learning resources.
7.3.1. Resources and roles
Twining (2002) points out that a clear distinction needs to be made between
intentions and what is actually achieved by computer use in education.
Twining’s computer practice framework and the four learning modes listed by
Newton and Rogers (2003) (receiver, reviser, explorer and creator), introduced
in section 2.1 are used here to reflect on the properties and benefits of the
DLRs. Data from pupil progress in the interventions and their responses along
with teacher opinions were used to determine whether the potential that the
resources were believed to have during the design phase of this study seemed
to have been realised (see below).
When choosing the learning resources an effort was made to find ones that
could possibly extend or transform learning activities by putting learners in the
role of explorer and/or reviser. This section discusses to what extent these
goals and the goals of effective learning were achieved.
The resource Erfðavísir puts pupils in the role of receiver as pupils read and
receive information from the website. It seemed to have the potential to put
pupils in the role of explorer and reviser, by having non-linear navigation and
interactive questions. This practice is in many ways similar to learning from a
textbook and in that way supports current practice. The main issue was
whether reading subject material from a website with some interactive
material was in any way better than lecturing and reading from a book.
The results were that the comparison groups scored slightly lower than the
intervention groups. Pupils did not engage with the opportunities to revise the
knowledge and explore ideas. The animations did not seem to add enough to
be said to extend the activity of reading. These results seem to support the
criticism of DLRs that mostly contain reading material that they have little to
offer beyond books. It still has to be taken into account that this website is not
- 168 -
designed specifically for use in schools and pupils only used the resource at
school and not at home unlike how a textbook would be expected to be used.
The question was also concerned with if using the website was different to
listening to the teacher. Pupils for the most part agreed that lecturing is better,
saying they understood better if the teacher explained well and it was better to
be able to ask questions.
The conclusion seems to be that Erfðavísir puts pupils in the role of receiver
which, in the way it was used in the intervention, supports current practice with
little chance of transforming or extending science learning. The lesson to be
learnt is that care has to be taken how such resources are designed and used.
The big issue is not to replace books but to develop teaching methods and
pedagogy that incorporates the best of both worlds, making learning science an
engaging activity, whether at home or in schools.
The teachers did not believe that DLRs would replace books any time soon
because schools are not sufficiently equipped for such a change. Recently e-
books for other appliances other than desktop computers have emerged and
other reasons than effective learning for using them. Those reasons include
easy access, portability, low cost and that they are easy to make. Those reasons
refer more to the static nature of books but new formats of digital textbooks
aim to maximize the effectiveness of learning by adding search and navigation,
audiovisuals, animations, 3D graphics and other state-of-the-art multimedia
functions (Kim et al., 2010). Such pupil-centred textbooks allow pupils to work
at different levels according to their needs. Whatever resource comes along
teachers will need to integrate them into the work of pupils focusing their tasks
and giving them purpose.
The website Chembalancer was the simplest and the best website in all the
interventions (see 6.2.3). Chembalancer is basically a drill and practice resource,
which puts pupils in the role of reviser. Chembalancer extends the task of
balancing chemical equations in the sense that the task is still the same and
could have been achieved without a computer. The task is extended though
because the process of giving pupils feedback is changed. Every pupil gets
- 169 -
instant feedback on their work instead of other slower and or less
individualised methods. The property of the website of giving visual aid in
building the molecules, may also be said to extend the task. These two features
seem to have been responsible for the intervention classes scoring higher than
the comparison classes.
The interactive tests used in this intervention are designed so that they only tell
the user whether the answer is correct or wrong but give no further advice. This
activity can also be done without a computer so the activity of revision is
extended, but not transformed.
One interpretation of the findings is that DLRs will produce better learning
results the more interactive features they contain. Two interactive simulations
were supposed to be used in the intervention. Sunny Meadows in ecology and
Bug Lab in genetics. They were believed to hold the potential to transform the
activity of exploring on one hand the development of an ecosystem, and on the
other, inheritance in bugs by modelling these phenomena in a simulation.
Observing the development of an ecosystem could hardly have been observed
otherwise in a classroom but exploring inheritance laws may to some extent be
done in pen and paper based tasks.
It seemed from the observations that the more interactive the DLR, the more
pupils engaged with them. This tendency seems to be reflected in the test
results, in the sense that those DLRs that had pupils scoring higher, seen with
Sunny Meadows and Chembalancer, which are highly interactive. Erfðavísir
where intervention pupils scored lower, is only interactive to a limited degree.
In the same way pupils had more positive views of those resources with more
interactive features, as long as there were not too many complicated features.
Bug Lab seemed to have the properties needed to transform the task of
understanding genetics laws, giving pupils an opportunity to observe and
manipulate a population of bugs. Though highly interactive and therefore
should have positive connotations, Bug Lab was deemed too complicated by
one teacher. When observing pupils it was clear that it had too many features
for them to navigate and partake in meaningful learning at the same time. It is
- 170 -
known that when technical applications get too complicated they interrupt the
purpose of using them, for example. Waycott (2004) found when looking at the
use of personal digital assistants that the focus shifted away from the intended
one when faced with novel interfaces and technical difficulties.
Sunny Meadows is also very interactive but much simpler than Bug Lab and
more suited to the pupils’ age. Both Ardac and Sezen (2002) and Steinberg
(2000) suggest that the groups using simulations in their study did not show
better progress due to the level of interaction with the simulation. Pupils using
Sunny Meadows were highly active and the simulations helped them infer how
ecosystems work, thus transforming the teaching and allowing them to explore
phenomena they would otherwise not have been able to do. Though the
positive effect was only medium sized, the pupil interviews revealed a stronger
conceptual understanding than perhaps traditional knowledge tests reflected.
The types of resources that proved useful in the intervention are not available
in Icelandic. The resources in English used in the interventions did not prove to
be a big hindrance to pupils but they were chosen because of low language
demands. Resources in pupils’ mother tongue are needed to study complicated
concepts and ideas.
The characteristics of successful DLRs as suggested from these interventions are
that they are highly interactive without being too complicated. They put pupils
in the role of explorer or reviser. That is not to say that resources that put
pupils in other roles do not have a place in science teaching just that the ones
used here did not prove successful. The resources used in the intervention
mostly support or extend pupil learning. Only one of the resources selected did
transform pupil learning in anyway.
7.3.2. Effects of testing and relevance
Teachers during the interventions were encouraged to make the URLs to the
websites available to pupils. As it turned out, pupils did not seem to regard
computers primarily as tools for learning. Pupils were asked what resource they
had used to study for the test (see section 6). DLRs were in all cases used by
less than 30% of pupils to study for the test. In comparison textbooks were
- 171 -
used by over 63% to up to 91%. Pupils stated both in the questionnaire and
focus groups that they realised that test questions would be based on the
textbook so that was the resource they more or less all used. Still the nature of
the resource seems to matter. There were some examples of pupils going back
to interactive quizzes and Chembalancer but not to reading material or
simulations.
The effect of using Chembalancer is larger than effects in the other two
interventions. This may be in some part due to the nature of the task. In
balancing chemical equations the task is exactly the same as in the test. The
simulation Sunny Meadows is meant to increase understanding of a complex
phenomenon but in that intervention the test tasks were quite different from
the simulation. Another interpretation might then be that that the more alike
the DLRs are to the tests the more likely one is to find a difference.
Testing may also have influenced difference between classes. In the genetic
intervention it is quite striking that both Tina’s classes raised their score well
over 3 points or close to doubled their score, whereas others gained 25% or
less. This may have many explanations, possibly that teachers made different
use of the pre-test. It seems from responses that questions that were both on
the pre-test and the post-test were discussed or taught specifically between the
tests by Tina. An example is a question where pupils are asked to order by size,
a body, a cell, a chromosome, a gene and DNA. The difference is striking, 44%
of Tina’s classes order correctly but 0-18% of the other classes. This may either
have been knowingly or something that would have been done by Tina anyway
since all her observed lessons seemed to indicate her being a highly efficient
teacher.
7.3.3. Effect of teachers’ pedagogical content knowledge
That teachers are important is well known from educational research. From a
meta-analysis of over 800 studies one of the main conclusions was ‘Teachers
are a major influence on student learning’ (Hattie, 2009 p.238). Educational
change is dependent on ‘what teachers do and think – it’s as simple and as
complex as that’ (Fullan, 2007 p. 129).
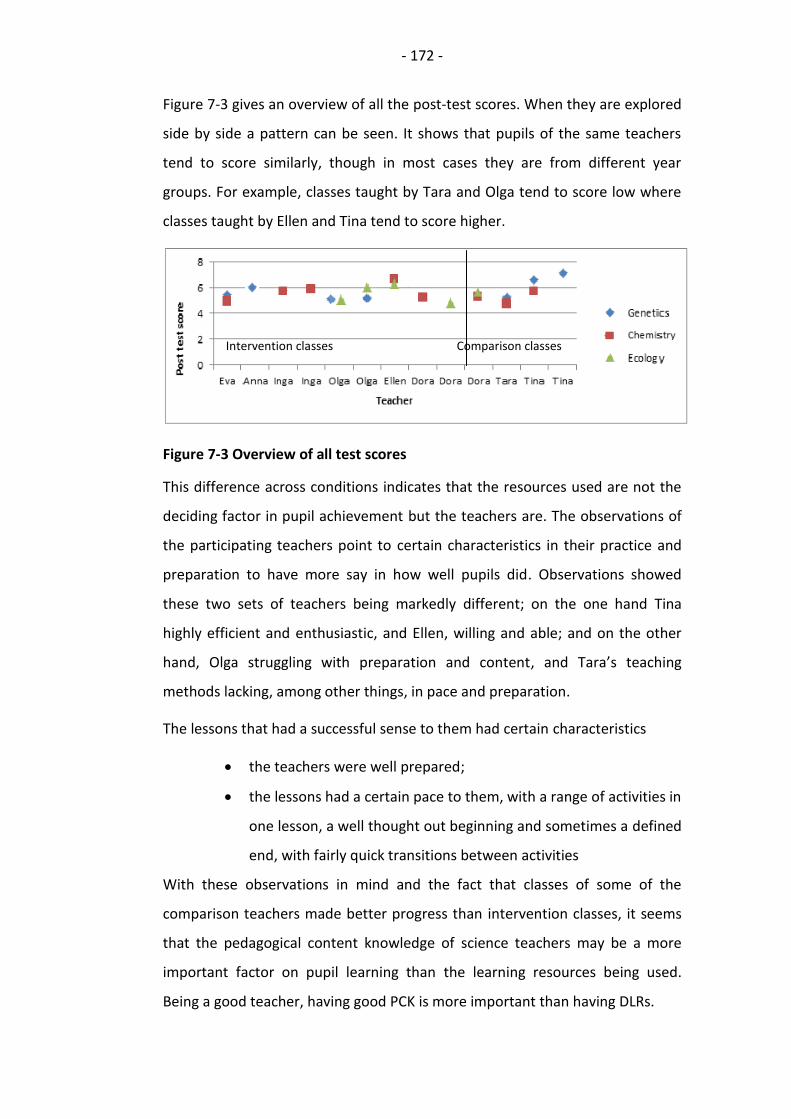
- 172 -
Figure 7-3 gives an overview of all the post-test scores. When they are explored
side by side a pattern can be seen. It shows that pupils of the same teachers
tend to score similarly, though in most cases they are from different year
groups. For example, classes taught by Tara and Olga tend to score low where
classes taught by Ellen and Tina tend to score higher.
Figure 7-3 Overview of all test scores
This difference across conditions indicates that the resources used are not the
deciding factor in pupil achievement but the teachers are. The observations of
the participating teachers point to certain characteristics in their practice and
preparation to have more say in how well pupils did. Observations showed
these two sets of teachers being markedly different; on the one hand Tina
highly efficient and enthusiastic, and Ellen, willing and able; and on the other
hand, Olga struggling with preparation and content, and Tara’s teaching
methods lacking, among other things, in pace and preparation.
The lessons that had a successful sense to them had certain characteristics
the teachers were well prepared;
the lessons had a certain pace to them, with a range of activities in
one lesson, a well thought out beginning and sometimes a defined
end, with fairly quick transitions between activities
With these observations in mind and the fact that classes of some of the
comparison teachers made better progress than intervention classes, it seems
that the pedagogical content knowledge of science teachers may be a more
important factor on pupil learning than the learning resources being used.
Being a good teacher, having good PCK is more important than having DLRs.
Intervention classes Comparison classes
- 173 -
7.4. Limitations and methodological comments
This study gives indications but not clear answers about the usefulness of the
resources. By having many different resources insights were gained as to what
features contributed to effectiveness. After this experience the attractiveness
of studies with an iterative research design is understandable, for example
studies such as those reported by Linn, Clark et al. (2003) which also includes
the design of the resource along with the associated pedagogy. When the
research reveals what parts were useful and which could use improvement, it is
tempting to change the design but a onetime only quasi-experimental design
does not allow that. The chosen quasi-experimental design is though the most
appropriate though when effectiveness is the main issue concerned.
The good thing about this intervention is the ‘natural setting’ as the classes are
taught by their teacher, in their regular lessons. Some interventions showing
large effects of the treatment have involved a significant manipulation of the
teaching situation, and so results have little transferability onto regular
classroom teaching. Taking for example interventions where the researcher
works with a small group of pupils (see e.g. Barton, 1997), in those studies it
can be said that the learning environment becomes yet another variable to
consider. Of course interventions such as this study require some manipulation
of the learning environment like taking pupils to a computer room. However,
this manipulation can quite easily become part of the regular practice for those
wanting to capitalise on the effect reported in studies. Manipulation of
teaching must be within reach for the everyday practitioner if studies are to be
successfully replicated in practice.
Aspects of the methods in this study that give room for improvement are first
of all the test design. As the resources in most cases covered only a small part
of the curriculum, a short test on precisely that part may have been more
appropriate. Using the regular assessment was chosen for sake of authenticity
and to increase the likelihood of pupils taking the tests seriously.
The quasi-experimental design limited the guidance that teachers could be
given because then the guidance would have become another variable to

- 174 -
consider. In working with the teachers, what happened was that the proficiency
of the teachers in dealing with new educational technology and resources
became a variable. However this variable seems to be the same one that
actually mattered more in the interventions; that is their TPCK and confidence.
7.5. Summary
This chapter discussed how the current uses of ICT in support and sometimes
extend science teaching but have not have had the transformative effect on
teachers and pupil roles that was suspected with the introduction of computers
to schools. Furthermore it discussed the way the resources chosen for the
interventions are all very different. What stands out is that none of them really
transform pupil learning though many have the potential to extend classroom
activities. Still the lessons learned are that visual elements and interactive
features seem to facilitate learning and engagement.
Furthermore it argued that the use of DLRs do not provide a ‘dream ticket’ to
science teaching and learning. The effective use of DLRs is dependent upon the
strength of the teacher’s pedagogical content knowledge and can be seen as a
potential area of development for the competent science teacher.
- 175 -
8. Conclusions and recommendations
I started this work intent on exploring why ICT had such a limited profile in
science education and to provide evidence that it may be used for the benefit
of pupils. My study showed the factors that affected teachers (see chapter 5
and section 7.2) and gave evidence on the effectiveness of a selection of DLRs
(chapter 6) and discussed what did affect the outcomes (see section 7.3.) This
last chapter sets out to tie this information into a set of suggestions relating to
the findings. First some recommendations for the school system are presented,
secondly for further research and lastly some final thoughts.
8.1. Recommendations for practice
During the data collection the focus of this thesis shifted from why are teachers
not using ICT to how can teachers’ use of ICT be facilitated. My study visibly
indicates that teachers and their knowledge base was more important than the
resources used, highlighted what has long been suggested that the best way to
school development and technology integration is through supporting teachers
(Cuban, 2001; Fullan, 2007). In the Icelandic context there are three interlinked
recommendations arising from this thesis on how technology integration might
be supported. Firstly, on the provision of physical tools together with the
development of relevant DLRs and other resources, as a foundation for the
successful integration of ICT into science teaching; secondly, concerning the
need for CPD of science teachers, including the need for support and a
collaborative community; and thirdly around the conceptual tools focused
around a shared vision and a collective understanding of what role the
educational community sees ICT playing in schools.
Even though ICT was first introduced to schools in the 1980s, schools have still
not changed. This problem of teachers not using ICT extensively is therefore still
relevant and maybe even more relevant now than in earlier years. Cavas et al
(2009) suggest that:
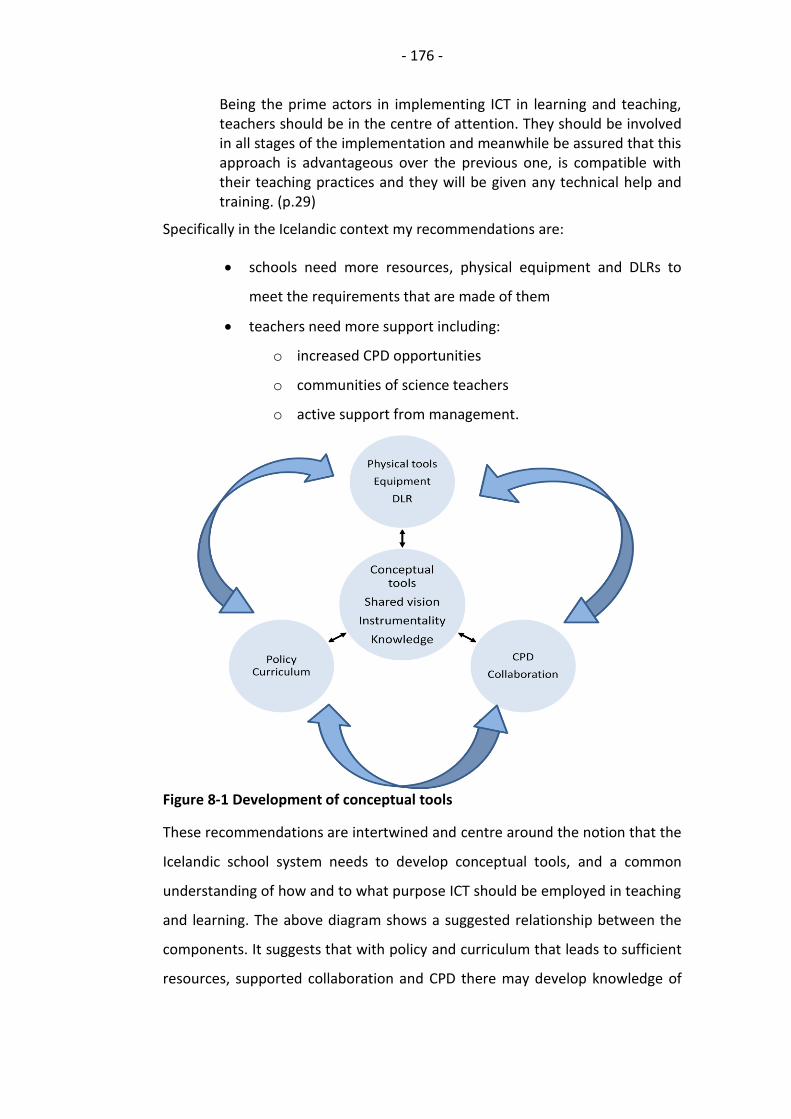
- 176 -
Being the prime actors in implementing ICT in learning and teaching, teachers should be in the centre of attention. They should be involved in all stages of the implementation and meanwhile be assured that this approach is advantageous over the previous one, is compatible with their teaching practices and they will be given any technical help and training. (p.29)
Specifically in the Icelandic context my recommendations are:
schools need more resources, physical equipment and DLRs to
meet the requirements that are made of them
teachers need more support including:
o increased CPD opportunities
o communities of science teachers
o active support from management.
Figure 8-1 Development of conceptual tools
These recommendations are intertwined and centre around the notion that the
Icelandic school system needs to develop conceptual tools, and a common
understanding of how and to what purpose ICT should be employed in teaching
and learning. The above diagram shows a suggested relationship between the
components. It suggests that with policy and curriculum that leads to sufficient
resources, supported collaboration and CPD there may develop knowledge of
- 177 -
and understanding of ICT and teaching methods, perhaps inspiration for design
of DLRs. These recommendations are further outlined in the next sections.
8.1.1. Physical tools – resources and DLRs
This thesis started out with the assumption that there were enough physical
resources. In some ways that proved to be the case (see contradiction C
section5.2.2), there are enough resources for the current mode of practice.
However if there is a will to develop further to include a more varied use of ICT,
that will mean that more or even different kinds of resources are needed. In
order for pupils to use computers on a regular basis, the provision of one
computer for classroom and one computer room per school is not enough. It
has to be said here that since the start of this work that the available tools have
changed considerably, that is to say on the market but not in schools. With the
arrival of tablets and smart-phones initiatives have started in two schools one
with the Kindle and one with the iPad. At first glance it seems that especially
with the ipad the teachers are experimenting with quite new ways of practice.
I suggest that the scarcity of relevant DLRs is not exactly an incentive for
teachers to demand more computers, so an effort needs to be put into
developing a selection of relevant resources in Icelandic. The interventions gave
some indication about what features and characteristics successful resources
need (as summarised in section 7.3.1). The experience from the interventions
also suggests that DLRs need to have to be highly relevant to the intended
learning aims. As it is, the availability is poor. This study showed that DLRs may
be used for pupil benefit, but a greater variety of digital learning materials is
needed, including learning resources relevant to all fields of science.
The last consideration I put forward is about resources is that the choice and
provision needs to take notice of how and why they are to be used. The general
school policy in Iceland is very much centred on individualised learning. The
new general National Curriculum is built up around the Key Competences for
Lifelong Learning (OECD). Emphasis is placed on skills, creativity, literacy,
sustainability and pupil choice and autonomy. ICT can no longer be considered
in isolation (Watson, 2006). A shift of focus from technology to learner is in
- 178 -
order, where equipment is chosen and supplied because of learning and
educational benefits and affordances rather than techno-centric enthusiasm.
8.1.2. Conceptual tools
Bringing in new technology needs new ways of thinking about teaching, namely
what role ICT should play in schools. Ways of thinking may be referred to as an
instrumentality, and if we want to take advantage of the whole potential of ICT
for teaching and learning an instrumentality needs to be developed. Developing
this instrumentality is a task facing the whole system: learners, teachers and
other stakeholders; ‘the learners construct a new object and concept for their
collective activity, and implement this new object and concept’ (Engeström and
Sannino, 2010 p. 2). The learners in this instance would be the teachers, who
need support and collaboration in order to learn together guided goals set out
by themselves, the curriculum and policy documents.
8.1.3. Collaboration and CPD
The last set of recommendations is about the need to build a set of conceptual
tools, through collaboration and CPD. The isolation and lack of knowledge
prevalent in the study was not expected. I had not anticipated how little
knowledge teachers have of the possibilities of employing ICT in their teaching.
The need to provide opportunities for collaboration, to facilitate flow and
construction of knowledge of ICT relevant practises for teachers is clear. The
interventions indicated that teachers need more than participating in small
scale interventions to change their practice. This underlined that change is a
gradual process.
Watson (2006) asks ‘Is the teacher a catalyst or inhibitor, an innovator or
conservator of the status quo?’ (p. 203). The conclusion that can be drawn from
this study is that teachers do differ in that regard. However, on the whole
Icelandic teachers seem to be ready for change. They have positive views
towards ICT, and they use what they have, but the system as a whole lacks the
common vision and infrastructure to take the next steps. Donnelly et al. (2011)
identified in their research that teachers differ in terms of technology
integration, from creative adapters with a strong sense of empowerment in
- 179 -
their teaching and wide PCK, to contented traditionalist with weak PCK,
resisting change, and in between selective adopters and inadvertent users.
They point out that different teachers dealing with different issues need
different approaches. There are indeed teachers who take it upon themselves
to learn and implement, but change on a systematic level needs official
support. In a small country like Iceland it should be easy to identify the pioneers
and support them in their endeavours and in inseminating their expertise for
more widespread school development.
Official initiatives to increase the use of ICT have only made it past the policy
papers to a limited extent. Younie (2006) reviewed official initiatives in the UK
and found them to be problematic:
Policy aims can be achieved if an awareness of the complexity of the implementation process is maintained, (by those implementing policy at the local level). This necessitates an understanding of the fact that it is a fluid, non-linear, reiterative process in which key factors are dynamically inter-related: namely, ICT needs to be implemented on multiple fronts, both materially in terms of an ICT infrastructure and culturally in terms of generating an ethos that values ICT for classroom practice (p. 399).
The initial provision of equipment had the characteristics of a movement from
the right (top-down) in the Four in Balance model (ten Brummelhuis and van
Amerongen, 2011) starting with ICT infrastructure and ending with leadership.
ten Brummelhuis and colleagues (2011) argue that the movement needs to be
from the left starting with a common vision and ending with the then
recommended provision of appropriate equipment. This corresponds with the
stepwise progress toward designing and implementing an instrumentality.
The notion of an instrumentality refers to the entire toolkit used in an activity, understood as a multi-layered constellation, which includes both material and conceptual elements (Engeström and Toiviainen, 2011, p. 36).
Here the activity would be using ICT for teaching and learning and the
instrumentality would include vision, expertise and skills in integrating digital
tools successfully into the learning process, most likely redesigning it at the
same time.
- 180 -
The learning process of developing an instrumentality will not happen by itself
nor with individual teachers. Though teachers are willing and able this is not
enough. Research has suggested that one characteristic of management in high
ICT using countries is a bottom up change-orientation, where teachers and/or
students instigate change (Pelgrum and Voogt, 2009). Similarly Fullan (2007)
suggests that the initiative for successful change needs to come from both the
bottom and the top.
This was also the approach used in the OECD DLR study. Country coordinators
were asked to find examples of both policy and practice and see whether
together they have some sort of systemic effect on education (Macdonald,
2008a). One of the weakest links in Iceland was the provision of grants,
particularly follow-up support, to projects that had shown themselves to be
successful. A financial basis for maintaining innovate ICT work and the
production of DLRs was not available. Figure 8-1 in that spirit does not show a
linear process but an interwoven circular motion where the initiative may come
from any direction and all elements have effect upon each other.
The question is then whose responsibility it should be to initiate collaboration
and CPD overall. A recent report from Ministry of Science, Education and
Culture (2010) states that it is the responsibility of almost all stakeholders to be
responsible for CPD and school development including the ministry and the
individual teacher. Though in practice, it is the headteacher in each school that
is responsible for the school curriculum and CPD.
There are many overlapping reforms such as anti-bullying, restitution, inclusion,
individualised learning and fewer initiatives from authorities on ICT
implementation. Previous ministers seem to have placed more emphasis on
technology with numerous policy documents (see introduction). Now ICT has
not even made it as a ‘pillar’ in the new curriculum, though it is separate in the
original OECD documents. Still ICT, cloaked as technology literacy, has found its
way there, and there is an emphasis on applied and integrative science and
there is a great emphasis on creativity and sustainability.
- 181 -
As a result of this thesis steps have already been taken to build a community of
teachers with the help of online environments and two grants. An ongoing
series of workshops was started around different themes with presentations
from both practicing teachers and lecturers from the University of Iceland. A
Facebook group was started in spring 2011 and in August 2012 had around 100
members, who share ideas and resources, debate, ask for and give advice.
Fullan (2007) states that communities of practice have not really taken off with
any depth or spread. In the few years since he stated that social media has
flourished exponentially, making it far easier at least to grow but to what
depths the learning and interactions an online community of science teachers
may reach is yet to be seen. I believe that as teachers become used to going to
an online community for advice and reflection social media may greatly support
CPD by providing opportunities and resources for learning and cooperation
when, and if, needed.
8.2. Recommendations for further research
This study did not give clear indications as to how or to what extent teacher
beliefs and attitudes affect their ICT use. One of the side roads that this thesis
could have gone towards is exploring further teachers’ attitudes towards work,
including ‘going the extra mile’ and why we prioritise so differently (see section
5.1.5). Issues around efficacy, ambition, incentives and why some are willing to
put in a little effort to implement changes and innovation but not all are of
interest. Others have also suggested that more work is needed in that area
(Ertmer, 2005; Mansour, 2009). This recommendation is repeated here but also
emphasising the need to explore to what extent those beliefs may be
influenced.
The intervention part of this study showed that existing DLRs may be used in
science teaching with some positive outcomes. Evaluation of usefulness of the
most common uses found in this study has not been carried out. It would be
beneficial for future practice to have an inkling as to whether these uses are
benefitting pupils in the way intended. Especially since the new National
Curriculum seems to expect further independent pupil work. It is clear however
- 182 -
that the resources and the vast array of digital tools are expanding
exponentially. After my experience with the quasi-experimental interventions it
is my contention that getting teachers involved in research with a design based
(see for example Juuti and Lavonen, 2006) element would be more sensible .
Working with a community of teachers may give opportunities for short
research informed studies promoting discussion and reflection with action
research elements. This would at the same time facilitate a development of a
common vision for ICT use in teaching with teachers collaboratively trying out
innovative ICT uses reflect on them and report to colleagues. This would
provide a more systematic recording of elements of the resources and the way
they are employed in teaching and what needs amendment.
8.3. Contributions
This thesis has provided a comprehensive overview in regard to ICT use in lower
secondary science teaching in Iceland, from the availability of resources and
how they are used to teacher and pupil attitudes towards the current practices.
Such a comprehensive overview was not available before and will prove a
valuable addition to existing literature on ICT implementation and school
development.
This study highlighted the factors that affect Icelandic teachers in their
technology integration. This work has established that implementing
technology is a complicated process and that the conditions that affect
teachers are numerous. There is rich potential for using ICT in science teaching
but also barriers that need to be overcome. Not one actor can be held
responsible for low technology integration, all stakeholders need to take an
invested interest and commit to further development.
In this thesis I used cultural historical activity theory to analyse and reflect on
aspects of teachers’ lives and their own practice. This use of activity theory
shed light on aspects that otherwise might have been overlooked or
misinterpreted. Methodologically, this study shows the value of collecting
different kinds of data to be able to compare and contrast qualitative and
quantitative data to give a rich description of a complex reality.
- 183 -
Last but not least the importance of teachers was emphasised as they proved
to be just as important and in some cases more important than the resources
used. This is important evidence that this is still the case. ICT implementation
has often been characterised by bringing in equipment and expecting teachers
to just take to it like fish to water (Cuban, 2001). That has not happened and my
study is a timely reminder in times of rapid technology influx that a sound TPKC
does not emerge by itself for majority of teachers.
8.4. Concluding remarks
Böhm (2004) said ‘Frequently investigators experience difficulties in sticking to
the central proposition of the investigation because of the ‘surfeit of important
details’’ (p. 274). At the beginning of analysing the interviews, I found that
teachers had spoken about all different kind of things other than those I had
asked about. For example, I asked about what resources they needed and they
would start talking about practical work and outdoor education. Being a novice
interviewer, I found this all really interesting and got side-tracked. Now at the
end of this road, I wonder whether this was not also a sign of the urgency or
better yet lack of urgency that teachers view ICT use. Maybe other matters are
far more urgent? Maybe teachers are more concerned with practical work,
assessment, classroom management and other things they started talking
about. Or maybe this is also a sign of the lack of knowledge that I found, that by
teachers not knowing about the affordances and benefits of ICT in teaching
science they do not realise the urgency of the matter!
My study has shown that ICT and DLRs may be used for pupil benefit but that it
also takes skills and knowledge on the teachers’ part. The effect that teacher
expertise has on learning may not be underestimated. In the coming years I will
do my best to implement the recommendations put forth in this thesis to
nurture my own and my colleagues expert TPKC so we may bring Icelandic
schools into the 21st century with innovative technology rich science teaching
and learning.
- 184 -
"Computers are not magic, teachers are magic."
~Craig R. Barrett, Intel Chief Executive Officer (Barrett, 2005)
- 185 -
Bibliography
Agung, S. and Schwartz, M. S. (2007). Students' Understanding of Conservation of Matter, Stoichiometry and Balancing Equations in Indonesia. International Journal of Science Education, 29, 1679 - 1702.
Ágústsdóttir, J. and Pálsdóttir, A. (2011). Skólaþróun í skugga kreppu: Sýn fjögurra skólastjóra í grunnskólum Reykjanesbæjar á áhrif efnahagskreppunnar á skólaþróun [School development in financial crisis: Perspectives of four headteacers on how the financial crisis has affected school development]. Netla, Ráðstefnurit Netlu – Menntakvika 2011
Ardac, D. and Sezen, A. H. (2002). Effectiveness of Computer-Based Chemistry Instruction in Enhancing the Learning of Content and Variable Control Under Guided Versus Unguided Conditions. Journal of Science Education and Technology, 11, 39-48.
Baggott, L. and Nichol, J. (1998). Multimedia simulation: a threat to or enhancement of practical work in science education? In: Wellington, J. (ed.) Practical Work in School Science. Which way now ? London, New York: Routledge.
Baggott La Velle, L., McFarlane, A. and Brawn, R. (2003). Knowledge transformation through ICT in science education: A case study in teacher-driven curriculum development. British Journal of Educational Technology 34, 183 - 199.
Baggott La Velle, L., Mcfarlane, A., John, P. D. and Brawn, R. (2004). According to the promises: the subculture of school science, teachers' pedagogic identity and the challenge of ICT. Education, Communication & Information, 4, 109 - 129.
Barrett, C. (2005). World summit on the information sociecty: Statement from Intel Corporation [Online]. Tunis: International Telecommunication Union. Available: http://www.itu.int/wsis/tunis/statements/docs/ps-intel-opening/1.html [Accessed January 5th 2012].
Barton, R. (1997). Computer-aided graphing: a comparative study. Journal of Information Technology for Teacher Education, 6, 59-72.
Bennett, J. (2003). Teaching and learning science, London, Continuum. Bingimlas, K. A. (2009). Barriers to the successful integration of ICT in teaching
and learning environments: A review of the literature. Eurasia Journal of Mathematics, Science & Technology Education, 5, 235-245.
Bjarnadóttir, B. H., Símonardóttir, H. and Garðarsdóttir, R. B. (2007). Staða náttúrufræðikennlu í grunnskólum landins, Lokaskýrsla [Status of science Education in Icelandic primary and lower secondary schools, final report]. Reykjavík: Verkefna og námsstyrkjasjóður FG og SÍ Reykjavík.
Bjarnadóttir, U. B. (2007). Þróunarverkefni Árbæjarskóla og Skólavörubúðarinnar í náttúruvísindum, [Report of the Development project in Árbæjarschool and School supply store] [Online]. Available: http://www.arbaejarskoli.is/files/Yfirlitssk%C3%BDrsla._2006-2007_1694942626.doc and
- 186 -
http://www.arbaejarskoli.is/skolastarf/throunarverkefni-arbaejarskola-og-skolavorubudar-i-natturuvisindum/ [Accessed August 31 2008].
Bloor, M., Frankland, J., Thomas, M. and Robson, K. (2001). Focus groups in social research, London - Thousand Oaks - New Delhi, Sage Publications Ltd.
Böhm, A. (2004). Theoretical Coding: Text Analysis in Grounded Theory. In: Flick, U., Kardoff, E. v. & Steinke, I. (eds.) A companion to qualitative research. London, Thousand Oaks, New Delhi: SAGE.
Borko, H. (2004). Professional development and teacher learning: Mapping the terrain. Educational Researcher, 33, 3-15.
Bracewell, R. J., Sicilia, C., Park, J. and Tung, I. (2007). The problem of wide-scale implementation of effective use of information and communication technologies for instruction: Activity theory perspectives. Annual meeting of AERA, Tracking adoptation and non-adoptation of ICT activities by teachers. Chicaco.
Brandt, H. and Johansen, B. L. (2008). It og naturfag i den danske grundskole. The 9th Nordic Research Symposium on Science Education 11th – 15th June 2008 Reykjavík Iceland
Capacent (2007). Úttekt á framkvæmd stefnunnar um upplýsingasamfélagið 2004-2007: Auðlindir í allra þágu Nóvember 2007 [Report on implementation of the policy on the Information Society 2004-2007: Resources to Serve Everyone]. Reykjavík: Forsætisráðuneytið.
Cavas, B., Cavas, P., Karaoglan, B. and Kisla, T. (2009). A study on science teachers' attitudes toward information and communication technologies in education. The Turkish Online Journal of Educational Technology, 8, 20-32.
Charalambous, K., Ioannou, I. and Tsounda, M. (2011). Principals’ role in supporting their staff to integrate ICT in primary education. In: Bastiaens, T. & Ebner, M. (eds.) World Conference on Educational Multimedia, Hypermedia and Telecommunications 2011. Lisbon, Portugal: AACE.
Clinch, J. and Richards, K. (2002). How can the Internet be used to enhance the teaching of physics? . Physics Education, 37, 109-114
Cohen, L., Manion, L. and Morrison, K. (2007). Research methods in education, London and New York, Routledge.
Cox, M. (2000). Information and communications technologies: their role and value for science education. In: Monk, M. & Osborne, J. (eds.) Good practice in Science Teaching, What research has to say. Buckingham Philadelphia: Open University Press.
Cox, M., Preston, C. and Cox, K. (1999). What factors support or prevent teachers from using ICT in their classrooms? British Educational Research Association Conference. Sussex.
Cuban, L. (2001). Oversold and underused: Computers in the classroom, Harvard University Press.
Davis, F. D. (1989). Perceived Usefulness, Perceived Ease of Use, and User Acceptance of Information Technology. MIS Quarterly, 13, 319-340.
- 187 -
De Lange, T. and Lund, A. (2008). Digital Tools and Instructional Rules: A study of how digital technologies become rooted in classroom procedures. Outlines. Critical Practice Studies, 2, 36-58.
Donnelly, D., McGarr, O. and O’Reilly, J. (2011). A framework for teachers’ integration of ICT into their classroom practice. Computers & Education, 57, 1469-1483.
Drent, M. and Meelissen, M. (2008). Which factors obstruct or stimulate teacher educators to use ICT innovatively? Computers & Education, 51, 187-199.
Drever, E. (2003). Using semi-structured interviews in small-scale research: a teacher's guide, Glasgow, Scottish Council for Research in Education.
Elfarsdóttir, G. ó. (2005). Hafa viðhorf skólastjórnenda áhrif á framgang upplýsingatækninnar? [Do the attitudes of school management affect the progress of ICT in schools?]. Unpublished Masters Thesis, University of Iceland.
Engeström, Y. (1987). Learning by expanding: An activity-theoretical approach to developmental research, Orienta-Konsultit Oy Helsinki, Finland.
Engeström, Y. (2001). Expansive learning at work: Toward an activity theoretical reconceptualization. Journal of education and work, 14, 133-156.
Engeström, Y. and Sannino, A. (2010). Studies of expansive learning: Foundations, findings and future challenges. Educational Research Review, 5, 1-24.
Engeström, Y. and Toiviainen, H. (2011). Co-configurational design of learning instrumentalities. In: Ludvigsen, S., Lund, A., Rasmussen, I. & Säljö, R. (eds.) Learning across sites: new tools, infrastructures and practices. London: Routledge.
Ertmer, P. A. (1999). Addressing first-and second-order barriers to change: Strategies for technology integration. Educational Technology Research and Development, 47, 47-61.
Ertmer, P. A. (2000). Responsive Instructional Design: Scaffolding the Adoption and Change Process. 23rd National Convention of the Association for Educational communications and Technology. Denver.
Ertmer, P. A. (2001). Responsive Instructional Design: Scaffolding the Adoption and Change Process. Educational Technology, 41, 33-38.
Ertmer, P. A. (2005). Teacher pedagogical beliefs: The final frontier in our quest for technology integration? Educational Technology Research and Development, 53, 25-39.
Ertmer, P. A. and Ottenbreit-Leftwich, A. T. (2010). Teacher technology change: How knowledge, confidence, beliefs, and culture intersect. Journal of research on Technology in Education, 42, 255-284.
Fishbein, M. and Ajzen, I. (1975). Belief, attitude, intention and behaviour: An introduction to theory and research, Reading, MA, Addison-Wesley.
Forsætisráðuneytið (2008). Netríkið ísland: Stefna ríkisstjórnar Íslands um upplýsingasamfélagið[ Iceland the e-Nation: Icelandic government policy on the information society 2008-2012. ].
Fullan, M. (2007). The new meaning of educational change, New York, Teachers College Press.
- 188 -
Galanouli, D., Murphy, C. and Gardner, J. (2004). Teachers' perceptions of the effectiveness of ICT-competence training. Computers & Education, 43, 63-79.
Gall, J. P., Gall, M. S. D. and Borg, W. R. (1999). Applying Educational Research: A Practical Guide, 4th edition, New York, NY, Longman.
Gorard, S. (2007). Mixing methods is wrong: An everyday approach to educational justice. British Educational Research Association, London.
Gorard, S. and Taylor, C. (2004). Combining methods in educational and social research, Maidenhead, Open University Press.
Granger, C., Morbey, M., Lotherington, H., Owston, R. and Wideman, H. (2002). Factors contributing to teachers' successful implementation of IT. Journal of Computer Assisted Learning, 18, 480-488.
Guðmundsdóttir, M. L., Sigfússon, J., Kristjánsson, Á. L., Pálsdóttir, H. and Sigfúsdóttir., I. D. (2010). The Nordic youth research among 16 to 19 year old in Åland Islands, Denmark, Faroe Islands, Finland, Greenland, Iceland, Norway and Sweden. Reykjavík: ICSRA Icelandic Centre for Social Research and Analysis (Rannsóknir & Greining).
Guðmundsdóttir, S. (1999). Plægja þarf akurinn: athugun á tölvunotkun fimmtán kennara í sérkennslu [The field needs plowing: ICT use of fifteen SEN teachers]. Unpublished M.Ed. Thesis, Kennaraháskóli Íslands.
Hakkarainen, K., Ilomäki, L., Lipponen, L., Muukkonen, H., Rahikainen, M., Tuominen, T., Lakkala, M. and Lehtinen, E. (2000). Students' skills and practices of using ICT: results of a national assessment in Finland. Computers & Education, 34, 103-117.
Halldórsson, A. M., Ólafsson, R. F., Níelsson, Ó. H. and Björnsson, J. K. (2010). Staða íslenskra grunnskóla: Námsárangur og skýringarþættir í PISA 2006. OECD/Námsmatsstofnun.
Harrison, C., Comber, C., Fisher, T., Haw, K., Lewin, C., Lunzer, E., McFarlane, A., Mavers, D., Scrimshaw, P. and Somekh, B. (2002). ImpaCT2: The impact of information and communication technologies on pupil learning and attainment, Coventry, British Educational Communications and Technology Agency (BECTA).
Hattie, J. (2009). Visible learning: A synthesis of over 800 meta-analyses relating to achievement, London, Routledge.
Haydn, T. and Barton, R. (2008). ‘First do no harm’: Factors influencing teachers’ ability and willingness to use ICT in their subject teaching. Computers & Education, 51, 439-447.
Hennessy, S., Ruthven, K. and Brindley, S. (2005). Teacher perspectives on integrating ICT into subject teaching: commitment, constraints, caution, and change. Journal of Curriculum Studies, 37, 155-192.
Hennessy, S., Twigger, D., Driver, R., O'Shea, T., O'Malley, C. E., Byard, M., Draper, S., Hartley, R., Mohamed, R. and Scanlon, E. (1995). A classroom intervention using a computer-augmented curriculum for mechanics. International Journal of Science Education, 17, 189 - 206.
Hew, K. and Brush, T. (2007). Integrating technology into K-12 teaching and learning: current knowledge gaps and recommendations for future research. Educational Technology Research and Development, 55, 223-252.
- 189 -
Holding, B. (1985). Aspects of secondary students' understanding of elementary ideas in chemistry. Summary report CLIS project CSSME, University of Leeds.
Holmarsdottir, H. B. (2001). Icelandic: A Lesser-Used Language in the Global Community. International Review of Education/Internationale Zeitschrift für Erziehungswissenschaft/Revue internationale l'éducation, 47, 379-394.
Hsu, Y.-S. and Thomas, R. A. (2002). The impacts of a web-aided instructional simulation on science learning. International Journal of Science Education, 24, 955 - 979.
Issroff, K. and Scanlon, E. (2001). Case studies revisited: what can Activity Theory offer? Proceeding of First Eruo-CSCL Conference. Maastricht, Netherlands.
Jakobsdóttir, S. (2001). Some effects of information and communications technology on teaching and learning in Iceland. Journal of Information Techology for Teacher Education, 10, 87 - 100.
Jóhannsdóttir, T. (1999). Frumkvöðlar og annað fólk í ólgusjó upplýsinga. Um stöðu frumkvölða í upplýsingatækni í skólastarfi og mikilvægi fólks og menningar í breytingaferli. [Pioneers and other people in the torrent of information: On the position of pioneers in ICT implementation in schools and the importance of people and culture in the change process.]. Uppeldi og menntun, 107-118.
Jóhannsdóttir, T. (2009). Deviations from the convectional.´Contradictions as sources of change in teacher education In: Ellis, V., Edwards, A. & Smagorinsky, P. (eds.) Cultural-historical Perspectives on teacher Education and Development London and New York: Routledge.
Jóhannsson, ó. (2008). „Það er alltaf einhver í skólanum sem kann“: Gluggað í reynslu nokkurra kennara af glímunni við að tileinka sér upplýsingatækni í starfi ['There is always somebody in the school who knows how': Exploring the experience of few teachers adoption of ICT]. M.Ed. Thesis, University of Iceland, Reykjavík [Online] Available: http://hdl.handle.net/1946/1457 [Accessed July 2 2012].
Juuti, K. and Lavonen, J. (2006). Design-Based Research in Science Education: One Step Towards Methodology. NorDiNa, 4, 54-68.
Kaptelinin, V. and Nardi, B. A. (2006). Acting with technology, Cambridge, MIT Press.
Karasavvidis, I. (2009). Activity Theory as a conceptual framework for understanding teacher approaches to Information and Communication Technologies. Computers & Education, 53, 436-444.
Kennewell, S., Beauchamp, G., Jones, S., Meiring, L., Morgan, A., Norman, N., Parkinson, J., Tanner, H. and Thomas, G. (2007). The use of ICT to improve learning and attainment through interactive teaching. Swansea: Swansea Metropolitan University.
Kennisnet Foundation. (2011). Four in Balance Monitor 2011: ICT in Dutch primry, secondary and vocational education [Online]. Zoetermeer: Kennisnet. Available: http://downloads.kennisnet.nl/algemeen/Vier-in-balans-monitor-2011-Engelse-versie-internet.pdf [Accessed January 11th 2012].
- 190 -
Kim, M., Yoo, K.-H., Park, C. and Yoo, J.-S. (2010). Development of a Digital Textbook Standard Format Based on XML Advances in Computer Science and Information Technology. In: Kim, T.-h. & Adeli, H. (eds.). Springer Berlin / Heidelberg.
Krueger, R. A. and Casey, M. A. (2000). Focus groups: A practical guide for applied research, Thousand Oaks-London-New Delhi, Sage.
Kuutti, K. (1995). Activity Theory as a potential framework for human-computer interaction research. In: Nardi, B. (ed.) Context and Consciousness: Activity Theory and Human Computer Interaction. Cambridge: MIT Press.
Lavonen, J., Juuti, K., Aksela, M. and Meisalo, V. (2006). A Professional Development Project for Improving the Use of ICT in Science Teaching. Technology, Pedagogy and Education, 15, 159-174.
Lavonen, J., Juuti, K. and Meisalo, V. (2003). Designing a user-friendly microcomputer-based laboratory package through the factor analysis of teacher evaluations. International Journal of Science Education, 25, 1471—1487.
Lawson, T. and Comber, C. (1999). Superhighways technology: personnel factors leading to successful integration of information and communications technology in schools and colleges. Journal of Information Techology for Teacher Education, 8, 41-53.
Leach, J. (1995). Progression in Understanding of some Ecological Concepts in Children aged 5 - 16. Unpublished PhD Thesis University of Leeds.
Lewis, J. and Wood-Robinson, C. (2000). Genes, chromosomes, cell division and inheritance - do students see any relationship? International Journal of Science Education, 22, 177 - 195.
Lim, C. and Chai, C. (2004). An activity-theoretical approach to research of ICT integration in Singapore schools: Orienting activities and learner autonomy. Computers & Education, 43, 215-236.
Linn, M. C., Clark, D. and Slotta, J. D. (2003). WISE design for knowledge integration. Science Education, 87, 517-538.
Livingstone, S. (2011). Critical reflections on the benefits of ICT in education. Oxford Review of Education, 1-16.
Lög um grunnskóla (2008). [Laws on compulsory schools]. nr. 91. Lund, A. B., Cyvin, J. and Sundt, G. (2008 ). Naturfaglæreren i møtet med eleven
som IKT-bruker (The nature science teacher’s meeting with the pupil as an ICT user). The 9th Nordic Research Symposium on Science Education 11th - 15th June 2008. Reykjavík Iceland.
Macdonald, A. (2008a). Digital learning resources as systemic innovation. Background report. Iceland. Report prepared for the Ministry of Education, Science and Culture, Reykjavík and OECD CERI /Centre for Research and Innovation.
Macdonald, A., Halldórsson, A. M., Pálsdóttir, A., Jónsdóttir, S. R. and Pétursdóttir, S. (2010). Collective efficacy in a changing world: teacher agency in Icelandic schools. . Papers presented at a symposium held at , SERA (Scottish Educational Research Association) Annual Conference. Stirling, Scotland, 25-26 November 2010.
- 191 -
Macdonald A. (project leader) (May 2011). EmergeCTE: Emerging curriculum areas and collective teacher efficacy. New proposal to The Icelandic Research Fund 2012. Appendix A (Detailed project description).
Macdonald, M. A. (2008b). Intentions and reality: science and technology education in Iceland. Final report submitted to the Research Fund of Iceland. Reykjavík: Kennaraháskóli Íslands.
Mansour, N. (2009). Science teachers’ beliefs and practices: Issues, implications and research agenda. International Journal of Environmental & Science Education, 4, 25-48.
Marbach-Ad, G., Rotbain, Y. and Stavy, R. (2008). Using computer animation and illustration activities to improve high school students' achievement in molecular genetics. Journal of Research in Science Teaching, 45, 273-292.
McFarlane, A. and Sakellariou, S. (2002). The Role of ICT in Science Education. Cambridge Journal of Education, 32, 219 - 232.
McLaughlin, M. W. and Talbert, J. E. (1993). Introduction: New Visions of Teaching. In: Cohen, D. K., McLaughlin, M. W. & Talbert, J. E. (eds.) Teaching for Understanding: Challenges for Policy and Practice. San Francisco: Josey-Bass.
Meelissen, M. (2008). Computer attitudes and competencies among primary and secondary school students. In: Voogt, J. & Knezek, G. (eds.) International handbook of information technology in primary secondary education New York: Springer.
Mennta- og menningarmálaráðuneytið (2010). Skýrsla nefndar um endurskipulagningu endurmenntunar kennara [Committee report: Reorganisation of teacher continuous professional development]. Reykjavík: Ministry of education and culture.
Menntamálaráðuneytið (1996). Í krafti upplýsinga. Tillögur Menntamálaráðuneytisins um menntun, menningu og upplýsingatækni 1996-1999 [Powered by information: Suggestions of MSEC for education, culture and ICT for 1996-1999]. Reykjavík.
Menntamálaráðuneytið. (2007). Aðalnámsskrá grunnskóla náttúrufræði og umhverfismennt [National Curriculum: Science and Environment] [Online]. Available: <http://bella.mrn.stjr.is/utgafur/adalnamskra_grsk_natturufraedi-
umhverfismennt.pdf> [Accessed Desember 3rd 2007]. Meyvant Þórólfsson (2006). Náttúrufræðimenntun í grunnskólum : tillögur um
ráðgjöf, símenntun, mat, þróunarstarf og annan stuðning við kennara [Science in primary and lower secoandary schools: proposals for consultancy, CPD, assessment, school development and other support for teachers]. Commitee report for MSEC.
Ministry of Education Science and Culture (2001). Advantage for the Future Project Plan for e-Learning 2001-2003. Reykjavík: Menntamálaráðuneytið.
Ministry of Education Science and Culture (2005). Menntun kennara í stærðfræði- og náttúrufræðigreinum í grunn- og framhaldsskólum 2003-2004 [Education of Mathematic and science teachers in compulsory and
- 192 -
upper secondary schools 2003-2004]. Reykjavík: Menntamálaráðuneytið.
Mishra, P. and Koehler, M. (2006). Technological pedagogical content knowledge: A framework for teacher knowledge. The Teachers College Record, 108, 1017-1054.
Mumtaz, S. (2000). Factors affecting teachers' use of information and communications technology: a review of the literature. Technology, Pedagogy and Education, 9, 319-342.
Newton, L. and Rogers, L. (2003). Thinking frameworks for planning ICT in science lessons. School Science Review, 84, 113-120.
OECD/CERI. (2007). Digital learning resources as systemic innovation: Project outline and definitions [Online]. Centre for Educational Research and Innovation (CERI). Available: http://www.oecd.org/dataoecd/7/7/38777910.pdf [Accessed 13th June 2009].
OECD/CERI. (2008). OECD study on digital learning resources as systemic innovation. Country case report: Iceland. Final version. November 2008 [Online]. Available: http://www.oecd.org/dataoecd/10/7/41848715.pdf [Accessed 15th May 2011].
OFSTED (2002). ICT in schools: pupils’ achievement: progress report. HMI 423. London: HMSO for OFSTED
Ólafsson, R. F. and Björnsson, J. K. (2009). TALIS: Staða og viðhorf kennara og skólastjórnenda, Teaching and Learning International Study Reykjavík: Námsmatsstofnun.
Olson, J. (2000). Trojan horse or teacher’s pet? Computers and the culture of the school. Journal of Curriculum Studies, 32, 1-8.
Osborne, J. and Hennessy, S. (2003). Literature review in science education and the role of ICT: Promise, problems and future directions. A Report for NESTA Futurelab, 6.
Osborne, J., Simon, S. and Collins, S. (2003). Attitudes towards science: A review of the literature and its implications. International Journal of Science Education, 25, 1049-1079.
Papanastasiou, E. C., Zembylas, M. and Vrasidas, C. (2003). Can Computer Use Hurt Science Achievement? The USA Results from PISA. Journal of Science Education and Technology, 12.
Pelgrum, W. J. (2001). Obstacles to the integration of ICT in education: results from a worldwide educational assessment. Computers & Education, 37, 163-178.
Pelgrum, W. J. and Plomp, T. (1988). The IEA study 'Computers in education': A multi national longitudinal assessment. In: Lovis, F. & Tagg, E. D. (eds.) Computers in education Amsterdam: Elsevier Science Publishers.
Pelgrum, W. J. and Voogt, J. (2009). School and teacher factors associated with frequency of ICT use by mathematics teachers: Country comparisons. Education and Information Technologies, 14, 293-308.
Pintrich, P. R. (2003). A motivational science perspective on the role of student motivation in learning and teaching contexts. Journal of Educational Psychology, 95, 667.
- 193 -
Rodrigues, S. (2006). Pedagogic practice integrating primary science and elearning: the need for relevance, recognition, resource, reflection, readiness and risk. Technology, Pedagogy and Education, 15, 175-189.
Rodrigues, S. (2007). Factors that influence pupil engagement with science simulations: the role of distraction, vividness, logic, instruction and prior knowledge. Chemistry Education Research and Practice, 8, 1-12.
Rogers, L. and Finlayson, H. (2004). Developing successful pedagogy with information and communications technology: how are science teachers meeting the challenge? Technology, Pedagogy and Education, 13, 287-305.
Saka, A., Cerrah, L., Akdeniz, A. and Ayas, A. (2006). A Cross-Age Study of the Understanding of Three Genetic Concepts: How Do They Imagine the Gene, DNA and Chromosome? Journal of Science Education and Technology, 15, 192-202.
Saye, J. (1997). Technology and Educational Empowerment: Students´Perspectives. . Educational Technology Research and Development, 45, 5-25.
Scrimshaw, P. (2004). Enabling teachers to make successful use of ICT. Coventry: British Educational Communications and Technology Agency.
Shadish, W. R., Cook, T. D. and Campbell, D. T. (2002). Experimental and quasi-experimental designs for generalized causal inference, Boston, New York, Houghton, Mifflin and Company.
Shulman, L. (1987). Knowledge and Teaching: Foundations of the New Reform. Harvard Educational Review, 57, 1-23.
Sigþórsson, R. (2008). Mat í þágu náms : samræmd próf, kennsluhugmyndir kennara, kennsla og nám í náttúrufræði og íslensku í fjórum íslenskum grunnskólum [Assessment for learning: Standardized tests in four Icelandic schools] [Online]. PhD Thesis, Háskóli Íslands. Available: http://skemman.is/handle/1946/1973 [Accessed 7th December 2011].
Sigurgeirsson, I. (1992). The Role, Use and Impact of Curriculum Materials in Intermediate Level Icelandic Classrooms. Unpublished Ph.D. thesis., Falmer: University of Sussex
Solomon, G. E. A., Johnson, S. C., Zaitchik, D. and Carey, S. (1996). Like Father, Like Son: Young Children's Understanding of How and Why Offspring Resemble Their Parents. Child Development, 67, 151-171.
Somekh, B. (2008). Factors affecting teachers’ pedagogical adoption of ICT. In: Voogt, J. & Knezek, G. (eds.) International handbook of information technology in primary and secondary education. New York: Springer.
Songer, N. B. (2007). Digital Resources or Cognitive Tools: A Discussion of Learning Science with Technology. In: Abell, S. & Lederman, N. (eds.) Handbook of Research on Science Education. Mahwah, NJ: Erlbaum.
Spillane, J. P. (1999). External reform initiatives and teachers' efforts to reconstruct their practice: The mediating role of teachers' zones of enactment. Journal of Curriculum Studies, 31, 143-175.
Starfshættir í grunnskólum. (nd). Rannsókn: Starfshættir í grunnskólum 2009-2011. Niðurstöður úr spurningakönnun, öðrum hluta, til starfsmanna grunnskóla. [Research: Practices in compulsory schools 2009-2011. Results from survey, part II, school personel.] [Online]. Háskóli Íslands,
- 194 -
Háskólinn á Akureyri, Listaháskóli Íslands. Available: http://skrif.hi.is/starfshaettir/files/2010/08/Starfshattarannsokn_nidurstodur_vagn4.pdf [Accessed 15th September 2011].
Statistics Iceland. (ND). Statistics Iceland [Online]. Reykjavik. Available: http://hagstofa.is/ [Accessed 9th February 2011 2011].
Stavridou, H. and Solomonidou, C. (1998). Conceptual reorganization and the construction of the chemical reaction concept during secondary education. International Journal of Science Education, 20, 205 - 221.
Stefánsson, K. K. (2006). ‘I just don’t think it’s me’: A study on the willingness of Icelandic learners to engage in science related issues. Masters thesis,University of Oslo.
Steinberg, R. N. (2000). Computers in teaching science: To simulate or not to simulate? American Journal of Physics, 68, S37-S41.
Stevenson, I. (2008). Tool, tutor, environment or resource: Exploring metaphors for digital technology and pedagogy using activity theory. Computers & Education, 51, 836-853.
Strauss, A. L. and Corbin, J. (1990). Basics of qualitative research: grounded theory procedures and Techniques, Newbury Park, Sage.
Sugar, W., Crawley, F. and Fine, B. (2004). Examining teachers’ decisions to adopt new technology. Educational Technology and Society, 7, 201-213.
Tan, K. C., Hedberg, J. G., Koh, T. S. and Seah, W. C. (2006). Datalogging in Singapore schools: supporting effective implementations. Research in Science & Technological Education, 24, 111 - 127.
ten Brummelhuis, A. C. A. (1995). Models of educational change : the introduction of computers in Dutch secondary education. Phd Thesis, Universisty of Twente.
ten Brummelhuis, A. C. A. and van Amerongen, M. (2011). Four in Balance Monitor 2011: ICT in Dutch primary, secondary and vocational education. Zoetermeer: Kennisnet foundation.
Thompson, B. M. and Parrott, J. (2003). Investigating the Impact of the Authentic Science Experiences in the Information Technology in Science (ITS) Center for Teaching and Learning on Teachers’ Beliefs. ITS Working Paper. Department of Educational Psychology Texas A&M University
Þórólfsson, M., Macdonald, A. and Lárusson, E. (2007). Sýn fimm grunnskólakennara á nám og kennslu í náttúruvísindum. Tímarit Félags um menntarannsóknir 4.
Þórólfsson, M., Macdonald, A. and Lárusson, E. (2009). Náttúrufræðinám með stuðningi upplýsinga- og samskiptatækni. Tímarit um menntarannsóknir, 6, 85 - 106.
Tobin, K. and McRobbie, C. J. (1996). Cultural myths as constraints to the enacted science curriculum. Science Education, 80, 223-241.
Twining, P. (2002). Conceptualising Computer Use in Education: Introducing the Computer Practice Framework (CPF). British Educational Research Journal, 28, 95-110.
Venville, G., Gribble, S. J. and Donovan, J. (2005). An exploration of young children's understandings of genetics concepts from ontological and epistemological perspectives. Science Education, 89, 614-633.
- 195 -
Vilji og veruleiki (2008). Intentions and reality: science and technology education in Iceland, Final report Submitted to the Research Fund of Iceland
Wallace, R. M., Kupperman, J., Krajcik, J. and Soloway, E. (2000). Science on the Web: Students Online in a Sixth-Grade Classroom. The Journal of the Learning Sciences, 9, 75-104.
Watson, D. (2006). Understanding the relationship between ICT and education means exploring innovation and change. Education and Information Technologies, 11, 199-216.
Waycott, J. (2004). The appropriation of PDAs as learning and workplace tools: an activity theory perspective. Institute of Educational Technology, The Open University.
Wellington, J. (2004). Using ICT in teaching and learning science. In: Holliman, R. & Scanlon, E. (eds.) Mediating Science Learning through Information and Communications Technology. London and New York: Open University Press.
Wellington, J. and Britto, J. (2004). Learning science through ICT at home. In: Braund, M. & Reiss, M. (eds.) Learning Science Outside the Classroom. London: Routledge Falmer.
Wolff, B., Knodel, J. and Sittitrai, W. (1993). Focus groups and Surveys as Complementary Research Methods: A Case Example. In: Morgan, D. L. (ed.) Successful focus groups : advancing the state of the art. Newbury Park; London: Sage Publications.
Younie, S. (2006). Implementing government policy on ICT in education: Lessons learnt. Education and Information Technologies, 11, 385-400.
Zacharia, Z. and Anderson, O. R. (2003). The effects of an interactive computer-based simulation prior to performing a laboratory inquiry-based experiment on students’ conceptual understanding of physics. American Journal of Physics, 71, 618-629.
Zacharia, Z. C. (2007). Comparing and combining real and virtual experimentation: an effort to enhance students' conceptual understanding of electric circuits. Journal of Computer Assisted Learning, 23, 120-132.
- 196 -
Svava Pétursdóttir
List of abbreviations
CPD – continuous professional development
DLR – digital learning resources
ICT – information and communication technology
IWB - interactive whiteboard
OECD - Organisation for Economic Co-operation and Development
NCEM – National Centre for educational materials
MSEC – Ministry of science, education and culture
Menntamálaráðuneytið
Mennta- og menningarmálaráðuneytið
TPCK - technological pedagogical content knowledge

- 197 -
Appendices
There are two appendices
All resources used in this study may be found at:
http://svavap.wordpress.com/edd-thesis/
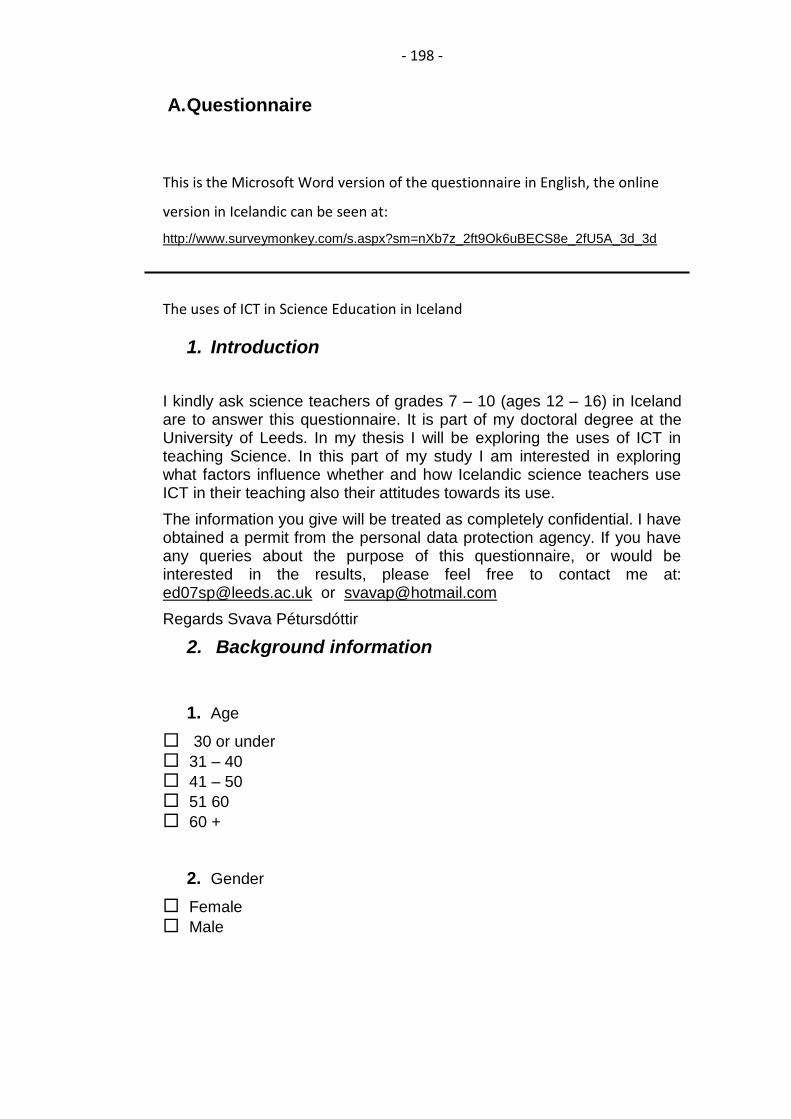
- 198 -
A. Questionnaire
This is the Microsoft Word version of the questionnaire in English, the online
version in Icelandic can be seen at:
http://www.surveymonkey.com/s.aspx?sm=nXb7z_2ft9Ok6uBECS8e_2fU5A_3d_3d
The uses of ICT in Science Education in Iceland
1. Introduction
I kindly ask science teachers of grades 7 – 10 (ages 12 – 16) in Iceland are to answer this questionnaire. It is part of my doctoral degree at the University of Leeds. In my thesis I will be exploring the uses of ICT in teaching Science. In this part of my study I am interested in exploring what factors influence whether and how Icelandic science teachers use ICT in their teaching also their attitudes towards its use.
The information you give will be treated as completely confidential. I have obtained a permit from the personal data protection agency. If you have any queries about the purpose of this questionnaire, or would be interested in the results, please feel free to contact me at: [email protected] or [email protected]
Regards Svava Pétursdóttir
2. Background information
1. Age
30 or under
31 – 40
41 – 50
51 60
60 +
2. Gender
Female
Male
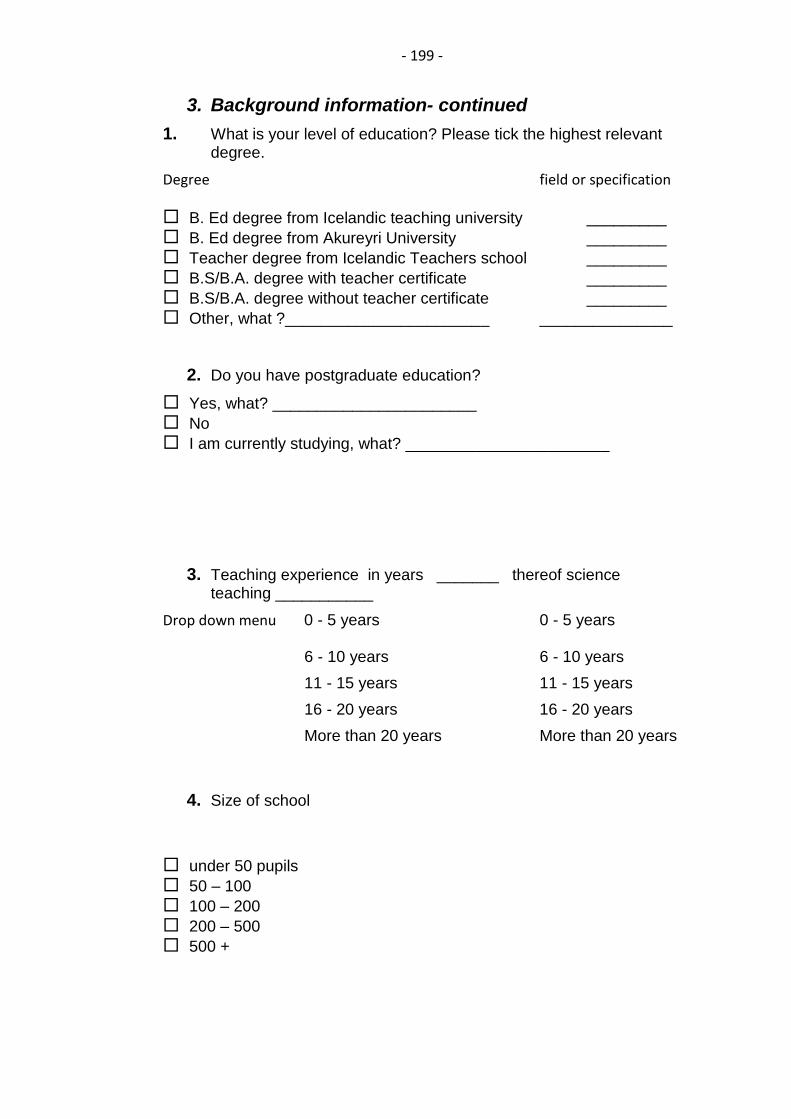
- 199 -
3. Background information- continued
1. What is your level of education? Please tick the highest relevant degree.
Degree field or specification
B. Ed degree from Icelandic teaching university _________
B. Ed degree from Akureyri University _________
Teacher degree from Icelandic Teachers school _________
B.S/B.A. degree with teacher certificate _________
B.S/B.A. degree without teacher certificate _________
Other, what ?_______________________ _______________
2. Do you have postgraduate education?
Yes, what? _______________________
No
I am currently studying, what? _______________________
3. Teaching experience in years _______ thereof science teaching ___________
Drop down menu 0 - 5 years 0 - 5 years
6 - 10 years 6 - 10 years
11 - 15 years 11 - 15 years
16 - 20 years 16 - 20 years
More than 20 years More than 20 years
4. Size of school
under 50 pupils
50 – 100
100 – 200
200 – 500
500 +

- 200 -
4. Use of ICT in science teaching
This section is about what kind of ICT resources are available in the school and whether you use them.
1. Hardware and facilities please tick the one best applicable. If you teach in many rooms answer for the one you use most.
N=123 Yes and I use it often
Yes and I use it occasionally
Yes but I never use it
No it is not available
There is a computer in my classroom
45% 19% 1% 36%
The school has provided me with a laptop
36% 17% 2% 45%
There are 2 or more computers in my classroom
10% 10% 0% 79%
There is an internet connection in my classroom
57% 35% 2% 7%
There is a projector in my classroom 42% 18% 1% 39%
There is an interactive whiteboard in my classroom
11% 1% 1% 87%
Students have access to computers in the school in library or other common areas
29% 49% 10% 12%
My school has a laptop trolley available
16% 18% 9% 58%
There is a computer room/cluster with enough computers for each student in a whole class
21% 41% 10% 27%
Web based learning environments eg. WebCT or http://moodle.org/
5% 4% 10% 81%
Other available computer hardware__________________
2. What kind of data loggers and other digital science equipment is available in your school?
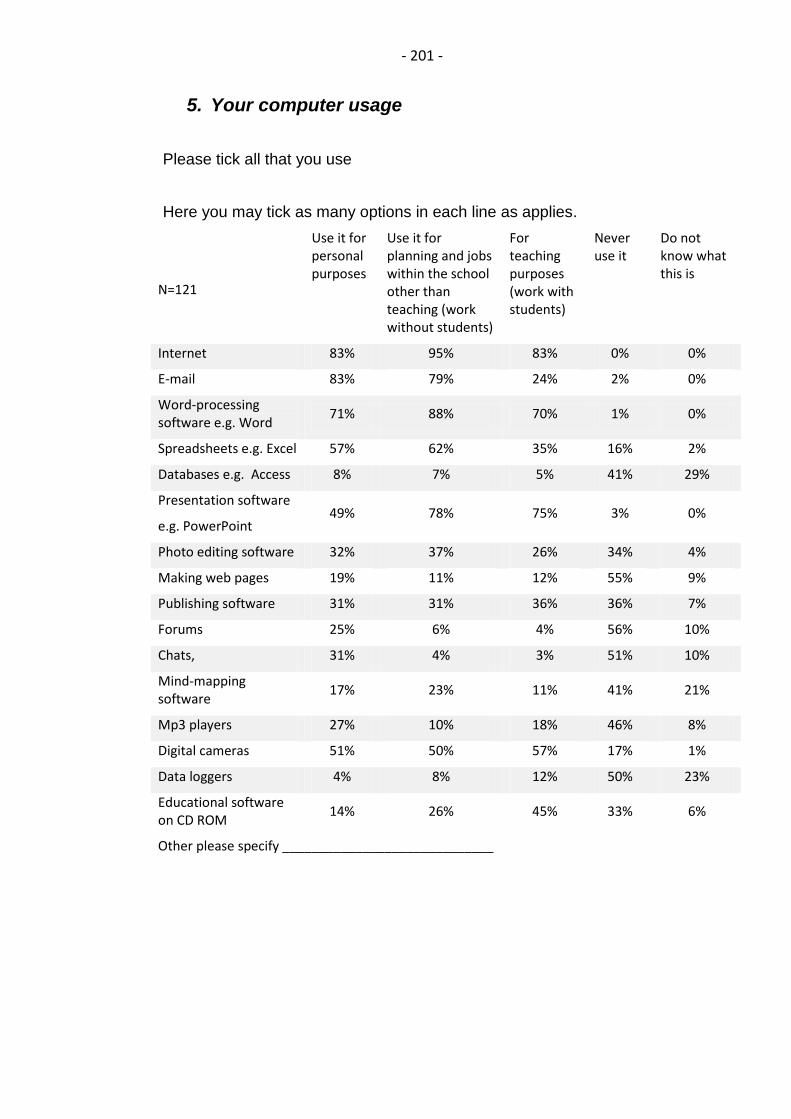
- 201 -
5. Your computer usage
Please tick all that you use
Here you may tick as many options in each line as applies.
N=121
Use it for personal purposes
Use it for planning and jobs within the school other than teaching (work without students)
For teaching purposes (work with students)
Never use it
Do not know what this is
Internet 83% 95% 83% 0% 0%
E-mail 83% 79% 24% 2% 0%
Word-processing software e.g. Word
71% 88% 70% 1% 0%
Spreadsheets e.g. Excel 57% 62% 35% 16% 2%
Databases e.g. Access 8% 7% 5% 41% 29%
Presentation software
e.g. PowerPoint 49% 78% 75% 3% 0%
Photo editing software 32% 37% 26% 34% 4%
Making web pages 19% 11% 12% 55% 9%
Publishing software 31% 31% 36% 36% 7%
Forums 25% 6% 4% 56% 10%
Chats, 31% 4% 3% 51% 10%
Mind-mapping software
17% 23% 11% 41% 21%
Mp3 players 27% 10% 18% 46% 8%
Digital cameras 51% 50% 57% 17% 1%
Data loggers 4% 8% 12% 50% 23%
Educational software on CD ROM
14% 26% 45% 33% 6%
Other please specify _____________________________
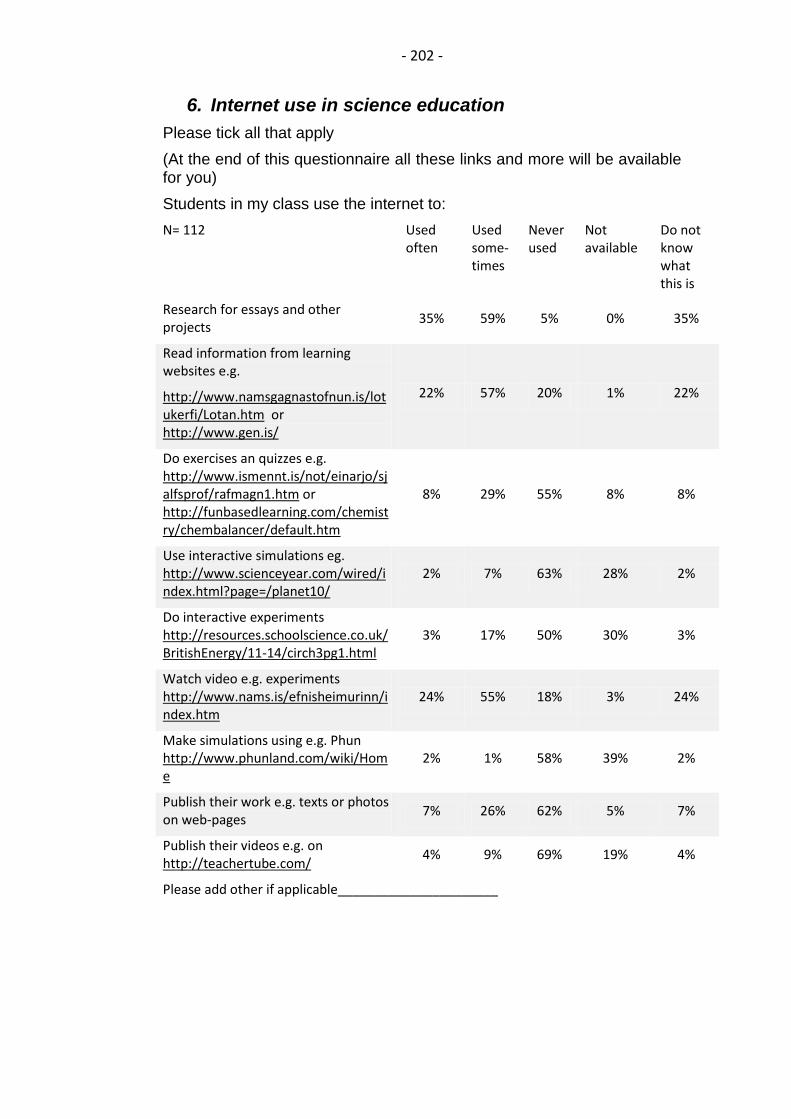
- 202 -
6. Internet use in science education
Please tick all that apply
(At the end of this questionnaire all these links and more will be available for you)
Students in my class use the internet to:
N= 112 Used often
Used some-times
Never used
Not available
Do not know what this is
Research for essays and other projects
35% 59% 5% 0% 35%
Read information from learning websites e.g.
http://www.namsgagnastofnun.is/lotukerfi/Lotan.htm or http://www.gen.is/
22% 57% 20% 1% 22%
Do exercises an quizzes e.g. http://www.ismennt.is/not/einarjo/sjalfsprof/rafmagn1.htm or http://funbasedlearning.com/chemistry/chembalancer/default.htm
8% 29% 55% 8% 8%
Use interactive simulations eg. http://www.scienceyear.com/wired/index.html?page=/planet10/
2% 7% 63% 28% 2%
Do interactive experiments http://resources.schoolscience.co.uk/BritishEnergy/11-14/circh3pg1.html
3% 17% 50% 30% 3%
Watch video e.g. experiments http://www.nams.is/efnisheimurinn/index.htm
24% 55% 18% 3% 24%
Make simulations using e.g. Phun http://www.phunland.com/wiki/Home
2% 1% 58% 39% 2%
Publish their work e.g. texts or photos on web-pages
7% 26% 62% 5% 7%
Publish their videos e.g. on http://teachertube.com/
4% 9% 69% 19% 4%
Please add other if applicable______________________
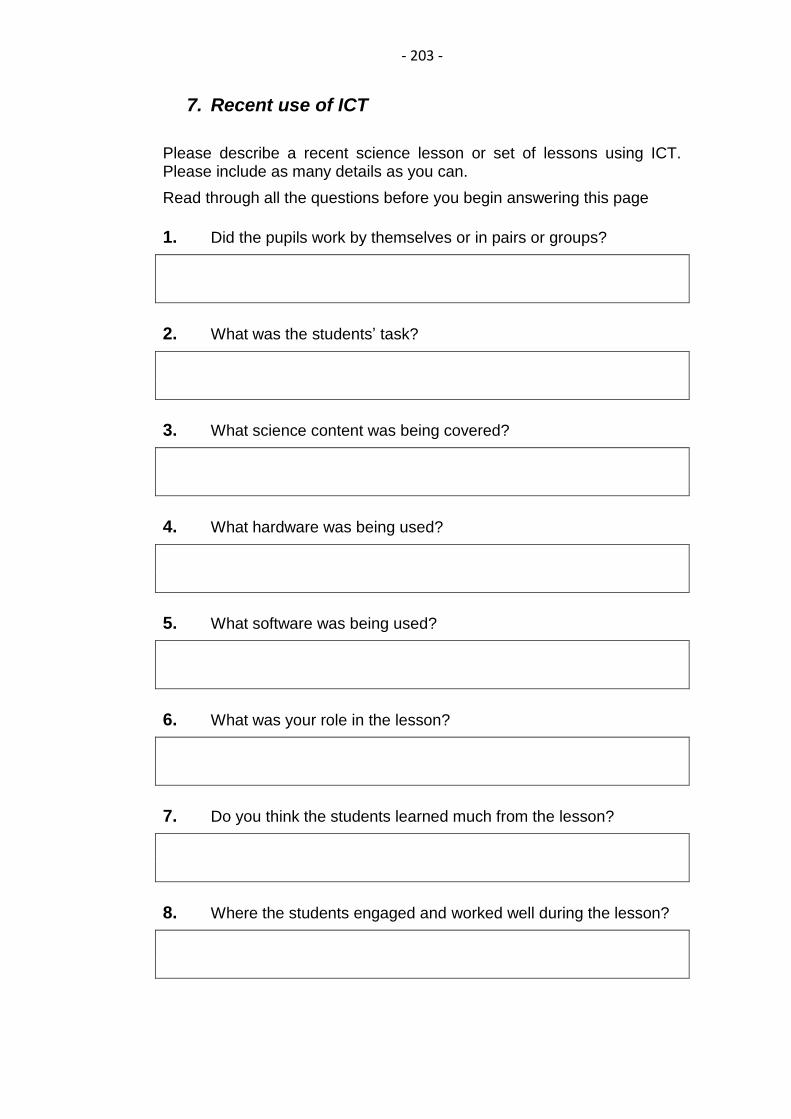
- 203 -
7. Recent use of ICT
Please describe a recent science lesson or set of lessons using ICT. Please include as many details as you can.
Read through all the questions before you begin answering this page
1. Did the pupils work by themselves or in pairs or groups?
2. What was the students’ task?
3. What science content was being covered?
4. What hardware was being used?
5. What software was being used?
6. What was your role in the lesson?
7. Do you think the students learned much from the lesson?
8. Where the students engaged and worked well during the lesson?

- 204 -
8. Factors that influence my use of ICT
1. What factors do you think make it easy for you and encourage you to employ ICT with pupils?
2. What factors do you think stop you or discourage you from employing ICT with pupils?

- 205 -
9. Support and assistance
Please tick everything you have access to
Science head of department/coordinator
Support of colleagues within the school
A supportive management team
ICT coordinator- consultant within the school
ICT coordinator outside the school
Support in setting up computer equipment
Support in using software
Support for preparation of practical work that includes computers
Support, assistance during practical work
Other __________________________________________________
10. Training and courses in using ICT in Science education
1. Have you had any training in using ICT in teaching generally?
Yes no
If people answer yes> go to question 2, if no > question 3
2. Please give more information about the training you have had
3. Have you had any training in using ICT in teaching Science?
Yes no
If people answer no > next section if Yes > question 4
4. Please give more information about the training you have had
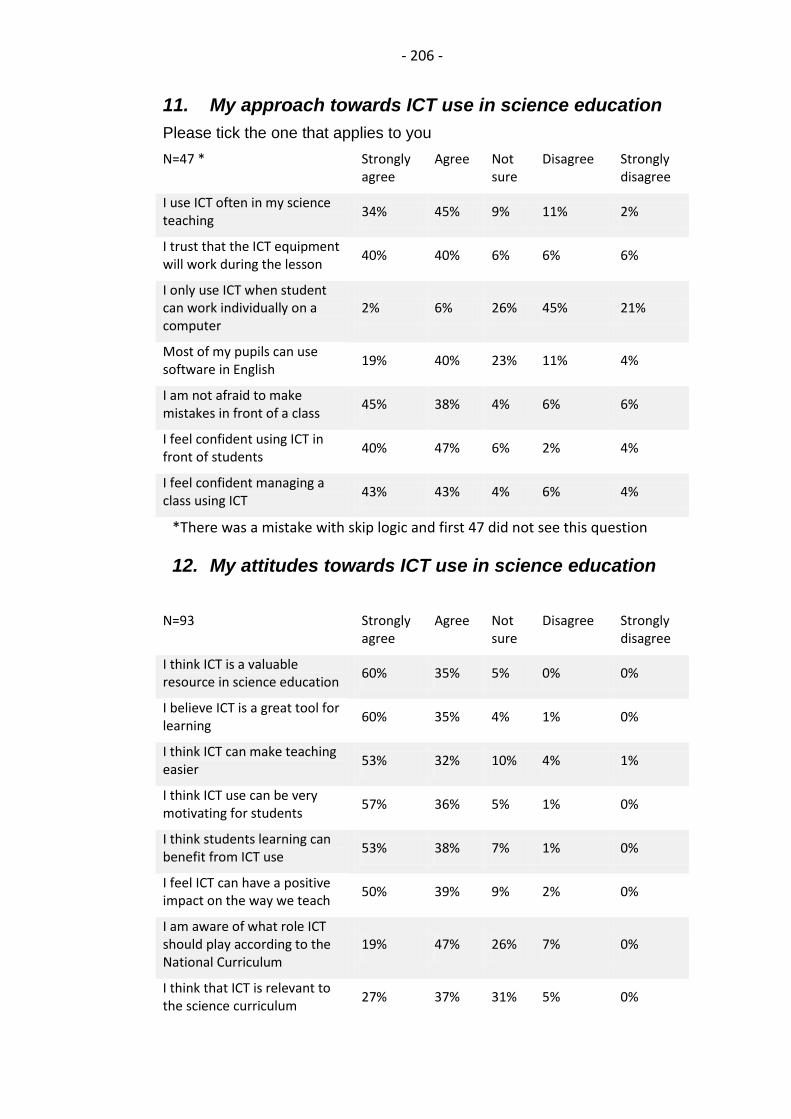
- 206 -
11. My approach towards ICT use in science education
Please tick the one that applies to you
N=47 * Strongly agree
Agree Not sure
Disagree Strongly disagree
I use ICT often in my science teaching
34% 45% 9% 11% 2%
I trust that the ICT equipment will work during the lesson
40% 40% 6% 6% 6%
I only use ICT when student can work individually on a computer
2% 6% 26% 45% 21%
Most of my pupils can use software in English
19% 40% 23% 11% 4%
I am not afraid to make mistakes in front of a class
45% 38% 4% 6% 6%
I feel confident using ICT in front of students
40% 47% 6% 2% 4%
I feel confident managing a class using ICT
43% 43% 4% 6% 4%
*There was a mistake with skip logic and first 47 did not see this question
12. My attitudes towards ICT use in science education
N=93 Strongly agree
Agree Not sure
Disagree Strongly disagree
I think ICT is a valuable resource in science education
60% 35% 5% 0% 0%
I believe ICT is a great tool for learning
60% 35% 4% 1% 0%
I think ICT can make teaching easier
53% 32% 10% 4% 1%
I think ICT use can be very motivating for students
57% 36% 5% 1% 0%
I think students learning can benefit from ICT use
53% 38% 7% 1% 0%
I feel ICT can have a positive impact on the way we teach
50% 39% 9% 2% 0%
I am aware of what role ICT should play according to the National Curriculum
19% 47% 26% 7% 0%
I think that ICT is relevant to the science curriculum
27% 37% 31% 5% 0%
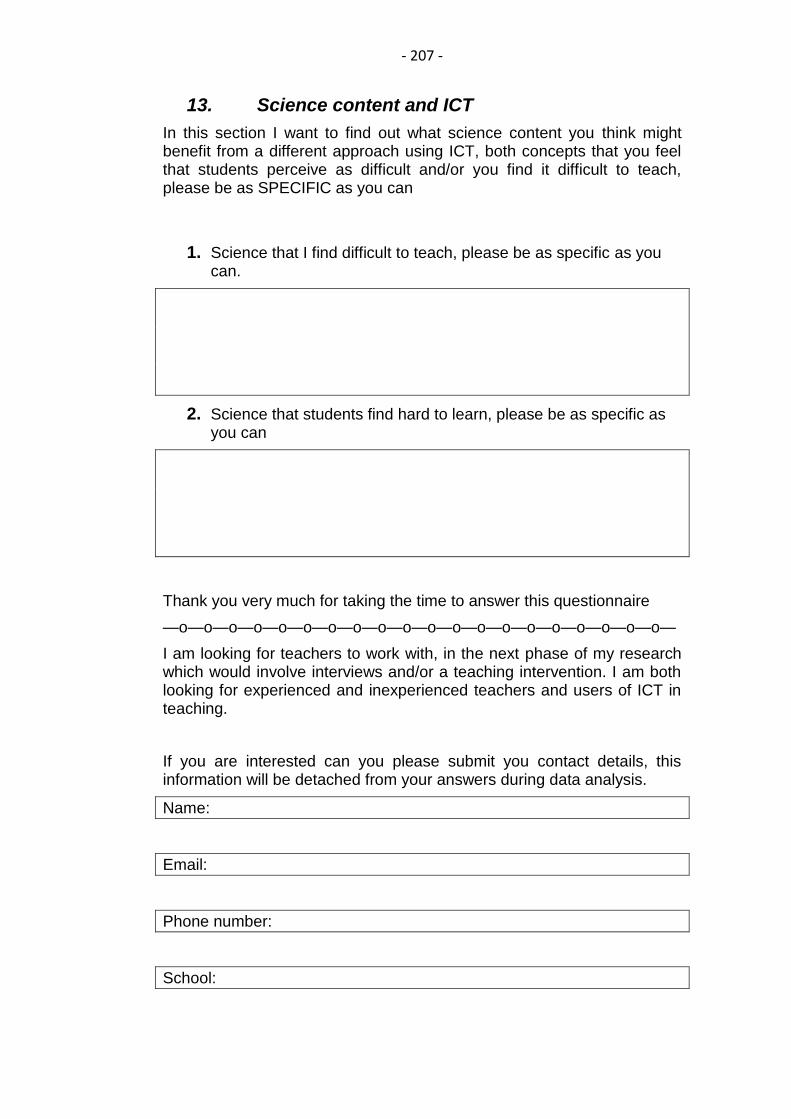
- 207 -
13. Science content and ICT
In this section I want to find out what science content you think might benefit from a different approach using ICT, both concepts that you feel that students perceive as difficult and/or you find it difficult to teach, please be as SPECIFIC as you can
1. Science that I find difficult to teach, please be as specific as you can.
2. Science that students find hard to learn, please be as specific as you can
Thank you very much for taking the time to answer this questionnaire
—o—o—o—o—o—o—o—o—o—o—o—o—o—o—o—o—o—o—o—o—
I am looking for teachers to work with, in the next phase of my research which would involve interviews and/or a teaching intervention. I am both looking for experienced and inexperienced teachers and users of ICT in teaching.
If you are interested can you please submit you contact details, this information will be detached from your answers during data analysis.
Name:
Email:
Phone number:
School:
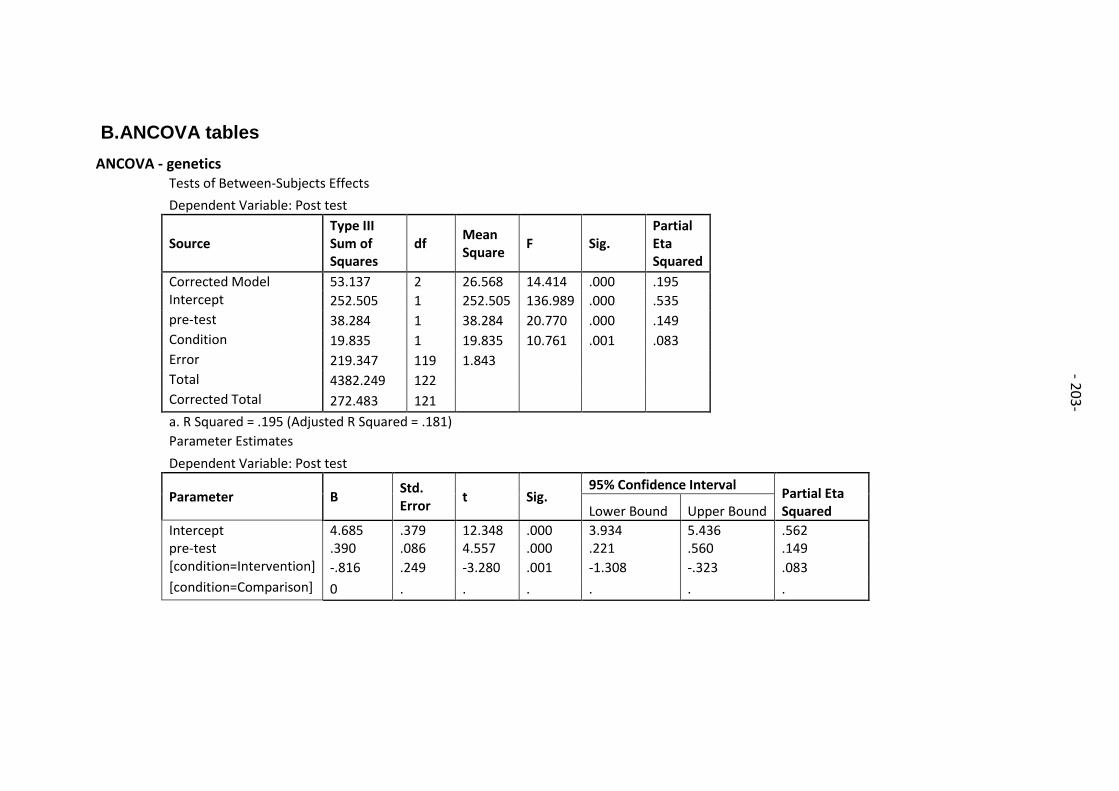
- 208 -
B. ANCOVA tables
ANCOVA - genetics Tests of Between-Subjects Effects
Dependent Variable: Post test
Source Type III Sum of Squares
df Mean Square
F Sig. Partial Eta Squared
Corrected Model 53.137 2 26.568 14.414 .000 .195 Intercept 252.505 1 252.505 136.989 .000 .535
pre-test 38.284 1 38.284 20.770 .000 .149
Condition 19.835 1 19.835 10.761 .001 .083
Error 219.347 119 1.843
Total 4382.249 122
Corrected Total 272.483 121
a. R Squared = .195 (Adjusted R Squared = .181) Parameter Estimates
Dependent Variable: Post test
Parameter B Std. Error
t Sig. 95% Confidence Interval
Partial Eta Squared Lower Bound Upper Bound
Intercept 4.685 .379 12.348 .000 3.934 5.436 .562 pre-test .390 .086 4.557 .000 .221 .560 .149 [condition=Intervention] -.816 .249 -3.280 .001 -1.308 -.323 .083
[condition=Comparison] 0 . . . . . .
- 20
3-

- 209 -
ANCOVA- balancing chemical equations
Tests of Between-Subjects Effects
Dependent Variable: Balancing chemical equation
Source Type III Sum of Squares
df Mean Square
F Sig. Partial Eta Squared
Corrected Model 192.489 2 96.244 11.031 .000 .145
Intercept 385.414 1 385.414 44.176 .000 .254
pre-test 99.848 1 99.848 11.445 .001 .081
Condition 111.964 1 111.964 12.833 .000 .090
Error 1134.188 130 8.725
Total 5556.000 133
Corrected Total 1326.677 132
a. R Squared = .145 (Adjusted R Squared = .132)
Parameter Estimates
Dependent Variable: Balancing chemical equation
Parameter B Std. Error
t Sig. 95% Confidence Interval Partial Eta Squared Lower Bound Upper Bound
Intercept 2.834 .666 4.258 .000 1.517 4.151 .122
pre-test .517 .153 3.383 .001 .215 .820 .081
[condition=Intervention] 1.878 .524 3.582 .000 .841 2.915 .090
[condition=Comparison] 0 . . . . . .
- 20
4-

- 210 -
ANCOVA -ecology
Tests of Between-Subjects Effects
Dependent Variable: Post test scores
Source Type III Sum of Squares
df Mean Square
F Sig. Partial Eta Squared
Corrected Model 68.075 2 34.037 14.640 .000 .243
Intercept 132.311 1 132.311 56.907 .000 .385
pre-test 57.785 1 57.785 24.854 .000 .215
condition 3.920 1 3.920 1.686 .197 .018
Error 211.577 91 2.325
Total 3181.823 94
Corrected Total 279.652 93
a. R Squared = .243 (Adjusted R Squared = .227)
Parameter Estimates
Dependent Variable: Post test scores
Parameter B Std. Error
t Sig. 95% Confidence Interval Partial Eta Squared Lower Bound Upper Bound
Intercept 3.227 .459 7.038 .000 2.316 4.138 .352 pre-test .555 .111 4.985 .000 .334 .777 .215 [condition=Intervention] .414 .319 1.298 .197 -.219 1.046 .018 [condition=Comparison] 0 . . . . . .
- 15
1-
- 15
1-
- 20
5-