University Microiiims, A XtKOXCompany , Ann Arbor, Michigar
127
70 - 23,982 KELLEY, Robert Eugene, 1921- DIFFERENCES BETWEEN TRANSFER AND NON-TRANSFER STUDENTS AND THEIR ACADEMIC PERFORMANCE AT THE UNIVERSITY OF OKLAHOMA. The University of Oklahoma, Ph.D., 1970 Education, higher University Microiiims, A XtKOXCompany , Ann Arbor, Michigar THIS DISSERTATION HAS BEEN MICROFILMED EXACTLY AS RECEIVED
-
Upload
khangminh22 -
Category
Documents
-
view
0 -
download
0
Transcript of University Microiiims, A XtKOXCompany , Ann Arbor, Michigar
70 - 23,982
KELLEY, Robert Eugene, 1921-DIFFERENCES BETWEEN TRANSFER AND NON-TRANSFER STUDENTS AND THEIR ACADEMIC PERFORMANCE AT THE UNIVERSITY OF OKLAHOMA.The University of Oklahoma, Ph.D., 1970 Education, higher
University Microiiims, A XtKOXCompany , Ann Arbor, Michigar
THIS DISSERTATION HAS BEEN MICROFILMED EXACTLY AS RECEIVED
THE U m V E R S m OF OKLAHOMA.
ORADUAOS COLLEŒ
DIFFEREHCES BETWEEN TRANSFER AND NON-TRANSFER
STmSNTS AND THEIR ACADEMIC PERFORMANCE AT THE UNIVERSITY OF OKLAHOMA
A DISSERTATION
SUBMITTED TO THE CHUUXJATE FACULTY
In partial fulfillment of the requirements for the
degree of
DOCTOR OF PHILOSOPHY
BY
ROBERT EUŒNE KELLEY
Norman, Oklahoma
1970

A STUDY OF DIFFERENCES BETWEEN TRAEBFER AID BDI-TRABSFER
STUDENTS AND THEIR ACAISXEC PERFORMANCE
AT THE UNIVERSITY OF OiOAEOMA
APPROVED BY
. f c
DISSERTATION CCmHTTEE

ACM0WIZDGMENT8
The writer wishes to express his appreciation to all members of his dissertation committee for their generous use of time and counsel in
helping him complete this dissertation - Dr. Herbert R. Hengst, Dr. Cmer
J. Rupiper, Dr. William C. Price, and Dr. Robert W. Culp. Dr. Robert L.
Bailey and his staff were most helpful during the data collection phase
of the study and the Computer Center in the tabulations.Special acknowledgment is extended to Dr. C. Stanley Clifton,
ferror director of the School of Social Work, for his early ercouragerent;
and to Dr. Herbert R. Hengst for his sustained guidance through the entire
course of the study.
ill

TABI£ OF CONTENTS
P&ge
ACKHOHIEDOMENTS.......................................... illLIST OF T A B I £ 3 .......................................... vl
Chapter
I. Iiro.ODUCTIOM................................ 1
Background and Heed for the Study............ 1Statement of the Problem and Purpose of Study . . . 5Definition of Terms.......................... TThe Sample and Limitations of Study.......... 9O fx»"» ^ rs 1 AW X kwV X Xp*0 V
II. REVIEW OF THE LITERATURE.................. 13
Introduction................................ 13National Studies of Transfer Students . . . . . . . 13Regional Studies of Transfer Students ............ 23Studies of Transfer Students Within the
State of Oklahoma........................ 30
III. METHODOLOGY.................................. 35Study Design and Procedures.................. 35Hypotheses.................................. 37Statistical Tests .................. .. . 38Sources of Data and Collection Procedures... 39Population and Sampling M e t h o d .............. 40Summary ........................................ 43
IV. FINDINGS OF THE STUDY........................ 44A Demographic Picture of the Student Population . . 44Tests of the Hypotheses - Findings from Tests of
Differences Between Sample Means . . . . . . . . Ç2Tests of the Hypotheses - Findings of Differences
as Measured by the Graduation/Withdrawal Rate. . 70Summary of Findings.............................. 82
Iv
Chapter Page
V. SUMMARY; C0HCLUSI0H3; AID RECClMEimTIOHS.......... 8)
Svmmary............................................ 85Conclue Iona........................................ 86Recoonendatlona.................................... 88
BIBLIOGRAPHY.............................................. 90APPENDICES................................................ 94
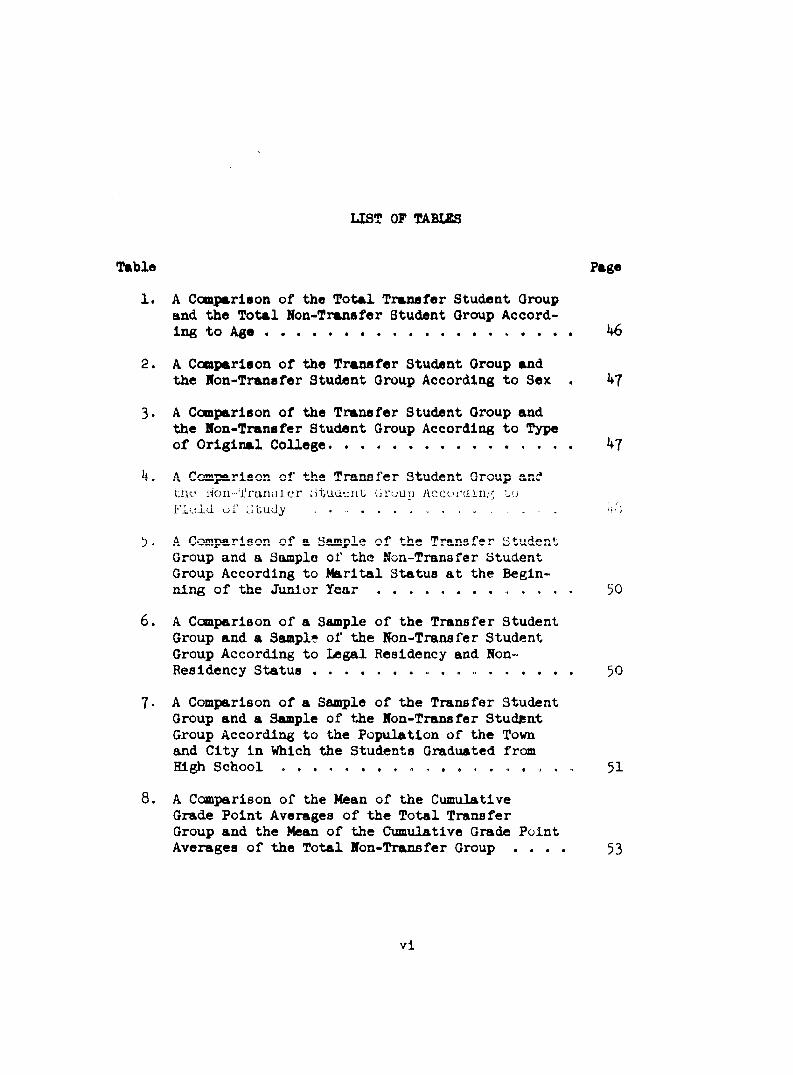
LIS? OF TABLES
Table Page
1. A Ccmparison of the Total Transfer Student Group and the Total Non-Transfer Student Group According to A g e ...................................... 46
2. A Comparison of the Transfer Student Group andthe Non-Transfer Student Group According to Sex , 4?
3 . A Comparison of the Transfer Student Group and the Non-Transfer Student Group According to Typeof Original College............................... 47
4. A Comparison of the Transfer Student Group snc?thf Nori-u'ranai'er Stuuont (iroup Accordiii;/ auFluid uT CuUdy .. . , Id
). A Comparison of a Sample of the Transfer Student Group and a Sample of the Non-Transfer Student Group According to Marital Status at the Beginning of the Junior Y e a r ................ 50
6. A Comparison of a Sample of the Transfer Student Group and a Sample of the Non-Transfer Student Group According to Legal Residency and Non- Residency Status.............. 50
7 . A Comparison of a Sample of the Transfer Student Group and a Sample of the Non-Transfer Studjsnt Group According to the Population of the Town and City In Which the Students Graduated fromHigh S c h o o l ................ . , 51
8. A Comparison of the Mean of the Cumulative Grade Point Averages of the Total Transfer Group and the Mean of the Cumulative Grade Point Averages of the Total Non-Transfer Group . . . . 53
vl
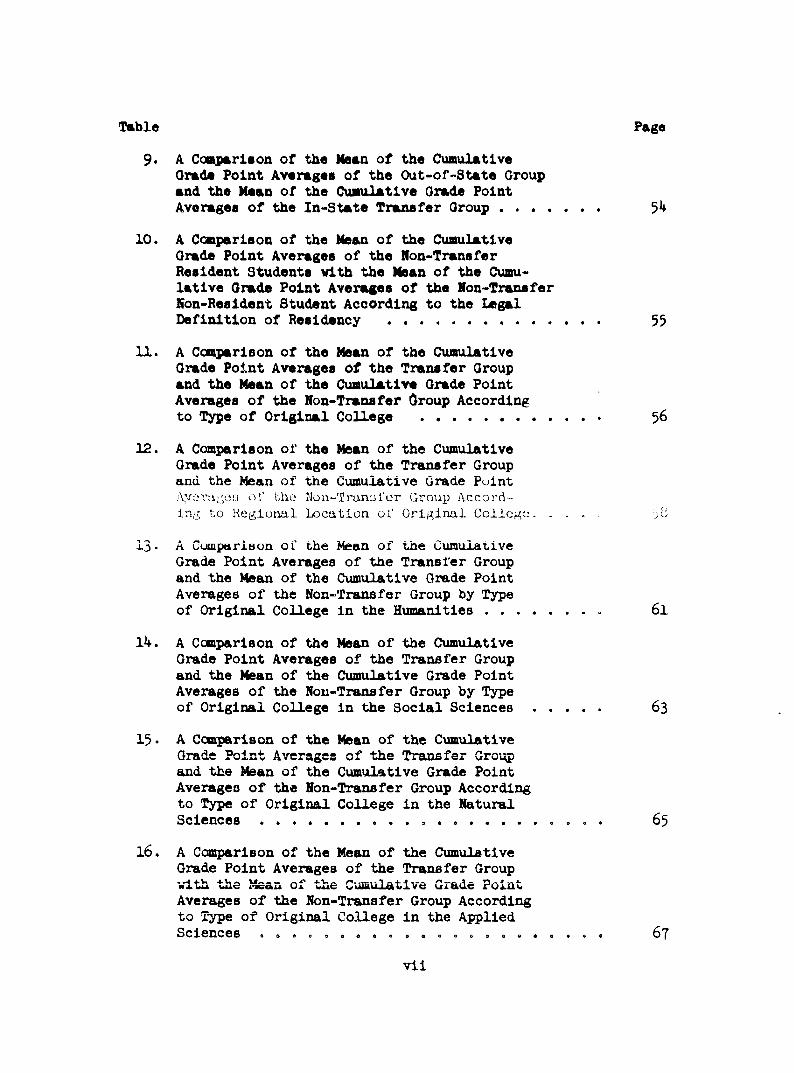
Table Page
9< A Coaparlaon of the Mean of the CumulativeGrade Point Averages of the Out-of-8tate Group and the Mean of the Cumulative Grade PointAverages of the In-State Transfer Group ............ 5^
10. A Ccmparison of the Mean of the Cumulative Grade Point Averages of the Non-Transfer Resident Students with the Mean of the Cumulative Grade Point Averages of the Non-Transfer Non-Resident Student According to the LegalDefinition of Residency .......................... $$
11. A Comparison of the Mean of the Cumulative Grade Point Averages of the Transfer Group and the Mean of the Cumulative Grade Point Averages of the Non-Transfer Group Accordingto Type of Original College ...................... 56
12. A Comparison of the Mean of the Cumulative Grade Point Averages of the Transfer Group and the mean of the Cumulative Grade PointAyeva^orj os’ the Mon-ïmniil'er Group According to Hegional Location of Original College. ..... >0
13. A Cumpariaon 01 the Mean of the CumulativeGrade Point Averages of the Transfer Group and the Meem of the Cumulative Grade Point Averages of the Non-Transfer Group by Typeof Original College in the Humanities.......... 6l
14. A Comparison of the Mean of the CumulativeGrade Point Averages of the Transfer Group and the Mean of the Cumulative Grade Point Averages of the Non-Transfer Group by Typeof Original College in the Social Sciences......... 63
1 3. A Ccmparison of the Mean of the CumulativeGrade Point Averages of the Transfer Group and the Mean of the Cumulative Grade Point Averages of the Non-Transfer Group According to Type of Original College in the Natural Sciences .................. . . . . . . . . . . . . 63
1 6 . A Ccmparison of the Mean of the CumulativeGrade Point Averages of the Transfer Group with the Mean of the Cumulative Grade Point Averages of the Non-Transfer Group According to Type of Original College in the AppliedSciences . . . . . . . . . . . 67
vii

Table Page
1 7. A Comparlaon of the Mean of the Cumulative Grade Point Averages of Transfer StudentGroups by Sex and Field of Study ..................... 66
16. A Ccmiparlson of the Graduation/Vflthdraval Rate of Transfers as a Total Group to the Graduation/Withdrawal Rate of Non-Transfers as a Total Group .................................. 71
1 9. A Comparison of the Graduation/Withdrawal Rate of In-State Transfer Students and the Graduation/withdrawal Rate of Out-Of-StateTransfer Students .................................. 72
20. A Comparison of the Graduatio n/Wlthdraval Rate of the Non-Transfer Resident Students to the Graduatin/Withdrawal Rate of the Non-Transfer Non-Resident Students ..................... 73
21. A Comparison of the Graduation/WithdrawalRate of the Transfer Students Compared, toihü Graduation/withdrawal Rate of the Non- Tranni'er ^JLudtaitu According lu T.ypu ul'Original College................... . '[j
22. A Comparison of the Graduation/Withdrawal Rate of the Out-Of-State Transfer Students to the Graduation/Withdrawal Rate of the Native Students According to the Geographic Regionof the Original C o l l e g e ............................ 76
2 3. A Comparison of the Graduation/Withdrawal Rate of the Transfer Students to the Graduation/Withdrawal Rate of the Non-TransferStudents According to the Field of Study .......... 78
24. A Comparison of the Graduation/Withdrawal Rate of Transfer Students by Sex and Fieldof Study............................................ 80
2 5. Summary of Tests of the Hypotheses.................. 8l
viii

DITFBRBHCES BETWEEN TRANSFER AND NON-TRANSFER
STUDENTS AND THEIR ACADEMIC PERFORMANCE
AT TEE UNIVERSITY OF OKLAHOMA
CHAPTER I
INTRODUCTION
Background, and Need for the Study
Increased demands by the American people for higher education havecreated an unprecedented nationwide increase in the number of admissions
*c college from 3,^80,000 in i960 to 6,750,000 in 1969. Accompanying thisincrease, there has been an increase in the number of studies done about
the college student and his performance, mainly in the form of follow-up2studies of college freshmen. An applicant that has been studied less ex
tensively has been the transfer student. Yet the transfer student may
merit equal attention to that shown to the applicant from high school if we can assume the figures concerning his rate of increase as published by
^Fact Book on American Hi^er Education. (Washington, D. C.: American Council on Education, I969), p* 9005.
2"Admissions, Student, University and College," Datrlx Reference Listing (Ann Arbor: University Micro Fi.ijns, I968),

2
the College Entrance Examination Board are correct. Willingham and Flndlkyan contend that the rate of Increase of transfer students exceeded the rate of
QIncrease of direct admissions In I9 6 8.
While applicants for direct admission continued to exceed applications
for admission by transfer by a substantial margin of 5 to 1 In the 1960's,
scsae of the factors which generated the Increase In transfer applications
would appear to be equally applicable In the 1970*s. In brief these were(1 ) Increased academic specialization among Institutions especially lAere
statewide coordinating systems exist, (2) Increased geographic mobility of students, (3 ) Increased output of Junior colleges
In addition to this Increase In numbers, as found In the IgSO's
and as projected Into the 197 0's, note should be made of the greater variance in personality characteristics among transfer students as compared to
non-transfer students. This could imply greater differences in academic
performance. They are generally older, less likely to be at home on the
larger university campus, and seme studies have Indicated they have a greater
propensity for withdrawing than the non-transfer student.
'^Warren Willingham and Nurhan Flndlkyan, "Transfer Students: Who'sMoving frcaa Where to Where and What Determines Who is Admitted," College Board Review (Summer, I969); p. 4
kWarren Willingham and Kurhan Flndlkyan, Patterns of Admission for Transfer Students (Hew York: College Entrance Examination Board, 19^9); P» 1*
^J. Rouechek, Follow Up on Junior College Transfer Students (Los Angeles: Educational Research Information Center for Junior Colleges, I968),p. 4 ED 013—089«
3Hence, on the basis of national studies, the transfer student may
require greater skill in evaluation than the student vho is admitted di
rectly from high school. While grade point averages and American College
Testing or College Entrance Examination Board scores will probably continue
to be primary criteria for admission, it may be important especially in borderline instances to have information available concerning differences
in student performance according to type of original college and fields
of study concentration if declared. Failure to use all the information on hand, isq)erfect thou(^ some of these guidelines may be, can result in
(l) an inefficient use of college resources in terms of student turnover
and (2 ) disappointment to the student unable to handle courses for idiich6he has had insufficient preparation.
Studies xo date on the regional scene confirm much the same pic
ture as the national studies. 'These will be discussed in more detail in the next chapter. It is sufficient to state at this point that most of
the factors contributing to the increase in transfer students nationally
operate also in the Southwest and in the State of Oklahoma. In addition
to public junior colleges in Texas, Oklahoma, and Kansas, there has been
a long tradition of church related colleges and small independent colleges
existing side by side with larger state suppoi"ted colleges. The range of specializations and offerings at these colleges have by financial necessity
Op. Cit., p. ED 013-069.

been limited and Interchange between them and the larger colleges in both7directions has been going on for many years.'
The increasing Is^ortance of the transfer student within one state
can also be observed. The University of Oklahooia^ as one of the two largest
tax supported universities in the state, can expect to receive an increasingnumber of applications from other tax supported junior and senior colleges
whose course offerings have been coordinated by the Oklahoma State Regents
for Higher Education. While the national and regional studies do not uni-fomly agree on their findings as to differences in academic performanceof transfer students and non-transfer students, they do agree on the need
for each college periodically to conduct their o#m transfer studies in order8to improve service to students. The last such study done at the University
of Oklahoma was the Mann study done in 1963»^ Since his data were based on
a sample of students attending the university from 1959 to I962, it seemed appropriate that these findings be updated and based upon the greater di
versity found among the students enrolled in the late I96O ' s.
In summary, the need for the study developed because of increasing numbers of transfer students, their greater variability in personality char
acteristics, their propensity to withdraw prior to graduation with the
^John Cofifelt and Dan Hobbs, In yid Out of College (Oklahoma City: State Regents for Higjher Education, 19^4), p. 11.
ÛC. H. Holmes, "Transfer Student in the College of Liberal Arts,"
Junior College Review Board, XXXI (I961), p. 4$6.
%tltchell Mann, "The Academic Achievement of Transfer Students at the University of Oklahoma" Unpublished doctoral dissertation. University of Oklahoma, I963, p. 48.

5mutual loss to the university and the student, and a lack of current In
formation about transfer students and their performance conq>ared to non-
transfer students at the University of Oklahoma.
Statement of the Problem emd Purpose of the Study
The theoretical framework used In developing the statement of the problem was that developed by Getzell and others vho viewed behavior In a
social system such as a school or college as a function of Interaction be
tween two factors, the personality and the Institution.^^ In terms of this
theory, the experiences that the students had at their original college
could conceivably Influence their performance behavior at the university to which they transferred as juniors. The experiences of the students idio
began their freshman year at the university could likewise influence their
performance as Juniors; however, in their case they had one consistent
environment.
The general research hypothesis was developed consistent with the concepts of the Getzell*s frame-of-reference. It can be stated as follows;
that differences exist between transfer students and their academic per
formance and non-transfer students and their academic performance due In part to the experiences of the transfer students at their original college,
"Eae problem of the study, then. Is expressed In the following question:
What differences exist between transfer students and their academic
Jacob Getzell, and others. Educational administration as a Social Process (Evanston: Harper and Row, I9 6 8), p. 7 8.

6performance and. non-transfer students emd. their academic performance as
meatiured. by Indlvldueil cumulative grade point averages? The purpose of
the study was to exeunlne this problem by meems of a con^ratlve study,
comparing the academic perfonoance of a group of transfer students with the academic performemce of a group of randomly selected non-transfer stu
dents. The major elements of the problem based upon a review of related
studies were expressed In question form:1. How do transfer students as a total group compare academically
with non-transfer students as a total group?2. How do out-of-state transfer students compare academically with
In-state transfer students?
3« How do non-resident non-transfer students ccaiq>are academically vlth resident non-transfer students?
4. How do transfer students compare academically ',n_tb non-transfer
students according to type and size of original college from
^Ich the students transferred?
5. How do transfer students compare academically with non-transfer
students according to regional location of the original college
from which they came?6. How do transfer studentf compare academically with non-transfer
students according to type of original college and by major
field of study?
7» How do female transfer students compare academically with male transfer students?
Before proceeding to the discussion concerning the population from which
the sample groups were drawn and the limitations of the study, It Is

7appropriate to define the various terms vdiich will he used through the
study.
Definition of Terms^
The definition of terms includes both standard terms and those developed in connection with the type of college in order to take into con
sideration the factor of size. Since these terms will be used extensively in the study, an early clarification is appropriate.
Acadanic: A term in higher education pertaining to an instructionalprogram of course work. Academic performance refers to performance in an
instructional program.Academic Mobility; Characterized by ease of movement in instruc
tional programs and, for purposes of this study, between institutions of
higher education.
Grade Point Average; A measure of scholastic performance over a set of courses obtained by dividing the sum of the grade points esmed by
the total number of hours of course work attempted in the set also seen
as abbreviation, GPA.
Non-Transfer Students; Students enrolled at the University of Oklahoma since their freshman year. Also referred to as natives.
Transfer Students; Students vdio terminate enrollment in one in
stitution and subsequently enroll in another, usually with transfer credits.
For purpose of this study, a student with no less than twelve hours of trans
fer credit from his original college.
^^Definitions of Student Personnel Terms in Higher Education (Washington: Department of Health, Education and Welfare, l$oo/, pp. l-oO,

8
Resident Students; Students enrolled at the University whose parent's
legal residence is in Oklahoma ; or ^ o graduat<°:d frcm a high school in Okla
homa.
Ron-Resident Students; Students enrolled at the University whose
parent's legal residence is outside of Oklahoma.The following definitions incorporate standard terms found in Def
initions of Student Personnel Terms in Higher Education to which has been
added the arbitrary factor of size in limiting the term University to aninstitution with a minimum enrollment size of 2 ,5 0 0 students or more for
12purposes of this study only. The element of size was considered a significant factor influencing the environment at the original college.
College; An institution of higher education which offers educational programs above the level of the secondary school; includes four year and tvo year institutions, out for the purpose of this soudy is con
fined to four year colleges.
Junior College: A two year institution of higher education which
offers Associate of Art Degree.
University: A complex institution of higher education which has
as its puipose (l) instruction, (2 ) research, (3 ) service; confers advanced degrees as well as bachelor's degrees in a variety of disciplines and pro
vides at least two degree granting professional schools.
Private College; An institution of higher education in which the
principal emphasis is a program of liberal or general studies with the
12Op. Cit., p. 57«
9undergraduate education leading to a Bachelor of Arts or Bachelor of Science
Degree. Such colleges are predominately supported by private contributions,
or fees, and governed by boards of trustees appointed by agencies other than instruments of a public governmental unit.
State College; An institution of higher education supported by the s t a t e . F o r purposes of this study, any state supported college other
than a university or junior college. Also referred to as four year state colleges.
Graduation; The process of receiving formal recognition from a college or university, usually by the granting of a degree, for having com
pleted a program of study. For purposes of this study, the completion of
degree requirements for the Baccalaureate between September, I966 and June,
1969.Withdrawal' The termination of a student'’ 3 attendance in a class
or all classes before the end of the term. For purposes of this study,
the withdrawal from classes before completion of degree requirements for the Baccalaureate anytime between September, I966 and before June, I969.
The Sample and Limitations of the Study
The population from %diich the samples were drawn for ccmparison was limited to students classified as "Juniors" as of Fall, I966 at the
University of Oklahoma. jSie Junior year was chosen because it is a common
year for transition to the university for Junior college and state college students and the one in which undergraduates, transfer and non-transfer
^^Op. Cit., p. 38.

}.0
alike, tend to reaffirm or select their major field. The sample group con
sisted of an equal number (600 each) of transfer and non-transfer students
randomly selected from the total population of Juniors. The sample groups were in turn limited by the following exclusions:
(1) Students lAose permanent record card Indicated they had
already graduated but were enrolled for an additional degree.
They had already demonstrated an acceptable degree of persis
tence . The most common exeunple of this category was law students.(2 ) Students vho had earned less than twelve acceptable trans
fer credits at their original college. Their experience was con
sidered too brief to have had much effect upon their performance
at the University of Oklahoma. The most common example of these students were those who attended one or more summer sessionselsewhere but otherwise were continuously in residence at the
University.
(3 ) Students vho were still enrolled as of June, I969, the
cut off date set for the study. Their final cumulative grade
point average had yet to be established and their persistence to graduation could not be determined.
Sources of Data and Preliminary Study Procedures
The sources of data for the study were to be found la two locations;
(1 ) The Library Historical Collection for the Studenw Dlrectoiry,
1966-6 7 .(2 ) The Office of Admissions and Records for the original correspondence file and permanent record cards ,
11
The permanent record cards served as the primary sources of data from which the student's name, Identification number, date of birth, sex,
name of original college, hours transferred, major field, graduation/with
drawal status, and credit hours were extracted. Individual cumulative
grade point averages were not in the available records but were computed
by dividing the grade points earned by the credit hours attempted. The cumulative grade point average from Fall, I966 until graduation or with
drawal was the one used.
The decision was made to use a comparative study of cumulative
grade point averages of transfer students and non-transfer students. In this study, the students would be the independent variable and the cumu
lative grade point averages of the students would be the dependent variable.
The development of the hypotheses followed- The statement of the hypothocec
and the plan for testing the hypotheses are discussed in detail in Chapter
III. The decision of determining which statistical model would be most applicable to the data remained and the t test of difference between sam
ple means wus chosen as the primary test to be used in conjunction with the
acceptance or rejection of the hypotheses.
Summary
In summary, the increased number of college applicants has created
an unprecedented demand for college admissions. with increased numbers there has developed an increase in transfer applicants who pose more com
plex problems because of their diversity and attrition; yet the volume of research about them has been less than the research completed concerning
direct admissions. Drawing upon the systems theory idea developed by
12Getzell and others concerning the impact of an institution upon an individual and vice versa, the general hypothesis was developed that differences
exist between transfer students and their performance and non-transfer stu
dents and their performance due in part to the previous college experiences
of the transfer students. With the addition of the idea of measuring this
difference by means of the cumulative grade point averages of the students,
the problem was defined and preparation made for a comparative study in
\dilch the students, transfer and non-transfer, compared in various ways
would be the independent variable and the grade point average the dependent variable. Data for such a study was found to be available in the office
of Admissions and Records.!Die final design of the study including the null hypotheses, the
dGtail3 of the collection plan, and the zanncr In 'Ælch the etudy «•ne
carried out will be diacunsed in Chapter III after a review of related
studies has been presented in Chapter II. Chapter IV will report the testing of the hypotheses and findings of the study In tabular and narrative
form. Chapter V will summarize the findings, implications, and recommen
dations for further study.
CHAPTER II
REVIEW OF THE LITERATURE
Since the beginning of the Junior college movement in the early
1900*8 , the transfer student has been a subject of special interest to
Junior colleges and those senior colleges with \dicm the Junior college has
had transfer arrangements. Since I96O, this interest has broadened within the field of higher education to include the studies of transfer students
frcm all types of colleges. It is with this broader interest that this
study is particularly concerned with special reference to the type and
size of the college from which th? transfer student came and their per
formance at their new college. The review of the literature has been di
vided into two main parts, the first dealing with the national transfer
picture and the second with regional and statewide studies. The review
concludes with an examination of recent studies done concerning transfer students in Oklahoma.
National Studies of Transfer Students
The student applying for admission to a college with a petition
for advanced standing credit from another college became much more common
during the decade of the 1960's than in the decade of the 1950*s or earlier. However, they were not in the majority. Applications from freshmen still
13

14outnumbered tranefer application# by 'j to 1 according to the WiUinghaa-Findikyan etudy; but the number of tranefer applications increased both in
14absolute and proportional terms. Borne writers have gone so far as to pre
dict the transfer student will comprise one-third of the college population
in the 1970's. According to the studies reviewed, this mobile student has
been admitted to junior colleges, senior colleges, and universities with
out too much difficulty.The most comprehensive studids of the transfer student and his per
formance have probably come from the Center for the Study of Higher Educa
tion at the University of California at Berkeley. The chairman of that cen
ter during the 1950's, T. E. McConnell, wrote a general publication entitled
A General Pattern for American Public Education. I n this publication,Ir. th* chapter on "Dlntlnctnnn:;, Dlî’î’or-or.t!.:it!';n, or
i")!!!')! ionticin" tho o u o c o r o ; o f t , ho J u n i o r r o I I t, r ' anr . i 'c r’ 'Uodoni, . Ho quol-.ù
from atudieo done at the Berkeley campus of the University of California
and studies done at the Los Angeles campus of the same university which arrived at different conclusions from their studies. In brief the transfer
group at Berkeley performed essentially as well as the native students en
rolled continuously at Berkeley since their freshman year; at the Los Angeles
campus, the transfer students did not perform as well as the native students.
Yet considering both studies together, McConnell believed that the transfer
programs were operating successfully. He also discussed the California
14Willingham and Findikyan, Op. Cit., p. 13.E. McConnell, A General Pattern for American Public Education
(New York: McGraw-Hill, 1962), p. 115-
15Master Plan for Higher Education In the same review, Indicating that the
plan encouraged Interchange between the Junior colleges and the senior colleges and universities.
Few writers have been so extensive and productive In connection with studies of transfer students as Leland L. Medsker. In these studies, he
frequently collaborated with Dorothy Knoell. Among his better known studies have been Factors Affecting Performance of Transfer Students from Two to
Four Year Colleges, The Junior College: Progress and Prospect, and From
Jhnlor to Senior College: A National Study of the Transfer Student. The
purpose of this latter study. From Junior to Senior College, was to obtain
facts, figures, and opinions leading to a fairly comprehensive evaluationof the Junior college transfer function as It was being performed In the
16oarlj’ 1 5 ^ 0 ’a. Tuc üLuaplu or core y,rovip, au Ihc authoru called their ,'ujun-
plc, conalulcd ot 7;2Uj Junior college utudentu who entered lour year in
stitutions in the fall of I960, primarily as full time students with Junior
standing. Four thousand twenty of these ctudents graduated In I962. The study originally considered comparing an entering group of transfer students
such as i960 Juniors with an equivalent number of native students, but later
shifted to a study of students who graduated regardless of the date of trans
fer. The advantage of the study was that no artificial time limit was set
for graduation; the disadvantage was the lack of access to Information about
attrition especially among native students. The major findings of the study17merit summarizing.
Knoell and L. L. Medsker, From Junior to Senior College, Washington, D. C., American Council on Education, 1965, p. 18-2 3 .
17,Op. Cit., p. 18-22,

161. student CharacterlBtlcs; There was not much varia
bility in personal characteristics between transfer students and native students. Both groups were mostly white, protestant, of native b o m parentage, and under 21 years of age. There were more men than woisen.High school academic records of the men and the women were found to favor the wcsien.
2. Academic Performance: Sixty-two per cent of thejunior college students were granted their baccalaureate degrees within three years after transfer; nine per cent were still enrolled. Percentage of graduates among the native student group was not available,In comqmrison by broad fields of study, the transfer students had about the same probabilities of success as the native students. Engineering students took longer but attrition in engineering was no greater than in other fields.In the comparison of grade point averages, the native students participating in the study were found to is^rove more steadily in upper division grades emd averages than their classmates who were transfer students. Differences between means of the cumulative grade point averages of the native students compared to the transfer students were significant at the .01 level.
3. Attrition After Transfer; At the beginning of the fourth year, twenty-nine per cent of the transfer students were no longer enrolled and had not graduated. The attrition rates for native students were not available. Economic reasons were given as main reason for attrition; only one-third were dismissed (among the transfer students vho withdrew) because of poor grades.
4. Institutional Differences and State Differences;Vast differences were found in the success of the transfer students in the 43 participating colleges emd universities to which the students transferred. Differences were also noted between the ten states in ^ich the study was conducted. No clear pattern seemed to emerge s to the reason for these differences .
5* Policies and Practices and Articulation; Meat students with at least a C average in their junior college program had a fairly wide range of four year
ITinatitutlona to ■which they could transfer in I96O and in 1964. Rie area in which the most significant changes occurred during the course of the study was that of articulation and coordination among the two year and four year colleges. It improved.
These findings of the Khoell and Medsker study gave a preview of some of
the trends that mi^t he expected in the current study of transfer stu
dents at the Uhiversity of Oklahoma.Addressing themselves to a wider range of transfers and non-transfer
students than previously mentioned studies idiich dealt solely with junior college transfer students, a group of sociologists at the Uhiversity of
Washington at Seattle produced a study entitled Migration of College and University Students in the United States. The data for this study were
obtained in I963 and published in I968. It should be noted that they in
cluded both freshmen and transfer students in their study without differen
tiating between the two. They did differentiate between the migration of
undergraduate and graduate students. Their study also contained numerous flow charts tracing the main streams of migration - thus giving a visual
picture of the transfer patterns. The purpose of their study was to iden
tify and analyze migration patterns and secondly analyze social; econcsnic; demographic and educational factors related to student migration in order
to predict amount and direction of Interstate college migration. Factor
and regression analyses were employed to arrive at conclusions.
18Oossman and others. Migration of College and University Students in the Iftiited States (Seattle; University of Washington Press, 1966),pp. 31-6^.

18% e y found that each region had out-migrations and In-migrations.
The total net flow charts shoved a main source of out-mlgratlon consistently
vas In the Middle Atlantic states with a net outflow In I963 of 20,000 stu
dents to the Northeast (New England), 33^000 to the Great Lakes, l6 ,000 to
the Southeast, 7,000 to the Great Plains and beyond. The Great Lakes area In turn distributed a net out-mlgratlon of 13,700 students to the Southeast
and Southwest. The Middle Atlantic states and New England were the only two geographic regions with a net loss. The above figures Include all stu
dents — graduate and undergraduate.In terms of undergraduate migration flows -- the concern of the
particular study of Oklahoma transfer students being undertaken — the Mid
dle Atlantic states were the main source of out-mlgratlon: 2,400 to the
Northeast, 13,000 to the Great lakes area, 12,000 to the Southeast, 2,900
to the Great Plains, and 3,200 to the Southwest. As with the total group
of students, graduate and undergraduate, the Great Lakes region was the
second largest source of undergraduate out-migration sending 12,000 stu
dents to the plains area and the Southwest.The authors saw these concentrations of out-mlgratlon from the Mid-
Atlantic states continuing throughout the 1960's. They also saw a trend for net out-mlgratlon to go primarily to public Institutions. Their factor
analysis showed the hipest positive loadings on such variables as relative
stress on public education facilities, student aid, tuition, and fees In
factors Influencing out-mlgratlon.In 1967, an Educational Research Information Center (ERIC) for
junior colleges was set up at the Uhiversity of California at Los Angeles.

19Among the 46 studies listed at the end of I968, two were particularly re
lated to the subject of this study. The first of these studies was done from the vantage point of a junior college; the second a survey of twenty-
four studies concerning transfer students recorded at the center.Ball; at the College of the Sequoias at Visalia, California, ex
plored the problem "Can a student of average academic aptitude aspire to
a degree in a California state supported coUege?**^^ Be did this by securing information from the records of transfer students at the various
senior colleges to which they transferred going back eleven years to I953
and 1954. Be found (l) less than one-third of the students received the AA degree or transferred, (2 ) among those who transferred one-half of them
received their baccalaureate, and (3) perseverance appeared to be more im
portant than grades.Rouechek at the Center in Los Angeles surveyed twenty-four studies
recorded at the clearing house dealing with success achieved by transfer
students and found they led to the following conclusions;^®
(1) Students typically experience a grade point drop during their first semester at the senior college.
(2) In most cases recovery in marks is noted in later semesters.
(3) The grade point average continues to inçrove with each semester.
^^LLncoln B. Hall, "Performance of Average Students in a Junior College and in Four Year Institutions" (Sacramento: California State Department of Education Reports, 19^7), P* 1
20J. Rouechek, "Follow-Ups of the Junior College Transfer Student" (Los Angeles: Educational Research Information Center for Junior CollegesReports, 196?), ED. OI3-O69»
20(4) Their grade point averages are lover than the
native students.(5) The transfer student Is less likely to graduate
(than the native students).
(6 ) The transfer student takes longer to graduate.In regard to methodology, he found that for the most part the studies vere
based on GPA coaqpllatlons and did not lend Insight Into reasons for failure
or success; secondly that they did not draw Inferences or recommendations for modifying the junior college offerings In the light of the findings.
The most recently published national study of the transfer was the
study entitled Patterns of Admission for Transfer Students published by
the College Entrance Examination Board and summarized In the summer, I969piedition of College Board Review. In this study, Warren Willingham and
N. Findlkyan drew upon data obtained from l46 institutions, a representative sample of colleges and universities both publi c and private in all
geographic regions of the country. The reason for the study was stated by the authors, "We were concerned with vh&t type of students are trans
ferring from lAere to \diere nationally and \diat seems to determine whetherppthey are admitted. The procedure entailed sending out a questionnaire
to representative Institutions and asking them to fill this out and provide
transcripts of a representative group of the students at the respective
college.
These were their major findings: (1) the vast majority of applications and enrolled students went to public Institutions, (2 ) the majority
^^IJJ-lngham and Findlkyan, Op. Cit., pp. I-I8.^Ibld.. p. 2 ,
21
came from public colleges and vere state residents: about one-third camefrom another state, (3) most transfers came from other four year colleges
but the proportion from junior colleges is Increasing to a substantial
forty-three per cent (as of 196g), (4) by regions the Northeast has the
smallest proportion of new students vho are transfers (12 per cent) idiile
the West Coast has the most (32 per cent), the national average is 22 per
cent, (3) the interstate migrant is over represented at private colleges and under represented at the less affluent public colleges, (6 ) potential barriers to admission exist against transfer students including loss of
credits, proportionately less financial aid than freshmen and lack of space.
The study closed with statements and tables designed to show that nevly enrolled transfer students increased over 30 per cent from I96I to 1966 lAile
nev freshmen increased 25 per cent at these same institutions, They pre
dicted that the ratio in the 1$Y0'S would be 1 to 3 or one-third of the
typical large stfte universities' enrollment would be transfer students.
The study did not attempt to measure or evaluate the performance of transfer students with non-transfer students nor measure the retention rate.
In its comprehensiveness and its prediction of increases in trans
fer students, the WlUingham-Flndikyan study vas reminiscent of one done
in 1962 based upon data collected in the 1950's by B a r l e y . H e made a
series of comparative studies of transfer students using a variety of meas
ures seeking to measure performance for predictive purposes. His study
Implied there would be an increase which did develop in transfer students.
23■ John Barley, Promise and Performance (Berkeley: Center for theStudy of Higher Education, 1962), Appendix.
22
Although considering other measures, he uniformly used graduation and with
drawal rate 3 as predictors - In contrast to the more common use of the cumu
latlve grade point average. Although this review of the literature concerning national studies on the topic of transfer students has relied primarily on
published monographs and books rather than articles. It would be appropriate
to mention briefly two pertinent articles In the periodicals since the
Medsker emd Khoell 1965 study and exclusive of the Willingham study.Kahlman In the Junior College Journal of March, I967, deplored the
attrition of junior college students after transferring to a four year col
lege.. He advanced the belief that the burden of the dlchotcmous nature
of the junior college fsills upon the transfer student. If he Is to compete
on the 3rd year college level, he should have the first two years of college
equal to the four year college student's first two years. He particularly
singled out the social sciences which he thought needed to be increased on
the junior college level in terms of scope, size, purpose, and level of difficulty. Such steps he believed would reduce this attrition. Specific
attrition figures were not given.W. T. Perel and Valro did a study on the community college and the
college parallel program as reported In the Journal of Higher Education In 1969.^^ In this study they singled out mathematics and languages as subjects in which transfer students had difficulty. They found a wide variance
between standards at the university and those at the junior college in the
PIlJ. Kuhlman, "Attrition of Junior College Students," Junior College Journal, Vol. 37m (march, 1967), p. 6 8.
T. Perel and Valro, "Community College and College Parallel Programs," Journal of Higher Education (January, I969), p. 4?
23Mldveet, South, and East. Their recommendation vas for much more artic
ulation between the two types of Institutions wherever the subjects involved
a vertical sequential, structure.In summary, starting with the earlier studies of transfer students
idiich begem with the advent of the junior college movement in the early 1900's and culminating in the studies of the 1960's, the national picture is one of a gradual, increase In the number of transfer students up until
i960 amd a rapid increase thereafter both in absolute amd proportions^,
terms. These national studies have been of particular value in pointing
out the chamges in trams fer patterns quamtitatively. In terms of evalua
tion of performance of transfer students compared to non-transfer students, a substamtiaü. body of additional relevamt information was found in regional.
Regional Studies Of ïra-nafer Students
Ccmments as to regional transfer patterns have been made in most of the national transfer student studies such as the tendency of students
to transfer from colleges in the middle Atlantic states to state colleges
and universities in the Midwest, however for studies seeking to explore
transfer patterns and the performance of students following those transfer
patterns within a limited geographical area, the best source appeared to
be University Microfilms of Ann Arbor, Michigan. Accordingly a search was
requested of this organization for all studies dealing with Transfer Stu
dents, Uhiversity and College, and Performance Achievement Academic with qualifying conditions, years I96O throu^ 1969> The listings as prepared
revealed a total of 25 studies concerning transfer students and their

24
performance had been done since I960. Eleven of these studies had been
done between I967 and I969. Nineteen of these 25 studies dealt solely with junior college students. Since the purpose of this study encompassed a
broader range of transfers, the emphasis was placed upon those studies deal
ing with both junior college emd senior college transfer students on the undergraduate level. By reviewing dissertation abstracts it was possible
to identify those studies %diich appeared directly related to the one being
imdertahen. A summary of these follows.
Russell did an analysis of the academic performance of transfer stu
dents and native students and their major fields in the college of arts and
sciences at the University of Georgia in 1963.^ He found no particular statistically significant differences between the two groups of students
there though the junior college transfer students experienced more of a drop in their grads point average than the four year college transfers,
Jcner did a similar analysis of native and transfer students at2Tthe same university, the Ifaiversity of Georgia, in 1966. He however used
a more elaborate design and sought to establish relationships between the
students in his sample and such variables as grades in senior year at high school, sex, scholastic aptitude test scores. His major findings of sta
tistical significance were that the natives out-performed the transfer
James W. Russell, "An Analysis of the Academic Performance of Transfer and Native Students and their Major Fields in the College of Arts and Sciences at the Uhiversity of Georgia," Unpublished doctoral dissertation, University of Georgia, I963.
27'Franklin M. Jones, "A Controlled Comparison of the Academic Per- foiTnance of Native and Transfer Students at the Uhiversity of Georgia,” Unpublished doctoral dissertation. University of Georgia, I966.
25students In terms of predictor variables and In actual performance In college and that the female students out-performed the male students <>
Young made a study of the Influence of certain factors related to
the academic performance to transfer students admitted to Pennsylvania State28University in 19o2 « He vas particularly interested in changes in academic
performance of the advanced standing (transfer) student subsequent to admission to the Uhiversity. He sought to Investigate the importance of sex,
age, type of former Institution, fratemlty-sororlty status, residence, part
time work, and marital status as these variables related to the cumulative
grade point average of the student. His sample Included 453 students. The
criteria of "academic adjustment" was used to show the change In grade point average of the student after transfer. The ^ tests of significance were
used along with analysis of variance for the ccsnparisons between the larger
groups. Ü2 found statistically significant differences in mean grade point
averages according to sex, and age, in favor of the younger students The
type of former institution was significant only In the case of the junior
college students In favor of the native students. He did not find frater-
nlty-sororlty status, residence or part time work or marital status to be
significant. The comparison of the transfer students as a \diole to the na
tive students was an Incidental comparison since he was concentrating on different types of transfer student comparisons. He concluded that the
natives out-performed the transfer.
William Young, "Influence of Certain Factors Related to Academic Performance of Transfer Students Admitted to the Pennsylvania State University," Unpublished doctoral dissertation, Pennsylvania State University, 1962.

26In some Instances, researchers although emphasizing Junior college
transfers as compared to non-transfer students made an effort to routinely Include comparisons between Junior college students and transfer students
from four year Institutions. Mann whose study will be discussed In con
nection with studies done In the state of Oklahoma In the next section of
the chapter made this effort In several of his comparisons; however, this
was not uniformly done and the type of four year Institution was rarely29specified. ^ One such study that did seek to go beyond this limitation
should be mentioned, namely the one by Johnson at the University of Missouri completed In 196$.3^ He built Into the purpose of his study the cosqmrlson
of the scholastic achievement of students %dio transferred from four year
colleges to the University of Missouri with the scholastic achievement of
students who completed, all their work at the University as well as the junior college students comparisons. Using samples oi 2d) junior college stu
dents and 297 four year college students, and lOlh resident students, he
found no difference In cumulative grade averages between the Junior college
and residence groups. Using a t test of differences between the means of
the four year college transfers and the native group, he found a difference In favor of the four year transfer students over the native students. "Oils
was the only significant difference he found In that compari .on.
^^Mltchell Mann, "The Academic Achievement of Transfer Students at the University of Oklahoma," Ihipubllshed doctoral dissertation. University of Oklahcma, I963.
30Charles Eugene Johnson, "A Study of the Scholastic Achievement of -Junior College Transfer Students at the University of Missouri," Unpublished doctoral dissertation. University of Missouri, 1965*

27Hanflon mad* a atudy of th« Academic Parformanc* of Undergraduate
Tranefer Students at the University of Oregon in 1968.^^ 'nte purpose of
his study was to coiqpare the academic performance of undergraduate trans
fer students with native students at the University of Oregon. His sample
Included I60 sophomore transfer students and 218 native stisdents as of the Fall of 1962. The cosqtarlsons were for differences between total groups
and by type of previous college, first year GPA, and by sex. He found, as
evidenced by statistically significant differences, transfer students did
not perform as well during their first year or any other year as the native
students; that there was no difference between two year college and four
year college transfers. He recoemended revisions be considered in transfer policies, added research at each institution receiving transfers, and u ’.pocldl ui'iuàlciliuii piuf/p'aui fu r li'uaijft:!' ütudf.aita ,
W 1L r laadc; a aludy of the Academic Performance oi 'i’rannfei- oluticiilLi
at New Mexico State University in 1969.^^ He sought to compare transfers from the following sources with native students; four year college transfers; two year college transfers; and breuxch transfers. His sample was
limited to students completing 48 semester hours at another college who
graduated in I966 or I967 compared to an equivalent number of students who
completed all their requirements at NM3U (Hew Mexico State University).
3^John E. Hanson, “A Study of the Acadeadc Performance of Undergraduate Transfer Students at the University of Oregon," Unpublished doctoral dissertation, Uhiversity of Oregon, I968.
^Srfilllam Curtis Witter, "Academic Performance of Transfer Students at New Mexico State University," Unpublished doctoral dissertation, New Mexico State University, I969.

28Specific ccoperlaona were made according to type of original college and type of college attended at HMBU. Data were analyzed by t test for differ
ences between means and analysis of variance. He found (l) native students
and 4 year transfers scored significantly higher In mean OPA's than Junior
college emd branch transfers, (2 ) Junior college transfers suffered from
"transfer shock", (3) the 4 year college transfers and native students
scored significantly higher In colleges of Arts and Sciences and College of Education.
In sumsmrlzlng these regional studies made In the states of Penn
sylvania, Georgia, Missouri, Nev Mexico, and Oregon, It appeared that they did not all come to the same conclusions although their purposes, design,
and methodologies were quite similar. Jones, Young, and Witter found the
iiaLlve aludeiila did uetter Uian the tr&uaiei' atudcnta while Juhiwon found
no differences of statistical significance between his groups. Whether
these variances in findings were due to regional differences or differences
in the sizes of the samples studied or inherent differences between the par
ticular groups under study was not clear. Hence these findings at large
universities serving statewide and regional constituencies appeared less uniform than the conclusions and summaries In the national studies.
Two recent articles In the periodicals should be mentioned before
moving to a review of studies done during the 1960*b In the state of Okla
homa. These articles dealt primarily with transfer students and their prob
lems In attrition, a point the national studies also enqdiasized; but giving
some positive viewpoints In assessing the loss.

29David Irving in his ai-ticln found that attrition figures on trans
fer students may not take into account the fact that the same students may graduate at another c o l l e g e . H e did an eight-year follow-up study of
students at the Uhiversity of Georgia using a sample of 1,037 students.
He found that within that time span that 46 per cent of the male students
in his sample graduated and 42 per cent of the female students graduated. However, by adding transfer students to the male group that $1 per cent of the sample group graduated and the difference between the lower percentages
and the 51 per cent were transfer students \dio graduated elseidiere.
Cope in the Horth Central Association Quarterly, Pall, I969, re
ported on a study of drop-outs among transfer students at the Ihiversity 34of Michigan. He found that they could be classified in order of impor
tance as; (1) academic drop-outs, (2) social drop-outs - ■ those vho found no groups or friends at the large university, (3) social academic dropouts vdio combined the first two classifications — unable to maintain the standards and no friends, and (4 ) those whose religious Ideas were chal
lenged. He found they were not all lost to higher education as many went
on to other colleges more to their liking during a ten-year span of time.
^^David Irving, "Graduation and Withdrawal: An Eight Year Follow-Up,” College and University, 4l (Pall, I965), pp. 32-37.
G. Cope, "Types of High Ability Drop-Outs," North Central Association Quarterly, XLIV (Pall, I969), pp. 253-257.

30
Studies of Transfer Students Within Oklahoma
The most ccsqprehenslve study vould appear to he that hy Coffelt
and Hobbs - the In and Out of CoTi#g* s t u d y . T h i s vas a longitudinal
study of 13^000 freshmen entering Oklahoma colleges In the Fall of I962.
The puzpose vas to study and Identify significant characteristics associated vlth admission and retention. Chapter IV of the study Includes a specific discussion of the students yho transferred. They found that about 1 out of 6 freshmen vho terminated during the first tvo semesters transferred
to another Oklahcma college. A record vas not kept of those yho transferred
out of state. Among the 902 such transfers, the state four year colleges
vere the net gainers vhlle the state universities, private, and two year colleges were the net losers. Oklahoma State University exchanged the
greatest number \/lth other Oklahoma colleges with a net loss of 10 students.
Central State College was the greatest gainer with a net gain of 97 students. Among private institutions the (diversity of Tulsa had the greatest
drawing power with a net gain of 29. Generally In terms of median grade point average, the universities and four year colleges upgraded their classes
by transfers \dille the two year colleges absorbed some of the less able
students.
The Mann study might be considered to be a contemporain study to the one done by Coffelt emd Hobbs since it was completed in 1963."^^ However,
^^Coffelt and Hobbs, Op. Clt.36Mann, Op. Cit.
31his sample group was taken from students who entered the University of Okla
homa with junior classifications during the fall semester of 1958-59 and 1959-
60. Its title was The Academic Achievement of Transfer Students at the Uni
versity of Oklahoma. The problem was to compare the academic success and persistency of junior college transfer students with transfers from Oklahoma
four year colleges and with native students of the University of Oklahoma.
In so doing he used three sample groups of 96 students each from the junior
college group; four year college group, and the university natives. Els
hypotheses were that there would be no difference between students with respect to grade point average, source of student (original college), end
college major. Using analysis of variance of mean grade point averages, he
found significance in persistency, source of institution and college major. Ho’.rever, in his further aneJLysis by chi square, he found little difference
existed between the transfer students of .junior colleges and the transfer
students of the four year colleges as measured by grade point averages.
His only other significant finding was that the transfer student did not
do as well in the College of Engineering which was one of his four fields
of study as in the other three fields.3?
The Hoemann study was completed in I967 at Oklahoma State Univer
sity.3^ T3iis was a study centring the academic performance and persistency
^^Mann, Op. Cit., p. 38.
3^Victor Harold Hoemann, "A Comparative Study of the Academic Achievement and Persistence to Graduate of Junior College Transfer Student and Native Students in the College of Arts and Sciences, Oklahoma State University," Unpublished doctoral dissertation, Oklahoma State University, I967.

32of junior college transfers in the College of Arts and Sciences at Oklahoma State University vith Arts and Science majors lAo began their freshman year
at the University. It further proposed to explore such factors as sex, choice of major, and occupational status of the student's father. Areas
of study vere defined as Biological Sciences, language and Fine Arts, Physical Sciences, and Social Sciences. The population from idiich his sainple
vas dravn vas juniors in I963 or 1964 vith out-of-state transfers eliminated;
only those vith 60 or more hours transfer credit vere retained; those vith
fathers in military service vere eliminated; so that his total sangle vas reduced to I06 students. These vere then matched vith I06 native students.
American College Testing (ACT) score matching vas added for further control.
The t test vas used for testing betveen groups vith the exception of type of college where analysis of variance was used. Hoemann found relatively
few significant differences between his various znaoched groups which led
him to the following conclusions;
Junior college transfer students cumulative GPA drops the first semester after transferring; but male transfer students had a significantly higher GPA at the end of eight seroesters.
Both transfer students and. native students appeared to have the same change of success in the various majore in terms of grade point averages.
Comparing the students according to the student's father's occupation shoved few significant differences :
There vas no significant difference betveen the number who persisted and graduated from the four junior colleges in the comparison. Hoemann implied that students may attend any of the four junior colleges - Cameron, Eastern A & M, Northeastern A & M, and Northern Oklahoma - and may

33expect to do equally veil In academic performance and persistency to graduate after transferring to Oklahcna State University. 39
Zimmerman did a study of the academic achievements and persistence
of Murray State Agricultural College (a two year college) students transferring to four year colleges and universities.^ This vas a follow-up
study of 1223 students who completed from 30 to 60 hours in residence at Murray State from September 1946 to M&y I958. The purpose was to provide
evidence of the academic success and persistence of the Murray State students 'dio transferred to four year colleges. Scholarship as reflected by
ΠA and persistency as measured by receiving one or more baccalaureate de
grees were the criteria of measurement.Zimmerman found the overall academic record for the 677 students
\rtio transferred after earning 60 hours at Murray was a GPA of 2.5: for those with 30 hours credit their GPA i-jss 2 ,k and for those with less than these hours it was 2 .3> Home Economies majors and agricultural majors
were most persistent. Although this study was completed recently (I967),
its value would be primarily historical and less representative of the present day status of transfer students and their growth in numbers than the other studies discussed.
^%oemann. Op. Cit., Ch. V.
^*^^ulah A. Zimmerman; "A Study of Academic Achievements and Persistence of Murray State Agricultural College Students Transferring to Four Year Colleges and Universities," Unpublished doctoral dissertation, Oklahcma State University, I967.

34
Siimmary of Related Studies In the Literature
While acknovledglng the presence of earlier studies ; the review of the literature concentrated upon studies done during the decade of the
1960's. National; regional, and studies conducted within the confines of
the stat? of Oklahcma were reviewed in that order. The findings nationwide
could he summarized as follows: (l) the rate of increase in transfer students has accelerated during the 1960's, (2) there was evidence that this
increase at an unspecified rate will continue during the 1970's, (3) the
net out-migration of transfer students will probably continue to be from
the Eastern seaboard especially the Middle Atlantic States to the Vest including the Southwest, (4 ) public institutions especially the large state
tax supported universities will be most affected, ($) attrition bAw been
a persistent problem among transfer students,
xhe findings in regional studies have been less consistent than
those conducted on a national level. Generally the regional studies have compared the performance of Junior college students with the performance of
native students as measured by cumulative grade point averages. They have
found little difference between the two groups in terms of statistical significance. Studies conducted within the confines of the state of Oklahoma have found few significant differences in performance between transfer stu
dents and non-transfer students re^rdless of the source of transfer; in
attrition only in the field of engineering was there a noticeable difference between the transfer students and the native students in favor of the native students.
CHAPTER III
METHODOLOGY
The purpose of this chapter is to describe the methodology used
In carrying out the study. This began with the defining of the problem,
the decision to use a conqparatlve study as a means of examining the prob
lem, the determining of the major elements of the problem, the development
of hypotheses, and the plans for testing of the hypotheses. The sources
of the data and the collection procedures used are discussed Including the dsvelopaent of the student personal data form as a collection instrument. The chapter closes v/ith a discussion of the population and the sampling
method used.
Study Design and ProceduresThe study began with defining the problem as a concern for the
academic performance of transfer students at the University of Oklahoma.
As presented In more precise terms In Chapter I, the problem was to determine lAat differences exist between transfer students and their academic
performance and non-transfer students and their academic performance as measured by cumulative grade point averages at the Iftilversity of Oklahoma.
The problem was examined by means of a comparative study; the aca
demic performance of a group of transfer students was compared with the
35

36academic performance of a group of randomly selected non-transfer students.
These categories of students, broken dovn into various sub-groupings, therefore comprised the independent variable for the study.
The major elements of the problem selected for comparison vere based
upon camparisons found to be significant in previous studies of transfer
students as repoz*ted in the review of the literature in Chapter II. They
included comparisons of differences betveen the transfer student group and
the non-transfer student group according to location of the college of trans
fer, legal residency, type of original college, field of study, and sex.The dependent variable selected for measuring differences betveen
the tvo groups of students vas the cumulative grade point average. This
was chosen because it enjoys vide usage both nationally smd in the South
west region among colleges as a factor normally considered in evaluating transfer applications, and the inforsatior. necessary to compnte indi’/idioal
grade point averages vas available in the registrar’s permanent record
cards. Kerlinger advocates the use of alternate dependent variables when4lpossible in ex post facto studies as an additional control measure. The
alternate dependent variable chosen for this study was the graduation/with
drawal rate. This measure was chosen because in addition to serving as a measure of performance, it permitted an evaluation of attrition - the grad
ual withdrawal of students before cosqileting degree requirements.
Saving determined the elements of the problem and designated the
variables, the next step in the study design was to convert the elements
of the problem into null hypotheses so they could be tested by probability
^^TCerlinger, Op. Cit., pp. 368,373.
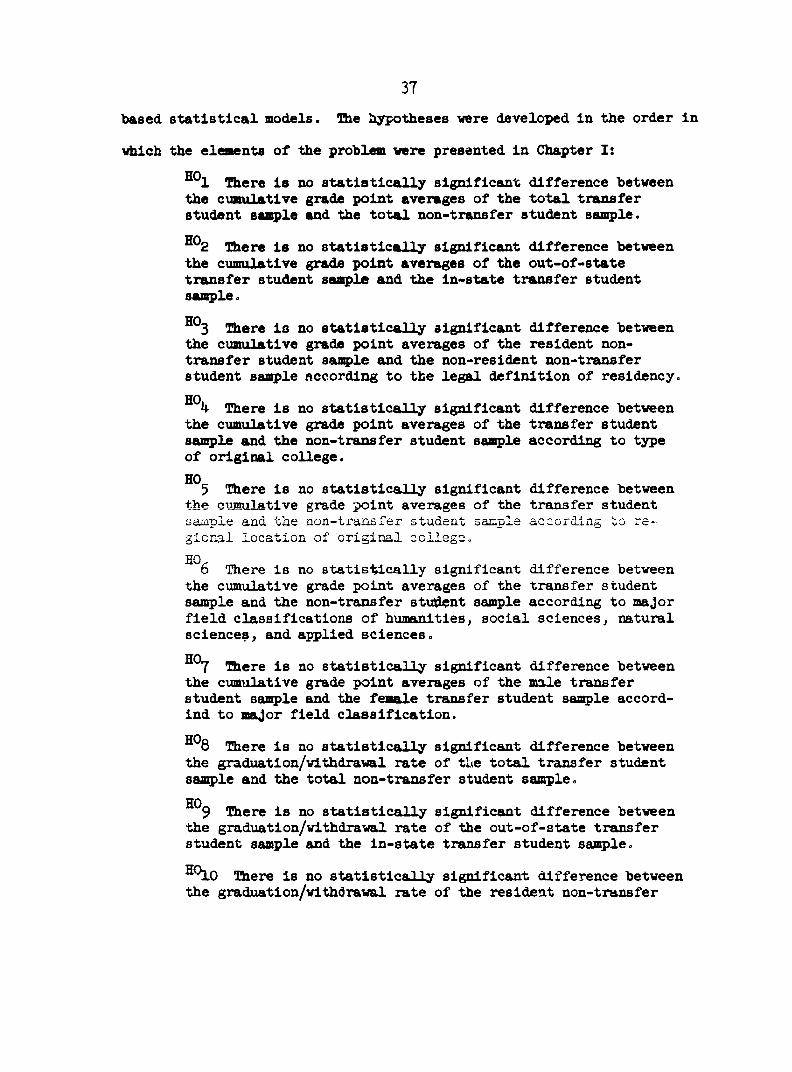
37based statistical models. The hypotheses vere developed In the order InlAlch the elements of the problem vere presented In Chapter I:
^^1 There Is no statistically significant difference betveen the cumulative grade point averages of the total transfer student sample and the total non-transfer student sample.
^^2 There Is no statistically significant difference betveen the cumulative grade point averages of the out-of-state transfer student sample and the In-state transfer student sample.
^^3 There Is no statistically significant difference betveen the cumulative grade point averages of the resident nontransfer student sanple and the non-resident non-transfer student sample according to the legal definition of residency.HOh There Is no statistically significant difference betveen the cumulative grade point averages of the transfer student sample and the non-transfer student sample according to type of original college.HO5 There Is no statistically significant difference betveen the cumulative grade point averages of the transfer studentsample and the non-transfer student sample according to regional location of original college.HO,6 There is no statistically significant difference betveen the cumulative grade point averages of the transfer student sample and the non-transfer student sample according to major field classifications of humanities, social sciences, natural sciences, and applied sciences.HO7 There Is no statistically slgnlflcsmt difference betveen the cumulative grade point averages of the male transfer student sample and the female transfer student sample accord- Ind to major field classification.
There Is no statistically significant difference betveen the graduatlon/vlthdraval rate of the total transfer student sample and the total non-transfer student sample.HO9 There Is no statistically significant difference betveen the graduatlon/vlthdraval rate of the out-of-state transfer student sample and the In-state transfer student sample.
^9lO There Is no statistically significant difference betveen the graduatlon/vlthdraval rate of the resident non-transfer
38student saiq>le and the non-resident non-transfer student sample according to the legsLL definition of residency.HO11 There Is no statistically significant difference betveen the graduatlon/vlthdraval rate of the transfer student sample and the non-transfer student sample according to type of original college.
There is no statistically significant difference betveen the graduation/vithdraval rate of the transfer student sample and the non-transfer student sample according to regional location of original college.
^^13 There is no statistically significant difference betveen the graduation/vithdraval rate of the transfer student sample and the non-transfer student sample according to major field classifications of the humanities social sciences, natural sciences, and applied sciences.
^^14 There is no statistically significant difference betveen the graduation/vithdraval rate of the male transfer student sasq>le and the female transfer student sample according to major field classifications.
Statistical Tests ‘ïhe statistical model for testing these hypotheses as measured by
the cumulative grade point average vas the t test of differences between
sample means. This test was chosen because the grade point average being
normally distributed, homogeneous In variance, continuous and having equal
Intervals of measure met the assumptions underlying the application of a42parametric statistical probability model. % e t test is such a model,
idiere a pooled variance feature Is permitted for comparisons betveen groups vlth unequal numbers.
The statistical model chosen for testing the seven hypo theses of
differences as measured by the graduation/vithdraval rate vas chi square.
42Kerlinger, Op. Cit., pp. 258-259*
39The graduâtlon/vlthdraiml rate> being a nominal measure, does not meet the
assumptions underlying the use of a parametric statistic* Chi square can
be used with noadnal measure and is particularly suitable for problems in-]iOvolving discrete variables. A reproduction of the statistical design can
be found as Appendix C.
Sources of Data and Collection Procedures Used
The data were obtained from three basic sources:
(1) The University of Clclahoma Student Directory, I966-67(2) The University of ovi«hni» Permanent Record Cards (Transcript
of Grades)(3) The University of Oklahoma Admission File Folders (original
application and related papers > also called correspondence file).
The Student Directory was obtained from the University Library Historical collection., The other two source documents were maintained in the Office
of the Dean of Admissions and Registrar. The permanent record cards served
as the source of data necessary to the testing of twelve of the fourteen null hypotheses. In connection with the tvo null hypotheses concerned with
the legal residence of the students, tvo hundred randomly selected file fold
ers were sampled, among the six hundred such folders in the native saiq>le
group, in order to obtain thirty or more non-resident native students, A
total of forty-five such names were obtained which were then matched against
an equal number of resident native students. The permanent record cards gave balance of data needed.
43George H. Weinberg and John A. Shumaker, Statistics An Intuitive Approach (Belmont, California: Wadsworth Publishers, 1962), p. 193.
40Initially, It vas anticipated that only inactive record cards would
be used; because a substantial number of students in the sample were still
enrolled as of June, I969, both active and Inactive records were used In the final compilation of names for the population. These were then matched
against those in the Student Directory.
The Student Personal Data Sheet was designed as the primary collec
tion Instrument. The Instrument permitted uniform checking of all permanent record cards and served as a work sheet for cceiputlng Individual grade
point averages. It also proved useful as a source document for key punch cards idrlch were used In tabulating, computing of the cumulative mean
grade point averages, and statistical variances. (See Appendix C for reproduction of Personal Data Sheet.)
Population and Sampling !<!ethod
T h e Student Directory published by the University Student Senate
listed 2,303 students classified as Junior In Its I966-67 edition. Ihe source for the directory listing was a computer printed list of registra
tions as of September, I966, furnished to the Senate by the Office of Ad
missions and Records.
Students vho had already received a degree In another field, such as lav students, vere eliminated from the population as the study sou^t
original undergraduate comparisons. Those with three to eleven hours of
transfer credit did not meet the limitations of the study and vere elimi
nated, as their status regarding classification remained undetermined at the time the study was cooq>leted. Also eliminated were 86 students ^ o
ell^ier enrolled and did not attend or vho changed their name after enrolling.
kl
A population of 1,878 studanta remained. A rectangular graph of the popu
lation can be found on page 42.
The sampling procedure centered around the application of a list
of random numbers to each student's personal data sheets. After eliminating
the personal data sheets of students who did not meet study lisiitatione, the
personal data sheets were divided into two groups: the transfer student group and the non-transfer student group, in alphabetical order. The per
sonal data sheets vere then numbered serially within each group with a total of 6o4 transfer students and a total of 1,140 non-transfer students remaining.
At the same time the student's personal data sheets were being hand
sorted, a computer generated list of random numbers was being prepared by44the computer center. The random deviates for the sample were taken from
a normal distribution beginning with Interger number 2 end expending to
n-.iaber yy'j. Out of t'ue 604 personal data sheens in the tranaier group, four
were withdrawn under the following procedure: four random numbers vere
taken from the list of random numbers and then personal data sheets bearing
these same numbers were withdrawn from the pile of data sheets, leaving a sample group of 600 transfer students. Out of the l,l40 sheets in the non
transfer group, 600 were selected using the following procedure: 600 ran
dom numbers were taken from the list and the data sheets bearing those same
numbers were withdrawn from the pile of data sheets, thus constituting a
sample group of 600 non-transfer students.
llJl .Conçïuter Sub-Routine RAHEUp Scientific Sub-Routine Package 360- A-CM- 03 X, Version 3> International Business Machines Co., I967.

k2
One further sampling procedure was carried out vdien out of the non- transfer group, 100 student personal data sheets were withdrawn using the
IdentlcsûL procedure described above In order to study certain demographic
characteristics with a smaller sub-sample group In more depth than the orig
inal data sheets permitted. These actions completed the ss#pllng procedures used. Technical support for the coaqputatlons was obtained from the Univer
sity computing center throu^ the use of key punch cards prepared from the
personal data sheets.
Population
Sample A
{'Transfer Group)
H 6o4
Sample B
(native Group)
N 1140
I Sample C
Enrolled Irouo)
N 134
1878-
Third Year Undergraduates as of the Pall Semester, I966 at
the University of Oklahoma Who Met limitations of Study
^^Source of Ifames; Student Directory I966-67, University of Oklahoma and IMlverslty of Oklahoma Permanent Record Cards, Office of Dean of Admissions and Registrar.
43
Svanm>ry
In mummry, tha atudy began with defining the probiem ae a concern
for the academic perfonaance of transfer students at the University of Okla
homa. The problem was examined by a costparative study in which the major elements of the problem were identified, the students classifications were
designated as the independent variable, and the cumulative grade point av
erages as the primary dependent variable. Data were found to be available
for the study in the Office of the Dean of Admissions and Registrar. Juniors
enrolled as of Phil, 1)66, at the University of Oklahoma were sampled by a random sampling method. Null hypotheses were developed as a result of ex
amining the parts of the problem. The testing of these hypotheses was accomplished through the use of a matrix design. The specific test used was t h e Lent- o I' d l l '1 ' e r e n c r n î bwLwecn iiamn 1 a I'wr t, i tü-’; d i r-r ncr.,, t;?.-
tween the various sample groups of students as measured by the cumulative
grade point averages. The testing of the hypotheses through the use of an
alternate dependent variable, namely the graduation/withdrawal rate, was
accomplished through the application of the chi square statistical model.
The results of the application of these tests to the data leading to acceptance or rejection of the various hypotheses is presented in Chapter IV which follows. The .05 level of difference was the level set at which the null hypotheses could be rejected. Differences at the .01 or .001 level, if any, would be so noted.

CHAPTER IV
FINDI1Ï08 OF THE STUDY
The purpose of this chapter Is to present the findings of the
study with particular reference to the testing of the hypotheses developed in Chapter III. It is divided into three sections. The first is concerned
with the demographic data comparison leading to a profile of the student
whose academic performance was measured; the second with the testing of the hypotheses through an examination of differences between the mean of the
cumulative grade point average of the transfer ntudent cample group and the
non-transfer student sample group; and the third -.d.th the testing of the
hypotheses through an examination of the differences between the graduation/
withdrawal rates of the transfer student sample group and the non-transfer student sample group.
A Demographic Picture of the Student Population
Despite the size of the University of Oklahoma with over 12,000
undergraduate students enrolled in the fall of I966 in a diversity of course
offerings, the Junior class of I966-67 appeared to be a rather homogeneous group. Mueller pointed out the similarity of interests, living routines,
k6and age of college youth. Her generalizations would appear to apply to
^iCate Mueller, Student Personnel Work in Higher Education. (Boston: Houghton Mifflin Company, 1962), p. 97*
44

45students at the University of Oklahoma as much as they applied to students at the University of Indiana where she did much of her research. The Uni
versity of Oklahoma has an extensive dormitory system and the age range of
the junior class vas essentially the same as the limited age range found at
the University of Indiana -- 20-23 years of age.The majority of the students entered for the first time either in
the fall of 1966 (the transfer group) or the fall of 1964 (the non-transfer
group). Of the 1200 students, 10Ô0 were between I9 and 2h years of age.Two out of three were males. Six out of ten attended and graduated from a
high school in Oklahoma; rather evenly distributed between high schools in the large urban centers of Oklahoma City and Tulsa and graduates from high
schools in smaller cities such as Altus, Lawton, or Norman. There were fev frca towns of less than 5,COO population. In the out-of-state group,
students from high schools in the Dallas-Fort Worth area were frequently
found as well as students from the Greater New York and Chicago areas.There were few students from the Mountain States or West Coast cities.
With but few exceptions, the transfer students had earned from
to 60 credit hours; some students had earned more, primarily those \dio had
changed their majors several times. The transfer students' cumulative grade
point average earned from fall of 1966 until graduation or withdrawal varied,
but the majority were in the 2.00 to 3.00 range with an average grade point of 2.50 on a 4.00 point scale. In-state transfer students are required to
have a cumulative grade point average of 1.6 on a 4.00 scale for admission,
\diile out-of-state transfer students are required to have a cumulative grade
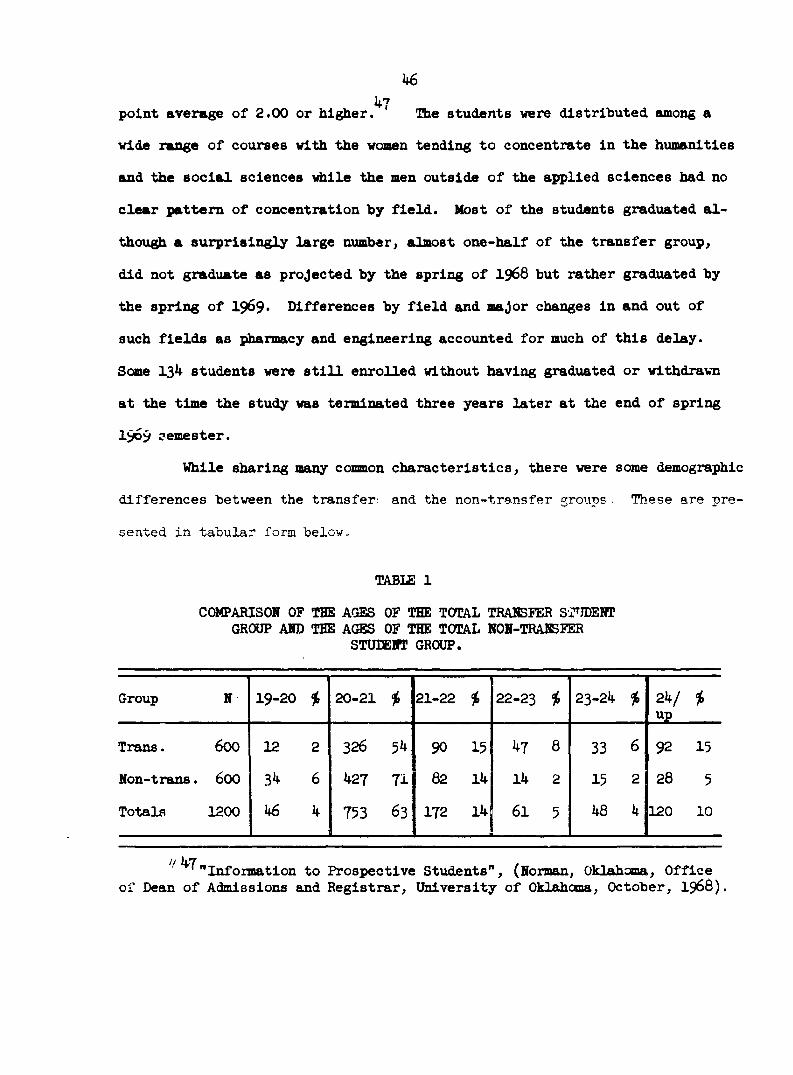
k6k'îpoint average of 2.00 or higher. The students were distributed among a
wide range of courses with the women tending to concentrate in the humanities
and the social sciences \diile the men outside of the applied sciences had no
clear pattern of concentration by field. Most of the students graduated al
though a surprisingly large number; almost one-heilf of the transfer group,
did not graduate as projected by the spring of I966 but rather graduated by the spring of I969. Differences by field and major changes in and out of
such fields as pharmacy and engineering accounted for much of this delay.
Some 134 students were still enrolled without having graduated or withdrawn at the time the study was terminated three years later at the end of spring
1969 semester.While sharing many common characteristics, there were some demographic
differences between the transfer and the non-transfer groups These are pre
sented in tabular form below.
TÂBI£ 1
COMPARISON OF THE A Œ 8 OF THE TOTAL TRANSFER SÙDDENT GROUP AND THE A Œ S OF THE TOTAL NON-TRAIBFER
STUIEWr GROUP.
Group N 19-20 20-21 $ 21-22 $ 22-23 23-24 24/up
Trans. 600 12 2 326 54 90 15 47 8 33 6 92 15Non-trans. 600 34 6 427 71 82 14 14 2 15 2 28 5
Totals 1200 46 4 753 63 172 14 61 5 48 4 120 10
^ ^"Information to Prospective Students", (Norman, Oklahoma, Office of Dean of Admissions and Registrar, University of Oklahoma, October, I968),

47
Ab shown In Table 1 the transfer student group showed a greater variance in
age cooipared to the non-transfer student group being some^diat older but having
the same medlsm age, 20, as the non-transfers.
TABIZ 2COMPARISON OF THE TRANSFER STUKNT GROUP AND
NON-TRANSFER STUDENT CffiOUP BY SEX
Group N Ifele Per Cent Female Per Cent Total Per Cent
Transfers 600 3Ô7 6k.3
Non-transfers 600 375 62.5
Total 1200 762 63.5
213
225438
35.5
37.5
36.5
100100100
The distribution of the tvo groups by sex «■as strikingly similar in Table 2, 64.5 per cent of the transfer students and 62.5 per cent of th:
non-transfer students were male; while 35«5 per cent and 37*5 per cent respectively of the two groups were female.
TABIE 3
CŒPARISON OF TRANSFER STUDENT GROUP AND NON-TRAIBFER STUnSNT GROUP BY TYPE OF ORIGINAL COLLEGE
Group N Uni- Per verslty Cent
State Per Coll. Cent
Prl. Per Coll. Cent
Jun. Per Coll. Cent
Total Per Cent
Transfer 600 159 27 149 25 104 17 188 31 100
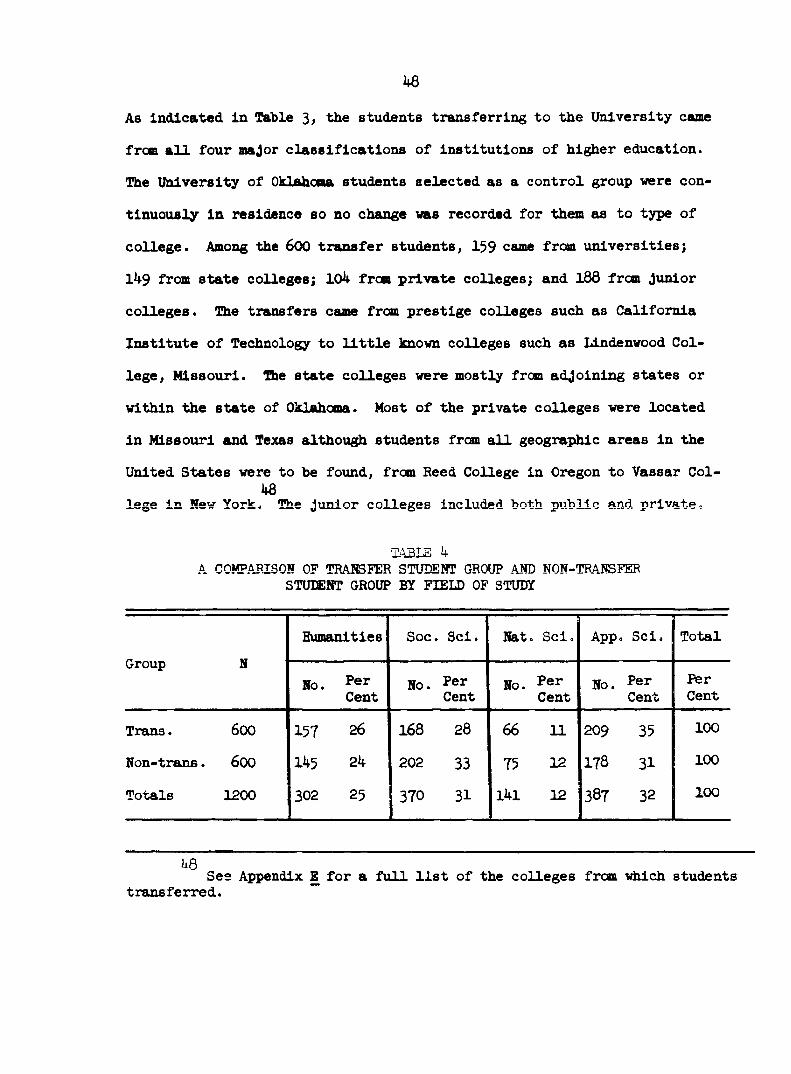
48
As Indicated in Table 3, the students transferring to the University came
from four major classifications of institutions of higher education. The Uhiversity of Oklahosm students selected as a control group were con
tinuously in residence so no change was recorded for them as to type of
college. Among the 600 transfer students, 139 came from universities;
149 from state colleges; 104 from private colleges; and l88 from junior
colleges. The transfers came from prestige colleges such as California Institute of Technology to little known colleges such as Lindenvood Col
lege, Missouri. The state colleges were mostly from adjoining states or
within the state of Oklahoma. Most of the private colleges were located
in Missouri and Texas although students from all geographic areas in theUnited States were to be found, from Reed College in Oregon to Vassar Col-
48lege in New York. The junior colleges included both public and private.
ÏA3LS 4A COMPARISON OF TRAfBFER STUDENT GROUP AND NON-TRANSFER
STUIENT GROUP BY FIELD OF STUDY
Group NHumanities Soc. Sci. Nat. Sci. App, Sci. Total
No. PerCent
No. Per Cent No. Per
Cent No. PerCent
PerCent
Trans. 600 157 26 168 28 66 11 209 35 100
Non-trans. 6oo 145 24 202 33 75 12 178 31 100
Totals 1200 302 25 370 31 l4l 12 387 32 100
48 See Appendix E for a full list of the colleges from which students transferred.

49
The distribution of the students by field of study as presented in Table 4
showed that both the transfer students and the non-transfer students were
enrolled in a wide range of academic fields of study. Among the transfer
students 209 out of 600 had major concentrations in the applied sciences. However there were representations in all major fields with men particu
larly choosing the applied sciences including the college of business
\diile women tended to choose the humanities and social sciences. A mi
nority of both groups chose the natural sciences.In addition to the comparisons made between the two large sample
groups of 600 each, a group of 100 transfer students and a group of 100
non-transfer students were randomly selected as outlined in Chapter III
from their respective groups of 60C transfer students and 600 non-trsmsfer 49students. The additional Information obtained from their correspondence
file ’fl’as their marital status, their legal residency status, and the name
of the town or city in which they graduated from high school.
4*3^ A sample of 100 was considered adequate to constitute a normal distribution for idiich implications could be drawn. George H. Weinberg and John A. Schumaker, Statistics An Intuitive Approach (Belmont, California: Wadsworth Publishing Company, Inc., 1962), pi 203.

50
TABI£ 5A CŒ4PARIS0M OF SAMPIZS OF THE TRAHBfER STUDBm GROUP
AHD THE HOH.TRAHBÆR STUIZHT GROUP ACCORDING TO MARITAL STATUS AT THE BEGINNING
OF THE JUNIOR TEAR
Group N Married Not Married
Transfers LOONon-transfers 100
Totals 200
121628
88
84172
As presented in Table 5, 12 out of the 100 transfer students in this sample were self reported as married; \diile l6 out of the 100 non-transfer students
in the sample were self reported as married. It should be noted these data
were frca tlie original application form and were not necessarily represent
ative of their marital status at graduation. 'The majority of the students
in both groups were unmarried.
TABIE 6
A CŒPARISON OF SAMPIES OF THE TRANSFER STOTENT GROUP AND THE NON-TRANSFER STUDEST GROUP ACCORDING TO LEGAL
RESIDENCY AND NON-RESIDENCY STATUS
Group N Residents Non-Residents
Transfers 100
Non-transfers 100
Totals 200
576o
117
^3
40
33
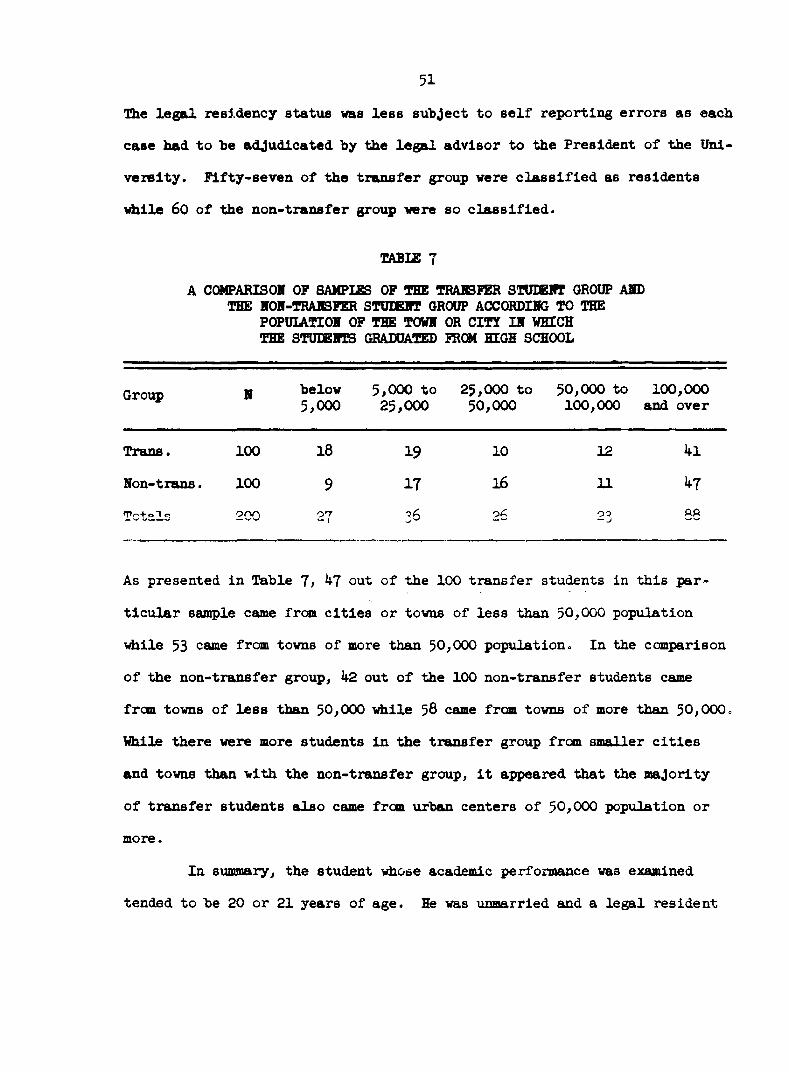
51The legal residency status was less subject to self reporting errors as each case had to be adjudicated by the legal advisor to the President of the Uni
versity. Fifty-seven of the transfer group were classified as residents lAlle 60 of the non-transfer group were so classified.
TAB1£ 7A C(M*ARISOI OF SAMP1£S OF THE TRAR3fER STUIEHT GROUP AHD
THE H0H-TRAH3FER STUIEHI GROUP ACCORDIHG TO THE PQPÜIATIOI OF THE TOWH OR CITY IH WHICH THE STUIXRIS GRADUATED FRCM HIGH SCHOOL
Group H below5,000
5,000 to25,000
25,000 to 50,000
50,000 to 100,000
100,000 and over
Trans. 100 18 19 10 12 41
Non-trans. 100 9 17 16 11 47Totals 200 27 36 26 23 SB
As presented In Table 7, ^7 out of the 100 transfer students in this particular sample came from cities or towns of less than $0,000 population
\dille $3 came from towns of more than $0,000 population. In the comparison
of the non-transfer group, k2 out of the 100 non-transfer students came from towns of less than $0,000 while $8 came from towns of more than $0,000.
While there were more students In the transfer group from smaller cities
and towns than with the non-transfer group. It appeared that the majority
of transfer students also ceune from urban centers of $0,000 population or more.
In summary, the student whose academic performance was examined
tended to be 20 or 21 years of age. He was unmarried and a legal resident
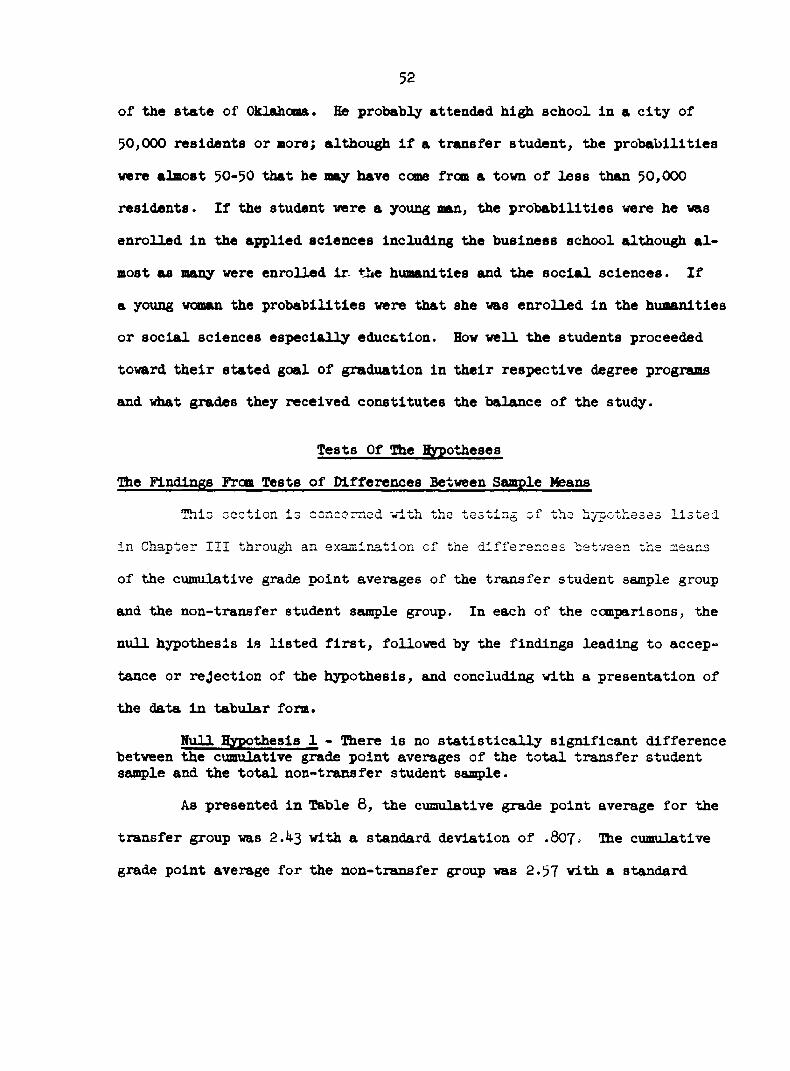
52
of the state of Oklahoma. He probably attended high school in a city of
50,000 residents or more; although if a transfer student, the probabilities
were almost 50-5O that he may have come from a town of less than 50,000 residents. If the student were a young man, the probabilities were he was
enrolled in the applied sciences including the business school although almost as many were enrolled ir the humanities and the social sciences. If
a young woman the probabilities were that she was enrolled in the humanities
or social sciences especially education. How well the students proceeded
toward their stated goal of graduation in their respective degree programs
and what grades they received constitutes the balance of the study.
Tests Of The Hypotheses
The Findings From Tests of Differences Between Sample Means
ThiG GGction is conccmod vith the testing of tha hypotheses listed
in Chapter III through an examination of the differences hetveen the means
of the cumulative grade point averages of the transfer student sample group and the non-transfer student sample group. In each of the comparisons, the
null hypothesis is listed first, followed by the findings leading to accep
tance or rejection of the hypothesis, and concluding with a presentation of the data in tabular form.
Hull %pothesis 1 - Oiere is no statistically significant difference between the cumulative grade point averages of the total transfer student sangle and the total non-transfer student sample.
As presented in Table 8, the cumulative grade point average for the
transfer group was 2.43 with a standard deviation of .807. The cumulative
grade point average for the non-transfer group was 2.57 with a standard

53deviation of .701. The t value obtained was 3«3& lAlch was statistically significant beyond the .001 level. Since the non-transfer students showed
a significantly higher grade point average than the transfer students, null
hypothesis one was rejected. There w«*s a statistically significant difference between the two groups - In favor of the non-transfer group.
TABUS 8
A COMPARISOI OF THE MEAI OF THE CUMULATIVE GRAK POIMT AVERAGE OF THE TOTAL TRAHSFER CmOUP AHD THE MEAH
OF TEE CUMULATIVE GRABE POIIT AVERAGE OF THE TOTAL HOH-TRAESIER GROUP
Group H Mean StandardDeviation
S. E. of Dlff. t value
Transfers 600 2.43 .807
Non-transfers 600 2.57 ,701 3.36*^Significant at the .001 level.50
Null Hypothesis 2 - There Is no statistically significant difference between the cumulative grade point average of the out-of-state transfer sample and the In-state transfer student sample.
"Die data for this canparison concern solely the transfer group. Hence the total size of the two sub-groups of In-state transfers and out-
of-state transfers totals 600 students rather than 1200 as presented in
Table 8. As presented In Table 9, the cumulative grade point average for
the In-state transfer groups was 2.33 with a standard deviation of .869
Distribution of t probability: from Table III by R. A. Fisherand F. Yates, Statistical Tables for Biological, Agricultural, and Medical Research. Edinburg, Scotland: Oliver and Boyd Ltd. as reproduced InDownle and Heath, Basic Statistical Methods (London: Harper and Row, 1965).
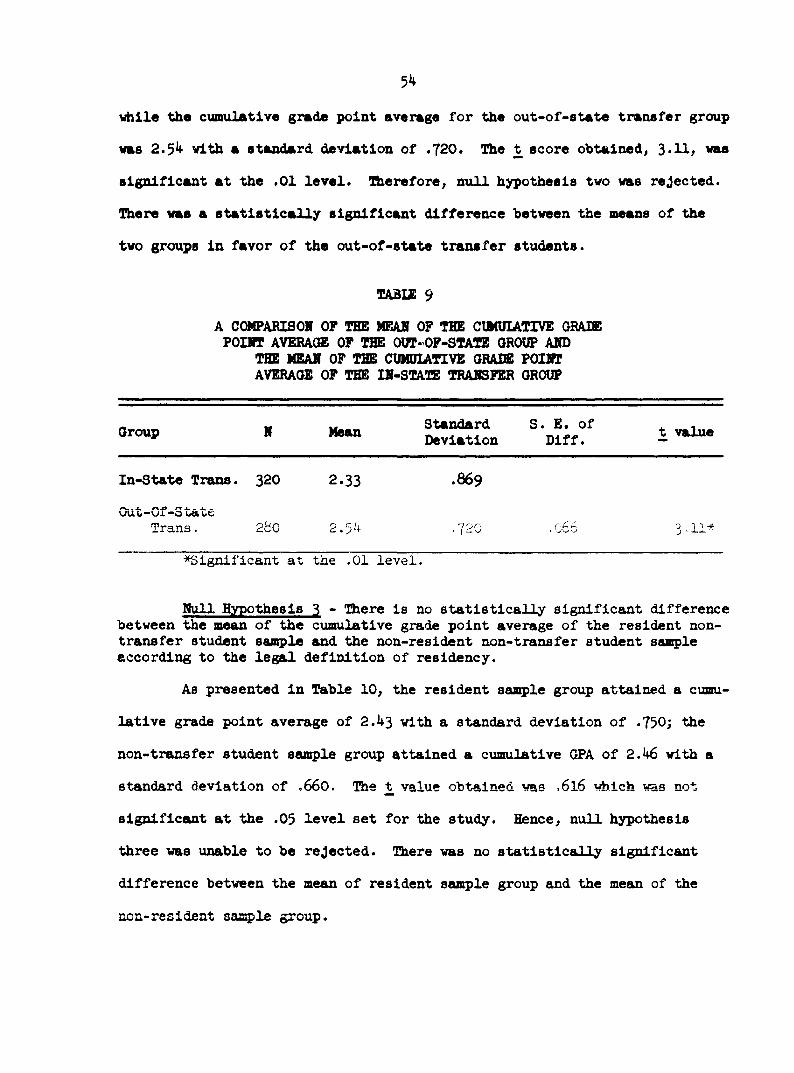
54
while the cumulative grade point average for the out-of-state transfer group
was 2.54 with a standard deviation of .720. The t score obtained, 3*11; vas
significant at the .01 level. Therefore, null hypothesis two was rejected, ühere was a statistically significant difference between the means of the
two groups in favor of the out-of-state transfer students.
TA3I£ 9A CCMPARISOH OF THE MEAH OF THE CIMUUTIVE GBAIX FOIHT AVERACæ OF THE OOT-OF-STATE GROUP AHD
THE MEAH OF THE CUMUIATIVE GRADE POIRT AVERAGE OF THE IH-STATE TRAHSFER GROUP
Group H Mean StandardDeviation
S. E. of Diff. t value
In-state Trans. 320 2.33 .869Out-Of-State
Trans. 280 2.34 .720 .066 3 11-Significant at the .01 level.
Hull Hypothesis 3 - There is no statistically significant differencebetween the mean of the cumulative grade point average of the resident nontransfer student sample and the non-resident non-transfer student sample according to the legal definition of residency.
As presented in Table 10, the resident saaqple group attained a cumu
lative grade point average of 2.43 with a standard deviation of .750; the
non-transfer student sample group attained a cumulative GPA of 2.46 with a
standard deviation of ,66o. The t value obtained was .616 ^dxich was not
significsint at the .03 level set for the study. Hence, null hypothesis
three was unable to be rejected. There was no statistically significant
difference between the mean of resident saaq)le group and the mean of the
non-resident sample group.

55
TABLE 10A CCBfPARISOX OF THE MEAH OF THE CIMUUTIVE GRAIZ POIHT AVERAGE OF THE lOH-TRAHBFER RESIOEVr STUIÜHI SAMPI£ WITH THE MEAH OF THE CUMUUTIVE GRADE POIHT AVERAGE
OF THE H0H-TRAH3IER H0H-RE8IŒHT STUDEHT SAMPLE ACCORDIHG TO THE IZOAL DBFIHITIOH
OF RESIDEHCE
Group H Mean StandardDeviation
S. E. of Dlff. t value
Residents 45 2.43 .750Non-Residents 45 2.46 .660 15 .616
Ho Blgnlflc&nt t value vas obtained.
Bun i ^ othesls 4 - There Is no statistically significant difference between the cumulative grade point averages of the transfer student saaq>le and the non-transfer student sample - according to type of original college.
As presented in Table 11, the cumulative grade point average Tor
the transfer group from other universities was 2.69 with a standard deviation of .823; the group from private colleges had a mean GPA of 2.57 with
a standard deviation of .60O; the group from junior colleges had a mean
GPA of 2.16 with a standard deviation of .892. When compared to the pre
viously established cumulative GPA of the non-transfer group of 2.57 with
a standard deviation of .7OI, the application of the t test to the data
produced t values of 1 .88, -2.92, -.047, and -6.59 respectively. Two of these t values, namely those of the state college group and the junior col
lege group, were statistically significant at the .01 level of difference
or beyond, both of the values being In favor of the non-transfer group. Therefore, null hypothesis four was rejected. There was a statistically

‘j6
significant difference between the cumulative grade point averages of the
state college student sample group and the junior college student sample group respectively compared to the cumulative grade point averages of the
non-transfer student sample group in both instances in favor of the non
transfer saatple group.
TABIE 11
A COMPARISON OF THE MEAN OF THE CUMUUTIVE MEAN GRADE POINT AVERAGE OF THE TRAIBFER GROUP AND THE MEAN
OF THE CUMUUTIVE MEAN GRADE POINT AVERAGE OF THE NON-TRANBPER GROUP ACCORDING
TO TYPE OF ORIGINAL COLIEGE
Transfer Group Non-Transfer Group
Type N Mean S D Type N Mean S D S E ofDiff. t value
Uni V. Hi 9 .U9ÜüILLn.Univ. 600 . YÜ1 1.Ü8
StateCollege 149 2.37 .823
Okla.Univ. 600 2.57 .701 .067 -2.92*
PrivateCollege 104 2.57 .600
Okla.Univ. 600 2.57 .701 •073 - .047
JuniorCollege 188 2.16 .892
Okla.Univ. 600 2.57 .701 .063 -6.57**
•Significant at .01 level. ••Significant at the .001 level.
Hull Hypothesis 3 - There is no statistically significant difference between the cumulative grade point averages of the transfer student sample and the non-transfer student sample according to regional location of original college.
As presented In Table 12, the majority of the students in this particular series of sample transfer groups came from the Southeast and South*rn

t)7region and the North-Central>Mldwest region rather than the Northoaot-Mld- Atlantlc or Wee tern area. Studenta fro» the northaaot tranal’er group
achieved the highest mean grade point average, 2 .66, for the transfer groups
ae compared to the Oklahoma University student who were the non-transfer control group with a mean grade point average of 2 .^7 * However, none of
the transfer groups were found to differ statistically significantly from the non-transfer group, with the highest t value being .817 In the case of
the Northeast student group. Hence null hypothesis five was unable to be
rejected. There was no statistically significant difference between the means of the transfer student sample group and the non-transfer student
sample group according to regional location of original college.
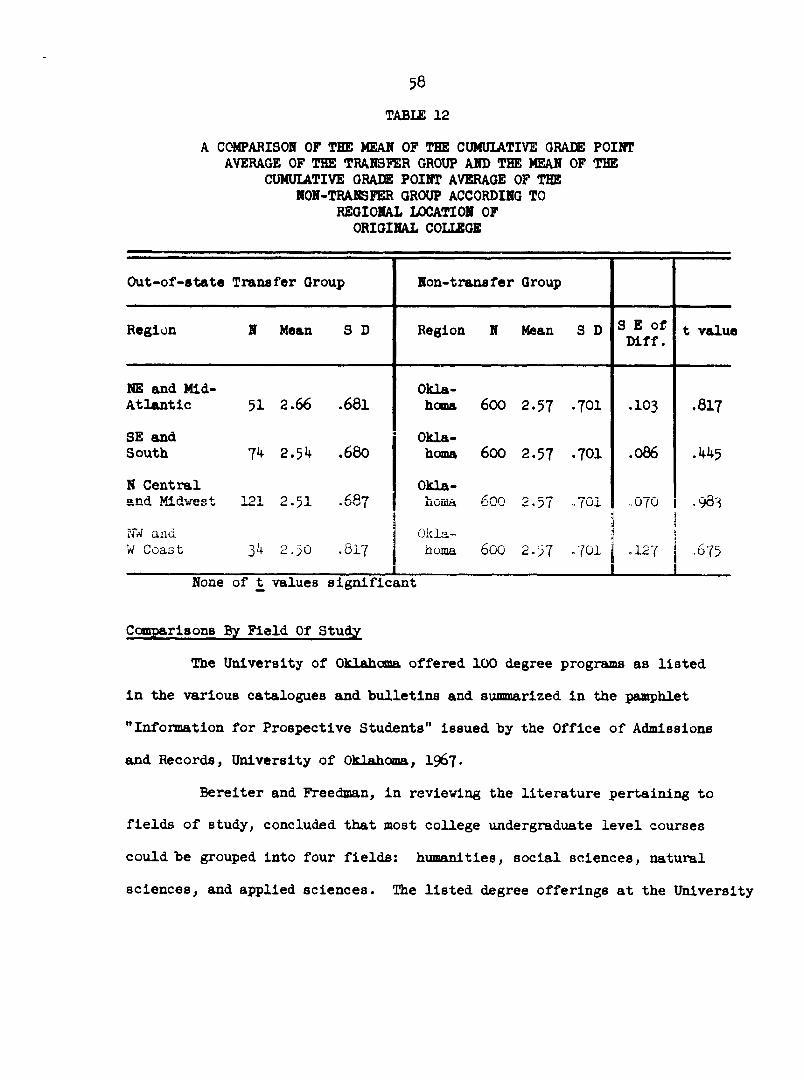
56
TAB1£ 12
A COMPARISON OF THE MEAN OF THE CUMULATIVE GRAZE POINT AVERAGE OF THE TRANSFER GROUP AND THE MEAN OF THE
CUMUIATIVE GRADE POINT AVERAGE OF THE NON-TRANSFER GROUP ACCORDING TO
REGIONAL LOCATION OF ORIGINAL COLIEGE
Out-of-state Transfer Group Non-transfer Group
Region N Mean S D Region N Mean S D S E of Diff. t valu#
NE and Mid- Atlantic 51 2.66 .681
Oklahoma 600 2.57 .701 .103 .817
SE and South 714 2.54 .680
Oklahoma 600 2.57 .701 .086 .445
N Centraland Midwest 121 2.51 .687
Oklahoma 600 2.57 701 .070 .983Î
and W Coast 3^ 2.50 .817
Oklahoma 600 2.57 .701 ,127
=,675
None of t values significant
Compariaons By Field Of Study
The University of Oklahoma offered 100 degree programs as listed
in the various catalogues and bulletins and summarized in the pamphlet
"Information for Prospective Students" issued by the Office of Admissions and Records, University of Oklahoma, 1967.
Bereiter and Freedman, in reviewing the literature pertaining to fields of study, concluded that most college undergraduate level courses
could be grouped into four fields: humanities, social sciences, natural
sciences, and applied sciences. The listed degree offerings at the University
59of Oklahoma were then assigned to one of these classifications. Assistance
in the classification process was provided hy the research librarian, Bizzell
Memorial Library, Uhiversity of Oklahoma. The full listing of this assignment of the degree offerings is reported in Appendix A condensation
of the major degree offerings included in the four fields of study categories
is presented below:Humanities: In the humanities the following disci
plines can be found: Art, Drama, English,Music, languages. History, Philosophy,Russian Studies. Journalism is also included.
Social Sciences: In the social sciences, the following disciplines can be found: Anthropology, Economics, Education, Home Economics, Political Science, Sociology and Social Work, Library Science, plus some subjects rot common to undergraduate curriculums such as Urban Studies.
Natural Sciences; In the natural sciences, the following disciplines can be found: Astronomy, Chemistry, Geology, Mathematics, Pharmacology, Pre-Medicine, and Zoology.
Applied Sciences: Accounting and related businesssubjects. Engineering with many subgroupings, Medical Technology, Nursing,Physical Therapy and Sanitary Science.
Testing the hypotheses of differences between the mean of the cumulative mean grade point averages of transfer group and the mean of the
Bereiter and Freedman, "Field of Study and the People in Them", The American College, ed. Nevitt Sanford (New York: Wiley and Son, I962), p. 571.
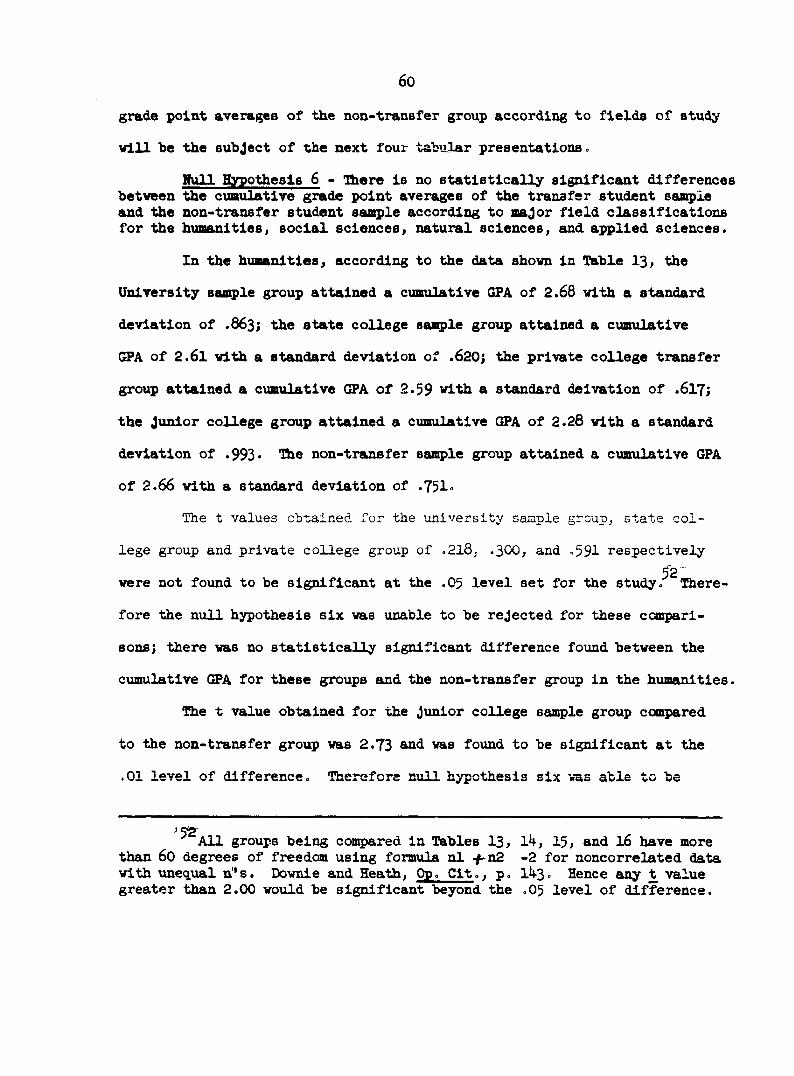
60grade point averages of the non-transfer group according to fields of study will he the subject of the next four tabular presentations.
I>un Hypothesis 6 - There is no statistically significant differences between the cumulative grade point averages of the transfer student eauqple and the non-transfer student saiq>le according to major field classifications for the humanities, social sciences, natural sciences, emd. applied, sciences.
In the humanities, according to the data shown in Table I3, the
University saag>le group attained a cumulative GPA of 2.68 with a standard deviation of .663; the state college saBg>le group attained a cumulative GPA of 2.61 with a standard deviation of .620; the private college transfer
group attained a cumulative GPA of 2.59 with a standard delvation of .617;
the junior college group attained a cumulative GPA of 2.28 with a standard
deviation of .993* The non-transfer sample group attained a cumulative GPAof 2.66 with a standard deviation of .751.
The t values obtained for the university sample group, state col
lege group and private college group of .218, .3OO, and .591 respectively52were not found to be significant at the .05 level set for the study. There
fore the null hypothesis six was unable to be rejected for these compari
sons; there was no statistically significant difference found between the
cumulative GPA for these groups and the non-trans fer group in the humanities.The t value obtained for the junior college sample group compared
to the non-transfer group was 2.73 and was found to be significant at the .01 level of difference. Therefore null hypothesis six was able to be
All groups being conçared in Tables I3, l4, I5, and I6 have more than 60 degrees of freedom using formula nl .f-n2 -2 for noncorrelated datawith unequal n’'s. Downie and Heath, Op. Cit., p. 1^3 . Hence any t value greater than 2.00 would be significant beyond the .05 level of difference.

61rejected Insofar as the Junior college sample group vas concerned. There
vas a statistically significant difference between the cumulative GPA of the Junior college group and the non-transfer group in favor of the non
transfer group in the humanities.
TABLE 13A COMPARISON OF THE MEAN OF THE CUMULATIVE GRADE POINT
AVERAGE OF TEE TRANSFER GROUP AND THE MEAN OF THE CUMUIATIVE GRADE POINT AVERAGE OF
THE NON-TRANSFER GROUP BY TYPE OF ORIGINAL COLIEGE IN
THE HUMANITIES
Transfer Group Non-transfer Group
Type
University
StateCollege
PrivateCollege
JuniorCollege
N Mean S D
46
25
40
46
2.68
2.61
2.59
2.28
.863
.620
.617
.993
Type
Okla., Univ,
Okla.Univ.
Okla.Univ.
Okla.Univ.
N Mean S D S E of Diff. t value
145 2.66 .741
145 2.66 .741
145 2.66 .741
145 2.66 .741
131 .218
L .
.128
,137
-•591
-2.73*^Significant at the .01 level.
Hull Hypothesis 6 - There is no statistically significant difference between the cumulative grade point averages of the transfer student sample and the non-transfer student sample according to type of original college in the social sciences.
In the social sciences, according to the data shown in Table l4,
the university sample group attained a cumulative GPA of 2.82 with a

62standard deviation of .583; the state college sample group attained a cumu
lative GPA of 2.38 with a standard deviation of .986; the private college
sample group attained a cumulative GPA of 2.^4 with a standard deviation
of .633; the junior college sample group attained a cumulative GPA of 2.26
with a standard deviation of .y4l. The non-transfer sample group attained
a cumulative GPA of 2 .$$ with a standard deviation of .678.The t value obtained for the university saoule group of 2.5O was
significant at the .05 level set for the study. Therefore, null hypothesis
six was able to be rejected for this comparison. There was a statistically significant difference found between the cumulative GPA's of the university
transfer student sample group and the non-transfer sample group in favor
of the university seunple group.The t value obtained for the state college sample group of -.139
"ms not found to be significant at the .05 level. Therefore, null hypoth
esis six was unable to be rejected for this comparison. There vas not a
statistically significant difference between the cumulative GPA’s of the
state college transfer student sample and the non-transfer student sample.
The t value obtained for the private coU.ege group of .088 was not
significant at the .05 level. Therefore, null hypothesis six was unable
to be rejected for this comparison. There was no statistically signifi
cant difference found between the cumulative GPA of the private college group and the non-transfer sample group.
The t value obtained for the Junior college sample group of -2.17
was found to be significant at the .05 level. Therefore, null hypothesis
six was able to be rejected for this comparison. There was a statistically

63
significant difference between the cumulative GPA of the junior college
transfer student san >le and the non-transfer student seuople In favor of the non-transfer student sample group In the social sciences.
TABI£ 14
A COMPARISON OF THE MEAH OF THE CIMUIATIVE GRADE POINT AVERAGE OF TEE TRANSFER GBOUP AND THE MEAN OF THE
CUMUIATIVE GRADE POINT AVERAΠOF THE NON-TRANSTER GROUP BY TYPE OF
ORIGINAL COLLEGE IN THE SOCIAL SCIENCES
Transfer Group Non-transfer Group
Type N Mean S D Type N Meem S D S E of Dlff. t value
University 47 2.82 .5830k1 n »Univ. 202 2.55 .678 .107 2.50*
StateCollege 40 2.38 .986
Okla, Univ. 202 2.55 .678 .126 -I.38
PrivateCollege 28 2.54 .633
Okla.Univ. 202 2,55 .678 .136 -0.088
JuniorCollege 53 2.26 .741
Okla.Univ. 202 2.55 .678 .107 -2.17*
* Significant at the .05 level.
Null Hypothesis 6 - There Is no statistically significant difference between the cumulative grade point averages of the transfer student sample according to major field cJ^asslficatlons In the natural sciences.
In the natural sciences, according to the data shown In Table 15,
the university sanrple group attalae d a cumulative CffA of 2.58 with a
standard deviation of .612; the state college sample group attained a cumu
lative GPA of 2.43 with a standard deviation of .$82; the private college
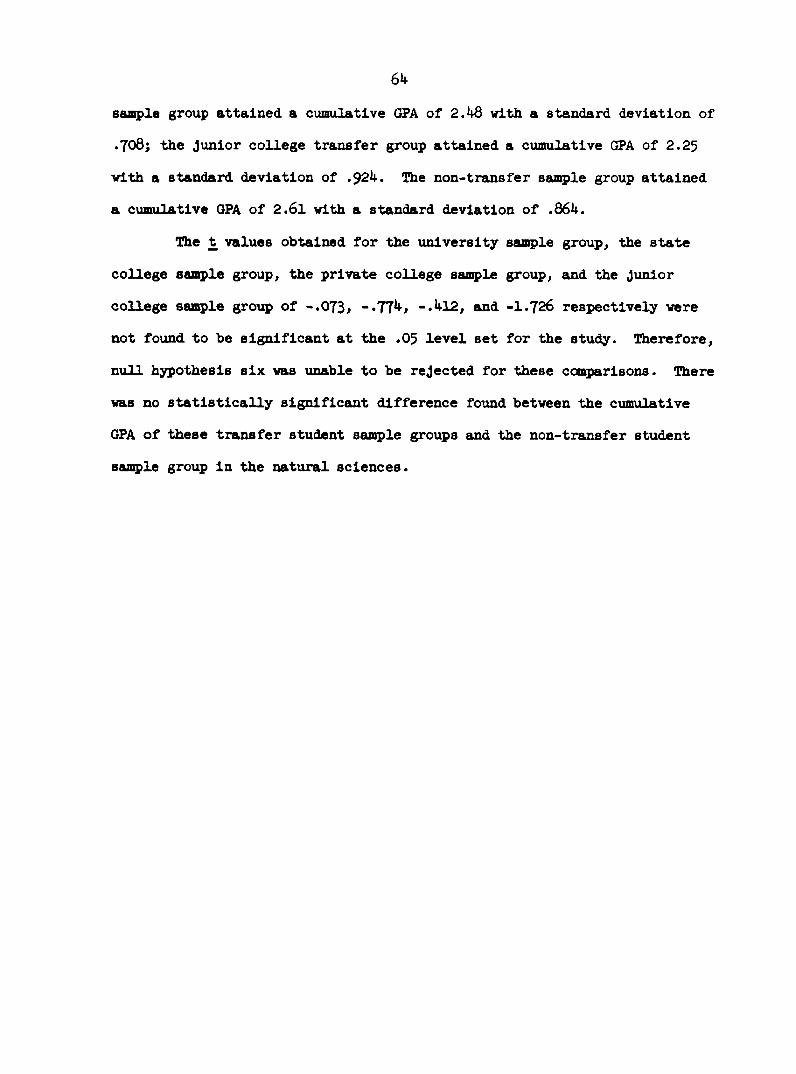
64sample group attained a cumulative GPA of 2.48 with a standard deviation of .708; the Junior college transfer group attained a cumulative GPA of 2.25
with a standard deviation of .924. The non-transfer sample group attained
a cumulative GPA of 2.61 with a standard deviation of .864.
The t values obtained for the university sample group, the state
college samrple group, the private college saunple group, amd the Junior
college sample group of -.073# -.774# -.412, and -I.726 respectively were not found to be significant at the .05 level set for the study. Therefore, null hypothesis six was unable to be rejected for these couqarisons. Ihere
was no statistically significemt difference found between the cumulative GPA of these transfer student sangle groups emd the non-transfer student saunple group in the natural sciences.

65
TABI£ 15A COMPARISOI OF THE MEAI OF THE CUMUIATIVE GRATE POUTT AVERAGES OF THE TRAIBFER ŒOUP AID THE MEAI OF THE
CUMUIATIVE GRADE POUT AVERAGES OF THE NOI-TRAISPER GROUP ACCORDIHG TO TYPE
OF ORIGIIAL COLIECæ II THE NATURAL SCIEHCE8
Transfer Group Non-transfer Group
Type I Mean S D Type I Mean 8 D S E of Diff, t value
University 15 2.58 .612Okla.Univ. 75 2.61 .864 .235 -.073
StateCollege 18 2 .J+3 .982
Okla.Univ. 75 2.61 .864 .233 -.774
PrivateCollege 9 . 2.Ü8 .708
Okla.Univ, 75 2,61 .864 ,300 _ kl2
JuniorCollege 2k 2.25 .924
Okla.Univ. 75 2.61 .864 .206 -1.726
lull Hypothesis 6 - There is no statistically significant difference between the cumulative grade point averages of the transfer student sample and the non-transfer student sample according to major field classifications of the applied sciences.
In the applied sciences, according to the data shown in Table l6,
the university sample group attained a cumulative GPA of 2 .6o with a standard deviation of .650; the state college sample group attained a cumulative
GPA of 2.28 with a standard deviation of .730; the private college sample
group attained a cumulative GPA of 2.53 with a standard deviation of .535;
the junior college transfer sample group attained a cumulative GPA of 1.95

66
with a standard deviation of .9IO. The non-transfer control group attained
a cumulative GPA of 2.51 with a standard, deviation of .612.The t values obtained for the university sample group and the pri
vate college sample group of .923 and .570 respectively were not found to be significant at the .05 level set for the study. Therefore null hypothesis six was unable to be rejected for these comparisons. There was no sta
tistically significant difference found between the cumulative GPA's of
these transfer studemt saa^le groups and the non-transfer student sample groups in the applied sciences.
The t value obtained for the state college sample group of -2 .49
was found to be significant at the .05 level. Therefore, null hypothesis six was able to be rejected for this comparison. There was a statistically
significant difference between the cuzsulative GPA's of the state college
group and the non-transfer group in favor of the non-transfer student sample
group in the applied sciences.
The t value obtained for the Junior college sample group of -5.44
was found to be statistically significant at the .001 level. Therefore,
null hypothesis six was able to be rejected for this comparison. There
was a statistically significant difference between the cumulative GPA of the Junior college transfer student saa^le and the non-transfer student
sample in favor of the non-transfer student sample group in the applied
sciences.

67
TABLE 16
A COMPARISOH OF THE MEAN OF THE CUMULATIVE GRADE POINT AVERAGES OF THE TRANSFER GROUP WITH THE MEAN OF THE CUMUIATIVE GRAIE POINT AVERAGES OF THE SON-TRANSFER
GROUP ACCORDING TO TYPE OF ORIGINAL COLLEGE IN THE APPLIED SCIENCES
Transfer Group Non-transfer Group
Type N Mean S D Type N Mean S D S E Of Diff. t value
University 51 2.60 .650Okla.Univ. 178 2.51 .612 .099 .923
StateCollege 66 2.28 .730
Okla.Univ. 178 2.51 .612 .093 -2 .49*
PrivateCollege 26 2.58 .535
Okla.Iftiiv. 178 2.51 .612
!612
.126 .570JuniorCollege 64 1.95 .910
Ohla .Univ . 173 .103
^Significant at the .05 level. ♦Significant at the .001 level.
Null Hypothesis 7 - There is no statistically significant difference between the cumulative grade noint averages of the male transfer student sample amd the female transfer student sample according to major field classification.
In the humanities, as shown in Table 17, the male sample group attained a cumulative GPA of 2 .hi with a standard deviation of .902. The female sample group attained a cumulative GPA of 2.66 with a standard deviation of .718. The t value obtained was I.50 which was not statistically significant at the .05 level. Hence, null hypothesis seven was unable to be rejected in the comparison of the means of the cumulative GPA of the male and female sample groups in the humanities.
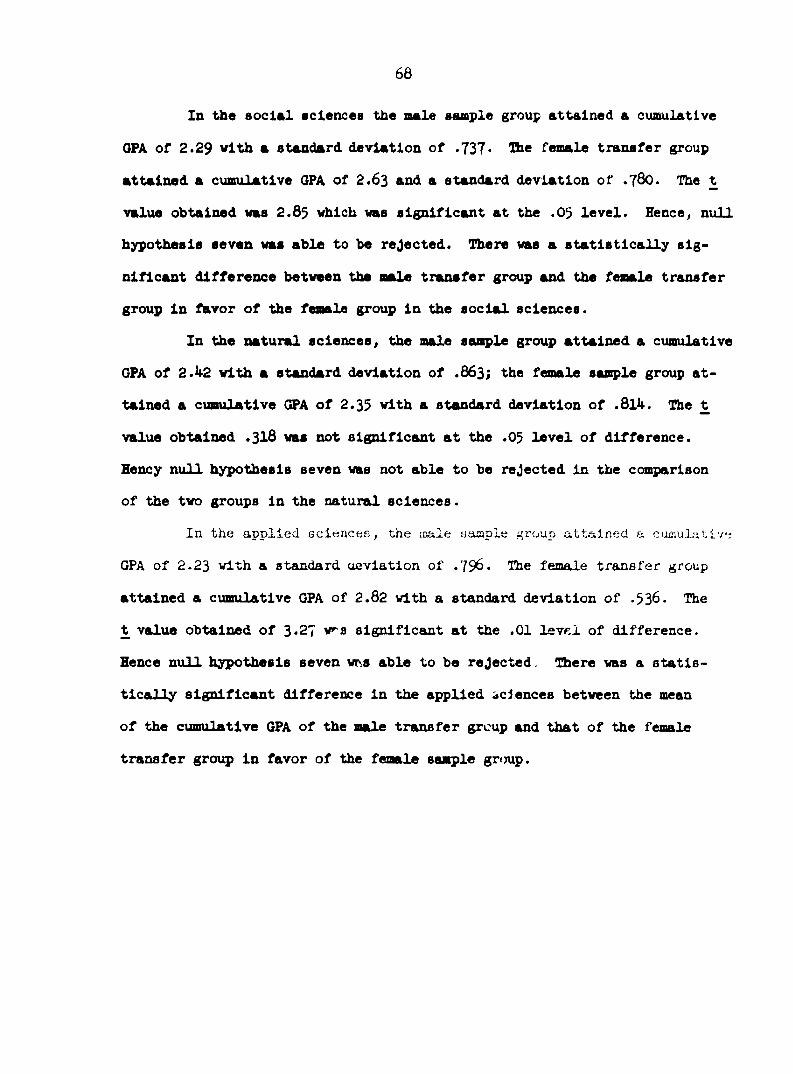
68
In the social sciences the male sample group attained a cumulative
GPA of 2.29 with a standard deviation of .737* The female transfer group
attained a cumulative GPA of 2.63 and a standard deviation of .7^0 . The t
value obtained was 2 .8$ which was significant at the .0$ level. Hence, null hypothesis seven was able to be rejected. There was a statistically sig
nificant difference between the male transfer group and the female transfer group in f&vor of the female group in the social sciences.
In the natural sciences, the male sample group attained a cumulative GPA of 2.42 with a standard deviation of .863; the female ssunple group at
tained a cumulative GPA of 2.3$ with a standard deviation of .814. The t
value obtained .318 was not significant at the .0$ level of difference.Hency null hypothesis seven was not able to be rejected in the comparison of the two groups in the natural sciences.
In the applied sciences, the ^ale sample group attained a cumulative
GPA of 2.23 with a standard ueviaticn of .79^. The female transfer group attained a cumulative GPA of 2.82 with a standard deviation of .$36. The t value obtained of 3*2? w^s significant at the .01 level of difference. Hence null hypothesis seven WRS able to be rejected. There was a statis
tically significant difference in the applied sciences between the mean
of the cumulative GPA of the male transfer group and that of the female transfer group in favor of the female sample group.
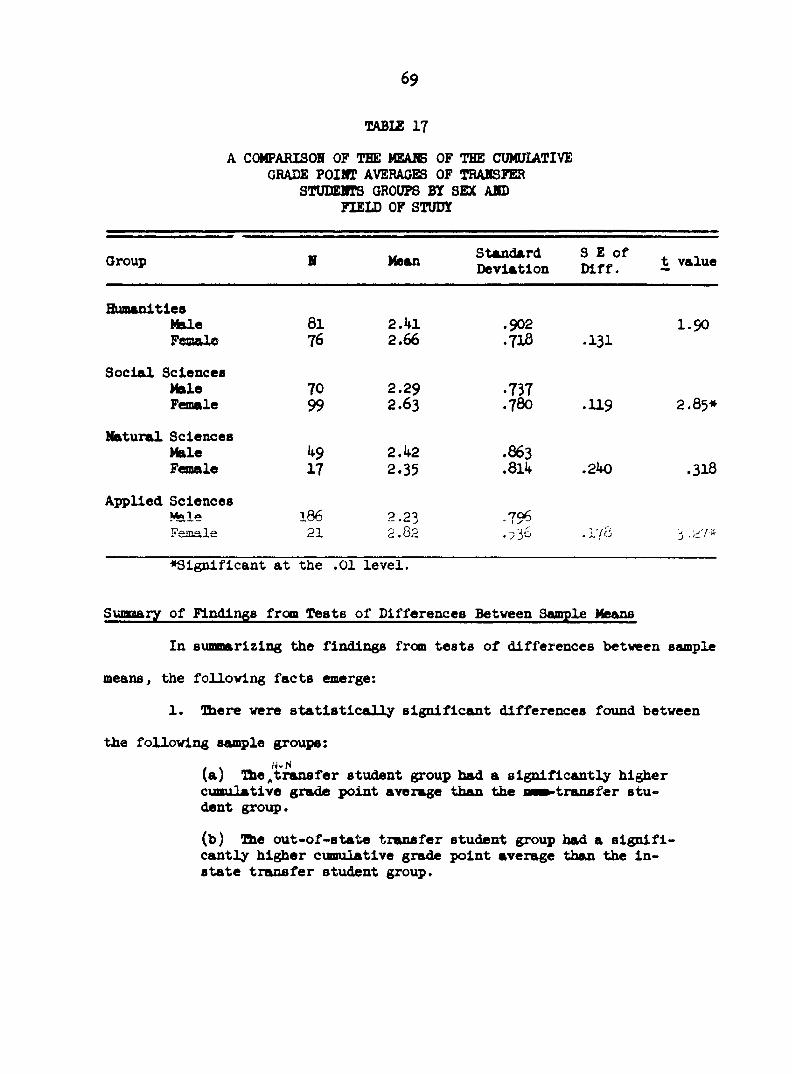
69
TABIZ 17
A CCMPARISOH OF TEE MEANS OF THE CUMUIATIVE GRADE POINT AVERAGES OF TRANSFER
STUDENTS GROUPS BY SEX AND FIELD OF STUDY
Group N Mean StandardDeviation
S E of Diff. t value
HumanitiesMale 81 2.41 .902 1.90Female 76 2.66 .718 •131
Social Sciences Male Female
7099
2.292.63
.737
.780 .119 2.85*
Natural Sciences Male Female
4917
2.422.35
.863
.814 .240 .318Applied Sciences
NfeleFemale
18621
2.232.82
.796
.,36 .178 j.27*••Significant at the .01 level.
Summary of Findings from Teste of Differences Between Sample Means
In summarizing the findings from testa of differences between sample means, the following facts emerge:
1. There were statistically significant differences found between the following sample groupe:
(a) The transfer student group had a significantly higher cumulative grade point average than the mmm»transfer student group.
(b) The out-of-state transfer student group bsid a significantly higher cumulative grade point average than the instate transfer student group.

70
(c) The non-transfer student group had a significantly higher cumulative grade point average than the state college student group and the junior college student group respectively.
(d) The non-transfer student group had a significantly higher cumulative grade point average than the transfer student group in the major field classifications of the humamitles^ social sciences, and applied sciences.(e) The female transfer student group had a significantly higher cumulative grade point average than the male transfer student group.
2 . There were no statistically significant differences noted in
the following comparisons between the sas^le groups:
(a) The transfer student group did not have any significantly different cumulative grade point average than the non-transfer student group according to regional location of their original college.(b) The transfer student group did not have any significantly different cumulative grade point averagethan the non-transl’er student according to the major field classification of natural sciences.
(c) The resident student group did not have any significantly different cumulative grade point average than the non-resident student group.
The Findings frcat Tests of Differences as Measured by the Graduation/Withdrawal Rate
The infoimation presented in this portion of the study deals with
the findings from the application of the graduation/withdrawal rate to the
data. The graduation/withdrawal rate was chosen as an alternate dependent
variable. In addition^ the measure permitted an examination of the persist
ence of the transfer sample group as compared to the persistence of the non
transfer sanqple group. The data are presented in the order identical to the previous presentation: statement of the null hypothesis, the findings in
narrative form, and closing with a tabular presentation of the findings.
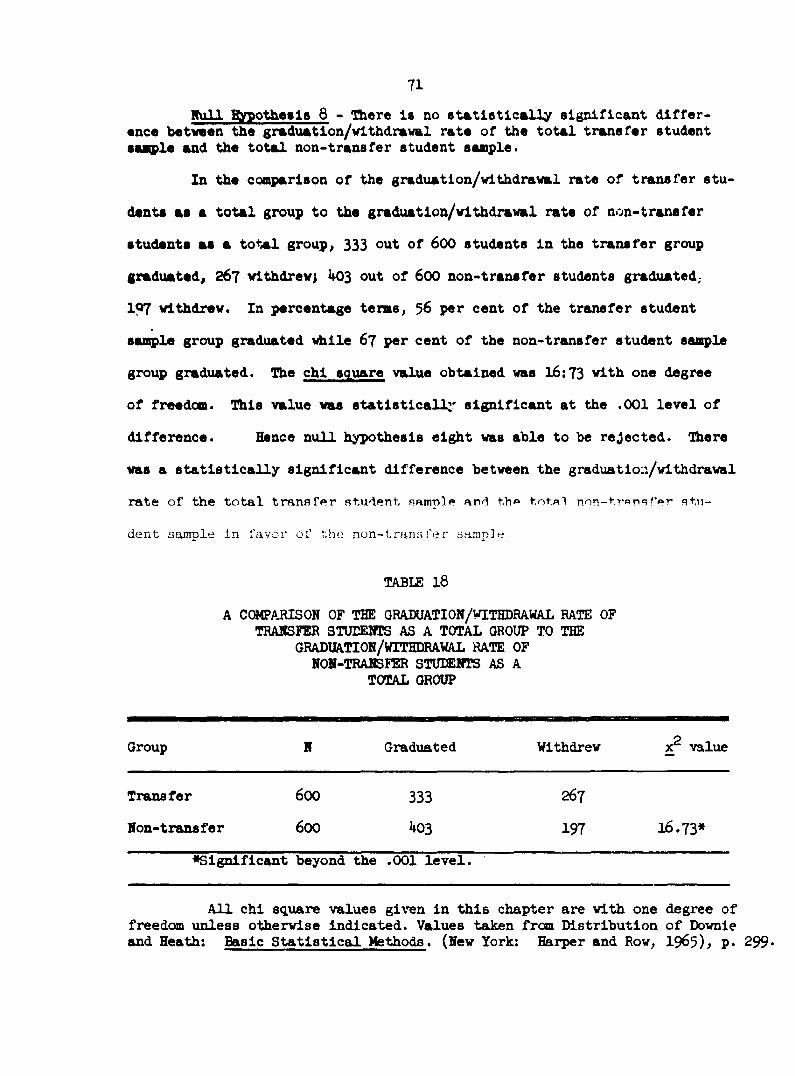
71Null gypothe«ia 8 - There Is no statistically significant differ
ence between the graduation/withdrawal rate of the total transfer student saaqple and the total non-transfer student sample.
In the comparison of the greduatlon/wlthdraval rate of transfer stu
dents as a total group to the graduation/withdrawal rate of n.^n-transfer students as a total group, 333 out of 600 students In the transfer group
graduated, 267 vlthdrev; 403 out of 60O non-transfer students graduated,107 withdrew. In percentage terms, $6 per cent of the transfer student
saiqple group graduated ^lle 67 per cent of the non-trsmsfer student sample
group graduated. The chi square value obtained was 16:73 with one degree of freedom. This value was statistically' significant at the .001 level of
difference. Hence null hypothesis eight was able to be rejected. There was a statistically significant difference between the graduation/withdrawal rate of the total transfer student sample and the total non-trsnsf'er stu
dent sample in favor of the non-transfer sample
TABI£ 18
A CCSCPARISON OF THE GRADUATION/WITHDRAWAL RATE OF TRANSFER STUDENTS AS A TOTAL GROUP TO THE
GRADUATION/WITHDRAWAL RATE OF NON-TRANSFER STUIENTS AS A
TOTAL GROUP
Group N Graduated Withdrew value
Transfer 600 333 267Non-transfer 600 403 197 16.73*
•Significant beyond the .001 level.
All chi square values given In this chapter are with one degree of freedom unless otherwise indicated. Values taken from Distribution of Dovnle and Heath: Basic Statistical Methods. (New York: Harper and Row, 1$6 ), p. 299*
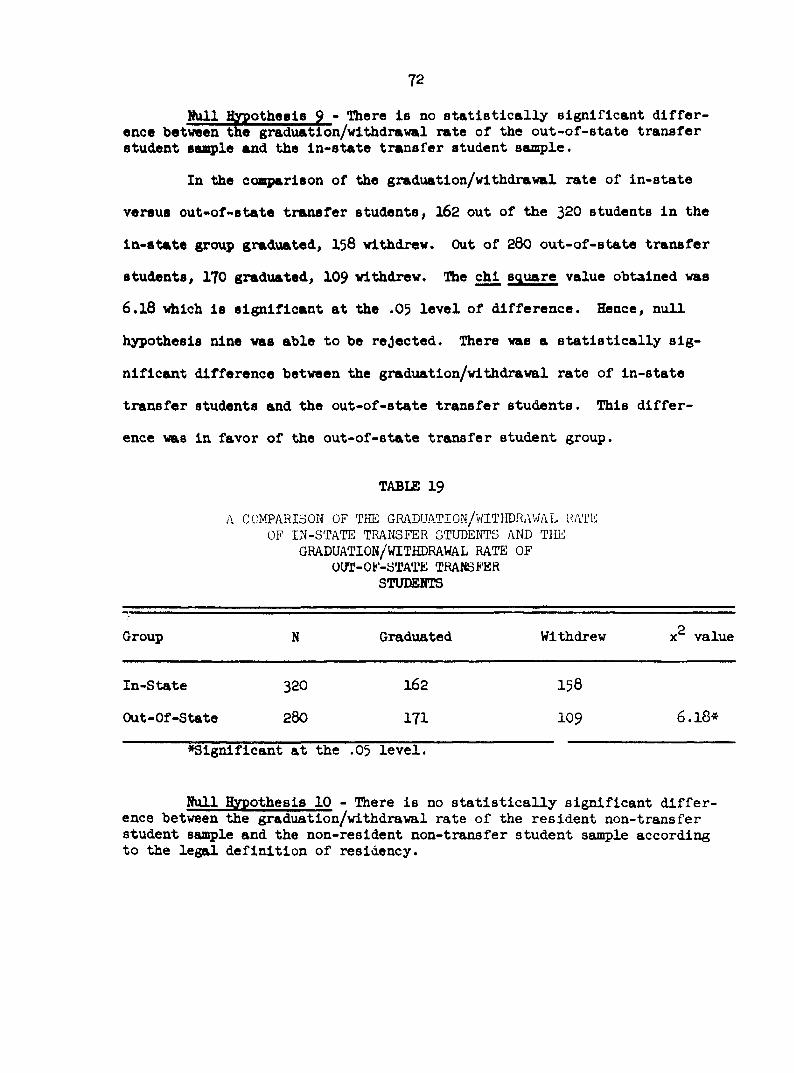
72
Null ^ypothesls 9 - There la no statistically significant difference between tne graduation/withdrawal rate of the out-of-state transfer student santple and the in-state transfer student sample.
In the comparison of the graduation/withdrawal rate of in-state versus out-of-state transfer students, 162 out of the 320 students in the
in-state group graduated, 136 withdrew. Out of 200 out-of-state transfer
students, 170 graduated, IO9 withdrew. The chi square value obtained was 6.16 lAich is significant at the .03 level of difference. Hence, null hypothesis nine was able to be rejected. There was a statistically sig
nificant difference between the graduation/withdrawal rate of in-state transfer students and the out-of-state transfer students. This differ
ence was in favor of the out-of-state transfer student group.
TABLE 19A COMPARISON OF THE GRADUATION/WITHDRAWAL KATE
OF IN-STATE TRANSFER STUDENTS AND THE GRADUATION/WITHDRAWAL RATE OF
OUT-OF-STATE TRANSFER STUDENTS
Group N Graduated Withdrew 0X value
In-State 320 162 158
Out-Of-State 280 171 109 6.18*
^Significant at the .03 level.
Null Hypothesis 10 - There is no statistically significant difference between the graduation/withdrawal rate of the resident non-transfer student sample and the non-resident non-transfer student sample according to the legal definition of residency.
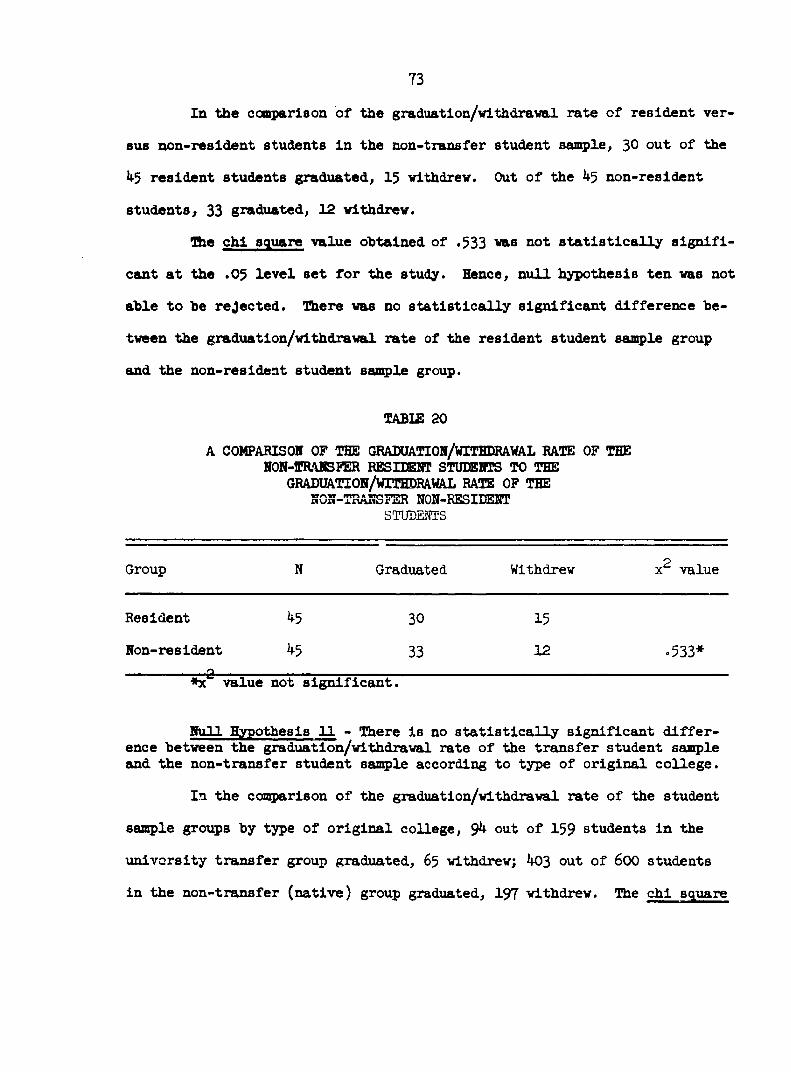
73
In the comparison of the graduation/withdraval rate of resident versus non-resident students in the non-transfer student sanqple, 30 out of the
4$ resident students graduated, 15 withdrew. Out of the 45 non-resident
students, 33 graduated, 12 withdrew.The chi square value obtained of .533 was not statistically signifi
cant at the .05 level set for the study. Hence, null hypothesis ten was not able to be rejected. There was no statistically significant difference be
tween the graduat ion/withdrawal rate of the resident student sangle group and the non-resident student sangle group.
ZABI£ 20A COMPARISOH OF TEE GRADUATIOH/WITEDRAWAL RATE OF THE
NON-ffRAHSPER RESUŒHT STUDERTS TO THE GRADUATION/WITHDRAWAL RATE OF THE
3FER NON-ÏSTUDENTS
Group N Graduated Withdrew value
Resident 45 30 15Hon-resident-------- rr-Q---=--
45 33 12 .533**x value not significant.
Hull Hypothesis 11 - There is no statistically significant difference between the graduation/withdrawal rate of the transfer student sample and the non-transfer student sample according to type of original college.
In the comparison of the graduation/withdrawal rate of the student
sazople groups by type of original college, 9^ out of 159 students in the
university transfer group graduated, 65 withdrew; 403 out of 6OO students
in the non-transfer (native) group graduated, 197 withdrew. The chi square
74value obtained 3-25> vas not significant at the .05 level set for the study. Hency, null hypothesis eleven vas unable to be rejected In the university transfer student comparison.
In the comqiarison of the graduation/vithdraval rate of the state
college transfer group, 82 out of 149 students in the state college transfer group graduated, 6? vlthdrev; 403 out of 600 students in the non-transfer
(native) group graduated, 197 vithdrew. The chi square value obtained,
7 *10, V8U3 significant at the .01 level or beyond. Hence, null hypothesis
eleven vas able to be rejected in the state college transfer group comparison in favor of the non-transfer student group.
In the comparison of the graduation/vithdraval rate of the private
college transfer group, 65 out of I03 students in the private college transfer group graduated, 38 withdrew; 403 out of 600 students in the non-transfer (native) group graduated, 197 withdrew. The chi square value obtained,
.481, was not significant at the .05 level set for the study. Hence, null hypothesis eleven was unable to be rejected in the private college comparison.
In the comparison of the graduation/vithdraval rate of junior col
lege transfer group, 91 out of 388 students in the junior college transfer group graduated, 97 withdrew. Out of 600 students in the non-transfer
(native) group, 403 graduated, 197 withdrew. The chi square value obtained,
20.75 was significant at the .001 level. Hence, null hypothesis eleven
was able to be rejected. There was a statistically significant difference
in the graduation/vithdraval rate between the junior co3JLege transfer sam
ple group and the non-transfer sample group in favor of the non-transfer sample group.
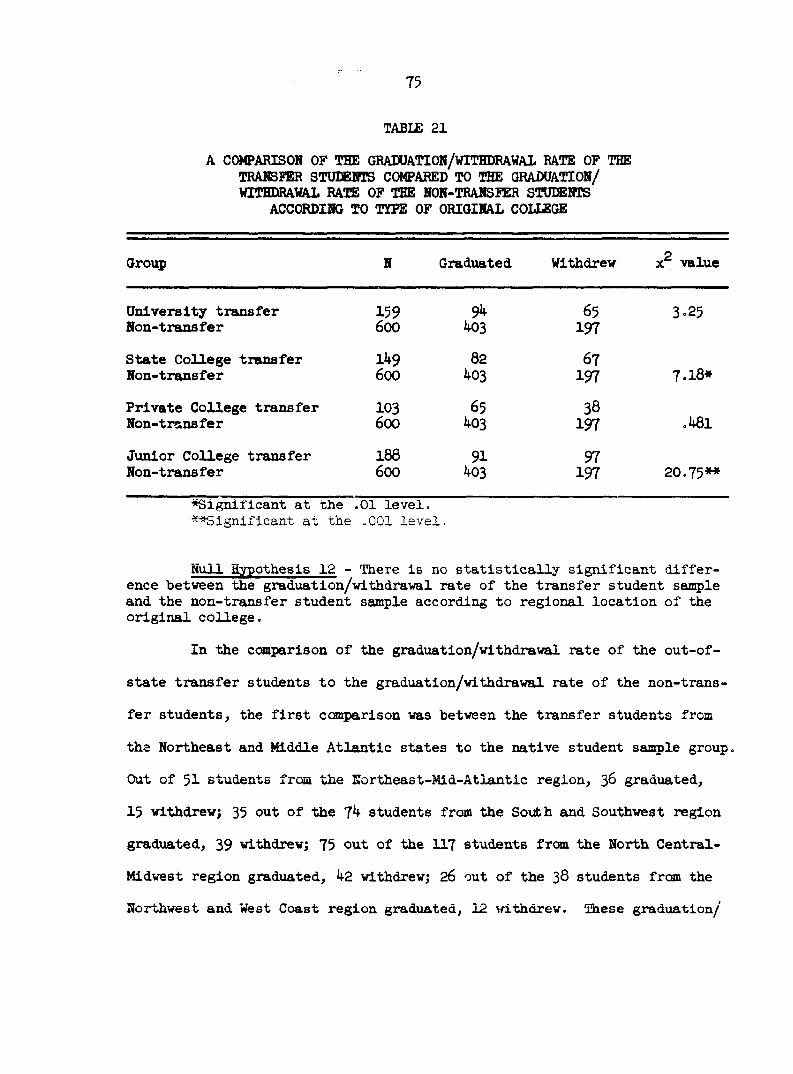
75
table 21
A CCWPARIS01Ï OF THE GRADUATION /WITHDRAWAL RATE OP THE TRANSFER STÜEËHTS CCMPARED TO THE GRADUATION/ WITHDRAWAL RATE OF THE NON-TRANSfER STUDENTS
ACCORDING TO TYPE OF ORIGINAL COLLEGE
Group N Graduated Withdrew value
University transfer 159 94 65 3.25Non-transfer 600 403 197State College transfer 149 82 67Non-transfer 600 403 197 7.18*Private College transfer 103 65 38Non-transfer 600 403 197 .481
Junior College transfer 180 91 97Non-trauisfer 600 403 197 20.75**
significant at the .01 level.■^Significant at the .001 level..
Null Hypothesis 12 - There Is no statistically significant difference between the graduation/withdrawal rate of the transfer student sample and the non-transfer student sample according to regional location of the original college.
In the comparison of the graduation/withdrawal rate of the out-of- state transfer students to the graduation/withdrawal rate of the non-transfer students, the first comparison was between the transfer students from the Northeast smd Middle Atlantic s"bates to the native student sample group. Out of $1 students from the Northeast-Mld-Atlantic region, 3^ graduated,15 withdrew; 35 out of the 7^ students from the South and Southwest region graduated, 39 withdrew; 75 out of the 117 students fr<aa the North Central- Mldwest region graduated, 42 withdrew; 26 out of "the 38 students from the Northwest and West Coast region graduated, 12 withdrew. Baese graduation/

76
vlthdraval rates were compared to those of the native students. Out of the 600 students in the non-transfer (native) sample group, U03 graduated, 147 withdrew.
The chi square values obtained were .119, 10.57, .287, and .012
respectively. The comparison between the students from the Southern area
and the Oklahoma native students was the only value significsmt. Hence, null hypothesis twelve was able to be rejected in the case of the Southern
student group in favor of the native (non-transfer) sample group. In the
other comparisons by geographic regions, there was no statistically significant difference between those groups and the native student saa^le
group.
TABLE 22
A COMPARISON OF TEE GRADUATION/WITHDRAWAL RATE OF 'TEE OUT-OF-STATE TRANSFER STUDSÎÎTS TO THE GRADUATION/WITHDRAWAL RATE OF THE NATT/E STUDENTS ACCORDING
TO THE GEOGRAPHIC REGION OF THE ORIGINAL COLI£GE
Group N Graduated Withdrew value
HE and Mid-Atlantic 51 36 15 .119Native (Oklahoma) 600 403 197South Ik 35 39 10.57*Native (Oklahoma) 600 403 197
North Cantral-MidwGst 117 75 42Native (Oklahoma) 600 403 197 .287NW and Vest Coast 38 26 12Ibtive (Oklahoma) 600 403 197 .012
^Significant at the .01 level.

77Hill] Hypothesis 13 - There is no statistically significant differ
ence betveen the graduation/vithdraval rate of the transfer student sample and the non-transfer student sangle according to major field classifications of the humanities, social sciences, natureü. sciences, and applied sciences.
In the comparison of the graduation/vithdraval rates of students by
fields of study in the humanities, 8$ out of 157 students in the transfer student sample group graduated, J2 vithdrev; 103 out of 1^5 students in the
non-transfer group seuaple graduated, k2 vithdrev. The chi square value ob
tained vhen comparing the frequencies obtained vith the frequencies expected vas 8.45 vhich vas significant beyond the .01 level. Hence, in the humani
ties, null hypothesis thirteen vas able to be rejected. There vas a sta
tistically significant difference betveen the transfer sample group and
the non-transfer sample group as measured by the graduation/vithdraval rate in favor of the non-transfer group.
In the comparison of the graduation/withdrawal rates in the social sciences, the natural sciences, and the applied sciences, the chi square
values obtained were 5-67, 2.37, and I.90 respectively; out of these three values only 5*67 vas significant beyond the .05 level. Hence in the social
sciences, there was a statistical difference, and null hypothesis thirteen
vas able to be rejected in favor of the non-transfer students. In the
natural sciences and applied sciences, the null hypotheses were unable to be rejected.
In summary, in the comparison of the graduation/vithdraval rates
of the transfer sample groups to the graduation/vithdraval rates of the non-transfer sample groups by fields of study, null hypothesis thirteen
vas able to be rejected in the humanities and the social sciences in favor

78
of the native groups. But null hypothesis thirteen was unable to be rejected in the natural sciences and applied sciences fields of study.
TABLE 23
A COMPARISQI 07 THE ORABOATIGl/WITHniAHAL RATE OF TRAHSIER STUIEEIS TO THE GRABOATIOl/WlTHDRAViAL RATE OF THE HOH-TRAHBPER STUIffiHTS ACCORBIBG
TO THE FIELD OF STUDY
Group N Graduated Withdrew 2X value
HumanitiesTransfer 157 85 72 8.45**Hbn-transfer 145 103 42
Social SciencesTransfer 168 91 77Non-transfer 202 135 67 5.67*
Natural Sciences'Transfer 00 31 35 2.37Non-transfer 75 46 29
Applied SciencesTransfer 209 126 83
178 119 59 1.90
■•«•Significant at the .01 level.
Wtiil Bvnothesis l4 - There is no statistically significant difference between the graduation/withdrawal rate of the male transfer student sample and the female transfer student sample according to major field classifications.
In the comparison of the graduation/vithdraval rates by sex and
field of study in the humanities, k2 out of the 8l students in the male
transfer group sample graduated, 39 withdrew; 43 out of the 76 students
in the female transfer group graduated, 33 wi-thdrev. The chi square value
79obtained, .186, vas not statistically significamt at the .05 level set for the study, leuce, null hypothesis fourteen vas unable to be rejected in the coBQMirison by sex and field of study in the humanities field of study.
In the cosqiarison of the graduation/vithdraval rates in the social sciences, 36 out of the 70 students in the male transfer group sample grad
uated, 3^ vithdrew; 55 out of the 98 students in the fonale transfer group
graduated, 43 withdrew. The chi square value obtained, .198, was not sta
tistically significant at the .05 level. Hence, null hypothesis fourteen was unable to be rejected in the comparison by sex and field of study in
the social sciences. There was no statistically significant difference obtained.
In the comparison of the graduat ion/withdrawal rates in the natural
science?; 23 out of the 49 students in the male transfer group graduated,
26 withdrew. Out of 17 students in the female transfer group, 8 graduated,
9 withdrew. The chi square value obtained, .075, was not significant at
the .05 level. Hence null hypothesis fourteen was unable to be rejected in the comparisons by sex and field of study in the natural sciences.
In the comparison of the graduation/withdrawal rates in the ap
plied sciences, II3 out of the I87 students in the male transfer group grad
uated, 74 withdrew. Out of 22 students in the female transfer group, I3
graduated, 9 withdrew. Tde chi square value obtained, .012, was not sig
nificant at the .05 level.
In summary, in the cootparison of the graduation/withdrawal rates of the transfer students by sex and field of study, no statistically sig-
nificGuit chi square values were obtained in any of the comparisons. Hence

8onull hypothesl# fourteen was unable to be rejected. There was no statistically significant difference in the graduation/vithdraval rates betveen
the male and female transfer students by field of study.
TAB1£ 2k
A COMPAEIISOI 07 THE ORASUATIOS/WITHDRAUAL RATE 07 TRACfER STUTERES BT SEX AID
7IELD 07 STUDY
Group I Graduated Withdrew 2X value
HumanitiesMale 81 k2 39 0.1887dmale 76 43 33
Social SciencesMale 70 36 3kFemale 98 55 k3 0.198
Natural Sciencesîfele 49 23 26Female 17 8 9 0.075
Applied SciencesMale 187 113 74Female 22 13 9 0.012
Sinmoary of Tests of the %rpotheses
The purpose of Chapter IV vas to present the findings of tho study
vith special reference to testing the null hypotheses presented in Chapter III. Differences in performance betveen the various classification groups
of students as measured by the cumulative grade point averages of the stu
dents were examined first by the t test. Differences in performance betveen
the various classification groups of students as measured by the alternate

81dependent variable, the graduation/vithdraval rate, vere then examined by
the chi square test.
The results of these examinations are presented in Table 25. Individual t values and chi square values are not included for purposes of
the summary but can be found in the individual tables adready presented
including their degree of significance of differences, at the .05 level
or beyond.
TABI£ 25
SUMMARY OF TESTS OF THE HULL HYPOTHESES
Hullhypothesis
Type of Ccsqmrison
TypeTest Results* Accept
Hull Hy.Reject Hull Hy
HO 1HO 8
Total groupsTr. vs. non-tr.
t“x2
Stat. Sig.Stat, Sig,
RR
HO 2 HO 9
In-state vs. Out-of-state
t"x2
Stat. Sig. Stat. Sig.
RR
HO 3 HO 10
Residents vs. Hon-residents V Not Stat. Sig.
Hot Stat. Sig.AA
HO k HO 11
Type of Original Coll. V Stat. Sig.
Stat. Sig.RR
HO 5 HO 12
Regional vs. Oklahoma
Hot Stat. Sig. Stat. Sig.
AR
HO 6 HO 13
Field of Study
Stat. Sig. Stat. Sig.
RR
HO 7 HO 14
Male vs. Female V Stat. Sig.
Hot. Stat. Sig. AR
■•Stat. Sig. - Statistically significant at the .05 level of difference set for the study.
Hot Stat. Sig. - Hot statistically significant at the .05 level of difference set for the study.
82Summary of Findings
Statistically significant values were obtained in the application
of the t test and the chi square test to the data in the following compari
sons - hence the null hypotheses were able to be rejected in these cosrari- sons:
(1) The total transfer student group differed from the total non-transfer student group in favor of the non-transfer group; (that is, the non-transfer student group had a significantly
higher cumulative GPA and graduation rate than the total trans
fer student group).
(2) The out-of-state transfer student group differed from the
in-state transfer student group (that is, the out-of-state student group bad a significantly higher cumulative GPA and grad-
'oaticn rate than the in-state group),
(3) The non-transfer student group differed from the transfer student group according to type of original college in favor of the non-transfer group with the exception of the university
transfers and private college transfers (that is, the non
transfer group had a significantly higher cumulative GPA and
graduation rate than the transfer group from other colleges
with the exception of transfers from universities and private
colleges where there was no difference).
(!«■) In regard to differences by fields of studies:
(a) In the humanities, there were differences found between the non-transfer group and the junior college group
83
In favor of the non-tranafer group (that Is, the null hypothesis vas able to be rejected in this comparison in the humanities).
(b) In the social sciences, there were differences between
the non-transfer group and the university group in favor of
the university group; secondly there were differences betveen the non-transfer group and the junior college group
in favor of the non-transfer group (that is, the null hy
potheses were able to be rejected in these comparisons in
the social sciences).(c) In the naturaJL sciences there were no differences found
between groups (that is, the null hypotheses were unable to be rejected in the natural sciences).
(d) In the applied sciences, there were differences betveen the junior college students and the non-transfer group in favor of the non-transfer group (that is, the null hypothesis
was able to be rejected in the junior college comparison in
the applied sciences). Similar differences were noted in the
state college comparison in the applied sciences - again in
favor of the non-transfer group (that is, the null hypothesis
was able to be rejected in the state college comparison).
Statistically significant values vere not obtained in the application
of the t test and the chi square test to the data in the following comparisons (that is, the null hypotheses were not able to be rejected in these comparisons):

84(1) The transfer student group and the non-transfer student
group did not differ according to regional location of original college except In the case of the Southern regional coorparlsons—
(that Is, the two groups did not have a significantly different cumulative GPA or graduation rate.)
(2 ) The non-transfer resident group and the non-transfer nonresident group did not differ according to the legal definition of residency — (that Is, there vas no statistically significant
difference In their cumulative GPA or graduation rate.)
Statistically significant values vere obtained In the application oft test to the data In the foliovlng cotnparlsons, but not In the application
of the chi square test to the data (that Is, the null hypothesis vas able
to be rejected only as measured by cumulative GPA):The female transfer student group differed from the ;aalo
transfer group - in favor of the female group - that is,
the female transfer group had a significantly higher cumu
lative GPA than the male transfer group.
Statistically significant differences vez*e obtained In the application of the chi square test to the data In the foUovlng comqmrlson but
not In the application of the t test to the data (that Is, the null hypoth
esis vas able to be rejected only as measured by the graduation/vithdraval
rats):The out-of-state Southern regional group differed from the non-
transfer group - In favor of the non-transfer group -(that Is, the
non-transfer group had a significantly higher graduation rate than
transfer group from the southern accrediting region.)
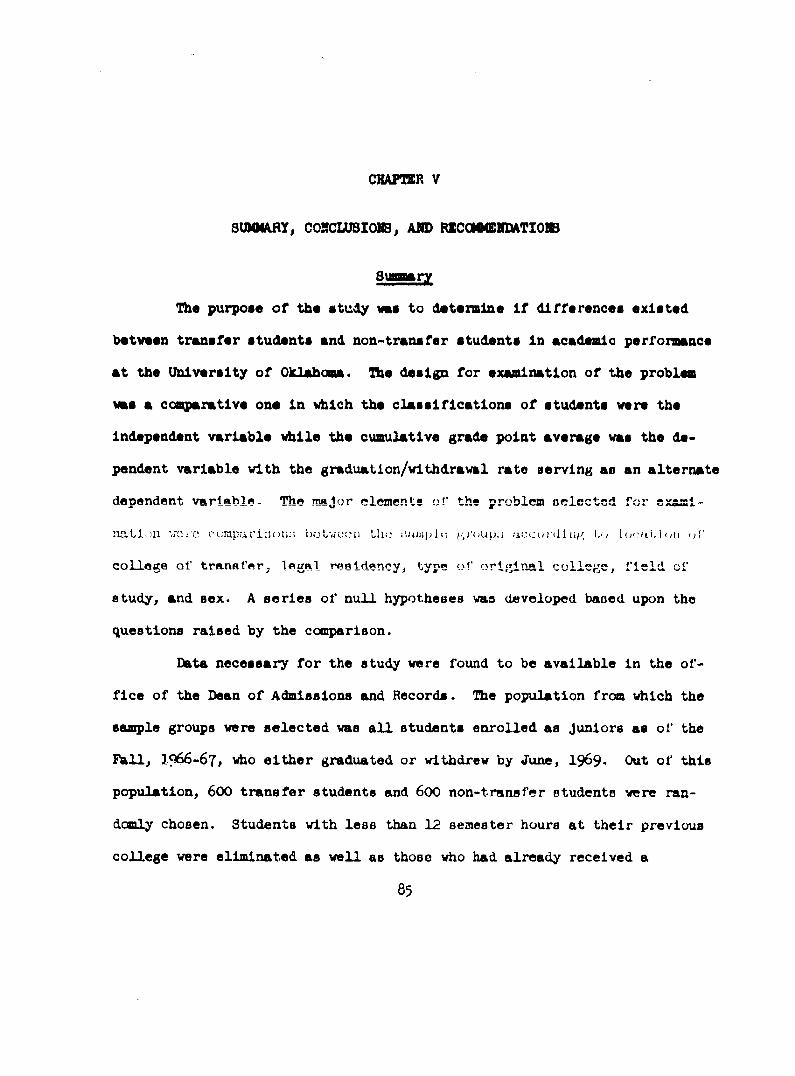
CHAPTER V
SUMMARY, COHCLUSIONB, A N D R E C O M M E N D A T I O N
Suaaaary
The purpose of the study vas to determine if differences existed
between transfer students and non-transfer students In academic performance
at the University of Oklahcna. The design for examination of the problem %ms a comparative one in which the classifications of students were the independent variable while the cumulative grade point average was the de
pendent variable with the graduation/withdrawal rate serving as an alternate dependent variable- The major elements of the problem selected for examination vcic curapnrinon;; hutwoon tho oiniiph: f.;roup,) .-iccoriilnp to hx /U,I(,u i'
college of tranafer, legal residency, type of original college, field of
study, and sox. A series of null hypotheses was developed based upon the
questions raised by the comparison.
Data necessary for the study vere found to be available in the office of the Dean of Admissions and Records. The population frcsn \diich the
sample groups were selected was all students enrolled as Juniors as of the
Fall, 15566-67, who either graduated or withdrew by June, 1969. Out of this population, 600 transfer students and 600 non-transfer students were ran
domly chosen. Students with less than 12 semester hours at their previous
college were eliminated as well as those who had already received a
85

06baccalaureate degree. A student personal data sheet vas designed for the study as a collection inetrument and worksheet for each individual student's cumulative grade point averages. Heeded items of infozmation were secured
from the registrar's permanent record cards and the file folders. The in
formation from the personal data sheet was subsequently posted to punch cards. Given the information from the punch cards, the univertity computer center performed all the needed calculations for the tables designed to test
the null hypotheses.
The statistical model chosen for testing the null hypotheses as meas
ured by the cumulative grade point averages was the t test of differences between sanq>le means. The statistical model chosen for testing the null hy
potheses of no difference between sainple groups as measured by the gradua- 'bioi'i/wltadrayal iuLu wu3 chi uquare.
Concluslong
The following conclusions are presented subject to the limitations
of the study ac to sample groups and the population from which the sample groups were drawn - students classified as juniors at the University of
Oklahoma as of September, 1$66, and continuing until either graduation or
withdrawal with a cutvoff date of June, I969.
(1) Transfer students did not perform as well academically as the non-transfer students in so far as academic grades were concerned and per
sistency to graduation.
(S) Out-of-state transfer students out-perfozmed in-state trans
fer students in academic gradms and paraietency to graduation; however, the
Ihziversity admission standards for these students was originally higher.

87
(3) Legal residency status appeared to have little or no influence upon academic grades or graduation.
(4 ) The type of original college from vAiich the student transferred appeared to make a difference in his academic grades and persistency to
graduation. Transfers from universities with enrollments in excess of 2,^00
students and trsmsfers from private colleges appeared to have the best chsmces of successfully cooqpleting course requirements. Restated, transfers from statr colleges and particularly junior college transfers had
considerable difficulty in making the transition and satisfactorily completing course requirements for graduation.
(5) The regional location of the transfer student's original col
lege appeared to make little or no difference in either academic gradesor persistency to graduation,
(6) The field of study into which the transfer student entered
and the type of original college from which be entered appeared to influ
ence his academic grades and his persistency to graduation. Students from state colleges and Junior colleges in particular appeared to have real dif
ficulty in the social sciences and the applied sciences fields of study.
In the humanities and in the natural sciences, these students had less difficulty.
(?) Female transfer students appeared to out-perform male trans
fer students In academic grades but not necessarily in persistence to graduation.

88
Recommendations(1) In viev of the differences in the findings of transfer stu
dent studies within the span of less than ten years, periodic studies of
transfer students seem indicated if information is to remain current and reflect the changl ng transfer student pattern in large universities such
as the thiiversity of Oklahoma»
(2) A program of orientation for transfer students to he held early
in the semester for Interested applicants and those students lAo have already transferred may be indicated. It could be a brief one or two-day session
under the direction of the vice-president of the university community. Its
purpose would be to assist the transfer student in his transition by meansof authoritative guidance, to make him feel welcome, and to possibly reduce
the relatively high withdra%l rate of transfer students compared to native
students at the university.
(3) Little attention should be paid to the geographic area of the country from which transfer students come and more attention to the type
of college from which they transfer. The IMiversity of Oklahona should
be able to recruit students from any geographic area of the country with
out excessive concern for the out-of-state transfer student withdrawing -
if other factors remained equal.
(4) Increased articulation with state colleges and particularly junior colleges as to difficulties some of their student's experience at
the University of Oklahoma as well as the successes they experience seems
indicated. Particular attention mi^t be given to the field of study into
idiich the transfer student plans to enter and his preparation for the field

89
at his original coIJLege - In order to reduce the withdrawal rate of such
students especially In the social and applied sciences.

BIBLIOGRAPHI

BIBLIOGRAPHY
Books
Cof felt ; John and Hobbs, Dan. In and Out of College. Oklahoma City: Oklahoma State Regents for Higher Education, 1$64.
Definition of Student Personnel Terms. Washington, D. C.:U. 8 . Department of Health, Education and Welfare, 1968.
Parley, John. Proad.se and Performance. Berkeley: Center for Study ofHigher Education, 1962.
Dovnle and Heath. Basic Statistical Methods. Hew York: Hazper andRow, 1965.
Educational Directory 1968-69 Part III. Washington, D. C.:Rational Center for Educational Statistics, 19bti.
. Fact Book of American Higher Education. Washington, D, C.: American Council on Education, I969.
GoBsman, Charles S. et al. Migration of College and University Studentsin the IMited States. Seattle: University of Washington Press,
---------------
Getzell, Jacob and others. Educational Administration as a Social Process. Hew York: Harper and Row, I967.
Jencks, Christopher and Relsman, David. The Académie Revolution. Garden City: Doubleday and Company, I968.
Kerllnger, Fred. Foundations of Behavioral Research. Hew York: Holt,Rinehart, Winston, 1964.
Kuoell, Dorothy M. and Medsksr, Deland L. From Junior to Senior Con#g*»- Washington, D. C.: American Council on Education, I965.
McConnell, T. R. A General Pattern for American Public Righer Education. San Francisco: McGraw Hill, I962.
Medsker, Lelemd L. The JuMor College - Progress and Prospect. H e w York: McGraw Hill Co., I96O.
90

91Mueller; Kate. Student Personnel Work In Higher Education. Boston;
Houston Mifflin Company; l$6l.
0 . U. Directory I966-67» The Student Senate of the UniversityOf Oklahoma Publishers. Lubbock; Texas: Craftsman Press ; I966.
Rouechek; J. Follow <Jp on Junior College Transfer Students, Los Angeles: Educational Research Infonnation Center for Junior Colleges; 1968.
Rudolph; Fredrick. The American College and tfaiversity. New York: KnopfCompany; I962.
Sanford; Eevitt. The American College. Mew York: Wiley and Sons; I962.
Siegel; Sidney. Mon-Parametic Statistics. Hew York: McGraw Hill; 1996.
Trent; Jaiaes W. and Msdsker; Le land L. Beyond H i ^ School. Ssm Francisco: Jossey-Bass; I968.
Weinberg and Shumaker. Statistics An Intuitive Approach. Belmont; California: Wadsworth Publishers ; 1962.
Willint Mun; Walter and Findikyan; Surhan. Patterns of Admission for Transfer Students. Hew York: College Entrance Examination Board; I969.
Wiachell; Cons'oance, Guide to Reference Books . Chicago: American LibraryAssociation, 1^ 2%
Articles
CopC; R. G. "Types of High Ability Drop Outs," North Central Association Quarterly. XLIV (Fall; I969); pp. 253-257.
Holmes ; C. H. "The Transfer Student in the College of Liberal Arts," Junior College Journal, XXXI (April, 1961), pp. 456-460.
Hill; Arthur E. "A Longitudinal Study of Attrition Among High Aptitude Students," Journal of Educational Research, 60 (December, I966).
Irving; Donald V. "Graduation and Withdrawal: An Eight Year Follow UpStudy," College and University, 4l (Fall, I965), pp. 32-37,
Kahlman, John M. "The Dilemma of the Junior College," Junior College Journal, 37 (March, I967); p. 68.
Ferel, William and Vario, Phillip. "The Community College and College Parallel Program," Journal of Higher Education, XL (January,1969), p. 47.

92
WlUlnghaa, Walter and Findikyan, Hurtaan. "Who is Moving From Where to Where and What Determines Who is Admitted," College Board Review, UQCIl (Summer, I969), p. 4 .
ReportsPrice, William C. Information for Prospective Students. Norman: Universityospec
9§e7of Oklahoma Press, October, 1
Itapublished Doctoral DissertationsFairchild, Patricia C. "Grade Point Average and Variance as Criteria of
College Academic Performance." Uhpublished Doctoral Dissertation, University of Oklahoma, I969.
Hansen, John E. "A Study of the Academic Performance of IhidergraduateTransfer Students at the University of Oregon." Unpublished Doctoral Dissertation, (diversity of Oregon, I96Ô.
Hoemann, Victor H. "A Comparative Study of the Academic Achievement and Persistence to Graduation of Junior College Transfer Students and Native Students in the College of Arts and Sciences at Oklahoma State University." Unpublished Doctoral Dissertation, OklahomaState University, I967.
Johnson, Charles. ’’A Study of the Scholastic Achievement of Junior College Transfer Students at the University of Missouri." Unpublished Doctoral Dissertation, University of Missouri, I965.
Jones, Franklin M. "A Controlled Comparison of the Academic Performance of Native arl Transfer Students at the Ifeiversity of Georgia." Unpublished Doctoral Dissertation, University of Georgia, I966,
Mann, Mitchell. "The Academic Achievement of Transfer Students at the University of Oklahoma." Unpublished Doctoral Dissertation, IMiversity of Oklahoma, I963.
Russell, J. W. "An Analysis of the Academic Performance of Transfer and Native STudents and their Major Fields in the College of Arts and Science at the University of Georgia." Unpublished Doctoral Dissertation, University of Georgia, I963.
Witter, William C. "Academic Performance of Transfer Students at New Mexico State University.” Unpublished Doctoral Dissertation,Hew Mexico State University, I969.

93
Young, William. "Influence of Certain Factors Related to Academic Performance of lative and Transfer Students at the Pennsylvania State Itaiversity.^ Unpublished Doctoral Dissertation, Pennsylvania State Ihiiversity, I963.
Zimmerman, Beaulah A. "A Story of Academic Achievements and Performance of Murray State Agricultural College Students Transferring to Four Tear Colleges." Unpublished Doctoral Dissertation, Oklahcomi State University, 1967.

APPENDICES
94

APPENDIX A
DERIVATION OF M A JOR ITEMS OF
INFORMATION USED

APPENDIX A
Derivation of Major Item# of Inforawitlon Uaed
The derivation of major items of information used:
of Student
I. D. Number
Date of Birth SexHmmidency Cod«
Name of College and type control
Regional Location
In-State/Out-of- State Location
Hours TransferredCollege at 0 . U.
Major Field
Names were taken from the Student Directory. However, where differences existed such as the use of nicknames or initials, the name used was that recorded on the permanent record cards.
Permanent Record Card
Permanent Record Card and correspondence filePermanent Record Card and correspondence fileCorrespondence rile
Permanent Record Card for Name ; Educational Directory 1968-69 Part III for size and type control
Permanent Record Card
Educational Directory*
Permanent Record Card
Pezmaxient Record Card and correspondence file
Permanent Record Card and correspondence file
*Educational Directory, 1968-I969 Part III. National Center for Educational Statistics, Washington, D. C., U. 3 . Government Printing Office, I966.
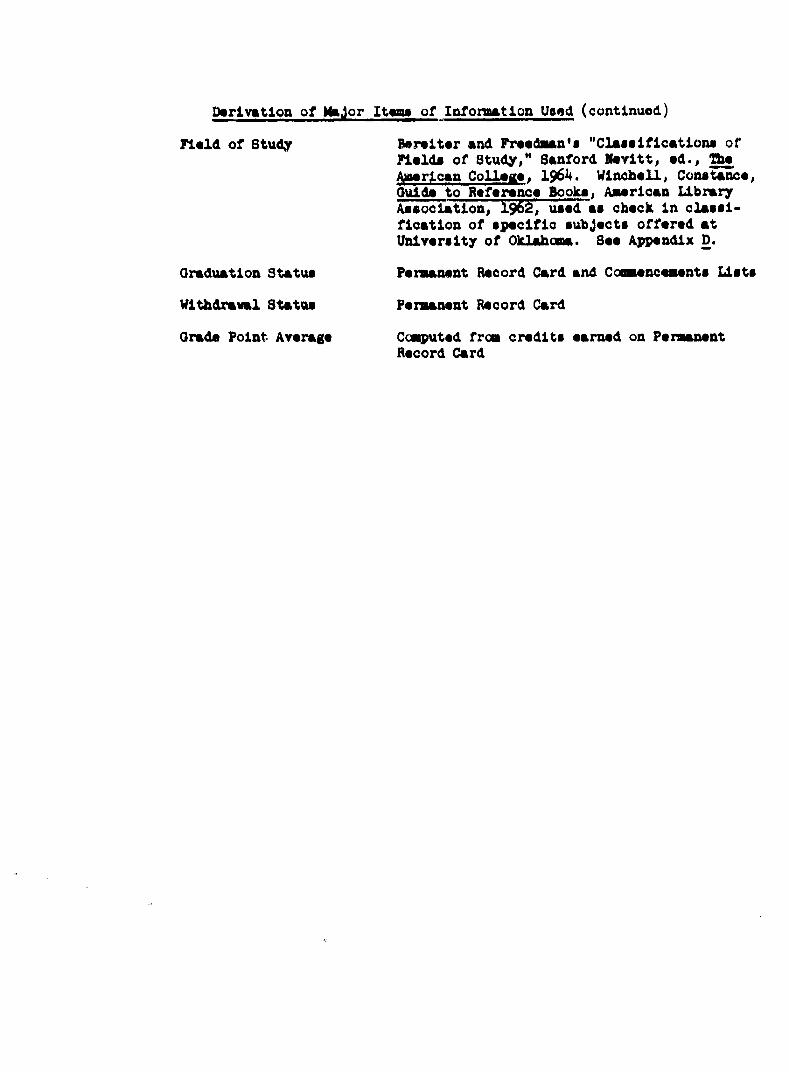
P r i v a t i o n of Major It«m# of Information Uaed (continued)
Field of Study
Graduation Status
Beraitsr and Fraedman's "Classifications of Fields of Study," Sanford Hevitt, ed., The American C o l l e g e , 1964. Winohell, Constance, Guide to Reference B o o k s , American Library Association, 1962, used as check in classification of specific subjects offered at University of Oklahooa. See Appendix D.
Permanent Record Card and Commencements Lists
Withdrawal Status
Grade Point Average
Permanent Record Card
Computed from credits earned on Permanent Record Card

c çO c,4P •* ^
C r ••
AFFEIDIX B
PERSOMAl DATA, SHEET

STUDENT INFORMATION SHEET PERSONAL DATA
Last Name First Middle Student No.
n I i— 1Year of Birth Student Residence Sex
Code CodeO.U. Native
Code
TRANSFER DATA
1 1Name of College . City State
I l l 1 I I 1 III 1 1 I 1 ^ II rType College In State Out Staue Hours Credit Points O.P.A.
Code Code Code Transfd. Received OriginalCollege
FOLLOW - UP DATA
Admitted to O.U. School or College
CodeMa j or
At Time of Graduation
Major At Time of Withdrawal
Field of Study at Graduation
Code
J_LGraduated, Type of DegreeWithdrew Earned
or Still Enrolled
O.P.A. at O.U.
O.P.A. WorksheetGrade Hours Weight Points
A 4
B 3
C 2
D 1
F 0
I 0
U 0
S 0
Totals
Remarks
Must Recheck Record Card
Record Card out of File
Date Record Card Examined
See Reverse Side for Codes
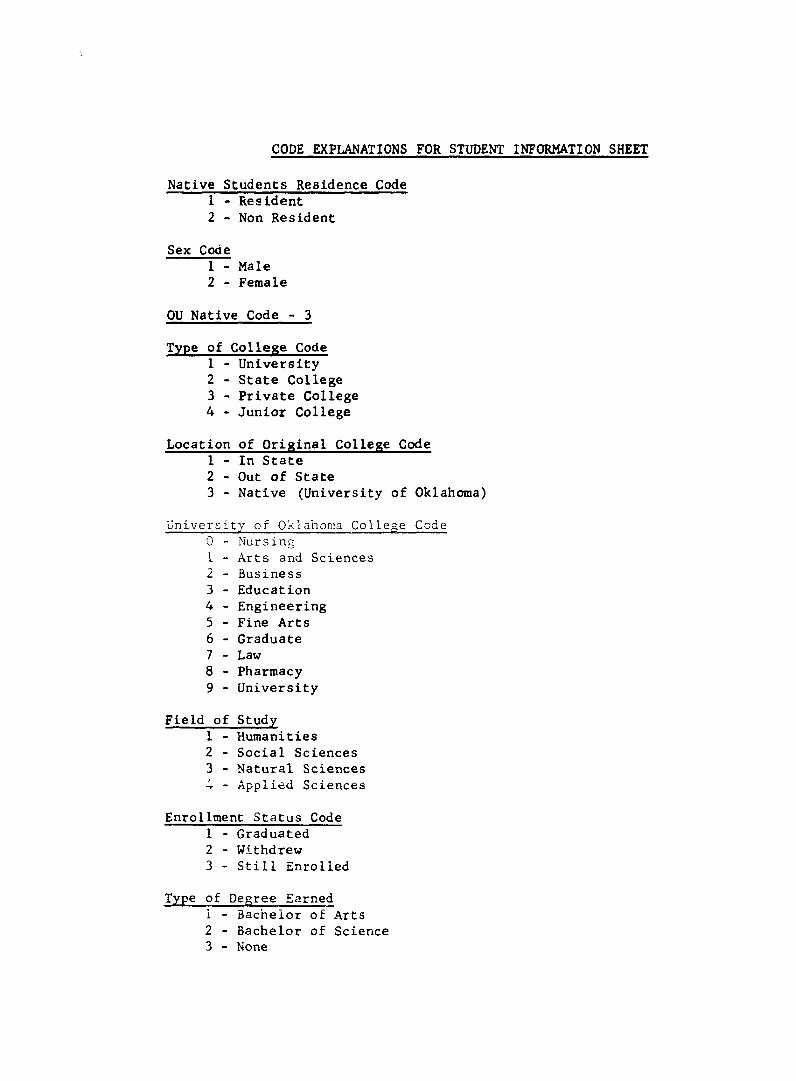
CODE EXPLANATIONS FOR STUDENT INFORMATION SHEET
Native Students Residence Code1 - Resident2 - Non Resident
Sex Code1 - Male2 - Female
OU Native Code - 3
Type of College Code1 - University2 - State College3 - Private College4 - Junior College
Location of Original College Code1 - In State2 - Out of State3 - Native (University of Oklahoma)
University of Oklahoma College Code0 - Nursing1 - Arts and Sciences2 - Business3 - Education4 - Engineering5 - Fine Arts6 - Graduate7 - Law8 - Pharmacy9 - University
Field of Study1 - Humanities2 - Social Sciences3 - Natural Sciences4 - Applied Sciences
Enrollment Status Code1 - Graduated2 - Withdrew3 - Still Enrolled
Type of Degree Earned1 - Bachelor of Arts2 - Bachelor of Science3 - None

APFEHDIX C
STATISTICAL STUDY IE8IGM

grade
P01 n
aVorares
"ransfer Students Field of Study In State Out of Stu
Univ. State Pvt. Jr. Univ. State F' Col. Col. Col. Col.
Jr.loi.
Non-Transfer Students at Uniu of Okla. Total
.ofHumanities a
............ 0 •Social 1 Sciences
0 ----
' •
Natural 1 Sciences
0
' %
Applied k Sciences
0 4
TotalsBas i o. design for exploring différence:
perfc.'i'iriance - between non-transfer students ■ coming t'S the University of Oklahoma with 1 o by major field of study.
Variables; (1) students stratified by (2) cumulative grade point
or withdrawal
Upper limit of "n"; the number of trari; Fall 66 plus an equal number of "n" chosen a; of classified juniors.
Differences between main groupings ic imeans.
■rade point averages - one measure of academic■ ,ie University of Oklahoma and transfer students■ more credits remaining for their BA or BS degree
Lypu of original institution andaverage from Fall 66 until their graduation
;r students among classified "juniors" as of "uidom from the remaining non-transfer population
tested by "t" test of differences between sample
11

, . •
AFFEIDIX D
F I E I D S O F STUDY

o # I... -
ASFBXDZX D
Art
Flelda of Study Major Code Breakdown
HnunTIES Coda 1
GreekArt EducationArt HistoryArt History EducationDesigiiPaintingSculpture
DanceBalletBallet Pedagogy Modem Dance Modem Dance Pedagogy
DramaActing and Directing Broadcasting Design and Technical Production
Speech EducationEnglishFrench
General Fine Arts
History
Latin
Latin American Studies
LettersMus ic
Philosophy
Pre-Minlsterlal Studies
Radio and Television BroadcastingRussian
Russian Studies
SpanishSpeech
Degree Programs: taken from paaçhlet Information for Prospective Studentsissued by Office of Admissions and Records, Ihiiversity of Oklahoma, I968.
Classifications from: Winchell, Constance, Guide to Reference Books, Chicago,American Library Association, 1962.Eereiter and Freedman, "Fields of Study and the People in Them," The America^College, ed. Nevltt Sanford, lev York, Wiley and Sons, I962. «

# %
** #ft* 1w. . '-f.*. !SOCIAL SCISICES Code 2
AnthropologyCltlzenehlp/Pabllc Affairs Econosd.cs
Education Professions Teaching Certificates
ArtBookkeeping and Clerical PracticeBusinessEarly ChildhoodElementary EducationForeign languageHome Econosd.csJournalismlanguage ArtsMathematicsMusic InstrumentsMusic, vocalMusic, conblnedPhysical EducationBeading SpecialistSchool PsychologistSchool PsychometrlstScienceSocial Studies.Speech and Drama Special Education
Education, PhysicalEducation - School Service Certificates
Principal, elementary Principal, secondary Superintendent LibrarianGuidance and Counseling
Education, General * g ^Business Education
Education Psychology Elementary Education Secondary Education Higher Education Guidance and Counseling History and Philosophy
General Administration Mathematics Education Special Education
Foreign ServiceGeography
Hooie EconomicsEarly Childhood Education Fashion Arts
General Interior Design Eutrltlon-Dletetlcs Textiles and Clothing Vocational Hcsie Economics
Library Science
Political SciencePsychology
Public Administration
Regional and City Planning
Social Work
Sociology Urban Studies

HATÜRAL SCIENCES Code 3_ Anatomy• * • * • -. Cm .#A
5: Astrcncny Blo Chemistry Biological Fhycology
Botany
Chemistry Geology
Geophysics
Mathematics
Meterclogy Mlcrohiology
natural 3c Pathology
Phaimacology
Physiology
Physics Pre-Dentistry
Pre-MedicineStatistics (Mathematical)
Zoology

» * . . • .
AFPLISD S Q P K E S Code A
Accounting. #
Aero Space Engineering
Applied Mathematics
Architecture Blo Medical Engineering
Business Adislnlstratlon
Chemical Engineering Civil Engineering
Computer Science Engineering
Compter Science Mathematics
Economics and Business Statistics
Electrical Engineering Engineering
Engineering Physics
Engineering Mechanics
FinanceGeneral Business Administration
Geological Engineering
Industrial Engineering laboratory Technology
Code A
Management
Marketing
Mechanical Engineering
Medical Technology Medicine
Metallurgical Engineering
Natural Gas Engineering Nuclear Engineering
NursingPetroleum Engineering
Petroleum land Manag fanent
PhaiüacyPhysicai Therapy
Sanitary Science and Public Health Blostatlstlcs and epldemlnology Environmental Health Health Administration Human Ecology laboratory Practice
Systems Engineering
i f , / . .
e
AFFEIDIX E LISTIia OF ORZaiKAL CGLIZQXS FFCM WHICH
STUIZIIS TRAE8FERRED
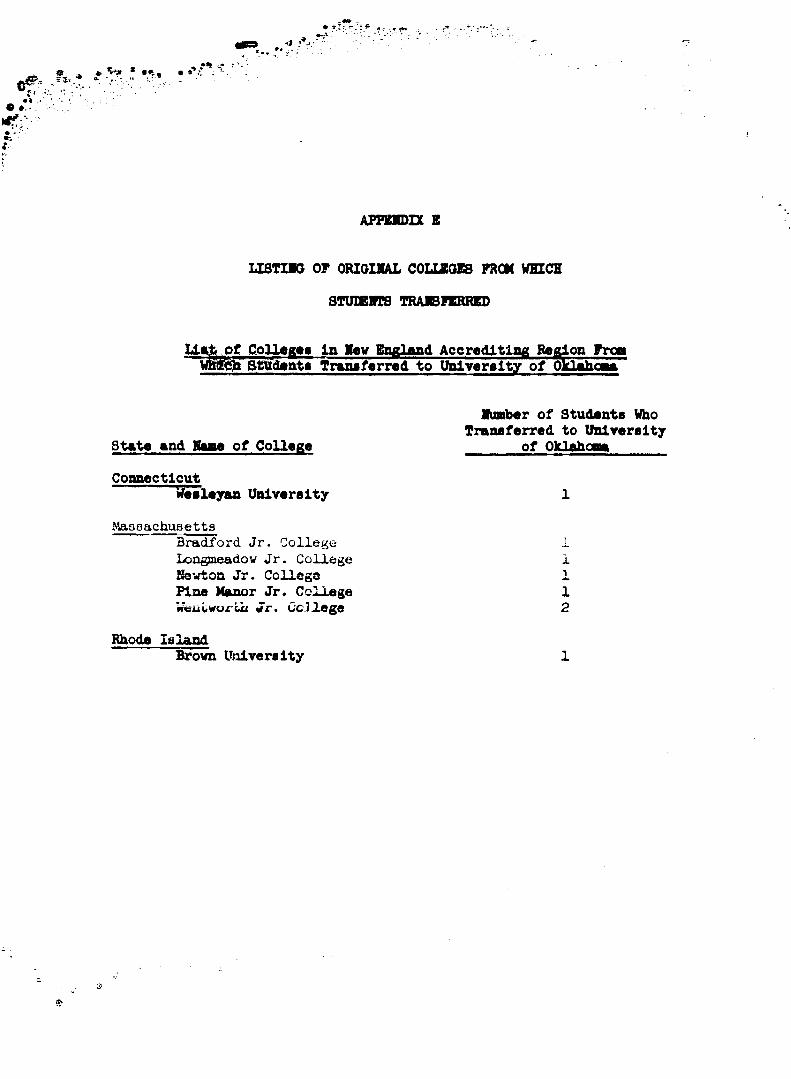
ffl. , ’V» ■ , t , # •t*.-*
• ».NT?';-
AFFEIDIX E
LISTIIO OF ORIGINAL COLLEGES FROM WHICH STUlSnB TRAEBPERRED
LliAjpg CoUeg## In Mev England Accrediting Region From WIffillH StHd»nti Traiuferred to University of Oklmhmm
State >nd Nmme of CollegeConnecticut
Weeleyan UnlveraityMasaachusetts
Bradford Jr. College Longmeadow Jr. College Newton Jr. College Pine Manor Jr. College Woutworbh Jr. C'C.Ilege
Rhode IslandBrown University
Humber of Students Who Transferred to University
of Oklahcaa
11112

L ist of Collagea In Middl# 3 t > f » A cortdltlng Region Pro#Whioh 8tud#ntm Trmnaferred to Unlveraity o f olflnhnfiii
8t&t# and Hm m of CollegeNumber of Students Who
Treneferred to University of Oklahoma
DelaumreNone.
District of ColumbieMount Vernon Jr. College
i t-5 George Washington Univexéity « - Uhi^r|ity of Maryland'
- - Jersey" . . .o ' Mount Clair State College7 . Rutgers University
1210
12
New YorkCUNY Brooklyn College nûqâvk Valley Jr. CollegeNew York Unlveraity at New YorkNaaoau County Jr. CollegeNew York Institute of TechnologyState Unlveraity of New York at BuffaloState University of New York at AlbanySt. Bonaventure UniversitySt. John UniversitySyracuse UniversityUhion College
. ' Vassar Colleges ^Pennsylvania
Gettysburg College Harrisburg Community Collège Uhiversity of Pittsburgh University of Pennsylvania °Wilson College
11y11111322
1211
Out of United StatesUniversity of Paris

List of Coll#g#m In Oottthrn Aooradlting ^ g l o n from Which Student» Tr#m«f*rr«d to tinivr«lty of Oklaho—
8 tnt# and Mama of Collage
AlabamaNona
Florida.Nona
a
Number of Student» Who Tran»farr»d to Uhlvar»lty
of Oklahc
GeorgiaGeorgia Technical Institute
iCbntuehyBastam Kentucky Unlveraity Mipr^ead State College Unlveraity of Kentucky
Miaaiemli^i' Oûlf Park Jr. College
111
Contcnary CullcgcLouiaiazux t'ulytechnical laulituteMcNeese State CollegeTulane University
North CarolinaConverse CollegeEast Caroline State University
TennesseeMemphis State University Vanderbilt University-
Texas
a.J-P
12
Abilene Christian College 2Amarillo Jr. College 3Austin College 2Baylor UniversityDel Mar Jr. College 1East Texas State University 2Eardln Simmons University 3Our Lady of the Lake College 2North Texas State University 3San Antonio Jr. College 1Southern Methodist University 3Texarkana Jr College 1

Liât of College» In Southern Accrediting Region (continued)
State and Name of College
Texae (continued)Texas Christian College Texas Technological College University of Texas at El Paso Uhiversity of Texas at Arlington Trinity College Tyler Jr. College Texas College Victoria Jr. College
Kunber of Students Who Transferred to University
Of Oklahoma
kk2
%
VirginiaBridgewater College, Randolph Macon College University of Virginia
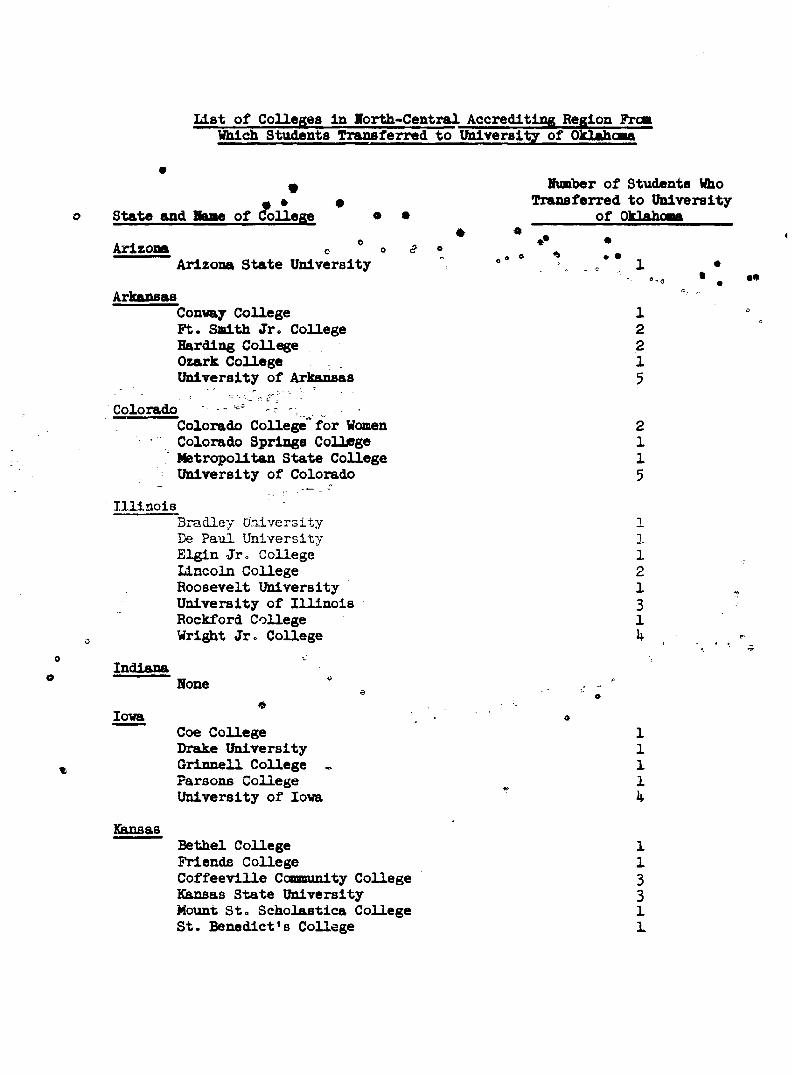
List of Colleges In Worth-Central Accrediting Region PromWhich Students Transferred to Ttalverslty of Oklahoma
•^ Number of Students Who
. * # Transferred to OnlversltyState and Same of College • • of Oklahoma---------------------- . •------* 7 — :--------------Arizona c o c ? o ^ ^
Arizona State University " ° * 1 •®-’0 ® 0
ArkansasConvay College 1Ft. Smith Jr. College 2Harding College 2Ozark College 1Ikiiversity of Arkansas 5
Colorado - ^Colorado College for Women 2Colorado Springs College 1Metropolitan State College 1tftiiverslty of Colorado 5
IllinoisBradley University 1Be Paul University 1Elgin Jr. College 1Lincoln College 2Roosevelt University 1University of Illinois 3Rockford College 1Wright Jr. College 4
Indiana
lova
Kansas
None
Coe College 1Drake Ifaiverslty 1Grinnell College « 1Parsons College 1Uhiversity of lova 4
Bethel College 1Friends College 1Coffeevllle Community College 3Kansas State University 3Mount St. Scholastlca College 1St. Benedict's College 1

List of Colleges In North-Central Accrediting Region (continued)
State and Ifcuae of College
Kansas (continued) ^St. John'^College Sacred HeAt College Wichita State University University of Kansas
Number of Students Who Transferred to University
of Oklahoma
1122
MinnesotaNone
* Missouri
© Michigan,
Christian College Central Missouri College Drury College Metropolitan Jr. College Lindenvood College St. Louis University Stephens College Webster College Went’-forth Millts.r'/ Institute William Wood College Westminister College University of Missouri
Grand Rapids College (Jr. College) Hope College =
NebraskaGrace Bible College University of Nebraska •
North Dakota None
South DakotaSouth Dakota State Uhiversity
Nev MexicoEastern Nev Mexico University Uhiversity of New Mexico
73k121313375
11
11
21
00

Liât of Colleges In Morth-Central Accrediting Region (continued)Number o/ Students Who
Transferrad to Ifaiversity State amd Marne of College of Oklahoma
OhioGfberlln College 1Oxford State College 1University of Ohio at Colombus 1Ihxlverslty of Ohio at Miami 1Ihiiversity of Cincinnati 2
O University of Toledo 1
West VirginiaMarshall (diversity 1
WyomingCasper Jr. College 1
WisconsinBeloit College 1Marquette University 1Mount Mary College 1Uni.versity of Wisconsin at Madison 2
© O
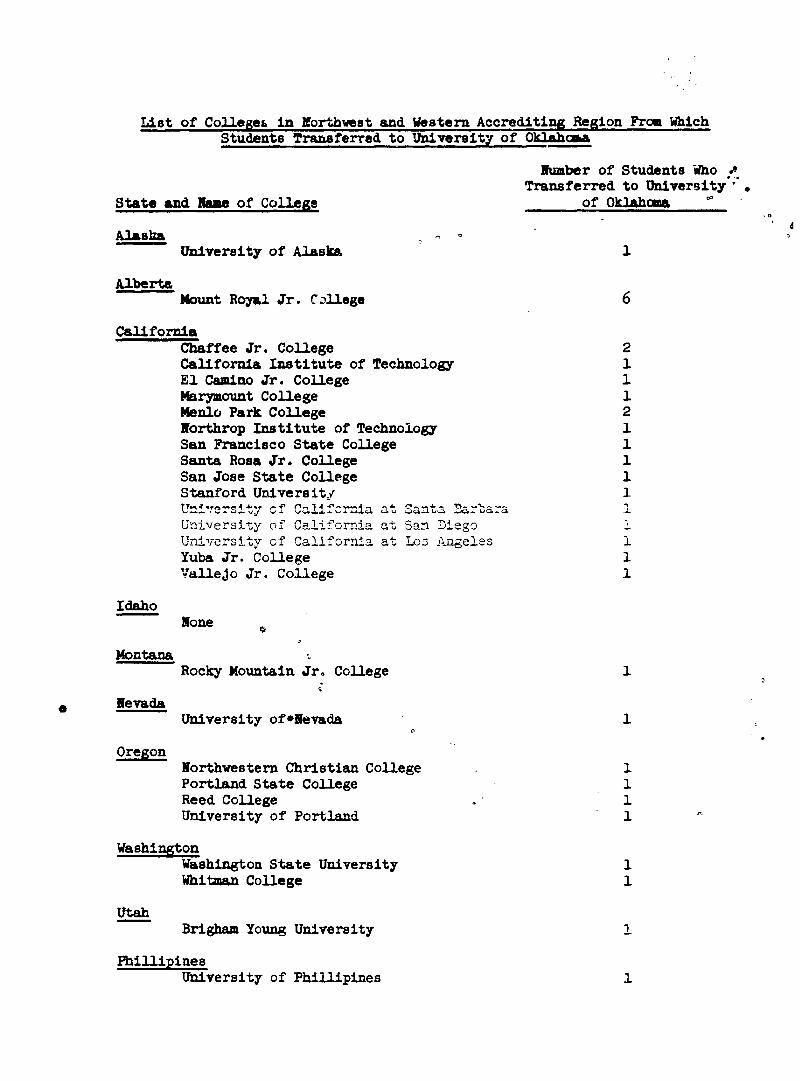
List of Colleger In Northwest and Western Accrediting Region Prom Which Students Tranaferrcd to University of Oklahoma
Amber of Students Who Transferred to University '
State and Maae of College of Oklahoma ^
Alaska - °University of Alaska 1
AlbertaMount Royal Jr. College 6
CaliforniaChaffee Jr. College 2California Institute of Technology 1El Camino Jr. College 1Marymount College 1Menlo Park College 2Northrop Institute of Technology 1San Francisco State College 1Santa Rosa Jr. College 1San Jose State College 1Stanford University 1University cf California at Santa Sartara 1University of California at San Diego 1University of California at Los Angeles 1Yuba Jr. College 1Vallejo Jr. College 1
IdahoNone
Montana
Nevada
Oregon
Rocky Mountain Jr. College
University of*Nevada
UtahBrigham Young University
PblllipinesUniversity of Phillipines
Northwestern Christian College 1Portland State College 1Reed College .• 1University of Portland 1
WashingtonWashington State University 1Whitman College 1

List of Colleges Within the State of Oklahcaoa According to Type of College and Type of Control from Which Students
• «• Transferred to Ualverslty of Oklahoma* ;— ' -
. • f Number of Students Wholame of College and Clty^ f Transferred to University
m'y- »• Where Located * < of owiahrma
• Universities*^ Oklahoma City Ihiiversity^ Oklahoma City 12
• Oklahoma State IMiversity, Stillwater 22*, •** o University of Oklahotsa, lorman not applicable
° ■ University of Tulsa, Tulsa 10
State CollegesCentral State College, Edmond 4lEast Central State College, Ada 1$Langston University, Guthrie 0Northeastern State College, Tahlequah 20Northwestern State College, Alva 6Oklahoma College of Liberal Arts, Chickasha 7Panhandle A & M College, Goodwell 1Southeastern State College, Durant 12Southwestern State College, Weatherford 15
Private Colleges1Bethany Nazarene College, Bethany
Oklahcana Baptist University, Shawnee 10Oklahoma Christian College, Oklahoma City 5Phillips University, Enid
Junior CollegesAltus Jr. College, Altus 7Bacone College, Muskogee 1Cameron State A & M College, lawton** 51
Connors State A & M College, Warner 3Eastern State A & M College, Wilburton l6El Reno Jr. College, El Reno 1Murray State A & M College, Tishomingo 10Northeastern State A & M College, Miamic 22Northern Oklahoma College, Tonkawa l6Oklahoma Military Academy, Claremore . 4Poteau Jr. College, Poteau 2St. Gregory's College, Shawnee 5Sayre Jr. College, Sayre 0Seminole Jr. College, Seminole 0Southwestern College, Oklahoma City 1
* As defined in study - teim university reserved for institutions of Higher Education with two or more graduate programs and enrollment in excess of 2500 students as of September, 1966.
**Became a four year state college effective Pall, I968.