UNIT 5 ECOSYSTEM FUN~TION~NG - eGyanKosh
29
UNIT 5 ECOSYSTEM FUN~TION~NG Structure 5.1' Introduction Objectives 21 - i 5.2 Ecosystem as a Unit of Nature 1 5.3 Components of Ecosystem Abiotic Components , . Biotic Components 5.4 Tolerance Range and Limiting Factor I Tolerance Range Limiting Factor 5.5 TrophicLevel 5.6 o Ecological Pyramids Pyramid of Numbers Pyramid of Biomass . Pyramid of Energy Limitations of Ecological Pyramids 5.7 Energy Input in Ecosystem 5.8 Concept of Production Primary Production Secondar). Production 5.9 Energy Flow 5.10 Food Chain and Food Web Food Chain Food Web 5.11 Ecosystem Control 5.12 Summary 5:13 Terminal Questions 5.14 Answers As you know from your study of Block-4, FST-1; and Block-1, LSE-02, that an ecosystem consists of the community of organisms in a given area together with the abiotic (non-living) components of the environment. The term ecosystem is applied to both small and large ecological systems. Thus we might consider a small pond or even a tree as an ecosystem. On a much larger scale; we can examine a.crop field, a grassland, forest, ocean, or even our planet on the whole as an ecosystem. Ecosystems have both structure and function. The structure of an ecosystem is determified by the components that make up the system, while ecosystem function i; determind by the manner In which these components interact in a complementary way. Let us examine these interactions in more detail. In this unit you would find certain terms and concepts that you have studied before (in the above units). Here, these concepts have been elaborated further, or they are used as a background material for explaining otber concepts. Before, you start going through this unit, we'advise you to give a quick glance to the units mentioned below. i) Unit-14, Block-4, FST-1; ii) Unit-1. Block-1, LSE-02. Objectives After studying this unit you would be able to : explain why ecosystem is taken up as a unit of study; identify the various components of an ecosystem and state the f u n c t i ~ ~ a l role of producers, primary consumers. secondary consumers and decomposer4 in an ecosystem; summarise the concept of limiting factors and tolerance range; recognise different types of ecological pyramids, and realise the usefulnes4 and limitations of ecological pyramids in describing ecosystem dynamics; describe gross primary production, net primary production and secondary production; explain food-chain, food web, and flow of energy through the cco<y\tcm;
-
Upload
khangminh22 -
Category
Documents
-
view
4 -
download
0
Transcript of UNIT 5 ECOSYSTEM FUN~TION~NG - eGyanKosh

UNIT 5 ECOSYSTEM FUN~TION~NG Structure 5.1' Introduction
Objectives 21 - i 5.2 Ecosystem as a Unit of Nature
1 5.3 Components of Ecosystem Abiotic Components
, . Biotic Components 5.4 Tolerance Range and Limiting Factor
I Tolerance Range Limiting Factor
5.5 TrophicLevel 5.6 o Ecological Pyramids
Pyramid of Numbers Pyramid of Biomass . Pyramid of Energy Limitations of Ecological Pyramids
5.7 Energy Input in Ecosystem 5.8 Concept of Production
Primary Production Secondar). Production
5.9 Energy Flow 5.10 Food Chain and Food Web
Food Chain Food Web
5.11 Ecosystem Control 5.12 Summary 5:13 Terminal Questions 5.14 Answers
As you know from your study of Block-4, FST-1; and Block-1, LSE-02, that an ecosystem consists of the community of organisms in a given area together with the abiotic (non-living) components of the environment. The term ecosystem is applied to both small and large ecological systems. Thus we might consider a small pond or even a tree as an ecosystem. On a much larger scale; we can examine a.crop field, a grassland, forest, ocean, or even our planet on the whole as an ecosystem.
Ecosystems have both structure and function. The structure of an ecosystem is determified by the components that make up the system, while ecosystem function i; determind by the manner In which these components interact in a complementary way. Let us examine these interactions in more detail.
In this unit you would find certain terms and concepts that you have studied before (in the above units). Here, these concepts have been elaborated further, or they are used as a background material for explaining otber concepts. Before, you start going through this unit, we'advise you to give a quick glance to the units mentioned below. i) Unit-14, Block-4, FST-1; ii) Unit-1. Block-1, LSE-02.
Objectives After studying this unit you would be able to :
explain why ecosystem is taken up as a unit of study; identify the various components of an ecosystem and state the f u n c t i ~ ~ a l role of producers, primary consumers. secondary consumers and decomposer4 in an ecosystem; summarise the concept of limiting factors and tolerance range;
recognise different types of ecological pyramids, and realise the usefulnes4 and limitations of ecological pyramids in describing ecosystem dynamics; describe gross primary production, net primary production and secondary production;
explain food-chain, food web, and flow of energy through the cco<y\tcm;

Q ~ ~ h : ~un~tioning and TYW de t~ne and use in proper context the terms 'ecological efficiency', 'energy budget', and 'ecological feedback'.
I ~ 5.2 ECOSYSTEM AS A UNIT OF NATURE ~ An ecosystem can be visualised as a functional unit of nature representing complex interactions between living and non-living components. The study of any ecosystem involves systematic description of the components and understanding of the close relationship between the biotic and the abiotic components. Why consider ecosystem
- I - 4
as a unit of study? This, perhaps, is the question arising in your mind presently. If 1 one wishes to study the various aspects of relationships of living and non-Jiving I components of the environment, it would be easy to understand and interpret these relationships in a smaller component of the biosphere,, that is the ecosystem. We shall i elaborate this further with the help of an example. Let us consider a village ecosystem (see Fig. 5.1). It is depicted here by the area enclosed within the dotted lines. The boxes within the village ecosystem represent three sub-systems namely: producers or
'crop plants, cattle and humans. The solid lines connecting the boxes represent the interactions. Solar energy, fertilisers and pesticides are the major inputs brought from outside the village ecosystem. These inputs determine the quantum of output, that is, foodgrain, fodder and other animal products which are exported from the village. So, you see that, the village ecosystem could be considered as a model to study the organisms and their environment as an integrated unit.
L-,-------- J Fig. 5.1 : A model of village ecosystem
Ecosystems are mnceptual models and these models can be applied at any scale, from a bowl o i water to the whole earth. Ecosystems represent enormous contrast in size and complexity. For the purpose of study, an ecosystem can be delineated in almost any way convenient to the interest of the investigator. In the case of some ecosystems such as lake, river or pond, distinct boundaries can be recognised but in the case of other ecosystems, such as a grassland, forest, village or town, boundaries are not so sharp however, they can bk delineated according to the object ~f study or any other practical consideration.
5.3 COMPONENTS OF ECOSYSTEM
All ecosystems possess both biotic and abiotic components. Let us now examine these two components.
a -without, bios - life 5.3.1 Abiotic Components Three broad categories of abiotic components can be visualised,
i) Inorganic Substances : There are about forty elements that are required in various processes of living organisms. Some of these are macronutrients which the plants need in relatively large amounts, and others are micronutrients, that are required in trace amounts. There are nine macronutrients : carbon, hydrogen and

oxygen (the three elements found in all organic compounds), and nitrogen, potassibm, calcium, phosphorus, magnesium, and sulphur. Some examples of micronutrients are : iron, chlorine, copper, manganese, zinc, molybdenum and borc
ii) Organic Substances : These include carbohydrates, proteins, lipids and their derivatives which are derived from the waste products of plants and animals or are the remains of dead plants and animals. Organic fragments of different sizes and composition formed as a result of decomposition of organic residues are collectively called organic detritus. Decomposing organic matter releases nutrients along with the formation of a dark, amorphous, colloidal substance called humus which is important for the fertility of soil (also see Unit-4, LSE-02). New humus is added as old humus gets converted into mineral elements.
: i l iii) .Climatic Factors : This includes temperature, rainfall, humidity, and light, and their daily and seasonal fluctuations. These abiotic constituents are very important for the survival and continuation of living beings and the ecosystem.
5.3.2 Biotic Components We categorise the biotic components of an ecosystem into three categories on the basis of how they obtain energy and nutrients.
i) Producers : Producers. also called autotrophs, are largely green plants that can make food from simple inorganic materials. Food refers to complex organic compounds such as carbohydrates, fats and proteins. Green plants accomplish food making through the process of photosynthesis. In this process, green plants use carbon dioxide, water and some minerals, to produce carbohydrates first. and later various other-organic compounds such as fats and proteins. Oxygen is given off by plants as a byproduct of photosynthesis. During photosynthesis, radiant energy of sunlight is conve'rted into chemical eriergy and is stored in the chemical bonds of the compounds made by the plants (see the equation given below).
Chlorophyll (in green plants)
6C0,+6H20 + Light Energy C,,H,,O, + 6 0 , (''~rbon Water Sun Gluco\e Oxygen
) \ ~ d e (sugar)
The major primary producers of aquatic ecosystems (freshwater and marine) are various species of algae (see Fig. 5.2). In terrestrial ecosystems. the major primary producers are predominantly herbaceous and woody plants. Somc photosynthetic prokaryotic organisms such as blue green algae and a few bacteria are also called primary producers. Besides the green plants there are certain chemosynthetic bacteria that are also autotrophic. But they obtain the energy for the'synthesis of organic compounds (amino acids, proteins) from sources other than solar energy. Some of these sources are : ammonia (NH,), methane (CH,), and hydrogen sulphide (H2S). You can surely make a long'list of animals that obtain their food from green plants. Can you also name a few organisms that depend on the chemosynthetic bacteria for nutrition? We give you a few examples of the same. Organisms like crabs, molluscs and giant worms, that are present at o r near the oceanic floor where sunlight cannot penetrate, get their food from chemosynthetic bacteria.
Consumers : These are also called as phagotrophs or heterotrophs. The organisms grouped under this category cannot manufahure h e i r own food but obtain their energy and nutrients by feeding on other organisms. Some eat primary producers (green plants) to get their food supply and are called herbivores. In terrestrial ecosystem typical herbivores are insects, birds and mammals. Two important groups of herbivores mammals are rodents and ungulates. Primary consumers also include parasites (fungi, plants or.animals) of plants (see Fig. 5.3). In aquatic ecosystems (freshwater and marine) the typical examples of herbivoresare : small crustaceans and molluscs. Most of these organisms such as water fleas. copepods. crab larvae, mussels and clams are filter feeders and extract the minute, primary producers from water.
EFosystenl Functioning
In. Detritus is derived from latirr word 'detere' meaning near nnuy.
Producer = Primary Producer aut, auto-self; trophus-feeding
Fig. 5.2 : Marine algae a) Laminaria agardhii b) Nereocystis luetkeana
Phago - eat
heteros - other different: trophos - feeding
Herbivores = Prirnarv Consumers herba - grass. grreat crops; vora - devour, cat

EXmysystern : Functioning and Types
Ungulates are hoofed, grazing animals, such as horses, cattle and sheep that are adapted for running on the tips of their digits
a
Fig. 5.3 : Some Parasites of Plants a) Dodder (Cuscuta sp.) b) Mistletoe (Viscum sp.)
Carnis-flesh secondary consumer=carnivore
Besides. there are animals which depend on herbivores for food and are cal!ed secondary consumers . Since secondary consumers feed on herbivores, they & ~ - c therefore. carnivores. There are also animals that feed on secondary consumers. They too are carnivores, and are known as tertiary consumers. Secondarv and tcrtiary consumers may be : a) predators which hunt, capture and kill their prey; b) carrion feeders which feed on corpses; or c) parasites in which they are much smaller than the host. and they live on it while the.host is alive. They depend on the metabolism of their host for their energy supply.
There are some animals that have quite flexible food habits as they eat plants, (therefore are herbivores) and animals (therefore are carnivores). They are
Omnib -all known as omnivores o f which man himself is a good example.
Sapros - decomposed, rotkn; iii) ~ e c o m ~ o s e ~ s : Also known as saprotrophs. Mostly, these are microscopic and are trophos - reeding heterotrophic in nature. Decomposer organisms obtain their eneigy and nutrients
7: by degrading dcacl organic matter. When plants and animals die, their bodies are still a source of energy and nutrients, as are their waste productssuch as urine and facces which they discard throughout their life times. These organic remains are decomposed by micro-organisms, namely fungi and bacteria which grow saprophytically on these remains. They secrete digestive enzymes from their
Decompser ,organisms secrete bodics on the dead and wasted materials. subsequently absorbing the products d g r r J i v e a z l m ~ l h m t b c l r of cligcstion. l'lie ri~te of digestion is variable. The organic matter of animal bodies into the dead organic wastes such as urine, faeces and corpses is cpnsumed within a matter of weeks material and absorb the digested food. This is in contra& to whcrcas fallen leaves and brqnches may take years to decomposes. During the c ~ ~ = U m e r s which eat and digest decomposition of wood. fungi'act and produce an enzyme cellulase, that softens it internally.
S , the wood. This enables the small animals to penetrate and ingest the material. Fri~gments of decomposing tnaterial are called detritus, and many small animals Iced on these, contributing to the process of breakdown. They are called detritivores. Because of the combined activities of the true decomposers (fungi
.and bacteria) and detritivores (animals), in the breakdown (decomposition) of matel-ials, thtiy are sometimes collectively referred to as decomposers. Although, stri~tly the term decomposer relates to saprophytic organisms, Some typical terrestrial detritivores are : earthworm (see Fig. 5.4a), woodlice, millipedes (see
1 Fig. 5.43) and other smallei' (< 0.5 mm) animals such as mites, springtail and nematodes.
The important end result of the decomposer activity is that inorganic nutrients, originally bound up in the tissue of organisms are converted into simple forms that are usable once again by the producer organisms. Apart from processing and clearing the organic wastes, decomposers are vitally important for regenerating ecosystem fertility by releasing nutrients for utilisation by plants, that were locked up in the organic matter.
5.4 TOLERANCE RANGE AND LIMITING FACTOR
Fig. 5.4 : Detritivores. Jn the above section you have studied the biotic and abiotic components of the a) Earthworm, b) Millipede ecosystem and their functional roles and relationships. You have also seen how
Important these components are for the survival and well-being of the organisms and ulti~nately the whole ecosystem. These components are required in certain minimum and maximum limits for the optimal functioning of the organisms.

'11 ' 5.4.1 Tolerance Range Organisms are able to survive only within certain maximum and minimum limits with respect to each environmental factor such as water, light and temperature. These are called the tolerance limits and the range in between these limit\ is the tolerance ranges (see Fig. 5.5). Different organisms have different tolerance ranges (see Fig. 5.6). Beyond the maximum and minimum limits ot this range. no member of a particular species can survive. For example, fish generally tolerate a narrow riunge of water temperature. If the water cools below the range of tolerance. they die or rnovc to warmer waters. Mlnlmum M B X I ~ U ~
Llmlt 01 Tolerance Limtt of Tolerance
- -
Ekosystcm Funrtioninp
I I
I I Optimum I I I
I Zone of I
C : Low Temperature High
Fig. 5.5 : . bnge of tolerance for a population of organisms of the same species, to an environmental factor - in this case temperature. The organisms shown here are scarlet prawns. -
L
, Human , (naked)
Tc--
Call
Cow

: w n i n g and l y ~ 5.4.2 Limiting Factor i In all ecosystems one factor, usually abiotic, limits the growth of organisms and is therefore called a limiting factor. The limiting factor is one that outweighs all the other factors that are necessary for the growth of organisms. It is the primary determinant for growth because it lies beyond the minimum and maximum limits of
t the range of tolerance. For example, phosphorus is a limiting factor in certain aquatic ecosystem. It is the first to be used up. When phosphorus is reduced, the growth of algae is impaired. So, this is an example, where pho3phorus is in short supply and is thus a limiting factor.
As mentioned above. just as the shortage of any abiotic factor impairs the survival of organisms In an ecosystem, so can an excess. Any factor that is in excess may be detrimental for the living organisms, directly or iricl~~ectly. You may be wondering, how' Let us consider an example of a power plan1 from where the hot water pours into a nearby stream. As a result, the temperature or water in the area nearby shoots up from 10" C to 300 C. This sudden therryal vhock IS fatal for many fish and other aquatic organisms. The above example, illustrates the direct effect of excess of a factor.
How the factors indirectly affect living beings is illustrated by the following example. If we over-water or tlood a patch of land having trees. on a prolonged basis. then the excess water saturates, the soil by displacing air needed by the trees from the soil pores, thus creating anaerobic conditions. As a result, the roots get deprived of oxygen leading to the death of the trees. The excess of the water thus indirectly affects the suwival of trees adversely.

5.5 TROPHIC LEVEL
In an ecosystem, the various biotic components are related to each other and form food chains (see FST-1, Unit-14, Section 14.3). If we group all the organisms in a food chain according to their general source of nutrition, we can assign them different trophic (feeding) levels -- (Fig. 5.7). The producer organisms belong to first trophic
Fourth Trophlc Consumers Level
(Top Carn~vores)
Consumers B Thlrd Trophlc Level
(Garn~vores)
Level
. First Trophic
Producers Level dPlants)
1 Fig. 5.7 : Diagrammatic representation of trophic levels in an ecosystem.
level, primary consumers (herbivores) to the second trophic leve', secondary consumers (carnivores) to the third trophic level and tertiary ct\ lsumers (top carnivores) to the fourth trophic level. Man, who is an omnivore may belong to more than one trophic level (see Fig. 5.8) . There are usually four or five trophic levels, and seldom more than six - its reasons you would study in Section 5.9 of this unit.
. . . . . . . . . . . . . . . . . . . . . . . . . . . I I 1 - rig. 5.8 : Three food chains drawn separately to show that an organism can occupy different trophic levels. . -
In this diagram, the position of man in different food chains illustrates this point. The arrows indicate the direction of food chain.
The study of trophic level gives us an idea about the energy transformation in an ecosystem. It provides a useful conceptual basis to include all organisms that share the same general mode of feeding into one group and they together are said to belong to the same trophic level. This feeding level concept, implies that organisms obtain food through the same number of steps from the producer. One thing should be clear to you, that is, the trophic levels are numbered according to the steps an organisms is away frorn the source of food or energy, that is the producei.
. 5.6 ECOLOGICAL PYRAMIDS
Ecosystem Functioning
, The ancient Egyptians constructed elaborate tombs called pyramids. The base of the pyramid is broad and it supports the upper levels of the structure. and it narrows to a point at the top. A sim~lar situation is seen when we study and depict the trophic relationships in an ecosystem. The different trophic levels of an ecosystem are related to one another and can be summarised in the form of ecological pyramids. The base of each pyramid represents the producers or the first trophic level while the apex represents tertiary or high-level consu.mers; other consumer trophic levels are in

kwysem : Functioning and TYW between. There are three kinds of ecological pyramids possible which are discussed below.
5.6.1 Pyramid of Numbers A graphic representation of the total number of individuals of different species belonging to each trophic level in an ecosystem is known as pyramid of numbers. It consists of a number of horizontal bars depicting specific trophic levels which are arranged sequentially from primary producer level through herbivore, carnivore onwards (Fig. 5.9). The length of each bar represents the'total number of individuals
Number of 4 individuals/
\. square meter
.I \
Secondary Consumer (Camhare)
/ \ / \
Primary consumer (Herbivore)
\
/ \ / \
Primary Prducer / \ (Pmducer) \ 100
/ /
\
/ \ \
L--- ---A , -
Fig. 5.9 : An upright pyramid of numbers. The number of individuals indicated h~ the Qgure are hypothetical, and the organisms are not drawn to the same scale.
at each trophic level in an ecosystem. The number of individuals drastically decreases with each step towards higher trophic levels and the diagrammatic representation assumes a pyramidal shape and is called pyramid of numbers. In such pyramids, you would find that generally the higher trophic levels are occupied by relatively large-sized animals which are also less abundant. This is due to the fact that animals at higher trophic levels are larger than the animals which they capture from the lower trophic level. In case of tiger or lion, the size relationship does not hold good as cattle and other preys may be larger in size. This could be explained on the basis that these wild cats are powerful and eat their prey by cutting into manageable pieces.
For most ecosystems, pyramids of numbers are right side up because numbering of organisms decrease at successively higher trophic levels. However, there are some ecological systems for which pyramids of number may be inverted. For example, if we depict the situation of single tree along with its dependent insect population we would get an inverted pyramid as shown in Fig. 5.10. Since the tree is a primary producer, it would represent the base of the pyramid and the dependent phytophagous insect population will represent the second trophic level.
Number of indivdualsl
- -/square meter r-
Primary \ / Consumer \ / 500 (HerbiMre) \ /
/
Primary Pmducer (Producer)
Fig. 5.10 : An inverted pyiamid of numbers. The number of individuals indicated in the figure are hypothetical, and the organisms are not drawn to the same scale.

Describing the structure of ecosystem through a pyramid of numbers may be quite instructive in some sense but it suffers from certain limitations that we shall discuss now. i) You know that the producers vary greatly in size. In such pyramids, for example, a single grass plant o r alga is given the same status as a single tree. This also explains why a true pyramid \hape is often not obtained, and we get an inverted pyramid. Also parasitic food c h a ~ n s (you would study in Subsection 5.10.1, iii) of this unit) may give inverted pyramid. ii) The range of numbers is so great that it is often difficult to draw the pyramids to scale, although logarithmic scales may be used.
5.6.2 Pyramid of Biomass ' You have seen that pyramid of numbers is not a very good method to use if the
organisms at different trophic levels are of greatly differing sizes. To overcome the shortcomings of the pyramid of numbers, the pyramid'uf biomass is used. Biomass represents the total dry weight of living beings of different species at each trophic level at a particular time. And it is usually determined by collecting all the organisms occupying each trophic level separately and measuring their dry weight. This eliminates the size difference problem because all kinds of organisms at a trophic level are weighed. Biomass is measured in g/m2. A t the time of s'ampling, the amount of biomass is known as standing crop,or standing biomass. Generally, the biomass of producers is much greater than biomass of herbivores and the biomass of herbivores is greater than the biomass of carnivores and so on and so forth. In other words, we find that biomass decreases at each trophic level if we move from producer to.top carnivore. Therefore, diagrammatic representation of biomass of individuals belonging to the different trophic levels invariably assumes the shape of an upright pyramid (Fig. 5.11). This, however, is not always the case. In some aquatic
Elomass if = Total Combined Third Trophic Welght of AII Level Carnivores
Biomass (grams dry weight1
square meter)
Secondary Consumer (Carn~vore)
Blornass of = Total Combined
Primary Second Troph~c We~ght of All Consumer Level Herbivores
(Herbivore)
\ \ \ B~ornass of First = Total Combined
Primary \ Trophlc Level We~ght ot AII Producer
\ Producers , (Producer) \ \ \
----A P -
Fig. 5.11 : Pyramid of Biomass. I he numerical ligures ot biomass as indicated abote are hypothetical, and the organisms are not drawn to the same scale.
ecosystems, like large lakes and oceans, the pyramid of biomass: sometimes assumes an inverted form (see Fig. 5.12a). Since microscopic phytoplanktonic algae are primary producers in the aquatic system, they have short life cycle, thus they reproduce rapidly. Being single-celled organisms, they do not accumulate much biomass and they are eaten up faster by organisms like zooplankton, fish etc. Consequently, at a given time, the total weight or the standing crop of phytoplankton is less as compared to herbivores or othkr consumers. This is the reason for the base of the pyramid in aquatic ecosystem being smaller than the super structure.

Fcosystem : Fanctioning and Types Biomass
(grams dry weight1 square meter)
\ Secondarv Consumers / \
~Cernlvwes) / \ / \
/ e w \ / \
/ - \ - - - +- - - -L \ /
Primary Consumers \ /
(Herbivores) \ /
Pr~maly Producers (Producars)
\ 1 v
Fig. 5.12 : Pyramid of biomass in an open ocean ecosystem at two different times of the year a) during winters, b) during spring season. The numerical figures as indicated above are hypothetical and the
organisms drawn are not to the same scale.
For constructing the pyramid of biomass, the time of sampling is very important. You could ask why? Let us discuss this point with a specific example, that is of ocean. 13 open ocean, the producers are microscopic phytoplankton and consumers range from microscopic zooplankton to massive organisms like whales. Here, the biomass of consumers may temporarily exceed that of primary producers, if sampling is done when the number of phytoplankton is low such as in winters. During such sampling periods, the pyramid of biomass would look as shown in Fig. 5.12a. However, if the samples are taken during spring when phytoplankton populations are immensely large, or if several generations of phytoplankton are included, the pyramid shape would look like as shown in Fig. 5.12b. From this example, it should be clear to you that the time of sampling is very crucial. In the same ecosystem, we can get an inverted pyramid at one time of the year and an upright pyramid in a different season.
5.6.3 Pyramid of Energy
The Erst law of thermodynamics states that energy may be transformed from one form to another but can be neither created nor destroyed.
The second law of thermodynamics states that the conversion of energy from one form to another is never 100 per cent efficient, that is, some energy is always wasted in energy conversions.
When we wis'n to compkre the funct'ional roles of the trophic levels in an ecosystem, an energy pyramid is probably the most informative. It overcomes some of the objections pertaining to the pyramid of numbers and biomass. An energy pyramid more accurately reflects the laws of thermodynamics, with loss of energy being depicted at each transfer to another trophic level, hence the pyramid is always upright (see Fig. 5.13). Energy pyramids in the case of aquatic ecosystem are also upright, even where the pyramid of biomass is inverted. In energy pyramids, a given trophic level, always has a smaller energy content than the trophic level immediately below it. This is due to the fact that some energy is always lost as heat in going from one trophic level to the next. Each bar in the pyramid indicates the amount of energy utilised at each trophic level in a given time, annually per unit area. The unit of meakurement is kcal/m21yr.
A pyramid of energy must be based on determination of the actual amounts of energy that individuals take in, how much they burn up during metabolism, how much remains in their waste products, and how much they store in their body tissues. The energy inputs and outputs are calculated so that energy flow can be expressed per unit area of land (or volume of water) per unit time. Though, these calculations are a bit difficult than for the other pyramids, the advantages of energy pyramid are many: i) It takes into account the rate of production, in contrast to the pyramids of numbers

Fxosystern Functioning Energy Kilocalories Square meter/ Year
(KcaVsqmIyr) ?
Ter;iary Consumer
' (Top Carnivore)
Secondary Consumer (Carnivore)
(Herbivore)
10.000
Fig. 5.13 : Pyramid of energy. The cumulative energy content of primary producers is always higher as compared to the energy in the next trophic level and so on and so forth, over a period of time. The numerical
figures as indicated above are hypothetical, the organisms are not drawn to the same scale.
and biomass which indicate the standing states of organisms at a particular moment in time. Each bar of a.pyramid of energy represents the amount of energy per unit area or volume that flows through that trophic level in a given time period. ii) Weight for weight, two species do not necessarily have the same energy content. Comparisons based on biomass may, therefore, be misleading. iii) Apart from allowing different ecosystems to be compared, the relative importance of populations within one ecosystem can be compared and inverted pyramids are not obtained. iv) Input of solar energy can be added as an extra rectangle at the base of a pyramid of energy
,IN 5.6.4 Limitations of Ecological Pyramids The pyramid of energy is a significant improvement over the previous two types of ecological pyramids, yet all of them overlook one or another important aspect. Some of these limitations are discussed below.
i) Some species practise more than one mode of nutrition or belong to two or more trophic levels. This is particularly true in the case of consumers of higher trophic levels. Man is an example. He gets his food from primary producers as well as from higher trophic levels. Such organisms which feed at more than one trophic level are extremely difficult to depict in ecological pyramids.
ii) Saprophytes play a vital role in ecosystem but they are not represented in ecological pyramids.
iii) Detritus such as litter and humus is an important source of energy and exerts considerable influence on ecosystem function, yet it is not depicted in ecological pyramids.
iv) Ecological pyramids do not provide any clue to seasonal and diurnal variations.
v) The rate of transfer from one trophic level to another is not reflected in the ecological pyramids.

5.7 ENERGY INPUT IN ECOSYSTEM - C
I Table 5.1
Survival and functioning of ecosystem is dependent on the input of energy. Continuous availability af energy is essential for supporting diverse ecosystem processes. For any ecosystem, the ultimate source of energy is sunlight. And as you know, it enters the kosystem through the producers. When a primary consumer (herbivore) eats a producer, and is itself eaten by secondary consumers, we can say that energy is flowing through the ecosystem. You have already studied some aspects of solar energy input in Subsection 2.2.2, Unit 2, Block-1 of this course. The information provided therein, would serve you as a base material for understanding this and the subsequent sections of this unit. ~ Mean total radiation of sun and
sky, on a horizontal surface (in ~ callcm2/day) (After Ramdad and ~ Yegnanarayanan, 1954)
TRIVANDRUM 487 I BANGALORE 467
MADRAS 530 DHARWAR 480 BOMBAY 499 ' POONA 506
AHMEDABAD 543 JODHPUR 534
As you already know that the amount of solar energy received at the outer boundary of earth's atmosphere is at the rate of 2cal/cm2/min. This quantity is fixed and known as solar constant. You have also learnt that about 30 per cent ofthe sunlight reaching the earth's atmosphere is reflected back into space, about 51 pet cent is absorbed as heat by ground, vegetation or water, and about 19 per cent is pbsorbed by the atmosphere. Only a small fraction of sunlight, that is, about 0.b2 per tent reaching the atmosphere is used in photosynthesis. Nevertheless; it is this small fraction on which all the organisms of the ecosystem depend. The actual amount of solar flux' received at the surface of the earth is dependent on various climatic, geographic and other environmental factors. On an average the total amount of solar energy that reaches th'e earth's surface is about 3,400 kcal/m2/day. It varies significantly from one place to another, for example, it decreases with latitude and its input also varies during different seasons at any given location. The solar flux values for fourteen different stations in India are given in Table 5.1, and it varies from 361 to 543 cal/cm/day .
I ~
I ~ ~ I ;
i i I
5.8 CONCEPT OF PRODUCTION
JAIPUR 495 ALLAHAB'AD 511 CALCUTTA 486 DELHI 489 JULLUNDUR 496 SRINAGAR 361
16 You have just studied that ecosystems are unable to function, unless there is a constant input of energy from an external source that is sun. Solar energy enters the
I

biotic components of the ecosystem through primary producers. And you know that the plants store solar energy in the form of chemical bond energy through the process of photosynthesis. In the following subsections you would study about this stored solar energy in the plants and its availability to the next trophic levels.
5.8.1 Primary Production Energy accumulated by plants during photosynthesis is called production or more specifically primary production. It is the first and the basic form of energy stored in an ecosystem. Production is defined technically as the amount of biomass or organic matter produced per unit &ea in a given period. It can be expressed in terms of
2 weight (g/m2) or energy {kcallm ) . The .rate at which energy accumulates is 2 know$ as primary productivity.It is expressed in terms of kcallm /yr or g/m2/yr.
In case of plants, primary production is generally differentiated into two distinct categories, namely gross primary production (GPP) and net primary production (NPP). Gross primary production refers to the total amount of solar energy fixed into organic matter by primary producers through photosynthesis. A considerable portion of the solar energy fixed by plants (GPPI. is utilised by plants themselves in respiration (R) to get the energy needed f ~ r their t?-,-tabolism and for other vital functions. The amount of energy left after respiratory consumption (R) is incorporated into new body tissue (growth) or is used for producing nzw individuals (reproduction). The amount of biomass or organic matter accumulated by plants per unit area in a given period is called net pr-mary prodi~ction. The overall relationship between GPP and NPP can be written as :
GPP - R = NPP or GPP = NPP + R
F r o q this equation,.you might have noticed that whatever energy is fixed by plants (GPP) some of it is used for their own maintenance (R) and only remaining (NPP) is available for the next trophic level. So net primary production is the only energy available for the next trophic level.
The annual net primary productivity of the whole biosphere is approximately 170 billion tons (dry weight) of organic matter. Of this total, about 115 billion tons are produced on land and about 55 billion tons in the oceans, despite the fact that the oceans occupy about 70% of the earth's surface. We the human beings harvest about 1.2 billion tons per year as plant food.
Production efficiency : The maximum amount of solar energy harvested by plants is about 5 per cent but the average for green plants, on the whole is only a small fraction of sunlight, i.e., 0.02 per cent reaching the atmosphere. The production efficiency, that is the ratio of net primary production to gross primary production (of green plants) is on the average rather high. It varies between 40 to 85 per cent. The most efficient are those plants which have low maintenance requirement due to minimum non-photosynthetic (non green) tissues, such as in grasses, algae and phytoplankton. Algae and crops like corn have an efficiency of about 80 to 85 per cent, submerged aquatic plants 60 to 75 per cent, deciduous forests about 42 per cent.
Different ecosystems have different productivities (see Fig. 5.14). Productivity of ecosystems depends on a variety of factors such as sunlight, temperature, rainfall and the availability of nutrients. Those situations that provide the best circumstances for plant growth are the most productive. Warm, moist, sunny areas with high levels of nutrients in the soil are ideal. 'some areas have low productivity because one of the essential factors is missing. Deserts have low productivity because water is scarce, arctic areas too have low productivity because temperature is low, and open oceans also have low productivity because nutrients are in short supply. Coral reefs and tropical rain forests have high productivity. Marshes and estuaries are-highly productive since waters running into them are rich in the nutrients and they also get enough light.
You have just seen that some ecosystems have consistently high production. Such high production usually results from an additional input of eriergy subsidy to the system. The energy subsidy, as you have learnt may be in the form of high ambient temperature, rainfall, or inflow of nutrients. Some agricultural systems also have high productivity, e.g., sugarcane has a productivity of 1.700 to 1,800 glyr; corn 10.000 glyr; and some tropical crops up to 3,000 glyr. Can you now think of the energy subsidies that are linked to high production? In agricultural system energy subsidy
Ecosystem Functioning

Eco~ystern : Functionin and Types t includes the use of fossil fuels for land preparation and the use of fertilisers and pesticides. - -
. - Fig. 5.14 : Comparative productivities of different ero~ystems of the world. The numerical fiwres written in bold are the average values and the ones written in parentheses represent the range of productivity
(Data from R.H. Whittakar, Communities and Ecosystems, 1975).
5.8.2 Secondary Production You have seen that net primary prodyction is the only energy available to consumers or heterotrophs including man. Herbivores such as cow or deel g a z e upon grass and utilise primary produ'ction. T h e food is processed in the sfomach of animals. Digested material is assimilated in the body and the unutilised material is excreted. Some of the assimilated energy is used up in respiration to provide energy for the metabolic needs of body such as maintenance and repair of tissues. The remaining part is utilised for producing new tissues for reproduction. Production of animal biomass on account of growth as well as addition of new individuals of animals is referred to as secondary production. And secondary productivity is the rate of formation of new organic matter by heterotrophs.
Very little of the plant matter that is consumed is actually converted to animal tissue. In terms of energy content, the conversion is only about 10 per cent. This energy loss is shown in Fig. 5.15, where a rabbit has 0.1 kcal of secondary production for every

1 kcal of food eaten. What happens to the other 90 per cent? Fig. 5.15 shows that Ecosystem Functioning most of this difference is used in respiration to power the animal's movements and maintain its body functions. A certain amount is not assimilated at all and is therefore excreted in the faeces. Thus relatively little energy is left for the production of new body tissues.
12 Kccll Gross Pnmary Prdduclbn
10 K d Ntll Prlmary Production
€iten. and not. Lost
Ass~milated . vla.
Uneaten
0 89 Iccal Eaten. fl.1 Kcal
~rod'uhion by Carnivlves
Fig. 5.15 : Energy relationships in an ecosystem. The average values for energy transfer w e illustrated, the actual values vary from system to system.
T o put this concept on a familiar level, let us consider an adult human. A person eats daily, yet a healthy adult does not gain weight at all. T o summarise, although there ere large variations from ecosystem to ecosystem, as a ,;p,neralisation, for every 10 kqal of plant tissue available to herbivores, about 1 kral will be eaten, and only aboui 0.1 kcal will bdstored in the form of body weigh:,
It must be clear to you that in contrast to primary production, secondary production is usually not differentiated into 'gross and net' categories because heterotrophs consume only already manufactured food. , Just as net prlmary production is limited by a number of variables, so is secondary production. The quantity, quality (including the nutrient status and digestibility), and availability of net production are the 'three limitations.
S.9 ENERGY FLOW
-As you know our world is a solar-powered system, and green plants are the entry gates ol energy into ecosystem. In Unit 2, Subsection 2.2.5, Block-1, LSE-02 you have already learnt that out of the total incoming solar energy, only a very small fraction is absorbed by plants. And on this small fraction of sunlight trapped by plants is built the entire living world. In this section we shall discuss with you as to how the different biotic components of an ecosystem are related in terms of energy.
From your study of the First block of this course plus the Fourth block of FST-1, you have sufficient background information on this topic. One thing you should remember is that any organism derives its energy from the 'food' it consumes. And you know that all organisms cannot make their own food and only the producers have the capacity to do so. Therefore, various organisms in an ecosystem musifulfil their energy needs by relying on producers directly or indirectly. In other words we can say that energy flows from the first trophic level, that is, from producers to the subsequent trophic levels. In an ecosystem energy is transferred in an orderly sequence. See ~ g . 5.16 carefully before you proceed further.
Have you noticed the following two points in the figure? i) The flow of energy is in one direction only, and ii) some energy is lost as heat at every successive step.
Now let us consider the first point, that is. the direction of flow of energv. Ene~gv flows from lower (producer) to higher (herbivore, carnivore, etc.) trophic level. It never flows in the reverse direction, that is, from carnivores to herbivores to green plants. Organisms at each trophic level depend on those at lower trophic levels for

&mystem : m o e md tne energy to sustain themselves and reproduce. For example, we cannot convert energy directly from the sun into food. We depend on green plants to make such transformation for us. This is in accordance with the first law of thermodynamics, that energy cannot be created nor destroyed but may be transforxhed from one form
'into another. For example, the energy of visible light is transformed into chemical energy of the glucose molecule synthesised by green plants through photosynthesis. The living organisms including plants utilise glucose in respiration, which releases chemical energy, and a part of which is ultimately dissipated as heat, that is, the third form of energy.
Th~rd Troph~c Level Fourth Trophic Level Pr~mary Consumers Secondary Consumers Telt~ary Consumers
Decomposers
Fig. 5.16 : Energy flow through an ecosystem. Producers capture a small amount of solar energy and make i t available for the subsequent biotic components of the ecosystem, whether they are herbivores,
carnivores, top carnivores or for that matter even the decomposers.
4 . Let us now take the second point that i$ the loss of some energy at each trophicievel. You might recall that the second law of thermodynamics states that when energy is transformed from one form into another, some fit is co~verted into unushl t energy, such as heat. Let us understand this with another example. When you slide a box along the floor, some of the energy you are putting into pushing the box is being converted into heat energy, due to friction. And this heat energy escapes into * the surrounding environment. In the same way when the energy stored in muscle cells is used to contract arm muscles, some of the useful energy is lost as body heat from athe body. Since heat energy cannot be used to do useful work, more energy must be supplied to a biological system from outside to compensate the inevitable energy loss. In order to continue to function, organisms and ecosystems must receive energy supply on a continuing basis.
Related to the various aspects of energy flow in an ecosystem is the question - why only a few links in the food chain? The unavoidable loss of usable energy between feeding levels explains why food chains are relatively short - at the most four or five links. From your study of pyramids of energy you have seen that how the amount of energy decreases from the first trophic level onwards. At the fourth or the fifth level very little energy is left to support another trophic level. In general, there is about 90 per cent loss of energy mainly as heat as we proceed from one trophic level to the next higher level. In other words, only 10 per cent energy of a particular trophic level is incorporated into the tissues of the next trophic level. Thus, if 1,000 kcal of plant energy were consumed by herbivores, about 100 kcal would be converted into herbivore tissue, 10 kcal to the carnivores and 1 kilocalories to the top carnivore tissues. Considering these aspects it is clear that in human communities, consu'mption of food defived from animals such as meat, eggs and dairy products have high energy cost as compared to foods obtained directly from plants.
In energy terms it is more economical to eat bread made from wheat than to feed the wheat to hens and then eat the eggs and chicken meat (also see Fig. 5.17). T h i ~ is because eating wheat as bread avoids using any part of its energy 'to keep the
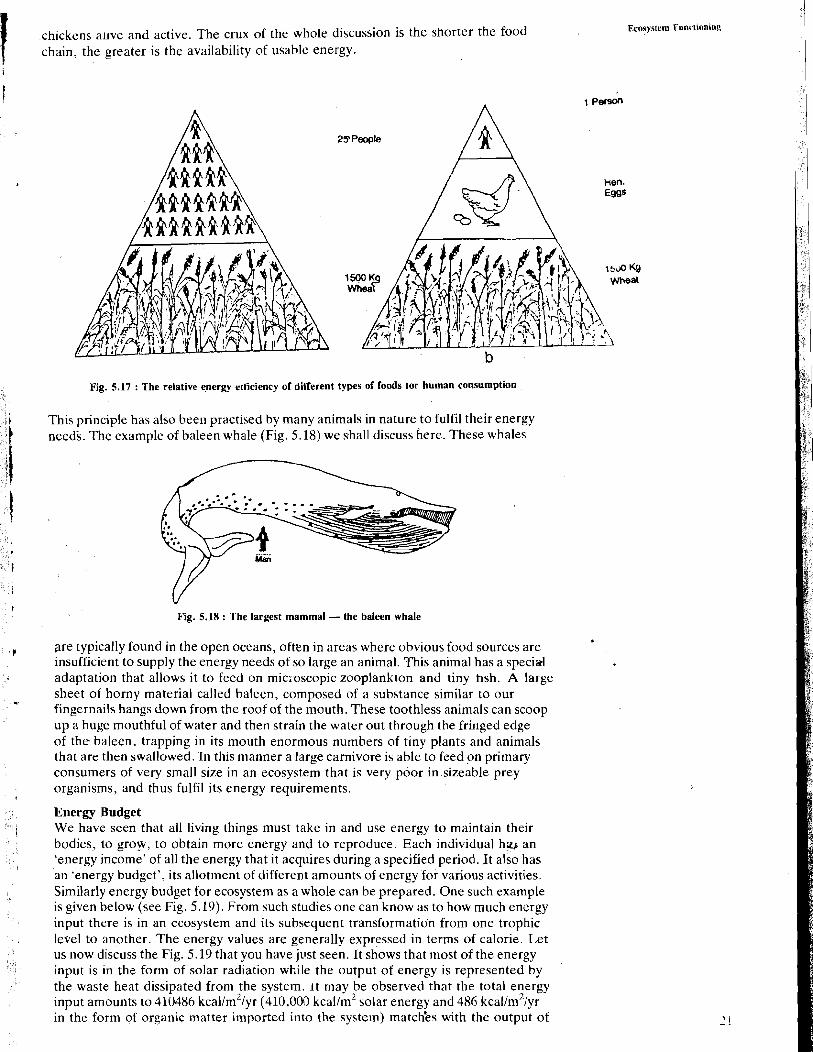
chickens ahvc and active. The crux of the whole discussion is the shorter the food chain, the greater is the availability of usable energy.
Ecosystem Functioning
1 Person
29 People
Fig. 5.17 : The relative energy erticiency of ditferent types of foods tor human consumption
This principle has also been practised by many animals in nature to fulfil their energy needs. The example of baleen whale (Fig. 5.18) we shall discuss here. These whales
Fig. 5.18 : The largest mammal - the baleen whale
are typically found in the open oceans, often in areas where obv~ous food sources are insufficient to supply the energy needs of so large an animal. This animal has a special adaptation that allows it to feed on micnoscopic zooplankton and tiny tlsh. A large sheet of horny material called baleen, composed of a substance similar to our fingernails hangs down from the roof of the mouth. These toothless animals can scoop up a huge mouthful of water and then strain the water out through the fringed edge of the baleen. trapping in its mouth enormous numbers of tiny plants and animals that are then swallowed. In this manner a large carnivore is able to feed on primary consumers of very small size in an ecosystem that is very poor in sizeable prey organisms, and thus fulfil its energy requirements.
Energy Budget We have seen that all living things must take in and use energy to maintain their bodies, to grow, to obtain more energy and to reproduce. Each individual hzs an 'energy income' of all the energy that it acquires during a specified period. Jt also has an 'energy budget', its allot~nent of different amounts of energy for various activities. Similarly energy budget for ecosystem as a whole can be prepared. One such example is given below (see Fig. 5.19). From such studies one can know as to how much energy input there is in an ecosystem and its subsequent transformation from one trophic level to another. The energy values are generally expressed in terms of calorie. Let us now discuss the Fig. 5.19 that you have just seen. It shows that most of the energy input is in the form of solar radiation while the output of energy is represented by the waste heat dissipated from the system. ~t may be observed that the total energy input amounts to 410486 kcallm2/yr (410,000 kcal/m2 solar energy and 486 kcallm21yr in the form of organic matter imported into the system) match'es with the output of

I 1 Ecusystem : Functioning and Types
Fig. 5.19 : Energy flow diagram for Silver springs, Florida. All the energy figures are expressed ar kcal1mVyr. (After Odum, 1957).
energy (407986 kcal1m2lyr) lost as waste heat and (2500 kcallmLlyr exported from the system in the form of organic mat_ter).

5.10 FOOD CHAIN AND FOOD WEB
You are familiar with the concept of food chain and food web that you have studied earlier in FST-1, Unit 14. Based on that we would discuss these in m o h detail in the following sections.
5.10.1 Food Chain In a food chain, the food energy is transformed from a given source through a series of species, each of which eats the one before itself in the chain. This repeated series of eating and being eaten is always initiated with green plants, which convert radiant energy into chemical energy which is stored in food. A very simple food chain is :
Sun - grass - goat - man
In the previous sections, you have also studied that at each transfer a proportion of the food, energy is lost as heat. This limits the number of links or steps in a food chain, usually to four or five. In aquatic ecosystems, microscopic green plants called phytoplankton and algae play the same role as grasses in a pasture or trees in a forest.
Based on the kinds of organismsthat constitute the first trophic level, three types of food chains can be distinguished. These are : i) grazing food chain, ii) detritus food chain, and iii) auxifiary food chain.
i) Grazing Good Chain : Grazing food chains are quite familiar to most of us. Cow or deer grazing in a field represen6 a grazing food chain. Similarly, eating of phytoplanktonic algae by zooplankton and fish is another example of grazing food chain. In most ecosystems, only a small proportion of the total community energy flows through grazing food chains. Also ?t each step, significant amount of organic matter is shunted to detritus food chain-through death, decay and excretion by living organisms.
The grazing food chains in forest and ocean represent two extreme types. Ocean food chains are among the longest, up to five links, in contrast to forest types which mostly consist of three or rarely four links. One of the. reasons for the longer length of grazing food chains in aquatic ecosystems is'the small size of the phytoplankton and zooplankton that chiefly comprise the first two trophic levels. If there are many small herbivores at level two, this means that the carnivores at level three also can be relatively small and numerous, and an additional carnivore level can be accommodated before the last level, represented by a relatively small number of large carnivores.

&mystem : Functioning and Types ii) Detritus Food Chains : Detritus food chains begin with dead organic matter which is an important source of energy. A large amountpf organic matter is contributed
I: \
by the death of plants, plant parts, animals and their excretion products. These :I types of food chains are present in all ecosystems but they are over dorni;-~~+lng I
in forest ecosystems and shallow water communities. ?i ii
I Various species of microscopic fungi, bacteria and other saprophytes play a prominent role in decomposing organic matter to obtain energy needed for their survivafand growth. In this process they release various nutrients, locked in dead organic matter, which are used readily by the green plants.-Detritus food chains are interconnected with grazing food chains and other auxiliary f o ~ d chains through certain specific common organisms to permit crossing over of energy and material flow from one ciicuit to another. For example, cattle do not assimilate all of the energy stored in plants, undigested residues in faeces become available
I for the decomposers and the detritivores.
Detritus food chains are located mainly in the soil or in the sed;ments of aqbatic /
ecosystems. They form an essential component of natural ecosystems and are necessary for self-sustenance and for maintaining ecological balance. Detritus food chains can be of great practical value for modern man for sewage treatment and control of water pollution.
Most of the natural ecosystems possess both grazing and detritus types of food chains. Their relative importance however, varies from onesecosystem to another. In terrestrial and shallow water ecosystems, detritus food chains dominate because a major proportion of the annual energy flow passes through this circuit. In case of tidal marshes, almost 90 pqr cent of the primary production is routed through the detritus food chains. In deep water aquatic systems rapid turnover of organisms and high rate of harvest are responsible for the dominance of grazing food chains. :
-
iii) ~ u x % a r ~ Food Chains : In addition to grazing and detritus food chains there are other auxiliary food chains operated through parasites and scavengers. Some parasitic food chains may be quite complex and may involve unrelated organisms. A deer fed upon by internal roundworms and external ticks or a man with malarial parasites in his. blood are examples of parasitic food chains. Oh, parasitic relations are quite involved as parasites are transmitted through a variety of vectors .or through unrelated intermediary host organisms. Like the other food chains, the ultimate source of energy for all auxiliaiy food chains is,. solar energy orginally harvested by plants..
5.10.2 Food Web In nature no food chain is ~solated or is simple asodescribed in the above examples. i: A plant may serve as a food source for many herbivores simultaneously, erg.. grass I
plants can support d e e ~ , cow, grasshopper or rabbit. Similarly, a herbivore may bc food source formany different carnivorous species (see Fig. 5.20). Also food
4
Fig. 5.20 : A simplified version of a food web.

availability and preferences of herbivores as well as carnivores may shift seasonally (e.g., we eat mangoes in the summer and oranges in the winter).
In an ecosystem, when all interconnections between food chains are mmped out, they form a food web (see Fig. 5.20). A food web illustrates, all possible transfers of .
energy and nutrients among thc organisms in an ecosystem, whereas a food chain traces only one pathway in the food web.
The food web for most communities is very complex, involving innumerable k i d s af living organisms. With many interlocking food chains the community rcmains stable even if one or more of these relations are altered. For example, in a stream-side ecosystem if the grasshoppers become scarce or their population is wiped out because of some calamity, the frogs preying on grasshoppers are not forced to die or move out of that place. They can instead feed on other organisms such as flies or butterflies (see Fig. 5.20). Obviously, then a food web introduces a strong element of stability into an ecosystem. Larger the number of components involved, the more stable the ecosystem is.
5.11 ECOSYSTEM CONTROL
In this section, let us discuss about yet anothel' important aspect of ecosystem functioning, that is, how it maintains its ecological balance. By now, it must be obvious to you that an ecosystem is a dynamic system, wherein a lot of events take place. For example, animals eat and in turn are eaten, moisture and nutrients flow in and out of the system, and weathers change. In spite of all these happenings the ecosystems persist and recover from the slight disturbances. This cnqacity of an ecosystem to self-regdate or self-maintain is called homeostasis. I s .l't this gbility of ecosystems to recover from certain perturbations remarkable? LC t us take a simple example to see that how is this balance maintained in spite of the f.!ght disturbances in the ecosystem. Consider a grassland, when there is a drought, do not grow well. The mice that eat the grass become malnourished. When this happens, their birth rate decreases. And also the hungry mice retreat to their burrows and sleep. By doing so, they need less food and are less exposed to predators, so their de'ath rates decrease. Their behaviour protects their own population balance as well as that of the grasses which are not being consumed while the mice hibcrnate. Such a mechanism is known as feedback regulation and is very important to maintain the ecological balance. It is the prime regulatory mechanism for the ecosystem as a whole. You may know that there are several kinds of organisms comprising an ecosystem. So all the organisms in an ecosystem are part of several different feedback
'loops. A feedback loop may be defined as relationship in which a change in some original rate, altcrs the rate of direction of further change. In the above example, we had deliberately taken a very small group of living beings, that has primarily the mice and the plants.
Now we take up, another parameter of ecosystem balance. One factor that aftects the stability or persistence of some ecosystems under small or moderate environmental stress is species diversity - the number of species and their relative abundance in a given ecosystem. High species diversity tends to increase long-term persistence of the ecosystem. It is because with so many different species and the linkages between them, risk is spread more widely. An ecosystem having a good variety of species has more ways available to respond to most environmental stresses. For example, the loss or drastic reduction of one species ip an ecosystem, with complex food web usually does not threaten the existence of others, because most consumers have several alternative food supplies. In contrast, the highly specialised agricultural ecosystem, planted with only one type of crop such as wheat or rice is highly vulnerable to destruction from a single plant disease or insects. Therefore, the essence of the whole discussion is that most balanced ecosystems contain many different species.
The discussion so far, might have led you to conclude that the ecosystems have the ability to cope up with any disruption. You should realise that this ability is limited. Extremities like fires (destroy the landscape), over-exploitation (e.g., rampant ,ieforestation, mining) or excessive simplification !monoculture, plantation, cropfields) or too severe and prolonged stre\\ch (like drought, pollution) seriously
Ecorvstem Functioning
Homeo = same; Stasis = standing

trcaystern : Functioning and Types hamper the control mechanism, resulting in ecosystem degradation. The lesson is obvious. We should check and control our actions, so that, we do not overload the ecosystem.

5.12 SUMMARY
In this unit we have examined various aspects of ccosystem functioning. So far you have learnt that :
Ecosystems are considered functional units of nature having no specified size or limits.
Ecosystems comprise di'fferent biotic and abiotic components which are functionally coordinated and operate in an integrated, holistic manner.
Every organism has a capacity to tolerate a certain range of a particular environmental factor. This range is known as the tolerance range. At the extremities of the tolerance range the factor becomes limiting.
The concept of trophic level tells us as to which organisms share the same general source of nutrition.
Trophic relationships of an ecosystem can be represented graphically in the form of ecological pyramid. The base of the pyramid represents the producers and the successive tiers represent the subsequent higher trophic levels..
Ecological pyramids are of three types : one - pyramid of number depicts the number of individual organisms at each trophic level; second - pyramid of biomass represents total weight of the living organisms at each trophic level, third pyramid of energy shows the amount of energy utilised at successive trophic levels.
Ecological pyramids. give useful information about the functiofial structure of an ecosystem, but they also have some limitations. Important among them are : a) decomposers are not' represented; b) organisms which take food from different trophic levels are not accounted for; c) one gets no idea about the seasonal and daily variations and also about the detritus litter as an energy source; d) the rate of transfer from one trophic level to another is not known.
Energy is transferred in an srderly sequence, i.e., from sun to producers, to consumers,.to decomposers. Energy flow is always downhill and unidirectional. Heat is constantly lost during the process of energy transfer as expressed in the first and the second laws of thermodynamics. In an ecosystem,energy flow can be quantified. Energy budget refers to the energy enterihg and leaving an ecosystem in a given span of time.
Ecosystems are solar-powered systems. Green plants capture solar energy and store in the form of organic substances. 'Gross primary productivity of an ecosystem is the rate at which organic matter is produced during photosynthesis. Net' primary productivity represents the rate at which some of this matter is incorporated into plant bodies. Net primary productivity is less than gross primary productivity because of the losses resulting from plant metabolism. Increase in the weight of consumers which depend on organic food is termed as secondary production.
Productivity varies from one kind of ecosystem to another and from one time to another. The availability of water, the amount ofminerals and many other factors in addition to incident radiation limit productivity in different ecosystems.
Ecosystem Functioning
Ecosystem : Func- and Energy passes from one trophic level to the next. Approximately 90 per cent of the energy is lost at each transfer. On the average, about 10% of the energy entering a particular trophic level is available to the next level in an ecosystem. Therefore, the biomass that an ecosystem can support at each trophic level declines rapidly. The loss of energy at each trophic level, limits the number of trophic levels in a food chain to four or five.
Organisms of various trophic levels are related to each other through feeding relationships, that can be represented in terms of food chain. Three main types of food chains can be distinguished namely grazing, detritus and auxiliary food chains. The relative importance of these chains may vary in different ecosystems.
0 Ecosystems are highly dynamic entities. They have evolved effective homeostatic mechanism for self-regulation through feedback control.
I ) a) Fill in the blank spaces with appropriate words.
All ecosystems have the same three categories of organisms; .................. , which use abiotic sources of energy and nutrients to synthesise organic molecules; ................. , which acquire energy and nutrients by digesting the
.................. organic molecules of living organisms; and , which obtain energy and nutrients by digesting the organic molecules of dead organisms, their excretions and other organic (but no longer living) materials. Of the
................... three categories, an ecosystem could persist without
2) a) Discuss the concept - range of tolerance. Can you think of any examples in which the range of tolerance was exceeded in ecosystems you are fadiliqr with? What happened during these incidents?
b) What js a limiting factor? What is the limiting factor in most terrestrial ecosystems?
3) a) Which of the following pyramid can never assume an inverted shape?
pyramid of biomass, pyramid of number, pyramid of energy.
....................................................................................................
b) Which trophic level remains unrepresented in ecological pyramids?
.....................................................................................................

c) Why pyramid of biomass in some.aquatic ecosystems like lakes and oceans acquires an inverted shape?
4) a) The net primary productivity of an ecosystem is the total amount of producer tissue formed per unit area per unit time, or the ..................I productivity, minus the chemical energy used in ................... The amount of chemical energy decreases with each step in a food chain, since each organism uses some of the energy to ................ ..., a process that converts chemical energy to .................., and this form of energy is lost from the food chain. (Fill in the blank spaces with appropriate words)
b) Productivity can be expressed in terms of k ~ a l / m ~ / ~ r or g/m2/yr. Discuss the differences and the similarities between these two expressiens.
c) What influences productivity?
d) Which.ecosystems have high net productivity?
e) What is secondary production? How does it differ from primary production?
...................................................................................................
5 ) a) Fill m the blank spaces with appropriate words : Energy enters an ecosystem primarily as .................. and leaves an ecosystem primarily as ................... Within the ecosystem, it is transferred from organism to organism in the form of .................. energy.
b) Can energy be recycled through an ecosystem? Yes or No?
c) Assume that a plant convert's 1 per cent of the light energy it received from the sun into plant material and that an animal,stores 10 per cent of the food energy that it eats. Starting with 10,000 calories of light energy, how much energy is available to a person who eats :
i ) Wheat ....................... calories ii) hen.. .................... .calories ... 111) frog.. ................... .;calories
i Ecosystem Funellon6ng

~cosyscem:lhc6mtwmdT~prs d) A group of explorers is stranded on a barren island. All they have in their stores are some hens and some wheat. To make these resources last as long as possible, should they :
i) eat the wheat and when it is finished, kill and eat the hens, or ii) feed the wheat to the hen, collect and eat the eggs laid and when the
wheat is gone, kill and eat the hens, or iii) kill and eat the hens first and when they are finished eat tbe wheat? Choose the correct choice and write its number in the box provided below.
Also justify you1 answer, in not more than 4 to 5 lines.
...................................................................................................
e) Is there one o i more than one food web in any ecosystem?
f ) During the 1970s, shark-killing expeditions became a fad. Why are sharks important in the food chain of the ocean, and what do you suppose,might happen to other fishes if a large number of sharks disappeared?
6 ) In what way food web relationships promote ecosystem stability? Support your answer with a suitable example.
-- 5.14 ANSWERS
Self-assessment Questions
i$ a) i) v' ii) x i i i ) V iv) x v) x
-E primary producers
biotic components consumer
decomposers
L abiotic components -4 inorganic elements
energy
substrate or medium

c) Write from your own experience
Hint : i) water in a desert ii) salinity in an aquatic ecosystem
2) a) wheat, corn (first trophic level)
. goat, rat (second trophic level)
1ion;cat (third trophic level)
b) Hint : e:g., bear,
Second trophic level (herbivore) as it eats tubers and various other plant products; third trophic level (carnivore) as it eats animals like deer which is a herbivore; fourth trophic kvel (top carnivore) as it eats animals like frog which are carnivores.
c) In-situations where the number of producers is less than the subsequent trophic levels, we get an inverted pyramid, e.g., a large number of insects feeding on a single tree.
e) In energy pyram~ds, a particular trophic level always has a smaller energy content than the trophic level immediately below it. This is because some energy is lost while transfer from one trophic level to the next. Since the amount of energy decreases from the first trophic level onwards, therefore the energy pyramids are always upright and never inverted.
3) a) In an ecosystem the producers utilise solar energy and store it in the food they prepare which are mainly carbohydrates. The plant tissues that have the stored solar energy in them serve as a source of energy for the herbivores. And the herbivores pass on the energy to the carnivores and so on and so forth. Thus the ultimate source of energy for our planet which on the whole can b e . nnsidered as a large ecosystem, is sun.
Consumers
/ /
Decomposers p c) i)
d) ii)
e) iij
f ) desert and semi-desert areas (7)
I savanna (5) hi
: I/ 1 open ocean (6)
i 1 estuary (3) temperate deciduous forest (4)
I1
tropical rain forest (2)
coral reefs (1)
I extreme desert (8)
Ecosystem Functioning

- : - ~ T J P 4) a) Your choice.
b) Hint : If one population of a food chain suffers a decline; then this particular food chain could disappear.
c) v) d) iv)
e) iii)
f) ii)
g) iii)
h) ii)
Terminal Questions 1) producers, consumers, decomposers, consumers.
2) a) Every living organism can tolerate certain range of a particular environmental factor. Beyond this range the organism is unable to survive, e .g . , one of the factors that\influence the life in lakes is pH. Due to acid rain, the p H of th- lakes becomes low, consequently most of the living organisms perish. The water of such lakes appear transparent as the lake becomes devoid of life. (Recall from FST-1, Unit 16, Sub-section 16.2.1)
.( Another e x a i p l e is the accum"1ation of hazardous wastes in the bodies of organisms like birds, man, etc. who are at the top of the food chain. (See FST-1, Unit 16, Sub-section 16.2.1)
b) Living organisms are dependent on certain environmental factors for .their survival and well being. If any of these factors is in short supply, o r even in an excess, it becomes a limiting factor. In most terrestrial ecosystems, water is a limiting factor.
3) a) pyramid of energy
b) decomposers
c) In lakes and sea, most primary producers are single-celled algae which are very small and short-lived. These producers have rapid turnover as compared to the animals of secondary and tertiary trophic levels, e.g., various kinds of fish. These organisms of secondary and tertiary trophic levels are large in size and outweigh the producers. So if we calculate the biomass of various trophic levels in conditions when the biomass of producers is less than the consumers. the pyramid assumes an inverted shape.
4) a) gross, respiration, d o work, heat
b) Similarities - both are the units t o measure primary productivity.
Differences - primary productivity in terms of weight is expressed as g/m'/yr. and in terms of energy is expressed as k ~ a l / m ' / ~ r .
c) Productivity is influenced by a variety of factors such as sunlight, temperature. rainfall and availability of nutrients.
d) Ecosystems like coral reefs, tropical rain forests and estuaries have high net productivities.
e) Secondary production refers to the production by consumer organisms. In primary production, the solar energy is trapped by producers resulting in the increase of their biomass; whereas in secondary production, the consumers utilise the stored energy of plants, for building their bodies.
5) a) Light; heat, chemical
b) No
c) i) 10 calories ii) 1 calorie iii) 0.1 calorie
d) If we sustain.the population of men as well as hen or the stored wheat, the stock would exhaust faster. So first, hens be eaten and thentwheat. This will enable the wheat stock to last longer.
wheat - hen - man .......... (1 wheat - man .......... (2)

In food chain (2) since man is neare.r the therefore, the energy loss would be minimum and they can be sustained on the available wheat stock for a longer-period.
t e ) O n e food web
f) Disappearance of shark would lead to a massive increase in the number of small fish. This would exert tremendous pressure on the phytoplankton population. In times, when the phytoplankton number is very low, there won't be enough food-for the fish, and result would be increased mortality of small fish. Thus the entire food chain would be disrupted.
6 ) A food web shows the feeding interrelationships which exist between various food chains found within an ecosystem. A food web. has a number of alternative routes for energy flow, which help in promoting ecosystem stability. Give an cxample of your choice.