Unemployed or employed? Diagnosis of the situation of higher education graduates on the labour...
13
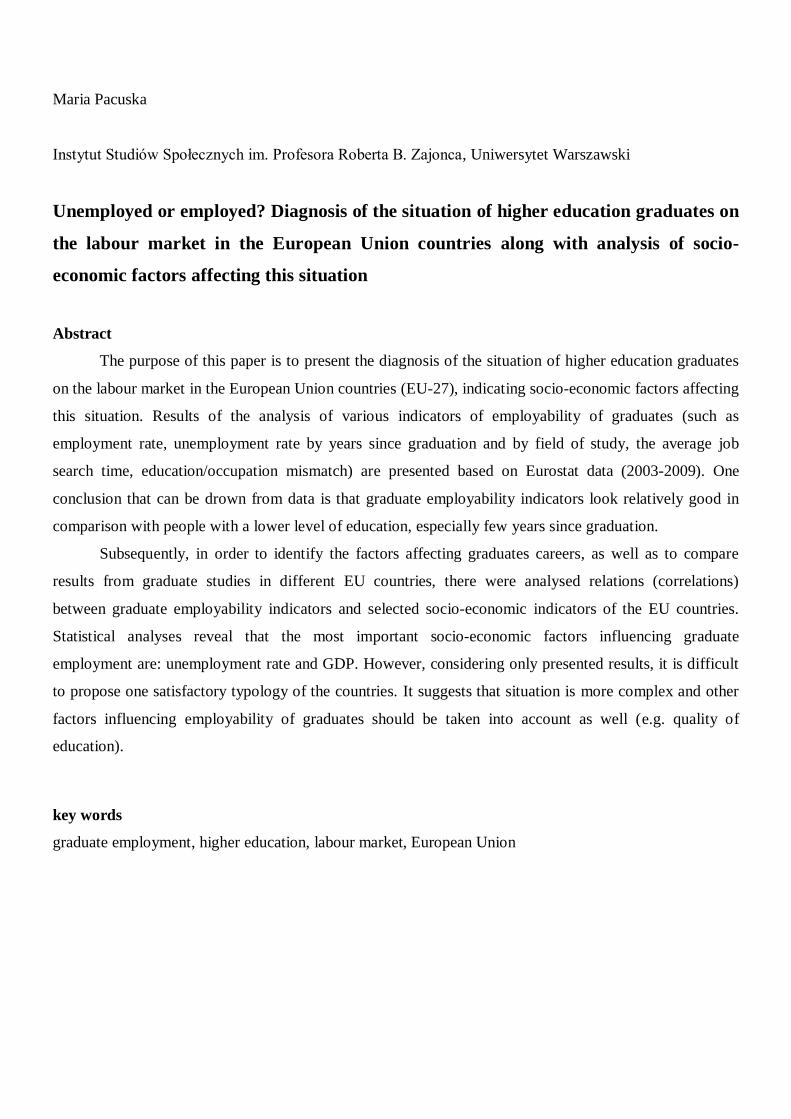
Maria Pacuska Instytut Studiów Społecznych im. Profesora Roberta B. Zajonca, Uniwersytet Warszawski Unemployed or employed? Diagnosis of the situation of higher education graduates on the labour market in the European Union countries along with analysis of socio- economic factors affecting this situation Abstract The purpose of this paper is to present the diagnosis of the situation of higher education graduates on the labour market in the European Union countries (EU-27), indicating socio-economic factors affecting this situation. Results of the analysis of various indicators of employability of graduates (such as employment rate, unemployment rate by years since graduation and by field of study, the average job search time, education/occupation mismatch) are presented based on Eurostat data (2003-2009). One conclusion that can be drown from data is that graduate employability indicators look relatively good in comparison with people with a lower level of education, especially few years since graduation. Subsequently, in order to identify the factors affecting graduates careers, as well as to compare results from graduate studies in different EU countries, there were analysed relations (correlations) between graduate employability indicators and selected socio-economic indicators of the EU countries. Statistical analyses reveal that the most important socio-economic factors influencing graduate employment are: unemployment rate and GDP. However, considering only presented results, it is difficult to propose one satisfactory typology of the countries. It suggests that situation is more complex and other factors influencing employability of graduates should be taken into account as well (e.g. quality of education). key words graduate employment, higher education, labour market, European Union
Transcript of Unemployed or employed? Diagnosis of the situation of higher education graduates on the labour...
Maria Pacuska
Instytut Studiów Społecznych im. Profesora Roberta B. Zajonca, Uniwersytet Warszawski
Unemployed or employed? Diagnosis of the situation of higher education graduates on
the labour market in the European Union countries along with analysis of socio-
economic factors affecting this situation
Abstract
The purpose of this paper is to present the diagnosis of the situation of higher education graduates
on the labour market in the European Union countries (EU-27), indicating socio-economic factors affecting
this situation. Results of the analysis of various indicators of employability of graduates (such as
employment rate, unemployment rate by years since graduation and by field of study, the average job
search time, education/occupation mismatch) are presented based on Eurostat data (2003-2009). One
conclusion that can be drown from data is that graduate employability indicators look relatively good in
comparison with people with a lower level of education, especially few years since graduation.
Subsequently, in order to identify the factors affecting graduates careers, as well as to compare
results from graduate studies in different EU countries, there were analysed relations (correlations)
between graduate employability indicators and selected socio-economic indicators of the EU countries.
Statistical analyses reveal that the most important socio-economic factors influencing graduate
employment are: unemployment rate and GDP. However, considering only presented results, it is difficult
to propose one satisfactory typology of the countries. It suggests that situation is more complex and other
factors influencing employability of graduates should be taken into account as well (e.g. quality of
education).
key words
graduate employment, higher education, labour market, European Union
Introduction
Recently criticisms of institutions of higher education for failing to satisfy the needs of industry and
commerce, or the economy, have intensified. It is argued that higher education graduates are often
unemployed and that gainful graduate employment is an indicator of the effectiveness of the higher
education delivery system as well as demand for higher education in society [1, 4, 5].
European Union bodies have given the importance of enhancing employability through education
and training in order to meet current and future labour market challenges [3]. According to Council
conclusions on the employability of graduates from education and training [2] – Employability is the
combination of factors which enable individuals to progress towards or enter employment, to stay in
employment and to progress during their career - is a complex concept, involving not only each
individual's characteristics, skills, attitudes and motivation, but also other external factors which lie
beyond the scope of education and training policy, such as labour market regulations, demography, the
structure of the economy and the overall economic situation.[2:4] This statement has inspired the creation
of the article.
The purpose of this paper is to present the diagnosis of the situation of higher education graduates
on the labour market in the European Union countries (EU-27), indicating socio-economic factors affecting
this situation. In the first place the results of the analysis of various indicators of employability of
graduates are presented based on Eurostat data. This will allow to answer the question whether graduates
have difficulty on the labour market.
Subsequently, in order to identify the factors affecting graduates careers, as well as to compare
results from graduate studies in different EU countries, there will be analysed the relation (correlations)
between graduate employability indicators with indicators of socio-economic situation of the EU countries,
e.g. GDP, GDP per capita, unemployment rate, the proportion of people with higher education in society,
the average wages, etc.
Since graduate survey on European level conducted by Eurostat come from different years (2003-
2009) and only such statistics are available1, data form different years were examined, but only the data
from the same year were compared. Graduates in this study will be taken to mean people aged 20 to 34
years having attained higher education level (ISCED levels 5 and 6).
I. Do higher education graduates face difficulties in the labour market? Results of the analysis
of various indicators of graduate employability
1 Bologna Process Implementation Report [1] sometimes refer to newer data, however more recent raw data on which would be
possible to perform such advanced statistical analysis are not yet available
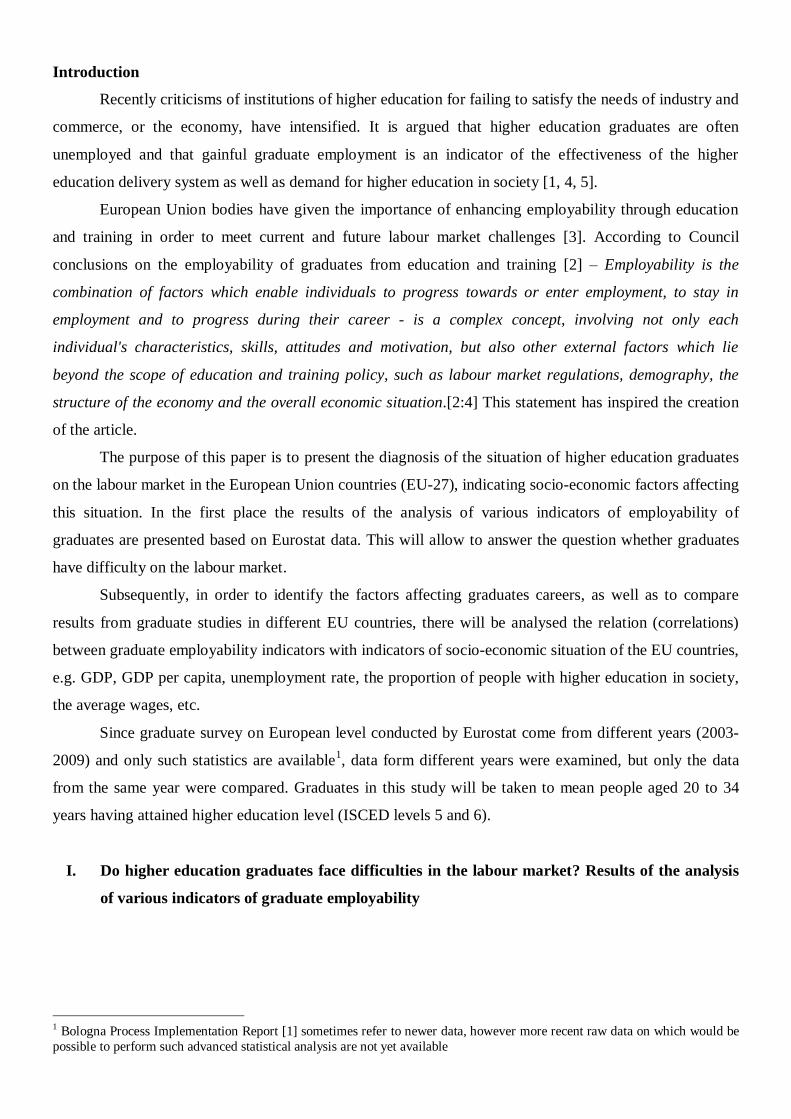
a) Unemployment rate
It seems that recent graduates indeed face some difficulties in the labour market. For European
Union countries (EU-27) average unemployment rate of recent higher education graduates (who graduated
less than 3 years before) is moderately high - 13,1 (data obtained in years 2003-2007). There are, however,
significant differences among countries. The highest graduate unemployment by less than 3 years since
graduation occurs in Greece (30,9), Italy (24,9), Portugal (19,2) and Spain (18,5), whereas the lowest
unemployment rate is in Latvia (6,5), United Kingdom (6,4), Malta (5,3), Estonia (5,1) and Netherlands
(3.8) (see table below).
Table 1. Unemployment rate of persons aged 20-34, by years since graduation (ISCED 5-6) (the average
of the years 2003-2007) - %, difference – percentage points.
Source: Own calculations based on Eurostat.
There are as well differences among the highly educated according to the number of years since
graduation. 3 years or over after graduation average of graduate unemployment rate in EU-27 is at a
considerably lower level – 4,9. The indicator captures the labour market entry prospects of recent
Country Less than 3 years 3 years or over Difference
Greece 30,9 10,9 20,0
Italy 24,9 6,4 18,5
Portugal 19,2 6,3 12,9
Spain 18,5 7,4 11,1
France 16 5,9 10,1
Romania 15,6 2,7 12,9
Poland 15,4 5 10,4
Slovakia 13,8 3,4 10,4
Cyprus 13,5 3,5 10,0
Bulgaria 13 4,9 8,1
Belgium 12,7 3,6 9,1
Slovenia 12,4 3,2 9,2
Luxembourg 12 2,8 9,2
Denmark 11,3 3 8,3
Hungary 10,5 2,3 8,2
Czech Republic 8,1 1,4 6,7
Lithuania 7,8 3,6 4,2
Finland 7,7 3,4 4,3
Sweden 6,9 2,9 4,0
Austria 6,8 2,4 4,4
Germany 6,6 3,8 2,8
Ireland 6,6 3 3,6
Latvia 6,5 2,5 4,0
United Kingdom 6,4 2,3 4,1
Malta 5,3 1 4,3
Estonia 5,1 3,8 1,3
Netherlands 3,8 1,8 2,0
European Union (27
countries) 13,1 4,9 8,2
graduates in comparison to the employment situation of more experienced young people. Overall, the
unemployment ratio of recent graduates is considerably higher than that of more experienced young
people. In more than half of the EU-27 countries (15 out of 27), the unemployment ratio of recent
graduates is higher than 10%, while three or more years after graduation there is only one country with
such a graduate unemployment rate (Greece). Countries with the largest gaps between recent graduates and
those with more experience are Greece again (difference of 20 percentage points) and Italy (18,5); while
countries with the smallest gaps are Estonia (difference of 1,3 percentage points), Netherlands (2) and
Germany (2,8).
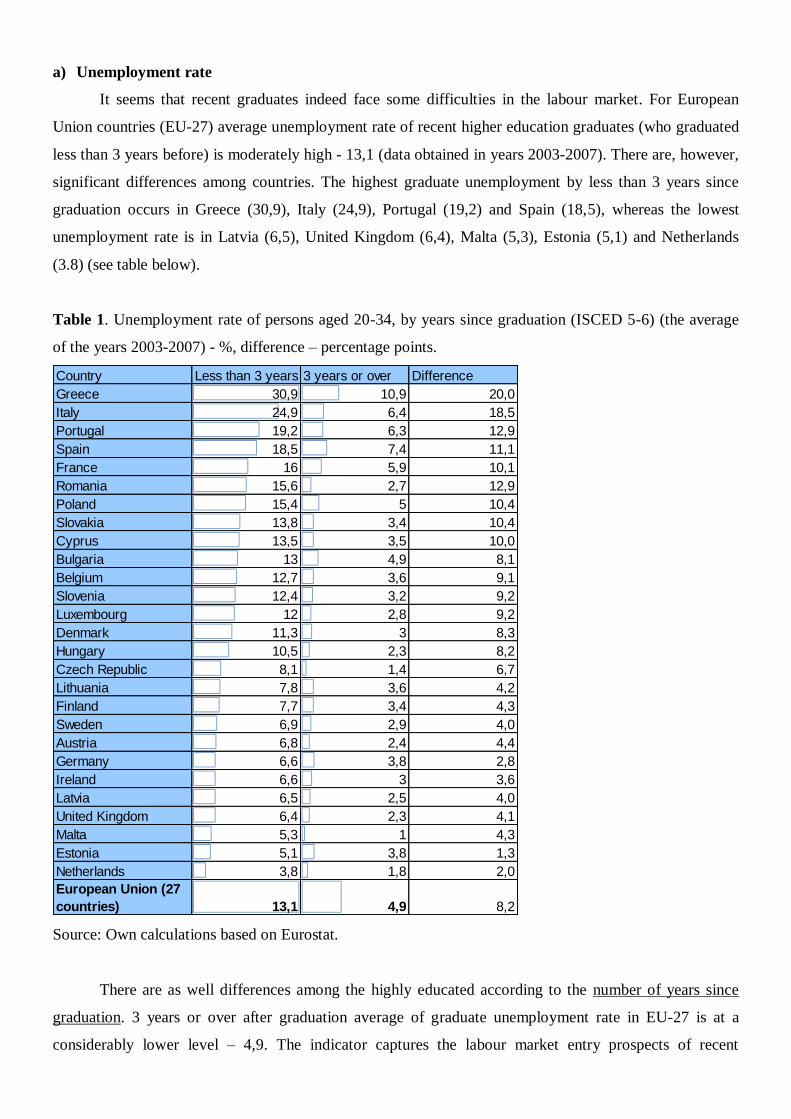
The graduate unemployment rate differs also according to field of study. It is often taken for
granted that graduates of science have better prospects on labour market than humanities graduates.
Analysed data to some extend confirm that. Average unemployment rate for graduates of humanities and
arts for EU-27 is the highest – 9,7. On the other hand, unemployment rate for social sciences is equal with
science (7,5). The lowest unemployment concern graduates in the field of health and welfare (4,5)2.
Chart 1. Unemployment rate by field of study (ISCED 5-6) (2003-2007); average for European Union (27
countries) - %
Source: Own calculations based on Eurostat.
There are however countries, in which other field of study than humanities bring higher
unemployment. Take for instance graduates of agriculture and veterinary or services in countries like
Bulgaria and Estonia. Besides, there is one country (Latvia) where among science, mathematics and
computing graduates there are more unemployed (difference of 2 percentage points) than among
humanities graduates.
2 Differences are statistically significant.
9,7
7,9 7,5 7,5 76
5,44,5
Humanitiesand arts
Agricultureand veterinary
Socialsciences,
business andlaw
Science,mathematics
andcomputing
Services Education Engineering,manufacturing
andconstruction
Health andWelfare
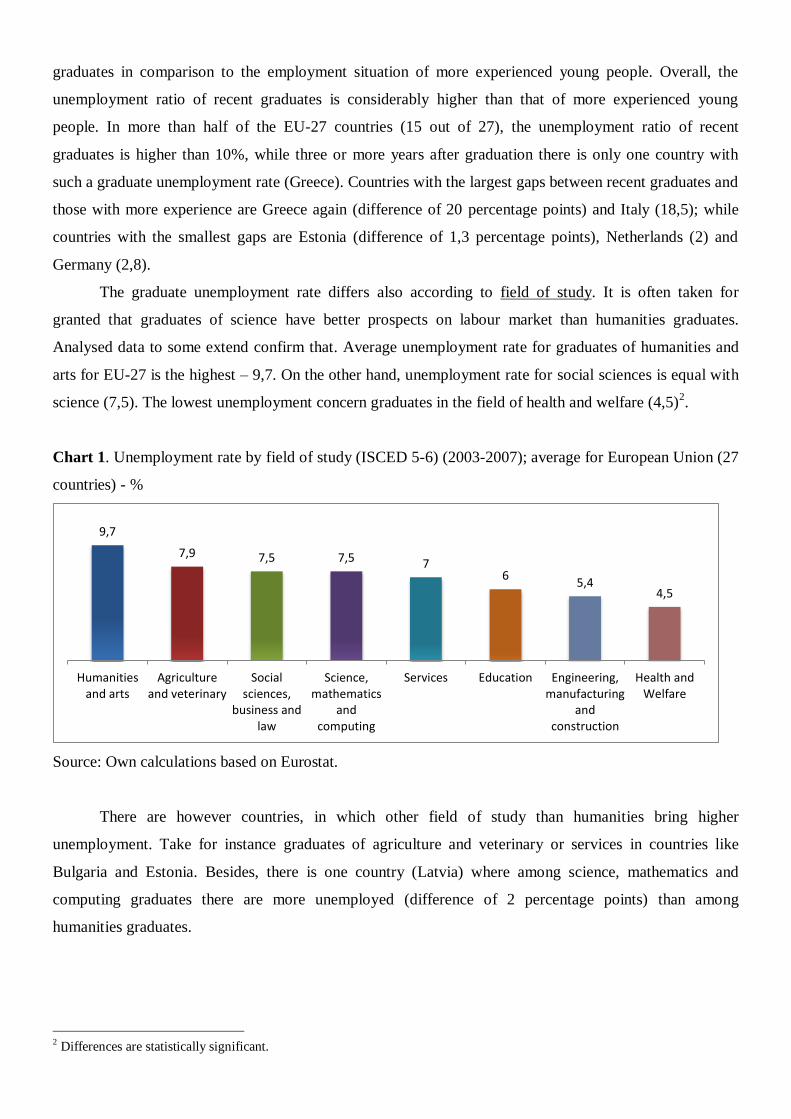
Another important conclusion that can be drown form available data is that the situation of
graduates looks good compared to graduates having attained lower levels of education. On average, the
higher the level of education, the lower the unemployment ratio of young people (see chart below).
Chart 2. Unemployment rate of persons aged 20-34 by education level (the average of the years 2003-
2007) - %
Source: Own calculations based on Eurostat.
On average, unemployment rate is the highest for people with pre-primary, primary, lower and
upper secondary education - 16,3, for upper secondary education and post-secondary non-tertiary
education - it is 10,9 and for first and second stage of tertiary education (levels 5 and 6) unemployment rate
is the lowest – 7,1. The biggest gap between the unemployment ratios of young people with low and high
educational attainment is in Slovakia (67% vs. 7%) and the Czech Republic (34% vs. 3%), followed by
Poland (40% vs.10%). These are the countries where gaining a higher education degree improves young
people's labour market prospects the most. In contrast, there are countries where there is practically no
difference between unemployment ratios for the low and high skilled – this is the case of Cyprus, Italy,
Portugal and Greece. Interestingly, in the latter two countries, the unemployment ratio of highly educated
young people is even slightly higher than that of the low educated. This phenomenon is often labelled as
“over-education” [5].
0
10
20
30
40
50
60
70
Pre-primary, primary, lower and upper secondary education shorter than 3 years (levels 0-3CS)
Upper secondary education (excluding level 3C shorter than 3 years) and post-secondary non-tertiary education(levels 3A, 3B and 4)
First and second stage of tertiary education (levels 5 and 6)
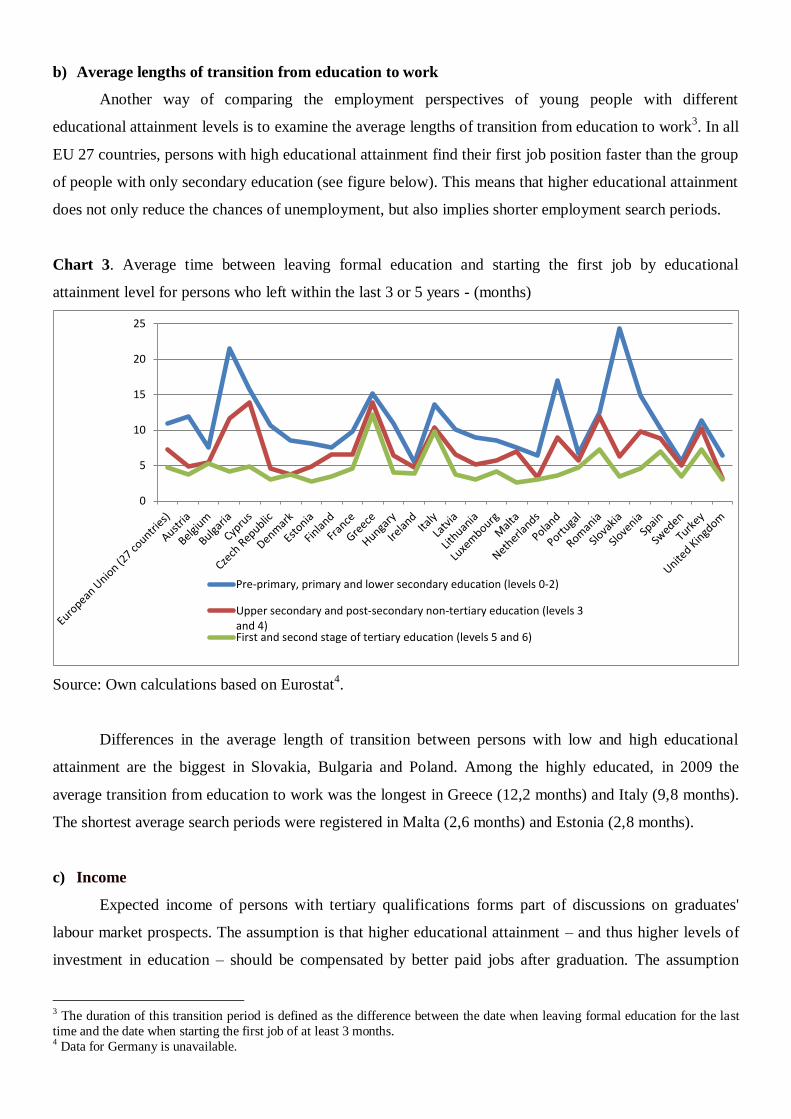
b) Average lengths of transition from education to work
Another way of comparing the employment perspectives of young people with different
educational attainment levels is to examine the average lengths of transition from education to work3. In all
EU 27 countries, persons with high educational attainment find their first job position faster than the group
of people with only secondary education (see figure below). This means that higher educational attainment
does not only reduce the chances of unemployment, but also implies shorter employment search periods.
Chart 3. Average time between leaving formal education and starting the first job by educational
attainment level for persons who left within the last 3 or 5 years - (months)
Source: Own calculations based on Eurostat4.
Differences in the average length of transition between persons with low and high educational
attainment are the biggest in Slovakia, Bulgaria and Poland. Among the highly educated, in 2009 the
average transition from education to work was the longest in Greece (12,2 months) and Italy (9,8 months).
The shortest average search periods were registered in Malta (2,6 months) and Estonia (2,8 months).
c) Income
Expected income of persons with tertiary qualifications forms part of discussions on graduates'
labour market prospects. The assumption is that higher educational attainment – and thus higher levels of
investment in education – should be compensated by better paid jobs after graduation. The assumption
3 The duration of this transition period is defined as the difference between the date when leaving formal education for the last
time and the date when starting the first job of at least 3 months. 4 Data for Germany is unavailable.
0
5
10
15
20
25
Pre-primary, primary and lower secondary education (levels 0-2)
Upper secondary and post-secondary non-tertiary education (levels 3and 4)First and second stage of tertiary education (levels 5 and 6)
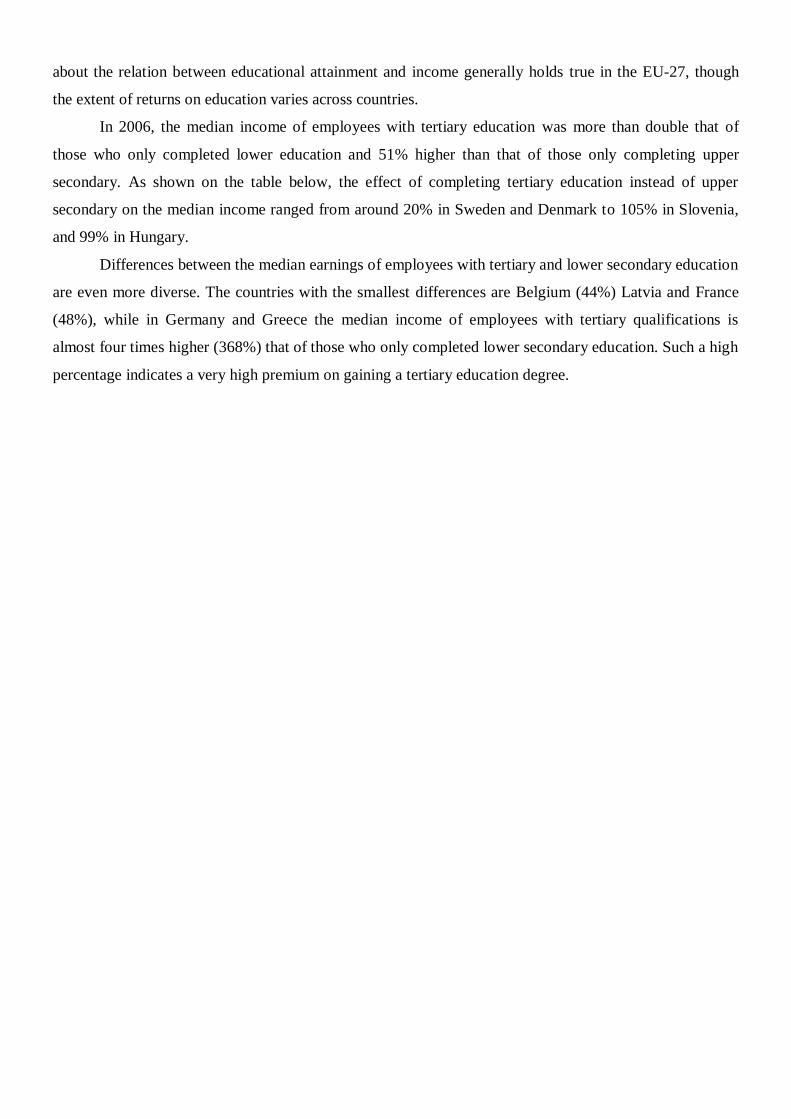
about the relation between educational attainment and income generally holds true in the EU-27, though
the extent of returns on education varies across countries.
In 2006, the median income of employees with tertiary education was more than double that of
those who only completed lower education and 51% higher than that of those only completing upper
secondary. As shown on the table below, the effect of completing tertiary education instead of upper
secondary on the median income ranged from around 20% in Sweden and Denmark to 105% in Slovenia,
and 99% in Hungary.
Differences between the median earnings of employees with tertiary and lower secondary education
are even more diverse. The countries with the smallest differences are Belgium (44%) Latvia and France
(48%), while in Germany and Greece the median income of employees with tertiary qualifications is
almost four times higher (368%) that of those who only completed lower secondary education. Such a high
percentage indicates a very high premium on gaining a tertiary education degree.
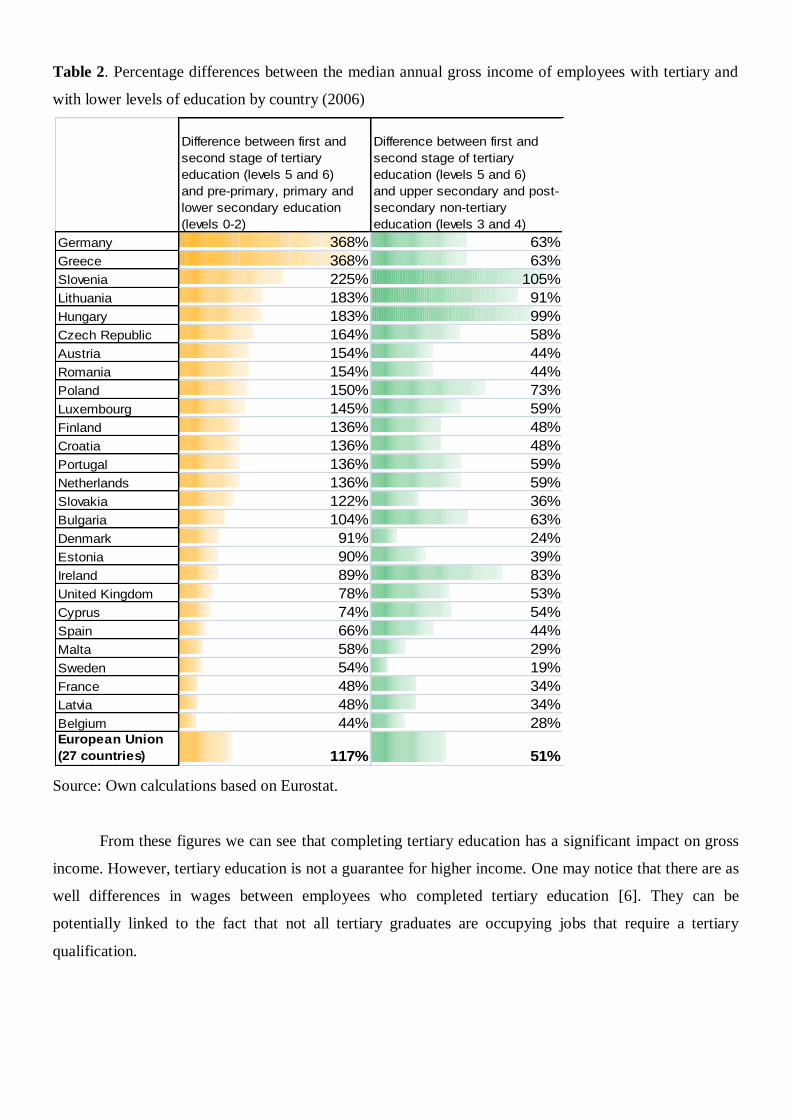
Table 2. Percentage differences between the median annual gross income of employees with tertiary and
with lower levels of education by country (2006)
Source: Own calculations based on Eurostat.
From these figures we can see that completing tertiary education has a significant impact on gross
income. However, tertiary education is not a guarantee for higher income. One may notice that there are as
well differences in wages between employees who completed tertiary education [6]. They can be
potentially linked to the fact that not all tertiary graduates are occupying jobs that require a tertiary
qualification.
Difference between first and
second stage of tertiary
education (levels 5 and 6)
and pre-primary, primary and
lower secondary education
(levels 0-2)
Difference between first and
second stage of tertiary
education (levels 5 and 6)
and upper secondary and post-
secondary non-tertiary
education (levels 3 and 4)
Germany 368% 63%
Greece 368% 63%
Slovenia 225% 105%
Lithuania 183% 91%
Hungary 183% 99%
Czech Republic 164% 58%
Austria 154% 44%
Romania 154% 44%
Poland 150% 73%
Luxembourg 145% 59%
Finland 136% 48%
Croatia 136% 48%
Portugal 136% 59%
Netherlands 136% 59%
Slovakia 122% 36%
Bulgaria 104% 63%
Denmark 91% 24%
Estonia 90% 39%
Ireland 89% 83%
United Kingdom 78% 53%
Cyprus 74% 54%
Spain 66% 44%
Malta 58% 29%
Sweden 54% 19%
France 48% 34%
Latvia 48% 34%
Belgium 44% 28%European Union
(27 countries) 117% 51%
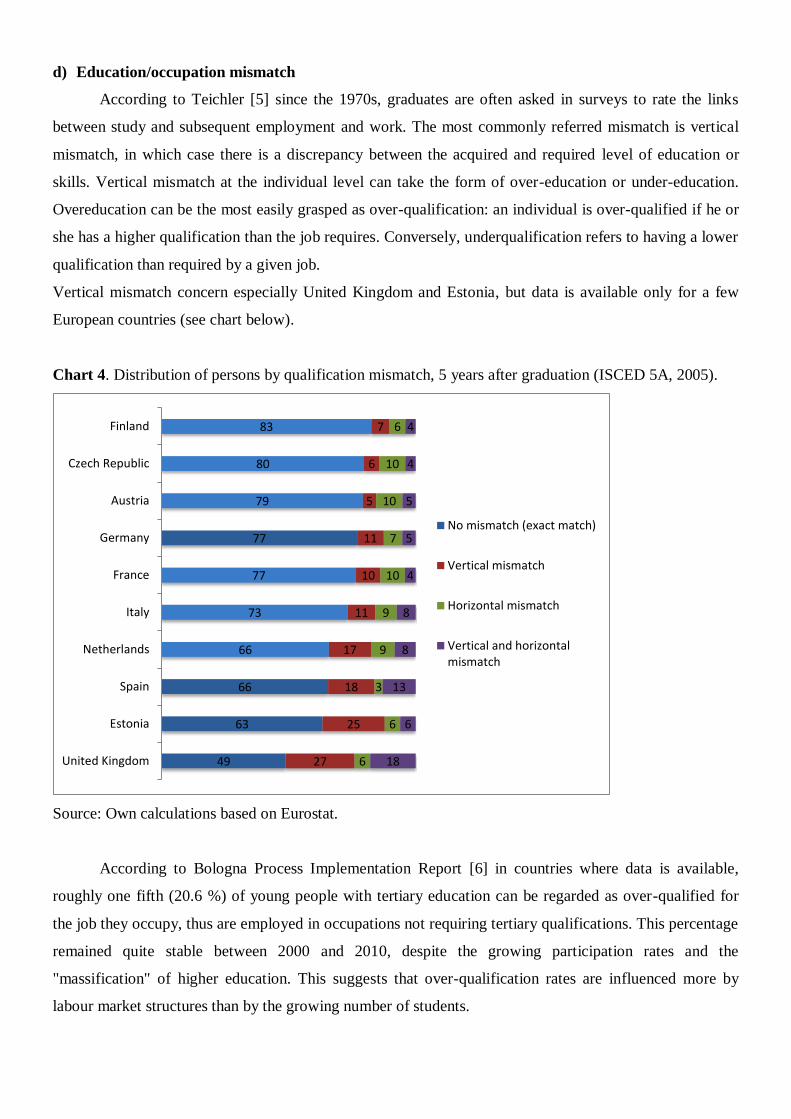
d) Education/occupation mismatch
According to Teichler [5] since the 1970s, graduates are often asked in surveys to rate the links
between study and subsequent employment and work. The most commonly referred mismatch is vertical
mismatch, in which case there is a discrepancy between the acquired and required level of education or
skills. Vertical mismatch at the individual level can take the form of over-education or under-education.
Overeducation can be the most easily grasped as over-qualification: an individual is over-qualified if he or
she has a higher qualification than the job requires. Conversely, underqualification refers to having a lower
qualification than required by a given job.
Vertical mismatch concern especially United Kingdom and Estonia, but data is available only for a few
European countries (see chart below).
Chart 4. Distribution of persons by qualification mismatch, 5 years after graduation (ISCED 5A, 2005).
Source: Own calculations based on Eurostat.
According to Bologna Process Implementation Report [6] in countries where data is available,
roughly one fifth (20.6 %) of young people with tertiary education can be regarded as over-qualified for
the job they occupy, thus are employed in occupations not requiring tertiary qualifications. This percentage
remained quite stable between 2000 and 2010, despite the growing participation rates and the
"massification" of higher education. This suggests that over-qualification rates are influenced more by
labour market structures than by the growing number of students.
49
63
66
66
73
77
77
79
80
83
27
25
18
17
11
10
11
5
6
7
6
6
3
9
9
10
7
10
10
6
18
6
13
8
8
4
5
5
4
4
United Kingdom
Estonia
Spain
Netherlands
Italy
France
Germany
Austria
Czech Republic
Finland
No mismatch (exact match)
Vertical mismatch
Horizontal mismatch
Vertical and horizontalmismatch
II. Identification of the factors connected to socio-economic conditions of the countries and
affecting graduate employment
Employment and unemployment of young people do not only depend on the quality of education
young people receive. Changes in the general state of the economy and the labour market are among the
most important determinants of job opportunities. According to Bruwer [1] the unemployment rate is
usually a good indicator of the state of labour markets. If one is being pragmatic, it then follows that the
most dominant obvious cause for graduate unemployment is a stagnation in economic growth. Another
reason for the increasing graduate unemployment is the increasing labour force participation rate among
graduates, mainly the female population, this being the net outcome of the larger graduating classes.
Due to the limited volume of this article only selected factors related to the socio-economic
situation of each country possibly affecting the graduates’ employment have been taken into account. The
latest available comparable data on the situation of graduates in the labour market (Eurostat, 2009) were
analysed.
For EU-27 countries the following correlations with an employment rate of young people with
higher education being five years after graduation have been identified:
strong negative correlation (-0,66997) with the total youth unemployment rate (of people being less
than 25 years, regardless of their present level of education). It means that when youth
unemployment falls, the employment rate of graduates grows.
strong negative correlation (-0,557) with general unemployment rate (total annual average for each
of the EU-27 country). Decline in unemployment rate is connected with the increase of the graduate
employment rate. Moreover, it is worth noticing that there is a strong correlation (at the level of
0,9) between general unemployment rate and youth unemployment rate.
positive correlation of an average strength (0,361) with gross domestic product at market prices. If
the GDP in a country grows, indicator of employment of young people with higher education also
grows.
minor positive correlation (0,244) with an average age of persons who left higher education system
within the last 3-5 years. The higher the average age of graduates, the higher graduate employment
rate. It is not an obvious conclusion. Lindberg’s analysis suggest an explanation of this fact - higher
graduate employment rate concern countries where more of the graduates had already been active
on the labour market before actually graduating. Therefore, an attempt should be made to
standardise the meaning of the graduation with respect to the initial transition from education to
work (Lindberg: 633).
minor correlation (0,09) with level of public expenditure on tertiary education – as percentage of
GDP. The higher the expenditure, the slightly higher rate of graduate employment. It should be
noted, however, that level of public expenditure correlates strongly (0,664) with value of the ratio
of GDP.
insignificant negative correlation (-0,09) with the percentage of people with higher education in the
population (people 15-64 years old). The smaller the percentage (when there are less people with
higher education in society), the higher percentage of employed graduates.
Therefore, it seems reasonable to assume that the most important factors connected to the socio-
economic situation of the country influencing graduate employment are: unemployment rate and GDP.
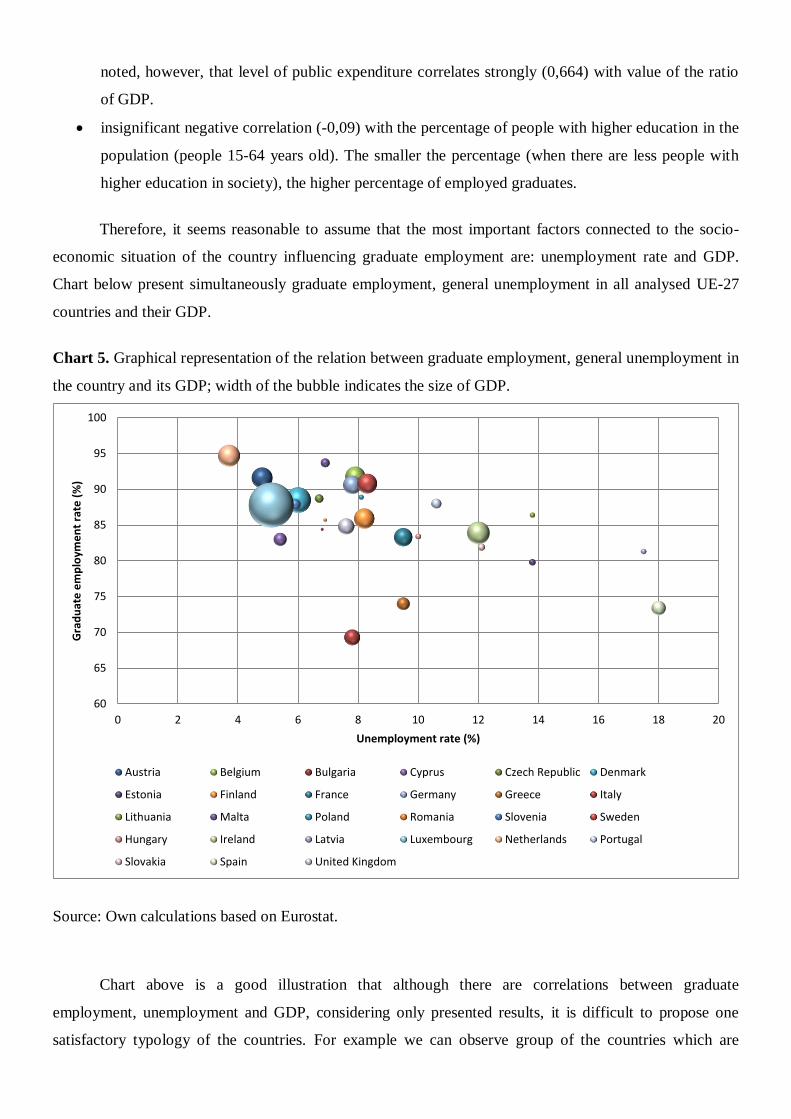
Chart below present simultaneously graduate employment, general unemployment in all analysed UE-27
countries and their GDP.
Chart 5. Graphical representation of the relation between graduate employment, general unemployment in
the country and its GDP; width of the bubble indicates the size of GDP.
Source: Own calculations based on Eurostat.
Chart above is a good illustration that although there are correlations between graduate
employment, unemployment and GDP, considering only presented results, it is difficult to propose one
satisfactory typology of the countries. For example we can observe group of the countries which are
60
65
70
75
80
85
90
95
100
0 2 4 6 8 10 12 14 16 18 20
Gra
du
ate
em
plo
yme
nt
rate
(%
)
Unemployment rate (%)
Austria Belgium Bulgaria Cyprus Czech Republic Denmark
Estonia Finland France Germany Greece Italy
Lithuania Malta Poland Romania Slovenia Sweden
Hungary Ireland Latvia Luxembourg Netherlands Portugal
Slovakia Spain United Kingdom
characterized by a relatively low rate of graduate unemployment and in the same time high general
unemployment and small GDP (Latvia, Estonia), but there is also one country with similar employment
with medium GDP (Spain). There are as well countries, where unemployment is not so high (smaller than
10%), GDP is medium and graduate employment is relatively low – less than ¾ of graduates are employed
(case of Italy and Greece). It suggests that situation is complex and other factors influencing employability
of graduates should be taken into account as well (e.g. quality of education, structure of economy).
Summary
Labour market situation of graduates is most precarious in southern countries such as Greece,
Portugal, Italy and Spain. These are the countries where graduate unemployment rate is high, same as
average lengths of transition from education to work. Among the highly educated, the average transition
from education to work in 2009 was the longest in Greece (12.2 months) and Italy (9.8 months). Moreover,
in Italy, Portugal and Greece there is practically no difference between unemployment ratios for the low
and high skilled.
As has been demonstrated, the most important factors connected to the socio-economic situation of
the country influencing graduate employment are: unemployment rate and GDP. Usually - based on
Eurostat EU-27 countries data - graduate unemployment is higher, when total unemployment rate is high.
On the other hand, when gross domestic product in a country grows, indicator of employment of young
people with higher education also grows. There are however some exceptions, i.e. countries where GDP is
medium and graduate employment relatively low (case of Spain, Greece and Italy). It suggests that
situation is complex and other factors influencing employability of graduates should be taken into account
as well (e.g. quality of education, structure of economy).
Literature references:
1. Bruwer J., (1998), First destination graduate employment as key performance indicator: outcomes
assessment perspectives, Cape Technikon South Africa, Unit for institutional planning and
research.
2. Council conclusions on the employability of graduates from education and training, Brussels, 10
and 11 May 2012, [17.02.2014],
‹http://www.consilium.europa.eu/uedocs/cms_data/docs/pressdata/en/educ/130142.pdf›
3. Crosier D., Purser L., Smidt H., (2007), Trends V: Universities Shaping the European Higher
Education Area, EUA Publications [19.07.2013], ‹http://www.eua.be/eua-work-and-policy-
area/building-the-european-higher-education-area/trends-in-european-higher-education.aspx›.

4. Lindberg M. E., (2007), ”At the Frontier of Graduate Surveys” Assessing participation and
employability of graduates with master’s degree in nine European countries, “Higher Education”,
53: 623–644.
5. Teichler U., (2002), Graduate employment and work in Europe: diverse situations and common
perceptions, “Tertiary Education and Management” 8: 199–216, 2002.
6. The European Higher Education Area in 2012: Bologna Process Implementation Report, (2012),
Education, Audiovisual and Culture Executive Agency.