Unclaimed Children Revisited: California Case Study
144
REPORT Unclaimed Children Revisited California Case Study Janice L. Cooper | Yumiko Aratani April 2010 Rachel Masi | Patti Banghart | Sarah Dababnah Ayana Douglas-Hall | Alex Tavares | Shannon Stagman
-
Upload
khangminh22 -
Category
Documents
-
view
1 -
download
0
Transcript of Unclaimed Children Revisited: California Case Study
R E P O RT
Unclaimed Children RevisitedCalifornia Case Study
Janice L. Cooper | Yumiko Aratani April 2010Rachel Masi | Patti Banghart | Sarah Dababnah Ayana Douglas-Hall | Alex Tavares | Shannon Stagman
Copyright © 2010 by the National Center for Children in Poverty
The National Center for Children in Poverty (NCCP) is the nation’s leading public
policy center dedicated to promoting the economic security, health, and well-being
of America’s low-income families and children. Using research to inform policy and
practice, NCCP seeks to advance family-oriented solutions and the strategic use of
public resources at the state and national levels to ensure positive outcomes for the next
generation. Founded in 1989 as a division of the Mailman School of Public Health at
Columbia University, NCCP is a nonpartisan, public interest research organization.
Lead authors
Janice L. Cooper, Phd, is interim director at NCCP and assistant clinical professor, health Policy and Management at Columbia university Mailman school of Public health. she is principal investigator of the unclaimed Children revisited California Case study. dr. Cooper directed NCCP’s health and mental health work from May 2005 to January 2010.
Yumiko aratani, Phd, is senior research associate and was acting director of Family economic security at the National Center for Children in Poverty from august 2009 to april 2010. she is lead analyst for unclaimed Children revisited. her research has focused on the role of housing in stratifica-tion processes, parental assets and children’s well-being.
aCkNowLedgMeNts
the authors are grateful for the generous funding provided by the California endowment and the Zellerbach Family Foundation for this project. gwen Foster and ellen walker provided valuable guidance to this project. special thanks to Vivien saveth and Lola adedokun for their research assistance that made significant contributions to this report. we also thank telly Valdellon, Morris ardoin and amy Palamisano who provided support for the production of this report. we would also like to thank tom wilson, Bryan Fisher, kari Yoshizuka and their team at the California department of Mental health for their generous support and for providing us with Medi-Cal and Client and service Information data.
this project would not have been possible without the support of our advisory group. special thanks to william arroyo, Bill Carter, sai-Ling Chan-sew, Jennifer Clancy, rachel guerrero, John Landsverk, rosa ana Lozada-garcia, Perry Jones, abram rosenblatt, gale walker, rosa warder, Constance M. weisner and Captain Young.
UNClAiMed CHildReN ReviSiTed: California Case StudyJanice L. Cooper, Yumiko aratani, rachel Masi, Patti Banghart, sarah dababnah, ayana douglas-hall, alex tavares, shannon stagman
Dedicated to Jane Knitzer.
National Center for Children in Poverty Unclaimed Children Revisited: California Case Study 3
Unclaimed Children RevisitedCalifornia Case StudyJanice L. Cooper | Yumiko aratani april 2010rachel Masi | Patti Banghart | sarah dababnah ayana douglas-hall | alex tavares | shannon stagman
ExEcutivE Summary . . . . . . . . . . . . . . . . . . . . . . . . . . . . . . . . . . . . . . . . . . . . . . . . . . . . . . . . . . . . . . . . . 4
chaptEr 1introduction . . . . . . . . . . . . . . . . . . . . . . . . . . . . . . . . . . . . . . . . . . . . . . . . . . . . . . . . . . . . . . . . . . . . . . . . . . . . 14
chaptEr 2Who are california’s unclaimed children today? . . . . . . . . . . . . . . . . . . . . . . . . . . . . . . . . . . . . . . . . . . . . 21
chaptEr 3Service Delivery – System Gains, co-occurring, access . . . . . . . . . . . . . . . . . . . . . . . . . . . . . . . . . . . . . . . 33
chaptEr 4research-informed Services (Evidence-based practices) . . . . . . . . . . . . . . . . . . . . . . . . . . . . . . . . . . . . . . . 44
chaptEr 5Developmentally-appropriate Services and Supports . . . . . . . . . . . . . . . . . . . . . . . . . . . . . . . . . . . . . . . . . . 54
chaptEr 6Family- and youth-driven Services . . . . . . . . . . . . . . . . . . . . . . . . . . . . . . . . . . . . . . . . . . . . . . . . . . . . . . . . . 65
chaptEr 7culturally- and Linguistically-competent Services . . . . . . . . . . . . . . . . . . . . . . . . . . . . . . . . . . . . . . . . . . . . .76
chaptEr 8prevention and Early intervention Within a public health Framework . . . . . . . . . . . . . . . . . . . . . . . . . . .86
chaptEr 9Financing children’s mental health Services . . . . . . . . . . . . . . . . . . . . . . . . . . . . . . . . . . . . . . . . . . . . . . . . . 97
chaptEr 10information technology and Outcome measurement . . . . . . . . . . . . . . . . . . . . . . . . . . . . . . . . . . . . . . . . 111
chaptEr 11Lessons Learned . . . . . . . . . . . . . . . . . . . . . . . . . . . . . . . . . . . . . . . . . . . . . . . . . . . . . . . . . . . . . . . . . . . . . . . . 120
references . . . . . . . . . . . . . . . . . . . . . . . . . . . . . . . . . . . . . . . . . . . . . . . . . . . . . . . . . . . . . . . . . . . . . . . . . . . . . 130
appendix 1: california case Study Strategic advisory Work Group . . . . . . . . . . . . . . . . . . . . . . . . . . . . 134
appendix 2: california case Study Focus Group interview Facilitators . . . . . . . . . . . . . . . . . . . . . . . . . 135
appendix 3: Overview of policies and Legislation mentioned by System Leaders . . . . . . . . . . . . . . . . . 136
appendix 4: Glossary of terms . . . . . . . . . . . . . . . . . . . . . . . . . . . . . . . . . . . . . . . . . . . . . . . . . . . . . . . . . . . 138
appendix 5: mental health claimants (under 25 in urc counties), Fy05-06 . . . . . . . . . . . . . . . . . . . 140
appendix 6: caL-OhmS – characteristics of county alcohol and Drug Services among children under 18, by county . . . . . . . . . . . . . . . . . . . . . . . . . . . . . . . . . . . . . . . . . . . . . . . . . . . . . 142
4
exeCUTive SUMMARy
Setting the Context: UCR Background
Unclaimed Children Revisited (UCR) complements Unclaimed Children: The Failure of Public Respon-sibility to Children in Need of Mental Health Ser-vices (1982), a seminal report authored by Dr . Jane Knitzer . The initial report served to rally the child and adolescent mental health field to take action towards policy reform .
The current national study is a multi-pronged initia-tive that generates new knowledge about policies across the united States that promote or inhibit the delivery of high-quality mental health services and supports to children, youth, and families . UCR places a strong emphasis on identifying policies that support services that are culturally competent, devel-opmentally appropriate, and research-informed . The initiative encompasses four main projects:♦ a national survey of state-level children’s mental
health directors and advocates;♦ a statewide case-study of california, with a focus
on 11 counties;♦ a case-study of outcomes-based management
in children’s mental health service delivery in michigan; and
♦ a working paper series that explores the state of the field on family and youth engagement, financing, trauma, school-based mental health, and cross-systems support of effective practices .
The California Case Study
The California Case Study (CCS) represents a major component of Unclaimed Children Revisited. CCS is a multi-method, multi-level study that includes: ♦ analysis of the state policy context with special
attention to specific reform-oriented policies, including the mental health Services act;
♦ 11 in-depth county case studies that illustrate aspects of effective mental health service delivery and policy; and
♦ fiscal analysis designed to shed light on the current funding picture and the comparative efficacy of different financing approaches .
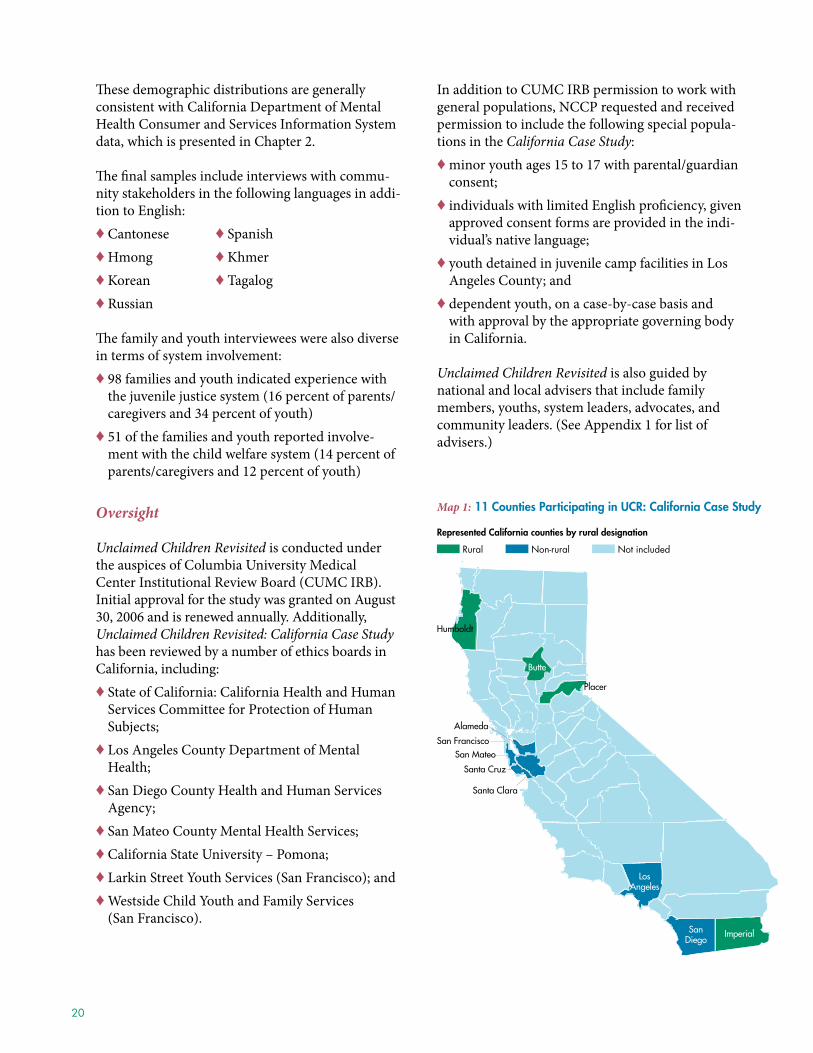
The 11 counties include: alameda, Butte, humboldt, imperial, Los angeles, placer, San Diego, San Francisco, San mateo, Santa clara, and Santa cruz .
The purpose of CCS is to identify, document, and analyze effective fiscal, infrastructural, and related policies that support research-informed practices for mental health services to children and adolescents in california . The study also generates “lessons learned” from individual initiatives . CCS, together with the other components of UCR, examines the current status of children’s mental health policies in the united States, particularly those that support improved outcomes for children, adolescents, and their families .
The california Endowment Foundation and the Zellerbach Family Foundation funded the study .
Who Are California’s Unclaimed Children Today?
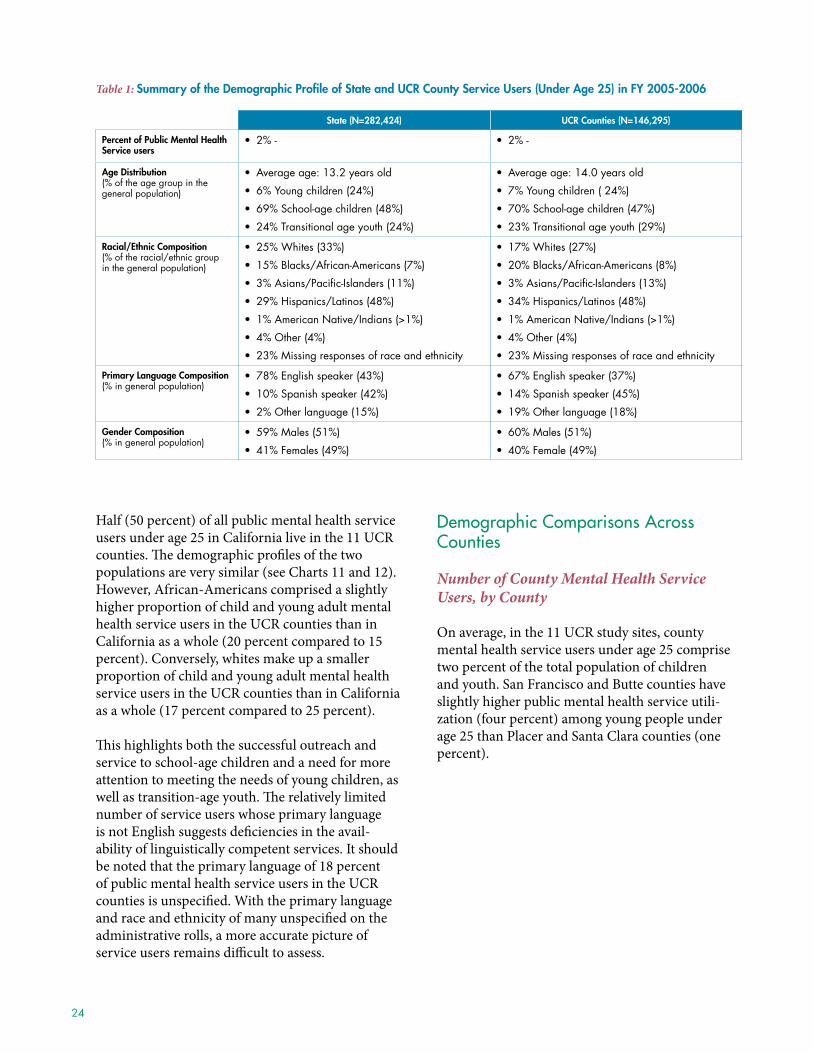
Demographics Comparisons Between California and the 11 UCR Study Counties
The demographic profile of children and youth in the 11 ucr counties is remarkably similar to the general child population in california . The demographic profile of the study’s population (young public mental health service users under 25) in the 11 ucr counties is also comparable to the same subgroup across the state; however, there are slightly larger asian and smaller white populations in the ucr counties and slightly larger proportions of Spanish-speaking children and youth . Differences in gender and racial/ethnic composition, primary language utilization, and medi-cal (medicaid) coverage arise when comparing young mental health service users and the general population of children and youth .
National Center for Children in Poverty Unclaimed Children Revisited: California Case Study 5
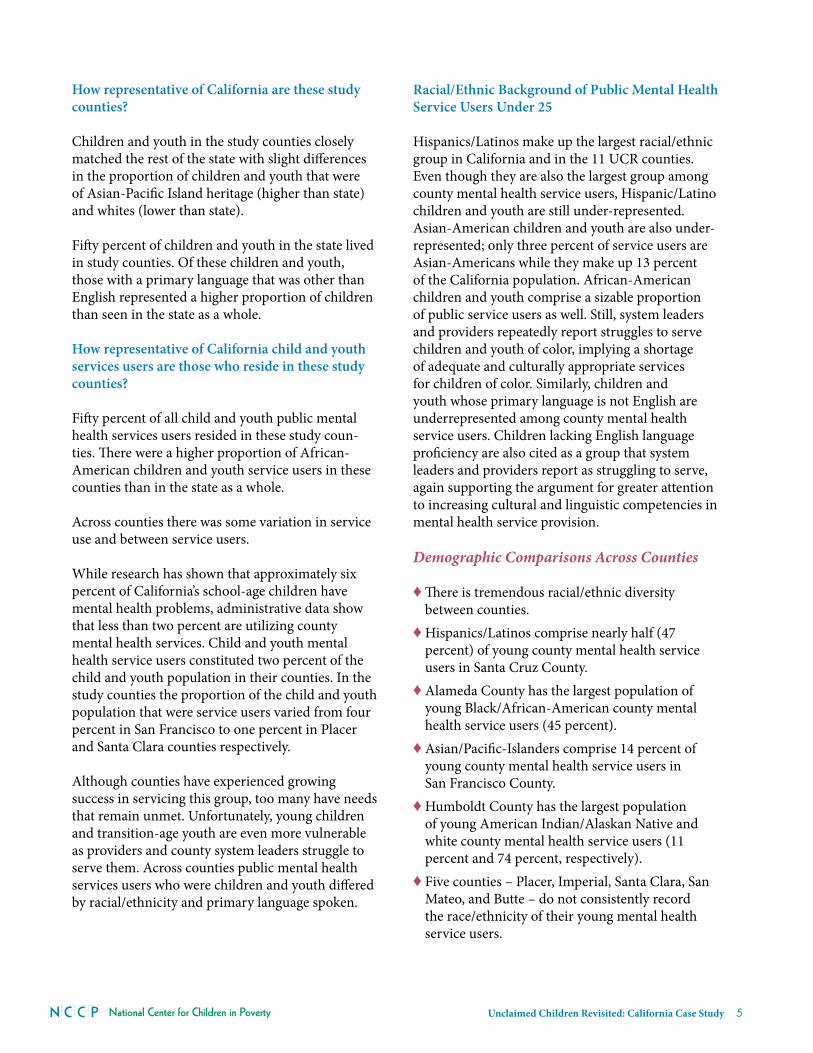
How representative of California are these study counties?
children and youth in the study counties closely matched the rest of the state with slight differences in the proportion of children and youth that were of asian-pacific island heritage (higher than state) and whites (lower than state) .
Fifty percent of children and youth in the state lived in study counties . Of these children and youth, those with a primary language that was other than English represented a higher proportion of children than seen in the state as a whole .
How representative of California child and youth services users are those who reside in these study counties?
Fifty percent of all child and youth public mental health services users resided in these study coun-ties . There were a higher proportion of african-american children and youth service users in these counties than in the state as a whole .
across counties there was some variation in service use and between service users .
While research has shown that approximately six percent of california’s school-age children have mental health problems, administrative data show that less than two percent are utilizing county mental health services . child and youth mental health service users constituted two percent of the child and youth population in their counties . in the study counties the proportion of the child and youth population that were service users varied from four percent in San Francisco to one percent in placer and Santa clara counties respectively .
although counties have experienced growing success in servicing this group, too many have needs that remain unmet . unfortunately, young children and transition-age youth are even more vulnerable as providers and county system leaders struggle to serve them . across counties public mental health services users who were children and youth differed by racial/ethnicity and primary language spoken .
Racial/Ethnic Background of Public Mental Health Service Users Under 25
hispanics/Latinos make up the largest racial/ethnic group in california and in the 11 ucr counties . Even though they are also the largest group among county mental health service users, hispanic/Latino children and youth are still under-represented . asian-american children and youth are also under-represented; only three percent of service users are asian-americans while they make up 13 percent of the california population . african-american children and youth comprise a sizable proportion of public service users as well . Still, system leaders and providers repeatedly report struggles to serve children and youth of color, implying a shortage of adequate and culturally appropriate services for children of color . Similarly, children and youth whose primary language is not English are underrepresented among county mental health service users . children lacking English language proficiency are also cited as a group that system leaders and providers report as struggling to serve, again supporting the argument for greater attention to increasing cultural and linguistic competencies in mental health service provision .
Demographic Comparisons Across Counties
♦ There is tremendous racial/ethnic diversity between counties .
♦ hispanics/Latinos comprise nearly half (47 percent) of young county mental health service users in Santa cruz county .
♦ alameda county has the largest population of young Black/african-american county mental health service users (45 percent) .
♦ asian/pacific-islanders comprise 14 percent of young county mental health service users in San Francisco county .
♦ humboldt county has the largest population of young american indian/alaskan Native and white county mental health service users (11 percent and 74 percent, respectively) .
♦ Five counties – placer, imperial, Santa clara, San mateo, and Butte – do not consistently record the race/ethnicity of their young mental health service users .
6
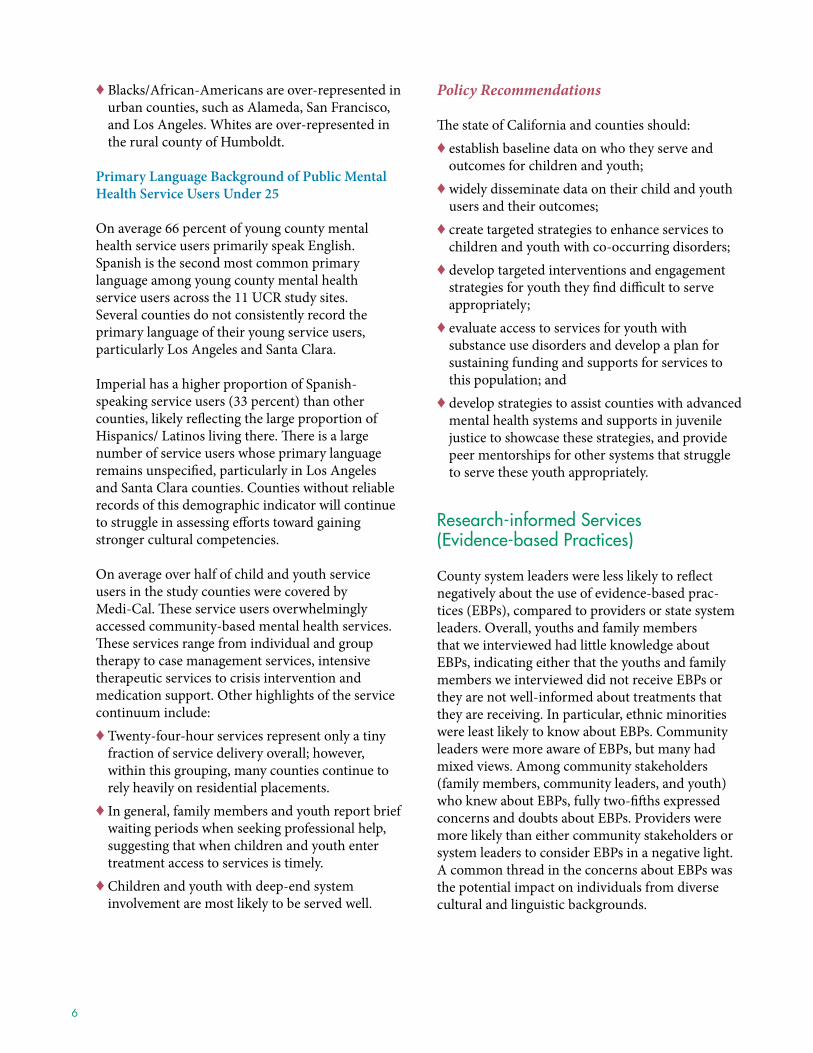
♦ Blacks/african-americans are over-represented in urban counties, such as alameda, San Francisco, and Los angeles . Whites are over-represented in the rural county of humboldt .
Primary Language Background of Public Mental Health Service Users Under 25
On average 66 percent of young county mental health service users primarily speak English .Spanish is the second most common primary language among young county mental health service users across the 11 ucr study sites .Several counties do not consistently record the primary language of their young service users, particularly Los angeles and Santa clara .
imperial has a higher proportion of Spanish-speaking service users (33 percent) than other counties, likely reflecting the large proportion of hispanics/ Latinos living there . There is a large number of service users whose primary language remains unspecified, particularly in Los angeles and Santa clara counties . counties without reliable records of this demographic indicator will continue to struggle in assessing efforts toward gaining stronger cultural competencies .
On average over half of child and youth service users in the study counties were covered by medi-cal . These service users overwhelmingly accessed community-based mental health services . These services range from individual and group therapy to case management services, intensive therapeutic services to crisis intervention and medication support . Other highlights of the service continuum include:♦ twenty-four-hour services represent only a tiny
fraction of service delivery overall; however, within this grouping, many counties continue to rely heavily on residential placements .
♦ in general, family members and youth report brief waiting periods when seeking professional help, suggesting that when children and youth enter treatment access to services is timely .
♦ children and youth with deep-end system involvement are most likely to be served well .
Policy Recommendations
The state of california and counties should:♦ establish baseline data on who they serve and
outcomes for children and youth;♦ widely disseminate data on their child and youth
users and their outcomes;♦ create targeted strategies to enhance services to
children and youth with co-occurring disorders;♦ develop targeted interventions and engagement
strategies for youth they find difficult to serve appropriately;
♦ evaluate access to services for youth with substance use disorders and develop a plan for sustaining funding and supports for services to this population; and
♦ develop strategies to assist counties with advanced mental health systems and supports in juvenile justice to showcase these strategies, and provide peer mentorships for other systems that struggle to serve these youth appropriately .
Research-informed Services (evidence-based Practices)
county system leaders were less likely to reflect negatively about the use of evidence-based prac-tices (EBps), compared to providers or state system leaders . Overall, youths and family members that we interviewed had little knowledge about EBps, indicating either that the youths and family members we interviewed did not receive EBps or they are not well-informed about treatments that they are receiving . in particular, ethnic minorities were least likely to know about EBps . community leaders were more aware of EBps, but many had mixed views . among community stakeholders (family members, community leaders, and youth) who knew about EBps, fully two-fifths expressed concerns and doubts about EBps . providers were more likely than either community stakeholders or system leaders to consider EBps in a negative light . a common thread in the concerns about EBps was the potential impact on individuals from diverse cultural and linguistic backgrounds .
National Center for Children in Poverty Unclaimed Children Revisited: California Case Study 7
about 60 percent of system leaders and providers who discussed EBps are implementing them, suggesting that california system leaders and providers are indeed incorporating EBps in their service-delivery systems . however, the scope often seems rather limited . The status of EBp implemen-tation also varies by discipline and county .
The major strategy identified for EBp implementa-tion was workforce development . This indicates that counties are still in the process of developing the workforce capacity to provide effective EBps . a major obstacle to the promotion and adoption of EBps is the state’s inability to accurately track or incentivize their use .
community leaders, providers, and system leaders all raised questions about the cultural competence of EBps, suggesting that cultural competency is one of the major challenges to its adoption, given the diversity of california’s population . Overall, juvenile justice has the highest percentage of leaders who discussed EBp implementation, followed by mental health and child welfare . humboldt had the highest proportion of system leaders and providers who discussed the implementation of EBps, followed by imperial and San Diego leaders and providers .
Recommendations
The state of california and counties should:♦ track and measure effectiveness and monitor or
improve program implementation as an integral part of EBp implementation . This should include developing outcomes for children, youth and their families and indicators based on selected interventions;
♦ develop a mechanism for reaching consensus on fiscal ways to support implementation of EBps;
♦ expand workforce competencies in EBps in general and include a focus on culturally and linguistically appropriate EBps and culturally-adapted strategies;
♦ increase technical assistance and supports on EBps, the implementation of EBps and county specific contexts for optimal adoption for providers;
♦ develop incentives to implement EBps (include adequate reimbursement to cover costs associated with implementation and engagement strategies);
♦ reach out to community stakeholders and increase their awareness and knowledge regarding EBps; and
♦ create general and targeted strategies to dissemi-nated information of EBps for all stakeholders .
developmentally-appropriate Services and Supports
california system leaders and providers perceive the service capacity for young children as strong, which they attribute to strong collaboration across disciplines . School-based services are also seen as a strength and strong programming reflects aB 3632 (funding stream specifically for youth in special education with mental health problems in california that falls under the jurisdiction of the county mental health authority) . On the other hand, services for transitional age youth were less frequently discussed compared with services for young children and school-age children and youth . respondents who talked about services for transi-tional age youth (tay) often discussed vocational and housing services .
public financing was seen as a strength underlying services for school-age children . yet across the developmental span, lack of funding was discussed as a major barrier for implementing services .
Overall, administrative data from the client and Service information (cSi) System shows strong services for school-age children in california . Leaders from more than half of ucr counties are also incorporating evidence-based services in school settings .
Recommendations
The state of california and counties should:♦ support state and professional efforts to improve
the competencies of all providers and teachers who work with children and youth with or at risk for mental health conditions so they are prepared to meet the needs of children;
♦ develop a comprehensive strategy and increase resources to support and expand the provision of prevention, early intervention and treatment services across the age-span;
8
♦ expand program service eligibility and flexibility for children and families covered by medi-cal, including opening up community-based services to transition-age youth to reduce inpatient service costs; and
♦ increase support and services for tay transi-tioning to the adult system, including increasing medi-cal eligibility for tay involved in the mental health system up to age 25 .
Family- and youth-driven Services
researchers, advocates, and policy makers acknowl-edge family- and youth-driven services are a core component in promoting the transition from a child-centered perspective to a family-centered perspective in children’s mental health policy and practice . Family and youth involvement and advo-cacy is a fundamental aspect to family- and youth-driven services .
Overall, system leaders and providers recognized the importance of family- and youth-driven services to support and promote positive change for chil-dren and youth and their families . most often, respondents reported on direct services that were offered at a local, county, and state level to treat the whole family . however, state or county strategies to promote the philosophy of family- and youth-driven services were not always consistent .
System leaders and providers discussed the array of services offered by their county or organization . They emphasized clinical treatments provided to children, youth, and families . interestingly, in the analysis of the family and youth stakeholder inter-views, we found that family member and youth stakeholders perceived clinical services and clinical workers to be the most helpful . in addition, family members and youth found community-based services to be the most helpful .
System leaders and providers described strategies and challenges to youth and family advocacy and involvement . These strategies reflect variation in involvement and advocacy by county and discipline . analysis of the community leaders, family members and youth stakeholders reinforces this theme . Over one third of youth reported being actively involved
in advocating for themselves or others with mental health care needs . There was significant involvement in advocacy by family members, youth and commu-nity leaders, but there is still progress to be made, specifically with non-English speaking stakeholders .
We provide insight into the perspectives of system leaders, providers, family members, and youth at a county and state level . The targeted counties appear to embrace the philosophy of family- and youth-driven care . although, the philosophy is not fully embedded in practice across all counties and disciplines, there is progress being made towards family- and youth-driven services and care .
progress varies by county and within county, and in order to create greater system-wide change, policies and funding streams need to facilitate family- and youth-driven services . Strategies need to go beyond providing direct services for select populations and reflect the overall philosophy of family- and youth-driven care where services are customized based on the individual needs of the child/youth and his or her family and at their direction . These changes in philosophy need to come from leadership at the state and county level to encourage the system to look at the family as a whole and perceive the family as a partner in reaching the desired goals of each child, youth, and family .
Policy Recommendations
The state of california and counties should:♦ enact policies and funding streams needed to
facilitate family and youth-driven services;♦ ensure that strategies reflect overall philosophy of
family and youth-driven care; and♦ build capacity for more culturally and linguisti-
cally competent services to help promote advo-cacy in non-English speakers .
National Center for Children in Poverty Unclaimed Children Revisited: California Case Study 9
Culturally- and linguistically-competent (ClC) Services
On the whole, system leaders and providers equally discussed strengths and challenges in providing culturally and linguistically competent services . The most frequently mentioned strengths by system leaders and providers were structural strengths such as providing specific cLc programs . The mental health Services act (mhSa) is also perceived as a positive vehicle to promote cLc services . One notable strategy mentioned by system leaders and providers is providing incentives for hiring or developing bilingual and bicultural staff . The most frequently mentioned challenges relate to infrastructure issues, such as lack of culturally and linguistically competent staff and training . The second most frequently discussed challenge was the gap in services . System leaders and providers felt that Latino and asian/pacific islander were the groups most lacking in terms of cLc services . among community stakeholders, variations exist on the factors influencing access to children’s mental health services . african-americans perceived their race as a factor affecting their service access, while Latino and american indian/alaskan Natives felt neighborhood is the factor . an equal proportion of Latino groups suggested there was no effect of socioeconomic or demographic status on access . asians/pacific islanders saw language and culture as major barriers to access .
Recommendations
The state of california and counties should:♦ provide for and support counties leaders in the
development of strategies to build an infrastruc-tural response to improving the level of systems’ cultural and linguistic competence and to reduce disparities based on race/ethnicity and language access;
♦ expand the workforce’s capacity with providers from diverse racial, cultural, ethnic and linguistic communities;
♦ develop core competencies for providers in cultural and linguistic competence and provide necessary training to attain these competencies;
♦ address providers’ concerns regarding insuf-ficient cultural and linguistic competence and
inadequate experience in specific community-based interventions for working with diverse populations;
♦ provide funding for intensive community engage-ment strategies;
♦ build on successful models implemented through the mental health Services act and other funding;
♦ address the challenges posed by the non-supplan-tation clause, which undermines sustainability of effective cultural- and linguistically-appropriate programming;
♦ support capacity improvement for more cultur-ally and linguistically competent services to help promote advocacy among non-English speakers;
♦ finance county to county peer learning on inno-vative strategies and effective interventions that improve cultural and linguistic competence in service delivery and reduce disparities;
♦ ensure that services provided to immigrants are effective and culturally and linguistically competent; and
♦ track data on race, ethnicity and English language proficiency of service users and their outcomes .
Prevention and early intervention (Pei) Within a Public Health Framework
california has enacted groundbreaking policies (mhSa, First 5, EpSDt expansion) designed to bring the children’s mental health system in california toward a system of prevention and early intervention within a public health framework . System leaders and providers discussed strengths in pEi, which include a greater awareness of its value, and an increased emphasis on pEi efforts and initia-tives . respondents discussed a vast array of preven-tion programs and initiatives for early childhood and school-age youth, but offered few examples of prevention programs for transition-age youth .
Though california has made many strides in implementing prevention and early intervention, respondents also discussed challenges including low resources, service capacity, and lack of systemic priority in providing pEi services .
10
in these tough economic times, it is critically impor-tant to raise awareness of the long-term benefits and cost-effectiveness of pEi in reducing behavioral and emotional disorders in children .
Recommendations
The state of california and counties should:♦ increase legislative and systemic funding, focus
and support for prevention and early interven-tion practices and policies in mental health, as well as continued expansion of assessment and screening of at-risk children who may otherwise “fall through the cracks;”
♦ expand application and outcome tracking of evidence-based child and family prevention programs, supports, policies and strategies to help reduce risk factors in the child’s environment (community, family, school, and individual) that can lead to future problem behaviors;
♦ integrate positive youth development models system-wide to increase bonding of children and engage families and communities in promoting and enhancing positive mental health in children; and
♦ strengthen collaboration within communities, and across county, state and federal disciplines through shared language and vision of children’s mental health; strategic planning; resources coordination; and the development of measurable outcomes tracked over time to ensure account-ability over the long-term .
Financing Children’s Mental Health Services
The study’s review of financing in the counties included secondary data analysis using medi-cal data that confirmed information from key infor-mant interviews of system leaders and providers who identified school-age children and youth as having the greatest access to mental health services . These analyses also support key informant themes that children and youth who are school-aged have access to a more vibrant and wider array of mental health services and supports than children in early childhood or youth transitioning to adulthood . The consequences of this according to our review
of medi-cal data is one of displaced utilization by youth transitioning to adulthood . These youth and young adults with mental health problems are disproportionately represented in the most costly of the mental health treatment sector, inpatient care . They are driven to this level of care because of the poor funding options at the community level . This finding suggests that policy changes that open up community-based services to this group might be the most cost effective policy option .
The analyses also showed that among medi-cal enrollees, children with mental health conditions were more likely to be male than their counterparts without mental health conditions . Further, and con-sistent with other studies, per-claimant costs varied widely . however, the state’s ability to understand the implications of this variation is somewhat limited by the inability to track costs and utilization data more precisely . certain service categories are tracked in a manner that prevents service cost comparisons at a macro level or hinders greater understanding of the relative fiscal implications of different services within a service category . These challenges have serious implications for the delivery of effective ser-vices in the outpatient setting . in particular, despite an apparent policy push to advance evidence-based practices, these services are not easily tracked and not easily supported through financing .
Stakeholders provided perspectives on the strengths and challenges associated with adequately financing a range of children’s mental health services in california that on balanced weighed heavily toward major barriers . While they identified major sources of funding, they also referenced the compelling need to support a comprehensive array of services and pinpointed the pivotal role medi-cal/EpSDt and mhSa plays in increasing access to services as clear system benefits . Emerging tensions and distrust often characterize stakeholder relationships particularly between different levels of government and between payers and providers . increased fiscal tensions, particularly with medi-cal/EpSDt, has led some stakeholders perceive fiscal policy as one that undermines a comprehensive set of services, threatens innovation and flexibility and compro-mises greater adoption of funded empirically-supported or evidence-based practices .
National Center for Children in Poverty Unclaimed Children Revisited: California Case Study 11
a major concern is how to sustain existing programs as reflected in the views presented . in 2009 california faced one of its most severe budgetary crises . Significant paralysis in public budgetary decision-making ensued that put crucial mental health funding such as mhSa funding, a targeted fiscal stream, in jeopardy . mhSa’s major components survived a ballot initiative aimed at redirecting some of those funds . The public financing of mental health services for children and youth in california remains fragile .
Policy Recommendations
The state of california and counties should:♦ expand program service eligibility and flexibility
for children and families covered by medi-cal . This should include policy changes that open up community-based services to transition-age-youth as a cost effective policy option;
♦ improve their abilities to track service utilization and costs, including tracking incentives for the implementation of evidence-based programs;
♦ develop specific fiscal incentives with relevant billing coded to encourage implementation of evidence-based practices;
♦ develop appropriate tools to measure change in child/participant, family and community level outcomes, both short term and long term;
♦ establish well-defined outcomes and indicators for tracking child and family outcomes at program and system levels;
♦ ensure that data sharing is a top priority by: (a) requiring the sharing of electronic records and data across counties and agencies; (b) making data sharing a condition of joint planning for children and family services; and (c) safeguarding privacy; and
♦ promote an effort to develop appropriate measuring tools and maintain consistency in evaluating service and system impacts on children and families .
information Technology and Outcome Measurement
information technology systems and outcomes management components provide accountability and transparency, which can contribute to more effective and sustainable services to children and families in need . The california Dmh has encour-aged the use of technology systems by providing funding, including mhSa funding, to counties to develop it improvements and to implement elec-tronic records . respondents shared that data collec-tion allows for quality assessment and improve-ment of services . Data sharing across systems can help facilitate joint-planning and better outcomes for families . There is some provider resistance to using it systems . information technology tracking systems are used for billing and finances and not outcomes . Some respondents noted confidentiality concerns and conflicts with hipaa .
There have been some improvements in individual and program level outcomes, yet there is system-atic inconsistency in measuring outcomes across all children in the system . at a system level, county reported performance measures are not appropri-ately measuring effectiveness of system-level impact on families and children . respondents reported that outcome management is in its infancy . Numerous respondents suggested a lack of funding, data, and clear definitions as some of the challenges in measuring outcomes .
Recommendations
The state of california and counties should:♦ establish well-defined outcomes and indicators for
tracking child and family outcomes at program and system levels;
♦ increase in sharing of electronic records and data across counties and agencies to help facilitate joint-planning for children and family services;
♦ develop appropriate tools to measure change in child-participant, family and community level outcomes, both short term and long term; and
♦ promote an effort to develop appropriate measuring tools and maintain consistency in evaluating service and system impacts on children and families .
12
lessons learned
consensus among key informants on areas that need reform in children’s mental health is evident . Broadly, key informants agree that major changes need to occur in how services are delivered and funded . The nature of the suggested reforms in funding ranged from broad changes beyond the field such as universal insurance reform to targeted initiatives such as facilitating integration and funding flexibility . in particular, system leaders and providers expect to see the funding reform from the federal level .
This level of agreement across key stakeholders in the mental health system suggests room for a more cohesive and coherent agenda for children, youth, and their families . it also indicates that the state children’s mental health field may be well-positioned to speak with one voice on funding and service delivery . all participants also agreed on the need for more family-based services, but in its implementation, it appears to mean different things depending on the key informant . While community stakeholders identified the need for strategies such as outreach and information to navigate the system, system leaders and providers did not mention these two important strategies . This gap suggests that state leaders need to create institutional policies that address these strategies in order to facilitate better access .
ThE CalifORnia CasE sTudy
sTudy dEsign
site selection
Working with the California Strategic Advisory Work Group, NCCP identified 12 counties in California that are considered innovative in terms of children’s mental health service delivery. The work group considered factors such as system of care involvement and cross-system collaborations as well as counties’ support of initiatives focused on cultural competence, family/youth empowerment and support, and prevention and early intervention. Additional county diversity characteristics were taken into consideration, such as urban/rural designation, location within the state, and overall demographics. These counties included: Alameda, Butte, Contra Costa, Humboldt, Imperial, Los Angeles, Placer, San Diego, San Francisco, San Mateo, Santa Clara, and Santa Cruz. Of these 12 selected counties, all but Contra Costa County agreed to participate in the study. Of the remaining counties, four are rural and seven are non-rural (suburban or urban).
data sources
This study includes three major data sources: primary data collected through face-to-face and telephone interviews and focus groups; program-specific data provided by study participants; and secondary data from the California Department of Mental Health on Medi-Cal and Client and Service Information (CSI) System claims and enrollment data.
Participants
NCCP targeted three types of respondents for participation in the California Case Study: • StateandCountySystemLeaders – Individuals who hold
high-level county or state positions in child-serving agen-cies, former county directors, and experts on the following systems or disciplines: mental health; special education; public health; child welfare; juvenile justice; substance abuse and prevention; developmental disabilities; finance; and early childhood.
• Providers – Mental health providers: those who deliver any type of direct mental health services to children, youth, or families; and non-mental health providers: those who offer other direct services to children, youth, or families, including teachers and health professionals.
• CommunityStakeholders – Community leaders: individuals whose prominence in the community stems from the perception that they represent some or all sectors of the community. Their standing may derive from their profes-sional status, residency, group affiliation, historical roots, or moral, religious or ethical stance. Family members: parents, siblings, grandparents, other related primary caregivers, or guardians to a youth up to and including age 18 with the characteristics described above. Youth stakeholders: youths aged 14 to 25 who possessed one or more of the following characteristics: experience with one of the 11 targeted county mental health systems; expressed unmet need for mental health services; involve-ment with the special education (for SED only), juvenile justice, or social services systems; or identify as a home-less or runaway youth, former or current substance user, or gay, lesbian, bisexual or transgendered.
National Center for Children in Poverty Unclaimed Children Revisited: California Case Study 13
daTa COllECTiOn METhOds
Primary data
The California Case Study includes a comprehensive array of data collection instruments designed for each type of informant: system leader, provider, or community stakeholder.
InterviewsandFocusGroups – Each interview discussion guide contains 15 to 35 questions, depending on area of expertise. Participants were interviewed individually or in small groups. Generally, interviews took place in person unless circumstances warranted a phone interview. Interviews lasted 30 to 90 minutes, with duration varying depending upon the format and response length. No respondent had access to the questions prior to the inter-view. System leaders were encouraged but not required to provide supplemental data to support their perspectives that would be included in secondary data analysis.
sampling Methods
InterviewsandFocusGroupParticipants – Invitation letters and informational documents about the California Case Study were sent to children’s mental health directors in the 11 participating counties. Each was asked to provide NCCP with a contact to help coordinate the recruitment of system leaders and other stakeholders. A modified snow-ball technique was employed to identify additional system leaders, experts, and providers from various child-serving agencies in each county as potential respondents. Through these contacts, study fliers, community-based organizations, California-based consultants, and NCCP’s local advisory board, we recruited youth consumers and their families from a range of cultural and linguistic backgrounds. The State Department of Mental Health also agreed to partici-pate. A similar snowball technique was used with state-level key informants to recruit other leaders in state child-serving agencies.
Participant demographics
Seven hundred seven individuals enrolled in CCS. Los Angeles County had the highest number of respondents; Humboldt County had the least. The final number of enrollees in the study for in-person and phone interviews was 676, which included 31 state-level system leaders; 179 county-level system leaders; 185 parents and care-givers; 191 youth; 61 service providers; 29 community leaders.
system leaders
Two hundred ten state and county system leaders completed the study. Representation was strongest from the mental health sector and weakest from system leaders representing public health, substance abuse and treatment, and developmental disabilities. The average response rate among county system leaders varied widely, from 39 percent (public health) to 83 percent (mental health). Across counties, system leaders from San Diego had the highest response rate (79 percent), whereas Alameda and San Mateo Counties had the lowest (46 percent). Thirty-one state system leaders participated in the study, with the highest response from mental health leaders (93 percent).
Providers
The final sample contained 61 providers. Three-quarters of these were mental health providers; the remaining 15 identified as other health professionals or direct care providers.
Community stakeholders
Overall, community stakeholder participation was strongest in Los Angeles County and weakest in Humboldt County. The community stakeholders who participated were comprised of community leaders (seven percent), family members (46 percent), and youths (47 percent). In addition to biological parents, family members interviewed also included grandparents, siblings, and foster parents.
An effort was made to engage a sample of community stakeholders that accurately reflects the cultural and linguistic diversity of each county. NCCP obtained the primary threshold languages of Medi-Cal beneficiaries for all of the target counties as a proxy measure for the linguistic backgrounds of the consumers. The number of threshold languages varied by county, with up to 12 in Los Angeles County. NCCP hired field staff representing 11 linguistic capacities, including Spanish, Tagalog, Vietnamese, Mandarin, Cantonese, Korean, Farsi (Dari), Khmer (Cambodian), Russian, Hmong, and West Armenian. All consent forms were made available in each of these languages, with the exception of Hmong and Tagalog. NCCP also partnered with a variety of organizations to target a number of culturally-specific groups, including the Asian American, African American, Russian, Middle Eastern, and Latino communities.
secondary data
To supplement and verify information obtained during primary data collection, NCCP researchers engaged in an extensive secondary data collection process. In addition to information provided by interviewees, NCCP analyzed the following sources: • Medi-Cal Data Sets (2001-2006);• County Secondary Data Sheets: Data sheets designed
by NCCP were distributed to one key system leader by discipline in each county. The data sheets were intended to collect information on each county’s service access and available funding streams;
• Client and Service Information System (CSI) Data; and• California Outcomes Measurement System (CalOMS)
Treatment Data.
14
CHAPTeR 1
introduction
Setting the Context: UCR Background
Unclaimed Children Revisited (UCR) updates Un-claimed Children: The Failure of Public Responsibility to Children in Need of Mental Health Services (1982), a seminal report authored by Dr . Jane Knitzer . The initial report served to rally the child and adolescent mental health field to take action towards policy reform .
The current national study is a multi-pronged initia-tive that generates new knowledge about policies across the united States that promote or inhibit the delivery of high-quality mental health services and supports to children, youth, and families . UCR places a strong emphasis on identifying policies that support services that are culturally compe-tent, developmentally appropriate, and research-informed . The initiative encompasses four main projects:♦ National survey of state-level children’s mental
health directors and advocates (N=53);♦ Statewide case study of california, with a focus
on 11 counties (N=707);♦ case study of outcomes-based management
in children’s mental health service delivery in michigan (N=103); and
♦ Working paper series that explores the state of the field on family and youth engagement, financing, trauma, school-based mental health, and cross-systems support of effective practices .
The California Case Study
The California Case Study (CCS) represents a major component of Unclaimed Children Revisited. CCS is a multi-method, multi-level study that includes: ♦ analysis of the state policy context with special
attention to specific reform-oriented policies, including the mental health Services act;
♦ 11 in-depth county case studies that illustrate aspects of effective mental health service delivery and policy; and
♦ Fiscal analysis designed to shed light on the current funding picture and the comparative efficacy of different financing approaches .
The purpose of CCS is to identify, document, and analyze effective fiscal, infrastructural, and related policies that support research-informed practices for mental health services to children and adolescents in california . The study also generates “lessons learned” from individual initiatives . CCS, together with the other components of UCR, examines the current status of children’s mental health policies in the united States, particularly those that support improved outcomes for children, adolescents, and their families .
Study design
Site Selection
together with the california Strategic advisory Work Group (see appendix 1), Nccp identified 12 counties in california that are considered innova-tive in terms of children’s mental health service delivery . The work group considered factors such as system of care involvement and cross-system collaborations as well as counties’ support of initia-tives focused on cultural competence, family/youth empowerment and support, and prevention and early intervention . additional county diversity char-acteristics were taken into consideration, such as urban/rural designation, location within the state, and overall demographics . These counties included:
♦ alameda ♦ imperial ♦ San Francisco♦ Butte ♦ Los angeles ♦ San mateo♦ contra costa ♦ placer ♦ Santa clara♦ humboldt ♦ San Diego ♦ Santa cruz
National Center for Children in Poverty Unclaimed Children Revisited: California Case Study 15
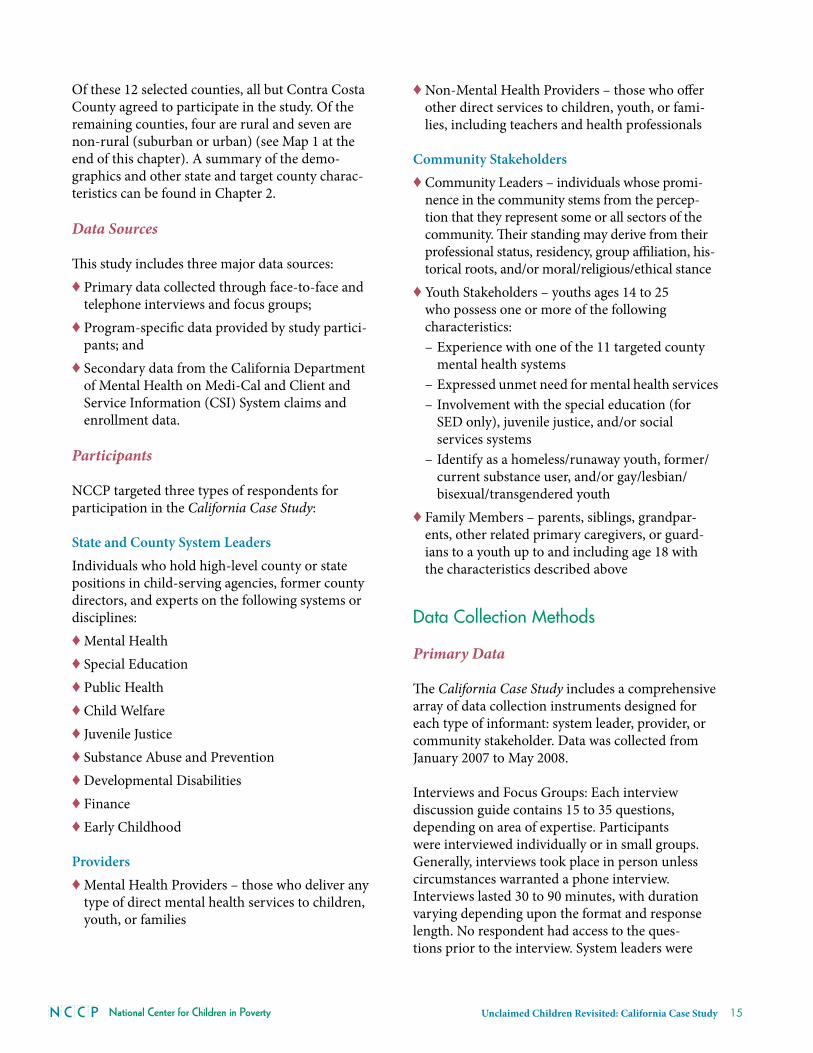
Of these 12 selected counties, all but contra costa county agreed to participate in the study . Of the remaining counties, four are rural and seven are non-rural (suburban or urban) (see map 1 at the end of this chapter) . a summary of the demo-graphics and other state and target county charac-teristics can be found in chapter 2 .
Data Sources
This study includes three major data sources:♦ primary data collected through face-to-face and
telephone interviews and focus groups;♦ program-specific data provided by study partici-
pants; and♦ Secondary data from the california Department
of mental health on medi-cal and client and Service information (cSi) System claims and enrollment data .
Participants
Nccp targeted three types of respondents for participation in the California Case Study:
State and County System Leaders individuals who hold high-level county or state positions in child-serving agencies, former county directors, and experts on the following systems or disciplines:♦ mental health ♦ Special Education♦ public health♦ child Welfare♦ Juvenile Justice♦ Substance abuse and prevention♦ Developmental Disabilities♦ Finance ♦ Early childhood
Providers ♦ mental health providers – those who deliver any
type of direct mental health services to children, youth, or families
♦ Non-mental health providers – those who offer other direct services to children, youth, or fami-lies, including teachers and health professionals
Community Stakeholders♦ community Leaders – individuals whose promi-
nence in the community stems from the percep-tion that they represent some or all sectors of the community . Their standing may derive from their professional status, residency, group affiliation, his-torical roots, and/or moral/religious/ethical stance
♦ youth Stakeholders – youths ages 14 to 25 who possess one or more of the following characteristics:
– Experience with one of the 11 targeted county mental health systems
– Expressed unmet need for mental health services – involvement with the special education (for
SED only), juvenile justice, and/or social services systems
– identify as a homeless/runaway youth, former/current substance user, and/or gay/lesbian/bisexual/transgendered youth
♦ Family members – parents, siblings, grandpar-ents, other related primary caregivers, or guard-ians to a youth up to and including age 18 with the characteristics described above
data Collection Methods
Primary Data
The California Case Study includes a comprehensive array of data collection instruments designed for each type of informant: system leader, provider, or community stakeholder . Data was collected from January 2007 to may 2008 .
interviews and Focus Groups: Each interview discussion guide contains 15 to 35 questions, depending on area of expertise . participants were interviewed individually or in small groups . Generally, interviews took place in person unless circumstances warranted a phone interview . interviews lasted 30 to 90 minutes, with duration varying depending upon the format and response length . No respondent had access to the ques-tions prior to the interview . System leaders were
16
encouraged but not required to provide supple-mental data to support their perspectives that would be included in secondary data analysis .
Secondary Data
in order to supplement and verify information obtained during primary data collection, Nccp researchers engaged in an extensive secondary data collection process . in addition to informa-tion provided by interviewees, Nccp analyzed the following sources:*♦ medi-cal Data Sets (2001-2006);♦ county Secondary Data Sheets: Data sheets
designed by Nccp were distributed to one key system leader by discipline in each county .** The data sheets were intended to collect informa-tion on each county’s service access and available funding streams;
♦ client and Service information System (cSi) Data; and
♦ california Outcomes measurement System (calOmS) treatment Data .
Sampling Methods
interviews and Focus Group participants: invitation letters and informational documents about the california case Study were sent to all of the children’s mental health Directors in the 11 partici-pating counties . Each county was asked to provide Nccp with a contact to help coordinate the recruit-ment of system leaders and other stakeholders . a modified snowball technique was employed to iden-tify additional system leaders, experts, and providers from various child-serving agencies in each county as potential respondents . Through these contacts, study fliers, community-based organizations, california-based consultants, and Nccp’s local advisory board, we recruited youth consumers and their families from a range of cultural and linguistic backgrounds . The State Department of mental health also agreed to participate . a similar snowball technique was used with state-level key informants to recruit other leaders in state child-serving agencies .
Participant Demographics
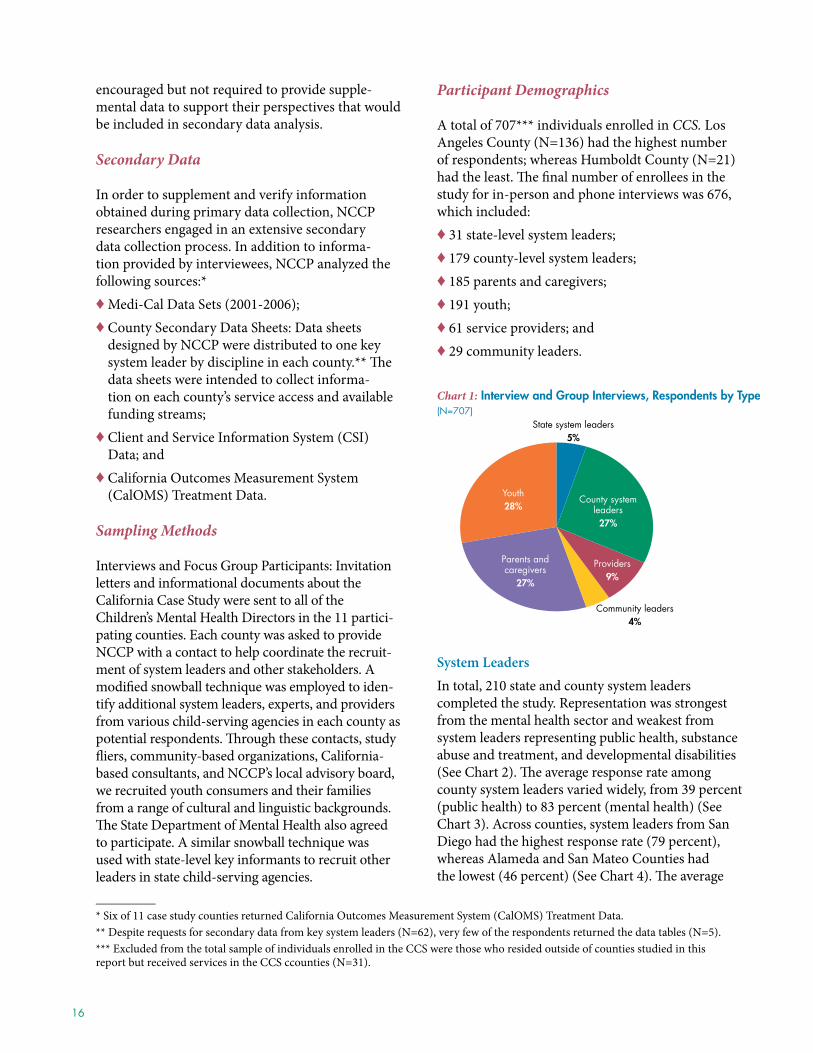
a total of 707*** individuals enrolled in CCS. Los angeles county (N=136) had the highest number of respondents; whereas humboldt county (N=21) had the least . The final number of enrollees in the study for in-person and phone interviews was 676, which included:♦ 31 state-level system leaders;♦ 179 county-level system leaders;♦ 185 parents and caregivers;♦ 191 youth;♦ 61 service providers; and♦ 29 community leaders .
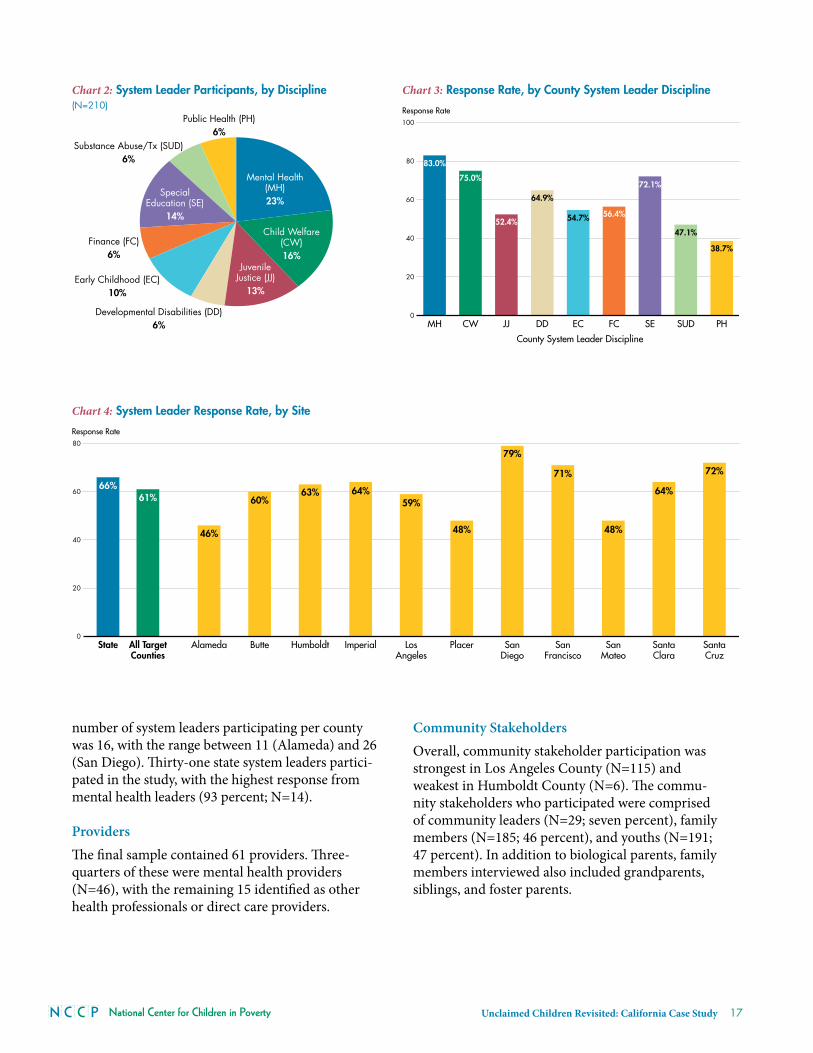
System Leadersin total, 210 state and county system leaders completed the study . representation was strongest from the mental health sector and weakest from system leaders representing public health, substance abuse and treatment, and developmental disabilities (See chart 2) . The average response rate among county system leaders varied widely, from 39 percent (public health) to 83 percent (mental health) (See chart 3) . across counties, system leaders from San Diego had the highest response rate (79 percent), whereas alameda and San mateo counties had the lowest (46 percent) (See chart 4) . The average
__________* Six of 11 case study counties returned california Outcomes measurement System (calOmS) treatment Data .** Despite requests for secondary data from key system leaders (N=62), very few of the respondents returned the data tables (N=5) .*** Excluded from the total sample of individuals enrolled in the ccS were those who resided outside of counties studied in this report but received services in the ccS ccounties (N=31) .
Chart 1: Interview and Group Interviews, Respondents by Type(N=707)
Youth28%
Parents andcaregivers
27%
Community leaders4%
Providers9%
County systemleaders
27%
State system leaders5%
National Center for Children in Poverty Unclaimed Children Revisited: California Case Study 17
number of system leaders participating per county was 16, with the range between 11 (alameda) and 26 (San Diego) . Thirty-one state system leaders partici-pated in the study, with the highest response from mental health leaders (93 percent; N=14) .
Providers The final sample contained 61 providers . Three-quarters of these were mental health providers (N=46), with the remaining 15 identified as other health professionals or direct care providers .
Community Stakeholders Overall, community stakeholder participation was strongest in Los angeles county (N=115) and weakest in humboldt county (N=6) . The commu-nity stakeholders who participated were comprised of community leaders (N=29; seven percent), family members (N=185; 46 percent), and youths (N=191; 47 percent) . in addition to biological parents, family members interviewed also included grandparents, siblings, and foster parents .
Chart 2: System Leader Participants, by Discipline(N=210)
Public Health (PH)6%
Substance Abuse/Tx (SUD)6%
SpecialEducation (SE)
14%
Finance (FC)6%
Early Childhood (EC)10%
Developmental Disabilities (DD)6%
JuvenileJustice (JJ)
13%
Child Welfare(CW)16%
Mental Health(MH)23%
Chart 3: Response Rate, by County System Leader Discipline
0
20
40
60
80
100
PHSUDSEFCECDDJJCWMH
Response Rate
County System Leader Discipline
38.7%
47.1%
72.1%
56.4%54.7%
64.9%
52.4%
75.0%
83.0%
Chart 4: System Leader Response Rate, by Site
0
20
40
60
80
SantaCruz
SantaClara
SanMateo
SanFrancisco
SanDiego
PlacerLosAngeles
ImperialHumboldtButteAlamedaAll TargetCounties
State
Response Rate
72%
64%
48%
71%
79%
48%
59%64%63%
60%
46%
61%66%

18
a tremendous effort was made to engage a sample of community stakeholders that accurately reflects the cultural and linguistic diversity of each county . Nccp obtained the primary threshold languages of medi-cal beneficiaries* for all of the target counties as a proxy measure for the linguistic backgrounds of the consumers . The number of threshold languages varied by county, with up to 12 in Los angeles county . Nccp hired field staff representing 11 linguistic capacities, including Spanish, tagalog,
vietnamese, mandarin, cantonese, Korean, Farsi (Dari), Khmer (cambodian), russian, hmong, and West armenian . all consent forms were made avail-able in each of these languages, with the exception of hmong and tagalog .** Nccp also partnered with a variety of organizations to target a number of culturally-specific groups, including the asian american, african american, russian, middle Eastern, and Latino communities .
Chart 6: Number of Threshold Languages, by County (2005)
0
2
4
6
8
10
12
SantaCruz
SantaClara
SanMateo
SanFrancisco
SanDiego
PlacerLosAngeles
ImperialHumboldtButteAlameda
Number
1
5
1
44
1
12
10
2
4
__________* a threshold language in a given county is defined as one spoken by at least 3,000 medi-cal beneficiaries or five percent of the medi-cal population .** in the philippines, where the most dominant language is tagalog, English is prevalent in written communication . Thus, tagalog-speaking individuals signed English consent forms, though a translator was present for questions . in the case of hmong, though there are also writing systems for the language, their use is not common . Therefore, for monolingual hmong speakers, a translator certified respondents’ oral consent to the study process . translation decisions were made in consultation with county leaders, the Strategic advisory Work Group, and other experts in the field .
Chart 5: Community Stakeholder Participation, by County (N=405)
0
10
20
30
40
50
60
YouthFamily MemberCommunity Leader
Santa CruzSanta ClaraSan MateoSan FranciscoSan DiegoPlacerLos AngelesImperialHumboldtButteAlameda
Number
0
10
20
30
40
50
60
YouthFamily MemberCommunity Leader
SantaCruz
SantaClara
SanMateo
SanFrancisco
SanDiego
PlacerLosAngeles
ImperialHumboldtButteAlameda
50123171153 5
14
5
22
34
5
57
61
13
23
9
23
11
27
106
51
9
4
14
27
National Center for Children in Poverty Unclaimed Children Revisited: California Case Study 19
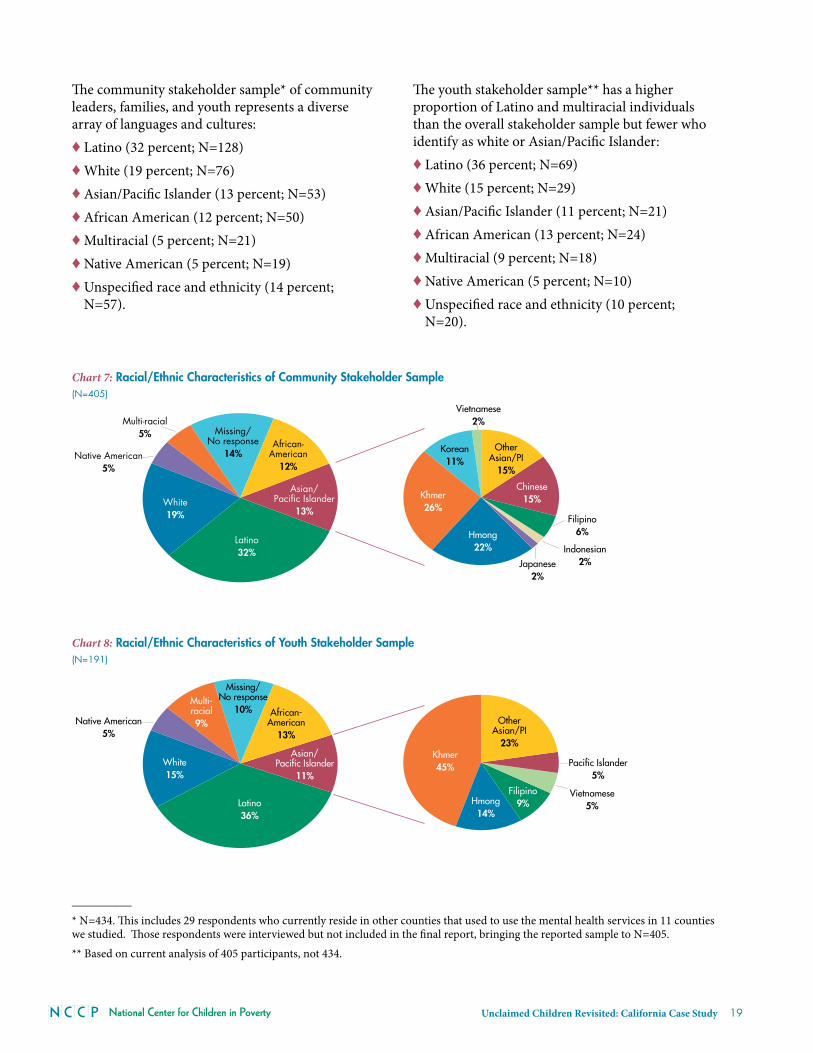
The community stakeholder sample* of community leaders, families, and youth represents a diverse array of languages and cultures: ♦ Latino (32 percent; N=128)♦ White (19 percent; N=76)♦ asian/pacific islander (13 percent; N=53)♦ african american (12 percent; N=50)♦ multiracial (5 percent; N=21)♦ Native american (5 percent; N=19)♦ unspecified race and ethnicity (14 percent;
N=57) .
The youth stakeholder sample** has a higher proportion of Latino and multiracial individuals than the overall stakeholder sample but fewer who identify as white or asian/pacific islander:♦ Latino (36 percent; N=69)♦ White (15 percent; N=29)♦ asian/pacific islander (11 percent; N=21)♦ african american (13 percent; N=24)♦ multiracial (9 percent; N=18)♦ Native american (5 percent; N=10)♦ unspecified race and ethnicity (10 percent;
N=20) .
__________* N=434 . This includes 29 respondents who currently reside in other counties that used to use the mental health services in 11 counties we studied . Those respondents were interviewed but not included in the final report, bringing the reported sample to N=405 .** Based on current analysis of 405 participants, not 434 .
Chart 7: Racial/Ethnic Characteristics of Community Stakeholder Sample(N=405)
Missing/No response
14%
Multi-racial5%
Native American5%
White19%
Latino32%
Asian/Pacific Islander
13%
African-American
12%
Vietnamese2%
Korean11%
Khmer26%
Hmong22%
Japanese2%
Indonesian2%
Filipino6%
Chinese15%
OtherAsian/PI
15%
Chart 8: Racial/Ethnic Characteristics of Youth Stakeholder Sample(N=191)
Missing/No response
10%Multi-racial9%Native American
5%
White15%
Latino36%
Asian/Pacific Islander
11%
African-American
13%
Khmer45%
Hmong14%
Filipino9%
Vietnamese5%
Pacific Islander5%
OtherAsian/PI
23%
20
These demographic distributions are generally consistent with california Department of mental health consumer and Services information System data, which is presented in chapter 2 .
The final samples include interviews with commu-nity stakeholders in the following languages in addi-tion to English:♦ cantonese ♦ Spanish♦ hmong ♦ Khmer♦ Korean ♦ tagalog♦ russian
The family and youth interviewees were also diverse in terms of system involvement:♦ 98 families and youth indicated experience with
the juvenile justice system (16 percent of parents/caregivers and 34 percent of youth)
♦ 51 of the families and youth reported involve-ment with the child welfare system (14 percent of parents/caregivers and 12 percent of youth)
Oversight
Unclaimed Children Revisited is conducted under the auspices of columbia university medical center institutional review Board (cumc irB) . initial approval for the study was granted on august 30, 2006 and is renewed annually . additionally, Unclaimed Children Revisited: California Case Study has been reviewed by a number of ethics boards in california, including:♦ State of california: california health and human
Services committee for protection of human Subjects;
♦ Los angeles county Department of mental health;
♦ San Diego county health and human Services agency;
♦ San mateo county mental health Services;♦ california State university – pomona;♦ Larkin Street youth Services (San Francisco); and♦ Westside child youth and Family Services
(San Francisco) .
in addition to cumc irB permission to work with general populations, Nccp requested and received permission to include the following special popula-tions in the California Case Study:♦ minor youth ages 15 to 17 with parental/guardian
consent;♦ individuals with limited English proficiency, given
approved consent forms are provided in the indi-vidual’s native language;
♦ youth detained in juvenile camp facilities in Los angeles county; and
♦ dependent youth, on a case-by-case basis and with approval by the appropriate governing body in california .
Unclaimed Children Revisited is also guided by national and local advisers that include family members, youths, system leaders, advocates, and community leaders . (See appendix 1 for list of advisers .)
Map 1: 11 Counties Participating in UCR: California Case Study
Represented California counties by rural designation
Rural Not included
San FranciscoSan Mateo
Santa Cruz
Santa Clara
Alameda
Humboldt
Placer
Butte
LosAngeles
SanDiego
Imperial
Non-rural
National Center for Children in Poverty Unclaimed Children Revisited: California Case Study 21
CHAPTeR 2
Who Are California’s Unclaimed Children Today?
Setting the Context: Unclaimed Children 25 years later
in the original Unclaimed Children report, Dr . Jane Knitzer noted that there were some three million children in the united States with serious emotional disturbance (SED),1 and at least two-thirds of them were not receiving adequate services . children and youth with intense mental health needs and those who were most vulnerable to developing them were the least likely to receive appropriate services .2 at the time, few states had policies and programs that specifically focused on children and youth with SED and their families . Even fewer had the infrastruc-tural supports for sustained attention to children and youth . many lacked dedicated staff and budgets for children’s mental health . They even lacked the support to develop systems to track and monitor outcomes or their own expenditures on children’s mental health services . Thus, state policy actions fostered an over reliance on costly residential place-ments, reinforced the fragmentation of services between systems, and contributed only sparingly to building community-based delivery systems . in this chapter, data from the california Depart-ment of mental health’s (Dmh) consumer and Services information (cSi) System for fiscal year 2005/2006 is presented . cSi data contains service users of california’s public mental health system, and in this chapter we describe demographic char-acteristics of the service users .
The california Department of mental health’s (Dmh) consumer and Services information (cSi) System collects statewide demographic, diagnostic, and treatment-related data on mental health service users served by either county/city Dmh providers, or private practitioners contracted by county/city mental health programs . These include all providers whose legal entities are reported to the county cost
report under the category treatment program and the individual and group practitioners, most of whom were formerly in the Fee-for-Service system . These practitioners are individual or group practice psychiatrists; psychologists; licensed clinical social workers (LcSWs); marriage, family, and child coun-selors (mFcc); and registered nurses (rN) as well as those in mixed specialty group practices . The cSi system reflects both medi-cal and non-medi-cal service users . in this study, our analysis is limited to those under age 25 in fiscal year 2005-06 .
We also used the u .S . census Bureau’s american community Survey (acS) to describe demographic characteristics of children and youth who live in california to compare with children and youth in the public mental health system .
County Mental Health Services Categorization
county mental health services are categorized as either community-based (which are day or outpa-tient treatment) or non-community-based (which are 24-hour, inpatient or residential services) . as defined in the cSi, day services are those that provide a range of therapeutic and rehabilita-tive programs as an alternative to inpatient care . Outpatient services are short-term or sustained therapeutic interventions for individuals experi-encing acute and/or ongoing psychiatric distress . Finally, 24-hour services are designed to provide a therapeutic environment of care and treatment within a residential setting . Depending on the severity of the mental disorder and the need for related medical care, treatment would be provided in one of a variety of settings . See appendix 4 for more detailed descriptions of the services received by the service users of day, outpatient, and 24-hour modes of service .
22
demographics Comparisons between California and the 11 UCR Counties
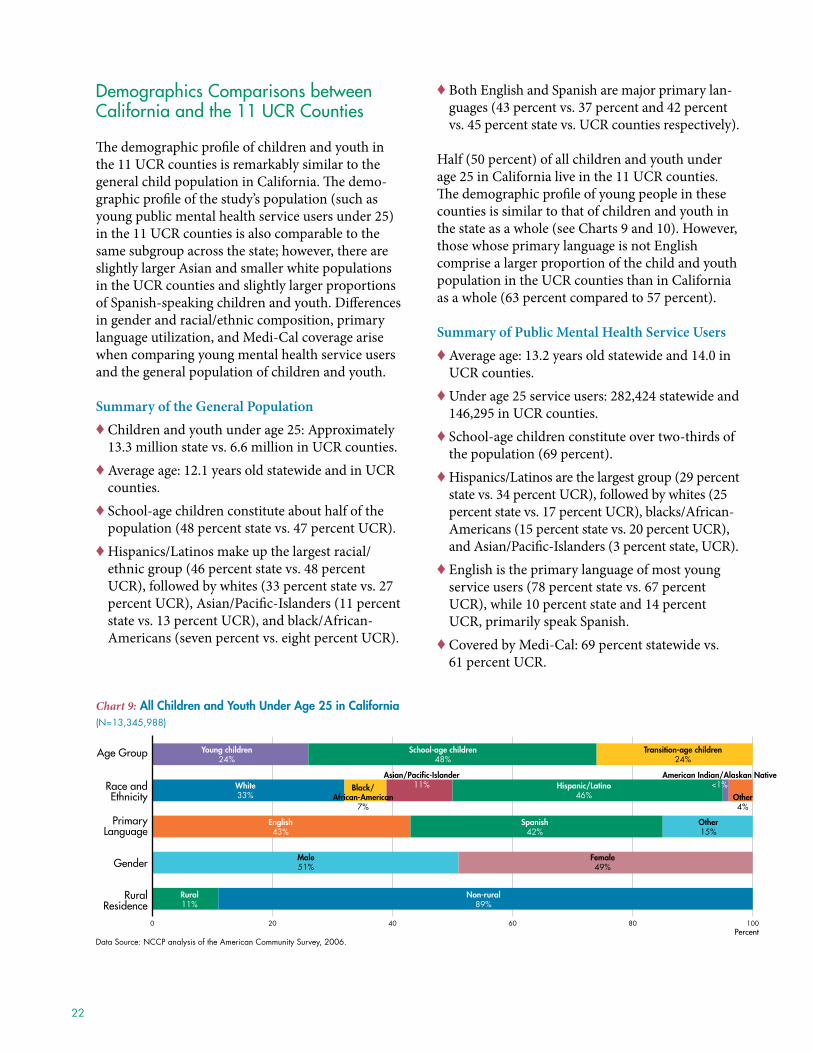
The demographic profile of children and youth in the 11 ucr counties is remarkably similar to the general child population in california . The demo-graphic profile of the study’s population (such as young public mental health service users under 25) in the 11 ucr counties is also comparable to the same subgroup across the state; however, there are slightly larger asian and smaller white populations in the ucr counties and slightly larger proportions of Spanish-speaking children and youth . Differences in gender and racial/ethnic composition, primary language utilization, and medi-cal coverage arise when comparing young mental health service users and the general population of children and youth .
Summary of the General Population♦ children and youth under age 25: approximately
13 .3 million state vs . 6 .6 million in ucr counties .♦ average age: 12 .1 years old statewide and in ucr
counties .♦ School-age children constitute about half of the
population (48 percent state vs . 47 percent ucr) .♦ hispanics/Latinos make up the largest racial/
ethnic group (46 percent state vs . 48 percent ucr), followed by whites (33 percent state vs . 27 percent ucr), asian/pacific-islanders (11 percent state vs . 13 percent ucr), and black/african-americans (seven percent vs . eight percent ucr) .
♦ Both English and Spanish are major primary lan-guages (43 percent vs . 37 percent and 42 percent vs . 45 percent state vs . ucr counties respectively) .
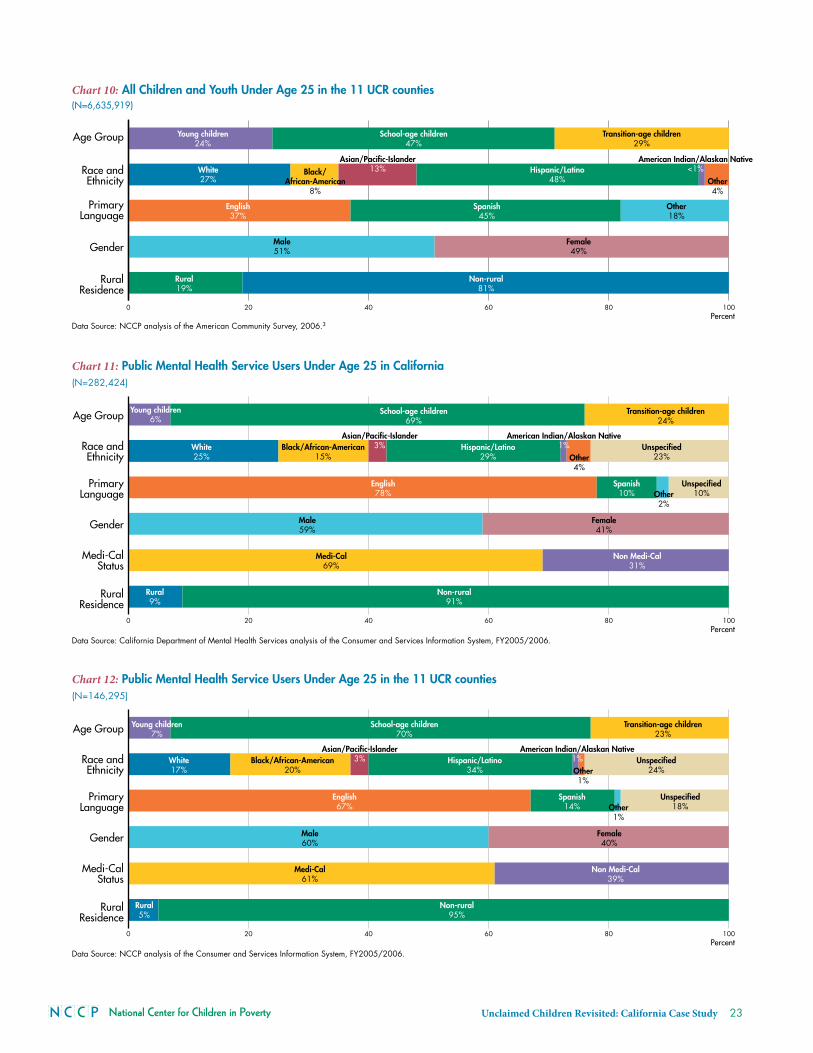
half (50 percent) of all children and youth under age 25 in california live in the 11 ucr counties . The demographic profile of young people in these counties is similar to that of children and youth in the state as a whole (see charts 9 and 10) . however, those whose primary language is not English comprise a larger proportion of the child and youth population in the ucr counties than in california as a whole (63 percent compared to 57 percent) .
Summary of Public Mental Health Service Users♦ average age: 13 .2 years old statewide and 14 .0 in
ucr counties .♦ under age 25 service users: 282,424 statewide and
146,295 in ucr counties .♦ School-age children constitute over two-thirds of
the population (69 percent) .♦ hispanics/Latinos are the largest group (29 percent
state vs . 34 percent ucr), followed by whites (25 percent state vs . 17 percent ucr), blacks/african-americans (15 percent state vs . 20 percent ucr), and asian/pacific-islanders (3 percent state, ucr) .
♦ English is the primary language of most young service users (78 percent state vs . 67 percent ucr), while 10 percent state and 14 percent ucr, primarily speak Spanish .
♦ covered by medi-cal: 69 percent statewide vs . 61 percent ucr .
Chart 9: All Children and Youth Under Age 25 in California (N=13,345,988)
0 20 40 60 80 100
Data Source: NCCP analysis of the American Community Survey, 2006.
Age Group
Race andEthnicity
PrimaryLanguage
Gender
RuralResidence
Young children24%
School-age children48%
Transition-age children24%
White33%
Black/African-American
7%
Asian/Pacific-Islander11% Hispanic/Latino
46%
American Indian/Alaskan Native<1%
Other4%
English43%
Spanish42%
Other15%
Male51%
Female49%
Rural11%
Non-rural89%
Percent
National Center for Children in Poverty Unclaimed Children Revisited: California Case Study 23
Chart 10: All Children and Youth Under Age 25 in the 11 UCR counties (N=6,635,919)
0 20 40 60 80 100
Data Source: NCCP analysis of the American Community Survey, 2006.3
Age Group
Race andEthnicity
PrimaryLanguage
Gender
RuralResidence
Young children24%
School-age children47%
Transition-age children29%
White27%
Black/African-American
8%
Asian/Pacific-Islander13% Hispanic/Latino
48%
American Indian/Alaskan Native<1%
Other4%
English37%
Spanish45%
Other18%
Male51%
Female49%
Rural19%
Non-rural81%
Percent
Chart 11: Public Mental Health Service Users Under Age 25 in California (N=282,424)
0 20 40 60 80 100
Data Source: California Department of Mental Health Services analysis of the Consumer and Services Information System, FY2005/2006.
Age Group
Race andEthnicity
PrimaryLanguage
Gender
Medi-CalStatus
RuralResidence
Young children6%
School-age children69%
Transition-age children24%
White25%
Black/African-American15%
Asian/Pacific-Islander3% Hispanic/Latino
29%
American Indian/Alaskan Native1%
Other4%
English78%
Spanish10% Other
2%
Male59%
Female41%
Rural9%
Non-rural91%
Unspecified23%
Unspecified10%
Medi-Cal69%
Non Medi-Cal31%
Percent
Chart 12: Public Mental Health Service Users Under Age 25 in the 11 UCR counties (N=146,295)
0 20 40 60 80 100
Data Source: NCCP analysis of the Consumer and Services Information System, FY2005/2006.
Age Group
Race andEthnicity
PrimaryLanguage
Gender
Medi-CalStatus
RuralResidence
Young children7%
School-age children70%
Transition-age children23%
White17%
Black/African-American20%
Asian/Pacific-Islander3% Hispanic/Latino
34%
American Indian/Alaskan Native1%Other1%
English67%
Spanish14% Other
1%
Male60%
Female40%
Rural5%
Non-rural95%
Unspecified24%
Unspecified18%
Medi-Cal61%
Non Medi-Cal39%
Percent
24
half (50 percent) of all public mental health service users under age 25 in california live in the 11 ucr counties . The demographic profiles of the two populations are very similar (see charts 11 and 12) . however, african-americans comprised a slightly higher proportion of child and young adult mental health service users in the ucr counties than in california as a whole (20 percent compared to 15 percent) . conversely, whites make up a smaller proportion of child and young adult mental health service users in the ucr counties than in california as a whole (17 percent compared to 25 percent) .
This highlights both the successful outreach and service to school-age children and a need for more attention to meeting the needs of young children, as well as transition-age youth . The relatively limited number of service users whose primary language is not English suggests deficiencies in the avail-ability of linguistically competent services . it should be noted that the primary language of 18 percent of public mental health service users in the ucr counties is unspecified . With the primary language and race and ethnicity of many unspecified on the administrative rolls, a more accurate picture of service users remains difficult to assess .
demographic Comparisons Across Counties
Number of County Mental Health Service Users, by County
On average, in the 11 ucr study sites, county mental health service users under age 25 comprise two percent of the total population of children and youth . San Francisco and Butte counties have slightly higher public mental health service utili-zation (four percent) among young people under age 25 than placer and Santa clara counties (one percent) .
Table 1: summary of the demographic Profile of state and uCR County service users (under age 25) in fy 2005-2006
state (n=282,424) uCR Counties (n=146,295)
Percent of Public Mental health service users
• 2% - • 2% -
age distribution (% of the age group in the general population)
• Average age: 13.2 years old
• 6% Young children (24%)
• 69% School-age children (48%)
• 24% Transitional age youth (24%)
• Average age: 14.0 years old
• 7% Young children ( 24%)
• 70% School-age children (47%)
• 23% Transitional age youth (29%)
Racial/Ethnic Composition (% of the racial/ethnic group in the general population)
• 25% Whites (33%)
• 15% Blacks/African-Americans (7%)
• 3% Asians/Pacific-Islanders (11%)
• 29% Hispanics/Latinos (48%)
• 1% American Native/Indians (>1%)
• 4% Other (4%)
• 23% Missing responses of race and ethnicity
• 17% Whites (27%)
• 20% Blacks/African-Americans (8%)
• 3% Asians/Pacific-Islanders (13%)
• 34% Hispanics/Latinos (48%)
• 1% American Native/Indians (>1%)
• 4% Other (4%)
• 23% Missing responses of race and ethnicity
Primary language Composition (% in general population)
• 78% English speaker (43%)
• 10% Spanish speaker (42%)
• 2% Other language (15%)
• 67% English speaker (37%)
• 14% Spanish speaker (45%)
• 19% Other language (18%)
gender Composition (% in general population)
• 59% Males (51%)
• 41% Females (49%)
• 60% Males (51%)
• 40% Female (49%)
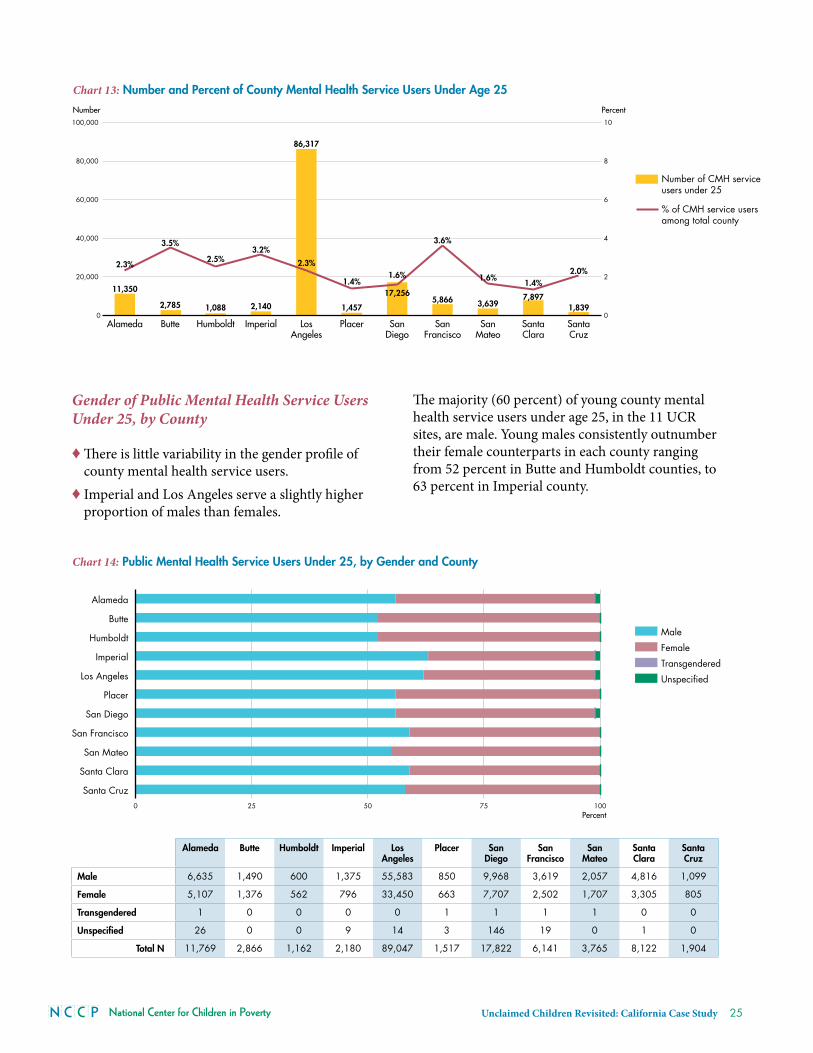
National Center for Children in Poverty Unclaimed Children Revisited: California Case Study 25
Gender of Public Mental Health Service Users Under 25, by County
♦ There is little variability in the gender profile of county mental health service users .
♦ imperial and Los angeles serve a slightly higher proportion of males than females .
The majority (60 percent) of young county mental health service users under age 25, in the 11 ucr sites, are male . young males consistently outnumber their female counterparts in each county ranging from 52 percent in Butte and humboldt counties, to 63 percent in imperial county .
alameda Butte humboldt imperial los angeles
Placer san diego
san francisco
san Mateo
santa Clara
santa Cruz
Male 6,635 1,490 600 1,375 55,583 850 9,968 3,619 2,057 4,816 1,099
female 5,107 1,376 562 796 33,450 663 7,707 2,502 1,707 3,305 805
Transgendered 1 0 0 0 0 1 1 1 1 0 0
unspecified 26 0 0 9 14 3 146 19 0 1 0
Total n 11,769 2,866 1,162 2,180 89,047 1,517 17,822 6,141 3,765 8,122 1,904
Chart 13: Number and Percent of County Mental Health Service Users Under Age 25
0
20,000
40,000
60,000
80,000
100,000
SantaCruz
SantaClara
SanMateo
SanFrancisco
SanDiego
PlacerLosAngeles
ImperialHumboldtButteAlameda0
2
4
6
8
10
0
2
4
6
8
10
Santa CruzSanta ClaraSan MateoSan FranciscoSan DiegoPlacerLos AngelesImperialHumboldtButteAlameda
Number Percent
Number of CMH service users under 25
% of CMH service usersamong total county
1,8397,897
3,6395,86617,256
1,457
86,317
2,1401,0882,785
11,350
2.0%1.4%
1.6%
3.6%
1.6%1.4%
2.3%
3.2%2.5%
3.5%
2.3%
Chart 14: Public Mental Health Service Users Under 25, by Gender and County
Male
Female
Transgendered
Unspecified
0 25 50 75 100
Santa Cruz
Santa Clara
San Mateo
San Francisco
San Diego
Placer
Los Angeles
Imperial
Humboldt
Butte
Alameda
Percent
0 25 50 75 100
Unspecified
Transgendered
Female
Male
Santa Cruz
Santa Clara
San Mateo
San Francisco
San Diego
Placer
Los Angeles
Imperial
Humboldt
Butte
Alameda
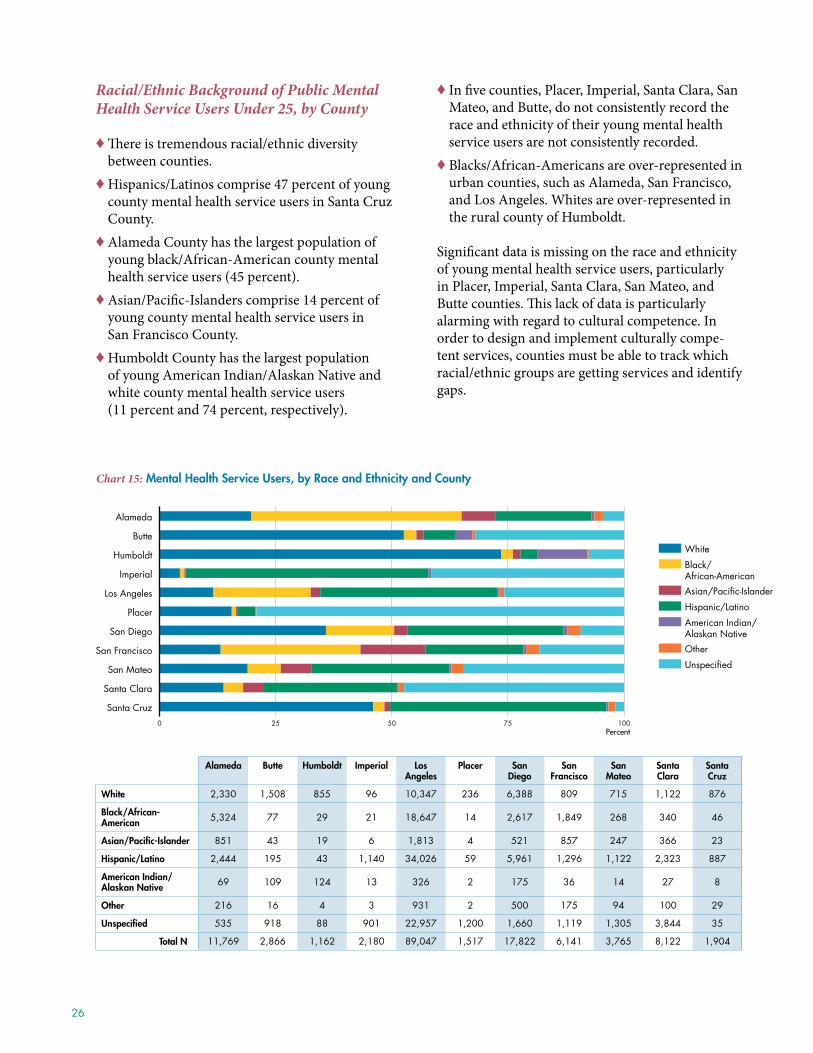
26
Racial/Ethnic Background of Public Mental Health Service Users Under 25, by County
♦ There is tremendous racial/ethnic diversity between counties .
♦ hispanics/Latinos comprise 47 percent of young county mental health service users in Santa cruz county .
♦ alameda county has the largest population of young black/african-american county mental health service users (45 percent) .
♦ asian/pacific-islanders comprise 14 percent of young county mental health service users in San Francisco county .
♦ humboldt county has the largest population of young american indian/alaskan Native and white county mental health service users (11 percent and 74 percent, respectively) .
♦ in five counties, placer, imperial, Santa clara, San mateo, and Butte, do not consistently record the race and ethnicity of their young mental health service users are not consistently recorded .
♦ Blacks/african-americans are over-represented in urban counties, such as alameda, San Francisco, and Los angeles . Whites are over-represented in the rural county of humboldt .
Significant data is missing on the race and ethnicity of young mental health service users, particularly in placer, imperial, Santa clara, San mateo, and Butte counties . This lack of data is particularly alarming with regard to cultural competence . in order to design and implement culturally compe-tent services, counties must be able to track which racial/ethnic groups are getting services and identify gaps .
alameda Butte humboldt imperial los angeles
Placer san diego
san francisco
san Mateo
santa Clara
santa Cruz
White 2,330 1,508 855 96 10,347 236 6,388 809 715 1,122 876
Black/african-american 5,324 77 29 21 18,647 14 2,617 1,849 268 340 46
asian/Pacific-islander 851 43 19 6 1,813 4 521 857 247 366 23
hispanic/latino 2,444 195 43 1,140 34,026 59 5,961 1,296 1,122 2,323 887
american indian/alaskan native 69 109 124 13 326 2 175 36 14 27 8
Other 216 16 4 3 931 2 500 175 94 100 29
unspecified 535 918 88 901 22,957 1,200 1,660 1,119 1,305 3,844 35
Total n 11,769 2,866 1,162 2,180 89,047 1,517 17,822 6,141 3,765 8,122 1,904
Chart 15: Mental Health Service Users, by Race and Ethnicity and County
0 25 50 75 100
Santa Cruz
Santa Clara
San Mateo
San Francisco
San Diego
Placer
Los Angeles
Imperial
Humboldt
Butte
Alameda
White
Black/African-American
Asian/Pacific-Islander
Hispanic/Latino
American Indian/Alaskan Native
Other
Unspecified
Percent
0 25 50 75 100
Unspecified
others
American Indian
Hispanic/Latino
Asian/Pacific Islander
Black/African-American
WhiteSanta Cruz
Santa Clara
San Mateo
San Francisco
San Diego
Placer
Los Angeles
Imperial
Humboldt
Butte
Alameda
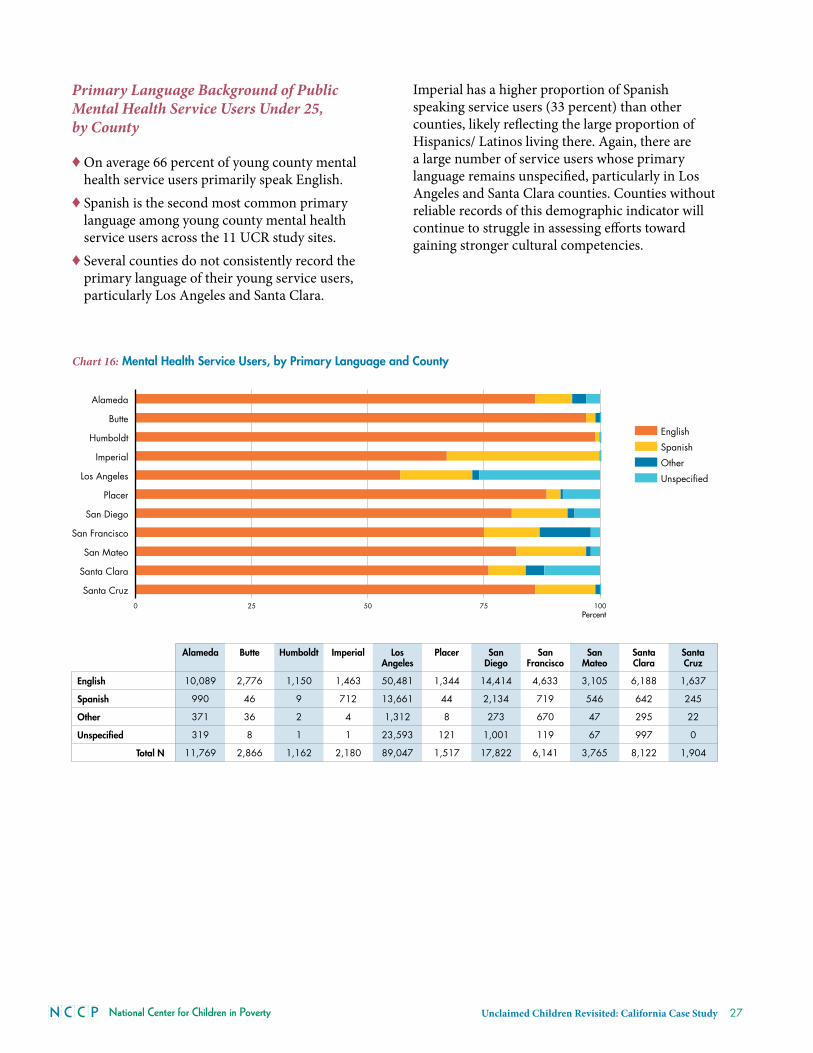
National Center for Children in Poverty Unclaimed Children Revisited: California Case Study 27
Primary Language Background of Public Mental Health Service Users Under 25, by County
♦ On average 66 percent of young county mental health service users primarily speak English .
♦ Spanish is the second most common primary language among young county mental health service users across the 11 ucr study sites .
♦ Several counties do not consistently record the primary language of their young service users, particularly Los angeles and Santa clara .
imperial has a higher proportion of Spanish speaking service users (33 percent) than other counties, likely reflecting the large proportion of hispanics/ Latinos living there . again, there are a large number of service users whose primary language remains unspecified, particularly in Los angeles and Santa clara counties . counties without reliable records of this demographic indicator will continue to struggle in assessing efforts toward gaining stronger cultural competencies .
alameda Butte humboldt imperial los angeles
Placer san diego
san francisco
san Mateo
santa Clara
santa Cruz
English 10,089 2,776 1,150 1,463 50,481 1,344 14,414 4,633 3,105 6,188 1,637
spanish 990 46 9 712 13,661 44 2,134 719 546 642 245
Other 371 36 2 4 1,312 8 273 670 47 295 22
unspecified 319 8 1 1 23,593 121 1,001 119 67 997 0
Total n 11,769 2,866 1,162 2,180 89,047 1,517 17,822 6,141 3,765 8,122 1,904
Chart 16: Mental Health Service Users, by Primary Language and County
0 25 50 75 100
Santa Cruz
Santa Clara
San Mateo
San Francisco
San Diego
Placer
Los Angeles
Imperial
Humboldt
Butte
Alameda
English
Spanish
Other
Unspecified
Percent
0 25 50 75 100
Unspecified
Other
Spanish
English
Santa Cruz
Santa Clara
San Mateo
San Francisco
San Diego
Placer
Los Angeles
Imperial
Humboldt
Butte
Alameda
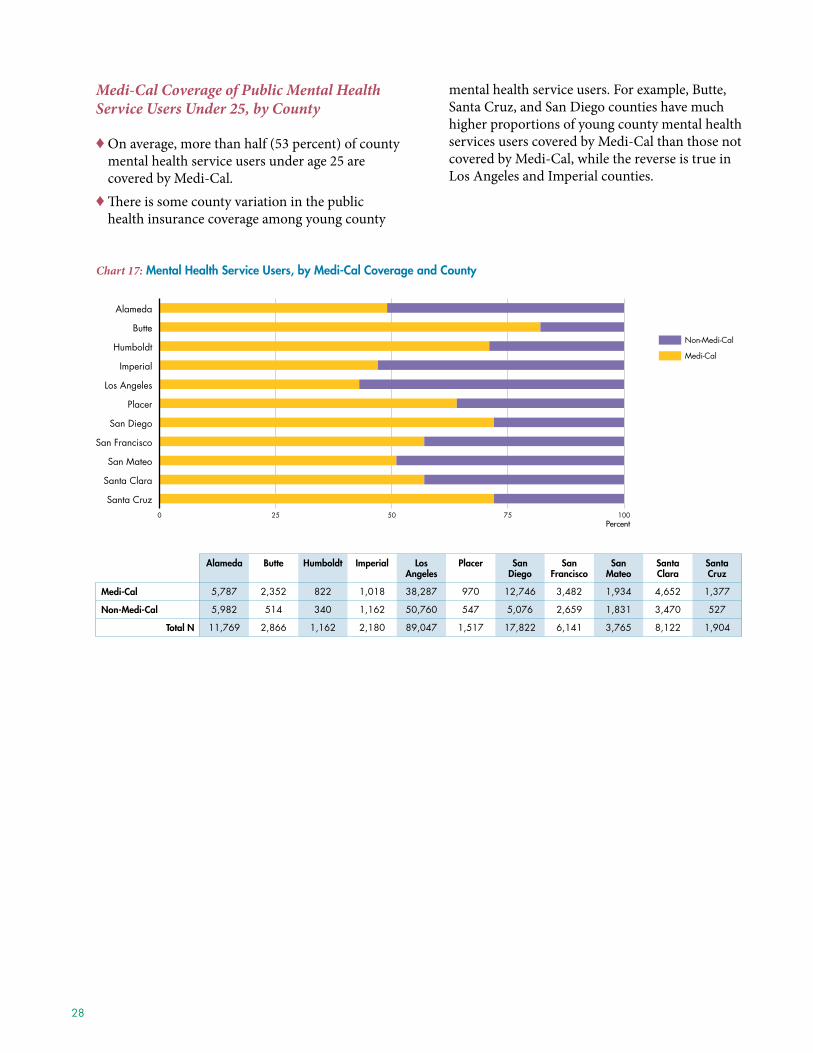
28
alameda Butte humboldt imperial los angeles
Placer san diego
san francisco
san Mateo
santa Clara
santa Cruz
Medi-Cal 5,787 2,352 822 1,018 38,287 970 12,746 3,482 1,934 4,652 1,377
non-Medi-Cal 5,982 514 340 1,162 50,760 547 5,076 2,659 1,831 3,470 527
Total n 11,769 2,866 1,162 2,180 89,047 1,517 17,822 6,141 3,765 8,122 1,904
Medi-Cal Coverage of Public Mental Health Service Users Under 25, by County
♦ On average, more than half (53 percent) of county mental health service users under age 25 are covered by medi-cal .
♦ There is some county variation in the public health insurance coverage among young county
mental health service users . For example, Butte, Santa cruz, and San Diego counties have much higher proportions of young county mental health services users covered by medi-cal than those not covered by medi-cal, while the reverse is true in Los angeles and imperial counties .
Chart 17: Mental Health Service Users, by Medi-Cal Coverage and County
0 25 50 75 100
Santa Cruz
Santa Clara
San Mateo
San Francisco
San Diego
Placer
Los Angeles
Imperial
Humboldt
Butte
Alameda
Non-Medi-Cal
Medi-Cal
Percent
0 25 50 75 100
Non Medi-Cal
Medi-Cal
Santa Cruz
Santa Clara
San Mateo
San Francisco
San Diego
Placer
Los Angeles
Imperial
Humboldt
Butte
Alameda
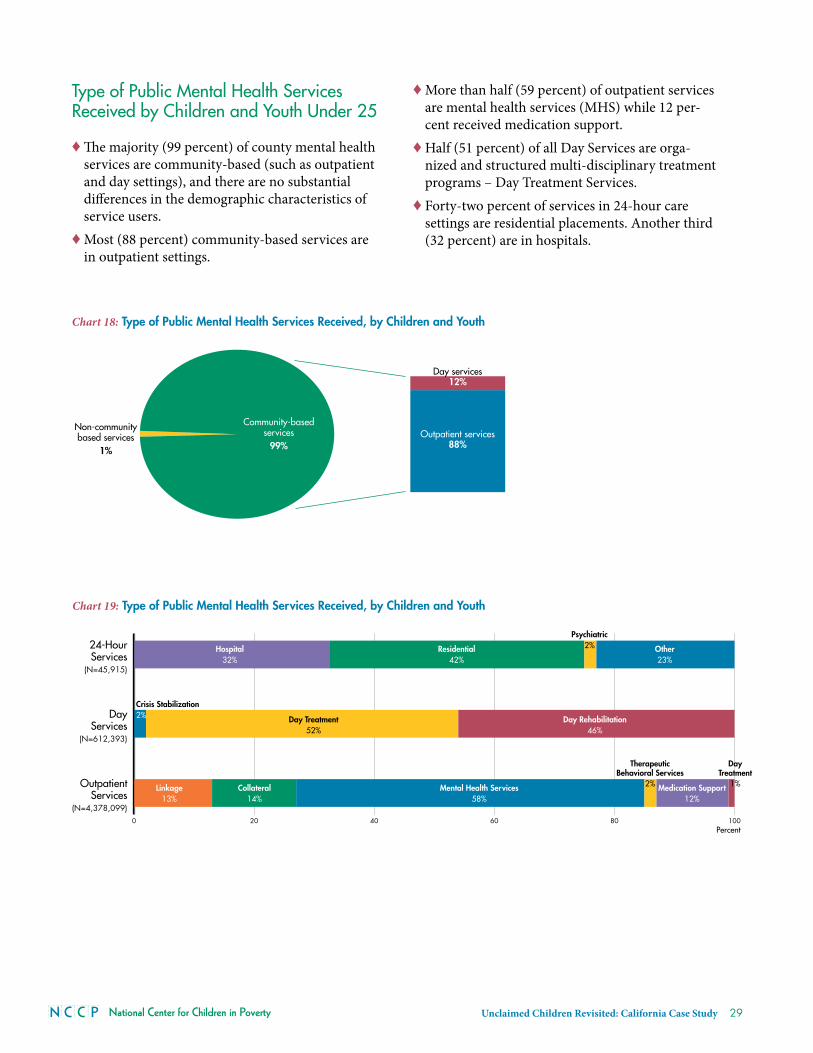
National Center for Children in Poverty Unclaimed Children Revisited: California Case Study 29
Type of Public Mental Health Services Received by Children and youth Under 25
♦ The majority (99 percent) of county mental health services are community-based (such as outpatient and day settings), and there are no substantial differences in the demographic characteristics of service users .
♦ most (88 percent) community-based services are in outpatient settings .
♦ more than half (59 percent) of outpatient services are mental health services (mhS) while 12 per-cent received medication support .
♦ half (51 percent) of all Day Services are orga-nized and structured multi-disciplinary treatment programs – Day treatment Services .
♦ Forty-two percent of services in 24-hour care settings are residential placements . another third (32 percent) are in hospitals .
Chart 18: Type of Public Mental Health Services Received, by Children and Youth
Non-communitybased services
1%
Community-basedservices
99%
Non-community based services 45,915
Community-based services 4,990,492
Day services12%
Outpatient services88%
Chart 19: Type of Public Mental Health Services Received, by Children and Youth
0 20 40 60 80 100
OutpatientServices
(N=4,378,099)
DayServices
(N=612,393)
24-HourServices
(N=45,915)
Hospital32%
Residential42%
Psychiatric2% Other
23%
Crisis Stabilization2% Day Treatment
52%Day Rehabilitation
46%
Collateral14%
Mental Health Services58%
Linkage13%
TherapeuticBehavioral Services
2% Medication Support12%
DayTreatment
1%
Percent
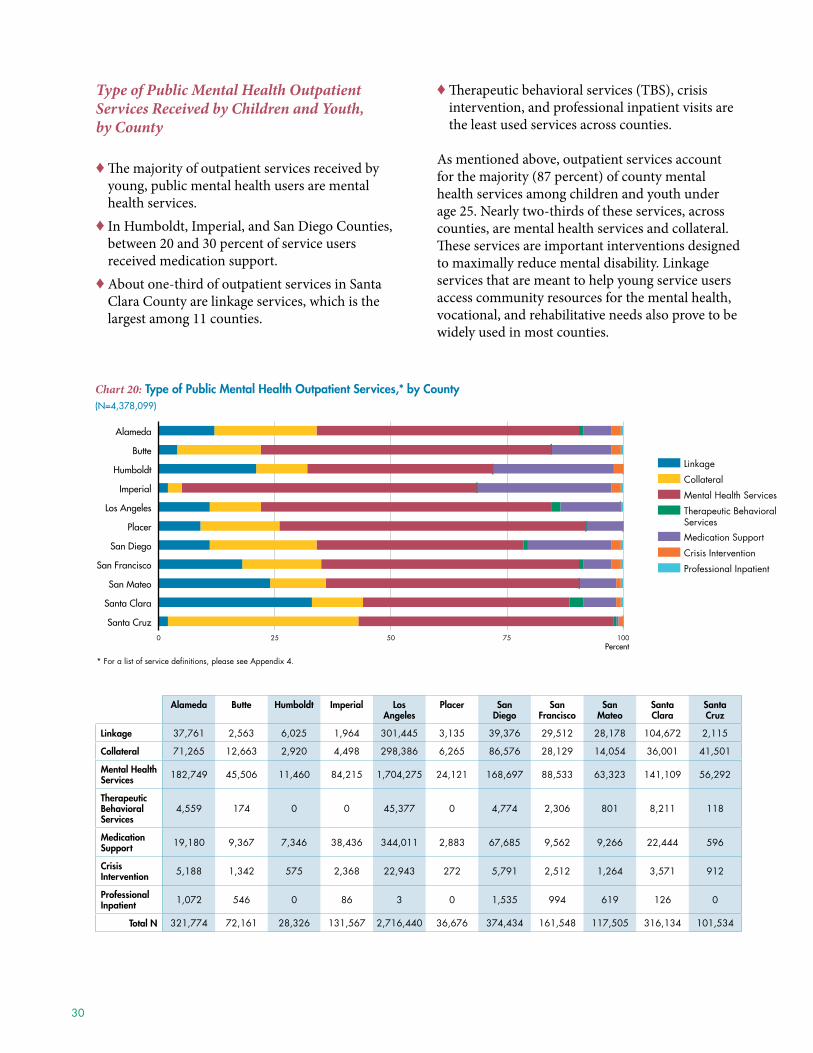
30
alameda Butte humboldt imperial los angeles
Placer san diego
san francisco
san Mateo
santa Clara
santa Cruz
linkage 37,761 2,563 6,025 1,964 301,445 3,135 39,376 29,512 28,178 104,672 2,115
Collateral 71,265 12,663 2,920 4,498 298,386 6,265 86,576 28,129 14,054 36,001 41,501
Mental health services 182,749 45,506 11,460 84,215 1,704,275 24,121 168,697 88,533 63,323 141,109 56,292
Therapeutic Behavioral services
4,559 174 0 0 45,377 0 4,774 2,306 801 8,211 118
Medication support 19,180 9,367 7,346 38,436 344,011 2,883 67,685 9,562 9,266 22,444 596
Crisis intervention 5,188 1,342 575 2,368 22,943 272 5,791 2,512 1,264 3,571 912
Professional inpatient 1,072 546 0 86 3 0 1,535 994 619 126 0
Total n 321,774 72,161 28,326 131,567 2,716,440 36,676 374,434 161,548 117,505 316,134 101,534
Type of Public Mental Health Outpatient Services Received by Children and Youth, by County
♦ The majority of outpatient services received by young, public mental health users are mental health services .
♦ in humboldt, imperial, and San Diego counties, between 20 and 30 percent of service users received medication support .
♦ about one-third of outpatient services in Santa clara county are linkage services, which is the largest among 11 counties .
♦ Therapeutic behavioral services (tBS), crisis intervention, and professional inpatient visits are the least used services across counties .
as mentioned above, outpatient services account for the majority (87 percent) of county mental health services among children and youth under age 25 . Nearly two-thirds of these services, across counties, are mental health services and collateral . These services are important interventions designed to maximally reduce mental disability . Linkage services that are meant to help young service users access community resources for the mental health, vocational, and rehabilitative needs also prove to be widely used in most counties .
Chart 20: Type of Public Mental Health Outpatient Services,* by County (N=4,378,099)
0 25 50 75 100
Santa Cruz
Santa Clara
San Mateo
San Francisco
San Diego
Placer
Los Angeles
Imperial
Humboldt
Butte
Alameda
0 25 50 75 100
Professional Inpatient
Crisis Intervention
Medication Support
Therapeutic Behavioral Services
Mental Health Services
Collateral
LinkageSanta Cruz
Santa Clara
San Mateo
San Francisco
San Diego
Placer
Los Angeles
Imperial
Humboldt
Butte
Alameda
Linkage
Collateral
Mental Health Services
Therapeutic Behavioral Services
Medication Support
Crisis Intervention
Professional Inpatient
Percent
* For a list of service definitions, please see Appendix 4.
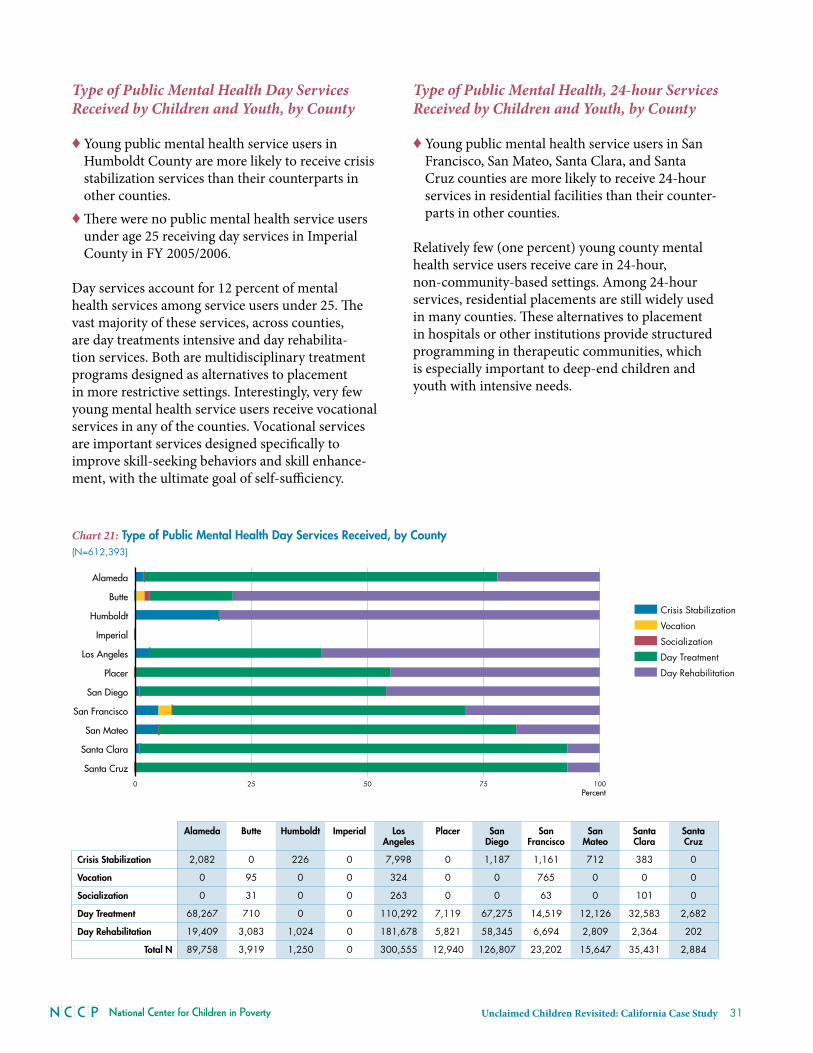
National Center for Children in Poverty Unclaimed Children Revisited: California Case Study 31
Type of Public Mental Health Day Services Received by Children and Youth, by County
♦ young public mental health service users in humboldt county are more likely to receive crisis stabilization services than their counterparts in other counties .
♦ There were no public mental health service users under age 25 receiving day services in imperial county in Fy 2005/2006 .
Day services account for 12 percent of mental health services among service users under 25 . The vast majority of these services, across counties, are day treatments intensive and day rehabilita-tion services . Both are multidisciplinary treatment programs designed as alternatives to placement in more restrictive settings . interestingly, very few young mental health service users receive vocational services in any of the counties . vocational services are important services designed specifically to improve skill-seeking behaviors and skill enhance-ment, with the ultimate goal of self-sufficiency .
Type of Public Mental Health, 24-hour Services Received by Children and Youth, by County
♦ young public mental health service users in San Francisco, San mateo, Santa clara, and Santa cruz counties are more likely to receive 24-hour services in residential facilities than their counter-parts in other counties .
relatively few (one percent) young county mental health service users receive care in 24-hour, non-community-based settings . among 24-hour services, residential placements are still widely used in many counties . These alternatives to placement in hospitals or other institutions provide structured programming in therapeutic communities, which is especially important to deep-end children and youth with intensive needs .
alameda Butte humboldt imperial los angeles
Placer san diego
san francisco
san Mateo
santa Clara
santa Cruz
Crisis stabilization 2,082 0 226 0 7,998 0 1,187 1,161 712 383 0
Vocation 0 95 0 0 324 0 0 765 0 0 0
socialization 0 31 0 0 263 0 0 63 0 101 0
day Treatment 68,267 710 0 0 110,292 7,119 67,275 14,519 12,126 32,583 2,682
day Rehabilitation 19,409 3,083 1,024 0 181,678 5,821 58,345 6,694 2,809 2,364 202
Total n 89,758 3,919 1,250 0 300,555 12,940 126,807 23,202 15,647 35,431 2,884
Chart 21: Type of Public Mental Health Day Services Received, by County (N=612,393)
0 25 50 75 100
Santa Cruz
Santa Clara
San Mateo
San Francisco
San Diego
Placer
Los Angeles
Imperial
Humboldt
Butte
Alameda
0 25 50 75 100
Day Rehabilitation
Day Treatment
Socialization
Vocation
Crisis Stabilization
Santa Cruz
Santa Clara
San Mateo
San Francisco
San Diego
Placer
Los Angeles
Imperial
Humboldt
Butte
Alameda
Crisis Stabilization
Vocation
Socialization
Day Treatment
Day Rehabilitation
Percent
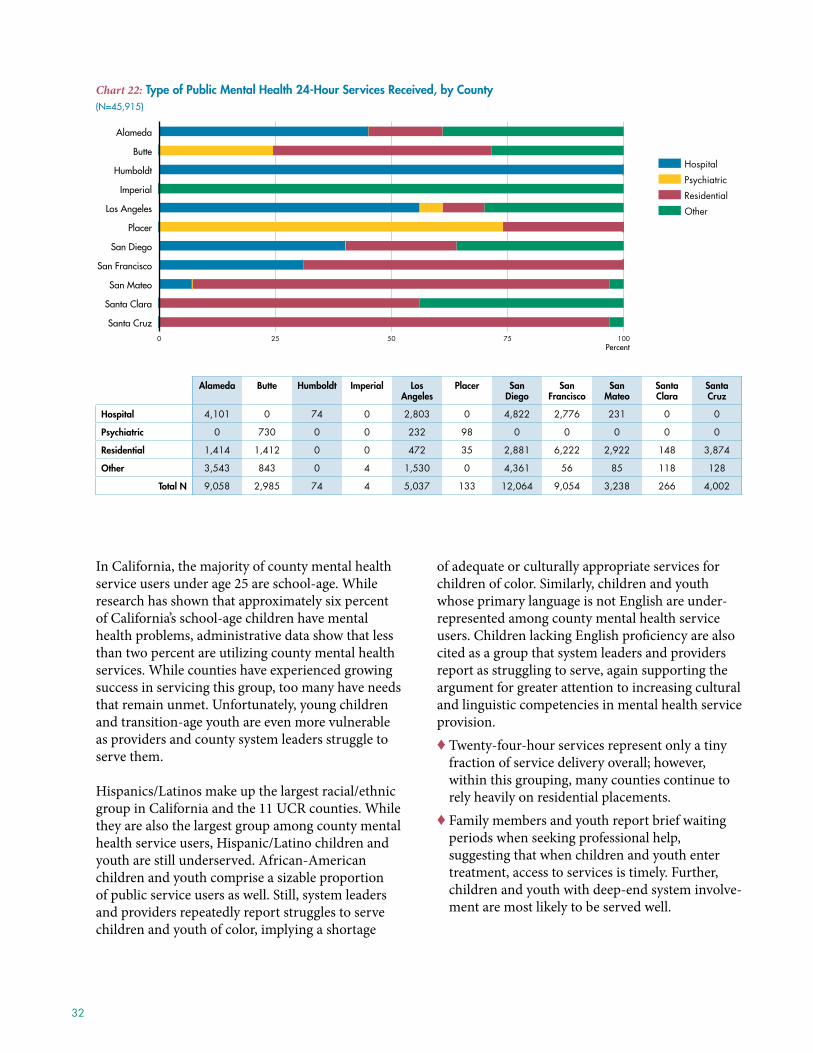
32
alameda Butte humboldt imperial los angeles
Placer san diego
san francisco
san Mateo
santa Clara
santa Cruz
hospital 4,101 0 74 0 2,803 0 4,822 2,776 231 0 0
Psychiatric 0 730 0 0 232 98 0 0 0 0 0
Residential 1,414 1,412 0 0 472 35 2,881 6,222 2,922 148 3,874
Other 3,543 843 0 4 1,530 0 4,361 56 85 118 128
Total n 9,058 2,985 74 4 5,037 133 12,064 9,054 3,238 266 4,002
Chart 22: Type of Public Mental Health 24-Hour Services Received, by County (N=45,915)
0 25 50 75 100
Santa Cruz
Santa Clara
San Mateo
San Francisco
San Diego
Placer
Los Angeles
Imperial
Humboldt
Butte
Alameda
0 25 50 75 100
Other
Residential
Psychiatric
Hospital
Santa Cruz
Santa Clara
San Mateo
San Francisco
San Diego
Placer
Los Angeles
Imperial
Humboldt
Butte
Alameda
Hospital
Psychiatric
Residential
Other
Percent
in california, the majority of county mental health service users under age 25 are school-age . While research has shown that approximately six percent of california’s school-age children have mental health problems, administrative data show that less than two percent are utilizing county mental health services . While counties have experienced growing success in servicing this group, too many have needs that remain unmet . unfortunately, young children and transition-age youth are even more vulnerable as providers and county system leaders struggle to serve them .
hispanics/Latinos make up the largest racial/ethnic group in california and the 11 ucr counties . While they are also the largest group among county mental health service users, hispanic/Latino children and youth are still underserved . african-american children and youth comprise a sizable proportion of public service users as well . Still, system leaders and providers repeatedly report struggles to serve children and youth of color, implying a shortage
of adequate or culturally appropriate services for children of color . Similarly, children and youth whose primary language is not English are under-represented among county mental health service users . children lacking English proficiency are also cited as a group that system leaders and providers report as struggling to serve, again supporting the argument for greater attention to increasing cultural and linguistic competencies in mental health service provision . ♦ twenty-four-hour services represent only a tiny
fraction of service delivery overall; however, within this grouping, many counties continue to rely heavily on residential placements .
♦ Family members and youth report brief waiting periods when seeking professional help, suggesting that when children and youth enter treatment, access to services is timely . Further, children and youth with deep-end system involve-ment are most likely to be served well .

National Center for Children in Poverty Unclaimed Children Revisited: California Case Study 33
CHAPTeR 3
Service delivery – System Gains, Co-occurring, Access
Setting the Context: Unmet Mental Health Service Needs Among Children and youth
considerable changes in the philosophy, adminis-tration, and operation of services for children and young adults with mental health concerns in the nearly three decades since Unclaimed Children was first published notwithstanding, the level of unmet need remains high .4 today, an estimated 10 percent of all children in the united States have an SED that severely disrupts social, academic, and emotional functioning .5, 6, 7 conservative estimates reveal that 75 percent of those in need are unable to access appropriate mental health services .8, 9 Further, many of the same groups remain particularly vulnerable . For instance, while 76 percent of white children with mental health needs are not receiving services, the rate is even higher among children of color, ranging from 77 percent to 90 percent .10, 11 half of all children in the child welfare system have recog-nized mental health problems, but only 15 percent of these children are receiving treatment services .12 and while 25 percent of uninsured and 32 percent of publicly-insured children have mental health needs, 87 percent and 73 percent of these children (respectively) have unmet needs .13, 14
in california, approximately six percent of school-age children (6 to 17 years old) have mental health problems, but only 19 percent of these children receive adequate services .15 This concentration of unmet need is significantly higher than the national average and most states .16 Given the continued vulnerability of both young children under age 5, and young adults nationwide, it is likely that these age groups are also experiencing substantial difficul-ties in accessing mental health services across the state .
mood disorders, especially major depression, are highly prevalent in the general population . These disorders and alcohol use disorders often co-occur within individuals .17 individuals with co-occurring mental health and substance use disorders (cmSD) also have worse clinical courses and outcomes and are at increased risk of suicide and social and occu-pational impairment and disability .18
Prior Research and Research Questions
previous research that examines mental health services utilization nationwide demonstrates that children, youth, and families experience barriers to access that are confounded by demographic, socio-economic, cultural, linguistic, and geographic attributes .19, 20, 21 Data from california mirror some of these national problems .22, 23 in addition, from the perspective of service users, structural barriers such as wait times, provider accessibility, and more integral factors such as provider-patient therapeutic alliance, can impact access to and the quality of treatment .24, 25 From a public policy perspective, understanding the characteristics of the popula-tion of children and families being served, those who remain unserved or underserved, and the factors that contribute to increased access and better outcomes are vital .26 Bearing these factors in mind, the study investigators asked the following questions:♦ What are system leaders and provider’s perspec-
tives regarding systemic gains in service delivery for children?
in California, approximately six percent of school-age children (6 to 17 years old) have mental health problems, but only 19 percent of these children receive adequate services. This concentration of unmet need is significantly higher than the national average and most states.
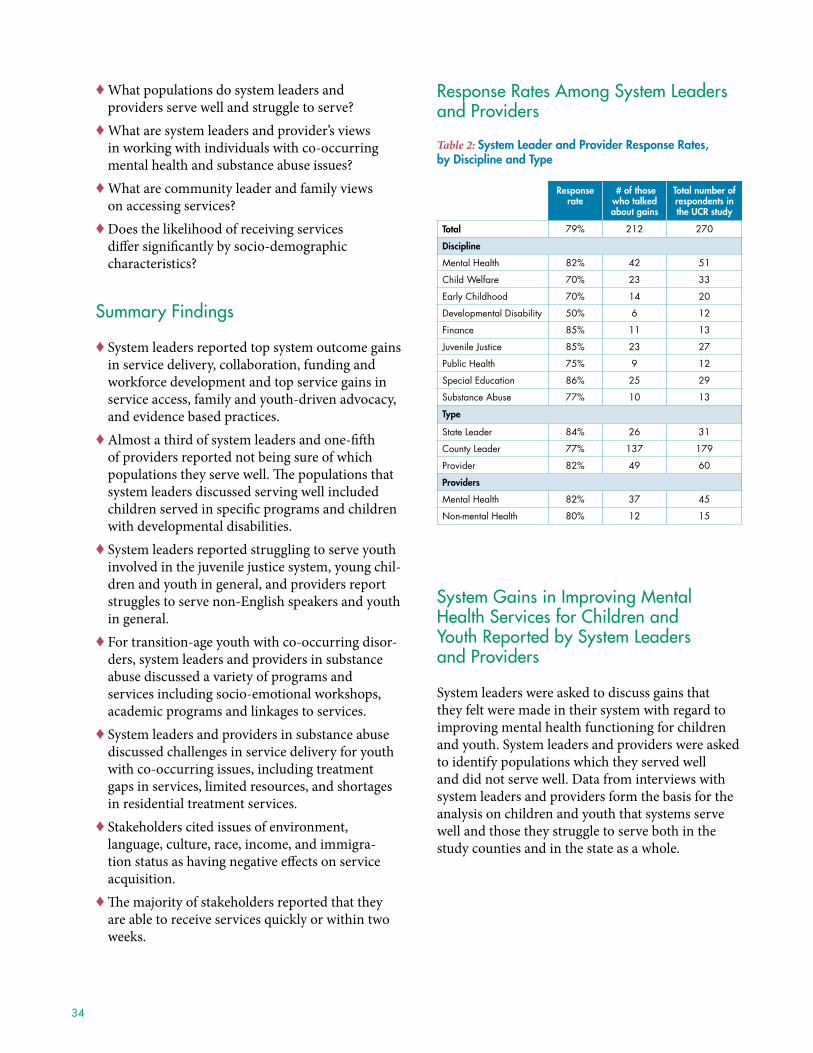
34
♦ What populations do system leaders and providers serve well and struggle to serve?
♦ What are system leaders and provider’s views in working with individuals with co-occurring mental health and substance abuse issues?
♦ What are community leader and family views on accessing services?
♦ Does the likelihood of receiving services differ significantly by socio-demographic characteristics?
Summary Findings
♦ System leaders reported top system outcome gains in service delivery, collaboration, funding and workforce development and top service gains in service access, family and youth-driven advocacy, and evidence based practices .
♦ almost a third of system leaders and one-fifth of providers reported not being sure of which populations they serve well . The populations that system leaders discussed serving well included children served in specific programs and children with developmental disabilities .
♦ System leaders reported struggling to serve youth involved in the juvenile justice system, young chil-dren and youth in general, and providers report struggles to serve non-English speakers and youth in general .
♦ For transition-age youth with co-occurring disor-ders, system leaders and providers in substance abuse discussed a variety of programs and services including socio-emotional workshops, academic programs and linkages to services .
♦ System leaders and providers in substance abuse discussed challenges in service delivery for youth with co-occurring issues, including treatment gaps in services, limited resources, and shortages in residential treatment services .
♦ Stakeholders cited issues of environment, language, culture, race, income, and immigra-tion status as having negative effects on service acquisition .
♦ The majority of stakeholders reported that they are able to receive services quickly or within two weeks .
Response Rates Among System leaders and Providers
Table 2: system leader and Provider Response Rates, by discipline and Type
Response rate
# of those who talked about gains
Total number of respondents in the uCR study
Total 79% 212 270
discipline
Mental Health 82% 42 51
Child Welfare 70% 23 33
Early Childhood 70% 14 20
Developmental Disability 50% 6 12
Finance 85% 11 13
Juvenile Justice 85% 23 27
Public Health 75% 9 12
Special Education 86% 25 29
Substance Abuse 77% 10 13
Type
State Leader 84% 26 31
County Leader 77% 137 179
Provider 82% 49 60
Providers
Mental Health 82% 37 45
Non-mental Health 80% 12 15
System Gains in improving Mental Health Services for Children and youth Reported by System leaders and Providers
System leaders were asked to discuss gains that they felt were made in their system with regard to improving mental health functioning for children and youth . System leaders and providers were asked to identify populations which they served well and did not serve well . Data from interviews with system leaders and providers form the basis for the analysis on children and youth that systems serve well and those they struggle to serve both in the study counties and in the state as a whole .
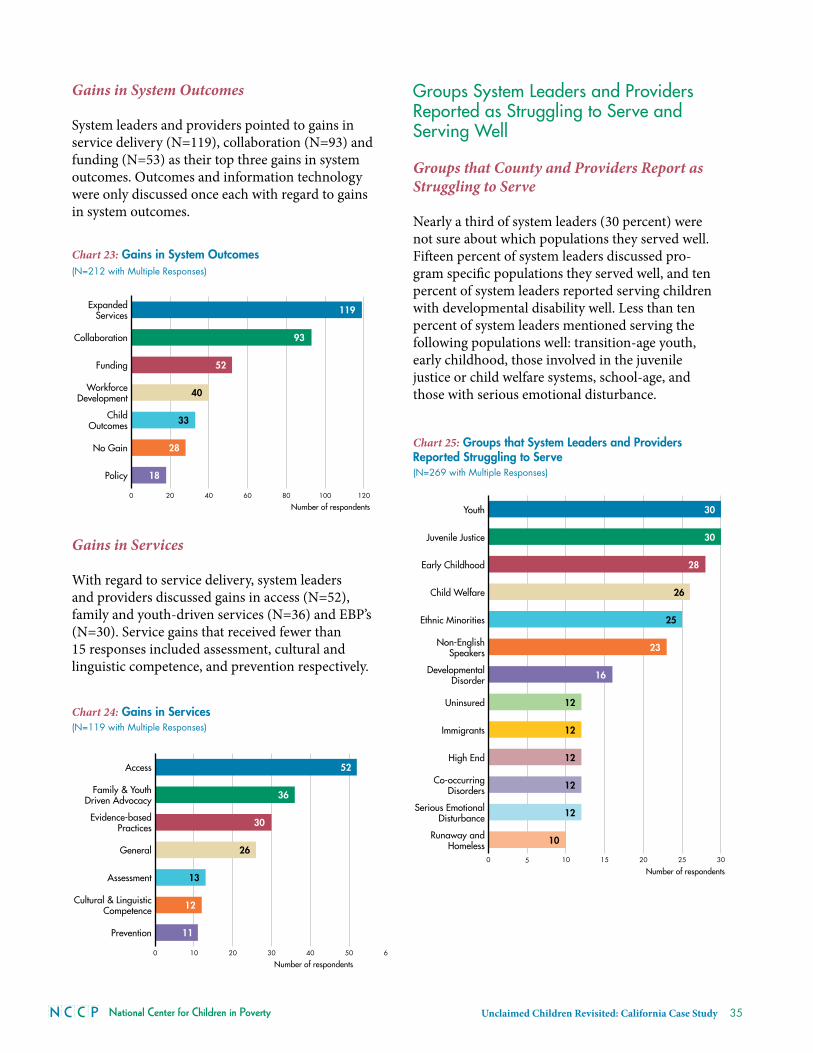
National Center for Children in Poverty Unclaimed Children Revisited: California Case Study 35
Gains in System Outcomes
System leaders and providers pointed to gains in service delivery (N=119), collaboration (N=93) and funding (N=53) as their top three gains in system outcomes . Outcomes and information technology were only discussed once each with regard to gains in system outcomes .
Gains in Services
With regard to service delivery, system leaders and providers discussed gains in access (N=52), family and youth-driven services (N=36) and EBp’s (N=30) . Service gains that received fewer than 15 responses included assessment, cultural and linguistic competence, and prevention respectively .
Groups System leaders and Providers Reported as Struggling to Serve and Serving Well
Groups that County and Providers Report as Struggling to Serve
Nearly a third of system leaders (30 percent) were not sure about which populations they served well . Fifteen percent of system leaders discussed pro-gram specific populations they served well, and ten percent of system leaders reported serving children with developmental disability well . Less than ten percent of system leaders mentioned serving the following populations well: transition-age youth, early childhood, those involved in the juvenile justice or child welfare systems, school-age, and those with serious emotional disturbance .
Chart 23: Gains in System Outcomes (N=212 with Multiple Responses)
0 20 40 60 80 100 120
Policy
No Gain
ChildOutcomes
WorkforceDevelopment
Funding
Collaboration
ExpandedServices
18
28
33
40
52
93
119
Number of respondents
Chart 24: Gains in Services(N=119 with Multiple Responses)
0 10 20 30 40 50 60
Prevention
Cultural & LinguisticCompetence
Assessment
General
Evidence-basedPractices
Family & YouthDriven Advocacy
Access
11
12
13
26
30
36
52
Number of respondents
Chart 25: Groups that System Leaders and Providers Reported Struggling to Serve(N=269 with Multiple Responses)
0 5 10 15 20 25 30
Runaway andHomeless
Serious EmotionalDisturbance
Co-occurringDisorders
High End
Immigrants
Uninsured
DevelopmentalDisorder
Non-EnglishSpeakers
Ethnic Minorities
Child Welfare
Early Childhood
Juvenile Justice
Youth
10
12
12
12
12
12
16
23
25
26
28
30
30
Number of respondents
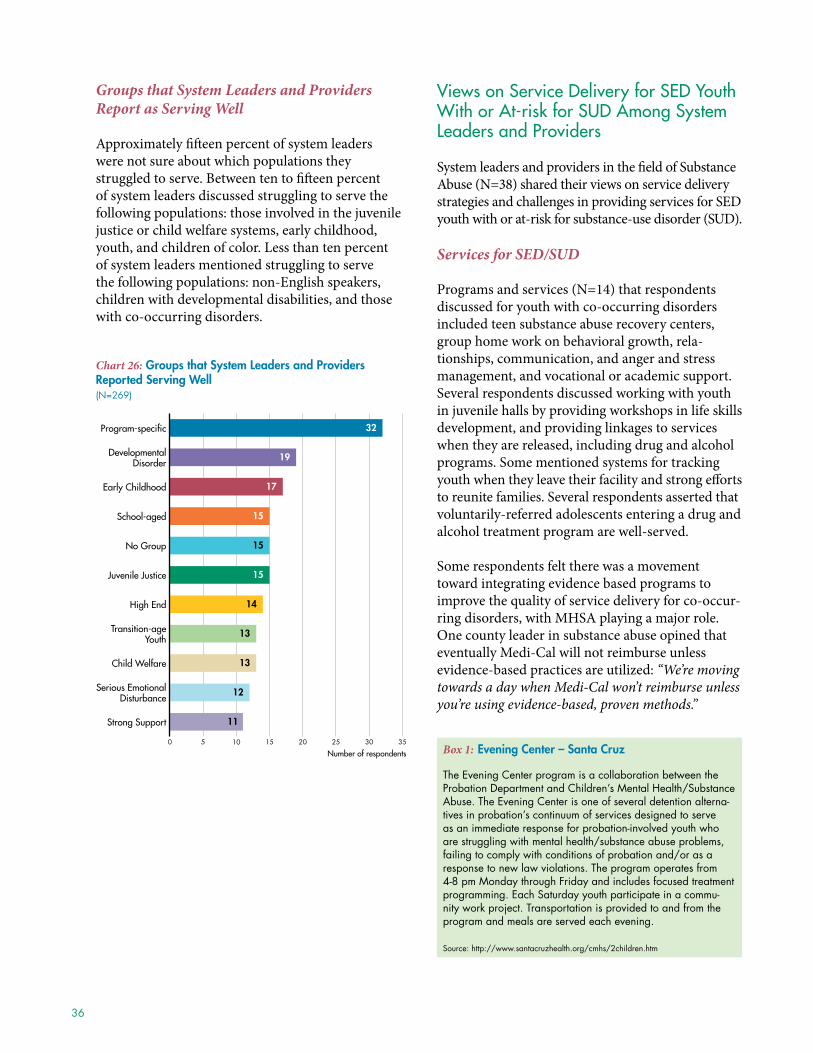
36
Groups that System Leaders and Providers Report as Serving Well
approximately fifteen percent of system leaders were not sure about which populations they struggled to serve . Between ten to fifteen percent of system leaders discussed struggling to serve the following populations: those involved in the juvenile justice or child welfare systems, early childhood, youth, and children of color . Less than ten percent of system leaders mentioned struggling to serve the following populations: non-English speakers, children with developmental disabilities, and those with co-occurring disorders .
views on Service delivery for Sed youth With or At-risk for SUd Among System leaders and Providers
System leaders and providers in the field of Substance abuse (N=38) shared their views on service delivery strategies and challenges in providing services for SED youth with or at-risk for substance-use disorder (SuD) .
Services for SED/SUD
programs and services (N=14) that respondents discussed for youth with co-occurring disorders included teen substance abuse recovery centers, group home work on behavioral growth, rela-tionships, communication, and anger and stress management, and vocational or academic support . Several respondents discussed working with youth in juvenile halls by providing workshops in life skills development, and providing linkages to services when they are released, including drug and alcohol programs . Some mentioned systems for tracking youth when they leave their facility and strong efforts to reunite families . Several respondents asserted that voluntarily-referred adolescents entering a drug and alcohol treatment program are well-served .
Some respondents felt there was a movement toward integrating evidence based programs to improve the quality of service delivery for co-occur-ring disorders, with mhSa playing a major role . One county leader in substance abuse opined that eventually medi-cal will not reimburse unless evidence-based practices are utilized: “We’re moving towards a day when Medi-Cal won’t reimburse unless you’re using evidence-based, proven methods.”
Chart 26: Groups that System Leaders and Providers Reported Serving Well(N=269)
0 5 10 15 20 25 30 35
Strong Support
Serious EmotionalDisturbance
Child Welfare
Transition-ageYouth
High End
Juvenile Justice
No Group
School-aged
Early Childhood
DevelopmentalDisorder
Program-specific
11
12
13
13
14
15
15
15
17
19
32
Number of respondents Box 1: Evening Center – santa Cruz
The Evening Center program is a collaboration between the Probation Department and Children’s Mental Health/Substance Abuse. The Evening Center is one of several detention alterna-tives in probation’s continuum of services designed to serve as an immediate response for probation-involved youth who are struggling with mental health/substance abuse problems, failing to comply with conditions of probation and/or as a response to new law violations. The program operates from 4-8 pm Monday through Friday and includes focused treatment programming. Each Saturday youth participate in a commu-nity work project. Transportation is provided to and from the program and meals are served each evening.
Source: http://www.santacruzhealth.org/cmhs/2children.htm
National Center for Children in Poverty Unclaimed Children Revisited: California Case Study 37
Several respondents discussed broad based substance abuse prevention strategies for school-age youth, including substance abuse prevention programs in schools, mentoring programs, leadership develop-ment and targeting at-risk youth for early interven-tion . a county leader in substance abuse discussed development of strategic action plans to prevent alcohol or drug use: “We have a prevention frame-work focused entirely on environmental prevention. This is one of the prevention strategies involving policy change, social marketing, ordinances. Engaging kids to be able to identify these things and give them tools to recognize them on tv, ads, etc.”
respondents discussing collaboration (N=12) with substance abuse and other agencies were over-whelmingly positive in their responses, including better linkages and coordination with probation and juvenile justice and other systems . Other collaborative efforts included task force coalitions, interagency service planning and integration with behavioral health services among others . responses regarding substance abuse and mental health service collaboration were mixed . Some felt there was strong integration and others felt there was room for improvement between mental health and substance abuse services, as the systems are not as integrated or sufficient as they should be .
Challenges in Service Delivery for SED/SUD
respondents discussing challenges (N=15) in service delivery for youth with co-occurring disorders mentioned that the system continues to struggle with the population . treatment gaps in services for youth with co-occurring disorders persist . Limited resources are available to fund programs, especially for transition-age youth with co-occurring mental health problems . respondents discussed shortages of residential services for co-occurring youth, stating there are waiting lists to enter residential facilities . There was mention of financial constraints in the inability to bill medi-cal for substance abuse treatment services .
respondents discussed staffing shortages and capacity issues (N=10) in addressing co-occurring and dually-diagnosed disorders and mentioned that there are trainings being implemented to improve the proficiency of providers . There was mention of
mhSa funding helping to expand training to make providers “co-occurring capable” and increase their ability to integrate mental health and alcohol or drug abuse treatment and prevention . Still others discussed that there is a shortage of providers with the expertise to deal with substance-abusing mental health clients, as well as a shortage of providers who can address the culturally linguistic needs of the dually-diagnosed population .
Several respondents pointed to the issue of inap-propriate identification of needed services for substance-abusing youth, who are often referred to only mental health services, as mentioned by a county leader in substance abuse: “For chil-dren needing mental health services, the process of receiving appropriate treatment happens more often. The process of identifying the needs and getting the appropriate assistance for individuals with substance abuse is less effective.”
Some respondents discussed the negative impact on children with parents who are imprisoned for drug use offenses . The Substance abuse crime preven-tion act (Sacpa)/prop . 36, passed in November 2000, addressed the issue of alternatives to incarcer-ation for substance abusing individuals (see box) .
Box 2: The substance abuse Crime Prevention act (saCPa)/Prop. 36
Under SACPA, first or second time non-violent adult drug offenders who use, possess, or transport illegal drugs for personal use will receive drug treatment rather than incarcera-tion. Implementation of SACPA has required a new model of collaboration between the criminal justice system and public health agencies to promote treatment as a more appropriate and effective alternative for illegal drug use. SACPA was designed to:
• preserve jail and prison cells for serious and violent offenders;
• enhance public safety by reducing drug-related crime; and
• improve public health by reducing drug abuse through proven and effective treatment strategies.
Eligible offenders may receive up to one year of drug treatment and six months of aftercare. Treatment must be provided in a program licensed or certified by the state. The courts may sanc-tion offenders who are not amenable to treatment. Vocational training, family counseling, literacy training, and other services may also be provided. Upon completion of successful drug treatment, participants may petition the sentencing court for dismissal of charges.
Source: http://www.adp.cahwnet.gov/SACPA/overview.shtml
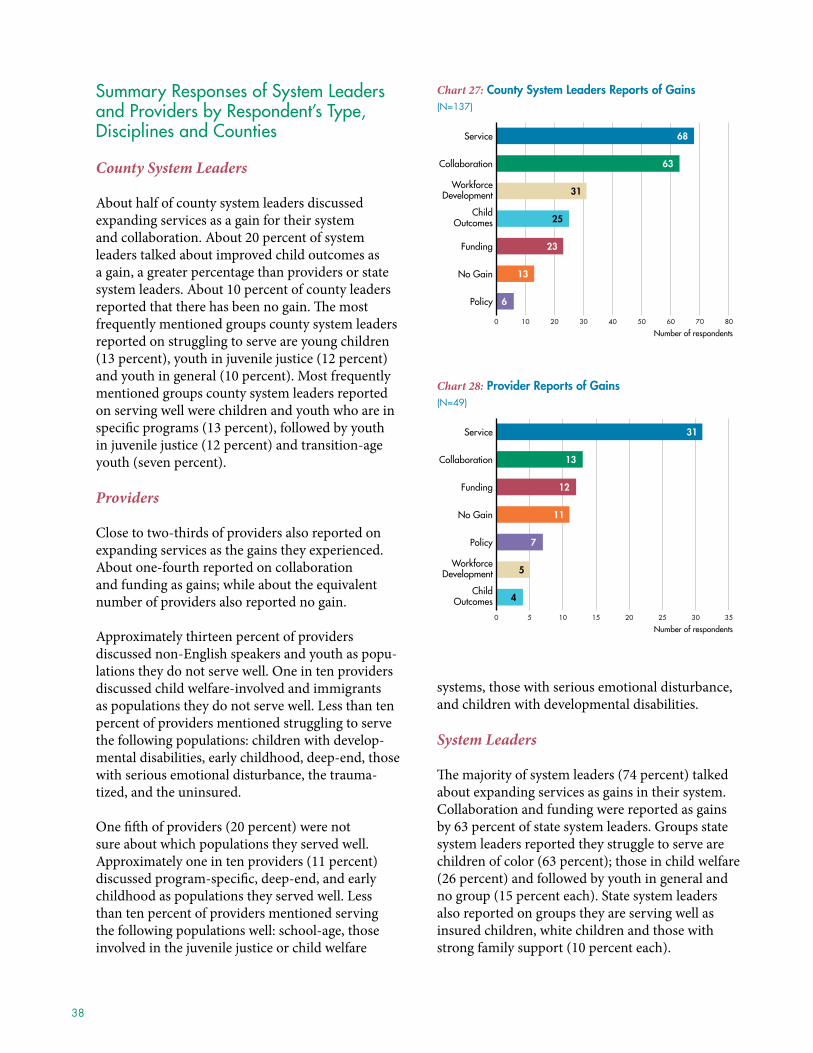
38
Summary Responses of System leaders and Providers by Respondent’s Type, disciplines and Counties
County System Leaders
about half of county system leaders discussed expanding services as a gain for their system and collaboration . about 20 percent of system leaders talked about improved child outcomes as a gain, a greater percentage than providers or state system leaders . about 10 percent of county leaders reported that there has been no gain . The most frequently mentioned groups county system leaders reported on struggling to serve are young children (13 percent), youth in juvenile justice (12 percent) and youth in general (10 percent) . most frequently mentioned groups county system leaders reported on serving well were children and youth who are in specific programs (13 percent), followed by youth in juvenile justice (12 percent) and transition-age youth (seven percent) .
Providers
close to two-thirds of providers also reported on expanding services as the gains they experienced . about one-fourth reported on collaboration and funding as gains; while about the equivalent number of providers also reported no gain .
approximately thirteen percent of providers discussed non-English speakers and youth as popu-lations they do not serve well . One in ten providers discussed child welfare-involved and immigrants as populations they do not serve well . Less than ten percent of providers mentioned struggling to serve the following populations: children with develop-mental disabilities, early childhood, deep-end, those with serious emotional disturbance, the trauma-tized, and the uninsured .
One fifth of providers (20 percent) were not sure about which populations they served well . approximately one in ten providers (11 percent) discussed program-specific, deep-end, and early childhood as populations they served well . Less than ten percent of providers mentioned serving the following populations well: school-age, those involved in the juvenile justice or child welfare
systems, those with serious emotional disturbance, and children with developmental disabilities .
System Leaders
The majority of system leaders (74 percent) talked about expanding services as gains in their system . collaboration and funding were reported as gains by 63 percent of state system leaders . Groups state system leaders reported they struggle to serve are children of color (63 percent); those in child welfare (26 percent) and followed by youth in general and no group (15 percent each) . State system leaders also reported on groups they are serving well as insured children, white children and those with strong family support (10 percent each) .
Chart 27: County System Leaders Reports of Gains (N=137)
0 10 20 30 40 50 60 70 80
Policy
No Gain
Funding
ChildOutcomes
WorkforceDevelopment
Collaboration
Service
6
13
23
25
31
63
68
Number of respondents
Chart 28: Provider Reports of Gains (N=49)
0 5 10 15 20 25 30 35
ChildOutcomes
WorkforceDevelopment
Policy
No Gain
Funding
Collaboration
Service
4
5
7
11
12
13
31
Number of respondents
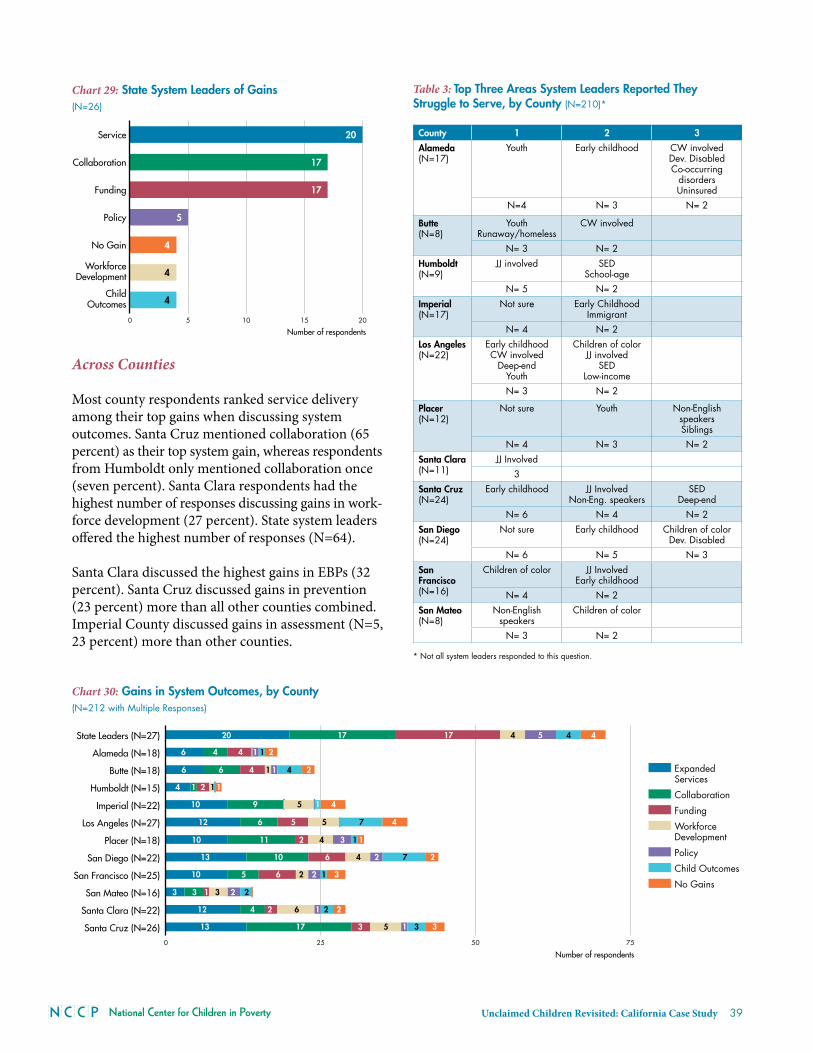
National Center for Children in Poverty Unclaimed Children Revisited: California Case Study 39
Across Counties
most county respondents ranked service delivery among their top gains when discussing system outcomes . Santa cruz mentioned collaboration (65 percent) as their top system gain, whereas respondents from humboldt only mentioned collaboration once (seven percent) . Santa clara respondents had the highest number of responses discussing gains in work-force development (27 percent) . State system leaders offered the highest number of responses (N=64) .
Santa clara discussed the highest gains in EBps (32 percent) . Santa cruz discussed gains in prevention (23 percent) more than all other counties combined . imperial county discussed gains in assessment (N=5, 23 percent) more than other counties .
Chart 29: State System Leaders of Gains (N=26)
0 5 10 15 20
ChildOutcomes
WorkforceDevelopment
No Gain
Policy
Funding
Collaboration
Service
4
4
4
5
17
17
20
Number of respondents
Chart 30: Gains in System Outcomes, by County (N=212 with Multiple Responses)
0 25 50 75
No Gains
Child Outcomes
Policy
Workforce Development
Funding
Collaboration
Expanded ServicesSanta Cruz (N=26)
Santa Clara (N=22)
San Mateo (N=16)
San Francisco (N=25)
San Diego (N=22)
Placer (N=18)
Los Angeles (N=27)
Imperial (N=22)
Humboldt (N=15)
Butte (N=18)
Alameda (N=18)
State Leaders (N=27)
0 25 50 75
Santa Cruz (N=26)
Santa Clara (N=22)
San Mateo (N=16)
San Francisco (N=25)
San Diego (N=22)
Placer (N=18)
Los Angeles (N=27)
Imperial (N=22)
Humboldt (N=15)
Butte (N=18)
Alameda (N=18)
State Leaders (N=27)
Expanded Services
Collaboration
Funding
Workforce Development
Policy
Child Outcomes
No Gains
20 17 17 4 5 4 4
6 4 4 11 2
6 6 4 1 1 4 2
4 1 2 1 1
10 9 5 1 4
12 6 5 5 7 4
10 11 2 4 3 1 1
13 10 6 4 2 7 2
10 5 6 2 2 1 3
3 3 1 3 2 2
12 4 2 6 1 2 2
13 17 3 5 3 31
Number of respondents
Table 3: Top Three areas system leaders Reported They struggle to serve, by County (N=210)*
County 1 2 3
alameda(N=17)
Youth Early childhood CW involvedDev. DisabledCo-occurring
disordersUninsured
N=4 N= 3 N= 2
Butte(N=8)
YouthRunaway/homeless
CW involved
N= 3 N= 2humboldt(N=9)
JJ involved SEDSchool-age
N= 5 N= 2imperial(N=17)
Not sure Early ChildhoodImmigrant
N= 4 N= 2los angeles(N=22)
Early childhoodCW involved
Deep-endYouth
Children of colorJJ involved
SED Low-income
N= 3 N= 2
Placer(N=12)
Not sure Youth Non-English speakersSiblings
N= 4 N= 3 N= 2santa Clara(N=11)
JJ Involved3
santa Cruz(N=24)
Early childhood JJ InvolvedNon-Eng. speakers
SEDDeep-end
N= 6 N= 4 N= 2san diego(N=24)
Not sure Early childhood Children of colorDev. Disabled
N= 6 N= 5 N= 3san francisco(N=16)
Children of color JJ InvolvedEarly childhood
N= 4 N= 2san Mateo(N=8)
Non-English speakers
Children of color
N= 3 N= 2
* Not all system leaders responded to this question.

40
Table 4: Top Three areas that system leaders Reported serving Well, by County (N=210)
County 1 2 3
alameda(N=11)
School-ageProgram-specific
Not sure
CW involvedDev. Disabled
N=3 N=2Butte(N=5)
No oneN=2
humboldt(N=11)
TAY Not sure Program-specific
N=4 N=3 N=2imperial(N=16)
Not sure Children of colorDev. DisabledLow-income
N=6 N=2los angeles(N=14)
Not sure Deep endProgram-specific
JJ InvolvedNo one
N=7 N=3 N=2
Placer(N=5)
Not sure School-age children Program-specificN=4 N=3 N=2
santa Clara(N=12)
Not sure No one Program-specificDev. Disabled
N=4 N=3 N=2santa Cruz(N=23)
JJ Involved Dev. DisabledProgram-specific
TAY
Deep-end SED
Not sureN=5 N=3 N=2
san diego(N=25)
Program-specificNot sure
Early childhood Children of colorDev. Disabled
N=5 N=5 N=3san francisco(N=15)
Children of color CW involvedEarly childhoodProgram-specific
N=4 N=2san Mateo(N=7)
Early childhoodN=3
Table 5: source of Referral of County alcohol and drug services among Children under 18, by County
County 1st 2nd 3rd
imperial(N=493)
Individual (Self-referral)
School/Education
Alcohol/Drug abuse program
419 (85%) 57 (12%) 7 (1%)santa Clara(N=636)
Non-SACPA Court/Criminal
Justice
School/Education
Individual (Self-referral)
297 (47%) 127 (20%) 123 (19%)santa Cruz(N=521)
School/Education
Individual (Self-referral)
Non-SACPA Court / Criminal
Justice305 (59%) 87 (17%) 5 (1%)
san diego(N=1,452)
Non-SACPA Court/Criminal
Justice
Individual (Self-referral)
Comprehensive Drug Court
Implementation (CDCI)
695 (48%) 282 (19%) 101 (7%)san francisco(N=324)
Non-SACPA Court/Criminal
Justice
School/Education
Other Community Referral
142 (44%) 69 (21%) 69 (21%)san Mateo(N=743)
Juvenile Drug Court/Juvenile
Probation
Non-SACPA Court/Criminal
Justice
Individual (Self-referral)
376 (51%) 172 (23%) 55 (7%)
Source: The California Outcome Measuring System (Cal-OMS). Data collected only in six of the 11 case study counties.
Chart 31: Gains in Services, by County (N=265 with Multiple Responses)
0 10 20 30 40
Santa Cruz (N=26)
Santa Clara (N=22)
San Mateo (N=16)
San Francisco (N=25)
San Diego (N=22)
Placer (N=18)
Los Angeles (N=27)
Imperial (N=22)
Humboldt (N=15)
Butte (N=18)
Alameda (N=18)
Expanded Services
Collaboration
Funding
Workforce Development
Policy
0 10 20 30 40
Policy
Workforce Development
Funding
Collaboration
Expanded Services
Santa Cruz (N=26)
Santa Clara (N=22)
San Mateo (N=16)
San Francisco (N=25)
San Diego (N=22)
Placer (N=18)
Los Angeles (N=27)
Imperial (N=22)
Humboldt (N=15)
Butte (n=18)
Alameda (N=18)
6 4 4 1
6 6 4 1 1
4 1 2 1
10 9 5
12 6 5 5
10 11 2 4 3
13 10 6 4 2
10 5 6 2 2
3 3 1 3 2
12 4 2 6 1
13 17 3 5 1
Number of respondents
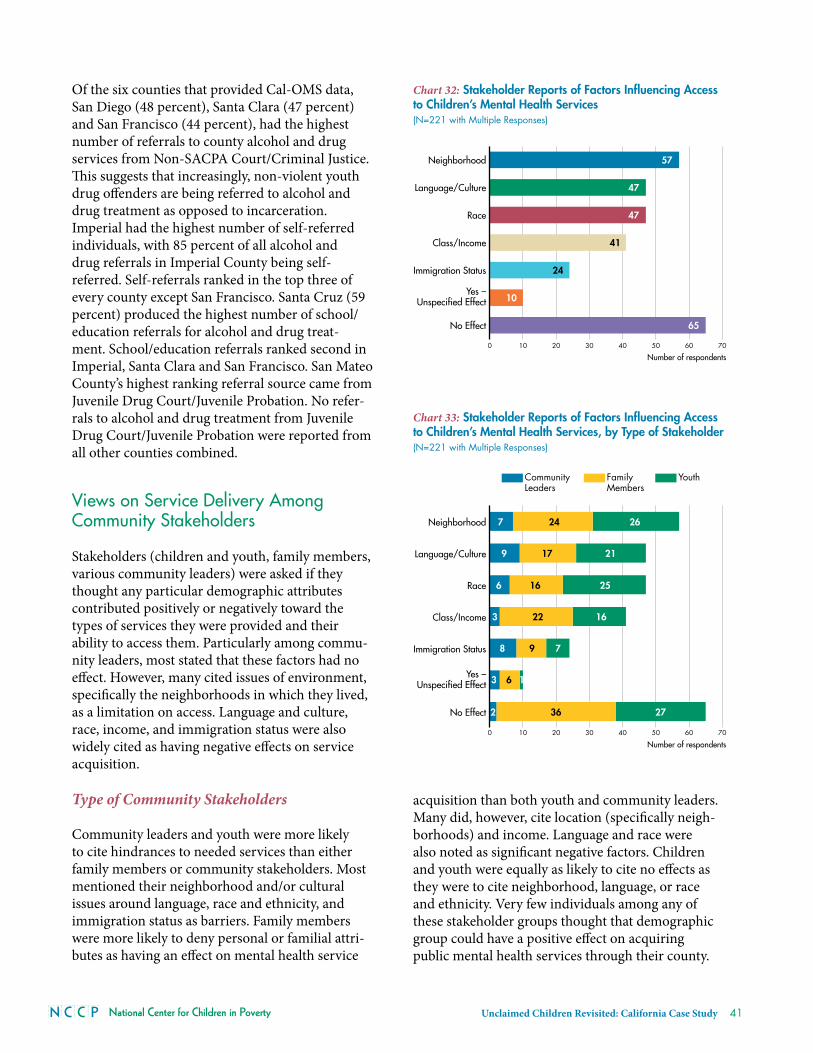
National Center for Children in Poverty Unclaimed Children Revisited: California Case Study 41
Of the six counties that provided cal-OmS data, San Diego (48 percent), Santa clara (47 percent) and San Francisco (44 percent), had the highest number of referrals to county alcohol and drug services from Non-Sacpa court/criminal Justice . This suggests that increasingly, non-violent youth drug offenders are being referred to alcohol and drug treatment as opposed to incarceration . imperial had the highest number of self-referred individuals, with 85 percent of all alcohol and drug referrals in imperial county being self-referred . Self-referrals ranked in the top three of every county except San Francisco . Santa cruz (59 percent) produced the highest number of school/education referrals for alcohol and drug treat-ment . School/education referrals ranked second in imperial, Santa clara and San Francisco . San mateo county’s highest ranking referral source came from Juvenile Drug court/Juvenile probation . No refer-rals to alcohol and drug treatment from Juvenile Drug court/Juvenile probation were reported from all other counties combined .
views on Service delivery Among Community Stakeholders
Stakeholders (children and youth, family members, various community leaders) were asked if they thought any particular demographic attributes contributed positively or negatively toward the types of services they were provided and their ability to access them . particularly among commu-nity leaders, most stated that these factors had no effect . however, many cited issues of environment, specifically the neighborhoods in which they lived, as a limitation on access . Language and culture, race, income, and immigration status were also widely cited as having negative effects on service acquisition .
Type of Community Stakeholders
community leaders and youth were more likely to cite hindrances to needed services than either family members or community stakeholders . most mentioned their neighborhood and/or cultural issues around language, race and ethnicity, and immigration status as barriers . Family members were more likely to deny personal or familial attri-butes as having an effect on mental health service
acquisition than both youth and community leaders . many did, however, cite location (specifically neigh-borhoods) and income . Language and race were also noted as significant negative factors . children and youth were equally as likely to cite no effects as they were to cite neighborhood, language, or race and ethnicity . very few individuals among any of these stakeholder groups thought that demographic group could have a positive effect on acquiring public mental health services through their county .
Chart 32: Stakeholder Reports of Factors Influencing Access to Children’s Mental Health Services(N=221 with Multiple Responses)
0 10 20 30 40 50 60 70
No Effect
Yes –Unspecified Effect
Immigration Status
Class/Income
Race
Language/Culture
Neighborhood
65
10
24
41
47
47
57
Number of respondents
Chart 33: Stakeholder Reports of Factors Influencing Access to Children’s Mental Health Services, by Type of Stakeholder(N=221 with Multiple Responses)
0 10 20 30 40 50 60 70
YouthFamily Members
Community Leaders
No Effect
Yes –Unspecified Effect
Immigration Status
Class/Income
Race
Language/Culture
Neighborhood 7 24 26
9 17 21
6 16 25
3 22 16
8 9 7
3 6 1
2 36 27
Number of respondents

42
Wait Times Among County Mental Health Service Users
The majority of community stakeholders reported timely access to mental health services . community stakeholders were also asked how long they usually have to wait for needed mental health assistance . about half of the stakeholders who answered the questions said that they are able to receive services quickly or within two weeks . about one in five said that they have to wait more than three months .
community leaders recognized the tremendous variation in wait time for services . about one-third (32 percent) stated that young mental health services users receive needed services quickly or within two weeks . Nearly one- third (28 percent) stated that the wait is usually more than three months, while a number of the remaining community leaders said that it is dependent on the service and situation . a similar response pattern was seen among the family members interviewed . however, youth respondents were more likely to report shorter wait times . half (52 percent) described waiting periods of fewer than two weeks, while only 11 percent cited more than three months .
Chart 34: Wait Times Experienced by Stakeholders(N=319 Respondents)
0 30 60 90 120 150
Not sure/No experience
Depends on theservice & illustration
More than3 months
1 to 3 months
2 to 4 weeks
Quick/Within2 weeks
32
46
53
16
33
139
Number of respondents
Chart 35: Wait Times Experienced by Stakeholders, by Type of Stakeholder(N=319 Respondents)
0 30 60 90 120 150
YouthFamily Members
Community Leaders
Not sure/No experience
Depends on theservice & illustration
More than3 months
1 to 3 months
2 to 4 weeks
Quick/Within2 weeks
8 50 81
2 19 12
4 9 3
7 29 17
3 14 29
1 16 15
Number of respondents

National Center for Children in Poverty Unclaimed Children Revisited: California Case Study 43
Chapter Summary
in california, the majority of county mental health service users under age 25 are school-age . While research has shown that approximately six percent of california’s school-age children have mental health problems, administrative data show that less than two percent are utilizing county mental health services . While counties have experienced growing success in servicing this group, too many have needs that remain unmet . unfortunately, young children and transition-age youth are even more vulnerable as providers and county system leaders struggle to serve them .
When system leaders were asked about the gains that they saw in improving mental health func-tioning in youth, they reported system outcome gains in service delivery, collaboration, funding and workforce development . Findings were fairly consistent across counties in mentioning these four areas as gains .
System leaders reported service gains in service access, family and youth-driven advocacy, and evidence based practices . There was slightly more variation across counties in the discussion of service gains .
an interesting finding is that about a third of system leaders and one-fifth of providers reported not being sure of which populations they serve well . This may suggest a level of uncertainty about the ability to service public mental health services users in general . The top populations system leaders and providers mentioned serving well included program specific and youth with developmental disabilities . The highest number of system leaders reported being unsure about which populations they strug-gled to serve, although those that did pointed to struggles to serve juvenile justice involved, early childhood and youth in general . providers report struggles to serve non-English speakers and youth in general .
When stakeholders were asked about their experi-ence in receiving services, many cited issues of environment, language and culture, race, income, and immigration status as having negative effects on service acquisition . Family members and youth report a greater likelihood of using informal systems support networks rather than relying on profes-sionals . however, they also report brief waiting periods, when seeking professional help, with the majority of stakeholders reporting that they are able to receive services quickly or within two weeks . This suggests that when children and youth enter treat-ment, access to services is timely . Further, children and youth with deep-end system involvement are most likely to be served well .
Policy Recommendations
The state of California and counties should:♦ establish baseline data on who they serve and
outcomes for children and youth;♦ widely disseminate data on their child and youth
users and their outcomes;♦ create targeted strategies to enhance services to
children and youth with co-occurring disorders;♦ develop targeted interventions and engagement
strategies for youth they find difficult to serve appropriately;
♦ evaluate access to services for youth with substance use disorders and develop a plan for sustaining funding and supports for services to this population; and
♦ develop strategies to assist counties with advanced mental health systems and supports in juvenile justice to showcase these strategies, and provide peer mentorships for other systems that struggle to serve these youth appropriately .
44
CHAPTeR 4
Research-informed Services (evidence-based Practices)
Setting the Context: Why evidence-based Practices?
in the quest for quality mental health services for children and youth, implementation of evidence-based practices (EBps) has emerged as a major strategy among policymakers for attaining optimal service quality . Efforts to improve quality compel attention to increasing service capacity . Specifically, national data suggest that many children and youths do not receive needed services27, 28 and often get care that is considered suboptimal . 29, 30, 31 The california Department of mental health estimates that approximately 300,000 children and youths with mental health conditions are not receiving the care that they need .32
in children’s mental health services research, the term EBps refers to scientific-based knowledge about service practices and provides “a shorthand term that denotes the quality, robustness, or validity of scientific evidence as it is brought to bear on these issues .”33 While states have been in a posi-tion to lead the effort in implementing EBps, they face many challenges in adopting EBps in large systems .34 These challenges center around work-force, organizational capacity, factors that facilitate practice fidelity and consistency, and cultural and linguistic relevance .35, 36
This chapter draws upon three datasets to lay out the dominant themes, key concepts, and indi-vidual contributions on the implementation status of evidence-based practices . The datasets derive from interviews with system leaders, providers, community leaders, family members, and youths as well as online survey responses from youths and family members . Drawing from responses from system leaders and providers, we examine these stakeholders’ reactions to and perspectives on factors that promote or hinder efforts to improve
quality through the use of evidence-based practices . investigators sought to understand what respon-dents thought about evidence-based practices, how they assessed efforts to implement evidence-based practices, what strategies they could identify, and what barriers existed to implementation . The data culled from interviews with family members, youths, and community leaders shed light on family members’, youths’, and community leaders’ knowl-edge and attitudes toward evidence-based practices .
Box 3: Quick facts: Mental health services act (Mhsa) and Mandate for Evidence-based Practices
A mandate in MHSA exists for “innovative programs,” designed to:21
• improve access to the underserved;
• enhance service quality and improve outcomes;
• increase access to services; and
• advance cross system collaboration.
Even a framework document developed by Mental Health Oversight Accountability Commission that defines innovation does not specifically reference evidence-based practices.23 According to a state progress report on MHSA, however, it appears many counties have interpreted the mandate for service-quality improvement to be a mandate to implement evidence-based practices.24
Box 4: Evidence-based Practices
Tool or intervention based on knowledge generated through a process that:
• randomly assigns study participants into treatment and control groups;
• specifies population of focus;
• follows a prescribed way of implementation (sometimes by manual);
• possesses multiple outcome measures; and
• renders statistically significant differences between treatment and control groups that are replicable.37

National Center for Children in Poverty Unclaimed Children Revisited: California Case Study 45
Policy Towards EBPs in the State of California
The promotion of evidence-based practices on a statewide basis has generally occurred through two major vehicles . The first includes both state and county funding for the california institute of mental health (cimh) to disseminate informa-tion on EBps . The second involves various efforts by academic institutions across the state to develop centers of excellence in partnership with communi-ties and where communities with federal funding, mainly through System of care, have sought to impact practice .
The california institute for mental health, with state and some county funding, is a leading agency in EBp implementation in the state’s public mental health system . The institute’s work in the area of EBps began in 200138 with the release of
“Values-Driven Evidence-Based Practices Initiatives.” The report focused on principles associated with recovery and wellness, cultural competence, and family-driven care and aimed to combine these principles with scientific knowledge-based research to improve the mental health and service systems in california .39
Prior Research and Research Questions
research suggests that california’s efforts to imple-ment effective practices can be assisted by an understanding of those factors that impede uptake and those that sustain continuous learning to improve practice . in particular, research has identi-fied leaders’ and providers’ attitudes as critical to the adoption of evidence-based practices .40, 41 recent studies have pointed to the role of system leaders and policymakers in disseminating new knowledge and increasing use rates of empirically supported practice .42 meanwhile, research also reveals barriers to implementation of evidence-based practices, including tension between fidelity and community modifications, the clear mismatch between provider preparation and expectations of evidence-based practice, and large variation in the ability to trans-port EBps from one setting to another .43 a growing body of research also links the knowledge and atti-tudes of family members and consumers not only to quality efforts in general but specifically to the use of evidence-based practices .44, 45 in light of this body of evidence and in order to better understand the status of EBp implementation in california, the study investigators asked the following questions: ♦ What are the overall views towards EBps among
system leaders and providers? ♦ What major strategies do county and state agen-
cies use in promoting EBps? ♦ What common barriers do county leaders and
providers face in the uptake of EBps? ♦ What do youth and families know about EBps?
Box 5: Values-driven Evidence-based Practices
The initiative’s goals include:
• Disseminate information about EBPs to youth (consumers), family members, service providers, managers, and admin-istrators so that each of these groups can participate in fully-informed decision-making;
• Prioritize youth (consumers) and family voices, cultural competency, and proven effectiveness in the selection and adaptation of new practices; and
• Adequately support practitioners, managers, and administra-tors through a “comprehensive implementation process.”
Thus, this state-funded initiative emphasizes the roles of multiple players in EBP implementation.
California Institute of Mental Health’s (CiMH) current approach is using “the Community Development Team” (CDT) model, a multi-level training and technical assistance strategy. As part of CiMH values driven evidence-based practices implementation projects, they are supporting the following EBPs:
• Multidimensional Treatment Foster Care (MDTFC);
• Functional Family Therapy (FFT);
• Teaching Pro-social Skills (including Aggression Replacement Training curriculum);
• Multidimensional Family Therapy (MDFT);
• Depression Treatment Quality Improvement (DTQI);
• Wraparound;
• Incredible Years (IY);
• Trauma Focused Cognitive Behavioral Therapy (TFCBT); and
• Multisystemic Therapy (MST).
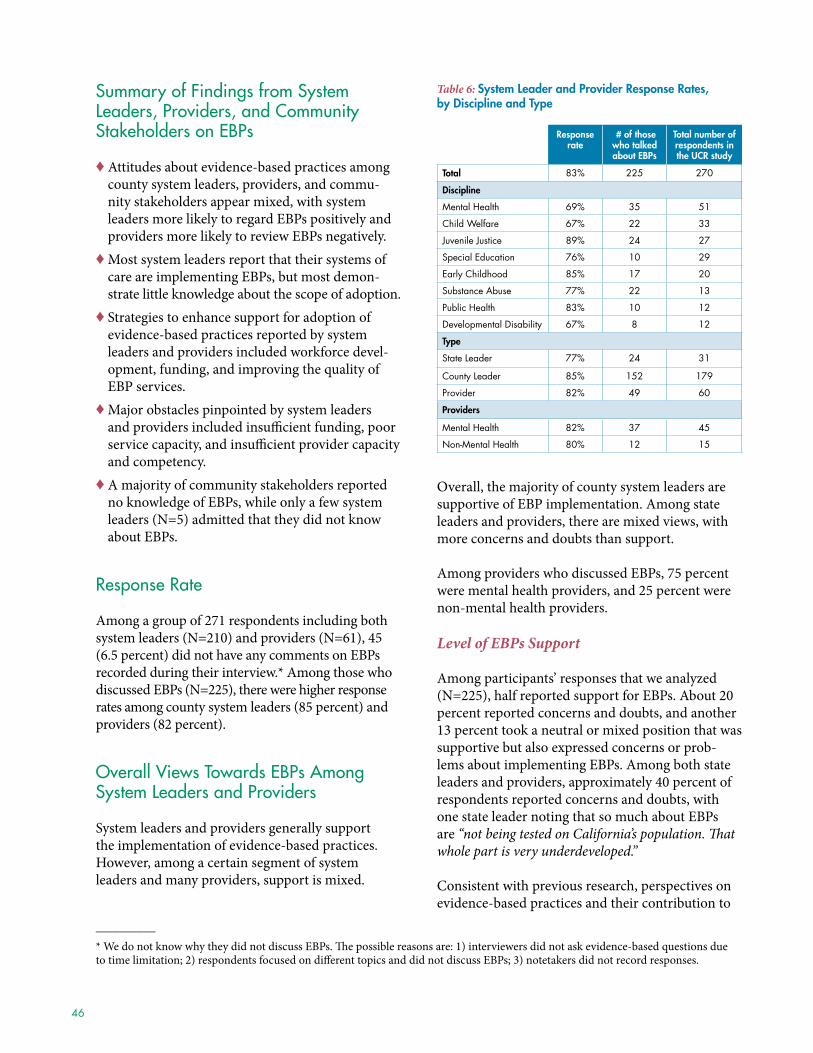
46
Summary of Findings from System leaders, Providers, and Community Stakeholders on eBPs
♦ attitudes about evidence-based practices among county system leaders, providers, and commu-nity stakeholders appear mixed, with system leaders more likely to regard EBps positively and providers more likely to review EBps negatively .
♦ most system leaders report that their systems of care are implementing EBps, but most demon-strate little knowledge about the scope of adoption .
♦ Strategies to enhance support for adoption of evidence-based practices reported by system leaders and providers included workforce devel-opment, funding, and improving the quality of EBp services .
♦ major obstacles pinpointed by system leaders and providers included insufficient funding, poor service capacity, and insufficient provider capacity and competency .
♦ a majority of community stakeholders reported no knowledge of EBps, while only a few system leaders (N=5) admitted that they did not know about EBps .
Response Rate
among a group of 271 respondents including both system leaders (N=210) and providers (N=61), 45 (6 .5 percent) did not have any comments on EBps recorded during their interview .* among those who discussed EBps (N=225), there were higher response rates among county system leaders (85 percent) and providers (82 percent) .
Overall views Towards eBPs Among System leaders and Providers
System leaders and providers generally support the implementation of evidence-based practices . however, among a certain segment of system leaders and many providers, support is mixed .
Overall, the majority of county system leaders are supportive of EBp implementation . among state leaders and providers, there are mixed views, with more concerns and doubts than support .
among providers who discussed EBps, 75 percent were mental health providers, and 25 percent were non-mental health providers .
Level of EBPs Support
among participants’ responses that we analyzed (N=225), half reported support for EBps . about 20 percent reported concerns and doubts, and another 13 percent took a neutral or mixed position that was supportive but also expressed concerns or prob-lems about implementing EBps . among both state leaders and providers, approximately 40 percent of respondents reported concerns and doubts, with one state leader noting that so much about EBps are “not being tested on California’s population. That whole part is very underdeveloped.”
consistent with previous research, perspectives on evidence-based practices and their contribution to
Table 6: system leader and Provider Response Rates, by discipline and Type
Response rate
# of those who talked about EBPs
Total number of respondents in the uCR study
Total 83% 225 270
discipline
Mental Health 69% 35 51
Child Welfare 67% 22 33
Juvenile Justice 89% 24 27
Special Education 76% 10 29
Early Childhood 85% 17 20
Substance Abuse 77% 22 13
Public Health 83% 10 12
Developmental Disability 67% 8 12
Type
State Leader 77% 24 31
County Leader 85% 152 179
Provider 82% 49 60
Providers
Mental Health 82% 37 45
Non-Mental Health 80% 12 15
__________* We do not know why they did not discuss EBps . The possible reasons are: 1) interviewers did not ask evidence-based questions due to time limitation; 2) respondents focused on different topics and did not discuss EBps; 3) notetakers did not record responses .
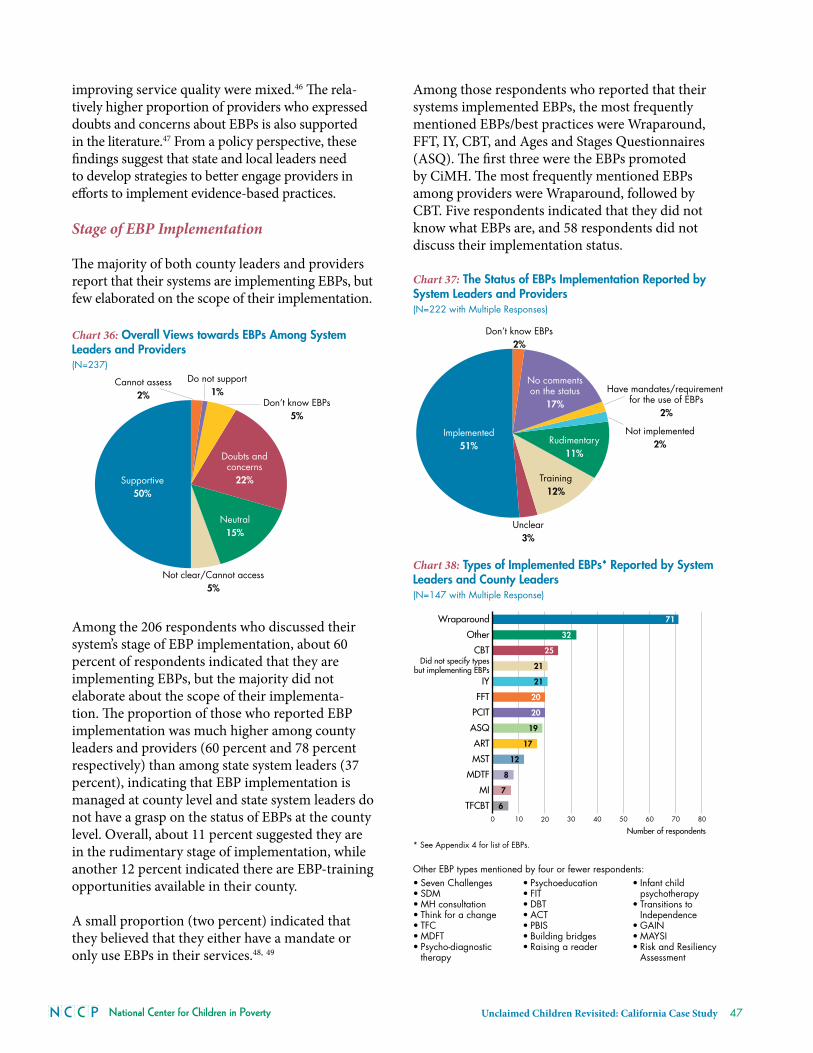
National Center for Children in Poverty Unclaimed Children Revisited: California Case Study 47
improving service quality were mixed .46 The rela-tively higher proportion of providers who expressed doubts and concerns about EBps is also supported in the literature .47 From a policy perspective, these findings suggest that state and local leaders need to develop strategies to better engage providers in efforts to implement evidence-based practices .
Stage of EBP Implementation
The majority of both county leaders and providers report that their systems are implementing EBps, but few elaborated on the scope of their implementation .
among the 206 respondents who discussed their system’s stage of EBp implementation, about 60 percent of respondents indicated that they are implementing EBps, but the majority did not elaborate about the scope of their implementa-tion . The proportion of those who reported EBp implementation was much higher among county leaders and providers (60 percent and 78 percent respectively) than among state system leaders (37 percent), indicating that EBp implementation is managed at county level and state system leaders do not have a grasp on the status of EBps at the county level . Overall, about 11 percent suggested they are in the rudimentary stage of implementation, while another 12 percent indicated there are EBp-training opportunities available in their county .
a small proportion (two percent) indicated that they believed that they either have a mandate or only use EBps in their services .48, 49
among those respondents who reported that their systems implemented EBps, the most frequently mentioned EBps/best practices were Wraparound, FFt, iy, cBt, and ages and Stages Questionnaires (aSQ) . The first three were the EBps promoted by cimh . The most frequently mentioned EBps among providers were Wraparound, followed by cBt . Five respondents indicated that they did not know what EBps are, and 58 respondents did not discuss their implementation status .
Chart 36: Overall Views towards EBPs Among System Leaders and Providers (N=237)
Supportive50%
Not clear/Cannot access5%
Neutral15%
Doubts andconcerns
22%
Don’t know EBPs5%
Do not support1%
Cannot assess2%
Chart 37: The Status of EBPs Implementation Reported by System Leaders and Providers (N=222 with Multiple Responses)
Implemented51%
Unclear3%
Training12%
Rudimentary11%
Not implemented2%
Have mandates/requirement for the use of EBPs
2%
No commentson the status
17%
Don’t know EBPs2%
Other EBP types mentioned by four or fewer respondents:• Seven Challenges• SDM• MH consultation• Think for a change• TFC• MDFT• Psycho-diagnostic
therapy
• Psychoeducation• FIT• DBT• ACT• PBIS• Building bridges• Raising a reader
• Infant child psychotherapy
• Transitions to Independence
• GAIN • MAYSI• Risk and Resiliency
Assessment
Chart 38: Types of Implemented EBPs* Reported by System Leaders and County Leaders (N=147 with Multiple Response)
0 10 20 30 40 50 60 70 80
TFCBT
MI
MDTF
MST
ART
ASQ
PCIT
FFT
IY
Did not specify typesbut implementing EBPs
CBT
Other
Wraparound
6
7
8
12
17
19
20
20
21
21
25
32
71
Number of respondents
* See Appendix 4 for list of EBPs.
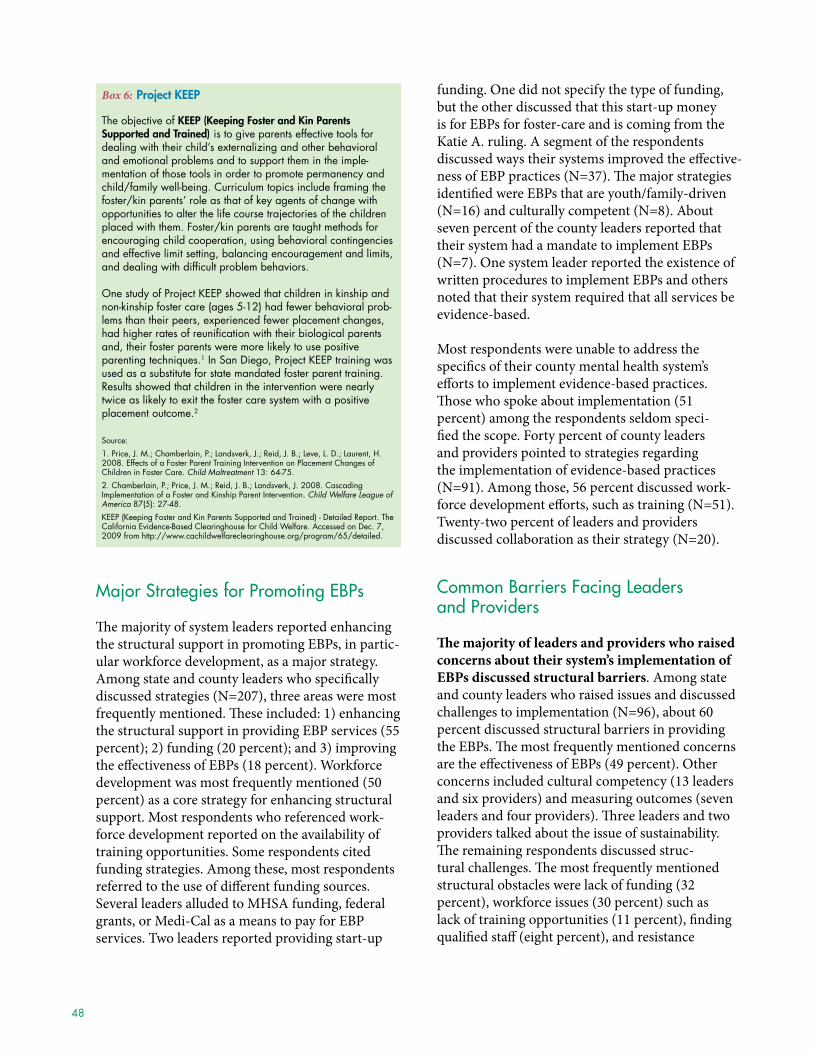
48
Major Strategies for Promoting eBPs
The majority of system leaders reported enhancing the structural support in promoting EBps, in partic-ular workforce development, as a major strategy . among state and county leaders who specifically discussed strategies (N=207), three areas were most frequently mentioned . These included: 1) enhancing the structural support in providing EBp services (55 percent); 2) funding (20 percent); and 3) improving the effectiveness of EBps (18 percent) . Workforce development was most frequently mentioned (50 percent) as a core strategy for enhancing structural support . most respondents who referenced work-force development reported on the availability of training opportunities . Some respondents cited funding strategies . among these, most respondents referred to the use of different funding sources . Several leaders alluded to mhSa funding, federal grants, or medi-cal as a means to pay for EBp services . two leaders reported providing start-up
funding . One did not specify the type of funding, but the other discussed that this start-up money is for EBps for foster-care and is coming from the Katie a . ruling . a segment of the respondents discussed ways their systems improved the effective-ness of EBp practices (N=37) . The major strategies identified were EBps that are youth/family-driven (N=16) and culturally competent (N=8) . about seven percent of the county leaders reported that their system had a mandate to implement EBps (N=7) . One system leader reported the existence of written procedures to implement EBps and others noted that their system required that all services be evidence-based .
most respondents were unable to address the specifics of their county mental health system’s efforts to implement evidence-based practices . Those who spoke about implementation (51 percent) among the respondents seldom speci-fied the scope . Forty percent of county leaders and providers pointed to strategies regarding the implementation of evidence-based practices (N=91) . among those, 56 percent discussed work-force development efforts, such as training (N=51) . twenty-two percent of leaders and providers discussed collaboration as their strategy (N=20) .
Common Barriers Facing leaders and Providers
The majority of leaders and providers who raised concerns about their system’s implementation of EBPs discussed structural barriers . among state and county leaders who raised issues and discussed challenges to implementation (N=96), about 60 percent discussed structural barriers in providing the EBps . The most frequently mentioned concerns are the effectiveness of EBps (49 percent) . Other concerns included cultural competency (13 leaders and six providers) and measuring outcomes (seven leaders and four providers) . Three leaders and two providers talked about the issue of sustainability . The remaining respondents discussed struc-tural challenges . The most frequently mentioned structural obstacles were lack of funding (32 percent), workforce issues (30 percent) such as lack of training opportunities (11 percent), finding qualified staff (eight percent), and resistance
Box 6: Project KEEP
The objective of KEEP (Keeping foster and Kin Parents supported and Trained) is to give parents effective tools for dealing with their child’s externalizing and other behavioral and emotional problems and to support them in the imple-mentation of those tools in order to promote permanency and child/family well-being. Curriculum topics include framing the foster/kin parents’ role as that of key agents of change with opportunities to alter the life course trajectories of the children placed with them. Foster/kin parents are taught methods for encouraging child cooperation, using behavioral contingencies and effective limit setting, balancing encouragement and limits, and dealing with difficult problem behaviors.
One study of Project KEEP showed that children in kinship and non-kinship foster care (ages 5-12) had fewer behavioral prob-lems than their peers, experienced fewer placement changes, had higher rates of reunification with their biological parents and, their foster parents were more likely to use positive parenting techniques.1 In San Diego, Project KEEP training was used as a substitute for state mandated foster parent training. Results showed that children in the intervention were nearly twice as likely to exit the foster care system with a positive placement outcome.2
Source:
1. Price, J. M.; Chamberlain, P.; Landsverk, J.; Reid, J. B.; Leve, L. D.; Laurent, H. 2008. Effects of a Foster Parent Training Intervention on Placement Changes of Children in Foster Care. Child Maltreatment 13: 64-75.
2. Chamberlain, P.; Price, J. M.; Reid, J. B.; Landsverk, J. 2008. Cascading Implementation of a Foster and Kinship Parent Intervention. Child Welfare League of America 87(5): 27-48.
KEEP (Keeping Foster and Kin Parents Supported and Trained) - Detailed Report. The California Evidence-Based Clearinghouse for Child Welfare. Accessed on Dec. 7, 2009 from http://www.cachildwelfareclearinghouse.org/program/65/detailed.
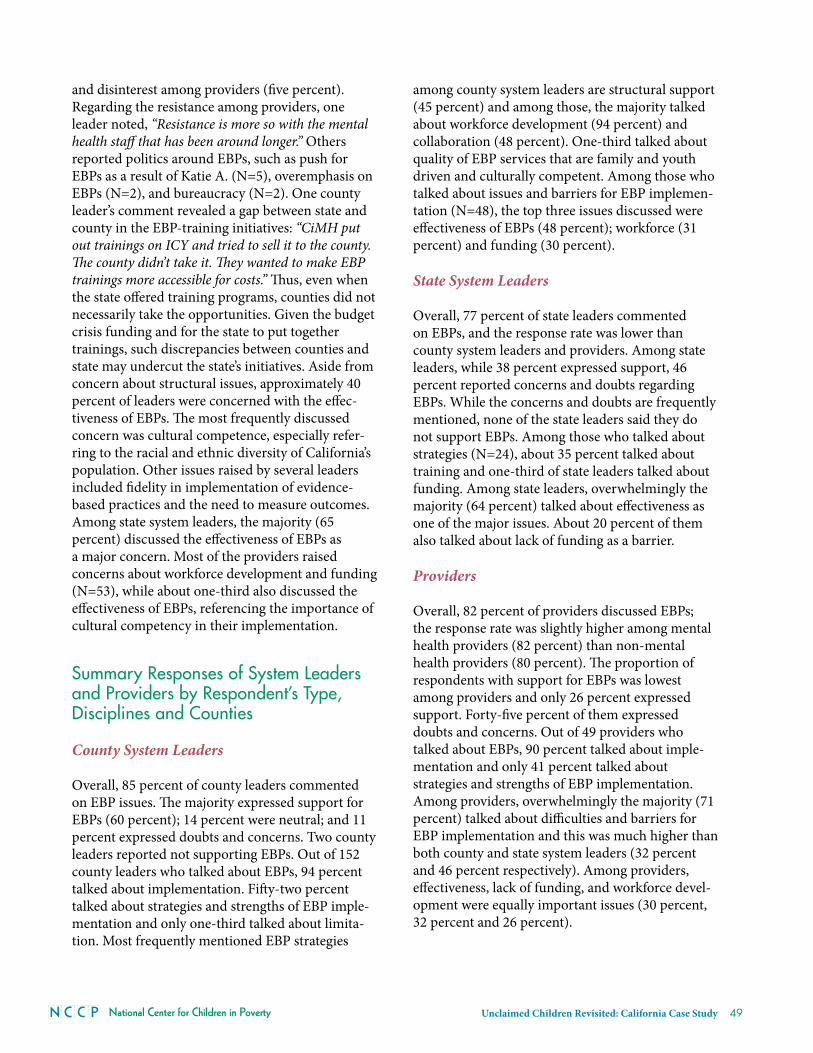
National Center for Children in Poverty Unclaimed Children Revisited: California Case Study 49
and disinterest among providers (five percent) . regarding the resistance among providers, one leader noted, “Resistance is more so with the mental health staff that has been around longer.” Others reported politics around EBps, such as push for EBps as a result of Katie a . (N=5), overemphasis on EBps (N=2), and bureaucracy (N=2) . One county leader’s comment revealed a gap between state and county in the EBp-training initiatives: “CiMH put out trainings on ICY and tried to sell it to the county. The county didn’t take it. They wanted to make EBP trainings more accessible for costs.” Thus, even when the state offered training programs, counties did not necessarily take the opportunities . Given the budget crisis funding and for the state to put together trainings, such discrepancies between counties and state may undercut the state’s initiatives . aside from concern about structural issues, approximately 40 percent of leaders were concerned with the effec-tiveness of EBps . The most frequently discussed concern was cultural competence, especially refer-ring to the racial and ethnic diversity of california’s population . Other issues raised by several leaders included fidelity in implementation of evidence-based practices and the need to measure outcomes . among state system leaders, the majority (65 percent) discussed the effectiveness of EBps as a major concern . most of the providers raised concerns about workforce development and funding (N=53), while about one-third also discussed the effectiveness of EBps, referencing the importance of cultural competency in their implementation .
Summary Responses of System leaders and Providers by Respondent’s Type, disciplines and Counties
County System Leaders
Overall, 85 percent of county leaders commented on EBp issues . The majority expressed support for EBps (60 percent); 14 percent were neutral; and 11 percent expressed doubts and concerns . two county leaders reported not supporting EBps . Out of 152 county leaders who talked about EBps, 94 percent talked about implementation . Fifty-two percent talked about strategies and strengths of EBp imple-mentation and only one-third talked about limita-tion . most frequently mentioned EBp strategies
among county system leaders are structural support (45 percent) and among those, the majority talked about workforce development (94 percent) and collaboration (48 percent) . One-third talked about quality of EBp services that are family and youth driven and culturally competent . among those who talked about issues and barriers for EBp implemen-tation (N=48), the top three issues discussed were effectiveness of EBps (48 percent); workforce (31 percent) and funding (30 percent) .
State System Leaders
Overall, 77 percent of state leaders commented on EBps, and the response rate was lower than county system leaders and providers . among state leaders, while 38 percent expressed support, 46 percent reported concerns and doubts regarding EBps . While the concerns and doubts are frequently mentioned, none of the state leaders said they do not support EBps . among those who talked about strategies (N=24), about 35 percent talked about training and one-third of state leaders talked about funding . among state leaders, overwhelmingly the majority (64 percent) talked about effectiveness as one of the major issues . about 20 percent of them also talked about lack of funding as a barrier . Providers
Overall, 82 percent of providers discussed EBps; the response rate was slightly higher among mental health providers (82 percent) than non-mental health providers (80 percent) . The proportion of respondents with support for EBps was lowest among providers and only 26 percent expressed support . Forty-five percent of them expressed doubts and concerns . Out of 49 providers who talked about EBps, 90 percent talked about imple-mentation and only 41 percent talked about strategies and strengths of EBp implementation . among providers, overwhelmingly the majority (71 percent) talked about difficulties and barriers for EBp implementation and this was much higher than both county and state system leaders (32 percent and 46 percent respectively) . among providers, effectiveness, lack of funding, and workforce devel-opment were equally important issues (30 percent, 32 percent and 26 percent) .
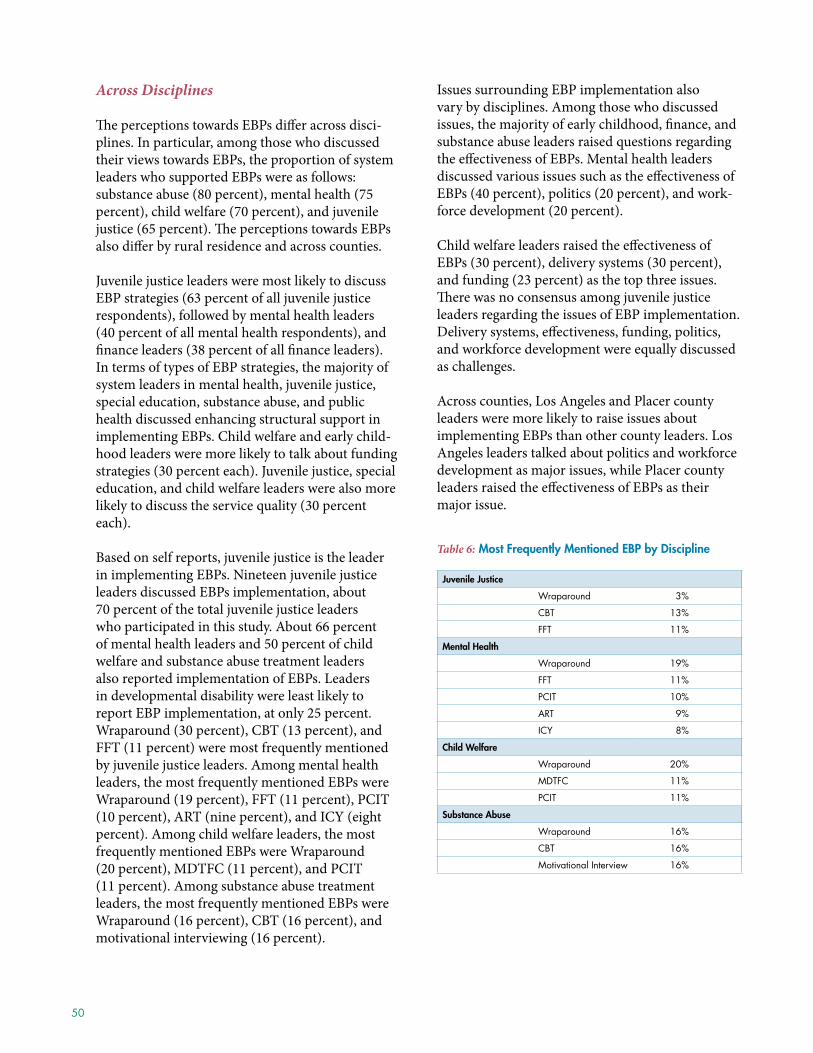
50
Across Disciplines
The perceptions towards EBps differ across disci-plines . in particular, among those who discussed their views towards EBps, the proportion of system leaders who supported EBps were as follows: substance abuse (80 percent), mental health (75 percent), child welfare (70 percent), and juvenile justice (65 percent) . The perceptions towards EBps also differ by rural residence and across counties .
Juvenile justice leaders were most likely to discuss EBp strategies (63 percent of all juvenile justice respondents), followed by mental health leaders (40 percent of all mental health respondents), and finance leaders (38 percent of all finance leaders) . in terms of types of EBp strategies, the majority of system leaders in mental health, juvenile justice, special education, substance abuse, and public health discussed enhancing structural support in implementing EBps . child welfare and early child-hood leaders were more likely to talk about funding strategies (30 percent each) . Juvenile justice, special education, and child welfare leaders were also more likely to discuss the service quality (30 percent each) .
Based on self reports, juvenile justice is the leader in implementing EBps . Nineteen juvenile justice leaders discussed EBps implementation, about 70 percent of the total juvenile justice leaders who participated in this study . about 66 percent of mental health leaders and 50 percent of child welfare and substance abuse treatment leaders also reported implementation of EBps . Leaders in developmental disability were least likely to report EBp implementation, at only 25 percent . Wraparound (30 percent), cBt (13 percent), and FFt (11 percent) were most frequently mentioned by juvenile justice leaders . among mental health leaders, the most frequently mentioned EBps were Wraparound (19 percent), FFt (11 percent), pcit (10 percent), art (nine percent), and icy (eight percent) . among child welfare leaders, the most frequently mentioned EBps were Wraparound (20 percent), mDtFc (11 percent), and pcit (11 percent) . among substance abuse treatment leaders, the most frequently mentioned EBps were Wraparound (16 percent), cBt (16 percent), and motivational interviewing (16 percent) .
issues surrounding EBp implementation also vary by disciplines . among those who discussed issues, the majority of early childhood, finance, and substance abuse leaders raised questions regarding the effectiveness of EBps . mental health leaders discussed various issues such as the effectiveness of EBps (40 percent), politics (20 percent), and work-force development (20 percent) . child welfare leaders raised the effectiveness of EBps (30 percent), delivery systems (30 percent), and funding (23 percent) as the top three issues . There was no consensus among juvenile justice leaders regarding the issues of EBp implementation . Delivery systems, effectiveness, funding, politics, and workforce development were equally discussed as challenges .
across counties, Los angeles and placer county leaders were more likely to raise issues about implementing EBps than other county leaders . Los angeles leaders talked about politics and workforce development as major issues, while placer county leaders raised the effectiveness of EBps as their major issue .
Table 6: Most frequently Mentioned EBP by discipline
Juvenile Justice
Wraparound 3%
CBT 13%
FFT 11%
Mental health
Wraparound 19%
FFT 11%
PCIT 10%
ART 9%
ICY 8%
Child Welfare
Wraparound 20%
MDTFC 11%
PCIT 11%
substance abuse
Wraparound 16%
CBT 16%
Motivational Interview 16%
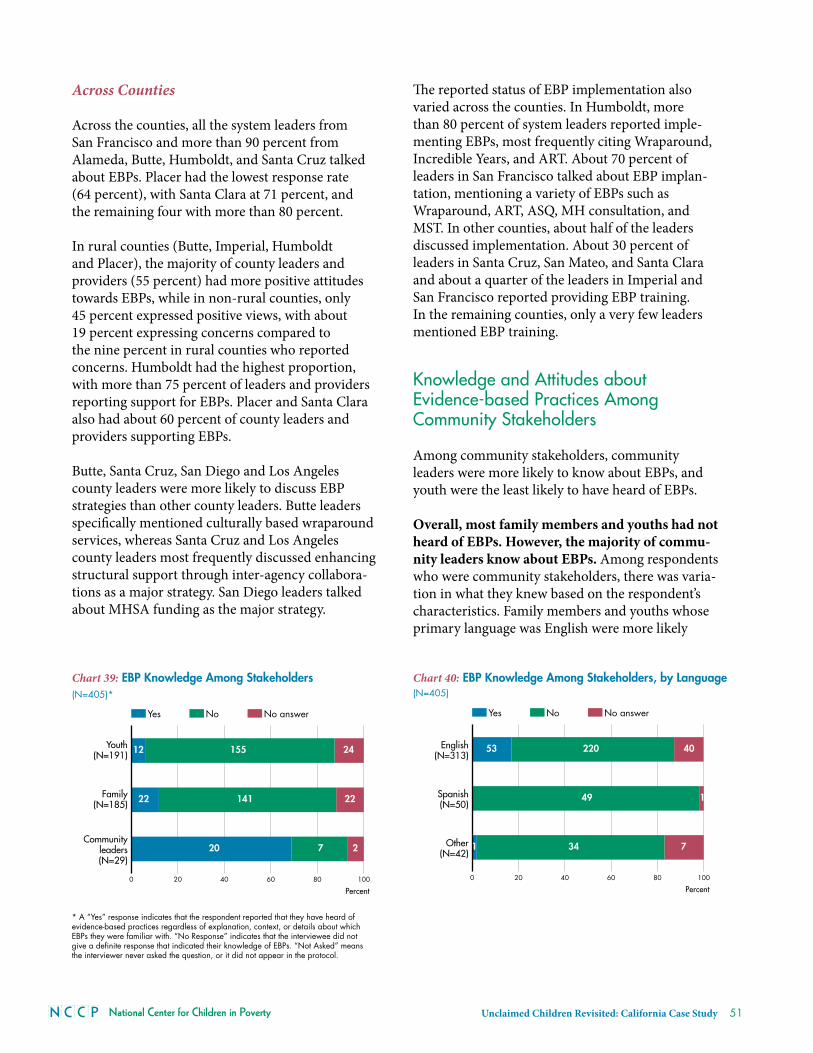
National Center for Children in Poverty Unclaimed Children Revisited: California Case Study 51
Across Counties
across the counties, all the system leaders from San Francisco and more than 90 percent from alameda, Butte, humboldt, and Santa cruz talked about EBps . placer had the lowest response rate (64 percent), with Santa clara at 71 percent, and the remaining four with more than 80 percent .
in rural counties (Butte, imperial, humboldt and placer), the majority of county leaders and providers (55 percent) had more positive attitudes towards EBps, while in non-rural counties, only 45 percent expressed positive views, with about 19 percent expressing concerns compared to the nine percent in rural counties who reported concerns . humboldt had the highest proportion, with more than 75 percent of leaders and providers reporting support for EBps . placer and Santa clara also had about 60 percent of county leaders and providers supporting EBps .
Butte, Santa cruz, San Diego and Los angeles county leaders were more likely to discuss EBp strategies than other county leaders . Butte leaders specifically mentioned culturally based wraparound services, whereas Santa cruz and Los angeles county leaders most frequently discussed enhancing structural support through inter-agency collabora-tions as a major strategy . San Diego leaders talked about mhSa funding as the major strategy .
The reported status of EBp implementation also varied across the counties . in humboldt, more than 80 percent of system leaders reported imple-menting EBps, most frequently citing Wraparound, incredible years, and art . about 70 percent of leaders in San Francisco talked about EBp implan-tation, mentioning a variety of EBps such as Wraparound, art, aSQ, mh consultation, and mSt . in other counties, about half of the leaders discussed implementation . about 30 percent of leaders in Santa cruz, San mateo, and Santa clara and about a quarter of the leaders in imperial and San Francisco reported providing EBp training . in the remaining counties, only a very few leaders mentioned EBp training .
Knowledge and Attitudes about evidence-based Practices Among Community Stakeholders
among community stakeholders, community leaders were more likely to know about EBps, and youth were the least likely to have heard of EBps .
Overall, most family members and youths had not heard of EBPs. However, the majority of commu-nity leaders know about EBPs. among respondents who were community stakeholders, there was varia-tion in what they knew based on the respondent’s characteristics . Family members and youths whose primary language was English were more likely
Chart 39: EBP Knowledge Among Stakeholders (N=405)*
0 20 40 60 80 100
No answerNoYes
Communityleaders(N=29)
Family(N=185)
Youth(N=191)
* A “Yes” response indicates that the respondent reported that they have heard of evidence-based practices regardless of explanation, context, or details about which EBPs they were familiar with. “No Response” indicates that the interviewee did not give a definite response that indicated their knowledge of EBPs. “Not Asked” means the interviewer never asked the question, or it did not appear in the protocol.
20
22
12
7
141
155
2
22
24
Percent
Chart 40: EBP Knowledge Among Stakeholders, by Language (N=405)
0 20 40 60 80 100
No answerNoYes
Other(N=42)
Spanish(N=50)
English(N=313)
1
53
34
49
220
7
1
40
Percent
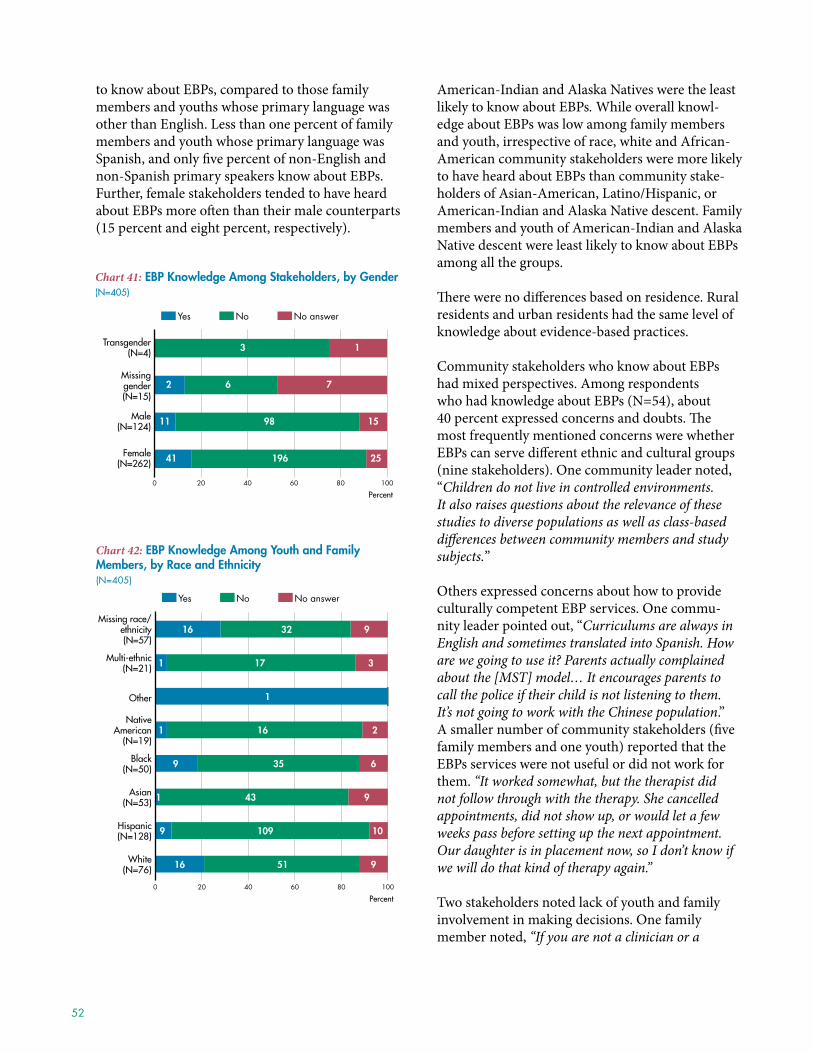
52
to know about EBps, compared to those family members and youths whose primary language was other than English . Less than one percent of family members and youth whose primary language was Spanish, and only five percent of non-English and non-Spanish primary speakers know about EBps . Further, female stakeholders tended to have heard about EBps more often than their male counterparts (15 percent and eight percent, respectively) .
american-indian and alaska Natives were the least likely to know about EBps. While overall knowl-edge about EBps was low among family members and youth, irrespective of race, white and african-american community stakeholders were more likely to have heard about EBps than community stake-holders of asian-american, Latino/hispanic, or american-indian and alaska Native descent . Family members and youth of american-indian and alaska Native descent were least likely to know about EBps among all the groups .
There were no differences based on residence . rural residents and urban residents had the same level of knowledge about evidence-based practices .
community stakeholders who know about EBps had mixed perspectives . among respondents who had knowledge about EBps (N=54), about 40 percent expressed concerns and doubts . The most frequently mentioned concerns were whether EBps can serve different ethnic and cultural groups (nine stakeholders) . One community leader noted, “Children do not live in controlled environments. It also raises questions about the relevance of these studies to diverse populations as well as class-based differences between community members and study subjects.”
Others expressed concerns about how to provide culturally competent EBp services . One commu-nity leader pointed out, “Curriculums are always in English and sometimes translated into Spanish. How are we going to use it? Parents actually complained about the [MST] model… It encourages parents to call the police if their child is not listening to them. It’s not going to work with the Chinese population .” a smaller number of community stakeholders (five family members and one youth) reported that the EBps services were not useful or did not work for them . “It worked somewhat, but the therapist did not follow through with the therapy. She cancelled appointments, did not show up, or would let a few weeks pass before setting up the next appointment. Our daughter is in placement now, so I don’t know if we will do that kind of therapy again.”
two stakeholders noted lack of youth and family involvement in making decisions . One family member noted, “If you are not a clinician or a
Chart 41: EBP Knowledge Among Stakeholders, by Gender (N=405)
0 20 40 60 80 100
No answerNoYes
Female(N=262)
Male(N=124)
Missinggender(N=15)
Transgender(N=4)
41
11
2
196
98
6
3
25
15
7
1
Percent
Chart 42: EBP Knowledge Among Youth and Family Members, by Race and Ethnicity (N=405)
0 20 40 60 80 100
No answerNoYes
White(N=76)
Hispanic(N=128)
Asian(N=53)
Black(N=50)
NativeAmerican
(N=19)
Other
Multi-ethnic(N=21)
Missing race/ethnicity(N=57)
16
9
1
9
1
1
1
16
51
109
43
35
16
17
32
9
10
9
6
2
3
9
Percent

National Center for Children in Poverty Unclaimed Children Revisited: California Case Study 53
therapist, you cannot get in. Families and kids need someone who listens to them, rather [than] tell them what to do.” Nearly one-fifth of community stake-holders (17 .8 percent) had positive opinions about EBps and found them helpful or were supportive of EBp use . One youth noted, “I experienced therapy using CBT…Over a period of three days, it helps empower you to deal with your problems. I found the therapy on my own…I would recommend it to youth who have problems and issues.” a smaller number of respondents (N=16) expressed no opin-ions regarding EBps, and eight respondents took a neutral position .
Chapter Summary
county system leaders were less likely to reflect negatively about the use of EBps, compared to providers or state system leaders . Overall, youths and family members that we interviewed had little knowledge about EBps, indicating either that the youths and family members we interviewed did not receive EBps or they are not well-informed about treatments that they are receiving . in particular, ethnic minorities were least likely to know about EBps . community leaders were more aware of EBps, but many had mixed views . among commu-nity stakeholders (family members, community leaders, and youth) who knew about EBps, fully two-fifths expressed concerns and doubts about EBps . providers were more likely than either community stakeholders or system leaders to consider EBps in a negative light . a common thread in the concerns about EBps was the potential impact on individuals from diverse cultural and linguistic backgrounds .
about 60 percent of respondents who discussed EBps are implementing them, suggesting that california system leaders and providers are indeed incorporating EBps in their service-delivery systems . however, the scope often seems rather limited . The status of EBp implementation also varies by discipline and county .
The major strategy identified for EBp implementa-tion was workforce development, indicating that counties are still in the process of developing a workforce that will be able to provide effective EBps . a major obstacle to the promotion and adoption
of EBps is the state’s inability to accurately track or incentivize their use, as discussed in chapter 7 on financing .
community leaders, providers, and system leaders raised questions about the cultural competence of EBp services, suggesting that cultural competency is one of the major challenges to its adoption, given the diversity of california’s population, a topic that is further discussed in chapter 6 on culturally and linguistically competent services . Overall, juve-nile justice has the highest percentage of leaders discussing EBp implementation, followed by mental health and child welfare . humboldt had the highest proportion of system leaders and providers discussing the implementation of EBps, followed by imperial and San Diego leaders and providers .
Recommendations
The state of California and counties should:♦ track and measure effectiveness and monitor or
improve program implementation as an integral part of EBp implementation . This should include developing outcomes for children, youth and their families and indicators based on selected interventions;
♦ develop a mechanism for reaching consensus on fiscal ways to support implementation of EBps;
♦ expand workforce competencies in EBps in general and include a focus on culturally and linguistically appropriate EBps and adapted strategies;
♦ increase technical assistance and supports on EBps, the implementation of EBps and county specific contexts for optimal adoption for providers;
♦ develop incentives to implement EBps (include adequate reimbursement to cover costs associated with implementation and engagement strategies);
♦ reach out to community stakeholders and increase their awareness and knowledge regarding EBps; and
♦ create general and targeted strategies to dissemi-nate information of EBps for all stakeholders .
54
CHAPTeR 5
developmentally-appropriate Services and Supports
Setting the Context: Providing Mental Health Services that Match developmental Needs of Children, youth and Families
children’s mental health services’ early history often neglected the need for services that were designed to meet the developmental needs of children, youth, and families .50 This service history includes the presumption that the same or similar interven-tion strategies for adults might work for children .51 Knitzer’s two reports, Unclaimed Children and At the School House Door, brought national attention to the plight of children with mental health conditions who endured a service delivery system that refused to recognize their developmental needs .52, 53 Then as now public policies and financing streams often failed to utilize the vast body of evidence on child development when crafting policies or assigning funds . california’s System of care movement was a first step towards implementing developmentally-appropriate services and supports, but a focus on prevention, early intervention, and a public health approach remained lacking . pioneering policy movements in california such as proposition 10, the mental health Services act, and EpSDt expansion have increasingly embraced mental health within the context of a public health framework . While some of these advances have been inspired by litiga-tion, their impact has been dramatic . For example, Snowden and his colleagues point out that through EpSDt expansion, service access has significantly increased for children birth to age 5 .54
research from developmental psychology stresses the importance of adopting an ecological view when it comes to practice .55 This view requires that prac-tice recognizes the importance of relationships in a child or young person’s life, particularly relation-ships with family members or caregivers, peers, and significant others .56 in addition, researchers have
identified the role of risk factors, including parental risk factors, and settings on a child’s mental health .57, 58 increasingly, attention is being paid to the constella-tion of practice implications of this knowledge and the need for policies that support best practice .59 a developmental perspective in policy recognizes that the role of relationships in a child or young person’s development demands policy supports that reinforce the importance of relationships . For example, policies that encourage access to insurance coverage for parents or siblings are supportive of a family-centered approach . policies supportive of building social skills in children and youth across the developmental span, such as school-based social emotional learning, are more likely to positively impact peer relationships and ultimately the child’s development . in the same vein, building on a child’s resilience, the ability to successfully address risks, may lead to different policy options, such as a family risk-based approach to determining eligibility for services .
This chapter describes major themes, key concepts, and recurring and unique perspectives that emerge from a developmental lens . Data for this chapter comes from interviews with state and county system leaders and providers . analysis of the data focused at two levels . The first basic level gauged partici-pants’ perspectives on access to services by develop-mental phase: early childhood (0 to 5), school-age
Box 7: Children’s system of Care: Children’s Mental health services act
The “System of Care” philosophy integrates multiple disciplines and methods of service delivery to create a holistic approach to care. A System of Care recognizes the importance of a child’s caregivers, environment, community, culture, and various other factors in improving outcomes. The State of California codified this approach to service delivery for chil-dren and youth with SED in 1984. Since the initial legislation, the act has been amended three times to expand System of Care across the state.
National Center for Children in Poverty Unclaimed Children Revisited: California Case Study 55
(6 to 18), and transition-age (18 to 25) . The second level focused on whether the services themselves reflected a developmental perspective . a devel-opmentally-appropriate perspective was loosely defined taking into consideration the existence of screenings and assessments, interventions, and transitions that reflected the developmental needs of children and the settings in which these strategies occurred .
Prior Research and Research Questions
The growing body of knowledge on factors that help prevent mental health conditions in chil-dren and youth, attenuate symptoms and condi-tions, and constitute effective intervention for the most seriously affected calls for a comprehensive approach embodied in a public health framework . This framework was embraced in california policy and codified in law by the mental health Services act (mhSa) .60 it is a framework that addresses the impact of the lack of a developmental perspective evident in mental health practices . From a policy perspective, this means identifying both chal-lenges and opportunities in implementing effective developmentally appropriate services and changing service systems accordingly . Study investigators sought to assess the state of developmentally appro-priate services and supports for children, youth, and their families . This goal led them to make the following inquiries:♦ What are system leaders’ and providers’ perspec-
tives regarding the capacity of their service systems to provide services and supports across the developmental span (early childhood, school age, and youth transitioning to adulthood)?
♦ What major strategies do county leaders and providers use to promote and support develop-mentally appropriate services and supports?
♦ What major challenges do county leaders and providers face in providing developmentally appropriate services?
Summary Findings
♦ Service delivery system for school-age children and youth deemed most advanced by stakeholders .
♦ System leaders and providers were more likely to discuss assessment in connection with young children than with school-age children and youth or youth transitioning to adulthood .
♦ respondents were more likely to identify challenges in financing for the service-delivery system of young children than for that of other age groups .
♦ System leaders and providers were more likely to describe the service-delivery system for youth transitioning to adulthood as inadequate or non-existent than the service-delivery system of other age groups .
Box 8: Early Childhood and development: Proposition 10 California Children and families Commission/first 5
As a result of a $0.50 tax on tobacco products in California, the California Children and Families Commission, also known as First 5, was created. The bulk of the money is dedicated to the formation of 58 First 5 county commissions that distribute funds to local communities. The goal of First 5 is to create guidelines and a strategic mission for early childhood and development programs in every county in California. This funding is not specific to mental health, though certain coun-ties have used some of their resources to support programs focusing on social and emotional health and development. Commission’s major strategies include:
• direct services
• system development, including providers
• public education piece
• transition (pre-school – K )
• Revenue 2006-07 $116m.
Source: First 5 California. Accessed Dec. 7, 2009 from http://www.ccfc.ca.gov/.
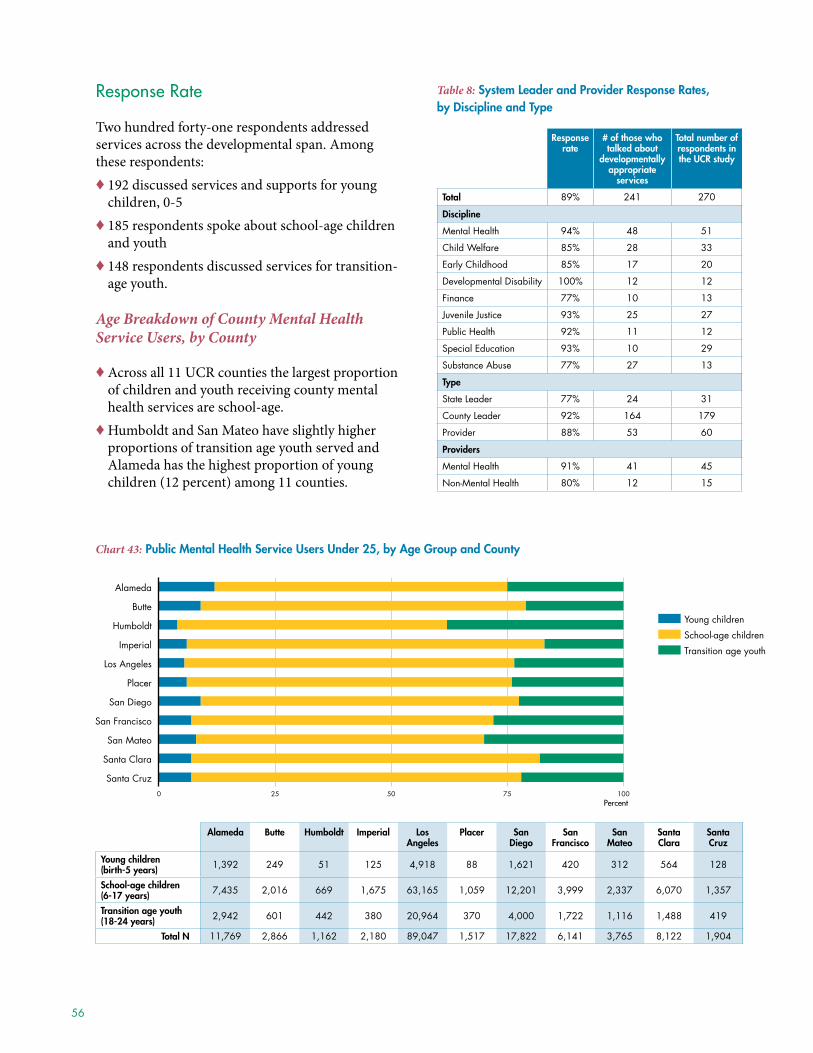
56
Response Rate
two hundred forty-one respondents addressed services across the developmental span . among these respondents:♦ 192 discussed services and supports for young
children, 0-5 ♦ 185 respondents spoke about school-age children
and youth♦ 148 respondents discussed services for transition-
age youth .
Age Breakdown of County Mental Health Service Users, by County
♦ across all 11 ucr counties the largest proportion of children and youth receiving county mental health services are school-age .
♦ humboldt and San mateo have slightly higher proportions of transition age youth served and alameda has the highest proportion of young children (12 percent) among 11 counties .
Table 8: system leader and Provider Response Rates, by discipline and Type
Response rate
# of those who talked about
developmentally appropriate
services
Total number of respondents in the uCR study
Total 89% 241 270
discipline
Mental Health 94% 48 51
Child Welfare 85% 28 33
Early Childhood 85% 17 20
Developmental Disability 100% 12 12
Finance 77% 10 13
Juvenile Justice 93% 25 27
Public Health 92% 11 12
Special Education 93% 10 29
Substance Abuse 77% 27 13
Type
State Leader 77% 24 31
County Leader 92% 164 179
Provider 88% 53 60
Providers
Mental Health 91% 41 45
Non-Mental Health 80% 12 15
alameda Butte humboldt imperial los angeles
Placer san diego
san francisco
san Mateo
santa Clara
santa Cruz
young children (birth-5 years) 1,392 249 51 125 4,918 88 1,621 420 312 564 128
school-age children (6-17 years) 7,435 2,016 669 1,675 63,165 1,059 12,201 3,999 2,337 6,070 1,357
Transition age youth (18-24 years) 2,942 601 442 380 20,964 370 4,000 1,722 1,116 1,488 419
Total n 11,769 2,866 1,162 2,180 89,047 1,517 17,822 6,141 3,765 8,122 1,904
Chart 43: Public Mental Health Service Users Under 25, by Age Group and County
0 25 50 75 100
Santa Cruz
Santa Clara
San Mateo
San Francisco
San Diego
Placer
Los Angeles
Imperial
Humboldt
Butte
Alameda
Young children
School-age children
Transition age youth
Percent
0 25 50 75 100
Transition-age Children
School-age Children
Young Children
Santa Cruz
Santa Clara
San Mateo
San Francisco
San Diego
Placer
Los Angeles
Imperial
Humboldt
Butte
Alameda

National Center for Children in Poverty Unclaimed Children Revisited: California Case Study 57
Services delivery for young Children Reported by System leaders and Providers
Service Array for Young Children
System leaders and providers describe the service array for young children as strong but capacity challenges are evident. Nearly 200 respondents (N=192) spoke about services to young children (0 to 5) . Nineteen respondents (six percent) had no knowledge or could not answer questions specific to early child-hood services . Over 130 participants commented on specific services or types of services for young children . Of these respondents, over one-fifth charac-terized the service delivery system of young children as strong, and another fifth discussed positive aspects and challenges of service capacity . among those who discussed capacity, more than half (51 percent) assessed their service capacity as limited . Some respondents (8 .8 percent) talked about assessments, while others discussed family-based treatment (8 .8 percent) or parent-focused services (8 .3 percent) .
across the developmental span, respondents were more likely to discuss assessment in connection with young children than with school-age or tran-sition-age youth . a small number of respondents commented on transitions and on outcomes, in particular their importance for young children (3 .5 percent and less than three percent respectively) . respondents (N=22) across all counties referred to Family resource centers, and the wide-ranging community based services that they provide .
Strategies for Providing Services for Young Children
Current financing strategies for young children are perceived as vibrant. respondents who spoke about early childhood services also spoke about funding . Of the 120 respondents who talked about funding that focused on the developmental continuum, 45 percent (N=55) spoke about early childhood services and funding . most of these respondents (53 percent) discussed the strength of financing and fiscal policies, but input on the challenges also received a lot of attention (45 percent) . in fact, compared to other responses across the develop-mental span these respondents were more likely
to talk about fiscal challenges when referring to young children than those discussing school-age or transition-age services .
Strong collaboration is a hallmark of the early child-hood delivery system among study counties. Overall, 21 respondents discussed collaboration . most responses were positive (over 90 percent) . among those respondents speaking about early childhood who focused on the strength of the collaboration in the early childhood system, none discussed chal-lenges . a small number of respondents referred to the development of an early-childhood consortium in their communities .
Services delivery for School-age Children and youth Reported by System leaders and Providers
Service Array for School-age Children and Youth
A school-based focus is recognized as a service delivery system strength. a number of system leaders and providers (N=181) commented on the state of services for school-age children and youth . Nearly half of the respondents (48 percent) spoke about specific services . about 28 percent described their services for school-age children as strong, while a small number characterized service provision as community-based or family-based (nine percent and six percent respectively) .
Strategies for Providing Services for School-Age Children and Youth
respondents from all 11 counties spoke about a strong focus and strong programming that centered on school-age youth or school-based services . however, only one state-level system leader described the service delivery for school-age children as strong . approximately 70 percent of those who talked about services for school-age children discussed capacity . Of those who referred to capacity, about 16 percent considered capacity for school-based services limited or poor . Specific limitations expressed included the lack of capacity to serve older youth, youth with co-occurring disorders, young children, and undoc-umented youth . Three respondents referenced the
58
impact of policy problems on capacity . in particular, one respondent cited the lack of fit between confidentiality regulations in schools and those in health and mental health, which contrib-uted to other unnecessary barriers to access . “We have a lot of trouble sharing without getting parents involved. Most of the nature of the school is that we talk to the child not the families. [There are] lots of school districts here and a county office of education, but [it] doesn’t have direct management of the school district. We have a state-funded office of education and schools are locally funded.”
another said, “The Department of Mental Health and Juvenile Hall are two entirely different cultures of those two departments, however there are still differing viewpoints. If you understand mental health in one way, 90 percent of children in the camps would qualify for mental health services, but that’s not the mental health model. As you move into school-age children and even older children, the focus of treatment and intervention is on the far end of the continuum, or on the kids who are most obviously mentally ill, who have a diagnosis, and who receive medications…but there are a lot of folks who suffer and are left to cope on their own.”
One respondent expressed frustration, illustrating the capacity problems related to a poor policy response, in this case jurisdictional issues . This respondent commented, “[there was] a homeless girl, age 14, [who] was raped and suicidal. Clinicians refused to see her or 5150 (involuntary hold) her because she was out of jurisdiction. They wanted to send her back to Alameda. When you totally follow the rules, it can get in the way. She was hurt in Santa Cruz, not Alameda. The fact that they refused to see her perpetuated her mental instability even more.”
Some services were identified as strong and effec-tive. One-third of all respondents described their county or state capacity for school-age children as strong, comprehensive, or representing a school-based focus . Over one-fifth of these respondents described this programming as possessing a heavy focus on the use of evidence-based services (22 percent) . respondents from mental health and juvenile justice were more likely to discuss the implementation of evidence-based practices in schools and for school-age students than those from
other disciplines . respondents from child welfare, developmental disabilities, public health, and early childhood did not mention evidence-based practices (EBps) in this context, and only one respondent from special education alluded to the use of EBps .
mental health providers most frequently described programming as strong whereas only one non-mental health provider attributed strength to the programming for school-age children .
Financing is critical to services for school-age children and youth: AB 3632 was perceived as a core strength of service-delivery system for school-age children and youth. Over half of the respondents (47 percent) who commented on school-age services talked about financing (N=85) . Of these respondents, about 25 percent addressed financing of school-based services, positively attrib-uting the strength of programming to the exis-tence of aB 3632 . in particular, nine respondents represented mental health leaders, including one state leader who referenced aB 3632 . Three mental
Box 9: Mental health services for special Education students: aB 3632; aB 2726; Chapter 26.5
Federal law, pursuant to the Individuals with Disabilities Education Act (IDEA), requires states to provide free appro-priate public education to students with disabilities in their localities. In 1982, Christopher T. v. San Francisco Unified School District found the defendants at fault in not referring special education students in need of residential placements. This triggered the passage of AB 3632 in 1984, which designated the county mental health departments as having the responsibility for special education students with serious emotional disturbances and Individualized Education Plans (IEPs). AB 2726 expanded the specifications of the 1984 legislation by clarifying interagency collaborations and respon-sibilities for a student in need of mental health services. These mandates are now part of the California Government Code, Chapter 26.5. School districts must now identify and refer the students to the county mental health authority. The county mental health department then has 50 days to conduct an assessment. In collaboration with the student’s IEP team, mental health services are offered. These services are generally tradi-tional (such as individual therapy; medication support) and do not include services such as Wraparound. However, residential placement is an option if less intensive services fail to benefit the student. The IEPs are reviewed on a regular basis. There is also a process for disputes and conflict resolution.
Source: Griffin, Michael. 2007. Special Education and Related Services in California Schools: Basic Information for Therapists, California Association of Marriage and Family Therapists. Accessed Dec. 7, 2009 from http://www.camft.org/scriptcontent/index.cfm?displaypage=../ScriptContent/CAMFTarticles/Misc/BasicInformationForTherapists.htm
National Center for Children in Poverty Unclaimed Children Revisited: California Case Study 59
health providers also attributed the strength of the delivery system of school age children and youth to aB 3632 . Four special education leaders and one juvenile justice and finance leader respectively addressed aB 3236 and its contribution to mental-health capacity for school-age children . Three respondents spoke about challenges associated with aB 3632, including the politics . One commented that: “26.5 [AB 3632 is commonly referred to as 26.5] is a four-letter word in advisory board meet-ings. Getting a kid designated as Severe Emotional Disorder (SED) is difficult because of going through the school psychologist, who rather than referring for ongoing mental health, becomes the gatekeeper. If the list is long then a child is often not identified even though they need to be.”
Public financing was viewed as positively contrib-uting to the strength of services for school-age children and youth. a large minority of respon-dents who discussed financing spoke positively about other aspects of the strength of financing school-based services (30 percent), (including public and private funding) . The overwhelming majority of these respondents focused on public financing . Three respondents referenced mhSa, and three referenced private funds . Funding diversity also received attention positively contrib-uting to school-based services . respondents who commented on the strength of public financing included representatives from developmental disability (N=1), finance (N=2), juvenile justice (N=3), mental health (N=12), substance use (N=3), and one state leader in substance abuse . among providers there were four mental health providers and one non-mental health provider who talked about the strength of the state’s financing for this age group . Some respondents discussed the diversity of funding (14 percent) from two opposing perspec-tives, as a positive factor and as a barrier .
Funding limitations were blamed as source of service capacity challenges. a large number of respondents commented on funding limitations . indeed, 22 of the respondents who discussed financing of school-based services also commented on limited funding as contributing to capacity problems . among the fiscal challenges identi-fied were narrow definitions for service eligibility, medi-cal as a constraint on serving families and
providing some types of services, and, in one case, the underuse of a vital funding stream for american indian/alaska Natives . Only two respondents, both leaders in finance (one a state leader and the other from San Diego), could report on the proportion of their budgets that was devoted to services for school-age children .
Collaboration was seen as a healthy factor in service-delivery system for school-age children and youth. Of the approximately 13 percent of respondents who commented on the delivery system for school-age children (N=36), the majority spoke positively about collaboration (90 percent) . While only one county leader specifically mentioned the existence of codified collaborative agreements like signed interagency agreements or memoranda of understanding, many spoke of working closely to provide needed services to school-age children and youth . Only 10 percent of those who referenced collaboration, service integration, or the strength of the service continuum for school-age youth discussed problems and challenges . among these challenges were difficulties working across systems, the lack of common language and understanding of concepts, and turf issues .
For example, one county leader remarked: “One of the biggest fallouts in doing really comprehensive work in San Francisco is the school district.”
another commented, “Our partners don’t really understand mental health problems. If we expect them to identify them and help us serve these children, then there needs to be increased understanding, when it’s obviously not being heard from us when you see a behavior, a defiant child, etc, that child needs help.”
The hard work of collaboration is stressed by one respondent in this comment, “The redesign requires them – social services – to lead it. So they are like, ‘Well you aren’t doing mine, why should I do yours? [It’s the] sort of thing and then we have a silo where we [deal on] a have-by case.”
Not surprisingly, leaders from community mental health and special education were most likely to comment on collaboration for school age youth, with 11 mental health leaders and nine special education leaders referencing collaboration . mental
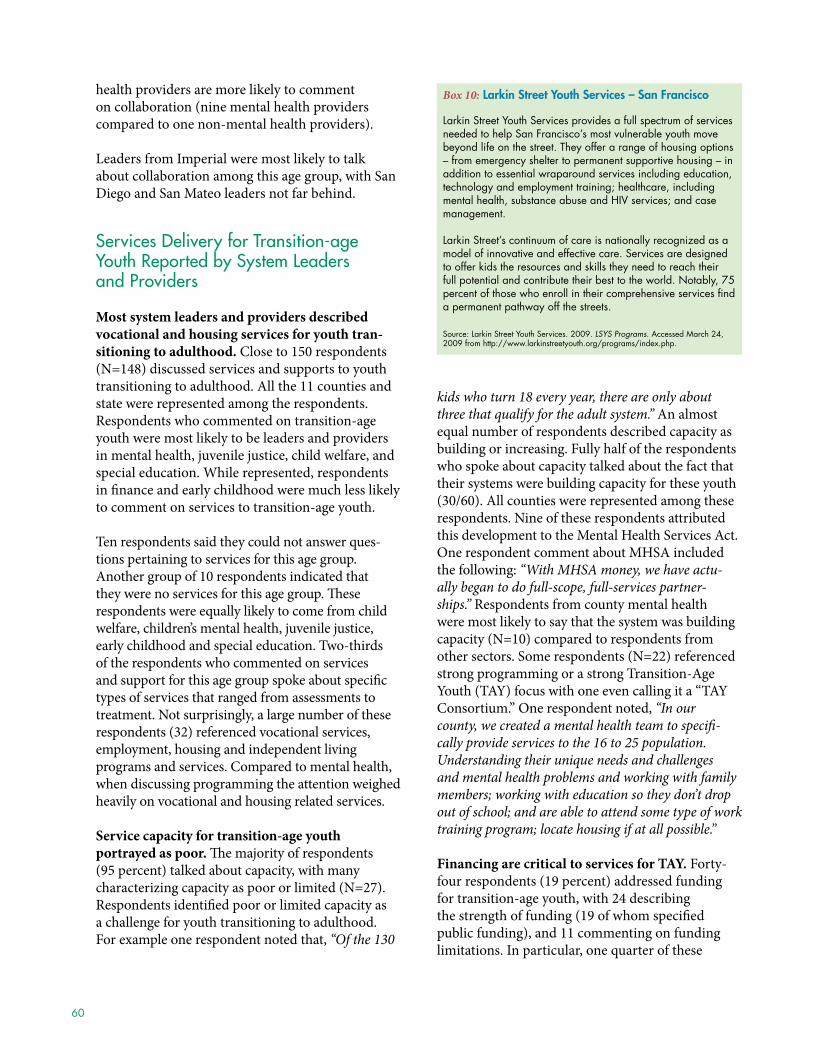
60
health providers are more likely to comment on collaboration (nine mental health providers compared to one non-mental health providers) .
Leaders from imperial were most likely to talk about collaboration among this age group, with San Diego and San mateo leaders not far behind .
Services delivery for Transition-age youth Reported by System leaders and Providers
Most system leaders and providers described vocational and housing services for youth tran-sitioning to adulthood. close to 150 respondents (N=148) discussed services and supports to youth transitioning to adulthood . all the 11 counties and state were represented among the respondents . respondents who commented on transition-age youth were most likely to be leaders and providers in mental health, juvenile justice, child welfare, and special education . While represented, respondents in finance and early childhood were much less likely to comment on services to transition-age youth .
ten respondents said they could not answer ques-tions pertaining to services for this age group . another group of 10 respondents indicated that they were no services for this age group . These respondents were equally likely to come from child welfare, children’s mental health, juvenile justice, early childhood and special education . two-thirds of the respondents who commented on services and support for this age group spoke about specific types of services that ranged from assessments to treatment . Not surprisingly, a large number of these respondents (32) referenced vocational services, employment, housing and independent living programs and services . compared to mental health, when discussing programming the attention weighed heavily on vocational and housing related services .
Service capacity for transition-age youth portrayed as poor. The majority of respondents (95 percent) talked about capacity, with many characterizing capacity as poor or limited (N=27) . respondents identified poor or limited capacity as a challenge for youth transitioning to adulthood . For example one respondent noted that, “Of the 130
kids who turn 18 every year, there are only about three that qualify for the adult system.” an almost equal number of respondents described capacity as building or increasing . Fully half of the respondents who spoke about capacity talked about the fact that their systems were building capacity for these youth (30/60) . all counties were represented among these respondents . Nine of these respondents attributed this development to the mental health Services act . One respondent comment about mhSa included the following: “With MHSA money, we have actu-ally began to do full-scope, full-services partner-ships.” respondents from county mental health were most likely to say that the system was building capacity (N=10) compared to respondents from other sectors . Some respondents (N=22) referenced strong programming or a strong transition-age youth (tay) focus with one even calling it a “tay consortium .” One respondent noted, “In our county, we created a mental health team to specifi-cally provide services to the 16 to 25 population. Understanding their unique needs and challenges and mental health problems and working with family members; working with education so they don’t drop out of school; and are able to attend some type of work training program; locate housing if at all possible.”
Financing are critical to services for TAY. Forty-four respondents (19 percent) addressed funding for transition-age youth, with 24 describing the strength of funding (19 of whom specified public funding), and 11 commenting on funding limitations . in particular, one quarter of these
Box 10: larkin street youth services – san francisco
Larkin Street Youth Services provides a full spectrum of services needed to help San Francisco’s most vulnerable youth move beyond life on the street. They offer a range of housing options – from emergency shelter to permanent supportive housing – in addition to essential wraparound services including education, technology and employment training; healthcare, including mental health, substance abuse and HIV services; and case management.
Larkin Street’s continuum of care is nationally recognized as a model of innovative and effective care. Services are designed to offer kids the resources and skills they need to reach their full potential and contribute their best to the world. Notably, 75 percent of those who enroll in their comprehensive services find a permanent pathway off the streets.
Source: Larkin Street Youth Services. 2009. LSYS Programs. Accessed March 24, 2009 from http://www.larkinstreetyouth.org/programs/index.php.
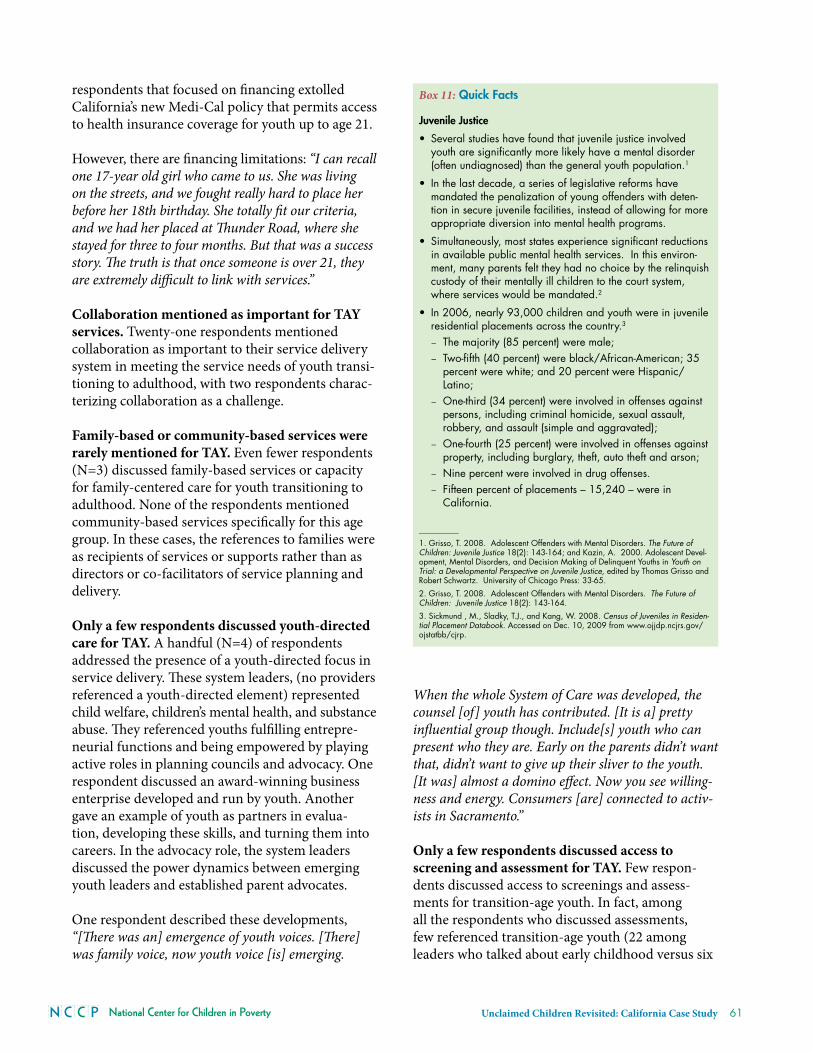
National Center for Children in Poverty Unclaimed Children Revisited: California Case Study 61
respondents that focused on financing extolled california’s new medi-cal policy that permits access to health insurance coverage for youth up to age 21 .
however, there are financing limitations: “I can recall one 17-year old girl who came to us. She was living on the streets, and we fought really hard to place her before her 18th birthday. She totally fit our criteria, and we had her placed at Thunder Road, where she stayed for three to four months. But that was a success story. The truth is that once someone is over 21, they are extremely difficult to link with services.”
Collaboration mentioned as important for TAY services. twenty-one respondents mentioned collaboration as important to their service delivery system in meeting the service needs of youth transi-tioning to adulthood, with two respondents charac-terizing collaboration as a challenge .
Family-based or community-based services were rarely mentioned for TAY. Even fewer respondents (N=3) discussed family-based services or capacity for family-centered care for youth transitioning to adulthood . None of the respondents mentioned community-based services specifically for this age group . in these cases, the references to families were as recipients of services or supports rather than as directors or co-facilitators of service planning and delivery .
Only a few respondents discussed youth-directed care for TAY. a handful (N=4) of respondents addressed the presence of a youth-directed focus in service delivery . These system leaders, (no providers referenced a youth-directed element) represented child welfare, children’s mental health, and substance abuse . They referenced youths fulfilling entrepre-neurial functions and being empowered by playing active roles in planning councils and advocacy . One respondent discussed an award-winning business enterprise developed and run by youth . another gave an example of youth as partners in evalua-tion, developing these skills, and turning them into careers . in the advocacy role, the system leaders discussed the power dynamics between emerging youth leaders and established parent advocates .
One respondent described these developments, “[There was an] emergence of youth voices. [There] was family voice, now youth voice [is] emerging.
When the whole System of Care was developed, the counsel [of] youth has contributed. [It is a] pretty influential group though. Include[s] youth who can present who they are. Early on the parents didn’t want that, didn’t want to give up their sliver to the youth. [It was] almost a domino effect. Now you see willing-ness and energy. Consumers [are] connected to activ-ists in Sacramento.”
Only a few respondents discussed access to screening and assessment for TAY. Few respon-dents discussed access to screenings and assess-ments for transition-age youth . in fact, among all the respondents who discussed assessments, few referenced transition-age youth (22 among leaders who talked about early childhood versus six
Box 11: Quick facts
Juvenile Justice
• Several studies have found that juvenile justice involved youth are significantly more likely have a mental disorder (often undiagnosed) than the general youth population.1
• In the last decade, a series of legislative reforms have mandated the penalization of young offenders with deten-tion in secure juvenile facilities, instead of allowing for more appropriate diversion into mental health programs.
• Simultaneously, most states experience significant reductions in available public mental health services. In this environ-ment, many parents felt they had no choice by the relinquish custody of their mentally ill children to the court system, where services would be mandated.2
• In 2006, nearly 93,000 children and youth were in juvenile residential placements across the country.3
– The majority (85 percent) were male; – Two-fifth (40 percent) were black/African-American; 35 percent were white; and 20 percent were Hispanic/Latino;
– One-third (34 percent) were involved in offenses against persons, including criminal homicide, sexual assault, robbery, and assault (simple and aggravated);
– One-fourth (25 percent) were involved in offenses against property, including burglary, theft, auto theft and arson;
– Nine percent were involved in drug offenses. – Fifteen percent of placements – 15,240 – were in California.
__________
1. Grisso, T. 2008. Adolescent Offenders with Mental Disorders. The Future of Children: Juvenile Justice 18(2): 143-164; and Kazin, A. 2000. Adolescent Devel-opment, Mental Disorders, and Decision Making of Delinquent Youths in Youth on Trial: a Developmental Perspective on Juvenile Justice, edited by Thomas Grisso and Robert Schwartz. University of Chicago Press: 33-65.
2. Grisso, T. 2008. Adolescent Offenders with Mental Disorders. The Future of Children: Juvenile Justice 18(2): 143-164.
3. Sickmund , M., Sladky, T.J., and Kang, W. 2008. Census of Juveniles in Residen-tial Placement Databook. Accessed on Dec. 10, 2009 from www.ojjdp.ncjrs.gov/ojstatbb/cjrp.
62
among those who discussed transition-age youth) . respondents who spoke about transition-age youth also made few references to the importance of the transition process as distinct from programs focused on transition-age youth . references to transition included hearty endorsements of specific programs or discussion of poor links to the adult mental health system when it was needed . a handful of respon-dents referenced youth-directed care (N=4) .
Summary Responses of System leaders and Providers by Respondent’s Type, disciplines and Counties
County System Leaders
county system leaders who talked about types of services across the developmental span most often talked about services to school-age children (42 percent), followed by services to young children (38 percent), and then services to youth transi-tioning to adulthood (20 percent) . These respon-dents were more likely to describe characteristics of services, service capacity, or whether services are family-based . about one-third of system leaders discussing attributes of services described them as strong, and nearly half of these responses consid-ered the service-delivery system for young children to be strong, slightly more than the responses that focused on school-age children . These system leaders were least likely to describe services to tran-sition-age youth as strong . about 20 percent of the responses by county leaders emphasized capacity when discussing factors about services, while nearly one-third described their systems as building capacity . Nearly 90 percent of the system leaders who described their system as building capacity were focused on services for transition-age youth .
county leaders most often talked about assessments in the context of young children . in addition to spe-cifics about services, a small proportion of responses by system leaders at the county level (12 percent) concerned family-centered services or services to parents from a developmental perspective . Three-fifths of these respondents directed their comments to the early-childhood stage . Only four respondents who talked about family-centered care did so in con-nection with youth transitioning to adulthood .
county system leaders were most concerned about the types of challenges the services they described confronted . These comments were overwhelmingly about workforce (68 percent) . closely tied to these challenges were issues surrounding funding . Nearly two-fifths of respondents on financing commented on its challenges, of which 82 percent were county system leaders . conversely, county leaders also contributed to the comments that suggested the system’s financing is strong (46 percent of the respondents) .
State System Leaders
unsurprisingly, system leaders at the state level in a state-supervised (county-run) system were less likely to respond to questions about types of services . Of the 27 respondents who commented on service types, more than half of state leaders most frequently mentioned capacity (15 respondents), the strength of the service-delivery system, and family- and youth-directed services . No state system leaders commented on specific services, although one system leader discussed assessments . State leaders were less likely to discuss specific challenges related to service delivery, as opposed to generally pointing out service-capacity concerns . Stigma and concerns with aB 3632 were the most frequently mentioned service delivery challenges explored by state system leaders . These leaders contributed more to the discussion on funding than any other topic . Of the 15 respondents who commented on funding, state leaders discussed funding in relation to early childhood and school-age and transition-age youth evenly . The 13 state leaders who spoke about funding focused on both the strengths and the challenges .
Providers
The top four most frequently mentioned comments by providers in the study were evenly distributed and concentrated on services (46 percent) . among those who commented on services, about one-fourth talked about capacity, and another one-fifth charac-terized their delivery system as strong (20 percent) . about 12 percent talked about family-focused services and services for parents . Only one provider focused on assessments, which was in the context of working with school-age children and youth . providers also offered responses on challenges
National Center for Children in Poverty Unclaimed Children Revisited: California Case Study 63
facing the service-delivery system . These responses concentrated on stigma and on workforce . included in this discussion were references to funding . These providers contributed less to discussion on financing than other types of respondents . Of all the responses on financing, only 10 percent were contributed by providers . provider responses were equally divided between the strengths of financing and its chal-lenges . across the developmental span, providers were more likely to talk about funding in relation-ship to services for young children (37 percent) and transition-age youth (30 percent) than school-age children and youth (26 percent) .
Across Disciplines
Leaders from child welfare, mental health, and early childhood were more likely to describe consor-tium for early childhood delivery systems . System leaders from juvenile justice, followed by mental health and special education were most likely to describe services provided for children and youth as family-based or having the characteristics of family-centered care, as were non-mental health providers . respondents in juvenile justice, mental health, and special education were more likely than other respondents to report that they did not know specifically about services for young children .
Juvenile justice and children’s mental health leaders who participated in the study referred to the use of EBps in school-based programming . Some system leaders (N=7) described the care-delivery system for school-age children and youth as one where they are “building capacity .” These leaders in mental health (N=2), finance (N=2), education (N=2), and early childhood (N=1), along with one provider represented five counties (imperial, Santa cruz, San Diego, Butte, and San mateo) .
respondents in mental health, juvenile justice, special education, and substance abuse were more likely to characterize their programs for school-age children as strong . respondents from juvenile justice, child welfare, developmental disabilities, mental health, and public health who pointed new medi-cal policy of insurance coverage for youth up to age 21 . Fourteen respondents focused on vocational programming, homeless services and funding, and employment . county leaders from child welfare, developmental disabilities, and
juvenile justice were more likely to discuss these issues than leaders in finance, mental health, public health, or substance abuse .
Across Counties
all respondents talked about the strengths of some of the current financing strategies for young children . respondents in all counties except those in placer and San mateo talked about challenges in financing for providing services for young children . respon-dents in San Diego and Santa clara most frequently mentioned the strengths in services for young children while respondents in Butte, Los angeles, and San Francisco more frequently talked about the financing challenge in providing services for young children . Leaders in alameda, Butte, and Los angeles were more likely to describe cross-system collaborations for early childhood delivery systems .
These respondents represented a range of counties . respondents from Butte, alameda, and San Diego more frequently mentioned the strengths of state’s financing for school-age group . respondents from five counties discussed family-based services in rela-tion to school-age children and youth . They were equally likely to be from San mateo, Los angeles, placer, San Francisco, and Santa cruz counties . The service type described ranged from parent-targeted services (N=15) to prevention focused (N=10), assessments (N=9), referral (N=9), and residential treatment (N=3) .
meanwhile, respondents from Los angeles, humboldt, San Diego, San mateo, Santa clara, imperial, and alameda discussed their focus on EBps services for school-age children and youth, with more respondents from Los angeles and humboldt discussing this topic than the other counties .
Some system leaders (N=7) described the care-delivery system for school-age children and youth as the area they are “building capacity .” These leaders represented five counties (imperial, Santa cruz, San Diego, Butte, and San mateo) .
county leaders in Butte, followed by those in imperial, alameda, and placer most frequently mentioned non-clinical services for transitional youth including vocational programming, homeless services and employment .
64
Chapter Summary
california system leaders and providers perceive the service capacity for young children as strong, which they attribute to its strong collaborations across disciplines . School-based services are also seen as robust with strong programming as a result of aB 3632 . On the other hand, services for transitional age youth were less frequently discussed compared with services for young children and school-age children and youth . Those who talked about services for transitional age youth often discussed vocational and housing services .
public financing was seen as strength for services for school-age children; yet across the develop-mental span, lack of funding was discussed as a major barrier for implementing services .
Overall, administrative data from cSi shows strong services for school-age children in california . Leaders from more than half of ucr counties are also incorporating evidence-based services in school settings .
Recommendations
The state of California and counties should:♦ support state and professional efforts to improve
the competencies of all providers and teachers who work with children and youth with or at risk for mental health conditions so the workforce is prepared to meet the needs of children;
♦ develop a comprehensive strategy and increase resources to support and expand the provision of prevention, early intervention and treatment services across the age-span;
♦ expand program service eligibility and flexibility for children and families covered by medi-cal, including opening up community-based services to transition-age youth to reduce inpatient service costs; and
♦ increase support and services for tay transi-tioning to the adult system, including increasing medi-cal eligibility for tay involved in the mental health system up to age 25 .
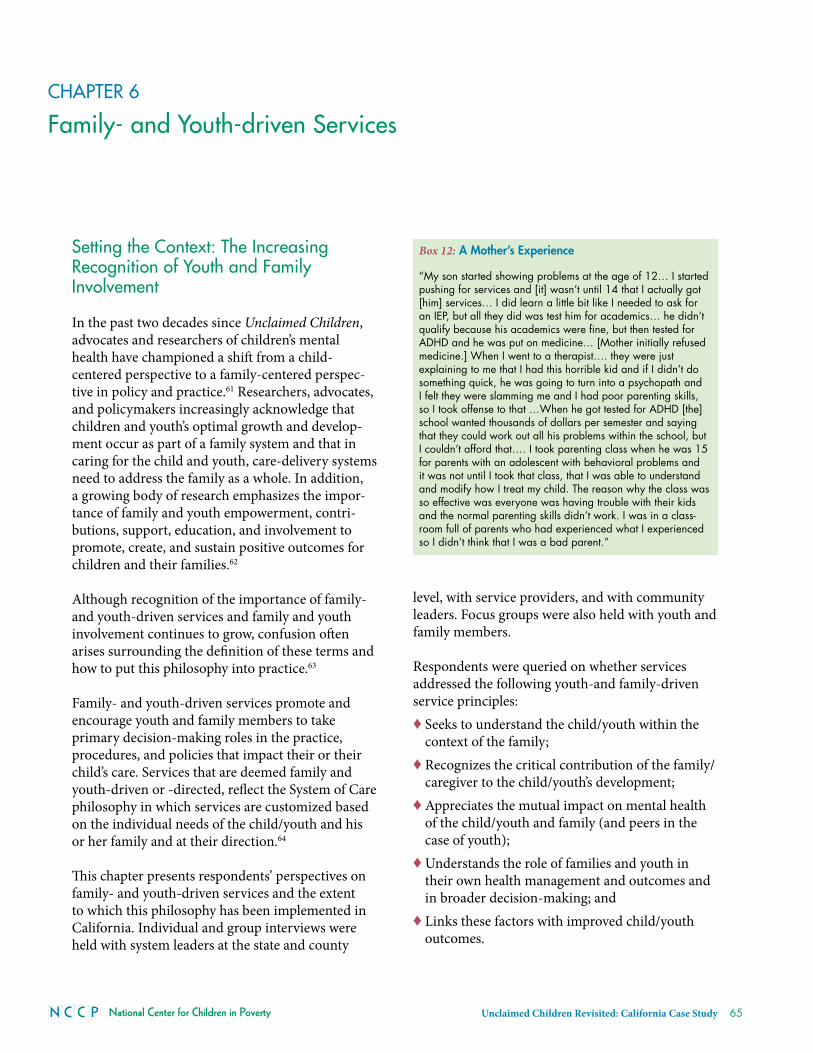
National Center for Children in Poverty Unclaimed Children Revisited: California Case Study 65
CHAPTeR 6
Family- and youth-driven Services
Setting the Context: The increasing Recognition of youth and Family involvement
in the past two decades since Unclaimed Children, advocates and researchers of children’s mental health have championed a shift from a child-centered perspective to a family-centered perspec-tive in policy and practice .61 researchers, advocates, and policymakers increasingly acknowledge that children and youth’s optimal growth and develop-ment occur as part of a family system and that in caring for the child and youth, care-delivery systems need to address the family as a whole . in addition, a growing body of research emphasizes the impor-tance of family and youth empowerment, contri-butions, support, education, and involvement to promote, create, and sustain positive outcomes for children and their families .62
although recognition of the importance of family- and youth-driven services and family and youth involvement continues to grow, confusion often arises surrounding the definition of these terms and how to put this philosophy into practice .63
Family- and youth-driven services promote and encourage youth and family members to take primary decision-making roles in the practice, procedures, and policies that impact their or their child’s care . Services that are deemed family and youth-driven or -directed, reflect the System of care philosophy in which services are customized based on the individual needs of the child/youth and his or her family and at their direction .64
This chapter presents respondents’ perspectives on family- and youth-driven services and the extent to which this philosophy has been implemented in california . individual and group interviews were held with system leaders at the state and county
level, with service providers, and with community leaders . Focus groups were also held with youth and family members .
respondents were queried on whether services addressed the following youth-and family-driven service principles: ♦ Seeks to understand the child/youth within the
context of the family; ♦ recognizes the critical contribution of the family/
caregiver to the child/youth’s development;♦ appreciates the mutual impact on mental health
of the child/youth and family (and peers in the case of youth);
♦ understands the role of families and youth in their own health management and outcomes and in broader decision-making; and
♦ Links these factors with improved child/youth outcomes .
Box 12: a Mother’s Experience
“My son started showing problems at the age of 12… I started pushing for services and [it] wasn’t until 14 that I actually got [him] services… I did learn a little bit like I needed to ask for an IEP, but all they did was test him for academics… he didn’t qualify because his academics were fine, but then tested for ADHD and he was put on medicine… [Mother initially refused medicine.] When I went to a therapist…. they were just explaining to me that I had this horrible kid and if I didn’t do something quick, he was going to turn into a psychopath and I felt they were slamming me and I had poor parenting skills, so I took offense to that …When he got tested for ADHD [the] school wanted thousands of dollars per semester and saying that they could work out all his problems within the school, but I couldn’t afford that…. I took parenting class when he was 15 for parents with an adolescent with behavioral problems and it was not until I took that class, that I was able to understand and modify how I treat my child. The reason why the class was so effective was everyone was having trouble with their kids and the normal parenting skills didn’t work. I was in a class-room full of parents who had experienced what I experienced so I didn’t think that I was a bad parent.”
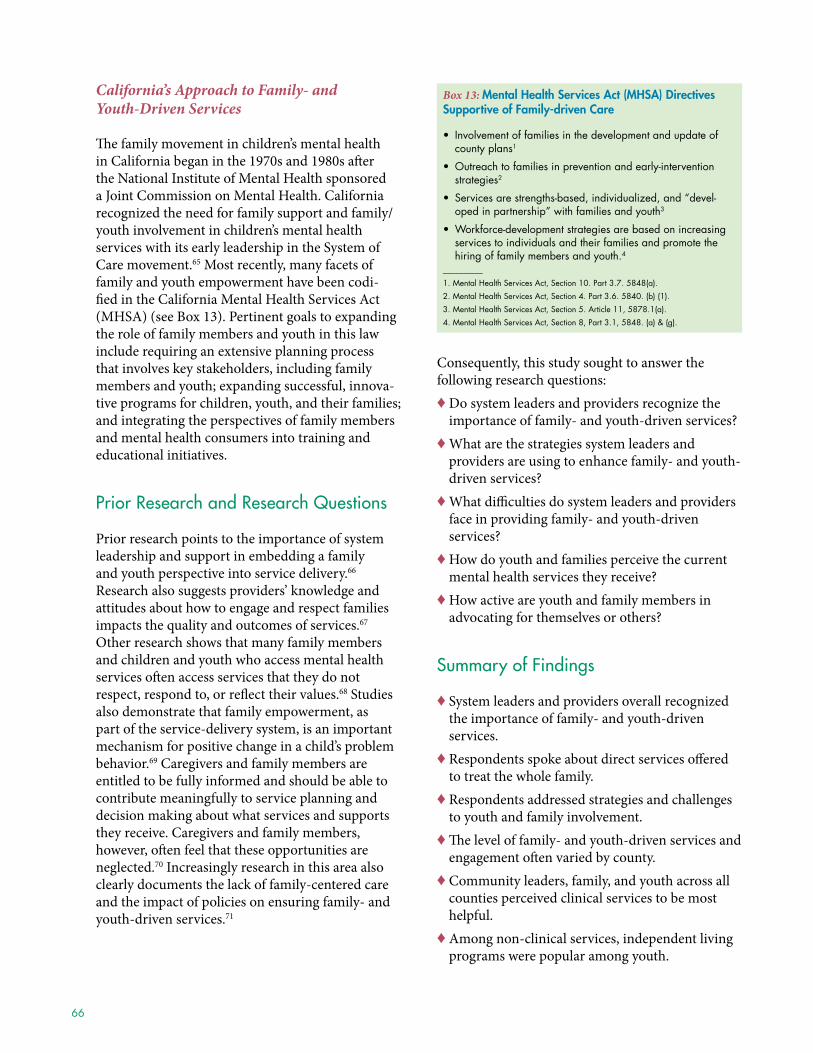
66
California’s Approach to Family- and Youth-Driven Services
The family movement in children’s mental health in california began in the 1970s and 1980s after the National institute of mental health sponsored a Joint commission on mental health . california recognized the need for family support and family/youth involvement in children’s mental health services with its early leadership in the System of care movement .65 most recently, many facets of family and youth empowerment have been codi-fied in the california mental health Services act (mhSa) (see Box 13) . pertinent goals to expanding the role of family members and youth in this law include requiring an extensive planning process that involves key stakeholders, including family members and youth; expanding successful, innova-tive programs for children, youth, and their families; and integrating the perspectives of family members and mental health consumers into training and educational initiatives .
Prior Research and Research Questions
prior research points to the importance of system leadership and support in embedding a family and youth perspective into service delivery .66 research also suggests providers’ knowledge and attitudes about how to engage and respect families impacts the quality and outcomes of services .67 Other research shows that many family members and children and youth who access mental health services often access services that they do not respect, respond to, or reflect their values .68 Studies also demonstrate that family empowerment, as part of the service-delivery system, is an important mechanism for positive change in a child’s problem behavior .69 caregivers and family members are entitled to be fully informed and should be able to contribute meaningfully to service planning and decision making about what services and supports they receive . caregivers and family members, however, often feel that these opportunities are neglected .70 increasingly research in this area also clearly documents the lack of family-centered care and the impact of policies on ensuring family- and youth-driven services .71
consequently, this study sought to answer the following research questions:♦ Do system leaders and providers recognize the
importance of family- and youth-driven services? ♦ What are the strategies system leaders and
providers are using to enhance family- and youth- driven services?
♦ What difficulties do system leaders and providers face in providing family- and youth-driven services?
♦ how do youth and families perceive the current mental health services they receive?
♦ how active are youth and family members in advocating for themselves or others?
Summary of Findings
♦ System leaders and providers overall recognized the importance of family- and youth-driven services .
♦ respondents spoke about direct services offered to treat the whole family .
♦ respondents addressed strategies and challenges to youth and family involvement .
♦ The level of family- and youth-driven services and engagement often varied by county .
♦ community leaders, family, and youth across all counties perceived clinical services to be most helpful .
♦ among non-clinical services, independent living programs were popular among youth .
Box 13: Mental health services act (Mhsa) directives supportive of family-driven Care
• Involvement of families in the development and update of county plans1
• Outreach to families in prevention and early-intervention strategies2
• Services are strengths-based, individualized, and “devel-oped in partnership” with families and youth3
• Workforce-development strategies are based on increasing services to individuals and their families and promote the hiring of family members and youth.4
__________
1. Mental Health Services Act, Section 10. Part 3.7. 5848(a).
2. Mental Health Services Act, Section 4. Part 3.6. 5840. (b) (1).
3. Mental Health Services Act, Section 5. Article 11, 5878.1(a).
4. Mental Health Services Act, Section 8, Part 3.1, 5848. (a) & (g).
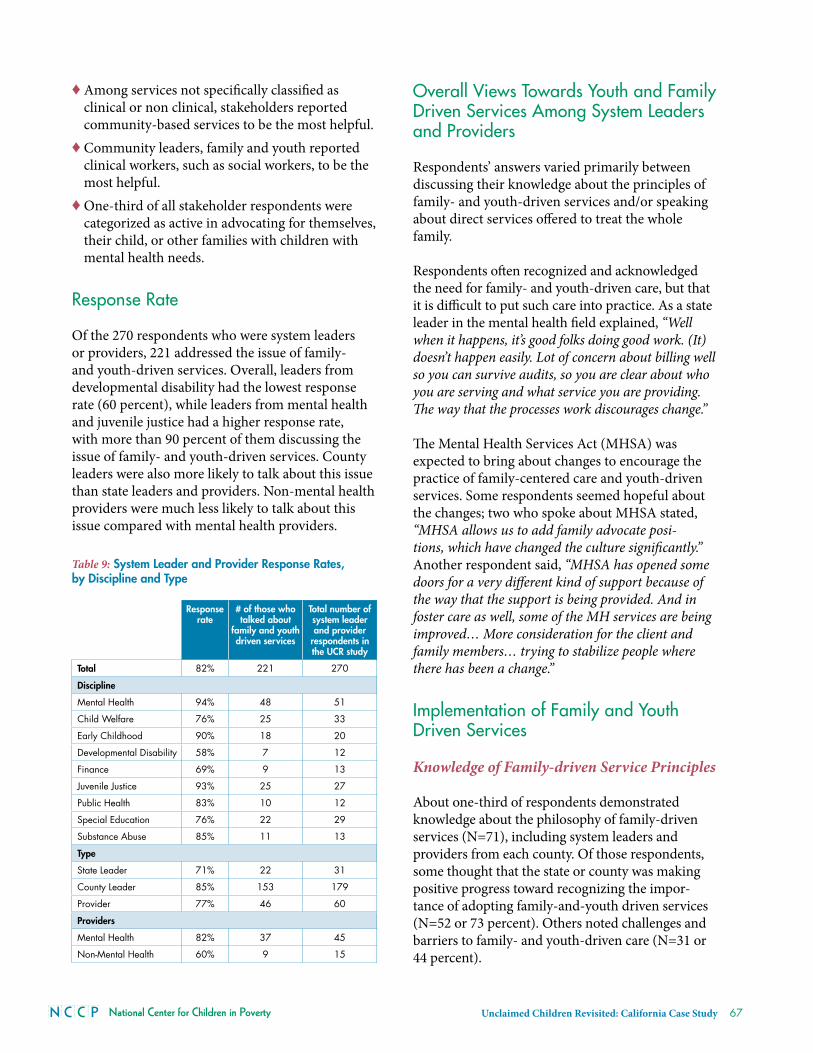
National Center for Children in Poverty Unclaimed Children Revisited: California Case Study 67
♦ among services not specifically classified as clinical or non clinical, stakeholders reported community-based services to be the most helpful .
♦ community leaders, family and youth reported clinical workers, such as social workers, to be the most helpful .
♦ One-third of all stakeholder respondents were categorized as active in advocating for themselves, their child, or other families with children with mental health needs .
Response Rate
Of the 270 respondents who were system leaders or providers, 221 addressed the issue of family- and youth-driven services . Overall, leaders from developmental disability had the lowest response rate (60 percent), while leaders from mental health and juvenile justice had a higher response rate, with more than 90 percent of them discussing the issue of family- and youth-driven services . county leaders were also more likely to talk about this issue than state leaders and providers . Non-mental health providers were much less likely to talk about this issue compared with mental health providers .
Table 9: system leader and Provider Response Rates, by discipline and Type
Response rate
# of those who talked about
family and youth driven services
Total number of system leader and provider
respondents in the uCR study
Total 82% 221 270
discipline
Mental Health 94% 48 51
Child Welfare 76% 25 33
Early Childhood 90% 18 20
Developmental Disability 58% 7 12
Finance 69% 9 13
Juvenile Justice 93% 25 27
Public Health 83% 10 12
Special Education 76% 22 29
Substance Abuse 85% 11 13
Type
State Leader 71% 22 31
County Leader 85% 153 179
Provider 77% 46 60
Providers
Mental Health 82% 37 45
Non-Mental Health 60% 9 15
Overall views Towards youth and Family driven Services Among System leaders and Providers
respondents’ answers varied primarily between discussing their knowledge about the principles of family- and youth-driven services and/or speaking about direct services offered to treat the whole family .
respondents often recognized and acknowledged the need for family- and youth-driven care, but that it is difficult to put such care into practice . as a state leader in the mental health field explained, “Well when it happens, it’s good folks doing good work. (It) doesn’t happen easily. Lot of concern about billing well so you can survive audits, so you are clear about who you are serving and what service you are providing. The way that the processes work discourages change.”
The mental health Services act (mhSa) was expected to bring about changes to encourage the practice of family-centered care and youth-driven services . Some respondents seemed hopeful about the changes; two who spoke about mhSa stated, “MHSA allows us to add family advocate posi-tions, which have changed the culture significantly.” another respondent said, “MHSA has opened some doors for a very different kind of support because of the way that the support is being provided. And in foster care as well, some of the MH services are being improved… More consideration for the client and family members… trying to stabilize people where there has been a change.”
implementation of Family and youth driven Services
Knowledge of Family-driven Service Principles
about one-third of respondents demonstrated knowledge about the philosophy of family-driven services (N=71), including system leaders and providers from each county . Of those respondents, some thought that the state or county was making positive progress toward recognizing the impor-tance of adopting family-and-youth driven services (N=52 or 73 percent) . Others noted challenges and barriers to family- and youth-driven care (N=31 or 44 percent) .
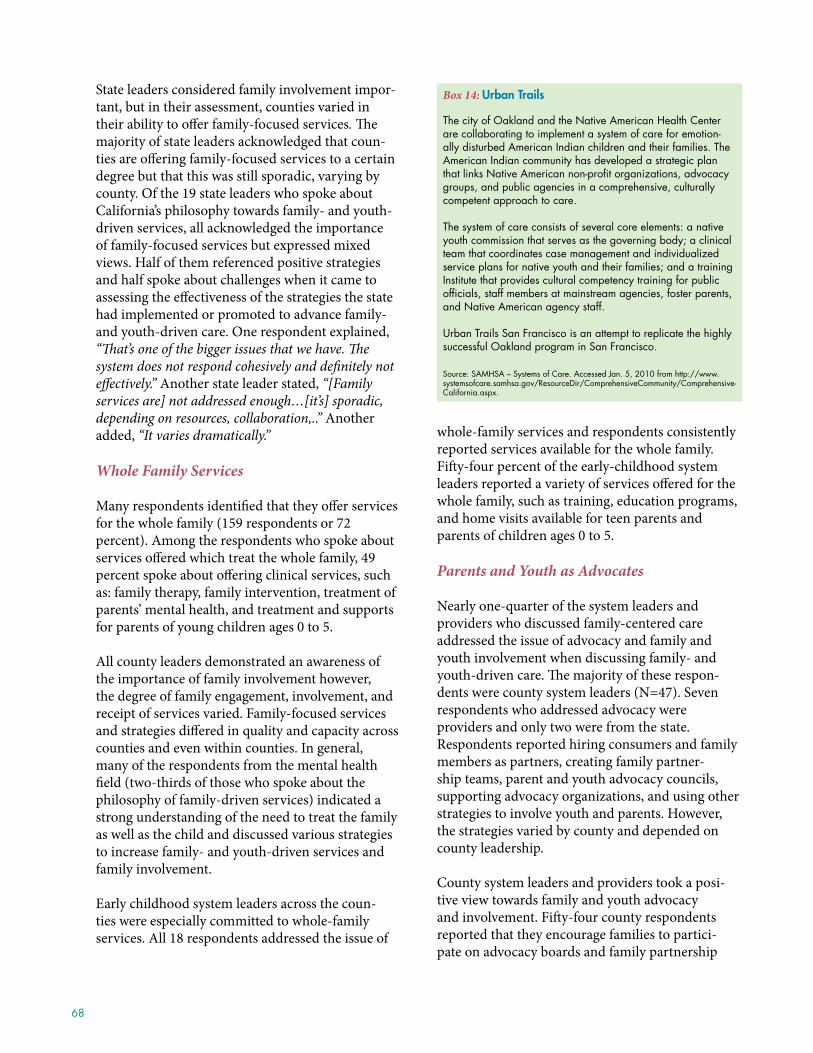
68
State leaders considered family involvement impor-tant, but in their assessment, counties varied in their ability to offer family-focused services. The majority of state leaders acknowledged that coun-ties are offering family-focused services to a certain degree but that this was still sporadic, varying by county . Of the 19 state leaders who spoke about california’s philosophy towards family- and youth-driven services, all acknowledged the importance of family-focused services but expressed mixed views . half of them referenced positive strategies and half spoke about challenges when it came to assessing the effectiveness of the strategies the state had implemented or promoted to advance family- and youth-driven care . One respondent explained, “That’s one of the bigger issues that we have. The system does not respond cohesively and definitely not effectively.” another state leader stated, “[Family services are] not addressed enough…[it’s] sporadic, depending on resources, collaboration,..” another added, “It varies dramatically.”
Whole Family Services
many respondents identified that they offer services for the whole family (159 respondents or 72 percent) . among the respondents who spoke about services offered which treat the whole family, 49 percent spoke about offering clinical services, such as: family therapy, family intervention, treatment of parents’ mental health, and treatment and supports for parents of young children ages 0 to 5 .
all county leaders demonstrated an awareness of the importance of family involvement however, the degree of family engagement, involvement, and receipt of services varied . Family-focused services and strategies differed in quality and capacity across counties and even within counties . in general, many of the respondents from the mental health field (two-thirds of those who spoke about the philosophy of family-driven services) indicated a strong understanding of the need to treat the family as well as the child and discussed various strategies to increase family- and youth-driven services and family involvement .
Early childhood system leaders across the coun-ties were especially committed to whole-family services . all 18 respondents addressed the issue of
whole-family services and respondents consistently reported services available for the whole family . Fifty-four percent of the early-childhood system leaders reported a variety of services offered for the whole family, such as training, education programs, and home visits available for teen parents and parents of children ages 0 to 5 .
Parents and Youth as Advocates
Nearly one-quarter of the system leaders and providers who discussed family-centered care addressed the issue of advocacy and family and youth involvement when discussing family- and youth-driven care . The majority of these respon-dents were county system leaders (N=47) . Seven respondents who addressed advocacy were providers and only two were from the state . respondents reported hiring consumers and family members as partners, creating family partner-ship teams, parent and youth advocacy councils, supporting advocacy organizations, and using other strategies to involve youth and parents . however, the strategies varied by county and depended on county leadership .
county system leaders and providers took a posi-tive view towards family and youth advocacy and involvement . Fifty-four county respondents reported that they encourage families to partici-pate on advocacy boards and family partnership
Box 14: urban Trails
The city of Oakland and the Native American Health Center are collaborating to implement a system of care for emotion-ally disturbed American Indian children and their families. The American Indian community has developed a strategic plan that links Native American non-profit organizations, advocacy groups, and public agencies in a comprehensive, culturally competent approach to care.
The system of care consists of several core elements: a native youth commission that serves as the governing body; a clinical team that coordinates case management and individualized service plans for native youth and their families; and a training Institute that provides cultural competency training for public officials, staff members at mainstream agencies, foster parents, and Native American agency staff.
Urban Trails San Francisco is an attempt to replicate the highly successful Oakland program in San Francisco.
Source: SAMHSA – Systems of Care. Accessed Jan. 5, 2010 from http://www.systemsofcare.samhsa.gov/ResourceDir/ComprehensiveCommunity/Comprehensive-California.aspx.
National Center for Children in Poverty Unclaimed Children Revisited: California Case Study 69
teams . many counties are attempting to give family members and youth a voice in the system by imple-menting advisory boards or family-partnership teams, although these efforts are not always county-driven . This initiative demonstrates counties’ shift from child-oriented practices to whole-family services and strategies . Family- and youth-driven services within counties vary and are challenged by funding barriers, but across counties, there appeared to be a transition towards the philosophy of serving the family as a whole .
Common Barriers Facing System leaders and Providers
Funding challenges often made it difficult to provide family- and youth-driven services. Fifteen percent of system leaders and providers raised the issue of funding when discussing family- and youth-driven services . according to county system leaders, strict criteria governing medi-cal provider certification and reimbursement and stringent rules that mandate a link between family treatment and a child’s diagnosis are among the obstacles providers face . The lack of flexible funding for family services also creates a barrier for families who need to access services . many found that the current funding system discourages family treatment and the family approach towards therapy .
State leaders also acknowledged that the ability to treat the family is limited by funding . many state leaders (seven out of 19), who discussed family ser-vices, spoke about funding, specifically, that funding is a major barrier for providing services to the whole family . Several of these respondents described funding as restrictive . One state leader explained that the “system is driven by medi-cal,” which requires that the child have an identified mental health condition to provide services and makes it difficult to provide services for the family . another respondent reported that when funding is so inte-grally tied to the individual child, the onus is on the provider “to be savvy about how they bill EPSDT.” Even when there is specific funding to support family treatment, sustaining these efforts is a major problem . another state leader explained that there are “specialty” programs for adults that counties have started through federal or foundation grants, as
the mhSa intended, but counties are struggling to find continuous funding for the programs .
Counties reported some unwillingness or diffi-culty in working with families. a few respondents spoke of the challenges and strategies regarding substance abuse treatment availability (N=12) . respondents (five of the 12) reflected on chal-lenges, such as the difficulty of collaborating with parents who have substance abuse problems and the need to treat them as well as their children . as one participant stated “You sort of hit the hardest issue, parents with SUD (substance use disorder) and dependency problems. Very hard to work with them before they have gotten their SUD needs met.” While families in need of addiction services are not the only group of families that counties reported they struggled to serve using a family-based approach, they were mentioned most frequently . Families whose services are court-ordered and some with child welfare involvement may also pose a chal-lenge . Families are sometimes resistant to treat-ment and services . respondents acknowledged the difficulty for families to care for their children when experiencing many significant additional stressors . another respondent explained the challenges due to funding, “The drug treatment services don’t neces-sarily get funded to support family involvement. The funds focus on the kids. The funding really needs to change. We take on a family-focus approach because you have to take into account family functionality.” and another respondent stated, “Adolescents need different outcomes and expectations for those with intact families. Sixty percent of kids live with adults who have substance abuse problems.”
Summary Responses of System leaders and Providers by Respondent’s Type, disciplines and Counties
County System Leaders
Overall, 85 percent of county leaders discussed family driven services . all counties demonstrated an awareness of the importance of family involvement, however, counties are involving families and pro-viding family services to varying degrees . Services and strategies ranged across counties and within counties . in general, many of the respondents (45
70
out of the 68 that spoke about the philosophy of family driven services) from the mental health field demonstrated a strong understanding of the need to treat the family as well as the child, and discussed various strategies to increase family and youth driven services and family involvement .
State System Leaders
State Leaders considered family involvement impor-tant, but they find counties vary on their ability to offer family focused services . The majority of state leaders (12 out of 18) acknowledged that counties are offering family-focused services to a certain degree, but that this was still sporadic, varying by county . Of the 10 respondents who spoke about california’s philosophy towards family and youth driven services, all 10 acknowledged the impor-tance . The ability to treat the family is limited by funding . many of the state leaders (eight out of the 18 who discussed family services) noted that funding is a major barrier for providing services to the whole family .
Providers
most of the providers (77 percent) also discussed family driven services . a majority of these providers (N=35) indicated that they use a family focused approach to offering services, and how this has been a shift for some . For instance, a provider in Butte county noted, “We used to sit around as profes-sionals, now we do [so] with families. It is empow-ering.” another provider in placer county explained that she now spends 80 percent of her time serving families . Other providers noted that serving the whole family is challenging given the severity of some parents’ struggles such as substance use disor-ders and some of the funding challenges to treating the whole family .
Across Disciplines
The majority of system leaders and providers across disciplines discussed family-driven services . Of the 52 system leaders and providers who discussed the philosophy of family-driven services, 71 percent spoke positively about implementing a family-driven philosophy, while 29 percent thought this was a challenge for their system . providers and system
leaders in juvenile justice had the highest percentage of providers who talked about family driven services as a challenge (71 percent), although there was a small number of juvenile justice providers that discussed the philosophy of family driven services (N=7) . Early childhood system leaders across the counties were especially committed to whole-family services . all 18 respondents addressed the issue of whole-family services and respondents consistently reported services available for the whole family . Fifty-four percent of the early childhood system leaders reported a variety of services offered for the whole family, such as training, education programs, and home visits available for teen parents and parents of children ages 0 to 5 . additionally, many of the respondents (45 out of the 68) spoke about the philosophy of family driven services from the mental health field . These leaders demonstrated a strong understanding of the need to treat the family as well as the child, and discussed various strategies to increase family and youth driven services and family involvement . This finding could be the result of the mhSa legislation .
Across Counties
all counties demonstrated an awareness of the importance of family involvement . at the same time, counties are involving families and providing family services to varying degrees . For example, seventy-nine providers and system leaders across counties discussed the philosophy of family services . in three counties, however, half or nearly half of the providers discussed challenges of family-driven services . at the same time, counties are taking steps to include families . San mateo county, for instance, has created family partnership teams, in San Diego families and youth participate on advocacy round-tables, and Santa clara county has staffed family partners to do targeted education and outreach . many (N=27) county respondents addressed the issue of funding when discussing family and youth driven services . counties reported experiencing some unwillingness or difficulties in working with families . Several respondents (10) spoke of the challenges and strategies regarding substance abuse treatment availability . respondents (three of the 10) reflected on challenges, such as the difficulty to collaborate with the parents who have substance
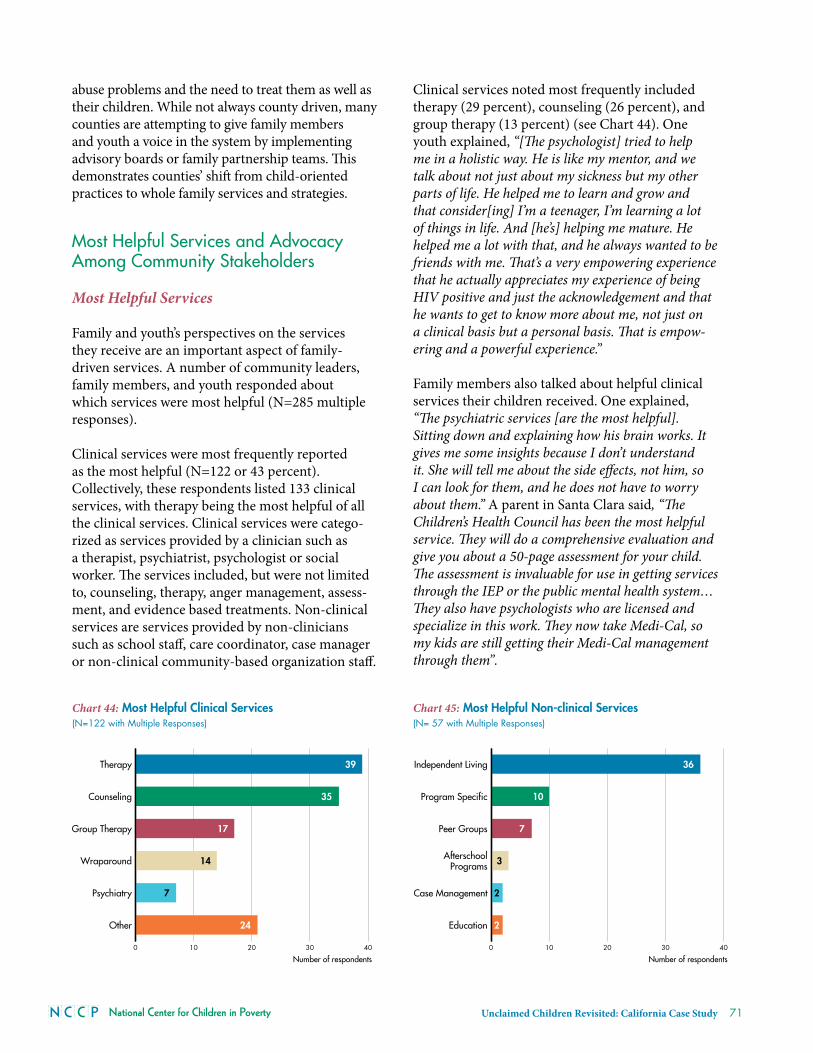
National Center for Children in Poverty Unclaimed Children Revisited: California Case Study 71
abuse problems and the need to treat them as well as their children . While not always county driven, many counties are attempting to give family members and youth a voice in the system by implementing advisory boards or family partnership teams . This demonstrates counties’ shift from child-oriented practices to whole family services and strategies .
Most Helpful Services and Advocacy Among Community Stakeholders
Most Helpful Services
Family and youth’s perspectives on the services they receive are an important aspect of family-driven services . a number of community leaders, family members, and youth responded about which services were most helpful (N=285 multiple responses) .
clinical services were most frequently reported as the most helpful (N=122 or 43 percent) . collectively, these respondents listed 133 clinical services, with therapy being the most helpful of all the clinical services . clinical services were catego-rized as services provided by a clinician such as a therapist, psychiatrist, psychologist or social worker . The services included, but were not limited to, counseling, therapy, anger management, assess-ment, and evidence based treatments . Non-clinical services are services provided by non-clinicians such as school staff, care coordinator, case manager or non-clinical community-based organization staff .
clinical services noted most frequently included therapy (29 percent), counseling (26 percent), and group therapy (13 percent) (see chart 44) . One youth explained, “[The psychologist] tried to help me in a holistic way. He is like my mentor, and we talk about not just about my sickness but my other parts of life. He helped me to learn and grow and that consider[ing] I’m a teenager, I’m learning a lot of things in life. And [he’s] helping me mature. He helped me a lot with that, and he always wanted to be friends with me. That’s a very empowering experience that he actually appreciates my experience of being HIV positive and just the acknowledgement and that he wants to get to know more about me, not just on a clinical basis but a personal basis. That is empow-ering and a powerful experience.”
Family members also talked about helpful clinical services their children received . One explained, “The psychiatric services [are the most helpful]. Sitting down and explaining how his brain works. It gives me some insights because I don’t understand it. She will tell me about the side effects, not him, so I can look for them, and he does not have to worry about them.” a parent in Santa clara said, “The Children’s Health Council has been the most helpful service. They will do a comprehensive evaluation and give you about a 50-page assessment for your child. The assessment is invaluable for use in getting services through the IEP or the public mental health system…They also have psychologists who are licensed and specialize in this work. They now take Medi-Cal, so my kids are still getting their Medi-Cal management through them”.
Chart 44: Most Helpful Clinical Services(N=122 with Multiple Responses)
0 10 20 30 40
Other
Psychiatry
Wraparound
Group Therapy
Counseling
Therapy
24
7
14
17
35
39
Number of respondents
Chart 45: Most Helpful Non-clinical Services(N= 57 with Multiple Responses)
0 10 20 30 40
Education
Case Management
AfterschoolPrograms
Peer Groups
Program Specific
Independent Living
2
2
3
7
10
36
Number of respondents

72
approximately 20 percent of respondents listed non-clinical services as the most helpful services . independent living programs were the most frequently (63 percent) reported helpful, non-clinical service, followed by specific programs that respondents named (17 percent) and peer groups (12 percent) (see chart 45) . One youth in humboldt county described the independent living program (iLp) in which he was living, “[It] helped me all the way, and now I got a job. They help with all kinds of things from referrals to money.” another youth in Santa cruz explained, “I’m in the ILP. They helped with rent and employment, life skills, school…they provided an employment specialist to help with [a] job and help find it and provided 200 hours of work and then find work.”
One family member described the community-based services received: “The most helpful place has been Art Share because their priority is the youth and the community. There is no other organization like that. What is so special about them is that they are generally there to help. Every time I go there they treat me like family…They have given me a place to belong.”
Most Helpful Services Among Specific Groups
Both rural and non-rural stakeholders found clin-ical services to be the most helpful . Of the non-rural stakeholders, 55 percent found clinical services to be the most helpful . Similarly, the majority (60 percent) of rural stakeholders also found clinical services the most helpful .
clinical services were popular among the majority (74 percent) of Spanish-speaking interviewees, and more so than English-speaking and other non-English-speaking respondents (see table 10).
Table 10: Respondents Who spoke about Clinical or non-clinical services, by Primary language
Clinical services
non-clinical services
English speakers 98 52
Spanish speakers 14 2
Other non-English speakers 10 3
Total (n) 122 57
While collectively community leaders, family members, and youth reported clinical services to be the most helpful, non-clinical services were the most popular among youth . This discrepancy most likely reflects independent living programs offered for transition-aged youth, as they were the most frequently reported helpful, non-clinical services .
Most Helpful Providers
community leaders, family, and youth found clinical workers to be the most helpful . Of those who discussed helpful service providers (N=320), over one-third (36 percent) reported clinical workers as the most helpful . The most frequently reported helpful clinical workers included: social workers (30 percent), counselors (27 percent), and therapists (22 percent) . For example, one youth in alameda county who found his social worker to be the most helpful explained, “I can always come ask her stuff if I don’t know how to do something. I don’t have anyone else I can ask. Anything I ask, she always
Box 15: youth in Mind
• A statewide organization made of young people affected by the mental health system. – Mission is to improve the lives of youth impacted by the mental health system through education, advocacy and collaboration.
– Members participate in all levels of system change including member leadership skills summits, mental health conferences and local advocacy opportunities.
Source: California Mental Health Advocates for Youth. 2009. Youth in Mind: Youth Inspiring Leadership and Advocacy in Mental Health. Accessed March 24, 2009 from http://www.cmhacy.org/conf-yla.html.
Chart 46: Community Stakeholder Views of Most Helpful People(N=320 with Multiple Responses)
Unclear6%Other
2%Medical
7%
Informal22%
Clinical36%
Non Clinical27%
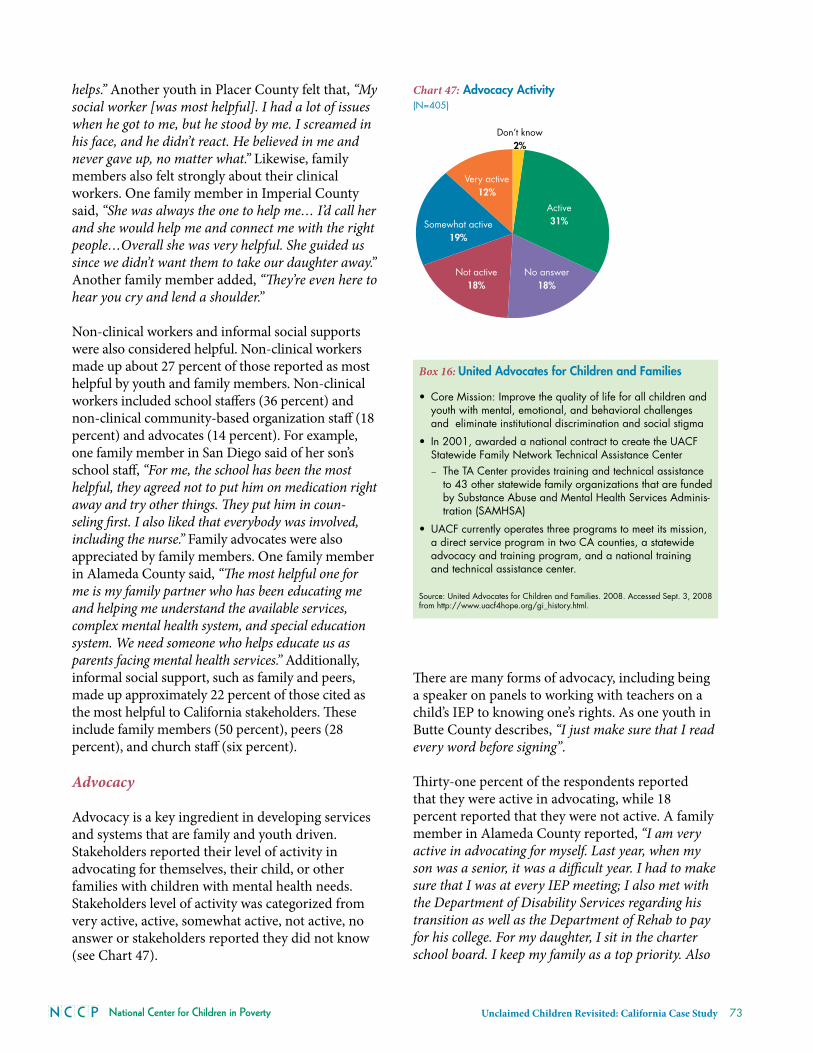
National Center for Children in Poverty Unclaimed Children Revisited: California Case Study 73
helps.” another youth in placer county felt that, “My social worker [was most helpful]. I had a lot of issues when he got to me, but he stood by me. I screamed in his face, and he didn’t react. He believed in me and never gave up, no matter what.” Likewise, family members also felt strongly about their clinical workers . One family member in imperial county said, “She was always the one to help me… I’d call her and she would help me and connect me with the right people…Overall she was very helpful. She guided us since we didn’t want them to take our daughter away.” another family member added, “They’re even here to hear you cry and lend a shoulder.”
Non-clinical workers and informal social supports were also considered helpful . Non-clinical workers made up about 27 percent of those reported as most helpful by youth and family members . Non-clinical workers included school staffers (36 percent) and non-clinical community-based organization staff (18 percent) and advocates (14 percent) . For example, one family member in San Diego said of her son’s school staff, “For me, the school has been the most helpful, they agreed not to put him on medication right away and try other things. They put him in coun-seling first. I also liked that everybody was involved, including the nurse.” Family advocates were also appreciated by family members . One family member in alameda county said, “The most helpful one for me is my family partner who has been educating me and helping me understand the available services, complex mental health system, and special education system. We need someone who helps educate us as parents facing mental health services.” additionally, informal social support, such as family and peers, made up approximately 22 percent of those cited as the most helpful to california stakeholders . These include family members (50 percent), peers (28 percent), and church staff (six percent) .
Advocacy
advocacy is a key ingredient in developing services and systems that are family and youth driven . Stakeholders reported their level of activity in advocating for themselves, their child, or other families with children with mental health needs . Stakeholders level of activity was categorized from very active, active, somewhat active, not active, no answer or stakeholders reported they did not know (see chart 47) .
There are many forms of advocacy, including being a speaker on panels to working with teachers on a child’s iEp to knowing one’s rights . as one youth in Butte county describes, “I just make sure that I read every word before signing” .
Thirty-one percent of the respondents reported that they were active in advocating, while 18 percent reported that they were not active . a family member in alameda county reported, “I am very active in advocating for myself. Last year, when my son was a senior, it was a difficult year. I had to make sure that I was at every IEP meeting; I also met with the Department of Disability Services regarding his transition as well as the Department of Rehab to pay for his college. For my daughter, I sit in the charter school board. I keep my family as a top priority. Also
Box 16: united advocates for Children and families
• Core Mission: Improve the quality of life for all children and youth with mental, emotional, and behavioral challenges and eliminate institutional discrimination and social stigma
• In 2001, awarded a national contract to create the UACF Statewide Family Network Technical Assistance Center – The TA Center provides training and technical assistance to 43 other statewide family organizations that are funded by Substance Abuse and Mental Health Services Adminis-tration (SAMHSA)
• UACF currently operates three programs to meet its mission, a direct service program in two CA counties, a statewide advocacy and training program, and a national training and technical assistance center.
Source: United Advocates for Children and Families. 2008. Accessed Sept. 3, 2008 from http://www.uacf4hope.org/gi_history.html.
Chart 47: Advocacy Activity (N=405)
Very active12%
Somewhat active19%
Not active18%
No answer18%
Active31%
Don’t know2%
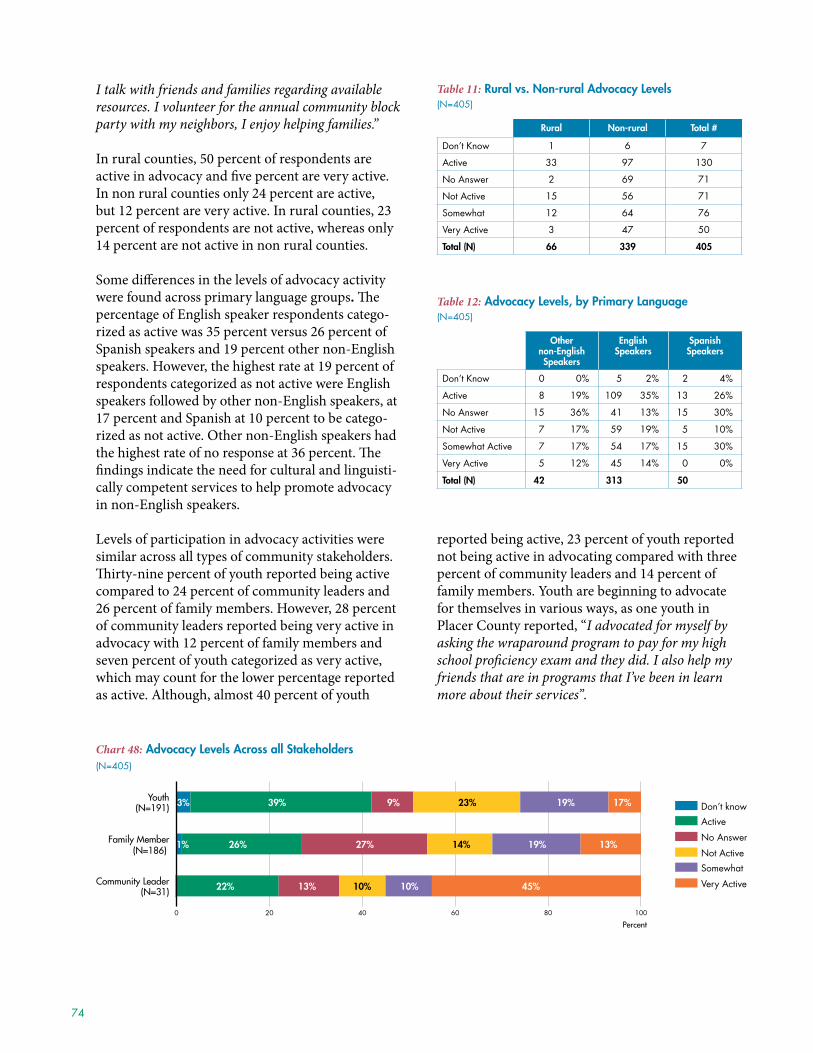
74
I talk with friends and families regarding available resources. I volunteer for the annual community block party with my neighbors, I enjoy helping families.”
in rural counties, 50 percent of respondents are active in advocacy and five percent are very active . in non rural counties only 24 percent are active, but 12 percent are very active . in rural counties, 23 percent of respondents are not active, whereas only 14 percent are not active in non rural counties .
Some differences in the levels of advocacy activity were found across primary language groups. The percentage of English speaker respondents catego-rized as active was 35 percent versus 26 percent of Spanish speakers and 19 percent other non-English speakers . however, the highest rate at 19 percent of respondents categorized as not active were English speakers followed by other non-English speakers, at 17 percent and Spanish at 10 percent to be catego-rized as not active . Other non-English speakers had the highest rate of no response at 36 percent . The findings indicate the need for cultural and linguisti-cally competent services to help promote advocacy in non-English speakers .
Levels of participation in advocacy activities were similar across all types of community stakeholders . Thirty-nine percent of youth reported being active compared to 24 percent of community leaders and 26 percent of family members . however, 28 percent of community leaders reported being very active in advocacy with 12 percent of family members and seven percent of youth categorized as very active, which may count for the lower percentage reported as active . although, almost 40 percent of youth
reported being active, 23 percent of youth reported not being active in advocating compared with three percent of community leaders and 14 percent of family members . youth are beginning to advocate for themselves in various ways, as one youth in placer county reported, “I advocated for myself by asking the wraparound program to pay for my high school proficiency exam and they did. I also help my friends that are in programs that I’ve been in learn more about their services”.
Chart 48: Advocacy Levels Across all Stakeholders (N=405)
Don’t knowActive
No Answer
Not ActiveSomewhat
Very Active
0 20 40 60 80 100
Very Active
Somewhat
Not Active
No Answer
Active
Don’t knowCommunity Leader
Family Member
Youth
0 20 40 60 80 100
Community Leader(N=31)
Family Member(N=186)
Youth(N=191) 3% 39% 9% 23% 19% 17%
1% 26% 27% 14% 19% 13%
22% 13% 10% 10% 45%
Percent
Table 11: Rural vs. non-rural advocacy levels (N=405)
Rural non-rural Total #
Don’t Know 1 6 7
Active 33 97 130
No Answer 2 69 71
Not Active 15 56 71
Somewhat 12 64 76
Very Active 3 47 50
Total (n) 66 339 405
Table 12: advocacy levels, by Primary language (N=405)
Other non-English speakers
English speakers
spanish speakers
Don’t Know 0 0% 5 2% 2 4%
Active 8 19% 109 35% 13 26%
No Answer 15 36% 41 13% 15 30%
Not Active 7 17% 59 19% 5 10%
Somewhat Active 7 17% 54 17% 15 30%
Very Active 5 12% 45 14% 0 0%
Total (n) 42 313 50
National Center for Children in Poverty Unclaimed Children Revisited: California Case Study 75
Chapter Summary
researchers, advocates, and policy makers acknowl-edge family- and youth-driven services are a core component in promoting the transition from a child-centered perspective to a family-centered perspective in children’s mental health policy and practice .72 Family and youth involvement and advo-cacy is a fundamental aspect to family- and youth-driven services . This chapter examined key infor-mants’ (state and county system leaders, providers, family members, and youth) perspectives on family- and youth-driven services and involvement .
Overall, system leaders and providers recognized the importance of family- and youth-driven services to support and promote positive change for chil-dren and youth and their families . most often, respondents reported on direct services that were offered at a local, county, and state level to treat the whole family . however, state or county strategies to promote the philosophy of family- and youth-driven services were not always consistent .
System leaders and providers discussed the array of services offered by their county or organization . They emphasized clinical treatments provided to children, youth, and families . interestingly, in the analysis of the family and youth stakeholder inter-views, we found that family member and youthstakeholders perceived clinical services and clinical workers to be the most helpful . in addition, family members and youth found community-based services to be the most helpful .
System leaders and providers described strategies and challenges to youth and family advocacy and involvement . These strategies reflect variation in involvement and advocacy by county and discipline . analysis of the community leaders, family members and youth stakeholders reinforces this theme . Over one third of youth reported being actively involved in advocating for themselves or others with mental health care needs . There was significant involvement in advocacy by family members, youth and commu-nity leaders, but there is still progress to be made, specifically with non-English speaking stakeholders .
The chapter provides insight into the perspectives of system leaders, providers, family members, and youth at a county and state level . The targeted coun-ties appear to embrace the philosophy of family- and youth-driven care . although, the philosophy is not fully embedded in practice across all coun-ties and disciplines, there is progress being made towards family- and youth-driven services and care .
progress varies by county and within county, and in order to create greater system-wide change, policies and funding streams need to facilitate family- and youth-driven services . Strategies need to go beyond providing direct services for select populations and reflect the overall philosophy of family- and youth-driven care where services are customized based on the individual needs of the child/youth and his or her family and at their direction . These changes in philosophy need to come from leadership at the state and county level to encourage the system to look at the family as a whole and perceive the family as a partner in reaching the desired goals of each child, youth, and family .
Policy Recommendations
The state of California and counties should:♦ enact policies and funding streams need to facili-
tate family and youth-driven services;♦ ensure that strategies should reflect overall
philosophy of family and youth-driven care; and♦ build capacity for more culturally and linguisti-
cally competent services to help promote advo-cacy among non-English speakers .
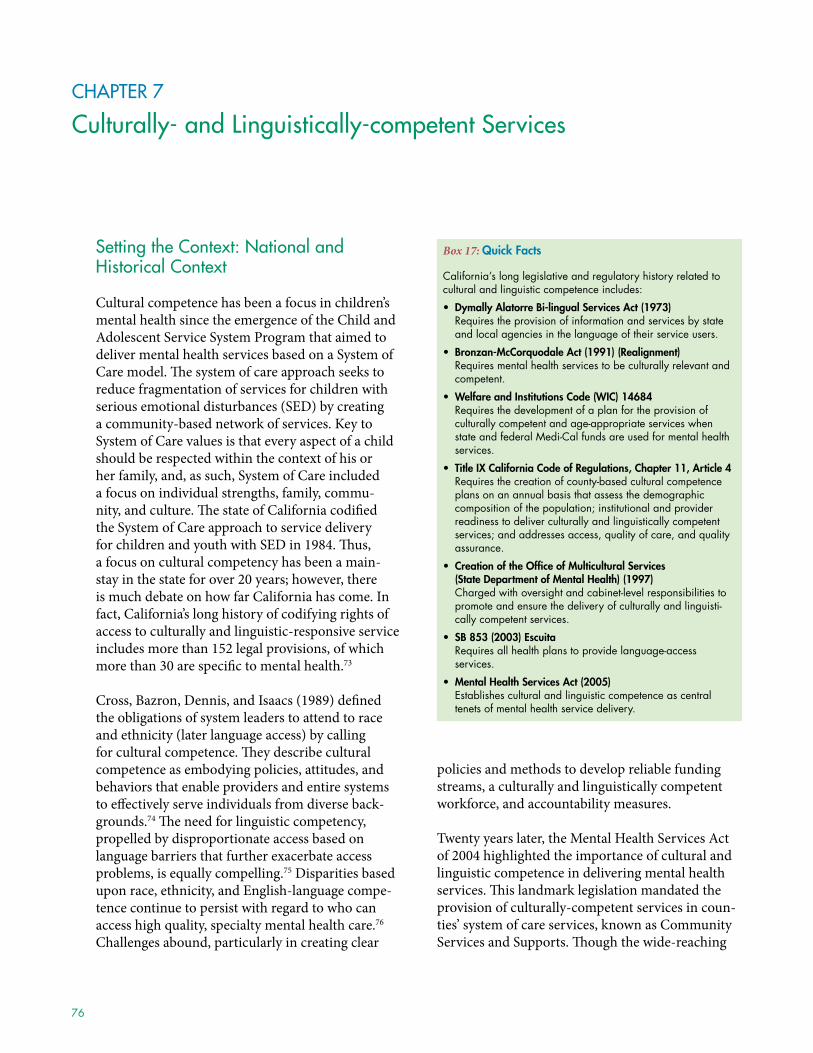
76
CHAPTeR 7
Culturally- and linguistically-competent Services
Setting the Context: National and Historical Context
cultural competence has been a focus in children’s mental health since the emergence of the child and adolescent Service System program that aimed to deliver mental health services based on a System of care model . The system of care approach seeks to reduce fragmentation of services for children with serious emotional disturbances (SED) by creating a community-based network of services . Key to System of care values is that every aspect of a child should be respected within the context of his or her family, and, as such, System of care included a focus on individual strengths, family, commu-nity, and culture . The state of california codified the System of care approach to service delivery for children and youth with SED in 1984 . Thus, a focus on cultural competency has been a main-stay in the state for over 20 years; however, there is much debate on how far california has come . in fact, california’s long history of codifying rights of access to culturally and linguistic-responsive service includes more than 152 legal provisions, of which more than 30 are specific to mental health .73
cross, Bazron, Dennis, and isaacs (1989) defined the obligations of system leaders to attend to race and ethnicity (later language access) by calling for cultural competence . They describe cultural competence as embodying policies, attitudes, and behaviors that enable providers and entire systems to effectively serve individuals from diverse back-grounds .74 The need for linguistic competency, propelled by disproportionate access based on language barriers that further exacerbate access problems, is equally compelling .75 Disparities based upon race, ethnicity, and English-language compe-tence continue to persist with regard to who can access high quality, specialty mental health care .76 challenges abound, particularly in creating clear
policies and methods to develop reliable funding streams, a culturally and linguistically competent workforce, and accountability measures .
twenty years later, the mental health Services act of 2004 highlighted the importance of cultural and linguistic competence in delivering mental health services . This landmark legislation mandated the provision of culturally-competent services in coun-ties’ system of care services, known as community Services and Supports . Though the wide-reaching
Box 17: Quick facts
California’s long legislative and regulatory history related to cultural and linguistic competence includes:
• dymally alatorre Bi-lingual services act (1973) Requires the provision of information and services by state and local agencies in the language of their service users.
• Bronzan-McCorquodale act (1991) (Realignment) Requires mental health services to be culturally relevant and competent.
• Welfare and institutions Code (WiC) 14684 Requires the development of a plan for the provision of culturally competent and age-appropriate services when state and federal Medi-Cal funds are used for mental health services.
• Title iX California Code of Regulations, Chapter 11, article 4 Requires the creation of county-based cultural competence plans on an annual basis that assess the demographic composition of the population; institutional and provider readiness to deliver culturally and linguistically competent services; and addresses access, quality of care, and quality assurance.
• Creation of the Office of Multicultural services (state department of Mental health) (1997)Charged with oversight and cabinet-level responsibilities to promote and ensure the delivery of culturally and linguisti-cally competent services.
• sB 853 (2003) Escuita Requires all health plans to provide language-access services.
• Mental health services act (2005) Establishes cultural and linguistic competence as central tenets of mental health service delivery.
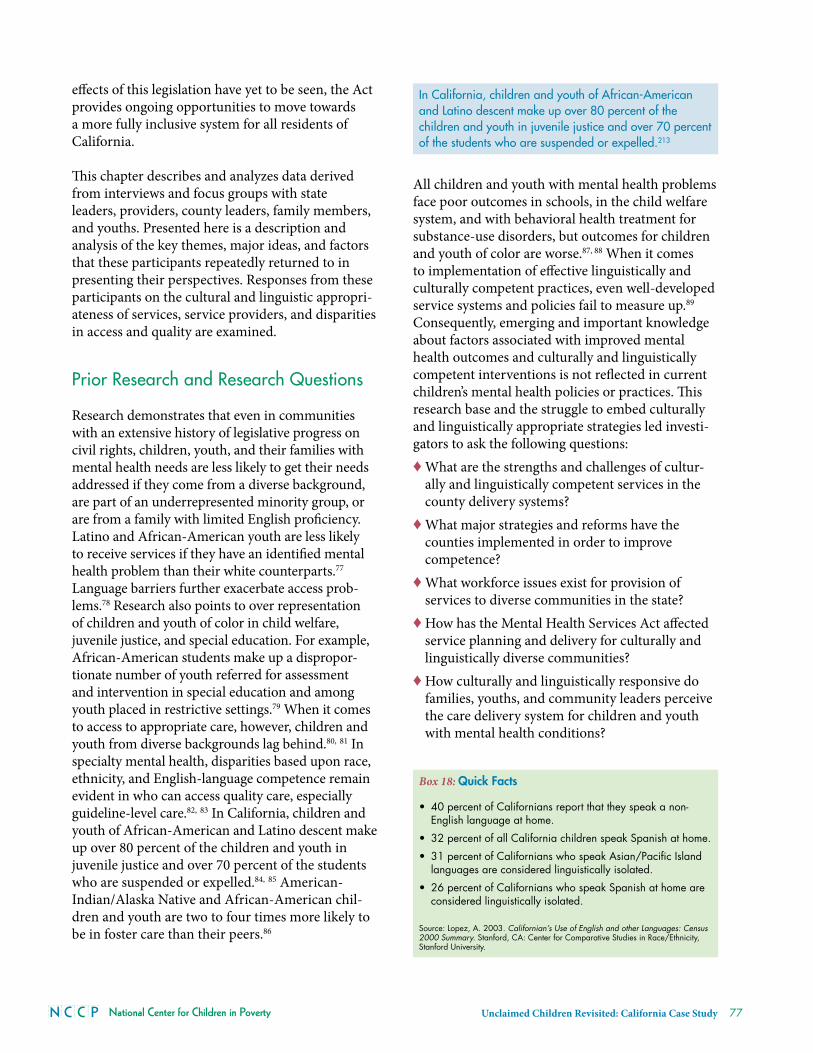
National Center for Children in Poverty Unclaimed Children Revisited: California Case Study 77
effects of this legislation have yet to be seen, the act provides ongoing opportunities to move towards a more fully inclusive system for all residents of california .
This chapter describes and analyzes data derived from interviews and focus groups with state leaders, providers, county leaders, family members, and youths . presented here is a description and analysis of the key themes, major ideas, and factors that these participants repeatedly returned to in presenting their perspectives . responses from these participants on the cultural and linguistic appropri-ateness of services, service providers, and disparities in access and quality are examined .
Prior Research and Research Questions
research demonstrates that even in communities with an extensive history of legislative progress on civil rights, children, youth, and their families with mental health needs are less likely to get their needs addressed if they come from a diverse background, are part of an underrepresented minority group, or are from a family with limited English proficiency . Latino and african-american youth are less likely to receive services if they have an identified mental health problem than their white counterparts .77 Language barriers further exacerbate access prob-lems .78 research also points to over representation of children and youth of color in child welfare, juvenile justice, and special education . For example, african-american students make up a dispropor-tionate number of youth referred for assessment and intervention in special education and among youth placed in restrictive settings .79 When it comes to access to appropriate care, however, children and youth from diverse backgrounds lag behind .80, 81 in specialty mental health, disparities based upon race, ethnicity, and English-language competence remain evident in who can access quality care, especially guideline-level care .82, 83 in california, children and youth of african-american and Latino descent make up over 80 percent of the children and youth in juvenile justice and over 70 percent of the students who are suspended or expelled .84, 85 american-indian/alaska Native and african-american chil-dren and youth are two to four times more likely to be in foster care than their peers .86
all children and youth with mental health problems face poor outcomes in schools, in the child welfare system, and with behavioral health treatment for substance-use disorders, but outcomes for children and youth of color are worse .87, 88 When it comes to implementation of effective linguistically and culturally competent practices, even well-developed service systems and policies fail to measure up .89 consequently, emerging and important knowledge about factors associated with improved mental health outcomes and culturally and linguistically competent interventions is not reflected in current children’s mental health policies or practices . This research base and the struggle to embed culturally and linguistically appropriate strategies led investi-gators to ask the following questions:♦ What are the strengths and challenges of cultur-
ally and linguistically competent services in the county delivery systems?
♦ What major strategies and reforms have the counties implemented in order to improve competence?
♦ What workforce issues exist for provision of services to diverse communities in the state?
♦ how has the mental health Services act affected service planning and delivery for culturally and linguistically diverse communities?
♦ how culturally and linguistically responsive do families, youths, and community leaders perceive the care delivery system for children and youth with mental health conditions?
Box 18: Quick facts
• 40 percent of Californians report that they speak a non-English language at home.
• 32 percent of all California children speak Spanish at home.
• 31 percent of Californians who speak Asian/Pacific Island languages are considered linguistically isolated.
• 26 percent of Californians who speak Spanish at home are considered linguistically isolated.
Source: Lopez, A. 2003. Californian’s Use of English and other Languages: Census 2000 Summary. Stanford, CA: Center for Comparative Studies in Race/Ethnicity, Stanford University.
in California, children and youth of African-American and latino descent make up over 80 percent of the children and youth in juvenile justice and over 70 percent of the students who are suspended or expelled.213
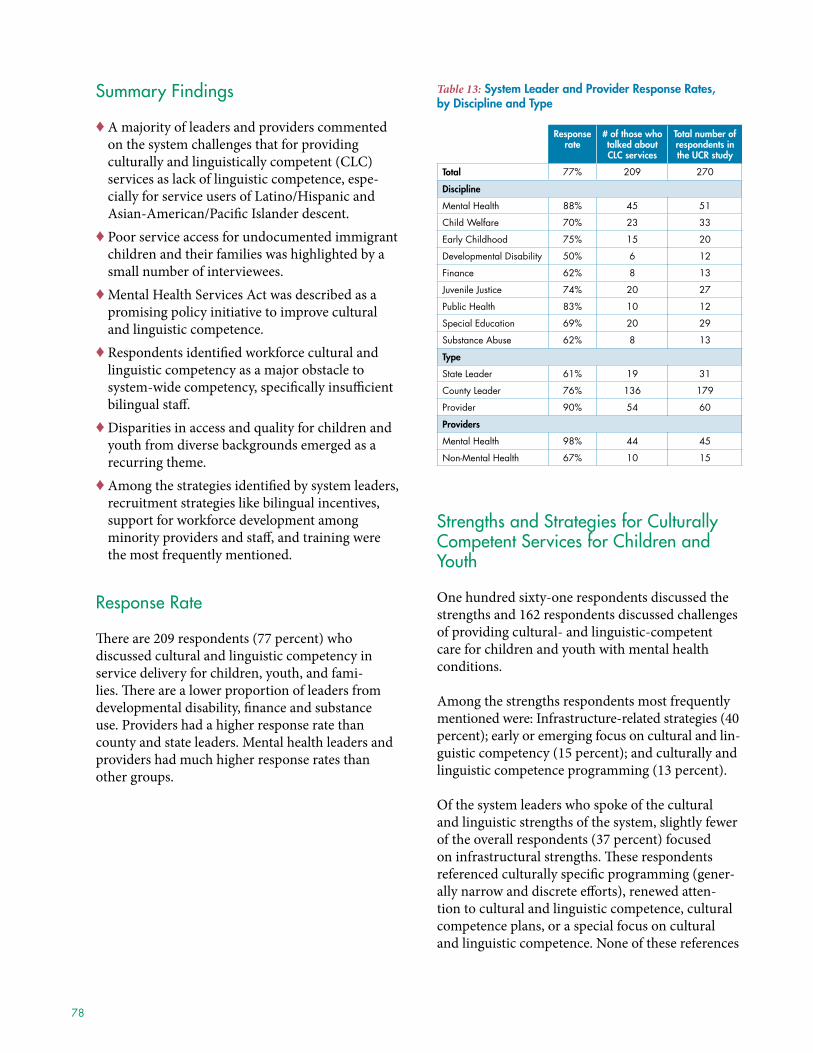
78
Summary Findings
♦ a majority of leaders and providers commented on the system challenges that for providing culturally and linguistically competent (cLc)services as lack of linguistic competence, espe-cially for service users of Latino/hispanic and asian-american/pacific islander descent .
♦ poor service access for undocumented immigrant children and their families was highlighted by a small number of interviewees .
♦ mental health Services act was described as a promising policy initiative to improve cultural and linguistic competence .
♦ respondents identified workforce cultural and linguistic competency as a major obstacle to system-wide competency, specifically insufficient bilingual staff .
♦ Disparities in access and quality for children and youth from diverse backgrounds emerged as a recurring theme .
♦ among the strategies identified by system leaders, recruitment strategies like bilingual incentives, support for workforce development among minority providers and staff, and training were the most frequently mentioned .
Response Rate
There are 209 respondents (77 percent) who discussed cultural and linguistic competency in service delivery for children, youth, and fami-lies . There are a lower proportion of leaders from developmental disability, finance and substance use . providers had a higher response rate than county and state leaders . mental health leaders and providers had much higher response rates than other groups .
Table 13: system leader and Provider Response Rates, by discipline and Type
Response rate
# of those who talked about ClC services
Total number of respondents in the uCR study
Total 77% 209 270
discipline
Mental Health 88% 45 51
Child Welfare 70% 23 33
Early Childhood 75% 15 20
Developmental Disability 50% 6 12
Finance 62% 8 13
Juvenile Justice 74% 20 27
Public Health 83% 10 12
Special Education 69% 20 29
Substance Abuse 62% 8 13
Type
State Leader 61% 19 31
County Leader 76% 136 179
Provider 90% 54 60
Providers
Mental Health 98% 44 45
Non-Mental Health 67% 10 15
Strengths and Strategies for Culturally Competent Services for Children and youth
One hundred sixty-one respondents discussed the strengths and 162 respondents discussed challenges of providing cultural- and linguistic-competent care for children and youth with mental health conditions .
among the strengths respondents most frequently mentioned were: infrastructure-related strategies (40 percent); early or emerging focus on cultural and lin-guistic competency (15 percent); and culturally and linguistic competence programming (13 percent) .
Of the system leaders who spoke of the cultural and linguistic strengths of the system, slightly fewer of the overall respondents (37 percent) focused on infrastructural strengths . These respondents referenced culturally specific programming (gener-ally narrow and discrete efforts), renewed atten-tion to cultural and linguistic competence, cultural competence plans, or a special focus on cultural and linguistic competence . None of these references
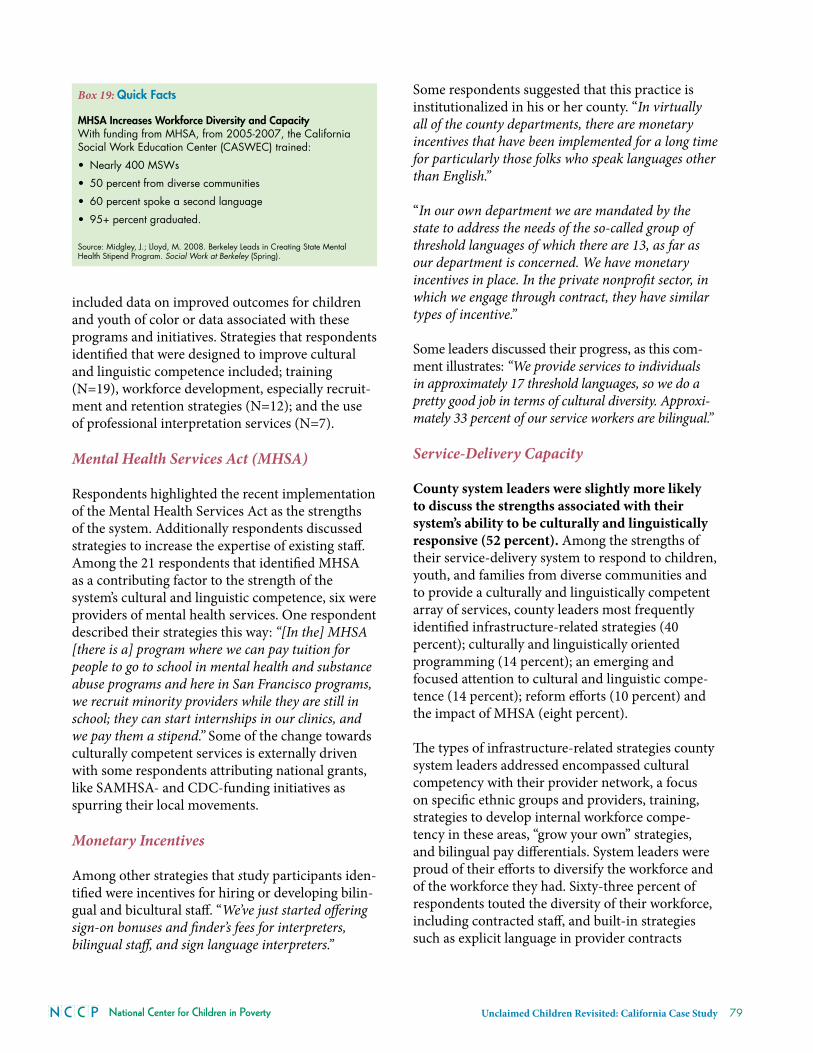
National Center for Children in Poverty Unclaimed Children Revisited: California Case Study 79
included data on improved outcomes for children and youth of color or data associated with these programs and initiatives . Strategies that respondents identified that were designed to improve cultural and linguistic competence included; training (N=19), workforce development, especially recruit-ment and retention strategies (N=12); and the use of professional interpretation services (N=7) .
Mental Health Services Act (MHSA)
respondents highlighted the recent implementation of the mental health Services act as the strengths of the system . additionally respondents discussed strategies to increase the expertise of existing staff . among the 21 respondents that identified mhSa as a contributing factor to the strength of the system’s cultural and linguistic competence, six were providers of mental health services . One respondent described their strategies this way: “[In the] MHSA [there is a] program where we can pay tuition for people to go to school in mental health and substance abuse programs and here in San Francisco programs, we recruit minority providers while they are still in school; they can start internships in our clinics, and we pay them a stipend.” Some of the change towards culturally competent services is externally driven with some respondents attributing national grants, like SamhSa- and cDc-funding initiatives as spurring their local movements .
Monetary Incentives
among other strategies that study participants iden-tified were incentives for hiring or developing bilin-gual and bicultural staff . “We’ve just started offering sign-on bonuses and finder’s fees for interpreters, bilingual staff, and sign language interpreters.”
Some respondents suggested that this practice is institutionalized in his or her county . “In virtually all of the county departments, there are monetary incentives that have been implemented for a long time for particularly those folks who speak languages other than English.”
“In our own department we are mandated by the state to address the needs of the so-called group of threshold languages of which there are 13, as far as our department is concerned. We have monetary incentives in place. In the private nonprofit sector, in which we engage through contract, they have similar types of incentive.”
Some leaders discussed their progress, as this com-ment illustrates: “We provide services to individuals in approximately 17 threshold languages, so we do a pretty good job in terms of cultural diversity. Approxi-mately 33 percent of our service workers are bilingual.”
Service-Delivery Capacity
County system leaders were slightly more likely to discuss the strengths associated with their system’s ability to be culturally and linguistically responsive (52 percent). among the strengths of their service-delivery system to respond to children, youth, and families from diverse communities and to provide a culturally and linguistically competent array of services, county leaders most frequently identified infrastructure-related strategies (40 percent); culturally and linguistically oriented programming (14 percent); an emerging and focused attention to cultural and linguistic compe-tence (14 percent); reform efforts (10 percent) and the impact of mhSa (eight percent) .
The types of infrastructure-related strategies county system leaders addressed encompassed cultural competency with their provider network, a focus on specific ethnic groups and providers, training, strategies to develop internal workforce compe-tency in these areas, “grow your own” strategies, and bilingual pay differentials . System leaders were proud of their efforts to diversify the workforce and of the workforce they had . Sixty-three percent of respondents touted the diversity of their workforce, including contracted staff, and built-in strategies such as explicit language in provider contracts
Box 19: Quick facts
Mhsa increases Workforce diversity and CapacityWith funding from MHSA, from 2005-2007, the California Social Work Education Center (CASWEC) trained:
• Nearly 400 MSWs
• 50 percent from diverse communities
• 60 percent spoke a second language
• 95+ percent graduated.
Source: Midgley, J.; Lloyd, M. 2008. Berkeley Leads in Creating State Mental Health Stipend Program. Social Work at Berkeley (Spring).
80
that addressed cultural and linguistic competence . about 12 percent of the respondents on infrastruc-tural strengths alluded to programming . Over half of these respondents focused on Latino staff and 10 percent focused on asian/pacific island staff . a handful of respondents mentioned provider strength and capacity among african-american, Native, or russian providers or programs . in terms of training, respondents talked mostly about efforts to push for certification, improved assessments, and requirements that staff complete annual training . a small number of respondents on infrastructural strengths focused on strategies to develop internal county capacity . Some comments referred to the capacity presented through mhSa, but others, like this county mental health leader, talked about recent efforts that are being institutionalized, “Another change [is] a very strong focus to have a very diverse staff, in last couple years. Keep internship program, host master’s getting degree. Culturally, language proficient, pipeline, I started, only hire for linguistic competence. It shifted the ethnic and linguistic compe-tence of staff, demographic change to reflect people who need services.”
Challenges in Culturally Competent Care for Children and youth
Key among the challenges discussed were barriers to infrastructure (40 percent), disproportionate numbers of underserved children and youth of diverse backgrounds (17 percent), and stigma (nine percent) . among those who focused on infrastruc-tural challenges of cultural and linguistic competence in their localities, a clear majority (65 percent) of these respondents focused on lack of culturally and linguistically competent staff . Of the respondents that reported lack of cultural and linguistic competence among service providers, over a quarter referred to the lack of staff bilingual in Spanish and cultural competence with Latino service users and their fami-lies . close to another one-fifth of these respondents focused on the asian/pacific islander population .
Workforce Capacity
insights from respondents discussing inadequate workforce competency regarding cultural and linguistic abilities were particularly poignant .
“[The county] lack[s]…clinicians who [are] skilled or experienced in language, race, and relational abili-ties. The county is multi-ethnic; many providers are mono-lingual,” is how one county system leader in early childhood described the situation in his/her county . another respondent, a mental health provider, described the workforce issue in this way, “To answer the workforce question I would say that there is a lack of a diverse workforce. Who provides services? They are white women. And who needs the services? They are African-American young men or Asian elder women. The population that needs services [is] not white anymore. I think public mental health services [needs to] be systematic, working with families, be cultural competent.”
another mental health provider described the poor alignment between service users and providers this way: “There are a lot of things they don’t understand. Our community is growing way too fast, and we are not up-to-date, nor do we have the staff. County employees are overworked and barely keeping up, they should be a step ahead. One of the main shortages is linguistic competency, and cultural awareness it is not up to par. Not even basic human contact, the way they greet and talk to clients. They are not friendly.” respondents acknowledged that a wide range of training was available but questioned the caliber of training on cultural competence, with one respon-dent commenting, “[Regarding] cultural competence, the county is strong on words and weak in action. They think a four-hour training session discussing racism is good enough. The level of discourse is unin-telligent and not practical.”
The focus by respondents on linguistic compe-tence was particularly strong . These participants often intertwined the needs of Latino and asian americans with the need for linguistic competency, although in some instances (N=5), the needs of non-English speakers were generically pinpointed .
Disparities in Access to CLC Services
a recognized system challenge that respondents linked to inadequate cultural and linguistic compe-tence is service access among children and youth from diverse backgrounds and their families . Fifty-four respondents discussed disparities in access
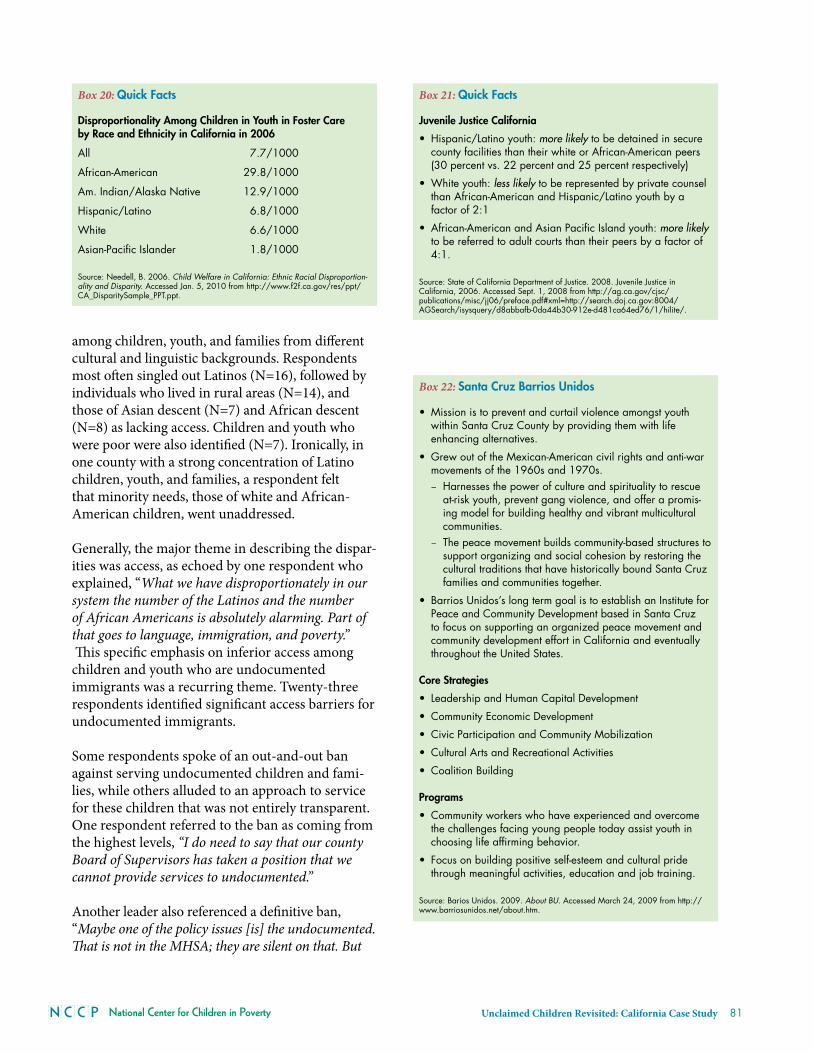
National Center for Children in Poverty Unclaimed Children Revisited: California Case Study 81
Box 20: Quick facts
disproportionality among Children in youth in foster Care by Race and Ethnicity in California in 2006
All 7.7/1000
African-American 29.8/1000
Am. Indian/Alaska Native 12.9/1000
Hispanic/Latino 6.8/1000
White 6.6/1000
Asian-Pacific Islander 1.8/1000
Source: Needell, B. 2006. Child Welfare in California: Ethnic Racial Disproportion-ality and Disparity. Accessed Jan. 5, 2010 from http://www.f2f.ca.gov/res/ppt/CA_DisparitySample_PPT.ppt.
among children, youth, and families from different cultural and linguistic backgrounds . respondents most often singled out Latinos (N=16), followed by individuals who lived in rural areas (N=14), and those of asian descent (N=7) and african descent (N=8) as lacking access . children and youth who were poor were also identified (N=7) . ironically, in one county with a strong concentration of Latino children, youth, and families, a respondent felt that minority needs, those of white and african-american children, went unaddressed .
Generally, the major theme in describing the dispar-ities was access, as echoed by one respondent who explained, “What we have disproportionately in our system the number of the Latinos and the number of African Americans is absolutely alarming. Part of that goes to language, immigration, and poverty.” This specific emphasis on inferior access among children and youth who are undocumented immigrants was a recurring theme . twenty-three respondents identified significant access barriers for undocumented immigrants .
Some respondents spoke of an out-and-out ban against serving undocumented children and fami-lies, while others alluded to an approach to service for these children that was not entirely transparent . One respondent referred to the ban as coming from the highest levels, “I do need to say that our county Board of Supervisors has taken a position that we cannot provide services to undocumented.”
another leader also referenced a definitive ban, “Maybe one of the policy issues [is] the undocumented. That is not in the MHSA; they are silent on that. But
Box 21: Quick facts
Juvenile Justice California
• Hispanic/Latino youth: morelikely to be detained in secure county facilities than their white or African-American peers (30 percent vs. 22 percent and 25 percent respectively)
• White youth: lesslikely to be represented by private counsel than African-American and Hispanic/Latino youth by a factor of 2:1
• African-American and Asian Pacific Island youth: morelikely to be referred to adult courts than their peers by a factor of 4:1.
Source: State of California Department of Justice. 2008. Juvenile Justice in California, 2006. Accessed Sept. 1, 2008 from http://ag.ca.gov/cjsc/publications/misc/jj06/preface.pdf#xml=http://search.doj.ca.gov:8004/AGSearch/isysquery/d8abbafb-0da44b30-912e-d481ca64ed76/1/hilite/.
Box 22: santa Cruz Barrios unidos
• Mission is to prevent and curtail violence amongst youth within Santa Cruz County by providing them with life enhancing alternatives.
• Grew out of the Mexican-American civil rights and anti-war movements of the 1960s and 1970s. – Harnesses the power of culture and spirituality to rescue at-risk youth, prevent gang violence, and offer a promis-ing model for building healthy and vibrant multicultural communities.
– The peace movement builds community-based structures to support organizing and social cohesion by restoring the cultural traditions that have historically bound Santa Cruz families and communities together.
• Barrios Unidos’s long term goal is to establish an Institute for Peace and Community Development based in Santa Cruz to focus on supporting an organized peace movement and community development effort in California and eventually throughout the United States.
Core strategies
• Leadership and Human Capital Development
• Community Economic Development
• Civic Participation and Community Mobilization
• Cultural Arts and Recreational Activities
• Coalition Building
Programs
• Community workers who have experienced and overcome the challenges facing young people today assist youth in choosing life affirming behavior.
• Focus on building positive self-esteem and cultural pride through meaningful activities, education and job training.
Source: Barios Unidos. 2009. About BU. Accessed March 24, 2009 from http://www.barriosunidos.net/about.htm.
82
our county has taken the position that they cannot be served through public dollars .” Others have perceived this very silence in mhSa to be a strength; one remark that typifies this sentiment suggests that mhSa is being used as a vehicle to serve the undocu-mented . a county system leader in special education said, “It has allowed counties to serve other people who may not be chronically ill or may not receive Medi-Cal funding, such as uninsured or undocumented individ-uals, older adults, or children aged 0 to 5 years.”
Several other respondents talked about services to the undocumented in a manner that suggested policies were somewhat murky and implementation mixed . “For undocumented clients in LA, it’s pretty much “don’t ask, don’t tell.” MHSA covers them as ‘uninsured’ though not eligible for Medi-Cal. That is very limited.”
a small minority of respondents named a major system challenge related to cultural and linguistic competence as racism (less than five percent) . Six system leaders and five providers talked about “straight out racism,” “segregation,” and “discrimina-tion” based upon an inability to speak English . The system leaders came from across all sectors, and the providers were from four different counties .
Workforce
The main types of infrastructure-related challenges county system leaders highlighted included lack of cultural and linguistic competence among the workforce (N=58), funding (N=6), training (N=4), and attrition (N=3) .
One county child welfare leader summed up the conundrum leaders face with regard to attrition, “The schools pay much better and [so do the] two prisons here.”
more than 85 percent of the county system leaders that focused on challenges related to infrastruc-ture to support cultural and linguistic competence pointed to workforce competence and capacity issues as major barriers . in particular, of the 75 respondents on this subject, 58 emphasized lack of cultural and linguistic competence among existing staff . Lack of culturally appropriate providers for Latino and asian/pacific islander children, youth, and families was the most frequently identified problem (25 percent) .
The dilemma for county leaders to deliver effec-tive services through improved language access is encapsulated in this response from a county mental health system leader, “We can’t interview people in Spanish and that can’t be any part of our interview. We look for Spanish-speaking clinicians. There is a test they pass that is ridiculous. We did not have a chance to assess their language skills in a more clinical kind of way. This is, to me, problematic. This impacts service delivery. Some pass the test, but can’t provide language services to clients.”
among asian/pacific islanders, hmong, chinese, and tagalog were most frequently identified as language and cultural needs that providers were unable to address with current staffing patterns . african-american (10 percent of respondents), Native (six percent), arab-american, russian, and african (less than five percent respectively) were racial/ethnic and language groups that were also identified as presenting challenges to the current workforce . all counties were represented among those who reported shortages in cultur-ally competent staff for Latino and asian/pacific islander service users . however, humboldt and Butte specially mentioned the need for more staff supports for hmong service users . For african-american service users, county leaders in the Bay area and imperial counties were most likely to express a need for more cultural competence among service providers .
For Native service users, system leaders in humboldt, Los angeles, and imperial identified service provider challenges . System leaders from all disciplines discussed workforce challenges to meet the diverse needs of service users . however, child welfare and mental health leaders particularly stressed the need for language and cultural respon-siveness for asian/pacific islanders . The intractable and deep-rooted nature of the challenges is reflected in this comment from a provider, “Do you know what most people of color think when social services come to the door? What do you think they think when mental health services come to the door? These systems – social service, mental health, probation – they weren’t designed to help. They were so conde-scending in their genesis. It will take a huge amount of evolution for this to change.”
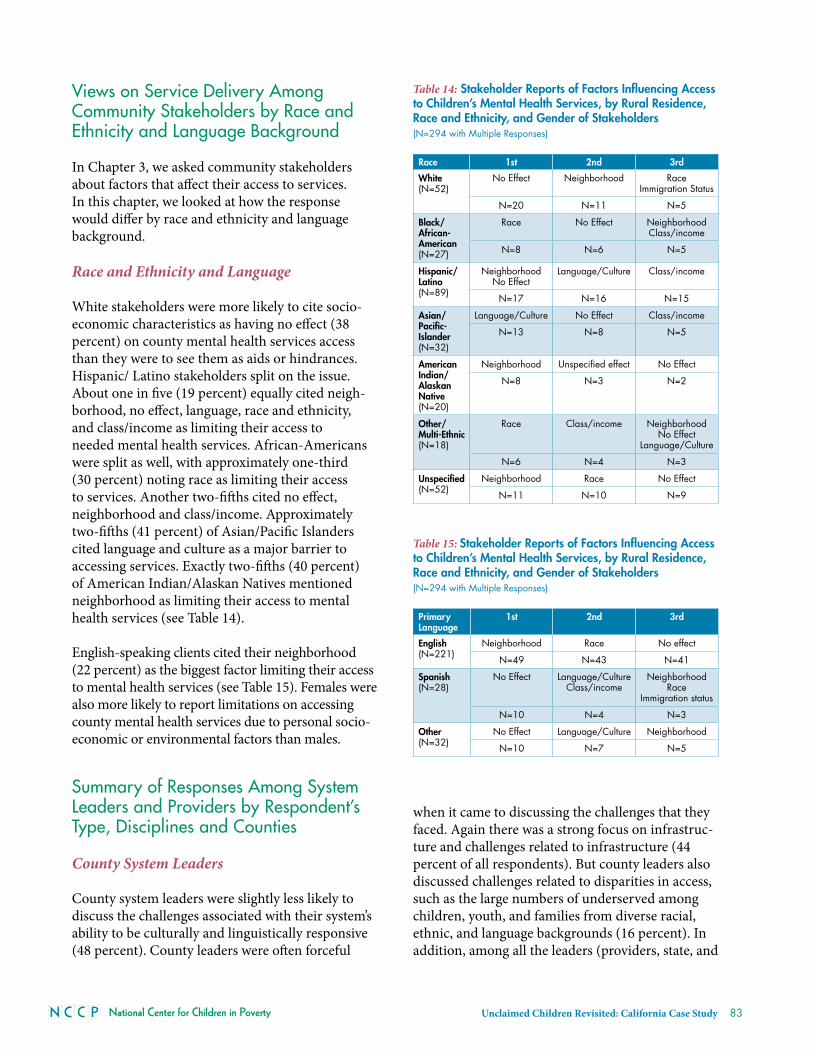
National Center for Children in Poverty Unclaimed Children Revisited: California Case Study 83
views on Service delivery Among Community Stakeholders by Race and ethnicity and language Background
in chapter 3, we asked community stakeholders about factors that affect their access to services . in this chapter, we looked at how the response would differ by race and ethnicity and language background .
Race and Ethnicity and Language
White stakeholders were more likely to cite socio-economic characteristics as having no effect (38 percent) on county mental health services access than they were to see them as aids or hindrances . hispanic/ Latino stakeholders split on the issue . about one in five (19 percent) equally cited neigh-borhood, no effect, language, race and ethnicity, and class/income as limiting their access to needed mental health services . african-americans were split as well, with approximately one-third (30 percent) noting race as limiting their access to services . another two-fifths cited no effect, neighborhood and class/income . approximately two-fifths (41 percent) of asian/pacific islanders cited language and culture as a major barrier to accessing services . Exactly two-fifths (40 percent) of american indian/alaskan Natives mentioned neighborhood as limiting their access to mental health services (see table 14) .
English-speaking clients cited their neighborhood (22 percent) as the biggest factor limiting their access to mental health services (see table 15) . Females were also more likely to report limitations on accessing county mental health services due to personal socio-economic or environmental factors than males .
Summary of Responses Among System leaders and Providers by Respondent’s Type, disciplines and Counties
County System Leaders
county system leaders were slightly less likely to discuss the challenges associated with their system’s ability to be culturally and linguistically responsive (48 percent) . county leaders were often forceful
when it came to discussing the challenges that they faced . again there was a strong focus on infrastruc-ture and challenges related to infrastructure (44 percent of all respondents) . But county leaders also discussed challenges related to disparities in access, such as the large numbers of underserved among children, youth, and families from diverse racial, ethnic, and language backgrounds (16 percent) . in addition, among all the leaders (providers, state, and
Table 14: stakeholder Reports of factors influencing access to Children’s Mental health services, by Rural Residence, Race and Ethnicity, and gender of stakeholders (N=294 with Multiple Responses)
Race 1st 2nd 3rd
White(N=52)
No Effect Neighborhood RaceImmigration Status
N=20 N=11 N=5
Black/african-american (N=27)
Race No Effect NeighborhoodClass/income
N=8 N=6 N=5
hispanic/latino (N=89)
Neighborhood No Effect
Language/Culture Class/income
N=17 N=16 N=15
asian/Pacific-islander (N=32)
Language/Culture No Effect Class/income
N=13 N=8 N=5
american indian/alaskan native (N=20)
Neighborhood Unspecified effect No Effect
N=8 N=3 N=2
Other/ Multi-Ethnic (N=18)
Race Class/income Neighborhood No Effect
Language/Culture
N=6 N=4 N=3
unspecified (N=52)
Neighborhood Race No Effect
N=11 N=10 N=9
Table 15: stakeholder Reports of factors influencing access to Children’s Mental health services, by Rural Residence, Race and Ethnicity, and gender of stakeholders (N=294 with Multiple Responses)
Primary language
1st 2nd 3rd
English(N=221)
Neighborhood Race No effect
N=49 N=43 N=41
spanish(N=28)
No Effect Language/Culture Class/income
NeighborhoodRace
Immigration status
N=10 N=4 N=3
Other(N=32)
No Effect Language/Culture Neighborhood
N=10 N=7 N=5
84
county leaders), county system leaders were most likely to discuss the plight of the undocumented as a system challenge (9 percent) . These respondents also discussed the role of stigma and challenges associ-ated with the implementation of evidence-based practices more than their counterparts in the study .
State System Leaders
The minority of state system leaders discussed strengths associated with their system’s ability to be culturally and linguistically responsive . among system strengths related to cultural and linguistic competence, state leaders pointed to the mental health Services act, a growing focus on cultural and linguistic competence, and on other reforms that bode well for cultural competence, in particular a state- and private-funded initiative to address dispro-portionally and a separate multi-year funded initia-tive to reduce or eliminate disparities . The majority of the state system leaders also focused on system chal-lenges, particularly the number of diverse communi-ties that remain underserved . Though the responses about underserved populations varied widely, the top most frequently mentioned were Latino and rural communities . Of state system leaders that focused on challenges, the most often mentioned challenges were meeting the needs of the underserved (30 percent), infrastructure (19 percent), and stigma (17 percent) .
Providers
While many providers recognized inherent strengths in the system of care to deliver culturally and lin-guistically competent services, most (53 percent) focused on the system’s challenges . Of those provid-ers who commented on challenges, about 40 percent discussed challenges that were structural in nature and overwhelmingly highlighted workforce issues . The infrastructure-related challenges providers most often mentioned included poor provider-patient racial/ethnic concordance (55 percent of respon-dents), lack of cultural and linguistic competence among providers (31 percent), inadequate provider training (14 percent), and funding and funding politics difficulty (13 percent) . Four providers com-mented on the difficulty of recruiting and retaining providers . Fifteen providers reported a lack of cultur-ally and linguistically competent staff, particularly for the Latino community, and seven providers discussed lack of staff that serve asian-american communities .
providers were slightly less likely to discuss the strengths associated with their system’s ability to be culturally and linguistically responsive (47 percent) . respondents shed light on a number of strengths of the system, including strategies and programs designed to improve access and acceptance for culturally and linguistically diverse communities . The most frequently mentioned strengths related to infrastructure (46 percent); followed by refer-ences to intentional cultural and linguistic-specific, -directed, or -focused programming; and an emerging cultural and linguistic focus (14 percent and 13 percent) . The types of infrastructure-related supports that providers mentioned included training; specific workforce-development initia-tives; and organizational features like leadership, collaboration, and mission . compared to other types of respondents, providers were least likely to discuss the mental health Services act as a strength from the perspective of cultural and linguistic competence .
Across Disciplines
System leaders from developmental disability, early childhood, finance, juvenile justice, and substance abuse are more likely to report structural strengths for cLc services than other disciplines . System leaders from developmental disability, finance juvenile justice, and substance abuse were also more likely to report provider capacity to offer cLc services as strengths . Finance and mental health leaders discussed mhSa as their strengths while other system leaders did not refer to mhSa . System leaders also talked about structural challenges for providing cLc services . more than half of system leaders from child welfare, developmental disability, mental health, public health and special education talked about the structural challenges . in particular, about 80 percent of public health leaders cited structural challenges for cLc services . Early child-hood, mental health and substance abuse leaders also talked about challenges of implementing culturally and linguistically competent EBps (20 percent, 13 percent and 13 percent respectively) while other leaders did not discuss this topic . Serving undocumented was discussed as a chal-lenge by public health leaders (20 percent); juvenile justice leaders (15 percent), finance, substance abuse and early childhood leaders (13 percent each) .
National Center for Children in Poverty Unclaimed Children Revisited: California Case Study 85
Across Counties
Overall, leaders and providers from Butte, placer, Santa clara, Santa cruz, San Diego and San mateo were more likely to talk about strengths of the system while the remaining county leaders and providers talked more about challenges in providing cLc services . in terms of type of strengths, the majority of leaders talked about structural strengths except humboldt (33 percent) . Equally, about one-third of leaders from Santa clara, Santa cruz, San Francisco, and San mateo talked about having specific cLc programs as their strengths . Leaders and providers from more than half of the coun-ties talked about infrastructural challenges as well . These are from alameda (85 percent); Butte (67 percent); humboldt (75 percent); Los angeles (75 percent); Santa cruz (55 percent); San Francisco (62 percent) and San mateo (50 percent) . in terms of infrastructural challenges, the leaders and providers from most of the counties talked about lack of cLc staff, and leaders and providers from humboldt and alameda were more likely to talk about this issue than that of other counties . Those from humboldt were more likely to talk about the lack of Latino cLc staff in their county (58 percent of their county leaders and providers) than other counties .
Chapter Summary
Overall, system leaders and providers equally dis-cussed strengths and challenges in providing cultur-ally and linguistically competent (cLc) services . The most frequently mentioned strengths by system leaders and providers were structural strengths such as providing specific cLc programs . mhSa is also perceived as a positive vehicle to promote cLc ser-vices . One notable strategy frequently mentioned by system leaders and providers is providing incentives for hiring or developing bilingual and bicultural staff . The most frequently mentioned challenges are also infrastructural issues, in particular, workforce related such as lack of culturally and linguistically competent staff and training issues . The second most frequently discussed challenge was the gap in services . Latino and asian/pi are the groups that system leaders and providers felt most lacking in terms of cLc services . among community stakeholders, there are some variation on the factors influencing access to children’s mental health services . african-americans
perceived their race as a factor affecting their ser-vice access, while Latino and american indian/alaskan Natives felt neighborhood is a factor, and an equal amount of Latino groups suggested no effect of socioeconomic or demographic status on access . asians/pacific islanders saw language and culture as a major barrier to access .
Recommendations
The state of California and counties should:♦ provide for and support counties leaders in the
development of strategies to build an infrastructural response to improving the level of systems’ cultural and linguistic competence and to reduce disparities based on race and ethnicity and language access;
♦ expand the workforce’s capacity with providers from diverse (racial/cultural/ethnical and linguis-tical) communities;
♦ develop core competencies for providers in cultural and linguistic competence and provide necessary training to attain these competencies;
♦ address providers’ concerns regarding insufficient cultural and linguistic competence and inadequate experience in specific community-based interven-tions for working with diverse populations;
♦ provide funding for intensive community engage-ment strategies;
♦ build on successful models implemented through the mental health Services act and other funding;
♦ address the challenges posed by the non-supplan-tation clause, which undermines sustainability of effective cultural- and linguistically-appropriate programming;
♦ support capacity improvement for more cultur-ally and linguistically competent services to help promote advocacy among non-English speakers;
♦ finance county to county peer learning on inno-vative strategies and effective interventions that improve cultural and linguistic competence in service delivery and reduce disparities;
♦ ensure that services provided to immigrants are effective and culturally and linguistically compe-tent; and
♦ track data on race, ethnicity and English language proficiency of service users and their outcomes .
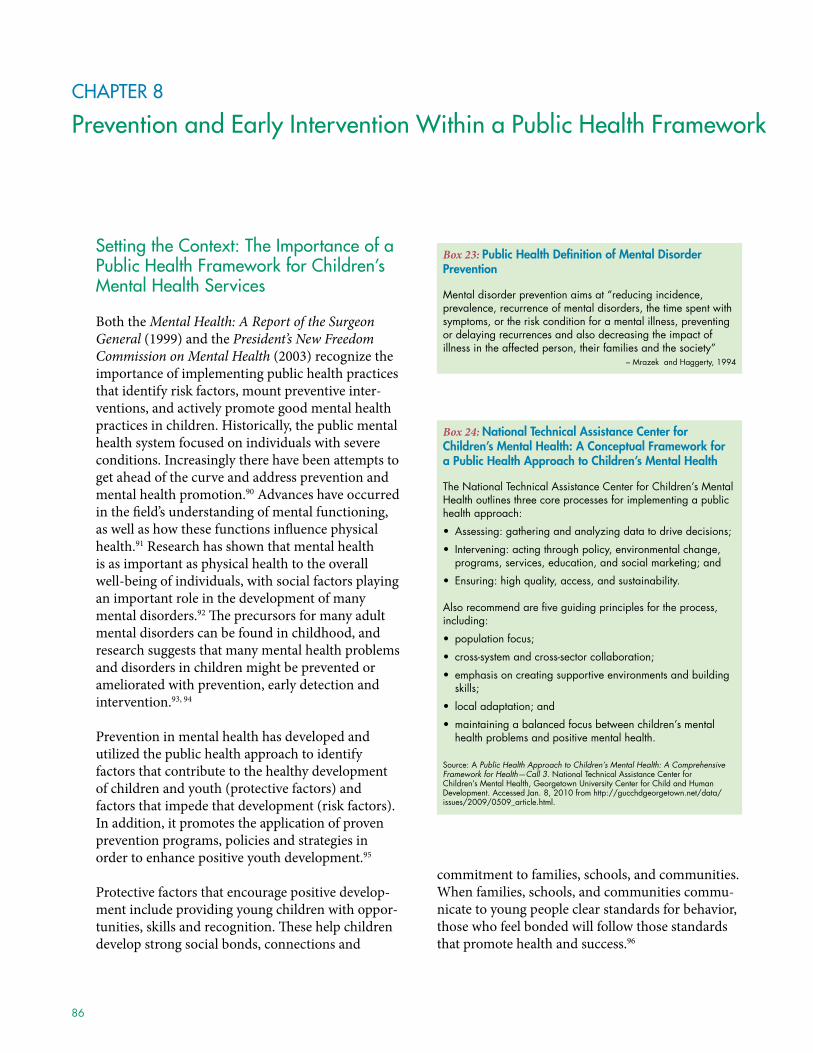
86
CHAPTeR 8
Prevention and early intervention Within a Public Health Framework
Setting the Context: The importance of a Public Health Framework for Children’s Mental Health Services
Both the Mental Health: A Report of the Surgeon General (1999) and the President’s New Freedom Commission on Mental Health (2003) recognize the importance of implementing public health practices that identify risk factors, mount preventive inter-ventions, and actively promote good mental health practices in children . historically, the public mental health system focused on individuals with severe conditions . increasingly there have been attempts to get ahead of the curve and address prevention and mental health promotion .90 advances have occurred in the field’s understanding of mental functioning, as well as how these functions influence physical health .91 research has shown that mental health is as important as physical health to the overall well-being of individuals, with social factors playing an important role in the development of many mental disorders .92 The precursors for many adult mental disorders can be found in childhood, and research suggests that many mental health problems and disorders in children might be prevented or ameliorated with prevention, early detection and intervention .93, 94
prevention in mental health has developed and utilized the public health approach to identify factors that contribute to the healthy development of children and youth (protective factors) and factors that impede that development (risk factors) . in addition, it promotes the application of proven prevention programs, policies and strategies in order to enhance positive youth development .95
protective factors that encourage positive develop-ment include providing young children with oppor-tunities, skills and recognition . These help children develop strong social bonds, connections and
commitment to families, schools, and communities . When families, schools, and communities commu-nicate to young people clear standards for behavior, those who feel bonded will follow those standards that promote health and success .96
Box 23: Public health definition of Mental disorder Prevention
Mental disorder prevention aims at “reducing incidence, prevalence, recurrence of mental disorders, the time spent with symptoms, or the risk condition for a mental illness, preventing or delaying recurrences and also decreasing the impact of illness in the affected person, their families and the society”
– Mrazek and Haggerty, 1994
Box 24: national Technical assistance Center for Children’s Mental health: a Conceptual framework for a Public health approach to Children’s Mental health
The National Technical Assistance Center for Children’s Mental Health outlines three core processes for implementing a public health approach:
• Assessing: gathering and analyzing data to drive decisions;
• Intervening: acting through policy, environmental change, programs, services, education, and social marketing; and
• Ensuring: high quality, access, and sustainability.
Also recommend are five guiding principles for the process, including:
• population focus;
• cross-system and cross-sector collaboration;
• emphasis on creating supportive environments and building skills;
• local adaptation; and
• maintaining a balanced focus between children’s mental health problems and positive mental health.
Source: A Public Health Approach to Children’s Mental Health: A Comprehensive Framework for Health—Call 3. National Technical Assistance Center for Children’s Mental Health, Georgetown University Center for Child and Human Development. Accessed Jan. 8, 2010 from http://gucchdgeorgetown.net/data/issues/2009/0509_article.html.
National Center for Children in Poverty Unclaimed Children Revisited: California Case Study 87
Families are the primary institution for raising children with positive beliefs, clear standards and healthy behaviors . The prevalence of single parent-headed households, teen pregnancy, low parental educational levels, and low family incomes, present various and significant challenges for parents to be successful in their roles . parental practices can determine the influence and development of youth problem behavior .97 inconsistent and infective disciplining, monitoring of activities, and building positive interactions with their child increase the risks of children developing a range of problem behaviors, including substance abuse and anti-social behavior .98
in order to achieve effective prevention and early intervention (pEi) service delivery for children and families, interagency, interdisciplinary and community stakeholder collaboration is necessary . collaboration efforts can include coordinated stra-tegic planning, multi-agency budget submissions, implementation of comprehensive screening and assessment, and case management .99 interagency collaborations can help mobilize more talents, resources and approaches to influence an issue than any single organization could achieve alone .100 collaboration can enable organizations to become involved in new and broader issues without having the sole responsibility for managing or developing those issues .101 collaboration can minimize duplica-tion of effort and services . This economy of scale can be a positive side effect of improved trust and communication among groups that would normally compete with one another .102
collaborating and sharing resources is an effective strategy considering the economic cost for treat-ment of mental health disorders in children and youth . These disorders – which include depression, anxiety, conduct disorder, and substance abuse – take a tremendous toll on the well-being of young people and their families, costing the u .S . an esti-mated $247 billion annually .103 Outpatient treatment accounts for a significant proportion of mental health expenditures for children and youth (nearly 60 percent) .104 it is suspected that a significant proportion of these outpatient costs are attributable to school-related services by mental health profes-sionals . research shows that there are not enough remedial services (such as psychotherapy and
medical treatment) available given the number of people needing services .105
Overall, pEi efforts targeted to children, youth and their families have been shown to be beneficial and cost-effective and reduce the need for more costly interventions and outcomes such as welfare depen-dency and juvenile detention .106 Early intervention efforts can improve school readiness, health status, and academic achievement and reduce the need for grade retention, and special education services . primary prevention is a proven, effective strategy that can address a range of health and social issues, including widespread youth violence, skyrocketing medical costs, epidemic chronic illnesses, and the ever-expanding gap between rich and poor .107
Prior Research and Research Questions
in recent years, there has been a shift in the focus on children’s and youth mental health care policy in california . Groundbreaking policy implementations including the mental health Services act (mhSa), First 5, and the expansion of EpDSt funding have all helped to steer the children’s mental health system in california toward prevention and early intervention within a public health framework . Study investigators sought to assess the state of prevention and Early intervention for children, youth, and their families through the following inquiries:♦ What are system leaders’ and providers’ perspec-
tives regarding current strengths in pEi services?♦ What are system leaders’ and providers’ views
toward state policies with regard to pEi?♦ What major challenges do system leaders’ and
providers’ face in expanding pEi services?♦ What recommendations do system leaders and
providers suggest to promote and support expan-sion of pEi services?
“The movement toward a public health perspective on mental health requires both the belief that mental health is essential to overall health and that society as a whole must take part in transforming an individual disease-based model into a systems approach to ensuring health.”
– A. Kathryn Power, Director SAMSHA/CMHS, 01-01-08
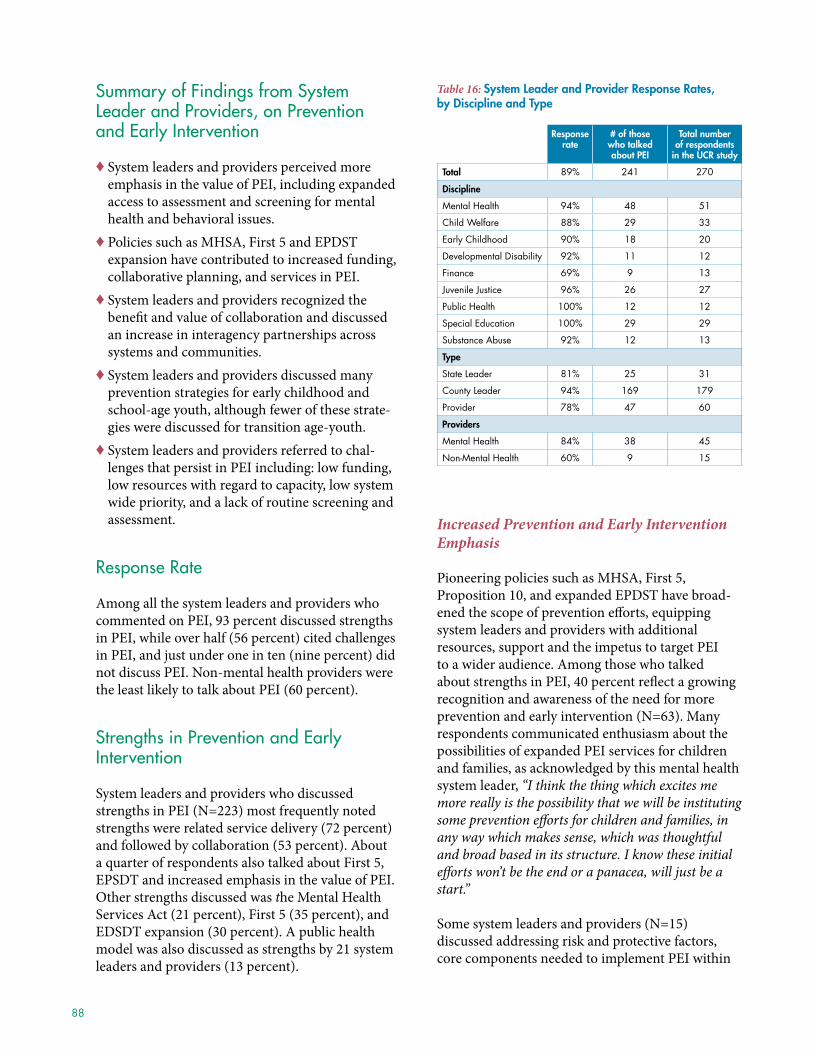
88
Summary of Findings from System leader and Providers, on Prevention and early intervention
♦ System leaders and providers perceived more emphasis in the value of pEi, including expanded access to assessment and screening for mental health and behavioral issues .
♦ policies such as mhSa, First 5 and EpDSt expansion have contributed to increased funding, collaborative planning, and services in pEi .
♦ System leaders and providers recognized the benefit and value of collaboration and discussed an increase in interagency partnerships across systems and communities .
♦ System leaders and providers discussed many prevention strategies for early childhood and school-age youth, although fewer of these strate-gies were discussed for transition age-youth .
♦ System leaders and providers referred to chal-lenges that persist in pEi including: low funding, low resources with regard to capacity, low system wide priority, and a lack of routine screening and assessment .
Response Rate
among all the system leaders and providers who commented on pEi, 93 percent discussed strengths in pEi, while over half (56 percent) cited challenges in pEi, and just under one in ten (nine percent) did not discuss pEi . Non-mental health providers were the least likely to talk about pEi (60 percent) .
Strengths in Prevention and early intervention
System leaders and providers who discussed strengths in pEi (N=223) most frequently noted strengths were related service delivery (72 percent) and followed by collaboration (53 percent) . about a quarter of respondents also talked about First 5, EpSDt and increased emphasis in the value of pEi . Other strengths discussed was the mental health Services act (21 percent), First 5 (35 percent), and EDSDt expansion (30 percent) . a public health model was also discussed as strengths by 21 system leaders and providers (13 percent) .
Increased Prevention and Early Intervention Emphasis
pioneering policies such as mhSa, First 5, proposition 10, and expanded EpDSt have broad-ened the scope of prevention efforts, equipping system leaders and providers with additional resources, support and the impetus to target pEi to a wider audience . among those who talked about strengths in pEi, 40 percent reflect a growing recognition and awareness of the need for more prevention and early intervention (N=63) . many respondents communicated enthusiasm about the possibilities of expanded pEi services for children and families, as acknowledged by this mental health system leader, “I think the thing which excites me more really is the possibility that we will be instituting some prevention efforts for children and families, in any way which makes sense, which was thoughtful and broad based in its structure. I know these initial efforts won’t be the end or a panacea, will just be a start.”
Some system leaders and providers (N=15) discussed addressing risk and protective factors, core components needed to implement pEi within
Table 16: system leader and Provider Response Rates, by discipline and Type
Response rate
# of those who talked about PEi
Total number of respondents
in the uCR study
Total 89% 241 270
discipline
Mental Health 94% 48 51
Child Welfare 88% 29 33
Early Childhood 90% 18 20
Developmental Disability 92% 11 12
Finance 69% 9 13
Juvenile Justice 96% 26 27
Public Health 100% 12 12
Special Education 100% 29 29
Substance Abuse 92% 12 13
Type
State Leader 81% 25 31
County Leader 94% 169 179
Provider 78% 47 60
Providers
Mental Health 84% 38 45
Non-Mental Health 60% 9 15

National Center for Children in Poverty Unclaimed Children Revisited: California Case Study 89
a public health approach . although respondents in the substance abuse field make up only five percent of the interviewees, they composed 29 percent of those discussing risk and protective factors . One state mental leader remarked, “Addressing kids early on, kids from stressed families, kids that are trauma exposed. There is enough research that tells us who is at risk. We have put the entrance to our system at the failure side. Now you are in probation, now you’ve been arrested…but if you look at this early on, you could’ve addressed this early on.”
Service Array for Prevention and Early Intervention
System leaders and providers (N=161) discussed an array of prevention programs and initiatives for children, youth and their families . Each indi-vidual county controls how prevention funding is allocated and directed, creating various types of initiatives and programs implemented within coun-ties . among those leaders and providers, about 30 percent talked about services specific to young chil-dren (N=46), while 23 percent talked about school age children (N=35) . preventions and interventions for transitional-age youth were discussed only by two respondents .
a variety of screening tools were discussed by respondents (N=69) . ages and Stages Questionnaire (aSQ) was identified by 32 percent of system leaders and providers (N=22) . One county leader noted their process, “We have allowed the providers to discuss what they would like to use for a screening tool. They’ve all decided that the Ages and Stages Questionnaire was the most effective for the major screen. ASQ [is the] most popular”.
Other tools mentioned were multidisciplinary team tool (16 percent; N=11); maySi (seven percent, N=5) and Denver Developmental assessment (six percent, N=4) .
Mental Health Services Act (MHSA)
System leaders in california (N=33) expressed hope, optimism and high expectations that the mhSa would create more funding resources and opportunities to increase services and to collabo-rate . mhSa mandates that at least 51 percent of county and local budgets must be allocated toward pEi supports .
respondents generally referenced an increased focus on treatment and high-needs interventions with less resources going toward pEi . prior to mhSa, one system leader in public health put it: “Well, honestly before prop 63 there was very little in terms of prevention, especially for young children. Only recently with prop 63, Department of Mental Health started focusing on prevention. The initial focus [was] not on prevention, [but] on high end mental health needs and intervention. Planning for prevention [is] just now starting.”
The economic landscape has changed greatly from between the time the interviews were conducted and the release of this report . many leaders in the field express concerns about the future promise of the mhSa due to the governor’s proposed Fy 2009-10 budget plan to redirect $227 million in
Box 25: Early Mental health initiative (EMhi)
Funded through the California Department of Mental Health, it provides matching grants to local education authorities to implement early mental health prevention and early interven-tion programs. Programs funded through EMHI must be on a school site and focused on services for children in kindergarten through third grades who are experiencing mild to moderate school adjustment difficulties. The program is not intended to serve students with more severe difficulties.
Source: California Map to Inclusive Childcare. Accessed Dec. 8, 2009 from http://www.cainclusivechildcare.org/camap/hottopics.html.
Box 26: ages and stages Questionnaires (asQ)
• Designed for children up to 60 months of age
• Addresses developmental areas of communication, gross and fine motor skills, problem solving, personal and social development
• Questions are age-specific
• Comes in English, Spanish, French, Korean and other languages
• Parents indicate child’s developmental skills on 25 to 35 items at each well-child visit
• Depending on age being screened, reading level ranges from third- to 12th-grade comprehension
• Gives a single pass/fail score
• Takes 10 to 15 minutes to complete
Source: Connect for Kids. Accessed Jan. 5, 2010 from www.connectforkids.org.
90
mhSa dollars this year . a proposed ballot initiative that would reverse critical provisions of proposition 63 failed in early 2008.
First 5/Prop.10
about 34 percent of system leaders and providers who talked about strengths considered First 5 (prop . 10) to have positively impacted expansions in funding and services in early childhood . These included increases in mental health services, preven-tion services, training capacity for parents, teachers and staff and assessments and screenings . They attri-bute successful impacts of early interventions to First 5 . One county leader in public health highlighted this impact, “I would probably start with talking about voters approving prop 10, First 5 and having sources of funding specifically for very young children. That’s where prevention starts and investing in early care and early education and early access to health, access to program for kids and parents, parenting training, etc.” Other respondents credit First 5 with increased school readiness and family support and narrowing the achievement gap for children at highest risk of school failure . in the area of assessment and screening, First 5 also gets credit for expanding the number of children who are being identified for developmental and mental health needs, especially in high-risk communities, by these respondents .
PEI Services for Young Children
System leaders and providers who work with the 0 to 5 population noted that there is growing aware-ness that mental health disorders do occur in early childhood and that early intervention can prevent future mental health disorders . according to a county leader in early childhood: “I think more and more community members, providers, and decision makers are slowly realizing that early identification and intervention is key to long term success and that MH disorders do exist in the 0 to 4 population.” Other respondents described greater efforts to screen children for behavioral, mental health and developmental disorders . consequently, according to one county mental health leader: “Youth are getting assessed at a younger age and families getting flagged sooner.” The pre-natal to Three initiative was discussed by 14 respondents and illustrates how a country wide, public-private collaboration can build on existing programs to provide a single point of entry for early childhood services and to improve service management and delivery .”108
PEI Services for School-age Children
School-age or school-based services were discussed by 23 percent of system leaders and providers (N= 35) . respondents referred to multiple school-based programs, as typified by a county leader in special education: “We have Safe School Programs: [that address] bullying, stigmatization, support groups, diversity, abandonment, at risk youth. School coun-selors can use them to guide support groups on a variety of areas: abuse, drugs, etc.”
Substance abuse prevention programs were frequently mentioned . One county leader in substance abuse illustrated a collaborative approach, as an example of an initiative that addressed risk factors and preventing substance abuse: “We have early intervention strategies in place to help children who show risk factors for substance abuse. We find the youth through people who work with them, such as their parents, schools, or the juvenile justice system, and then we have programs in place to track their progress and report the information back to us.”
Box 27: Quick facts
Mental health services act and Mandate Prevention and Early intervention:
• Prevention and early intervention represent one of five central components of MHSA.
• Children and youth 0 to 5 constitute a priority population.
• At least 51 percent of local mental health authorities’ budgets for PEI must support this population
• Core components of PEI programs should include: – Outreach to support early recognition of mental health problems;
– Engagement and linkages with appropriate services and supports;
– Stigma reduction; and – Prevention and early intervention services.
Source: Mental Health Services Act, 4, Part 3.6, 5840.
National Center for Children in Poverty Unclaimed Children Revisited: California Case Study 91
Box 28: Pre-natal to Three: san Mateo County
Overview
The Prenatal to Three Initiative focuses on:
• Building parent confidence and skills;
• Early identification of medical and developmental problems; and
• Seamless integration of services for infants, toddlers, and families.
actions and Program design
The Prenatal to Three Initiative illustrates how a countywide, public-private collaboration can build on existing programs to provide a single point of entry for early childhood services and to improve service management and delivery. Key features include:
• Service coordination. A network of local, state, and federal programs that participate in the initiative share resources, training opportunities, specialty services, and community out-reach efforts. A centralized registration and referral system handles links to physicians, clinics, child care, and social services across the county.
• Home visiting. Birthing hospitals, prenatal care facilities, and partner agencies refer low-income families to the initiative’s centralized registration system, which refers them to one of three teams of home visitors. The teams include public health nurses, social workers, and specialists. Families receive visits during pregnancy and for up to eight weeks after their child’s birth. Depending on the family’s needs, the visitors address child development, child safety, family literacy, nutri-tion, family planning, mental health, substance abuse, and domestic violence.
• Parent support and education groups. Community workers, public health nurses, and parent volunteers lead ongoing classes where parents discuss their concerns. Classes use the “Strengthening Multicultural Families and Communi-ties” curriculum. Drop-in support groups utilize Touchpoints principles. In October 2002, Prenatal to Three added inter-disciplinary, six-month therapy groups for dually diagnosed mothers with their infants and toddlers, facilitated by mental health and substance abuse professionals.
• Early literacy development. The initiative has close ties to libraries and a local foundation’s child literacy efforts. Home visitors give each family a book, library card application, voucher for a free child T-shirt available at the libraries, and access to a book lending service. Parent support groups and special events are held at libraries.
• Training for providers. The initiative brings state and national experts to the county for staff and community training sessions. Topics have included assessment and screening instruments, infant mental health and brain development, and recognizing chemical dependency in families.
Source: Prenatal to Three Initiative. Accessed Jan. 15, 2010 from http://www.co.sanmateo.ca.us/portal/site/health.
Box 29: The California friday night live Program
friday night live (FNL) is designed for high school-aged youth. Activities are organized by youth to appeal to youth. Dances, haunted houses, community service and social action activi-ties, movie nights, and participation in advocacy for safe and healthy environments such as sober grad, are just some of the activities that FNL youth both participate in and organize. One of the most distinguishing aspects of the Friday Night Live is youth involvement in mentoring. In FNL, high school-aged youth can act as mentors and tutors to middle school and elementary school students. FNL mentoring activities provide opportunities for young people to engage in ongoing, mutually beneficial, caring relationships which strengthen young people to face today’s challenges.
The primary focus of the FNL/CL/FNL Kids/FNL Mentoring Programs is to form youth/adult partnerships with young people, providing programs rich in opportunities and support, so young people will be less likely to engage in problem behaviors, more likely to achieve in school, and more likely to attend higher education or secure a full-time job. FNL’s vision is to work hand-in hand with young people so they are both problem free and fully prepared.
Source: Friday Night Live. Accessed Jan. 5, 2010 from http://www.fridaynightlive.org.
PEI Services for Transition-age Youth
unlike the focus on early childhood and school-age youth, respondents generally did not discuss transition-age youth when they referred to preven-tion programs . however, suicide prevention and substance abuse prevention were discussed as strat-egies that system leaders and providers are using (N=5 and N=9 respectively) . prevention services in juvenile justice were mentioned to prevent and reduce recidivism rates . The prevention program most often noted by respondents (N=3) was the healthy return initiative (see Box 30) . Others recommended expanded pEi services in order to identify problems, and address issues before chil-dren became involved in state systems, one system leader in special education, “They should try to identify kids at a younger age, maybe by assessments; so that high risk youths do not end up in prisons. If we were to target children at a young age and provide them with services at a young age. That would diffuse them from ending up in the court system.”
Family-focused Prevention Strategies
among those commented on, most strategies designed to engaged or support families around prevention that respondents addressed (N=37)
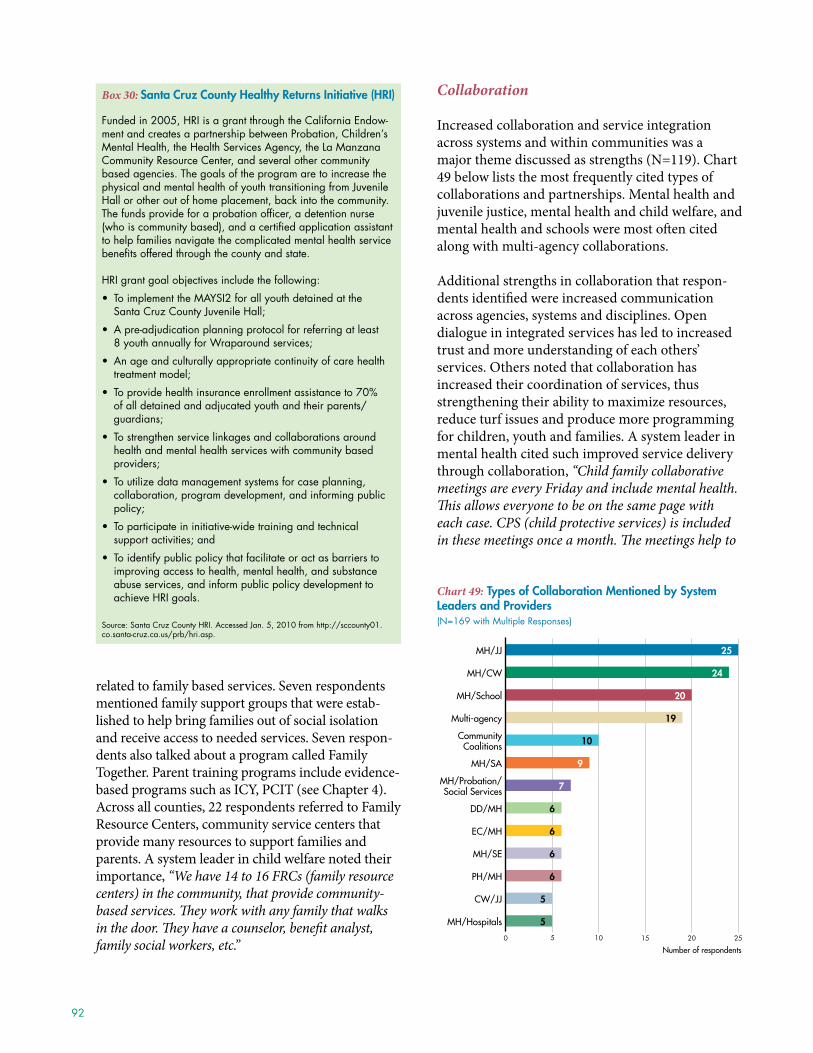
92
related to family based services . Seven respondents mentioned family support groups that were estab-lished to help bring families out of social isolation and receive access to needed services . Seven respon-dents also talked about a program called Family together . parent training programs include evidence-based programs such as icy, pcit (see chapter 4) . across all counties, 22 respondents referred to Family resource centers, community service centers that provide many resources to support families and parents . a system leader in child welfare noted their importance, “We have 14 to 16 FRCs (family resource centers) in the community, that provide community-based services. They work with any family that walks in the door. They have a counselor, benefit analyst, family social workers, etc.”
Collaboration
increased collaboration and service integration across systems and within communities was a major theme discussed as strengths (N=119) . chart 49 below lists the most frequently cited types of collaborations and partnerships . mental health and juvenile justice, mental health and child welfare, and mental health and schools were most often cited along with multi-agency collaborations .
additional strengths in collaboration that respon-dents identified were increased communication across agencies, systems and disciplines . Open dialogue in integrated services has led to increased trust and more understanding of each others’ services . Others noted that collaboration has increased their coordination of services, thus strengthening their ability to maximize resources, reduce turf issues and produce more programming for children, youth and families . a system leader in mental health cited such improved service delivery through collaboration, “Child family collaborative meetings are every Friday and include mental health. This allows everyone to be on the same page with each case. CPS (child protective services) is included in these meetings once a month. The meetings help to
Box 30: santa Cruz County healthy Returns initiative (hRi)
Funded in 2005, HRI is a grant through the California Endow-ment and creates a partnership between Probation, Children’s Mental Health, the Health Services Agency, the La Manzana Community Resource Center, and several other community based agencies. The goals of the program are to increase the physical and mental health of youth transitioning from Juvenile Hall or other out of home placement, back into the community. The funds provide for a probation officer, a detention nurse (who is community based), and a certified application assistant to help families navigate the complicated mental health service benefits offered through the county and state.
HRI grant goal objectives include the following:
• To implement the MAYSI2 for all youth detained at the Santa Cruz County Juvenile Hall;
• A pre-adjudication planning protocol for referring at least 8 youth annually for Wraparound services;
• An age and culturally appropriate continuity of care health treatment model;
• To provide health insurance enrollment assistance to 70% of all detained and adjucated youth and their parents/guardians;
• To strengthen service linkages and collaborations around health and mental health services with community based providers;
• To utilize data management systems for case planning, collaboration, program development, and informing public policy;
• To participate in initiative-wide training and technical support activities; and
• To identify public policy that facilitate or act as barriers to improving access to health, mental health, and substance abuse services, and inform public policy development to achieve HRI goals.
Source: Santa Cruz County HRI. Accessed Jan. 5, 2010 from http://sccounty01.co.santa-cruz.ca.us/prb/hri.asp.
Chart 49: Types of Collaboration Mentioned by System Leaders and Providers (N=169 with Multiple Responses)
0 5 10 15 20 25
MH/Hospitals
CW/JJ
PH/MH
MH/SE
EC/MH
DD/MH
MH/Probation/Social Services
MH/SA
CommunityCoalitions
Multi-agency
MH/School
MH/CW
MH/JJ
5
5
6
6
6
6
7
9
10
19
20
24
25
Number of respondents
National Center for Children in Poverty Unclaimed Children Revisited: California Case Study 93
streamline treatment and helps with identifying better resources for families. Before there was a lot of confu-sion when communication was done simply by email, now everyone seems clear when leaving the meetings, about the families.”
respondents attributed the increase in interagency collaboration to the system of care initiative (SOc), as one system observer noted, “…The whole system of care. It was revolutionary in its time. It was 15 years ago. The whole concept of collaboration was really supported by these whole policies.” a system leader in child welfare described the process, “We include the Department of Mental Health (DMH), education, social services, health, and anyone who we feel needs to be brought onto the [multidisciplinary] team to really focus on mental health, substance abuse and domestic violence. Make sure we connect with services in the community.” multi-disciplinary teams (mDt) consist of representatives from a variety of disciplines (agencies) which meet to discuss child abuse and neglect cases .
collaboration also fostered community needs assessments through targeting at-risk geographic areas and at-risk youth, according to respondents . a system leader in early childhood noted, “We did research and looked at all the risk factors. We identi-fied the strategic zip codes. We broke into nine regions and built community partnerships. We now have early care and education activities in each region (health care, wrap, mental health.) The community wanted to look at what they looked like in hours etc. They wanted to build up community capacity.” This focus according to system leaders and providers extended to increased community planning and advocacy efforts .
Early Periodic Screening, Diagnosis, and Treatment (EPSDT)
about one-third of system leaders and providers who talked about strengths viewed EpSDt as a strength in expanding access to assessment and screening of children and youth by increasing early detection and intervention and preventing problems from becoming worse (N=48) . a 1993 lawsuit led to the increased EpSDt financing of mental health services and expanded eligibility for children and youth, “As a result of that [lawsuit], EPSDT programs increased and the budget for those programs increased, enabling us to reach out and provide mental health services for a lot of communities who couldn’t previously access treatment,” noted one system leader . respondents mentioned that ESpDt expansion has provided more funding for school-based and community-based services for children and youth .
Challenges in Prevention and early intervention Facing System leaders and Providers
although california has made many strides in pEi in recent years, system leaders and providers (N=135) discussed different concerns regarding providing services that are focused on prevention and early interventions . The primary challenges discussed included service gaps in providing pEi services (44 percent), lack of sufficient funding (29 percent), collaboration (24 percent), mhSa (21 percent) and workforce development (18 percent) .
Service Gaps in Providing PEI Services
While there has been a shift in policy and an increased expansion in assessments and screen-ings of children and youth, system leaders and providers discussed barriers in service delivery that are focused on prevention and early interven-tion (N=59) . among those respondents, 49 percent talked about lack of systemic focuses on pEi (N=29) and 47 percent discussed lack of routine screening (N=27) . Some commented on low systemic focus, lack of urgency toward the value of pEi, and lack of awareness about the long term cost-benefit as challenges, “There isn’t enough public exposure and awareness to the importance of prevention and its
Box 31: Community Prevention initiative
Funded and directed by the California Department of Alcohol and Drug Programs (ADP), this technical assistance and training project is intended to serve California agencies and organizations involved in community-based prevention. The purpose of Community Prevention Initiative, as outlined by ADP is “to reduce and manage community-level risks and problems directly attributable to and/or collaterally resulting from ATOD availability, manufacture, distribution, promotion, sale and/or use.”
Source: Community Prevention Initiative. Accessed Jan. 5, 2010 from http://www.ca-cpi.org/index.htm.
94
potential gains. There needs to be more studies on prevention and intervention and the benefits and gains. Focus on the monetary impact of early inter-vention and prevention, it is much more expensive to put a 18-year-old in jail for 10 years than it is to treat them for 16 years of their lives in early intervention programs.” respondents described their assessment and screening process as reactive, usually after a child has been placed in the system . a system leader in developmental disabilities illustrated this issue, “If an instance of violence or a behavioral challenge happens in the classroom and they discover that there may be a mental health problem, then they might chase down a diagnosis. But there is no routine screening or any strategies to get the jump on or imple-ment any measures to prevent mental health problems in the general population.” Four leaders talked about lack of outcome measurements especially related to prevention . One system leader commented on lack of systematic screening on siblings even when a family assessment is conducted .
Lack of Funding
The lack of funding support for pEi was advanced by system leaders and providers (N=39) as a source of their inability to provide adequate services related to pEi . a system leader in mental health commented, “Lack of awareness and understanding or about money…unwillingness to put resources in prevention and intervention and that’s because the result of those activities are down the road and those that control the money won’t see results until further down the road and [when] they aren’t the ones around.”
Evidence-based programs in prevention can be expensive and some respondents discussed that
there is far too little funding to implement and expand prevention programs . Some respondents mentioned funding barriers to implementing prevention initiatives, as put by a system leader in special education, “Persistent barriers to preven-tive model – if we want to engage agencies, we have to find a way to support those agencies. We need funding, funding, funding. And we need staff, leader-ship, assurance of support – fiscally, technically.”
Workforce
The role of the workforce in addressing pEi was described as a challenge by 24 system leaders and providers . among the specific concerns were gaps in worker expertise in early identification of mental health and a lack of capacity to meet the demand for services . One system leader described the dilemma in building capacity, “We have major shortfalls. It’s a crisis in terms of early childhood workforce. We don’t have the child development experts to work in collab-oration with teachers. Our capacity to do this work has major challenges. Especially with new research that is coming out about early childhood, our work-force is really unprepared to intervene effectively.”
Summary Reponses of System leaders and Providers by Respondent’s Type, disciplines and Counties
County System Leaders
The majority of county leaders talked about strengths of pEi services (93 percent) while 53 per-cent of leaders also talked about challenges associ-ated with pEi services . a majority also talked about strategies and county leaders were much more likely to talk about strategies (57 percent) compared with providers and state leaders (28 percent and 40 percent respectively) . in terms of the strengths, 73 percent of county leaders talked about service deliv-ery-related strengths, followed by collaborations (51 percent) and increasing emphasis on pEi (27 percent) . county leaders were least likely to men-tion First 5 as a strength of pEi (18 percent) com-pared with providers (38 percent) and state leaders (28 percent) . in terms of challenges, one-fourth of county leaders talked about gaps in services, while workforce development and collaboration was each
Box 32: Quick facts
EPsdT lawsuit
In 1993, a group of California-based attorneys filed a lawsuit against the state Department of Health Services, charging that the state was not sufficiently complying with the federal law. The courts agreed, and the EPSDT mental health benefit implemented as a result of this lawsuit increased the availability of State General Funds to finance Medi-Cal specialty mental health services provided to eligible children and adolescents.
Source: Early and Periodic Screening, Diagnosis and Treatment (EPSDT) Fact Sheet. California Alliance of Child and Family Services. Accessed Dec. 8, 2009 fromhttp://www.cacfs.org/files/advocacy/FINAL3EPSDTFactSheet.pdf.
National Center for Children in Poverty Unclaimed Children Revisited: California Case Study 95
discussed by 12 percent of county leaders . much fewer county leaders reported challenges of public health models (one percent) than providers (11 percent) and state leaders (12 percent) . The most frequently mentioned collaborations among county leaders were mental health and juvenile justice col-laborations . The most frequently mentioned types of challenges are gaps in services (25 percent) and workforce development (12 percent) .
State System Leaders
While the majority of state leaders talked about strengths related to pEi services (89 percent), state leaders were most likely to discuss challenges (80 percent) and this was much higher compared with providers and county leaders . in terms of type of strengths state leaders discussed, mhSa was discussed by 60 percent of state leaders, and most frequently mentioned among this group . Service delivery and increasing pEi emphasis were also mentioned by more than one-third of state leaders . at the same time, 70 percent of state leaders also acknowledged mhSa as one of the challenges for pEi while about one-fourth of state leaders also talked about collaboration as a challenge for pEi .
Providers
among providers, 89 percent talked about strengths and 55 percent talked about challenges . providers were less likely to discuss strategies (28 percent) related to pEi and lower than county and state leaders . more than half of providers talked about challenges (55 percent) . most frequently mentioned types of strengths were collaboration, discussed by 51 percent of providers; followed by service delivery (47 percent), which was much lower than for county and state leaders . providers are most likely to talk about First 5 as a strength (38 percent) compared with county and state leaders (18 percent and 28 percent respectively) . types of challenges discussed by providers are gaps in services (26 percent of providers); followed by mhSa and lack of funding which were mentioned by 13 percent of providers .
Across Disciplines
Over 90 percent of leaders talked about strengths of pEi across disciplines, with the exception of develop-mental disability and special education (82 percent and 83 percent respectively) . Early childhood, public health and substance abuse leaders were much more likely to talk about strategies that are related to pEi (83 percent, 75 percent, 75 percent respectively) while developmental disability leaders were the least likely to discuss them (nine percent) . among those who talked about strengths, the majority talked about pEi services; and substance abuse and public health leaders were much more likely to discuss service strengths than other disciplines . responses on collaborations related to pEi varied across disci-plines . Substance abuse leaders were most likely to talk about collaborations (92 percent), and the collaborations with mental health (58 percent) and juvenile justice (33 percent) were more frequently mentioned than collaborations with other agen-cies . The majority of child welfare, developmental disability and juvenile justice system leaders also talked about collaborations (62 percent, 55 percent, and 54 percent) . Finance and public health were less likely to discuss collaborations than others (39 percent and 22 percent) . regarding type of strategies related to pEi, the majority of early childhood leaders were most likely to talk about family-based services . One-third of public health leaders also talked about family-based services . Substance abuse leaders were most likely refer to substance abuse prevention programs and funding as strategies (42 percent and 67 percent) . Substance abuse leaders were also more likely to discuss lack of funding as well as gaps in providing pEi services (42 percent each) .
Across Counties
across counties, more than 90 percent of system leaders and providers talked about strengths of pEi services . however, the majority of leaders and providers across counties also indicated the chal-lenges related to pEi services . placer, San Diego and San mateo leaders were less likely to talk about challenges than other county leaders (35 percent, 44 percent and 47 percent respectively) . Santa cruz leaders and providers were more likely to discuss strategies related to pEi than any other counties (71 percent) . Los angeles county leaders
96
most frequently referred to the Katie a . lawsuit as an increase in pEi services (20 percent) while very few leaders and providers from other coun-ties mentioned it . regarding the type of strengths discussed across counties, service related strengths were most frequently discussed across counties . collaboration was most frequently mentioned by San mateo (80 percent) and alameda (75 percent) while humboldt leaders talked about collaborations the least (14 percent) . San mateo leaders and providers were most likely to discuss mhSa as strength for pEi services (67 percent) . EpSDt was most frequently discussed by alameda leaders and providers (63 percent) . placer leaders were most likely to talk about increasing pEi emphasis . regarding the challenges, leaders and providers from Los angeles were most likely to point to gaps in pEi services (40 percent), followed by Santa cruz (33 percent) and Santa clara (31 percent) . alameda leaders also talked about the limitation of EpSDt (38 percent) . Lack of funding was more frequently discussed by Butte, Santa cruz, and San Francisco leaders, which consisted of about one-quarter of their respondents .
Chapter Summary
california has enacted groundbreaking funding policies (mhSa, First 5, EpSDt expansion) that aimed to bring the children’s mental health system in california toward a system of prevention and early intervention within a public health framework . System leaders and providers discussed strengths in pEi, which include a greater awareness of its value, and an increased emphasis on pEi efforts and initia-tives . respondents discussed a vast array of preven-tion programs and initiatives for early childhood and school-age youth, but offered few examples of prevention programs for transition-age youth .
Though california has made many strides in implementing prevention and early intervention, respondents also discussed challenges including low resources, poor service capacity, and lack of systemic priority in providing pEi services .
in these tough economic times, it is critically impor-tant to raise awareness of the long-term benefits and cost-effectiveness of prevention and early interven-tion in reducing behavioral and emotional disorders in children .
Recommendations
The state of California and counties should:♦ increase legislative and systemic funding, focus
and support for prevention and early interven-tion practices and policies in mental health, as well as continued expansion of assessment and screening of at-risk children who may otherwise “fall through the cracks;”
♦ expand application and outcome tracking of evidence-based child and family prevention programs, supports, policies and strategies to help reduce risk factors in the child’s environment (community, family, school, and individual) that can lead to future problem behaviors;
♦ integrate positive youth development models system-wide to increase bonding of children and engage families and communities in promoting and enhancing positive mental health in children; and
♦ strengthen collaboration within communities, and across county, state and federal disciplines through shared language and vision of children’s mental health; strategic planning; resources coordination; and the development of measurable outcomes tracked over time to ensure account-ability over the long-term .
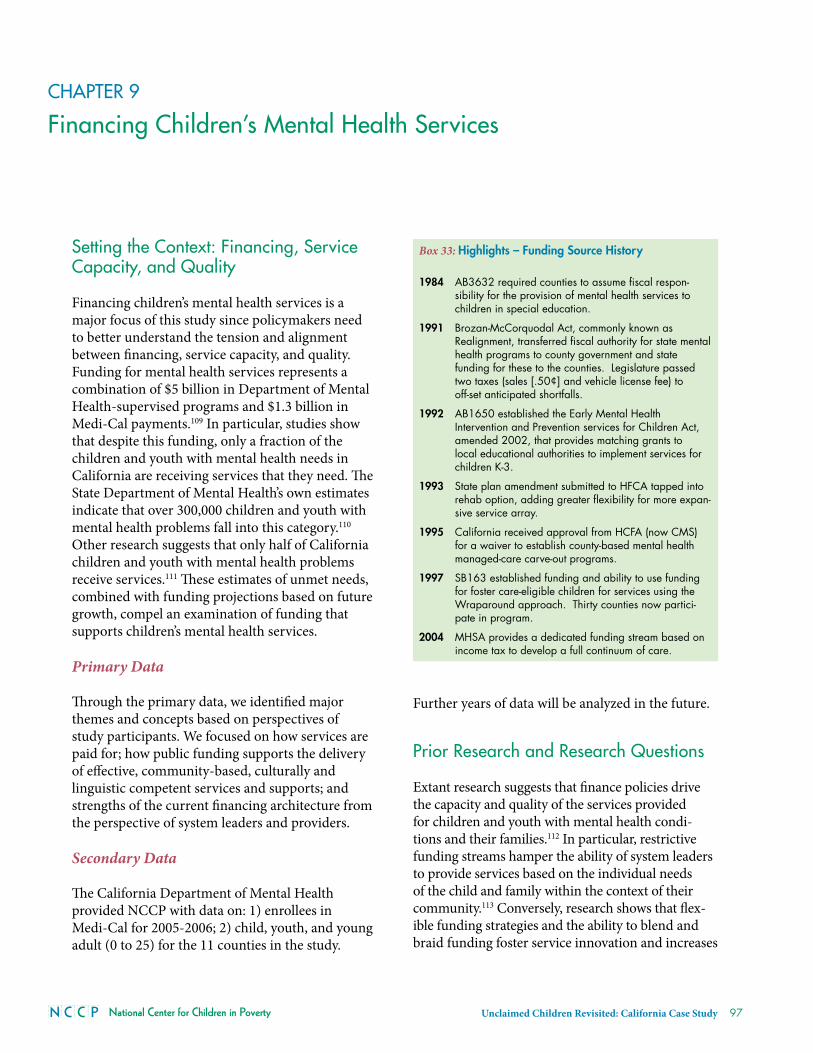
National Center for Children in Poverty Unclaimed Children Revisited: California Case Study 97
CHAPTeR 9
Financing Children’s Mental Health Services
Setting the Context: Financing, Service Capacity, and Quality
Financing children’s mental health services is a major focus of this study since policymakers need to better understand the tension and alignment between financing, service capacity, and quality . Funding for mental health services represents a combination of $5 billion in Department of mental health-supervised programs and $1 .3 billion in medi-cal payments .109 in particular, studies show that despite this funding, only a fraction of the children and youth with mental health needs in california are receiving services that they need . The State Department of mental health’s own estimates indicate that over 300,000 children and youth with mental health problems fall into this category .110 Other research suggests that only half of california children and youth with mental health problems receive services .111 These estimates of unmet needs, combined with funding projections based on future growth, compel an examination of funding that supports children’s mental health services .
Primary Data
Through the primary data, we identified major themes and concepts based on perspectives of study participants . We focused on how services are paid for; how public funding supports the delivery of effective, community-based, culturally and linguistic competent services and supports; and strengths of the current financing architecture from the perspective of system leaders and providers .
Secondary Data
The california Department of mental health provided Nccp with data on: 1) enrollees in medi-cal for 2005-2006; 2) child, youth, and young adult (0 to 25) for the 11 counties in the study .
Further years of data will be analyzed in the future .
Prior Research and Research Questions
Extant research suggests that finance policies drive the capacity and quality of the services provided for children and youth with mental health condi-tions and their families .112 in particular, restrictive funding streams hamper the ability of system leaders to provide services based on the individual needs of the child and family within the context of their community .113 conversely, research shows that flex-ible funding strategies and the ability to blend and braid funding foster service innovation and increases
Box 33: highlights – funding source history
1984 AB3632 required counties to assume fiscal respon-sibility for the provision of mental health services to children in special education.
1991 Brozan-McCorquodal Act, commonly known as Realignment, transferred fiscal authority for state mental health programs to county government and state funding for these to the counties. Legislature passed two taxes (sales [.50¢] and vehicle license fee) to off-set anticipated shortfalls.
1992 AB1650 established the Early Mental Health Intervention and Prevention services for Children Act, amended 2002, that provides matching grants to local educational authorities to implement services for children K-3.
1993 State plan amendment submitted to HFCA tapped into rehab option, adding greater flexibility for more expan-sive service array.
1995 California received approval from HCFA (now CMS) for a waiver to establish county-based mental health managed-care carve-out programs.
1997 SB163 established funding and ability to use funding for foster care-eligible children for services using the Wraparound approach. Thirty counties now partici-pate in program.
2004 MHSA provides a dedicated funding stream based on income tax to develop a full continuum of care.
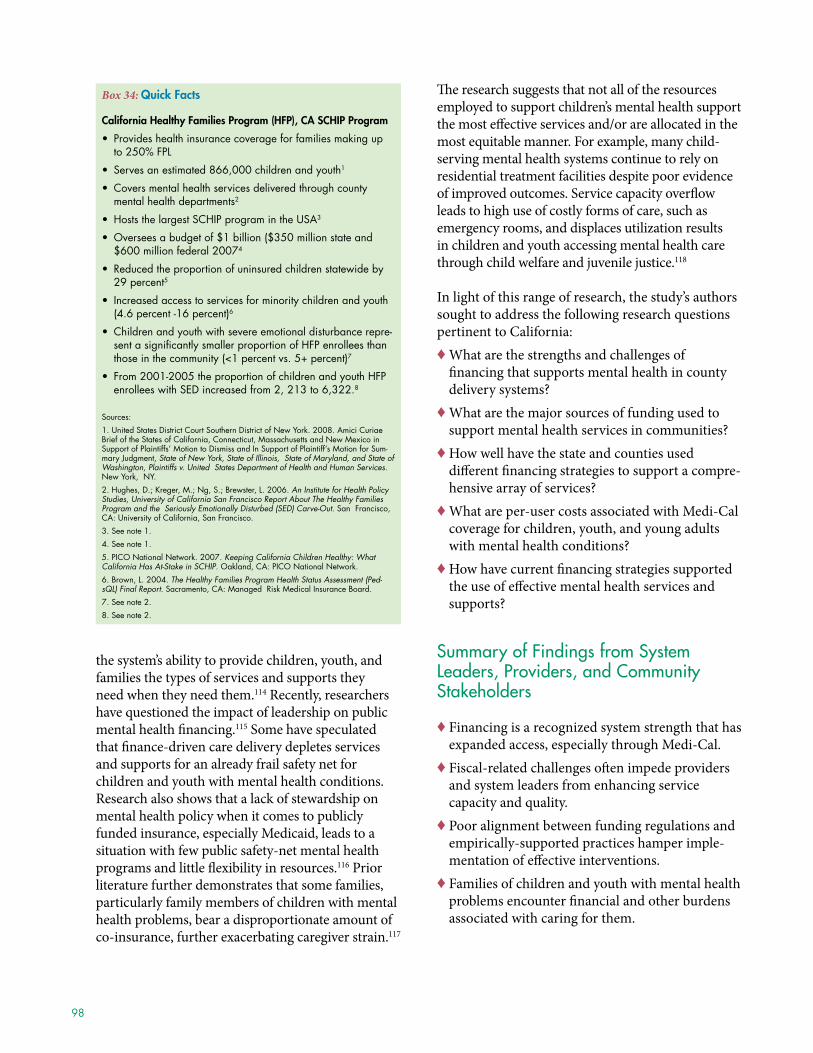
98
the system’s ability to provide children, youth, and families the types of services and supports they need when they need them .114 recently, researchers have questioned the impact of leadership on public mental health financing .115 Some have speculated that finance-driven care delivery depletes services and supports for an already frail safety net for children and youth with mental health conditions . research also shows that a lack of stewardship on mental health policy when it comes to publicly funded insurance, especially medicaid, leads to a situation with few public safety-net mental health programs and little flexibility in resources .116 prior literature further demonstrates that some families, particularly family members of children with mental health problems, bear a disproportionate amount of co-insurance, further exacerbating caregiver strain .117
The research suggests that not all of the resources employed to support children’s mental health support the most effective services and/or are allocated in the most equitable manner . For example, many child-serving mental health systems continue to rely on residential treatment facilities despite poor evidence of improved outcomes . Service capacity overflow leads to high use of costly forms of care, such as emergency rooms, and displaces utilization results in children and youth accessing mental health care through child welfare and juvenile justice .118
in light of this range of research, the study’s authors sought to address the following research questions pertinent to california:♦ What are the strengths and challenges of
financing that supports mental health in county delivery systems?
♦ What are the major sources of funding used to support mental health services in communities?
♦ how well have the state and counties used different financing strategies to support a compre-hensive array of services?
♦ What are per-user costs associated with medi-cal coverage for children, youth, and young adults with mental health conditions?
♦ how have current financing strategies supported the use of effective mental health services and supports?
Summary of Findings from System leaders, Providers, and Community Stakeholders
♦ Financing is a recognized system strength that has expanded access, especially through medi-cal .
♦ Fiscal-related challenges often impede providers and system leaders from enhancing service capacity and quality .
♦ poor alignment between funding regulations and empirically-supported practices hamper imple-mentation of effective interventions .
♦ Families of children and youth with mental health problems encounter financial and other burdens associated with caring for them .
Box 34: Quick facts
California healthy families Program (hfP), Ca sChiP Program
• Provides health insurance coverage for families making up to 250% FPL
• Serves an estimated 866,000 children and youth1
• Covers mental health services delivered through county mental health departments2
• Hosts the largest SCHIP program in the USA3
• Oversees a budget of $1 billion ($350 million state and $600 million federal 20074
• Reduced the proportion of uninsured children statewide by 29 percent5
• Increased access to services for minority children and youth (4.6 percent -16 percent)6
• Children and youth with severe emotional disturbance repre-sent a significantly smaller proportion of HFP enrollees than those in the community (<1 percent vs. 5+ percent)7
• From 2001-2005 the proportion of children and youth HFP enrollees with SED increased from 2, 213 to 6,322.8
Sources:
1. United States District Court Southern District of New York. 2008. Amici Curiae Brief of the States of California, Connecticut, Massachusetts and New Mexico in Support of Plaintiffs’ Motion to Dismiss and In Support of Plaintiff’s Motion for Sum-mary Judgment, State of New York, State of Illinois, State of Maryland, and State of Washington, Plaintiffs v. United States Department of Health and Human Services. New York, NY.
2. Hughes, D.; Kreger, M.; Ng, S.; Brewster, L. 2006. An Institute for Health Policy Studies, University of California San Francisco Report About The Healthy Families Program and the Seriously Emotionally Disturbed (SED) Carve-Out. San Francisco, CA: University of California, San Francisco.
3. See note 1.
4. See note 1.
5. PICO National Network. 2007. Keeping California Children Healthy: What California Has At-Stake in SCHIP. Oakland, CA: PICO National Network.
6. Brown, L. 2004. The Healthy Families Program Health Status Assessment (Ped-sQL) Final Report. Sacramento, CA: Managed Risk Medical Insurance Board.
7. See note 2.
8. See note 2.
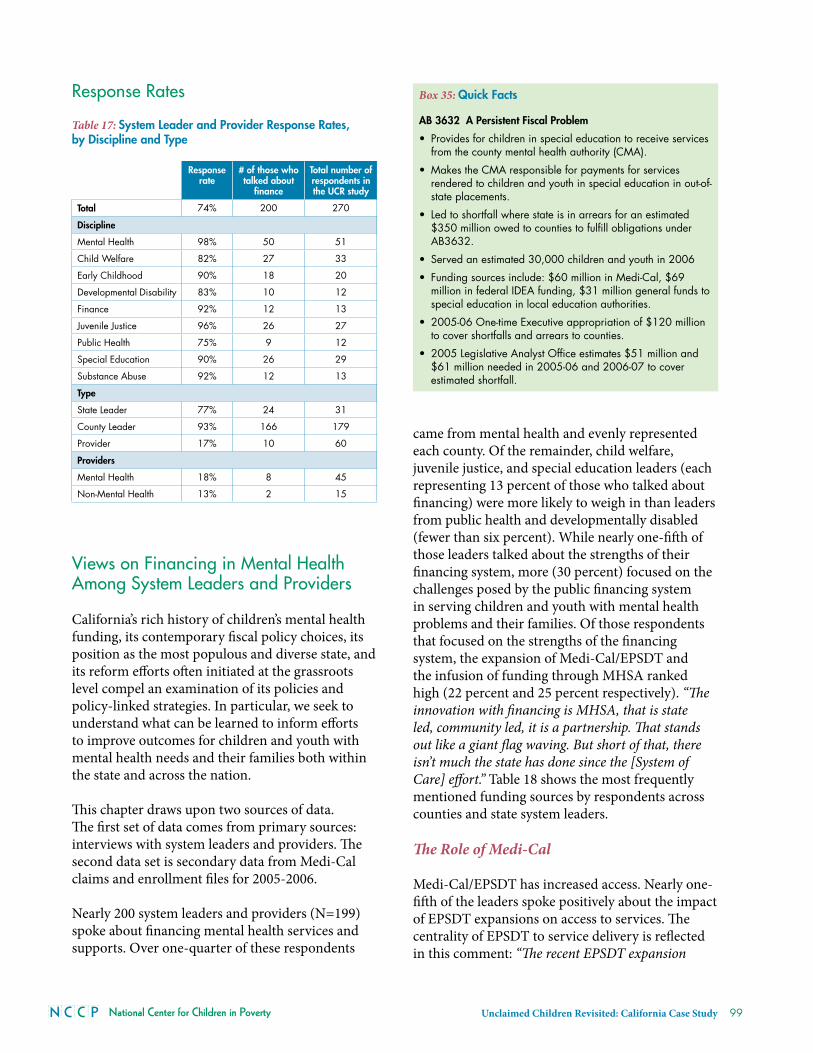
National Center for Children in Poverty Unclaimed Children Revisited: California Case Study 99
Response Rates
Table 17: system leader and Provider Response Rates, by discipline and Type
Response rate
# of those who talked about
finance
Total number of respondents in the uCR study
Total 74% 200 270
discipline
Mental Health 98% 50 51
Child Welfare 82% 27 33
Early Childhood 90% 18 20
Developmental Disability 83% 10 12
Finance 92% 12 13
Juvenile Justice 96% 26 27
Public Health 75% 9 12
Special Education 90% 26 29
Substance Abuse 92% 12 13
Type
State Leader 77% 24 31
County Leader 93% 166 179
Provider 17% 10 60
Providers
Mental Health 18% 8 45
Non-Mental Health 13% 2 15
views on Financing in Mental Health Among System leaders and Providers
california’s rich history of children’s mental health funding, its contemporary fiscal policy choices, its position as the most populous and diverse state, and its reform efforts often initiated at the grassroots level compel an examination of its policies and policy-linked strategies . in particular, we seek to understand what can be learned to inform efforts to improve outcomes for children and youth with mental health needs and their families both within the state and across the nation .
This chapter draws upon two sources of data . The first set of data comes from primary sources: interviews with system leaders and providers . The second data set is secondary data from medi-cal claims and enrollment files for 2005-2006 .
Nearly 200 system leaders and providers (N=199) spoke about financing mental health services and supports . Over one-quarter of these respondents
came from mental health and evenly represented each county . Of the remainder, child welfare, juvenile justice, and special education leaders (each representing 13 percent of those who talked about financing) were more likely to weigh in than leaders from public health and developmentally disabled (fewer than six percent) . While nearly one-fifth of those leaders talked about the strengths of their financing system, more (30 percent) focused on the challenges posed by the public financing system in serving children and youth with mental health problems and their families . Of those respondents that focused on the strengths of the financing system, the expansion of medi-cal/EpSDt and the infusion of funding through mhSa ranked high (22 percent and 25 percent respectively) . “The innovation with financing is MHSA, that is state led, community led, it is a partnership. That stands out like a giant flag waving. But short of that, there isn’t much the state has done since the [System of Care] effort.” table 18 shows the most frequently mentioned funding sources by respondents across counties and state system leaders .
The Role of Medi-Cal
medi-cal/EpSDt has increased access . Nearly one-fifth of the leaders spoke positively about the impact of EpSDt expansions on access to services . The centrality of EpSDt to service delivery is reflected in this comment: “The recent EPSDT expansion
Box 35: Quick facts
aB 3632 a Persistent fiscal Problem
• Provides for children in special education to receive services from the county mental health authority (CMA).
• Makes the CMA responsible for payments for services rendered to children and youth in special education in out-of-state placements.
• Led to shortfall where state is in arrears for an estimated $350 million owed to counties to fulfill obligations under AB3632.
• Served an estimated 30,000 children and youth in 2006
• Funding sources include: $60 million in Medi-Cal, $69 million in federal IDEA funding, $31 million general funds to special education in local education authorities.
• 2005-06 One-time Executive appropriation of $120 million to cover shortfalls and arrears to counties.
• 2005 Legislative Analyst Office estimates $51 million and $61 million needed in 2005-06 and 2006-07 to cover estimated shortfall.
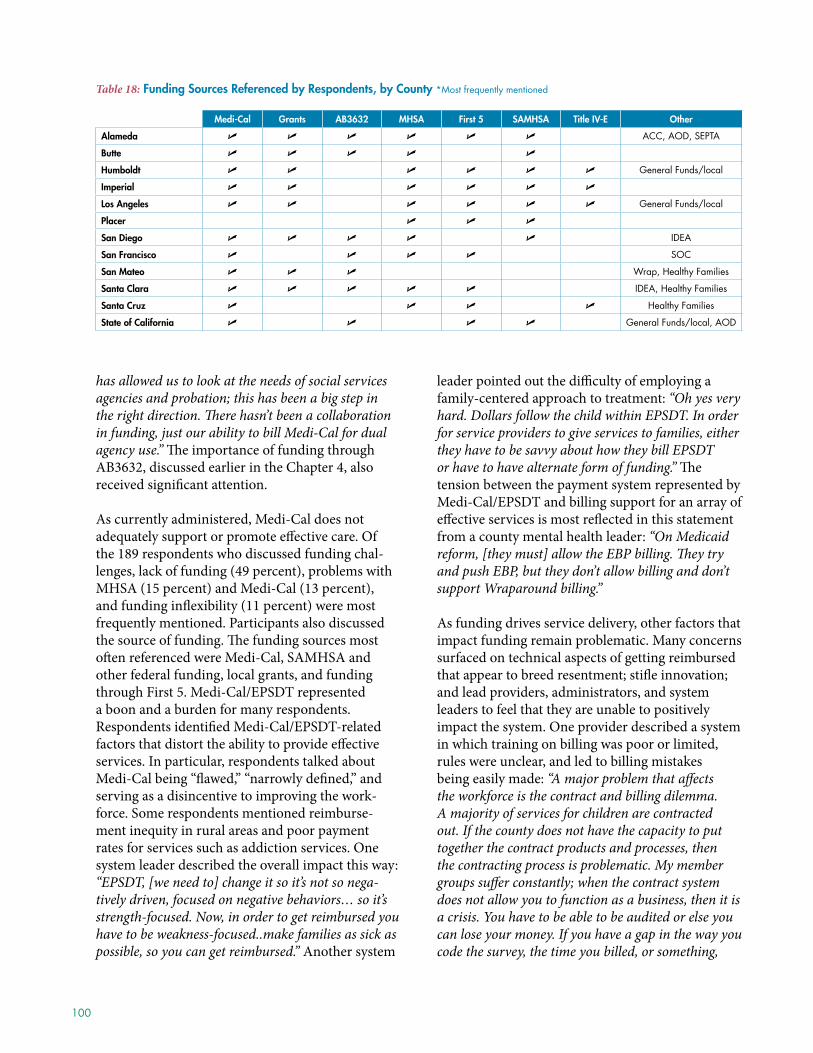
100
has allowed us to look at the needs of social services agencies and probation; this has been a big step in the right direction. There hasn’t been a collaboration in funding, just our ability to bill Medi-Cal for dual agency use.” The importance of funding through aB3632, discussed earlier in the chapter 4, also received significant attention .
as currently administered, medi-cal does not adequately support or promote effective care . Of the 189 respondents who discussed funding chal-lenges, lack of funding (49 percent), problems with mhSa (15 percent) and medi-cal (13 percent), and funding inflexibility (11 percent) were most frequently mentioned . participants also discussed the source of funding . The funding sources most often referenced were medi-cal, SamhSa and other federal funding, local grants, and funding through First 5 . medi-cal/EpSDt represented a boon and a burden for many respondents . respondents identified medi-cal/EpSDt-related factors that distort the ability to provide effective services . in particular, respondents talked about medi-cal being “flawed,” “narrowly defined,” and serving as a disincentive to improving the work-force . Some respondents mentioned reimburse-ment inequity in rural areas and poor payment rates for services such as addiction services . One system leader described the overall impact this way: “EPSDT, [we need to] change it so it’s not so nega-tively driven, focused on negative behaviors… so it’s strength-focused. Now, in order to get reimbursed you have to be weakness-focused..make families as sick as possible, so you can get reimbursed.” another system
leader pointed out the difficulty of employing a family-centered approach to treatment: “Oh yes very hard. Dollars follow the child within EPSDT. In order for service providers to give services to families, either they have to be savvy about how they bill EPSDT or have to have alternate form of funding.” The tension between the payment system represented by medi-cal/EpSDt and billing support for an array of effective services is most reflected in this statement from a county mental health leader: “On Medicaid reform, [they must] allow the EBP billing. They try and push EBP, but they don’t allow billing and don’t support Wraparound billing.”
as funding drives service delivery, other factors that impact funding remain problematic . many concerns surfaced on technical aspects of getting reimbursed that appear to breed resentment; stifle innovation; and lead providers, administrators, and system leaders to feel that they are unable to positively impact the system . One provider described a system in which training on billing was poor or limited, rules were unclear, and led to billing mistakes being easily made: “A major problem that affects the workforce is the contract and billing dilemma. A majority of services for children are contracted out. If the county does not have the capacity to put together the contract products and processes, then the contracting process is problematic. My member groups suffer constantly; when the contract system does not allow you to function as a business, then it is a crisis. You have to be able to be audited or else you can lose your money. If you have a gap in the way you code the survey, the time you billed, or something,
Table 18: funding sources Referenced by Respondents, by County *Most frequently mentioned
Medi-Cal grants aB3632 Mhsa first 5 saMhsa Title iV-E Other
alameda ACC, AOD, SEPTA
Butte
humboldt General Funds/local
imperial
los angeles General Funds/local
Placer
san diego IDEA
san francisco SOC
san Mateo Wrap, Healthy Families
santa Clara IDEA, Healthy Families
santa Cruz Healthy Families
state of California General Funds/local, AOD
National Center for Children in Poverty Unclaimed Children Revisited: California Case Study 101
you will lose a lot of money. Medi-Cal does not allow you to bill to reserve. If there are technical errors, if the way you bill was wrong, the state wants the money back.” another provider took issue with the system for educating organizations: “We got training from the Department of Mental Health Services, and a person came out to our facility and told us exactly how to present our progress notes, including the exact wording and format. When we had ques-tions, another person came out and told us something different than what the original trainer told us. It was a different story depending upon who we talked to, and the auditors might see things completely different. So there was inconsistency between the auditors and the trainers.” These problems have implications for small agencies and agencies new to mental health service provision and for the implementation of evidence-based practices .
a number of providers and system leaders expressed concerns about the influence of medi-cal administration on adoption of evidence-based practices (N=8) . according to one provider of child mental health services, “Right now, we implement very little evidence-based treatments because we are a private agency, so we don’t have to follow that because we don’t rely on federal or state funding. The most common barriers to evidence-based treatment is that there is so much paperwork that you have to do, that it prevents any good clinician from providing effective treatment. There is a minimum of 20 pages of paperwork required for some of the evidence based-treatment if you want to get funding from the govern-ment. The way that the payments are disbursed is punitive because you are only allowed a minimum amount of time for note-taking and for case manage-ment. And when auditors come, it is really scary for mental health providers.”
a provider in another county reflected on the qual-ity-compliance debate this way: “There is pressure to maintain high quality but keep up with demand of paperwork. There is auditor pressure and Medi-Cal pressure. Auditors come from Sacramento; they are trained to deny. They’re trying to take a microscope to see what you did wrong, and they’re small amounts. Supervisors and managers get anxious and feel pres-sure and push that down to line-staff. The pressure is what makes the quality of services go down. Our staff sometimes doesn’t take lunch or they work and not get paid. They are really committed to our clients.”
Leaders at the state level commented on the lack of alignment between the regulatory environment and quality services: “[We are] moving towards [where] state-of-the-art services is perceived as a risk. [They are] doing things in a way that isn’t supportive.” another leader from a county referenced a system where “mixed messages” are being put out . a strong perception among these leaders, including state system leaders, was that medi-cal as currently administered was overly compliance-driven, stymied genuine accountability, and contributed to a climate of fear and phobia about audits . among the many concerns about audits were that they were
Box 36: The inmate Exception1
Federal law prohibits Medicaid payments “with respect to care or services for any individual who is an inmate of a public institution.”
Children in the juvenile justice system who are held in correc-tional institutions such as juvenile halls, camps, ranches or California Youth Authority facilities are those most affected by the inmate exception.
Federal law is also clear that Medicaid coverage may be suspended but eligibility should not be terminated upon incar-ceration; Medicaid coverage must be immediately restored upon release unless the person is no longer eligible. However, state regulations terminate Medi-Cal eligibility for inmates, and a survey of California Probation Departments show disparities in county practices with respect to Medi-Cal billing for youths in institutions.
State and county policy and practice could be changed to increase federal financial participation in health care services to youth in the juvenile justice system. Strategies include: 1) coverage of youth awaiting placement; 2) ensuring that court orders, placements, and program structure maximize eligibility for coverage; 3) clarifying state policy concerning termination of eligibility, reinstatement of benefits upon release, and coverage of treatment services provided in the community to youth who are wards of the California Youth Authority.
For more than a year, the Youth Justice Coalition along with dozens of families and parents has organized an effort to challenge the LA County Department of Probation’s billing of families. On Feb. 13th, 2009, the chief of probation in LA County declared a moratorium [suspension] on all billing of families with youth involved in the juvenile justice system (deten-tion and camp).2
Sources:
1. Youth Law Center. 2002. The “Inmate exception” and Its Impact on Healthcare Services for Children in Out-of-home Care in California. San Francisco, CA.
2. Youth Justice Coalition. 2009. Getting Paid: The Bills Collected by the Los Angeles Department of Probation Put Youth at Risk and Impoverish Families. Los Angeles, CA. Accessed Dec. 29, 2009 from https://org2.democracyinaction.org/o/5438/im-ages/2-28-09%20Thru%203-7-09%20YJC%20Action%20Update.pdf.
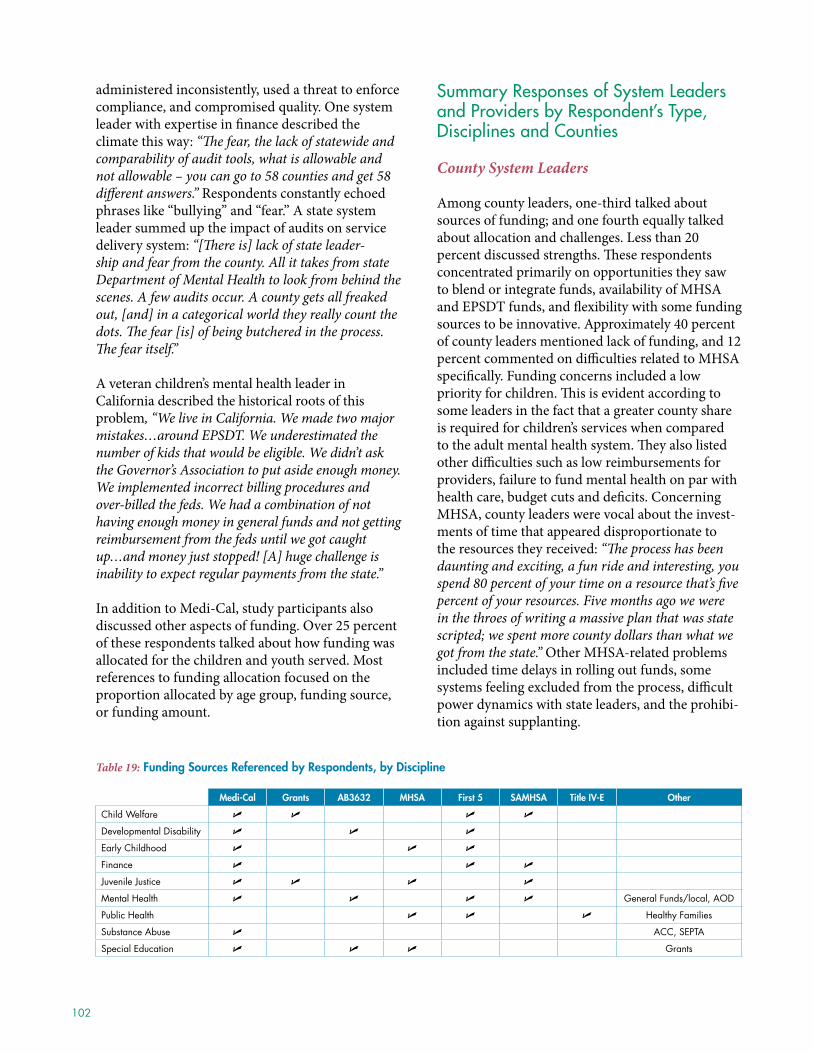
102
administered inconsistently, used a threat to enforce compliance, and compromised quality . One system leader with expertise in finance described the climate this way: “The fear, the lack of statewide and comparability of audit tools, what is allowable and not allowable – you can go to 58 counties and get 58 different answers.” respondents constantly echoed phrases like “bullying” and “fear .” a state system leader summed up the impact of audits on service delivery system: “[There is] lack of state leader-ship and fear from the county. All it takes from state Department of Mental Health to look from behind the scenes. A few audits occur. A county gets all freaked out, [and] in a categorical world they really count the dots. The fear [is] of being butchered in the process. The fear itself.”
a veteran children’s mental health leader in california described the historical roots of this problem, “We live in California. We made two major mistakes…around EPSDT. We underestimated the number of kids that would be eligible. We didn’t ask the Governor’s Association to put aside enough money. We implemented incorrect billing procedures and over-billed the feds. We had a combination of not having enough money in general funds and not getting reimbursement from the feds until we got caught up…and money just stopped! [A] huge challenge is inability to expect regular payments from the state.”
in addition to medi-cal, study participants also discussed other aspects of funding . Over 25 percent of these respondents talked about how funding was allocated for the children and youth served . most references to funding allocation focused on the proportion allocated by age group, funding source, or funding amount .
Summary Responses of System leaders and Providers by Respondent’s Type, disciplines and Counties
County System Leaders
among county leaders, one-third talked about sources of funding; and one fourth equally talked about allocation and challenges . Less than 20 percent discussed strengths . These respondents concentrated primarily on opportunities they saw to blend or integrate funds, availability of mhSa and EpSDt funds, and flexibility with some funding sources to be innovative . approximately 40 percent of county leaders mentioned lack of funding, and 12 percent commented on difficulties related to mhSa specifically . Funding concerns included a low priority for children . This is evident according to some leaders in the fact that a greater county share is required for children’s services when compared to the adult mental health system . They also listed other difficulties such as low reimbursements for providers, failure to fund mental health on par with health care, budget cuts and deficits . concerning mhSa, county leaders were vocal about the invest-ments of time that appeared disproportionate to the resources they received: “The process has been daunting and exciting, a fun ride and interesting, you spend 80 percent of your time on a resource that’s five percent of your resources. Five months ago we were in the throes of writing a massive plan that was state scripted; we spent more county dollars than what we got from the state.” Other mhSa-related problems included time delays in rolling out funds, some systems feeling excluded from the process, difficult power dynamics with state leaders, and the prohibi-tion against supplanting .
Table 19: funding sources Referenced by Respondents, by discipline
Medi-Cal grants aB3632 Mhsa first 5 saMhsa Title iV-E Other
Child Welfare
Developmental Disability
Early Childhood
Finance
Juvenile Justice
Mental Health General Funds/local, AOD
Public Health Healthy Families
Substance Abuse ACC, SEPTA
Special Education Grants
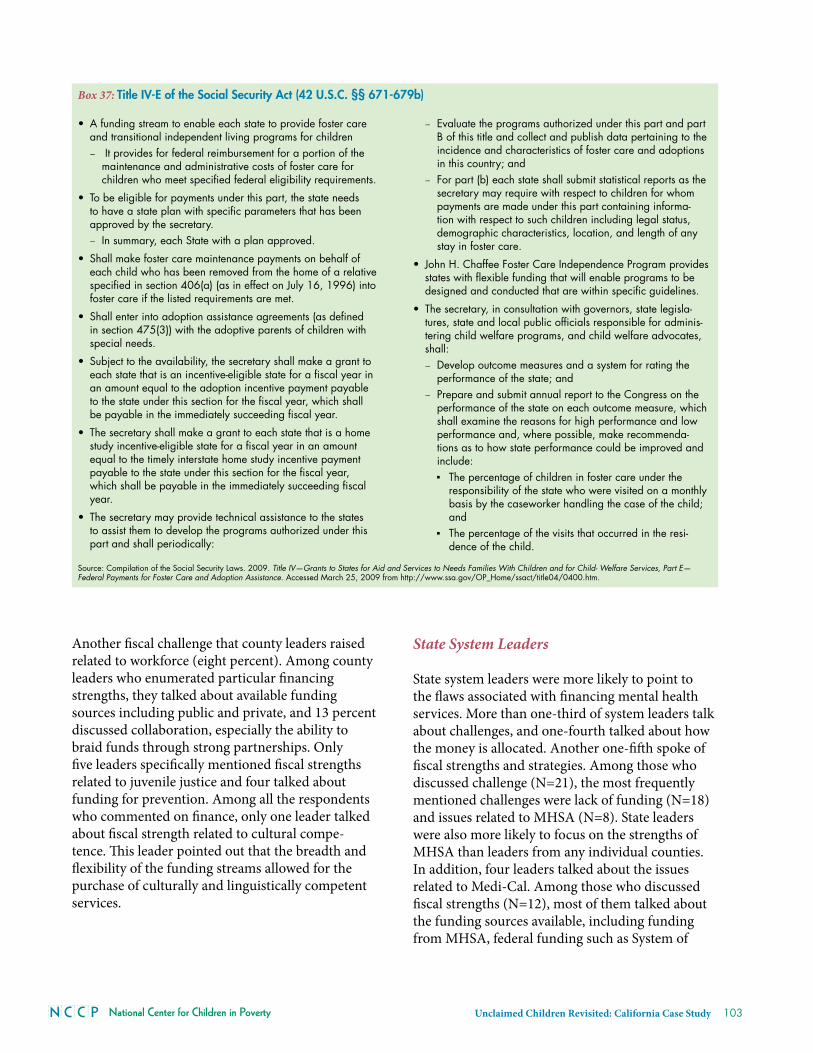
National Center for Children in Poverty Unclaimed Children Revisited: California Case Study 103
another fiscal challenge that county leaders raised related to workforce (eight percent) . among county leaders who enumerated particular financing strengths, they talked about available funding sources including public and private, and 13 percent discussed collaboration, especially the ability to braid funds through strong partnerships . Only five leaders specifically mentioned fiscal strengths related to juvenile justice and four talked about funding for prevention . among all the respondents who commented on finance, only one leader talked about fiscal strength related to cultural compe-tence . This leader pointed out that the breadth and flexibility of the funding streams allowed for the purchase of culturally and linguistically competent services .
State System Leaders
State system leaders were more likely to point to the flaws associated with financing mental health services . more than one-third of system leaders talk about challenges, and one-fourth talked about how the money is allocated . another one-fifth spoke of fiscal strengths and strategies . among those who discussed challenge (N=21), the most frequently mentioned challenges were lack of funding (N=18) and issues related to mhSa (N=8) . State leaders were also more likely to focus on the strengths of mhSa than leaders from any individual counties . in addition, four leaders talked about the issues related to medi-cal . among those who discussed fiscal strengths (N=12), most of them talked about the funding sources available, including funding from mhSa, federal funding such as System of
Box 37: Title iV-E of the social security act (42 u.s.C. §§ 671-679b)
Source: Compilation of the Social Security Laws. 2009. Title IV—Grants to States for Aid and Services to Needs Families With Children and for Child- Welfare Services, Part E—Federal Payments for Foster Care and Adoption Assistance. Accessed March 25, 2009 from http://www.ssa.gov/OP_Home/ssact/title04/0400.htm.
• A funding stream to enable each state to provide foster care and transitional independent living programs for children – It provides for federal reimbursement for a portion of the maintenance and administrative costs of foster care for children who meet specified federal eligibility requirements.
• To be eligible for payments under this part, the state needs to have a state plan with specific parameters that has been approved by the secretary. – In summary, each State with a plan approved.
• Shall make foster care maintenance payments on behalf of each child who has been removed from the home of a relative specified in section 406(a) (as in effect on July 16, 1996) into foster care if the listed requirements are met.
• Shall enter into adoption assistance agreements (as defined in section 475(3)) with the adoptive parents of children with special needs.
• Subject to the availability, the secretary shall make a grant to each state that is an incentive-eligible state for a fiscal year in an amount equal to the adoption incentive payment payable to the state under this section for the fiscal year, which shall be payable in the immediately succeeding fiscal year.
• The secretary shall make a grant to each state that is a home study incentive-eligible state for a fiscal year in an amount equal to the timely interstate home study incentive payment payable to the state under this section for the fiscal year, which shall be payable in the immediately succeeding fiscal year.
• The secretary may provide technical assistance to the states to assist them to develop the programs authorized under this part and shall periodically:
– Evaluate the programs authorized under this part and part B of this title and collect and publish data pertaining to the incidence and characteristics of foster care and adoptions in this country; and
– For part (b) each state shall submit statistical reports as the secretary may require with respect to children for whom payments are made under this part containing informa-tion with respect to such children including legal status, demographic characteristics, location, and length of any stay in foster care.
• John H. Chaffee Foster Care Independence Program provides states with flexible funding that will enable programs to be designed and conducted that are within specific guidelines.
• The secretary, in consultation with governors, state legisla-tures, state and local public officials responsible for adminis-tering child welfare programs, and child welfare advocates, shall: – Develop outcome measures and a system for rating the performance of the state; and
– Prepare and submit annual report to the Congress on the performance of the state on each outcome measure, which shall examine the reasons for high performance and low performance and, where possible, make recommenda-tions as to how state performance could be improved and include: ▪ The percentage of children in foster care under the
responsibility of the state who were visited on a monthly basis by the caseworker handling the case of the child; and
▪ The percentage of the visits that occurred in the resi-dence of the child.
104
care, and flexibility from some of these sources . One leader lauded the availability of funding to develop and sustain a family movement . two leaders specifically talked about the emerging focus on prevention made possible by mhSa .
Providers
among providers, most talked about challenges (eight) and a few talked about strengths (four) . among those who spoke of challenges, the over-whelming majority (seven out of eight leaders) discussed lack of funding . This line of response centered on low wages, the lack of funds for specific populations, and the administrative costs of administering small grant funds . Four providers also talked about problems related to medi-cal, including low reimbursement and technical problems with billing . approximately half of the providers talked about strengths, and their discussions centered on the availability of First 5 funding to make up the gap for the uninsured in medi-cal, the expansion of EpSDt, availability of aB 3632, and the funding specifically earmarked for contracted services .
Across Disciplines
With the exception of juvenile justice and finance leaders, less than half of system leaders talked about strengths of the financing system . public health leaders were least likely to talk about fiscal strengths while the majority (78 percent) discussed challenges . Developmental disability leaders were least likely to talk about fiscal challenges (40 percent) . in terms of the type of funding, finance leaders were most likely to talk about medi-caL, followed by developmental disability and mental health leaders (10 percent each) . about 14 percent of mental health leaders also talked about mhSa as the major funding sources . Except developmental disability leaders and early childhood leaders, more than half of other leaders talked about funding as the major challenge . Workforce is also discussed as major challenges among finance leaders (33 percent) and public health leaders .
Across Counties
The majority of alameda, Santa cruz, San Diego, San Francisco and San mateo leaders talked about fiscal strengths while less than half of leaders talked about fiscal strengths in the remaining counties . Except Butte, placer and San Diego and San mateo, the majority of leaders from all the remaining coun-ties talked about fiscal challenges . alameda county leaders were most likely to discuss medi-cal among funding sources (38 percent) . Butte and placer and San Diego and San mateo leaders were less likely to talk about funding challenges than other county leaders (33, 36, 40 and 46 percent respectively) .
Financing Mental Health Services and Supports: Secondary data Analysis of Medi-Cal Payment and Utilization
This section of the chapter analyzes payment and utilization information for services and supports delivered to children and youth in the 11 coun-ties included in the study . in particular, it outlines average per-claimant costs for children and youth enrolled in medi-cal who received mental health services . The results of this analysis show the following:♦ per-claimant costs for children and youth with
mental health conditions in 2005-2006 were approximately $6,000 .
♦ counties varied in their average per-claimant expenditures and which services they support .
♦ counties with the highest per-claimant costs for inpatient services also had high per-claimant outpatient costs .
♦ average per-claimant costs for outpatient behav-ioral health services, by county, ranged from $3,142 to $11,206 .
♦ The average payment for mental health claim-ants, including outpatient and inpatient services, was significantly impacted by race and ethnicity, primary language, and gender .
♦ Several behavioral health payment modes repre-sent black boxes and hamper the state and coun-ty’s ability to track effective services and promote transparency .
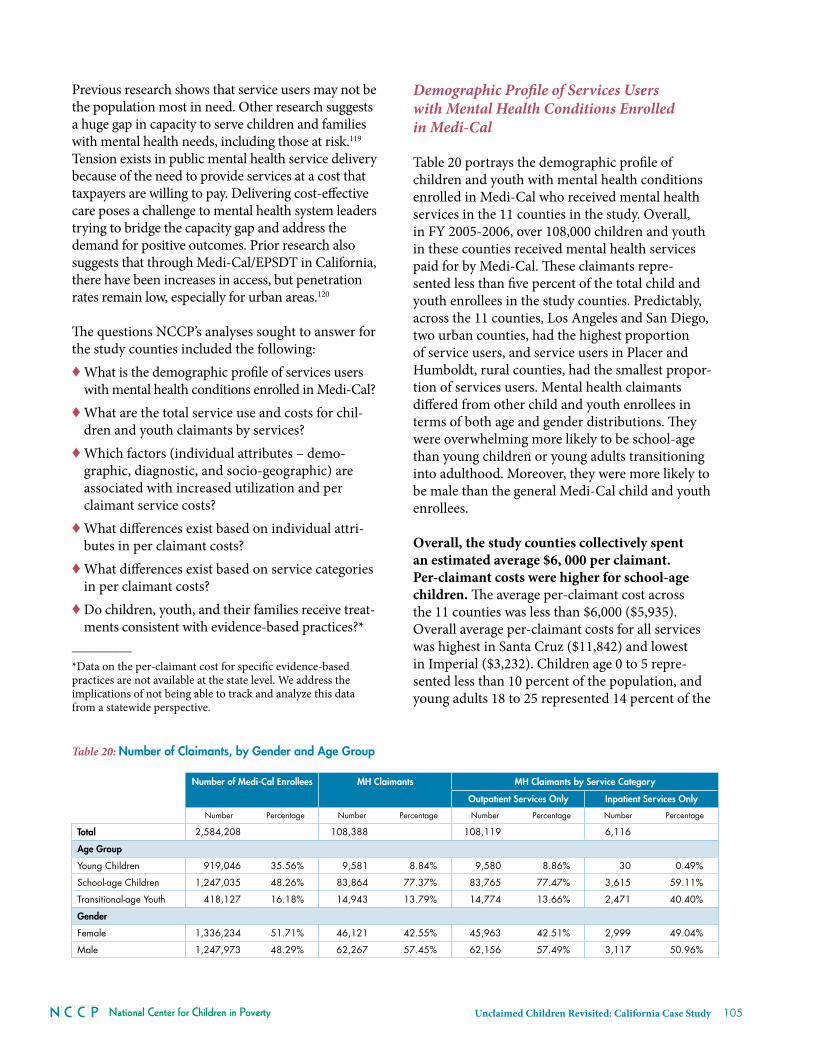
National Center for Children in Poverty Unclaimed Children Revisited: California Case Study 105
previous research shows that service users may not be the population most in need . Other research suggests a huge gap in capacity to serve children and families with mental health needs, including those at risk .119 tension exists in public mental health service delivery because of the need to provide services at a cost that taxpayers are willing to pay . Delivering cost-effective care poses a challenge to mental health system leaders trying to bridge the capacity gap and address the demand for positive outcomes . prior research also suggests that through medi-cal/EpSDt in california, there have been increases in access, but penetration rates remain low, especially for urban areas .120
The questions Nccp’s analyses sought to answer for the study counties included the following:♦ What is the demographic profile of services users
with mental health conditions enrolled in medi-cal?♦ What are the total service use and costs for chil-
dren and youth claimants by services?♦ Which factors (individual attributes – demo-
graphic, diagnostic, and socio-geographic) are associated with increased utilization and per claimant service costs?
♦ What differences exist based on individual attri-butes in per claimant costs?
♦ What differences exist based on service categories in per claimant costs?
♦ Do children, youth, and their families receive treat-ments consistent with evidence-based practices?*
__________*Data on the per-claimant cost for specific evidence-based practices are not available at the state level . We address the implications of not being able to track and analyze this data from a statewide perspective .
Demographic Profile of Services Users with Mental Health Conditions Enrolled in Medi-Cal
table 20 portrays the demographic profile of children and youth with mental health conditions enrolled in medi-cal who received mental health services in the 11 counties in the study . Overall, in Fy 2005-2006, over 108,000 children and youth in these counties received mental health services paid for by medi-cal . These claimants repre-sented less than five percent of the total child and youth enrollees in the study counties . predictably, across the 11 counties, Los angeles and San Diego, two urban counties, had the highest proportion of service users, and service users in placer and humboldt, rural counties, had the smallest propor-tion of services users . mental health claimants differed from other child and youth enrollees in terms of both age and gender distributions . They were overwhelming more likely to be school-age than young children or young adults transitioning into adulthood . moreover, they were more likely to be male than the general medi-cal child and youth enrollees .
Overall, the study counties collectively spent an estimated average $6, 000 per claimant. Per-claimant costs were higher for school-age children. The average per-claimant cost across the 11 counties was less than $6,000 ($5,935) . Overall average per-claimant costs for all services was highest in Santa cruz ($11,842) and lowest in imperial ($3,232) . children age 0 to 5 repre-sented less than 10 percent of the population, and young adults 18 to 25 represented 14 percent of the
Table 20: number of Claimants, by gender and age group
number of Medi-Cal Enrollees Mh Claimants Mh Claimants by service Category
Outpatient services Only inpatient services Only
Number Percentage Number Percentage Number Percentage Number Percentage
Total 2,584,208 108,388 108,119 6,116
age group
Young Children 919,046 35.56% 9,581 8.84% 9,580 8.86% 30 0.49%
School-age Children 1,247,035 48.26% 83,864 77.37% 83,765 77.47% 3,615 59.11%
Transitional-age Youth 418,127 16.18% 14,943 13.79% 14,774 13.66% 2,471 40.40%
gender
Female 1,336,234 51.71% 46,121 42.55% 45,963 42.51% 2,999 49.04%
Male 1,247,973 48.29% 62,267 57.45% 62,156 57.49% 3,117 50.96%
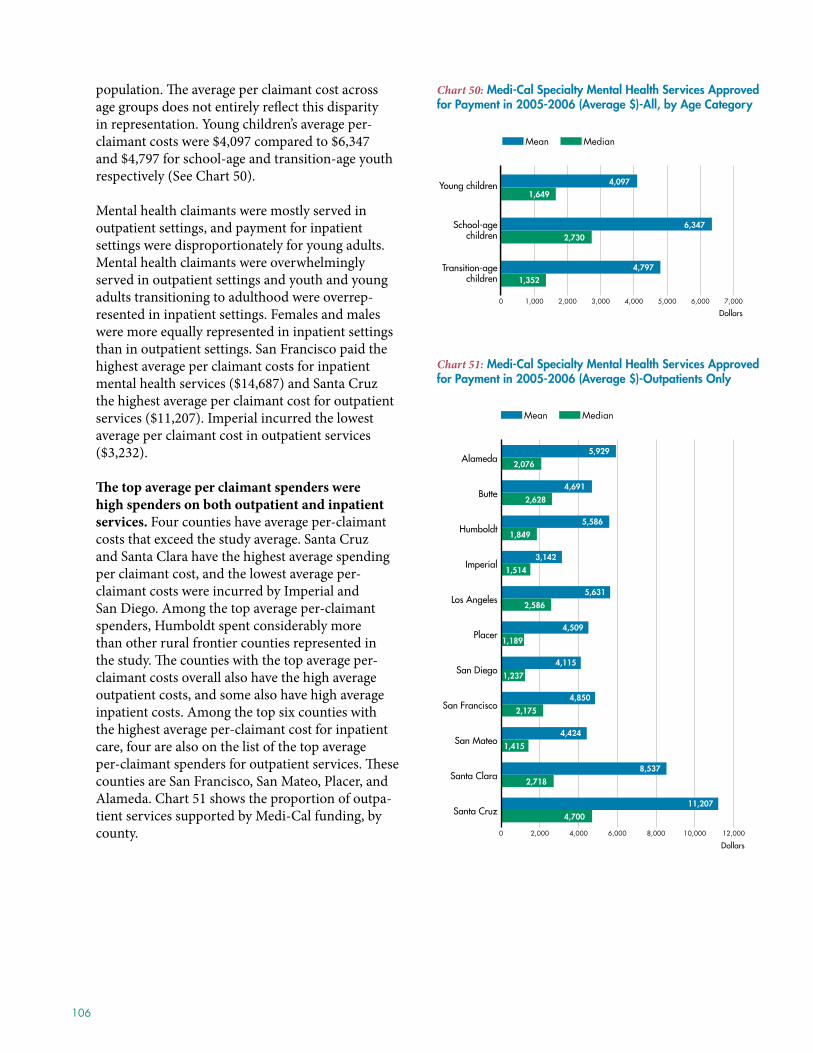
106
population . The average per claimant cost across age groups does not entirely reflect this disparity in representation . young children’s average per-claimant costs were $4,097 compared to $6,347 and $4,797 for school-age and transition-age youth respectively (See chart 50) .
mental health claimants were mostly served in outpatient settings, and payment for inpatient settings were disproportionately for young adults . mental health claimants were overwhelmingly served in outpatient settings and youth and young adults transitioning to adulthood were overrep-resented in inpatient settings . Females and males were more equally represented in inpatient settings than in outpatient settings . San Francisco paid the highest average per claimant costs for inpatient mental health services ($14,687) and Santa cruz the highest average per claimant cost for outpatient services ($11,207) . imperial incurred the lowest average per claimant cost in outpatient services ($3,232) .
The top average per claimant spenders were high spenders on both outpatient and inpatient services. Four counties have average per-claimant costs that exceed the study average . Santa cruz and Santa clara have the highest average spending per claimant cost, and the lowest average per-claimant costs were incurred by imperial and San Diego . among the top average per-claimant spenders, humboldt spent considerably more than other rural frontier counties represented in the study . The counties with the top average per-claimant costs overall also have the high average outpatient costs, and some also have high average inpatient costs . among the top six counties with the highest average per-claimant cost for inpatient care, four are also on the list of the top average per-claimant spenders for outpatient services . These counties are San Francisco, San mateo, placer, and alameda . chart 51 shows the proportion of outpa-tient services supported by medi-cal funding, by county .
Chart 50: Medi-Cal Specialty Mental Health Services Approved for Payment in 2005-2006 (Average $)-All, by Age Category
0 1,000 2,000 3,000 4,000 5,000 6,000 7,000
Median
Mean
Transition-agechildren
School-agechildren
Young children
MedianMean
6,347
2,730
4,797
1,352
1,649
4,097
Dollars
Chart 51: Medi-Cal Specialty Mental Health Services Approved for Payment in 2005-2006 (Average $)-Outpatients Only
0 2,000 4,000 6,000 8,000 10,000 12,000
Median
Mean
Santa Cruz
Santa Clara
San Mateo
San Francisco
San Diego
Placer
Los Angeles
Imperial
Humboldt
Butte
Alameda
MedianMean
2,076
5,929
2,628
4,691
1,849
5,586
1,514
3,142
2,586
5,631
1,189
4,509
1,237
4,115
2,175
4,850
1,415
4,424
2,718
8,537
4,700
11,207
Dollars
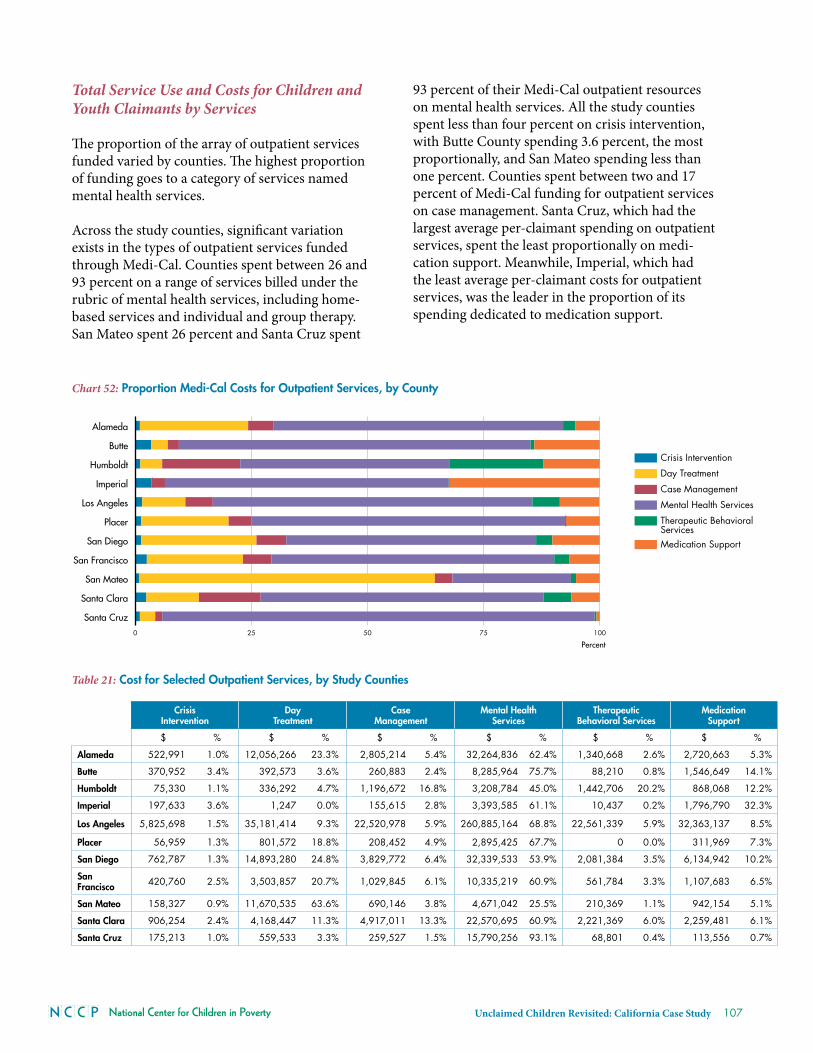
National Center for Children in Poverty Unclaimed Children Revisited: California Case Study 107
Total Service Use and Costs for Children and Youth Claimants by Services
The proportion of the array of outpatient services funded varied by counties . The highest proportion of funding goes to a category of services named mental health services .
across the study counties, significant variation exists in the types of outpatient services funded through medi-cal . counties spent between 26 and 93 percent on a range of services billed under the rubric of mental health services, including home-based services and individual and group therapy . San mateo spent 26 percent and Santa cruz spent
93 percent of their medi-cal outpatient resources on mental health services . all the study counties spent less than four percent on crisis intervention, with Butte county spending 3 .6 percent, the most proportionally, and San mateo spending less than one percent . counties spent between two and 17 percent of medi-cal funding for outpatient services on case management . Santa cruz, which had the largest average per-claimant spending on outpatient services, spent the least proportionally on medi-cation support . meanwhile, imperial, which had the least average per-claimant costs for outpatient services, was the leader in the proportion of its spending dedicated to medication support .
Table 21: Cost for selected Outpatient services, by study Counties
Crisis intervention
day Treatment
Case Management
Mental health services
Therapeutic Behavioral services
Medication support
$ % $ % $ % $ % $ % $ %
alameda 522,991 1.0% 12,056,266 23.3% 2,805,214 5.4% 32,264,836 62.4% 1,340,668 2.6% 2,720,663 5.3%
Butte 370,952 3.4% 392,573 3.6% 260,883 2.4% 8,285,964 75.7% 88,210 0.8% 1,546,649 14.1%
humboldt 75,330 1.1% 336,292 4.7% 1,196,672 16.8% 3,208,784 45.0% 1,442,706 20.2% 868,068 12.2%
imperial 197,633 3.6% 1,247 0.0% 155,615 2.8% 3,393,585 61.1% 10,437 0.2% 1,796,790 32.3%
los angeles 5,825,698 1.5% 35,181,414 9.3% 22,520,978 5.9% 260,885,164 68.8% 22,561,339 5.9% 32,363,137 8.5%
Placer 56,959 1.3% 801,572 18.8% 208,452 4.9% 2,895,425 67.7% 0 0.0% 311,969 7.3%
san diego 762,787 1.3% 14,893,280 24.8% 3,829,772 6.4% 32,339,533 53.9% 2,081,384 3.5% 6,134,942 10.2%
san francisco 420,760 2.5% 3,503,857 20.7% 1,029,845 6.1% 10,335,219 60.9% 561,784 3.3% 1,107,683 6.5%
san Mateo 158,327 0.9% 11,670,535 63.6% 690,146 3.8% 4,671,042 25.5% 210,369 1.1% 942,154 5.1%
santa Clara 906,254 2.4% 4,168,447 11.3% 4,917,011 13.3% 22,570,695 60.9% 2,221,369 6.0% 2,259,481 6.1%
santa Cruz 175,213 1.0% 559,533 3.3% 259,527 1.5% 15,790,256 93.1% 68,801 0.4% 113,556 0.7%
Chart 52: Proportion Medi-Cal Costs for Outpatient Services, by County
0 25 50 75 100
Santa Cruz
Santa Clara
San Mateo
San Francisco
San Diego
Placer
Los Angeles
Imperial
Humboldt
Butte
Alameda
0 25 50 75 100
Medication Support
Therapeutic Behavioral Services
Mental Health Services
Case Management
Day Treatment
Crisis Intervention
Santa Cruz
Santa Clara
San Mateo
San Francisco
San Diego
Placer
Los Angeles
Imperial
Humboldt
Butte
Alameda
Crisis Intervention
Day Treatment
Case Management
Mental Health Services
Therapeutic Behavioral ServicesMedication Support
Percent

108
Average per-claimant costs for outpatient services was vastly different by county for different types of outpatient services. in general, these estimates of average per-claimant costs offer a snapshot, since this data represents only one year of medi-cal claims data .
Factors Associated with Increased Utilization and Per-claimant Service Costs
The average payment for mental health claim-ants, including outpatient and inpatient services, was significantly impacted by race and ethnicity, primary language, and gender . (p>0 .05) . The average outpatient payments for white mental health claimants were significantly higher than the average outpatient payments for mental health claimants of any other racial/ethnic group . inpatient services showed significantly higher average payments for whites than Latino mental health claimants, but not for other racial/ethnic groups . The average payments for mental health claimants whose primary language is English were significantly higher than the average payments for primarily Spanish-speaking mental health claimants for all services, and significantly higher than other primary languages based on service . The average payments for male mental health claimants were significantly higher than the average payments for female counterparts in all services .
Policy Implications in Tracking Evidence Based Practices
Mental Health Services category represents a black box when trying to analyze the types of outpatient services that Medi-Cal mental health service users receive. The state of California’s inability to track the use of evidence-based practices impairs their uptake in the state. Nccp was unable to analyze the utilization of evidence-based practices in the publicly financed children’s mental health system because the state has not set up specific billing codes for these practices . Specific evidence-based practices may or may not fit under generic modes established to bill for services, such as outpatient treatment, and, within that, thera-peutic behavioral services, as day treatment or day rehabilitation services . in some cases, compo-nents of EBps can be billed under existing billing
Chart 53: Medi-Cal Specialty Mental Health Services Approved for Payment in 2005-2006 (Average $)-All, by Treatment Types
0 2,000 4,000 6,000 8,000
Median
Mean
Inpatientservices only
Outpatientservices only
All services
MedianMean
5,935
5,529
2,386
3,8157,430
2,260
Dollars
Chart 54: Average (Mean) Payment, by Race
0 3,000 6,000 9,000
Hispanic
Alaskan Native or American Indian
Asian or PI
Black
White
Inpatientservices
Outpatientservices
All services
American Indian/Alaskan Native
White
HispanicBlack/African American
Asian/Pacific Islander
7,3015,892
5,0924,969
5,103
6,7955,416
4,7694,452
4,796
8,3298,231
6,6707,904
6,211
Dollars
Chart 55: Average (Mean) Payment, by Primary Language
0 2,000 4,000 6,000 8,000
Other
Spanish
English
Inpatientservices
Outpatientservices
All services
SpanishEnglish Other
6,3574,716
5,060
5,9084,5054,429
7,8765,367
7,476
Dollars
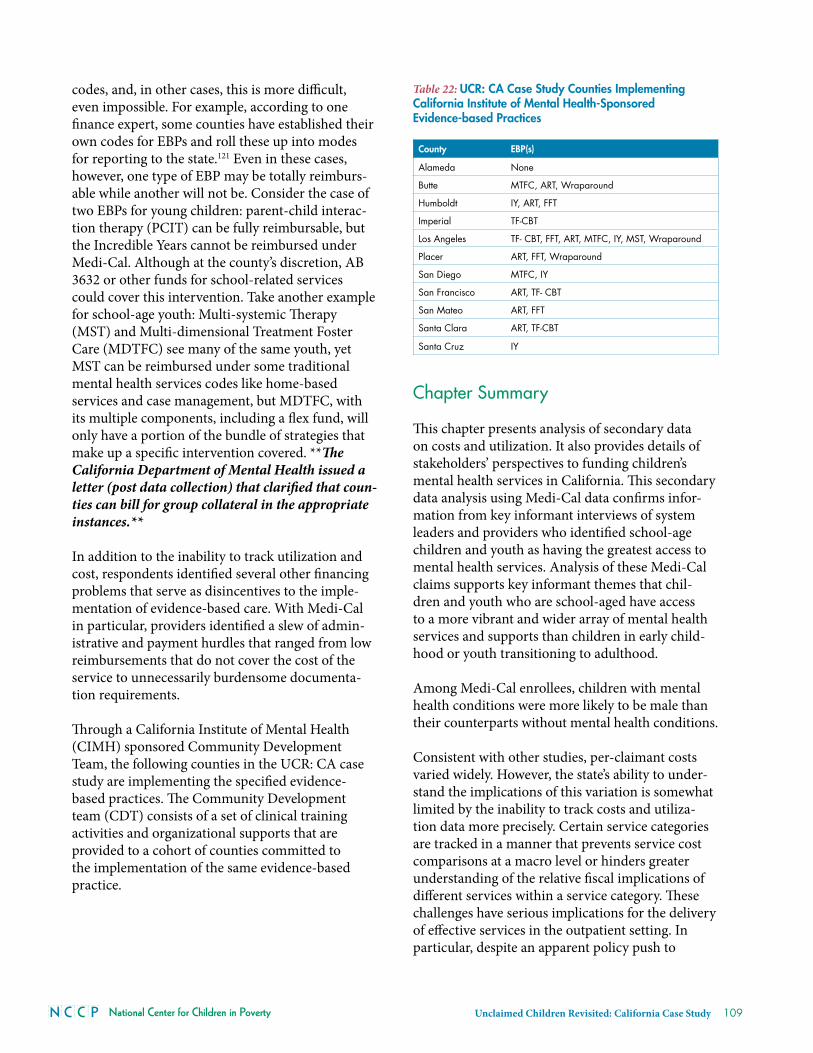
National Center for Children in Poverty Unclaimed Children Revisited: California Case Study 109
codes, and, in other cases, this is more difficult, even impossible . For example, according to one finance expert, some counties have established their own codes for EBps and roll these up into modes for reporting to the state .121 Even in these cases, however, one type of EBp may be totally reimburs-able while another will not be . consider the case of two EBps for young children: parent-child interac-tion therapy (pcit) can be fully reimbursable, but the incredible years cannot be reimbursed under medi-cal . although at the county’s discretion, aB 3632 or other funds for school-related services could cover this intervention . take another example for school-age youth: multi-systemic Therapy (mSt) and multi-dimensional treatment Foster care (mDtFc) see many of the same youth, yet mSt can be reimbursed under some traditional mental health services codes like home-based services and case management, but mDtFc, with its multiple components, including a flex fund, will only have a portion of the bundle of strategies that make up a specific intervention covered . **The California Department of Mental Health issued a letter (post data collection) that clarified that coun-ties can bill for group collateral in the appropriate instances.**
in addition to the inability to track utilization and cost, respondents identified several other financing problems that serve as disincentives to the imple-mentation of evidence-based care . With medi-cal in particular, providers identified a slew of admin-istrative and payment hurdles that ranged from low reimbursements that do not cover the cost of the service to unnecessarily burdensome documenta-tion requirements .
Through a california institute of mental health (cimh) sponsored community Development team, the following counties in the ucr: ca case study are implementing the specified evidence-based practices . The community Development team (cDt) consists of a set of clinical training activities and organizational supports that are provided to a cohort of counties committed to the implementation of the same evidence-based practice .
Table 22: uCR: Ca Case study Counties implementing California institute of Mental health-sponsored Evidence-based Practices
County EBP(s)
Alameda None
Butte MTFC, ART, Wraparound
Humboldt IY, ART, FFT
Imperial TF-CBT
Los Angeles TF- CBT, FFT, ART, MTFC, IY, MST, Wraparound
Placer ART, FFT, Wraparound
San Diego MTFC, IY
San Francisco ART, TF- CBT
San Mateo ART, FFT
Santa Clara ART, TF-CBT
Santa Cruz IY
Chapter Summary
This chapter presents analysis of secondary data on costs and utilization . it also provides details of stakeholders’ perspectives to funding children’s mental health services in california . This secondary data analysis using medi-cal data confirms infor-mation from key informant interviews of system leaders and providers who identified school-age children and youth as having the greatest access to mental health services . analysis of these medi-cal claims supports key informant themes that chil-dren and youth who are school-aged have access to a more vibrant and wider array of mental health services and supports than children in early child-hood or youth transitioning to adulthood .
among medi-cal enrollees, children with mental health conditions were more likely to be male than their counterparts without mental health conditions .
consistent with other studies, per-claimant costs varied widely . however, the state’s ability to under-stand the implications of this variation is somewhat limited by the inability to track costs and utiliza-tion data more precisely . certain service categories are tracked in a manner that prevents service cost comparisons at a macro level or hinders greater understanding of the relative fiscal implications of different services within a service category . These challenges have serious implications for the delivery of effective services in the outpatient setting . in particular, despite an apparent policy push to
110
advance evidence-based practices, these services are not easily tracked and not easily supported through financing .
This review of medi-cal data also shows displaced utilization by youth transitioning to adulthood . These youth and young adults with mental health problems are disproportionately represented in the most costly of the mental health treatment sector, inpatient care . They are driven to this level of care because of the poor funding options at the commu-nity level . This finding suggests that policy changes that open up community-based services to this group might be the most cost effective policy option .
in this chapter, system and community leaders, providers and family members weighed-in on the strengths and challenges associated with adequately financing a range of children’s mental health services in california . They identified major sources of funding, the referenced the compelling need to support a comprehensive array of services and pinpointed the pivotal role medi-cal/EpSDt and now mhSa plays in increasing access to services . increased fiscal tensions, particularly with medi-cal/EpSDt, has led to pressure for greater accountability that some stakeholders interpret as narrowly defining the scope of services that can be paid for, as discouraging innovative and flexibility, and, compromising greater adoption of funded empirically-supported or evidence-based practices . The technical and practical implementation prob-lems with reimbursement appear to consume the energies and time of system leaders . The urgency of resolving these problems seems evident given their impact on the climate for practice and the ability to move forward with sustaining available services and the system as a whole .
according to many stakeholders the mhSa repre-sents a core financing vehicle that has presented both opportunity (in the form of flexibility and supporting programmatic innovation) and chal-lenges with regard to the prohibition not to supplant resources . in particular, mhSa is credited with creating a robust focus on prevention and early intervention, on keenly attending to culturally and linguistically responsive service delivery, and, on advancing the concept of family-driven services and supports .
a major concern is how to sustain existing programs as reflected in the views presented . amidst these financing uncertainly shortly after data collection for this project, california faced one of its most severe budgetary crises . Significant paralysis in public budgetary decision-making ensued that put even mhSa funding, a targeted funding stream, in jeopardy . Facing high political stakes efforts to rescind mhSa’s major compo-nents through the ballot process were rejected . The central thrust and underlying impetus driven by the fiscal crunch remains and looms over much of the public financing of mental health and related programming .
Policy Recommendations
The state of California and counties should:♦ expand program service eligibility and flexibility
for children and families covered by medi-cal . This should include policy changes that open up community-based services to transition-age-youth as a cost effective policy option;
♦ improve their abilities to track service utilization and costs, including tracking incentives for the implementation of evidence-based programs;
♦ develop specific fiscal incentives with relevant billing coded to encourage implementation of evidence-based practices;
♦ develop appropriate tools to measure change in child/participant, family and community level outcomes, both short term and long term;
♦ establish well-defined outcomes and indicators for tracking child and family outcomes at program/system levels;
♦ ensure that data sharing is a top priority by: (a) requiring the sharing of electronic records and data across counties and agencies; (b) making data sharing a condition of joint planning for children and family services; (c) safeguarding privacy; and
♦ promote an effort to develop appropriate measuring tools and maintain consistency in evaluating service and system impacts on children and families .
National Center for Children in Poverty Unclaimed Children Revisited: California Case Study 111
CHAPTeR 10
information Technology and Outcome Measurement
Setting the Context: Quality and Accountability for the delivery of Child Mental Health Services
infrastructure supports are essential to improved service delivery and access . This chapter reviews information technology systems, and outcomes management . research demonstrates that fiscal incentives alone do not improve quality .122 information technology is a key component in an infrastructure that supports quality improve-ments .123 Quality and accountability have recently emerged as prominent concerns in the delivery of mental health services . The measurement of outcomes has gained attention in the last two decades in research, practice and policy .124 research has determined that developing measurable outcomes will increase accountability of mental health systems and services in order to reduce inap-propriate and ineffective care and to produce data to continually improve services and supports .125
While many studies on the efficacy of information technology have been limited to the medical and health care field, the promotion of information technology use is also gaining momentum in the human service field . particularly with the growing emphasis on evidence-based practices, human service agencies have been looking to infrastruc-tural supports such as information technology to demonstrate positive clinical outcomes . They have also been recognized as a way for providers to share information across systems that serve the same families to increase the effectiveness of services . Following the release of the president’s New Freedom commission, the commission’s Subcommittee on children and Families released a vision for children that stated: “There should be a clear focal point for responsibility and account-ability for children’s mental health care . Services and
systems should be guided by standards for access to and quality of care and performance measures of service delivery and outcomes in order to reduce inappropriate and ineffective care and to produce data for continuous quality improvement of services and supports .”126
Prior Research and Research Questions
many experts consider health information tech-nology key to improving efficiency and quality of health care, and research has demonstrated that efficiency and quality is improved with informa-tion technology such as decision support models and electronic health records .127 The use of infor-mation technology such as electronic records is becoming more common, although precise esti-mates are not available . One research study found that 23 .9 percent of physicians used them in ambu-latory settings, and five percent of hospitals used computerized physician order entry, suggesting that widespread use of electronic records is not yet available .128
in light of this range of research, the study’s authors sought to address the following research questions pertinent to california:♦ What are the strengths and challenges of
information technology that supports mental health in county delivery systems?
♦ What are system leader and provider views on the strengths and challenges in measuring outcomes for children and families?
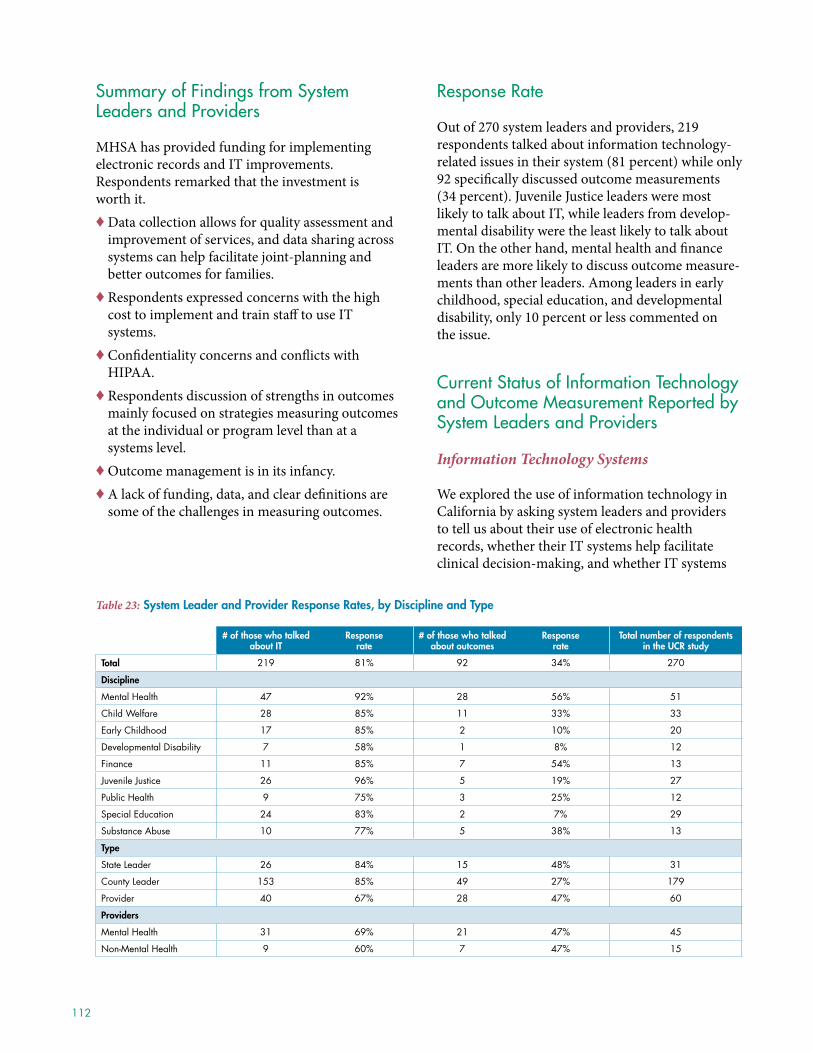
112
Summary of Findings from System leaders and Providers
mhSa has provided funding for implementing electronic records and it improvements . respondents remarked that the investment is worth it .♦ Data collection allows for quality assessment and
improvement of services, and data sharing across systems can help facilitate joint-planning and better outcomes for families .
♦ respondents expressed concerns with the high cost to implement and train staff to use it systems .
♦ confidentiality concerns and conflicts with hipaa .
♦ respondents discussion of strengths in outcomes mainly focused on strategies measuring outcomes at the individual or program level than at a systems level .
♦ Outcome management is in its infancy .♦ a lack of funding, data, and clear definitions are
some of the challenges in measuring outcomes .
Response Rate
Out of 270 system leaders and providers, 219 respondents talked about information technology- related issues in their system (81 percent) while only 92 specifically discussed outcome measurements (34 percent) . Juvenile Justice leaders were most likely to talk about it, while leaders from develop-mental disability were the least likely to talk about it . On the other hand, mental health and finance leaders are more likely to discuss outcome measure-ments than other leaders . among leaders in early childhood, special education, and developmental disability, only 10 percent or less commented on the issue .
Current Status of information Technology and Outcome Measurement Reported by System leaders and Providers
Information Technology Systems
We explored the use of information technology in california by asking system leaders and providers to tell us about their use of electronic health records, whether their it systems help facilitate clinical decision-making, and whether it systems
Table 23: system leader and Provider Response Rates, by discipline and Type
# of those who talked about iT
Response rate
# of those who talked about outcomes
Response rate
Total number of respondents in the uCR study
Total 219 81% 92 34% 270
discipline
Mental Health 47 92% 28 56% 51
Child Welfare 28 85% 11 33% 33
Early Childhood 17 85% 2 10% 20
Developmental Disability 7 58% 1 8% 12
Finance 11 85% 7 54% 13
Juvenile Justice 26 96% 5 19% 27
Public Health 9 75% 3 25% 12
Special Education 24 83% 2 7% 29
Substance Abuse 10 77% 5 38% 13
Type
State Leader 26 84% 15 48% 31
County Leader 153 85% 49 27% 179
Provider 40 67% 28 47% 60
Providers
Mental Health 31 69% 21 47% 45
Non-Mental Health 9 60% 7 47% 15
National Center for Children in Poverty Unclaimed Children Revisited: California Case Study 113
are shared across service systems (such as mental health, juvenile justice, child welfare) for informa-tion sharing and/or joint planning . many (N=220 respondents) of the system leaders and providers responded about it systems, although the question was not asked consistently and the amount of infor-mation provided varied .
IT Systems Development
Overall, counties and systems within counties varied on whether they had it systems in place and the extent to what their systems did . Functions of it systems ranged from simple billing processes to electronic client records and online case notes to data systems and departments to support quality assurance . These findings were also reinforced with interviews of state leaders (across systems), who generally spoke of how the development of it systems has mostly been left up to individual providers and the counties . it has not been a state focus as some mental health state leaders suggested (though a juvenile justice state leader said that there’s a push at the state level to automate court records), or because the state feels it can’t require the county to use a specific it system since services are county-administered .
The state mental health agency has, however, encouraged the use of technology systems by providing funding earmarked for this . State leaders interviewed thought the technology money avail-able in the mhSa has helped counties to develop their it systems . another state mental health leader said that all of the mhSa it dollars are dedicated for electronic records .
Electronic Records
Sixty-three respondents (29 percent) said that their records are electronically automated . use of electronic client records varied across counties and disciplines . mental health respondents in two counties (imperial and San Diego) said they use electronic records, while two other counties (Butte and San mateo) said they have plans to imple-ment electronic records . among the other disci-plines, juvenile justice respondents in four counties (imperial, Los angeles, Santa cruz, and San mateo); child welfare respondents in one county (Santa cruz) (although this was the only county to answer
this question); substance abuse respondents in one county (Los angeles); early childhood respondents in two counties (alameda and Santa cruz); and public health respondents in one county (Santa cruz) all reported use of electronic records .
at the state level, a state mental health leader thought that most of the counties were moving toward electronic records and that there is money set aside in the mhSa for this . She noted, “We are asking counties for a road map towards electronic records.” another state mental health leader added that Department of mental health is strongly encouraging the use of electronic records and provides guidelines to counties .
Clinical Decision Making
Only 36 respondents (16 percent) said that their it systems facilitates clinical decision-making . mental health respondents in two counties (alameda and San mateo) said that clinical decision-making is done electronically, while respondents in Los angeles said they are working towards this . among the other systems, juvenile justice respondents in four counties (imperial, Los angeles, Santa cruz, and San Diego); substance abuse workers in two counties (humboldt and imperial); and early child-hood workers in one county (Santa cruz) reported that they use electronic-based clinical decision-making programs . child welfare respondents noted that there is a state-wide system for helping them with clinical decision making .
a mental health provider in alameda county explained about their clinical decision-making system: “(It’s) pretty expensive, but the benefits to a clinician are fantastic,” and another mental health provider in San mateo noted that it “allows clini-cians to focus on outcomes .” One state mental health leader explained that if counties are moving towards electronic records that he’d like to see them have the capacity for clinical management in the near future .
Joint Planning/Information Sharing
Thirty-eight respondents (17 percent) spoke about joint-planning and management across systems . Fewer counties and systems indicated that they are able to share client information with one another
114
electronically . Juvenile justice system leaders and providers in five counties (humboldt, imperial, Los angeles, San Diego, and San Francisco) said that they share information electronically with other systems such as probation . child welfare respondents in two counties (humboldt and San Francisco) share information, and early childhood respondents in Santa cruz county explained that they share information with partners involved in the First 5 initiative . at the state level, a child welfare leader explained that the child welfare agency and the mental health department began a data sharing initiative to help track families receiving both mental health and child welfare services, how effec-tive services are, and the families’ outcomes .
Benefits of joint planning and information sharing that were mentioned included accountability of providers involved and having a sense of “dosage” of services particularly for “high end” users is helpful . respondents mostly spoke however, about the chal-lenges surrounding client information confidenti-ality in sharing client information . a juvenile justice system leader commented, “Everyone is very protec-tive on their sets of information,” and a special educa-tion system leader noted, “The information could be valuable but we want to balance that with the confi-dentiality of kids too.” respondents also spoke about the inability to share information with mental health due to hippa regulations . For example, a child welfare system leader said, “The biggest problems are the fact that with all the restrictions about ability to share information and HIPAA… (it) prevents us from serving children.” another respondent in regard to hipaa policies added, “This is really a challenge because if we had a system where we could look up information from all sides of care (such as mental health, juvenile justice) then it would make it much easier to know what was going on with the child and appropriately help the child and their family.”
Policy implications: sharing electronic records between systems may have confidentiality chal-lenges but sharing data across agencies may facili-tate joint-planning for family services .
Quality Assurance
twenty-two respondents (10 percent) said that it facilitated quality assurance . mental health respon-dents in two counties (imperial and Santa cruz)
indicated that they have data quality management tools, while mental health respondents in San mateo county indicated that they are planning to imple-ment this soon . respondents from child welfare (in three counties- imperial, Santa cruz, and San Diego), from special education (in two coun-ties- alameda and Butte), from substance abuse (in two- counties alameda and Santa cruz), and from finance in humboldt county also said that they have data tools for quality management and tracking client outcomes .
While respondents were not asked specifically about the usefulness of quality assurance processes, one respondent remarked, “You can do quality assurance at minimum (sic) of your requirements, or you can excel. We live in quality assurance. We believe in it. IT is the only methodology. We believe in assessments, documentation, tracking of lab work needed. We have a very well established QA program in our dept. We believe in that.”
Box 38: Child Welfare system improvement and accountability act (aB 636)
In 2001, the California Legislature passed the Child Welfare System Improvement and Accountability Act (AB 636). The groundbreaking legislation was designed to improve outcomes for children in the child welfare system while holding county and state agencies accountable for the outcomes achieved. This statewide accountability system, which went into effect January 1, 2004, is an enhanced version of the federal over-sight system mandated by Congress and used to monitor states’ performance.
goals of aB 636:
• Protect children from abuse and neglect.
• Have children safely maintained in their own homes when-ever possible and appropriate.
• Provide children permanency and stability in their living situations.
• Preserve the continuity of family relationships and connec-tions for children.
• Enhance families’ capacity to provide for their children’s needs.
• Ensure children receive appropriate services to meet their educational needs.
• Ensure children receive adequate services to meet physical and mental health needs.
• Prepare youth emancipating from foster care to transition into adulthood.
Source: Accessed on Dec. 8, 2009 from http://www.cdss.ca.gov/cdssweb/entres/pdf/AB636.pdf.
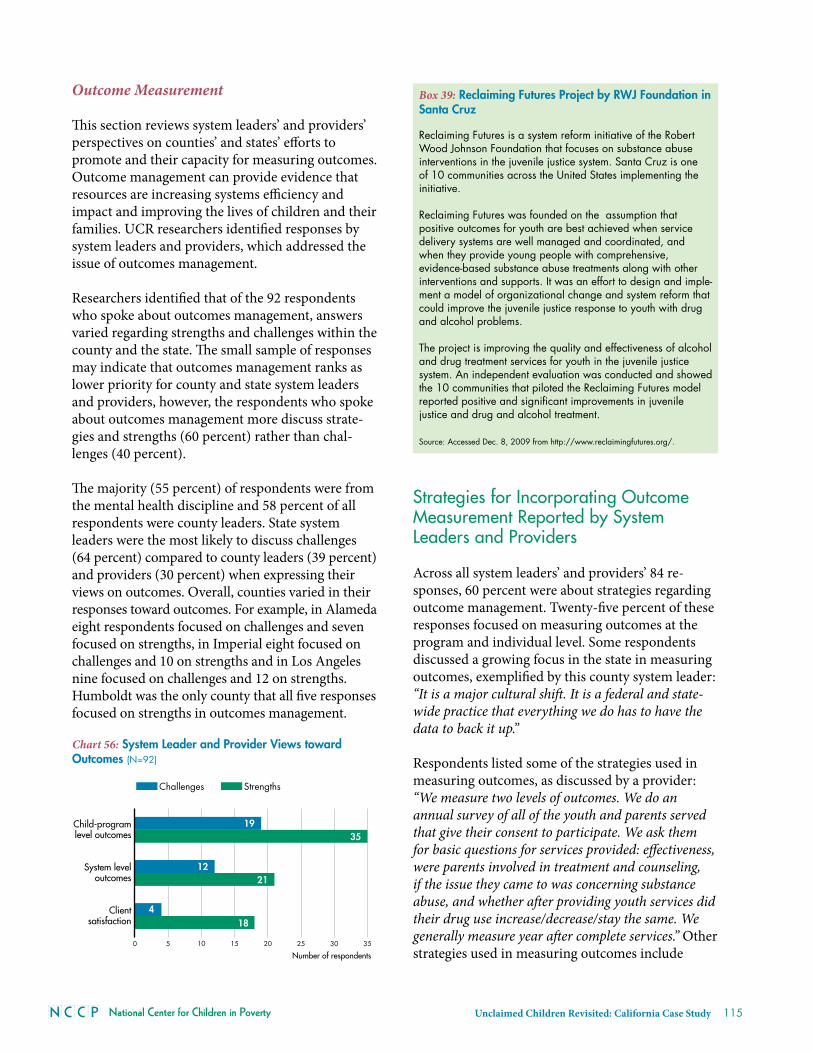
National Center for Children in Poverty Unclaimed Children Revisited: California Case Study 115
Outcome Measurement
This section reviews system leaders’ and providers’ perspectives on counties’ and states’ efforts to promote and their capacity for measuring outcomes . Outcome management can provide evidence that resources are increasing systems efficiency and impact and improving the lives of children and their families . ucr researchers identified responses by system leaders and providers, which addressed the issue of outcomes management .
researchers identified that of the 92 respondents who spoke about outcomes management, answers varied regarding strengths and challenges within the county and the state . The small sample of responses may indicate that outcomes management ranks as lower priority for county and state system leaders and providers, however, the respondents who spoke about outcomes management more discuss strate-gies and strengths (60 percent) rather than chal-lenges (40 percent) .
The majority (55 percent) of respondents were from the mental health discipline and 58 percent of all respondents were county leaders . State system leaders were the most likely to discuss challenges (64 percent) compared to county leaders (39 percent) and providers (30 percent) when expressing their views on outcomes . Overall, counties varied in their responses toward outcomes . For example, in alameda eight respondents focused on challenges and seven focused on strengths, in imperial eight focused on challenges and 10 on strengths and in Los angeles nine focused on challenges and 12 on strengths . humboldt was the only county that all five responses focused on strengths in outcomes management .
Strategies for incorporating Outcome Measurement Reported by System leaders and Providers
across all system leaders’ and providers’ 84 re-sponses, 60 percent were about strategies regarding outcome management . twenty-five percent of these responses focused on measuring outcomes at the program and individual level . Some respondents discussed a growing focus in the state in measuring outcomes, exemplified by this county system leader: “It is a major cultural shift. It is a federal and state-wide practice that everything we do has to have the data to back it up.”
respondents listed some of the strategies used in measuring outcomes, as discussed by a provider: “We measure two levels of outcomes. We do an annual survey of all of the youth and parents served that give their consent to participate. We ask them for basic questions for services provided: effectiveness, were parents involved in treatment and counseling, if the issue they came to was concerning substance abuse, and whether after providing youth services did their drug use increase/decrease/stay the same. We generally measure year after complete services.” Other strategies used in measuring outcomes include
Box 39: Reclaiming futures Project by RWJ foundation in santa Cruz
Reclaiming Futures is a system reform initiative of the Robert Wood Johnson Foundation that focuses on substance abuse interventions in the juvenile justice system. Santa Cruz is one of 10 communities across the United States implementing the initiative.
Reclaiming Futures was founded on the assumption that positive outcomes for youth are best achieved when service delivery systems are well managed and coordinated, and when they provide young people with comprehensive, evidence-based substance abuse treatments along with other interventions and supports. It was an effort to design and imple-ment a model of organizational change and system reform that could improve the juvenile justice response to youth with drug and alcohol problems.
The project is improving the quality and effectiveness of alcohol and drug treatment services for youth in the juvenile justice system. An independent evaluation was conducted and showed the 10 communities that piloted the Reclaiming Futures model reported positive and significant improvements in juvenile justice and drug and alcohol treatment.
Source: Accessed Dec. 8, 2009 from http://www.reclaimingfutures.org/.
Chart 56: System Leader and Provider Views toward Outcomes (N=92)
0 5 10 15 20 25 30 35
Strengths
Challenges
Clientsatisfaction
System leveloutcomes
Child-programlevel outcomes
StrengthsChallenges
1935
1221
184
Number of respondents
116
strong evaluative tools through SamhSa and the mhSa, mentioned by a mental health system leader: “SAMSA and MHSA have strong evaluative tools, there are good structures for data collection, reporting on an annual basis, and project reporting all throughout the process, so we have really good measurement. We know what we did, what did and didn’t work. On other types of funding that isn’t grant-specific, like Realignment and Medi-Cal, we don’t have such clear outcome evaluation built in.”
in addition, another respondent observed that for certain federally funded programs it is required by law to measure outcomes: “From the funded programs, by law, we are required to measure outcomes by evidence data. We hire a local evaluator, in addition to the indicators we use to measure addi-tional outcomes. How much of attributed success was due to service delivery, is due to mitigating circum-stances. The commission is very serious about this.”
respondents also discussed that outcomes are measured as part of evidence-based practices that are delivered, but are not always consistent . another respondent discussed the commitment to measuring outcomes for 0 to 5, primarily through First 5 support: “The First 5 funded mental health initiative was hugely successful. It had measured outcomes and published data.” however, one of the challenges cited by a respondent was the difficulty in measuring early interventions and prevention services .
respondents also discussed strategies and approaches towards outcomes management at the system level . respondents reported that a commit-ment to outcomes countywide is building, exem-plified in this quote: “System change work, around building commitment to outcomes county wide, a lot of work on data and measure, third is about strengthening community capacity, community building, to partner with government.” in addition, one respondent stated that outcomes of collabora-tion between departments have been measured in the past . however, the state removed requirements of the cBcL (child behavior check list), which was being used to measure outcomes . child welfare department’s use of the child Welfare System improvement and accountability act (aB636) to report outcomes was also discussed: “The whole child welfare system is under [A]B636, which basi-cally looked at outcomes for kids.”
responses focused on both performance and financial outcomes and some interviewees stated that they are required to report on performance measures to the state . a system leader in finance stated, “The county focuses on both the performance and the financial outcomes; you have to meet the budget, you can’t overspend. We focus on bringing in as much as we can.”
Challenges in incorporating Outcome Measurement Facing System leaders and Providers
interviewees spoke about challenges in measuring outcomes at the individual and program level and at the system level .
Some of the challenges listed in measuring out-comes at the individual and program level as well as the system level are funding, the lack of data, the lack of clear definitions of outcomes, and that out-comes are not measured consistently if at all .
respondents state that child outcomes and program level outcomes are not measured well . These concerns are exemplified in this quote: “Child outcomes, we don’t measure very well… signifi-cant challenges with the locus score and if we are providing [for] the right needs.” Often there are no formal outcome management specific practices . it is also difficult to demonstrate outcomes from early intervention and prevention . These challenges are highlighted by this early childhood system leader: “Providers are saying that they are helping the children, and from their perspective, the children are happy. There is no data to support it.”
at a system level, respondents noted that outcome management system is in its infancy and therefore it is still difficult to provide evidence . One respon-dent put it, “At this point we have new services from the EPSDT money and we are looking at some fresh outcomes, but it’s difficult to ‘prove’ outcomes based on performance at this early point.” Other difficul-ties at the system-level included measuring whether people access services, but not if services are effec-tive: “You were supposed to see 1,500 kids, did you see 1,500 kids? as [opposed to] did those 1,500 kids improve after you saw them?” There are not clear outcome evaluations built into the system .
National Center for Children in Poverty Unclaimed Children Revisited: California Case Study 117
respondents also spoke about the difficulties in defining outcome measures and evaluating their appropriateness, expressed by this county leader, “We haven’t yet figured out how to measure outcomes or reprimand those who don’t meet county expectan-cies.” This can influence their ability to measure outcomes at any level . respondents reported that it systems are used to track billing and some data, but not outcomes: “There is really no way of knowing if client is getting better or not except asking clini-cian about this person. Is progressing. New clinical records… will decide what kind of things do we want to be tracking on the clients. Not able to go and pull that out right now. We primarily keep information on billing requirements.” Funding was also a challenge because evaluation can be expensive and resources are limited .
Overall, respondents reported that there have been some improvements in outcomes manage-ment, especially with the progress made towards individual and program level outcomes . however, there does not seem to be a systematic and consis-tent process used to measure outcomes across all
children in the system . at a system level, there are performance measures, which counties report to the state, but these are not appropriately measuring the effectiveness of the system and its impact on chil-dren and families . also, there seems to be a lack of raw data to track outcomes . information technology tracking systems are used for billing, finances, and not outcomes . Lastly, some strategies involve anec-dotal measures of outcomes, but do not use specific measuring tools .
Summary of Responses Among System leaders and Providers by Respondent’s Type, disciplines and Counties
County System Leaders
county leaders made up the majority of the respon-dents who spoke about outcomes (53 percent or N=49) . Nearly half of these county leaders discussed challenges with outcomes management while the majority discussed strategies for tracking outcomes (82 percent) . ten county leaders discussed the need for defining outcome measures, four discussed the challenge of funding outcome measurement, and eleven county leaders spoke of the need for measuring child and program level outcomes . about half of the county leaders who discussed outcomes reported that they track individual or program level data and sixteen county leaders said that they are collecting or interested in collecting system level data for assessing outcomes .
State System Leaders
The use of it technology was mostly being imple-mented by systems at the county level . child welfare respondents, however, noted that there is a state-wide electronic system for helping them with clinical decision-making . additionally, the state child welfare and the mental health departments began a data-sharing initiative to help track families receiving both mental health and child welfare services, how effective services are, and families’ outcomes . a total of fifteen state leaders discussed outcomes . Of those, 66 percent discussed challenges while 46 percent spoke of strategies for outcomes management . Four state leaders discussed the need for defining outcome measures, four discussed the challenge of funding
Box 40: The Oakland Community action Partnership (OCaP)
The goal of the Oakland Community Action Partnership (OCAP) is to maximize the impact on Oakland’s low-income community by supporting anti-poverty programs and services that lift individuals and families out of poverty into self-sufficiency.
OCAP is committed to the investment in a network of services aimed at developing self-sufficiency and improving the lives of low-income individuals and families in Oakland. Successful applicants will provide services in one or more of OCAP’s three program focus areas: housing, employment, and supportive services. In addition, all programs and services supported by CSBG funding must support one of more of the following six national goals:
• Low-income people become more self-sufficient;
• The conditions in which low-income people live are improved;
• Low-income people own a stake in their community;
• Partnerships among supporters and providers of service to low-income people are achieved;
• Agencies increase their capacity to achieve results; and
• Low-income people, especially vulnerable populations, achieve their potential by strengthening family and other supportive systems.
Source: Department of Human Services, City of Oakland. Accessed Dec. 8, 2009 from http://www.oaklandhumanservices.org/initiatives/OCAP/Funding.htm.
118
outcome measurement, and four state leaders spoke of the need for measuring child and program level outcomes . Four of the state leaders reported that they track individual child or program level data and three state leaders said that they are collecting or interested in collecting system level data for assessing outcomes . One state leader explained that they have a peer Quality review case process where state inspection teams work with counties . another state leader reported that they’ve established a state accountability and outcomes system with child well-being indicators to examine the needs of children and how they are meeting those needs .
Providers
a total of twenty-eight providers spoke about outcomes . Thirty-nine percent of those providers spoke about challenges with outcomes and three-quarters of these providers discussed strategies for outcomes management . Only one provider discussed the need for defining outcome measures . One provider discussed the challenge of funding outcome measurement, and four providers spoke of the chal-lenge of measuring client satisfaction . Over half of the providers who discussed outcomes reported that they measure parent satisfaction (N=16), and one fourth of these providers reported that they collect individual level or program level outcomes data .
Across Disciplines
The use of it technology as noted above varied across counties and disciplines . The child welfare system was the only system to implement the use of it technology at the state level, and the state depart-ments of child welfare and mental health were the only state systems to report a data sharing initiative . providers across disciplines spoke of the challenges they face and strategies they’ve implemented for measuring outcomes . mental health providers most often spoke of the challenges of tracking individual and program level data (N=9) and system level data (N=8) . however, collecting system level and individual and program data were also the most commonly reported strategies by mental health providers (N=8 and N=13 respectively) . providers in the child welfare system also spoke about chal-lenges and strategies . They most commonly reported defining standards as the largest challenge (N=3) and tracking systems level outcomes (N=5) .
Both mental health and child welfare providers explained that they have performance outcomes .
Across Counties
use of it technology including electronic records, clinical decision making, sharing client information electronically, and data tools for tracking outcomes varied across counties and disciplines . respondents in six of the eleven counties indicated that they had electronic records . These counties included: alameda (early childhood), imperial (mental health and juvenile justice), Los angeles (juvenile justice and substance abuse), San Diego (mental health), Santa cruz (juvenile justice, child welfare, early childhood, and public health), and San mateo (juvenile justice) . respondents from the mental health system in two counties, alameda and San mateo, said that clinical decision-making is done electronically, while respondents in Los angeles said they are working towards this . among the other systems, juvenile justice respondents in four counties (imperial, Los angeles, Santa clara, and San Diego); substance abuse workers in two coun-ties (humboldt and imperial); and early childhood workers in one county (Santa cruz) reported that they use electronic based clinical decision-making programs . Finally, fewer counties and systems indicated that they are able to share client infor-mation with one another electronically . Juvenile justice system leaders and providers in five coun-ties (humboldt, imperial, Los angeles, San Diego, and San Francisco) said that they share information electronically with other systems such as proba-tion . child welfare respondents in two counties (humboldt and San Francisco) share information, and early childhood respondents in Santa cruz county explained that they share information with partners involved in the First 5 initiative .
providers and system leaders across counties who discussed outcomes most often spoke about the challenges of tracking individual and program level data (N=19) and defining performance standards (N=15) . They also most often listed tracking indi-vidual and program level data (N=35) and system level data (N=21) as strategy they were working towards or would like to implement . respondents in San Diego, for instance, reported that they have an Outcomes report that tracks a set of system outcomes .
National Center for Children in Poverty Unclaimed Children Revisited: California Case Study 119
Chapter Summary
information technology systems and outcomes management components provide accountability and transparency, which can contribute to more effective and sustainable services to children and families in need . The california Department of mental health has encouraged the use of tech-nology systems by providing funding, including mhSa funding, to counties to develop it improve-ments and to implement electronic records . respondents shared that data collection allows for quality assessment and improvement of services . Data sharing across systems can help facilitate joint-planning and better outcomes for families . There is some provider resistance to using it systems . information technology tracking systems are used for billing and finances and not outcomes . Some respondents noted confidentiality concerns and conflicts with hipaa .
There have been some improvements in individual and program level outcomes, yet there is system-atic inconsistency in measuring outcomes across all children in the system . at a system level, county reported performance measures are not appropri-ately measuring effectiveness of system-level impact on families and children . respondents reported that outcome management is in its infancy . Numerous respondents suggested a lack of funding, data, and clear definitions as some of the challenges in measuring outcomes .
Recommendations
The state of California and counties should:♦ establish well-defined outcomes and indicators for
tracking child and family outcomes at program/system levels;
♦ an increase in sharing of electronic records and data across counties and agencies can help to facilitate joint-planning for children and family services;
♦ development of appropriate measuring tools to measure change in child/participant, family and community level outcomes, both short term and long term; and
♦ promote an effort to develop appropriate measuring tools and maintain consistency in evaluating service and system impacts on children and families .
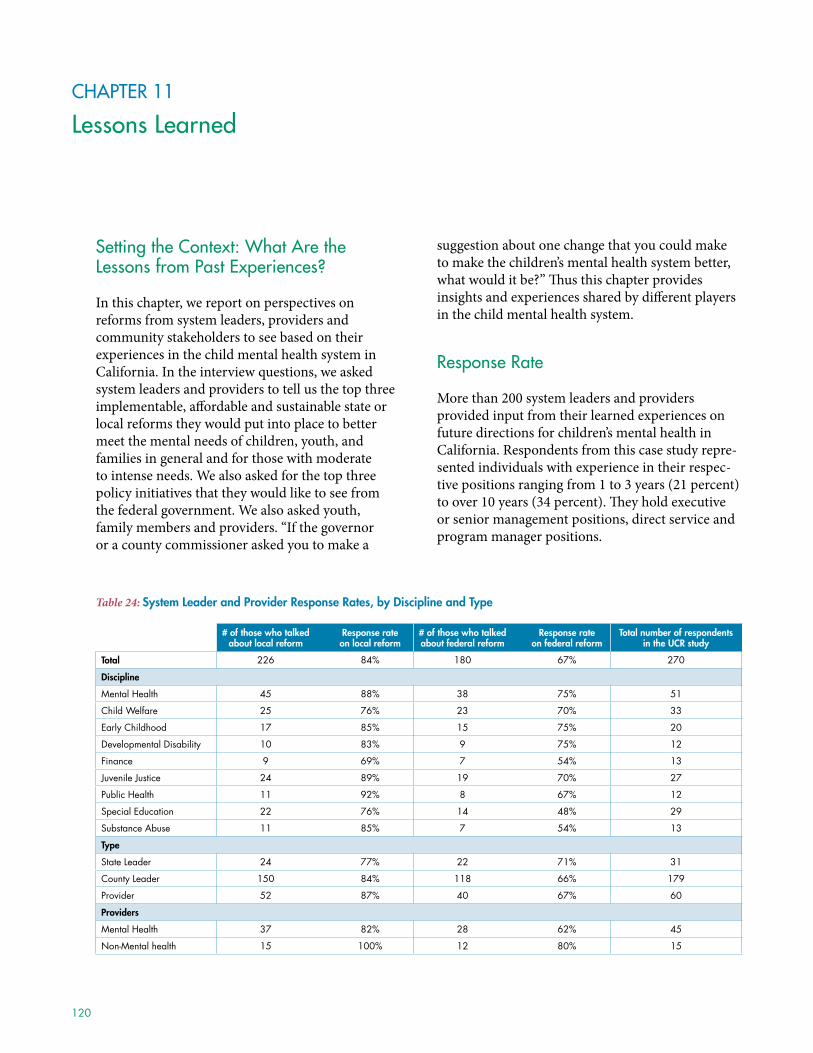
120
CHAPTeR 11
lessons learned
Setting the Context: What Are the lessons from Past experiences?
in this chapter, we report on perspectives on reforms from system leaders, providers and community stakeholders to see based on their experiences in the child mental health system in california . in the interview questions, we asked system leaders and providers to tell us the top three implementable, affordable and sustainable state or local reforms they would put into place to better meet the mental needs of children, youth, and families in general and for those with moderate to intense needs . We also asked for the top three policy initiatives that they would like to see from the federal government . We also asked youth, family members and providers . “if the governor or a county commissioner asked you to make a
suggestion about one change that you could make to make the children’s mental health system better, what would it be?” Thus this chapter provides insights and experiences shared by different players in the child mental health system .
Response Rate
more than 200 system leaders and providers provided input from their learned experiences on future directions for children’s mental health in california . respondents from this case study repre-sented individuals with experience in their respec-tive positions ranging from 1 to 3 years (21 percent) to over 10 years (34 percent) . They hold executive or senior management positions, direct service and program manager positions .
Table 24: system leader and Provider Response Rates, by discipline and Type
# of those who talked about local reform
Response rate on local reform
# of those who talked about federal reform
Response rate on federal reform
Total number of respondents in the uCR study
Total 226 84% 180 67% 270
discipline
Mental Health 45 88% 38 75% 51
Child Welfare 25 76% 23 70% 33
Early Childhood 17 85% 15 75% 20
Developmental Disability 10 83% 9 75% 12
Finance 9 69% 7 54% 13
Juvenile Justice 24 89% 19 70% 27
Public Health 11 92% 8 67% 12
Special Education 22 76% 14 48% 29
Substance Abuse 11 85% 7 54% 13
Type
State Leader 24 77% 22 71% 31
County Leader 150 84% 118 66% 179
Provider 52 87% 40 67% 60
Providers
Mental Health 37 82% 28 62% 45
Non-Mental health 15 100% 12 80% 15
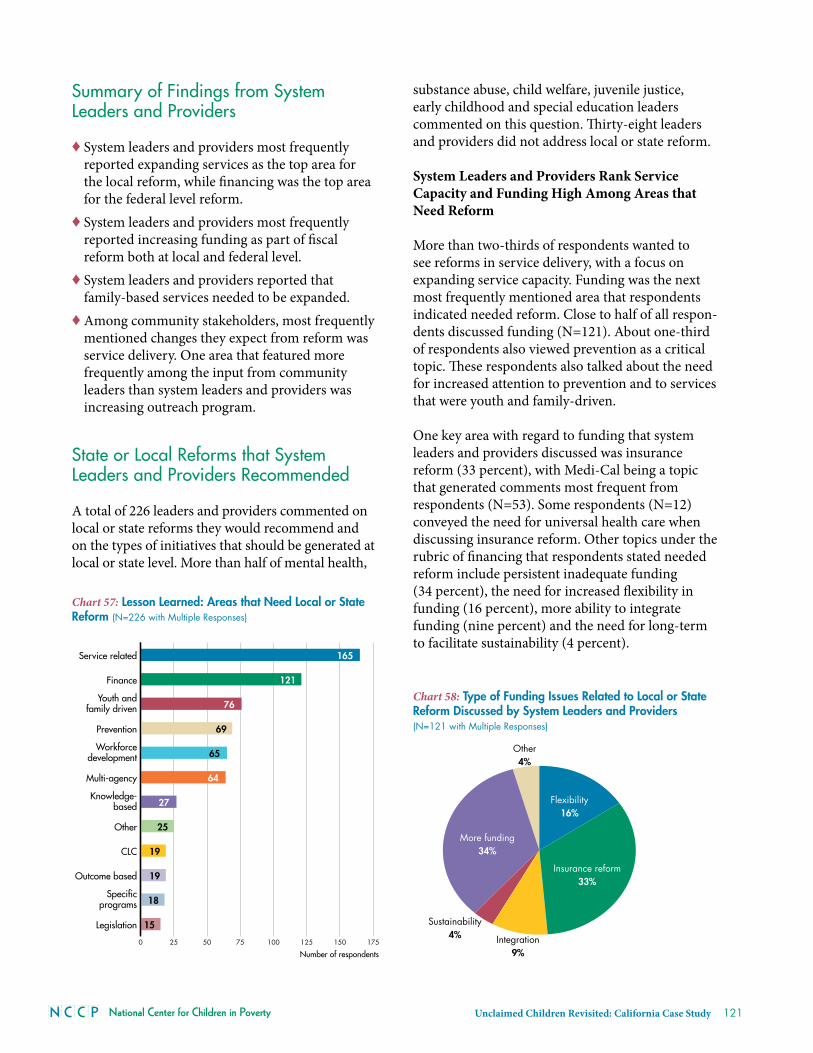
National Center for Children in Poverty Unclaimed Children Revisited: California Case Study 121
Summary of Findings from System leaders and Providers
♦ System leaders and providers most frequently reported expanding services as the top area for the local reform, while financing was the top area for the federal level reform .
♦ System leaders and providers most frequently reported increasing funding as part of fiscal reform both at local and federal level .
♦ System leaders and providers reported that family-based services needed to be expanded .
♦ among community stakeholders, most frequently mentioned changes they expect from reform was service delivery . One area that featured more frequently among the input from community leaders than system leaders and providers was increasing outreach program .
State or local Reforms that System leaders and Providers Recommended
a total of 226 leaders and providers commented on local or state reforms they would recommend and on the types of initiatives that should be generated at local or state level . more than half of mental health,
substance abuse, child welfare, juvenile justice, early childhood and special education leaders commented on this question . Thirty-eight leaders and providers did not address local or state reform .
System Leaders and Providers Rank Service Capacity and Funding High Among Areas that Need Reform
more than two-thirds of respondents wanted to see reforms in service delivery, with a focus on expanding service capacity . Funding was the next most frequently mentioned area that respondents indicated needed reform . close to half of all respon-dents discussed funding (N=121) . about one-third of respondents also viewed prevention as a critical topic . These respondents also talked about the need for increased attention to prevention and to services that were youth and family-driven .
One key area with regard to funding that system leaders and providers discussed was insurance reform (33 percent), with medi-cal being a topic that generated comments most frequent from respondents (N=53) . Some respondents (N=12) conveyed the need for universal health care when discussing insurance reform . Other topics under the rubric of financing that respondents stated needed reform include persistent inadequate funding (34 percent), the need for increased flexibility in funding (16 percent), more ability to integrate funding (nine percent) and the need for long-term to facilitate sustainability (4 percent) .
Chart 57: Lesson Learned: Areas that Need Local or State Reform (N=226 with Multiple Responses)
0 25 50 75 100 125 150 175
Legislation
Specificprograms
Outcome based
CLC
Other
Knowledge-based
Multi-agency
Workforcedevelopment
Prevention
Youth andfamily driven
Finance
Service related
15
18
19
19
25
27
64
65
69
76
121
165
Number of respondents
Chart 58: Type of Funding Issues Related to Local or State Reform Discussed by System Leaders and Providers (N=121 with Multiple Responses)
Other4%
More funding34%
Sustainability4% Integration
9%
Insurance reform33%
Flexibility16%
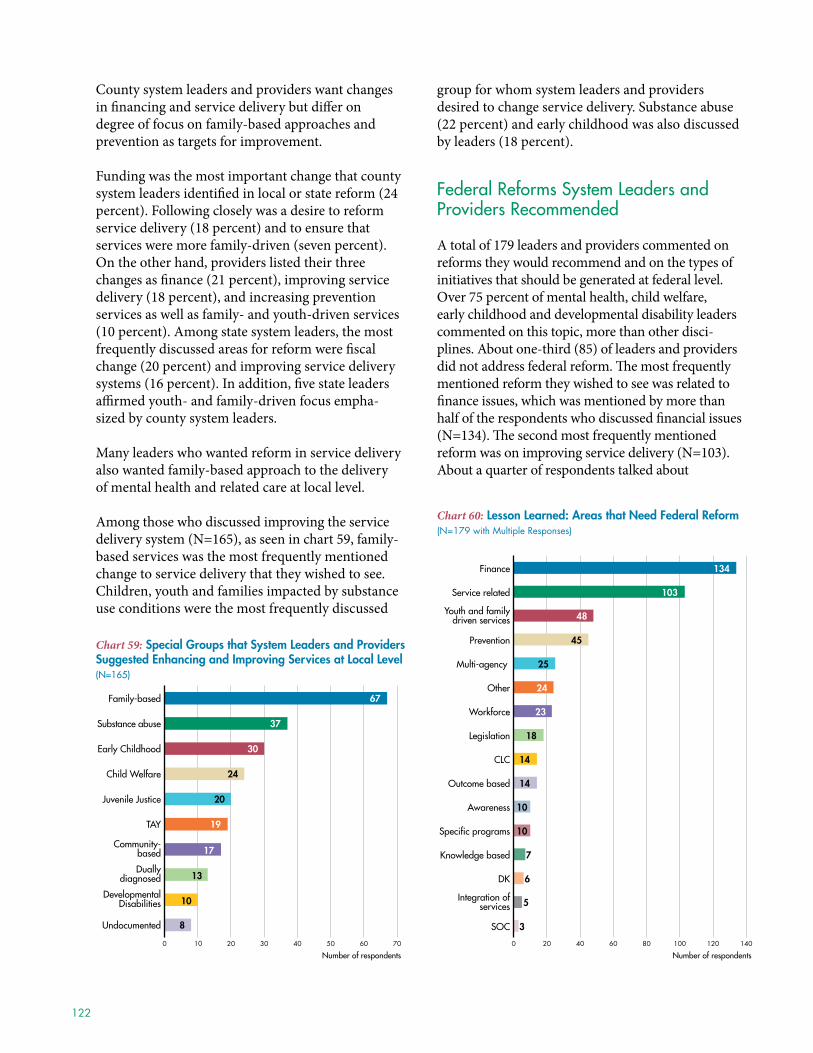
122
county system leaders and providers want changes in financing and service delivery but differ on degree of focus on family-based approaches and prevention as targets for improvement .
Funding was the most important change that county system leaders identified in local or state reform (24 percent) . Following closely was a desire to reform service delivery (18 percent) and to ensure that services were more family-driven (seven percent) . On the other hand, providers listed their three changes as finance (21 percent), improving service delivery (18 percent), and increasing prevention services as well as family- and youth-driven services (10 percent) . among state system leaders, the most frequently discussed areas for reform were fiscal change (20 percent) and improving service delivery systems (16 percent) . in addition, five state leaders affirmed youth- and family-driven focus empha-sized by county system leaders .
many leaders who wanted reform in service delivery also wanted family-based approach to the delivery of mental health and related care at local level .
among those who discussed improving the service delivery system (N=165), as seen in chart 59, family-based services was the most frequently mentioned change to service delivery that they wished to see . children, youth and families impacted by substance use conditions were the most frequently discussed
group for whom system leaders and providers desired to change service delivery . Substance abuse (22 percent) and early childhood was also discussed by leaders (18 percent) .
Federal Reforms System leaders and Providers Recommended
a total of 179 leaders and providers commented on reforms they would recommend and on the types of initiatives that should be generated at federal level . Over 75 percent of mental health, child welfare, early childhood and developmental disability leaders commented on this topic, more than other disci-plines . about one-third (85) of leaders and providers did not address federal reform . The most frequently mentioned reform they wished to see was related to finance issues, which was mentioned by more than half of the respondents who discussed financial issues (N=134) . The second most frequently mentioned reform was on improving service delivery (N=103) . about a quarter of respondents talked about
Chart 60: Lesson Learned: Areas that Need Federal Reform (N=179 with Multiple Responses)
0 20 40 60 80 100 120 140
SOC
Integration ofservices
DK
Knowledge based
Specific programs
Awareness
Outcome based
CLC
Legislation
Workforce
Other
Multi-agency
Prevention
Youth and familydriven services
Service related
Finance
3
5
6
7
10
10
14
14
18
23
24
25
45
48
103
134
Number of respondents
Chart 59: Special Groups that System Leaders and Providers Suggested Enhancing and Improving Services at Local Level (N=165)
0 10 20 30 40 50 60 70
Undocumented
DevelopmentalDisabilities
Duallydiagnosed
Community-based
TAY
Juvenile Justice
Child Welfare
Early Childhood
Substance abuse
Family-based
8
10
13
17
19
20
24
30
37
67
Number of respondents
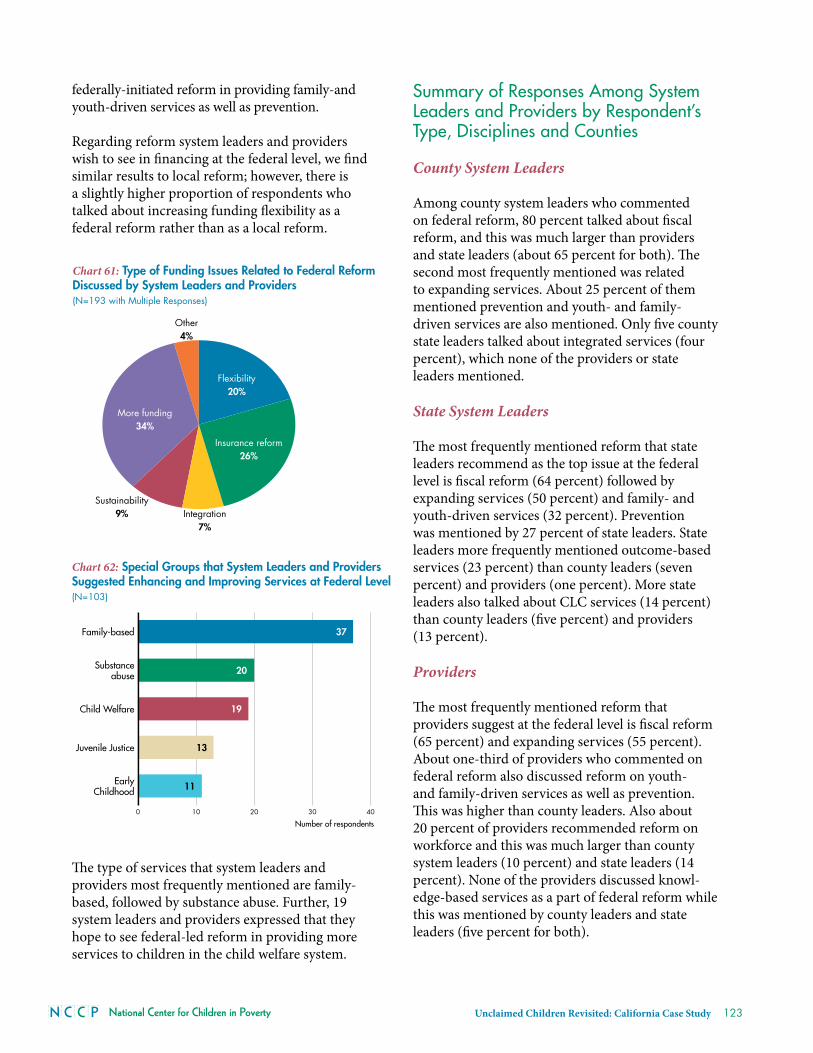
National Center for Children in Poverty Unclaimed Children Revisited: California Case Study 123
federally-initiated reform in providing family-and youth-driven services as well as prevention .
regarding reform system leaders and providers wish to see in financing at the federal level, we find similar results to local reform; however, there is a slightly higher proportion of respondents who talked about increasing funding flexibility as a federal reform rather than as a local reform .
The type of services that system leaders and providers most frequently mentioned are family-based, followed by substance abuse . Further, 19 system leaders and providers expressed that they hope to see federal-led reform in providing more services to children in the child welfare system .
Summary of Responses Among System leaders and Providers by Respondent’s Type, disciplines and Counties
County System Leaders
among county system leaders who commented on federal reform, 80 percent talked about fiscal reform, and this was much larger than providers and state leaders (about 65 percent for both) . The second most frequently mentioned was related to expanding services . about 25 percent of them mentioned prevention and youth- and family-driven services are also mentioned . Only five county state leaders talked about integrated services (four percent), which none of the providers or state leaders mentioned .
State System Leaders
The most frequently mentioned reform that state leaders recommend as the top issue at the federal level is fiscal reform (64 percent) followed by expanding services (50 percent) and family- and youth-driven services (32 percent) . prevention was mentioned by 27 percent of state leaders . State leaders more frequently mentioned outcome-based services (23 percent) than county leaders (seven percent) and providers (one percent) . more state leaders also talked about cLc services (14 percent) than county leaders (five percent) and providers (13 percent) .
Providers
The most frequently mentioned reform that providers suggest at the federal level is fiscal reform (65 percent) and expanding services (55 percent) . about one-third of providers who commented on federal reform also discussed reform on youth- and family-driven services as well as prevention . This was higher than county leaders . also about 20 percent of providers recommended reform on workforce and this was much larger than county system leaders (10 percent) and state leaders (14 percent) . None of the providers discussed knowl-edge-based services as a part of federal reform while this was mentioned by county leaders and state leaders (five percent for both) .
Chart 61: Type of Funding Issues Related to Federal Reform Discussed by System Leaders and Providers (N=193 with Multiple Responses)
Other4%
More funding34%
Sustainability9% Integration
7%
Insurance reform26%
Flexibility20%
Chart 62: Special Groups that System Leaders and Providers Suggested Enhancing and Improving Services at Federal Level (N=103)
0 10 20 30 40
EarlyChildhood
Juvenile Justice
Child Welfare
Substanceabuse
Family-based
11
13
19
20
37
Number of respondents
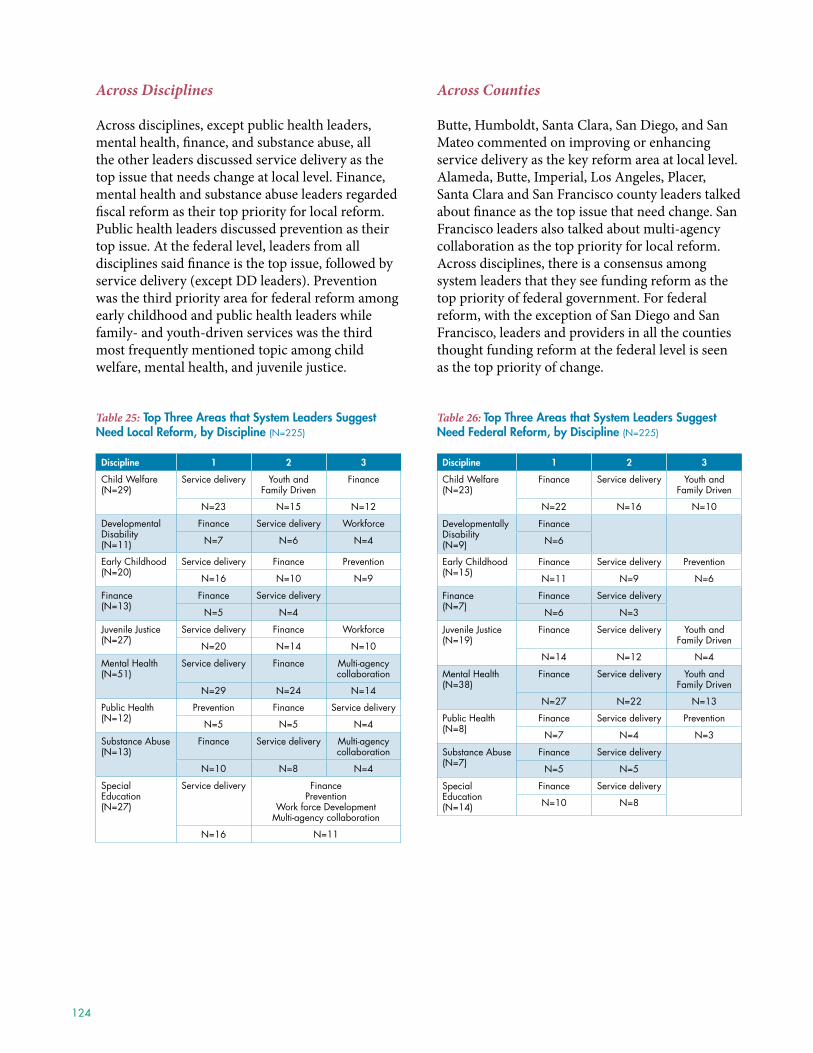
124
Across Disciplines
across disciplines, except public health leaders, mental health, finance, and substance abuse, all the other leaders discussed service delivery as the top issue that needs change at local level . Finance, mental health and substance abuse leaders regarded fiscal reform as their top priority for local reform . public health leaders discussed prevention as their top issue . at the federal level, leaders from all disciplines said finance is the top issue, followed by service delivery (except DD leaders) . prevention was the third priority area for federal reform among early childhood and public health leaders while family- and youth-driven services was the third most frequently mentioned topic among child welfare, mental health, and juvenile justice .
Table 25: Top Three areas that system leaders suggest need local Reform, by discipline (N=225)
discipline 1 2 3
Child Welfare(N=29)
Service delivery Youth and Family Driven
Finance
N=23 N=15 N=12
Developmental Disability (N=11)
Finance Service delivery Workforce
N=7 N=6 N=4
Early Childhood(N=20)
Service delivery Finance Prevention
N=16 N=10 N=9
Finance(N=13)
Finance Service delivery
N=5 N=4
Juvenile Justice(N=27)
Service delivery Finance Workforce
N=20 N=14 N=10
Mental Health(N=51)
Service delivery Finance Multi-agency collaboration
N=29 N=24 N=14
Public Health(N=12)
Prevention Finance Service delivery
N=5 N=5 N=4
Substance Abuse(N=13)
Finance Service delivery Multi-agency collaboration
N=10 N=8 N=4
Special Education(N=27)
Service delivery FinancePrevention
Work force DevelopmentMulti-agency collaboration
N=16 N=11
Across Counties
Butte, humboldt, Santa clara, San Diego, and San mateo commented on improving or enhancing service delivery as the key reform area at local level . alameda, Butte, imperial, Los angeles, placer, Santa clara and San Francisco county leaders talked about finance as the top issue that need change . San Francisco leaders also talked about multi-agency collaboration as the top priority for local reform . across disciplines, there is a consensus among system leaders that they see funding reform as the top priority of federal government . For federal reform, with the exception of San Diego and San Francisco, leaders and providers in all the counties thought funding reform at the federal level is seen as the top priority of change .
Table 26: Top Three areas that system leaders suggest need federal Reform, by discipline (N=225)
discipline 1 2 3
Child Welfare(N=23)
Finance Service delivery Youth and Family Driven
N=22 N=16 N=10
Developmentally Disability(N=9)
Finance
N=6
Early Childhood(N=15)
Finance Service delivery Prevention
N=11 N=9 N=6
Finance(N=7)
Finance Service delivery
N=6 N=3
Juvenile Justice(N=19)
Finance Service delivery Youth and Family Driven
N=14 N=12 N=4
Mental Health(N=38)
Finance Service delivery Youth and Family Driven
N=27 N=22 N=13
Public Health(N=8)
Finance Service delivery Prevention
N=7 N=4 N=3
Substance Abuse(N=7)
Finance Service delivery
N=5 N=5
Special Education(N=14)
Finance Service delivery
N=10 N=8
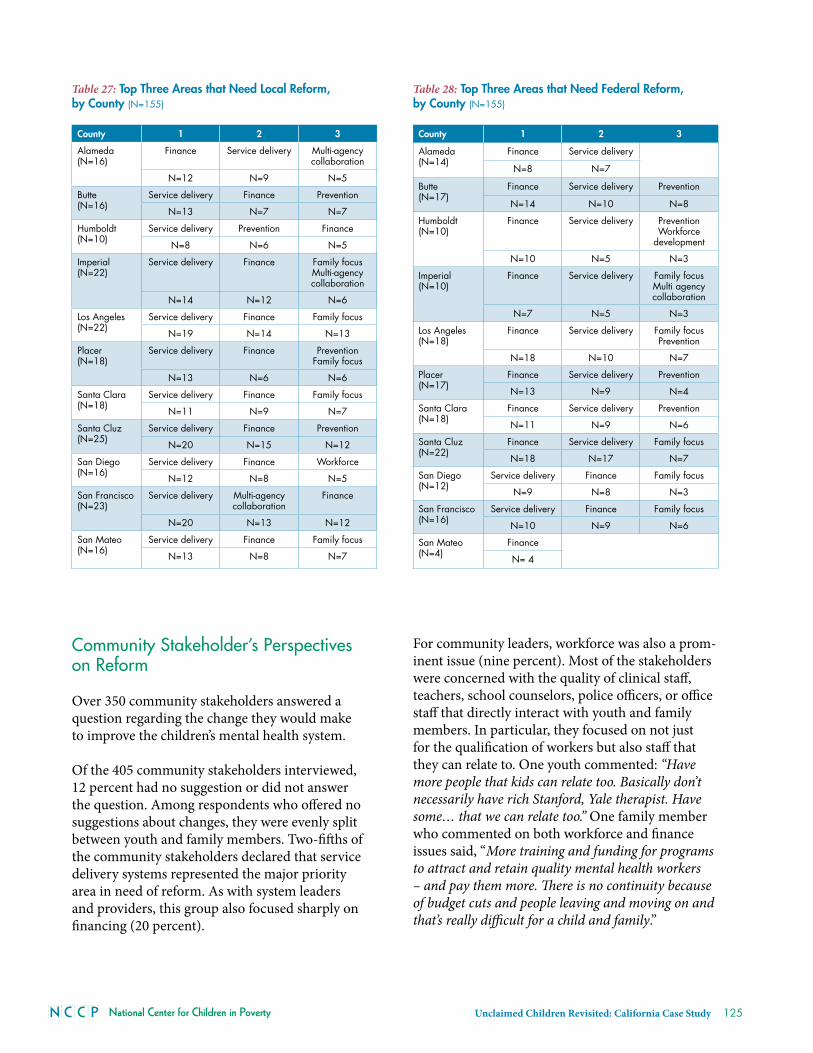
National Center for Children in Poverty Unclaimed Children Revisited: California Case Study 125
Community Stakeholder’s Perspectives on Reform
Over 350 community stakeholders answered a question regarding the change they would make to improve the children’s mental health system .
Of the 405 community stakeholders interviewed, 12 percent had no suggestion or did not answer the question . among respondents who offered no suggestions about changes, they were evenly split between youth and family members . two-fifths of the community stakeholders declared that service delivery systems represented the major priority area in need of reform . as with system leaders and providers, this group also focused sharply on financing (20 percent) .
For community leaders, workforce was also a prom-inent issue (nine percent) . most of the stakeholders were concerned with the quality of clinical staff, teachers, school counselors, police officers, or office staff that directly interact with youth and family members . in particular, they focused on not just for the qualification of workers but also staff that they can relate to . One youth commented: “Have more people that kids can relate too. Basically don’t necessarily have rich Stanford, Yale therapist. Have some… that we can relate too.” One family member who commented on both workforce and finance issues said, “More training and funding for programs to attract and retain quality mental health workers – and pay them more. There is no continuity because of budget cuts and people leaving and moving on and that’s really difficult for a child and family .”
Table 27: Top Three areas that need local Reform, by County (N=155)
County 1 2 3
Alameda(N=16)
Finance Service delivery Multi-agency collaboration
N=12 N=9 N=5
Butte(N=16)
Service delivery Finance Prevention
N=13 N=7 N=7
Humboldt(N=10)
Service delivery Prevention Finance
N=8 N=6 N=5
Imperial(N=22)
Service delivery Finance Family focusMulti-agency collaboration
N=14 N=12 N=6
Los Angeles(N=22)
Service delivery Finance Family focus
N=19 N=14 N=13
Placer(N=18)
Service delivery Finance PreventionFamily focus
N=13 N=6 N=6
Santa Clara(N=18)
Service delivery Finance Family focus
N=11 N=9 N=7
Santa Cluz(N=25)
Service delivery Finance Prevention
N=20 N=15 N=12
San Diego(N=16)
Service delivery Finance Workforce
N=12 N=8 N=5
San Francisco(N=23)
Service delivery Multi-agency collaboration
Finance
N=20 N=13 N=12
San Mateo(N=16)
Service delivery Finance Family focus
N=13 N=8 N=7
Table 28: Top Three areas that need federal Reform, by County (N=155)
County 1 2 3
Alameda(N=14)
Finance Service delivery
N=8 N=7
Butte(N=17)
Finance Service delivery Prevention
N=14 N=10 N=8
Humboldt(N=10)
Finance Service delivery PreventionWorkforce
development
N=10 N=5 N=3
Imperial(N=10)
Finance Service delivery Family focusMulti agency collaboration
N=7 N=5 N=3
Los Angeles(N=18)
Finance Service delivery Family focusPrevention
N=18 N=10 N=7
Placer(N=17)
Finance Service delivery Prevention
N=13 N=9 N=4
Santa Clara(N=18)
Finance Service delivery Prevention
N=11 N=9 N=6
Santa Cluz(N=22)
Finance Service delivery Family focus
N=18 N=17 N=7
San Diego(N=12)
Service delivery Finance Family focus
N=9 N=8 N=3
San Francisco(N=16)
Service delivery Finance Family focus
N=10 N=9 N=6
San Mateo(N=4)
Finance
N= 4
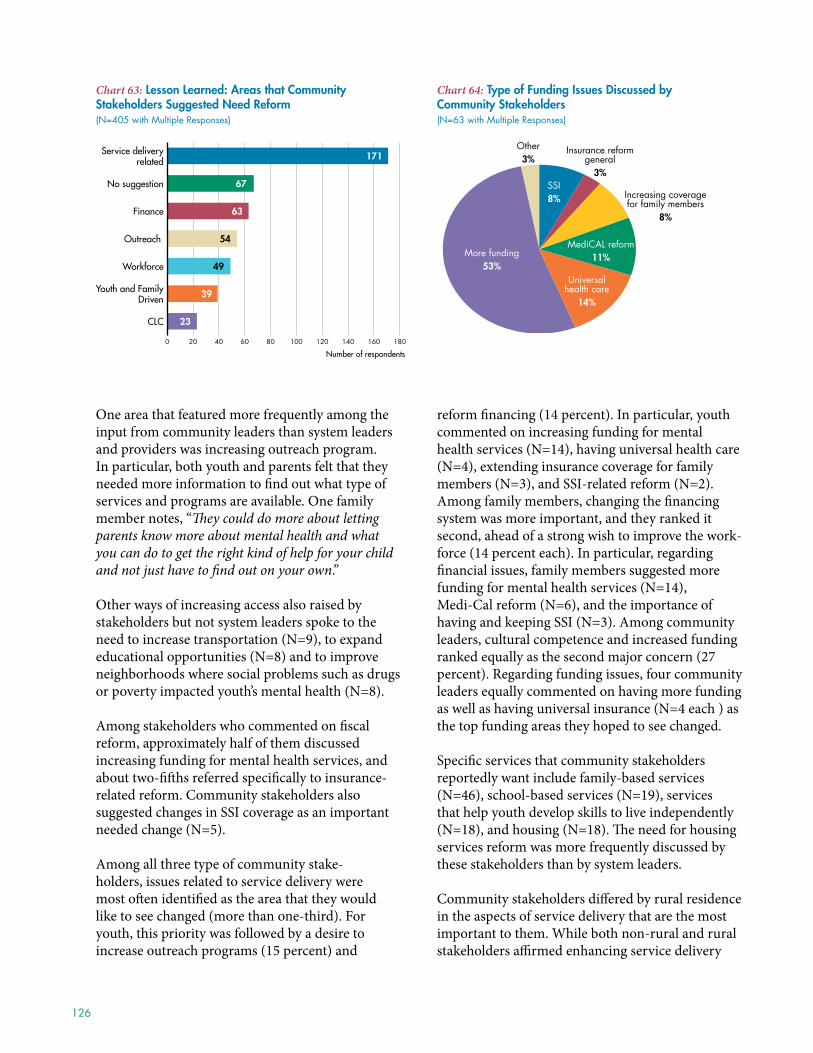
126
One area that featured more frequently among the input from community leaders than system leaders and providers was increasing outreach program . in particular, both youth and parents felt that they needed more information to find out what type of services and programs are available . One family member notes, “They could do more about letting parents know more about mental health and what you can do to get the right kind of help for your child and not just have to find out on your own .”
Other ways of increasing access also raised by stakeholders but not system leaders spoke to the need to increase transportation (N=9), to expand educational opportunities (N=8) and to improve neighborhoods where social problems such as drugs or poverty impacted youth’s mental health (N=8) .
among stakeholders who commented on fiscal reform, approximately half of them discussed increasing funding for mental health services, and about two-fifths referred specifically to insurance-related reform . community stakeholders also suggested changes in SSi coverage as an important needed change (N=5) .
among all three type of community stake-holders, issues related to service delivery were most often identified as the area that they would like to see changed (more than one-third) . For youth, this priority was followed by a desire to increase outreach programs (15 percent) and
reform financing (14 percent) . in particular, youth commented on increasing funding for mental health services (N=14), having universal health care (N=4), extending insurance coverage for family members (N=3), and SSi-related reform (N=2) . among family members, changing the financing system was more important, and they ranked it second, ahead of a strong wish to improve the work-force (14 percent each) . in particular, regarding financial issues, family members suggested more funding for mental health services (N=14), medi-cal reform (N=6), and the importance of having and keeping SSi (N=3) . among community leaders, cultural competence and increased funding ranked equally as the second major concern (27 percent) . regarding funding issues, four community leaders equally commented on having more funding as well as having universal insurance (N=4 each ) as the top funding areas they hoped to see changed .
Specific services that community stakeholders reportedly want include family-based services (N=46), school-based services (N=19), services that help youth develop skills to live independently (N=18), and housing (N=18) . The need for housing services reform was more frequently discussed by these stakeholders than by system leaders .
community stakeholders differed by rural residence in the aspects of service delivery that are the most important to them . While both non-rural and rural stakeholders affirmed enhancing service delivery
Chart 63: Lesson Learned: Areas that Community Stakeholders Suggested Need Reform (N=405 with Multiple Responses)
0 20 40 60 80 100 120 140 160 180
CLC
Youth and FamilyDriven
Workforce
Outreach
Finance
No suggestion
Service deliveryrelated
23
39
49
54
63
67
171
Number of respondents
Chart 64: Type of Funding Issues Discussed by Community Stakeholders (N=63 with Multiple Responses)
Other3%
More funding53%
Universalhealth care
14%
MediCAL reform11%
Increasing coveragefor family members
8%
Insurance reformgeneral
3%SSI8%
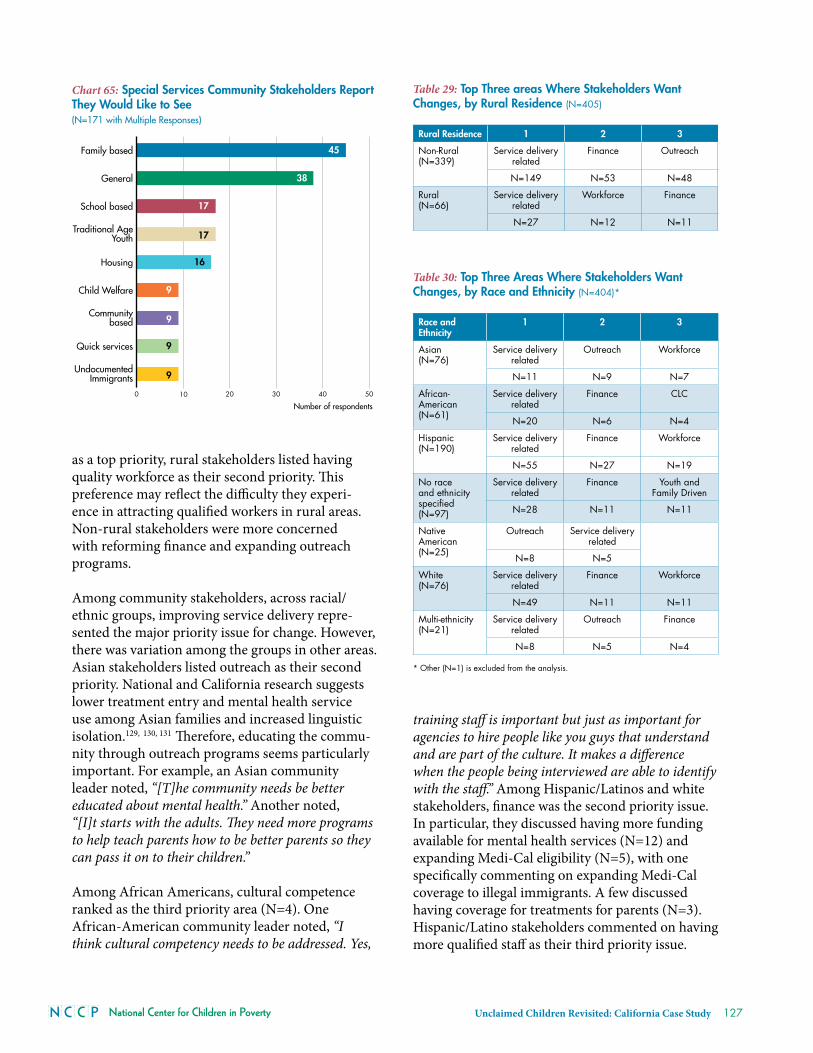
National Center for Children in Poverty Unclaimed Children Revisited: California Case Study 127
Chart 65: Special Services Community Stakeholders Report They Would Like to See (N=171 with Multiple Responses)
0 10 20 30 40 50
UndocumentedImmigrants
Quick services
Communitybased
Child Welfare
Housing
Traditional AgeYouth
School based
General
Family based
9
9
9
9
16
17
17
38
45
Number of respondents
as a top priority, rural stakeholders listed having quality workforce as their second priority . This preference may reflect the difficulty they experi-ence in attracting qualified workers in rural areas . Non-rural stakeholders were more concerned with reforming finance and expanding outreach programs .
among community stakeholders, across racial/ethnic groups, improving service delivery repre-sented the major priority issue for change . however, there was variation among the groups in other areas . asian stakeholders listed outreach as their second priority . National and california research suggests lower treatment entry and mental health service use among asian families and increased linguistic isolation .129, 130, 131 Therefore, educating the commu-nity through outreach programs seems particularly important . For example, an asian community leader noted, “[T]he community needs be better educated about mental health.” another noted, “[I]t starts with the adults. They need more programs to help teach parents how to be better parents so they can pass it on to their children.”
among african americans, cultural competence ranked as the third priority area (N=4) . One african-american community leader noted, “I think cultural competency needs to be addressed. Yes,
training staff is important but just as important for agencies to hire people like you guys that understand and are part of the culture. It makes a difference when the people being interviewed are able to identify with the staff.” among hispanic/Latinos and white stakeholders, finance was the second priority issue . in particular, they discussed having more funding available for mental health services (N=12) and expanding medi-cal eligibility (N=5), with one specifically commenting on expanding medi-cal coverage to illegal immigrants . a few discussed having coverage for treatments for parents (N=3) . hispanic/Latino stakeholders commented on having more qualified staff as their third priority issue .
Table 29: Top Three areas Where stakeholders Want Changes, by Rural Residence (N=405)
Rural Residence 1 2 3
Non-Rural(N=339)
Service delivery related
Finance Outreach
N=149 N=53 N=48
Rural(N=66)
Service delivery related
Workforce Finance
N=27 N=12 N=11
Table 30: Top Three areas Where stakeholders Want Changes, by Race and Ethnicity (N=404)*
Race and Ethnicity
1 2 3
Asian(N=76)
Service delivery related
Outreach Workforce
N=11 N=9 N=7
African-American(N=61)
Service delivery related
Finance CLC
N=20 N=6 N=4
Hispanic (N=190)
Service delivery related
Finance Workforce
N=55 N=27 N=19
No race and ethnicity specified(N=97)
Service delivery related
Finance Youth and Family Driven
N=28 N=11 N=11
Native American (N=25)
Outreach Service delivery related
N=8 N=5
White(N=76)
Service delivery related
Finance Workforce
N=49 N=11 N=11
Multi-ethnicity(N=21)
Service delivery related
Outreach Finance
N=8 N=5 N=4
* Other (N=1) is excluded from the analysis.
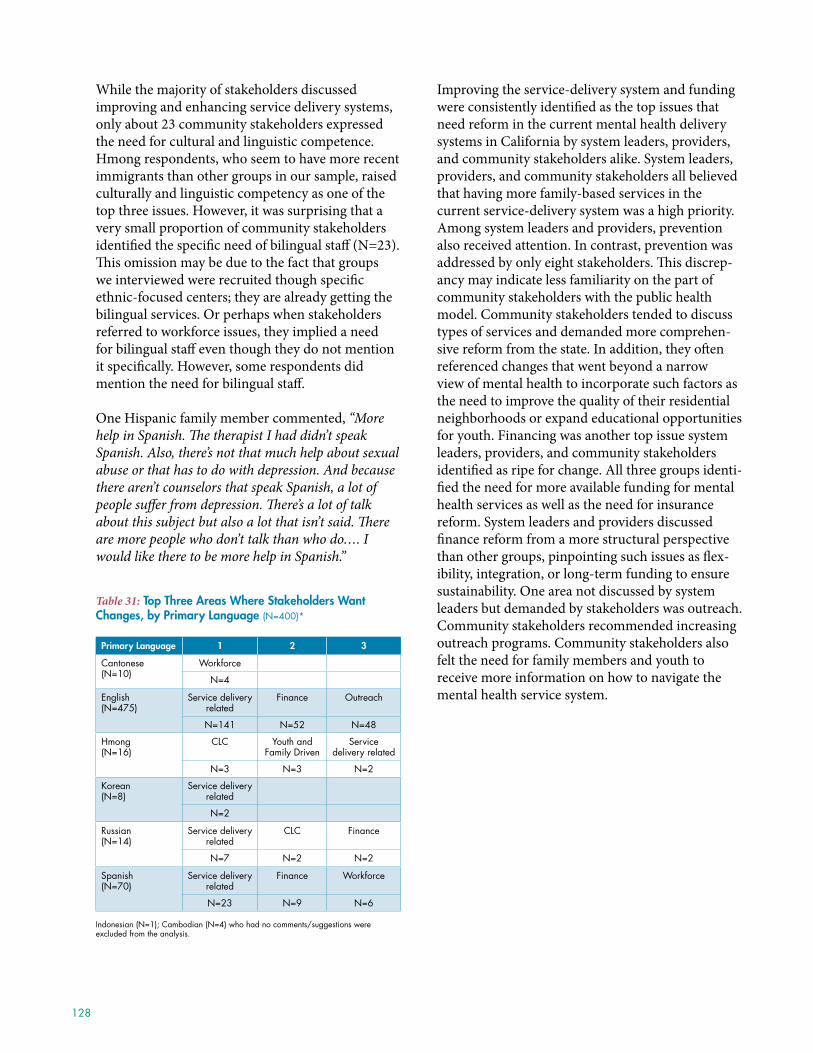
128
While the majority of stakeholders discussed improving and enhancing service delivery systems, only about 23 community stakeholders expressed the need for cultural and linguistic competence . hmong respondents, who seem to have more recent immigrants than other groups in our sample, raised culturally and linguistic competency as one of the top three issues . however, it was surprising that a very small proportion of community stakeholders identified the specific need of bilingual staff (N=23) . This omission may be due to the fact that groups we interviewed were recruited though specific ethnic-focused centers; they are already getting the bilingual services . Or perhaps when stakeholders referred to workforce issues, they implied a need for bilingual staff even though they do not mention it specifically . however, some respondents did mention the need for bilingual staff .
One hispanic family member commented, “More help in Spanish. The therapist I had didn’t speak Spanish. Also, there’s not that much help about sexual abuse or that has to do with depression. And because there aren’t counselors that speak Spanish, a lot of people suffer from depression. There’s a lot of talk about this subject but also a lot that isn’t said. There are more people who don’t talk than who do…. I would like there to be more help in Spanish.”
Table 31: Top Three areas Where stakeholders Want Changes, by Primary language (N=400)*
Primary language 1 2 3
Cantonese(N=10)
Workforce
N=4
English (N=475)
Service delivery related
Finance Outreach
N=141 N=52 N=48
Hmong(N=16)
CLC Youth and Family Driven
Service delivery related
N=3 N=3 N=2
Korean(N=8)
Service delivery related
N=2
Russian(N=14)
Service delivery related
CLC Finance
N=7 N=2 N=2
Spanish(N=70)
Service delivery related
Finance Workforce
N=23 N=9 N=6
Indonesian (N=1); Cambodian (N=4) who had no comments/suggestions were excluded from the analysis.
improving the service-delivery system and funding were consistently identified as the top issues that need reform in the current mental health delivery systems in california by system leaders, providers, and community stakeholders alike . System leaders, providers, and community stakeholders all believed that having more family-based services in the current service-delivery system was a high priority . among system leaders and providers, prevention also received attention . in contrast, prevention was addressed by only eight stakeholders . This discrep-ancy may indicate less familiarity on the part of community stakeholders with the public health model . community stakeholders tended to discuss types of services and demanded more comprehen-sive reform from the state . in addition, they often referenced changes that went beyond a narrow view of mental health to incorporate such factors as the need to improve the quality of their residential neighborhoods or expand educational opportunities for youth . Financing was another top issue system leaders, providers, and community stakeholders identified as ripe for change . all three groups identi-fied the need for more available funding for mental health services as well as the need for insurance reform . System leaders and providers discussed finance reform from a more structural perspective than other groups, pinpointing such issues as flex-ibility, integration, or long-term funding to ensure sustainability . One area not discussed by system leaders but demanded by stakeholders was outreach . community stakeholders recommended increasing outreach programs . community stakeholders also felt the need for family members and youth to receive more information on how to navigate the mental health service system .
National Center for Children in Poverty Unclaimed Children Revisited: California Case Study 129
Chapter Summary
consensus among key informants on areas that need reform in children’s mental health is evident . all key informants agree that major changes need to occur in how services are delivered and funded . The nature of the suggested reforms in funding ranged from broad changes beyond the field such as universal insurance reform to targeted initiatives such as facilitating integration and funding flex-ibility . in particular, system leaders and providers expect to see the funding reform from the federal level . This level of agreement across key stake-holders in the mental health system suggests room for a more cohesive and coherent agenda for children, youth, and their families . it also indicates that the state children’s mental health field may be well-positioned to speak with one voice on funding and service delivery . all participants also agreed on the need for more family-based services, but in its implementation, it appears to mean different things depending on the key informant . While community stakeholders identified the need for strategies such as outreach and information to navigate the system, these two important strategies were not mentioned by system leaders and providers . This gap suggests that state leaders need to create institutional poli-cies that address these strategies in order to facilitate better access .
130
1 . children with serious emotional disorders are defined as those from birth to 18 years of age who currently, or at any time during the past year, had diagnosable mental, behavioral, or emotional disorders of sufficient duration to meet criteria in the Diagnostic and Statistical manual of mental health Disorders (DSm iiir), resulting in functional impairment that substan-tially interfered with or limited their role functioning in family, school, or community settings . See Friedman r ., Kutash K ., and Duchnowski a . 1996 . The population of concern: Defining the issues . in Children’s Mental Health: Creating Systems of Care in a Changing Society . B . Stroul (Ed .) . Baltimore, mD: paul h . Brookes publishing company . 2 . Knitzer, J . 1982 . Unclaimed Children: The Failure of Public Responsibility to Children and Adolescents in Need of Mental Health Services . Washington, Dc: children’s Defense Fund .3 . county data presented in chart 2-4 from the american community Survey 2006 was estimated by combining of public-use microdata areas (pumas) .4 . Kataoka, S .; Shang, L .; Wells, K . 2002 . unmet Need for mention health care among u .S . children: variation by Ethnicity and insurance Status . American Journal of Psychiatry 159(9): 1548-1555 .5 . ibid .6 . howell, E . 2004 . Access to Children’s Mental Health Services Under Medicaid and SCHIP . Washington, Dc: urban institute .7 . mark, t .; Buck, J . 2006 . characteristics of u .S . youths with Serious Emotional Disturbance: Data from the National health interview Survey . Psychiatric Services 57(11): 1573-1578 . 8 . See reference 4 .9 . See reference 6 .10 . See reference 4 .11 . See reference 7 .12 . Burns, B .; phillips, S .; Wagner, h .; et al . 2004 . mental health Need and access to mental health Services by youths involved with child Welfare: a National Survey . Journal of the American Academy of Child and Adolescent Psychiatry 43(8): 960-970 .13 . See reference 4 .14 . Busch, S .; mccue horwitz, S . 2004 . access to mental health Services: are uninsured children Falling Behind? Mental Health Services Research 6(2): 109-116 .15 . Strum, r .; ringel, J .; andreyeva, t . 2003 . Geographic Dispar-ities in children’s mental health care . Pediatrics 112(4): e308 .16 . ibid .17 . Grant, B .F .; harford, t .c . 1995 . comorbidity between DSm-iv alcohol use Disorders and major Depression: results of a National Survey . Drug Alcohol Depend 39: 179–206 .18 . hirschfeld, r .; hasin, D .; Keller, m .; Endicott, J .; Wunder, J ., 1990 . Depression and alcoholism: comorbidity in a Longitudinal Study. in: maser, J .; cloninger, c ., (Eds .) Cormorbidity of Mood and Anxiety Disorders, American Psychiatric Association, Washington, Dc .19 . masi, r .; cooper, J . 2006 . Children’s Mental Health: Facts for Policymakers. New york, Ny: National center for children in poverty, columbia university mailman School of public health .
20 . howell, E .; mcFeeters, J . 2008 . children’s mental health care: Differences by race/Ethnicity in urban/rural areas . Journal of Health Care for the Poor and Underserved 19(1): 237-247 .21 . See reference 15 .22 . hough, r . i .; hazen, a . i .; Soriano, F . i .; Wood, p .; mccabe, K .; yeh, m . 2002 . mental health Services for Latino adolescents with psychiatric Disorders . Psychiatric Services 53(12): 1556-1562 .23 . Garland, a . F .; Lau, a . S .; yeh, m .; mccabe, K .; hough, r . i .; Landsverk, J . 2005 . racial and Ethnic Difference in utilization of mental health Services among high-risk youths . American Journal of Psychiatry 167(7): 1336-1343 .24 . halliday-Boykins, c .; Schoenwald, S .; Letourneau, E . J . 2005 . care-giver Therapist Ethnic Similarity predicts youth Outcomes from an Empirically-based treatment . Journal of Clinical Child and Adolescent Psychology 73(5): 808-818 .25 . Gallucci, G .; Swartz, W .; hackerman, F . 2005 . impact of the Wait for an initial appointment on the rate of Kept appointments at a mental health center . Psychiatric Services 56(3): 344-346 .26 . Ferguson, c . c . 2007 . Barriers to Serving the vulnerable: Thoughts of a Former public Official . Health Affairs 2(5): 1358-1365 .27 . See reference 4 .28 . Davis, m .; Geller, J . L .; hunt, B . 2006 . Within-state availability of transition-to-adulthood Services for youths with Serious mental health conditions . Psychiatric Services 57(11): 1594-1599 .29 .Budde, S .; mayer, S .; Zinn, a .; Lippold, m .; avrushin, a .; Bromberg, a .; et al . 2004 . Residential Care in Illinois: Trends and Alternatives . chicago, iL: chapin hall center for children at the university of chicago .30 . rawal, p . h .; Lyon, J . S .; macintyre, i . J . c .; hunter, J . c . 2004 . regional variation and clinical indicators of antipsy-chotic use in residential treatment: a Four State comparison . The Journal of Behavioral Health Services & Research 31(2): 178-188 .31 . Weisz, J . r .; Sandler, i . N .; Durlak, J . a .; anton, B . S . 2005 . promoting and protecting youth mental health through Evidence-based prevention and treatment . American Psychologist 60(6): 628-648 .32 . california mental health planning council . 2003 . California Mental Health Master Plan: A Vision for California . Sacramento, ca . 33 . hoagwood, K .; Burns, B . J .; Kiser, L .; ringelsen, h .; Schoenwald, S . K . 2001 . Evidence-based practice in child and adolescent mental health Services . Psychiatric Services 52(9): 1179-1189 .34 . Bruns, E .; hoagwood, K . 2008 . State implementation of Evidence-based practice for youths, part i: responses to the State of the Evidence . Journal of the American Academy of Child and Adolescent Psychiatry 47: 369-373 .35 . Glisson, c .; Landsverk, J .; Schoenwald, S .; Kelleher, K .; hoagwood, K . E .; mayberg, S .; et al . 2008 . assessing the
References
National Center for Children in Poverty Unclaimed Children Revisited: California Case Study 131
Organizational Social context (OSc) of mental health Services: implications for research and practice . Administration and Policy in Mental Health and Mental Health Services Research 35: 98-113 .36 . Whaley, a . L .; Davis, K . E . 2007 . cultural competence and Evidence-based practice: a complementary perspective . American Psychologist 62(6): 563-574 .37 . De Los reyes, a .; Kazdin, a .E . 2006 . conceptualizing changes in Behavior in intervention research: The range of possible changes model . Psychological Review 113(3): 554-83 .38 . california institute of mental health (cimh) 2008 . value Driven Evidence-based practices . accessed Dec . 8, 2009 from http://www .cimh .org/initiatives/evidence-based-practice .aspx .39 . ibid .40 . proctor, E . K .; Knudsen, K . J .; Fedoravicius, N .; hovman, p .; rosen, a .; perron, B . 2007 . implementation of Evidence-based practice in community Behavioral health: agency Director perspectives . Administration and Policy in Mental Health & Mental Health Services Research 34(5): 479-488 .41 . Nelson, t . D .; Steele, r . G . 2007 . predictors of practitioner Self-reported use of Evidence-based practices: practitioner training, clinical Setting, and attitudes toward research . Administration and Policy in Mental Health & Mental Health Services Research 34(4): 319-330 .42 . Jewell, c . J .; Bero, L . a . 2008 . Developing Good taste in Evidence: Facilitators of and hindrances to Evidence-informed health policymaking in State Government . The Milbank Quarterly 86(2): 177-208 .43 . Schoenwald, S . K .; chapman, J . E .; Kelleher, K .; hoagwood, K . E .; Landsverk, J .; Stevens, J .; et al . 2008 . a Survey of the infrastructure for children’s mental health Services: implications for the implementation of Empirically Supported treatments (ESts) . Administration and Policy in Mental Health and Mental Health Services Research 35: 84-97 .44 . Scheyett, a .; mccarthy, E .; rausch, c . 2006 . consumer and Family views on Evidence-based practices and adult mental health Services . Community Mental Health Journal 43(3): 243-257 .45 . hoagwood, K .; Green, E .; Kelleher, K .; Schoewald, S .; rolls-reutz, J .; Landsverk, J . et al . 2008 . Family advocacy, Support and Education in children’s mental health . Administration and Policy in Mental Health & Mental Health Services Research 35(1-2): 73-83 .46 . tanenbaum, S . J . 2005 . Evidence-based practice as mental health policy: Three controversies and a caveat . Health Affairs 24(1): 163-175 .47 . aarons, G . 2004 . mental health provider attitudes toward adoption of Evidence-based practice: The Evidence-based practice attitude . Mental Health Services Research 6(2): 61-74 .48 . mental health Services act, Section 9, part 3 .2, 5830 (a) and (b) . 49 . mental health Services Oversight and accountability commission . 2008 . innovation resource committee recommendations . accessed aug . 31, 2008, from http://www .dmh .ca .gov/mhSOac/publications_and_resources .asp .50 . Knitzer, J . 1996 . children’s mental health: changing paradigms and policies . in E . F . Zigler; S . L . Kaga; N . W . hall (Eds .) Children, Families and Government: Preparing for the Twenty-first Century . New york: cambridge university press .
51 . Osher, t . 1996 . Why Children Are Not Little Adults Or What Managed Behavioral Care Consider to be Appropriate for Children and Youth. arlington, va: Federation of Families for children’s mental health .52 . Knitzer, J . 1982 . Unclaimed Children: The Failure of Public Responsibility to Children in Need of Mental Health Services . Washington, Dc: children’s Defense Fund .53 . Knitzer, J .; Steinberg, Z .; Fleish, B . 1990 . At the Schoolhouse Door: An Examination of Programs and Policies for Children with Emotional and Behavioral Problems . New york, Ny: Bank Street college of Education .54 . Snowden, L . r .; masland, m .; Wallace, N .; Fawley-King, K .; cuellar, a . E . 2008 . increasing california children’s medicaid-financed mental health treatment by vigorously implementing medicaid’s Early periodic Screening, Diagnosis and treatment program . Medical Care Research & Review 46(6): 558-564 .55 . Whitaker, r . c .; Orzol, S . m .; Kahn, r . S . 2006 . maternal mental health, Substance use and Domestic violence in the year after Delivery and Subsequent Behavior problems in children at age 3 years . Archives of General Psychiatr 63: 551-560 .56 . Luthar, S . S . 2006 . resilience in Development: a Synthesis of research across Five Decades . in D . cicchetti; D . J . cohen (Eds .) Developmental Psychopathology: Risk, Disorder and Adaptation . New york, Ny: John Wiley & Sons .57 . See reference 55 .58 . cuffe, S . p .;mcKeown, r . E .; addy, c . L .; Garrison, c . Z . 2005 . Family and psychosocial risk Factors in a Longitudinal Epidemiological Study of adolescents . Journal of the American Academy of Child and Adolescent Psychiatry 44(2): 121-129 .59 . masten, a . S .; powell, J . L . 2003 . a resilience Framework for research, policy and practice . in S . S . Luthar (Ed .), Resilience and Vulnerability: Adaptation in the Context of Childhood Adversities . New york, Ny: cambridge university press .60 . mental health Services act . accessed Jan . 5, 2010 from http://www .dmh .ca .gov/prop–63/mhSa/default .asp .61 . See reference 56 .62 . Dababnah, S .; cooper, J . 2006 . Challenges and Opportunities in Children’s Mental Health: A View from Families and Youth (unclaimed children revisited: Working paper No . 1) . New york, Ny: National center for children in poverty, columbia university mailman School of public health .See reference 45 .Johnson, p .; Jones, p . 2007 . transition-aged youth Focus Groups: youth voice and the mental health Services act . Report and Recommendations. accessed Dec . 12, 2007 from http://www .dmh .ca .gov/pOQi/docs/ccyr_Finalversion .pdfNicholson, J .; Biebel, K .; Katz-Levy, K .; Williams, v . F . 2004 . The prevalence of parenthood in adults with mental illness: implications for State and Federal policymakers, programs and providers . in r . manderscheid; m . henderson (Eds .) Mental Health, United States, 2002 . rockville, mD: Substance abuse and mental health Services administration .63 . Friesen, B . J .; pullmann, m .; Koroloff, N . m .; rea, t . 2004 . multiple perspectives on Family Outcomes in children’s mental health . in m . Epstein; K . Kutash; a . Duchnowski (Eds .) Outcomes for Children and Youth with Emotional Behavioral Disorders and their Families . austin, tx: prO-ED inc .
132
64 . SamhSa System of care 2008 . accessed Sept . 4, 2008 from http://www .systemsofcare .samhsa .gov/headermenus/deffamily-driven .aspx .65 . united advocates for children and Families . 2008 . accessed Sept . 4, 2008 from http://www .uacf4hope .org/gi_history .html .66 . Shaller, D .; consulting, S . 2007 . patient-centered care: What does it take? New york, New york: commonwealth Fund .67 . Lazear, K . J .; Worthington, J .; Detres, m . 2004 . Family Experience of the mental health System (FEmhS) — Findings compendium: Findings Brief 5 helpfulness of Formal Services, Family Organizations and informal Supports . tampa, FL: university of South Florida, Louis de la parte Florida mental health institute (Fmhi), research and training center for children’s mental health . (Fmhi Series publication #224-5) .68 . clausen, J .; Dresser, K .; rosenblatt, a .; attkisson, c . 1998 . impact of the child and adolescent Service System program in california: perceptions of Families and Service providers . Journal of Emotional and Behavioral Disorders 6: 114 .69 . Graves, K .; Shelton, t . 2007 . Family Empowerment as a mediator between Family-centered Systems of care and changes in child Functioning: identifying and important mechanism of change . Journal of Child and Family Studies 16: 556-566 .70 . See reference 67 .71 . See reference 65 .72 . See Dababnah in reference 62 .73 . perkins, J .; youdelman, m . 2008. Summary of State Law Requirements Addressing Language Needs in Health . chapel hill, Nc: National health Law program .74 . cross t .; Bazron, B .; Dennis, K .; isaacs, m . 1989. Towards a Culturally Competent System of Care, volume i . Washington, D .c .: Georgetown university child Development center, caSSp technical assistance center .75 . Flores, G .; Laws, m .; mayo, S .; Zuckerman, B .; milagros, a .; medina, L .; et al . 2003 . Errors in medical interpretation and their potential clinical consequences in pediatric Encounters . Pediatrics 111(1): 6-14 .76 . Beardslee, W . r .; Gladstone, t . r .; Wright, E . J .; cooper, a . B . 2003 . a Family-based approach to the prevention of Depressive Symptoms in children at risk: Evidence of parental and child change . Pediatrics 112(2): 119-131 .77 . See reference 4 .78 . Flores, G .; abreu, m .; tomany-Korman, S . c . 2006 . Why are Latinos the most uninsured racial/Ethnic Group of uS children? a community-based Study of risk Factors for and consequences of Being an uninsured Latino child [Electronic version] . Pediatrics 118: 730-740 . 79 . Fierros, E . G .; conroy, J . W . 2002 . Racial Disparities in the Identification, Funding and Provision of Special Education . in D . J .Losen; G . Orfield (Eds .) Racial Inequity in Special Education . cambridge, ma: harvard Educationpress .80 . hough, r . i .; hazen, a . i .; Soriano, F . i .; Wood, p .; mccabe, K .; yeh, m . 2002 . mental health Services for Latino adolescents with psychiatric Disorders. Psychiatric Services 53(12): 1556-1562 .81 . pumariega, a .; rogers, K .; rothe, E . 2005. culturally competent Systems of care for children’s mental health: advances and challenges . Community Mental Health Journal 41(5): 539 .
82 . See reference 76 .83 . richardson, L . ;, Diguiseppe, D .; Garrison, m .; christakis, D . a . 2003. Depression in medicaid-covered youth: Differences by race and Ethnicity . Archives of Pediatric and Adolescent Medicine 157: 984-989 .84 . State of california Department of corrections and rehabilitation . 2008 . A Comparison of the Division of Juvenile Justice’s Institution and Parole Populations . Sacramento, ca: Department of corrections and rehabilitation, Division of Juvenile Justice, Juvenile research Branch .85 . ucLa/iDEa . Suspension and Expulsion at-a-Glance . accessed Dec . 8, 2009 from http://idea .gseis .ucla .edu/publications/suspension/images/suspension .pdf.86 . Needell, B . Child Welfare in California: Ethnic Racial Disproportionality and Disparity . accessed Dec . 9, 2009 from http://www .f2f .ca .gov/res/ppt/ca_Disparity_Sample_ppt .ppt .87 . hurlburt, m . S .; Leslie, L . K .; Landsverk, J .; Barth, r .; Burns, B .; Gibbons, r . D .; et al . 2004 . contextual predictors of mental health Service use among children Open to child Welfare . Archives of General Psychiatry 61: 1217-1224 .88 . rowe, c . L .; Liddle, h . a .; Greenbaum, p . E . 2004. impact of psychiatric comorbidity on treatment of adolescent Drug abusers . Journal of Substance Abuse Treatment 26: 129-140 .89 . Biebel, K .; Katz-Levy, K .; Nicholson, J .; Williams, v . 2006 . using medicaid Effectively for children with Serious Emotional Disturbance (Draft): 1-55 .90 . u .S . Department of health and human Services 1999 . Mental Health: A Report of the Surgeon General. rockville, mD: u .S . Department of health and human Services, Substance abuse and mental health administration Services, center for mental health Services, National institute of mental health .91 . World health Organization . 2001 . The World Health Report 2001 – Mental Health: New Understanding, New Hope. Geneva, Switzerland: World health reporting .92 . albee, G .W .; and ryan K . 1998 . an Overview of primary prevention. Journal of Mental Health 7(5): 441-449 .93 . See reference 90 .94 . centers for Disease control and prevention . 1999 . An Ounce of Prevention…What are the Returns? 2nd ed ., rev . atlanta, Ga: u .S . Department of health and human Services, cDc .95 . hawkins J .D .; catalano r .F .; associates . 1992 . Communities That Care: Action for Drug Abuse Prevention . San Francisco: Jossey-Bass, inc .96 . hawkins, J .D .; and Weiss, J . G . 1985 . The Social Development model: an integrated approach to Delinquency prevention . Journal of Primary Prevention 6: 73-97 .97 . Biglan, a .: metzler, carol W .; 1998 . a public health perspective for research on Family-focused interventions . National Institute of Drug Abuse Research 177: 430-457 .98 . Kumpfer, K .L .; alexander, J .F .; mcDonald, L .; Olds, D .L . 1998 . Family-focused Substance abuse prevention: What has Been Learned from Other Fields . National Institute of Drug Abuse Research 177: 77-102 .99 . center for mental health Services . 1996 . Systems of Care Fact Sheet. rockville, mD: u .S . Department of health and human Services .

National Center for Children in Poverty Unclaimed Children Revisited: California Case Study 133
100 . roberts-DeGennaro, m . 1986a . Building coalitions for political advocacy . Social Work July/august: 308-311 .101 . Black .t . 1983 . coalition Building – Some Suggestions . Child Welfare 62: 263-268 .102 . Brown .c . 1984 . The Art of Coalition Building: a Guide for Community Leaders . New york: The american Jewish committee .103 . National academy of Sciences . 2009 . Stronger Effort Needed to prevent mental, Emotional, and Behavioral Disorders in young people, Experts urge. Science Daily . accessed Feb . 13, 2009 from http://www .sciencedaily .com /releases/2009/02/090213115022 .htm .104 . 2001 . mental health care for youth: Who Gets it? how much Does it cost? Who pays? Where Does the money Go? RAND Research Highlights . Santa monica, ca: raND .105 . See reference 94 .106 . See reference 95 .107 . prevention institute . 2008 . Our Prevention Approach. Oakland, ca . accessed Dec . 9, 2009 from http://www .preven-tionistitute .org/approach .html .108 . pathways mapping initiative . accessed on Jan . 5, 2010 from http://www .pathwaystooutcomes .org/index .cfm?fuseaction=page .viewpage&pageid=532 .109 . california Department of mental health . 2009 . Governor’s Budget: 2008-2009: Department of mental health . accessed Sept . 5, 2008 from http://www .ebudget .ca .gov/StateagencyBudgets/4000/4440/department .html#printable .110 . california mental health planning council . 2003 . California Mental Health Master Plan: A Vision for California. Sacramento, ca: california Department of mental health .111 . Furstenberg, F .; Waller, m . r .; Wang, J . 2003 . The Well-being of California’s Children . San Francisco, ca .112 . cooper, J . L . 2008 . Towards Better Behavioral Health for Children, Youth and their Families: Financing that Supports Knowledge. New york, Ny: National center for children in poverty, columbia university mailman School of public health .113 . ibid .114 . Biebel, K .; Katz-Levy, K .; Nicholson, J .; Williams, v . 2006 . using medicaid Effectively for children with Serious Emotional Disturbance (Draft): 1-55 .115 . See reference 112 .116 . Frank, r .; Glied, S . 2006 . changes in mental health Financing Since 1971: implications for policymakers and patients . Health Affairs 25(3): 601-613 .117 . Busch, S .; Barry, c . 2007 . mental health Disorders in childhood: assessing the Burden on Families . Health Affairs 26(4): 1088-1095 .118 . Budde, S .; mayer, S .; Zinn, a .; Lippold, m .; avrushin, a .; Bromberg, a .; et al . 2004 . Residential Care in Illinois: Trends and Alternatives . chicago, iL: chapin hall center for children at the university of chicago .119 . teich, J . L .; Buck, J . a .; Graver, L .; Shroeder, D .; Zheng, D . 2003 . utilization of public mental health Services by children with Serious Emotional Disturbance . Administration and Policy in Mental Health 30(6): 523-534 .
120 . Snowden, L . r .; masland, m .; Wallace, N .; Fawley-King, K .; cuellar, a . E . 2008 . increasing california children’s medicaid-financed mental health treatment by vigorously implementing medicaid’s Early periodic Screening, Diagnosis and treatment program . Medical Care Research and Review 46(6): 558-564 .121 . Dababnah, S . 2008 . personal communication with todd Sosna, may 8, 2008 .122 . cooper, J . L .; aratani, y .; Knitzer, J .; Douglass-hall, a .; masi, r .; Banghart, p .; Dababnah, S . 2008 . Unclaimed Children Revisited: The Status of Children’s Mental Health Policy in the United States . New york, Ny: National center for children in poverty, columbia university mailman School of public health .123 . coffey, r . m .; Buck, J . a .; Kassed, c .; Dilonardo, J .; Forhan, c .; marder, W . D .; et al . 2008 . transforming mental health and Substance abuse Data Systems in the united States . Psychiatric Services 59(11): 1257-1263 .124 hoagwood, K .; Jensen, p . S .; petti, t .; Burns, B . J . 1996 . Outcomes of mental health care for children and adolescents: a comprehensive conceptual model . Journal of the American Academy of Child and Adolescent Psychiatry 35(8): 1055-1063 .125 . huang, L .; Stroul, B . a .; Friedman, r .; mrazek, p .; Friesen, B .; pires, S . a .; et al . 2005 . transforming mental health care for children and their Families . American Psychologist 60(6):615-627 .126 ibid .127 . chaudry, B .; Wang, J .; Wu, S .; maglione, m .; mojica, W .; roth, E .; morton, S . c .; Shekelle, p . G . 2006 . Systematic review: impact of health information technology on Quality, Efficiency, and costs of medical care Annual Internal Medicine 144: E12-E22 .128 . Jha, a . K .; Ferris, t . G .; Donelan, K .; Desroches, c .; Shields, a .; rosenbaum, S .; Blumenthal, D . 2006 . how common are Electronic health records in the united States? a Summary of the Evidence . Health Affairs 10/11/2006 Web Exclusive: W496-507 .129 . abe-Kim, J .; takeuchi, D . t .; hong, S .; Zane, N .; Sue, S .; Spencer, m . S .; et al . 2007 . use of mental health-related Services among immigrant and u .S .-born asian americans: results from the National Latino and asian american Study . American Journal of Public Health 97(1): 91-98 .130 . Sue, S .; Fujino, D . c .; hu, L .; takeuchi, D . t .; Zane, N . 1991 . community mental health Services for Ethnic minority Groups: a test of the cultural responsiveness hypothesis . Journal of Consulting and Clinical Psychology 59(4): 533-540 .131 . Lopez, a . 2003 . Californian’s Use of English and Other Languages: Census 2000 Summary . Stanford, ca: center for comparative Studies in race/Ethnicity, Stanford university .
134
APPeNdix 1
National Center for Children in Poverty Unclaimed Children Revisited – California Case Study Strategic Advisory Work Group
William arroyo, mDmedical Directorchild youth and Family program administrationLos angeles county Department of mental health
Bill carter, LcSWDeputy Directorcalifornia institute for mental health
Sai-Ling chan-Sew, LcSWDirectorchildren, youth and Family Services
Jennifer clancyExecutive Directorvillage care international, inc .
rachel Guerrero, LcSW chief, Office of multicultural ServicesState Department mental health
John Landsverk, phD Senior research Scientistchild and adolescent Services research centerchildren’s hospital of San Diego
rosa ana Lozada-Garcia, LcSWchief Executive Officer – harmonium main Office
perry Jonespacific News Servicesyouth communications team
abram rosenblatt, phDprofessor, Department of psychiatryuniversity of california, San Francisco
Gale WalkerBronze trianglecommunity Development corporation
rosa E . Warder, mFahealth EducatorDirector Family partnership program,alameda county Behavioral health care andunited advocates for children and Families
constance m . Weisner, Drph, mSWprofessor, Department of psychiatryuniversity of california, San Francisco
captain youngyouth advocate

National Center for Children in Poverty Unclaimed Children Revisited: California Case Study 135
APPeNdix 2
National Center for Children in Poverty Unclaimed Children Revisited – California Case Study Focus Group and interview Facilitators
Bo Thao
Elizabeth Bustos
Liz marucheau
Leticia mendoza
celeste Buckley
Janice cooper
Sarah Dababnah
tara Simitian
Jilly Becerra
Lola adedokun
mark Walden
Jennifer cheng
Esperanza Sanchez
carole currie
carol Wahpepah
carmen pineda
Lynn DeLapp
Ellen valdellon
mel valdellon
Beverly chan
Omar Lopez
rodrigo alatriste-Diaz
Thuy Doan
teri toothman
patricia Seo
Kathleen Bowers
pam hawkins
Sophya chum
Jing Guo
rachel mcLean
yumiko aratani
Gabriela Garcia
Njoke Thomas
alla arzumanyan
Sivutha Saro
merced Barrera
allegra harrison
patricia Johnson
Felica Jones
Ben Winker
136
Mental Health Services for Special Education Students: AB 3632; AB 2726; Chapter 26.5Federal law, pursuant to the individuals with Disabilities Education act (iDEa), requires states to provide free appro-priate public education to students with disabilities in their localities . in 1982, christopher t . v . San Francisco unified School District found the defendants at fault in not refer-ring special education students in need of residential place-ments . This triggered the passage of aB 3632 in 1984, which designated the county mental health departments as having the responsibility for special education students with serious emotional disturbances and individualized Education plans (iEps) . aB 2726 expanded the specifications of the 1984 legislation by clarifying interagency collaborations and responsibilities for a student in need of mental health services . These mandates are now part of the california Government code, chapter 26 .5 . School districts must now identify and refer the students to the county mental health authority . The county mental health department then has 50 days to conduct an assessment . in collaboration with the student’s iEp team, mental health services are offered . These services are generally traditional (such as individual therapy; medication support) and do not include services such as Wraparound . however, residential placement is an option if less intensive services fail to benefit the student . The iEps are reviewed on a regular basis . There is also a process for disputes and conflict resolution .
Community-Based Mental Health System: Short-Doyle Act/ Bronzan-McCorquodale ActThe State of california passed the Short-Doyle act in 1957, with the intent of creating more of a community-based system for mental health service delivery . The act created the structure and funding streams of local mental health Boards . The early 1990s ushered in the Bronzan-mccorquodale act, which clari-fied rules and regulations from the Short-Doyle act and gave more responsibilities to the counties . it also increased consumer and family participation on the mental health Boards to ensure a diverse representation of perspectives .
Children’s System of Care: Children’s Mental Health Services Act The “System of care” philosophy integrates multiple disciplines and methods of service delivery to create a holistic approach to care . a System of care recognizes the importance of a child’s caregivers, environment, community, culture, and various other factors in improving outcomes . The State of california codified this approach to service delivery for children and youth with SED in 1984 through aB 3920 . Since the initial legislation, the act has been amended three times in order to expand Systems of care across the State .
Wraparound: SB 163SB 163 (1997) allows counties to use existing foster care and adoption assistance dollars to implement five-year Wraparound pilots . The goals of the pilots are to keep children and youth in home, out of group home care, or to return them to home settings as soon as possible . Wraparound accomplishes these goals by engaging children and youth with SED and their fami-lies in an individualized care plan that builds on their strengths and involves a number of service professionals in the process .
Early and Periodic Screening, Diagnosis and Treatment (EPSDT)EpSDt is available for medicaid-eligible children across the united States . The intent of EpSDt is to improve low-income children’s access to preventive, diagnostic, and treatment services (ages 0 to 21) . in 1993, in a lawsuit against the california Department of health Services (DhS), Smith v . Belshe, a group of attorneys successfully sued to expand EpSDt coverage . This led to a partnership between DhS and the State Department of mental health, and an increase in funding for mental health services for eligible children and youth .
Foster Care Mental Health: SB 933, Chapter 311SB 933, passed in 1998, had a significant impact on out-of-state placement for children and youth in the foster care system, as well as interagency responsibilities and collaborations for this population . among other provisions, the legislation required formation of a multi-disciplinary team in the county to deter-mine the suitability of out-of-state placement on a case-by-case basis . SB 933 also put stricter restrictions on which out-of-state facilities to use, making it required that the host state/agency meet california licensing regulations . The State Department of Social Services, in response to the legislation, also developed best practice guidelines for assessing children, youth, and fami-lies being served by the child welfare system .
Proposition 63 Mental Health Services Actproposition 63 was passed by california voters in 2004 and became known as the mental health Services act (mhSa) . it highlighted the prevalence of adult and child mental health disorders in the general population and the importance of prevention and early intervention and cultural and linguistic competence . californians with personal incomes of $1 million or more are taxed one percent, which is projected to make $1 .5 billion available in 2007-08 (mental health Services act progress, may 2008, ca State Department of mental health) . mhSa focuses on six primary areas: 1 . community program planning2 . community Services and Supports (cSS; System of care
Services) for: – children – youth, including transition age
APPeNdix 3
Overview of Policies and legislation Mentioned by System leaders
National Center for Children in Poverty Unclaimed Children Revisited: California Case Study 137
– adults – Older adults3 . capital Facilities and information technology4 . Education and training programs5 . prevention and Early intervention programs6 . innovative programs
Given these ambitious goals, the Dmh implemented a gradual implementation of mhSa, with the end objective being a full continuum of care, from prevention to intensive services . The first phase, community program planning, entailed a series of community stakeholder meetings and other processes to determine how the use the forthcoming funds . Each county was required to submit a Three-year program and Expenditure plan to the State Department of mental health (Dmh) to implement the community Support and Services (cSS) component . Dmh mandated the following concepts be included in the cSS Three-year plans:1 . community/stakeholder collaboration;2 . cultural competence;3 . consumer- and family-driven services;4 . Wellness focus (recovery model, resilience); and5 . integrated/coordinated service experiences
While the Dmh administers the funds, the mhSa Oversight and accountability commission also reviews the county plans and approves expenditures . Once the funds are distributed to the counties, the county mental authority has the responsi-bility for budget allocation and collaboration with providers and other local systems . counties specify funding amount for each type of service (Full Service partnerships, General System Development, or Outreach and Engagement) and target popu-lation (children; youth, including transition age; adults; and older adults); however, mhSa funds cannot supplant existing programs . programs and services vary by county and details of each county’s proposed plans appear in the county-specific sections in chapter 2 .
Quote from Dmh:“Individuals accessing services funded by the Mental Health Services Act may have voluntary or involuntary legal status which shall not affect their ability to access the expanded services under this Act. Services provided in jails and juvenile hall must be for the purpose of facilitating discharge.”
Foster Care Mental Health Litigation: Katie A. v. BontáKatie a . v . Bontá, a 2002 class action lawsuit against the county of Los angeles and the State of california, complained that appropriate mental health services were not being provided to children in the foster care system . Katie a ., a 15 year-old at the time of the lawsuit, was placed 37 times in the past 11 years, mostly in non-family settings, and never received adequate services for her emotional and psychological issues . Los angeles county settled in 2003, agreeing that children and youth in the custody of the Department of children and Family Services need stable, long-term placements . The settlement also stipulated that children who are in or at risk for being place in the foster care system in Los angeles county will receive appropriate mental health services in a home-like setting when necessary . The county also agreed to create a six-member expert board to advise them on implementing the settlement . The State of california has yet to settle the lawsuit .
Lanterman-Petris-Short ActThe Lanterman-petris-Short act, proposed by three california State assembleymen and signed into law by Governor ronald reagan in 1967, focused on eliminating the inappropriate use of involuntary confinement of persons with mental illness, developmental disabilities, or substance abuse disorders . The act also protected individuals with these disorders through a judicial review process . The legislation focuses on providing appropriate, prompt behavioral health services using existing resources . Section 5150 of the law does provide officers and other professionals the ability to place individuals on a 72-hour involuntary hold if they pose a threat to themselves or others .
Lanterman Developmental Disabilities Act (AB 846)The Lanterman act was authored by assembleyman Frank D . Lanterman in 1973 . The legislation mandated that individuals with developmental disabilities receive the same legal rights as others in the community, including the rights to a free educa-tion and to the least restrictive settings possible . This mandate is primarily carried out through california regional center system . The 21 regional centers contract with the california State Department of Developmental Services and coordinates services for children, youth and adults with developmental disabilities, as well as their families . The regional centers are private, non-profit agencies who provide most services free or at low cost .
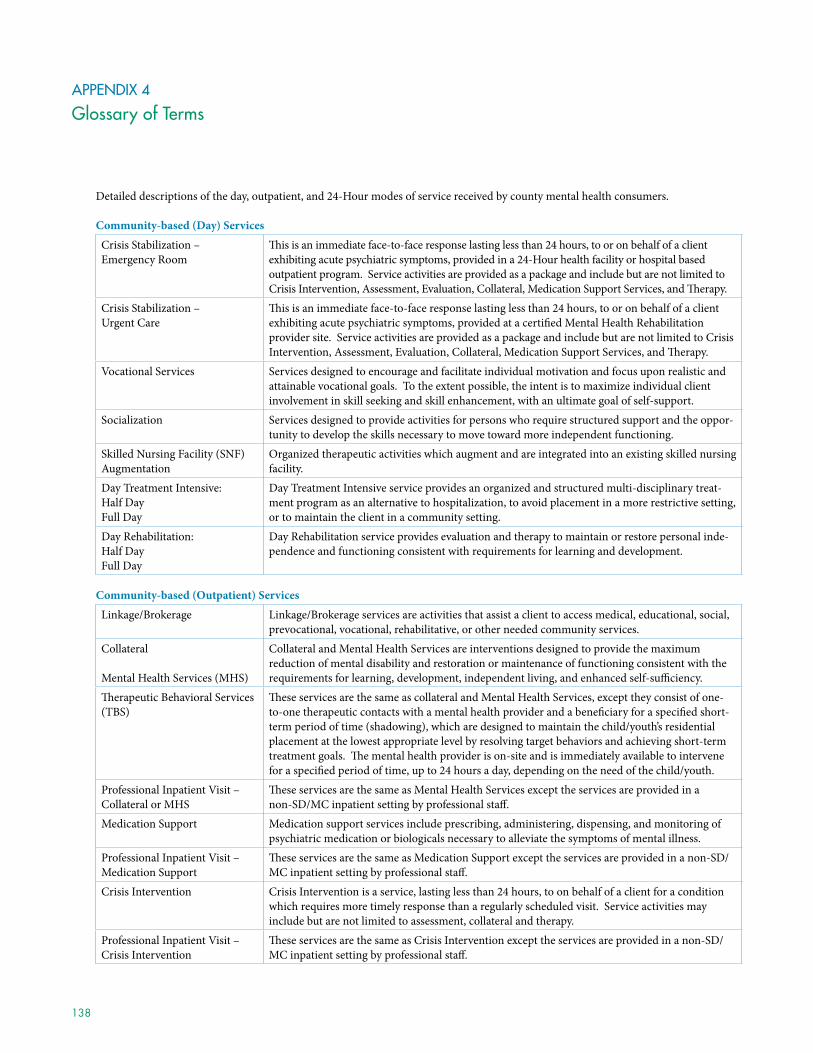
138
Detailed descriptions of the day, outpatient, and 24-hour modes of service received by county mental health consumers .
Community-based (Day) Services
crisis Stabilization – Emergency room
This is an immediate face-to-face response lasting less than 24 hours, to or on behalf of a client exhibiting acute psychiatric symptoms, provided in a 24-hour health facility or hospital based outpatient program . Service activities are provided as a package and include but are not limited to crisis intervention, assessment, Evaluation, collateral, medication Support Services, and Therapy .
crisis Stabilization – urgent care
This is an immediate face-to-face response lasting less than 24 hours, to or on behalf of a client exhibiting acute psychiatric symptoms, provided at a certified mental health rehabilitation provider site . Service activities are provided as a package and include but are not limited to crisis intervention, assessment, Evaluation, collateral, medication Support Services, and Therapy .
vocational Services Services designed to encourage and facilitate individual motivation and focus upon realistic and attainable vocational goals . to the extent possible, the intent is to maximize individual client involvement in skill seeking and skill enhancement, with an ultimate goal of self-support .
Socialization Services designed to provide activities for persons who require structured support and the oppor-tunity to develop the skills necessary to move toward more independent functioning .
Skilled Nursing Facility (SNF) augmentation
Organized therapeutic activities which augment and are integrated into an existing skilled nursing facility .
Day treatment intensive:half DayFull Day
Day treatment intensive service provides an organized and structured multi-disciplinary treat-ment program as an alternative to hospitalization, to avoid placement in a more restrictive setting, or to maintain the client in a community setting .
Day rehabilitation:half Day Full Day
Day rehabilitation service provides evaluation and therapy to maintain or restore personal inde-pendence and functioning consistent with requirements for learning and development .
Community-based (Outpatient) Services
Linkage/Brokerage Linkage/Brokerage services are activities that assist a client to access medical, educational, social, prevocational, vocational, rehabilitative, or other needed community services .
collateral
mental health Services (mhS)
collateral and mental health Services are interventions designed to provide the maximum reduction of mental disability and restoration or maintenance of functioning consistent with the requirements for learning, development, independent living, and enhanced self-sufficiency .
Therapeutic Behavioral Services (tBS)
These services are the same as collateral and mental health Services, except they consist of one-to-one therapeutic contacts with a mental health provider and a beneficiary for a specified short-term period of time (shadowing), which are designed to maintain the child/youth’s residential placement at the lowest appropriate level by resolving target behaviors and achieving short-term treatment goals . The mental health provider is on-site and is immediately available to intervene for a specified period of time, up to 24 hours a day, depending on the need of the child/youth .
professional inpatient visit – collateral or mhS
These services are the same as mental health Services except the services are provided in a non-SD/mc inpatient setting by professional staff .
medication Support medication support services include prescribing, administering, dispensing, and monitoring of psychiatric medication or biologicals necessary to alleviate the symptoms of mental illness .
professional inpatient visit – medication Support
These services are the same as medication Support except the services are provided in a non-SD/mc inpatient setting by professional staff .
crisis intervention crisis intervention is a service, lasting less than 24 hours, to on behalf of a client for a condition which requires more timely response than a regularly scheduled visit . Service activities may include but are not limited to assessment, collateral and therapy .
professional inpatient visit – crisis intervention
These services are the same as crisis intervention except the services are provided in a non-SD/mc inpatient setting by professional staff .
APPeNdix 4
Glossary of Terms
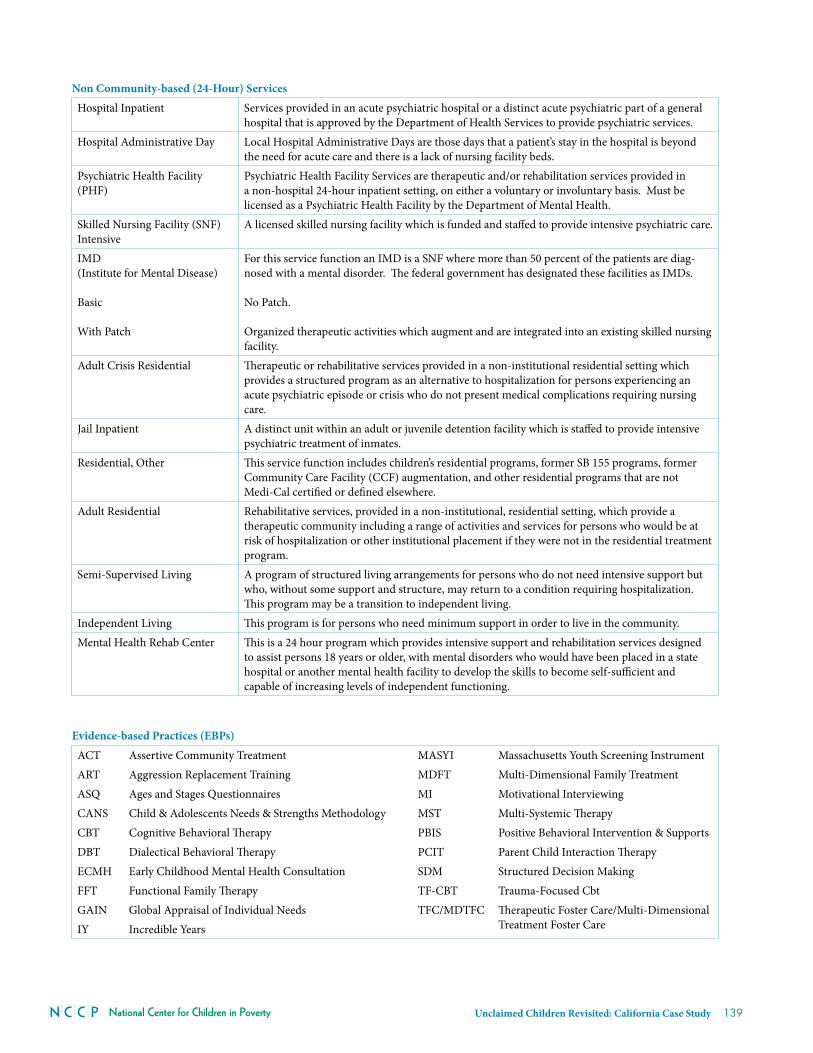
National Center for Children in Poverty Unclaimed Children Revisited: California Case Study 139
Non Community-based (24-Hour) Services
hospital inpatient Services provided in an acute psychiatric hospital or a distinct acute psychiatric part of a general hospital that is approved by the Department of health Services to provide psychiatric services .
hospital administrative Day Local hospital administrative Days are those days that a patient’s stay in the hospital is beyond the need for acute care and there is a lack of nursing facility beds .
psychiatric health Facility (phF)
psychiatric health Facility Services are therapeutic and/or rehabilitation services provided in a non-hospital 24-hour inpatient setting, on either a voluntary or involuntary basis . must be licensed as a psychiatric health Facility by the Department of mental health .
Skilled Nursing Facility (SNF) intensive
a licensed skilled nursing facility which is funded and staffed to provide intensive psychiatric care .
imD (institute for mental Disease)
Basic
With patch
For this service function an imD is a SNF where more than 50 percent of the patients are diag-nosed with a mental disorder . The federal government has designated these facilities as imDs . No patch . Organized therapeutic activities which augment and are integrated into an existing skilled nursing facility .
adult crisis residential Therapeutic or rehabilitative services provided in a non-institutional residential setting which provides a structured program as an alternative to hospitalization for persons experiencing an acute psychiatric episode or crisis who do not present medical complications requiring nursing care .
Jail inpatient a distinct unit within an adult or juvenile detention facility which is staffed to provide intensive psychiatric treatment of inmates .
residential, Other This service function includes children’s residential programs, former SB 155 programs, former community care Facility (ccF) augmentation, and other residential programs that are not medi-cal certified or defined elsewhere .
adult residential rehabilitative services, provided in a non-institutional, residential setting, which provide a therapeutic community including a range of activities and services for persons who would be at risk of hospitalization or other institutional placement if they were not in the residential treatment program .
Semi-Supervised Living a program of structured living arrangements for persons who do not need intensive support but who, without some support and structure, may return to a condition requiring hospitalization . This program may be a transition to independent living .
independent Living This program is for persons who need minimum support in order to live in the community .mental health rehab center This is a 24 hour program which provides intensive support and rehabilitation services designed
to assist persons 18 years or older, with mental disorders who would have been placed in a state hospital or another mental health facility to develop the skills to become self-sufficient and capable of increasing levels of independent functioning .
Evidence-based Practices (EBPs)
act assertive community treatment maSyi massachusetts youth Screening instrument art aggression replacement training mDFt multi-Dimensional Family treatmentaSQ ages and Stages Questionnaires mi motivational interviewingcaNS child & adolescents Needs & Strengths methodology mSt multi-Systemic TherapycBt cognitive Behavioral Therapy pBiS positive Behavioral intervention & SupportsDBt Dialectical Behavioral Therapy pcit parent child interaction TherapyEcmh Early childhood mental health consultation SDm Structured Decision makingFFt Functional Family Therapy tF-cBt trauma-Focused cbtGaiN Global appraisal of individual Needs tFc/mDtFc Therapeutic Foster care/multi-Dimensional
treatment Foster careiy incredible years
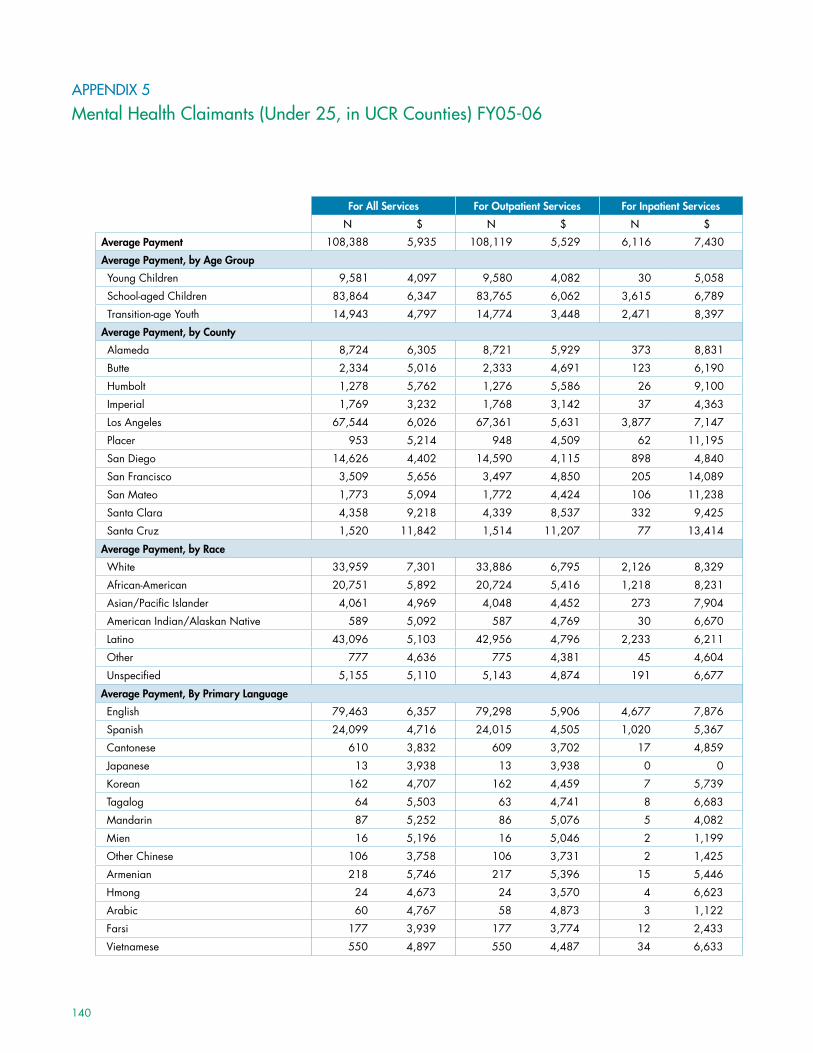
140
for all services for Outpatient services for inpatient services
N $ N $ N $
average Payment 108,388 5,935 108,119 5,529 6,116 7,430
average Payment, by age group
Young Children 9,581 4,097 9,580 4,082 30 5,058
School-aged Children 83,864 6,347 83,765 6,062 3,615 6,789
Transition-age Youth 14,943 4,797 14,774 3,448 2,471 8,397
average Payment, by County
Alameda 8,724 6,305 8,721 5,929 373 8,831
Butte 2,334 5,016 2,333 4,691 123 6,190
Humbolt 1,278 5,762 1,276 5,586 26 9,100
Imperial 1,769 3,232 1,768 3,142 37 4,363
Los Angeles 67,544 6,026 67,361 5,631 3,877 7,147
Placer 953 5,214 948 4,509 62 11,195
San Diego 14,626 4,402 14,590 4,115 898 4,840
San Francisco 3,509 5,656 3,497 4,850 205 14,089
San Mateo 1,773 5,094 1,772 4,424 106 11,238
Santa Clara 4,358 9,218 4,339 8,537 332 9,425
Santa Cruz 1,520 11,842 1,514 11,207 77 13,414
average Payment, by Race
White 33,959 7,301 33,886 6,795 2,126 8,329
African-American 20,751 5,892 20,724 5,416 1,218 8,231
Asian/Pacific Islander 4,061 4,969 4,048 4,452 273 7,904
American Indian/Alaskan Native 589 5,092 587 4,769 30 6,670
Latino 43,096 5,103 42,956 4,796 2,233 6,211
Other 777 4,636 775 4,381 45 4,604
Unspecified 5,155 5,110 5,143 4,874 191 6,677
average Payment, By Primary language
English 79,463 6,357 79,298 5,906 4,677 7,876
Spanish 24,099 4,716 24,015 4,505 1,020 5,367
Cantonese 610 3,832 609 3,702 17 4,859
Japanese 13 3,938 13 3,938 0 0
Korean 162 4,707 162 4,459 7 5,739
Tagalog 64 5,503 63 4,741 8 6,683
Mandarin 87 5,252 86 5,076 5 4,082
Mien 16 5,196 16 5,046 2 1,199
Other Chinese 106 3,758 106 3,731 2 1,425
Armenian 218 5,746 217 5,396 15 5,446
Hmong 24 4,673 24 3,570 4 6,623
Arabic 60 4,767 58 4,873 3 1,122
Farsi 177 3,939 177 3,774 12 2,433
Vietnamese 550 4,897 550 4,487 34 6,633
APPeNdix 5
Mental Health Claimants (Under 25, in UCR Counties) Fy05-06
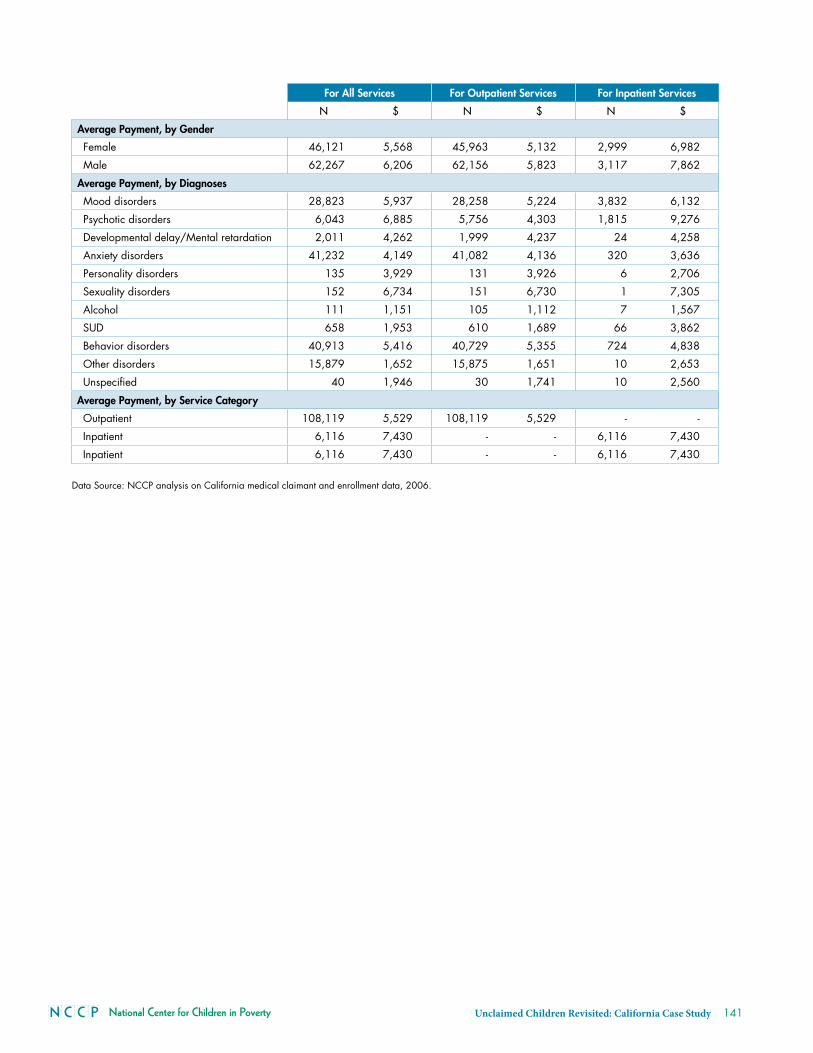
National Center for Children in Poverty Unclaimed Children Revisited: California Case Study 141
for all services for Outpatient services for inpatient services
N $ N $ N $
average Payment, by gender
Female 46,121 5,568 45,963 5,132 2,999 6,982
Male 62,267 6,206 62,156 5,823 3,117 7,862
average Payment, by diagnoses
Mood disorders 28,823 5,937 28,258 5,224 3,832 6,132
Psychotic disorders 6,043 6,885 5,756 4,303 1,815 9,276
Developmental delay/Mental retardation 2,011 4,262 1,999 4,237 24 4,258
Anxiety disorders 41,232 4,149 41,082 4,136 320 3,636
Personality disorders 135 3,929 131 3,926 6 2,706
Sexuality disorders 152 6,734 151 6,730 1 7,305
Alcohol 111 1,151 105 1,112 7 1,567
SUD 658 1,953 610 1,689 66 3,862
Behavior disorders 40,913 5,416 40,729 5,355 724 4,838
Other disorders 15,879 1,652 15,875 1,651 10 2,653
Unspecified 40 1,946 30 1,741 10 2,560
average Payment, by service Category
Outpatient 108,119 5,529 108,119 5,529 - -
Inpatient 6,116 7,430 - - 6,116 7,430
Inpatient 6,116 7,430 - - 6,116 7,430
Data Source: NCCP analysis on California medical claimant and enrollment data, 2006.
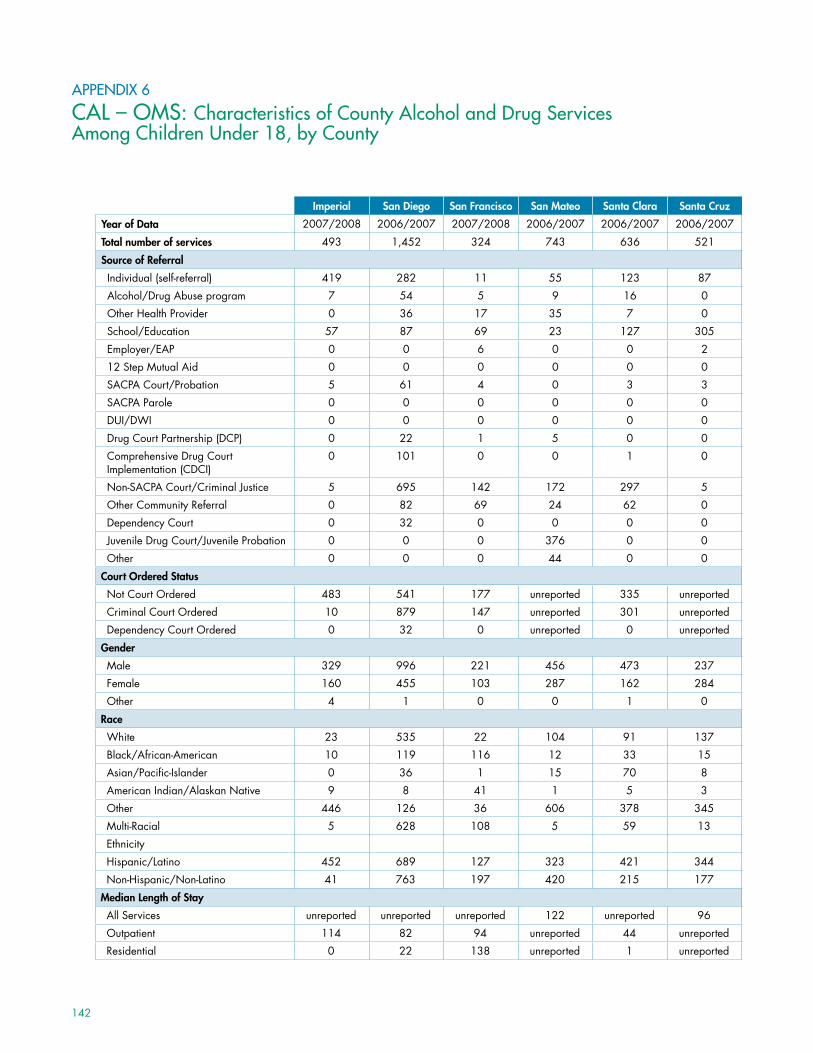
142
imperial san diego san francisco san Mateo santa Clara santa Cruz
year of data 2007/2008 2006/2007 2007/2008 2006/2007 2006/2007 2006/2007
Total number of services 493 1,452 324 743 636 521
source of Referral
Individual (self-referral) 419 282 11 55 123 87
Alcohol/Drug Abuse program 7 54 5 9 16 0
Other Health Provider 0 36 17 35 7 0
School/Education 57 87 69 23 127 305
Employer/EAP 0 0 6 0 0 2
12 Step Mutual Aid 0 0 0 0 0 0
SACPA Court/Probation 5 61 4 0 3 3
SACPA Parole 0 0 0 0 0 0
DUI/DWI 0 0 0 0 0 0
Drug Court Partnership (DCP) 0 22 1 5 0 0
Comprehensive Drug Court Implementation (CDCI)
0 101 0 0 1 0
Non-SACPA Court/Criminal Justice 5 695 142 172 297 5
Other Community Referral 0 82 69 24 62 0
Dependency Court 0 32 0 0 0 0
Juvenile Drug Court/Juvenile Probation 0 0 0 376 0 0
Other 0 0 0 44 0 0
Court Ordered status
Not Court Ordered 483 541 177 unreported 335 unreported
Criminal Court Ordered 10 879 147 unreported 301 unreported
Dependency Court Ordered 0 32 0 unreported 0 unreported
gender
Male 329 996 221 456 473 237
Female 160 455 103 287 162 284
Other 4 1 0 0 1 0
Race
White 23 535 22 104 91 137
Black/African-American 10 119 116 12 33 15
Asian/Pacific-Islander 0 36 1 15 70 8
American Indian/Alaskan Native 9 8 41 1 5 3
Other 446 126 36 606 378 345
Multi-Racial 5 628 108 5 59 13
Ethnicity
Hispanic/Latino 452 689 127 323 421 344
Non-Hispanic/Non-Latino 41 763 197 420 215 177
Median length of stay
All Services unreported unreported unreported 122 unreported 96
Outpatient 114 82 94 unreported 44 unreported
Residential 0 22 138 unreported 1 unreported
APPeNdix 6
CAl – OMS: Characteristics of County Alcohol and drug Services Among Children Under 18, by County
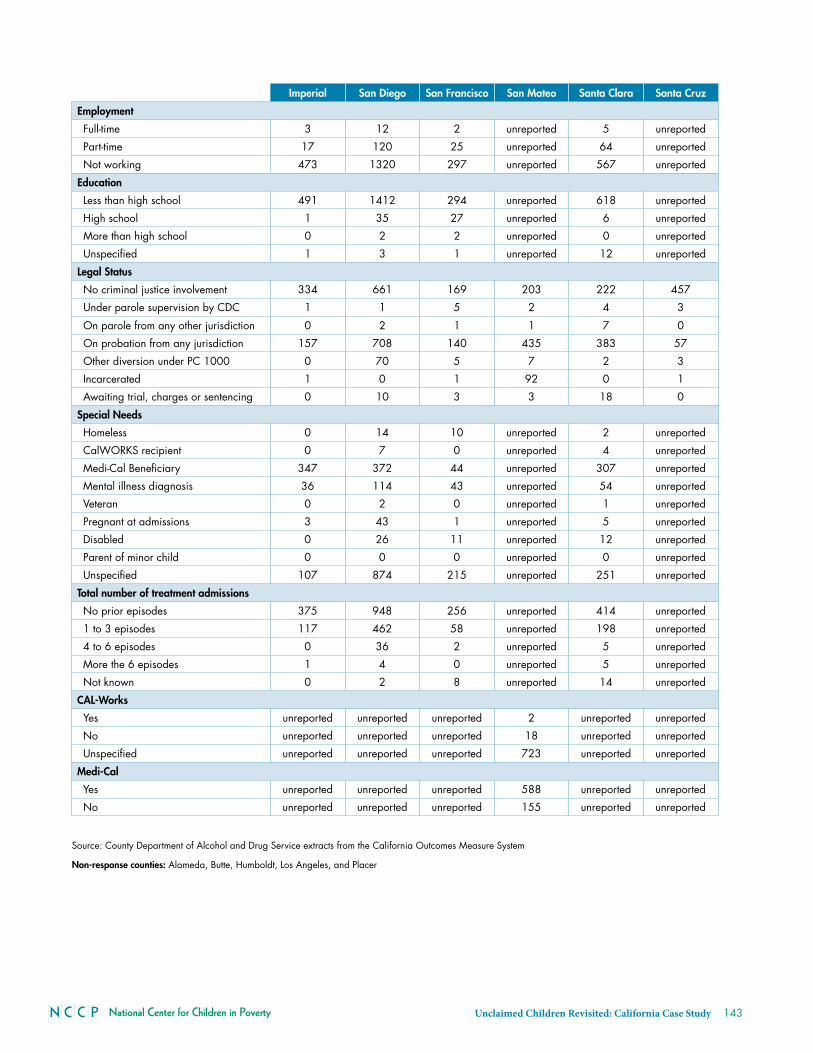
National Center for Children in Poverty Unclaimed Children Revisited: California Case Study 143
imperial san diego san francisco san Mateo santa Clara santa Cruz
Employment
Full-time 3 12 2 unreported 5 unreported
Part-time 17 120 25 unreported 64 unreported
Not working 473 1320 297 unreported 567 unreported
Education
Less than high school 491 1412 294 unreported 618 unreported
High school 1 35 27 unreported 6 unreported
More than high school 0 2 2 unreported 0 unreported
Unspecified 1 3 1 unreported 12 unreported
legal status
No criminal justice involvement 334 661 169 203 222 457
Under parole supervision by CDC 1 1 5 2 4 3
On parole from any other jurisdiction 0 2 1 1 7 0
On probation from any jurisdiction 157 708 140 435 383 57
Other diversion under PC 1000 0 70 5 7 2 3
Incarcerated 1 0 1 92 0 1
Awaiting trial, charges or sentencing 0 10 3 3 18 0
special needs
Homeless 0 14 10 unreported 2 unreported
CalWORKS recipient 0 7 0 unreported 4 unreported
Medi-Cal Beneficiary 347 372 44 unreported 307 unreported
Mental illness diagnosis 36 114 43 unreported 54 unreported
Veteran 0 2 0 unreported 1 unreported
Pregnant at admissions 3 43 1 unreported 5 unreported
Disabled 0 26 11 unreported 12 unreported
Parent of minor child 0 0 0 unreported 0 unreported
Unspecified 107 874 215 unreported 251 unreported
Total number of treatment admissions
No prior episodes 375 948 256 unreported 414 unreported
1 to 3 episodes 117 462 58 unreported 198 unreported
4 to 6 episodes 0 36 2 unreported 5 unreported
More the 6 episodes 1 4 0 unreported 5 unreported
Not known 0 2 8 unreported 14 unreported
Cal-Works
Yes unreported unreported unreported 2 unreported unreported
No unreported unreported unreported 18 unreported unreported
Unspecified unreported unreported unreported 723 unreported unreported
Medi-Cal
Yes unreported unreported unreported 588 unreported unreported
No unreported unreported unreported 155 unreported unreported
Source: County Department of Alcohol and Drug Service extracts from the California Outcomes Measure System
non-response counties: Alameda, Butte, Humboldt, Los Angeles, and Placer

215 west 125th street, New York, NY 10027 tel 646-284-9600 n fax 646-284-9623
www.nccp.org