ueZnk fu;a=.k izkf/kdj.k - Narmada Control Authority
110
Amarkantak BARGI INDIRA SAGAR SARDAR SAROVAR Bhopal, January -2018 FOR OFFICIAL CIRCULATION ONLY ueZnk fu;a=.k izkf/kdj.k Narmada Control Authority ueZnk dNkj esa ljnkj ljksoj cka/k LFky rd dk Okkf"kZd ty ys[kk ANNUAL WATER ACCOUNT OF NARMADA BASIN UPTO SARDAR SAROVAR DAM SITE Tky Ok"kZ 1 tqykbZ] 2015 & 30 twu] 2016 Water Year 1 st July, 2015 - 30 th June, 2016 MATIYARI BARNA SUKTA KOLAR TAWA Hkksiky] tuojh - 2018 OMKARESHWAR MAHESHWAR MAN JOBAT G U L F O F C A M B A Y
-
Upload
khangminh22 -
Category
Documents
-
view
1 -
download
0
Transcript of ueZnk fu;a=.k izkf/kdj.k - Narmada Control Authority

Amarkantak
BARGI
INDIRA
SAGAR
SARDAR
SAROVAR
Bhopal, January -2018
FOR OFFICIAL CIRCULATION ONLY
ueZnk fu;a=.k izkf/kdj.k
Narmada Control Authority
ueZnk dNkj esa ljnkj ljksoj cka/k LFky rd dk Okkf"kZd ty ys[kk
ANNUAL WATER ACCOUNT OF NARMADA BASIN UPTO
SARDAR SAROVAR DAM SITE
Tky Ok"kZ 1 tqykbZ] 2015 & 30 twu] 2016Water Year 1st July, 2015 - 30th June, 2016
MATIYARI
BARNA
SUKTA
KOLAR
TAWA
Hkksiky] tuojh - 2018
OMKARESHWAR
MAHESHWAR
MAN JOBAT
GULF
OF
CAMBAY

Narmada Control Authority
ueZnk dNkj esa ljnkj ljksoj cka/k LFky rd dk Okkf"kZd ty ys[kk
ANNUAL WATER ACCOUNT OF NARMADA BASIN UPTO
SARDAR SAROVAR DAM SITE
Tky Ok"kZ 1 tqykbZ] 2015 & 30 twu] 2016 Water Year 1st July, 2015 - 30th June, 2016
FOR OFFICIAL CIRCULATION ONLY
ueZnk fu;a=.k izkf/kdj.k
Hkksiky] tuojh - 2018 Bhopal, January - 2018

SL No SUBJECT Page No.
1 NWDT Award stipulations on Water Accounting in Narmada River Basin 1 to 3
2 Methedology for assesment of utilizable flow in Narmada basin 4
3 Statement showing year wise water utilization in Narmada basin up to Sardar Sarovar/Garudeshwar at a Glance - Overview-I 5
4 Utilizable flow of Narmada river and water utilization by Party States - Graph 6
5Statement showing State wise utilizable flow and allocated share in Namada Basin during the water year 2015-16 at a glance - Overview
– II 7
6 Statement showing State wise water withdrawals during the year 2015-16 at a glance - Overview - III (A) 8
7 Statement Showing utilizable flow at SSP to be shared amongst the party states, during water year 2015-16 - Overview-III(B) 9
8 State wise water utilization in MAF and category wise utilization by party States - Plate - I 10
9 Overview of Annual Water Account upto Sardar Sarovar Dam for the Water Year 2015-16 - Overview - IV 11
10 Zone wise utilizable flow at cardinal station - Plate - 2 12
11 Zone wise water utilization and utilization of utilizable flow in MAF - Plate - 3 13
12 Index map of Narmada Basin - Map - 1 14
ZONE – I ( NARMADA UP TO BARGI PROJECT)
13Map showing location of existing and ongoing Major & Medium Projects and Irrigation Division wise jurisdiction for Minor Irrigation
Schemes Zone – I (upto Bargi) - Map - 2 15
14 Summary of utilizable flow upto Bargi Reservoir 16
15 Break-up of sector wise water utilization from major, medium projects & minor schemes 17
16 Outflow from Power house and spillway from Bargi Reservoir. 18
17 Upstream utilization from Major & Medium Projects upto Bargi. 19
18 Water utilization from Major & Medium Irrigation Projects during Water Year 2015-16.
( i ) Bargi & Bargi Diversion Project 20
( ii ) Matiyari Project 21
( iii ) Jalgaon & Banjar Project 22
(iv) Bichhiya & Dhuandhar Project 23
ANNUAL WATER ACCOUNT OF NARMADA BASIN UPTO SARDAR SAROVAR DAM SITE DURING THE WATER YEAR 2015-16
CONTENTS
(1)

SL No SUBJECT Page No.
19 Crop wise actual and planned area irrigated through Major & Medium Projects for the Water Year 2015-16 for Kharif. 24
20 Crop wise actual and planned area irrigated through Major & Medium Projects for the Water Year 2015-16 for Rabi & Hot weather. 25
21 Season wise actual area irrigated and water utilization through Minor Surface Gravity schemes during the Water Year 2015-16. 26
22 Season wise actual area irrigated and water utilization through Lift scheme during the Water Year 2015-16. 27
23 Carry over live storage and difference in live storage for the Major & Medium Irrigation Projects 28
ZONE –II (BARGI to BURMANGHAT)
24Map showing location of existing and ongoing Major & Medium Projects and Irrigation Division wise jurisdiction for Minor Irrigation
Schemes Zone-II (upto Burmanghat) - Map -3 29
25 Summary of utilizable flow upto Burmanghat. 30
26 Break-up of sector wise water utilization from major, medium projects & minor schemes 31
27 Observed flow at Burmanghat 32
28 Upstream utilization from Major & Medium Projects upto Burmanghat. 33
29 Water utilization from Major & Medium Projects during water year 2015-16.
(i) Mehgaon Tola Tank & Pariat Tank 34
(ii) Barnoo & Bohribund Tank 35
( iii ) Madai Tank 36
30 Crop wise actual and planned area irrigated through Major & Medium Projects for the Water Year 2015-16 for Kharif. 37
31 Crop wise actual and planned area irrigated through Major & Medium Projects for the Water Year 2015-16 for Rabi & Hot weather. 38
32 Season wise actual area irrigated and water utilization through Minor Surface Gravity schemes during the Water Year 2015-16. 39
33Season wise actual area irrigated and water utilization through Lift scheme (Irrigation & Water Supply Schemes) during the Water Year
2015-16. 40
34 Carry over live storage and difference in live storage for the Major & Medium Irrigation Projects. 41
ZONE –III ( BURMANGHAT to HOSHANGABAD)
35Map showing location of existing and ongoing Major & Medium Projects and Irrigation Division wise jurisdiction for Minor Irrigation
Schemes Zone-III (upto Hoshangabad) - Map -4 42
36 Summary of utilizable flow upto Hoshangabad. 43
37 Break-up of sector wise water utilization from major, medium projects & minor schemes 44
38 Observed flow at Hoshangabad. 45
39 Upstream utilization from Major & Medium Projects upto Hoshangabad 46
40 Water utilization from Major & Medium Projects during water year 2015-16.
(2)
SL No SUBJECT Page No.
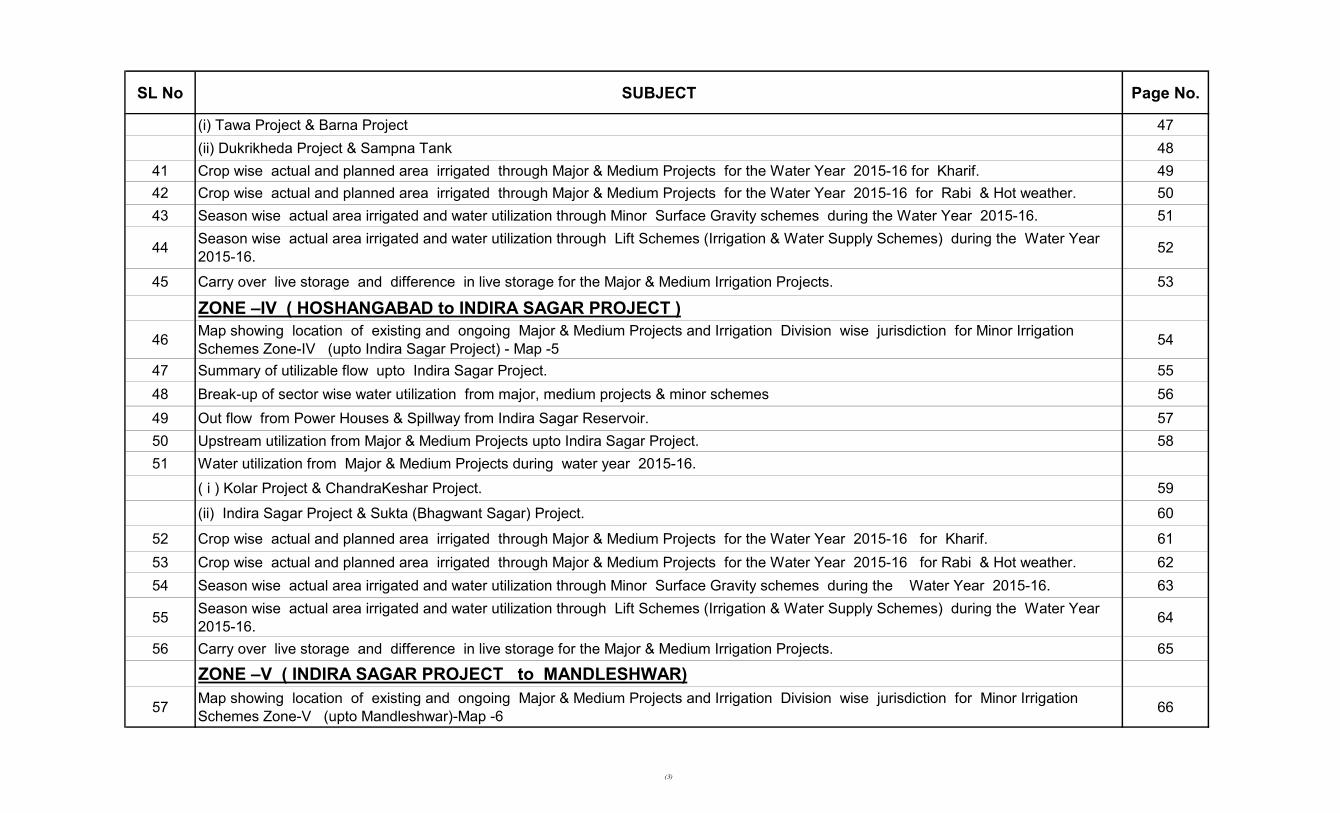
(i) Tawa Project & Barna Project 47
(ii) Dukrikheda Project & Sampna Tank 48
41 Crop wise actual and planned area irrigated through Major & Medium Projects for the Water Year 2015-16 for Kharif. 49
42 Crop wise actual and planned area irrigated through Major & Medium Projects for the Water Year 2015-16 for Rabi & Hot weather. 50
43 Season wise actual area irrigated and water utilization through Minor Surface Gravity schemes during the Water Year 2015-16. 51
44Season wise actual area irrigated and water utilization through Lift Schemes (Irrigation & Water Supply Schemes) during the Water Year
2015-16.52
45 Carry over live storage and difference in live storage for the Major & Medium Irrigation Projects. 53
ZONE –IV ( HOSHANGABAD to INDIRA SAGAR PROJECT )
46Map showing location of existing and ongoing Major & Medium Projects and Irrigation Division wise jurisdiction for Minor Irrigation
Schemes Zone-IV (upto Indira Sagar Project) - Map -554
47 Summary of utilizable flow upto Indira Sagar Project. 55
48 Break-up of sector wise water utilization from major, medium projects & minor schemes 56
49 Out flow from Power Houses & Spillway from Indira Sagar Reservoir. 57
50 Upstream utilization from Major & Medium Projects upto Indira Sagar Project. 58
51 Water utilization from Major & Medium Projects during water year 2015-16.
( i ) Kolar Project & ChandraKeshar Project. 59
(ii) Indira Sagar Project & Sukta (Bhagwant Sagar) Project. 60
52 Crop wise actual and planned area irrigated through Major & Medium Projects for the Water Year 2015-16 for Kharif. 61
53 Crop wise actual and planned area irrigated through Major & Medium Projects for the Water Year 2015-16 for Rabi & Hot weather. 62
54 Season wise actual area irrigated and water utilization through Minor Surface Gravity schemes during the Water Year 2015-16. 63
55Season wise actual area irrigated and water utilization through Lift Schemes (Irrigation & Water Supply Schemes) during the Water Year
2015-16. 64
56 Carry over live storage and difference in live storage for the Major & Medium Irrigation Projects. 65
ZONE –V ( INDIRA SAGAR PROJECT to MANDLESHWAR)
57Map showing location of existing and ongoing Major & Medium Projects and Irrigation Division wise jurisdiction for Minor Irrigation
Schemes Zone-V (upto Mandleshwar)-Map -6 66
(3)

SL No SUBJECT Page No.
58 Summary of utilizable flow upto Mandleshwar. 67
59 Break-up of sector wise water utilization from major, medium projects & minor schemes 68
60 Observed flow at Omkareshwar 69
61 Upstream utilization from Major & Medium Projects upto Mandleshwar . 70
62 Water utilization from Major & Medium Projects during water year 2015-16.
( i ) Dejla Dewda Tank & Paras Tank 71
(ii ) Choral Nakheri Tank & Upper Beda Tank 72
(iii) Omkareshwar Sagar Project 73
63 Crop wise actual and planned area irrigated through Major & Medium Projects for the Water Year 2015-16 for Kharif. 74
64 Crop wise actual and planned area irrigated through Major & Medium Projects for the Water Year 2015-16 for Rabi & Hot weather. 75
65 Season wise actual area irrigated and water utilization through Minor Surface Gravity schemes during the Water Year 2015-16. 76
66Season wise actual area irrigated and water utilization through Lift Schemes (Irrigation & Water Supply Schemes) during the Water Year
2015-16. 77
67 Carry over live storage and difference in live storage for the Major & Medium Irrigation Projects. 78
ZONE –VI ( MANDLESHWAR to SARDAR SAROVAR PROJECT)
68Map showing location of existing and ongoing Major & Medium Projects and Irrigation Division wise jurisdiction for Minor Irrigation
Schemes Zone-VI (upto Sardar Sarovar Project)- Map -7 79
69 Summary of utilizable flow upto Sardar Sarover Project. 80
70 Break-up of sector wise water utilization from major, medium projects & minor schemes 81
71 Observed flow at Sardar Sarovar Project. 82
72 Upstream utilization from Major & Medium Projects upto Sardar Sarovar Project. 83
73 Water utilization from Major & Medium Projects during water year 2015-16.
( i ) Man Project & Jobat Project. 84
(ii) Sardar Sarovar Project. 85
(iii) Satak & Segwal Tank 86
(iv) Kunda & Sakalda Tank. 87
(4)

SL No SUBJECT Page No.
74 Crop wise actual and planned area irrigated through Major & Medium Projects for the Water Year 2015-16 for Kharif. 88
75 Crop wise actual and planned area irrigated through Major & Medium Projects for the Water Year 2015-16 for Rabi & Hot weather. 89
76 Season wise actual area irrigated and water utilization through Minor Surface Gravity schemes during the Water Year 2015-16. 90
77Season wise actual area irrigated and water utilization through Lift Schemes (Irrigation & Water Supply Schemes) during the Water Year
2012-13.91
78 Carry over live storage and difference in live storage for the Major & Medium Irrigation Projects 92
79 Ten Daily releases of Narmada Water from Narmada Main Canal to Rajasthan for the water year 2015-16. 93
80 Map showing location of GDS sites in Upper, Middle & Lower Zone in Narmada Basin Maps 8 – 10. 94-96
(5)

NWDT AWARD STIPULATIONS ON WATER ACCOUNTING IN NARMADA RIVER BASIN Clause II - Determination Of The Utilisable Quantum Of Narmada Water
The Tribunal hereby determines that the utilisable quantum of waters of the Narmada at Sardar Sarovar Dam Site on the basis of 75 per cent dependability should be assessed at 28 Million Acre Feet (34,537.44 M.cu.m.).
Clause III - Apportionment of the Utilizable Quantum of Narmada Water (1) The Tribunal hereby orders that out of the utilisable quantum of Narmada water, (a) Madhya Pradesh is entitled to a share of 18.25 Million Acre Feet
(22,511.01 M.cu.m.), (b) Gujarat is entitled to a share of 9 Million Acre Feet (11,101.32 M.cu.m.), (c) Rajasthan is entitled to a share of 0.5 Million Acre Feet (616.74 M.cu.m.) and (d) Maharashtra is entitled to a share of 0.25 Million Acre Feet (308.37 M.cu.m.);
(2) Further, it is clarified that the apportionment relates to actual withdrawals and not consumptive use; (3) Within its share of water, each party State is free to make such changes in the pattern of water use and in the areas to be benefited within or outside the
Narmada basin in its territory as it may consider necessary. Clause IV - Order With Regard To Excess Water and Sharing of Distress (1) The utilisable flow of Narmada in excess of the 28 Million Acre Feet (34,537.44 M.cu.m.) of utilisable flow in any water year, i.e., from 1st of July to 30th
of June of next calendar year is apportioned in the following ratios of allocation i.e., 73 for Madhya Pradesh, 36 for Gujarat, 1 for Maharashtra and 2 for Rajasthan;
(2) In the event of the available utilisable waters for allocation in any water year from 1st of July to 30th June of the next calendar year falling short of 28
Million Acre Feet (34,537.44 M.cu.m.), the shortage should be shared between the various States in the ratio of 73 for Madhya Pradesh, 36 for Gujarat, 1 for Maharashtra and 2 for Rajasthan.
3) The available utilisable waters in a water year will include the water carried over from the previous water year as assessed on the 1st of July on the basis
of stored water available on that date:
(1)

(4) The available utilisable water on any date will be inclusive of return flows and exclusive of losses due to evaporation of the various reservoirs; (5) It may be mentioned that in many years there will be surplus water in the filling period after meeting the storage requirements and withdrawals during the
period. This will flow down to sea. Only a portion of it will be utilisable for generating power at Sardar Sarovar River-Bed Power-House and the rest will go waste. It is desirable that water which would go waste without even generating power at the last River-Bed Power-House, should be allowed to be utilised by the party States to the extent they can. Gujarat is, therefore, directed that whenever water starts going waste to sea without generating power, or based on the information received from upstream gauging stations, it anticipates that water would so go waste, it shall inform the Narmada Control Authority (hereinafter referred to as the Authority) and designated representatives of all the concerned States. Gujarat shall also inform them when such flows cease. During the period of such flows, the party States, whose reservoirs are spilling and the spill water cannot be stored elsewhere, may utilise such flows from the said reservoirs as they like and such utilisation by the party States will not count towards allotment of suppliers to them, but, use of such water will not establish any prescriptive rights.
Clause IX - Regulated Releases to be made by Madhya Pradesh for the Requirement of Sardar Sarovar Project (vi) Utilisation in a water year by each party State shall be figured out on the basis of actual daily discharge at canal head on every major and medium
project. For minor project, it shall be on the basis of area irrigated under different crops, the delta for each crop being approved by the Authority. For pumping schemes, drawing directly from the river, its tributaries or reservoirs, whether for irrigation, domestic or industrial use, water drawn shall be reckoned on the basis of the rated capacity of pumps and the number of hours they run. For a cross check, the seasonwise and cropwise area irrigated by each pumping scheme shall also be recorded, and if the figures of water drawn as worked out by the two aforesaid methods differ, the decision of the Authority as regards water drawn shall be final.
(vii) Withdrawals from Sardar Sarovar for Navagam Canal for Gujarat and Rajasthan shall be measured at the head of Navagam Canal. The supply to
Rajasthan shall be measured at Gujarat-Rajasthan border. The loss in the canal in carrying the supply for Rajasthan shall be determined by the Authority after the canal has been constructed and shall reckon against the share of Rajasthan. Water let down into the river from Sardar Sarovar through power house turbines shall be measured on the basis of power generated by it and that escaped through the spillway by measurement at the spillway. Gujarat may let down water from Sardar Sarovar for its downstream use by making specific indent for it and such releases shall reckon against its share. Such releases for downstream use shall be made through the turbines and the power so generated shared between Madhya Pradesh, Maharashtra and Gujarat in the prescribed ratio. Water let down into the river from Sardar Sarovar except at the specific indent of Gujarat shall not reckon against the share of Gujarat. The water drawn from Sardar Sarovar for use in Madhya Pradesh and Maharashtra, as the case may be, shall reckon against the share of water of that State.
(2)

(viii) For major and medium projects, water account shall be kept by 10 daily period. The last 10 daily period of a month may have 11 days, 10 days or less, depending upon the number of days in the month. For minor schemes water accounts shall be kept by crop seasons, Kharif (July to October) Rabi (November to March) and hot weather (April to June). For pumping schemes and domestic and industrial uses it shall be monthly.
(ix) The water use by minor and pumping schemes in any ten daily period may provisionally be taken to be the same as in the corresponding period in the
previous year on the basis of average use during the crop period. For final water account, however, it will be determined as in (vi) above. (x) Each State shall furnish to the Authority and make available to any party State desiring the same, such data and information as the Authority may require
and ask for. (xi) The Authority shall arrange the review of the ten day releases made by Madhya Pradesh at least once a month and oftener as considered necessary for
directing any change in the releases. It may designate a person for doing so. (xii) The Authority shall direct final adjustment to be made in the following water year of the use in excess of the authorized use, if any, by any State or States
during the preceding water year by curtailing the share(s) of the State or States concerned which have used water in excess and make over the same to the State or States which have received short supplies. Water supplied to Rajasthan on any day in excess of 10 per cent over and above its indent shall reckon against use by Gujarat.
(xiii) The Authority shall furnish the annual water account for the water year to the Governments of the party States by the end of August of the next water
year. Each State may make any observation on the account and/or point out corrections in it, if any, within one month of its receipt. After making the necessary modifications, the Authority shall furnish to each party State the final annual water account for the water year by 31st October. The Authority shall cause the annual water account to be published each year.
(3)

METHODOLOGY FOR ASSESSMENT OF UTILIZABLE FLOW IN NARMADA BASIN
The Narmada Water Dispute Tribunal assessed and apportioned utilizable quantum of Narmada water amongst party States, i.e. Madhya Pradesh, Gujarat, Maharashtra and Rajasthan as described in page 1. Accordingly, NCA has been publishing Annual Water Account (AWA) every year since 1980-81. The AWA till the water year 2005-06 was prepared on the basis of “A Manual on preparation of Annual Water Account of Narmada Basin” prepared by Regional Office, NCA in 2001 by following two major steps:
(a) Virgin flow at the terminal point over a water Year = Flow measured at d/s end of reach + Actual total withdrawal in the reach (irrigation use, domestic & industrial use and diversions outside basin) + Evaporation losses (10% of the storages created u/s of gauge site) – Regeneration from withdrawals (10% of irrigation use, 60% of domestic & industrial use) ± Change in storage between beginning and end of water Year.
(b) Utilizable flow in water Year available for allocation = Virgin flow (as calculated above) + Regeneration from withdrawals + Total live storage available at the beginning of water year in reach (carry over) – Evaporation losses from storages.
Since the above methodology was very cumbersome exercise , a review was carried out by SSRRC about the procedure of preparing AWA and the methodology for estimation of utilizable flow at any control point as per stipulations given in NWDT Award was modified in the 9th SSRRC meeting. The AWA from the water year 2006-07 onwards has been prepared as per the modified methodology represented as below:
utilizable flow at any point = Observed flow at any point + u/s utilization ± change in storages ± carryover storage in u/s reservoirs
CONTROL POINTS
Keeping in view of the developments taken place in Narmada river , following six control points are finalized in the main river and one in the Narmada Main Canal. (i) RABLS (Bargi) Project (ii) Burmanghat (iii) Hoshangabad (iv) Indira Sagar Project (v) Maheshwar Project (Mandleshwar site till Maheshwar dam comes up) (vi) Sardar Sarovar Project (vii) Gujarat-Rajasthan border
These control points will basically divide the Narmada river basin in 6 zones and Narmada Main Canal Command Area into 2 zones (Gujarat & Rajasthan). At present discharge at Gujarat- Rajasthan Border is being measure by GoG using Acoustic Doppler Current Profiler (ADCP) instrument installed at 1 Km upstream of the border, which is duly verified by GoR. Amarkantak Burmanghat ISP SSP Source Bargi Hoshangabad Maheshwar
Guj-Raj Border
(4)

OVERVIEW - I
S.No. Area Irrigated
(M.Cum) ( Maf ) (Lakh Ha.) (M.Cum) ( Maf ) (M.Cum) ( Maf ) (M.Cum) (M.Cum)
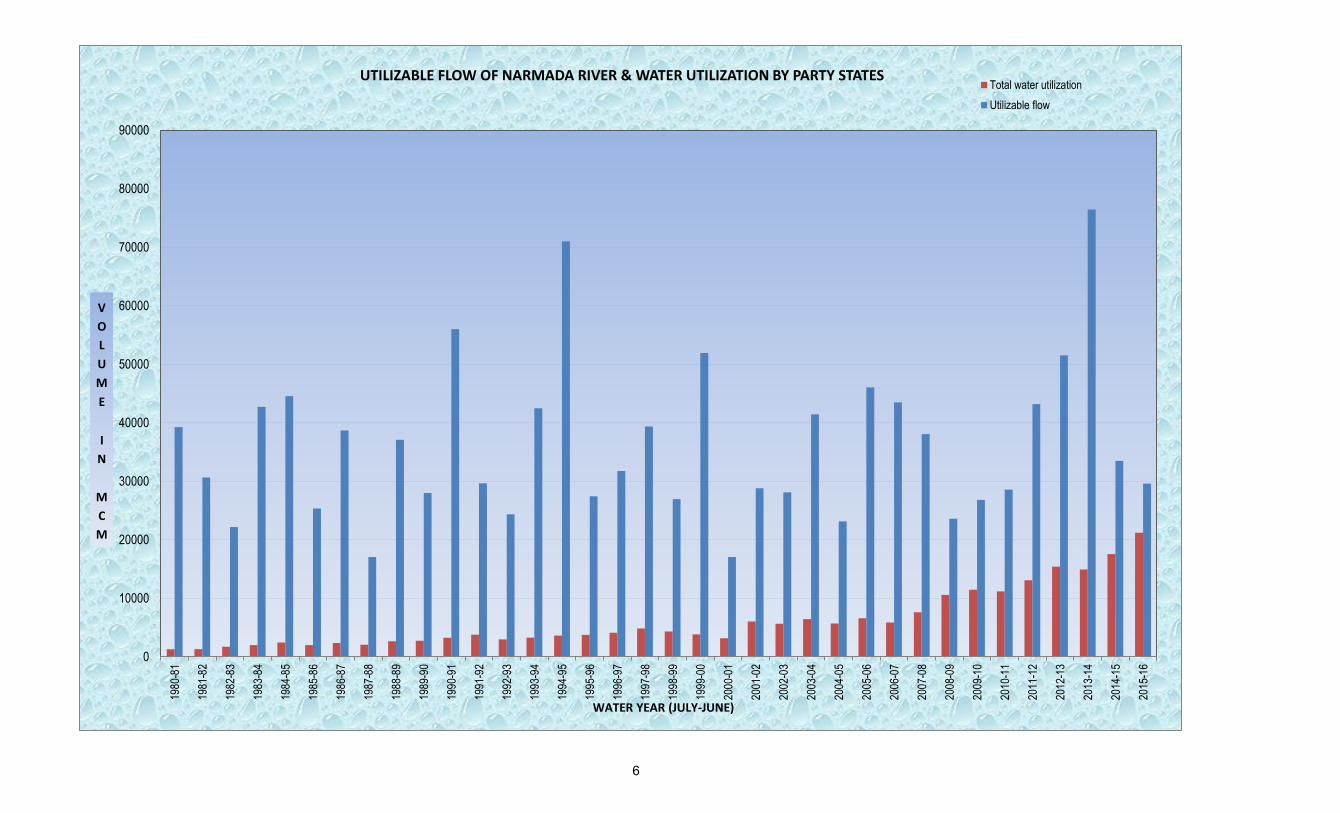
1 1980 - 1981 39251.00 31.82 1.13 1,196.40 0.97 1254.00 1.02 788.92 2711.00
2 1981 - 1982 30622.00 24.83 1.16 1,224.49 0.99 1283.00 1.04 504.33 2711.00
3 1982 - 1983 22176.00 17.98 1.48 1,656.77 1.34 1714.00 1.39 1147.06 2716.00
4 1983 - 1984 42726.00 34.64 1.56 1,898.16 1.54 1963.00 1.59 376.31 2730.00
5 1984 - 1985 44550.00 36.12 1.97 2,344.24 1.90 2418.00 1.96 404.72 2730.00
6 1985 - 1986 25330.00 20.54 1.87 1,863.57 1.51 1979.00 1.60 652.69 2730.00
7 1986 - 1987 38677.00 31.36 2.47 2,261.41 1.83 2331.00 1.89 1450.63 2730.00
8 1987 - 1988 17027.00 13.80 2.11 1,960.42 1.59 2026.00 1.64 730.30 6226.00
9 1988 - 1989 37080.00 30.06 2.91 2,527.11 2.05 2619.00 2.12 795.16 6276.00
10 1989 - 1990 27972.00 22.68 2.67 2,565.55 2.08 2702.00 2.19 1509.32 6296.00
11 1990 1991 56012.00 45.41 3.17 3,063.94 2.48 3223.00 2.61 937.18 6314.00
12 1991 - 1992 29612.00 24.01 5.24 3,545.37 2.87 3738.00 3.03 588.04 6370.00
13 1992 - 1993 24326.00 19.72 3.79 2,837.16 2.30 2966.00 2.40 927.29 6370.00
14 1993 - 1994 42468.00 34.43 3.99 3,046.67 2.47 3264.00 2.65 2913.29 6370.00
15 1994 - 1995 73471.00 59.56 4.50 3,392.28 2.75 3597.00 2.92 1775.22 6370.00
16 1995 - 1996 27419.00 22.23 4.48 3,521.41 2.85 3725.00 3.02 805.90 6370.00
17 1996 - 1997 31751.00 25.74 5.14 3,892.50 3.16 4082.00 3.31 802.98 6370.00
18 1997 - 1998 39359.00 31.91 6.80 4,605.47 3.73 4807.00 3.90 1768.10 6370.00
19 1998 - 1999 26955.00 21.85 6.21 4,088.44 3.31 4306.00 3.49 1696.38 6370.00
20 1999 - 2000 51895.00 42.07 4.67 3,592.54 2.91 3812.00 3.09 991.30 6370.00
21 2000 - 2001 17025.00 13.80 3.97 2,547.53 2.07 3151.00 2.55 916.58 6370.00
22 2001 - 2002 28807.77 23.35 4.59 4,499.04 3.65 6000.86 4.86 1045.32 6370.43
23 2002 - 2003 28077.87 22.76 8.10 4,981.24 4.04 5640.52 4.57 1209.45 6370.43
24 2003 - 2004 41437.34 33.59 8.90 6,008.40 4.87 6415.28 5.20 969.25 6370.43
25 2004 - 2005 23131.35 18.75 9.34 5,298.93 4.30 5648.21 4.58 869.59 6370.43
26 2005 - 2006 46033.36 37.32 5.63 6,060.20 4.91 6556.85 5.32 655.23 22008.30
27 2006 - 2007 43465.01 35.25 4.81 4,321.45 3.50 5860.55 4.75 1768.47 22070.24
28 2007 2008 38045.97 30.84 7.83 6,677.72 5.41 7585.51 6.15 1152.40 22070.24
29 2008 - 2009 23577.57 19.11 8.93 9,522.47 7.72 10581.55 8.58 1146.36 22070.24
30 2009 2010 26799.5 21.72 3.60 10,090.07 8.18 11432.25 9.26 856.51 22070.24
31 2010 2011 28557.52 23.15 6.78 9,833.16 7.97 11180.81 9.06 1918.44 22070.24
32 2011 2012 43180.60 35.04 5.74 11425.87 9.26 13066.18 10.59 2357.03 22070.24
33 2012 2013 51509.77 41.75 12.11 13204.66 10.71 15394.39 12.48 1173.53 22070.24
34 2013 2014 76437.36 61.97 15.10 12787.85 10.37 14917.37 12.09 4077.44 22070.24
35 2014 2015 33467.27 27.13 13.68 15691.42 12.72 17528.05 14.21 1917.50 22451.35
36 2015 2016 29585.26 23.98 19.41 18754.29 15.2 21172.55 17.16 3420.70 22479.58
Note : 1. Utilizable quantum of water of the Narmada at Sardar Sarovar Dam site on the basis of 75 % dependability = 34.54 BM3 ( 28.00 Maf )
2. Allocation of water to states as per N.W.D.T. Award .. (a) Madhya Pradesh = 22.51 BM3 ( 18.25 Maf )
(b) Gujarat = 11.10 BM3 ( 9.00 Maf )
(c) Maharashtra = 0.31 BM3 ( 0.25 Maf )
Water use for
irrigationGross water use for Irrigation,
Domestic & Ins\dustrial sector
STATEMENT SHOWING YEARWISE WATER UTILIZATION IN NARMADA BASIN UP TO SARDAR SAROVAR /GARUDESHWAR AT A GLANCE
Water YearVolume of virgin/utilized
flow at Garudeshwar/SSP
Available live storage as on 1st
July in Major & Medium
Projects
Created reservoir live storage
(Major & Medium Projects)
5
6
0
10000
20000
30000
40000
50000
60000
70000
80000
90000
198
0-8
1
198
1-8
2
198
2-8
3
198
3-8
4
198
4-8
5
198
5-8
6
198
6-8
7
198
7-8
8
198
8-8
9
198
9-9
0
199
0-9
1
199
1-9
2
199
2-9
3
199
3-9
4
199
4-9
5
199
5-9
6
199
6-9
7
199
7-9
8
199
8-9
9
199
9-0
0
200
0-0
1
200
1-0
2
200
2-0
3
200
3-0
4
200
4-0
5
200
5-0
6
200
6-0
7
200
7-0
8
200
8-0
9
200
9-1
0
201
0-1
1
201
1-1
2
201
2-1
3
201
3-1
4
201
4-1
5
201
5-1
6
V
O
L
U
M
E
I
N
M
C
M
WATER YEAR (JULY-JUNE)
UTILIZABLE FLOW OF NARMADA RIVER & WATER UTILIZATION BY PARTY STATES Total water utilization
Utilizable flow

OVERVIEW - I
S.No. Area Irrigated
(M.Cum) ( Maf ) (Lakh Ha.) (M.Cum) ( Maf ) (M.Cum) ( Maf ) (M.Cum) (M.Cum)
1 1980 - 1981 39251.00 31.82 1.13 1,196.40 0.97 1254.00 1.02 788.92 2711.00
2 1981 - 1982 30622.00 24.83 1.16 1,224.49 0.99 1283.00 1.04 504.33 2711.00
3 1982 - 1983 22176.00 17.98 1.48 1,656.77 1.34 1714.00 1.39 1147.06 2716.00
4 1983 - 1984 42726.00 34.64 1.56 1,898.16 1.54 1963.00 1.59 376.31 2730.00
5 1984 - 1985 44550.00 36.12 1.97 2,344.24 1.90 2418.00 1.96 404.72 2730.00
6 1985 - 1986 25330.00 20.54 1.87 1,863.57 1.51 1979.00 1.60 652.69 2730.00
7 1986 - 1987 38677.00 31.36 2.47 2,261.41 1.83 2331.00 1.89 1450.63 2730.00
8 1987 - 1988 17027.00 13.80 2.11 1,960.42 1.59 2026.00 1.64 730.30 6226.00
9 1988 - 1989 37080.00 30.06 2.91 2,527.11 2.05 2619.00 2.12 795.16 6276.00
10 1989 - 1990 27972.00 22.68 2.67 2,565.55 2.08 2702.00 2.19 1509.32 6296.00
11 1990 1991 56012.00 45.41 3.17 3,063.94 2.48 3223.00 2.61 937.18 6314.00
12 1991 - 1992 29612.00 24.01 5.24 3,545.37 2.87 3738.00 3.03 588.04 6370.00
13 1992 - 1993 24326.00 19.72 3.79 2,837.16 2.30 2966.00 2.40 927.29 6370.00
14 1993 - 1994 42468.00 34.43 3.99 3,046.67 2.47 3264.00 2.65 2913.29 6370.00
15 1994 - 1995 73471.00 59.56 4.50 3,392.28 2.75 3597.00 2.92 1775.22 6370.00
16 1995 - 1996 27419.00 22.23 4.48 3,521.41 2.85 3725.00 3.02 805.90 6370.00
17 1996 - 1997 31751.00 25.74 5.14 3,892.50 3.16 4082.00 3.31 802.98 6370.00
18 1997 - 1998 39359.00 31.91 6.80 4,605.47 3.73 4807.00 3.90 1768.10 6370.00
19 1998 - 1999 26955.00 21.85 6.21 4,088.44 3.31 4306.00 3.49 1696.38 6370.00
20 1999 - 2000 51895.00 42.07 4.67 3,592.54 2.91 3812.00 3.09 991.30 6370.00
21 2000 - 2001 17025.00 13.80 3.97 2,547.53 2.07 3151.00 2.55 916.58 6370.00
22 2001 - 2002 28807.77 23.35 4.59 4,499.04 3.65 6000.86 4.86 1045.32 6370.43
23 2002 - 2003 28077.87 22.76 8.10 4,981.24 4.04 5640.52 4.57 1209.45 6370.43
24 2003 - 2004 41437.34 33.59 8.90 6,008.40 4.87 6415.28 5.20 969.25 6370.43
25 2004 - 2005 23131.35 18.75 9.34 5,298.93 4.30 5648.21 4.58 869.59 6370.43
26 2005 - 2006 46033.36 37.32 5.63 6,060.20 4.91 6556.85 5.32 655.23 22008.30
27 2006 - 2007 43465.01 35.25 4.81 4,321.45 3.50 5860.55 4.75 1768.47 22070.24
28 2007 2008 38045.97 30.84 7.83 6,677.72 5.41 7585.51 6.15 1152.40 22070.24
29 2008 - 2009 23577.57 19.11 8.93 9,522.47 7.72 10581.55 8.58 1146.36 22070.24
30 2009 - 2010 26799.50 21.72 3.6 10,090.07 8.18 11432.25 9.27 856.51 22070.24
31 2010 - 2011 28557.52 23.15 6.78 9,833.16 7.97 11180.81 9.06 1918.44 22070.24
32 2011 - 2012 43180.60 35.04 5.74 11425.87 9.26 13066.18 10.59 2357.03 22070.24
33 2012 - 2013 51509.77 41.75 12.11 13204.66 10.71 15394.39 12.48 1173.53 22070.24
34 2013 - 2014 76437.36 61.97 15.10 12787.85 10.37 14917.37 12.09 4077.44 22070.24
35 2014 - 2015 33467.27 27.13 13.68 15691.42 12.72 17528.05 14.21 1917.50 22451.35
37 2015 - 2016 29585.26 23.98 19.41 18754.29 15.20 21172.55 17.16 3420.70 22479.58
Note:2. Utilizable quantum of water of the Narmada at Sardar Sarovar Dam site on the basis of 75 % dependability = 34.54 BM3 ( 28.00 Maf )
3. Allocation of water to states as per N.W.D.T. Award : (a) Madhya Pradesh = 22.51 BM3 ( 18.25 Maf )
(b) Gujarat = 11.10 BM3 ( 9.00 Maf )
(c) Maharashtra = 0.31 BM3 ( 0.25 Maf )
(d) Rajasthan = 0.62 BM3 ( 0.50 Maf )
1. Virgin Flow from 1980-81 to 2005-06 & utilizable flow 2006-07 to 2015-16
Water use for
irrigationGross water use for Irrigation,
Domestic & Industrial sector
STATEMENT SHOWING YEARWISE WATER UTILIZATION IN NARMADA BASIN UP TO SARDAR SAROVAR /GARUDESHWAR AT A GLANCE
Water YearVolume of virgin/utilizable
flow at Garudeshwar/SSP
Available live storage
as on 1st July in
Major & Medium
Projects
Created reservoir live storage
(Major & Medium Projects)
5
OVERVIEW - II
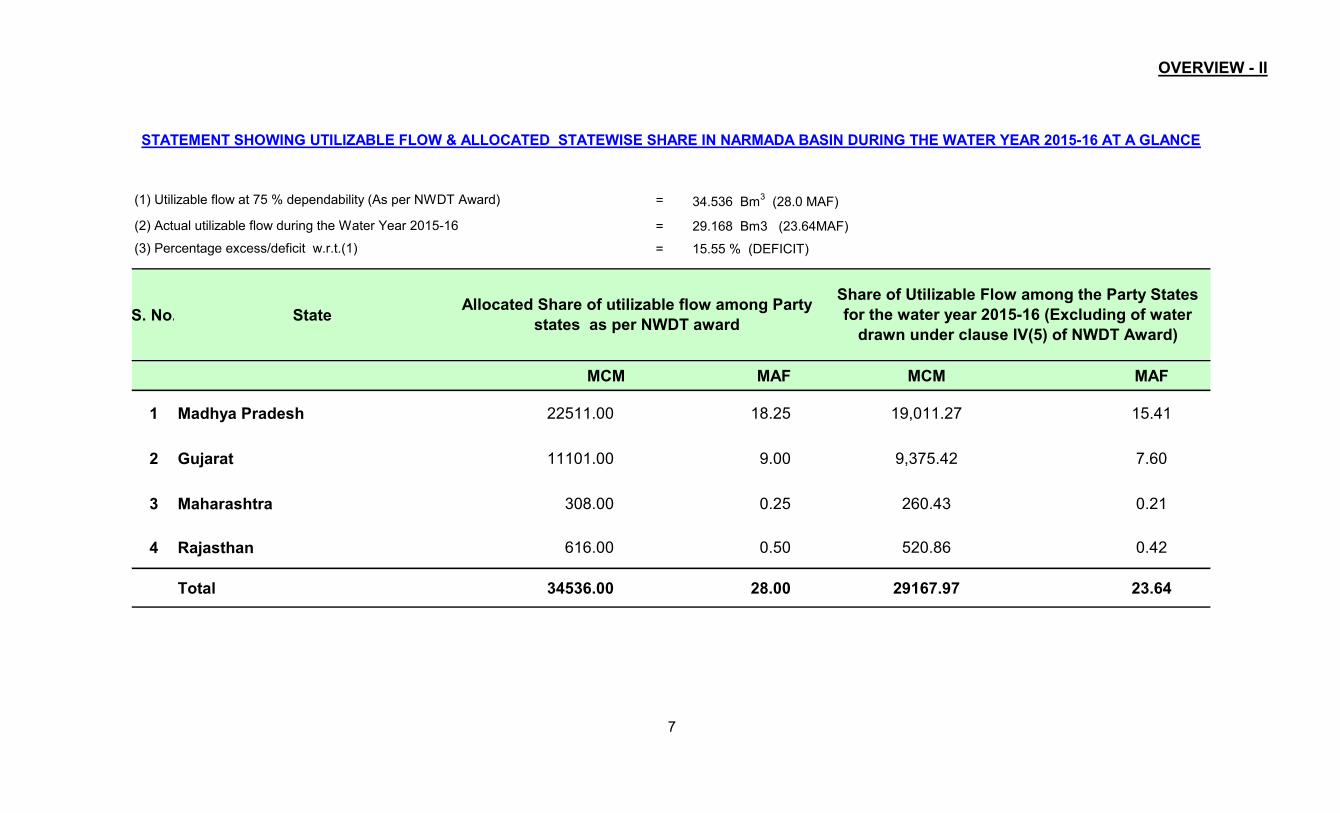
= 34.536 Bm3
(28.0 MAF)
= 29.168 Bm3 (23.64MAF)
= 15.55 % (DEFICIT)
S. No. State
MCM MAF MCM MAF
1 Madhya Pradesh 22511.00 18.25 19,011.27 15.41
2 Gujarat 11101.00 9.00 9,375.42 7.60
3 Maharashtra 308.00 0.25 260.43 0.21
4 Rajasthan 616.00 0.50 520.86 0.42
Total 34536.00 28.00 29167.97 23.64
(3) Percentage excess/deficit w.r.t.(1)
STATEMENT SHOWING UTILIZABLE FLOW & ALLOCATED STATEWISE SHARE IN NARMADA BASIN DURING THE WATER YEAR 2015-16 AT A GLANCE
Allocated Share of utilizable flow among Party
states as per NWDT award
Share of Utilizable Flow among the Party States
for the water year 2015-16 (Excluding of water
drawn under clause IV(5) of NWDT Award)
(1) Utilizable flow at 75 % dependability (As per NWDT Award)
(2) Actual utilizable flow during the Water Year 2015-16
7

OVERVIEW - III(A)
Irrigation Domestic Industrial
MCM MAF MCM MCM MCM MCM MAF
1 Madhya Pradesh 19,011.27 15.41 9839.34 397.00 13.04 10249.38 8.31
2 Gujarat 9,375.42 7.60 8553.60 1829.57 47.40 10430.57 8.46*
3 Maharashtra 260.43 0.21 - - - - - -
4 Rajasthan 520.86 0.42 361.35 131.25 - 492.60 0.40
Total 29167.98 23.64 18754.29 2357.82 60.44 21172.55 17.16
STATEMENT SHOWING STATEWISE WATER WITHDRAWALS DURING THE WATER YEAR 2015-16 AT A GLANCE
Withdrawals For Different Uses
* Includes 0.34 MAF utililized under section IV (5) of NWDT Award & 0.01 MAF of water drawn by GoG though Godbole gate in addition to the
mandatory releases of 600 Cusecs for environmental use.
Share of Utilizable Flow among
the party states for the water year
2015-16StateS. No.
Total
8

OVERVIEW-III(B)
SL No Description MCM MAF
1 Total Utilizable Flow assessed at Sardar Sarovar Project during the Water Year 2015-16 29585.26 23.98
2
Quantum of withdrawal made by GoG during spillover period towards maximisation of
power through CHPH by invoking Cluase IV(5) of NWDT award, which is not tobe accounted
towards their share , included in total utilizable flow assessed at Sardar Sarovar Project.417.29 0.34
3Spill over quantity from Sardar Sarovar Project during the water year 2015-16, part of total
utilizable flow assessed at Sardar Sarovar Project given in (1).1005.00 0.81
4 Net quantum of utilizable flow to be shared amongst party states (1) - (2). 29167.97 23.64
STATEMENT SHOWING UTILIZABLE FLOW AT SARDAR SAROVAR PROJECT TO BE SHARED AMONGST PARTY
STATES DURING WATER YEAR 2015-16
9

PLATE - 1
0.0
2.0
4.0
6.0
8.0
10.0
12.0
14.0
16.0
18.0
8.31
8.46
0.00
0.40
15.41
7.60
0.21
0.42 Uti
liza
tio
n (
MA
F)
STATE WISE WATER UTILIZATION AND UTILIZABLE FLOW
Actual Utilization Share of utilizable Flow
0.0
2.0
4.0
6.0
8.0
10.0
0.01 0.04
0.00
0.00
0.24
1.48
0.00 0.11
7.98 6.92
0.00 0.29
8.31 8.46
0.00 0.40
CATEGORY WISE WATER UTILIZATION BY PARTY STATES
Industrial Domestic Irrigation Total
10

OVERVIEW - IV
MAF
1 BARGI 374 14556 2232.00 2125.02 154.36 673.51 5184.89 4.20
2 BARMANGHAT 526 26453 4019.41 2803.21 154.55 678.43 7655.60 6.21
3 HOSHANGABAD 676 44548 9160.27 5801.93 -420.35 1345.59 15887.44 12.88
4 INDIRA SAGAR PROJECT 845 61642 12709.42 7324.05 -754.63 2685.62 21964.46 17.81
5 MANDLESHWAR 940 72809 15589.25 8761.33 -763.34 2703.93 26291.17 21.31
6 SARDAR SAROVAR PROJECT 1164 87892 16840.21 21172.57* -925.05 3420.70 29585.26 23.98
7 GUJARAT - RAJASTHAN BORDER - - 492.60 -
*
Distance
from
Source
(Km)
Utilizable flow
MCM
Observed
flow /Outflow
OVERVIEW OF ANNUAL WATER ACCOUNT UPTO SARDAR SAROVAR DAM FOR THE WATER YEAR 2015-16
Sl No CARDINAL STATIONS
MCM
Carryover
storage
Change in
Live Storage
MCM MCMMCM
Upstream
Utilizations
Inclusive of 10911.50 MCM of water released at HR of NMC for various uses by GoG & GoR and other losses , water let out through escapes and also 417.29 MCM released for
maximisation of power generation through CHPH by GoG during spillover of SSP by invoking Clause IV(5) of NWDT Award & includes 11.67 MCM of water drawn by GoG though
Godbole gate in addition to the mandatory releases of 600 Cusecs for environmental use..
- - - -
Catchment
area Upto
Cardinal Stn.
(Sq.Km)
11

PLATE-2
0,00
5,00
10,00
15,00
20,00
25,00
30,00
RABLS (BargiProject)
Barmanghat Hoshangabad Indira SagarProject
Mandleshwar Sardar SarovarProject
4.20
6.21
12.88
17.81 21.31
4.20
2.01
6.67
4.93
3.50
2.67
Qu
an
tum
of
Wa
ter
(MA
F)
CARDINAL STATIONS
ZONE-WISE UTILIZABLE FLOW
Contribution from Zone Upstream Cumulative Utilizable Flow
12
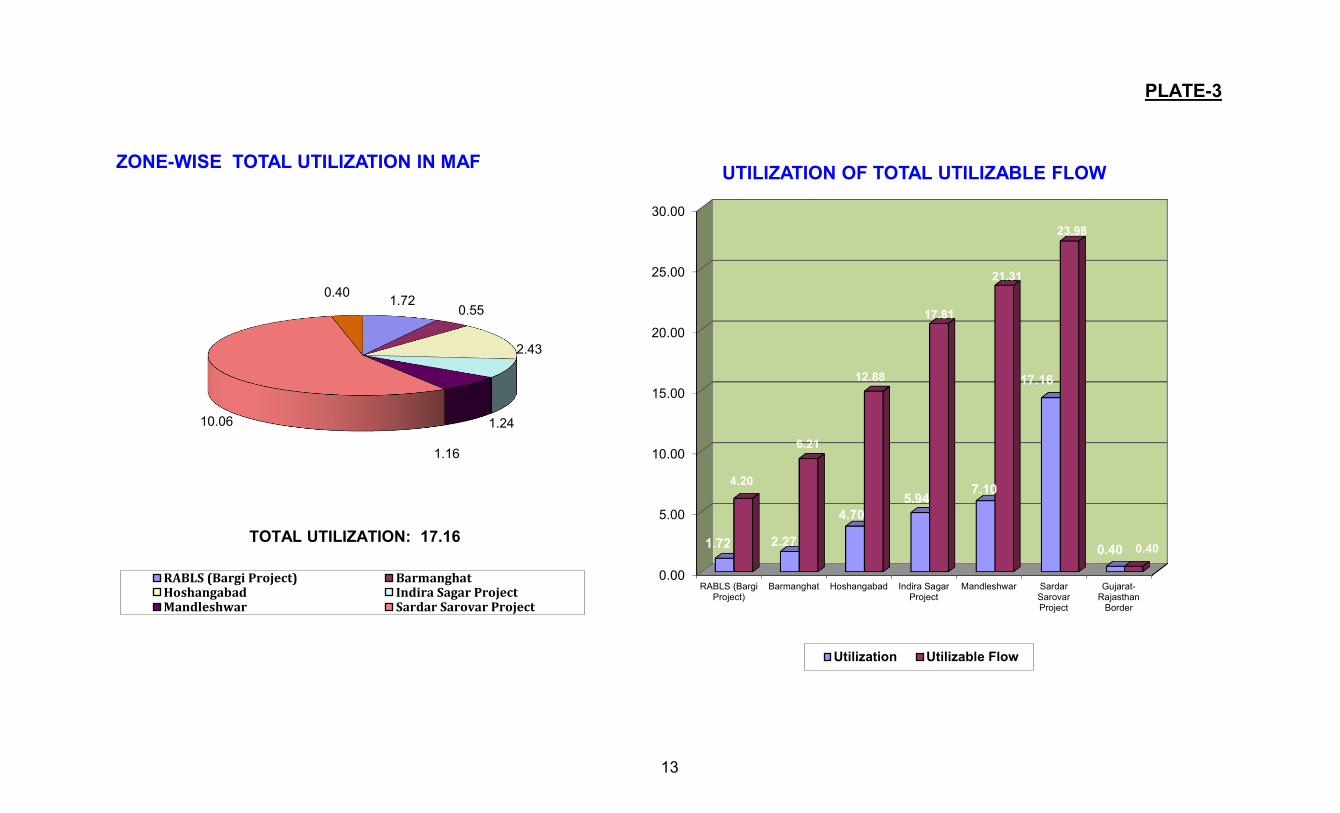
PLATE-3
1.72 0.55
2.43
1.24
1.16
10.06
0.40
ZONE-WISE TOTAL UTILIZATION IN MAF
RABLS (Bargi Project) BarmanghatHoshangabad Indira Sagar ProjectMandleshwar Sardar Sarovar Project
TOTAL UTILIZATION: 17.16
0.00
5.00
10.00
15.00
20.00
25.00
30.00
RABLS (BargiProject)
Barmanghat Hoshangabad Indira SagarProject
Mandleshwar SardarSarovarProject
Gujarat-Rajasthan
Border
1.72 2.27
4.70
5.94 7.10
17.16
0.40
4.20
6.21
12.88
17.81
21.31
23.98
0.40
UTILIZATION OF TOTAL UTILIZABLE FLOW
Utilization Utilizable Flow
13

BHOPAL RAISEN
VIDISHA
SEHORE
SHAJAPUR
DEWAS
UJJAIN
RATLAM
DHAR
INDORE
KHARGONE
GODHRA
VADODARA
BHARUCH
SURAT
KHANDWA
JALGAON
AMRAVATI
BETUL
HOSHANGABAD
CHHINDWARA
SEONI
BALAGHAT
NARSINGPUR
MANDLA
SHAHDOL
BILASPUR
DURG
DAMOH
DHULE
NAGPUR
P R A D E S H M A D H Y A
M A D H Y A P R A D E S H
R A J A S T H A N
G U J A R A T
G U J A R A T
DINDORI
RAJNANDGAON
BARWANI
Amarkantak
BARGI
INDIRA
SAGAR
SARDAR
SAROVAR
M A H A R A S H T R A
G
U
L
F
O
F
C
A
M
B
A
Y
73o 74o 76o 77o 78o 79o 80o 81o
24o
23o
22o
21o
75o
BANDRA
24o
23o
22o
21o
73o 74o 76o 77o 78o 79o 80o 81o 75o
JABALPUR
LEGEND
BASIN BOUNDARY
STATE BOUNDARY
DISTRICT BOUNDARY
ZONE BOUNDARY
ROADS
RIVERS
SCALE : 0 20 30 60 70 KM 40 10
ZONE-6
MAP-1
NARMADA CONTROL AUTHORITY
NARMADA RIVER BASIN
INDEX MAP OF NARMADA BASIN
SAGAR
MATIYARI
BARNA
SUKTA
KOLAR
TAWA
JOBAT MAN
MAHESHWAR
OMKARESHWAR
ZONE-5
ZONE-4
ZONE-3
ZONE-2
ZONE-1
14

BALAGHAT
MANDLA
SHAHDOL
JABALPUR
KAWARDHA
PENDRA
UMARIA
AMARKANTAK
82 o 81 o 80 o
82 o 81 o 80 o
23 o
22 o
23 o
22 o
NARMADA CONTROL AUTHORITY
NARMADA RIVER BASIN
MAP SHOWING LOCATION OF EXISTING AND
ON GOING MAJOR & MEDIUM PROJECTS AND
IRRIGATION DIVISION-WISE JURISDICTION FOR
MINOR IRRIGATION SCHEMES-
ZONE-I
MAP-2
WATER RESOURCES
DIVISION, CHHUIKHADAN
WATER RESOURCES
DIVISION, KAWARDHA
WATER RESOURCES
DIVISION, MANDLA
WATER RESOURCES
DIVISION, DINDORI
WATER RESOURCES
DIVISION, ANUPPUR
WATER RESOURCES
DIVISION, NIWAS
WATER RESOURCES
DIVISION No-1, SEONI
BANJAR RIVER PROJECT
DIVISION, BAIHAR
MEHGON
TOLA TANK
MATIYARI
BICHHIYA
TANK
DHUANDHAR
JALGAON
TANK
BANJAR
PROJECT
BARGI DAM
LEGEND
BASIN BOUNDARY
ZONE BOUNDARY
RIVERS
DISTRICT HEAD QUARTERS
IMPORTANT TOWNS
DAM SITE & SUBMERGENCE
ZONE-1 (UP TO BARGI)
DISTANCE FROM SOURCE : 374 Km
CATCHMENT AREA : 14556 Sq Km
15

ZONE - I
UPTO BARGI PROJECT

Sl No Description Unit
I Observed Flow MCM 2232.00
II Upstream Utilizations
II a. Major & Medium Projects MCM 1394.80
II b. Minor Projects MCM 730.22
II c. Total MCM 2125.02
III Change (increase`+' / decrease`-') in Live Storage MCM 154.36
IV Carryover storage (Live Storage as on 01.07.2015) MCM 673.51
V Utilizable flow upto Bargi (I + IIc + III + IV ) MCM 5184.89
MAF 4.20
ZONE 1 - NARMADA UP TO BARGI RESERVOIR
SUMMARY
Narmada
upto Bargi
16

Unit Irrigation Domestic Industrial Total
1 MCM 1392.65 - 2.15 1394.80
S.No.
730.22MCM 728.65 1.57 -
BREAK-UP OF SECTOR WISE WATER UTILIZATION FROM MAJOR, MEDIUM PROJECTS & MINOR SCHEMES
Water Utilization
Major & Medium Projects
Minor Projects Including
Lift & Pumping Schemes
2
Category of Projects
17

AWA - 1
: BARGI (RANI AVANTI BAI LODHI SAGAR PROJECT)
Category : Major
: Narmada
: E.E.,R.A.B.L.S. Left Masonry Dam Dn, Barginagar, Jabalpur
Month Year 1-10 11-20 21-30/31 Total
July 2015 38.96 67.36 60.34 166.66
August 2015 59.96 59.93 54.59 174.48
September 2015 103.86 57.60 69.12 230.58
October 2015 70.85 63.46 29.58 163.89
November 2015 32.71 44.82 52.88 130.41
December 2015 51.50 39.67 48.25 139.42
January 2016 62.71 70.40 79.12 212.23
February 2016 73.08 73.48 37.17 183.73
March 2016 74.23 45.68 61.04 180.95
April 2016 61.29 82.32 90.29 233.90
May 2016 89.03 88.90 79.49 257.42
June 2016 50.01 54.01 54.31 158.33
Total 768.19 747.63 716.18 2,232.00
(Figures in MCM)
A.I. OBSERVED FLOW (OUT FLOWS FROM POWER HOUSES & SPILLWAY )
Name of Project
Name of river / tributary
Reporting Officer
18
AWA - 2
Kharif Rabi Hotweather Total
(Ha.) (Ha.) (Ha.) (Ha.) (Ha.)
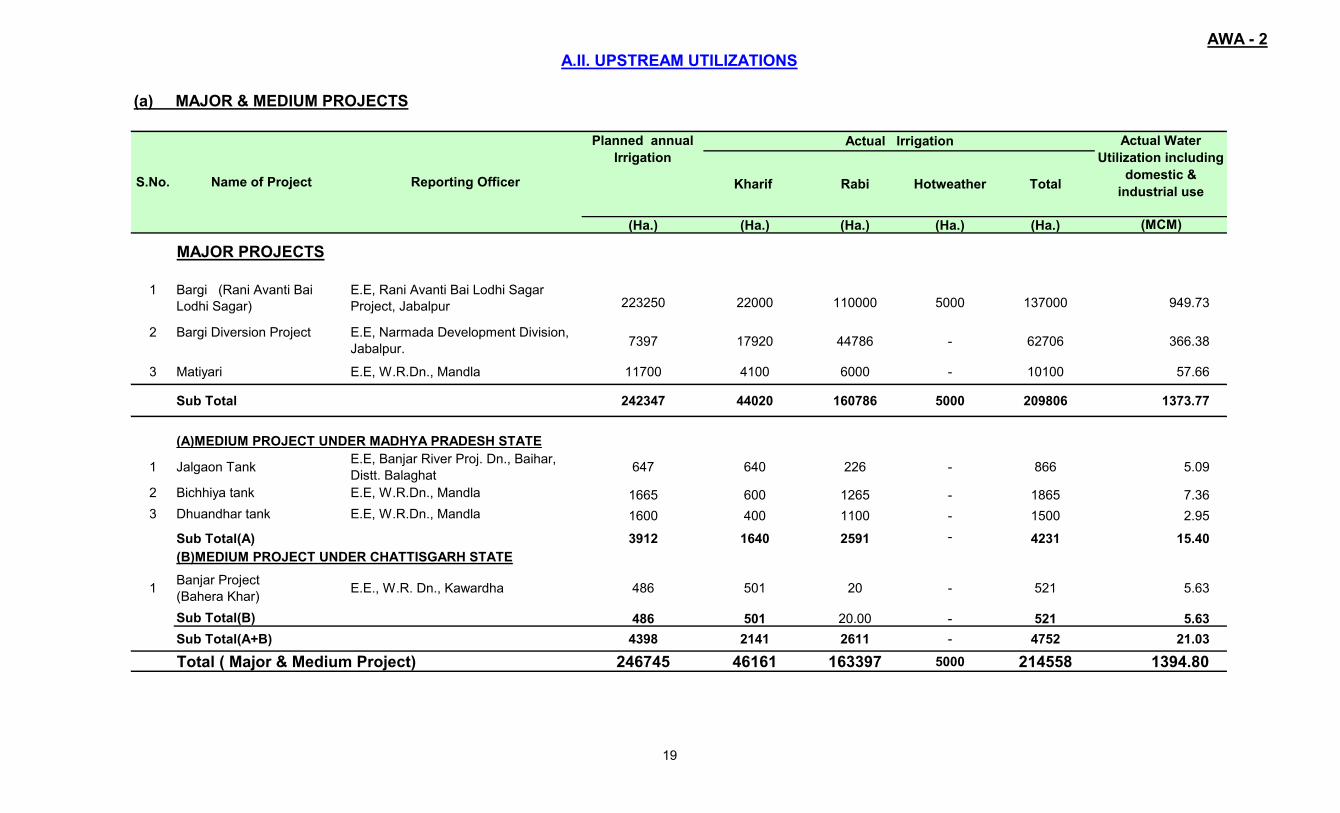
MAJOR PROJECTS
1 Bargi (Rani Avanti Bai
Lodhi Sagar)
E.E, Rani Avanti Bai Lodhi Sagar
Project, Jabalpur 223250 22000 110000 5000 137000 949.73
2 Bargi Diversion Project E.E, Narmada Development Division,
Jabalpur.7397 17920 44786 - 62706 366.38
3 Matiyari E.E, W.R.Dn., Mandla 11700 4100 6000 - 10100 57.66
Sub Total 242347 44020 160786 5000 209806 1373.77
(A)MEDIUM PROJECT UNDER MADHYA PRADESH STATE
1 Jalgaon TankE.E, Banjar River Proj. Dn., Baihar,
Distt. Balaghat647 640 226 - 866 5.09
2 Bichhiya tank E.E, W.R.Dn., Mandla 1665 600 1265 - 1865 7.36
3 Dhuandhar tank E.E, W.R.Dn., Mandla 1600 400 1100 - 1500 2.95
Sub Total(A) 3912 1640 2591 - 4231 15.40
(B)MEDIUM PROJECT UNDER CHATTISGARH STATE
1Banjar Project
(Bahera Khar)E.E., W.R. Dn., Kawardha 486 501 20 - 521 5.63
Sub Total(B) 486 501 20.00 - 521 5.63
Sub Total(A+B) 4398 2141 2611 - 4752 21.03
Total ( Major & Medium Project) 246745 46161 163397 5000 214558 1394.80
A.II. UPSTREAM UTILIZATIONS
S.No.
(a) MAJOR & MEDIUM PROJECTS
(MCM)
Actual IrrigationPlanned annual
Irrigation
Actual Water
Utilization including
domestic &
industrial useName of Project Reporting Officer
19

AWA - 3
: : Bargi Diversion Project
Category : Major : Major
: Narmada :
: :
Month Year 1-10 11-20 21-30/31 Total 1-10 11-20 21-30/31 Total
July 2015 6.70 5.51 22.68 34.89 0.00 0.00 11.45 11.45
August 2015 24.59 38.37 62.16 125.12 11.58 17.20 28.70 57.48
September 2015 49.10 78.00 47.23 174.33 27.91 32.30 34.56 94.77
October 2015 71.99 51.54 0.32 123.85 39.07 25.93 0.00 65.00
November 2015 0.00 1.03 8.33 9.36 0.00 0.00 1.07 1.07
December 2015 16.17 25.61 28.19 69.97 5.60 11.48 11.89 28.97
January 1016 25.66 16.57 19.70 61.93 12.77 7.57 6.41 26.75
February 1016 21.14 28.84 21.08 71.06 12.67 11.65 9.28 33.60
March 1016 24.98 11.74 15.62 52.34 6.41 4.54 4.30 15.25
April 1016 17.43 26.01 18.08 61.52 1.01 5.48 8.06 14.55
May 1016 27.64 29.27 41.20 98.11 3.98 0.49 7.28 11.75
June 1016 27.84 28.50 10.91 67.25 3.04 2.59 0.11 5.74
Total 313.24 340.99 295.50 949.73 124.04 119.23 123.11 366.38
(Figures in MCM) (Figures in MCM)
Reporting Officer C.E.,Upper Narmada Zone, Jablpur (M.P.)
WATER UTILIZATION BY MAJOR & MEDIUM IRRIGATION PROJECTS DURING THE WATER YEAR 2015-16(As measured at canal head)
Narmada Name of river / tributary
Name of Project Bargi (Rani Avanti Bai Lodhi Sagar Project)
C.E.,,R.A.B.L.S. Project, Bargi Hills,Jabalpur
20
AWA - 3
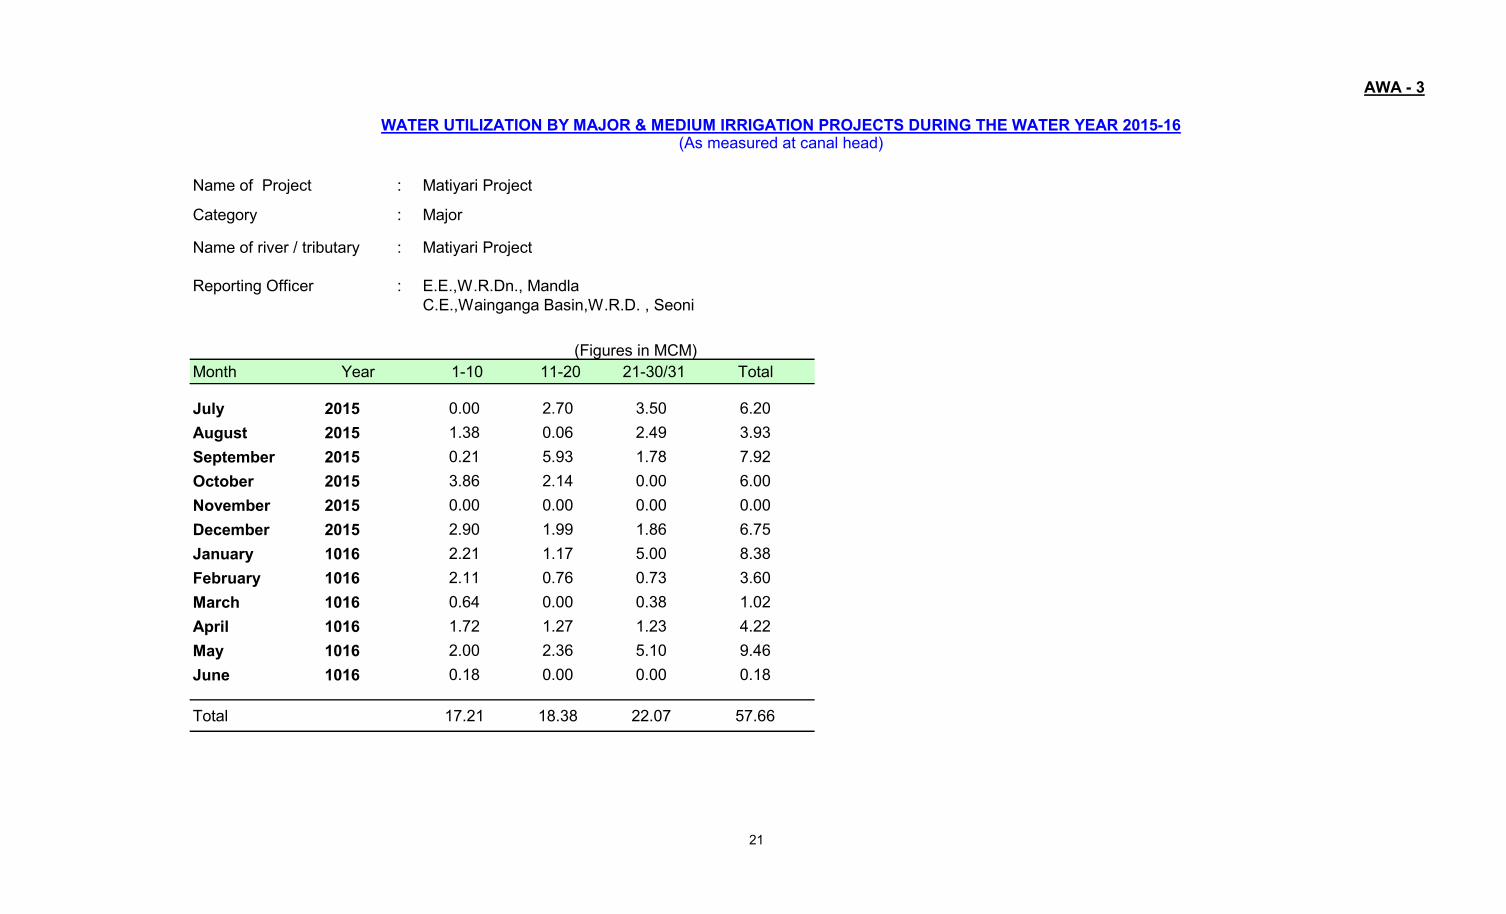
WATER UTILIZATION BY MAJOR & MEDIUM IRRIGATION PROJECTS DURING THE WATER YEAR 2015-16(As measured at canal head)
Name of Project : Matiyari Project
Category : Major
Name of river / tributary : Matiyari Project
Reporting Officer : E.E.,W.R.Dn., Mandla
C.E.,Wainganga Basin,W.R.D. , Seoni
(Figures in MCM)
Month Year 1-10 11-20 21-30/31 Total
July 2015 0.00 2.70 3.50 6.20
August 2015 1.38 0.06 2.49 3.93
September 2015 0.21 5.93 1.78 7.92
October 2015 3.86 2.14 0.00 6.00
November 2015 0.00 0.00 0.00 0.00
December 2015 2.90 1.99 1.86 6.75
January 1016 2.21 1.17 5.00 8.38
February 1016 2.11 0.76 0.73 3.60
March 1016 0.64 0.00 0.38 1.02
April 1016 1.72 1.27 1.23 4.22
May 1016 2.00 2.36 5.10 9.46
June 1016 0.18 0.00 0.00 0.18
Total 17.21 18.38 22.07 57.66
21

AWA - 3
WATER UTILIZATION BY MAJOR & MEDIUM IRRIGATION PROJECTS DURING THE WATER YEAR 2015-16(As measured at canal head)
: : Banjar River Project ( Bahera Khar Medium Project)
Category : Medium : Medium
: Banjar Nalla : Banjar River/Kukurbahra Nalla
: E.E., ,Banjar River Project Div., Baihar : E.E., Water Resources Division, Kawardha (C.G.)
(Figures in MCM)
Month Year 1-10 11-20 21-30/31 Total 1-10 11-20 21-30/31 Total
July 2015 0.30 0.32 0.28 0.90 0.00 0.14 0.26 0.40
August 2015 0.28 0.30 0.24 0.82 0.24 0.24 0.34 0.82
September 2015 0.24 0.28 0.22 0.74 0.36 0.32 0.24 0.92
October 2015 0.24 0.26 0.15 0.65 0.24 0.24 0.02 0.50
November 2015 0.00 0.00 0.00 0.00 0.00 0.00 0.00 0.00
December 2015 0.00 0.00 0.00 0.00 0.00 0.00 0.00 0.00
January 1016 0.30 0.30 0.28 0.88 0.14 0.24 0.26 0.64
February 1016 0.28 0.25 0.27 0.80 0.10 0.00 0.00 0.10
March 1016 0.10 0.12 0.08 0.30 0.00 0.14 0.00 0.14
April 1016 0.00 0.00 0.00 0.00 0.24 0.24 0.24 0.72
May 1016 0.00 0.00 0.00 0.00 0.24 0.24 0.24 0.72
June 1016 0.00 0.00 0.00 0.00 0.24 0.24 0.19 0.67
Total 1.74 1.83 1.52 5.09 1.80 2.04 1.79 5.63 *
* Out of 5.63 MCM Water Utilization, 3.48 MCM for Irrigation use, 2.15 MCM for Industrial use.
Name of Project Jalgaon Project
(Figures in MCM)
Name of river / tributary
C.E.,Wainganga Basin,W.R.D., Seoni
Reporting Officer
22
AWA - 3
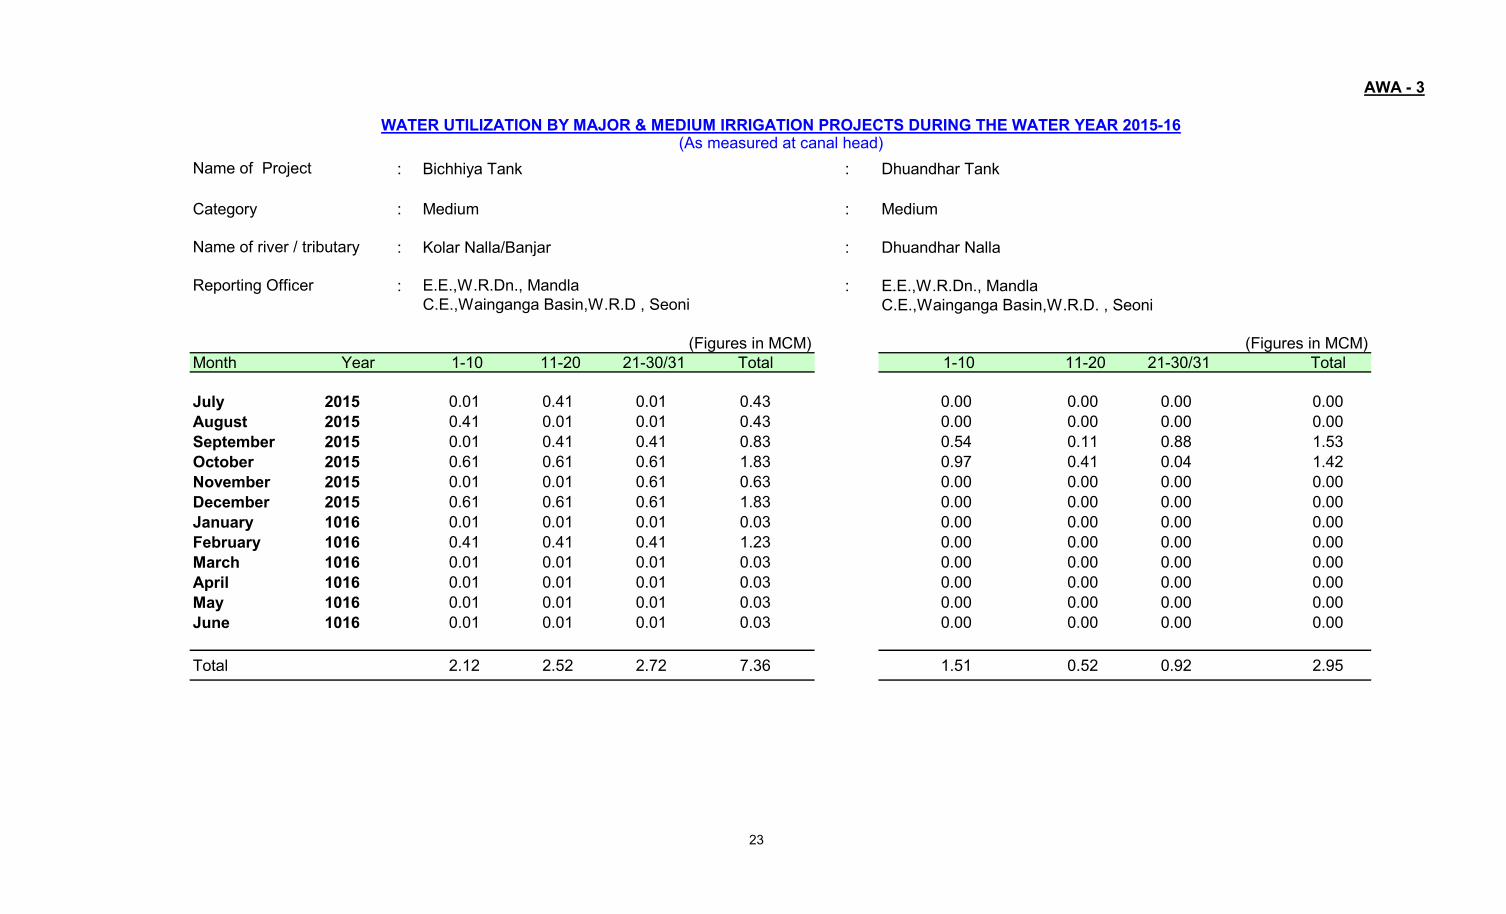
WATER UTILIZATION BY MAJOR & MEDIUM IRRIGATION PROJECTS DURING THE WATER YEAR 2015-16(As measured at canal head)
: Bichhiya Tank : Dhuandhar Tank
Category : Medium : Medium
: Kolar Nalla/Banjar : Dhuandhar Nalla
: : E.E.,W.R.Dn., Mandla
C.E.,Wainganga Basin,W.R.D. , Seoni
Month Year 1-10 11-20 21-30/31 Total 1-10 11-20 21-30/31 Total
July 2015 0.01 0.41 0.01 0.43 0.00 0.00 0.00 0.00
August 2015 0.41 0.01 0.01 0.43 0.00 0.00 0.00 0.00
September 2015 0.01 0.41 0.41 0.83 0.54 0.11 0.88 1.53
October 2015 0.61 0.61 0.61 1.83 0.97 0.41 0.04 1.42
November 2015 0.01 0.01 0.61 0.63 0.00 0.00 0.00 0.00
December 2015 0.61 0.61 0.61 1.83 0.00 0.00 0.00 0.00
January 1016 0.01 0.01 0.01 0.03 0.00 0.00 0.00 0.00
February 1016 0.41 0.41 0.41 1.23 0.00 0.00 0.00 0.00
March 1016 0.01 0.01 0.01 0.03 0.00 0.00 0.00 0.00
April 1016 0.01 0.01 0.01 0.03 0.00 0.00 0.00 0.00
May 1016 0.01 0.01 0.01 0.03 0.00 0.00 0.00 0.00
June 1016 0.01 0.01 0.01 0.03 0.00 0.00 0.00 0.00
Total 2.12 2.52 2.72 7.36 1.51 0.52 0.92 2.95
C.E.,Wainganga Basin,W.R.D , Seoni
(Figures in MCM)
Reporting Officer E.E.,W.R.Dn., Mandla
Name of river / tributary
Name of Project
(Figures in MCM)
23

AWA - 4
Category CCA (Ha) Total
Paddy Cotton Ground Nut Jowar/Maize Pulses Vegetables Fodder Soyabeen Others Kharif
1 2 3 4 5 6 7 8 9 10 11 12 13 14
Major 157000 22000 - - - - - - --
22000
24790 4750 26650 1322069410
2 Bargi Diversion Project Major 54538 17920 - - - - - - - - 17920
- -
-
3 Matiyari Project Major 10120 4100 - - - - - - - -4100
5648 5648
4 Jalgaon Tank Medium 1619 640 640
538 - - - - - - - - 538
5 Banjar Project Medium 486 486 486
2024 - - - - - - - - 2024
6 Bichhiya Tank Medium 2797 600600
400 - - - - - - - - 400
7 Dhuandhar Tank Medium 1410 400 400
500 - - - - - - - - 500
Bargi (Rani Avanti Bai
Lodhi Sagar )
AREA IRRIGATED THROUGH MAJOR AND MEDIUM PROJECTS FOR THE WATER YEAR 2015-16
S.No.
ProjectCropwise actual / planned irrigated area during Kharif season (Ha)
1
24

AWA - 4
Wheat Wheat Gram Pulses Vegetables Peas Linseed Total Perennial Pulses Vegetables Fodder & Total Hot
(HYV) (ORD) & others Rabi others Weather
1 2 3 15 16 17 18 19 20 21 22 23 24 25 26 27
Major 46300 46300 40000 16700 - - 9500 158800 - - - - 5000
52000 52000 37500 8000 149500 12600 4090 1570 1570 19830
2 Bargi Diversion Project Major 1510 43110 90 50 - 26 - 44786 - - - -
- - - - - 245000*
3 Matiyari Project Major 6000 6000
6520 6520
4 Jalgaon Tank Medium
5 Banjar Project Medium - -
405 405
6 Bichhiya Tank Medium 1265 - 1265
1265 1265
7 Dhuandhar Tank Medium 1100 1100
1100 1100
- - - - -
-- -
- -
- - -
- - - - --
-
-
- -
-
- 151 70
- -
-
-
-
-
- -
-
1
-
-
- - -
- -
-
- -
-
Bargi (Rani Avanti Bai
Lodhi Sagar )
AREA IRRIGATED THROUGH MAJOR AND MEDIUM PROJECTS FOR THE WATER YEAR 2015-16
S.No.
Project Category
Cropwise actual / planned irrigated area during Rabi & Hot Weather ( Ha. )
* 245000 Ha is total planned irrigated area.
- -
-
5 226 - - -
-
25

AWA - 5
(i) MINOR SURFACE GRAVITY SCHEMES
Kharif RabiHot
weather
Peren
nial Total Kharif Rabi Total
1 2 3 4 5 6 7 8 9 10 11 12 13 14
(A)MINOR SURFACE GRAVITY SCHEMES UNDER MADHYA PRADESH STATE.
1 BARGI
( i ) W.R.Dn. Anuppur 6 935 797 11 381 0.00 - 392 0.04 1.15 1.19
( ii ) Banjar River Project Dn., Baihar 41 14351 11260 4912 818 0.00 - 5730 32.63 5.08 37.71
(iii ) W.R.Dn.No.1, Seoni 15 4505 4039 0.00 2406 0.00 - 2406 0.00 12.35 12.35
( iv ) W.R.Dn., Dindori 52 11851 13813 0.00 7903 0.00 - 7903 0.00 43.91 43.91
( v ) W.R.Dn. Mandla 70 9670 7750 1215 5394 0.00 - 6609 3.21 28.60 31.81
Sub Total(A) 184 41312 37659 6138 16902 0.00 - 23040 35.88 91.09 126.97
(B)MINOR SURFACE GRAVITY SCHEMES UNDER CHATTISGARH STATE
( i ) W.R.Dn., Chhuikhadan 4 786 331 0.00 0.00 0.00 - 0 0.00 0.00 0.00
( ii ) W.R.Dn., Kawardha 7 1900 - 809 0.00 0.00 - 809 2.83 0.00 2.83
Sub Total(B) 11 2686 331 809 0.00 0.00 - 809 2.83 0.00 2.83
195 43998 37990 6947 16902 0.00 - 23849 38.71 91.09 129.80
A.II. UPSTREAM UTILIZATION
Sub Total (A+B)
S.No. Cardinal Site Water Resources DivisionNo of
Schmes
CCA
(Ha)
Planned
annual
Irrigation
(Ha)
Actual Area Irrigated (Ha) Water Utilization (MCM)
(b) MINOR PROJECTS
26

AWA - 5
(ii) LIFT SCHEMES (Irrigation & Water Supply Schemes)
Kharif Rabi Hotweather Perennial Irrigation Domestic Industrial Irrigation Domestic Industrial Total
1 2 3 4 5 6 7 8 9 10 11 12 13 14 15 16
1 E.E, W.R.Dn., Mandla 3 824 860 - - - - - - - - - - - *
2 E.E, W.R.Dn., No. 1., Seoni. 3 335 229 - - - - - - - - - - -
3 E.E, Banjar River Project Dn., - - - - - - - - - - - - - -
Baihar, Distt. Balaghat.
4 Schemes of PHED & Local
administration
4 - - - - - - - 16815 - - 1.57 - 1.57
- 5 Private Pumping Scheme under
Agriculture Department of
Mandla, Dindori & Balaghat
Reported by NVDA.
9925 - - - - - - - - - 598.85 - - 598.85 *
Sub Total 9935 1159 1089 0.00 0.00 0.00 0.00 0.00 16815 0.00 598.85 1.57 0.00 600.42
TOTAL 10130 45157 39079 6947 16902 0.00 0.00 0.00 16815 0.00 728.65 1.57 0.00 730.22
(b) MINOR PROJECTS
* Data not received , last year data is repeated.
A.II. UPSTREAM UTILIZATION
Actual area irrigated (Ha.) No. of pumping hours Utilization (MCM)Planned
annual
Irrigation (Ha.)
Sr No Water Resources DivisionNo of
SchemesC C A
(Ha)
27

AWA - 6
Gross
Storage
Dead
Storage
Live
Storage C.C.A.
Live storage as
on 1.7.2015
Live storage
as on 1.7.2016
Change in
Live Storage
(Col. 10-9)
(MCM) (MCM) (MCM) (Ha) (MCM) (MCM) (MCM)
1 2 3 4 5 6 7 8 9 10 11
MAJOR PROJECTS
1 E.E, RABLS, Jabalpur Rani Avanti Bai
Lodhi Sagar
Narmada 3920.00 740.00 3180.00 157000 657.75 813.75 156.00
2 E.E, W.R.Dn., Mandla Matiyari Matiyari 56.80 5.68 51.12 10120 5.57 6.1 0.53
Sub - Total 3976.80 745.68 3231.12 167120 663.32 819.85 156.53
(A) MEDIUM PROJECTS UNDER MADHYA PRADESH STATE.
1 E.E, Banjar River Project
Dn., Baihar Distt. Balaghat
Jalgaon Tank Banjar 0.3 0.00 0.30 1619 0.30 0.30 0.00
2 E.E, W.R.Dn., Mandla Bichhiya tank Kolar nalla /
Banjar
8.50 0.64 7.87 2797 0.72 0.02 -0.70
Dhuandhar tank Dhuandhar 5.25 0.15 5.11 1410 0.00 0.00 0.00
Sub - Total (A) 14.05 0.79 13.28 5826 1.02 0.32 -0.70
(B)MEDIUM PROJECTS UNDER CHATTISGARH STATE
1 E.E., W.R. Dn., Kawardha Banjar Project Banjar 14.76 1.05 13.71 2567 9.17 7.70 -1.47
Sub - Total (B) 14.76 1.05 13.71 486 9.17 7.70 -1.47
Sub Total (A+B) 28.81 1.84 26.99 6312 10.19 8.02 -2.17
4005.61 747.52 3258.11 173432 673.51 827.87 154.36
CARRYOVER LIVE STORAGE & CHANGE IN LIVE STORAGE FOR THE MAJOR AND MEDIUM IRRIGATION PROJECTS
Total ( Major & Medium Project )
S.No. Reporting Officer Name of ProjectName of river /
tributary
28

23 o
22 o
23 o
22 o
DAMOH
CHHINDAWARA
NARSINGPUR
79 o 78 o
79 o 78 o
MAP-3
WATER RESOURCES
DIVISION No-1, SEONI
WATER RESOURCES
DIVISION, NARSINGPUR
WATER RESOURCES
DIVISION, JABALPUR
WATER RESOURCES
DIVISION, DAMOH
80 o
80 o 81 o
NARMADA CONTROL AUTHORITY
NARMADA RIVER BASIN
MAP SHOWING LOCATION OF EXISTING AND
ON GOING MAJOR & MEDIUM PROJECTS AND
IRRIGATION DIVISION-WISE JURISDICTION FOR
MINOR IRRIGATION SCHEMES-
ZONE-II
WATER RESOURCES
DIVISION, KATNI
LEGEND
BASIN BOUNDARY
ZONE BOUNDARY
RIVERS
DISTRICT HEAD QUARTERS
IMPORTANT TOWNS
DAM SITE & SUBMERGENCE
BARGI
BARMANGHAT
ZONE-II (BARGI TO BARMANGHAT)
DISTANCE FROM SOURCE : 526 Km
CATCHMENT AREA : 26453 Sq Km
BOHRIBUND
MADAI
TANK BARNOO
TANK PARIAT
TANK
MEHGON TOLA
TANK
29

ZONE - II
RABLS (BARGI) PROJECT TO BARMANGHAT

Sl No Description Unit
I Observed flow MCM 2232.00 4019.41
II Upstream Utilizations
II a. Major & Medium Projects MCM 1394.80 47.29 1442.09
II b. Minor Projects MCM 730.22 630.90 1361.12
II c. Total MCM 2125.02 678.19 2803.21
III Change (increase`+' / decrease`-') in Live Storage MCM 154.36 0.19 154.55
IV Carryover storage (Live Storage as on 01.07.2015) MCM 673.51 4.92 678.43
V Utilizable flow (I + IIc + III + IV ) MCM 5184.89 7655.60
MAF 4.20 6.21
ZONE 2 - NARMADA UP TO BURMANGHAT
SUMMARY
Narmada upto
Barmanghat
Bargi to
BarmanghatUpto Bargi
30

Unit Irrigation Domestic Industrial Total
1 MCM 27.42 19.87 - 47.29Major & Medium Projects
80.78 - 630.90
BREAK-UP OF SECTOR WISE WATER UTILIZATION FROM MAJOR, MEDIUM PROJECTS & MINOR SCHEMES
2Minor Projects Including
Lift & Pumping SchemesMCM 550.12
S.No. Category of Projects Water Utilization
31

AWA - 1
: BARMANGHAT
Category : GDS
: Narmada
: E.E. Narmada Division C.W.C. Bhopal
Month Year 1-10 11-20 21-30/31 Total
July 2015 108.64 196.40 215.52 520.56
August 2015 436.25 262.79 217.16 916.20
September 2015 244.76 113.70 128.65 487.11
October 2015 119.20 118.17 63.28 300.65
November 2015 72.39 58.61 84.04 215.04
December 2015 60.88 54.30 57.22 172.40
January 2016 74.34 78.24 90.33 242.91
February 2016 88.40 90.88 61.25 240.53
March 2016 68.45 57.65 68.20 194.30
April 2016 92.73 63.41 97.29 253.43
May 2016 96.94 101.95 101.71 300.60
June 2016 52.39 59.15 64.14 175.68
Total 1,515.37 1,255.25 1,248.79 4,019.41
(Figures in MCM)
A.I. OBSERVED FLOW
Name of Gauge site
Name of river / tributary
Reporting Officer
32

AWA - 2
Kharif Rabi Hotweather Total
(Ha.) (Ha.) (Ha.) (Ha.) (Ha.)
1 Mehgaon Tola Tank E.E, Hiran W.R.Dn., Jabalpur 2150 43 1898 - 1941 9.00
2 Barnoo Tank E.E, Hiran W.R.Dn., Jabalpur 1300 365 358 - 723 2.08
3 Madai Tank E.E, Hiran W.R.Dn., Jabalpur 465 160 206 - 366 2.46
4 Bohribund Tank E.E.,W.R.Dn. Katni 6495 3150 1435 - 4585 13.88
5 Pariat TankCommissioner. Municipal
Corporation. Jabalpur- - - - - 19.87
Total ( Medium Project) 10410 3718 3897 - 7615 47.29
(a) MAJOR & MEDIUM PROJECTS
(MCM)
Actual Irrigation
A.II. UPSTREAM UTILIZATIONS
Planned annual
Irrigation
Actual Water
Utilization including
domestic & industrial Name of Project Reporting OfficerS.No.
33

AWA - 3
: : Pariat Tank
Category : Medium : Medium
: Bidri Nalla/Gour :
: :
Month Year 1-10 11-20 21-30/31 Total 1-10 11-20 21-30/31 Total
July 2015 0.00 0.00 0.00 0.00 1.09
August 2015 0.00 0.00 0.00 0.00 1.09
September 2015 0.00 0.00 0.00 0.00 0.09
October 2015 0.00 0.00 0.00 0.00 2.30
November 2015 0.17 0.15 0.52 0.84 1.45
December 2015 1.03 3.13 0.67 4.83 2.25
January 2016 1.01 0.00 0.00 1.01 1.95
February 2016 0.00 0.00 2.32 2.32 1.95
March 2016 0.00 0.00 0.00 0.00 2.05
April 2016 0.00 0.00 0.00 0.00 1.75
May 2016 0.00 0.00 0.00 0.00 1.95
June 2016 0.00 0.00 0.00 0.00 1.95
Total 2.21 3.28 3.51 9.00 19.87 *
.
* Data not received on Ten Daily Basis.
C.E.,,Wainganga Basin, WRD, Seoni..
(Figures in MCM) (Figures in MCM)
E.E.,Hiran W.R.Dn. Jabalpur
Mehgaon Tola Tank
WATER UTILIZATION BY MAJOR & MEDIUM IRRIGATION PROJECTS DURING THE WATER YEAR 2015-16
(As measured at canal head)
Pariat Name of river / tributary
Name of Project
Reporting Officer Commissioner. Municipal Corporation. Jabalpur
34

AWA - 3
WATER UTILIZATION BY MAJOR & MEDIUM IRRIGATION PROJECTS DURING THE WATER YEAR 2015-16
(As measured at canal head)
: : Bohribund Tank
Category : Medium : Medium
: Barnoo Nalla : Bhutia Nalla/Hiran
: :
Month Year 1-10 11-20 21-30/31 Total 1-10 11-20 21-30/31 Total
July 2015 0.47 0.00 0.35 0.82 0.18 0.19 0.15 0.52
August 2015 0.26 0.47 0.27 1.00 0.00 0.00 0.00 0.00
September 2015 0.03 0.04 0.19 0.26 0.99 1.20 0.88 3.07
October 2015 0.00 0.00 0.00 0.00 1.68 1.56 0.36 3.60
November 2015 0.00 0.00 0.00 0.00 0.78 0.85 0.83 2.46
December 2015 0.00 0.00 0.00 0.00 0.95 0.89 0.86 2.70
January 2016 0.00 0.00 0.00 0.00 0.00 0.00 0.00 0.00
February 2016 0.00 0.00 0.00 0.00 0.09 0.13 0.25 0.47
March 2016 0.00 0.00 0.00 0.00 0.18 0.26 0.35 0.79
April 2016 0.00 0.00 0.00 0.00 0.08 0.10 0.09 0.27
May 2016 0.00 0.00 0.00 0.00 0.00 0.00 0.00 0.00
June 2016 0.00 0.00 0.00 0.00 0.00 0.00 0.00 0.00
Total 0.76 0.51 0.81 2.08 4.93 5.18 3.77 13.88
E.E.,Hiran W.R.Dn. Jabalpur
Barnoo TankName of Project
Reporting Officer
C.E.,Wain Ganga Basin.WRD, SeoniC.E.,,Wainganga Basin, WRD, Seoni..
(Figures in MCM) (Figures in MCM)
Name of river / tributary
E.E.,W.R.Dn. Katni
35

AWA - 3
WATER UTILIZATION BY MAJOR & MEDIUM IRRIGATION PROJECTS DURING THE WATER YEAR 2015-16
(As measured at canal head)
: Madai Tank
Category : Medium
Name of river / tributary : Madai Nalla
Reporting Officer : E.E.,Hiran W.R.Dn. Jabalpur
C.E.,Wainganga Basin,W.R.D , Seoni
(Figures in MCM)
Month Year 1-10 11-20 21-30/31 Total
July 2015 0.31 0.07 0.20 0.58
August 2015 0.73 0.04 0.36 1.13
September 2015 0.11 0.39 0.25 0.75
October 2015 0.00 0.00 0.00 0.00
November 2015 0.00 0.00 0.00 0.00
December 2015 0.00 0.00 0.00 0.00
January 2016 0.00 0.00 0.00 0.00
February 2016 0.00 0.00 0.00 0.00
March 2016 0.00 0.00 0.00 0.00
April 2016 0.00 0.00 0.00 0.00
May 2016 0.00 0.00 0.00 0.00
June 2016 0.00 0.00 0.00 0.00
Total 1.15 0.50 0.81 2.46
Name of Project
36

AWA - 4
Category CCA (Ha) Total
Paddy Cotton Ground Nut Jowar/Maize Pulses Vegetables Fodder Soyabeen Others Kharif
1 2 3 4 5 6 7 8 9 10 11 12 13 14
1 Mehgaontola Tank Medium 2099 43 - - - - - - - - 43
769 769
2 Bohribund tank Medium 5423 3150 3150
2428 - - - - - - - - 2428
3 Barnoo Tank Medium 2030 365 365
1532 - - - - - - - - 1532
4 Madai Tank Medium 2330 160 160
1258 - - - - - - - - 1258
AREA IRRIGATED THROUGH MAJOR AND MEDIUM PROJECTS FOR THE WATER YEAR 2015-16
Cropwise actual / planned irrigated area during Kharif season (Ha)S.No.
Project
37

AWA - 4
Wheat Wheat Gram Pulses Vegetables Peas Linseed Total Perennial Pulses Vegetables Fodder & Total Hot
(HYV) (ORD) & others Rabi others Weather
1 2 3 15 16 17 18 19 20 21 22 23 24 25 26 27
1 Mehgaontola Tank Medium 1898 1898 - - - - -
911 911
2 Bohribund tank Medium 1435 - - - - - - 1435 - - - - -
4047 4047
3 Barnoo Tank Medium 358 - - - - - - 358 - - - - -
- 607 607
4 Madai Tank Medium - 206 - - - - - 206 - - - -
1073 1073
AREA IRRIGATED THROUGH MAJOR AND MEDIUM PROJECTS FOR THE WATER YEAR 2015-16
S.No.
Project Category
Cropwise actual / planned irrigated area during Rabi & Hot Weather ( Ha. )
38

AWA - 5
(i) MINOR SURFACE GRAVITY SCHEMES
Kharif RabiHot
weather
Peren
nialTotal Kharif Rabi Total
1 2 3 4 5 6 7 8 9 10 11 12 13 14
1 BARMANGHAT
( i ) E.E, Hiran W.R.Dn., Jabalpur 86 11119 7817 891 5684 - - 6575 2.67 17.51 20.18
( ii ) E.E, W.R.Dn., Katni 35 9146 6762 1127 622 - - 1749 4.85 3.48 8.33
Sub TotaL 121 20265 14579 2018 6306 - - 8324 7.52 20.99 28.51
No of
SchmesWater Resources DivisionCardinal SiteS.No.
A.II. UPSTREAM UTILIZATION
Actual Area Irrigated Water Utilization (MCM)
(b) MINOR PROJECTS
Planned
annual
Irrigation
(Ha)
CCA
39
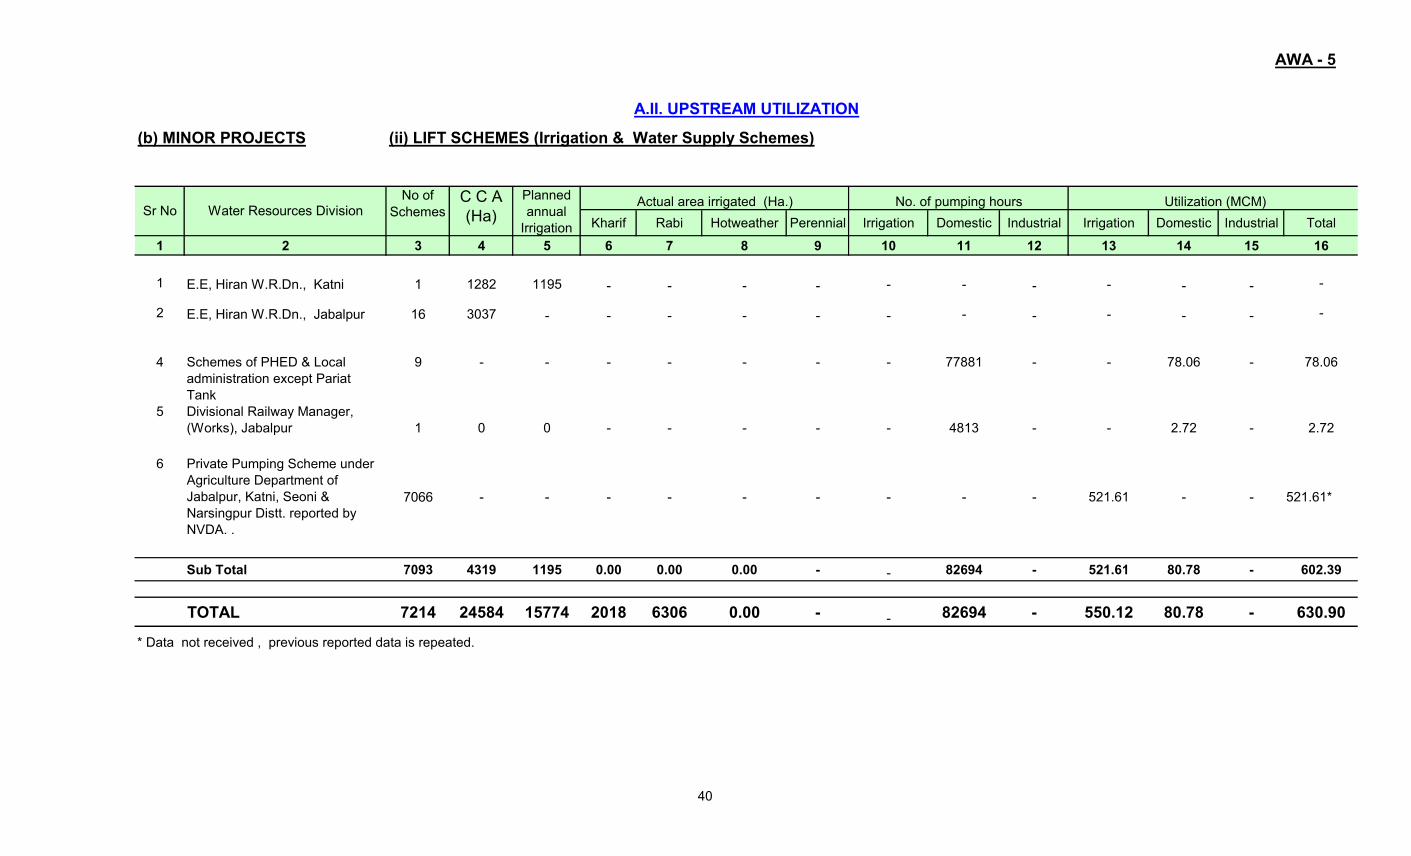
AWA - 5
(ii) LIFT SCHEMES (Irrigation & Water Supply Schemes)
Kharif Rabi Hotweather Perennial Irrigation Domestic Industrial Irrigation Domestic Industrial Total
1 2 3 4 5 6 7 8 9 10 11 12 13 14 15 16
1 E.E, Hiran W.R.Dn., Katni 1 1282 1195 - - - - - - - - - - -
2 E.E, Hiran W.R.Dn., Jabalpur 16 3037 - - - - - - - - - - - -
4 Schemes of PHED & Local
administration except Pariat
Tank
9 - - - - - - - 77881 - - 78.06 - 78.06
5 Divisional Railway Manager,
(Works), Jabalpur 1 0 0 - - - - - 4813 - - 2.72 - 2.72
6 Private Pumping Scheme under
Agriculture Department of
Jabalpur, Katni, Seoni &
Narsingpur Distt. reported by
NVDA. .
7066 - - - - - - - - - 521.61 - - 521.61*
Sub Total 7093 4319 1195 0.00 0.00 0.00 - - 82694 - 521.61 80.78 - 602.39
TOTAL 7214 24584 15774 2018 6306 0.00 - - 82694 - 550.12 80.78 - 630.90
* Data not received , previous reported data is repeated.
Water Resources Division
Planned
annual
Irrigation
(b) MINOR PROJECTS
A.II. UPSTREAM UTILIZATION
No of
SchemesActual area irrigated (Ha.) No. of pumping hours Utilization (MCM)
Sr NoC C A
(Ha)
40

AWA - 6
S.No. Reporting Officer Name of ProjectName of river /
tributary
Gross
Storage
Dead
Storage
Live
Storage C.C.A.
Live
storage as
on 1.7.2015
Live
storage as
on 1.7.2016
Change in
live storage
(MCM) (MCM) (MCM) (Ha) (MCM) (MCM) (MCM)
1 2 3 4 5 6 7 8 9 10 11
MEDIUM PROJECTS
1 E.E, Hiran W.R.Dn., Jabalpur Mehgaon Tola Tank Bidri Nalla/Gour 11.62 1.11 10.51 2099 1.43 0.95 -0.48
2 E.E, Hiran W.R.Dn., Jabalpur Barnoo Tank Barnoo Nalla 9.90 0.40 9.51 2030 0.68 0.72 0.04
3 E.E, Hiran W.R.Dn., Jabalpur Madai Tank Madia Nalla 8.21 0.30 7.92 2330 0.11 0.63 0.52
4 E.E, W.R.Dn., Katni Bohribund Tank Bhuta Nalla/Hiran 36.93 2.41 34.52 5428 0.05 0.78 0.73
5Commissioner, Municipal
Corporation, Jabalpur
Pariat Tank Pariat Nalla22.22 1.84 20.38 - 2.65 2.03 -0.62
88.88 6.06 82.84 11887 4.92 5.11 0.19
CARRYOVER LIVE STORAGE & DIFFERENCE IN LIVE STORAGE FOR THE MAJOR AND MEDIUM IRRIGATION PROJECTS
Total ( Medium Project )
41
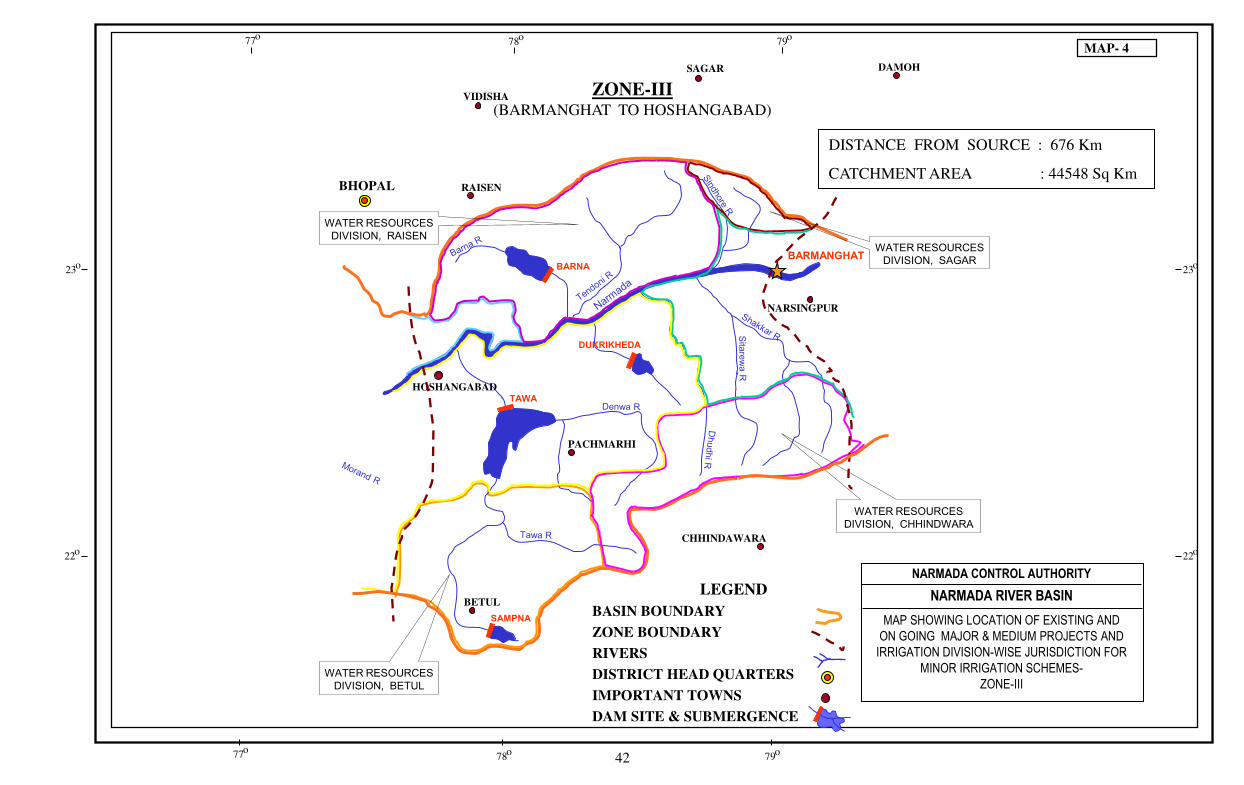
23 o
22 o
23 o
22 o
DAMOH SAGAR
VIDISHA
RAISEN BHOPAL
HOSHANGABAD
BETUL
CHHINDAWARA
NARSINGPUR
PACHMARHI
79 o 78 o 77 o
79 o 78 o 77 o
MAP- 4
WATER RESOURCES
DIVISION, SAGAR
WATER RESOURCES
DIVISION, RAISEN
WATER RESOURCES
DIVISION, BETUL
WATER RESOURCES
DIVISION, CHHINDWARA
BARNA
DUKRIKHEDA
TAWA
SAMPNA
NARMADA CONTROL AUTHORITY
NARMADA RIVER BASIN
MAP SHOWING LOCATION OF EXISTING AND
ON GOING MAJOR & MEDIUM PROJECTS AND
IRRIGATION DIVISION-WISE JURISDICTION FOR
MINOR IRRIGATION SCHEMES-
ZONE-III
LEGEND
BASIN BOUNDARY
ZONE BOUNDARY
RIVERS
DISTRICT HEAD QUARTERS
IMPORTANT TOWNS
DAM SITE & SUBMERGENCE
ZONE-III (BARMANGHAT TO HOSHANGABAD)
DISTANCE FROM SOURCE : 676 Km
CATCHMENT AREA : 44548 Sq Km
BARMANGHAT
42

ZONE - III
BARMANGHAT TO HOSHANGABAD

Sl No Description Unit
I Observed flow MCM 4019.41 9160.27
II Upstream Utilizations
II a. Major & Medium Projects MCM 1442.09 2239.81 3681.90
II b. Minor Projects MCM 1361.12 758.91 2120.03
II c. Total MCM 2803.21 2998.72 5801.93
III Change (increase`+' / decrease`-') in Live Storage MCM 154.55 -574.90 -420.35
IV Carryover storage (Live Storage as on 01.07.2015) MCM 678.43 667.16 1345.59
V Utilizable flow (I + IIc + III + IV ) MCM 7655.60 15887.44
MAF 6.21 12.88
Barmanghat to
Hoshangabad
Narmada upto
Hoshangabad
ZONE 3 - NARMADA UP TO HOSHANGABAD
SUMMARY
Upto
Barmanghat
43

Unit Irrigation Domestic Industrial Total
1 MCM 2231.52 - 8.29 2239.81
BREAK-UP OF SECTOR WISE WATER UTILIZATION FROM MAJOR, MEDIUM PROJECTS & MINOR SCHEMES
Category of Projects Water Utilization
Major & Medium Projects
S.No.
2 Minor Projects Including Lift &
Pumping Schemes
758.91MCM 757.32 1.59 -
44

AWA - 1
: HOSHANGABAD
Category : GDS
: Narmada
: E.E. Narmada Division C.W.C. Bhopal
Month Year 1-10 11-20 21-30/31 Total
July 2015 120.10 773.02 787.67 1680.79
August 2015 1,051.51 1,502.12 440.09 2993.72
September 2015 453.09 239.93 193.09 886.11
October 2015 162.86 168.53 118.24 449.63
November 2015 118.45 98.31 120.46 337.22
December 2015 105.29 101.96 109.24 316.49
January 2016 115.24 126.46 160.44 402.14
February 2016 143.87 146.33 135.27 425.47
March 2016 125.52 152.84 130.20 408.56
April 2016 134.84 133.28 155.23 423.35
May 2016 152.52 152.83 167.30 472.65
June 2016 130.26 108.37 125.51 364.14
Total 2,813.55 3,703.98 2,642.74 9,160.27
(Figures in MCM)
A.I. OBSERVED FLOW
Name of Gauge site
Name of river / tributary
Reporting Officer
45
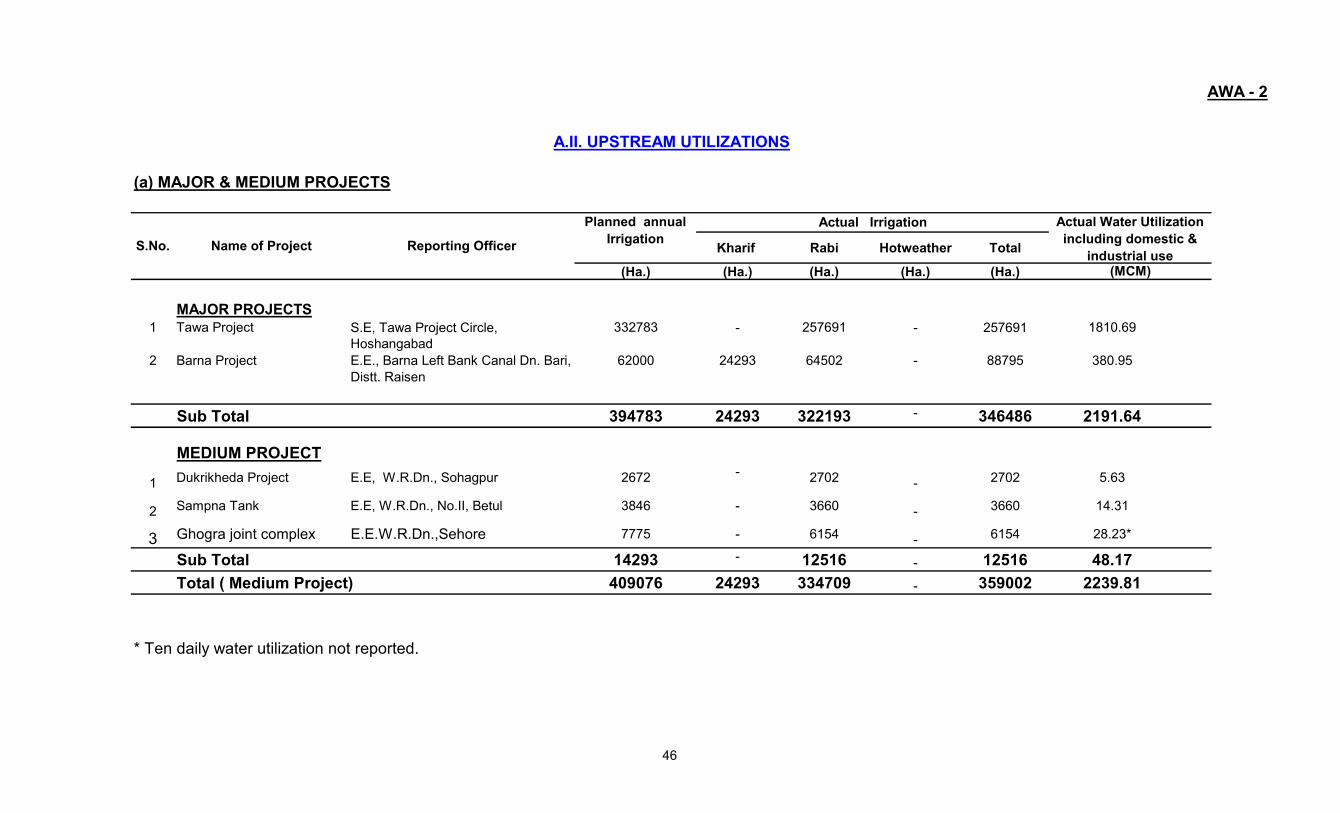
AWA - 2
Kharif Rabi Hotweather Total
(Ha.) (Ha.) (Ha.) (Ha.) (Ha.)
MAJOR PROJECTS
1 Tawa Project S.E, Tawa Project Circle, 332783 - 257691 - 257691 1810.69
Hoshangabad
2 Barna Project E.E., Barna Left Bank Canal Dn. Bari,
Distt. Raisen
62000 24293 64502 - 88795 380.95
Sub Total 394783 24293 322193 - 346486 2191.64
MEDIUM PROJECT
1 Dukrikheda Project E.E, W.R.Dn., Sohagpur 2672 - 2702 - 2702 5.63
2 Sampna Tank E.E, W.R.Dn., No.II, Betul 3846 - 3660 - 3660 14.31
3 Ghogra joint complex E.E.W.R.Dn.,Sehore 7775 - 6154 - 6154 28.23*
Sub Total 14293 - 12516 - 12516 48.17
Total ( Medium Project) 409076 24293 334709 - 359002 2239.81
* Ten daily water utilization not reported.
(a) MAJOR & MEDIUM PROJECTS
(MCM)
Actual Irrigation
A.II. UPSTREAM UTILIZATIONS
Planned annual
Irrigation
Actual Water Utilization
including domestic &
industrial useName of Project Reporting OfficerS.No.
46

AWA - 3
: : Tawa Project
Category : Major : Major
: Barna/Narmada :
: :
Month Year 1-10 11-20 21-30/31 Total 1-10 11-20 21-30/31 Total
July 2015 0.00 0.00 0.00 0.00 0.27 0.27 0.27 0.81
August 2015 0.00 0.00 8.24 8.24 0.26 0.26 0.26 0.78
September 2015 17.54 25.57 9.11 52.22 0.24 0.24 14.24 14.72
October 2015 25.68 18.20 0.00 43.88 0.25 34.00 98.87 133.12
November 2015 0.00 7.69 19.07 26.76 114.29 121.03 123.81 359.13
December 2015 29.17 24.00 17.15 70.32 121.96 123.70 140.87 386.53
January 2016 22.83 24.99 24.33 72.15 128.61 129.05 145.76 403.42
February 2016 27.34 27.62 26.76 81.72 130.22 123.10 60.48 313.80
March 2016 25.66 0.00 0.00 25.66 16.02 1.17 16.14 33.33
April 2016 0.00 0.00 0.00 0.00 40.97 40.97 40.97 122.91
May 2016 0.00 0.00 0.00 0.00 40.99 0.23 0.23 41.45
June 2016 0.00 0.00 0.00 0.00 0.23 0.23 0.23 0.69
Total 148.22 128.07 104.66 380.95 594.31 574.25 642.13 1,810.69 *
*Out of total 1810.69 MCM,1802.40 MCM used for Irrign.through from LBC & RBC & 8.291 MCM for Industrial use (Ordinance factory, Itarsi).
S.E., Tawa Project Circle Hoshangabad
WATER UTILIZATION BY MAJOR & MEDIUM IRRIGATION PROJECTS DURING THE WATER YEAR 2015-16(As measured at canal head)
Tawa/NarmadaName of river / tributary
Name of Project
Reporting Officer
C.E.,WRD, Circle, Hoshangabad
Barna Project
(Figures in MCM)
E.E.,Barna Left Bank Dn, Bari
S.E. Tawa Project Circle. Hoshangabad
(Figures in MCM)
47

AWA - 3
WATER UTILIZATION BY MAJOR & MEDIUM IRRIGATION PROJECTS DURING THE WATER YEAR 2015-16(As measured at canal head)
: : Sampna Tank
Category : Medium : Medium
: Ghogra & Dadka Nalla : Sampna
: : E.E., W.R.Dn. No. II Betul
C.E. WRD, Hoshangabad C.E. WRD, Hoshangabad
Month Year 1-10 11-20 21-30/31 Total 1-10 11-20 21-30/31 Total
July 2015 0.00 0.00 0.00 0.00 0.00 0.00 0.00 0.00
August 2015 0.00 0.00 0.00 0.00 0.00 0.00 0.00 0.00
September 2015 0.00 0.00 0.00 0.00 0.00 0.00 0.00 0.00
October 2015 0.00 0.00 0.00 0.00 0.00 0.00 0.00 0.00
November 2015 1.17 1.16 1.16 3.49 0.00 0.83 1.90 2.73
December 2015 0.74 0.71 0.69 2.14 1.65 0.00 0.64 2.29
January 2016 0.00 0.00 0.00 0.00 2.56 0.87 0.00 3.43
February 2016 0.00 0.00 0.00 0.00 0.05 2.48 0.84 3.37
March 2016 0.00 0.00 0.00 0.00 0.00 0.00 0.00 0.00
April 2016 0.00 0.00 0.00 0.00 0.00 0.00 0.00 0.00
May 2016 0.00 0.00 0.00 0.00 0.99 1.50 0.00 2.49
June 2016 0.00 0.00 0.00 0.00 0.00 0.00 0.00 0.00
Total 1.91 1.87 1.85 5.63 5.25 5.68 3.38 14.31
E.E. Pipariya Branch Canal Dn. Sohagpur
Name of river / tributary
Reporting Officer
(Figures in MCM) (Figures in MCM)
Name of Project Dukrikheda Tank
48

AWA - 4
Category CCA (Ha) Total
Paddy Cotton Ground Nut Jowar/Maize Pulses Vegetables Fodder Soyabeen Others Kharif
1 2 3 4 5 6 7 8 9 10 11 12 13 14
1 Tawa Project Major 246864 - - - - - - - - - -
74060 9308 12343 37030 12343 2469 4939 7446 159938
2 Barna Project Major 57904 24293 - - - - - - - - 24293
9000 9000
3 Dukrikheda Project Medium 7486 - - - - - - - - - -
4 Sampna Project Medium 4710 - - - - - - - - - -
5 Ghogra Project Medium 5600 - - - - - - - 0 0
2175 2175
AREA IRRIGATED THROUGH MAJOR AND MEDIUM PROJECTS FOR THE WATER YEAR 2015-16
Cropwise actual / planned irrigated area during Kharif season (Ha)S.No.
Project
49

AWA - 4
Wheat Wheat Gram Pulses Vegetables Peas Linseed Total Perenial Pulses Vegetables Fodder & Total Hot
(HYV) (ORD) & others Rabi others Weather
1 2 3 15 16 17 18 19 20 21 22 23 24 25 26 27
1 Tawa Project Major 247217 528 9427 - - - 519 257691 - - - - -
74060 61717 17280 2469 4937 4937 160463 3723 1862 1862 7447
2 Barna Project Major 44746 10182 6332 2710 532 - - 64502 - - - - -
39000 - - - - 39000
3 Dukrikheda Project Medium - - - - - - - 2702 - - - - -
2672 - 2672
4 Sampna Project Medium 3660 - - - - - - 3660 - - - - -
- 3644 36445 Ghogra Project Medium 700 2404 3050 6154
650 2100 2850 5600
;
AREA IRRIGATED THROUGH MAJOR AND MEDIUM PROJECTS FOR THE WATER YEAR 2015-16
S.No.
Project Category
Cropwise actual / planned irrigated area during Rabi & Hot Weather ( Ha. )
50

AWA - 5
(i) MINOR SURFACE GRAVITY SCHEME
Kharif RabiHot
weather
Peren
nial Total Kharif Rabi Total
1 2 3 4 5 6 7 8 9 10 11 12 13 14
1 HOSHANGABAD
( i ) E.E, W.R.Dn., Damoh 4 2683 2655 - 2510 - - 2510 - 12.60 12.60
( ii ) E.E, W.R.Dn., Chhindwara 18 5444 8546 - 5525 - - 5525 - 33.15 33.15
(iii ) S.E, Tawa Project Circle, Hoshangabad. 18 5070 4648 - 4132 - - 4132 - 18.53 18.53*
(iv) E.E, W.R.Dn., Raisen 53 16380 19734 382 15939 - - 16321 2.12 88.55 90.67
(v) E.E, W.R.Dn. No. 2, Betul. 50 15003 12189 - 14041 - - 13350 - 64.97 64.97
Sub Total 143 44580 47772 382 42147 - - 41838 2.12 217.80 219.92
* Data not received, previous reported data is repeated.
CCA
(Ha)
Planned
annual
Irrigation
(Ha)
Actual Area Irrigated (Ha) Water Utilization (MCM)
(b) MINOR PROJECTS
A.II. UPSTREAM UTILIZATION
S.No. Cardinal Site Water Resources DivisionNo of
Schmes
51

AWA - 5
(ii) LIFT SCHEMES (Irrigation & Water Supply Schemes)
Kharif Rabi Hotweather Perennial Irrigation Domestic Industrial Irrigation Domestic Industrial Total
1 2 3 4 5 6 7 8 9 10 11 12 13 14 15 16
1 E.E, W.R.Dn., Damoh - - - - - - - - - - - - - -
2 E.E, W.R.Dn., Chhindwara 4 604 724 - - - - - - - - - - -
3 S.E., Tawa Project Circle Hoshangabad. 3 354 360 - 90 - - 860 - - 0.66 - - 0.66
4 E.E, W.R.Dn., Raisen 3 537 - - - - - - - - - - - -
5 E.E, W.R.Dn. No. 2, Betul. 8 877 748 - - - - - - - - - - -
6 Schemes of PHED & Local
administration
3 - - - - - - - 2343 - - 1.59 - 1.59
7 Private Pumping Schemes under
Agriculture Department of Hoshangabad
(50%) reported by NVDA.
12388 - - - - - - - - - 536.74 - - 536.74 *
Sub Total 12409 2372 1832
-
90
-
- 860 2343 - 537.40 1.59
-
538.99
TOTAl 12552 46952 49604 382 42237 - - 860 2343 - 757.32 1.59-
758.91
* Data not received, previous reported data is repeated.
(b) MINOR PROJECTS
A.II. UPSTREAM UTILIZATION
No of
SchemesActual area irrigated (Ha.) No. of pumping hours Utilization (MCM)
Sr No Water Resources DivisionC C A
(Ha)
Planned
annual
Irrigation
52

AWA - 6
Gross
Storage
Dead
Storage
Live
Storage C.C.A.
Live storage
as on 1.7.2015
Live storage
as on 1.7.2016
Change
in live
storage
(MCM) (MCM) (MCM) (Ha) (MCM) (MCM) (MCM)
1 2 3 4 5 6 7 8 9 10 11
MAJOR PROJECTS
1 E.E., Barna Left Bank Canal
Dn. Bari.
Barna Project Barna/Narmada 539.04 83.20 455.80 57904 148.10 23.87 -124.23
2 S.E, Tawa Project Circle,
Hoshangabad
Tawa Project Tawa/Narmada 2311.54 367.57 1943.96 246886 516.71 51.00 -465.71
2850.58 450.77 2399.76 304790 664.81 74.87 -589.94
MEDIUM PROJECTS
1 E.E, W.R.Dn., Sohagpur Dukrikheda Project Ghogra Nalla 13.37 0.73 12.64 7486 0.00 0.00 0.00
2 E.E, W.R.Dn., No.II, Betul Sampna Tank Sampna 16.92 2.60 14.32 4710 0.00 14.32 14.32
3 E.E, W.R.Dn., Sehore Ghogra Project Ajnal/Narmada 31.83 3.60 28.23 5600 2.35 3.07 0.72
62.12 6.93 55.19 17796.00 2.35 17.39 15.04
2912.70 457.70 2454.95 322586 667.16 92.26 -574.90
CARRYOVER LIVE STORAGE & DIFFERENCE IN LIVE STORAGE FOR THE MAJOR AND MEDIUM IRRIGATION PROJECTS
Total ( Major & Medium Project )
Total ( Medium Project )
Total ( Major Project )
S.No. Reporting Officer Name of ProjectName of river /
tributary
53
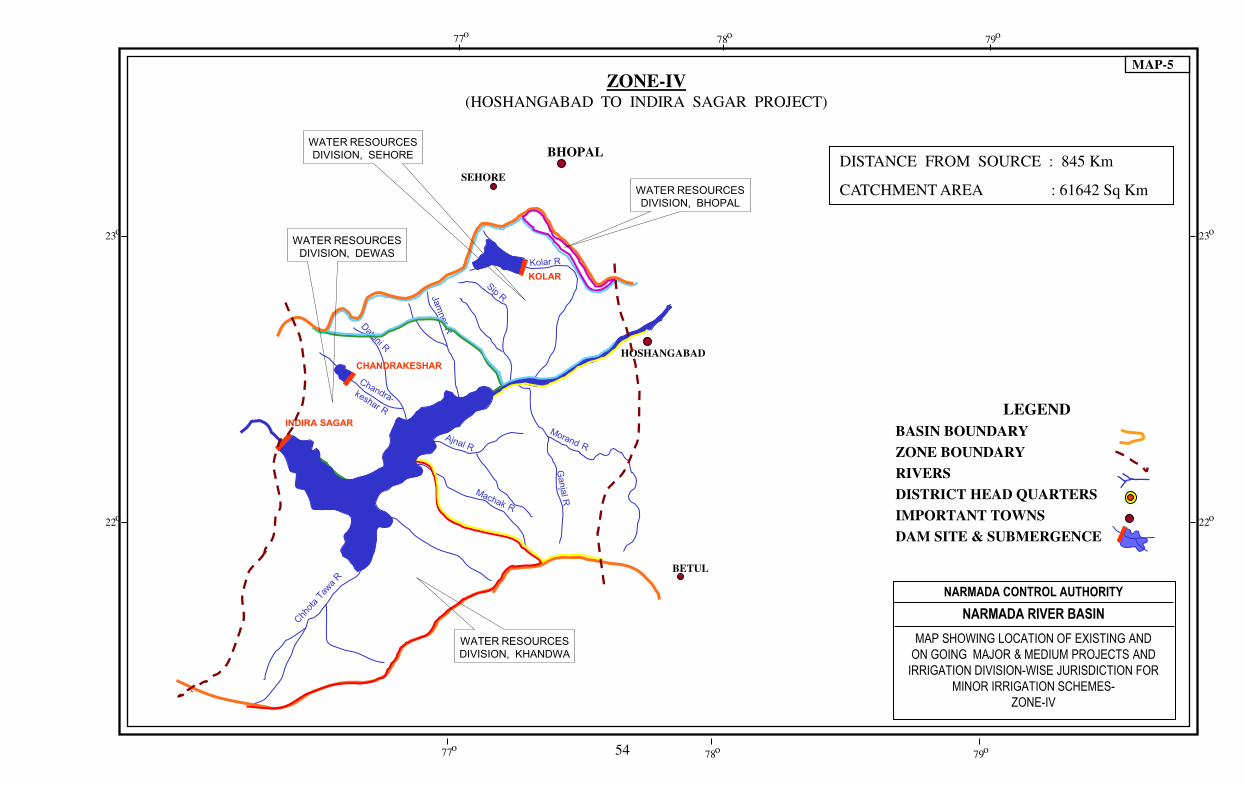
23 o
22 o
23 o
22 o
BHOPAL
SEHORE
HOSHANGABAD
BETUL
79 o 78 o 77 o
79 o 78 o 77 o
MAP-5
WATER RESOURCES
DIVISION, BHOPAL
WATER RESOURCES
DIVISION, SEHORE
WATER RESOURCES
DIVISION, DEWAS
WATER RESOURCES
DIVISION, KHANDWA
KOLAR
INDIRA SAGAR
CHANDRAKESHAR
NARMADA CONTROL AUTHORITY
NARMADA RIVER BASIN
MAP SHOWING LOCATION OF EXISTING AND
ON GOING MAJOR & MEDIUM PROJECTS AND
IRRIGATION DIVISION-WISE JURISDICTION FOR
MINOR IRRIGATION SCHEMES-
ZONE-IV
LEGEND
BASIN BOUNDARY
ZONE BOUNDARY
RIVERS
DISTRICT HEAD QUARTERS
IMPORTANT TOWNS
DAM SITE & SUBMERGENCE
ZONE-IV (HOSHANGABAD TO INDIRA SAGAR PROJECT)
DISTANCE FROM SOURCE : 845 Km
CATCHMENT AREA : 61642 Sq Km
54

ZONE - IV
HOSHANGABAD TO INDIRA SAGAR PROJECT

Sl No Description Unit
I Observed flow MCM 9160.27 12709.42
II Upstream Utilizations
II a. Major & Medium Projects MCM 3681.90 931.91 4613.81
II b. Minor Projects MCM 2120.03 590.21 2710.24
II c. Total MCM 5801.93 1522.12 7324.05
III Change (increase`+' / decrease`-') in Live Storage MCM -420.35 -334.28 -754.63
IV Carryover storage (Live Storage as on 01.07.2015) MCM 1345.59 1340.03 2685.62
V Utilizable flow (I + IIc + III + IV ) MCM 15887.44 21964.46
MAF 12.88 17.81
ZONE 4 - NARMADA UP TO INDIRA SAGAR PROJECT
SUMMARY
Narmada
upto ISP
Hoshangabad
to ISP
Upto
Hoshangabad
55
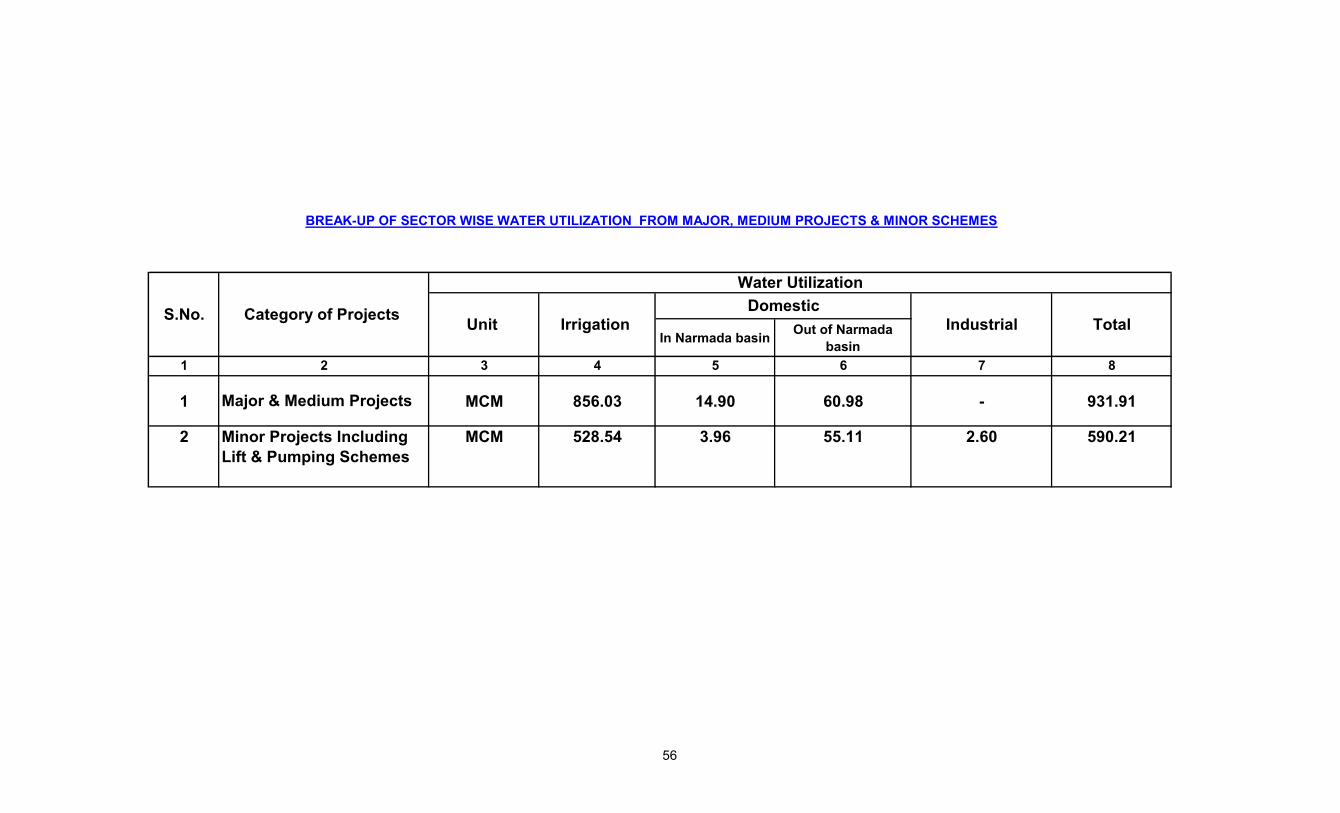
In Narmada basinOut of Narmada
basin
1 3 4 5 6 7 8
1 MCM 856.03 14.90 60.98 - 931.91
2.60
Major & Medium Projects
55.11
S.No.
2
2 Minor Projects Including
Lift & Pumping Schemes
MCM 528.54 590.213.96
BREAK-UP OF SECTOR WISE WATER UTILIZATION FROM MAJOR, MEDIUM PROJECTS & MINOR SCHEMES
Water Utilization
DomesticCategory of Projects
Unit Irrigation Industrial Total
56

AWA - 1
: INDIRA SAGAR PROJECT
Category : Major
: Narmada
: General Manager, NHDC, Narmada Nagar.
Month Year 1-10 11-20 21-30/31 Total
July 2015 207.52 365.30 316.81 889.63
August 2015 309.22 1,383.75 925.10 2618.07
September 2015 411.35 151.30 167.10 729.75
October 2015 235.09 536.28 354.58 1125.95
November 2015 282.18 208.57 353.38 844.13
December 2015 439.25 316.14 393.82 1149.21
January 2016 318.71 195.95 527.57 1042.23
Feburary 2016 348.44 391.72 249.70 989.86
March 2016 413.76 215.92 222.83 852.51
April 2016 217.81 290.05 369.84 877.70
May 2016 397.32 394.56 360.09 1151.97
June 2016 196.66 140.57 101.18 438.41
Total 3,777.31 4,590.11 4,342.00 12,709.42
(Figures in MCM)
A.I. OBSERVED FLOW (OUTFLOWS FROM POWER HOUSES & SPILLWAY)
Name of Gauge site
Name of river / tributary
Reporting Officer
57

AWA - 2
Kharif Rabi Hotweather Total
(Ha.) (Ha.) (Ha.) (Ha.) (Ha.)
MAJOR PROJECTS1 Indira Sagar project CE (Canals), ISP, NVDA, Sanawad 78000 34800.00 105122
-139922 661.07
EE, ND Dn. 25, Narmada Nagar.
2 Sukta (Bhagwant Sagar
Project)Project) E.E, W.R.Dn., Khandwa 14200 254.00 13400 13654 79.19
3 KolarProject E.E., Kolar Canal Dn. Nasrullaganj. 36050 - 36060 - 36060 167.28*
Sub Total 128250 35054.00 154582 - 189636 907.54
MEDIUM PROJECT
1 Chandrakeshar tank E.E, W.R.Dn., Dewas 6250 - 6250 - 6250 24.37
Sub Total 6250 - 6250 - 6250 24.37
Total ( Major & Medium Project) 134500 35054.00 160832 - 195886 931.91
*
Reporting OfficerS.No.
Out of 167.28 MCM water utilization of Kolar Project this includes the 106.30 MCM for water use for irrigation & 60.98 MCM for Bhopal Nagar Nigam
water supply .
(a) MAJOR & MEDIUM PROJECTS
(MCM)
Actual Irrigation
A.II. UPSTREAM UTILIZATIONS
Planned annual
Irrigation
Actual Water
Utilization including
domestic & industrial
use
Name of Project
58

AWA - 3
: : Chandrakeshar dam
Category : Major : Medium
: Kolar :
: :
Month Year 1-10 11-20 21-30/31 Total 1-10 11-20 21-30/31 Total
July 2015 1.70 1.74 1.65 5.09 0.00 0.00 0.00 0.00
August 2015 1.68 1.68 1.87 5.23 0.00 0.00 0.00 0.00
September 2015 1.68 1.73 1.70 5.11 0.00 0.00 0.00 0.00
October 2015 1.72 1.68 4.51 7.91 0.00 0.00 1.69 1.69
November 2015 17.64 14.76 10.15 42.55 3.60 2.46 1.94 8.00
December 2015 15.74 19.17 18.80 53.71 1.11 2.87 3.09 7.07
January 2016 19.27 1.63 1.85 22.75 1.35 1.12 4.00 6.47
February 2016 1.67 1.68 1.40 4.75 1.07 0.07 0.00 1.14
March 2016 1.66 1.65 1.84 5.15 0.00 0.00 0.00 0.00
April 2016 1.55 1.68 1.68 4.91 0.00 0.00 0.00 0.00
May 2016 1.65 1.68 1.83 5.16 0.00 0.00 0.00 0.00
June 2016 1.60 1.68 1.68 4.96 0.00 0.00 0.00 0.00
Total 67.56 50.76 48.96 167.28 7.13 6.52 10.72 24.37
* Out of total releases 167.28 MCM,106.30 MCM released for irrigation and 60.98 MCM released for domestic use.
Reporting Officer
Kolar Project
WATER UTILIZATION BY MAJOR & MEDIUM IRRIGATION PROJECTS DURING THE WATER YEAR 2015-16
(As measured at canal head)
ChandrakesharName of river / tributary
Name of Project
(Figures in MCM) (Figures in MCM)
C.E., N/T Basin, WRD, Indore.
E.E., Kolar Canal Dn. Nasrullaganj.
S.E. Kolar Project Circle. Hoshnagabad
EE, WR Dn, Dewas
59

AWA - 3
WATER UTILIZATION BY MAJOR & MEDIUM IRRIGATION PROJECTS DURING THE WATER YEAR 2015-16
(As measured at canal head)
Name of Project : Indira Sagar Project Sukta (Bhagwant Sagar Project)
Category : Major Major
Name of river / tributary : Narmada Sukta
Reporting Officer : EE., N.D. Dn., No.25, Narmada Nagar. EE, WR Dn, Khandwa
Sanawad Distt. Khargone. C.E., N/T Basin, WRD, Indore.
(Figures in MCM) (Figures in MCM)
Month Year 1-10 11-20 21-30/31 Total 1-10 11-20 21-30/31 Total
July 2015 0.00 10.10 0.00 10.10 0.00 1.13 0.00 1.13
August 2015 0.00 0.00 0.00 0.00 0.00 0.00 0.00 0.00
September 2015 0.00 0.00 0.00 0.00 0.00 0.00 0.00 0.00
October 2015 0.00 0.00 0.00 0.00 0.00 0.00 0.00 0.00
November 2015 26.49 32.55 43.31 102.35 1.13 5.03 7.78 13.94
December 2015 42.90 42.36 45.98 131.24 8.44 4.37 5.64 18.45
January 2016 41.64 41.14 32.67 115.45 4.40 3.87 8.17 16.44
February 2016 40.75 40.75 36.67 118.17 8.97 12.12 3.12 24.21
March 2016 40.75 40.75 0.00 81.50 2.06 0.72 0.38 3.16
April 2016 0.00 0.00 0.00 0.00 1.24 0.22 0.23 1.69
May 2016 0.00 0.00 9.18 9.18 0.17 0.00 0.00 0.17
June 2016 28.28 37.08 27.72 93.08 0.00 0.00 0.00 0.00
Total 220.81 244.73 195.53 661.07 26.41 27.46 25.32 79.19 *
* Out of total 79.19 MCM, 14.90 MCM for domestic use & 64.29 MCM for Irrigation use.
60

AWA - 4
Category CCA (Ha) Total
Paddy Cotton Ground Nut Jowar/Maize Pulses Vegetables Fodder Soyabeen Others Kharif
1 2 3 4 5 6 7 8 9 10 11 12 13 14
1 Kolar Project Major 45087 - - - - - - - - - -
2254 9018 451 902 11272 23897
2 Indira Sagar Project Major 123000 - - - - - - - - - 34800
3Sukta (Bhagwant Sagar
Project)Major 17643
- - - - - - - - - -
3000 1000 4000 8000
4 Chandrakeshar Project Medium 6213 - - - - - - - - - -
1212 1212
AREA IRRIGATED THROUGH MAJOR AND MEDIUM PROJECTS FOR THE WATER YEAR 2015-16
Cropwise actual / planned irrigated area during Kharif season (Ha)S.No.
Project
61

AWA - 4
Wheat Wheat Gram Pulses Vegetables Peas Linseed Total Perennial Pulses Vegetables Fodder & Total Hot
(HYV) (ORD) & others Rabi others Weather
1 2 3 15 16 17 18 19 20 21 22 23 24 25 26 27
1 Kolar Project Major - - - - - - - 36050 - - - - -
- 27953 9017 36970
2 Indira Sagar Project Major - - - - - - - 105122 - - - - -
10400 0 0 - - - 3000 13400 - - - - -
4640 1160 5800 400 400
Medium 1101 2403 2018 728 - - 0 6250 - - - -
3636 1212 - 4848
AREA IRRIGATED BY NARMADA WATER BY MAJOR AND MEDIUM PROJECTS FOR THE WATER YEAR 2015-16
Cropwise actual / planned irrigated area during Rabi & Hot Weather ( Ha. )S.No.
Project Category
Chandrakeshar
Project
Sukta (Bhagwant
Sagar Project)3 Major
4
62

AWA - 5
(i) MINOR SURFACE GRAVITY SCHEMES
Kharif RabiHot
weather
Peren
nial Total Kharif Rabi Total
1 2 3 4 5 6 7 8 9 10 11 12 13 14
1 INDIRA SAGAR PROJECT
( i ) WR Dn Sehore 101 11640 11699 - 12826 - - 12826 - 38.48 38.48
Sub Total 101 11640 11699 - 12826 - - 12826 - 38.48 38.48
No of
Schmes
CCA
(Ha)
Planned
annual
Irrigation
(Ha)
Actual Area Irrigated (Ha) Water Utilization (MCM)
(b) MINOR PROJECTS
A.II. UPSTREAM UTILIZATION
S.No. Cardinal Site Water Resources Division
63
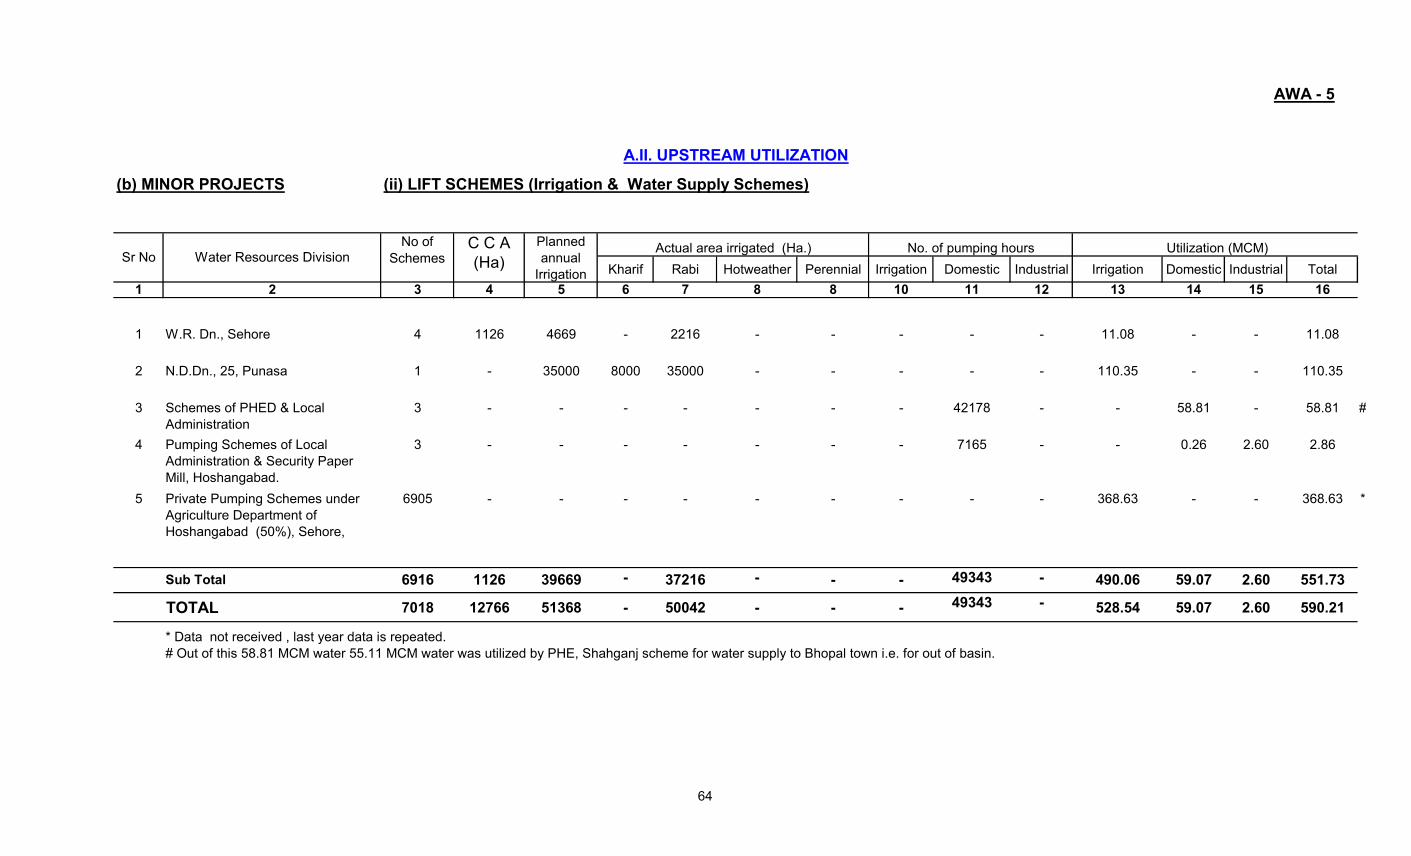
AWA - 5
(ii) LIFT SCHEMES (Irrigation & Water Supply Schemes)
Kharif Rabi Hotweather Perennial Irrigation Domestic Industrial Irrigation Domestic Industrial Total
1 2 3 4 5 6 7 8 8 10 11 12 13 14 15 16
1 W.R. Dn., Sehore 4 1126 4669 - 2216 - - - - - 11.08 - - 11.08
2 N.D.Dn., 25, Punasa 1 - 35000 8000 35000 - - - - - 110.35 - - 110.35
3 Schemes of PHED & Local
Administration
3 - - - - - - - 42178 - - 58.81 - 58.81 #
4 Pumping Schemes of Local
Administration & Security Paper
Mill, Hoshangabad.
3 - - - - - - - 7165 - - 0.26 2.60 2.86
5 Private Pumping Schemes under
Agriculture Department of
Hoshangabad (50%), Sehore,
Raisen & Betul reported by NVDA.
6905 - - - - - - - - - 368.63 - - 368.63 *
Sub Total 6916 1126 39669 - 37216 - - - 49343 - 490.06 59.07 2.60 551.73
TOTAL 7018 12766 51368 - 50042 - - - 49343 - 528.54 59.07 2.60 590.21
Sr No Water Resources Division
# Out of this 58.81 MCM water 55.11 MCM water was utilized by PHE, Shahganj scheme for water supply to Bhopal town i.e. for out of basin.
* Data not received , last year data is repeated.
C C A
(Ha)
Planned
annual
Irrigation
(b) MINOR PROJECTS
A.II. UPSTREAM UTILIZATION
No of
SchemesActual area irrigated (Ha.) No. of pumping hours Utilization (MCM)
64

AWA - 6
Gross
Storage
Dead
Storage
Live
Storage C.C.A.
Live storage as
on 1.7.2015
Live storage as
on 1.7.2016
Differenc
e (Col. 10-
9)
(MCM) (MCM) (MCM) (Ha) (MCM) (MCM) (MCM)
1 2 3 4 5 6 7 8 9 10 11
1
E.E., Kolar Canal Dn.
Nasrullaganj.
Kolar Project
Kolar 270.00 5.00 265.00 35040 79.00 12.55 -66.45
2General Manager, NHDC,
Narmada Nagar.
ISPNarmada 12212.00 2467.00 9745.00 123200 1228.00 924.00 -304.00
3 E.E., W.R. Dn., KhandwaSukta (Bhagwant
Sagar Project)Sukta 89.30 11.32 78.06 17643 31.20 69.20 38.00
12571.30 2483.32 10088.06 175883 1338.20 1005.75 -332.45
MEDIUM PROJECTS
1 E.E, W.R.Dn., Dewas Chandrakeshar Dam Chandrakeshar 30.06 1.59 28.48 6213 1.83 Below LSL -1.83
30.06 1.59 28.48 6213 1.83 0.00 -1.83
12601.36 2484.91 10116.54 182096 1340.03 1005.75 -334.28
CARRYOVER LIVE STORAGE & DIFFERENCE IN LIVE STORAGE FOR THE MAJOR AND MEDIUM IRRIGATION PROJECTS
Total ( Major & Medium Project )
Total ( Medium Project )
Total ( Major Project )
S.No. Reporting Officer Name of ProjectName of river /
tributary
65

KHANDWA
INDORE
PUNASA
23 o
22 o
23 o
22 o
75 o 76 o 74 o
75 o 74 o
MAP - 6
KHARGONE
THIKRI
WATER RESOURCES
DIVISION, MANDLESHWAR
WATER RESOURCES
DIVISION, KHARGONE
WATER RESOURCES
DIVISION, DEWAS
WATER RESOURCES
DIVISION, INDORE
MANDALESHWAR
MAHESHWAR
DEJLA
DEWADA
OMKARESHWAR
CHORAL
NAKHERI
PARAS
TANK
77 o
77 o 76 o
NARMADA CONTROL AUTHORITY
NARMADA RIVER BASIN
MAP SHOWING LOCATION OF EXISTING AND
ON GOING MAJOR & MEDIUM PROJECTS AND
IRRIGATION DIVISION-WISE JURISDICTION FOR
MINOR IRRIGATION SCHEMES-
ZONE-V
LEGEND
BASIN BOUNDARY
ZONE BOUNDARY
RIVERS
DISTRICT HEAD QUARTERS
IMPORTANT TOWNS
DAM SITE & SUBMERGENCE
INDIRA SAGAR
ZONE-V (INDIRA SAGAR PROJECT TO MANDLESHWAR)
DISTANCE FROM SOURCE : 940 Km
CATCHMENT AREA : 72809 Sq Km
66

ZONE - V INDIRA SAGAR PROJECT TO
MANDLESHWAR

Sl No Description Unit
I Observed flow (Measured at OSP) MCM 12709.42 15589.25
II Upstream Utilizations
II a. Major & Medium Projects MCM 4613.81 530.82 5144.63
II b. Minor Projects MCM 2710.24 906.46 3616.70
II c. Total MCM 7324.05 1437.28 8761.33
III Change (increase`+' / decrease`-') in Live Storage MCM -754.63 -8.71 -763.34
IV Carryover storage (Live Storage as on 01.07.2015) MCM 2685.62 18.31 2703.93
V Utilizable flow (I + IIc + III + IV ) MCM 21964.46 26291.17
MAF 17.81 21.31
ZONE 5 - NARMADA UP TO MANDLESHWAR
SUMMARY
ISP to
Mandleshwar
Upto
MandleshwarUpto ISP
67

In Narmada basinOut of Narmada
basin
1 MCM 529.82 1.00 - - 530.82Major & Medium Projects
BREAK-UP OF SECTOR WISE WATER UTILIZATION FROM MAJOR, MEDIUM PROJECTS & MINOR SCHEMES
S.No. Category of Projects
Water Utilization
Unit Irrigation Domestic
Industrial Total
2Minor Projects Including Lift &
Pumping Schemes- 906.46MCM 761.92 16.98 127.56
68

AWA - 1
: Omkareshwar Sagar Project (OSP)
Category : Project Station
: Narmada
: General Manager, NHDC Ltd,Siddhwarkoot Omkareshwar.
Month Year 1-10 11-20 21-30/31 Total
July 2015 240.88 494.38 554.34 1289.60
August 2015 848.37 1674.96 1138.87 3662.20
September 2015 513.61 272.42 20.61 806.64
October 2015 301.46 622.45 414.85 1338.76
November 2015 348.72 270.61 422.23 1041.56
December 2015 522.31 386.34 478.19 1386.84
January 2016 401.08 255.44 641.63 1298.15
Feburary 2016 425.53 486.51 321.02 1233.06
March 2016 477.58 242.38 259.50 979.46
April 2016 260.43 332.83 381.25 974.51
May 2016 408.97 409.51 305.97 1124.45
June 2016 202.92 136.53 114.57 454.02
Total 4951.86 5584.36 5053.03 15589.25
(Figures in MCM)
A.I. OBSERVED FLOW (OUTFLOWS FROM POWER HOUSE & SPILLWAY)
Name of Gauge site
Name of river / tributary
Reporting Officer
69

AWA - 2
Kharif Rabi Hotweather Total
(Ha.) (Ha.) (Ha.) (Ha.) (Ha.)
MAJOR PROJECT
1 Omkareshwar Sagar Project CE, Lower Narmada Projects, Indore 283324 5000 92000.00 - 97000 395.34
MEDIUM PROJECT
1 Paras Tank E.E, W.R.Dn., Dewas 1394 - 1500 - 1500 5.75
2 i. Choral Nakheri (Choral) 5036 - 3720 - 3720 19.20
ii. Choral Nakheri (Nakheri) Feeder dam
3 Dejla Dewada Tank E.E, W.R.Dn., Khargone 9000 - 9700 - 9700 97.53*
4 Upper Beda Tank EE., ND., Dn., No. 19, NVDA - - 3500 - 3500 13.00
Sub Total 15430 - 18420 - 18420 135.48
Total (Major & Medium Project) 298754 5000 110420 - 115420 530.82
* Out of 97.53 MCM water utilization of Dejla Dewda Tank , 96.53 MCM for water use for irrigation & 1.00 MCM for drinking water.
E.E, W.R.Dn., Indore
(a) MAJOR & MEDIUM PROJECTS
(MCM)
Actual Irrigation
A.II. UPSTREAM UTILIZATIONS
Planned annual
Irrigation
Actual Water
Utilization
including
domestic &
industrial use
Name of Project Reporting OfficerS.No.
70

AWA - 3
: :
Category : Medium : Medium
: Kunda :
: :
Month Year 1-10 11-20 21-30/31 Total 1-10 11-20 21-30/31 Total
July 2015 11.45 0.65 0.00 12.10
August 2015 38.19 0.65 0.00 38.84
September 2015 0.00 0.00 0.00 0.00
October 2015 0.00 0.00 0.00 0.00
November 2015 0.00 0.00 0.89 0.89
December 2015 4.06 10.24 4.30 18.60
January 2016 4.80 3.10 3.55 11.45
February 2016 2.85 5.50 5.40 13.75
March 2016 1.90 0.00 0.00 1.90
April 2016 0.00 0.00 0.00 0.00
May 2016 0.00 0.00 0.00 0.00
June 2016 0.00 0.00 0.00 0.00
Total 63.25 20.14 14.14 97.53 5.75 #
##
# #Out of total releases 97.53 MCM, 96.53 MCM released for irrgn. & 1.00 MCM released for domestic use. # Data not received on Ten Daily Basis.
Name of Project Dejla Dewada tank
C.E., N/T Basin, WRD, Indore.
(Figures in MCM)
Reporting Officer E.E, W.R.Dn., Khargone E.E, W.R.Dn., Dewas
Paras tank
WATER UTILIZATION BY MAJOR & MEDIUM IRRIGATION PROJECTS DURING THE WATER YEAR 2015-16
(As measured at canal head)
Name of river / tributary Paras
C.E., N/T Basin, WRD, Indore.
(Figures in MCM)
71

AWA - 3
WATER UTILIZATION BY MAJOR & MEDIUM IRRIGATION PROJECTS DURING THE WATER YEAR 2015-16
(As measured at canal head)
: :
Category : Medium : Medium
: :
: :
Month Year 1-10 11-20 21-30/31 Total 1-10 11-20 21-30/31 Total
July 2015 0.00 0.00 0.00 0.00 0.00 0.00 0.00 0.00
August 2015 0.00 0.00 0.00 0.00 0.00 0.00 0.00 0.00
September 2015 0.00 0.00 0.00 0.00 0.00 0.00 0.00 0.00
October 2015 0.00 0.00 0.00 0.00 0.00 0.00 0.00 0.00
November 2015 0.00 2.00 2.00 4.00 3.00 1.00 0.00 4.00
December 2015 2.00 1.50 1.50 5.00 2.00 1.00 0.00 3.00
January 2016 2.00 2.00 1.50 5.50 2.00 1.00 0.00 3.00
February 2016 1.50 1.00 1.00 3.50 2.00 1.00 0.00 3.00
March 2016 0.80 0.40 0.00 1.20 0.00 0.00 0.00 0.00
April 2016 0.00 0.00 0.00 0.00 0.00 0.00 0.00 0.00
May 2016 0.00 0.00 0.00 0.00 0.00 0.00 0.00 0.00
June 2016 0.00 0.00 0.00 0.00 0.00 0.00 0.00 0.00
Total 6.30 6.90 6.00 19.20 9.00 4.00 0.00 13.00
(Figures in MCM)
Name of Project
Name of river / tributary
Reporting Officer
Choral
(Figures in MCM)
E.E, W.R.Dn., Indore
C.E., N/T Basin, WRD, Indore.
Choral-Nakheri (Nakheri) Upper Beda Tank
Beda
E.E, ND Dn. No. 19, NVDA
72
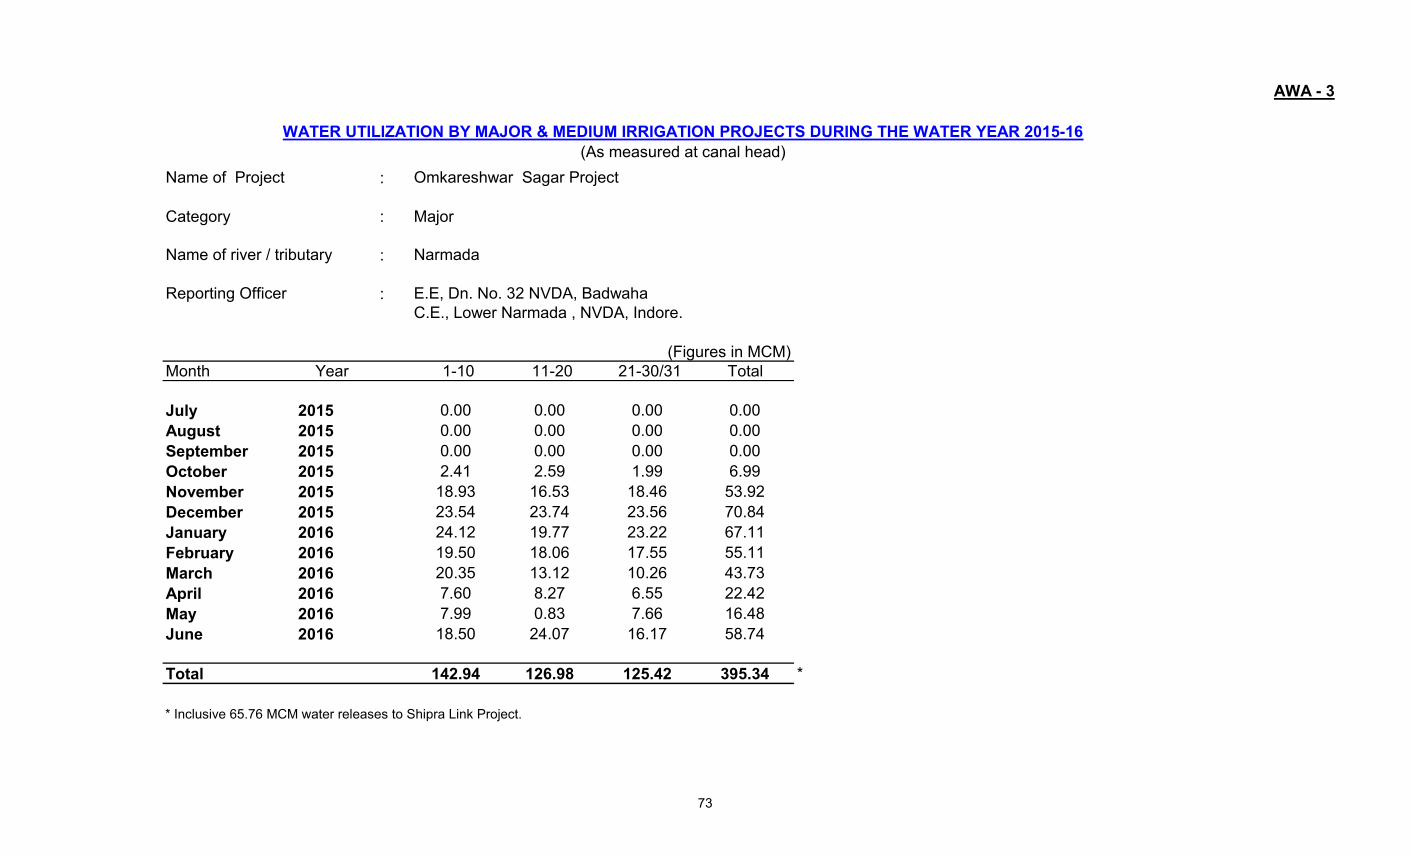
AWA - 3
WATER UTILIZATION BY MAJOR & MEDIUM IRRIGATION PROJECTS DURING THE WATER YEAR 2015-16
(As measured at canal head)
:
Category : Major
:
:
Month Year 1-10 11-20 21-30/31 Total
July 2015 0.00 0.00 0.00 0.00
August 2015 0.00 0.00 0.00 0.00
September 2015 0.00 0.00 0.00 0.00
October 2015 2.41 2.59 1.99 6.99
November 2015 18.93 16.53 18.46 53.92
December 2015 23.54 23.74 23.56 70.84
January 2016 24.12 19.77 23.22 67.11
February 2016 19.50 18.06 17.55 55.11
March 2016 20.35 13.12 10.26 43.73
April 2016 7.60 8.27 6.55 22.42
May 2016 7.99 0.83 7.66 16.48
June 2016 18.50 24.07 16.17 58.74
Total 142.94 126.98 125.42 395.34 *
* Inclusive 65.76 MCM water releases to Shipra Link Project.
Reporting Officer E.E, Dn. No. 32 NVDA, Badwaha
C.E., Lower Narmada , NVDA, Indore.
(Figures in MCM)
Name of Project Omkareshwar Sagar Project
Name of river / tributary Narmada
73

AWA - 4
Category CCA (Ha) Total
Paddy Cotton Ground Nut Jowar/Maize Pulses Vegetables Fodder Soyabeen Others Kharif
1 2 3 4 5 6 7 8 9 10 11 12 13 14
1 Omkareshwar Major 146800 - - - - - - - - - 5000
Sagar Project
2 Paras tank Medium 1507 - - - - - - - - - -
162 202 364
3 Medium 3900 - - - - - - - - - -
117 780 78 858 1833
4 Dejla Dewada Tank Medium 9000 - - - - - - - - - -
2700 900 1350 900 180 6030
5 Upper Beda Tank Medium - - - - - - - - - - 2000
AREA IRRIGATED THROUGH MAJOR AND MEDIUM PROJECTS FOR THE WATER YEAR 2015-16
Cropwise actual / planned irrigated area during Kharif season (Ha)
Choral-Nakheri
(Choral Project)
S.No.
Project
74
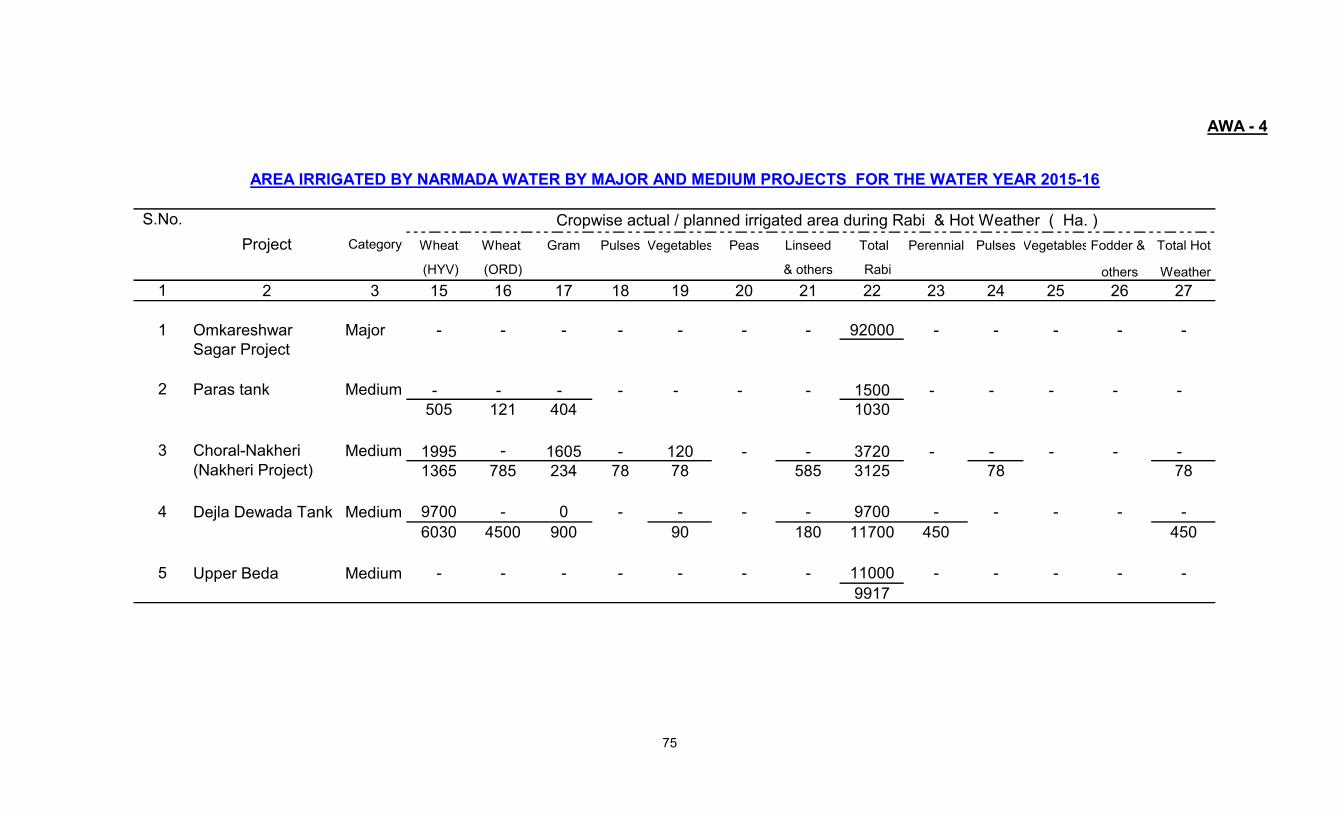
AWA - 4
Wheat Wheat Gram Pulses Vegetables Peas Linseed Total Perennial Pulses Vegetables Fodder & Total Hot
(HYV) (ORD) & others Rabi others Weather
1 2 3 15 16 17 18 19 20 21 22 23 24 25 26 27
1 Omkareshwar Major - - - - - - - 92000 - - - - -
Sagar Project
2 Paras tank Medium - - - - - - - 1500 - - - - -
505 121 404 1030
3 Medium 1995 - 1605 - 120 - - 3720 - - - - -
1365 785 234 78 78 585 3125 78 78
4 Dejla Dewada Tank Medium 9700 - 0 - - - - 9700 - - - - -
6030 4500 900 90 180 11700 450 450
5 Upper Beda Medium - - - - - - - 11000 - - - - -
9917
Cropwise actual / planned irrigated area during Rabi & Hot Weather ( Ha. )
Choral-Nakheri
(Nakheri Project)
AREA IRRIGATED BY NARMADA WATER BY MAJOR AND MEDIUM PROJECTS FOR THE WATER YEAR 2015-16
S.No.
Project Category
75

AWA - 5
(i) MINOR SURFACE GRAVITY SCHEMES
Kharif RabiHot
weather
Peren
nial Total Kharif Rabi Total
1 2 3 4 5 6 7 8 9 10 11 12 13 14
1 MANDLESHWAR
( i ) E.E, W.R.Dn., Indore * 18 3468 3063 - 2405 - - 2405 - 13.5 13.5
(ii) E.E, W.R.Dn., Dewas 12 4525 3506 - 3466 - - 3466 - 17.8 17.8
(iii) E.E, W.R.Dn., Khandwa 50 8347 7483 - 7275 - - 7275 - 36.38 36.38
(Iv) E.E, W.R.Dn., Khargone (part) 104 22930 28594 665 27926 - - 28591 - 116.2 116.2
Sub Total 184 39270 42646 665 41072 - - 41737 0.00 183.88 183.88
* Data not received, previous reported data is repeated.
A.II. UPSTREAM UTILIZATION
S.No. Cardinal Site Water Resources DivisionNo of
Schmes
CCA
(Ha)
Planned
annual
Irrigation
(Ha)
Actual Area Irrigated (Ha) Water Utilization (MCM)
(b) MINOR PROJECTS
76

AWA - 5
(ii) LIFT SCHEMES (Irrigation & Water Supply Schemes)
Kharif Rabi Hotweather Perennial Irrigation Domestic Industrial Irrigation Domestic Industrial Total
1 2 3 4 5 6 7 8 9 10 11 12 13 14 15 16
1 E.E, W.R.Dn., Dewas 2 460 460 - - - - - - - - - - -
2 E.E, W.R.Dn., Khandwa 5 705 598 - - - - - - - 0.00 - - 0.00
3 E.E, W.R.Dn., Khargone (part) 4 388 430 - - - - - - - - - - -
4 EE,.ND Dn., No.19, Bhikangaon 1 - 6945 1500 6500 - - - - - 10.38 - - 10.38
6 Schemes of PHED & Local
administration
12 - - - - - - - 85339 - - 144.54 - 144.54
7 Private Pumping Schemes under
Agriculture Department of Dewas,
Khandwa, Indore & Khargone Distt.
(40%) reported by NVDA.
9557 - - - - - - - - - 567.66 - - 567.66 *
Sub Total 9581 1553 8433 1500 6500 - - - 85339 - 578.04 144.54 - 722.58
TOTAL 9765 40823 51079 2165 47572 - - - 85339 - 761.92 144.54 - 906.46
(b) MINOR PROJECTS
C C A
(Ha)
* Data not received , previous reported data data is repeated.
A.II. UPSTREAM UTILIZATION
No of
SchemesActual area irrigated (Ha.) No. of pumping hours Utilization (MCM)
Sr No Water Resources Division
Planned
annual
Irrigation (Ha.)
77

AWA - 6
Gross
Storage
Dead
Storage
Live
Storage C.C.A.
Live storage
as on 1.7.2015
Live storage
as on 1.7.2016
Differenc
e (Col. 10-
9)
(MCM) (MCM) (MCM) (Ha) (MCM) (MCM) (MCM)
1 2 3 4 5 6 7 8 9 10 11
MAJOR PROJECTS
1 C.E., NHDC Ltd. Omkareshwar Sagar Project Narmada 987 688 299 146800 - - -
MEDIUM PROJECTS
2 E.E, W.R.Dn., Dewas Paras Tank Paras 30.06 1.59 28.48 6213 0.73 Below LSL -0.73
i. Choral Nakheri (Nakheri) Choral Feeder Tank
ii. Choral Nakheri (Choral) Choral 23.92 4.69 19.23 3900 6.13 - -6.13
4 E.E, W.R.Dn., Khargone Dejla Dewada Tank Kunda 56.35 6.06 50.29 9000 11.45 4.60 -6.85
5 EE, ND Dn., No. 19, NVDA Upper Beda Tank Beda 91.82 15.58 76.24 9900 0.00 5.00 5.00
202.15 27.92 174.24 29013 18.31 9.60 -8.71
1189.15 715.92 473.24 175813 18.31 9.60 -8.71
CARRYOVER LIVE STORAGE & DIFFERENCE IN LIVE STORAGE FOR THE MAJOR AND MEDIUM IRRIGATION PROJECTS
Total ( Major & Medium Project )
Total ( Medium Project )
E.E, W.R.Dn., Indore
S.No. Reporting Officer Name of ProjectName of river /
tributary
3
78

VADODARA
BHARUCH
SURAT
DHAR
GARUDESHWAR DHADGAON
ALIRAJPUR
BARWANI
NANDURBAR
23 o
22 o
23 o
22 o
75 o 76 o 74 o 73 o
75 o 74 o 73 o
MAP - 7
MANAWAR KUKSHI
KHARGONE
JAMBUGHODA
DABOI
ANKALESHWAR
THIKRI
WATER RESOURCES
DIVISION, KASRAWAD
WATER RESOURCES
DIVISION, BARWANI
WATER RESOURCES
DIVISION, DHAR
WATER RESOURCES
DIVISION, MANAWAR
WATER RESOURCES
DIVISION, ALIRAJPUR
GHATGHAR HYDRO
ELECTRIC PROJECT
CIRCLE, NASIK
NASIK IRRIGATION
CIRCLE,
NASIK
S S N N L,
GUJARAT
WATER RESOURCES
DIVISION, GOGAON
SARDAR
SAROVAR
DAM
JOBAT MAN DAM
SAKALDA
SATAK
TANK
SEGWAL
TANK
KUNDA
NARMADA CONTROL AUTHORITY
NARMADA RIVER BASIN
MAP SHOWING LOCATION OF EXISTING AND
ON GOING MAJOR & MEDIUM PROJECTS AND
IRRIGATION DIVISION-WISE JURISDICTION FOR
MINOR IRRIGATION SCHEMES-
ZONE-VI
LEGEND
BASIN BOUNDARY
ZONE BOUNDARY
RIVERS
DISTRICT HEAD QUARTERS
IMPORTANT TOWNS
DAM SITE & SUBMERGENCE
ZONE-VI (MANDLESHWAR TO SARDAR SAROVAR PROJECT)
DISTANCE FROM SOURCE : 1164 Km
CATCHMENT AREA : 87892 Sq Km
MANDALESHWAR
79
ZONE - VI
MANDLESHWAR TO SARDAR SAROVAR PROJECT

Sl No Description Unit
I Observed flow MCM 15589.25 16840.21
II Upstream Utilizations
II a. Major & Medium Projects utilization in M.P. MCM 5144.63 295.85# 5440.48
II b. Minor Projects MCM 3616.70 1192.22 4808.92
II c. Total Water utilization (to be considered ) MCM 8761.33 1488.07 10249.40
III Change (increase`+' / decrease`-') in Live Storage MCM -763.34 -161.71 -925.05
IV Carryover storage (Live Storage as on 01.07.2015) MCM 2703.93 716.77 3420.70
V Water Drawn By GOG Under Clause IV(5) MCM _ _ 417.29
VI Utilizable flow (I + IIc + III + IV- V ) MCM 26291.17 29167.97
MAF 21.31 23.64
# Excluding utilization by SSP which was already included in the observed flow of SSP.
SUMMARY
Mandleshwar to
SSP
Narmada
upto SSP
ZONE 6 - NARMADA UP TO SARDAR SAROVAR PROJECT
Upto
Mandleshwar
80

In the command of
Narmada basin
In the command of other
basin
1 MCM 5080.25 4261.82 47.40 11219.02
Industrial Total
1829.55
-
DomesticS.No. Category of Projects
Unit
1179.52
BREAK-UP OF SECTOR WISE WATER UTILIZATION FROM MAJOR, MEDIUM PROJECTS & MINOR SCHEMES
Water Utilization
12.70
Major & Medium Projects
2 Minor Projects Including
Lift & Pumping Schemes
- 1192.22
Irrigation
MCM
81

AWA - 1
: SARDAR SAROVAR PROJECT
Category : Major
: Narmada
: General Manager, SSNNL, Gandhinagar
Month Year 1-10 11-20 21-30/31 Total
July 2015 198.98 321.31 874.05 1394.34
August 2015 1,818.93 1,756.99 1,284.21 4860.13
September 2015 472.17 651.94 438.08 1562.19
October 2015 383.63 418.21 452.17 1254.01
November 2015 365.98 357.71 461.51 1185.20
December 2015 471.73 449.94 468.01 1389.68
January 2016 437.06 389.65 412.11 1238.82
February 2016 396.96 366.97 324.43 1088.36
March 2016 379.43 248.83 264.15 892.41
April 2016 112.22 99.31 104.83 316.36
May 2016 80.82 202.54 246.77 530.13
June 2016 276.16 549.83 302.59 1128.58
Total 5,394.07 5,813.23 5,632.91 16,840.21
(Figures in MCM)
A.I. OBSERVED FLOW (OUTFLOWS FROM SPILLWAY & POWER HOUSES)
Name of Gauge site
Name of river / tributary
Reporting Officer
82

AWA - 2
Kharif Rabi Hotweather Total
(Ha.) (Ha.) (Ha.) (Ha.) (Ha.)
MAJOR PROJECTS
1 Man C.E., Lower Narmada Projects,
Indore
15000 9465 12200 400 22065 153.24
2 Jobat C. E. Lower Narmada Zone, Indore 9848 6300 9200 200 15700 99.63
3 Sardar Sarovar Dam General Manager, SSNNL,
Gandhinagar
322301 181792 394249 - 576041 10430.57 #
Gujarat-Rajasthan Border - 48000 103000 - 151000 492.60
347149 245557 518649 600 764806 11176.04
MEDIUM PROJECT
1 Satak Tank E.E, W.R.Dn., Mandleshwar 1457 1445.00 2555 - 4000 14.08
2 Segwal Tank E.E, W.R.Dn., Barwani 1813 - 1630 - 1630 8.12
3 Kunda Tank E.E, W.R.Dn., No 1, Dhar 1658 - 1386 - 1386 8.10
4 Sakalda Tank E.E, W.R.Dn., Manawar 1700 - 2536 - 2536 12.68
Sub Total 6628 1445.00 8107 - 9552 42.98
Total ( Major & Medium Project) 353777 247002 526756 600 774358 11219.02
# Out of this total 10430.57 MCM of water released through HR of NMC,4772.73 MCM water utilized for irrigation in Narmada Command 1384.02 MCM water utilized for irrigation in other
command,1829.55 MCM water for domestic use,47.40 MCM water for Industrial Use, 1967.91 MCM for losses,storages in pool ,testing and other uses & 417.29 MCM of water drawn by GoG
during spillage period of SSP by invoking clause IV(5) towards maximization of power generation through CHPH will not be counted towards their share & includes 11.67 MCM of water drawn by
GoG though Godbole gate in addition to the mandatory releases of 600 Cusecs for environmental uses.
(a) MAJOR & MEDIUM PROJECTS
(MCM)
Actual Irrigation
Total ( Major Project)
A.II. UPSTREAM UTILIZATIONS
Planned annual
Irrigation
Actual Water Utilization
including domestic &
industrial useName of Project Reporting OfficerS.No.
83

AWA - 3
: :
Category : Major : Major
: : Hathni
: :
Month Year 1-10 11-20 21-30/31 Total 1-10 11-20 21-30/31 Total
July 2015 0.00 0.00 0.00 0.00 0.00 0.00 0.00 0.00
August 2015 0.00 0.00 1.54 1.54 0.00 0.00 1.04 1.04
September 2015 5.18 2.07 0.00 7.25 2.59 0.52 0.00 3.11
October 2015 0.00 2.94 11.01 13.95 0.00 0.00 0.00 0.00
November 2015 9.96 9.96 9.96 29.88 6.54 6.54 6.54 19.62
December 2015 9.96 9.96 10.96 30.88 6.54 6.54 7.19 20.27
January 2016 9.96 9.96 10.96 30.88 6.54 6.54 7.19 20.27
February 2016 9.96 9.96 8.97 28.89 6.54 6.54 5.89 18.97
March 2016 9.96 0.00 0.00 9.96 6.54 6.54 3.27 16.35
April 2016 0.00 0.00 0.00 0.00 0.00 0.00 0.00 0.00
May 2016 0.00 0.00 0.00 0.00 0.00 0.00 0.00 0.00
June 2016 0.00 0.00 0.00 0.00 0.00 0.00 0.00 0.00
Total 54.98 44.85 53.40 153.23 35.29 33.22 31.12 99.63
84
C.E., Lower narmada Projects, NVDA, Indore.
C.E., Lower Narmada Projects, NVDA, Indore.
(Figures in MCM)(Figures in MCM)
Reporting Officer
WATER UTILIZATION BY MAJOR & MEDIUM IRRIGATION PROJECTS DURING THE WATER YEAR 2015-16
(As measured at canal head)
ManName of river / tributary
Name of Project Man Project Jobat Project
E.E, Man Project Division, Indore

AWA - 3
WATER UTILIZATION BY MAJOR & MEDIUM IRRIGATION PROJECTS DURING THE WATER YEAR 2015-16
(As measured at canal head)
:
Category : Major
: Narmada
:
Month Year 1-10 11-20 21-30/31 Total
July 2015 180.90 291.17 254.79 726.86
August 2015 265.90 353.95 383.61 1,003.46
September 2015 365.07 349.02 261.94 976.03 4,772.73
October 2015 345.68 396.25 386.83 1,128.76 1,384.02
November 2015 335.35 334.75 444.69 1,114.79 1,829.55
December 2015 441.34 409.47 442.95 1,293.76 47.40
January 2016 442.55 395.83 430.84 1,269.22 1,967.91 10,418.90
February 2016 402.05 365.83 334.03 1,101.91 417.29 417.29
March 2016 378.29 241.53 219.73 839.55 10,001.61
April 2016 93.56 79.83 92.40 265.79 492.60
May 2016 67.92 192.40 225.60 485.92
June 2016 203.18 259.17 243.12 705.47 10,911.50 10,494.21 10,001.61
0.00
Total 3,521.79 3,669.20 3,720.51 10,911.50 *
85
Name of Project Sardar Sarovar Project
(Figures in MCM)
Name of river / tributary
Reporting Officer General Manager, SSNNL, Gandhinagar
*Out of this total 10911.50 MCM of water released through HR of NMC,4772.73MCM water utilized for irrigation in Narmada Command,1384.02 MCM water utilized for irrigation in other
command,1829.55 MCM water for domestic use,47.4 MCM water for Industrial Use, 1967.91 MCM for losses,storages in pool ,testing and other uses, 492.6 MCM for use of Rajasthan &
417.29 MCM of water drawn by GoG during spillage period of SSP by invoking clause IV(5) towards maximization of power generation through CHPH will not be counted towards their
share .

AWA - 3
WATER UTILIZATION BY MAJOR & MEDIUM IRRIGATION PROJECTS DURING THE WATER YEAR 2015-16
(As measured at canal head)
: :
Category : Medium : Medium
: Satak :
: :
Month Year 1-10 11-20 21-30/31 Total 1-10 11-20 21-30/31 Total
July 2015 0.00 0.00 0.00 0.00 0.00 0.00 0.00 0.00
August 2015 0.00 0.00 0.00 0.00 0.00 0.00 0.00 0.00
September 2015 0.00 0.00 0.00 0.00 0.00 0.00 0.00 0.00
October 2015 0.38 0.18 0.20 0.76 0.00 0.00 0.00 0.00
November 2015 0.20 0.29 0.98 1.47 0.00 0.00 0.00 0.00
December 2015 0.91 0.42 0.47 1.80 1.25 1.25 1.00 3.50
January 2016 1.08 1.08 1.35 3.51 0.40 0.40 0.42 1.22
February 2016 0.98 0.25 0.26 1.49 1.20 1.20 1.00 3.40
March 2016 1.54 0.85 0.35 2.74 0.00 0.00 0.00 0.00
April 2016 0.00 0.00 0.00 0.00 0.00 0.00 0.00 0.00
May 2016 0.00 0.20 0.24 0.44 0.00 0.00 0.00 0.00
June 2016 0.65 0.82 0.40 1.87 0.00 0.00 0.00 0.000
Total 5.74 4.09 4.25 14.08 2.85 2.85 2.42 8.12
86
(Figures in MCM)(Figures in MCM)
Segwal tank
E.E, W.R.Dn., Barwani
C.E., N/T Basin, WRD, Indore.
Name of river / tributary
C.E., N/T Basin, WRD, Indore.
Reporting Officer E.E, W.R.Dn., Khargone
Satak TankName of Project
Sozar Nala

AWA - 3
WATER UTILIZATION BY MAJOR & MEDIUM IRRIGATION PROJECTS DURING THE WATER YEAR 2015-16
(As measured at canal head)
:
Category : Medium Medium
: Buti Nalla Chiri/Khuh Nalla
:
Month Year 1-10 11-20 21-30/31 Total 1-10 11-20 21-30/31 Total
July 2015 0.00 0.00 0.00 0.00 0.00 0.00 0.00 0.00August 2015 0.00 0.00 0.00 0.00 0.00 0.00 0.00 0.00
September 2015 0.00 0.00 0.00 0.00 0.00 0.00 0.00 0.00
October 2015 0.00 0.00 0.00 0.00 0.00 0.00 0.00 0.00
November 2015 0.00 0.00 1.25 1.25 1.16 1.30 0.81 3.27
December 2015 1.00 1.00 1.00 3.00 1.32 1.24 1.14 3.70
January 2016 0.50 0.50 0.50 1.50 0.38 0.32 0.23 0.93
Feburary 2016 0.50 0.50 0.50 1.50 1.33 1.31 1.21 3.85
March 2016 0.50 0.35 0.00 0.85 0.38 0.32 0.23 0.93
April 2016 0.00 0.00 0.00 0.00 0.00 0.00 0.00 0.00
May 2016 0.00 0.00 0.00 0.00 0.00 0.00 0.00 0.00
June 2016 0.00 0.00 0.00 0.00 0.00 0.00 0.00 0.00
Total 2.50 2.35 3.25 8.10 4.57 4.49 3.62 12.68
87
Reporting Officer
(Figures in MCM)
Kunda tank
C.E., N/T Basin, WRD, Indore.
(Figures in MCM)
Sakalda tank
E.E, W.R.Dn., Dhar
C.E., N/T Basin, WRD, Indore.
E.E, W.R.Dn., Manawar
Name of river / tributary
Name of Project

AWA-4
Total
Paddy Cotton Ground Nut Jowar/Maize Pulses Vegetables Fodder Soyabeen Others Kharif
1 2 3 4 5 6 7 8 9 10 11 12 13 14
1 Major 15000 300 2015 1500 3500 - 450 - 1100 600 9465
300 3000 1500 3000 750 750 93002 Jobat Project* Major 9848 200 1500 1500 2000 - 300 - 400 400 6300
197 1477 1477 1970 191 295 5607
3 Segwal Tank Medium 747 - - - - - - - - - -
109 134 268 134 27 672
4 Satak tank Medium 2707 - 1094 - - 325 - 26 - - 1445
243 40 283
5 Kunda tank Medium 1658 - - - - - - - - - -
6 Sakalda Tank Medium 2350 - - - - - - - - - -
400 50 100 50 600
7 Sardar Sarovar Project Major 1869000 - - - - - - - - - 181792##44576 20051 1984 7930 2737 1727 2184 2203 83392
8 Narmada Main Canal Project Major151000 - - - - - - - - - 48000
14035 - - 4917 7373 21344** 47669
##
** This includes fruits 2764 Ha. & caster 18580 Ha. Note :- Cropwise actual area irrigation not reported by Govt. of Rajasthan.
GoG reported that "Total 576042 Ha. Area irrigated is reported by field officer. However a recent study carried out in Feb. 2016 by Bhaskaracharya
Institute for Space Application & Geo Informatics (BISAG) reveals that about 7.0 lakhs Ha. area is getting benefit of irrigation water through SSP.
AREA IRRIGATED THROUGH MAJOR AND MEDIUM PROJECTS FOR THE WATER YEAR 2015-16
Cropwise actual / planned irrigated area during Kharif season (Ha)
Man Project*
S.No. Project Category CCA (Ha)
88

AWA - 4
Wheat Wheat Gram Pulses Vegetables Peas Linseed Total Perennial Pulses Vegetables Fodder & Total Hot
(HYV) (ORD) & others Rabi others Weather
1 2 3 15 16 17 18 19 20 21 22 23 24 25 26 27
1 Major 5500 5600 500 - 300 - 300 12200 400 - - - 400
3000 3000 1500 300 7800 300 300 600
2 Jobat Project* Major 3500 5000 300 - 300 - 100 9200 200 - - 0 200
3940 985 492 295
5712 985 192 1177
3 Segwal Tank Medium 600 255 45 44 22 14 650 1630 - - - - -
68 672 402 1142
4 Satak tank Medium - 1788 340 - - 188 239 2555 - - - - -
810 40 324 1174
5 Kunda tank Medium 1000 136250 - - - - 1386
- - - - -
1658 1658
6 Sakalda Tank Medium 2536 - - - - - - 2536 - - - - -
1000 100 1100
7Sardar Sarovar
Project Major - - - - - - - 394249## - - - - -
50262 103539 23798 7265 13898 22716 35431 238909
8 Narmada Main
Canal ProjectMajor
- - - - - - - 103000 - - - -12293 - 15102 - 3569 - 72358* 103412
*This includes Cumin-23076, Musturd -32956, Fruits 2779 Ha, Fodder 2458 Ha., Isabgol-11089 Ha.
Man Project*
AREA IRRIGATED BY NARMADA WATER BY MAJOR AND MEDIUM PROJECTS FOR THE WATER YEAR 2015-16
S.No.
Project Category
Cropwise actual / planned irrigated area during Rabi & Hot Weather ( Ha. )
89

AWA - 5
(i) MINOR SURFACE GRAVITY SCHEMES
Kharif RabiHot
weather
Peren
nial Total Kharif Rabi Total
1 2 3 4 5 6 7 8 9 10 11 12 13 14
1 SARDAR SAROVAR
(i) E.E, W.R.Dn., Khargone (part) 69 15287 19063 443 27926 - - 28369 - 77.50 77.50
(ii) E.E, W.R.Dn., Barwani 95 16191 17536 - 17513 - - 17513 - 74.01 74.01
(iii) E.E, W.R.Dn., Dhar 59 15397 13477 - 13449 - - 13449 - 70.76 70.76
(iv) E.E, W.R.Dn., Manawar 141 17457 16349 - 17020 - - 17020 - 80.04 80.04
(v) E.E, W.R.Dn., Alirajpur 119 13222 13248 - 13251 - - 13251 - 58.69 58.69
(vi) E.E, N.D. Dn., Nandurbar 1 105 - - - - - - - - -
Sub Total 484 77659 79673 443 89159 - - 89602 - 361.00 361.00
A.II. UPSTREAM UTILIZATION
S.No. Cardinal Site Water Resources Division No of
Schems
CCA
(Ha)
Planned
annual
Irrigation
(Ha)
Actual Area Irrigated (Ha) Water Utilization (MCM)
(b) MINOR PROJECTS
90
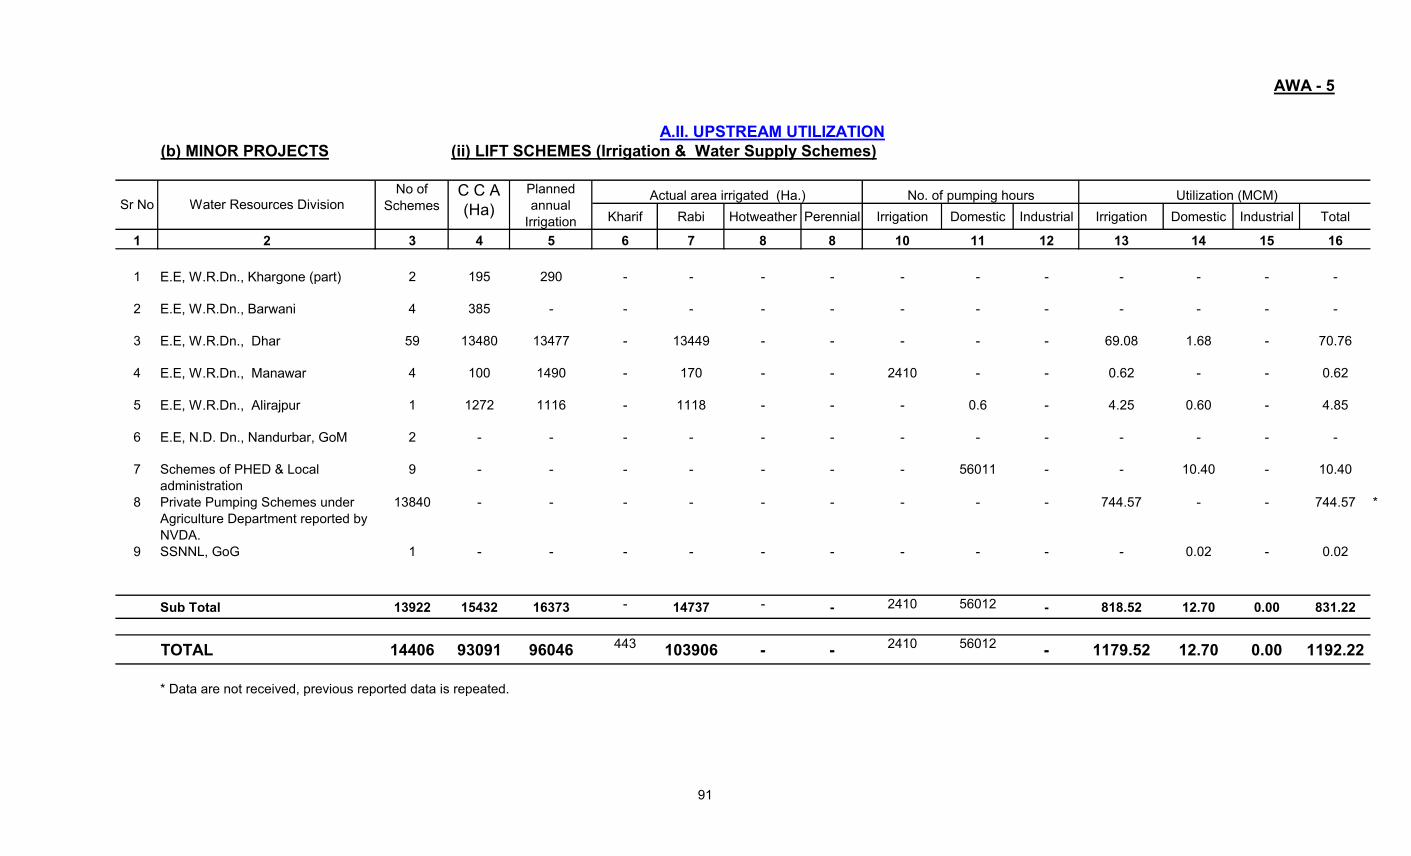
AWA - 5
(ii) LIFT SCHEMES (Irrigation & Water Supply Schemes)
Kharif Rabi Hotweather Perennial Irrigation Domestic Industrial Irrigation Domestic Industrial Total
1 2 3 4 5 6 7 8 8 10 11 12 13 14 15 16
1 E.E, W.R.Dn., Khargone (part) 2 195 290 - - - - - - - - - - -
2 E.E, W.R.Dn., Barwani 4 385 - - - - - - - - - - - -
3 E.E, W.R.Dn., Dhar 59 13480 13477 - 13449 - - - - - 69.08 1.68 - 70.76
4 E.E, W.R.Dn., Manawar 4 100 1490 - 170 - - 2410 - - 0.62 - - 0.62
5 E.E, W.R.Dn., Alirajpur 1 1272 1116 - 1118 - - - 0.6 - 4.25 0.60 - 4.85
6 E.E, N.D. Dn., Nandurbar, GoM 2 - - - - - - - - - - - - -
7 Schemes of PHED & Local
administration
9 - - - - - - - 56011 - - 10.40 - 10.40
8 Private Pumping Schemes under
Agriculture Department reported by
NVDA.
13840 - - - - - - - - - 744.57 - - 744.57 *
9 SSNNL, GoG 1 - - - - - - - - - - 0.02 - 0.02
Sub Total 13922 15432 16373 - 14737 - - 2410 56012 - 818.52 12.70 0.00 831.22
TOTAL 14406 93091 96046 443 103906 - - 2410 56012 - 1179.52 12.70 0.00 1192.22
* Data are not received, previous reported data is repeated.
Water Resources Division
Planned
annual
Irrigation
C C A
(Ha)
A.II. UPSTREAM UTILIZATION
(b) MINOR PROJECTS
No of
SchemesActual area irrigated (Ha.) No. of pumping hours Utilization (MCM)
Sr No
91

AWA - 6
Gross
Storage
Dead
Storage
Live
Storage C.C.A.
Live storage
as on 1.7.2015
Live storage
as on 1.7.2016
Difference (Col.
10-9)
(MCM) (MCM) (MCM) (Ha) (MCM) (MCM) (MCM)
1 2 3 4 5 6 7 8 9 10 11
1 C.E., Lower Narmada Zone,
NVDA, Indore
Man Man 145.03 19.16 125.87 15000 2.30 1.40 -0.90
2 C.E., Lower Narmada Zone,
NVDA, Indore
Jobat Hathni 77.84 7.80 70.04 9848 14.10 17.40 3.30
3 General Manager, SSNNL,
Gandhinagar
Sardar Sarovar Dam Narmada 9460.00 3700.00 5740.00 1869000 691.00 529.00 -162.00
9682.87 3726.96 5935.91 1893848 707.40 547.80 -159.60
MEDIUM PROJECTS
1 E.E, W.R.Dn., No 1, Dhar Kunda Tank Buti nalla 8.50 0.40 8.10 1658 0.00 0.00 0.00
2 E.E, W.R.Dn., Khargone Satak Tank Satak 19.80 1.43 18.37 2707 5.84 3.18 -2.66
3 E.E, W.R.Dn., Barwani Segwal TankZozar nalla /
Borad8.62 0.49 8.12 747 0.55 1.10 0.55
4 E.E, W.R.Dn., Manawar Sakalda TankChiri/Khug
nalla15.66 2.98 12.68 2350 2.98 2.98 0.00
52.58 5.30 47.27 7462 9.37 7.26 -2.11
9735.45 3732.26 6003.18 1901310 716.77 555.06 -161.71
92
92
CARRYOVER LIVE STORAGE & DIFFERENCE IN LIVE STORAGE FOR THE MAJOR AND MEDIUM IRRIGATION PROJECTS
Total ( Major & Medium Project )
Total ( Medium Project )
Total ( Major Project )
S.No. Reporting Officer Name of ProjectName of river
/ tributary

AWA - 3
: GUJARAT-RAJASTHAN BORDER
Category : Major
: Narmada Main Canal
: General Manager, (Technical), S.S.N.N.L., Gandhinagar.
Month Year 1-10 11-20 21-30/31
July 2015 - - - 29.18
August 2015 - - - -
September 2015 - - - -
October 2015 - - - -
November 2015 - - - 31.25
December 2015 - - - 105.73
January 2016 - - - 98.05
February 2016 - - - 83.24
March 2016 - - - 48.54
April 2016 - - - 29.69
May 2016 - - - 34.00
June 2016 - - - 32.92
Total - - - 492.60 *
*Ten daily data not reported.
TEN DAILY RELEASES OF NARMADA WATER FROM NARMADA MAIN CANAL TO RAJASTHAN, 2015-16
(As measured at Narmada main canal at 458.318 KM)
Name of Gauge site
Name of river / tributary
Reporting Officer
(Figures in MCM)
Total
93

BALAGHAT
MANDLA
SHAHDOL
JABALPUR
KAWARDAH
PENDRA
UMARIA
LEGEND
NARMADA BASIN BOUNDARY
GAUGE DISCHARGE &
SEDIMENT SITE
GAUGE DISCHARGE SITE
AMARKANTAK
82 o 81 o 80 o
82 o 81 o 80 o
23 o
22 o
23 o
22 o NARMADA CONTROL AUTHORITY
NARMADA RIVER BASIN
MAP SHOWING LOCATION OF GAUGE
DISCHARGE & SEDIMENT SITES IN
NARMADA BASIN
MAP-8
MOHGAON
MANOTE
DINDORI
JAMTARA
(Closed)
HRIDAYA
NAGAR
BAMNI
BANJAR
94

NARMADA CONTROL AUTHORITY
NARMADA RIVER BASIN
MAP SHOWING LOCATION OF GAUGE
DISCHARGE & SEDIMENT SITES IN
NARMADA BASIN
23 o
23 o
23 o
23 o
DAMOH SAGAR
VIDISHA
RAISEN BHOPAL
SEHORE
HOSHANGABAD
BETUL
CHINDAWARA
NARSINGPUR
PACHMARHI
79 o 78 o 77 o
79 o 78 o 77 o
LEGEND
NARMADA BASIN BOUNDARY
GAUGE DISCHARGE &
SEDIMENT SITE
GAUGE DISCHARGE SITE
MAP-9
PATAN
BARMANGHAT
GADARWARA
MAHESHWAR BARI
BARELI
SATRANA
(Closed)
TAWAKATI MACHNA
CHHIDGAON
SANDALPUR
HANDIA
HARDAKHAS
MANDLA
GINNORE
(Closed)
BELKHERI
HOSHANGABAD
SANDIA
95

VADODARA
BHARUCH
SURAT
KHANDWA
INDORE
DHAR
GARUDESHWAR
DHADGAON
ALIRAJPUR
BARWANI
PUNASA
NANDURBAR
22 o
22 o
22 o
22 o
75 o 76 o 74 o 73 o
75 o 74 o 73 o
NARMADA CONTROL AUTHORITY
NARMADA RIVER BASIN
MAP SHOWING LOCATION OF GAUGE
DISCHARGE & SEDIMENT SITES
INNARMADA BASIN
LEGEND
NARMADA BASIN BOUNDARY
GAUGE DISCHARGE &
SEDIMENT SITE
GAUGE DISCHARGE SITE
MAP-10
PATI
TIKOLA
(Closed) RAJGHAT
DHULSAR
AJANDIMAN
MANDLESHWAR
CHORAL
MORTAKKA
KOGAON THIKRI
KHARGONE
JOBAT
96