UCC Library and UCC researchers have made this item openly ...
355
UCC Library and UCC researchers have made this item openly available. Please let us know how this has helped you. Thanks! Title P-glycoprotein inhibition as a strategy to increase drug delivery across the blood-brain barrier: focus on antidepressants Author(s) O'Brien, Fionn E. Publication date 2013 Original citation O'Brien, F. E. 2013. P-glycoprotein inhibition as a strategy to increase drug delivery across the blood-brain barrier: focus on antidepressants. PhD Thesis, University College Cork. Type of publication Doctoral thesis Rights © 2013, Fionn E. O'Brien http://creativecommons.org/licenses/by-nc-nd/3.0/ Embargo information No embargo required Item downloaded from http://hdl.handle.net/10468/1400 Downloaded on 2022-03-12T11:14:04Z
-
Upload
khangminh22 -
Category
Documents
-
view
1 -
download
0
Transcript of UCC Library and UCC researchers have made this item openly ...

UCC Library and UCC researchers have made this item openly available.Please let us know how this has helped you. Thanks!
Title P-glycoprotein inhibition as a strategy to increase drug delivery acrossthe blood-brain barrier: focus on antidepressants
Author(s) O'Brien, Fionn E.
Publication date 2013
Original citation O'Brien, F. E. 2013. P-glycoprotein inhibition as a strategy to increasedrug delivery across the blood-brain barrier: focus on antidepressants.PhD Thesis, University College Cork.
Type of publication Doctoral thesis
Rights © 2013, Fionn E. O'Brienhttp://creativecommons.org/licenses/by-nc-nd/3.0/
Embargo information No embargo required
Item downloadedfrom
http://hdl.handle.net/10468/1400
Downloaded on 2022-03-12T11:14:04Z

Ollscoil na hÉireann
National University of Ireland
Coláiste na hOllscoile Corcaigh
University College Cork
School of Pharmacy
P-glycoprotein Inhibition as a Strategy to Increase
Drug Delivery across the Blood-Brain Barrier:
Focus on Antidepressants
Thesis presented by
Fionn E. O’Brien
under the supervision of Prof. John F. Cryan
Dr Brendan T. Griffin
for the degree of
Doctor of Philosophy
October, 2013
Head of School: Prof. Stephen Byrne

ii
Table of Contents
SCHOOL OF PHARMACY ................................................................................................................... II
DECLARATION ................................................................................................................................. X
ACKNOWLEDGEMENTS .................................................................................................................. XI
ABSTRACT .................................................................................................................................... XIII
CHAPTER 1: GENERAL INTRODUCTION ......................................................................................... 1
1.1. CENTRAL NERVOUS SYSTEM BARRIERS ........................................................................................... 2
1.2. THE BLOOD-BRAIN BARRIER: A MAJOR OBSTACLE IN THE DELIVERY OF DRUGS TO THE BRAIN ..................... 4
1.2.1. Structure and function of the BBB .................................................................................. 5
1.2.2. Routes of transport across the BBB ................................................................................ 9
1.2.3. Drug efflux transporters at the BBB ............................................................................. 13
1.2.4. Approaches to overcome the BBB to achieve drug delivery to the brain ..................... 14
1.2.4.1. Invasive approaches ......................................................................................................... 15
1.2.4.2. Non-invasive approaches .................................................................................................. 15
1.2.5. Methods to predict or measure drug transport across the BBB ................................... 16
1.2.5.1. In silico .............................................................................................................................. 16
1.2.5.2. In vitro............................................................................................................................... 18
1.2.5.3. In vivo and in situ approaches .......................................................................................... 22
1.2.5.4. Intracerebral microdialysis ............................................................................................... 24
1.3. P-GLYCOPROTEIN ................................................................................................................... 30
1.3.1. Structure and function of P-glycoprotein ..................................................................... 31
1.3.2. P-gp substrates and inhibitors ...................................................................................... 32
1.3.3. Regulation of P-gp expression and activity .................................................................. 35
1.3.4. Single nucleotide polymorphisms in ABCB1 .................................................................. 36
1.3.5. The contribution of P-gp efflux to treatment failure .................................................... 38
1.3.6. P-gp inhibition as a strategy to augment the therapeutic effects of P-gp substrate
drugs 40
1.3.7. Methods to assess drug interactions with P-gp at the BBB .......................................... 41
1.3.7.1. In silico approaches .......................................................................................................... 41
1.3.7.2. In vitro studies .................................................................................................................. 42
1.3.7.3. In vivo studies ................................................................................................................... 45
1.3.7.4. Human studies .................................................................................................................. 45
1.4. DEPRESSION .......................................................................................................................... 46
1.4.1. Neurobiology of depression .......................................................................................... 47
1.4.2. Treatment of depression .............................................................................................. 50
1.4.3. Side-effects of antidepressant drugs ............................................................................ 54
1.4.3.1. Serotonin syndrome ......................................................................................................... 55

Table of Contents
iii
1.4.4. Treatment-resistant depression ................................................................................... 57
1.4.5. Animal models of depression and antidepressant-like activity .................................... 61
1.4.6. P-gp expression and activity in depression ................................................................... 67
1.5. INTERACTIONS BETWEEN P-GP AND ANTIDEPRESSANT DRUGS AT THE BBB ......................................... 68
1.5.1. In vitro studies investigating the transport of antidepressants by P-gp ....................... 68
1.5.2. In vitro studies investigating the inhibition of P-gp by antidepressants ....................... 72
1.5.3. Limitations of in vitro studies investigating interactions between P-gp and
antidepressant drugs .................................................................................................................. 75
1.5.4. In vivo studies involving P-gp knockout rodents ........................................................... 76
1.5.5. In vivo studies involving P-gp inhibition in wild-type rodents ....................................... 87
1.5.6. Pharmacogenetic studies in humans ............................................................................ 92
1.5.7. Stress, the HPA axis, depression and P-gp .................................................................... 96
1.5.8. Inhibition of P-gp as a putative antidepressant augmentation strategy? .................. 103
1.6. AIMS OF THE THESIS .............................................................................................................. 107
1.6.1. Aim 1: Establish an integrated intracerebral microdialysis approach to determine the
effect of P-gp inhibition on antidepressant levels in the brain ................................................. 107
1.6.2. Aim 2: Establish and employ an in vitro model to identify antidepressants which are
transported substrates of human P-gp ..................................................................................... 108
1.6.3. Aim 3: Investigate the impact of P-gp inhibition on the pharmacodynamic activity of
antidepressants which are P-gp substrates .............................................................................. 108
1.6.4. Aim 4: Determine the effect of chronic treatment with a P-gp inhibitor and an
antidepressant on the brain distribution and behavioural and molecular responses to
antidepressant treatment ......................................................................................................... 109
CHAPTER 2: INHIBITION OF P-GLYCOPROTEIN ENHANCES TRANSPORT OF THE ANTIDEPRESSANT
IMIPRAMINE ACROSS THE BLOOD-BRAIN BARRIER: MICRODIALYSIS STUDIES IN THE CONSCIOUS
FREELY MOVING RAT ................................................................................................................... 110
ABSTRACT ......................................................................................................................................... 111
2.1. INTRODUCTION .................................................................................................................... 112
2.2. METHODS .......................................................................................................................... 115
2.2.1. Drugs and chemicals ................................................................................................... 115
2.2.2. Animals ....................................................................................................................... 115
2.2.3. Surgical procedures .................................................................................................... 115
2.2.3.1. Catheterization surgery .................................................................................................. 115
2.2.3.2. Microdialysis surgery ...................................................................................................... 116
2.2.4. Dialysis probe construction and calibration ............................................................... 116
2.2.5. Experimental design ................................................................................................... 117
2.2.6. Plasma extraction ....................................................................................................... 118

Table of Contents
iv
2.2.7. HPLC analysis .............................................................................................................. 119
2.2.7.1. HPLC equipment ............................................................................................................. 119
2.2.7.2. HPLC conditions .............................................................................................................. 119
2.2.7.3. Analyte identification and quantification ....................................................................... 120
2.2.8. Data analysis and statistical procedures .................................................................... 120
2.3. RESULTS ............................................................................................................................. 122
2.3.1. Plasma imipramine and desipramine pharmacokinetics ............................................ 122
2.3.2. Dialysate imipramine and desipramine pharmacokinetics ........................................ 125
2.3.3. Comparison of dialysate:plasma imipramine AUC ratios ........................................... 127
2.4. DISCUSSION ........................................................................................................................ 128
CHAPTER 3: HUMAN P-GLYCOPROTEIN DIFFERENTIALLY AFFECTS ANTIDEPRESSANT DRUG
TRANSPORT: RELEVANCE TO BLOOD-BRAIN BARRIER PERMEABILITY .......................................... 134
ABSTRACT ......................................................................................................................................... 135
3.1. INTRODUCTION .................................................................................................................... 136
3.2. METHODS .......................................................................................................................... 141
3.2.1. Drugs and chemicals ................................................................................................... 141
3.2.2. Cell-lines and materials .............................................................................................. 141
3.2.3. Cell culture .................................................................................................................. 141
3.2.4. Western blot analysis ................................................................................................. 141
3.2.5. Transport experiments ............................................................................................... 144
3.2.6. Transport experiment calculations ............................................................................. 145
3.2.7. Analytical procedures ................................................................................................. 146
3.3. RESULTS ............................................................................................................................. 149
3.3.1. Imipramine is a transported substrate of human P-gp in vitro .................................. 149
3.3.2. Human P-gp had no effect on the permeability of amitriptyline, duloxetine, fluoxetine
or mirtazapine in vitro .............................................................................................................. 150
3.3.2.1. Amitriptyline ................................................................................................................... 150
3.3.2.2. Duloxetine....................................................................................................................... 150
3.3.2.3. Fluoxetine ....................................................................................................................... 150
3.3.2.4. Mirtazapine ..................................................................................................................... 150
3.4. DISCUSSION ........................................................................................................................ 154
CHAPTER 4: P-GLYCOPROTEIN INHIBITION INCREASES THE BRAIN DISTRIBUTION AND
ANTIDEPRESSANT-LIKE ACTIVITY OF ESCITALOPRAM IN RODENTS .............................................. 161
ABSTRACT ......................................................................................................................................... 162
4.1. INTRODUCTION .................................................................................................................... 163
4.2. MATERIALS AND METHODS .................................................................................................... 165
4.2.1. Drugs and chemicals ................................................................................................... 165

Table of Contents
v
4.2.2. In vitro bidirectional transport studies ....................................................................... 165
4.2.3. In vivo pharmacokinetic studies ................................................................................. 166
4.2.3.1. Animals ........................................................................................................................... 166
4.2.3.2. Microdialysis probe construction and calibration .......................................................... 166
4.2.3.3. Surgical procedures ........................................................................................................ 166
4.2.3.4. Experimental design ....................................................................................................... 167
4.2.4. In vivo pharmacodynamic studies .............................................................................. 167
4.2.4.1. Tail suspension test......................................................................................................... 167
4.2.4.2. Locomotor activity .......................................................................................................... 168
4.2.5. HPLC analysis .............................................................................................................. 168
4.2.6. Data analysis and statistical procedures .................................................................... 169
4.3. RESULTS ............................................................................................................................. 170
4.3.1. In vitro bidirectional transport studies ....................................................................... 170
4.3.1.1. Western blot analysis ..................................................................................................... 170
4.3.1.2. Human P-gp limited escitalopram transport across MDCKII-MDR1 cells ........................ 170
4.3.2. In vivo pharmacokinetic studies ................................................................................. 175
4.3.2.1. P-gp inhibition had no effect on plasma escitalopram pharmacokinetics ...................... 175
4.3.2.2. P-gp inhibition increased escitalopram concentration in microdialysis samples ............ 175
4.3.2.3. Brain tissue escitalopram concentrations were increased following P-gp inhibition ..... 176
4.3.3. In vivo pharmacodynamic studies .............................................................................. 180
4.3.3.1. Verapamil augmented escitalopram response in tail suspension test ........................... 180
4.3.3.2. Effects of escitalopram and verapamil in the TST were not a function of increased
locomotor activity ................................................................................................................................ 181
4.3.3.3. Brain tissue concentrations of escitalopram were increased following verapamil pre-
treatment 181
4.3.3.4. Correlation between brain escitalopram concentration and immobility in the TST ....... 182
4.4. DISCUSSION ........................................................................................................................ 185
4.5. SUPPLEMENTARY INFORMATION: SUPPLEMENTARY MATERIALS AND METHODS ................................. 190
4.5.1. In vitro bidirectional transport studies ....................................................................... 190
4.5.1.1. Cell-lines and materials ................................................................................................... 190
4.5.1.2. Cell culture ...................................................................................................................... 190
4.5.1.3. Western blot analysis ..................................................................................................... 190
4.5.1.4. Transport Experiments ................................................................................................... 191
4.5.1.5. Transport experiment calculations ................................................................................. 192
4.5.2. Escitalopram extraction from plasma and brain tissue .............................................. 193
CHAPTER 5: THE P-GLYCOPROTEIN INHIBITOR CYCLOSPORIN A DIFFERENTIALLY INFLUENCES
BEHAVIOURAL AND NEUROCHEMICAL RESPONSES TO THE ANTIDEPRESSANT ESCITALOPRAM ... 195
ABSTRACT ......................................................................................................................................... 196
5.1. INTRODUCTION .................................................................................................................... 197

Table of Contents
vi
5.2. MATERIAL AND METHODS ...................................................................................................... 199
5.2.1. Drugs and chemicals ................................................................................................... 199
5.2.2. Animals ....................................................................................................................... 199
5.2.3. Effect of CsA administration in a mouse model of serotonin syndrome ..................... 199
5.2.4. Influence of CsA pre-treatment on the brain distribution and neurochemical and
behavioural effects of escitalopram ......................................................................................... 200
5.2.4.1. Tail suspension test......................................................................................................... 200
5.2.4.2. Brain concentrations of escitalopram, 5-HT and 5-HIAA ................................................ 201
5.2.4.3. Locomotor activity .......................................................................................................... 201
5.2.5. Microdialysis studies to investigate the effect of CsA pre-treatment on escitalopram-
induced increases in extracellular levels of 5-HT ...................................................................... 202
5.2.5.1. Microdialysis probe construction and calibration .......................................................... 202
5.2.5.2. Surgical procedures ........................................................................................................ 202
5.2.5.3. Experimental design ....................................................................................................... 203
5.2.5.4. HPLC analysis of 5-HT in microdialysis samples .............................................................. 203
5.2.6. Data analysis and statistical procedures .................................................................... 204
5.3. RESULTS ............................................................................................................................. 205
5.3.1. Effect of CsA administration in a mouse model of serotonin syndrome ..................... 205
5.3.1.1. Pre-treatment with CsA exacerbated the severity of behaviours associated with a mouse
model of serotonin syndrome ............................................................................................................. 205
5.3.2. Influence of CsA pre-treatment on the brain distribution and neurochemical and
behavioural effects of escitalopram ......................................................................................... 207
5.3.2.1. CsA pre-treatment increased hippocampal concentrations of escitalopram ................. 207
5.3.2.2. Pre-treatment with CsA augmented the effect of escitalopram on serotonin turnover in
the PFC 208
5.3.2.3. CsA pre-treatment did not augment escitalopram activity in the tail suspension test ... 210
5.3.2.4. CsA treatment significantly reduced locomotor activity ................................................. 211
5.3.3. Microdialysis studies to investigate the effect of CsA pre-treatment on escitalopram-
induced increases in extracellular levels of 5-HT ...................................................................... 213
5.3.3.1. Pre-treatment with CsA attenuated the increase in extracellular 5-HT in the PFC in
response to escitalopram administration ............................................................................................ 213
5.4. DISCUSSION ........................................................................................................................ 215
5.5. CONCLUSION ....................................................................................................................... 220
CHAPTER 6: P-GLYCOPROTEIN INHIBITION INCREASES THE BRAIN DISTRIBUTION OF THE
ANTIDEPRESSANT ESCITALOPRAM IN THE MOUSE: EFFECTS OF CHRONIC ADMINISTRATION ...... 221
ABSTRACT ......................................................................................................................................... 222
6.1. INTRODUCTION .................................................................................................................... 223
6.2. MATERIAL AND METHODS ...................................................................................................... 226
6.2.1. Drugs and chemicals ................................................................................................... 226

Table of Contents
vii
6.2.2. Animals ....................................................................................................................... 226
6.2.3. Experimental design ................................................................................................... 226
6.2.4. Tail suspension test .................................................................................................... 227
6.2.5. Determination of escitalopram and verapamil in brain and plasma samples ............ 227
6.2.6. Gene expression analysis ............................................................................................ 228
6.2.7. Data analysis and statistical procedures .................................................................... 228
6.3. RESULTS ............................................................................................................................. 230
6.3.1. Concomitant chronic treatment with the P-gp inhibitor verapamil and escitalopram
increased the brain levels of escitalopram, without affecting plasma levels ........................... 230
6.3.2. Body weight ................................................................................................................ 231
6.3.3. Tail suspension test .................................................................................................... 231
6.3.4. Gene expression analysis ............................................................................................ 232
6.4. DISCUSSION ........................................................................................................................ 235
CHAPTER 7: GENERAL DISCUSSION ........................................................................................... 240
7.1. OVERVIEW AND SUMMARY .................................................................................................... 241
7.2. THE NEED FOR MORE EFFECTIVE STRATEGIES TO IMPROVE RESPONSE TO ANTIDEPRESSANT TREATMENT.. 242
7.3. LIMITATIONS OF STUDIES IN P-GP KNOCKOUT MICE ..................................................................... 243
7.4. AN ADAPTABLE, INTEGRATED INTRACEREBRAL MICRODIALYSIS APPROACH TO ASSESS DRUG TRANSPORT
ACROSS THE BBB IN VIVO ..................................................................................................................... 245
7.5. THE IMPORTANCE OF IN VITRO STUDIES TO IDENTIFY DRUGS WHICH ARE TRANSPORTED SUBSTRATES OF
HUMAN P-GP..................................................................................................................................... 248
7.6. DETERMINING THE FUNCTIONAL RELEVANCE OF INCREASING BRAIN LEVELS OF ANTIDEPRESSANT DRUGS BY
P-GP INHIBITION: BEHAVIOURAL STUDIES ................................................................................................ 250
7.7. DO FINDINGS FROM ACUTE EXPERIMENTS IN RELATION TO THE IMPACT OF P-GP INHIBITION ON
ANTIDEPRESSANT TRANSPORT ACROSS THE BBB TRANSLATE TO CHRONIC STUDIES? ......................................... 252
7.8. LIMITATIONS OF THE WORK OUTLINED IN THIS THESIS .................................................................. 254
7.8.1. Limitations of in vivo studies ...................................................................................... 254
7.8.1.1. Intracerebral microdialysis ............................................................................................. 254
7.8.1.2. Non-selective nature of P-gp inhibitors used ................................................................. 255
7.8.1.3. Caution extrapolating findings in rodents to humans..................................................... 256
7.8.2. Limitations of in vitro studies ..................................................................................... 257
7.8.2.1. Non-BBB characteristics of cells used for in vitro studies ............................................... 258
7.8.2.2. Concentration-dependence of in vitro studies ............................................................... 258
7.9. IS P-GP INHIBITION A POTENTIALLY VIABLE OPTION TO AUGMENT ANTIDEPRESSANT TREATMENT CLINICALLY?
259
7.9.1. Which antidepressants are transported substrates of P-gp? ..................................... 259
7.9.2. Would adjunctive treatment with a P-gp inhibitor result in increased brain levels of a
P-gp substrate antidepressant in patients? .............................................................................. 264

Table of Contents
viii
7.9.3. How significant is the contribution of P-gp efflux to antidepressant resistance? ...... 264
7.9.4. Clinical promise and limitations of increasing brain distribution of P-gp substrate
antidepressants: Towards an antidepressant augmentation strategy? ................................... 265
7.10. OVERALL CONCLUSIONS AND FUTURE PERSPECTIVES .................................................................... 267
REFERENCES ................................................................................................................................. 269
APPENDIX A: ABBREVIATIONS ............................................................................................... 304
APPENDIX B: PUBLICATIONS AND PRESENTATIONS ............................................................... 307
B.1. PEER-REVIEWED PUBLICATIONS ............................................................................................... 307
B.2. MANUSCRIPTS IN PREPARATION: ............................................................................................. 307
B.3. CONFERENCE PRESENTATIONS ................................................................................................. 308
APPENDIX C: ESTABLISHMENT OF SURGICAL AND ANALYTICAL TECHNIQUES ........................ 310
C.1. INTRODUCTION .................................................................................................................... 311
C.2. METHODS .......................................................................................................................... 313
C.2.1. Drugs and chemicals ................................................................................................... 313
C.2.2. HPLC method development ........................................................................................ 313
C.2.2.1. HPLC equipment ............................................................................................................. 313
C.2.2.2. HPLC optimisation and validation ................................................................................... 313
C.2.2.3. HPLC conditions .............................................................................................................. 313
C.2.2.4. Analyte identification and quantification ....................................................................... 314
C.2.3. In vivo experiments ..................................................................................................... 314
C.2.3.1. Development of surgical procedures .............................................................................. 314
C.2.3.2. Catheterization surgeries ................................................................................................ 315
C.2.3.3. Blood sampling experiments .......................................................................................... 315
C.2.3.4. Plasma extraction ........................................................................................................... 315
C.2.3.5. Determination of diurnal variations in plasma corticosterone concentrations .............. 316
C.2.3.6. Development and validation of microdialysis technique ................................................ 316
C.2.3.7. Dialysis probe construction and calibration .................................................................... 316
C.2.3.8. Microdialysis surgery ...................................................................................................... 317
C.2.3.9. Microdialysis sampling experiments ............................................................................... 317
C.3. RESULTS ............................................................................................................................. 318
C.3.1. Optimal potential for ECD detector ............................................................................ 318
C.3.2. Calibration curves of HPLC method ............................................................................ 319
C.3.3. Plasma extraction efficiency ....................................................................................... 320
C.3.4. Imipramine and desipramine plasma profiles in anaesthetized rats .......................... 321
C.3.4.1. Following intravenous imipramine (15 mg.kg-1
) administration ..................................... 321
C.3.4.2. Following intraperitoneal imipramine (15 mg.kg-1
) administration ................................ 322
C.3.5. Imipramine and desipramine plasma profiles in conscious freely moving rats .......... 323
C.3.5.1. Following intravenous imipramine (1 mg.kg-1
) administration ....................................... 323

Table of Contents
ix
C.3.5.2. Following intravenous imipramine (5 mg.kg-1
) administration ....................................... 324
C.3.5.3. Following oral imipramine (30 mg.kg-1
) administration .................................................. 325
C.3.6. Diurnal variation in plasma corticosterone levels in a conscious freely moving rat one
day after catheterization surgery ............................................................................................. 326
C.3.7. Microdialysis probe recovery – in vitro experiments .................................................. 327
C.3.8. Imipramine and desipramine dialysate profiles in conscious freely moving rats after
intraperitoneal imipramine (30 mg.kg-1
) administration .......................................................... 328
C.4. DISCUSSION ........................................................................................................................ 329
APPENDIX D: MICRODIALYSIS PROBE CONSTRUCTION ........................................................... 332
D.1. BACKGROUND INFORMATION ................................................................................................. 332
D.2. MATERIALS ......................................................................................................................... 332
D.3. STEP-BY-STEP GUIDE ............................................................................................................. 333
D.3.1. Probe building ............................................................................................................ 333
D.3.2. Make aCSF (quantities for 500ml): ............................................................................. 334
D.3.3. Activate membrane of the probe ............................................................................... 334
D.3.4. Setting up syringes in pump. ...................................................................................... 334
APPENDIX E: MICRODIALYSIS SURGERY PROTOCOL ............................................................... 335
E.1. BACKGROUND INFORMATION ................................................................................................. 335
E.2. MATERIALS ......................................................................................................................... 335
E.3. STEP-BY-STEP GUIDE ............................................................................................................. 336
E.4. POST-SURGERY .................................................................................................................... 337
APPENDIX F: JUGULAR VEIN CATHETERISATION .................................................................... 338
F.1. METHODOLOGICAL NOTES ..................................................................................................... 338
APPENDIX G: CAROTID ARTERY CATHETERISATION ................................................................ 340
G.1. METHODOLOGICAL NOTES ..................................................................................................... 340

x
Declaration
This thesis comprises original work carried out by the author and has not been
submitted for any other degree at University College Cork, or elsewhere.
Author Contributions
All of the work described herein was performed independently by the author, with
the following exceptions:
Chapter 2
Dr Gerard Clarke assisted with the development and running of the HPLC method.
Chapter 4, 5 and 6
Dr Richard O’Connor conducted the tail suspension tests and locomotor activity
tests.
Chapter 5
Dr Gerard Clarke performed the analysis of monoamine content in brain tissue.
Maria Donovan assisted with the microdialysis experiments.
Chapter 6
Dr Karen Scott carried out the majority of the RNA extractions. Gerard Moloney
performed the majority of the PCR analyses.
Signed,
Fionn E. O’Brien

xi
Acknowledgements
I would firstly like to thank my PhD supervisors, Professor John F. Cryan and Dr
Brendan Griffin, for all of their support, guidance and instruction throughout my
PhD. research. It has been a great pleasure and tremendous honour to work under
their supervision, and to benefit from their wisdom and expertise.
Furthermore, I would like to express my gratitude to the Alimentary Pharmabiotic
Centre and the School of Pharmacy for providing me with the opportunity to pursue
my PhD research here in UCC.
To paraphrase a quote from Halford E. Luccock (via Yuliya – thanks Yuliya!), it takes
a whole orchestra to play a symphony. In this context, it is important to
acknowledge all the help and support I have received from my fellow labmates
throughout my PhD research, without whom I may as well have been whistling in
the wind! I would, therefore, like to thank Ted Dinan, Ger Clarke, Pat Fitzgerald,
Richard O’Connor, Maria Donovan, Gerry Moloney and Karen Scott, all of whom are
co-authors of work described in this thesis, and without whose help it would not
have been possible to complete those studies. Similarly, I’d like to sincerely thank
everyone else in the Lab of Neurogastroenterology for generating such a friendly,
helpful and collegial atmosphere within the group, especially our lab managers over
the years: Marcela Julio-Pieper; Sue Grenham; Ger Clarke; and the Moloneys, Gerry
and Rachel (no relation!). Selecting individuals for special thanks is a difficult
proposition; not due to a lack of people deserving of gratitude, but because of the
fear of omitting any of the many who have offered me much appreciated help
throughout my PhD. Nonetheless, it would be remiss of me not to specifically
express my gratitude to Caroline, for taking me under her wing and introducing me
to science when I was still an undergrad; Harriët, for teaching me cell culture
techniques; Javier, for being a fountain of knowledge in the early days; Anna, Aoife,
Caroll and Rachel, for their help with western blots; Olivia, for her much-valued
advice; Lieve, for her willingness to step in and help out when needed; and Colette,
for all her (underappreciated) work.

Acknowledgements
xii
I was also fortunate to be associated with the Pharmaceutics group in the School of
Pharmacy, and would like to thank all in that lab for their help and kindness. In
particular, Waleed, Fatma, Tom and Ken offered me much-valued advice and
assistance over the years.
Of course, there is more to life than science, and I am also grateful to have had the
opportunity to meet so many wonderful people and make such terrific, hopefully
lifelong, friends during my time in the lab. A special mention must go to Declan,
Kieran and Richard (all Brilliantly Overachieving Young Scientists) in this regard, as
well as the rest of COBRA (you know who you are!).
Last, but not least, I’d like to express my gratitude to my parents, Maura and
Stephen, my brother, Mark, and my beautiful, patient girlfriend, Sarah, who have
provided me with much needed support, love and encouragement throughout my
PhD.
Thank you all!

xiii
Abstract
Depression is among the leading causes of disability worldwide, affecting more than
350 million people globally. Currently available antidepressant drugs have
unsatisfactory efficacy, with up to 60% of depressed patients failing to respond
adequately to treatment. Emerging evidence has highlighted a potential role for the
multidrug efflux transporter P-glycoprotein (P-gp; encoded by the ABCB1 gene),
expressed at the blood-brain barrier (BBB), in the aetiology of treatment-resistant
depression. In the research outlined in this thesis, the potential of P-gp inhibition as
a strategy to enhance the brain distribution and pharmacodynamic effects of
antidepressant drugs was investigated in preclinical studies.
Microdialysis-based pharmacokinetic studies revealed that administration of the P-
gp inhibitors verapamil or cyclosporin A (CsA) enhanced the BBB transport of the
antidepressants imipramine and escitalopram in the conscious, freely moving rat.
Furthermore, P-gp inhibition by verapamil increased brain concentrations of
escitalopram following chronic administration in mice.
In addition to these in vivo studies, both imipramine and escitalopram were found
to be transported substrates of human P-gp using an in vitro bidirectional transport
model in Madine-Darby canine kidney cells transfected with ABCB1 (MDCK-MDR1).
These data indicate that in vivo findings demonstrating that P-gp limits the brain
levels of these two antidepressants in rodents may translate to humans. Moreover,
using the same in vitro model, we found that human P-gp exerted no effect on the
transport of four other antidepressants: amitriptyline, duloxetine, fluoxetine and
mirtazapine.
To build on the above-mentioned pharmacokinetic studies, the effect of P-gp
inhibition on pharmacodynamic responses to antidepressant treatment was
investigated in vivo. Pre-treatment with verapamil augmented the behavioural
effects of escitalopram in the tail suspension test (TST), a widely used and well-
validated model to assess antidepressant-like activity in mice. However, similar
augmentation effects in the TST were not observed in studies involving CsA.

Abstract
xiv
Moreover, pre-treatment with CsA exacerbated the behavioural manifestation of
an escitalopram-induced mouse model of serotonin syndrome, a serious adverse
reaction associated with serotonergic drugs. This finding highlights the potential for
unwanted side-effects which may occur as a result of increasing brain levels of
antidepressants by P-gp inhibition, although further studies are needed to fully
elucidate the mechanism(s) at play.
Taken together, the research outlined in this thesis demonstrates that P-gp may
restrict brain concentrations of escitalopram and imipramine in patients.
Furthermore, we have shown that chronic treatment with a P-gp inhibitor and a P-
gp substrate antidepressant results in elevated brain levels of the antidepressant.
Moreover, increasing the brain distribution of an antidepressant by P-gp inhibition
can result in an augmentation of antidepressant-like activity in vivo. These findings
raise the possibility that P-gp inhibition may represent a potentially beneficial
strategy to augment antidepressant treatment in clinical practice. Further studies
are now warranted to evaluate the safety and efficacy of this approach.

1
Chapter 1:
General Introduction

Chapter 1: General Introduction
2
1.1. Central nervous system barriers
The central nervous system (CNS), consisting of the brain and spinal cord, acts as
the main processing centre for the entire nervous system. The neurons in the CNS
communicate with each other via chemical and electrical signals which involve the
movement of small ionic molecules across neuronal membranes. Thus, it is crucial
that the ionic composition of the extracellular fluid in the CNS, which bathes the
central neurons, is strictly controlled and regulated to facilitate precise intercellular
signalling (Abbott, 2013). In contrast, the ionic composition of the blood varies
considerably; for example, following food intake or exercise. It is therefore
important that ion transport into and out of the CNS is tightly controlled to
maintain ion homeostasis for optimal neuronal signalling. This is achieved by a
number of CNS barriers, including the blood-brain barrier (BBB) and the blood-
cerebrospinal fluid barrier (BCSFB), which separate the CNS from the periphery
(Figure 1.1). In addition to their contribution to ion homeostasis, the CNS barriers
serve several additional functions, as outlined in Table 1.1.
Table 1.1: Functions of CNS barriers (adapted from Abbott, 2013)
Functions of central nervous system barriers
Maintenance of ion homeostasis, which is essential for optimal neural signalling
Regulation of molecular traffic, thereby ensuring sufficient uptake of essential nutrients
and clearance of metabolic waste products
Protection of the CNS from toxins
Maintenance of a low protein environment in the CNS, thereby limiting proliferation and
preserving neural connectivity
Separation of central and peripheral neurotransmitter pools, thereby limiting cross-talk
and facilitating non-synaptic signalling in the CNS
Facilitation of immune surveillance while guarding against inflammation and resultant cell
damage

Chapter 1: General Introduction
3
The BBB, discussed in more detail in Section 1.2, exists at the level of the
endothelial cells which line the blood microvessels in the brain, and is the most
important interface for molecular flux between the blood and the brain (Abbott et
al., 2010). The BCSFB consists of the epithelium of the choroid plexus, which is the
modified ependymal lining of the ventricles in the brain which secretes CSF (Laterra
et al., 1999b). Some solutes and drugs enter the brain primarily across the BCSFB,
while others enter via both the BBB and BCSFB (Abbott, 2013). However, the
majority of solutes and drugs gain entry to the brain via the BBB. The arachnoid
barrier is another CNS barrier existing at the arachnoid epithelium in the middle
layer of the meninges, which form the outer covering of the CNS. The arachnoid
barrier plays a very limited role in the entry of solutes into the brain (Abbott, 2013).
Figure 1.1: Location of the CNS barriers (Abbott, 2013)

Chapter 1: General Introduction
4
1.2. The blood-brain barrier: a major obstacle in the delivery of
drugs to the brain
The BBB plays a key role in maintaining homeostasis within the CNS; preserving the
composition of the internal milieu despite variations in the periphery and
protecting the brain against toxins, bacteria and viruses (Figure 1.2A). In addition,
the BBB regulates the uptake of endogenous molecules and xenobiotics into the
brain (Pardridge, 2007a; Neuwelt et al., 2008; Pariante, 2008; Zlokovic, 2008;
Abbott et al., 2010; Neuwelt et al., 2011).
Drug delivery is one of the major hurdles in the development of novel therapeutics
for brain disorders (Pardridge, 2005). While alternative approaches exist to achieve
direct drug delivery to the brain, there are severe disadvantages associated with
such approaches (discussed in more detail in Section 1.2.4.1). As a result, most
centrally acting drugs are administered peripherally (usually either orally or
parenterally). Therefore, transport across the blood-brain barrier (BBB) needs to be
achieved for these drugs to reach therapeutic concentrations at their site of action
in the brain. The extensive network of blood capillaries in the brain, with an average
of 40 µm between microvessels, means that, once drugs cross the BBB, the
distances over which diffusion needs to take place to reach target cells are short
(Pardridge, 2010). Therefore, in order to achieve widespread drug delivery
throughout the brain, drug delivery across the BBB is the preferred route of drug
transport.
Crucially, over 98% of small molecule drugs with potential for treatment of CNS
disorders are unable to cross the BBB to reach target sites within the brain, while
practically no large molecule therapeutics are able to penetrate the BBB (Figure
1.2B) (Pardridge, 2005; Neuwelt et al., 2008). This means that many CNS disorders
remain undertreated, even those with well-understood pathophysiology resulting
in clearly defined therapeutic targets, such as Huntington’s disease (Figure 1.2C).
Moreover, emerging evidence indicates that certain small molecule drugs used
clinically in the management of so-called “treatable” CNS disorders, such as
depression and epilepsy, may not reach adequate concentrations in the brains of

Chapter 1: General Introduction
5
some patients, thereby potentially contributing to the high prevalence of treatment
failure in these diseases (Loscher and Potschka, 2005b; Uhr et al., 2008).
Figure 1.2: The BBB - a bottleneck in drug development (adapted from Pardridge, 2005). A. Whole body autoradiogram of a mouse demonstrating that radiolabelled histamine penetrates all parts of the body apart from the CNS due to the CNS barriers. B. Statistics revealing the scale of the challenge presented by the BBB in the delivery of drugs to the brain. C. Only 5% of small molecule drugs are for the treatment of CNS disorders, and these are aimed at only four therapeutic indications.
1.2.1. Structure and function of the BBB
The BBB consists of three main ‘barriers’ which regulate molecular flux between the
blood and the brain. The ‘physical barrier’ consists of the tight junctions formed
between the brain capillary endothelial cells (BCECs) lining the blood capillaries in
the brain, which form the fundamental building block of the BBB (Figure 1.3).

Chapter 1: General Introduction
6
Figure 1.3: The blood-brain barrier (O'Brien et al., 2012b). A. The BBB consists of endothelial cells in the cerebral capillaries which, together with closely associated perivascular elements, such as pericytes, astrocyte endfoot processes and neurons, form the neurovascular unit. B. Illustration of tight junctions at the BBB C. Several drug efflux pumps, such as P-glycoprotein (P-gp), breast cancer resistance protein (BCRP) and multidrug resistance-associated proteins (MRP), are expressed at the BBB.

Chapter 1: General Introduction
7
Interactions between BCECs and other components of the neurovascular unit
(Hawkins and Davis, 2005), which consists of BCECs and perivascular cells such as
astrocytes, pericytes and neurons, induce the BBB-specific properties of the BCECs
(Janzer and Raff, 1987; Hayashi et al., 1997; Abbott et al., 2006; Armulik et al.,
2010). In addition, the dynamic permeability of the BBB varies in response to intra-
and intercellular signalling among these cells (Neuwelt et al., 2011).
One of the key characteristics of the BBB is the formation of tight junctions
between endothelial cells (Reese and Karnovsky, 1967; Brightman and Reese,
1969). These tight intercellular junctions consist of a highly complex network of
transmembrane and intracellular linking proteins, as well as signalling and
regulatory proteins (Figure 1.3B) (Wolburg and Lippoldt, 2002; Ballabh et al., 2004;
Wolburg et al., 2009; Abbott et al., 2010). Transmembrane proteins, such as
occludin, claudin-3,-5 and -12 and three members of the immunoglobulin
superfamily, junctional adhesion molecules (JAMs), endothelial selective adhesion
molecules (ESAM) and the coxsackie- and adenovirus receptor (CAR), tightly link the
endothelial cells together. Transmembrane proteins are linked to the actin
cytoskeleton within the cell via first- and second-order cytoplasmic accessory
scaffold molecules. Important first-order adaptor components, which bind directly
to the transmembrane proteins, include the zona occludens proteins (ZO 1-3), while
cingulin and junction associated coiled-coil protein (JACOP) are examples of second
order adaptor proteins. Signalling and regulatory molecules include multi-PDZ-
protein 1 (MUPP1), afadin (AF6) and 7H6. The adherens junction lends structural
support to the endothelial tissue. It is made up of vascular endothelial cadherin (VE-
cadherin), with the scaffolding proteins α-, β- and γ-catenin and desmoplakin, and
the platelet-endothelial cell adhesion molecule (PECAM), which mediates
homophilic adhesion.
The tight junctions between BCECs result in a continuous cellular wall, thereby
effectively sealing the paracellular route of transport, which is important for
hydrophilic or polar molecules which cannot penetrate the lipid environment of the
cell membrane (Zlokovic, 2008; Abbott et al., 2010). Thus, molecules must
predominantly traverse the BBB via the transcellular route to gain access to the

Chapter 1: General Introduction
8
brain (discussed in more detail in Section 1.2.2). However, a lack of fenestrations
and low levels of transcytosis result in relatively low levels of transcellular transport
at the BBB (Hawkins and Davis, 2005). Therefore, in general, physicochemical
properties such as lipophilicity, molecular weight and charge determine the ability
of a compound to cross the BBB, with only low molecular weight, lipophilic
molecules able to penetrate the physical barrier presented by the BCECs.
In addition to the ‘physical barrier’ presented by the tight junctions between BCECs,
there is also an ‘enzymatic barrier’ present at the BBB. Many drug metabolizing
enzymes, including members of the cytochrome P450 (CYP) family and others such
as glutathione-S-transferase and UDP-glucuronosyltransferase, are localized at the
BBB (Ghersi-Egea et al., 1994; Bauer et al., 2008; Dauchy et al., 2008; Dutheil et al.,
2009; Eyal et al., 2009). However, it is worth noting that the profile of CYP450
enzymes present at the BBB differs considerably to that of the liver. CYP1B1 has
been reported to be the most prominent CYP450 enzyme at the BBB, whereas CYPs
3A4, 2C9 or 2D6, involved in the hepatic metabolism of roughly 50% of drugs, were
not detected at the BBB (Dauchy et al., 2008). Nonetheless, compounds which are
substrates of the BBB enzymes may be broken down as they traverse BCECs,
thereby resulting in reduced bioavailability in the brain.
Furthermore, several uptake and efflux transporter proteins, expressed at the
luminal and/or abluminal membranes of the BCECs, play a vital role in the
regulation of molecule transfer across the BBB (Figure 1.3C) (Pardridge, 2007a).
From a drug delivery perspective, the expression of drug efflux transporters at the
BBB can limit brain exposure to substrate drugs, thereby constituting an ‘efflux
barrier’ (Urquhart and Kim, 2009). Therefore, the brain permeability of certain
compounds, which are subject to metabolism and/or drug efflux at the BBB, is
much lower than would be predicted based on physicochemical properties alone
(Cordoncardo et al., 1989; Begley, 2004; Hermann and Bassetti, 2007).

Chapter 1: General Introduction
9
1.2.2. Routes of transport across the BBB
The potential routes of drug transport across the BBB can be classified into three
broad categories: (1) passive transport; (2) carrier-mediated transport; and (3)
receptor-mediated transport (Figure 1.4).
Figure 1.4: Routes of drug transport across the BBB. 1. Passive transport: (a) The paracellular route of transport, important for polar solutes, is effectively sealed at the BBB due to the presence of tight junctions between cells. (b) Low molecular weight, non-polar, unionized, lipophilic solutes can traverse the BBB via the transcellular route of passive transport. 2. Carrier-mediated transport: (a) Efflux transporters expressed at the BBB can limit the permeability of solutes availing of the transcellular route of transport by actively extruding them back against a concentration gradient. (b) Influx transporters facilitate the uptake of essential solutes, such as glucose, which otherwise would not reach the brain. 3. Receptor-mediated transport: Transport receptors, such as the transferrin receptor, expressed at the BBB bind to specific substrates, such as transferrin. The receptor-substrate complex is internalised within the cell and trafficked to the opposite membrane, where the substrate is released. The receptor is subsequently recycled to its original membrane.
Passive transport involves drug diffusion down a concentration gradient, from a
region of high concentration (i.e. blood) to lower concentration (i.e. brain tissue),
and therefore does not require an energy source. It can be sub-divided into
paracellular (i.e. between cells) and transcellular (i.e. through cells) transport.
In general, the paracellular route of transport is important for low molecular
weight, hydrophilic, polar molecules which cannot traverse the lipid environment of

Chapter 1: General Introduction
10
the cell membrane. However, owing to the aforementioned tight junctions at the
BBB, under normal, healthy physiological conditions, the paracellular route of
transport is effectively sealed at the BBB. Therefore, polar drug molecules are, in
general, unable to cross the BBB and are not suitable candidates for the treatment
of CNS disorders as a result (Pardridge, 2005; Abbott, 2013).
In contrast, small molecular weight, non-polar, lipophilic drug molecules can exploit
the transcellular route of transport across the BBB, but only when they are in their
unbound free state (i.e. not bound by plasma proteins). Such drug molecules must
exhibit sufficient lipophilicity to be able to pass through the lipid bilayer and must
typically be less than 400-500 Da in size to avoid steric hindrance (Pardridge, 2005).
Thus, in general, low molecular weight, lipophilic drugs represent the category of
drug best able to reach the brain (Figure 1.5).
Figure 1.5: Relationship between lipid solubility, corrected for differences in molecular weight, and brain uptake rate of selected compounds (Laterra et al., 1999a). Higher values for oil/water partition coefficient correspond to greater lipophilicity. In general, brain uptake increases with increasing lipophilicity (compounds represented by black circles). Exceptions include substrates of active uptake processes (represented by orange squares), which exhibit greater uptake than would be predicted based on lipophilicity alone and substrates of efflux transporters or compounds which are highly plasma protein bound (represented by white triangles), which display lower uptake than would be predicted based on lipophilicity alone.

Chapter 1: General Introduction
11
However, low molecular weight lipophilic drug candidates are also susceptible to
active extrusion by efflux pumps (discussed in more detail in Section 1.2.3) and
enzymatic breakdown at the BBB, which could therefore restrict their brain
bioavailability.
In addition to active efflux processes, several active carrier-mediated uptake or
influx transporters are also expressed at the BBB (Table 1.2). Essential nutrients
such as glucose, amino acids, amines, nucleosides, monocarboxylates and small
peptides avail of this route of transport (Laterra et al., 1999a). As a result, an
adequate supply of these molecules, which otherwise would not cross the BBB, is
maintained in the brain. Some therapeutic compounds, such as L-DOPA (the
precursor of dopamine used in the treatment of Parkinson’s disease) via the large
neutral amino acid-transport system, gain access to the brain by exploiting naturally
occurring carrier-mediated transport systems at the BBB (Laterra et al., 1999a).
Most proteins are unable to cross the BBB due to their large size and hydrophilicity.
As a result, concentrations of plasma proteins in the brain are very low. However,
specific receptor-mediated transport processes exist at the BBB to facilitate the
transcytosis of particular proteins, such as insulin and transferrin. Efforts have been
made to exploit receptor-mediated transcytosis to enhance the delivery of peptide-
based therapeutics to the brain, known as the ‘molecular Trojan horse approach’
(Pardridge, 2007a).

Chapter 1: General Introduction
12
Table 1.2: Transport systems that operate from blood to brain (adapted from Laterra et al., 1999a)
Transport System Typical substrate
Metabolic substrates
Hexose Glucose
Monocarboxylic acid Lactate
Large neutral amino acid Phenylalanine
Basic amino acid Lysine
Acidic amino acid Glutamate
β-amino acid Taurine
Amine Choline
Purine Adenine
Nucleoside Adenosine
Saturated fatty acid Octanoate
Vitamins and co-factors
Thiamine Thiamine
Pantothenic acid Pantothenic acid
Biotin Biotin
Vitamin B6 Pyridoxal
Riboflavin Riboflavin
Niacinamine Niacinamine
Carnitine Carnitine
Inositol myo-Inositol
Electrolytes
Sodium Sodium
Potassium Potassium
Chloride Chloride
Hormones
Thyroid hormones T3
Vasopressin Arginine vasopressin
Insulin Insulin
Other peptides
Transferrin Transferrin
Enkephalins Leu-enkephalin

Chapter 1: General Introduction
13
1.2.3. Drug efflux transporters at the BBB
As mentioned in Section 1.2.2, several drug transporters are expressed at the BBB.
Efflux transporters from the adenosine triphosphate binding-cassette (ABC)
superfamily, in particular, exert significant functional transport at the BBB. ABC
transporters are primary active transporters, which use adenosine triphosphate
(ATP) hydrolysis to power the active efflux of their substrates against concentration
gradients. Forty-nine members of the ABC superfamily have been described in
humans, and these are divided in to 7 major sub-families: ABCA to ABCG (Sharom,
2008).
ABC transporters are expressed at various sites within the body, including the
kidney, liver, intestine and adrenal gland. Importantly, several members of the ABC
superfamily are localized at the BBB (Figure 1.6); including P-glycoprotein (P-gp;
encoded by the multidrug resistance 1 (MDR1/ABCB1) gene), breast cancer
resistance protein (BCRP; encoded by ABCG2) and multidrug resistance-associated
proteins 4 and 5 (MRP4 and 5; encoded by ABCC4 and 5 respectively) (Begley, 2004;
Loscher and Potschka, 2005a; Nies, 2007; Dauchy et al., 2008). The functional
impact of these ABC transporters on the brain accumulation of several drugs has
been elucidated in preclinical studies involving knockout mice and specific inhibitors
(de Vries et al., 2007). There is significant overlap in substrate specificity between
P-gp, BCRP and the MRPs, and many commonly used drugs are included among
their substrates (de Vries et al., 2007; Sharom, 2008; Zhou, 2008). Interestingly, P-
gp and BCRP appear to work in concert to synergistically limit the brain penetration
of certain drugs, including the anti-cancer agents topotecan and lapatinib (de Vries
et al., 2007; Polli et al., 2009).
Furthermore, ABC transporters have been implicated in resistance to
pharmacotherapy, most notably in oncology, where the expression of these efflux
pumps by cancer cells may confer resistance to chemotherapy with cytotoxic drugs
in cancer patients (Gottesman et al., 2002; Szakacs et al., 2006). In addition, there is
increasing evidence that ABC transporter-mediated drug efflux at the BBB may limit
brain drug delivery of several CNS drugs (Loscher and Potschka, 2005b), thereby

Chapter 1: General Introduction
14
leading to treatment failure in various brain disorders, including brain cancer
(Pauwels et al., 2007), epilepsy (Siddiqui et al., 2003) and stroke (Spudich et al.,
2006). In the field of psychiatry, much recent attention had been given to the role
of efflux pumps in the pharmacokinetic profile of antidepressant drugs. Increasing
evidence suggests that P-gp, in particular, may limit the ability of several
antidepressants to cross the BBB, thus resulting in inadequate brain concentrations
and therefore contributing to the poor success rate of current antidepressant
therapies (Uhr et al., 2008). The role of P-gp in the contribution to treatment failure
in CNS disorders is discussed in more detail in Section 1.3.5.
Figure 1.6: Drug transporters at the BBB. Several drug efflux and uptake transporters are expressed at the BBB. P-gp, BCRP and the MRPs expressed at the apical (i.e. blood) membranes of BCECs restrict the transport of their substrates across the BBB. There is also limited evidence of P-gp expression at the basolateral (i.e. brain) membrane (Bendayan et al., 2006), although the functional relevance of this is unclear.
1.2.4. Approaches to overcome the BBB to achieve drug delivery
to the brain
Existing methods to enhance the brain delivery of drugs which cannot cross the BBB
are largely inadequate for various reasons. They can be divided into two broad
categories: invasive and non-invasive approaches.

Chapter 1: General Introduction
15
1.2.4.1. Invasive approaches
Invasive transcranial drug delivery approaches involve bypassing the brain barriers
to directly administer drugs to the brain, such as direct intracerebroventricular (ICV)
injection or the intracerebral implantation of a controlled release drug delivery
device (Pardridge, 2007b).
Severe limitations associated with these techniques, not least the requirement for
surgical intervention, preclude their widespread use in clinical practice. In
particular, transcranial drug delivery techniques fail to achieve adequate drug
distribution throughout the brain due to the inefficiency of drug diffusion in brain
tissue (Pardridge, 2005). While high local concentration are achieved at the site of
injection or implantation, which can lead to toxicity, sufficient drug levels are not
reached at more distant brain regions as drug concentrations decline exponentially
with distance from the injection/implantation site (Pardridge, 2010). Attempts have
been made to overcome this limitation by utilising convection-enhanced-diffusion,
which involves the continuous infusion of fluid into the brain following
implantation, but to limited effect (Salvatore et al., 2006). Therefore, primarily due
to the invasive nature of the approach and the problems associated with drug
diffusion in brain tissue, direct transcranial drug administration only represents a
viable strategy in particular circumstances, such as brain cancer, where the clinical
benefit outweighs the risk involved.
1.2.4.2. Non-invasive approaches
Considering that the brain is served by an extensive network of blood capillaries,
with typically only 40 µm between capillaries in the brain, it is ideal to deliver drugs
intended for global brain distribution via the vascular route (Pardridge, 2010). This
represents a challenge for therapeutics which are unable to cross the BBB.
However, certain strategies exist to enhance the delivery of such drugs to the brain.
One potential approach to achieve this goal is by transient disruption of the BBB to
facilitate drug delivery to the brain. This can be done by the intracarotid infusion of
hyper-osmotic solutions, as described by Neuwelt and colleagues over 30 years ago
(Neuwelt et al., 1979; Neuwelt et al., 1980). However, this strategy has been

Chapter 1: General Introduction
16
rejected as impractical for general widespread use due to the obvious
disadvantages associated with non-selective disruption of the important protective
and homeostatic functions played by the BBB, including the inducement of epileptic
type seizures (Marchi et al., 2007). Future research, perhaps involving the use of
RNA interference (Campbell et al., 2011), localised ultrasound irradiation (Mesiwala
et al., 2002; Hynynen, 2008) or selective pharmacological modulation of BBB
permeability (Carman et al., 2011), may facilitate highly selective alteration of BBB
function to enable the targeted delivery of drugs to the brain.
Alternatively, rather than disrupting the BBB per se, attempts have been made to
enhance drug transport across the intact, fully functional BBB. These efforts have
included altering drug molecules using medicinal chemistry approaches (Greig et
al., 1990), linking drug molecules to CNS-targeting moieties (the BBB molecular
‘Trojan Horse’ approach) (Pardridge, 2006) or the incorporation of drug molecules
into colloidal carriers (Kreuter et al., 2003). The incorporation of CNS drug
molecules into colloidal drug carriers, thereby potentially masking unwanted
physicochemical properties, protecting from enzymatic degradation or drug efflux
and enhancing CNS bioavailability via increased transmembrane diffusion,
represents a particularly promising novel approach to achieve drug delivery to the
brain via the bloodstream without necessitating disruption of the BBB (Wohlfart et
al., 2011a).
1.2.5. Methods to predict or measure drug transport across the
BBB
Various approaches, ranging from in silico to in vitro and in vivo, exist to assess drug
transport across the BBB. Each of these approaches has associated strengths and
weaknesses, as will be outlined in the forthcoming sections, and can be best
employed at different stages in the drug discovery process.
1.2.5.1. In silico
In silico approaches to evaluate drug transport across the BBB make use of
computer-based simulations to predict whether a compound will penetrate the BBB
based on its molecular characteristics. In general, in silico approaches facilitate

Chapter 1: General Introduction
17
relatively cheap and rapid high-throughput screening of the BBB permeability of
potential lead compounds in early drug discovery, but typically only achieve ~70-
80% prediction accuracy (Goodwin and Clark, 2005; Dureja and Madan, 2007;
Broccatelli et al., 2012).
These in silico models are based on relationships between BBB permeability, as
measured experimentally in vitro or, preferably, in vivo, and molecular
characteristics of the test compounds used. For example, early work in this field
focused on the relationship between lipophilicity and BBB permeability (Oldendorf,
1974; Levin, 1980).
The utility of in silico models is primarily dependent on the quality and quantity of
the training and test datasets on which the model is based and the molecular
descriptors included in the model (Mensch et al., 2009).
With regards to such datasets, the ‘garbage in, garbage out’ dictum applies
(Mensch et al., 2009). It is crucial that the in vivo data on which the model is based
is appropriate and accurate, ideally generated under the same experimental
conditions in the same laboratory. In addition, it is necessary to be aware of the
limitations of the model in terms of its ‘chemical space’, as attempting to apply a
model to make predictions to molecules from outside the chemical space of the
dataset could result in misleading and inaccurate results (Goodwin and Clark, 2005).
Several molecular descriptors which influence BBB permeability have been
identified. Since early studies reported links between lipophilicity and BBB
permeability (Oldendorf, 1974; Levin, 1980), further key characteristics, such as
molecular weight, the polar surface area and the number of hydrogen-bond
acceptors, have come to light (Mensch et al., 2009). However, predicting BBB
permeability based on such physicochemical parameters alone focuses on passive
transcellular transport only, and neglects carrier-mediated and enzymatic processes
which may influence brain bioavailability. This is a major disadvantage of the
majority of models. Increasing recent effort has focused on developing quantitative
structure activity relationship (QSAR) models to predict if a compound will be
subject to active transport processes (as discussed in section 1.3.7.1). Integration of

Chapter 1: General Introduction
18
such QSAR information in more complex in silico models may facilitate more
accurate prediction of BBB permeability in the future, but to date no in silico model
which fully reflects the intricacies of the BBB exists (Mensch et al., 2009).
1.2.5.2. In vitro
A valid, predictive and representative in vitro screening tool would be of enormous
benefit in the development and design of novel approaches to overcome the BBB,
and to predict the BBB permeability of novel drug compounds. Ideally, such a model
would consist of a readily available, convenient, predictable and reproducible
immortalized endothelial cell line, with brain endothelial cell characteristics, low
paracellular permeability (due to the formation of tight junctions) and functional
expression the various transporters and enzymes present at the BBB in vivo to
physiologically relevant levels. However, no such ideal in vitro model has been
developed as yet (Cecchelli et al., 1999; Reichel et al., 2003; Garberg et al., 2005;
Avdeef, 2011).
In vitro systems used to investigate drug permeability across the BBB can be divided
into two broad categories: cells derived from a cerebral origin and cells not derived
from a cerebral origin (Table 1.3).
Brain capillary endothelial cells (BCECs), the fundamental building block of the BBB,
have been isolated with little or no contamination by other cell types (e.g. glial cells,
pericytes etc) from a range of species, including mouse, rat, cow, sheep, pig
monkey and human, and generally produce confluent cell monolayers after 9 days
in culture. However, the isolation of BCECs for primary systems requires time-
consuming, technically challenging and tedious work, and can be responsible for
inter-lab variations (Reichel et al., 2003). In addition, cultured BCECs lose or down-
regulate many key characteristics of the BBB in vivo, such as tight junctional
complexity, specific transporters and enzymes, especially when isolated from their
natural milieu (Cecchelli et al., 1999). This limitation can be somewhat overcome by
co-culturing BCECs with astrocytes, however, other limitations still apply (Cecchelli
et al., 1999). Immortalised brain endothelial cell lines, which demonstrate high
TEER values when cultured on transwell systems, have been recently developed

Chapter 1: General Introduction
19
(Weksler et al., 2005; Poller et al., 2008). These systems may represent a useful
investigational tool in the future, but further validation is needed before their
predictive utility can be definitely evaluated.
Alternatively, cells derived from a non-BBB origin which form confluent monolayers
with tight junctions when grown on an appropriate transwell support, can be used
to determine drug permeability across a biological membrane which may reflect
BBB permeability (Hellinger et al., 2012). Furthermore, such non-cerebral cell lines
may possess, or can be transfected with, certain properties which exist at the BBB,
such as P-gp expression. Cell lines commonly used for this purpose include the
naturally P-gp-expressing human colorectal adenocarcinoma (Caco-2) cells and
ABCB1-transfected, P-gp expressing Madine-Darby canine kidney cells (MDCK-
MDR1). These model cell-lines are polarized, with distinct apical and basolateral
membrane domains, when cultured on an appropriate transwell support.
As P-gp is exclusively expressed on the apical membrane of the cultured cells, the
comparison of apical-to-basolateral (A→B) permeability and basolateral-to-apical
(B→A) permeability for a test compound indicates if it is a P-gp substrate (Lin,
2007). Furthermore, these cell systems can be used to determine a drug’s apparent
permeability (Papp) across a P-gp expressing membrane. However, the fact that
these cells are from a non-cerebral origin is a considerable disadvantage, especially
when one considers that membrane properties influence P-gp mediated transport
(Romsicki and Sharom, 1999; Hellinger et al., 2012). In addition, non-cerebral cells
transfected with a singular aspect of the BBB, such as P-gp for example, fail to fully
reflect the variety of complex active processes present at the BBB in vivo.
Nonetheless, they can represent useful models for the prediction of BBB transport
(Hellinger et al., 2012).

20
Table 1.3: In vitro models to predict drug transport across the BBB (adapted from Reichel et al., 2003; Garberg et al., 2005; Mensch et al., 2009)
Method Advantages Limitations
Cells derived from a cerebral origin
Isolated brain
capillaries /
microvessels
Can be isolated from various sources
(animal/human)
Metabolically active
Reflective of in vivo situation
Significant loss of ATP → significant loss of activity
Difficult to access luminal surface of microvessels, therefore can
only conduct drug transport experiments from abluminal to
luminal side
Thus unsuitable for BBB-permeability screening
Primary BCECs
(monoculture)
Close to in vivo situation
Maintain many BBB-specific in vivo features
Can be prepared from a variety of sources (bovine
and porcine preferred due to higher yield than from
rats; ethical and tissue access constraints with
human sources)
Some significant BBB-features down-regulated or lost during
preparation
Tend to overestimate Pe values for lipid-mediated transport and
underestimate Pe for carrier-mediated transport
Lose expression of BBB-specific proteins (e.g. drug transport
pumps)
Primary BCECs
(co-culture or
astrocyte-
conditioned
medium)
As per monoculture, plus:
Up-regulation of P-gp function and increased TEER
relative to monocultures; therefore closer
approximation of in vivo situation
Time and resources required to isolate, seed and incubate
primary BCECs and astrocytes
Poor reproducibility
Immortalized
BCECs
Avoid disadvantages of primary systems with
respect to time, effort and reproducibility
Form monolayers
Useful for mechanistic and biochemical studies
Do not generate complete tight junctions (to date), therefore
unsuitable for studying BBB transport due to paracellular
leakiness

21
Method Advantages Limitations
Cells derived from non-cerebral origin
MDCK Reproducible, high TEER value
Low sucrose permeability
Easy to grow
Can be transfected with P-gp (to achieve polarized
expression)
Most representative of in vivo permeability for
passive and P-gp-effluxed compounds
Does not express other BBB-specific proteins which may play
significant roles in drug transport
Caco-2 Well-established model for permeability studies
(intestinal)
Naturally expressed P-gp in a polarised fashion when
cultured on a transwell support
Many differences from BCECs – morphology, protein expression,
metabolism etc
Expression of a variety of other efflux and uptake transporters in
addition to P-gp
Pe: apparent permeability; TEER: transepithelial electrical resistance (a measure of the tightness of junctions between cultured cells)

Chapter 1: General Introduction
22
1.2.5.3. In vivo and in situ approaches
Due to the limitations of the available in silico and in vitro BBB models, and the
complexity of the processes ongoing at the BBB, in vivo models remain the best way
of assessing the ability of a compound to cross the BBB. Moreover, in vivo
approaches provide crucial reference information for the testing and validation of
other models (Mensch et al., 2009). Several different in vivo approaches to
investigate drug transport across the BBB exist, including intravenous injection
followed by decapitation and brain collection, the brain uptake index approach,
brain perfusion, imaging studies and microdialysis. These approaches vary in terms
of their sensitivity and usefulness (Bickel, 2005; Nicolazzo et al., 2006; Mensch et
al., 2009).
Intravenous injection followed by decapitation and determination of drug
concentration in brain tissue represents a relatively simple, sensitive and
representative method of measuring brain uptake and has been described as the
‘gold standard’ for assessing BBB permeability (Nicolazzo et al., 2006). However,
using this approach, it is only possible to obtain brain concentrations at a terminal
time-point (i.e. one time-point per animal) and it is therefore necessary to use a
large number of animals to elucidate the brain distribution kinetics of a drug using
this method. Furthermore, as the brain vasculature accounts for approximately 5%
of the total brain volume (Wohlfart et al., 2011b), it is necessary to consider the
presence of drug within the brain capillaries which has not actually crossed the BBB
but will appear in brain homogenate samples. Many studies fail to account for this
issue, which in turn limits the conclusions that can be drawn from such studies in
relation to the BBB penetration of the compound of interest.
The problem of drug present in the cerebral vasculature can be overcome to some
extent by using the capillary depletion technique (Triguero et al., 1990), which
utilises density centrifugation to separate vascular components from other brain
tissue. Thus it is possible to measure drug concentrations in the supernatant, which
should theoretically only contain tissue from the brain parenchyma. However,
capillary depletion is an imperfect technique. For example, drug bound to low

Chapter 1: General Introduction
23
affinity or non-specific binding sites on the plasma membrane of brain capillary
endothelial cells may dissociate during the centrifugation process, thus producing
misleading results (Pardridge, 1995).
The brain uptake index (BUI) and isolated brain perfusion in situ techniques offer
some advantages compared to the intravenous administration approach outlined
above (Bickel, 2005). Both of these techniques specifically investigate processes
ongoing at the BBB, thereby avoiding factors such as metabolism in other organs
which can complicate deconvolution of data from intravenous studies. In addition,
the composition of the intravascular fluid in the cerebral microvasculature can be
readily manipulated, thereby facilitating investigation of the impact of factors such
as test solute concentration, protein binding and osmotic pressure on BBB
permeability (Bickel, 2005).
The BUI, first reported in the 1970s (Oldendorf, 1970) is a single pass technique,
whereby the test compound (along with a reference compound which is
impermeable to the brain as a control to correct for the fraction of the bolus
remaining in the vascular lumen at the time of sampling) is rapidly injected into the
common carotid artery of anaesthetised animals. Brain uptake is determined by
sampling of brain tissue 5-15 sec after the injection. The short timeframe involved
eliminates systemic recirculation and wash-out as potential confounding factors
(Bickel, 2005). However, the single pass nature of the technique limits the utility of
the BUI to substances with moderate-to-high BBB permeability, as the uptake of
less rapidly permeable compounds may not be detected. Morphine, for example,
has well-established CNS effects, but its BUI is scarcely above that of impermeant
vascular markers (Bickel, 2005). In addition, the short timeframe involved precludes
identification of slower uptake processes, such as receptor mediated endocytosis.
Some of these deficiencies can be overcome by adopting brain perfusion methods.
These approaches typically involve catheterization of the carotid artery and
disruption of endogenous blood flow to the brain, for example by severing the
heart ventricles. An oxygenated physiological buffer containing the test compound
is then perfused for a period of time up to 10 minutes (Bickel, 2005). Thus, the

Chapter 1: General Introduction
24
identification of compounds taken up into the brain via receptor mediated
transport, which takes place over a period of minutes rather than seconds, can be
achieved using this technique (Bickel, 2005).
Both the BUI and brain perfusion in situ approaches involve the use of anaesthesia
in the animals during the experiment, which may be a severe limitation given the
potential effects of anaesthesia on BBB permeability (Saija et al., 1989; Tetrault et
al., 2008; Thal et al., 2012). In addition, the problems previously outlined in relation
to drug contained within the brain vasculature also apply. The intracerebral
microdialysis technique offers several advantages compared to these methods.
1.2.5.4. Intracerebral microdialysis
Intracerebral microdialysis facilitates the determination of unbound concentrations
of both endogenous and exogenous substances in brain extracellular fluid (ECF) as a
function of time in conscious, freely moving animals (de Lange et al., 2000; Plock
and Kloft, 2005; Anderzhanova and Wotjak, 2013). Derived from earlier attempts to
sample amino acid and electrolytes in neuronal extracellular fluid across a semi-
permeable membrane, using the ‘push-pull’ method, the modern-day intracerebral
microdialysis technique was pioneered by Ungerstedt and co-workers at the
Karolinska institute in Stockholm, Sweden in the 1970s and 1980 (Ungerstedt and
Pycock, 1974; Darvesh et al., 2011). While it has predominantly been used to
monitor fluctuations in brain concentrations of neurotransmitters such as
serotonin, dopamine and noradrenaline in response to various interventions
(Ungerstedt and Hallstrom, 1987; Di Chiara et al., 1996), it has also been used to
monitor brain extracellular fluid levels of many drugs, including morphine
(Groenendaal et al., 2007), imipramine (Sato et al., 1994) and buspirone (Tsai and
Chen, 1997).
The key component of the microdialysis system is the microdialysis probe, which
consists of a small semi-permeable hollow membrane connected to inlet and outlet
tubing. The microdialysis probe can be surgically inserted into various body fluids or
body tissues, including the brain. Moreover, the probe can be targeted to specific
brain regions of interest with a high degree of accuracy using a stereotaxic frame.

Chapter 1: General Introduction
25
While microdialysis probes can come in a variety of different designs (de Lange et
al., 2000), the most commonly used design in intracerebral studies is the concentric
design (Figure 1.7A). At the microdialysis probe membrane, unbound molecules
capable of passing through the semi-permeable membrane will diffuse across the
membrane down their concentration gradients, either into or out of the probe
lumen (Figure 1.7B). According to Fick’s first and second laws (Fick, 1855), the rate
of diffusion is directly proportional to the concentration gradient. Therefore, the
amount of an analyte present in the dialysate will be proportional to the
concentration in the periprobe fluid (Anderzhanova and Wotjak, 2013).

26
Figure 1.7: Intracerebral microdialysis. A The microdialysis probe consists of inlet and outlet tubing, connected to a semipermeable membrane. The membrane length and the active area can be tailored to target specific brain regions of interest. The perfusate is continuously pumped through the probe at a slow flow rate B. Compounds with sufficiently low molecular weight (green circles) will diffuse into the probe down their concentration gradient, and be pumped out through the outlet tubing. C-D The microdialysis probe can be specifically targeted to a brain region of interest with a high degree of accuracy using a stereotaxic frame during implantation. Moreover, the probe remains intact in conscious, freely moving animals, thereby facilitating sampling without a need for anaesthesia.

Chapter 1: General Introduction
27
During a microdialysis experiment, the probe is continuously perfused with an
aqueous solution, known as the perfusate, which mimics the ionic composition of
the periprobe fluid, at a constant low flow rate (typically 0.5-5 µl.min-1). Outlet
tubing connects the membrane of the probe to the collection vial, in which the
sample, known as the dialysate, is collected for analysis by a suitable analytical
technique capable of dealing with the typically small volumes and low
concentrations associated with microdialysis studies. The concentration of the
analyte in the dialysate will reflect the concentration in the periprobe fluid.
However, as microdialysis experiments are not conducted under equilibrium
conditions, the dialysate concentration will always be lower than the actual
concentration in the fluid surrounding the probe. The relationship between
dialysate and periprobe concentrations is termed ‘probe recovery’ (Anderzhanova
and Wotjak, 2013)
The probe recovery is dependent on many factors, including flow rate, membrane
properties, perfusate composition, physicochemical properties of the analyte of
interest and temperature (de Lange et al., 2000). Probe recovery can be easily
determined in vitro by immersing the probe in a well filled with a solution of known
concentration of the analyte of interest, and then comparing dialysate
concentrations to well concentrations. Determination of in vivo probe recovery is
more difficult, but can be achieved by retrodialysis (where the molecule of interest
is included in the perfusate in a naive animal and percentage loss is calculated)
(Bouw and Hammarlund-Udenaes, 1998). A limitation of this approach is the
assumption that drug diffusion will be equal in both directions (i.e. the percentage
loss in retrodialysis experiments will be equal to the percentage gain in traditional
microdialysis experiments). More sophisticated approaches to establish in vivo
probe recovery, which do not make this assumption, include the no-net-flux
(Lonnroth et al., 1987) or the more complex dynamic-no-net-flux methods (Olson
and Justice, 1993).
The no-net-flux methodologies involve perfusing different concentrations (Cinlet) of
the compound of interest through the probe in a subject in which steady-state

Chapter 1: General Introduction
28
levels of the drug have been achieved. The resulting dialysate concentrations
(Coutlet) are measured, and the difference between Cinlet and resultant Coutlet are
plotted as a function of Cinlet (Figure 1.8). This plot will cross the x-axis at the point
where Cinlet is equal to the concentration in the periprobe fluid (as there has been
no loss or gain of the compound). If the plot is linear, and if true steady-state
conditions exist, the slope of the function will equal the in vivo recovery of the
probe for that compound (de Lange et al., 2000; Anderzhanova and Wotjak, 2013).
While the use of these techniques to establish in vivo probe recovery facilitates the
calculation of actual analyte concentrations in the brain ECF, there are several
limitations and difficulties associated with them (de Lange et al., 2000). For
Figure 1.8: The principle of the no-net-flux method to determine in vivo microdialysis recovery (Anderzhanova and Wotjak, 2013). Different concentrations of the compound of interest (Cinlet) are perfused through a microdialysis probe implanted in an animal in which steady state levels of the compound have been achieved and maintained. The concentration emerging from the probe (Coutlet) is determined, and the difference between the perfusate and dialysate concentrations (i.e. Cinlet - Coutlet) is plotted as a function of the perfusate concentration. The point at which the plot crosses the x-axis represents the point at which the perfusate concentration is equal to that of the periprobe fluid, and the slope of the line is equal to the in vivo receovery of the probe for that compound.

Chapter 1: General Introduction
29
example, they involve extremely time-consuming and challenging methodologies,
and attempts to validly employ these techniques are often fraught with difficulties.
To overcome these difficulties, a modified ‘ultraslow’ quantitative microdialysis
technique has been recently developed (Cremers et al., 2009). However, this
approach is proprietary, and cost issues may preclude its use, particularly in
academia. Therefore, in certain circumstances, it is on balance preferable to
calibrate probes in vitro only, and to selectively use probes with similar rates of
recovery to enable comparison of relative changes in dialysate concentrations
between different animals without a need to extrapolate absolute brain ECF
concentrations (Page and Lucki, 2002; Anderzhanova and Wotjak, 2013). While this
approach does not yield quantitative results per se, it facilitates evaluation and
comparison of relative levels of the analyte in different treatment groups.
Intracerebral microdialysis offers several key advantages over other approaches to
determine BBB transport (de Lange et al., 2000; Anderzhanova and Wotjak, 2013).
Using microdialysis, it is possible to sample from the brain ECF repeatedly over time
in the same animal, thus facilitating a high degree of temporal resolution
unattainable with other methods. In addition, this serves to reduce the number of
animals required to conduct a pharmacokinetic study, in accordance with the
‘reduction’ principal of the 3Rs in animal research (http://www.nc3rs.org.uk/).
Moreover, the animal is both conscious and freely moving throughout the sampling
period (Figure 1.7C), therefore avoiding potential effects of anaesthesia on BBB
function. In addition, microdialysis samples only contain drug which has penetrated
the BBB and is present in the brain ECF, as opposed to other techniques which
determine the concentration of drug in brain tissue which includes cerebral
capillaries. Furthermore, only unbound drug molecules will cross the microdialysis
probe semipermeable membrane, and it is these free drug molecules which are
pharmacologically active. Therefore, microdialysis facilitates the measurement of
pharmacologically relevant active site concentrations of drug molecules in the brain
(Hammarlund-Udenaes, 2010).

Chapter 1: General Introduction
30
1.3. P-glycoprotein
P-glycoprotein (P-gp) was first identified in the 1970s, when it was discovered to
confer resistance to cancer cells against chemotherapeutic agents in vitro (Juliano
and Ling, 1976), and was subsequently found to be localized in blood capillaries in
the brain (Cordoncardo et al., 1989; Thiebaut et al., 1989). P-gp is widely expressed
at specific sites within the body, including the BBB (Figure 1.9). It is the most
studied, and arguably most functionally important, member of the ABC family of
drug efflux transporters.
Figure 1.9: Distribution of P-gp within the body (Marzolini et al., 2004)

Chapter 1: General Introduction
31
1.3.1. Structure and function of P-glycoprotein
P-gp is encoded by the ABCB1 (also known as MDR1) gene, located on chromosome
7 at q21 with 28 exons encoding a protein of 1,280 amino acids, in humans (Ieiri,
2012). It is a 170-kDa membrane-bound broad-spectrum efflux pump, consisting of
twelve highly hydrophobic transmembrane domains, arranged as two bundles of six
helices linked by a highly charged extracellular ‘linker region’, and two intracellular
ATP-binding sites, known as nucleotide binding domains (NBDs) (Zhou, 2008; Aller
et al., 2009).
The hydrophobic ‘vacuum cleaner’ and flippase models have been proposed to
describe P-gp-mediated drug translocation (Shapiro and Ling, 1997; Aller et al.,
2009; Colabufo et al., 2010). In the hydrophobic ‘vacuum cleaner’ model, P-gp pulls
its substrates from the lipid bilayer and pumps them out of the cell through its
central cavity. According to the flippase model, P-gp ‘scans’ the inner leaflet of the
lipid bilayer and binds specific lipids and hydrophobic drugs prior to their extrusion
by ‘flipping’ the phospholipids from the inner to outer leaflets of the lipid bilayer.
The flippase model and the hydrophobic ‘vacuum cleaner’ model are not mutually
exclusive, and a combination of both models is illustrated in Figure 1.10 (Aller et al.,
2009; Eckford and Sharom, 2009). The active drug efflux process is powered by ATP
hydrolysis at the cytoplasmic NBDs (Sharom, 2008).

Chapter 1: General Introduction
32
Figure 1.10: Schematic illustrating the mechanism of action of P-gp (O'Brien et al., 2012b). A. In its substrate-binding conformation, P-gp contains a large substrate-binding pocket (SBP), comprising mostly of hydrophobic and aromatic residues. Lipid soluble P-gp substrate molecules travel into the SBP from the inner leaflet of the phospholipid (PL) bilayer membrane. Substrate-P-gp interactions lead to the binding of two ATP molecules to the nucleotide binding domain (NBD). B. ATP-binding causes dimerization of the NBDs, leading to a conformational change, resulting in an outward facing configuration. This outward facing arrangement facilitates the release of substrates into the extracellular environment or the outer leaflet of the PL bilayer, and sterically prevents the substrate from travelling into the intracellular space. Thus, P-gp acts as a unidirectional efflux pump (see (Aller et al., 2009)).
1.3.2. P-gp substrates and inhibitors
One of the hallmarks of P-gp is its substrate promiscuity, as it transports a wide
range of structurally unrelated compounds (Table 1.4) (Aller et al., 2009). Although
P-gp substrates are generally hydrophobic amphipathic compounds, no chemical
characteristic that clearly distinguishes between P-gp substrates and non-substrates
has been determined (Schinkel, 1999). Interestingly, there is a significant overlap in
substrate specificity between P-gp and drug metabolizing enzymes, such as
cytochrome P450 (CYP) enzymes (Wacher et al., 1995; Uhr et al., 2004). Thus, P-gp
and drug metabolizing enzymes in BCECs may work in tandem to reduce the ability
of certain drug molecules, which are substrates of both, to pass through the BBB in
a so-called “drug transporter-metabolism alliance” (as originally proposed in

Chapter 1: General Introduction
33
relation to drug absorption from the gut) (Benet, 2009). According to this
hypothesis, P-gp efflux would prevent the intact substrate from passing through the
BBB, resulting in a cycle where drug molecules passively diffuse into the BCEC,
followed by active P-gp mediated extrusion. Each time drug molecules diffuse into
the BCEC in this cycle, a certain proportion of the molecules would be broken down
by the drug metabolizing enzymes, while unchanged molecules would be recycled
back out of the cell by P-gp.
Compounds that interact with P-gp can be classified as substrates, modulators or
inhibitors (Colabufo et al., 2010). Substrates are subjected to active efflux by P-gp,
and therefore have a reduced ability to penetrate P-gp expressing membranes.
Modulators reduce substrate binding via a negative allosteric interaction, thereby
reducing P-gp-mediated substrate efflux; whereas inhibitors reduce P-gp function
by interfering with the substrate or nucleotide binding steps (Colabufo et al., 2010).
Therefore, modulators and inhibitors achieve the same pharmacological effect,
albeit via different mechanisms, and for the purposes of this thesis are considered
synonymous. Some, but not all, P-gp substrates also reduce P-gp function, and as
such can be classed as both substrates and inhibitors.

Chapter 1: General Introduction
34
Table 1.4: List of selected P-gp substrates and inhibitors (O'Brien et al., 2012b)
Drug class Selected examples
P-gp substrates
Anticancer agents Daunorubicin, doxorubicin, etoposide, imatinib,
methotrexate, mitoxantrone, paclitaxel, vinblastine,
vincristine Antidiarrhoeal
agents
Loperamide
Antihistamines Cetrizine, desloratadine, fexofenadine
Antipsychotics Risperidone
Antiretroviral
drugs
Amprenavir, indinavir, lopinavir, nelfinavir, ritonavir,
saquinavir
Cardioactive drugs Amiodarone, digoxin, diltiazem, quinidine, verapamil
Antiemetics Domperidone, ondansetron
β-blockers Talinolol
H2 receptor
antagonists
Cimetidine, ranitidine
P-gp inhibitors
First generation Amiodarone, cyclosporin A, nifedipine, quinidine, verapamil
Second generation Dexverapamil, GF120918 (elacridar), PSC-833 (valspodar),
VX-710 (biricodar)
Third generation LY-335979 (zosuquidar), LY475776, OC144-093, R-101933
(laniquidar), XR-9576 (tariquidar)

Chapter 1: General Introduction
35
1.3.3. Regulation of P-gp expression and activity
In common with other ABC transporters, the expression and activity of P-gp at the
BBB are altered in response to factors including xenobiotics, inflammation, infection
and disease (Miller, 2010).
In rodents, the increase in P-gp expression and activity in response to xenobiotics is
mediated via ligand-activated intracellular receptors, primarily the pregnane-X
receptor (PXR) (known as the steroid and xenobiotic receptor (SXR) in humans
(Loscher and Potschka, 2005b)) and the constitutive androstane receptor (CAR)
(Bauer et al., 2004; Bauer et al., 2006; Wang et al., 2010). Interestingly, as well as
upregulating efflux transporters such as P-gp, activation of PXR and CAR also
induces the expression of metabolic enzymes in a coordinated defensive response
to xenobiotic exposure (Bauer et al., 2008; Pascussi et al., 2008; Kohle and Bock,
2009). Both receptors are activated by numerous endogenous ligands, including bile
acids, and by several drugs, many of which are subjected to efflux or metabolism by
the transporters and enzymes regulated by the receptors themselves (Miller, 2010).
Furthermore, PXR and CAR have common activating ligands, including the clinically
used drugs rifampicin, taxol, dexamethasone and phenobarbital (Kliewer et al.,
2002; Willson and Kliewer, 2002). In addition, PXR and CAR share common target
genes, and both associate with the retinoid-X receptor before binding to DNA
(Miller, 2010).
The importance of xenobiotic-mediated increases in efflux transporter expression
were highlighted in a study in which transgenic mice expressing human PXR (hPXR)
were treated with the hPXR ligand, and clinically used antibiotic, rifampicin (Bauer
et al., 2006). The dosing regimen, designed to achieve free plasma rifampicin levels
equivalent to those achieved in patients undergoing course of rifampicin treatment,
resulted in a 2-3 fold increase in P-gp protein levels in intestine, liver and brain
capillaries. Moreover, this resulted in a 70% reduction in the antinociceptive effects
of methadone, an analgesic drug which is a transported P-gp substrate (Bauer et al.,
2006). This demonstrates the potential pharmacodynamic consequences of
xenobiotic-mediated drug transporter induction at the BBB.

Chapter 1: General Introduction
36
In addition to xenobiotics, inflammation and immune activation can modulate P-gp
expression and activity. These effects are highly complex and can result in up- or
down-regulation of P-gp (Roberts and Goralski, 2008). In essence, acute
inflammation or infection appears to result in reduced P-gp function and increased
accumulation of P-gp substrates in the brain, whereas P-gp function is recovered or
enhanced following chronic inflammation (Roberts and Goralski, 2008).
Furthermore, P-gp expression and activity may be altered in different disease
states, particularly in neurodegenerative diseases, such as Alzheimer’s disease for
example (Vogelgesang et al., 2002; Zlokovic, 2008). Indeed, β-amyloid (Aβ), a
protein involved in the pathophysiology of Alzheimer’s disease, is a transported
substrate of P-gp in vitro and in vivo (Kuhnke et al., 2007; Hartz et al., 2010), while
the deposition of Aβ is inversely correlated with P-gp expression in the brains of
elderly non-demented humans (Vogelgesang et al., 2002). Moreover, increasing P-
gp expression by PXR activation results in reduced brain accumulation of Aβ in a
mouse model of Alzheimer’s disease (Hartz et al., 2010). Thus, reduced P-gp
function has been hypothesized to be involved in the pathophysiology of
Alzheimer’s disease, resulting in increased deposition of the pathological protein Aβ
(Vogelgesang et al., 2004; Zlokovic, 2008).
1.3.4. Single nucleotide polymorphisms in ABCB1
Genetic heterogeneity in ABCB1 may influence P-gp functionality, and therefore
lead to clinically relevant inter-individual differences in the pharmacokinetics of P-
gp substrates. Indeed, more than 50 SNPs in ABCB1 have been identified in humans
(Table 1.5) (Stein et al., 1994; Hoffmeyer et al., 2000; Cascorbi et al., 2001; Ito et al.,
2001; Kim et al., 2001; Cascorbi, 2006; Salama et al., 2006; Kimchi-Sarfaty et al.,
2007; Sakurai et al., 2007) (see also: http://pharmacogenetics.ucsf.edu/cgi-
bin/Gene.py?hgncSymbol=ABCB1).
Most studies in this regard have focused on three SNPs in particular: rs1128503
(C1236T; exon 12), rs2032582 (T2677G; exon 21) and rs1045642 (C3435T; exon 26).
However, despite an abundance of studies, the functional impact of these SNPs, or
indeed of the others, remains largely unclear and somewhat controversial (Ieiri,

Chapter 1: General Introduction
37
2012). Given the substantial influence of environmental factors, such as xenobiotics
and infections (as discussed in Section 1.3.3), it is perhaps unsurprising that robust
genetic effects have not been observed. Moreover, some of these SNPs exist in
linkage disequilibrium with each other, and therefore focusing on individual SNPs,
as opposed to their role in haplotypes, may have obscured potentially relevant
genetic effects on P-gp functionality (Ambudkar et al., 2003; Marzolini et al., 2004).
Several studies have reported that specific ABCB1 SNPs can have an impact on P-gp
expression and function in humans, and therefore influence the pharmacokinetics
of certain drugs which are transported substrates of P-gp (Hoffmeyer et al., 2000;
Johne et al., 2002; Fukui et al., 2007; Ieiri, 2012). The first such study reported that
the synonymous C3435T SNP was associated with reduced P-gp expression in
individuals homozygous for the T allele compared to those homozygous for the C
allele (Hoffmeyer et al., 2000). This resulted in higher steady-state plasma levels of
the P-gp substrate digoxin following oral administration in those homozygous for
the T allele, indicating that intestinal P-gp was not limiting its oral absorption to the
same extent as in C/C carriers due to reduced P-gp expression (Hoffmeyer et al.,
2000). While this study has been replicated to an extent (Kurata et al., 2002), others
have reported directly contradictory findings, with lower digoxin bioavailability in
T/T carriers (Sakaeda et al., 2001). This example highlights inconsistencies in the
available data in relation to the functional impact of ABCB1 SNPs in general (Ieiri,
2012).

Chapter 1: General Introduction
38
Table 1.5: List of selected ABCB1 SNPs, associated amino acid changes and their frequencies in different ethnic groups
dbSNP ID SNP AA
substitution
Mutant allele frequency (%)
African Asian Caucasian
rs9282564 A61G Asn21Asp 2.5 1.7 8
rs2229109 G1199A Ser400Asn 1 0 2.5
rs1128503 C1236T Silent 20.9 68.5 45.9
rs2032582 G2677T Ala893Ser 10 45 46.4
rs2032582 G2677A Ala893Thr 0.5 6.7 3.6
rs1045642 C3435T Silent 20.2 40 56.1
rs2235015 G→T Intronic 30 6.7 15.8
rs2032583 T→C Intronic n/a n/a n/a
Mutant allele frequency data obtained from: http://pharmacogenetics.ucsf.edu
1.3.5. The contribution of P-gp efflux to treatment failure
Efflux of P-gp substrate drugs has been linked to treatment failure in many
diseases, most notably in cancer (Gottesman et al., 2002; Szakacs et al., 2006).
Indeed, P-gp was first identified as a result of it conferring treatment resistance to
certain anticancer agents in vitro (Dano, 1973; Juliano and Ling, 1976). Thus, the
name ‘multidrug resistance transporter’ was originally coined for P-gp, and it is still
often referred to by this term. Certain cancerous cells and tumours are known to
overexpress P-gp (Gottesman et al., 2002), and several cytotoxic drugs are avidly
transported P-gp substrates (Table 1.4). As a result, such cytotoxic drugs can be
ineffective in the treatment of P-gp overexpressing cancers, such as acute myeloid
leukaemia (Leith et al., 1999). Moreover, P-gp at the BBB contributes to the lack of
efficacy of these anticancer agents in the treatment of brain tumours (Kemper et
al., 2004).
Much recent interest has focused on the role of P-gp in treatment resistance
beyond oncology, with evidence implicating a potential involvement of P-gp efflux
in drug-resistant brain diseases such as CNS HIV infection, epilepsy, schizophrenia
and depression (Loscher and Potschka, 2005b).

Chapter 1: General Introduction
39
Several antiretroviral drugs used in the treatment of HIV are transported substrates
of P-gp (Table 1.4). In the CNS, HIV infection mostly targets microglia and, to a
lesser extent, astrocytes (Speth et al., 2005), and P-gp expression is upregulated in
HIV-infected astroglial and microglial cells (Langford et al., 2004). Therefore, P-gp
efflux presents an obstacle to successful treatment of CNS HIV at two stages: firstly
in limiting the distribution of antiretroviral drugs across the BBB, and secondly in
preventing their intracellular accumulation within infected cells.
Approximately one third of patients with epilepsy are resistant to treatment (Kwan
and Brodie, 2000). Multidrug resistance transporters, including P-gp, are
overexpressed in BCECs and astrocytes in epileptogenic brain tissue from patients
with refractory epilepsy (Tishler et al., 1995; Dombrowski et al., 2001; Aronica et
al., 2003; Aronica et al., 2004; Feldmann et al., 2013). Increasing in vitro and in vivo
evidence indicates that many, but not all, commonly prescribed anti-epileptic drugs
are transported substrates of efflux transporters, such as P-gp, at the BBB (Zhang et
al., 2012). Thus, overexpression of P-gp may prevent therapeutically effective
concentrations of the antiepileptic drugs from reaching the epileptic neurons,
thereby contributing to the high incidence of medically intractable epilepsy
(Potschka, 2012; Zhang et al., 2012). Indeed, preclinical and small-scale clinical
studies investigating the effect of P-gp inhibition as an adjunctive strategy in
epilepsy have reported promising results (Summers et al., 2004; van Vliet et al.,
2006)
In the field of psychiatry, much recent interest has focused on the role of P-gp in
the treatment of schizophrenia and depression (Loscher and Potschka, 2005b). Over
20% of patients with schizophrenia do not respond to treatment with
antipsychotics (Van Sant and Buckley, 2011). The majority of clinically used
antipsychotic drugs, such as amisulpride, aripiprazole risperidone and olanzapine,
are transported substrates of P-gp at the BBB (El Ela et al., 2004; Wang et al.,
2004a; Wang et al., 2004c; Doran et al., 2005; Wang et al., 2009). Clozapine, on the
other hand, is considered not to be a P-gp substrate (Schinkel et al., 1996; El Ela et
al., 2004) and is generally accepted to be more effective than other antipsychotics

Chapter 1: General Introduction
40
in the management of treatment-resistant schizophrenia (Kane et al., 1988; Van
Sant and Buckley, 2011), leading to speculation that its lack of transport by P-gp
may contribute to its relative efficacy (Loscher and Potschka, 2005b). However, the
evidence supporting a substantial role for P-gp in treatment resistant schizophrenia
is not fully convincing, and further research is required before drawing conclusions
in this regard, not least considering a more recent study reported that clozapine is a
P-gp substrate (Doran et al., 2005).
A growing body of preclinical and clinical evidence points toward a role for P-gp in
antidepressant treatment. This topic is discussed in detail in Section 1.5.
1.3.6. P-gp inhibition as a strategy to augment the therapeutic
effects of P-gp substrate drugs
Given the contribution of P-gp efflux to treatment failure, it has been proposed that
co-administration of P-gp inhibitors with P-gp substrate drugs may represent a
potential strategy to overcome P-gp-mediated drug resistance. Indeed, preclinical
studies, both in vitro and in vivo, have offered hope that this strategy could prove
to be beneficial in cancer and epilepsy (Fellner et al., 2002; Clinckers et al., 2005). In
addition, small scale studies in humans have yielded promising preliminary results
(List et al., 2001; Summers et al., 2004).
However, larger scale clinical trials to date, which have focused primarily on the use
of P-gp inhibitors in combination with cytotoxic drugs in treatment resistant cancer,
have not proven to be successful due to pharmacokinetic and pharmacodynamic
limitations, largely associated with the toxicity of the chemotherapeutic drug or a
lack of therapeutic benefit (Szakacs et al., 2006; Colabufo et al., 2010; Shaffer et al.,
2012).
For example, a high profile failure in this field involved a Phase III clinical trial of the
third generation P-gp inhibitor tariquidar as an adjunctive therapy in non-small cell
lung cancer (NSCLC) (http://clinicaltrials.gov/show/NCT00042302). This trial,
involving co-administration of the tariquidar and the cytotoxic drugs paclitaxel and
carboplatin in patients with advanced stage NSCLC, was terminated prematurely

Chapter 1: General Introduction
41
due to safety concerns. Tariquidar administration exacerbated side-effects
associated with the cytotoxic drugs, without improving patient outcomes (Szakacs
et al., 2006). The failure of this study was perceived as a major blow in the
development of P-gp inhibitors as a clinical augmentation strategy, despite the fact
that there were fundamental flaws in the study design (Szakacs et al., 2006). Firstly,
NSCLC has not been associated with P-gp overexpression, meaning that there was
no clear rationale underpinning adjunctive treatment with a P-gp inhibitor (Szakacs
et al., 2006). Secondly, the dose of tariquidar used in the clinical trial has been
subsequently revealed to be inadequate to achieve substantial inhibition of P-gp
(Kreisl et al., 2010).
Despite these setbacks, the availability of specific and potent modulators of P-gp
function at the BBB may lead to a therapeutically useful role for P-gp inhibitors in
the future. In particular, the potential of P-gp inhibition as an adjunctive strategy in
treatment resistant diseases aside from cancer, thereby avoiding problems
associated with potentiation of cytotoxic activity in healthy tissues, remains
underinvestigated. It should be noted, however, that a recent paper, published on
behalf of the International Transporter Consortium, questions whether clinical
modulation of efflux transport at the human BBB is likely to become a therapeutic
option in future (Kalvass et al., 2013).
1.3.7. Methods to assess drug interactions with P-gp at the BBB
Several different methodological approaches, ranging from in silico to in vivo and
human imaging studies, can be employed to assess drug interactions with P-gp.
Such studies can focus on drug-P-gp interactions in general, or with a specific
emphasis on interactions at the BBB in particular.
1.3.7.1. In silico approaches
As outlined in Section 1.2.5.1, attempts to predict or identify transported substrates
of efflux transporters based on structural properties have proven to be challenging
(Sharom, 2008). Recent advancements have led to more complex algorithms and a
better understanding of molecular characteristics that increase the likelihood of
being subjected to transport by P-glycoprotein (Desai et al., 2013). For example,

Chapter 1: General Introduction
42
most transported substrates of P-gp possess one or two hydrophobic centres, an
aromatic ring, electron donor and/or hydrogen bond donor and acceptor groups
(Raub, 2006). This knowledge can prove useful in the optimisation and selection of
lead compounds for further investigation, based on a desire to select substrates or
non-substrates of P-gp. However, in vitro or in vivo experimental approaches
remain the only reliable method to confidently identify transported substrates of P-
gp.
1.3.7.2. In vitro studies
Several in vitro screening assays can be used to determine interactions between
test compounds and P-gp, and thereby classify drugs as P-gp substrates or
inhibitors (Polli et al., 2001). Functional assays used to identify P-gp substrates
include the ATPase activity and bidirectional transcellular transport assays.
The relationship between P-gp activity and the breakdown of ATP is exploited in the
ATPase activity assay, whereby the release of inorganic phosphate as a result of ATP
hydrolysis following drug incubation with a P-gp expressing membrane is monitored
(Sarkadi et al., 1992). This facilitates high-throughput identification of compounds
that interact with P-gp. However, many compounds identified as so-called P-gp
‘substrates’ using this assay may not be subject to significant P-gp transport
(Schwab et al., 2003), and this is a major limitation of the ATPase activity assay. As a
result, this assay is of limited utility in the accurate identification of compounds that
are meaningfully subjected to P-gp-mediated transport (Balimane et al., 2006).
Bidirectional transcellular transport assays represent the gold standard for
identifying P-gp substrates in vitro, and are the most accurate predictive model for
the identification of P-gp substrates in vivo (Balimane et al., 2006; Feng et al., 2008)
(Figure 1.11). However, these monolayer efflux assays are labour intensive and,
consequently, time consuming with a relatively low-throughput.
Many cell-lines suitable for use in bidirectional transcellular transport assays are
available, including the naturally P-gp-expressing human colorectal
adenocarcinoma (Caco-2) cells and ABCB1-transfected Madine-Darby canine kidney

Chapter 1: General Introduction
43
cells (MDCK-MDR1). These model cell-lines are polarized, with distinct apical and
basolateral membrane domains, when cultured on an appropriate transwell
support. As P-gp is exclusively expressed on the apical membrane of the cultured
cells, the comparison of apical-to-basolateral (A→B) permeability and basolateral-
to-apical (B→A) permeability for a test compound indicates if it is a P-gp substrate.
A (B→A)/(A→B) transport ratio (TR) of > 2.0 is indicative of P-gp mediated efflux
(Lin, 2007).
The presence of other endogenous efflux transporters, in addition to P-gp, in these
cell systems may influence transport. Therefore, it is advisable to use specific and
potent P-gp inhibitors, in conjunction with the TR, to determine if P-gp mediated
efflux is the transport mechanism at play, and thus if the test compound is a P-gp
substrate. Furthermore, for ABCB1-transfected cell lines, such as MDCK-MDR1, a
‘corrected’ transport ratio (cTR) can be calculated by dividing the TR obtained in the
ABCB1-transfected cells by the TR obtained in the respective wild-type cell line
(Zhang et al., 2006; Kuteykin-Teplyakov et al., 2010). However, the expression of
endogenous drug transporters in these cell lines can be affected by transfection
with the human ABCB1 gene (Kuteykin-Teplyakov et al., 2010). This must be taken
into consideration when interpreting cTR values.
Similarly, known P-gp substrates can be used in the bidirectional transcellular
transport assay to determine if a test compound is a P-gp inhibitor. P-gp substrates
commonly used for this purpose include digoxin, loperamide and talinolol (Pariante
et al., 2003b; El Ela et al., 2004; Zhang et al., 2006). A decrease in the TR for the P-
gp substrate following co-incubation with the test compound is indicative of P-gp
inhibition by the test compound.
Other assays, which are less laborious and therefore offer higher throughput, can
be used for the identification and classification of P-gp inhibitors. These P-gp
inhibition assays utilise fluorescent P-gp substrates, such as calcein acetoxymethyl
ester (calcein AM) or rhodamine 123, can be easily automated, and have the
considerable advantage of a generic fluorescent output. Increased intracellular
accumulation (as measured by increased fluorescence) of the fluorescent P-gp

Chapter 1: General Introduction
44
substrate in P-gp expressing cells following co-incubation with the test compound
thus gives an indirect measure of P-gp inhibition (Varga et al., 1996; Ibrahim et al.,
2000; Stormer et al., 2001; Weiss et al., 2003; Feng et al., 2008). Similarly, the
susceptibility of P-gp-expressing-cells to P-gp-substrate cytotoxic drugs, such as
doxorubicin or vinblastine, can be determined. Enhanced cytotoxicity in the
presence of the test compound is indicative of P-gp-inhibition (Merry et al., 1991;
Jaffrezou et al., 1995).
Figure 1.11: Schematic of in vitro bidirectional transport assay. A cell line
expressing P-gp in a polarised fashion, on the apical membrane only (e.g. MDCK-
MDR1), is cultured as a monolayer on a semipermeable membrane at the base of a
transwell insert. Tight junctions form between the cells, thus limiting paracellular
transport. Transport studies are carried out in both the apical-to-basolateral (A→B)
direction, by adding the compound of interest to the apical chamber and sampling
from the basolateral chamber, and the basolateral-to-apical (B→A) direction. Based
on these experiments, the permeability of the compound in each direction can be
calculated, and the permeability in the B→A direction can be compared to the A→B
direction to yield a transport ratio. As P-gp, expressed on the apical membrane only,
will limit the permeability of its transported substrates in the A→B direction, but not
in the B→A direction, P-gp substrates will exhibit greater permeability in the B→A
direction than the A→B direction, thus yielding a transport ratio greater than 1.
Non-substrates of P-gp will yield transport ratios of approximately 1.
Apical chamber
Basolateral chamber
B→A
Transwell
insert
Cell
monolayer
P-gp
substrate
P-gp
substrate
A→B
P-g
p
P-g
p

Chapter 1: General Introduction
45
1.3.7.3. In vivo studies
While P-gp is encoded by a single gene in humans (ABCB1), its functions are
performed by two homologues in mice: the abcb1a and abcb1b genes (Devault and
Gros, 1990). The overall tissue distribution of P-gp overlaps well between the two
species (Ebinger and Uhr, 2006), and there seems to be a high level of correlation in
substrate specificities between mouse and human P-gp based on in vitro studies
(Feng et al., 2008), despite concern relating to potential species differences
(Yamazaki et al., 2001; Katoh et al., 2006; Baltes et al., 2007; Syvanen et al., 2009).
Thus, it appears that mouse-based models are useful, if imperfect, tools for
predicting P-gp-drug interactions in humans.
Abcb1a P-gp is highly expressed at the murine BBB, while it appears that abcb1b P-
gp is also expressed at the BBB, but to a much lesser extent (Pariante, 2008). Thus
the generation of abcb1 knockout mice, firstly single knockout abcb1a(-/-) mice in
1994 (Schinkel et al., 1994), followed by double knockout abcb1ab(-/-) in 1997
(Schinkel et al., 1997), has facilitated the study of the influence of P-gp on brain
pharmacokinetics of various drugs. P-gp deficient mice display normal viability,
thereby indicating that organisms can survive with a complete absence of P-gp
activity (Schinkel et al., 1997). This is an important consideration when evaluating
P-gp inhibition as a potential treatment strategy in patients.
By comparing brain/plasma drug concentration ratios between these P-gp-deficient
knockout mice to those of wild-type controls, it has been possible to identify drugs
as P-gp substrates in vivo. Alternatively, established P-gp inhibitors, such as
verapamil and cyclosporin A, can be administered to wild-type animals to
investigate the influence of P-gp inhibition on brain pharmacokinetics.
1.3.7.4. Human studies
Positron emission tomography (PET) imaging can be used to measure P-gp function
in human volunteers or patient populations, using radiolabelled substrates, such as
99m/94mTc-sestamibi, 11C-verapamil, 18F-paclitaxel or 11C-N-desmethyl-loperamide (de
Klerk et al., 2009; Wagner et al., 2009; Kreisl et al., 2010). Assessing P-gp function in
this way could be useful in predicting drug resistance in patients to be treated with

Chapter 1: General Introduction
46
P-gp substrate therapeutics, identifying disease-states which are associated with
alterations in P-gp activity or in assessing the ability of compounds to inhibit P-gp at
different doses in humans (de Klerk et al., 2009; Wagner et al., 2009; Kreisl et al.,
2010). However, imaging techniques are not generally used to identify drugs which
are subject to P-gp-mediated efflux at the BBB, as it would be necessary to generate
radio-labelled versions of each drug of interest to carry out such assessments.
1.4. Depression
Clinical depression is a common and devastating mood disorder, affecting more
than 350 million people globally (World Health Organisation, 2012). According to
the World Health Organisation, depression is the leading cause of disability
worldwide, and is a major contributor to the global burden of disease (World
Health Organisation, 2012).
Major depressive disorder is diagnosed based on symptomatic criteria, such as
those outlined in the Diagnostic and Statistical Manual of Mental Disorders (DSM-5;
Table 1.6) (American Psychiatric Association, 2013) or the International
Classification of Diseases (ICD). Suicide is an all-too-common tragic consequence of
depression; alarmingly suicide was the tenth leading cause of death in the United
States in 2010 (Centers for Disease Control and Prevention, 2013), and is a well-
recognised problem in Ireland and beyond. Given the severity of the symptoms
associated with depression and its widespread prevalence, there is a major need to
unravel the pathophysiology of the disorder, and to achieve optimal treatment
strategies.

Chapter 1: General Introduction
47
Table 1.6: Symptoms of major depressive disorder (DSM-5)
Symptom
1 Depressed mood or irritable most of the day, nearly every day
2 Decreased interest or pleasure in most activities, most of each day
3 Significant weight change (5%) or change in appetite
4 Change in sleep: either insomnia or hypersomnia
5 Change in activity: psychomotor agitation or retardation
6 Fatigue or loss or energy
7 Feelings of worthlessness or excessive/inappropriate guilt
8 Diminished ability to think or concentrate, or increased indecisiveness
9 Thoughts of death or suicide, or having a suicide plan
N.B. At least 5 of these 9 symptoms, including one of the first two, present nearly every
day for more than two weeks for clinical diagnosis of major depressive disorder
1.4.1. Neurobiology of depression
While considerable advances have been made since Hippocrates proposed that an
excess of black bile was the cause of melancholia, the neurobiological mechanisms
underlying depression, and its exact aetiology, remain unclear despite extensive
research (Cryan and Holmes, 2005; Krishnan and Nestler, 2008). Genetic and
environmental factors, such as stress in particular, play an important role in
conferring susceptibility to depression, with gene-environment interactions thought
to be particularly important (Wong and Licinio, 2001). Numerous hypotheses,
involving monoaminergic, neurotrophic, neuroendocrine and neuroimmune
mechanisms, have been proposed to underpin the neurobiological changes that
result in depression (Wong and Licinio, 2001; Duman and Monteggia, 2006;
Krishnan and Nestler, 2008; Leonard and Myint, 2009). While each of these
hypotheses has merit, none offers a comprehensive explanation of depression on
its own, as several mechanisms are likely to contribute to what is a
symptomatically, biologically and genetically heterogeneous disorder (Krishnan and
Nestler, 2008).
Over 50 years ago, serendipitous observations in relation to reserpine and
iproniazid and imipramine, drugs developed as antihypertensive, antituberculosis
and antihistamine agents, respectively, led to the ‘monoamine hypothesis’ of

Chapter 1: General Introduction
48
depression, which postulates that depression occurs as a result of reduced
monoaminergic transmission in the brain (Slattery et al., 2004; Krishnan and
Nestler, 2008). Reserpine treatment resulted in a depletion of monoamine stores,
inducing depressive symptomatology in a subset of patients, whereas treatment
with iproniazid or imipramine, which were later shown to enhance central
serotonin and noradrenaline neurotransmission, was found to elevate mood in
depressed patients. However, the cause of depression is far from being a simple
case of deficiencies in monoaminergic signalling, as highlighted by limitations of the
monoamine hypothesis of depression (Krishnan and Nestler, 2008). While
monoamine-based antidepressant drugs elicit rapid increases in monoamine
transmission, it requires weeks of treatment for them to produce a clinically
relevant enhancement of mood. Moreover, a high proportion of depressed patients
do not respond to treatment with these antidepressants at all (Fava, 2003). Thus, it
is now thought that acute increases in monoamine transmission by antidepressants
result in secondary neuroplastic changes which require a longer timescale to exert
their effect on mood (Krishnan and Nestler, 2008). Nonetheless, the vast majority
of clinically used antidepressants today act to increase monoamine
neurotransmission acutely, as efforts to identify and exploit other druggable targets
in depression have mostly proven to be unsuccessful (Table 1.7).
Another popular hypothesis pertaining to the pathogenesis of depression involves
neurotrophins and neurogenesis (Duman and Monteggia, 2006). Stress, one of the
main precipitating factors of depression in humans (Gold and Chrousos, 2002), and
antidepressant treatment have opposing effects on neurotrophic factors (Duman
and Monteggia, 2006). Preclinical studies have revealed that stress decreases the
expression of neurotrophic factors, such as brain-derived neurotrophic factor
(BDNF), in limbic structures associated with mood, and that these effects are
reversed or blocked by antidepressant treatment (Duman and Monteggia, 2006).
Similar BDNF deficits have been observed in post-mortem hippocampus samples
from suicide victims with depression (Karege et al., 2005). Moreover, neuroimaging
and post-mortem studies have revealed volumetric deficits in specific brain regions,
including the prefrontal cortex and hippocampus, in subsets of depressed patients

Chapter 1: General Introduction
49
(Cotter et al., 2001; Sheline, 2003), while preclinical studies have demonstrated
that several antidepressants induce adult hippocampal neurogenesis (Sahay and
Hen, 2007). Taken together, these observations support the concept that deficits in
neurotrophins, such as BDNF, may be at play in depression. Indeed, much
preclinical evidence points to a role for BDNF in depression and antidepressant
response (Duman and Monteggia, 2006). Moreover, direct infusion of BDNF into
the hippocampus induces an antidepressant-like effect in rodent models of
depression, such as the forced swim test or the learned helplessness model
(discussed in more detail in Section 1.4.5) (Siuciak et al., 1997; Shirayama et al.,
2002; Hoshaw et al., 2005). However, the ‘BDNF hypothesis of depression’ has
drawn criticism, as further preclinical studies failed to replicate some of these
findings, with some reporting directly opposing effects (Groves, 2007). Thus, it now
appears that, while BDNF-mediated signalling is involved in neuroplastic responses
to stress and chronic antidepressant treatment, these effects are both region- and
antidepressant-specific (Krishnan and Nestler, 2008).
Small increases in serum glucocorticoid levels are commonly reported in depressed
patients (Holsboer, 2000; Parker et al., 2003; Julio-Pieper and Dinan, 2010),
pointing to a potential role for dysregulation of the stress response via the
hypothalamic-pituitary-adrenal axis in the pathophysiology of depression. This
hypothesis is supported by the fact that some depression-like symptoms can by
induced in rodents by chronic administration of glucocorticoids (Gourley et al.,
2008), while depression is common among patients with Cushing’s syndrome, a
feature of which is extreme hypercortisolaemia (McEwen, 2007). Moreover, excess
glucocorticoids can reduce proliferation rates in the hippocampus, thereby
potentially contributing the volumetric deficits in hippocampal volume observed in
depression (a trait also seen in Cushing’s syndrome), as discussed above (McEwen,
2007).
Further evidence points to a potential involvement of neuroimmune mechanisms in
depression, resulting in the ‘cytokine or inflammatory hypothesis’ of depression
(Raison et al., 2006; Leonard, 2010). Depression is a common side-effect of

Chapter 1: General Introduction
50
cytokine-treatment with interferons or interleukins for diseases such as hepatitis C,
multiple sclerosis and cancer, affecting over 30% of patients (Loftis and Hauser,
2004; Dantzer et al., 2008; Leonard, 2010), and elevated levels of the cytokine IL-6
have been observed in depressed patients (Maes et al., 1995). Furthermore,
depressive disorders occur more frequently in diseases involving immune
dysfunction; cytokines can activate the HPA axis (a common trait in depression, as
discussed above); and cytokines can influence monoaminergic signalling in the brain
(which has been associated with depression as per the ‘monoamine hypothesis’)
(Dunn et al., 2005). Taken together, these associations indicate that immune
activation may play a role in at least a subset of depression cases.
Relatively recent findings have triggered an interest in the glutamate system in
depression (Cryan and O'Leary, 2010). Sub-anaesthetic doses of ketamine, a
psychomimetic non-competitive antagonist of the n-methyl-d-aspartate (NMDA)
glutamate receptor, have been reproducibly shown to elicit a rapidly acting, but
transient, antidepressant effect in patients who have not responded to other
antidepressant treatments (Berman et al., 2000; Zarate et al., 2006). However,
while the NMDA receptor, and downstream targets such as mTOR (Li et al., 2010),
represent promising novel targets for drug treatment, at present there is limited
evidence to suggest an important role for glutamatergic dysfunction in depression
per se and further studies are required to more fully characterize the potential
mechanisms at play (Krishnan and Nestler, 2008).
1.4.2. Treatment of depression
As stated earlier in Section 1.4.1, serendipity has played a bigger role than
hypothesis-driven drug discovery in the development of treatments for depression
to date (Slattery et al., 2004).
Both pharmacological and non-pharmacological treatment strategies for the
treatment of depression exist (Table 1.7). In general, more invasive non-
pharmacological strategies, such as electroconvulsive therapy (ECT) or deep brain
stimulation, are reserved for severe cases in which other approaches have failed
(Hollon et al., 2002).
Chapter 1: General Introduction
51
Antidepressant drugs are categorised into different classes, based on structural
characteristics and/or mechanisms of action, including selective serotonin reuptake
inhibitors (SSRIs), tricyclic antidepressants (TCAs) and monoamine oxidase
inhibitors (MAOIs) (Hollon et al., 2002; Joint Formulary Committee, 2013).
However, with the possible exception of agomelatine, a recently approved
melatonin receptor agonist and 5-HT2C receptor antagonist, all currently available
antidepressant drugs, regardless of class, primarily act by enhancing
monoaminergic transmission (Table 1.7). Substantial effort has been invested in
attempts to identify, and exploit, novel therapeutic targets in depression. However,
these efforts have generally not yet translated into alternative therapeutic options
(Berton and Nestler, 2006).
There is little to choose between different antidepressants in terms of efficacy,
although there is a marked difference in terms of safety and side-effects (Hollon et
al., 2002). Therefore, selection of an antidepressant for a particular patient is based
on personal and familial history, the likelihood of particular side effects, safety in
overdose and expense (Hollon et al., 2002). SSRIs are considered first-line, as they
are better tolerated and safer in overdose than other classes. TCAs, for example,
are more likely to be discontinued due to side-effects, and, moreover, can be fatally
toxic in cases of overdose. This is an important consideration, given that patients
suffering from depression are at a higher risk of suicide. MAOIs, on the other hand,
have dangerous interactions with some foods and drugs (refer to Section 1.4.3), and
they are reserved for use by specialists (Hollon et al., 2002; Joint Formulary
Committee, 2013).

52
Table 1.7: List of currently available antidepressant treatments (adapted from Berton and Nestler, 2006; Kupfer et al., 2012; Joint Formulary Committee, 2013)
Antidepressant
class
Drugs (subclass) Proposed mechanism of action
Pharmacological treatments
TCAs Amitriptyline, clomipramine, dosulepin, doxepin,
Imipramine, lofepramine, nortriptyline, trimipramine
Enhance monoaminergic transmission by non-selectively inhibiting the
reuptake of serotonin, dopamine and noradrenaline
TCA-related Mianserin (NaSSA), trazodone Modulation of monoaminergic system
MAOIs Irreversible: phenelzine, isocarboxazid,
tranylcypromine; Reversible: moclobemide
Enhance monoaminergic transmission by preventing the breakdown of
monoamines by inhibiting the monoamine oxidase enzyme
SSRIs Citalopram, escitalopram, fluoxetine, fluvoxamine,
paroxetine, sertraline
Enhance monoaminergic transmission by selectively preventing the reuptake
of serotonin
Other
Agomelatine Melatonergic agonist (MT1 and MT2 receptors) and 5-HT2C antagonist.
Duloxetine, Venlafaxine (SNRIs) Enhance monoaminergic transmission by preventing the reuptake of
serotonin and noradrenaline
Flupentixol Dopamine receptor blockade (primarily an antipsychotic)
Mirtazapine (NaSSA) Increases central noradrenergic and serotonergic neurotransmission by
inhibition of α2 and 5-HT2C presynaptic autoreceptors.
Reboxetine (NRI) Enhances noradrenergic transmission by preventing its reuptake
Tryptophan (serotonin precursor) Enhances serotonergic transmission by increasing central serotonin levels

53
Antidepressant
class
Drugs (subclass) Proposed mechanism of action
Non-pharmacological treatments
Electroconvulsive therapy (ECT) General brain stimulation
Magnetic stimulation General brain stimulation? A magnetic field is thought to affect the brain by
inducing electric currents and neuronal depolarization
Vagal nerve stimulation (VNS) Unknown
Psychotherapy Exact mechanism is uncertain, but is thought to involve learning new ways of
coping with problems
Deep brain stimulation In severely ill patients, stimulation of a region of the cingulate cortex found to
function abnormally in brain imaging scans reportedly has antidepressant
effects
MAOIs: monoamine oxidase inhibitors; NaSSA: noradrenergic and specific serotonergic antidepressant; NRI: noradrenaline reuptake inhibitor; SNRIs:
serotonin-noradrenaline reuptake inhibitors; SSRI: selective serotonin reuptake inhibitors; TCAs: tricyclic antidepressants
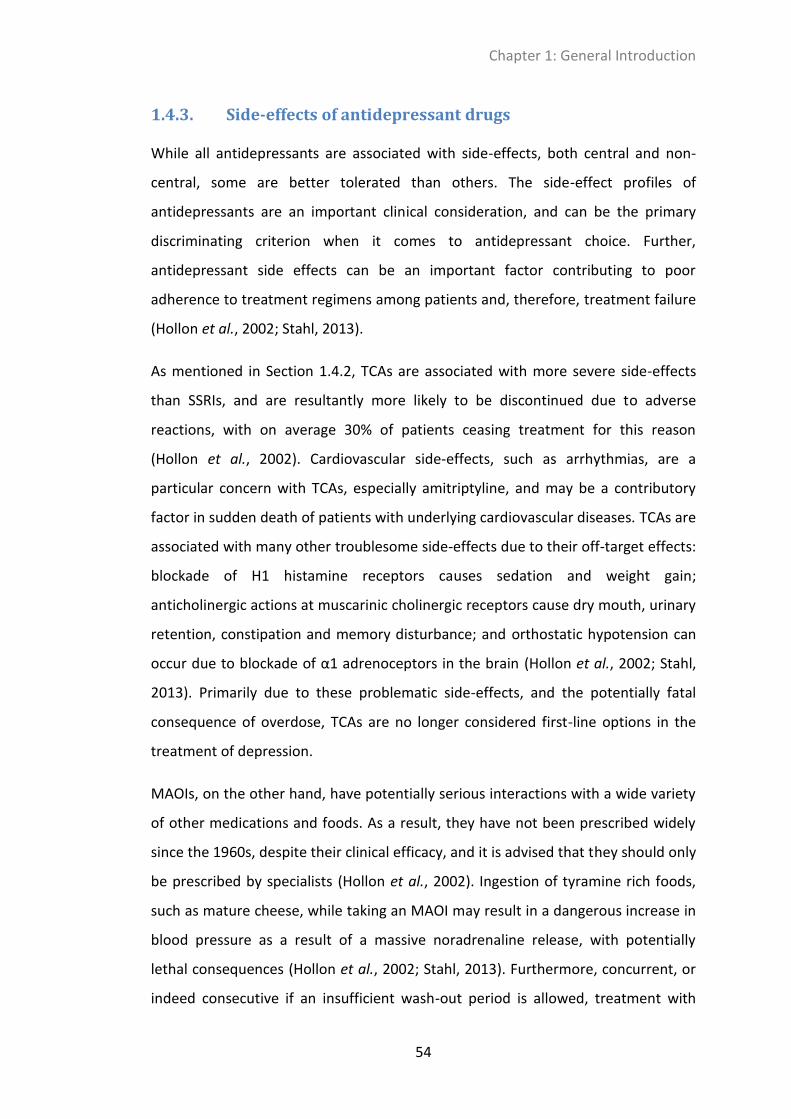
Chapter 1: General Introduction
54
1.4.3. Side-effects of antidepressant drugs
While all antidepressants are associated with side-effects, both central and non-
central, some are better tolerated than others. The side-effect profiles of
antidepressants are an important clinical consideration, and can be the primary
discriminating criterion when it comes to antidepressant choice. Further,
antidepressant side effects can be an important factor contributing to poor
adherence to treatment regimens among patients and, therefore, treatment failure
(Hollon et al., 2002; Stahl, 2013).
As mentioned in Section 1.4.2, TCAs are associated with more severe side-effects
than SSRIs, and are resultantly more likely to be discontinued due to adverse
reactions, with on average 30% of patients ceasing treatment for this reason
(Hollon et al., 2002). Cardiovascular side-effects, such as arrhythmias, are a
particular concern with TCAs, especially amitriptyline, and may be a contributory
factor in sudden death of patients with underlying cardiovascular diseases. TCAs are
associated with many other troublesome side-effects due to their off-target effects:
blockade of H1 histamine receptors causes sedation and weight gain;
anticholinergic actions at muscarinic cholinergic receptors cause dry mouth, urinary
retention, constipation and memory disturbance; and orthostatic hypotension can
occur due to blockade of α1 adrenoceptors in the brain (Hollon et al., 2002; Stahl,
2013). Primarily due to these problematic side-effects, and the potentially fatal
consequence of overdose, TCAs are no longer considered first-line options in the
treatment of depression.
MAOIs, on the other hand, have potentially serious interactions with a wide variety
of other medications and foods. As a result, they have not been prescribed widely
since the 1960s, despite their clinical efficacy, and it is advised that they should only
be prescribed by specialists (Hollon et al., 2002). Ingestion of tyramine rich foods,
such as mature cheese, while taking an MAOI may result in a dangerous increase in
blood pressure as a result of a massive noradrenaline release, with potentially
lethal consequences (Hollon et al., 2002; Stahl, 2013). Furthermore, concurrent, or
indeed consecutive if an insufficient wash-out period is allowed, treatment with

Chapter 1: General Introduction
55
MAOIs and other antidepressants may precipitate the potentially fatal serotonin
syndrome (see Section 1.4.3.1).
In comparison to TCAs and MAOIs, SSRI antidepressants are much better tolerated
(Hollon et al., 2002). Nevertheless, SSRI treatment is associated with many side
effects, mainly as a result of increased serotonergic signalling: gastrointestinal side-
effects, such as cramps and diarrhoea, via peripheral 5-HT3 and 5-HT4 receptors in
the gut; centrally-mediated side-effects; including anxiety, appetite dysregulation,
insomnia, sexual dysfunction, nausea and vomiting (Hollon et al., 2002; Stahl,
2013). While the side effects of SSRIs are generally less problematic and less
dangerous than those associated with other classes of antidepressants, they
nonetheless represent a significant clinical problem and can result in poor patient
adherence, with discontinuation of treatment in 10-20% of patients (Hollon et al.,
2002). Indeed, recent regulatory guidance recommended that doses of the
commonly prescribed SSRIs citalopram and escitalopram should be minimized due
to cardiovascular side-effects involving prolongation of the QT interval (Medicines
and Healthcare products Regulatory Agency, 2011). Thus, any potential strategy to
increase the selective delivery of antidepressants to their site of action in the brain,
minimizing peripheral exposure and thereby limiting peripheral side effects, could
be of enormous clinical benefit. However, enhancing brain concentrations of an
antidepressant drug could result in an increased risk of centrally-mediated side-
effects, such as those listed above.
1.4.3.1. Serotonin syndrome
Serotonin syndrome is a potentially fatal adverse drug reaction, which occurs as a
result of excessive serotonin signalling following ingestion of agents which enhance
serotonergic neurotransmission (Boyer and Shannon, 2005). It is characterised by
clinical symptoms such as tremor, clonus, muscular hypertonicity, altered mental
state and hyperthermia in patients (Boyer and Shannon, 2005). Examples of agents
which may precipitate serotonin syndrome are listed in Table 1.8 (Boyer and
Shannon, 2005; Haberzettl et al., 2013). While serotonin syndrome may occur after
ingestion of a single 5-HT enhancing agent, it is more commonly associated with

Chapter 1: General Introduction
56
intake of two or more serotonergic drugs with differing mechanisms of action, such
as SSRIs and MAOIs (Haberzettl et al., 2013). Indeed, life-threatening cases are
generally only observed where a combination of agents have been taken (Gillman,
2005).
Table 1.8: List of selected compounds known to contribute to the development of serotonin syndrome (adapted from Boyer and Shannon, 2005; Thanacoody, 2012; Haberzettl et al., 2013)
Classification Selected examples
SSRI antidepressants Citalopram, escitalopram, fluoxetine,
fluvoxamine, paroxetine, sertraline
MAOI antidepressants Clorgiline, moclobemide, phenelzine,
isocarboxazid
Other antidepressants Buspirone, clomipramine, nefazodone,
trazodone, venlafaxine
Anticonvulsants Valproate
Analgesics Fentanyl, pentazocine, pethidine, tramadol
Anti-emetic agents Granisetron, ondansetron and metoclopramide,
Anti-migraine drugs Sumatriptan
Bariatric medications Sibutramine
Antibiotics/antiretrovirals Linezolide (inhibits MAO) and ritonavir (inhibits
CYP3A4)
Cough remedies Dextromethorphan
Drugs of abuse methylenedioxymethamphetamine
(MDMA/’ecstasy’), lysergic acid diethylamide
(LSD), cocaine
Dietary supplements and herbal
products
Tryptophan, 5-hydroxy-tryptophan, Hypericum
perforatum (St John’s Wort)
Mood-stabilizers Lithium
Owing to a lack of comprehensive epidemiological data pertaining to serotonin
syndrome, it is not possible to definitively state its prevalence. However, estimates
have approximated an incidence of 0.4 cases per 1,000 patient-months of
treatment (Mackay et al., 1999). Moreover, the incidence of serotonin syndrome is
thought to be increasing as a result of better recognition by clinicians and greater
prescribing of serotonergic drugs in recent years (Thanacoody, 2012). Given its

Chapter 1: General Introduction
57
serious and potentially lethal consequences, it is ethically unacceptable to conduct
human experiments to investigate drug combinations which may induce serotonin
syndrome.
In this context, animal models of serotonin syndrome are an invaluable tool to
investigate drug combinations which may precipitate the syndrome in humans
(Haberzettl et al., 2013). Many of the symptoms of serotonin syndrome can be
successfully emulated in rodent models, which exhibit high levels of predictive
validity (Haberzettl et al., 2013). Behaviours associated with rodent models of
serotonin syndrome include tremor, hind limb abduction and involuntary tics.
These behaviours can be scored according to their severity, thereby facilitating
quantitative evaluation of the impact of a drug on the manifestation of serotonin
syndrome (Haberzettl et al., 2013).
1.4.4. Treatment-resistant depression
Despite the numerous drugs available for the treatment of depression (Table 1.7),
treatment resistant depression (TRD) represents a significant clinical challenge
(Souery et al., 2006). While the exact definition of TRD remains somewhat
contentious, it is clear that current antidepressant therapies have unsatisfactory
efficacy (Souery et al., 2006; Holtzheimer and Mayberg, 2011). It has been
estimated that up to 60% of depressed patients do not achieve an adequate
response to antidepressant treatment (Fava, 2003; Trivedi et al., 2006), with
remission rates declining even further following successive treatment failures (Rush
et al., 2006). Moreover, relapse occurs in a large proportion of patients who initially
respond to treatment (Holtzheimer and Mayberg, 2011). As depression is one of
the leading causes of disability in the developed world (Cryan and Leonard, 2010),
there is a major impetus to determine why so many patients fail to respond to
antidepressant treatment, and to devise novel strategies to improve treatment
outcomes.
Existing medication-based strategies recommended after the failure of an initial
antidepressant trial, which has been optimized in terms of dose and duration,
include augmentation with an adjunctive agent not thought to be an antidepressant

Chapter 1: General Introduction
58
in its own right or switching to another antidepressant drug (Connolly and Thase,
2011). A multisite, prospective, randomized, multistep clinical trial of outpatients
with nonpsychotic major depressive disorder, the Sequenced Treatment
Alternatives to Relieve Depression (STAR*D) study, was undertaken in recent years
to determine the effectiveness of existing treatment strategies for people with
major depression who did not respond to initial treatment with the SSRI
antidepressant citalopram (Rush et al., 2004). This study found that, in the majority
of patients, achieving remission of depressive episodes requires repeated trials of
sufficiently sustained, vigorously dosed antidepressant therapy. Furthermore,
switching antidepressant medication or augmenting it with another agent were
found to be reasonable strategies in cases of initial treatment failure (Gaynes et al.,
2008).
Numerous agents, including lithium and thyroid hormone, have been proposed to
augment the effects of antidepressants (Thase, 2004; Connolly and Thase, 2011).
The modes of action of these strategies are not fully understood. Augmentation
with lithium, primarily used as a mood stabiliser, is thought to enhance the effects
of antidepressant treatment via modulation of second messenger systems or
increases in hippocampal proliferation, while thyroid hormone may act by ‘priming’
noradrenergic neurotransmission or by correcting suboptimal thyroid function in a
subset of depressed patients (Thase, 2004; O'Leary et al., 2013). Although
adjunctive lithium and thyroid hormone have established efficacy in the treatment
of depression in particular circumstances, their relevance to modern practice is
unclear. Most of the supporting evidence for these agents comes from trials when
they were used in combination with TCAs in less severely resistant patients than
those typically in receipt of TCAs nowadays (Connolly and Thase, 2011). As a result,
it is impossible to confidently state their efficacy in TRD when used in combination
with more modern antidepressants, such as SSRIs, due to a lack of data in this
regard (Connolly and Thase, 2011). Given these issues, the troublesome side-effect
profile of lithium treatment and its narrow therapeutic index, lithium is no longer
widely used as an augmentation agent in TRD (Thase, 2004). The available evidence
indicates that thyroid hormones, such as triiodothyronine (T3) are essentially

Chapter 1: General Introduction
59
equivalent to lithium in terms of their efficacy as augmenters of antidepressant
activity, and therefore may be considered a preferable option given their generally
better tolerability and greater ease of administration (Connolly and Thase, 2011).
Additional randomised, placebo controlled trials are needed in order to evaluate
the efficacy of lithium or thyroid hormone in patients who have not responded to
first-line SSRI treatment (Connolly and Thase, 2011).
Atypical antipsychotic drugs, such as olanzapine, risperidone, quetiapine and
aripiprazole, have also been reported to be effective augmentation agents in major
depressive disorder (Nelson and Papakostas, 2009; Connolly and Thase, 2011).
Atypical antipsychotics are pharmacologically diverse, with each drug having a
distinct and complex set of receptor affinities involving dopaminergic and
serotonergic receptors, in addition to varying effects on noradrenergic,
histaminergic and cholinergic systems (Papakostas and Shelton, 2008).The
proposed neuropharmacological rationale underlying the use of antipsychotic drugs
as adjunctive agents in TRD involves their effects on various serotonin receptors, in
particular antagonism of the 5-HT2 receptor (Papakostas and Shelton, 2008). A
meta-analysis revealed that these agents are equally efficacious as each other as
adjunctive agents in TRD (Nelson and Papakostas, 2009). Moreover, the evidence
supporting their efficacy is more robust than that of lithium or T3 (Nelson and
Papakostas, 2009). However, these atypical antipsychotic agents are associated
with an increased risk of discontinuation due to adverse events, meaning that other
strategies are often preferred (Nelson and Papakostas, 2009). The evidence
supporting the efficacy other putative augmentation agents, such as buspirone,
pindolol and psychostimulants is less than convincing (Connolly and Thase, 2011).
In addition to augmentation, other commonly used strategies in cases of failure to
respond to initial antidepressant treatment involve switching to another
antidepressant drug or concurrent treatment with a combination of different
antidepressants. While the switching approach no doubt represents a good clinical
option, there is insufficient data to suggest that any antidepressant has a unique
therapeutic advantage compared to others in SSRI non-response (Connolly and

Chapter 1: General Introduction
60
Thase, 2011). Additional studies are needed to address this question. Similarly, the
use of antidepressant combination therapy in non-response is understudied,
although available data suggest that addition of mirtazapine or mianserin to SSRI
treatment may prove to be useful in this regard (Connolly and Thase, 2011).
As mentioned in Section 1.4.1, increasing recent evidence suggests that sub-
anaesthetic doses of ketamine may represent a potentially rapid and effective
option in TRD (Berman et al., 2000; Zarate et al., 2006). However, certain questions
remain to be answered before this approach is adopted into widespread clinical
practice (Rush, 2013). Given the restrictive inclusion criteria employed in studies to
date, whether or not these promising findings will generalize to wider populations
of depressed patients remains unclear. Moreover, the medium-to-long term
management required to maintain remission in ketamine-treated patients is not yet
known. The abuse potential and side effects associated with ketamine also
represent substantial drawbacks. Identification of the molecular pathways
responsible for the antidepressant action of ketamine and the potential
development of more specific, non-psychomimetic, drugs targeting these pathways
offers hope for the future (Cryan and O'Leary, 2010). Promisingly, a novel NMDAR
glycine-site functional partial agonist, GLYX-13, has been reported to elicit
antidepressant-like effects in rodent models of depression, without exhibiting
substance abuse-related or sedative side effects associated with ketamine, and is
now undergoing Phase II clinical development programme for TRD (Burgdorf et al.,
2013).
Other, non-pharmacological, strategies to combat TRD include vagus nerve
stimulation, deep brain stimulation in the subgenual cingulate region of the brain,
transcranial magnetic stimulation and electroconvulsive therapy(Holtzheimer and
Mayberg, 2011). These approaches are reserved for severe cases of TRD, and vary
in terms of their efficacy, with none representing a panacea in the treatment of
depression (Holtzheimer and Mayberg, 2011).
In summary, TRD remains a considerable clinical problem. Despite the limitations of
the monoamine hypothesis of depression, attempts to develop improved
Chapter 1: General Introduction
61
pharmacological treatment strategies based on novel mechanisms have yet to bear
fruit (Holtzheimer and Mayberg, 2011). Further research is required to attain a
greater understanding of the reasons why some patients respond to antidepressant
treatment while others do not, and to develop novel approaches to overcome TRD.
1.4.5. Animal models of depression and antidepressant-like
activity
One of the major challenges in elucidating the neurobiological mechanisms
underlying depression and in developing novel treatment strategies for this
disorder is the generation of satisfactory in vivo model systems in which to explore
these issues (Cryan and Holmes, 2005; O'Leary and Cryan, 2013). Due to practical
and ethical limitations, conducting studies in humans to further our knowledge of
the neurobiology of depression is difficult. Thus, translational animal models are
vital to develop a greater understanding of the disorder (Berton et al., 2012;
O'Leary and Cryan, 2013). Furthermore, owing to the prohibitively large cost of
clinical trials in pharmaceutical development, it is essential to have valid preclinical
animal models to evaluate the potential efficacy of novel antidepressants prior to
taking the decision to progress to clinical studies (Cryan and Holmes, 2005).
Despite difficulties in reproducing a complex human neuropsychiatric disorder like
depression in lower species, it is possible to model certain symptoms associated
with human depression in rodents (Table 1.6). For example, symptoms such as
anhedonia, weight/appetite changes, sleep disturbances and disrupted cognitive
performance can all be modelled in rodents. More complex psychological
symptoms, such as suicidal thoughts or feelings of worthlessness/guilt, cannot be
modelled, however (Cryan and Holmes, 2005). Thus, it is not possible to fully
recapitulate human depression in rodents, and it is necessary to avoid the pitfall of
anthropromorphization of emotion-related behaviours in such lower species,
especially in light of the substantial differences in brain anatomy between humans
and rodents (Cryan and Holmes, 2005; O'Leary and Cryan, 2013).
Moreover, the symptomatic heterogeneity of depression needs to be borne in mind
when discussing animal models of depression (Berton et al., 2012). Anhedonia, for

Chapter 1: General Introduction
62
example, is only present in approximately 50% of depressed patients (Berton et al.,
2012). An animal model of depression involves an inducing manipulation, such as
stress, resulting in a behavioural or neurobiological readout (O'Leary and Cryan,
2013). Thus, animal ‘models’ of depression which are based on particular individual
behaviours reflecting depressive symptomatology, such as anhedonia, may be more
accurately considered as ‘tests’ of depressive-like behaviours or of antidepressant-
like activity rather than models per se (O'Leary and Cryan, 2013).
Despite their limitations, the use of rodent models of depression, in particular those
involving transgenic mice, have helped to facilitate investigations of systems
thought to be involved in depression (Cryan and Mombereau, 2004; Cryan and
Holmes, 2005). The minimum requirements for a valid animal model of depression,
as proposed by McKinney and Bunney (1969), are that: the symptomatology or
manifestations are ‘reasonably analogous’ to human depression; behavioural
changes are amenable to objective monitoring; behavioural changes are reversible
by treatment with clinically effective antidepressant drugs; the model is
reproducible between investigators. While these requirements act as a worthwhile
guide in the development of animal models of depression, the need for behavioural
changes to be reversible by clinically effective antidepressant treatments may have
resulted in a circular situation whereby these models are primarily effective in the
identification of novel treatments which act via the same mechanisms as already
available antidepressants (Krishnan and Nestler, 2008). This may, in turn, have
contributed to difficulties in successfully identifying novel treatment approaches.
Furthermore, many compounds which have displayed antidepressant-like activity in
rodent models of depression have not proven to be clinically useful (O'Leary and
Cryan, 2013). Nonetheless, animal models of depression and antidepressant-like
activity represent valuable research tools, and several such models are in use today
(Table 1.9).
Two of the most commonly used and conceptually similar, but not synonymous,
rodent models of depression and antidepressant-like activity are the forced swim
test (FST, which can be performed in rats or mice) and the tail suspension test (TST,

Chapter 1: General Introduction
63
which is generally only performed in mice) (Cryan and Mombereau, 2004; Cryan
and Holmes, 2005; O'Leary and Cryan, 2013). These so-called ‘behavioural despair’
tests, in which rodents are placed in an inescapable cylinder of tepid water or
suspended upside-down by the tail, respectively, are based on the principle that the
rodents will initially engage in vigorous, but futile, escape-oriented movements,
followed by increasing bouts of passive immobility (Cryan and Holmes, 2005).
Administration of various clinically effective antidepressant treatments (both
pharmacological and non-pharmacological) prior to either the FST or TST prolong
the duration of escape-oriented activity, with a corresponding reduction in passive
immobility (Cryan and Holmes, 2005). Furthermore, factors which are implicated in
depression, including genetic predisposition and exposure to stress, alter
immobility behaviour in these tests (Cryan and Mombereau, 2004; Cryan and
Holmes, 2005).
Originally described as ‘behavioural despair’ (Porsolt et al., 1977a; Porsolt et al.,
1977b), the precise meaning of immobility and its relevance to depression in these
tests is controversial (Cryan and Mombereau, 2004). Given that immobility in the
TST or FST appears to be due to an inability or reluctance to maintain effort, as
opposed to a manifestation of generalised hypoactivity, it is tempting to speculate
that it may be analogous to psychomotor impairments commonly seen in
depressed patients (as listed in Table 1.6) (Cryan and Holmes, 2005). Another
source of contention in relation to the FST and TST is the criticism that they are
sensitive to acute antidepressant administration, rather than the chronic treatment
required to elicit a clinical response (as discussed in Section 1.4.2), thereby
suggesting that they may not act via the same long-term adaptive mechanisms that
result in antidepressant effects in humans (Cryan and Holmes, 2005).
Notwithstanding these criticisms, the FST and TST remain useful tools in
depression-related research, in particular when it comes to assessing strategies to
increase the pharmacodynamic activity of existing antidepressant treatments.
While the FST and TST are similar in their underlying principles and the main
behavioural readout, there are some key differences between the two paradigms

Chapter 1: General Introduction
64
which warrant discussion (Cryan et al., 2005a). The TST avoids possible confounding
contribution of hypothermic exposure and swimming capability (which can be an
issue for some mouse strains) as encountered in the FST. Furthermore, the pattern
of immobility differs between the two tests: in the FST animals engage in rapid
bouts of active behaviour, with immobility only emerging after the second minute
of the test. Contrastingly, in the TST animals can become immobile much earlier
during testing, but do not remain immobile for periods as long as those
encountered in the FST (Cryan et al., 2005a). Moreover, the two tests offer
differential sensitivity and divergent dose-response curves: whereas the FST may
not be consistently sensitive in detecting SSRI activity, the TST generally is (Cryan et
al., 2005a). Furthermore, genetic knockout of the GABAB receptor induces an
antidepressant effect in the FST, but not the TST (Mombereau et al., 2004).
Other animal models of depression include the learned helplessness (LH) and
chronic mild stress (CMS) models, both of which are based on the concept of
maladaptive coping responses to uncontrollable stresses (Cryan and Holmes, 2005;
O'Leary and Cryan, 2013), and the olfactory bulbectomy (OB) model (Song and
Leonard, 2005). Chronic treatment with antidepressant drugs reverses some of the
behavioural deficits in these models, thus providing pharmacological validity (Cryan
and Holmes, 2005; Song and Leonard, 2005). In particular, the CMS and OB models
result in behavioural, neurochemical, neuroimmune and neuroendocrine
alterations resembling those seen in depressed patients, some of which are
responsive only to chronic, but not acute, antidepressant treatment (Cryan and
Holmes, 2005; Song and Leonard, 2005).
Additional paradigms, such as the sucrose preference test or intracranial self-
stimulation can be employed to investigate depression-related behaviours (Cryan
and Holmes, 2005). These tests are useful in assessing anhedonic aspects of animal
models of depression, such as LH, CMS and OB listed above.

65
Table 1.9: Current rodent models used in depression research (adapted from O'Leary and Cryan, 2013)
Model Description
Acute stress-based models
Forced swim test (FST) When placed in an inescapable container of water, rats and mice will adopt an immobile posture; the duration of immobility is
reduced by antidepressant treatment
Modified FST As per FST, but swimming and climbing behaviours are assessed, in addition to immobility. Serotonergic antidepressants increase
swimming behaviour, whereas noradrenergic antidepressants increase climbing behaviour. Most commonly employed in rats.
Tail suspension test
(TST)
When suspended from a bar by the tail, mice will adopt an immobile posture. Like the FST, the duration of immobility is reduced
by antidepressant treatment.
Chronic stress-based models
Maternal separation When separated from their mother during early postnatal life, rodents (mainly rats) can develop depression-like phenotypes in
adulthood.
Prenatal stress Exposure to a stressor during pregnancy induces depression-like behaviour and persistent physiological changes in the offspring.
Unpredictable chronic
mild stress
Rodents are exposed to a variety of unpredictable stressors, resulting in depressive-like behaviours, which are prevented by
antidepressant treatment.
Social defeat stress Exposure to a novel, aggressive counterpart on a daily basis, with repeated defeat, evokes depression-like behaviours in the test
subject. In particular, the test subject displays social avoidance behaviours when put in contact with an unfamiliar counterpart,
and this is reversed by chronic antidepressant treatment
Learned helplessness Rodents subjected to repeated inescapable shocks subsequently do not escape when given the opportunity, an effect reduced by
chronic antidepressant treatment.
Genetic predisposition studies
Selective breeding Independent lines of mice and rats that differ in depression-like phenotype have been generated by selective breeding based on
depressive-like behaviours, for example Flinders sensitive line (FSL) rats and Rouen helpless mice
Strain differences Various strains of mice and rats have been reported to exhibit differential responses in various models of depression and
antidepressant-like activity
Directed gene targeting Genetically modified mice have been generated with disrupted expression of proteins thought to play a role in depression

66
Model Description
Dysfunction of limbic circuitry
Olfactory bulbectomy
(OB)
Removal of the olfactory bulbs in rodents results in various neurochemical and behavioural alterations, which are reversed by
chronic antidepressant treatment.
Focal lesions Transient inactivation of the rat infralimbic cortex has antidepressant-like effects
Optogenetics Inhibition or activation of specific groups of neurons in limbic areas of the brain have differential effects on depression-like
behaviours
Other
Drug withdrawal In rodents, amphetamine withdrawal is characterised by anhedonia, learned helplessness and increased immobility in the FST
and TST.
Neonatal drug
treatment
Neonatal administration of clomipramine induces various depression-like behaviours in adulthood

Chapter 1: General Introduction
67
1.4.6. P-gp expression and activity in depression
A PET study using 11C-verapamil has shown that P-gp function is increased in
patients with major depression receiving antidepressant treatment (de Klerk et al.,
2009). Using this technique, cerebral volume of distribution of 11C-verapamil, which
is a transported P-gp substrate, was used as a surrogate measure of P-gp function.
The reason for increased P-gp function in medicated depressed patients has not
been fully elucidated, but there are several potential explanations that warrant
further investigation.
Firstly, it may be due to P-gp induction by chronic antidepressant treatment itself,
and therefore not be related to the disease per se, as it is known that treatment
with xenobiotics can increase P-gp expression (Bauer et al., 2004; Narang et al.,
2008). This theory is supported by both in vitro and in vivo studies demonstrating
induction of P-gp by the antidepressant venlafaxine (Ehret et al., 2007; de Klerk et
al., 2010).
Secondly, various cytokines increase the expression and activity of P-gp in vitro
(Bauer et al., 2007; Yu et al., 2007; Liptrott et al., 2009) and immune activation,
with correspondingly increased circulating cytokine levels, has been widely
reported in at least a subset of depressed patients (Schiepers et al., 2005; Dinan,
2009). Therefore, immune activation may contribute to the increased P-gp function
observed in medicated depressed patients. However, P-gp activity, as measured by
the cerebral volume of distribution of 11C-verapamil, was reduced in rats which
were subjected to chronic foot-shock stress as a model of human depression (de
Klerk et al., 2010). This increase in the cerebral volume of distribution of 11C-
verapamil may be reflective of stress-mediated disruption of the BBB through non-
P-gp-mediated mechanisms, however, as no other marker was used to verify the
integrity of the BBB independent of P-gp. In addition, the translational value of this
rat model to processes ongoing at the BBB in depressed patients is unclear.
Finally, functional SNPs in the ABCB1 gene may explain the altered P-gp activity
observed in depressed patients. Indeed, certain uncommon polymorphisms in
ABCB1 were linked to the severity of depressive symptoms in a cohort of Taiwanese

Chapter 1: General Introduction
68
depressed patients (Lin et al., 2011). The functional impact of these particular
polymorphisms has not yet been characterised, however. It would be of interest to
conduct a PET study in a similar group of patients to determine if BBB P-gp function
is related to genotype.
1.5. Interactions between P-gp and antidepressant drugs at the
BBB
Antidepressant drugs need to penetrate the BBB to reach their site of action within
the brain. Therefore, it has been suggested that drug efflux by P-gp at the BBB may
contribute to the high prevalence of TRD. Indeed, many antidepressant drugs
interact with P-gp in vitro and in vivo, both as substrates and inhibitors. These
interactions have been postulated to be of clinical importance, as P-gp efflux would
limit the distribution of these drugs in to the brain, thereby potentially resulting in
sub-therapeutic target-site concentrations (Loscher and Potschka, 2005b) (Figure
1.13). Interestingly, it has also been hypothesized that inhibition of P-gp may, in
fact, be involved in the mechanism of action of antidepressant drugs (Pariante et
al., 2004), as discussed in detail in Section 1.5.7.
1.5.1. In vitro studies investigating the transport of
antidepressants by P-gp
Assays to identify P-gp inhibitors are generally more cost-effective and less labour-
intensive than studies aimed at identifying transported P-gp substrate. Therefore,
the majority of in vitro studies investigating interactions between antidepressant
drugs and-P-gp to date have focused on P-gp inhibition by antidepressants.
However, a small number of studies using bidirectional transcellular transport
assays (Rochat et al., 1999; Mahar Doan et al., 2002; Faassen et al., 2003; El Ela et
al., 2004; Maines et al., 2005), the ATPase assay (Ejsing et al., 2006; Wang et al.,
2008) or both (Feng et al., 2008) have been conducted.
Table 1.10 presents a summary of the available in vitro data on antidepressants as
P-gp substrates. Column 2 indicates the conclusions drawn by the studies’ authors,
and it is important to be aware that the interpretation of results may differ
between groups.

69
Table 1.10: In vitro studies investigating if various antidepressants are substrates of P-gp
Antidepressant P-gp substrate /
interaction? Transport ratio ATPase Km (µM) Model Ref
Bidirectional Transport Studies Amitriptyline N 1.34 n/a MDCK-MDR1 Mahar Doan et al., 2002 Y 4.51 n/a Caco-2 Faassen et al., 2003 Citalopram N 1 1.6 n/a MDCK-MDR1 Feng et al., 2008 N 2 1.2 n/a MDCK-mdr1a Feng et al., 2008 N 1.1 n/a BMEC monolayer Rochat et al., 1999 Clomipramine N 1.42 n/a MDCK-MDR1 Mahar Doan et al., 2002 Desipramine N 1.03 n/a MDCK-MDR1 Mahar Doan et al., 2002 Y 3.983 n/a Caco-2 Faassen et al., 2003 Doxepin N 1.15 n/a MDCK-MDR1 Mahar Doan et al., 2002 Fluoxetine N 1.18 n/a MDCK-MDR1 Mahar Doan et al., 2002 N 1 0.5 n/a MDCK-MDR1 Feng et al., 2008 N 2 0.6 n/a MDCK-mdr1a Feng et al., 2008 Fluvoxamine N 1.2 n/a MDCK-MDR1 Mahar Doan et al., 2002 N 1 0.9 n/a MDCK-MDR1 Feng et al., 2008 N 2 0.8 n/a MDCK-mdr1a Feng et al., 2008 Y 1.26 n/a Caco-2 El Ela et al., 2004 Imipramine N 1.05 n/a MDCK-MDR1 Mahar Doan et al., 2002 Y 6.04 n/a Caco-2 Faassen et al., 2003 Nortriptyline N 1.39 n/a MDCK-MDR1 Mahar Doan et al., 2002 N 1 1.1 n/a MDCK-MDR1 Feng et al., 2008 N 2 0.9 n/a MDCK-mdr1a Feng et al., 2008 Paroxetine N 1 1 n/a MDCK-MDR1 Feng et al., 2008 N 2 1 n/a MDCK-mdr1a Feng et al., 2008

70
Antidepressant P-gp substrate /
interaction? Transport ratio ATPase Km (µM) Model Ref
Paroxetine (contd) N n/a n/a B(ovine)R(etinal)EC Maines et al., 2005 Protriptyline Y 2 n/a MDCK-MDR1 Mahar Doan et al., 2002 Sertraline N 1 0.4 n/a MDCK-MDR1 Feng et al., 2008 N 2 0.5 n/a MDCK-mdr1a Feng et al., 2008 Trazodone N 0.94 n/a MDCK-MDR1 Mahar Doan et al., 2002 Trimipramine N 0.92 n/a MDCK-MDR1 Mahar Doan et al., 2002 Venlafaxine N 1 0.9 n/a MDCK-MDR1 Feng et al., 2008 N 2 1 n/a MDCK-mdr1a Feng et al., 2008
ATPase assay Bupropion N n/a 2676 ATPase assay Wang et al., 2008 →EB N n/a 109.3 ATPase assay Wang et al., 2008 →HB N n/a 318.2 ATPase assay Wang et al., 2008 →TB N n/a 2066 ATPase assay Wang et al., 2008 Citalopram Low n/a 441 ± 140.1 ATPase assay Feng et al., 2008 Fluoxetine Low n/a 51.6 ± 11.81 ATPase assay Feng et al., 2008 Fluvoxamine Low n/a 180 ± 35.7 ATPase assay Feng et al., 2008 Nortriptyline Y n/a 257.6 ATPase assay Ejsing et al., 2006 Low n/a 56.0 ± 15.73 ATPase assay Feng et al., 2008 Paroxetine Moderate n/a 26.2 ± 1.02 ATPase assay Feng et al., 2008 Sertraline High n/a 9.4 ± 1.45 ATPase assay Feng et al., 2008 Y n/a 4.7 ATPase assay Wang et al., 2008 →Desmethylsert Y n/a 6.5 ATPase assay Wang et al., 2008
Venlafaxine N n/a Neg ATPase assay Feng et al., 2008 Km = Michaelis constant (substrate concentration at which the reaction rate is half of its maximum value) 1, 2 Cut-off for significance: 1 1.7 or 2 1.5 (based on retrospective statistical analysis of inter-week system variability control data) 3 Note very high donor concentration (1 mM); → denotes a metabolite

Chapter 1: General Introduction
71
Of the antidepressants tested in transcellular transport assays to date, only
protriptyline has been identified as a modest P-gp substrate, while conflicting
findings have been reported in relation to amitriptyline, imipramine and
fluvoxamine (Mahar Doan et al., 2002; Faassen et al., 2003; El Ela et al., 2004; Feng
et al., 2008). However, the studies reporting positive findings in relation to
amitriptyline, imipramine and fluvoxamine involved the use of the Caco-2 cell line,
which expresses several other efflux and uptake transporters in addition to P-gp
(Taipalensuu et al., 2001). Further experiments, to confirm that P-gp was the
transporter responsible for the elevated TR observed in Caco-2 cells, were not
conducted (Faassen et al., 2003; El Ela et al., 2004), thereby rendering the findings
in relation to P-gp inconclusive. Similarly, there were limitations associated with the
studies reporting negative findings. For example, it has recently been shown that
transfection with ABCB1 in MDCK-MDR1 cells reduces the expression of
endogenous canine P-gp relative to the wildtype MDCK cells (Kuteykin-Teplyakov et
al., 2010). This finding may have implications for the interpretation of results from
many of the studies reporting negative findings, which were based on the
assumption that endogenous drug transporter expression would be the same for
wild-type and transfected cells.
In studies involving the ATPase assay, the SSRIs sertraline and paroxetine were
identified as high- and moderate-affinity P-gp substrates, respectively, while the
Michaelis constant (Km) values for nortriptyline and fluoxetine narrowly exceeded
the threshold set for moderate-affinity (Feng et al., 2008). However, the ATPase
assay does not determine if compounds are actually transported by P-gp. Thus,
based on the available data from in vitro studies, it seems that some
antidepressants interact with P-gp in vitro, but none have been robustly identified
as high affinity P-gp substrates which are subjected to P-gp mediated transport in
bidirectional transcellular transport assays.

Chapter 1: General Introduction
72
1.5.2. In vitro studies investigating the inhibition of P-gp by
antidepressants
Several antidepressants inhibit P-gp in vitro (Table 1.11). In Table 1.11, it is worth
noting that the data in the second column represent the conclusions drawn by the
specific authors of the individual studies. Again, it must be noted that the
interpretation of results may differ from group to group.
Interestingly, the level of P-gp inhibition observed for several of these
antidepressants was similar to that of established P-gp inhibitors, such as verapamil
and quinidine (Szabo et al., 1999; Weiss et al., 2003; Feng et al., 2008). For
example, the concentration required to reduce P-gp activity by 50% (IC50) for
paroxetine (29.8µM) and sertraline (31.8 µM) is similar to that of quinidine (33.8
µM) (Weiss et al., 2003). It should be noted, however, that these antidepressant
concentrations are 250- and 500-fold higher than normal therapeutic plasma levels
for paroxetine and sertraline respectively (Weiss et al., 2003). However, post-
mortem studies have demonstrated high brain-to-plasma concentration ratios for
certain antidepressants (Pariante, 2008), and neuroimaging studies of fluorine-
containing antidepressants have revealed steady-state brain concentrations in the
micromolar range (Bolo et al., 2000). Moreover, P-gp inhibition by sertraline has
been demonstrated in vivo (Wang et al., 2006a). Nonetheless, it remains uncertain
if P-gp-inhibitory concentrations of paroxetine or sertraline are reached at the BBB
in clinical use.

73
Table 1.11: In vitro studies investigating if various antidepressants are inhibitors of P-gp
Antidepressant P-gp
inhibitor? IC50 (µM) Model Ref
Amitriptyline Y n/a R123 uptake in Caco-2 cells Ibrahim et al., 2000
Y n/a R123/daunorubicin cellular uptake Szabo et al., 1999
Y n/a R123 efflux Varga et al., 1996
Citalopram Y 52.5 Calcein-AM transport in MDCK-MDR1 cells Feng et al., 2008
Clomipramine Y n/a R123 uptake in Caco-2 cells Ibrahim et al., 2000
Y n/a Cell-line susceptibility to P-gp-substrate cytotoxics Jaffrezou et al., 1995
Y n/a Cell-line susceptibility to P-gp-substrate cytotoxics Merry et al., 1991
Desipramine Y n/a R123 uptake in Caco-2 cells Ibrahim et al., 2000
Y n/a Cell-line susceptibility to P-gp-substrate cytotoxics Jaffrezou et al., 1995
Y n/a R123/daunorubicin cellular uptake Szabo et al., 1999
Doxepin Y n/a R123 uptake in Caco-2 cells Ibrahim et al., 2000
Y n/a R123/daunorubicin cellular uptake Szabo et al., 1999
Fluoxetine Y 31 Calcein-AM transport in MDCK-MDR1 cells Feng et al., 2008
Y n/a Digoxin uptake in Caco-2 cells Pariante et al., 2003b
Y 115.5 ± 11.7 Calcein-AM transport in L-MDR1 and pBCEC cells Weiss et al., 2003
Fluvoxamine N > 100 Calcein-AM transport in MDCK-MDR1 cells Feng et al., 2008
? 146.7 ± 1.95 Talinolol transport in Caco-2 cells El Ela et al., 2004
Imipramine Y n/a R123 uptake in Caco-2 cells Ibrahim et al. 2000
Y n/a Cell-line susceptibility to P-gp-substrate cytotoxics Jaffrezou et al. 1995
Y n/a R123/daunorubicin cellular uptake Szabo et al. 1999

74
Antidepressant P-gp
inhibitor? IC50 (µM) Model Ref
Maprotiline Y n/a R123/daunorubicin cellular uptake Szabo et al. 1999
Mianserin Y n/a Cell-line susceptibility to P-gp-substrate cytotoxics Jaffrezou et al. 1995
Nefazodone Y 4.7 R123 uptake in Caco-2 cells Stormer et al. 2001
Nortriptyline N > 100 Calcein-AM transport in MDCK-MDR1 cells Feng et al. 2008
N n/a R123 uptake in Caco-2 cells Ibrahim et al. 2000
Paroxetine Y 27.5 Calcein-AM transport in MDCK-MDR1 cells Feng et al. 2008
Y n/a [3H]Taxol uptake in bovine retinal endothelial cells Maines et al. 2005
Y 29.8 ± 11.1 Calcein-AM transport in L-MDR1 and pBCEC cells Weiss et al. 2003
Protriptyline Y n/a R123 uptake in Caco-2 cells Ibrahim et al. 2000
Sertraline Y 30 Calcein-AM transport in MDCK-MDR1 cells Feng et al. 2008
Y 31.8 ± 2.8 Calcein-AM transport in L-MDR1 and pBCEC cells Weiss et al. 2003
Trazodone N n/a R123 uptake in Caco-2 cells Stormer et al. 2001
Trimipramine Y n/a R123 uptake in Caco-2 cells Ibrahim et al. 2000
Y n/a Cell-line susceptibility to P-gp-substrate cytotoxics Jaffrezou et al. 1995
Y n/a R123/daunorubicin cellular uptake Szabo et al. 1999
Venlafaxine N > 100 Calcein-AM transport in MDCK-MDR1 cells Feng et al. 2008
Selected prototypical P-gp inhibitors
Quinidine Y 30.2 Calcein-AM transport in MDCK-MDR1 cells Feng et al. 2008
Y 33.8 ± 11.9 Calcein-AM transport in L-MDR1 and pBCEC cells Weiss et al. 2003
Verapamil Y 18.1 Calcein-AM transport in MDCK-MDR1 cells Feng et al. 2008
Y 18.9 ± 4.2 Calcein-AM transport in L-MDR1 and pBCEC cells Weiss et al. 2003
Chapter 1: General Introduction
75
1.5.3. Limitations of in vitro studies investigating interactions
between P-gp and antidepressant drugs
It is important to consider the limitations of these in vitro studies investigating
interactions between P-gp and antidepressant drugs; different studies have used
the same assay for the same compound and reported contrasting results.
Furthermore, different groups offer different interpretations of results, with
contrasting cut-off values for significance.
For example, the determined Km value for nortriptyline differed greatly between
two studies using the same assay (ATPase), 257.6 µM (Ejsing et al., 2006) versus 56
± 15.73 µM (Feng et al., 2008). Furthermore, the interpretation of these results
conflicted between the two groups. Despite the fact that a lower Km value
correlates with a stronger interaction, Ejsing and co-workers concluded that their
findings confirmed an interaction which may be of clinical significance between
nortriptyline and P-gp, while Feng and colleagues suggest that any such interaction
is of minimal significance as they classified nortriptyline as a low-affinity P-gp-
substrate. Similarly discrepant findings were obtained in relation to the P-gp-
substrate status of amitriptyline, imipramine and fluvoxamine by different groups
using transwell assay systems (Mahar Doan et al., 2002; Faassen et al., 2003; El Ela
et al., 2004; Feng et al., 2008).
Additionally, in P-gp-inhibition studies there was a marked contrast in the reported
IC50 values for fluoxetine, 31 µM (Feng et al., 2008) versus 115.5 ± 11.7 µM (Weiss
et al., 2003), while reported values for paroxetine and sertraline were in quite close
agreement between the same two studies. Thus, it can be difficult to draw
definitive conclusions from in vitro P-gp studies due to the discrepancies in results
obtained depending on assay used and numerous other potential confounding
factors. As a result, there remains a demand for the development of a validated and
highly reliable predictive screening model for the accurate identification of P-gp
substrates and inhibitors in vitro (von Richter et al., 2009).
In addition to the discordance in results obtained from different in vitro studies,
there has been disagreement between in vitro and in vivo findings regarding the P-

Chapter 1: General Introduction
76
gp-substrate status of certain antidepressant drugs. For example, citalopram
(Rochat et al., 1999; Feng et al., 2008) and paroxetine (Maines et al., 2005; Feng et
al., 2008) were found not to be P-gp-substrates in various cell culture models.
However, in vivo studies using P-gp knockout mice have demonstrated increased
brain/plasma concentration ratios in knockout mice relative to wild-type controls
for both drugs (see Section 1.5.4), thus suggesting that they are P-gp substrates at
the BBB in vivo (Uhr and Grauer, 2003; Uhr et al., 2003; Doran et al., 2005; Uhr et
al., 2008). These differences may be as a result of a failure of in vitro systems to
adequately reflect the complexity of the BBB in vivo, and therefore highlight the
difficulty in achieving acceptable correlations between in vitro and in vivo data in
relation to drug transport across the BBB (Avdeef, 2011), thus calling the relevance
of any of these in vitro assays into question. As P-gp extrudes its substrates directly
from the inner leaflet of the cellular membrane bilayer, the properties of the
membrane used in in vitro studies impact considerably on interactions between P-
gp and the compound being tested (Romsicki and Sharom, 1999). Therefore, the
use of epithelial cell lines such as Caco-2 and MDCK-MDR1 to predict interactions
between drugs and P-gp expressed at the endothelial BBB in vivo may not be
appropriate. To date, the use of BBB-derived endothelial cell lines in this regard has
been limited, primarily due to the leakiness of such cell lines when cultured as
monolayers in vitro (Avdeef, 2011). Alternatively, the discrepancies observed
between in vitro and in vivo studies may highlight important species differences
between substrate specificity of human (as measure in in vitro studies) and rodent
P-gp, or false assumptions relating to results derived from knockout mice. Indeed,
the relevance of marginally increased brain/plasma ratios in knockout mice, relative
to controls, has been questioned (Feng et al., 2008).
1.5.4. In vivo studies involving P-gp knockout rodents
Several studies using P-gp knockout mouse models, and a recent study using P-gp
knockout rats (Bundgaard et al., 2012), have determined that P-gp plays a major
role in the brain penetration of several antidepressants (Table 1.12) (Uhr et al.,
2000; Uhr and Grauer, 2003; Uhr et al., 2003; Grauer and Uhr, 2004; Doran et al.,

Chapter 1: General Introduction
77
2005; Uhr et al., 2007; Uhr et al., 2008; Karlsson et al., 2010; Karlsson et al., 2011).It
is important to note that the majority of studies using the P-gp knockout mouse
models in this regard have involved acute antidepressant administration. As
antidepressant drugs are administered chronically in clinical practice, studies
investigating the impact of P-gp ablation on the brain distribution of antidepressant
drugs and their metabolites following chronic administration would be of greater
value.
Interestingly, many of the identified P-gp-substrate-antidepressants are structurally
unrelated and come from a variety of drug classes: including SSRIs, TCAs and SNRIs.
Not all drugs from the same class behave similarly, however: sertraline, another
SSRI for example, is not a P-gp substrate (Doran et al., 2005).
Amitriptyline was found to have significantly higher brain concentrations in mice
deficient in P-gp than in wild-type controls one hour after acute administration (Uhr
et al., 2000). However, later studies determined that this effect was transient and
dependent on the dosing regimen and/or the route of administration (Grauer and
Uhr, 2004; Uhr et al., 2007). Thus, the relevance of P-gp to the CNS
pharmacokinetics of amitriptyline following chronic administration and at steady
state conditions is uncertain. While the exact reason for this phenomenon is
unclear, a number of theories have been proposed (Uhr et al., 2007). For example,
it is postulated that amitriptyline may induce changes at the BBB itself or that P-gp
may become oversaturated with time, as certain amitriptyline metabolites are also
P-gp substrates. Furthermore the original study used single knockout abcb1a(-/-)
mice (Uhr et al., 2000), while subsequent studies used double knockout abcb1ab(-/-)
mice (Grauer and Uhr, 2004; Uhr et al., 2007). Thus, the contrasting findings of the
two studies may be explained by differences between single knockout abcb1a(-/-)
mice and double knockout abcb1ab(-/-) mice.
Similarly, there is also a lack of clarity in the literature regarding the status of
fluoxetine as a P-gp substrate in vivo (Uhr et al., 2000; Doran et al., 2005). The
original study, using single knockout abcb1a(-/-) mice, found no difference between
the accumulation of fluoxetine in the brains of abcb1a(-/-) mice and wild type

Chapter 1: General Introduction
78
controls (Uhr et al., 2000). A subsequent study, however, found increased levels of
fluoxetine in double knockout abcb1ab(-/-) mice relative to wild type controls (Doran
et al., 2005). Taken together, these data suggest that the brain pharmacokinetics of
certain compounds may differ between single knockout abcb1a(-/-) mice and double
knockout abcb1ab(-/-) mice. Indeed, a recent study has also reported that the BBB
transport of glucocorticoids differs between single and double P-gp knockout mice
(Mason et al., 2012). Furthermore, the data from Uhr and co-workers is from a
single time point (one hour) following fluoxetine administration (Uhr et al., 2000);
Doran and colleagues, on the other hand, took samples at various time points
(Doran et al., 2005). Therefore, the impact of P-gp on fluoxetine distribution may be
time-dependent.
In addition to investigating the impact of P-gp ablation on venlafaxine
pharmacokinetics, Karlsson and co-workers looked at differences in behavioural
responses to subchronic venlafaxine treatment between wild-type and P-gp
knockout mice (Karlsson et al., 2011). Chronic treatment with venlafaxine affected
behaviour in the open field, with increased time spent in the centre of the arena
and a reduced number of rears associated with venlafaxine treatment.
Interestingly, this pharmacodynamic effect was more pronounced in P-gp knockout
mice than wild-type controls after 7 days of venlafaxine treatment. The difference
between the two strains was attenuated after 9 days of treatment, which may have
been due to habituation associated with repeated testing in the open field (Thiel et
al., 1999). While pharmacodynamic differences between P-gp knockout and wild-
type mice have previously been demonstrated following treatment with the
antipsychotic drug, risperidone (Kirschbaum et al., 2008), this remains the only
study demonstrating pharmacodynamic differences between the strains in
response to treatment with an antidepressant drug, and for this reason it is
important. However, the relevance of behaviour in the open field to antidepressant
treatment is unclear, and future studies in this area should focus on behavioural
pharmacodynamic readouts in established animal models of depression, such as the
forced swim test and tail suspension test (Cryan and Holmes, 2005).

79
Table 1.12: In vivo studies in P-gp knock-out rodents investigating if various antidepressants are P-gp substrates at the BBB
Antidepressant Dose Class Samples taken Brain/Plasma Conc. Sig Model Ref WT KO KO/WT
Amitriptyline 10 mg/kg s.c. TCA 30 min post-injection
8.1 8.0 1.0 3 ns female mdr1ab(-/-) mice
Uhr et al., 2007
10 mg/kg s.c. TCA 60 min post-injection
11.5 8.9 0.8 3 ns female mdr1ab(-/-) mice
Uhr et al., 2007
10 mg/kg s.c. TCA 120 min post-injection
11.7 16.0 1.4 3,4 * female mdr1ab(-/-) mice
Uhr et al., 2007
10 mg/kg s.c. TCA 240 min post-injection
12.8 12.0 0.9 3 ns female mdr1ab(-/-) mice
Uhr et al., 2007
5 mg/kg i.p. TCA 1 h post-injection n/a n/a ~ 1.9 1,2 * female mdr1a(-/-) mice
Uhr et al., 2000
10 mg/kg s.c. bd for 10 days
TCA 4 h after final dose
10.3 13.3 1.3 3 ns male mdr1ab(-/-) mice
Grauer and Uhr, 2004
→ E-OH- AMI n/a metab 30 min post-AMI injection
1.4 3.8 2.7 3 n/a female mdr1ab(-/-) mice
Uhr et al., 2007
n/a metab 60 min post-AMI injection
1.8 4.2 2.4 3 n/a female mdr1ab(-/-) mice
Uhr et al., 2007
n/a metab 120 min post-AMI injection
2.1 5.1 2.4 3 n/a female mdr1ab(-/-) mice
Uhr et al., 2007
n/a metab 240 min post-AMI injection
1.9 5.0 2.7 3,4 * female mdr1ab(-/-) mice
Uhr et al., 2007
n/a metab 1 h post-AMI injection
n/a n/a ~ 3.1 1,2 * male mdr1a(-/-) mice
Uhr et al., 2000

80
Antidepressant Dose Class Samples taken Brain/Plasma Conc. Sig Model Ref WT KO KO/WT
→ E-OH- AMI (contd)
n/a metab 4 h after final AMI dose
1.6 2.2 1.3 3,4 * male mdr1ab(-/-) mice
Grauer and Uhr, 2004
→ Z-OH-AMI n/a metab 30 min post-AMI injection
1.3 3.6 2.8 3 n/a female mdr1ab(-/-) mice
Uhr et al., 2007
n/a metab 60 min post-AMI injection
1.6 3.4 2.1 3 n/a female mdr1ab(-/-) mice
Uhr et al., 2007
n/a metab 120 min post-AMI injection
1.5 4.9 3.3 3 n/a female mdr1ab(-/-) mice
Uhr et al., 2007
n/a metab 240 min post-AMI injection
1.4 6.8 4.7 3,4 * female mdr1ab(-/-) mice
Uhr et al., 2007
n/a metab 1 h post-AMI injection
n/a n/a ~ 4.5 1,2 * male mdr1a(-/-) mice
Uhr et al., 2000
n/a metab 4 h after final AMI dose
1.5 7.4 4.9 3,4 * male mdr1ab(-/-) mice
Grauer and Uhr, 2004
→E-OH-NOR n/a metab 30 min post-AMI injection
n/a 5 0.5 n/a 3,5 n/a female mdr1ab(-/-) mice
Uhr et al., 2007
n/a metab 60 min post-AMI injection
n/a 5 0.6 n/a 3,5 n/a female mdr1ab(-/-) mice
Uhr et al., 2007
n/a metab 120 min post-AMI injection
0.5 1.0 2.2 3 n/a female mdr1ab(-/-) mice
Uhr et al., 2007
n/a metab 240 min post-AMI injection
0.6 1.9 3.2 3,4 * female mdr1ab(-/-) mice
Uhr et al., 2007
n/a metab 1 h post-AMI injection
n/a n/a ~ 2.8 1,2 * male mdr1a(-/-) mice
Uhr et al., 2000

81
Antidepressant Dose Class Samples taken Brain/Plasma Conc. Sig Model Ref WT KO KO/WT
n/a metab 4 h after final AMI dose
0.5 3.7 8.0 3,4 * male mdr1ab(-/-) mice
Grauer and Uhr, 2004
→Z-OH-NOR n/a metab 30 min post-AMI injection
n/a 5 0.2 n/a 3,5 n/a female mdr1ab(-/-) mice
Uhr et al., 2007
n/a metab 60 min post-AMI injection
n/a 5 0.2 n/a 3,5 n/a female mdr1ab(-/-) mice
Uhr et al., 2007
n/a metab 120 min post-AMI injection
0.2 0.5 2.5 3 n/a female mdr1ab(-/-) mice
Uhr et al., 2007
n/a metab 240 min post-AMI injection
0.3 0.9 2.8 3,4 * female mdr1ab(-/-) mice
Uhr et al., 2007
n/a metab 1 h post-AMI injection
n/a n/a ~ 2.3 1,2 * male mdr1a(-/-) mice
Uhr et al., 2000
n/a metab 4 h after final AMI dose
0.4 2.5 5.7 3,4 * male mdr1ab(-/-) mice
Grauer and Uhr, 2004
Citalopram 1 mg/kg s.c. SSRI 1 h post-injection 4.6 15.7 3.4 3,4 * male mdr1ab(-/-) mice
Uhr and Grauer, 2003
60 µg/day s.c SSRI After 11 days treatment
1.5 5.4 3.7 * male mdr1ab(-/-) mice
Uhr et al., 2008
3 mg/kg s.c. SSRI Multiple time points
5.1 9.7 1.9 * female mdr1ab(-/-) mice
Doran et al., 2005
5 mg/kg/day s.c. infusion
SSRI After 3 days treatment
22 44 2.0 *** mdr1a(-/-) mice Bundgaard et al., 2012
9 mg/kg/day s.c. infusion
SSRI After 3 days treatment
10 33 3.3 *** mdr1a(-/-) rat Bundgaard et al., 2012

82
Antidepressant Dose Class Samples taken Brain/Plasma Conc. Sig Model Ref WT KO KO/WT
Doxepin 10 mg/kg s.c. TCA 1 h post-injection 7.1 7.6 1.1 3,4 * male mdr1ab(-/-) mice
Uhr et al., 2003
→D-Doxepin n/a metab 1 h post-DOX injection
1.9 2.4 1.3 3,4 * male mdr1ab(-/-) mice
Uhr et al., 2003
Fluoxetine 1.5 mg/kg i.p SSRI 1 h post-injection n/a n/a ~ 1.1 1,2 ns male mdr1a(-/-) mice
Uhr et al., 2000
3 mg/kg s.c. SSRI Multiple time points
12.0 18.0 1.5 * female mdr1ab(-/-) mice
Doran et al., 2005
→Norfluoxetine n/a metab 1 h post-FLX injection
n/a n/a ~ 1.1 1,2 ns male mdr1a(-/-) mice
Uhr et al., 2000
Fluvoxamine 3 mg/kg s.c. SSRI Multiple time points
6.1 14.0 2.3 * female mdr1ab(-/-) mice
Doran et al., 2005
Mirtazapine 1 mg/kg s.c. NaSSA 1 h post-injection 3.1 3.0 1.0 ns male mdr1ab(-/-) mice
Uhr et al., 2003
60 µg/day s.c NaSSA After 11 days treatment
4.6 4.6 1.0 ns male mdr1ab(-/-) mice
Uhr et al., 2008
Nortriptyline 3 mg/kg s.c. TCA Multiple time points
11.0 20.0 1.8 * female mdr1ab(-/-) mice
Doran et al., 2005
5 mg/kg s.c. TCA n/a n/a n/a 1.6 * mdr1a(-/-) mice Ejsing et al., 2006
→ Nortriptyline n/a metab 30 min post-AMI injection
2.8 2.6 0.9 3 n/a female mdr1ab(-/-) mice
Uhr et al., 2007
n/a metab 60 min post-AMI injection
3.1 4.9 1.6 3 n/a female mdr1ab(-/-) mice
Uhr et al., 2007

83
Antidepressant Dose Class Samples taken Brain/Plasma Conc. Sig Model Ref WT KO KO/WT
→ Nortriptyline (contd)
n/a metab 120 min post-AMI injection
4.8 7.3 1.5 3 n/a female mdr1ab(-/-) mice
Uhr et al., 2007
n/a metab 240 min post-AMI injection
8.1 11.4 1.4 3,4 * female mdr1ab(-/-) mice
Uhr et al., 2007
n/a metab 1 h post-AMI injection
n/a n/a ~ 2.4 1,2 * male mdr1a(-/-) mice
Uhr et al., 2000
n/a metab 4 h after final AMI dose
6.8 14.6 2.1 3,4 * male mdr1ab(-/-) mice
Grauer and Uhr, 2004
Paroxetine 3 mg/kg s.c. SSRI Multiple time points
3.3 7.1 2.2 * female mdr1ab(-/-) mice
Doran et al., 2005
1 mg/kg s.c. SSRI 1 h post-injection 1.9 3.0 1.6 3,4 * male mdr1ab(-/-) mice
Uhr et al., 2003
Sertraline 3 mg/kg s.c. SSRI Multiple time points
24.0 27.0 1.1 ns female mdr1ab(-/-) mice
Doran et al., 2005
Trimipramine 10 mg/kg s.c. TCA 1 h post-injection 7.0 9.7 1.4 3,4 * male mdr1ab(-/-) mice
Uhr and Grauer, 2003
→D-Trimipramine
n/a metab 1 h post-TRIM injection
2.8 3.3 1.2 3,4 * male mdr1ab(-/-) mice
Uhr and Grauer, 2003
Venlafaxine 3 mg/kg s.c. SNRI Multiple time points
4.2 7.7 1.8 * female mdr1ab(-/-) mice
Doran et al., 2005
5 mg/kg s.c. SNRI 1 h post-injection 4.9 8.8 1.8 3,4 * male mdr1ab(-/-) mice
Uhr et al., 2003
300 µg /day s.c SNRI After 11 days treatment
3.7 6.5 1.8 * male mdr1ab(-/-) mice
Uhr et al., 2008

84
Antidepressant Dose Class Samples taken Brain/Plasma Conc. Sig Model Ref WT KO KO/WT
Venlafaxine (contd)
10 mg/kg i.p SNRI 1 h post-injection 4.1 8.9 2.2 3,4 ** male mdr1ab(-/-) mice
Karlsson et al., 2010
10 mg/kg i.p SNRI 3 h post-injection 4.3 7.4 1.7 3,4 *** male mdr1ab(-/-) mice
Karlsson et al., 2010
10 mg/kg i.p SNRI 6 h post-injection 3.7 5.5 1.5 3,4 * male mdr1ab(-/-) mice
Karlsson et al., 2010
10 mg/kg i.p SNRI 9 h post-injection 4.0 4.8 1.2 3,4 * male mdr1ab(-/-) mice
Karlsson et al., 2010
10 mg/kg i.p bd for 10 days
SNRI 1 h after last injection
4.8 8.2 1.7 3,4 *** male mdr1ab(-/-) mice
Karlsson et al., 2011
15 mg/kg/day s.c. infusion
SSRI After 3 days treatment
4.7 8.3 1.8 * mdr1a(-/-) mice Bundgaard et al., 2012
9 mg/kg/day s.c. infusion
SSRI After 3 days treatment
3.3 6.3 1.9 ** mdr1a(-/-) rat Bundgaard et al., 2012
→D-Venlafaxine n/a metab 1 h post-VEN injection
1.4 2.3 1.7 3,4 * male mdr1ab(-/-) mice
Uhr et al., 2003
n/a metab After 11 days VEN treatment
1.6 6.2 3.6 * male mdr1ab(-/-) mice
Uhr et al., 2008
n/a metab 1 h post-VEN injection
1.7 3.9 2.2 3,4 ** male mdr1ab(-/-) mice
Karlsson et al., 2010
n/a metab 3 h post-VEN injection
5.0 12.0 2.4 3,4 ** male mdr1ab(-/-) mice
Karlsson et al., 2010
n/a metab 6 h post-VEN injection
6.2 23.8 3.9 3,4 *** male mdr1ab(-/-) mice
Karlsson et al., 2010

85
Antidepressant Dose Class Samples taken Brain/Plasma Conc. Sig Model Ref WT KO KO/WT
→D-Venlafaxine (contd)
n/a metab 9 h post-VEN injection
5.3 15.9 3.0 3,4 ** male mdr1ab(-/-) mice
Karlsson et al., 2010
n/a metab 1 h after last VEN injection
1.8 3.5 1.9 3,4 *** male mdr1ab(-/-) mice
Karlsson et al., 2011
KO: P-gp knockout mice; KO/WT: ratio of brain/plasma ratios between KO and WT mice; metab: metabolite; NaSSA: noradrenergic and selective serotonergic antidepressant; SNRI: serotonin-noradrenaline reuptake inhibitor; SSRI: selective serotonin reuptake inhibitor; TCA: tricyclic antidepressant; WT: wild-type mice → denotes a metabolite

Chapter 1: General Introduction
86
It is important to consider the inherent limitations of the P-gp knockout mouse
model’s utility in the assessment of the impact of P-gp mediated efflux on drug
distribution into the brain. For example, the expression of BCRP mRNA in the
cerebral microvessels of abcb1a(-/-) mice is increased threefold relative to wild-type
animals (Cisternino et al., 2004). Furthermore, this increase in BCRP mRNA
expression is associated with a greater export of two of its substrates, prazosin and
mitoxantrone, from the brain of abcb1a(-/-) mice versus wild-type controls
(Cisternino et al., 2004). Importantly, other ABC transporters, including BCRP,
demonstrate overlapping drug specificities with P-gp (Litman et al., 2001; Sharom,
2008), and the expression of ABC drug transporters at the BBB may become
upregulated following exposure to xenobiotics (Miller, 2010). Therefore, potential
upregulation of alternative drug efflux transporters, such as BCRP, in P-gp knockout
mice must be considered before valid conclusions can be drawn regarding in vivo P-
gp-drug interactions using this model.
In addition, following a comparison of in vitro and in vivo data for 23 compounds, it
has been recommended that a threshold ratio of four-fold increase in brain/plasma
drug concentration ratios between P-gp knockout and wild-type mice (KO:WT B/P
ratio) should be set to assess P-gp-drug interactions in vivo (Feng et al., 2008). For
example, risperidone, despite having a KO:WT B/P ratio of 10, indicating that it is
heavily subjected to P-gp efflux, is still a reasonably efficacious antipsychotic agent
(Doran et al., 2005). This might reflect the potency of risperidone, meaning that
high brain concentrations are not required for it to exert its clinical effect. To date,
no antidepressant drug has been shown to have a KO:WT B/P ratio greater than 3.6
(Table 1.12). Thus, it seems that no antidepressant has yet been identified as a high
affinity transported P-gp substrate in vivo, and therefore the overall influence of P-
gp efflux on the effectiveness of antidepressants has been questioned (Doran et al.,
2005). Furthermore, in many studies using knockout mice, brain antidepressant
concentrations were not normalized against plasma levels (i.e. a brain/plasma
concentration ratio was not used). Despite plasma drug concentrations being
considerably higher in P-gp knockout than wild-type mice in some these studies, in
certain cases with statistically significant differences in plasma drug levels between

Chapter 1: General Introduction
87
the strains (Uhr et al., 2003), brain drug concentrations were compared directly
between strains (Uhr et al., 2003; Uhr et al., 2007). Thus statistically significant
differences in brain drug concentrations identified between these two strains in
such studies may have been partially due to variations in plasma pharmacokinetics,
rather than solely as a result of altered drug transport across the BBB due to a lack
of P-gp.
1.5.5. In vivo studies involving P-gp inhibition in wild-type
rodents
Other in vivo studies have made use of established P-gp inhibitors, such as
verapamil and cyclosporin A (CsA), to investigate if inhibition of P-gp results in
altered antidepressant drug penetration in to the brain (Table 1.13).
Using this method, nortriptyline was shown to have significantly higher brain/serum
ratios in rats treated with a P-gp-inhibitor than in untreated controls (Ejsing and
Linnet, 2005). However, this increase was relatively small, equating to a c. 25%
increase in the brain-serum ratio, compared to an 80% increase in the brains of P-
gp knockout compared to wild-type mice (Doran et al., 2005).
The use of whole brain in the analysis above may have obscured potentially greater
region-specific central increases in drug concentration. In order to address this
issue, the effect of P-gp inhibition on imipramine and desipramine concentrations
in various brain regions was determined, and it was found that there was a region-
specific effect (Clarke et al., 2009). For example, the frontal cortex/serum
imipramine concentration ratio was significantly increased to 2.4, compared to a
non-significant ratio of 1.1 in the hypothalamus (Clarke et al., 2009). Similarly for
desipramine, a significant effect was observed in the frontal cortex but not for
other brain areas (Clarke et al., 2009). Thus, it seems that the effect of P-gp on drug
penetration into the CNS is not uniform, and region-specific effects should be taken
in to account when interpreting data in P-gp-interaction studies, as potentially
significant results may be obscured or missed entirely.

Chapter 1: General Introduction
88
Interestingly, it has been demonstrated that pharmacological induction of P-gp
using any one of three different inducing agents (rifampicin, dexamethasone or 5-
pregnene-3beta-ol-20-on-16alpha-carbonitrile) results in reduced brain distribution
of risperidone and its active metabolite, 9-hydroxyrisperidone (Holthoewer et al.,
2010). Similar investigations in relation to antidepressant drugs would help to
further clarify the role played by P-gp in their BBB transport.
A study evaluating pharmacokinetic interactions between the antipsychotic drug
risperidone and the antidepressant sertraline in CF1 mice demonstrated P-gp
inhibition by sertraline, resulting in significantly increased brain risperidone levels
(Wang et al., 2006a). This in vivo finding supports in vitro studies reporting P-gp
inhibition by sertraline (Weiss et al., 2003; Feng et al., 2008). As the plasma
sertraline levels achieved in this study approximate those observed in patients
treated with the drug, this finding suggests that sertraline may induce clinically
significant P-gp inhibitory effects in therapeutic use. Whether these preclinical
findings can translate into therapeutic potential of P-gp inhibitors as adjunctive
therapies in the treatment of schizophrenia remains to be determined.

89
Table 1.13: In vivo studies using P-gp inhibition to investigate if various antidepressants are P-gp substrates at the BBB
Antidepressant Dose Class Species (strain)
P-gp inhibitor Brain
Region
Brain/Serum Conc.
Sig Ref Control P-gp I
P-gp I / Control
Imipramine 15 mg/kg i.p. TCA Rat (Sprague Dawley)
Verapamil (20 mg/kg i.p.)
HYPO 21.5 23.6 1.1 ns Clarke et al., 2009
15 mg/kg i.p. TCA Rat (Sprague Dawley)
Verapamil (20 mg/kg i.p.)
FC 11.9 28.4 2.4 * Clarke et al., 2009
15 mg/kg i.p. TCA Rat (Sprague Dawley)
Verapamil (20 mg/kg i.p.)
HIPPO 17.4 26.0 1.5 * Clarke et al., 2009
15 mg/kg i.p. TCA Rat (Sprague Dawley)
Verapamil (20 mg/kg i.p.)
BS 12.2 25.2 2.1 *** Clarke et al., 2009
→ Desipramine IMI 15 mg/kg i.p.
metabolite
Rat (Sprague Dawley)
Verapamil (20 mg/kg i.p.)
HYPO 31.5 32.3 1.0 ns Clarke et al., 2009
IMI 15 mg/kg i.p.
metabolite
Rat (Sprague Dawley)
Verapamil (20 mg/kg i.p.)
HIPPO 13.8 15.1 1.1 ns Clarke et al., 2009
IMI 15 mg/kg i.p.
metabolite
Rat (Sprague Dawley)
Verapamil (20 mg/kg i.p.)
FC 13.2 19.0 1.4 ** Clarke et al., 2009
IMI 15 mg/kg i.p.
metabolite
Rat (Sprague Dawley)
Verapamil (20 mg/kg i.p.)
BS 10.0 13.4 1.3 ns Clarke et al., 2009
Nortriptyline 5 mg/kg i.p. TCA Rat Verapamil (50 mg/kg i.p.)
Whole brain
n/a n/a 1.6 ** Ejsing et al., 2006
various i.p. (pooled)
TCA Rat Cyclosporin (200 mg/kg i.p.)
Whole brain
n/a n/a 1.3 * Ejsing et al., 2006

90
Antidepressant Dose Class Species (strain)
P-gp inhibitor Brain
Region
Brain/Serum Conc.
Sig Ref Control P-gp I
P-gp I / Control
Nortriptyline (contd)
25 mg/kg p.o.
TCA Rat (Wistar Hanover GALAS)
Cyclosporin (200 mg/kg p.o.)
Whole brain
16.2 22.5 1.4 * Ejsing and Linnet, 2005
10 mg/kg i.p TCA Rat (Wistar Hanover GALAS)
Cyclosporin (200 mg/kg i.p)
Whole brain
17.0 22.0 1.3 * Ejsing and Linnet, 2005
25 mg/kg i.p TCA Rat (Wistar Hanover GALAS)
Cyclosporin (200 mg/kg i.p)
Whole brain
23.0 27.0 1.2 ns Ejsing and Linnet, 2005
various (pooled)
TCA Rat (Wistar Hanover GALAS)
Cyclosporin (200 mg/kg p.o.)
Whole brain
20.0 25.0 1.3 ** Ejsing and Linnet, 2005
→ E-OH-NT NOR 25 mg/kg p.o.
metabolite
Rat (Wistar Hanover GALAS)
Cyclosporin (200 mg/kg p.o.)
Whole brain
1.2 2.0 1.7 ns Ejsing and Linnet, 2005
NOR 10 mg/kg i.p
metabolite
Rat (Wistar Hanover GALAS)
Cyclosporin (200 mg/kg i.p)
Whole brain
~ 1.7 ~1.9 1.1 ns Ejsing and Linnet, 2005
NOR 25 mg/kg i.p
metabolite
Rat (Wistar Hanover GALAS)
Cyclosporin (200 mg/kg i.p)
Whole brain
~ 0.9 ~ 1.1 1.2 ns Ejsing and Linnet, 2005
NOR various (pooled)
metabolite
Rat (Wistar Hanover GALAS)
Cyclosporin (200 mg/kg p.o.)
Whole brain
1.3 1.6 1.3 ns Ejsing and Linnet, 2005

91
Antidepressant Dose Class Species (strain)
P-gp inhibitor Brain
Region
Brain/Serum Conc.
Sig Ref Control P-gp I
P-gp I / Control
Risperidone1 1 mg/kg i.p. n/a (APD)
Mouse (CF1) Sertraline (SSRI; 10 µg/g i.p.)
Whole brain
1.6 2.3 1.4 ** Wang et al., 2006a
→ 9-OH-Risp n/a metabolite
Mouse (CF1) Sertraline (SSRI; 10 µg/g i.p.)
Whole brain
0.9 2.5 2.8 ** Wang et al., 2006a
P-gp I = group treated with P-gp inhibitor BS: brain stem; FC: frontal cortex; HIPPO: hippocampus; HYPO: hypothalamus 1 Risperidone is an antipsychotic drug (APD) known to be a P-gp substrate. This study demonstrates P-gp inhibition by sertraline in vivo. * p < 0.05; ** p < 0.01; *** p < 0.001; ns = non-significant
→ denotes a metabolite

Chapter 1: General Introduction
92
1.5.6. Pharmacogenetic studies in humans
Given that preclinical findings have identified many antidepressants as P-gp
substrates (Sections 1.5.4 and 1.5.5), and that medicated depressed patients have
been reported to have increased P-gp activity (de Klerk et al., 2009) (discussed in
Section 1.4.6), it is plausible that P-gp efflux of antidepressants may be clinically
relevant in resistance to the treatment of depression (as outlined in relation to
other brain disorders in Section 1.3.5).
Co-administration of a P-gp inhibitor, itraconazole, has been reported to increase
the bioavailability of paroxetine in humans (Yasui-Furukori et al., 2007), while
fluvoxamine and citalopram plasma pharmacokinetics were found to be dependent
on polymorphisms in the ABCB1 gene (Fukui et al., 2007; Nikisch et al., 2008),
indicating that these antidepressants are P-gp substrates in humans.
As outlined in Section 1.3.4, the functional significance of any of the many SNPs in
the ABCB1 gene is unclear and remains controversial. Nonetheless, similar links
have also been reported between ABCB1 genotype and the frequency of side
effects following antidepressant treatment (Roberts et al., 2002; de Klerk et al.,
2013).
Moreover, several studies have reported associations between ABCB1 SNPs and
response to treatment with antidepressants, including paroxetine, citalopram and
escitalopram (Gex-Fabry et al., 2008; Kato et al., 2008; Nikisch et al., 2008;
Sarginson et al., 2010; Lin et al., 2011; Singh et al., 2012). In contrast, no links were
found between these ABCB1 SNPs and treatment response for amitriptyline,
fluoxetine or nortriptyline (Roberts et al., 2002; Laika et al., 2006). Importantly,
there has been little consensus regarding the involvement of particular SNPs in
pharmacogenetic studies reporting positive results. Moreover, reported
associations for paroxetine and citalopram have not been replicated in subsequent
studies (Mihaljevic Peles et al., 2008; Peters et al., 2008), thereby raising concerns
over the validity of these observations.

Chapter 1: General Introduction
93
The majority of clinical studies in this area have focused on a small number of
ABCB1 SNPs, mostly at the 3435 and 2677 sites. An early study found postural
hypotension to be significantly more common following treatment with
nortriptyline in patients carrying the C3435T SNP (Roberts et al., 2002). It was
hypothesized that this may have been due to a relative increase in the
accumulation of nortriptyline, or its metabolites, in the brain due to reduced P-gp
function. Clinical response to nortriptyline (or fluoxetine) was not associated with
the C3435T SNP in this study, however (Roberts et al., 2002). In contrast, paroxetine
treatment-response has been reported to have a significant association with ABCB1
genotype (Gex-Fabry et al., 2008; Kato et al., 2008). However, the SNPs that were
linked to paroxetine treatment-response differed between these two studies. Kato
and colleagues reported a significant positive association between the G2677T/A
SNP and paroxetine treatment-response. Furthermore, a link between the ABCB1
haplotype combination 3435C–2677G–1236T and a poor therapeutic response to
paroxetine was identified (Kato et al., 2008). These associations did not reach
significance in the other above-mentioned study, however, in which a link was
found between a SNP at the 61 position in the ABCB1 gene and the therapeutic
response to paroxetine (Gex-Fabry et al., 2008). In addition, a later study failed to
replicate the findings of Kato and colleagues (Mihaljevic Peles et al., 2008). It
should, however, be noted that these studies were undertaken in patient cohorts
from different ethnic backgrounds (Japanese vs. Caucasians)
Furthermore, the associations reported between ABCB1 SNPs and paroxetine
treatment response have not been observed with other antidepressants. In fact,
Nikisch and colleagues (2008) reported directly conflicting findings with regard to
citalopram, with the 2677T genotype being significantly more common in non-
responders to citalopram treatment. This correlated with significantly lower plasma
and cerebrospinal fluid citalopram concentrations in patients with the 2677T
genotype relative to carriers of the wild-type allele, while no difference was
observed in the same study for the C3435T polymorphism (Nikisch et al., 2008).
However, the small number of subjects in this pilot study (n=15) is a limitation. In
addition, no significant correlation was found between the G2677T/A

Chapter 1: General Introduction
94
polymorphism and therapeutic response or side effect severity in patients treated
with amitriptyline (Laika et al., 2006).
Another study failed to find any correlation between the C3435T polymorphism and
the frequency of antidepressant-induced mania in bipolar patients, treated with
various serotonergic antidepressants (De Luca et al., 2003). However, the wide
range of antidepressants involved in the study, some of which have been reported
to be P-gp substrates in vivo (paroxetine, venlafaxine, fluoxetine etc.) and others
which have not (sertraline, nefazodone, moclobemide), and the focus on an
independent polymorphism, as opposed to its role as part of a haplotype, are major
confounding factors (De Luca et al., 2003).
The often contradictory literature surrounding the role of genetic differences in
ABCB1 in antidepressant response is complicated by several factors, not least the
focus on individual SNPs, as opposed to haplotypes, in the majority of studies and
the lack of clarity regarding the functional impact of these SNPs. In addition, in
many cases it has not been clear if the antidepressants in question are transported
substrates of human P-gp.
Rather than focusing on individual, previously described SNPs, Uhr and co-workers
undertook a comprehensive fine-mapping of the ABCB1 gene to identify variants
which may be associated with antidepressant response (Uhr et al., 2008).
Moreover, in this study, antidepressants were classified as P-gp substrates (namely
venlafaxine, citalopram, paroxetine and amitriptyline) or non-P-gp substrates
(mirtazapine), albeit based on findings from studies in P-gp knockout mice rather
than data pertaining to human P-gp.
In this study, no association was found between antidepressant treatment response
and the G2677T or C3435T SNPs (Uhr et al., 2008). This finding in relation to the
G2677T or C3435T SNPs was subsequently replicated for citalopram, following
analysis of data from the large Sequenced Treatment Alternatives to Relieve
Depression (STAR*D) sample of depressed patients (Peters et al., 2008).

Chapter 1: General Introduction
95
In contrast, two key intronic ABCB1 SNPs, rs2032583 and rs2235015, were
identified as strong predictors of remission when patients were treated with
antidepressants that were P-gp substrates (Uhr et al., 2008). Patients carrying the
rare alleles of these intronic SNPs and receiving treatment with P-gp substrate
antidepressants had a 7.7-fold higher chance to remit after 5 weeks than carriers of
the other alleles (Uhr et al., 2008). This association was not due to differences in
dosing or plasma levels, thus suggesting a role for P-gp function at the BBB.
Moreover, no such association was determined in patients treated with
mirtazapine, which is not a P-gp substrate (Uhr et al., 2008), thus supporting the P-
gp-related hypothesis. A later study partially replicated these findings for
paroxetine (P-gp substrate) and mirtazapine (non-substrate) in geriatric depression,
finding rs2032583, but not rs2235015, to be associated with response to paroxetine
treatment (Sarginson et al., 2010). However, in their retrospective analysis of data
from the large STAR*D clinical trial population, Peters and colleagues failed to
replicate the findings of Uhr and co-workers with regard to an association between
certain ABCB1 SNPs and citalopram response (Peters et al., 2008). While the
original focus of their study involved investigating potential links between three
common ABCB1 variants (C1236T, G2677T/A, and C3435T) and citalopram
response, two ABCB1 SNPs reported to be in tight linkage disequilibrium with
rs2032583 in the first haplotype block reported to be significant by Uhr and
colleagues were also genotyped. Neither of these SNPs were associated with
citalopram response in the STAR*D population (Peters et al., 2008; Peters et al.,
2009). However, it must be stressed that the authors did not have genotype data
on the actual SNPs reported to be at play by Uhr and co-workers.
In contrast to Uhr and colleagues’ findings in relation to P-gp substrate
antidepressants, no association was found between duloxetine response and
rs2032583 (Perlis et al., 2010). Bearing in mind that there are no published in vitro
or in vivo studies indicating that duloxetine is a transported P-gp substrate, this
finding does not necessarily contradict the previous study. Further research is
required to establish if duloxetine is a transported substrate of P-gp to facilitate
informed interpretation of this study’s finding in relation to rs2032583.

Chapter 1: General Introduction
96
Significant links were also found between escitalopram response and uncommon
ABCB1 SNPs in Taiwanese depressed patients (Lin et al., 2011). However, the loci
associated with remission in this patient cohort were different to those identified
by Uhr and co-workers. Moreover, a recent study has reported that the C3435T SNP
predicts the dose of escitalopram required to achieve remission, with significantly
higher doses required in carriers of the C allele (Singh et al., 2012). Although
citalopram, a racemic mixture of R- and S-enantiomers, has been identified as a P-
gp substrate in vivo, no study has yet investigated the effect of P-gp on the brain
distribution of escitalopram, the pharmacologically active S-enantiomer of
citalopram. This is a key consideration given that P-gp is known to exhibit
enantioselectivity for several drugs (de Lagerie et al., 2004; Wang et al., 2004b;
Sakugawa et al., 2009; Akamine et al., 2012). Thus, further studies are needed to
ascertain if escitalopram is a transported substrate of P-gp.
In summary, while several studies have highlighted potential pharmacogenetic
interactions between ABCB1 and antidepressant treatment, there has been little
consistency regarding the involvement of particular SNPs and most studies have not
been successfully replicated. However, recent findings regarding the rs2032583 SNP
offer much promise. Further studies investigating interactions between this SNP
and response to antidepressants which are transported substrates of human P-gp
are now warranted. However, it should be noted that efflux transporters other than
P-gp, such as breast cancer resistance protein (BCRP) and the multidrug resistance-
associated proteins (MRPs), are also expressed at the BBB. The role of these
transporters in the brain distribution and treatment response to antidepressants
has been under-investigated, especially in light of a study linking response to
citalopram treatment with a SNP in ABCC1, the gene encoding MRP1 (Lee et al.,
2010). Future studies should be conducted to address this issue.
1.5.7. Stress, the HPA axis, depression and P-gp
Stress is thought to play a major role in the development of depression (Gold and
Chrousos, 2002). The hypothalamic-pituitary-adrenal (HPA) axis controls the
physiological response to stress through the secretion of corticosteroid hormones

Chapter 1: General Introduction
97
such as cortisol, the main glucocorticoid in humans. As discussed in Section 1.4.1,
dysregulation of the HPA axis has been implicated in the pathogenesis of
depression (Holsboer, 2000; Julio-Pieper and Dinan, 2010). The HPA axis is
regulated by negative feedback inhibition, whereby secreted corticosteroid
hormones act on the hypothalamus and pituitary gland to suppress further HPA axis
activation by reducing corticotrophin-releasing factor (CRF) and adrenocorticotropic
hormone (ACTH) secretion, respectively.
Hyperactivity of the HPA axis is one of the most consistent biological findings in
depressed patients (Pariante and Lightman, 2008). Depressives often have elevated
plasma cortisol (Halbreich et al., 1985) and ACTH (Carroll et al., 2007) levels, and fail
to respond to the dexamethasone suppression test (Carroll, 1982a; Carroll, 1982b),
whereby administration of the synthetic glucocorticoid dexamethasone should
suppress the secretion of cortisol. This is indicative of central HPA axis overdrive,
with compromised negative feedback inhibition at the hypothalamic level of the
HPA axis, in depressed patients.
The effect of P-gp on the brain penetration of glucocorticoids is unclear and
somewhat controversial. Several early studies reported that many important
endogenous and synthetic glucocorticoids are P-gp-substrates (Ueda et al., 1992;
Vankalken et al., 1993; Schinkel et al., 1995; Meijer et al., 1998; Karssen et al.,
2001; Karssen et al., 2002; Uhr et al., 2002). However, subsequent evidence, from
experiments involving double knockout abcb1ab(-/-) mice, suggests that
corticosterone (the main glucocorticoid in rodents) and cortisol (the main
glucocorticoid in humans) are not P-gp substrates at the BBB in vivo (Mason et al.,
2008; Mason et al., 2010), despite initial reports to the contrary (Uhr et al., 2002).
Moreover, recent studies have revealed that the brain accumulation of the
glucocorticoids cortisol, corticosterone and dexamethasone is greater in single
knockout abcb1a(-/-) mice than wild-types, thereby further confusing the issue
(Mason et al., 2012).
Regardless of this controversy, it has been reported that double P-gp knockout
abcb1ab(-/-) mice have consistently lower plasma ACTH and corticosterone levels

Chapter 1: General Introduction
98
than control animals, thus indicating that P-gp may play a key role in the regulation
of the HPA axis, and that absence of P-gp results in sustained suppression of the
HPA axis (Muller et al., 2003; Yau et al., 2007). Furthermore, treatment with the
tricyclic antidepressant desipramine reduced both basal and activated HPA axis
activity in wild-type comparator mice, while the same treatment only reduced an
activated HPA axis in abcb1ab(-/-) mice (Yau et al., 2007). This difference observed
between P-gp knockout and wild-type mice further indicates that there may be a P-
gp-dependent mechanism at play in the regulation of the HPA axis. However, the
uncertainty regarding the involvement of P-gp in the BBB transport of endogenous
glucocorticoids makes it difficult to explain this phenomenon. The original
hypothesis, which proposed that an absence of P-gp at the BBB resulted in a
suppression of the HPA by increased negative feedback inhibition axis due to
enhanced corticosterone entry into the brain (Muller et al., 2003; Yau et al., 2007),
is contingent on corticosterone being a transported substrate of P-gp at the BBB.
Further investigations are therefore needed to fully explain these observations.
While hyperactivity of the HPA axis is associated with depression, successful
antidepressant therapy results in normalization of the HPA axis (Herr et al., 2003;
Kunzel et al., 2003). Antidepressant-mediated enhancement of glucocorticoid
receptor function has been demonstrated in vitro (Pariante et al., 1997; Pariante et
al., 2001; Herr et al., 2003; Pariante et al., 2003a; Pariante et al., 2003b).
Interestingly, this effect has been observed following antidepressant co-incubation
with certain glucocorticoids, such as dexamethasone and cortisol, but was not
evident with others, such as corticosterone (Pariante et al., 1997). Given the lack of
clarity regarding the role of P-gp in glucocorticoid transport, it is tempting to
speculate that these differences are due to differential transport of glucocorticoids
by P-gp. Further experiments are required to substantiate or disprove this
hypothesis. Interestingly, co-incubation with the P-gp-inhibitor verapamil
attenuated or reduced the glucocorticoid-enhancing effect of the antidepressants
clomipramine and fluoxetine (Pariante et al., 2001; Pariante et al., 2003a; Pariante
et al., 2003b), thus indicating that antidepressant-mediated P-gp-inhibition may be
the underlying mechanism at play. Therefore, it has been suggested that
Chapter 1: General Introduction
99
antidepressant drugs may increase the access of cortisol to the brain by inhibition
of P-gp at the BBB, thereby enhancing glucocorticoid-mediated negative feedback
on the HPA-axis, and that this may contribute to the clinical mechanism of action of
antidepressants (Figure 1.12) (Pariante et al., 2004).
This theory has, however, been challenged (Weber et al., 2005; Weber et al., 2006).
Firstly, it has been questioned if P-gp inhibition by antidepressants could be
clinically relevant given that it is only seen at concentrations above therapeutically
relevant plasma levels (Weber et al., 2005). Furthermore, it seems that P-gp is
present in excess in brain capillaries (Miller, 2010), which may influence the
concentration of P-gp inhibitor needed to meaningfully increase substrate transport
across a membrane (Kannan et al., 2009). As a result, for antidepressants to exert
clinically significant P-gp inhibition at the BBB, concentrations several times higher
than their IC50 would need to be achieved (Kalvass and Pollack, 2007). Therefore, it
remains unclear if P-gp inhibitory concentrations of antidepressants are reached at
the BBB in clinical use.
In the second study challenging the relevance of P-gp inhibition to HPA axis
normalising ability of antidepressants (Weber et al., 2006), a potentially sub-
effective dose of amitriptyline was used (Yau et al., 2007). Moreover, it involved the
comparison of corticosterone levels in the brain and plasma, and it has
subsequently been reported that corticosterone may not a P-gp substrate in vivo
(Mason et al., 2008), thus undermining conclusions drawn from the study.
Nonetheless, despite ample in vitro data demonstrating P-gp inhibition and P-gp-
mediated enhancement of glucocorticoid function by antidepressants, there is a
paucity of in vivo data to support the hypothesis that antidepressants inhibit P-gp,
resulting in enhanced glucocorticoid entry into the brain. In fact, the most recent
publication from the Pariante group (the original proposers of this hypothesis) in
relation to this question has failed to demonstrate that either acute or chronic
administration of the antidepressant drug desipramine results in enhanced brain
levels of glucocorticoids in an in situ mouse model (Mason et al., 2011). This study,
in conjunction with another reporting enhanced P-gp function following chronic

Chapter 1: General Introduction
100
antidepressant treatment (de Klerk et al., 2010) undermines the hypothesis, and
therefore it seems unlikely that antidepressant mediated inhibition of P-gp
contributes to the clinical mechanism of action of antidepressant drugs.
In summary, the theory suggesting that P-gp inhibition at the BBB by some
antidepressants may contribute to their mechanism of action is certainly
interesting, but there is an increasing body of evidence undermining the
hypothesis. The single study demonstrating P-gp inhibition by an antidepressant in
vivo (Wang et al., 2006a) has not yet been replicated. Furthermore, it has yet to be
proven that P-gp-inhibitory concentrations of antidepressants are reached at the
BBB in the clinical setting. It is also necessary to clarify the role of P-gp in the brain
accumulation of glucocorticoids, and the underlying mechanism behind the
reduced corticosterone levels observed in P-gp knockout mice relative to controls.
In addition, P-gp function has been shown to be increased in medicated depressed
patients, chronically treated with antidepressants, relative to healthy controls (de
Klerk et al., 2009). This would seem to contradict the theory that antidepressant
treatment inhibits P-gp function at the BBB. However, the antidepressants used by
the patients in this study were not listed. Therefore, it is not possible to determine
if patients were treated with antidepressant medications that are thought to inhibit
P-gp. Most importantly, a relatively recent study failed to demonstrate that
administration of the antidepressant desipramine resulted in P-gp inhibition leading
to enhanced glucocorticoid entry into the brain, thereby questioning the validity of
the original hypothesis (Mason et al., 2011). Therefore, on balance, evidence to
support the theory that P-gp inhibition by antidepressants at the BBB contributes to
their mechanism of action is controversial and not supported by the most recent in
vivo studies. More research in this area is needed to prove whether such negative
effects generalise to other antidepressants.
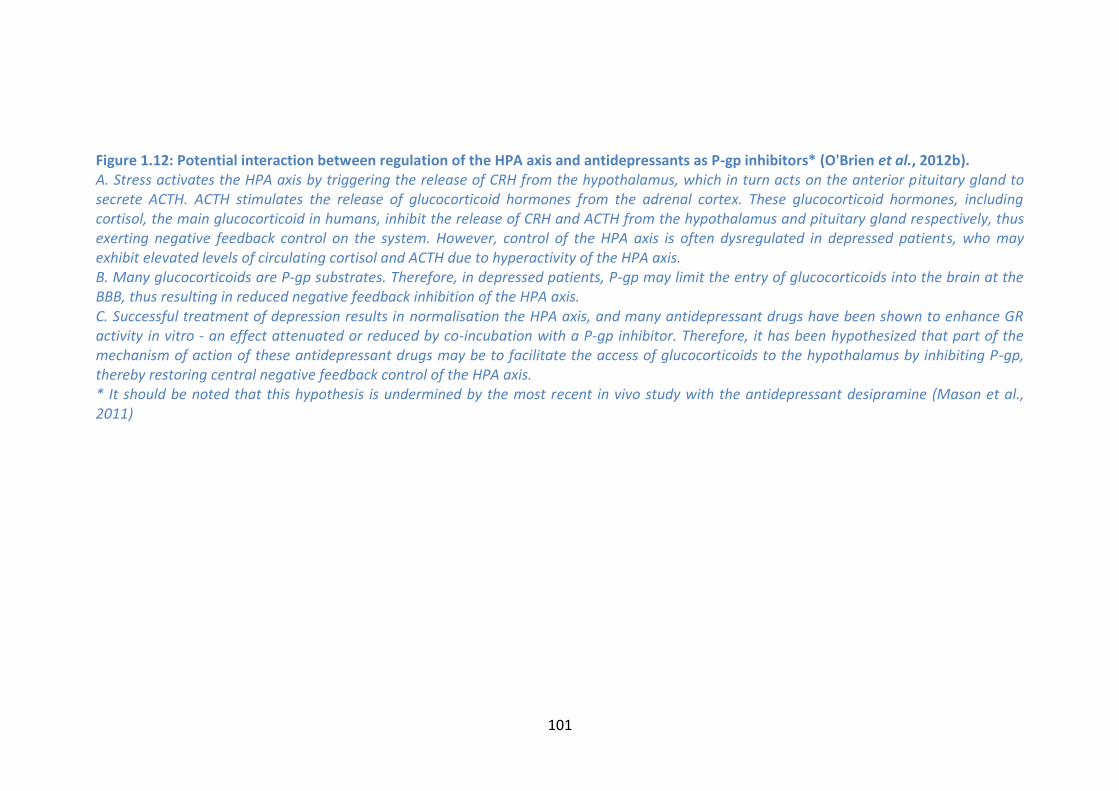
101
Figure 1.12: Potential interaction between regulation of the HPA axis and antidepressants as P-gp inhibitors* (O'Brien et al., 2012b). A. Stress activates the HPA axis by triggering the release of CRH from the hypothalamus, which in turn acts on the anterior pituitary gland to secrete ACTH. ACTH stimulates the release of glucocorticoid hormones from the adrenal cortex. These glucocorticoid hormones, including cortisol, the main glucocorticoid in humans, inhibit the release of CRH and ACTH from the hypothalamus and pituitary gland respectively, thus exerting negative feedback control on the system. However, control of the HPA axis is often dysregulated in depressed patients, who may exhibit elevated levels of circulating cortisol and ACTH due to hyperactivity of the HPA axis. B. Many glucocorticoids are P-gp substrates. Therefore, in depressed patients, P-gp may limit the entry of glucocorticoids into the brain at the BBB, thus resulting in reduced negative feedback inhibition of the HPA axis. C. Successful treatment of depression results in normalisation the HPA axis, and many antidepressant drugs have been shown to enhance GR activity in vitro - an effect attenuated or reduced by co-incubation with a P-gp inhibitor. Therefore, it has been hypothesized that part of the mechanism of action of these antidepressant drugs may be to facilitate the access of glucocorticoids to the hypothalamus by inhibiting P-gp, thereby restoring central negative feedback control of the HPA axis. * It should be noted that this hypothesis is undermined by the most recent in vivo study with the antidepressant desipramine (Mason et al., 2011)

102

Chapter 1: General Introduction
103
1.5.8. Inhibition of P-gp as a putative antidepressant
augmentation strategy?
While several preclinical studies have robustly identified various antidepressants as
transported P-gp substrates in rodents, these findings have generally not been
supported by investigations using in vitro bidirectional transport assays. From a
clinical perspective, interactions between antidepressant drugs and P-gp could
potentially lead to altered dose-to-plasma relationships and/or frequency of side
effects with altered P-gp function. In particular, P-gp-mediated efflux of
antidepressants at the BBB would limit the access of these drugs to their site of
action within the brain, therefore potentially contributing to the high rate of
treatment failure (Figure 1.13).
Further preclinical studies are required to more fully elucidate the role of P-gp in
determining the brain levels and effect of antidepressant drugs in vivo. To date, no
antidepressant has been robustly identified as a transported P-gp substrate both in
vitro and in vivo. In particular, it is difficult to draw definitive conclusions from the
available in vitro studies investigating if antidepressants are transported substrates
of human P-gp. Thus, there is a major need for additional research in this regard. In
addition, there is a paucity of studies demonstrating that brain concentrations of an
antidepressant can be augmented by pharmacological inhibition of P-gp. Indeed,
the only antidepressant drugs for which this has been reported are imipramine and
nortriptyline, both of which are seldom used TCA antidepressants. Given that
previous studies reported substantially smaller increases in the brain levels of
nortriptyline following P-gp inhibition than similar experiments involving P-gp
knockout mice (Doran et al., 2005; Ejsing and Linnet, 2005), it is important to
investigate the potential for modulation of P-gp as a strategy to enhance brain
delivery. Moreover, the pharmacodynamic impact of increasing brain
concentrations of P-gp substrate antidepressants has not been adequately
investigated to date.

Chapter 1: General Introduction
104
Figure 1.13: Antidepressants as transported substrates of P-gp at the BBB (O'Brien et al., 2012b). Based on numerous in vitro and in vivo studies, it is thought that many antidepressant drugs may be transported P-gp substrates at the BBB, thereby limiting their brain distribution. Therefore, therapeutically effective brain concentrations might not be achieved in some cases, which in turn may play a role in treatment resistant depression.
Many studies have reported associations between SNPs in ABCB1 and
antidepressant treatment response. However, there appears to be little consensus
among the reported results, with numerous publications claiming antithetical
findings. Nonetheless, the report of Uhr and colleagues in 2008 is extremely
promising (Uhr et al., 2008), especially considering that some of their findings were

Chapter 1: General Introduction
105
subsequently replicated (Sarginson et al., 2010); although it must also be noted that
others have failed to replicate certain aspects of these findings (Peters et al., 2008).
Thus, the importance of the putative role of ABCB1 variants in the clinical efficacy
of antidepressants remains controversial, and well-powered, prospective clinical
trials are needed to definitively resolve this issue (Peters et al., 2009).
Until such time as these trials have taken place, it remains plausible that P-gp
inhibitors may augment the effects of certain antidepressants, particularly in
treatment-resistant situations. Indeed, anecdotal evidence indicates a beneficial
effect of adjunctive verapamil treatment in severely depressed patients who are
refractory to SSRI treatment (Clarke et al., 2009). Clinical trials, exercising caution to
avoid potential unwanted side effects due to putative pharmacokinetic or
pharmacodynamic interactions, investigating this possibility may now be
warranted.
As outlined in Section 1.4.2, one common approach used in the treatment of TRD is
the augmentation of a failed antidepressant therapy with another agent, such as
the antipsychotics aripiprazole, olanzapine, quetiapine or risperidone (Philip et al.,
2010). Interestingly, some of these antipsychotics inhibit P-gp in vitro (Wang et al.,
2006b; Zhu et al., 2007; Feng et al., 2008); it is tempting to speculate that this
property may contribute to their therapeutic efficacy as adjunctive treatments.
Indeed, co-administration of risperidone with sertraline has been shown to result in
a trend for increased sertraline concentrations in the brain of CF1 mice in vivo
(Wang et al., 2006a). Therefore, one could hypothesize that the mechanistic
explanation for this augmentation strategy involves the inhibition of P-gp by the
antipsychotic drug, leading to increased central antidepressant concentrations.
However, further studies (both in vitro and in vivo) are needed to establish if there
is any merit to this hypothesis.
In conclusion, recent studies suggest that a complex, and as yet not fully
understood, relationship exists between antidepressants and drug efflux pumps,
such as P-gp, at the BBB, and that this relationship may impact on the therapeutic
efficacy of antidepressant treatment. TRD represents a major challenge in the

Chapter 1: General Introduction
106
treatment of depression, and there is a huge unmet medical need for novel
approaches to overcome this challenge. Advances in pharmacogenomics,
neuroimaging and animal studies, coupled with more sophisticated in vitro assay
technology, are sure to shed light on the interaction between antidepressants and
P-gp in the coming years, thus potentially resulting in new strategies for adjunctive
therapies for TRD.

Chapter 1: General Introduction
107
1.6. Aims of the thesis
This thesis aims to further investigate interactions between P-gp and
antidepressants at the BBB by addressing some key outstanding questions. In
particular, the role played by P-gp in the brain distribution of certain
antidepressants, such as escitalopram, has yet to be investigated. Moreover, it
remains unclear if antidepressants which have been identified as transported P-gp
substrates in rodents are also transported substrates of human P-gp. Most
importantly in the context of P-gp inhibition as a putative strategy to augment
antidepressant treatment, the effect of blocking P-gp on an antidepressant’s
activity in a relevant animal model remains to be elucidated.
1.6.1. Aim 1: Establish an integrated intracerebral microdialysis
approach to determine the effect of P-gp inhibition on
antidepressant levels in the brain
The intracerebral microdialysis approach offers several advantages as a means to
assess the impact of P-gp on the brain distribution of drug compounds, as outlined
in Section 1.2.5.4. Furthermore, by combining intracerebral microdialysis with
peripheral jugular vein and carotid artery catheterizations, it would be possible to
administer the drug of interest intravenously, thereby removing differences in drug
absorption as a confounding factor, as well as taking parallel serial blood samples,
thereby facilitating simultaneous monitoring of brain and plasma drug levels. Thus,
it would be possible to determine the effect of administration of a P-gp inhibitor on
the blood-brain barrier transport of antidepressant drugs in conscious freely
moving animals over a period of time. We aimed to develop such a model and to
apply it to different antidepressants to investigate the role of P-gp in their BBB
transport (Chapters 2 and 4).
Chapter 1: General Introduction
108
1.6.2. Aim 2: Establish and employ an in vitro model to identify
antidepressants which are transported substrates of
human P-gp
Due to reports of species differences in P-gp activity and specificity (Yamazaki et al.,
2001; Katoh et al., 2006; Baltes et al., 2007; Syvanen et al., 2009), and indeed
differences in the identification of P-gp substrates between single and double P-gp
knockout mice, the clinical relevance of preclinical studies demonstrating that P-gp
restricts the brain concentrations of various antidepressants in rodents is unclear.
The establishment and consistent, rational application of an in vitro bidirectional
transport model involving cells expressing human P-gp was therefore a priority,
given the paucity and inconsistency of the available data pertaining to the transport
of antidepressants by human P-gp. We aimed to establish such a model, and to use
it to screen a number of antidepressant in relation to their status as transported P-
gp substrates (Chapters 3 and 4).
1.6.3. Aim 3: Investigate the impact of P-gp inhibition on the
pharmacodynamic activity of antidepressants which are P-
gp substrates
While numerous studies have demonstrated that P-gp inhibition or P-gp knockout
results in increased brain levels of various antidepressants, it has not yet been
determined if enhancing brain levels of antidepressants in this way results in an
augmentation in their antidepressant-like activity. We aimed to address this
question, using appropriate animal models to investigate behavioural responses to
antidepressant treatment, as outlined in Section 1.4.5 (Chapters 4, 5 and 6).
Furthermore, we aimed to adapt our microdialysis model to investigate the impact
of P-gp inhibition on antidepressant-induced increases in extracellular serotonin
concentrations (Chapter 5).
Chapter 1: General Introduction
109
1.6.4. Aim 4: Determine the effect of chronic treatment with a P-
gp inhibitor and an antidepressant on the brain
distribution and behavioural and molecular responses to
antidepressant treatment
To date, studies investigating the effect of P-gp inhibition on the brain distribution
of antidepressants have exclusively involved acute treatments. Given that
antidepressants are prescribed on a chronic basis in clinical practice and considering
that the expression of P-gp, as well as other ABC transporters, can be up-regulated
in response to certain xenobiotics (Miller, 2010), it is essential to determine if P-gp
inhibition will result in enhanced brain levels of a P-gp substrate antidepressant
after chronic treatment. Moreover, there is typically a therapeutic delay of several
weeks in the onset of action of antidepressants clinically (Krishnan and Nestler,
2008). Therefore, the impact of P-gp inhibition on responses to chronic
antidepressant treatment is a key question (Chapter 6).

110
Chapter 2:
Inhibition of P-glycoprotein Enhances Transport
of the Antidepressant Imipramine across the
Blood-Brain Barrier: Microdialysis Studies in the
Conscious Freely Moving Rat
Fionn E. O’Brien1,2,3, Gerard Clarke1,4, Patrick Fitzgerald1, Timothy G. Dinan1,4,
Brendan T. Griffin2,# and John F. Cryan1,3,#
1 Alimentary Pharmabiotic Centre, University College Cork, Cork, Ireland
2 School of Pharmacy, University College Cork, Cork, Ireland
3 Department of Anatomy & Neuroscience, University College Cork, Cork, Ireland
4 Department of Psychiatry, University College Cork, Cork, Ireland
Published in: British Journal of Pharmacology (2012) 166(4):1333-43

Chapter 2: P-gp inhibition enhances imipramine BBB transport
111
Abstract
Background: Recent studies indicate that efflux of antidepressants by the multidrug
resistance transporter P-glycoprotein (P-gp) at the blood-brain barrier (BBB) may
contribute to treatment resistant depression (TRD) by limiting intracerebral
antidepressant concentrations. In addition, clinical experience shows that
adjunctive treatment with the P-gp inhibitor verapamil may improve the clinical
outcome in TRD. Therefore, the present study aimed to investigate the impact of P-
gp inhibition on the BBB transport of the tricyclic antidepressant imipramine and its
active metabolite desipramine.
Methods: Intracerebral microdialysis was used to monitor brain levels of
imipramine and desipramine following intravenous imipramine administration, with
or without pre-treatment with one of the P-gp inhibitors verapamil or cyclosporin A
(CsA). Plasma drug levels were also determined at regular intervals.
Results: Pre-treatment with either verapamil or CsA resulted in significant increases
in imipramine concentrations in the microdialysis samples, without altering
imipramine plasma pharmacokinetics. Furthermore, pre-treatment with verapamil,
but not CsA, led to a significant elevation in plasma and brain levels of desipramine.
Conclusions: The present study demonstrates that P-gp inhibition can enhance
intracerebral imipramine concentrations, thus supporting the hypothesis that P-gp
restricts brain levels of certain antidepressants, including imipramine. These
findings may help to explain reports of a beneficial response to adjunctive therapy
with verapamil in TRD.

Chapter 2: P-gp inhibition enhances imipramine BBB transport
112
2.1. Introduction
Recent pre-clinical studies indicate that several antidepressant drugs may be
substrates of the multidrug resistance transporter P-glycoprotein (P-gp) at the
blood-brain barrier (BBB) (O'Brien et al., 2012b). P-gp, encoded by the ABCB1 gene
in humans, is expressed at multiple sites within the body, including the luminal
membrane of the brain capillary endothelial cells which form the BBB (Cordoncardo
et al., 1989). Drug efflux by P-gp at the BBB represents a major obstacle in the
delivery of pharmacological compounds which are P-gp substrates to the brain, and
has been linked to treatment failure in various brain disorders, such as epilepsy and
brain cancer (Siddiqui et al., 2003; Pauwels et al., 2007).
Several functional single nucleotide polymorphisms (SNPs) in the ABCB1 gene have
been identified which impact on P-gp expression and/or function (Cascorbi, 2006).
These functional SNPs may therefore have an impact on the ability of P-gp
substrate drugs to reach the brain. Emerging clinical evidence indicates that the
response rate to treatment with antidepressants, particularly those which have
been shown to be P-gp substrates at the BBB in vivo, may be associated with ABCB1
genotype (Uhr et al., 2008; Sarginson et al., 2010; Lin et al., 2011). This suggests
that P-gp-mediated efflux may contribute to the high prevalence of treatment
resistant depression (TRD) by limiting antidepressant concentrations at their
intracerebral site of action (O'Brien et al., 2012b). In addition, preliminary clinical
studies have suggested that co-administration of the P-gp inhibitor verapamil may
be beneficial in TRD (Clarke et al., 2009). However, despite numerous in vivo studies
demonstrating enhanced brain levels of several antidepressants in P-gp knockout
mice compared to wild-type controls, the relative contribution of P-gp-mediated
efflux and passive permeability on the BBB transport of these antidepressant drugs
has yet to be definitively determined, and the significance of putative P-gp efflux to
the BBB transport of antidepressants remains contentious (O'Brien et al., 2012b).
Not all antidepressants are P-gp substrates, however. Mirtazapine is one such
example (Uhr et al., 2003; Uhr et al., 2008), and interestingly clinical response to
mirtazapine is not associated with ABCB1 genotype (Uhr et al., 2008). Furthermore,

Chapter 2: P-gp inhibition enhances imipramine BBB transport
113
the complexity of the relationship between antidepressants and P-gp should be
noted, as well as the difficulties in extrapolating results from one experimental
context to another (O'Brien et al., 2012b). This point is illustrated by work from the
Pariante group, where in vitro studies led to the proposal that activity of P-gp at the
BBB may itself be a target of antidepressant action (Pariante et al., 2003b; Pariante
et al., 2004), whereas recent in vivo results appear to contradict this hypothesis
(Mason et al., 2011).
While several studies have investigated the distribution of antidepressants into the
brain in P-gp knockout mice relative to wild-type controls, there is a paucity of
research investigating the impact of pharmacological P-gp inhibition on the ability
of antidepressants to penetrate the BBB, with only three such studies published to
date to our knowledge (Ejsing and Linnet, 2005; Ejsing et al., 2006; Clarke et al.,
2009). We have previously shown that pre-treatment with verapamil leads to
enhanced brain-to-serum ratios of the tricyclic antidepressant imipramine and its
active metabolite, desipramine, in certain brain regions (Clarke et al., 2009).
However, in vitro transport studies using different P-gp expressing cell-lines have
yielded conflicting findings regarding the P-gp substrate status of imipramine
(Mahar Doan et al., 2002; Faassen et al., 2003). Therefore, it remains unclear
whether P-gp limits the ability of imipramine to penetrate the BBB. These previous
studies in normal animals have only investigated brain-to-serum ratios at a single
(terminal) time-point post-antidepressant administration, and therefore have not
elucidated the time-dependent impact of P-gp inhibition on the distribution of
these antidepressants into the brain.
The present study utilises an integrated intracerebral microdialysis technique to
investigate the impact of pre-treatment with one of two distinct P-gp inhibitors,
verapamil or cyclosporin A (CsA), on free imipramine and desipramine
concentrations in brain extracellular fluid (ECF) over time in wild-type Sprague
Dawley rats. Intracerebral microdialysis represents a useful investigational tool
which can be used to assess drug permeability across the BBB as a function of time,

Chapter 2: P-gp inhibition enhances imipramine BBB transport
114
particularly when applied to the study of drug transporters in the central nervous
system (CNS) (Sawchuk and Elmquist, 2000).

Chapter 2: P-gp inhibition enhances imipramine BBB transport
115
2.2. Methods
2.2.1. Drugs and chemicals
High performance liquid chromatography (HPLC) grade acetonitrile, potassium
dihydrogen phosphate and orthophosphoric acid (OPA) were obtained from Fisher
Scientific (Ireland). Heparin sodium solution (Wockhardt UK Ltd, UK) and CsA
(Sandimmun; Novartis Pharmaceuticals UK Ltd, UK) were purchased from Uniphar
Group (Ireland). Imipramine, desipramine, trimipramine and verapamil were
obtained from Sigma-Aldrich as were all other chemicals unless otherwise stated.
2.2.2. Animals
Male Sprague Dawley rats (Harlan Laboratories, UK), weighing 255-290 g, were
used in this study (total n = 18). Animals were group-housed 4-6 animals per cage
and maintained on a 12 hour light/dark cycle (lights on at 08:00 h) with food and
water ad libitum. Room temperature was controlled at 22 ± 1°C. All procedures
were carried out in accordance with EU directive 89/609/EEC and approved by the
Animal Experimentation & Ethics Committee of University College Cork.
2.2.3. Surgical procedures
Animals were anaesthetized prior to surgery with a ketamine/xylazine mixture
(90/10 mg.kg-1 i.p.), with maintenance of anaesthesia achieved by repeating 20-25%
of the induction dose at 30-40 minute intervals, as required. Analgesia was
provided by pre-operative administration of carprofen (3 mg.kg-1 s.c.). Throughout
surgical procedures, the body temperature of each rat was maintained using a
heating pad.
2.2.3.1. Catheterization surgery
Two indwelling catheters were surgically implanted in each rat using standard
surgical techniques: one in the carotid artery for collection of serial blood samples
and one in the external right jugular vein to facilitate intravenous drug
administration (Thrivikraman et al., 2002; Huang et al., 2006; Heiser, 2007). All
catheters were pyrogen-free polyethylene tubing (Instech Laboratories, Plymouth
Meeting, PA). The arterial and venous catheters consisted of BPE-T25 tubing
Chapter 2: P-gp inhibition enhances imipramine BBB transport
116
(0.018"ID x 0.036"OD) and BPE-T50 tubing (0.023"ID x 0.038"OD), respectively. The
catheters were subcutaneously tunnelled to the back of the neck of the rat, where
they were exteriorized and connected to three-way Discofix® stopcocks (B. Braun).
To prevent clotting the catheters were filled with a heparinised saline solution (20
IU.ml-1).
2.2.3.2. Microdialysis surgery
Immediately after completion of catheterization surgery, while still anaesthetized,
rats were placed in a stereotaxic frame (Model 900 Small Animal Stereotaxic
Instrument, David Kopf Instruments, Bilaney Consultants, St Julians, Sevenoaks, UK)
with the skull flat. A small burr hole was made in the skull, centred 2.7 mm anterior
and 0.7 mm lateral to bregma. The microdialysis probe was slowly lowered 5 mm
from dura into the prefrontal cortex (PFC) (Paxinos and Watson, 1998) and secured
with skull screws and dental acrylic. The inlet of the probe was connected to a fluid
swivel (Instech Laboratories, Plymouth Meeting, PA) and the rats were single-
housed in cylindrical plexiglass containers (Instech Laboratories, Plymouth Meeting,
PA) filled with bedding and food pellets. The venous and arterial catheters were
secured to the swivel in the cage to prevent the rats from interfering with them,
while at the same time enabling free movement. Artificial cerebrospinal fluid (aCSF:
147 mM NaCl, 1.7 mM CaCl2, 0.9 mM MgCl2, and 4mM KCl) was continuously
perfused through each microdialysis probe at a rate of 1.5 μl.min-1 by a microlitre
‘Pico Plus’ syringe pump (Harvard Apparatus, Fircroft Way, Edenbridge, Kent UK)
and the rats allowed to recover overnight prior to sampling on the following day
during the optimal post-surgical period (de Lange et al., 2000).
2.2.4. Dialysis probe construction and calibration
Vertical concentric microdialysis probes were constructed as described elsewhere
(Page and Lucki, 2002). Briefly, a piece of fused silica (ID 75 ± 3 µm, OD 150 ± 6 µm;
CM Scientific Ltd, UK) was inserted through PE10 tubing (Instech Laboratories,
Plymouth Meeting, PA). A Spectra/Por® Micro-dialysis Hollow Fiber regenerated
cellulose semipermeable membrane with a 13 kD molecular weight cut-off
(Spectrum Laboratories, Inc.) was placed over the fused silica and into the PE10

Chapter 2: P-gp inhibition enhances imipramine BBB transport
117
tubing, and fixed in place using epoxy adhesive. The open end of the
semipermeable membrane was sealed with a 0.5 mm epoxy plug, and the active
area of the fibre, where diffusion takes place across the membrane, was limited to
3 mm in length by coating regions outside this range with epoxy adhesive. To
determine the in vitro probe recovery rate, each probe was immersed in a well of
aCSF containing a known concentration (100 ng.ml-1) of imipramine and
desipramine. The recovered concentration of imipramine and desipramine in the
perfusate was expressed as a percentage of the known concentration in the well.
Probes used in the in vivo studies had in vitro recovery rates between 6.8-12.2% for
imipramine and 7.0-13.5% for desipramine. As imipramine is known to bind to
plastic tubing (Friedl and Propping, 1984), it was not possible to calibrate the
probes in vivo using standard techniques such as the no-net-flux or retrodialysis
methods, due to imipramine binding to inlet (polyethylene) tubing in the probes
(unpublished observations). As the diffusion properties of compounds in brain
tissue are likely different from in vitro conditions, dialysate values were not
corrected to account for the in vitro recovery rate of the probe. However, it was
possible to directly compare the uncorrected dialysate concentrations between the
groups as there was no statistical difference between in vitro probe recovery rates
across the groups (Table 2.1), thus ensuring comparisons were valid as per
numerous previous reports (Sato et al., 1994; Evrard et al., 1998; Page and Lucki,
2002; Page et al., 2010).
2.2.5. Experimental design
Rats were separated into three groups: imipramine only (IMI only), imipramine plus
verapamil (IMI+VER) and imipramine plus CsA (IMI+CsA; n=6 per group) (Figure 2.1).
Imipramine (5 mg.kg-1 i.v.) was administered to all rats via the jugular vein catheter,
with or without pre-treatment with either verapamil or CsA, both of which are P-gp
inhibitors. Rats in the IMI+VERAP group were pre-treated with verapamil (20 mg.kg-
1 i.p.) 90 minutes before imipramine administration. Rats in the IMI+CsA group
were pre-treated with CsA (25 mg.kg-1 i.v.) 30 minutes before imipramine
administration. The doses, routes of administration and timing of P-gp inhibitor

Chapter 2: P-gp inhibition enhances imipramine BBB transport
118
administration used were based on those previously published in P-gp inhibition
studies (Tsai et al., 2002; Bart et al., 2003; Syvanen et al., 2006; Liow et al., 2007;
Clarke et al., 2009). Microdialysis samples (dialysates) from the PFC were collected
at 20 minute intervals for 1 hour before (blanks) and for 4 hours post-imipramine
administration. Dialysates were stored at -80oC until analysed by HPLC. Blood
samples were taken at 8 time-points, one before imipramine administration (blank)
and one at 5, 15, 30, 60, 120, 180 and 240 minutes post-imipramine administration.
Blood samples (~ 250 µl) were immediately centrifuged at 5000 rpm for 5 minutes,
plasma taken and stored at -80oC until extraction for analysis by HPLC with
electrochemical detection. At the conclusion of the experiment, rats were deeply
anaesthetized using intravenous ketamine/xylazine mixture, and bromophenol blue
dye was then infused through the probe to mark its location. The rats were
subsequently decapitated while under anaesthesia, and the brains removed for
histological verification of probe placement. Data were discarded if the probe
placement was outside of the PFC.
2.2.6. Plasma extraction
Imipramine and its active metabolite desipramine were extracted from plasma
using a liquid-liquid extraction technique as described previously (Clarke et al.,
2009), with some modifications. Briefly, 98 µl of plasma was spiked with 2 µl of the
internal standard, trimipramine, to yield a final concentration of 20 ng.ml-1
trimipramine. To this trimipramine-spiked plasma, 1 ml of sodium hydroxide (2 M)
and 3 ml of water were added. Extraction was carried out in 7.5 ml of 1.5% isoamyl
alcohol in n-heptane by vortexing for 30 seconds, followed by agitation on a
mechanical shaker for 15 min and then centrifugation at 5000 RPM for 15 min at
Figure 2.1: Schematic illustrating experimental design and timelines (refer to text in Section 2.2.5 for full details).

Chapter 2: P-gp inhibition enhances imipramine BBB transport
119
20°C. The upper solvent layer was transferred to a tube containing 200 µl of 25 mM
OPA, vortexed for 30 seconds, then agitated on a mechanical shaker for 15 min
followed by centrifugation at 5000 rpm for 15 min at room temperature. Twenty
microlitres of the lower aqueous phase was injected onto the HPLC system for
analysis.
2.2.7. HPLC analysis
2.2.7.1. HPLC equipment
The HPLC with electrochemical detection (HPLC-ECD) system consisted of a
Shimadzu LC-20AD XR Prominence Pump, CBM-20A communication bus module,
SIL-20AC XR Prominence Autosampler, CTO-20A Prominence Column oven (all
supplied by Mason Technology, Cork, Ireland). System components were used in
conjunction with Shimadzu LC solutions software (Mason Technology). The detector
used was ESA Coulochem III with the 5041 Amperometric Cell (Supplied by ESA
Analytical, Ltd., Brook Farm, Dorton, Aylesbury, Buckinghamshire, HP18 9NH
England). All samples were injected onto a reversed phase Luna 3 µm C18(2) 150 x
2 mm column (Phenomenex), which was protected by Krudkatcher Ultra in-line
filters (Phenomenex).
2.2.7.2. HPLC conditions
The HPLC-ECD method was adapted from previously described methods (Sato et al.,
1994; Frahnert et al., 2003). Briefly, the mobile phase which was used on the HPLC
system consisted of a mixture of potassium dihydrogen phosphate (25 mM, pH 7
with 4N NaOH) and HPLC grade acetonitrile (56:44). Mobile phase was filtered
through Millipore 0.22 µm Durapore filters (Millipore, Ireland) and vacuum
degassed prior to use. Compounds were eluted isocratically over a 30 min runtime
at a flow rate of 0.4 ml.min-1 after a 20 µl injection. The column was maintained at a
temperature of 30oC and samples/standards were kept at 8oC in the cooled
autoinjector prior to analysis. The glassy carbon working electrode combined with a
platinum reference electrode (ESA) was operated at a potential of 600 mV and a
range of 50 nA.

Chapter 2: P-gp inhibition enhances imipramine BBB transport
120
2.2.7.3. Analyte identification and quantification
Imipramine, desipramine, verapamil and trimipramine (internal standard) were
identified by their characteristic retention times as determined by standard
injections which were run at regular intervals during sample analysis. For the
extracted plasma samples, analyte:internal standard peak height ratios were
measured and compared with standard injections, and results were expressed as
nanograms of analyte per ml of plasma. As no extraction procedure was necessary
for microdialysis samples, analyte peak heights from undiluted samples were
compared directly with standard injections and expressed as nanograms of analyte
per ml of dialysate. The limit of detection (S/N ratio of 2) was 0.22 ng/ml and 0.28
ng/ml for desipramine and imipramine respectively, while the limit of quantification
(S/N ratio of 5) was 0.56 ng/ml for desipramine and 0.71 ng/ml for imipramine. The
co-efficient of variation (% CV) for the HPLC method was 2% for desipramine and
3% for imipramine (n=8). The accuracy of the technique was determined by carrying
out the extraction procedure on plasma samples spiked with known concentrations
of imipramine and desipramine followed by HPLC analysis. The mean (± SEM)
concentration determined for extracted desipramine and impramine samples were
96 ± 1 % and 102 ± 1 % of the known spiked concentration respectively (n = 4).
2.2.8. Data analysis and statistical procedures
Pharmacokinetic (PK) parameters were calculated from the observed data by non-
compartmental analysis. The area under the concentration-time curve (AUC) for
imipramine and desipramine in plasma and dialysate samples was calculated using
the linear trapezoidal method from the first to the last measured plasma
concentration in all cases. The elimination rate constant (kel) for imipramine in
plasma was calculated by log-linear regression of the last four plasma concentration
time-points. The apparent terminal elimination half-life (t1/2) of imipramine in
plasma was obtained from the kel. Imipramine clearance from plasma (Cl) after i.v.
bolus dose administration was calculated by dividing the i.v. dose by the AUC. All
statistical analyses were carried out using standard commercial software (PASW
Statistics, version 17.0.2; SPSS, Inc., Chicago, IL). Plasma and dialysate concentration

Chapter 2: P-gp inhibition enhances imipramine BBB transport
121
versus time profiles were compared using one-way repeated measures ANOVA.
Statistical analyses of all other parameters were carried out using one-way ANOVA.
Where a significant overall group effect was observed, the two-sided Dunnett’s
post-hoc test was used to elucidate differences between the IMI only group and the
other two groups. All data are reported as mean ± SEM. The criterion for statistical
significance was p ≤ 0.05.

Chapter 2: P-gp inhibition enhances imipramine BBB transport
122
2.3. Results
2.3.1. Plasma imipramine and desipramine pharmacokinetics
There was no significant difference between the groups in terms of imipramine
levels in plasma over time (F(2, 15) = 0.696, p > 0.05; Figure 2.2A). Furthermore,
there was no significant difference in mean plasma imipramine AUC values
between the groups (F(2, 15) = 0.726, p > 0.05; Table 2.1). Plasma pharmacokinetic
parameters for imipramine are listed in Table 2.1. No statistically significant
differences between the groups were observed in any of the plasma
pharmacokinetic parameters.
Due to transient technical difficulties with baseline stabilisation pertaining to the
electrochemical detection technique, it was not possible to determine plasma
desipramine concentrations at certain time-points for 2 of the 18 animals in the
study. As a result of these missing individual data-points, these animals could not
be included in repeated measures analysis of plasma desipramine levels, thus
reducing our group numbers to n= 5 for both the IMI only and IMI+CsA groups for
the repeated measures ANOVA. Nonetheless, there was a significant overall group
effect on plasma desipramine levels over time (F(2, 13) = 53.311, p < 0.001; Figure
2.2B), with significantly higher plasma desipramine concentrations in the
IMI+VERAP group than the IMI only group at every time-point (Figure 2.2B). In
addition, there was a significant group effect on mean plasma desipramine AUC
values (F(2, 15) = 40.689, p < 0.001; Table 2.1), with post-hoc analysis revealing that
the mean plasma desipramine AUC was significantly higher in the IMI+VERAP group
than the IMI only group (p < 0.001), with no difference between the IMI only and
IMI+CsA groups (Table 2.1).

Chapter 2: P-gp inhibition enhances imipramine BBB transport
123
Figure 2.2: Plasma imipramine and desipramine profiles A. Imipramine concentrations in plasma as measured at different time points. There was no statistical difference in imipramine plasma profiles between the 3 groups. B. Desipramine concentrations in plasma as measured at different time points. There was a significant overall difference between the groups in terms of desipramine plasma profiles (p < 0.001). Desipramine levels were markedly increased in the IMI+VERAP group relative to the IMI only group at all time points (** p < 0.01; *** p <0.001). Data are represented as mean ± SEM from 5-6 animals per group. Red square symbols with solid line represent IMI only group; green triangular symbols with dashed line represent IMI+VERAP group; blue diamond-shaped symbols with dotted line represent IMI+CsA group.

Chapter 2: P-gp inhibition enhances imipramine BBB transport
124
Table 2.1: Summary of key pharmacokinetic (PK) parameters and probe recovery values
IMI only
mean ± SEM IMI+VERAP
mean ± SEM IMI+CsA
mean ± SEM Overall p-
value
Plasma AUC (ng.ml-1 .min)
IMI 101 635 ± 18 370 88 002 ± 7876 81 041 ± 7350 0.500
DMI 11 137 ± 2393 46 050 ± 4984 *** 7990 ± 1 527 < 0.001***
Imipramine plasma PK
parameters
kel (min-1
x 10-3) 9.5 ± 1.1 7.9 ± 0.6 8.8 ± 0.7 0.426
t1/2 (min)
79.8 ± 12.3 90.2 ± 7.0 81.5 ± 6.0 0.681
Cl (ml.min-1)
15.43 ± 2.13 16.05 ± 1.55 17.69 ± 2.21 0.713
In vitro probe
recovery (%)
IMI 8.23 ± 0.80 8.91 ± 0.48 8.92 ± 0.66 0.703
DMI 8.62 ± 0.98 9.56 ± 0.68 9.18 ± 0.57 0.701
Dialysate AUC
(ng.ml-1 .min)
IMI 1322 ± 98 1802 ± 144* 2108 ± 169** 0.004**
DMI n/a1 158.4 ± 14 n/a1 n/a
Ratio of imipramine dialysate AUC: plasma
AUC 0.0149 ± 0.0024 0.0215 ± 0.0028
0.0274 ± 0.0038*
0.035*
AUC, area under the concentration curve; Cl, drug clearance from plasma; DMI, desipramine; IMI, imipramine kel, elimination rate constant; t1/2, half-life of drug in plasma. * p ≤ 0.05; ** p < 0.01; *** p < 0.001 (relative to IMI only group) n/a = not available 1 Below limit of quantification

Chapter 2: P-gp inhibition enhances imipramine BBB transport
125
2.3.2. Dialysate imipramine and desipramine pharmacokinetics
There was a significant overall group effect on dialysate imipramine concentrations
over time (F(2, 15) = 8.361, p < 0.01; Figure 2.3A), with significantly greater
dialysate imipramine concentrations observed in the IMI+CsA group than the IMI
only group between the second and fifth samples inclusive (Figure 2.3A). In
addition, there was a significant overall difference between the groups in terms of
dialysate imipramine AUC values (F(2, 15) = 7.533, p < 0.01; Table 2.1). The
increases in imipramine dialysate AUC values observed in the IMI+VERAP group
(36% increase; p = 0.05) and IMI+CsA group (59% increase; p < 0.01) relative to the
IMI only group were statistically significant. Desipramine levels in the dialysate
samples proved to be below the limit of quantification in the IMI only and IMI+CsA
groups. However, it was possible to quantify desipramine levels in the dialysate
from rats in the IMI+VERAP group (Figure 2.3B; Table 2.1), thus suggesting that the
levels were higher in this group although statistical analysis was precluded by the
lack of quantifiable samples from the other two groups.

Chapter 2: P-gp inhibition enhances imipramine BBB transport
126
Figure 2.3: Dialysate imipramine and desipramine profiles A. Imipramine concentrations in the dialysate samples as measured at different time intervals. Samples were continually collected and taken for analysis at 20 minute intervals. There was a significant overall group effect on dialysate imipramine concentrations over time (p < 0.05). Imipramine concentrations were significantly higher in the IMI+CsA group than the IMI only group between the second and fifth samples, inclusive (* p < 0.05; ** p < 0.01). B. Dialysate desipramine concentrations as measured at different time intervals. Note: Desipramine concentrations in dialysate samples from the IMI only and IMI+CsA groups were below the limit of quantification. The first 5 time-points shown represent mean values of 3-5 animals per time-point. At these early time-points, values for the excluded animal(s) were below the limit of quantification and were therefore omitted. Mean ± SEM; n = 6. Red square symbols with solid line represent IMI only group; green triangular symbols with dashed line represent IMI+VERAP group; blue diamond-shaped symbols with dotted line represent IMI+CsA group.

Chapter 2: P-gp inhibition enhances imipramine BBB transport
127
2.3.3. Comparison of dialysate:plasma imipramine AUC ratios
The dialysate:plasma imipramine AUC ratio gives an indication of BBB transport as it
accounts for any variations in plasma imipramine levels which might explain
observed differences in dialysate concentration. There was a significant overall
group effect on the ratio of dialysate:plasma imipramine AUC (F(2, 15) = 4.210, p <
0.05; Table 2.1). Post-hoc analysis revealed that the 84% increase observed in the
IMI+CsA group relative to IMI only group was statistically significant (p < 0.05),
while the 44% increase observed in the IMI+VERAP group relative to the IMI only
group was not statistically significant (Figure 2.4).
Figure 2.4: Comparison of dialysate:plasma imipramine AUC ratio Dialysate:plasma imipramine area under the curve (AUC) ratio for each group, normalised to IMI only group. There was a significant overall group effect (p < 0.05), with post-hoc analysis showing that the 84% increase evident in the IMI+CsA group is statistically significant (* p < 0.05). The 44% increase observed in the IMI+VERAP group did not reach statistical significance. Data are represented as mean ± SEM from 6 animals per group. Horizontally dotted red bar represents IMI only group; diagonally striped green bar represents IMI+VERAP group; black and blue checked bar represents IMI+CsA group.

Chapter 2: P-gp inhibition enhances imipramine BBB transport
128
2.4. Discussion
Despite some conflicting reports in the literature, much recent evidence highlights a
potential link between therapeutic response to antidepressants which have been
shown to be P-gp substrates and functional SNPs in the ABCB1 gene which encodes
P-gp in humans (Gex-Fabry et al., 2008; Kato et al., 2008; Nikisch et al., 2008; Uhr et
al., 2008; Sarginson et al., 2010; Lin et al., 2011). The present study demonstrates
that pre-treatment with either verapamil or CsA, both of which are well-established
P-gp inhibitors, significantly increases levels of the tricyclic antidepressant
imipramine in brain ECF without affecting imipramine levels in plasma. This offers
the intriguing possibility of adjunctive treatment with P-gp inhibitors to enhance
the BBB penetrating ability of certain antidepressant therapies, which may be
particularly relevant to TRD.
Furthermore, the potential to lower the dose of the antidepressant required to
achieve the same clinical effect when administered in combination with a P-gp
inhibitor may help to negate some of the problematic peripheral side-effects
associated with antidepressant therapy. Both verapamil and CsA are first
generation P-gp inhibitors with other pharmacological activities aside from P-gp
inhibition (Colabufo et al., 2010). Verapamil is primarily used as a calcium channel
blocker, while CsA is an immunosuppressive agent. Therefore, unwanted side-
effects associated with other pharmacological actions would likely preclude the
widespread use of these drugs to achieve adjunctive P-gp inhibition in the
management of depression. More specific second and third generation P-gp
inhibitors may represent viable alternatives due to reduced off-target effects.
However, it is important to be cautious when extrapolating results from preclinical
rodent studies to the clinical setting due to potential species differences in terms of
P-gp substrate specificity (Yamazaki et al., 2001; Baltes et al., 2007).
The P-gp-inhibition-mediated increases in brain antidepressant levels occurred
independently of any significant alteration in the plasma pharmacokinetics of
imipramine. Clinical investigations have demonstrated that co-administration of
verapamil increased imipramine bioavailability following oral administration in
Chapter 2: P-gp inhibition enhances imipramine BBB transport
129
healthy volunteers, and it was speculated that this effect was due to reduced oral
clearance of imipramine (Hermann et al., 1992). In the present study, pre-
treatment with verapamil did not alter the plasma clearance of imipramine (Table
2.1). We previously reported a significant, but small, increase in serum imipramine
concentration at a single (terminal) time-point following verapamil pre-treatment
(Clarke et al., 2009). This effect was not observed in the present study, possibly due
to the different routes of imipramine administration employed in the two studies
(i.p. previously versus i.v. in the present study) or the different methods of sampling
(trunk blood collection following decapitation previously versus sampling from
indwelling catheter in the present study).
The ratio of dialysate:plasma imipramine AUC for animals in the IMI+CsA group was
84% higher than for animals in the IMI only group. This observed difference was
statistically significant, which strongly suggests enhanced imipramine transport
across the BBB in CsA-treated animals. Although dialysate imipramine AUC was
significantly higher in the IMI+VERAP group than the IMI only group, the 44%
difference in the dialysate:plasma imipramine AUC ratio observed between these
groups did not reach statistical significance, likely due to the increased variability
observed when plasma concentrations were taken into account. As both CsA and
verapamil are well characterised as P-gp inhibitors (Baumert and Hilgeroth, 2009),
these data corroborate our previous findings (Clarke et al., 2009) and further
support the hypothesis that P-gp limits the ability of certain antidepressants,
including imipramine, to cross the BBB (O'Brien et al., 2012b). Moreover, it is worth
noting that the greater increase in brain imipramine levels observed in the CsA pre-
treated group compared with verapamil pre-treated animals is in agreement with
CsA being a more potent P-gp inhibitor than verapamil (Hsiao et al., 2008).
To our knowledge, the present study is the first to employ the microdialysis
technique to investigate the effect of P-gp inhibition on the ability of
antidepressants to cross the BBB and enter the brain. The microdialysis approach
offers several advantages over traditional methods which involve the analysis of
drug concentrations in brain homogenate samples (de Lange et al., 2000;

Chapter 2: P-gp inhibition enhances imipramine BBB transport
130
Hammarlund-Udenaes, 2010). Firstly, samples obtained using the microdialysis
technique only contain drug which has penetrated the BBB, whereas samples
obtained from brain homogenates are confounded by the presence of a network of
blood capillaries throughout the brain. Secondly, microdialysis measures only free
drug molecules in the brain ECF, whereas the traditional brain homogenate method
does not typically differentiate between pharmacologically inactive bound and
active unbound drug. Thirdly, using the microdialysis technique it is possible to
track fluctuations in brain drug concentrations in individual animals over time with
or without P-gp inhibition, thus providing temporal resolution which is not possible
with homogenate-based approaches. In addition, microdialysis enables us to
investigate the impact of P-gp inhibition on drug concentrations in a specific brain
region of interest, such as the PFC. While region-specific analysis can be carried out
using brain homogenate techniques (Clarke et al., 2009), previous studies have
almost exclusively focused on whole brain antidepressant drug concentrations
rather than investigating region-specific effects. This is a major limitation of such
studies considering that there are differences in P-gp expression and function
between different anatomical regions in the brain (Kwan et al., 2003; Clarke et al.,
2009). Therefore, the use of whole brain analysis previously may have obscured
important region-specific differences in drug concentrations.
When comparing dialysate concentrations which have not been corrected to
account for in vivo probe recovery in microdialysis studies investigating the impact
of P-gp efflux on the BBB transport of a drug, it is important to consider that
altering drug clearance by P-gp inhibition will likely have an impact on probe
recovery (Sawchuk and Elmquist, 2000). However, using mathematical modelling, it
has been predicted that in vivo probe recovery would be lower in situations where
efflux processes have been reduced, such as P-gp inhibition (Bungay et al., 1990).
Moreover, this has proven to be the case experimentally (de Lange et al., 1998; Xie
et al., 1999). Therefore, it is likely that if it were possible to correct our dialysate
concentrations for in vivo recovery, and thereby calculate actual brain ECF
imipramine concentrations, we would in fact see an even more exaggerated

Chapter 2: P-gp inhibition enhances imipramine BBB transport
131
increase in brain imipramine levels in the verapamil and CsA pre-treated animals
relative to the untreated controls.
Given the different methodology employed in the present study, it is difficult to
compare the magnitude of the increases in brain imipramine concentrations
reported here with those reported previously in other studies which have
investigated the impact of P-gp inhibition on the BBB transport of antidepressants.
Moreover, it will be of interest to assess how these findings will relate to human
patients treated chronically with antidepressants.
Interestingly, verapamil pre-treatment markedly enhanced the concentrations of
desipramine, an active metabolite of imipramine and an antidepressant in its own
right, in plasma. The mean AUC for desipramine in plasma in the IMI+VERAP group
was over 4-fold greater than the corresponding value in the IMI only group and
almost 6 times greater than the desipramine plasma AUC in the CsA pre-treated
group. We previously reported a 1.3-fold, non-significant increase in serum
desipramine levels in verapamil pre-treated rats relative to controls (Clarke et al.,
2009). The greater difference observed in the present study is likely due to
differences in the experimental protocol (i.e. dosing regimen and sampling
methods) as discussed previously. The mechanism underlying this verapamil-
mediated increase in plasma desipramine concentrations is unclear at present.
However, it seems unlikely that it is mediated by P-gp inhibition, as there was no
increase in plasma desipramine levels in CsA pre-treated animals. In addition to its
primary pharmacological role as a calcium channel antagonist and its ability to
inhibit P-gp, verapamil interacts with various other transporters, receptors and
metabolic enzymes (Auguet et al., 1986; Cole et al., 2000; Polasek et al., 2004;
Wang et al., 2004d). Moreover, verapamil has been shown to alter the
pharmacokinetics of several drugs (Backman et al., 1994; Kantola et al., 1998;
Fleishaker et al., 2000; Kovarik et al., 2005). Thus, it seems likely that the increase in
plasma desipramine levels might be mediated via one of these alternative
interactions rather than by inhibition of P-gp.

Chapter 2: P-gp inhibition enhances imipramine BBB transport
132
In particular, verapamil has been described as an inhibitor of cytochrome P450
enzymes (Wang et al., 2004d), and these enzymes play the predominant role in
imipramine and desipramine metabolism in humans (Lemoine et al., 1993). While
co-administration of verapamil did not alter imipramine plasma clearance (Table
2.1), one could speculate that the increase in plasma desipramine levels observed
in the IMI+VERAP group may be due to verapamil-mediated inhibition of
desipramine metabolism. In addition, it is worth noting that a functional
cytochrome P450 monooxygenase system exists in the brain (Ravindranath, 1998).
Therefore, putative inhibition of these enzymes by verapamil could impact on drug
levels in the brain.
The increased desipramine levels in plasma observed in the IMI+VERAP group were
reflected in the brain, where desipramine levels in microdialysis samples could only
be reliably quantified in animals pre-treated with verapamil, thus indicating higher
brain levels in these animals. Whether this increase in brain desipramine
concentrations plays a role in the putative therapeutic benefit of verapamil
augmentation in TRD, as anecdotally reported (Clarke et al., 2009), remains to be
clarified. However, it should be noted that a human study in healthy volunteers
found that verapamil co-administration had no effect on desipramine
concentrations in plasma following oral administration of imipramine (Hermann et
al., 1992). Therefore, the increase in desipramine levels following verapamil pre-
treatment in rats treated with i.v. imipramine observed here might not be relevant
in humans receiving oral imipramine treatment. As it was not possible to quantify
desipramine concentrations in dialysate samples from the IMI only or IMI+CsA
groups, it was not possible to determine whether pre-treatment with either P-gp
inhibitor had any impact on the BBB transport of desipramine.
In conclusion, the present study clearly demonstrates that pre-treatment with
either verapamil or CsA, both of which are P-gp inhibitors, results in increased brain
levels of the antidepressant imipramine in wild-type rats. This shows that P-gp
efflux limits the ability of imipramine to cross the BBB. These findings support the
increasing body of clinical evidence which indicates that P-gp mediated restriction

Chapter 2: P-gp inhibition enhances imipramine BBB transport
133
of the ability of certain antidepressants to reach their site of action within the brain
could potentially be a contributing factor to the high prevalence of TRD. In light of
these findings, it is tempting to speculate that adjunctive therapy with P-gp
inhibitors may offer clinical benefits in the treatment of depression.

134
Chapter 3:
Human P-glycoprotein Differentially
Affects Antidepressant Drug Transport:
Relevance to Blood-Brain Barrier Permeability
Fionn E. O’Brien1,2,3, Gerard Clarke1,4, Timothy G. Dinan1,4,
John F. Cryan1,3# and Brendan T. Griffin2,#
1 Alimentary Pharmabiotic Centre, University College Cork, Cork, Ireland
2 School of Pharmacy, University College Cork, Cork, Ireland
3 Department of Anatomy & Neuroscience, University College Cork, Cork, Ireland
4 Department of Psychiatry, University College Cork, Cork, Ireland
Published in:
The International Journal of Neuropsychopharmacology (2013) 16(10):2259-2272

Chapter 3: Antidepressant efflux by human P-gp
135
Abstract
The pharmacological concept that inhibition of the drug efflux pump P-glycoprotein
(P-gp) enhances brain distribution of the antidepressant imipramine in the rat has
recently been demonstrated. To determine if these findings are relevant to
humans, the present studies investigate if imipramine is a transported substrate of
human P-gp. Furthermore, additional experiments were carried out to determine if
findings in relation to imipramine and human P-gp would apply to other
antidepressants from a range of different classes. To this end, bidirectional
transport experiments were carried out in the ABCB1-transfected MDCKII-MDR1
cell line. Transported substrates of human P-gp are subjected to net efflux in this
system, exhibiting a transport ratio (TR) ≥ 1.5, and directional efflux is attenuated
by co-incubation of a P-gp inhibitor. Imipramine was identified as a transported
substrate of human P-gp (TR = 1.68, attenuated by P-gp inhibition). However, the
antidepressants amitriptyline, duloxetine, fluoxetine and mirtazapine were not
transported substrates of human P-gp (TR ≤ 1.16 in all cases). The present findings
offer insight into the role of P-gp in the distribution of antidepressants, revealing
that rodent findings pertaining to imipramine may translate to humans. Moreover,
the present results highlight that other antidepressants may not be transported
substrates of human P-gp.

Chapter 3: Antidepressant efflux by human P-gp
136
3.1. Introduction
Overcoming treatment resistant depression represents a major challenge in
psychiatry, with up to 50-60% of depressed patients not achieving adequate
response following antidepressant treatment (Fava, 2003). Increasing preclinical
evidence suggests that the multidrug resistance transporter P-glycoprotein (P-gp),
expressed at the blood-brain barrier (BBB), plays an important role in the brain
distribution of several, but not all, antidepressants (O'Brien et al., 2012b). These
findings may be of considerable clinical importance given that drug efflux by P-gp
can prevent therapeutic brain concentrations of centrally acting drugs from being
achieved, thereby resulting in treatment failure (Loscher and Potschka, 2005b).
Indeed, several gene association studies have recently reported links between
single nucleotide polymorphisms (SNPs) in ABCB1, the gene which encodes P-gp in
humans, and treatment response to certain antidepressants (Gex-Fabry et al., 2008;
Kato et al., 2008; Nikisch et al., 2008; Uhr et al., 2008; Sarginson et al., 2010; Lin et
al., 2011; Singh et al., 2012). These findings indicate that P-gp efflux at the BBB may
contribute to the high failure rate of treatment with these antidepressants by
preventing therapeutic brain levels from being achieved in some patients. However,
similar pharmacogenetic associations have not been observed for other
antidepressants (Roberts et al., 2002; Laika et al., 2006; Perlis et al., 2010),
indicating that P-gp efflux may not be clinically important for all antidepressant
drugs. It is therefore important to determine if individual antidepressants are
transported substrates of human P-gp to facilitate prediction of clinically relevant
interactions with P-gp at the BBB.
P-gp is a 170-kDa membrane-bound broad-spectrum unidirectional efflux pump,
also known as multidrug resistance protein 1 (MDR1). As a member of the
adenosine triphosphate binding-cassette (ABC) superfamily of efflux transporters,
P-gp uses ATP hydrolysis to power the active efflux of substrate molecules against a
concentration gradient (Figure 3.1A). Owing to the diverse composition of its
substrate-binding pocket, which contains distinct drug-binding sites consisting of
different individual residues, P-gp exhibits remarkably broad polyspecificity and is

Chapter 3: Antidepressant efflux by human P-gp
137
renowned for its substrate promiscuity (Aller et al., 2009). P-gp is expressed at
various sites in the body, including the apical membrane of the intestinal epithelial
cells, the biliary canalicular membrane of hepatocytes and the luminal membrane
of proximal tubular epithelial cells in the kidney (Marzolini et al., 2004). In addition,
P-gp is expressed at the luminal membrane of the endothelial cells in the cerebral
vasculature, where it acts as a “gatekeeper at the BBB” (Schinkel, 1999).
Despite the abundance of studies which have reported that P-gp restricts brain
concentrations of various structurally unrelated antidepressants from different
classes in rodents (Uhr et al., 2000; Uhr and Grauer, 2003; Uhr et al., 2003; Doran et
al., 2005; Ejsing and Linnet, 2005; Uhr et al., 2008; Clarke et al., 2009; Karlsson et
al., 2010; Bundgaard et al., 2012; O'Brien et al., 2012a; Karlsson et al., 2013; O'Brien
et al., 2013b), there has been a paucity of studies which have investigated whether
these antidepressants are also transported substrates of human P-gp. This is a
major concern in light of well-documented interspecies differences in terms of P-gp
substrate specificity and activity (Yamazaki et al., 2001; Katoh et al., 2006; Baltes et
al., 2007; Syvanen et al., 2009). Of the few in vitro studies which have investigated
interactions between human P-gp and antidepressants, many have used
approaches which offer little information regarding drug transport, such as the
ATPase assay, rather than adopting the gold-standard bidirectional transport
approach (Balimane et al., 2006; O'Brien et al., 2012b). Furthermore, some of the
bidirectional transport studies which have included antidepressants to date have
reported conflicting results, which may be explained by differences in
methodological approach and highlights well-documented problems associated
with inter-lab variability (Balimane et al., 2006; O'Brien et al., 2012b). Therefore, it
is imperative that additional research is carried out in this area to facilitate critical
evaluation of the role P-gp plays in antidepressant distribution in humans.
To this end, in vitro bidirectional transport studies were conducted in the ABCB1-
transfected MDCKII-MDR1 cell line (Figure 3.1B) to build on our recent rodent data
in relation to the tricyclic antidepressant imipramine (Clarke et al., 2009; O'Brien et
al., 2012a, Chapter 2) by ascertaining if it is also a transported substrate of human

Chapter 3: Antidepressant efflux by human P-gp
138
P-gp. Furthermore, we investigated if findings in relation to imipramine and human
P-gp would apply to other structurally distinct antidepressants.
Five antidepressants were included in the present study, with representatives from
each of the major antidepressant classes (Table 3.1). Despite their structural
differences and different classes, these drugs have broadly similar physicochemical
characteristics, with comparable molecular weights, lipophilicities and dissociation
constants (Table 3.1). However, the selected antidepressants differ in terms of
available information regarding their transport by P-gp from in vivo and in vitro
studies (Table 3.1). We aimed to determine if previous in vivo findings in rodents
would translate to studies involving human P-gp and to determine if previous in
vitro findings would be replicated for the selected antidepressants, thereby
enhancing our understanding of the role P-gp may play in the transport of these
antidepressant drugs across the BBB in humans.

139
Table 3.1: Antidepressants investigated in the present studies, including their structures, antidepressant classes, physicochemical properties and results from previous in vivo and in vitro P-gp studies
Drug name and structurea
Antidepressant Class
Physicochemical properties P-gp substrate? Refs
MW Log P pKa In vivo Human P-gp
Amitriptyline
TCA 277.4a 4.9a 9.4a Y? Y/N (Uhr et al., 2000; Mahar Doan et al.,
2002; Faassen et al., 2003; Grauer and Uhr, 2004; Uhr et al., 2007)
Duloxetine
SNRI 297.4a 4.0a 9.3b n/a n/a n/a
Fluoxetine
SSRI 309.3a 4.6a 8.7b Y/N N (Uhr et al., 2000; Mahar Doan et al., 2002; Doran et al., 2005; Feng et al.,
2008)

140
Drug name and structurea
Antidepressant Class
Physicochemical properties P-gp substrate? Refs
MW Log P pKa In vivo Human P-gp
Imipramine
TCA 280.4a 3.9a 9.4a Y Y/N (Mahar Doan et al., 2002; Faassen et al., 2003; Clarke et al., 2009; O'Brien
et al., 2012a)
Mirtazapine
NaSSA 265.4a 2.9a 7.7c N n/a (Uhr et al., 2003; Uhr et al., 2008)
Log P: partition co-efficient; MW: molecular weight; NaSSA: noradrenergic and specific serotonergic antidepressant; pKa: acid dissociation constant; SNRI: serotonin and noradrenaline reuptake inhibitor; SSRI = selective serotonin reuptake inhibitor; TCA = tricyclic antidepressant a www.drugbank.ca; b MSDS (ehs.lilly.com); c Remeron RDTM Monograph (www.remeronrd.ca)

Chapter 3: Antidepressant efflux by human P-gp
141
3.2. Methods
3.2.1. Drugs and chemicals
High performance liquid chromatography (HPLC) grade acetonitrile, potassium
dihydrogen phosphate and orthophosphoric acid (OPA) were obtained from Fisher
Scientific (Ireland). Mirtazapine, duloxetine hydrochloride and fluoxetine
hydrochloride were purchased from Discovery Fine Chemicals (Dorset, UK).
Verapamil hydrochloride, imipramine hydrochloride and amitriptyline
hydrochloride were obtained from Sigma-Aldrich (Ireland), as were all other
chemicals and materials unless otherwise stated.
3.2.2. Cell-lines and materials
MDCKII-WT and MDCKII-MDR1 cells were obtained from the Piet Borst Laboratory
(Netherlands Cancer Institute, Amsterdam, The Netherlands). Transport
experiments were carried out using Costar 3414 Polycarbonate Membrane
Transwell® Inserts (24 mm diameter, 3 µm pore size).
3.2.3. Cell culture
Cells were grown in 75 cm2 culture flasks using Dulbecco's Modified Eagle's
Medium, supplemented with 10% fetal bovine serum and 1% Penicillin-
Streptomycin. Cells were split twice weekly at a dilution of 1:12, and incubated at
37°C in a humidified 5% CO2 and 95% air atmosphere.
3.2.4. Western blot analysis
Expression of P-gp was confirmed by western blot analysis once a month (Figure
3.1C). The western blot procedure was performed as described previously (Gosselin
et al., 2010). MDCKII-MDR1 and MDCKII-WT monolayers were grown as per
transport experiments. Cells were washed with ice-cold phosphate-buffered saline,
then lysed in lysis buffer (HEPES 20 mM; Np-40 (1%); DTT 0.5 mM; Na3VO4 0.1 mM;
PMSF 0.1 mM; aprotinin 2 µg/ml; leupeptin 2 µg/ml; NaF 0.02 mM) for 15 min at
4°C. Cell lysate was centrifuged at 4°C for 10 min at 10 000 rpm. The supernatant
was stored at -80°C for later analysis. Five micrograms of cell protein were loaded in

Chapter 3: Antidepressant efflux by human P-gp
142
10-12% SDS-PAGE gel and run at 60-100 V for 120 min. After transfer onto a 0.2-µm
nitrocellulose membrane and blocking with 5% skimmed milk and 0.1% Tween 20 in
PBS, blots were probed overnight at 4°C with the C219 primary monoclonal P-gp
antibody (1:100 dilution in 2% skimmed milk) (Enzo Life Sciences (UK) Ltd, Exeter,
UK). Reprobing was conducted for 1 h at room temperature using a goat anti-
mouse IgG-HRP conjugate, diluted 1:2000 (Jackson Immunoresearch Europe Ltd).
Images were obtained using a luminescent image analyzer (LAS-3000; Fujifilm,
Ireland). For the detection of β-actin, the membranes were incubated with
Monoclonal Anti-β-Actin−Peroxidase antibody produced in mouse (1:15000).
Immunoblots were quantified using ImageJ software.

Chapter 3: Antidepressant efflux by human P-gp
143
Figure 3.1: A Mechanism of efflux by P-gp. P-gp substrates enter the P-gp substrate-binding pocket (SBP) via portals which are open to the cytoplasm and inner leaflet of the lipid bilayer. Binding of ATP to the nucleotide-binding domain (NBD), stimulated by interactions between the substrate and residues in the SBP, results in dimerization of the NBDs. This triggers a conformational change which sterically occludes transport of the substrate into the cytoplasm or the inner leaflet of the bilayer. Hence, when the substrate is released, it partitions into the outer leaflet of the bilayer or to the extracellular space, thereby preventing transport of the substrate across the lipid bilayer (Aller et al., 2009). B Schematic representation of the in vitro bidirectional transport model. A monolayer of MDCKII-MDR1 cells, cultured on a semi-permeable membrane at the base of a transwell insert, separates distinct apical and basolateral chambers. As human P-gp is expressed on the apical membrane of MDCKII-MDR1 cells only, it restricts the transport of P-gp substrates in the apical-to-basolateral (A→B) direction, but not in the basolateral-to-apical (B→A) direction. Therefore, transported substrates of human P-gp will exhibit lower permeability in the A→B than B→A direction, while non-substrates will have similar permeabilities in both directions. C Representative image of western blot, confirming greater expression of P-gp in MDCKII-MDR1 cells than MDCKII-WT cells.

Chapter 3: Antidepressant efflux by human P-gp
144
3.2.5. Transport experiments
The MDCKII-MDR1 cell line is stably transfected with ABCB1 and expresses human
P-gp on the apical membrane in a polarised fashion when cultured on an
appropriate transwell support (Pastan et al., 1988). Therefore, transported
substrates of human P-gp will have lower permeability in the apical-to-basolateral
(A→B) direction than in the basolateral-to-apical direction (B→A), due to the effect
of P-gp efflux at the apical membrane, exhibiting a (B→A)/(A→B) transport ratio
(TR) ≥ 2, while a TR between 1.5 and 2 is inconclusive (Polli et al., 2001; Zhang et al.,
2006). As the MDCKII-MDR1 cell line also expresses endogenous canine kidney
transporters, the TR in MDCKII-MDR1 cells can be compared to the TR in wild-type
MDCKII-WT cells to yield a corrected transport ratio (cTR), which in theory isolates
the effect of human P-gp. A cTR value of ≥ 1.5 indicates the test compound may be
a transported substrate of human P-gp (Schwab et al., 2003). However, transfection
with ABCB1 may alter the expression of endogenous transporters (Kuteykin-
Teplyakov et al., 2010). Therefore it is important to repeat transport experiments
with inhibition of P-gp to confirm that P-gp is responsible for net efflux in MDCKII-
MDR1 cells. In the present studies, where initial transport experiments indicated an
antidepressant may be a transported P-gp substrate, experiments were repeated
with co-incubation of the P-gp inhibitors verapamil (200 µM) and CsA (25 µM) as
previously described (Tang et al., 2002; Taub et al., 2005). For transport
experiments, cells (passage number: 8-30) were seeded at a density of 2x10⁶ cells
per well. Cells were allowed to grow to confluency over 4 days with 1.5 ml of
medium in the apical compartment and 2.6 ml of medium in the basolateral
compartment. The medium was changed daily and trans-epithelial electrical
resistance (TEER) measurements were taken each day using an Endohm meter
(World Precision Instruments, Sarasota, FL) to monitor the development and
integrity of the cell monolayer. On the days of experiments, the mean (± SD) TEER
value for MDCKII-WT cells was 194 (± 43) .cm2 and for MDCKII-MDR1 cells was
387 (± 36) .cm2. Fresh cell culture medium was added two hours before the
transport experiment. One hour later, cell culture medium was removed and
monolayers were rinsed twice with transport buffer (Hank’s Balanced Salt Solution

Chapter 3: Antidepressant efflux by human P-gp
145
[HBSS] with 10mM HEPES). All transport experiments were carried out
independently in three different transwells (n = 3). Transport experiments were
conducted by adding the test drug (freshly prepared in transport buffer) to the
donor chamber and measuring the appearance of drug at 30 minute intervals in the
receiver chamber over a two hour incubation period at 37°C. Apical and basolateral
chamber volumes were maintained at 1.5 and 2.6 ml, respectively, throughout the
transport experiment by replacing the volume (100 µl) removed from the receiver
chamber at each sampling point with an equal volume of blank transport buffer. In
addition, a 100 µl sample was taken from the donor chamber at the beginning of
the experiment, to confirm the initial donor concentration (C0), and at the end of
the experiment, to facilitate mass balance calculations. For apical-to-basolateral
(A→B) transport, the apical chamber is the donor chamber and the basolateral
chamber is the receiver chamber. Conversely, for basolateral-to-apical (B→A)
transport, the basolateral chamber is the donor chamber and the apical chamber is
the receiver chamber. For P-gp inhibition studies, the MDCKII-MDR1 cells were pre-
incubated with the P-gp inhibitor on both sides of the monolayer for 30 min before
addition of the antidepressant, and transport experiments were carried out in the
presence of the P-gp inhibitor in both chambers throughout the experiment. Fresh
transport buffer containing the appropriate P-gp inhibitor was replaced in the
receiver side after sampling.
3.2.6. Transport experiment calculations
The apparent permeability coefficient (Papp; unit: cm.s-1) of antidepressant in each
individual well was calculated using equation (3.1) (Youdim et al., 2003).
Importantly, this equation accounts for cellular retention of the test compound,
which may influence the results obtained from in vitro transport studies and
therefore needs to be taken into consideration.
(3.1)
where, VD = donor chamber volume (cm3), A = surface area of the cell monolayer
(4.67 cm2), MD = initial amount of drug in the donor chamber (mol), Mcells = amount

Chapter 3: Antidepressant efflux by human P-gp
146
of drug retained by the membrane/cells (mol) and
= change in the amount of
drug in the receiver chamber over time (mol.s-1).
The transport ratio (TR), which compares drug permeability in the B→A direction to
drug permeability in the A→B direction, was calculated using equation (3.2). A TR
greater than 1 indicates that net efflux of the drug is occurring. A TR value of ≥ 2
indicates that the test compound is a transported P-gp substrate, while a TR
between 1.5 and 2 is inconclusive (Polli et al., 2001; Zhang et al., 2006).
(3.2)
The corrected transport ratio (cTR), calculated using equation (3.3), takes the
effects of endogenous transporters on drug transport across MDCK cells into
account. Hence, in theory, the effect of human P-gp is evaluated specifically.
However, transfection with ABCB1 may alter the expression of endogenous
transporters (Kuteykin-Teplyakov et al., 2010). Therefore, a cTR value of ≥ 1.5, in
conjunction with a reduction in TR in MDCKII-MDR1 cells on co-incubation of a P-gp
inhibitor, is required for confirmation that the test compound is a transported P-gp
substrate (Polli et al., 2001; Schwab et al., 2003).
(3.3)
3.2.7. Analytical procedures
Samples were analysed by HPLC on a system consisting of a Shimadzu LC-20AD XR
Prominence Pump, CBM-20A communication bus module, SIL-20AC XR Prominence
Autosampler, CTO-20A Prominence Column oven, SPD-10A UV detector and RF-10A
XL fluorescence detector (all supplied by Mason Technology, Cork, Ireland) or ESA
Coulochem III with 5041 Amperometric Cell electrochemical detector (supplied by
ESA Analytical, Ltd., Aylesbury, Bucks, England). All samples were injected onto a
reversed phase Luna 3 µm C18 (2) 150 x 2 mm column (Phenomenex), which was
protected by Krudkatcher Ultra in-line filters (Phenomenex).

Chapter 3: Antidepressant efflux by human P-gp
147
The HPLC methods were adapted from previously described methods (Frahnert et
al., 2003; Rao et al., 2011; O'Brien et al., 2012a). Briefly, the mobile phase which
was used on the HPLC system consisted of a mixture of 25 mM potassium
dihydrogen phosphate (25 mM, pH 7 with 4N NaOH) and HPLC grade acetonitrile
(56:44). Mobile phase was filtered through Millipore 0.22 µm Durapore filters
(Millipore, Ireland) and vacuum degassed prior to use. Samples in transport buffer
were diluted 50:50 with mobile phase prior to injection. Compounds were eluted
individually using an isocratic method over a 15 min runtime at a flow rate of 0.4
ml.min-1 after 20-40 µl injections. The column was maintained at a temperature of
30oC and samples/standards were kept at 8oC in the cooled autoinjector prior to
analysis. The detector used and detection conditions for each antidepressant are
listed in Table 3.2, along with limits of detection (LOD) and limits of quantification
(LOQ) for each drug.

Chapter 3: Antidepressant efflux by human P-gp
148
Table 3.2: HPLC detection conditions and limits of quantification/detection for each of the five antidepressants
Drug Method of detection
Detection conditions
Injection volume (µl) LOD (nM) LOQ (nM)
Amitriptyline UV 230 nm 40 6.6 32.9
Duloxetine UV 230 nm 40 3.2 15.9
Fluoxetine UV 230 nm 40 4.7 23.3
Imipramine ECD Potential: 600 mV; Range: 50
nA 20 0.4 1.9
Mirtazapine FLD
Excitation: 290 nm;
Emission: 370 nm
20 35.4 177.7
C0 = initial concentration in the donor chamber; ECD: electrochemical detection; FLD: fluorescent detection; LOD: limit of detection; LOQ: limit of quantification; UV: ultraviolet detection

Chapter 3: Antidepressant efflux by human P-gp
149
3.3. Results
3.3.1. Imipramine is a transported substrate of human P-gp in
vitro
Initial experiments, carried out at 5 µM donor concentration, indicated that
imipramine may have been a transported substrate of human P-gp. Imipramine
permeability was greater in the B→A than A→B direction in MDCKII-MDR1 cells (TR
= 1.35; Table 3.3; Figure 3.2), while there was no net efflux in MDCKII-WT cells (TR =
0.90; Table 3.3; Figure 3.2). These results yielded a cTR of 1.51, which is in excess of
the cut-off for identification of a potential P-gp substrate (Figure 3.2). However, the
results were not conclusive as the TR in MDCKII-MDR1 cells was below 1.5.
Therefore, additional transport experiments were undertaken at a lower donor
concentration (1 µM) of imipramine to further investigate its potential efflux by
human P-gp. At 1µM donor concentration of imipramine, a greater net efflux effect
was observed in MDCKII-MDR1 cells (TR = 1.63; Table 3.3; Figure 3.2), while there
remained no difference between imipramine permeability across monolayers of
MDCKII-WT cells in the A→B and B→A directions (TR = 0.97; Table 3.3; Figure 3.3),
resulting in a cTR of 1.68 (Figure 3.3).
As the TR in MDCKII-MDR1 cells was above 1.5 and the cTR indicated that P-gp
efflux of imipramine was taking place, transport experiments were repeated in the
presence of the P-gp inhibitors verapamil (200 µM) or CsA (25 µM). Co-incubation
with verapamil attenuated the directional efflux effect, reducing the TR in MDCKII-
MDR1 cells to 1.11 (Table 3.3; Figure 3.3). Similarly, co-incubation with CsA
attenuated the directional efflux effect, reducing the TR in MDCKII-MDR1 cells to
1.05 (Table 3.3; Figure 3.3). Taken together, these results indicate that imipramine
is a transported substrate of human P-gp.

Chapter 3: Antidepressant efflux by human P-gp
150
3.3.2. Human P-gp had no effect on the permeability of
amitriptyline, duloxetine, fluoxetine or mirtazapine in
vitro
3.3.2.1. Amitriptyline
The permeability of amitriptyline was equivalent in A→B and B→A directions in
both MDCKII-WT (TR = 0.97) and MDCKII-MDR1 cells (TR = 0.87; Table 3.3; Figure
3.2), thus yielding a cTR of 0.90 (Figure 3.2). These results indicate that human P-gp
had no impact on amitriptyline transport in this model.
3.3.2.2. Duloxetine
The permeability of duloxetine was equivalent in both directions in MDCKII-WT cells
(TR = 0.93; Table 3.3; Figure 3.2). However, in MDCKII-MDR1 cells, the permeability
of duloxetine was greater in the A→B direction than in the B→A direction (TR =
0.72; Table 3.3; Figure 3.2), resulting in a cTR of 0.78 (Figure 3.2). These results
indicate that human P-gp had no impact on duloxetine transport in this model, but
may be subject to uptake processes in MDCKII-MDR1 cells.
3.3.2.3. Fluoxetine
The permeability of fluoxetine across both MDCKII-WT (TR = 0.80) and MDCKII-
MDR1 (TR = 0.63) cells was greater in the A→B direction than in the B→A direction
(Table 3.3; Figure 3.2), respectively, resulting in a cTR of 0.78 (Figure 3.2). These
results indicate that fluoxetine is not a transported substrate of human P-gp in this
model, but may be subject to uptake processes by endogenous canine kidney
transporters in both MDCKII-WT and MDCKII-MDR1 cells.
3.3.2.4. Mirtazapine
The permeability of mirtazapine was marginally greater in the B→A than A→B
direction in both MDCKII-WT and MDCKII-MDR1 cells. However, the TRs were
equivalently low in both cases (1.12 and 1.16, respectively; Table 3.3; Figure 3.2),
yielding a cTR of 1.04 (Figure 3.2). These results indicate that mirtazapine is not a
transported substrate of human P-gp in this model.

Chapter 3: Antidepressant efflux by human P-gp
151
Table 3.3: Permeability values calculated for each antidepressant drug from in vitro bidirectional transport studies
Drug Donor
concentration Cell type
P-gp
inhibitor
Papp A→B
(cm.s-1 x
10-5)
Papp B→A
(cm.s-1 x
10-5)
Amitriptyline 5 µM MDCKII-WT - 2.47 ± 0.09 2.40 ± 0.04
MDCKII-MDR1 - 2.10 ± 0.33 1.83 ± 0.18
Duloxetine 5 µM MDCKII-WT - 2.18 ± 0.14 2.02 ± 0.08
MDCKII-MDR1 - 1.48 ± 0.17 1.07 ± 0.10
Fluoxetine 5 µM MDCKII-WT - 2.32 ± 0.16 1.87 ± 0.19
MDCKII-MDR1 - 1.91 ± 0.12 1.20 ± 0.07
Imipramine
5 µM MDCKII-WT - 1.94 ± 0.22 1.74 ± 0.26
MDCKII-MDR1 - 1.56 ± 0.11 2.11 ± 0.19
1 µM
MDCKII-WT - 2.04 ± 0.00 1.98 ± 0.40
MDCKII-MDR1 - 1.40 ± 0.21 2.28 ± 0.07
MDCKII-MDR1 Verapamil 1.48 ± 0.12 1.65 ± 0.10
MDCKII-MDR1 CsA 1.62 ± 0.03 1.70 ± 0.14
Mirtazapine 5 µM MDCKII-WT - 2.05 ± 0.11 2.29 ± 0.08
MDCKII-MDR1 - 1.96 ± 0.05 2.29 ± 0.01
Papp: apparent permeability (n = 3; mean ± SD); TR: transport ratio; cTR: corrected transport
ratio

Chapter 3: Antidepressant efflux by human P-gp
152
Figure 3.2: Transport ratios (TR) in MDCKII-WT (white bars) and MDCKII-MDR1 cells (black bars), as well as corrected transport ratio (cTR) values (black bars with white diagonal stripes), for each drug at 5 µM donor concentration (mean ± SD; n = 3). Imipramine was the only drug to exhibit net efflux in MDCKII-MDR1 cells (TR = 1.35 and cTR = 1.51), indicating that it may be a transported substrate of human P-gp.

Chapter 3: Antidepressant efflux by human P-gp
153
Figure 3.3: Transport ratios (TR) in MDCKII-WT (white bar) and MDCKII-MDR1 cells (black bar), as well as the corrected transport ratio (cTR) value (black bar with white diagonal stripes), for imipramine at 1 µM donor concentration (mean ± SD; n = 3). Imipramine exhibited net efflux in MDCKII-MDR1 cells (TR = 1.63 and cTR = 1.68). Transport experiments were repeated in the presence of the P-gp inhibitors verapamil (grey bar with horizontal black lines) or CsA (grey bar with black squares) to determine if P-gp efflux was responsible for its elevated TR. a A compound with a TR of 1.5–2.0 is classified as a P-gp substrate if the directional efflux is attenuated by the presence of a P-gp inhibitor (Polli et al., 2001) b Above pre-defined cTR threshold for identification of a P-gp substrate (Schwab et al., 2003) c Directional efflux is attenuated by the presence of a P-gp inhibitor

Chapter 3: Antidepressant efflux by human P-gp
154
3.4. Discussion
Rodent studies have recently demonstrated that brain levels of the tricyclic
antidepressant (TCA) imipramine can be augmented in rats by pre-treatment with a
P-gp inhibitor (Clarke et al., 2009; O'Brien et al., 2012a, Chapter 2). The present
study using the MDCKII-MDR1 cell-line has revealed that imipramine is also a
transported substrate of human P-gp. Taken together, these findings indicate that
P-gp may restrict imipramine transport across the BBB in humans. In addition, the
present findings serve to clarify conflicting evidence from previous studies as to
whether imipramine is a transported substrate of human P-gp (Mahar Doan et al.,
2002; Faassen et al., 2003).
Regarding the previous studies, a TR of 6.04 has been reported for imipramine in
transport experiments in the Caco-2 cell line, indicating that active efflux processes
were limiting imipramine transport in the A→B direction (Faassen et al., 2003).
However, no further experiments to elucidate the transporter(s) responsible for
this effect were reported, which is vital as the Caco-2 cell line expresses a wide
variety of transporters in addition to P-gp (Taipalensuu et al., 2001). In contrast, a
TR of 1.05 was previously reported for imipramine in the MDCKII-MDR1 cell-line
(Mahar Doan et al., 2002). The discrepancy with present findings may be related to
differences in the methodological approaches between the two studies. For
example, the use of an appropriate donor concentration is a key factor in obtaining
accurate results using in vitro bidirectional transport studies. At higher donor
concentrations, P-gp may become saturated, leading to functional knockout of P-gp
activity (Balimane et al., 2006). This may result in false negative findings, even for
well-known P-gp substrates (Balimane et al., 2006). To avoid this pitfall, it has been
recommended that donor concentrations of 5 µM or less should be used where the
sensitivity of the analytical assay permits (Balimane et al., 2006). Whereas the
previous work of Mahar Doan and colleagues consisted of experiments involving a
10 µM donor concentration of imipramine, two different lower concentrations of
imipramine were used in the present study (5 µM and 1 µM). At 5 µM donor
concentration we observed a trend towards P-gp efflux for imipramine, leading us

Chapter 3: Antidepressant efflux by human P-gp
155
to carry out further experiments at 1 µM. At this lower donor concentration of
imipramine (1 µM = 280 ng.ml-1), which reflects therapeutic plasma levels (175-350
ng.ml-1) (Perry et al., 1994), a clear P-gp efflux effect was observed. In addition, the
previous transport experiment was conducted over a shorter timeframe, with
permeability calculations based on samples taken a single time-point at one hour
(Mahar Doan et al., 2002), whereas the present study involved samples taken at
several time-points over two hours. It is also important to note that monolayer
TEER values were not reported in the previous paper (Mahar Doan et al., 2002). As
a result, it is not possible to compare the confluencies of the monolayers between
the earlier work and our present studies.
In contrast to imipramine (TR = 1.35 in MDCKII-MDR1 cells and cTR = 1.51 at 5 µM
donor concentration), there was no indication that any of the other antidepressants
included in the present study may be subjected to efflux by human P-gp when
tested at a 5 µM donor concentration (TR ≤ 1.16 in MDCKII-MDR1 cells and cTR ≤
1.04 in each case). These results suggest that none of these antidepressant drugs
are meaningfully transported substrates of human P-gp. Therefore, further
transport experiments using additional donor concentrations for each of these
antidepressants were not carried out.
The observation that amitriptyline, another TCA which is structurally very similar to
imipramine (Table 3.1), was not a transported substrate of human P-gp in our in
vitro bidirectional transport model reveals that findings in relation to imipramine do
not generalize to other antidepressants, even those from the same class with very
similar molecular structures. This emphasizes the need to experimentally determine
interactions between P-gp and drugs, as attempts at prediction based on structural
and physicochemical properties alone can be fraught with difficulties. Historically,
efforts to develop quantitative structure-activity relationships for P-gp substrates
have been challenging (Sharom, 2008). However, recent developments, involving
larger datasets and taking a complex range of parameters into consideration, have
yielded more promising results, and may prove to be useful screening tools in the
early stages of drug development (Desai et al., 2013). The number of hydrogen

Chapter 3: Antidepressant efflux by human P-gp
156
bond acceptors (HBAs) in a molecule has been identified as one of the key
properties involved, with an increased number of HBAs associated with a higher
likelihood of being a P-gp substrate (Desai et al., 2013). Therefore, it is plausible
that the additional HBA provided by the nitrogen atom in the middle ring of the
imipramine structure, as opposed to the carbon atom in the analogous position of
the amitriptyline structure (Table 3.1), may explain why imipramine was found to
be a transported substrate of human P-gp in the present studies, but amitriptyline
was not.
The existing rodent data in relation to the influence of P-gp on amitriptyline brain
distribution is inconclusive. While it seems that P-gp does limit brain levels of
amitriptyline in mice (Uhr et al., 2000), this effect appears to be transient and
dependent on the dosing regimen used (Grauer and Uhr, 2004; Uhr et al., 2007).
Furthermore, previous in vitro transport investigations pertaining to the efflux of
amitriptyline by human P-gp have yielded antithetical findings. In common with
imipramine, it has been reported that amitriptyline may be a transported substrate
of human P-gp in Caco-2 cells (TR = 4.51) (Faassen et al., 2003), while others
concluded that it was not following transport experiments in MDCKII-MDR1 cells
(TR = 1.34) (Mahar Doan et al., 2002). Therefore, the present finding that
amitriptyline was not a transported substrate of human P-gp helps to bring clarity
to the role of P-gp in amitriptyline distribution.
In common with several other antidepressant drugs, most notably paroxetine and
sertraline (Weiss et al., 2003), the serotonin and noradrenaline reuptake inhibitor
(SNRI) duloxetine has been reported to be an inhibitor of P-gp (Ruike et al., 2010).
However, to our knowledge, there has been no study to date, either in vivo or in
vitro, which has investigated if duloxetine is subject to P-gp efflux. Therefore, the
finding that human P-gp had no effect on duloxetine permeability in our in vitro
model offers novel insight into the interaction between duloxetine and P-gp. This
finding is particularly important given duloxetine’s increasing clinical importance
and its role in a wide range of indications in addition to depression. Interestingly, in
vivo studies found that P-gp limits brain levels of another SNRI, venlafaxine (Doran

Chapter 3: Antidepressant efflux by human P-gp
157
et al., 2005; Karlsson et al., 2010). However, in common with duloxetine,
venlafaxine was not a transported substrate of human P-gp in vitro (Feng et al.,
2008). This highlights potential species differences and again underlines the
importance of analysis involving human P-gp such as that reported in the present
study.
There are directly conflicting reports in the literature pertaining to the role of P-gp
in the transport of the selective serotonin reuptake inhibitor (SSRI) fluoxetine
across the BBB in mice (Uhr et al., 2000; Doran et al., 2005). This discrepancy may
be attributable to differences between single P-gp knockout strains [e.g. abcb1a(-/-)]
and double P-gp knockout strains [i.e. abcb1ab(-/-)), as recently highlighted in
relation to the brain accumulation of glucocorticoids (Mason et al., 2012). However,
two in vitro transport studies have concurred, reporting that fluoxetine was not a
transported substrate of human P-gp in MDCKII-MDR1 cells (Mahar Doan et al.,
2002; Feng et al., 2008). The present study corroborates these earlier in vitro
transport studies, indicating that P-gp is unlikely to influence the brain distribution
of fluoxetine in patients.
The present finding that mirtazapine was not a transported substrate of human P-
gp in our in vitro model correlates well with in vivo studies, in which there was no
difference in brain levels of mirtazapine between wild-type and P-gp knockout mice
(Uhr et al., 2003; Uhr et al., 2008). While several studies have highlighted potential
pharmacogenetic interactions between single nucleotide polymorphisms (SNPs) in
ABCB1 and response to antidepressant treatment (Gex-Fabry et al., 2008; Kato et
al., 2008; Nikisch et al., 2008; Lin et al., 2011; Singh et al., 2012), there has been
little consistency regarding the involvement of particular SNPs. Moreover, attempts
to replicate some of these positive studies have failed (Mihaljevic Peles et al., 2008;
Peters et al., 2008). In addition, no similar pharmacogenetic association has been
found for other antidepressants (Roberts et al., 2002; Laika et al., 2006; Perlis et al.,
2010). The often contradictory literature surrounding the role of genetic variations
of ABCB1 in antidepressant response is complicated by several factors, including the
lack of clarity regarding the P-gp substrate status of the antidepressants involved in

Chapter 3: Antidepressant efflux by human P-gp
158
many of the studies. In two recent investigations, the antidepressants involved
were categorised as P-gp substrates or non-substrates (Uhr et al., 2008; Sarginson
et al., 2010). These studies reported significant associations between one particular
SNP (rs2032583) and response to treatment with antidepressants that were P-gp
substrates, while there was no such association for non-substrates of P-gp (Uhr et
al., 2008; Sarginson et al., 2010). Based on findings from experiments involving P-gp
knockout mice (Uhr et al., 2003; Uhr et al., 2008), mirtazapine was used as the non-
P-gp-substrate control in these studies. However, to our knowledge, there were no
data pertaining to human P-gp available for mirtazapine prior to the present study.
In light of well-documented species differences in P-gp activity and substrate
specificity (Yamazaki et al., 2001; Katoh et al., 2006; Baltes et al., 2007; Syvanen et
al., 2009), it was vital that further experiments to confirm that mirtazapine is not a
transported substrate of human P-gp were conducted to facilitate informed
interpretation of these clinical studies. In addition, the finding that amitriptyline,
duloxetine and fluoxetine were not transported substrates of human P-gp in our in
vitro bidirectional transport model may help to explain why no association was
found between ABCB1 SNPs and response to these antidepressants in previous
clinical studies (Roberts et al., 2002; Laika et al., 2006; Perlis et al., 2010). In
contrast, two studies have reported pharmacogenetic associations between ABCB1
SNPs and response to the SSRI escitalopram (Lin et al., 2011; Singh et al., 2012), and
we have recently identified escitalopram as a transported substrate of human P-gp
in the same in vitro model as used in the present study (O'Brien et al., 2013b,
Chapter 4). Moreover, we also demonstrated that inhibition of P-gp enhances the
brain distribution and antidepressant-like activity of escitalopram in rodents
(O'Brien et al., 2013b, Chapter 4). Taken together, these data indicate that the P-gp
inhibition strategy may represent a novel approach to augment escitalopram
treatment clinically. In light of the present results, it is tempting to speculate that
the same might apply to imipramine. However, further preclinical and clinical
studies are required to evaluate the safety and efficacy of this potential strategy.
In vitro bidirectional transport studies represent the gold standard approach for the
identification of transported substrates of human P-gp (Balimane et al., 2006).

Chapter 3: Antidepressant efflux by human P-gp
159
Nonetheless, this approach has its limitations, and it is necessary to be cognisant of
these when interpreting results from such studies. In particular, the present studies
involve canine kidney MDCKII cells transfected with human P-gp. The morphological
properties of this epithelial cell line differ from those of the endothelial cell-type
found at the BBB (Hellinger et al., 2012). Therefore, the present approach does not
represent a model of P-gp interactions at the BBB per se. Despite this limitation,
bidirectional transport experiments using MDCKII-MDR1 cells have been reported
to be more effective than an in vitro BBB model for the identification of P-gp
substrates (Hellinger et al., 2012). In addition, in vitro bidirectional transport studies
are often subject to inter-lab variability, as differences in methodological approach
may influence the results obtained (Balimane et al., 2006). Therefore, independent
replication of findings is crucial before definitive conclusions can be safely drawn
regarding the transport of drugs by human P-gp, in particular where in vitro results
contradict in vivo findings. In this context, the present study offers value as it
corroborates previous in vitro reports in relation to fluoxetine and helps to bring
clarity to conflicting evidence from previous in vitro studies involving imipramine
and amitriptyline. To further confirm the present findings, additional studies may
now be warranted. In particular, studies utilising the concentration equilibrium
transport assay approach, recently described in relation to anti-epileptic drugs
(Luna-Tortos et al., 2008; Zhang et al., 2010), would be of interest.
In conclusion, the present in vitro bidirectional transport studies offer valuable
insights into the role of P-gp in the distribution of antidepressants in humans. The
results indicate that findings from previous in vivo studies demonstrating that the
brain distribution of imipramine can be augmented by co-administration of a P-gp
inhibitor in rats (Clarke et al., 2009; O'Brien et al., 2012a, Chapter 2) may translate
to humans. Moreover, the present findings emphasize that results relating to
imipramine and P-gp cannot be readily generalized to other antidepressants, even
ones from the same class with similar structure. In addition, the present study
highlights that results from studies using P-gp knockout mice may not translate to
studies involving human P-gp. It is therefore important to screen individual
compounds, using appropriate experimental approaches, in order to evaluate

Chapter 3: Antidepressant efflux by human P-gp
160
interactions with human P-gp. Finally, results from the present studies may help to
facilitate informed interpretation of previous clinical studies which have
investigated links between SNPs in ABCB1 and therapeutic response to different
antidepressants.

161
Chapter 4:
P-glycoprotein Inhibition Increases the Brain
Distribution and Antidepressant-like Activity of
Escitalopram in Rodents
Fionn E. O’Brien1,2,3, Richard M. O’Connor3, Gerard Clarke1,4, Timothy G. Dinan1,4,
Brendan T. Griffin2 and John F. Cryan1,3,#
1 Alimentary Pharmabiotic Centre, University College Cork, Cork, Ireland
2 School of Pharmacy, University College Cork, Cork, Ireland
3 Department of Anatomy & Neuroscience, University College Cork, Cork, Ireland
4 Department of Psychiatry, University College Cork, Cork, Ireland
Published in: Neuropsychopharmacology (2013) 38(11):2209-19

Chapter 4: Escitalopram and P-gp
162
Abstract
Despite the clinical prevalence of the antidepressant escitalopram, over 30% of
escitalopram-treated patients fail to respond to treatment. Recent gene association
studies have highlighted a potential link between the drug efflux transporter P-
glycoprotein (P-gp) and response to escitalopram. The present studies investigated
pharmacokinetic and pharmacodynamic interactions between P-gp and
escitalopram. In vitro bidirectional transport studies revealed that escitalopram is a
transported substrate of human P-gp. Microdialysis-based pharmacokinetic studies
demonstrated that administration of the P-gp inhibitor cyclosporin A (CsA) resulted
in increased brain levels of escitalopram without altering plasma escitalopram
levels in the rat, thereby showing that P-gp restricts escitalopram transport across
the blood-brain barrier (BBB) in vivo. The tail suspension test (TST) was carried out
to elucidate the pharmacodynamic impact of P-gp inhibition on escitalopram effect
in a mouse model of antidepressant activity. Pre-treatment with the P-gp inhibitor
verapamil enhanced the response to escitalopram in the TST. Taken together, these
data indicate that P-gp may restrict the BBB transport of escitalopram in humans,
potentially resulting in sub-therapeutic brain concentrations in certain patients.
Moreover, by verifying that increasing escitalopram delivery to the brain by P-gp
inhibition results in enhanced antidepressant-like activity, we suggest that
adjunctive treatment with a P-gp inhibitor may represent a beneficial approach to
augment escitalopram therapy in depression.

Chapter 4: Escitalopram and P-gp
163
4.1. Introduction
Escitalopram, a selective serotonin reuptake inhibitor (SSRI), is among the most
commonly prescribed and clinically important antidepressants. However, over 30%
of escitalopram-treated depressed patients fail to respond to treatment, with a full
remission achieved in only 50% of cases (Kennedy et al., 2006). Recent clinical
studies have found associations between single nucleotide polymorphisms (SNPs) in
ABCB1, the gene encoding the multidrug efflux transporter P-glycoprotein (P-gp) in
humans, and escitalopram response (Lin et al., 2011; Singh et al., 2012). Given that
drug efflux by P-gp at the blood-brain barrier (BBB) can prevent therapeutic
concentrations of centrally-acting drugs from being achieved in the brain (Loscher
and Potschka, 2005b), this genetic association may indicate that escitalopram efflux
by P-gp at the BBB contributes to the high prevalence of treatment failure (O'Brien
et al., 2012b).
Therefore, findings from these clinical studies raise the intriguing possibility that
augmentation of failed escitalopram treatment with adjunctive P-gp inhibition
therapy may represent a novel approach to overcome treatment-resistant
depression in certain patients. Furthermore, in light of recent regulatory guidance,
which has recommended the limitation of escitalopram doses used clinically due to
the risk of QT prolongation, especially in the elderly (Medicines and Healthcare
products Regulatory Agency, 2011), it would be advantageous if it were possible to
selectively enhance escitalopram delivery to the brain by P-gp inhibition. This could
facilitate escitalopram dose reduction while maintaining therapeutic response,
thereby helping to minimise problems associated with peripheral side-effects.
However, several questions remain to be answered before this potential
therapeutic strategy becomes realised. For example, it is unknown if escitalopram is
a transported substrate of human P-gp or if P-gp efflux restricts the transport of
escitalopram across the BBB. Moreover, it is unknown if any putative enhancement
of escitalopram brain levels by P-gp inhibition would result in an augmentation of
its pharmacodynamic activity. While several studies have demonstrated that P-gp
restricts the brain distribution of various antidepressants in vivo (Uhr et al., 2000;

Chapter 4: Escitalopram and P-gp
164
Uhr and Grauer, 2003; Uhr et al., 2003; Grauer and Uhr, 2004; Ejsing and Linnet,
2005; Uhr et al., 2007; Uhr et al., 2008; Clarke et al., 2009; Karlsson et al., 2010;
Bundgaard et al., 2012; O'Brien et al., 2012a), it has not yet been determined if
increasing brain levels of any antidepressant due to P-gp knockout or P-gp
inhibition results in an augmentation of pharmacodynamic effect in an appropriate
animal model of antidepressant activity.
The present study was designed to address these outstanding questions, using a
combination of in vitro and in vivo approaches to investigate pharmacokinetic and
pharmacodynamic interactions between P-gp and escitalopram.
In vitro bidirectional transport studies, using cell-lines which express human P-gp
(Figure 4.1A), represent the gold standard for the identification of transported
substrates of human P-gp (Balimane et al., 2006; O'Brien et al., 2012b). This is
particularly important considering well-established species differences in P-gp
specificity (Yamazaki et al., 2001; Katoh et al., 2006; Baltes et al., 2007; Syvanen et
al., 2009). The integrated microdialysis approach adopted in the present
pharmacokinetic studies facilitated the simultaneous and repeated monitoring of
plasma and brain levels of escitalopram before and after administration of a P-gp
inhibitor under steady-state conditions. This approach gives a unique insight into
the effect of P-gp inhibition on escitalopram transport across the BBB.
Pharmacodynamic studies were carried out to determine if increasing the delivery
of escitalopram to the brain by inhibition of P-gp would result in enhanced
antidepressant-like activity. To this end, the tail suspension test (TST), which is
among the most commonly used and well-validated preclinical models for the
assessment of antidepressant activity (Cryan et al., 2005a), was conducted.

Chapter 4: Escitalopram and P-gp
165
4.2. Materials and methods
4.2.1. Drugs and chemicals
Acetonitrile, potassium dihydrogen phosphate and orthophosphoric acid were
obtained from Fisher Scientific (Ireland). Heparin sodium solution (Wockhardt UK
Ltd, UK) and cyclosporin A (CsA; Sandimmun) were purchased from Uniphar Group
(Ireland). Escitalopram oxalate was purchased from Discovery Fine Chemicals
(Dorset, UK). Verapamil hydrochloride and imipramine hydrochloride were
obtained from Sigma-Aldrich (Ireland), as were all other chemicals, reagents and
materials unless otherwise stated.
4.2.2. In vitro bidirectional transport studies
Transport experiments were conducted in MDCKII-WT and MDCKII-MDR1 cells,
obtained from the Laboratory of Prof. Piet Borst (Netherlands Cancer Institute,
Amsterdam, The Netherlands), as described in detail in the supplementary
information (Section 4.5.1). The MDCKII-MDR1 cell line is transfected with ABCB1
and expresses human P-gp on the apical membrane in a polarised fashion when
cultured on an appropriate transwell support (Pastan et al., 1988). Therefore
transported substrates of human P-gp will have lower permeability in the apical-to-
basolateral (A→B) direction than in the basolateral-to-apical direction (B→A) due to
the effect of P-gp efflux at the apical membrane, exhibiting a (B→A)/(A→B)
transport ratio (TR) ≥ 2 (Polli et al., 2001; Zhang et al., 2006).
As the MDCKII-MDR1 cell line also expresses endogenous canine kidney
transporters, the TR in MDCKII-MDR1 cells can be compared to the TR in wild-type
MDCKII-WT cells to yield a corrected transport ratio (cTR), which in theory isolates
the effect of human P-gp. A cTR value of ≥ 1.5 indicates the test compound is a
transported substrate of human P-gp (Schwab et al., 2003). However, transfection
with ABCB1 may alter the expression of endogenous transporters (Kuteykin-
Teplyakov et al., 2010). Therefore it is important to repeat transport experiments
with inhibition of P-gp to confirm that P-gp is responsible for net efflux in MDCKII-
MDR1 cells. The P-gp inhibitors verapamil (200 µM) and CsA (25 µM) were used in
the present study as previously described (Tang et al., 2002; Taub et al., 2005).

Chapter 4: Escitalopram and P-gp
166
Expression of P-gp was confirmed by western blot as described in the
supplementary information (Section 4.5.1.3).
4.2.3. In vivo pharmacokinetic studies
4.2.3.1. Animals
Male Sprague Dawley rats (Harlan Laboratories, UK), weighing 250-320 g, were
used in this study (total n = 10). Animals were group-housed 4-6 animals per cage
and maintained on a 12 hour light/dark cycle (lights on at 08:00 h) with food and
water ad libitum. Room temperature was controlled at 22 ± 1°C. All procedures
were carried out in accordance with EU directive 89/609/EEC and approved by the
Animal Experimentation & Ethics Committee of University College Cork.
4.2.3.2. Microdialysis probe construction and calibration
Microdialysis probes were constructed as previously described (O'Brien et al.,
2012a, Chapter 2). In vitro probe recovery values ranged from 5.64 to 8.28% for
escitalopram. Dialysate values were not corrected to account for in vitro recovery,
as the diffusion properties of compounds in brain tissue are likely different from in
vitro conditions. Rather, dialysate values are expressed as a percentage of steady
state concentration, calculated independently for each individual animal.
4.2.3.3. Surgical procedures
To facilitate intravenous and intra-arterial drug administration, as well as the
collection of serial blood samples, the jugular vein and carotid artery of each rat
were catheterised using standard surgical techniques, and microdialysis probes
were inserted into the prefrontal cortex (PFC: 2.7 mm anterior and 0.7 mm lateral
to bregma, lowered 5 mm from dura (Paxinos and Watson, 1998), as described
previously (O'Brien et al., 2012a, Chapter 2). Post-surgery, rats were single-housed
in cylindrical plexiglass containers with the probe inlet connected to a fluid swivel
(Instech Laboratories, Plymouth Meeting, PA). Artificial cerebrospinal fluid (aCSF:
147 mM NaCl, 1.7 mM CaCl2, 0.9 mM MgCl2, and 4mM KCl) was perfused through
each microdialysis probe at a rate of 1.5 μl.min-1. Rats were allowed to recover
overnight prior to sampling on the following day during the optimal post-surgical
period (de Lange et al., 2000).

Chapter 4: Escitalopram and P-gp
167
4.2.3.4. Experimental design
Rats were separated into two groups: Escitalopram plus vehicle (Escit+VEH) and
escitalopram plus CsA (Escit+CsA; n = 5 per group). To achieve and maintain steady
state levels of escitalopram (Bundgaard et al., 2007), a bolus dose of escitalopram
(6 mg.kg-1 i.v.) was administered to all rats at time (t) = 0 min, followed by a
continuous escitalopram infusion (4 mg.kg-1.h-1 i.v.). Rats in the Escit+CsA group
were treated with the P-gp inhibitor CsA (25 mg.kg-1 intra-arterial) (O'Brien et al.,
2012a, Chapter 2) after steady state escitalopram levels had been achieved at t =
120 min. Rats in the Escit+VEH group received the same volume (2 ml.kg-1) of
vehicle (1/12 ethanol: 2/12 Cremophor EL: 9/12 saline) at t = 120 min. Microdialysis
samples were collected at 20 min intervals, and stored at -80oC until analysed by
HPLC. Plasma samples (~ 250 µl) were collected at seven time-points: one before
escitalopram administration (blank) and one at 10, 40, 80, 120, 160 and 220 min
post-escitalopram bolus administration, and stored at -80oC until extraction for
HPLC analysis. At the conclusion of the experiment (t = 220 min), rats were
euthanized by intra-arterial administration of sodium pentobarbital. Brains were
subsequently removed and dissected. The right hemisphere was taken for
histological verification of probe placement. The PFC and hippocampus were taken
from the contralateral hemisphere to determine escitalopram concentration in
brain tissue at the termination of the experiment. Escitalopram was extracted from
plasma and brain tissue using a liquid-liquid extraction technique described in
supplementary information (Section 4.5.2).
4.2.4. In vivo pharmacodynamic studies
4.2.4.1. Tail suspension test
The tail suspension test (TST), one of the most widely used assays for assessing
antidepressant activity in rodents (Cryan et al., 2005a), was carried out using male
C57BL/6JOlaHsd mice (Harlan Laboratories, UK; 6-8 weeks old; total n= 67), as
described previously (O'Connor and Cryan, 2013). This allowed an assessment of
the pharmacodynamic impact of pre-treatment with the P-gp inhibitor verapamil
on escitalopram activity. Briefly, after a 5-7 day acclimation period, mice were pre-
treated with either the P-gp inhibitor verapamil (20 mg.kg-1 i.p.) or saline one hour

Chapter 4: Escitalopram and P-gp
168
before administration of either escitalopram (0.1 mg.kg-1 or 1 mg.kg-1 i.p.) or saline.
Thirty minutes after the second injection, mice were individually suspended by the
tail from a horizontal bar using adhesive tape. Six minute test sessions were
recorded by a video camera and subsequently scored by a trained observer blind to
the treatment groups. The amount of time spent immobile by the animal was
recorded. Brain tissue (PFC and hippocampus) was harvested from each animal 10
min after commencement of the TST and brain escitalopram and verapamil levels
were determined using the extraction procedure described in the supplementary
information (Section 4.5.2).
4.2.4.2. Locomotor activity
To investigate potential locomotor effects, which would confound analysis of
behavioural data from the TST, the impact of drug treatment on locomotor activity
was assessed as previously described (O'Connor and Cryan, 2013). A separate
cohort of mice were pre-treated with either the P-gp inhibitor verapamil (20 mg.kg-
1 i.p.) or saline one hour before administration of either escitalopram (0.1 mg.kg-1
i.p.) or saline, thus resulting in 4 groups. Thirty minutes after the second injection,
mice were individually placed in activity monitoring units (27 cm X 21 cm). Activity
was then monitored via beam breaks for 60 minutes.
4.2.5. HPLC analysis
Samples were analysed by HPLC using a reversed phase Luna 3 µm C18(2) 150 x 2
mm column (Phenomenex). The HPLC method was adapted from previously
described methods (Frahnert et al., 2003; Unceta et al., 2011). Briefly, the mobile
phase consisted of a mixture of 25 mM potassium dihydrogen phosphate (25 mM,
pH 7 with 4N NaOH) and HPLC grade acetonitrile (56:44). Compounds were eluted
isocratically over a 15 min runtime at a flow rate of 0.4 ml.min-1 after a 20 µl
injection. The UV detector was set to 230 nm and the fluorescent detector was set
to 249 nm excitation and 302 nm emission. Escitalopram, imipramine (internal
standard) and verapamil were identified and quantified based on their
characteristic retention times and peak heights as determined by standard
injections which were run at regular intervals during sample analysis. The limit of

Chapter 4: Escitalopram and P-gp
169
quantification (LOQ) for escitalopram was 6.25 ng.ml-1. The coefficients of variation
(% CV) for the HPLC method were 9.02%, 2.04% and 0.34% at 6.25 ng.ml-1 (LOQ), 20
ng.ml-1 (typical of microdialysis samples) and 1000 ng.ml-1 (typical of extracted
plasma or brain samples), respectively.
4.2.6. Data analysis and statistical procedures
All statistical analyses were carried out using standard commercial software (SPSS
Statistics, version 20.0.0; SPSS, Inc., Chicago, IL). Plasma and dialysate concentration
versus time profiles were analyzed using one-way repeated measures ANOVA.
Where significant overall group or time effects were observed, unpaired t-test or
LSD post-hoc test were used to elucidate differences between or within the groups,
respectively. Statistical analyses of differences between the two groups for all other
parameters pertaining to in vivo pharmacokinetic studies were carried out using
unpaired t-test. Results from the TST and locomotor studies were analysed
statistically by one-way ANOVA with LSD post-hoc. The strength of the association
between immobility in the TST and brain escitalopram concentrations was
evaluated using the Spearman rank-order correlation analysis. The criterion for
statistical significance was p ≤ 0.05.

Chapter 4: Escitalopram and P-gp
170
4.3. Results
4.3.1. In vitro bidirectional transport studies
4.3.1.1. Western blot analysis
Western blot analysis confirmed that expression of P-gp in ABCB1-transfected
MDCKII-MDR1 cells was higher than endogenous P-gp expression in MDCKII-WT
cells (Figure 4.1B).
4.3.1.2. Human P-gp limited escitalopram transport across MDCKII-
MDR1 cells
The transport ratio (TR) compares drug permeability across the cell monolayer in
the basolateral-to-apical (B→A) direction to drug permeability in the apical-to-
basolateral direction (A→B). Drugs which are transported substrates of human P-gp
will have greater permeability in the B→A than A→B direction (i.e. TR > 1) in
MDCKII-MDR1 cells, due to P-gp efflux restricting drug transport in the A→B
direction only (Figure 4.1A). To account for the potential impact of endogenous
transporters of MDCK cells, a corrected transport ratio (cTR) is determined relative
to wild-type cells.
In MDCKII-WT cells, which are not transfected with ABCB1 and therefore do not
express human P-gp, the apparent permeability (Papp) of escitalopram was greater
in the B→A than A→B direction, with a TR of 2.32 (Figure 4.1C and Table 4.1). This
indicates that endogenous MDCK transporters exert a net efflux effect on
escitalopram.
In MDCKII-MDR1 cells, which express human P-gp on the apical membrane only
(Figure 4.1A), the difference between B→A and A→B Papp was greater than in
MDCKII-WT cells, as evidenced by the TR of 7.22 and cTR of 3.11 (Figure 4.1D and
Table 4.1). Therefore, both the TR and cTR for escitalopram substantially exceeded
the recommended TR and cTR thresholds of 2 and 1.5, respectively, for the
identification of transported substrates of human P-gp (Polli et al., 2001; Schwab et
al., 2003; Zhang et al., 2006). Moreover, co-incubation of the P-gp inhibitor
verapamil (200 µM) reduced the TR in MDCKII-MDR1 cells to 1.51 (Figure 4.1E and
Table 4.1). Similarly, co-incubation of another P-gp inhibitor, CsA (25 µM), reduced

Chapter 4: Escitalopram and P-gp
171
the TR to 3.33 in MDCKII-MDR1 cells (Figure 4.1F and Table 4.1). Taken together,
the data from this series of in vitro bidirectional transport experiments
demonstrate that escitalopram is a transported substrate of human P-gp.

172
Figure 4.1: In vitro bidirectional transport studies A Schematic illustrating the in vitro bidirectional transport assay. MDCKII-MDR1 cells express human P-gp in a polarised fashion at the apical membrane only when cultured on a transwell support. When substrates of human P-gp are added to the apical chamber, their transport across the monolayer of cells is restricted by P-gp efflux, thereby reducing their apical-to-basolateral (A→B) permeability. When substrates of human P-gp are added to the basolateral chamber, P-gp does not limit their transport across the monolayer as it is not expressed at the basolateral membrane. Therefore, human P-gp substrates will have greater permeability in the basolateral-to-apical (B→A) direction than in the A→B direction, and directional efflux is attenuated by co-incubation of a P-gp inhibitor. Bidirectional transport studies are also carried out in MDCKII-WT cells, which do not express human P-gp, to determine the influence of endogenous transporters, including canine P-gp, on drug permeability. B Representative image of western blot demonstrating over 4.5-fold greater expression of P-gp in MDCKII-MDR1 cells than MDCKII-WT cells. C-D Escitalopram accumulation in receiver chamber over time in MDCKII-WT and MDCKII-MDR1 cells. Escitalopram crossed the monolayer to a greater extent in the B→A direction than A→B direction in both MDCKII-WT (C) and MDCKII-MDR1 (D) cells, indicating net efflux in both cell lines. However, the magnitude of the efflux effect was substantially greater in MDCKII-MDR1 cells, highlighting a role for human P-gp. E-F Escitalopram accumulation in receiver chamber over time in MDCKII-MDR1 cells with co-incubation of the P-gp inhibitors verapamil (E) or CsA (F). Co-incubation with either P-gp inhibitor attenuated the directional efflux of escitalopram, thereby confirming that escitalopram is a transported substrate of human P-gp (mean ± SEM; n = 3 in all experiments).

173

174
Table 4.1: Apparent permeability (Papp), transport ratio (TR) and corrected transport ratio (cTR) values from in vitro bidirectional transport studies
Cell-type Treatment
(P-gp inhibitor) Papp A→B
(x10-6 cm.s-1) Papp B→A
(x10-6 cm.s-1) TR cTR
MDCKII-WT None 7.75 ± 0.33 18.00 ± 0.51 2.32 n/a
MDCKII-MDR1 None 2.11 ± 0.10 15.23 ± 0.51 7.221 3.111
MDCKII-MDR1 Verapamil (200 µM)
4.87 ± 0.65 7.36 ± 1.13 1.51 n/a
MDCKII-MDR1 CsA
(25 µM) 3.35 ± 0.39 11.12 ± 0.42 3.33 n/a
1 Exceeds pre-defined threshold for identification of a transported P-gp substrate (Polli et al., 2001; Schwab et al., 2003; Zhang et al., 2006)

Chapter 4: Escitalopram and P-gp
175
4.3.2. In vivo pharmacokinetic studies
4.3.2.1. P-gp inhibition had no effect on plasma escitalopram
pharmacokinetics
Both CsA- and vehicle-treated groups exhibited similar plasma escitalopram
pharmacokinetics, with no group effect on plasma escitalopram levels over time
(F(1, 8) = 0.104, p = 0.756; Figure 4.2A). Steady-state plasma escitalopram levels
were reached within 120 min. However, after administration of either vehicle or
CsA at t = 120 min, an equivalent 15-20% increase in plasma escitalopram
concentrations, compared to steady-state levels, was evident in both groups. As
there was no difference between the groups in terms of plasma escitalopram
pharmacokinetics, any differences in brain escitalopram concentrations observed
between the groups can be attributed to altered BBB transport.
4.3.2.2. P-gp inhibition increased escitalopram concentration in
microdialysis samples
Steady-state dialysate levels of escitalopram were achieved within 120 min in all
cases. There was a statistically significant difference between the groups in terms of
dialysate escitalopram profiles (F(1, 8) = 11.569, p = 0.009; Figure 4.2B). There was
also a significant overall time effect (F(7, 56) = 24.763, p < 0.001), in addition to a
significant group x time interaction (F(1,56) = 10.160, p < 0.001).
In the Escit+VEH group, administration of vehicle resulted in an increase in dialysate
escitalopram levels relative to steady-state. This increase mirrored the 15-20%
increase evident in plasma levels and reached a maximum 17.08% at the 200 min
time-point, thereby indicating that administration of vehicle had no effect on the
transport of escitalopram across the BBB. The increase from steady-state was
statistically significant from 180 min onwards (Figure 4.2B).
In the Escit+CsA group, treatment with the P-gp inhibitor CsA resulted in an
increase from steady state levels, reaching a maximum increase of 66.94% at t =
220 min with a statistically significant elevation relative to steady-state from t = 160
min onwards (Figure 4.2B). Moreover, the increase in the Escit+CsA group was
significantly greater than that observed in the Escit+VEH group from t = 160 min

Chapter 4: Escitalopram and P-gp
176
onwards (Figure 4.2B). Taken together, these in vivo plasma and microdialysis
pharmacokinetic data demonstrate that inhibition of P-gp results in enhanced BBB
transport of escitalopram.
4.3.2.3. Brain tissue escitalopram concentrations were increased
following P-gp inhibition
At termination of the microdialysis experiment, PFC brain tissue escitalopram
concentrations were over three times greater in CsA-treated animals than vehicle-
treated controls (t(8) = 8.602, p < 0.001; Figure 4.2C). Moreover, the PFC brain
tissue:plasma escitalopram concentration ratio was also elevated over three-fold in
CsA-treated animals relative to controls (t(5.617) = 5.617, p = 0.004; Table 4.2), thus
demonstrating that escitalopram transport across the BBB is significantly increased
by P-gp inhibition.
Similarly, hippocampal brain tissue escitalopram concentrations were more than
2.5 times greater in CsA-treated animals than vehicle-treated controls (t(8) =
11.047, p < 0.001; Figure 4.2D). In addition, the hippocampal brain tissue:plasma
escitalopram concentration ratio was elevated more than 2.75-fold in CsA-treated
animals relative to vehicle-treated controls (t(8) = 5.458, p = 0.001; Table 4.2).
These findings corroborate the microdialysis results, and demonstrate that
inhibition of P-gp results in enhanced transport of escitalopram across the BBB.

177
Figure 4.2: In vivo pharmacokinetic studies A Plasma escitalopram pharmacokinetics. There was no difference in escitalopram plasma pharmacokinetics between vehicle- and CsA-treated animals. Steady state plasma escitalopram levels were achieved within 120 min in both groups. Administration of vehicle or the P-gp inhibitor CsA resulted in an equivalent 15-20% increase in plasma escitalopram levels from steady state in both groups. B Dialysate escitalopram pharmacokinetics. Steady state dialysate concentrations of escitalopram were also achieved in both groups within 120 min. Administration of vehicle resulted in a significant 17% increase in dialysate escitalopram concentration from steady state levels, which mirrored increases observed in plasma. Administration of the P-gp inhibitor CsA resulted in a 67% increase from steady state, which was significantly greater than that observed in the vehicle-treated group. C-D Brain tissue escitalopram concentrations. Escitalopram concentrations in brain tissue at termination of in vivo pharmacokinetic studies were significantly greater in CsA-treated animals than vehicle-treated animals in both the prefrontal cortex (C) and the hippocampus (D) (mean ± SEM; n = 5 per group for all graphs). * p < 0.05; ** p < 0.01; *** p < 0.001 between the groups # p < 0.05; ## p < 0.01; ### p < 0.001 compared to steady-state levels

178

179
Table 4.2: Escitalopram concentrations in plasma and brain tissue, and brain tissue:plasma escitalopram concentration ratios at termination of in vivo pharmacokinetic studies
Group Plasma Prefrontal Cortex Hippocampus
(ng.ml-1) (ng.g-1) B:P1 Ratio (ng.g-1) B:P1 Ratio
Escit+VEH 709 ± 26 7 074 ± 438 10.09 ± 0.87 7 999 ± 638 11.43 ± 1.19
Escit+CsA 678 ± 76 21 827 ± 1658 33.59 ± 4.09 20 432 ± 927 31.48 ± 3.48
p-value 0.709 < 0.001*** 0.004** < 0.001*** 0.001**
1 Brain region:plasma ratio
n = 5 per group; ** p < 0.01; *** p < 0.001

Chapter 4: Escitalopram and P-gp
180
4.3.3. In vivo pharmacodynamic studies
4.3.3.1. Verapamil augmented escitalopram response in tail suspension
test
The tail suspension test (TST) is one of the most widely used models for the
assessment of antidepressant activity in mice (Cryan et al., 2005a). When subjected
to the short term inescapable stress of suspension by the tail, mice adopt an
immobile posture. Treatment with antidepressant medications, including
escitalopram (Zomkowski et al., 2010), reduces the time spent immobile in this
paradigm in a dose-responsive manner (Cryan et al., 2005a).
In the present study, it was found that pre-treatment with the P-gp inhibitor
verapamil augmented the antidepressant response at both doses of escitalopram
investigated (Figure 4.3A). There was a significant overall difference between the
groups in immobility in the TST (F(5, 61) = 6.964, p < 0.001; Figure 4.3A). Post-hoc
analysis revealed that the 23 second reduction in immobility, compared to control
animals, observed in mice treated with the lower dose of escitalopram (0.1 mg.kg-1)
without verapamil pre-treatment was not statistically significant (p = 0.168). Pre-
treatment with verapamil augmented the response to this lower dose of
escitalopram by over 60%, resulting in a statistically significant 38 second reduction
in immobility versus controls (p = 0.01). Moreover, while treatment with the higher
dose of escitalopram (1 mg.kg-1) led to a significant reduction in immobility with or
without pre-treatment with verapamil (p = 0.001 and p < 0.001 respectively), the
magnitude of the reduction was augmented by almost 40% following pre-treatment
with verapamil (Figure 4.3A). These results demonstrate that inhibition of P-gp
augments the antidepressant-like effect of escitalopram in the TST.

Chapter 4: Escitalopram and P-gp
181
4.3.3.2. Effects of escitalopram and verapamil in the TST were not a
function of increased locomotor activity
Treatments which lead to increased locomotor activity could cause a reduction in
immobility in the TST unrelated to antidepressant-like activity. To investigate this
potential confounding factor, the effects of the present drug treatments on
locomotor activity were assessed. There was a significant difference in locomotor
activity between the groups (F(3, 23) = 4.605, p = 0.012; Figure 4.3B). Post-hoc
analysis revealed that mice in receipt of pre-treatment with verapamil exhibited
decreased locomotion relative to saline-treated controls, whether subsequently
treated with saline (p = 0.016) or escitalopram (p = 0.002). Administration of
escitalopram without verapamil pre-treatment had no effect on locomotor activity
(p = 0.252). As locomotor activity was not increased by treatment with verapamil
and/or escitalopram, the decreases in immobility observed in the TST can be
attributed to the antidepressant-like activity of escitalopram, as opposed to being
an artefact of increased locomotion.
4.3.3.3. Brain tissue concentrations of escitalopram were increased
following verapamil pre-treatment
Brain tissue escitalopram concentrations were significantly greater in mice pre-
treated with the P-gp inhibitor verapamil than control mice at both doses of
escitalopram treatment (Figure 4.3C). Pre-treatment with verapamil resulted in a
greater than two-fold increase in brain escitalopram levels in mice treated with 0.1
mg.kg-1 of escitalopram (t(17) = -3.010, p = 0.008) and a greater than 1.75-fold
increase in brain escitalopram levels in mice treated with 1 mg.kg-1 of escitalopram
(t(10) = -6.516, p < 0.001). Verapamil concentration in brain tissue was consistent
across the three verapamil-treated groups (1 163 ± 53 ng.ml-1). These results
confirm that administration of verapamil as a P-gp inhibitor resulted in increased
brain levels of escitalopram in the mice during the TST.

Chapter 4: Escitalopram and P-gp
182
4.3.3.4. Correlation between brain escitalopram concentration and
immobility in the TST
There was a moderately strong and statistically significant negative correlation
between escitalopram concentration in brain tissue and immobility in the TST (rs = -
0.594, n = 56, p < 0.001; Figure 4.3D). This indicates that the decreased immobility
observed in escitalopram-treated mice in receipt of verapamil pre-treatment was
related to the increased delivery of escitalopram to the brains of these animals.

183
Figure 4.3: In vivo pharmacodynamic studies A Tail suspension test. Treatment with escitalopram reduced the time spent immobile in the TST in a dose dependent manner. Treatment with verapamil without escitalopram had no impact on immobility. However, pre-treatment with verapamil augmented the antidepressant-like effect of escitalopram in the TST, further reducing the time spent immobile at both doses of escitalopram (mean ± SEM; n = 8-17 per group). B Locomotor activity. Treatment with verapamil, escitalopram or both did not increase locomotor activity, indicating that the reductions in immobility observed in the TST were due to antidepressant-like effects. In fact, treatment with verapamil reduced locomotor activity, with or without escitalopram treatment (mean ± SEM; n = 6-7 per group). C Brain tissue escitalopram concentrations. Pre-treatment with the P-gp inhibitor verapamil before administration of escitalopram significantly increased brain concentrations of escitalopram in mice used in the TST at both doses of escitalopram treatment (mean ± SEM; n = 6-12 per group). D Correlation between brain escitalopram concentration and immobility in the TST. There was a moderately strong negative correlation between escitalopram concentration in brain tissue and immobility in the TST (rs = -0.594, n = 56, p < 0.001). * p < 0.05; ** p < 0.01; *** p < 0.001 relative to saline-saline control group (or between two groups where indicated in Figure 4.3C)

184

Chapter 4: Escitalopram and P-gp
185
4.4. Discussion
The present findings clearly demonstrate that P-gp modulates the pharmacokinetics
and pharmacodynamics of the widely prescribed antidepressant escitalopram. In
showing that escitalopram is a transported substrate of human P-gp, and that
pharmacological inhibition of P-gp results in enhanced escitalopram transport
across the BBB in vivo, we open up the concept that P-gp inhibition may be a viable
and potentially safe strategy to augment the effects of escitalopram. Moreover, we
bolster this hypothesis by showing a pharmacodynamic consequence of elevated
brain levels of escitalopram by P-gp inhibition in a relevant animal model of
antidepressant activity. These novel findings are especially important in light of
recent clinical studies which have found associations between SNPs in ABCB1 and
response to escitalopram treatment (Lin et al., 2011) and the dose of escitalopram
required to achieve remission in major depression (Singh et al., 2012). While there
is generally no clear correlation between antidepressant plasma levels and
therapeutic efficacy (Perry et al., 1987; Spina et al., 1997; Normann et al., 2004), it
has been proposed that inter-individual variability in BBB transport, due to genetic
differences in P-gp functionality, may lead to clinically relevant differences in the
brain distribution of certain antidepressants (Kato et al., 2008).
The present results, in conjunction with previously reported pharmacogenetic
associations between ABCB1 genotype and treatment response (Lin et al., 2011;
Singh et al., 2012), support this hypothesis in relation to escitalopram, indicating
that P-gp may prevent therapeutic brain concentrations from being achieved in
certain patients with elevated P-gp activity due to functional SNPs in ABCB1.
To our knowledge, the behavioural studies included in the present work
demonstrate for the first time that the pharmacodynamic activity of an
antidepressant can be augmented by inhibition of P-gp. In addition, analysis of the
correlation between time spent immobile in the TST and brain escitalopram
concentrations indicated that the reduction in immobility was related to the
enhanced delivery of escitalopram to the brain following P-gp inhibition. These
novel findings are especially exciting as they indicate that this approach to increase

Chapter 4: Escitalopram and P-gp
186
escitalopram concentrations in the brain may prove to be therapeutically beneficial
in patients. In previous preclinical studies, escitalopram has been shown to reduce
immobility in the TST in a dose responsive manner up to a maximal response at 1
mg.kg-1 (Zomkowski et al., 2010). At higher doses of escitalopram, the time spent
immobile increased, likely due to peripheral side effects, resulting in a U-shaped
dose response curve (Zomkowski et al., 2010). In the present study, it was found
that pre-treatment with the P-gp inhibitor verapamil augmented the antidepressant
response at both doses of escitalopram investigated, including an enhanced
response to a 1 mg.kg-1 dose (Figure 4.3A). This highlights that the P-gp inhibition
strategy may facilitate augmentation of the central effects of escitalopram while
avoiding peripheral side effects associated with higher doses of escitalopram.
However, it should be noted that this approach could potentially result in increased
risk of unwanted central side effects. This risk could be offset by selectively
employing the P-gp inhibition augmentation strategy in patients shown to have
enhanced P-gp functionality or in conjunction with low dose escitalopram, thereby
serving to normalize brain levels of escitalopram rather than resulting in toxic brain
concentrations.
Our finding that administration of a P-gp inhibitor increased brain concentrations of
escitalopram without altering plasma levels conclusively demonstrates that
inhibition of P-gp enhances escitalopram transport across the BBB. Importantly, the
intracerebral microdialysis technique employed to monitor brain levels of
escitalopram measures only unbound drug levels in brain extracellular fluid (de
Lange et al., 2000). Given that drugs are active in the unbound form and that
escitalopram acts within the brain by inhibiting the serotonin reuptake transporter
in the extracellular synaptic cleft, the present findings are of particular
pharmacological relevance. Furthermore, the steady-state approach adopted in the
present study enabled the confirmation of microdialysis findings by determining
brain tissue concentrations from the same animals at termination of the
experiment, when differences between the groups were maximal. To our
knowledge, there are no data available in relation brain levels of escitalopram in
humans in clinical practice. Therefore, it is not possible to discuss the brain

Chapter 4: Escitalopram and P-gp
187
concentrations observed in the present studies in the context of those encountered
clinically. Future imaging or post-mortem studies may offer further information in
this regard. Nonetheless, our finding that brain tissue levels of escitalopram were
increased three-fold by P-gp inhibition compares favourably with recently reported
results from studies using P-gp knockout mice, which were published online as this
paper was being finalised (Karlsson et al., 2013). Given that it has proven difficult to
reproduce effects observed in P-gp knockout mice by P-gp inhibition in the past
(Ejsing and Linnet, 2005), it remained vital to demonstrate that P-gp inhibition
would result in similarly increased brain levels of escitalopram before proposing
that co-administration of a P-gp inhibitor may represent a promising approach to
enhance escitalopram delivery to the brain. Considering that patients are treated
chronically with antidepressants in clinical practice, future studies are required to
investigate if escitalopram concentrations in the brain can be enhanced and
maintained by repeated P-gp inhibition.
Well-documented interspecies differences in P-gp substrate specificity (Yamazaki et
al., 2001; Katoh et al., 2006; Baltes et al., 2007; Syvanen et al., 2009) mean that
findings in relation to P-gp transport obtained from animal models cannot be
readily extrapolated to humans. Therefore, appropriate in vitro bidirectional
transport studies involving human P-gp are necessary to enable evaluation of the
clinical relevance of results from rodent studies. Indeed, this is a very pertinent
point in light of our recent findings that the antidepressants amitriptyline and
fluoxetine, both of which have been identified as P-gp substrates in mice (Uhr et al.,
2000; Doran et al., 2005), are not transported substrates of human P-gp (O'Brien et
al., 2013a, Chapter 3). Therefore, the present finding that escitalopram is a
transported substrate of human P-gp indicates that findings from our in vivo studies
may translate to humans.
While the present studies have exclusively involved escitalopram, it is possible that
our findings may extend to certain other antidepressant drugs, as there is a growing
body of evidence to suggest that efflux by P-gp may influence treatment response
to several antidepressants (reviewed in O'Brien et al., 2012b). There is limited
information available in relation to antidepressant transport by human P-gp per se.

Chapter 4: Escitalopram and P-gp
188
However, in common with escitalopram, pharmacogenetic studies have revealed an
association between SNPs in ABCB1 and response to other antidepressants (Gex-
Fabry et al., 2008; Kato et al., 2008; Nikisch et al., 2008; Sarginson et al., 2010).
These antidepressants, including citalopram and paroxetine, are thought to be P-gp
substrates based on results from studies in P-gp knockout mice (Uhr and Grauer,
2003; Uhr et al., 2003; Doran et al., 2005; Uhr et al., 2008). However, it has been
reported that similar pharmacogenetic associations do not exist for other
antidepressants, including amitriptyline, duloxetine, fluoxetine and mirtazapine
(Roberts et al., 2002; Laika et al., 2006; Uhr et al., 2008; Perlis et al., 2010;
Sarginson et al., 2010). Emerging data from our lab, indicating that these four
antidepressants are not transported substrates of human P-gp, despite
aforementioned preclinical findings in relation to amitriptyline and fluoxetine (Uhr
et al., 2000; Doran et al., 2005), may offer an explanation for these observations.
(O'Brien et al., 2013a, Chapter 3). Further studies are now warranted to determine
if the present findings in relation to escitalopram generalise to other
antidepressants.
It should be noted that transporters other than P-gp, such as breast cancer
resistance protein (BCRP) and the multidrug resistance-associated proteins (MRPs),
also play an important role at the BBB. Given the significant overlap in substrate
specificity between P-gp, BCRP and the MRPs (Sharom, 2008), it is possible that
these alternative transporters may also influence the distribution of escitalopram
across the BBB. Indeed, racemic citalopram has been reported to be an MRP1
substrate, while the same study found an association between polymorphisms in
the MRP1 gene and citalopram response (Lee et al., 2010). Nonetheless, the range
of approaches adopted in the present studies, not least the in vitro study involving
MDCKII-MDR1 cells transfected with human P-gp, highlight an important role for P-
gp in escitalopram pharmacokinetics and pharmacodynamics independent of any
potential involvement of other transporters.
In summary, the present studies indicate that P-gp may restrict the BBB transport of
escitalopram in humans, potentially resulting in sub-therapeutic brain
concentrations in certain patients, particularly those with elevated P-gp

Chapter 4: Escitalopram and P-gp
189
functionality due to SNPs in ABCB1. Moreover, the novel finding that increasing
escitalopram delivery to the brain by P-gp inhibition results in enhanced
antidepressant-like activity indicates that adjunctive treatment with a P-gp inhibitor
may represent a beneficial approach to augment escitalopram therapy in
depression in such patients. This approach could potentially have the added benefit
of reducing the administered dose required to achieve escitalopram response,
which is particularly desirable following recent guidance recommending the
limitation of escitalopram doses used clinically due to the risk of QT prolongation
(Medicines and Healthcare products Regulatory Agency, 2011). The P-gp inhibitors
verapamil and CsA, used as tool compounds in the present proof-of-concept study,
have the advantage of being clinically available for non-CNS indications. However, it
is unlikely that these drugs would be appropriate for clinical use as P-gp inhibitors
due to their lack of specificity and potency, thereby requiring high doses to
adequately inhibit P-gp. Verapamil is primarily used as a calcium channel blocker,
while CsA is an immunosuppressant agent which also modulates other drug
transporters (Qadir et al., 2005). The use of more selective second or third
generation P-gp inhibitors may represent a more acceptable alternative for
potential clinical use. Additional studies, both preclinical and clinical, are now
warranted to further evaluate the safety and efficacy of this strategy to augment
treatment response to escitalopram.

Chapter 4: Escitalopram and P-gp
190
4.5. Supplementary information: supplementary materials and
methods
4.5.1. In vitro bidirectional transport studies
4.5.1.1. Cell-lines and materials
MDCKII-WT and MDCKII-MDR1 cells were obtained from the Piet Borst Laboratory
(Netherlands Cancer Institute, Amsterdam, The Netherlands). Transport
experiments were carried out using Costar 3414 Polycarbonate Membrane
Transwell® Inserts (24 mm diameter, 3 µm pore size), purchased from Sigma
Aldrich, as were all other materials and chemicals unless otherwise stated.
4.5.1.2. Cell culture
Cells were grown in 75 cm2 culture flasks using Dulbecco's Modified Eagle's
Medium, supplemented with 10% fetal bovine serum and 1% Penicillin-
Streptomycin. Cells were split twice weekly at a dilution of 1:12, and incubated at
37°C in a humidified 5% CO2 and 95% air atmosphere.
4.5.1.3. Western blot analysis
Expression of P-gp was confirmed by western blot analysis. Briefly, MDCKII-MDR1
and MDCKII-WT monolayers were grown as per transport experiments. Cells were
washed with ice-cold phosphate-buffered saline, then lysed in lysis buffer (HEPES
20 mM; Np-40 (1%); DTT 0.5 mM; Na3VO4 0.1 mM; PMSF 0.1 mM; aprotinin 2 µg.ml-
1; leupeptin 2 µg.ml-1; NaF 0.02 mM) for 15 min at 4°C. Cell lysate was centrifuged
at 4°C for 10 min at 10 000 rpm. The supernatant was stored at -80°C for later
analysis. Five micrograms of cell protein were loaded in 10-12%SDS-PAGE gel and
run at 60-100 V for 120 min. After transfer onto a 0.2-µm nitrocellulose membrane
and blocking with 5% skimmed milk and 0.1% Tween 20 in PBS, blots were probed
overnight at 4°C with the C219 primary monoclonal P-gp antibody (1:100 dilution in
2% skimmed milk; Enzo Life Sciences (UK) Ltd, Exeter, UK). Reprobing was
conducted for 1 h at room temperature using a goat anti-mouse IgG-HRP conjugate,
diluted 1:2000 (Jackson Immunoresearch Europe Ltd). Images were obtained using
a luminescent image analyzer (LAS-3000; Fujifilm, Ireland). For the detection of β-
actin, the membranes were incubated with Monoclonal Anti-β-Actin−Peroxidase

Chapter 4: Escitalopram and P-gp
191
antibody produced in mouse (1:15000). Immunoblots were quantified using ImageJ
software.
4.5.1.4. Transport Experiments
For transport experiments, cells (passage number: 23-25) were seeded at a density
of 2x10⁶ cells per well. Cells were allowed to grow to confluence over four days
with 1.5 ml of medium in the apical compartment and 2.6 ml of medium in the
basolateral compartment. The medium was changed daily and trans-epithelial
electrical resistance (TEER) measurements were taken each day using an Endohm
meter (World Precision Instruments, Sarasota, FL) to monitor the development and
integrity of the cell monolayer. On the day of experiment, the mean (± SEM) TEER
value for MDCKII-WT cells was 184 (± 7) .cm2 and for MDCKII-MDR1 cells was 533
(± 10) .cm2.Fresh cell culture medium was added to the cells two hours before the
transport experiment. One hour prior to the commencement of the transport
experiment, cell culture medium was removed and monolayers were rinsed twice
with transport buffer (Hank’s Balanced Salt Solution [HBSS] with 10 mM HEPES).
Transport experiments were carried out by adding escitalopram (5 µM, freshly
prepared in transport buffer) to the donor chamber and measuring the
concentration of escitalopram in the receiver chamber at 30 minute intervals over a
two hour incubation period at 37°C. Apical and basolateral chamber volumes were
maintained at 1.5 and 2.6 ml, respectively, throughout the transport experiment by
replacing the volume (100 µl) removed from the receiver chamber at each sampling
point with an equal volume of blank transport buffer. In addition, a 100 µl sample
was taken from the donor chamber at the beginning of the experiment, to confirm
the initial concentration (C0), and at the end of the experiment, to facilitate mass
balance calculations. For apical-to-basolateral (A→B) transport, the apical chamber
is the donor chamber and the basolateral chamber is the receiver chamber.
Conversely, for basolateral-to-apical (B→A) transport, the basolateral chamber is
the donor chamber and the apical chamber is the receiver chamber. To confirm the
identification of P-gp substrates in bidirectional transport studies using MDCKII-WT
and MDCKII-MDR1 cells, it is recommended that transport experiments are
repeated in the presence of at least two P-gp inhibitors (Zhang et al., 2006). If P-gp

Chapter 4: Escitalopram and P-gp
192
transport is the mechanism net efflux in MDCKII-MDR1 cells, inhibition of P-gp will
attenuate the efflux. For this reason, transport experiments were also carried out in
the presence either verapamil (200 µM in transport buffer) or CsA (25 µM in
transport buffer), both of which are P-gp inhibitors. The concentration chosen for
each P-gp inhibitor was based on studies in the literature (Tang et al., 2002; Taub et
al., 2005). For P-gp inhibition studies, the MDCKII-MDR1 cells were pre-incubated
with the P-gp inhibitor on both sides of the monolayer for 30 min before addition of
escitalopram (5 µM), and transport experiments were carried out in the presence of
the P-gp inhibitor in both chambers throughout the experiment. Fresh transport
buffer containing the appropriate P-gp inhibitor was replaced in the receiver side
after sampling. All transport experiments were carried out in triplicate.
4.5.1.5. Transport experiment calculations
The apparent permeability coefficient (Papp; unit: cm.s-1) of escitalopram in each
individual well was calculated using equation (4.1) (Youdim et al., 2003).
(4.1)
where, VD = donor volume (cm3), A = surface area of the cell monolayer (4.67 cm2),
MD = initial amount of escitalopram in the donor chamber (mol), Mcells = amount of
escitalopram retained by the membrane/cells (mol) and
= change in the
amount ofe scitalopram in the receiver chamber over time (mol.s-1).
The transport ratio (TR), which compares drug transport in the B→A direction to
drug transport in the A→B direction, was calculated using equation (4.2). A ratio
greater than 1 indicates that net efflux is taking place, and a TR value of ≥ 2
indicates that the test compound is a transported P-gp substrate, while a TR
between 1.5 and 2 is inconclusive (Polli et al., 2001; Zhang et al., 2006).
𝑎𝑝𝑝 =𝑉𝐷
[𝐴 × (𝑀𝐷 − 𝑀 𝑒𝑙𝑙𝑠 )]×
𝑀
𝑡

Chapter 4: Escitalopram and P-gp
193
(4.2)
The corrected transport ratio (cTR), calculated using equation (4.3), takes the
effects of endogenous transporters on drug transport across MDCK cells into
account. Hence, in theory, the effect of human P-gp, is evaluated specifically.
However, transfection with ABCB1 may alter the expression of endogenous
transporters (Kuteykin-Teplyakov et al., 2010). Therefore, a cTR value of ≥ 1.5, in
conjunction with a reduction in TR in MDCKII-MDR1 cells on co-incubation of a P-gp
inhibitor, is required for confirmation that the test compound is a P-gp substrate
(Polli et al., 2001; Schwab et al., 2003).
(4.3)
4.5.2. Escitalopram extraction from plasma and brain tissue
Escitalopram was extracted from plasma and brain tissue obtained from in vivo
pharmacokinetic studies using a liquid-liquid extraction technique described
previously (Clarke et al., 2009), with some modifications. Briefly, 48 µl of plasma
was spiked with 2 µl of the internal standard, verapamil, to yield a final
concentration of 1 µg.ml-1 verapamil. To this verapamil-spiked plasma, 1 ml of
sodium hydroxide (2 M) and 3 ml of water were added. Extraction was carried out
in 7.5 ml of 1.5% isoamyl alcohol in n-heptane by vortexing for 30 seconds, followed
by agitation on a mechanical shaker for 15 min and then centrifugation at 5000 rpm
for 15 min at 20°C. The upper solvent layer was transferred to a tube containing
200 µl of 25 mM OPA, vortexed for 30 seconds, then agitated on a mechanical
= (𝑀𝐷𝐶𝐾𝐼𝐼−𝑀𝐷 1)
(𝑀𝐷𝐶𝐾𝐼𝐼−𝑊 )
= 𝑎𝑝𝑝 ,𝐵 𝐴
𝑎𝑝𝑝 ,𝐴 𝐵

Chapter 4: Escitalopram and P-gp
194
shaker for 15 min followed by centrifugation at 5000 rpm for 15 min at room
temperature. Twenty microlitres of the lower aqueous phase was injected onto the
HPLC system for analysis. Brain tissue samples were weighed prior to
homogenization in 500 µl of verapamil-spiked (1 µg.ml-1) homogenization buffer
(i.e. HPLC mobile phase). Homogenized brain tissue was centrifuged at 14 000 rpm
at 8°C for 15 min, and escitalopram was extracted from 200 µl of the supernatant as
described above. As verapamil was used as a P-gp inhibitor in pharmacodynamic tail
suspension test (TST) studies, imipramine was used as an internal standard for
extractions from samples obtained following the TST. Due to technical difficulties
during this extraction procedure in brain samples from the TST, 2-4 samples per
group were lost during the extraction process, meaning that drug levels could not
be ascertained for these animals.

195
Chapter 5:
The P-glycoprotein Inhibitor Cyclosporin A
Differentially Influences Behavioural and
Neurochemical Responses to the Antidepressant
Escitalopram
Fionn E. O’Brien1,2,3, Richard M. O’Connor3, Gerard Clarke1,4, Maria D. Donovan2,3,
Timothy G. Dinan1,4, Brendan T. Griffin2 and John F. Cryan1,3,#
1 Alimentary Pharmabiotic Centre, University College Cork, Cork, Ireland
2 School of Pharmacy, University College Cork, Cork, Ireland
3 Department of Anatomy & Neuroscience, University College Cork, Cork, Ireland
4 Department of Psychiatry, University College Cork, Cork, Ireland
Published in: Behavioural Brain Research (2013) doi: 10.1016/j.bbr.2013.11.027

Chapter 5: CsA and Escitalopram
196
Abstract
Recent studies have raised the possibility that P-glycoprotein (P-gp) inhibition may
represent a putative augmentation strategy for treatment with certain
antidepressants. Indeed, we have previously shown that administration of the P-gp
inhibitor verapamil increased the brain distribution and behavioural effects of the
antidepressant escitalopram. The aim of the current study was to investigate if
similar effects occur with another P-gp inhibitor, cyclosporin A (CsA). CsA pre-
treatment exacerbated the severity of behaviours in an escitalopram-induced
mouse model of serotonin syndrome, a potentially life-threatening adverse drug
reaction associated with serotonergic drugs. P-gp inhibition by CsA enhanced the
brain distribution of escitalopram by 70-80%. Serotonin (5-HT) turnover in the
prefrontal cortex was reduced by escitalopram, and this effect was augmented by
CsA. However, CsA pre-treatment did not augment the effect of escitalopram in the
tail suspension test (TST) of antidepressant-like activity. Microdialysis experiments
revealed that pre-treatment with CsA failed to augment, but blunted, the increase
in extracellular 5-HT in response to escitalopram administration. This blunting effect
may contribute to the lack of augmentation in the TST. Taken together the present
studies demonstrate that co-administration of CsA and escitalopram produces
differential effects depending on the behavioural and neurochemical assays
employed. Thus the results highlight the need for further studies involving more
selective pharmacological tools to specifically evaluate the impact of P-gp inhibition
on behavioural responses to antidepressants which are subject to efflux by P-gp.

Chapter 5: CsA and Escitalopram
197
5.1. Introduction
Currently available drug treatments for depression have unsatisfactory efficacy,
with an estimated 50-60% of patients failing to adequately respond to
antidepressant treatment (Fava, 2003). Hence, there is a major impetus to
elucidate, and overcome, the mechanisms underlying resistance to antidepressant
drug treatment. Increasing evidence from preclinical and clinical studies has
highlighted a key role for the multidrug resistance efflux transporter P-glycoprotein
(P-gp), expressed at the blood-brain barrier (BBB), in limiting the brain distribution,
and therefore efficacy, of several antidepressant drugs (Uhr et al., 2008; Clarke et
al., 2009; O'Brien et al., 2012b; Karlsson et al., 2013; O'Brien et al., 2013a).
We have recently demonstrated that the selective serotonin reuptake inhibitor
(SSRI) escitalopram, one of the most commonly prescribed antidepressants, is a
transported substrate of human P-gp in vitro (O'Brien et al., 2013b, Chapter 4).
Moreover, pre-treatment with the P-gp inhibitor verapamil enhanced the brain
distribution of escitalopram and augmented its antidepressant-like activity in mice
(O'Brien et al., 2013b, Chapter 4), as measured in the tail suspension test (TST), one
of the most widely used models for assessing antidepressant activity in rodents
(Cryan et al., 2005a). In addition, microdialysis studies revealed that administration
of another P-gp inhibitor, cyclosporin A (CsA), also resulted in enhanced brain levels
of escitalopram in rats, thereby confirming the involvement of P-gp in its BBB
transport (O'Brien et al., 2013b, Chapter 4). These results raise the possibility that
treatment with escitalopram, and potentially other antidepressants which are
transported P-gp substrates, could be augmented by adjunctive therapy with a P-gp
inhibitor.
Notwithstanding the potential of P-gp inhibition to enhance antidepressant brain
distribution and therapeutic efficacy, the possibility that adjunctive P-gp inhibitor
therapy may elicit unwanted side effects merits further consideration. Indeed,
there is evidence to suggest that concurrent administration of serotonin (5-HT)
enhancing antidepressants and CsA, which is a clinically used immunosuppressant
as well as an inhibitor of P-gp, can result in serious adverse drug reactions. Three
Chapter 5: CsA and Escitalopram
198
case studies describing incidences of serotonin syndrome, a potentially life-
threatening adverse drug reaction associated with excessive serotonergic
neurotransmission (Boyer and Shannon, 2005), in patients treated with CsA and 5-
HT enhancing antidepressants, including escitalopram, have been published (Wong
et al., 2002; Lang et al., 2008; Newey et al., 2011). In addition, there have been over
30 reports of CsA-related serotonin syndrome since 2001, according to the FDA
Adverse Event Reporting System
(http://www.ehealthme.com/ds/cyclosporine/serotonin+syndrome; Accessed
29/09/13).
In the present studies, the effect of CsA administration in an escitalopram-induced
mouse model of serotonin syndrome was investigated to determine if CsA impacts
on the severity of behaviours associated with this model. In addition, further
behavioural studies were undertaken to determine if CsA pre-treatment would
augment the antidepressant-like activity of escitalopram in the TST, as previously
reported for another P-gp inhibitor (verapamil) (O'Brien et al., 2013b, Chapter 4).
Finally, the neurochemical effects of this drug combination were assessed by
measuring brain tissue levels of 5-HT and its metabolite, 5-hydroxyindoleacetic acid,
and by conducting intracerebral microdialysis studies to investigate the effect of
pre-treatment with CsA on the increase in extracellular 5-HT in response to
escitalopram administration.
Chapter 5: CsA and Escitalopram
199
5.2. Material and methods
5.2.1. Drugs and chemicals
Cyclosporin A (CsA; Sandimmun Concentrate for Solution for Infusion) was
purchased from Uniphar Group (Ireland). Escitalopram oxalate was purchased from
Discovery Fine Chemicals (Dorset, UK). 5-hydroxytryptophan (5-HTP) was obtained
from Sigma-Aldrich (Ireland), as were all other chemicals, reagents and materials
unless otherwise stated.
5.2.2. Animals
Male C57BL/6JOlaHsd mice (6-8 weeks old) and male Sprague Dawley rats
(weighing 265-315 g), purchased from Harlan Laboratories, UK, were used in these
studies. All animals were group-housed 4 animals per cage and maintained on a 12
hour light/dark cycle (lights on at 08:00 h) with food and water ad libitum. Room
temperature was controlled at 22 ± 1°C. All procedures were carried out in
accordance with EU directive 2010/63/EU and approved by the Animal
Experimentation & Ethics Committee of University College Cork.
5.2.3. Effect of CsA administration in a mouse model of serotonin
syndrome
Serotonin syndrome was evoked in male C57BL/6JOlaHsd mice by adapting
previously described methods involving co-administration of the serotonin
precursor 5-HTP and the SSRI escitalopram (Sanchez et al., 2003; Kreilgaard et al.,
2008). These agents act to increase serotonergic neurotransmission by enhancing
serotonin synthesis and preventing its reuptake, respectively (Haberzettl et al.,
2013). Together, these treatments induced a syndrome characterised by a number
of specific behaviours, as outlined in Table 5.1 (Diaz and Maroteaux, 2011;
Haberzettl et al., 2013). Mice were pre-treated with CsA (37.5, 75 or 150 mg/kg i.p.)
or its vehicle (1/12 ethanol: 2/12 Cremophor EL: 9/12 saline), one hour prior to co-
administration of 5-HTP (100 mg/kg i.p.) and escitalopram (2 mg/kg i.p.) (n = 7 per
group). Fifteen minutes later, mice were placed into a plexiglass arena (27 cm X 21
cm), and serotonin syndrome-related behaviours were scored by an observer blind
to the treatment groups for six one-minute periods at five-minute intervals (Figure

Chapter 5: CsA and Escitalopram
200
5.1A; Table 5.1). The sum of scores for each behaviour over the course of the
experiment was totalled for each animal as a measurement of the severity of each
behaviour. In addition, an overall serotonin syndrome score was calculated by
adding the sum of scores for each behaviour. Doses of 5-HTP and escitalopram
were chosen based on pilot studies and reports that treatment with 5-HTP (100
mg/kg) induces serotonin syndrome behaviours only when administered in
combination with another serotonin enhancing agent such as escitalopram
(Sanchez et al., 2003; Kreilgaard et al., 2008).
Table 5.1: Table listing the intermittent and continuous behaviours, and scoring systems, associated with the mouse model of serotonin syndrome used in the present study (adapted from Diaz and Maroteaux, 2011; Haberzettl et al., 2013)
Intermittent
behaviours Scoring
Continuous
Behaviours Scoring
Backward gait 0 Absent Flat body position 0 Absent
Tics 1 Once Piloerection 1 Perceptible
Hunched back 2 Several times Straub tail 2 Weak
Head weaving 3 Frequently Hind limb abduction 3 Medium
Forepaw treading 4 Permanently Tremor 4 Maximal
5.2.4. Influence of CsA pre-treatment on the brain distribution
and neurochemical and behavioural effects of
escitalopram
5.2.4.1. Tail suspension test
The tail suspension test (TST), one of the most widely used models for assessing
antidepressant activity in rodents (Cryan et al., 2005a), was carried out using male
C57BL/6JOlaHsd mice (6-8 weeks old; total n= 64 from Harlan, UK), as described
previously (O'Brien et al., 2013b). This facilitated investigation of the impact of pre-
treatment with the P-gp inhibitor CsA on the antidepressant-like activity of
escitalopram. Briefly, after a 5-7 day acclimation period, mice were pre-treated
with either the P-gp inhibitor CsA (75 mg/kg i.p.) or its vehicle one hour before
administration of either escitalopram (0.1 or 1 mg/kg i.p.) or saline (n = 9-14 per
group). Thirty minutes after the second injection, mice were individually suspended

Chapter 5: CsA and Escitalopram
201
by the tail from a horizontal bar using adhesive tape. Six minute test sessions were
recorded by video camera and the amount of time spent immobile by each animal
was subsequently scored by a trained observer blind to the treatment groups.
Doses of escitalopram and CsA were selected based on previous studies
(Zomkowski et al., 2010; O'Brien et al., 2012a; O'Brien et al., 2013b). Moreover,
pilot studies revealed that treatment with a higher dose of CsA (150 mg/kg)
resulted in a substantial increase in immobility in the TST, likely due to sedative
side-effects (data not shown).
5.2.4.2. Brain concentrations of escitalopram, 5-HT and 5-HIAA
Brain tissue (prefrontal cortex (PFC) and hippocampus) was harvested from each
animal 10 min after commencement of the TST. Hippocampal escitalopram levels
were determined using an extraction procedure and high performance liquid
chromatography (HPLC) method as described previously (O'Brien et al., 2013b).
Briefly, escitalopram was extracted from brain tissue using an acid-base liquid-liquid
extraction technique, with imipramine as an internal standard, prior to analysis by
HPLC with fluorescent detection (excitation wavelength: 249 nm; emission: 302
nm). Due to the low levels of escitalopram present in the brains of mice treated
with the lower dose of escitalopram (0.1 mg/kg), it was necessary to pool
hippocampal samples from two animals in these groups to successfully measure
escitalopram concentrations. In addition, levels of 5-HT and its metabolite, 5-
hydroxyindoleacetic acid (5-HIAA), were measured in the PFC, using previously
described tissue extraction and HPLC analysis methods (Browne et al., 2011;
Browne et al., 2013). Briefly, brain tissue was homogenized in ice cold mobile phase
with N-methyl-5-HT as an internal standard prior to analysis of the supernatant by
HPLC with electrochemical detection. This facilitated investigation of the effect of
escitalopram and/or CsA treatment on 5-HT turnover (i.e. the 5-HIAA:5-HT ratio).
5.2.4.3. Locomotor activity
To investigate potential locomotor effects, which could confound analysis of
behavioural data from the TST, the impact of drug treatment on locomotor activity
was assessed as previously described (O'Brien et al., 2013b). A separate cohort of
mice were pre-treated with either the P-gp inhibitor CsA (75 mg/kg i.p.) or vehicle

Chapter 5: CsA and Escitalopram
202
one hour before administration of either escitalopram (0.1 mg/kg i.p.) or saline (n =
6-7 per group). Thirty minutes after the second injection, mice were individually
placed in activity monitoring units (27 cm X 21 cm). Activity was then monitored via
beam breaks for 60 minutes.
5.2.5. Microdialysis studies to investigate the effect of CsA pre-
treatment on escitalopram-induced increases in
extracellular levels of 5-HT
5.2.5.1. Microdialysis probe construction and calibration
Microdialysis probes were constructed as previously described (O'Brien et al.,
2012a, Chapter 2). In vitro probe recovery values ranged from ~11 – 14% for 5-HT.
Dialysate values were not corrected to account for in vitro recovery, as the diffusion
properties of compounds in brain tissue are likely different from in vitro conditions
(Anderzhanova and Wotjak, 2013). Rather, dialysate 5-HT values are expressed as a
percentage of basal concentration, calculated independently for each individual
animal based on a minimum of three samples prior to drug administration, thereby
facilitating comparison of relative changes in extracellular 5-HT levels following
treatment (Anderzhanova and Wotjak, 2013).
5.2.5.2. Surgical procedures
Microdialysis studies were undertaken in male Sprague Dawley rats. The jugular
vein of each rat was catheterised using standard surgical techniques, to facilitate
intravenous drug administration, and microdialysis probes were inserted into the
prefrontal cortex (PFC) (2.7 mm anterior and 0.7 mm lateral to bregma, lowered 5
mm from dura (Paxinos and Watson, 1998)), as described previously (O'Brien et al.,
2012a; O'Brien et al., 2013b). Post-surgery, rats were single-housed in cylindrical
plexiglass containers with the probe inlet connected to a fluid swivel (Instech
Laboratories, Plymouth Meeting, PA). Artificial cerebrospinal fluid (147 mM NaCl,
1.7 mM CaCl2, 0.9 mM MgCl2, and 4mM KCl) was perfused through each
microdialysis probe at a rate of 1.5 μl.min-1. Rats were allowed to recover overnight
prior to sampling on the following day during the optimal post-surgical period (de
Lange et al., 2000).

Chapter 5: CsA and Escitalopram
203
5.2.5.3. Experimental design
CsA (25 mg/kg i.v.) or vehicle were administered 30 minutes prior to escitalopram
administration (0.25 mg/kg i.v. at t = 0 min) (n = 4 per group). The dose of CsA
chosen was based on a previously described dosing regimen shown to result in P-gp
inhibition (O'Brien et al., 2012a; O'Brien et al., 2013b). Microdialysis samples were
collected at 20 min intervals before and after drug administration, and stored at -
80oC until analysed by HPLC with electrochemical detection (HPLC-ECD). At the
conclusion of the experiment (t = 240 min), rats were euthanized by intravenous
administration of sodium pentobarbital. Brains were subsequently removed for
histological verification of probe placement.
5.2.5.4. HPLC analysis of 5-HT in microdialysis samples
The HPLC with electrochemical detection (HPLC-ECD) system consisted of a
Shimadzu LC-20AD XR Prominence Pump, CBM-20A communication bus module,
SIL-20AC XR Prominence Autosampler, CTO-20A Prominence Column oven (all
supplied by Mason Technology, Cork, Ireland). System components were used in
conjunction with Shimadzu LC solutions software (Mason Technology). The detector
used was ESA Coulochem III with the 5041 Amperometric Cell (Supplied by ESA
Analytical, Ltd., UK). All samples were injected onto a reversed phase KinetexTM 2.6
µm C18 100 Å (100 x 2.1 mm) column (Phenomenex, Ireland), which was protected
by Krudkatcher Ultra in-line filters (Phenomenex).
The mobile phase consisted of 0.1 M citric acid, 0.1 M sodium dihydrogen
phosphate, 0.01 mM EDTA (Alkem/Reagecon, Ireland), 5.6 mM octane-1-sulphonic
acid and 9% (v/v) methanol (Alkem/Reagecon), adjusted to pH 2.8 with 4 N sodium
hydroxide (Alkem/Reagecon), and was filtered prior to use (Millipore 0.22 µm
Durapore filters, Millipore, Ireland). Compounds were eluted isocratically over a 20
minute runtime at a flow rate of 0.4 ml/min after a 20 µl injection. The samples
were kept at 8˚C in the cooled autoinjector prior to injection and the column was
maintained at 30˚C. The glassy carbon working electrode, combined with a
platinum reference electrode (ESA Analytical, Ltd), was operated at a potential of
200 mV and a range of 100 pA. 5-HT was identified and quantified based on its

Chapter 5: CsA and Escitalopram
204
characteristic retention time and peak height, as determined by standard injections
which were run at regular intervals during sample analysis.
5.2.6. Data analysis and statistical procedures
Statistical analysis of data was carried out using standard commercial software
(SPSS Statistics, version 20.0.0; SPSS, Inc., Chicago, IL). The differences in brain
levels of escitalopram between two groups were analysed using unpaired t-test.
Results from 5-HT turnover, TST and serotonin syndrome studies were analysed
statistically by one-way ANOVA, with LSD post-hoc where an overall group effect
was determined. Differences in locomotor activity were analysed by two-way
ANOVA with LSD post-hoc to elucidate statistically significant differences between
treatment groups. Comparison of increases in extracellular levels of 5-HT following
escitalopram administration with and without pre-treatment with CsA were
analysed by repeated measures ANOVA, with parameter estimates analysis
highlighting time points where significant differences existed between the groups.
The criterion for statistical significance was p ≤ 0.05.

Chapter 5: CsA and Escitalopram
205
5.3. Results
5.3.1. Effect of CsA administration in a mouse model of serotonin
syndrome
5.3.1.1. Pre-treatment with CsA exacerbated the severity of behaviours
associated with a mouse model of serotonin syndrome
A statistically significant difference in overall serotonin syndrome score was
observed between the groups (F(3, 24) = 24.351, p < 0.001; Figure 5.1B). In
addition, statistically significant differences between the groups for each of the
three most prominent behaviours were observed (Figure 5.1C-E): tics (F(3, 24) =
14.762, p < 0.001), tremor (F(3, 24) = 7.838, p = 0.001) and hind limb abduction (F(3,
24) = 14.257, p < 0.001).
For the overall score, as well as for each of these individual behaviours, pre-
treatment with any of the three doses of CsA used resulted in a more severe
manifestation of the serotonin syndrome, as evidenced by the significantly higher
scores, relative to vehicle-pre-treated controls (p < 0.05, 0.01 or 0.001 in each case;
Figure 5.1B-E).

Chapter 5: CsA and Escitalopram
206
Figure 5.1: Effect of cyclosporin A (CsA) pre-treatment in a mouse model of serotonin syndrome. A Schematic illustrating the dosing regimen and scoring protocol used. B Overall serotonin syndrome score. Pre-treatment with any of the 3 doses of CsA significantly increased the overall serotonin syndrome score, relative to vehicle-treated mice. This increase was significantly lower in mice treated with 75 mg/kg CsA compared to the other two doses of CsA. C Cumulative scores for tics behaviour. Pre-treatment with any of the 3 doses of CsA resulted in a significantly greater number of tics during the observation periods compared to vehicle-treated mice, and this effect was more substantial in mice pre-treated with 150 mg/kg than 75 mg/kg of CsA. D Cumulative scores for tremor behaviour. Pre-treatment with any of the 3 doses of CsA significantly increased the severity of tremors in the mouse model of serotonin syndrome during the observation periods, relative to the vehicle-treated group. E Cumulative hind limb abduction score. Hind limb abduction was more pronounced in mice pre-treated with CsA than vehicle. This effect was greater in mice in receipt of CsA 37.5 or 150 mg/kg than 75 mg/kg (n = 7 per group). * p < 0.05; ** p < 0.01; *** p < 0.001 relative to vehicle-pre-treated group # p < 0.05; # # p < 0.01 between indicated groups in receipt of different doses of CsA

Chapter 5: CsA and Escitalopram
207
5.3.2. Influence of CsA pre-treatment on the brain distribution
and neurochemical and behavioural effects of
escitalopram
5.3.2.1. CsA pre-treatment increased hippocampal concentrations of
escitalopram
Hippocampal escitalopram concentrations were significantly greater in mice pre-
treated with the P-gp inhibitor CsA than control mice at both doses of escitalopram
treatment (Figure 5.2A+B). Pre-treatment with CsA resulted in a 71.4% increase in
brain escitalopram levels in mice treated with 0.1 mg/kg of escitalopram (t(4.474) =
-10.147, p < 0.001; Figure 5.2A) and a 79.8% increase in brain escitalopram levels in
mice treated with 1 mg/kg of escitalopram (t(16) = -7.385, p < 0.001; Figure 5.2B).
Figure 5.2: Effect of cyclosporin A (CsA) pre-treatment on brain concentrations of escitalopram. A Pre-treatment with CsA (75 mg/kg) resulted in a 71.4% increase in hippocampal concentrations of escitalopram at a dose of 0.1mg/kg (n = 5 pooled samples per group). B Pre-treatment with CsA (75 mg/kg) resulted in a 79.8% increase in hippocampal concentrations of escitalopram at a dose of 1mg/kg (n = 9 per group). # # # p < 0.001 between groups
Escitalopram 0.1 mg/kg
0
50
100
CsA (mg/kg) 0 75
# # #
Escit
alo
pra
m c
on
cen
trati
on
(n
g/g
)
Escitalopram 1 mg/kg
0
500
1000
CsA (mg/kg) 0 75
# # #
Escit
alo
pra
m c
on
cen
trati
on
(n
g/g
)A B

Chapter 5: CsA and Escitalopram
208
5.3.2.2. Pre-treatment with CsA augmented the effect of escitalopram on
serotonin turnover in the PFC
The treatment groups differed significantly in terms of 5-HT turnover in the PFC
(F(5, 60) = 13.961, p < 0.001; Figure 5.3A). There was no difference in PFC 5-HT
levels between the treatment groups (F(5, 60) = 1.494, p = 0.205; Figure 5.3B), but
there was a significant difference in PFC 5-HIAA levels (F(5, 60) = 2.513, p = 0.039;
Figure 5.3C).
In vehicle-pre-treated animals, escitalopram had no effect on either 5-HT or 5-HIAA
levels in the PFC, but reduced 5-HT turnover at the higher dose of escitalopram only
(1 mg/kg; p < 0.001).
CsA administration, without escitalopram treatment, had no impact on 5-HT levels,
5-HIAA levels or 5-HT turnover (p > 0.05). However, when CsA pre-treatment was
followed by escitalopram administration, 5-HIAA levels were significantly reduced
compared to control mice (p = 0.019 and 0.012 for escitalopram 0.1 and 1 mg/kg,
respectively). Interestingly, at both low (0.1 mg/kg) and high (1 mg/kg) doses of
escitalopram, CsA pre-treatment resulted in statistically significant reductions in 5-
HT turnover relative to the control group (p < 0.001). Moreover, 5-HT turnover was
reduced to a greater extent after CsA pre-treatment than observed following
administration of the same dose of escitalopram on its own (p < 0.01 for both doses
of escitalopram).

Chapter 5: CsA and Escitalopram
209
Figure 5.3: Effect of escitalopram and cyclosporin A (CsA) on 5-HT turnover, as well as 5-HT and 5-HIAA levels, in the PFC. A Escitalopram treatment reduced 5-HT turnover (i.e. the 5-HIAA:5-HT ratio) in a dose-dependent manner, with a significant reduction at 1 mg/kg, but not at 0.1 mg/kg. CsA treatment without escitalopram did not alter 5-HT turnover. However, when both CsA and escitalopram were administered, 5-HT turnover was reduced to a greater extent than at the equivalent dose of escitalopram without CsA pre-treatment. B Treatment with escitalopram and/or CsA had no significant impact on 5-HT concentrations in the PFC. C Escitalopram or CsA treatment alone did not cause a significant change in concentrations of the 5-HT metabolite, 5-HIAA, in the PFC. However, when escitalopram and CsA treatments were combined, 5-HIAA concentrations were significantly reduced, to the same extent, in comparison to the control group at each dose of escitalopram investigated (n = 9-14 per group). * p < 0.05; *** p < 0.001 relative to vehicle- and saline-treated control group # # p < 0.01 between indicated groups in receipt of the same dose of escitalopram

Chapter 5: CsA and Escitalopram
210
5.3.2.3. CsA pre-treatment did not augment escitalopram activity in the
tail suspension test
There was a significant difference between the groups in terms of immobility in the
TST (F(5, 58) = 9.859, p < 0.001; Figure 5.4A). In vehicle-pretreated mice,
escitalopram reduced the time spent immobile. Treatment with the higher (1
mg/kg) dose of escitalopram resulted in a statistically significant 40% reduction in
immobility compared to the saline-treated control group (p = 0.001), whereas
treatment with the lower (0.1 mg/kg) dose of escitalopram did not elicit a
significant reduction in immobility (p = 0.394).
Pre-treatment with CsA had no impact on immobility in saline-treated mice (p =
0.272). In common with vehicle-pre-treated mice, administration of the higher dose
of escitalopram significantly reduced the time spent immobile in the TST in CsA-pre-
treated mice (p < 0.001 vs controls). There was no difference in immobility
following administration of the higher dose of escitalopram between vehicle- and
CsA-pre-treated animals (p = 0.430). However, in mice treated with the lower dose
of escitalopram, there was a statistically significant difference between vehicle- and
CsA-pre-treated animals (p = 0.017), with CsA pre-treatment resulting in 37%
increase in the duration of immobility in the TST.

Chapter 5: CsA and Escitalopram
211
5.3.2.4. CsA treatment significantly reduced locomotor activity
Escitalopram treatment had no effect on locomotor activity (F(1, 23) = 0.165, p =
0.689; Figure 5.4B). In contrast, CsA did have a significant effect on this parameter
(F(1, 23) = 23.78, p < 0.001), but there was no interaction between the two
treatments (F(1, 23) = 0.727, p = 0.403). Post-hoc analysis revealed that CsA
treatment significantly diminished locomotor activity, with a 40-45% reduction in
the distance travelled in the activity monitoring unit, regardless of whether saline (p
= 0.01) or escitalopram (p = 0.005) was subsequently administered.

Chapter 5: CsA and Escitalopram
212
Figure 5.4: Effect of escitalopram and cyclosporin A (CsA) on immobility in the tail suspension test (TST) and locomotor activity. A Escitalopram reduced immobility in the TST in a dose-dependent manner, with a significant 40% reduction in mice treated with 1 mg/kg but no significant reduction in mice treated with 0.1 mg/kg of escitalopram. CsA treatment, without escitalopram, had no significant impact on immobility in the TST nor did CsA augment the antidepressant-like effects of escitalopram in the TST. On the contrary, pre-treatment with CsA before the 0.1 mg/kg dose of escitalopram caused a significant increase in the time spent immobile compared to mice in receipt of the same dose of escitalopram without CsA pre-treatment (n = 9-14 per group). B CsA treatment significantly reduced locomotor activity by 40-45%, with or without escitalopram administration. Escitalopram had no effect on locomotor activity (n = 6-7 per group). * p < 0.05; ** p < 0.01; *** p < 0.001 relative to vehicle- and saline-treated control group # p < 0.05 between indicated groups in receipt of the same dose of escitalopram

Chapter 5: CsA and Escitalopram
213
5.3.3. Microdialysis studies to investigate the effect of CsA pre-
treatment on escitalopram-induced increases in
extracellular levels of 5-HT
5.3.3.1. Pre-treatment with CsA attenuated the increase in extracellular
5-HT in the PFC in response to escitalopram administration
Pre-treatment with CsA attenuated the increase in extracellular 5-HT following
escitalopram administration, relative to the vehicle-pre-treated group (F(1, 6) =
6.899, p = 0.039; Figure 5.5). In addition, there was a significant group x time
interaction (F(15, 90), p < 0.001), indicating that the time-profile of 5-HT increase
differed between the groups.
In vehicle pre-treated rats, dialysate 5-HT levels rose to ~300-400% of basal levels
directly after administration of escitalopram, with a maximal increase to 411% of
basal levels at t = 80 min preceding a drop to ~250% at t = 240 min. In contrast, in
CsA pre-treated rats, escitalopram-induced increases in dialysate 5-HT levels rose
gradually and consistently to a maximum of ~223% at t = 200 min, and this increase
was significantly smaller than that observed in the vehicle-treated group up to 100
min post-escitalopram administration (Figure 5.5).

Chapter 5: CsA and Escitalopram
214
-80 -40 0 40 80 120 160 200 2400
100
200
300
400
500Escit+VEH
Escit+CsA
** *****
** *VEH or CsA
Escitalopram
Time (min)
Dia
lysate
5-H
T
(% o
f b
asal)
Figure 5.5: Effect of cyclosporin A (CsA) pre-treatment on escitalopram-induced increases in extracellular 5-HT in the PFC. Compared to the vehicle-treated control group, pre-treatment with CsA transiently blunted the increases in extracellular 5-HT in response to escitalopram treatment, with significantly lower increases from 20 – 100 minutes post-escitalopram administration, inclusive (n = 4 per group). * p < 0.05; ** p < 0.01; *** p < 0.001 relative to vehicle-treated group

Chapter 5: CsA and Escitalopram
215
5.4. Discussion
Increasing preclinical evidence indicates that inhibition of the drug efflux
transporter P-gp at the BBB may represent a putative strategy to augment therapy
with certain antidepressants by increasing their brain delivery (Ejsing and Linnet,
2005; Clarke et al., 2009; O'Brien et al., 2012a; O'Brien et al., 2012b; O'Brien et al.,
2013b). However, the potential clinical consequences of this strategy in terms of
increased side effects merit careful consideration. The prospect of increasing the
risk of serious side effects is a particular concern in light of case studies reporting
serotonin syndrome in patients treated with both 5-HT enhancing antidepressants
and CsA, which is a P-gp inhibitor in addition to its primary pharmacological action
as an immunosuppressant (Wong et al., 2002; Lang et al., 2008; Newey et al., 2011).
Indeed our data, using an animal model of serotonin syndrome, show for what is to
our knowledge the first time that CsA can augment the behavioural effects of the
SSRI escitalopram. In addition, CsA pre-treatment augmented the effect of
escitalopram on 5-HT turnover in the prefrontal cortex (PFC). Intriguingly, CsA failed
to enhance the effects of escitalopram in the TST, and actually blunted its
neurochemical effect in terms of increases in extracellular 5-HT concentrations in
the prefrontal cortex.
Serotonin syndrome is a potentially fatal adverse drug reaction, which occurs as a
result of excessive 5-HT signalling following ingestion of agents which enhance
serotonergic neurotransmission (Boyer and Shannon, 2005). It is characterised by
clinical symptoms such as tremor, clonus, muscular hypertonicity, altered mental
state and hyperthermia in patients (Boyer and Shannon, 2005). Examples of agents
which may precipitate serotonin syndrome include SSRIs and other antidepressants,
especially monoamine oxidase inhibitors (MAOIs), some antiemetics (e.g.
ondansetron, granisetron and metoclopraminde), certain drugs of abuse (e.g.
MDMA and LSD) and 5-HT precursors such as tryptophan (Boyer and Shannon,
2005; Haberzettl et al., 2013). While serotonin syndrome may occur after ingestion
of a single 5-HT enhancing agent, it is more commonly associated with intake of two
or more serotonergic drugs with differing mechanisms of action, such as SSRIs and
MAOIs (Haberzettl et al., 2013). Indeed, life-threatening cases are generally only

Chapter 5: CsA and Escitalopram
216
observed where a combination of agents has been taken (Gillman, 2005).
Importantly, the incidence of serotonin syndrome is thought to be rising with
increased prescribing of serotonergic drugs (Thanacoody, 2012). Considering the
serious and potentially fatal outcomes associated with serotonin syndrome, it is not
possible to conduct human experiments to investigate drug combinations which
may induce the syndrome. However, many of the symptoms of serotonin syndrome
can be successfully emulated in rodent models (Haberzettl et al., 2013). Thus, due
to their high level of predictive validity, such rodent models of serotonin syndrome
represent a valuable tool to assess drug combinations suspected of eliciting cases of
serotonin syndrome in humans (Haberzettl et al., 2013). In this context, the present
study offers confirmation that CsA may cause or exacerbate serotonin syndrome
when combined with serotonergic antidepressants, such as escitalopram, as per
previous case studies reported in humans treated with CsA in combination with
escitalopram, venlafaxine or sertraline (Wong et al., 2002; Lang et al., 2008; Newey
et al., 2011).
In addition to inhibiting P-gp, CsA has other pharmacological actions that may be
responsible for the effects seen in the present study. For example, CsA is a potent
calcineurin inhibitor and immunosuppressant. Interestingly, CsA has been reported
to potentiate tremors induced by harmine, a naturally occurring plant alkaloid
which inhibits the monoamine oxidase enzyme, thereby implicating the
monoaminergic system in its pharmacology (Shuto et al., 1998). Indeed, the present
data point to pharmacodynamic interactions between CsA and escitalopram
affecting serotonin transmission that may be either P-gp dependent or
independent. It is worth noting that the intermediate dose of CsA used in this study
(75 mg/kg) elicited a significantly milder exacerbation of the mouse model of
serotonin syndrome than the other two doses used (37.5 and 150 mg/kg). The
mechanism underlying this dose-dependent effect is unclear. However, pilot studies
revealed that the 75 and 150 mg/kg doses of CsA resulted in similar increases in
brain tissue concentrations of escitalopram (71% vs 62% increase, respectively; data
not shown). These findings indicate that a P-gp independent mechanism may be at
play, as the dose-dependent effect of CsA on serotonin syndrome behaviours

Chapter 5: CsA and Escitalopram
217
cannot be attributed to differences in brain levels of escitalopram. Further studies
are needed to ascertain whether findings in relation to the effect of CsA in this
model of serotonin syndrome occurred as a result of increased brain levels of
escitalopram at key sites involved in the regulation of serotonin syndrome due to P-
gp inhibition, or reflect an intrinsic effect of CsA on the serotonergic system.
We have recently demonstrated that pre-treatment with the P-gp inhibitor
verapamil results in increased escitalopram levels in brain homogenates (O'Brien et
al., 2013b, Chapter 4). In the present study, the impact of pre-treatment with CsA in
the same paradigm was investigated to determine if observations in relation to
verapamil extend to other P-gp inhibitors. Similar increases in escitalopram brain
concentrations were observed following pre-treatment with CsA as previously
reported for verapamil, thereby further confirming the key role played by P-gp in
the brain distribution of escitalopram.
In line with data from previous reports using different antidepressants (Connor et
al., 2000; Stenfors and Ross, 2002; Miura et al., 2005; Miura et al., 2007),
escitalopram treatment was found to reduce 5-HT turnover in the PFC in a dose-
dependent manner in the present study. Pre-treatment with CsA augmented this
effect. Despite there being a ~5-fold difference in brain levels of escitalopram
between the two groups (70 vs 349 ng/g, respectively), 5-HT turnover was reduced
to the same extent in mice treated with CsA and the lower dose of escitalopram as
those treated with the higher dose of escitalopram without CsA pre-treatment.
Therefore, the augmentation of escitalopram’s effect on 5-HT turnover by CsA pre-
treatment cannot be fully attributed to the increased brain levels of escitalopram
due to P-gp inhibition. Moreover, significant reductions in the PFC concentration of
the 5-HT metabolite, 5-HIAA, were only observed when both CsA and escitalopram
were administered together, regardless of brain concentrations of escitalopram.
Taken together, these observations indicate that CsA and escitalopram may work in
concert to reduce 5-HT turnover by reducing 5-HT metabolism via a P-gp-
independent mechanism, likely related to other pharmacological actions of CsA.
Interestingly, CsA administration on its own had no effect on 5-HT turnover,

Chapter 5: CsA and Escitalopram
218
suggesting that these effects are dependent on states where alterations in 5-HT
signalling are already present, as is the case following SSRI treatment.
In contrast to previous findings in relation to the P-gp inhibitor verapamil (O'Brien
et al., 2013b, Chapter 4), pre-treatment with CsA did not result in an augmentation
of escitalopram’s antidepressant-like activity in the TST. On the contrary, CsA pre-
treatment significantly increased the time spent immobile in mice treated with the
lower dose of escitalopram. The suppression of locomotor activity by CsA may
preclude meaningful interpretation of its influence on behaviour in the TST, as this
paradigm is sensitive to changes in locomotor activity unrelated to antidepressant-
like activity. It is worth noting, however, that verapamil treatment resulted in a
similar reduction in locomotion in the above-mentioned study in which it was found
to augment the antidepressant-like activity of escitalopram (O'Brien et al., 2013b,
Chapter 4). Importantly, intracerebral administration of calcineurin inhibitors,
including CsA, has been reported to induce depressive-like behaviour in rodent
models of depression (Zhu et al., 2011; Yu et al., 2013), thus underlining the
difficulties encountered when conducting behavioural P-gp inhibition studies using
relatively non-selective inhibitors. The divergence between the effects of CsA and
verapamil pre-treatment on escitalopram activity in the TST, despite comparable
reductions in locomotor activity and similar increases in brain levels of escitalopram
for both P-gp inhibitors, highlights the need for further studies involving more
selective P-gp inhibitors, such as the CsA analogue valspodar or tariquidar, to
specifically elucidate the impact of P-gp inhibition on the antidepressant-like
activity of escitalopram.
In light of the behavioural data observed, where CsA increased the severity of an
escitalopram-induced mouse model of serotonin syndrome but did not augment
the antidepressant-like activity of escitalopram in the TST, and the combined effect
of CsA and escitalopram in reducing 5-HT turnover, intracerebral microdialysis
studies were undertaken to investigate the pharmacodynamic effect of co-
administration of CsA and escitalopram on extracellular 5-HT. These experiments
were of particular interest considering a previous microdialysis study reported that
CsA administration reduced extracellular 5-HT levels in the PFC in mice by over 50%

Chapter 5: CsA and Escitalopram
219
relative to basal concentrations (Sato et al., 2007). To our knowledge, the present
study represents the first time that the impact of CsA administration on SSRI-
induced increases in extracellular 5-HT has been investigated. These experiments
revealed that CsA markedly blunted the increase in extracellular 5-HT in response
to escitalopram administration. These microdialysis findings may help to explain
why CsA differed to verapamil in terms of its impact on escitalopram activity in the
TST, as depletion of 5-HT attenuates the response to SSRIs in this paradigm (O'Leary
et al., 2007). However, it must be noted that, for technical reasons, microdialysis
experiments were undertaken in the rat, as opposed to mice used in behavioural
studies. Thus, potential inter-species differences between rats and mice in terms of
serotonergic responses to CsA need to be taken into consideration when
attempting to compare results from behavioural and microdialysis experiments.
Further studies, investigating the impact of CsA on serotonergic signalling in an
SSRI-induced animal model of serotonin syndrome, will offer additional insight into
the mechanism underlying the differential effects of CsA on behavioural responses
to escitalopram. In addition, future intracerebral microdialysis experiments should
be conducted to determine the effect of treatment with more selective P-gp
inhibitors (Colabufo et al., 2010), as opposed to CsA or verapamil, on escitalopram-
induced increases in extracellular 5-HT.

Chapter 5: CsA and Escitalopram
220
5.5. Conclusion
In conclusion, the present data reveal novel, but complex, pharmacokinetic and
pharmacodynamic interactions between CsA and the SSRI escitalopram. Firstly, we
demonstrate that CsA pre-treatment exacerbates the severity of symptoms
associated with a mouse model of serotonin syndrome. This finding, in conjunction
with previously published case studies (Wong et al., 2002; Lang et al., 2008; Newey
et al., 2011), indicates that caution should be exercised if CsA is to be administered
concurrently with a serotonergic antidepressant in clinical practice. The mechanism
underlying this effect remains elusive. Further studies are required to determine if
it is due to altered escitalopram pharmacokinetics as a result of P-gp inhibition, or
as a result of a combined effect of CsA and escitalopram on serotonergic
transmission related to other pharmacological actions of CsA, such as calcineurin
inhibition Furthermore, a novel pharmacodynamic interaction between CsA and
escitalopram was revealed, whereby these drugs acted in concert to reduce
serotonin turnover in the prefrontal cortex. Finally, these studies highlight the need
for further investigations using more selective pharmacological tools to specifically
elucidate the effect of P-gp inhibition on the activity of antidepressants which are
transported substrates of P-gp. Such experiments will serve to discriminate
between pharmacokinetic effects, due to P-gp inhibition per se, and potential
pharmacodynamic interactions related to alternative pharmacological effects which
may be encountered when using non-specific P-gp inhibitors.

221
Chapter 6:
P-glycoprotein Inhibition Increases the Brain
Distribution of the Antidepressant Escitalopram
in the Mouse: Effects of Chronic Administration
Fionn E. O’Brien1,2,3, Gerard Moloney3, Karen A. Scott3, Richard M. O’Connor3,
Gerard Clarke1,4, Timothy G. Dinan1,4, Brendan T. Griffin2 and John F. Cryan1,3,#
1 Alimentary Pharmabiotic Centre, University College Cork, Cork, Ireland
2 School of Pharmacy, University College Cork, Cork, Ireland
3 Department of Anatomy & Neuroscience, University College Cork, Cork, Ireland
4 Department of Psychiatry, University College Cork, Cork, Ireland
To be submitted to: Pharmacology Reports & Perspectives

Chapter 6: Chronic verapamil and escitalopram
222
Abstract
Recent preclinical studies have revealed a functionally important role for the drug
efflux pump P-glycoprotein (P-gp) at the blood-brain barrier (BBB) in limiting brain
levels and antidepressant-like activity of certain antidepressant drugs. Specifically,
acute administration of P-gp inhibitors, such as verapamil and CsA, have been
shown to augment brain concentrations and functional activity of the
antidepressant escitalopram in rodents. However, depression is a chronic disorder
and current treatments require prolonged administration to elicit their full
therapeutic effect. Thus, it is important to investigate whether acute findings in
relation to P-gp inhibition translate to chronic paradigms. To this end, the present
study investigates whether chronic treatment with the P-gp inhibitor verapamil and
the antidepressant escitalopram results in enhanced brain distribution and
antidepressant-like effects of escitalopram. Verapamil (10 mg/kg i.p.) and
escitalopram (0.1 mg/kg i.p.) were administered once daily for 22 days. On the final
day of treatment, brain regions and plasma were collected for analysis of cortical
and plasma concentrations of escitalopram and verapamil, and to determine the
hippocampal expression of genes previously reported to be altered by chronic
antidepressant treatment. Verapamil treatment resulted in a greater than two-fold
increase in brain levels of escitalopram, without altering plasma levels. Gene
expression analysis did not reveal an augmentation of molecular responses to
escitalopram treatment as a result of verapamil administration. Taken together,
these data demonstrate for the first time that P-gp inhibition can yield elevated
brain concentrations of an antidepressant after chronic treatment, but the
functional relevance of these increased brain levels remains unclear.

Chapter 6: Chronic verapamil and escitalopram
223
6.1. Introduction
Increasing data have revealed that the multidrug efflux transporter P-glycoprotein
(P-gp), expressed at the blood-brain barrier (BBB), restricts brain levels of several
clinically important antidepressant drugs, thereby potentially contributing to the
high prevalence of treatment failure (Uhr et al., 2008; O'Brien et al., 2012a; O'Brien
et al., 2012b; O'Brien et al., 2013a). Moreover, we have recently demonstrated that
acute inhibition of P-gp by verapamil enhances the behavioural effects of the
antidepressant escitalopram in the tail suspension test (TST) (O'Brien et al., 2013b),
one of the most widely used and well-validated animal models to assess
antidepressant-like activity (Cryan et al., 2005a). Taken together, these findings
raise the possibility that adjunctive treatment with a P-gp inhibitor may represent a
potentially beneficial augmentation strategy in treatment resistant depression.
Most studies investigating the effect of P-gp on antidepressant distribution into the
brain have focused on acute drug administration (O'Brien et al., 2012b). While a
limited number of studies have reported that brain levels of certain antidepressants
are elevated in P-gp knockout mice relative to wild-type controls after subchronic
(10-11 days) treatment (Grauer and Uhr, 2004; Uhr et al., 2008; Karlsson et al.,
2011; Karlsson et al., 2013), no study to date has investigated the effect of chronic
P-gp inhibition on antidepressant distribution into the brain in wild-type animals, to
our knowledge. This is a key consideration, as currently available antidepressants
are associated with a delayed response, typically requiring chronic treatment in
order to achieve their therapeutic effect in patients (Krishnan and Nestler, 2008).
Moreover, certain xenobiotics are known to upregulate the expression and activity
of P-gp (Miller, 2010). Indeed, the antidepressant venlafaxine, which is known to be
a transported P-gp substrate (O'Brien et al., 2012b), has been reported to increase
P-gp function in vitro and in vivo (Ehret et al., 2007; de Klerk et al., 2010). Thus,
even though acute P-gp inhibition can result in increased brain levels of certain
antidepressants, this effect could be negated following chronic exposure due to the
hypothetical counteractive upregulation of P-gp activity.

Chapter 6: Chronic verapamil and escitalopram
224
The primary goal of the present study is to determine whether chronic treatment
with the P-gp inhibitor verapamil and escitalopram would increase the brain
distribution of escitalopram. Recent studies, both in P-gp knockout (acute and
subchronic) (Karlsson et al., 2013) and wild-type (acute only) (O'Brien et al., 2013b)
rodents, have identified that escitalopram, a commonly prescribed selective
serotonin reuptake inhibitor (SSRI) antidepressant, is a transported P-gp substrate
at the BBB. In addition, putative behavioural and molecular effects of chronic
treatment with a P-gp inhibitor and a P-gp substrate antidepressant are
investigated. In particular, the expression of several genes involved in the
regulation of monoaminergic signalling, neurogenesis, responses to stress and gene
transcription and which have been reported to be sensitive to chronic
antidepressant treatment was assessed (Table 6.1).

Chapter 6: Chronic verapamil and escitalopram
225
Table 6.1: Target genes selected for mRNA expression analysis
Gene name
Protein product Function Studies implicating gene in antidepressant response
Nr3c1 Glucocorticoid receptor (GR)
Receptor for glucocorticoids, such as corticosterone in mice
(Peiffer et al., 1991; Seckl and Fink, 1992; Johansson et al., 1998; Bjartmar et al., 2000; Guidotti et al., 2013)
Nr3c2 Mineralocorticoid receptor (MR)
Cytosolic receptor for mineralocorticoids, such as aldosterone, as well as glucocorticoids
(Brady et al., 1991; Seckl and Fink, 1992; Johansson et al., 1998; Bjartmar et al., 2000)
Fkbp5 FK506 binding protein (FKBP5)
Immunophilin protein involved in immunoregulation and protein folding/trafficking
(Guidotti et al., 2013)
Egr1 Early growth response protein 1 (EGR1; aka Zif268 or NGFI-A)
Transcription factor (Morinobu et al., 1997; Johansson et al., 1998; Bjartmar et al., 2000; Sillaber et al., 2008)
Nr4a1 Nerve growth factor IB (NGFI-B)
Transcription factor (Bjartmar et al., 2000)
Slc6a4 Serotonin transporter (SERT)
Reuptake if 5-HT from synaptic space
(Lesch et al., 1993; Lopez et al., 1994; Benmansour et al., 1999)
Tph2 Tryptophan hydroxylase 2 (TPH2)
Rate limiting enzyme in the synthesis of 5-HT in CNS
(Abumaria et al., 2007; Shishkina et al., 2007; Heydendael and Jacobson, 2009)
Htr1a 5-HT1A receptor 5-HT autoreceptor involved in regulation of 5-HT signalling
(Burnet et al., 1994; Abumaria et al., 2007)
Kcnk2 Trek-1 Potassium channel (Heurteaux et al., 2006)
Bdnf Brain derived neurotrophic factor (BDNF)
Neurotrophin (Nibuya et al., 1995; Martinez-Turrillas et al., 2005; Sillaber et al., 2008; Alboni et al., 2010)
Creb cAMP response element-binding protein (CREB)
Transcription factor (Nibuya et al., 1996; Thome et al., 2000; Blom et al., 2002; Alboni et al., 2010)
S100a10 p11 Involved in regulation of 5-HT signalling in brain
(Svenningsson et al., 2006; Melas et al., 2012)

Chapter 6: Chronic verapamil and escitalopram
226
6.2. Material and methods
6.2.1. Drugs and chemicals
Escitalopram oxalate was purchased from Discovery Fine Chemicals (Dorset, UK).
Verapamil was obtained from Sigma-Aldrich (Ireland), as were all other chemicals,
reagents and materials unless otherwise stated.
6.2.2. Animals
Male C57BL/6JOlaHsd mice (6-8 weeks old at the beginning of the study),
purchased from Harlan Laboratories, UK, were used in this study. All animals were
group-housed 4 animals per cage and maintained on a 12 hour light/dark cycle
(lights on at 08:00 h) with food and water ad libitum. Room temperature was
controlled at 22 ± 1°C. All procedures were carried out in accordance with EU
directive 2010/63/EU and approved by the Animal Experimentation & Ethics
Committee of University College Cork.
6.2.3. Experimental design
Verapamil (10 mg/kg i.p.) or saline were administered at least 30min before
escitalopram (0.1 mg/kg i.p.) or saline each morning for 22 days (n = 9-10 per
group). Body weight was measured daily to monitor for potential adverse reactions
to treatment. On the penultimate day of treatment (day 21), mice were subjected
to the tail suspension test to assess the effect of chronic verapamil pre-treatment
on the antidepressant-like activity of escitalopram. On the final day of treatment,
mice were sacrificed 40 min after escitalopram and 100 minutes post-verapamil
administration. Timings were based on previous acute experiments (O'Brien et al.,
2013b, Chapter 4). Brain regions were immediately dissected out in ice-cold PBS
and trunk plasma was collected. All samples were snap frozen in isopentane on dry
ice, and stored at -80˚C until further processing. The dose of escitalopram was
selected based on our previous study, where 0.1 mg/kg of escitalopram was found
to elicit a behavioural effect in the TST only when administered in conjunction with
verapamil (O'Brien et al., 2013b). However, a lower dose of verapamil was used in
the present study (10 mg/kg rather than 20 mg/kg) due to concerns about potential

Chapter 6: Chronic verapamil and escitalopram
227
systemic side effects that may have arisen with prolonged high dose verapamil
treatment.
6.2.4. Tail suspension test
The tail suspension test (TST), one of the most widely used models for assessing
antidepressant activity in rodents (Cryan et al., 2005a), was carried out on the 21st
day of treatment, as described previously (O'Brien et al., 2013b). This facilitated
investigation of the impact of pre-treatment with the P-gp inhibitor verapamil on
the antidepressant-like activity of escitalopram after chronic administration of each
drug. Briefly, on the day of the TST, the P-gp inhibitor verapamil (10 mg/kg i.p.) or
saline was administered one hour before escitalopram (0.1 mg/kg i.p.) or saline
treatment. Thirty minutes after the second injection, mice were individually
suspended by the tail from a horizontal bar using adhesive tape. Six minute test
sessions were recorded by video camera and the amount of time spent immobile by
each animal was subsequently scored by a trained observer blind to the treatment
groups.
6.2.5. Determination of escitalopram and verapamil in brain and
plasma samples
Escitalopram and verapamil were extracted from cortical brain tissue and plasma
using a liquid-liquid extraction technique described previously (Clarke et al., 2009;
O'Brien et al., 2013b). Briefly, 48 µl of plasma was spiked with 2 µl of the internal
standard, imipramine, to yield a final concentration of 1 µg/ml imipramine. To this
imipramine-spiked plasma, 1 ml of sodium hydroxide (2 M) and 3 ml of water were
added. Extraction was carried out in 7.5 ml of 1.5% isoamyl alcohol in n-heptane by
vortexing for 30 seconds, followed by agitation on a mechanical shaker for 15 min
and then centrifugation at 5000 rpm for 15 min at 20°C. The upper solvent layer
was transferred to a tube containing 200 µl of 25 mM OPA, vortexed for 30
seconds, then agitated on a mechanical shaker for 15 min followed by
centrifugation at 5000 rpm for 15 min at room temperature. Twenty microlitres of
the lower aqueous phase was injected onto a HPLC system for analysis of
escitalopram and verapamil, using a previously described HPLC method (O'Brien et
Chapter 6: Chronic verapamil and escitalopram
228
al., 2013b). Brain tissue samples were weighed prior to homogenization in 500 µl of
imipramine-spiked (1 µg/ml) homogenization buffer (i.e. HPLC mobile phase).
Homogenized brain tissue was centrifuged at 14000 rpm at 8°C for 15 min, and
escitalopram and verapamil were extracted from 200 µl of the supernatant as
described above.
6.2.6. Gene expression analysis
The hippocampal expression of twelve genes, which have been shown to be
responsive to chronic antidepressant treatment or implicated in the antidepressant
response (Table 6.1), was analysed using real-time quantitative polymerase chain
reaction (qPCR). To our knowledge, p11, brain-derived neurotrophic factor (BDNF)
and cAMP-responsive element binding protein (CREB) are the only gene targets
which have been shown to be altered by chronic escitalopram treatment in the (rat)
brain (Jacobsen and Mork, 2004; Alboni et al., 2010; Melas et al., 2012). Total RNA
was extracted from hippocampal tissue using a commercially available kit
(mirVanaTM PARISTM Kit, Applied Biosystems, USA), as per the manufacturer’s
instructions. RNA purity and quantity was measured by spectrophotometric analysis
(NanoDrop® ND-1000 Spectrophotometer, NanoDrop Technologies, Inc., USA).
mRNA was reverse transcribed from 1 µg total RNA using a G-storm thermocycler
(G-storm, Surrey, UK). PCR primers and probes were purchased from Integrated
DNA Technologies (Belgium). Assays were designed for murine genes, as detailed in
Table 6.1. Analysis of gene expression was performed in triplicate on 384-well
plates using the LightCycler 480 System (Roche, Ireland), and the expression of each
gene was normalised to that of β-actin. The 2−ΔΔCT method was used to calculate
relative changes in gene expression determined from qPCR experiments (Livak and
Schmittgen, 2001). Gene expression values are expressed relative to the control
group.
6.2.7. Data analysis and statistical procedures
Statistical analysis of data was carried out using standard commercial software
(SPSS Statistics, version 20.0.0; SPSS, Inc., Chicago, IL). The differences in brain and
plasma levels of escitalopram between the two escitalopram-treated groups were

Chapter 6: Chronic verapamil and escitalopram
229
analysed using an unpaired Student’s t-test. Similarly, verapamil concentrations in
brain tissue and plasma were compared by unpaired Student’s t-test. Differences in
gene expression between the groups were analysed by two-way ANOVA, with
verapamil and escitalopram as factors, and the LSD post-hoc was used to elucidate
statistically significant differences between treatment groups. Differences in
changes in body weight over time were analysed by two-way repeated measures
ANOVA, with escitalopram and verapamil as factors. The criterion for statistical
significance was p ≤ 0.05.

Chapter 6: Chronic verapamil and escitalopram
230
6.3. Results
6.3.1. Concomitant chronic treatment with the P-gp inhibitor
verapamil and escitalopram increased the brain levels of
escitalopram, without affecting plasma levels
The concentrations of escitalopram in cortical brain tissue were significantly greater
in mice pre-treated with the P-gp inhibitor verapamil compared to saline-
pretreated mice, whereas there was no significant difference in plasma
escitalopram levels (Figure 6.1A+B). Pre-treatment with verapamil resulted in a
110% increase in cortical escitalopram levels (t(17) = -5.903, p < 0.001; Figure 6.1A),
but had no effect on plasma levels of escitalopram (t(17) = -0.98, p = 0.341); Figure
6.1B). Thus, the increase in brain concentrations of escitalopram can be attributed
to enhanced BBB transport due to P-gp inhibition, rather than a reflection of
elevated plasma concentrations.
Plasma (t(17) = 0.274, p = 0.787) and brain (t(14) = -0.810, p = 0.937) levels of
verapamil were equivalent in both verapamil-treated groups, with mean (± SEM)
concentrations of 390 (± 37) ng/ml in plasma and 202 (±15) ng/g in cortical tissue.

Chapter 6: Chronic verapamil and escitalopram
231
6.3.2. Body weight
Neither drug treatment, nor a combination of both drugs, had an effect on body
weight during the course of the 22 day of drug administration: escitalopram
(F(1,35) = 0.376, p = 0.544); verapamil (F(1, 35) = 0.096, p = 0.759); and
escitalopram x verapamil (F(1, 35) = 0.195, p = 0.661).
6.3.3. Tail suspension test
Neither escitalopram (F(1, 35) = 0.885, p = 0.353) nor verapamil (F(1, 35) = 0.004, p
= 0.950) had a significant impact on the duration of immobility in the TST, nor was
there an interaction between the two factors (F(1, 35) = 1.505, p = 0.228). In
comparison to previously reported acute experiments performed in our laboratory
Figure 6.1: Effect of verapamil pre-treatment on brain and plasma concentrations of escitalopram after chronic administration. A Pre-treatment with verapamil resulted in a 110% increase in concentrations of escitalopram in cortical brain tissue. B Pre-treatment with verapamil did not significantly alter plasma levels of escitalopram (n = 9-10 per group). *** p < 0.001 between groups
Chapter 6: Chronic verapamil and escitalopram
232
(O'Brien et al., 2013b), chronic administration reduced the time spent immobile in
saline-treated mice by 35% (97s vs 150s).
6.3.4. Gene expression analysis
For technical reasons, it was not possible to include all animals in gene expression
analysis. The total numbers of samples included for each gene are listed in Table
6.2. Two-way ANOVA analysis of PCR results revealed a verapamil, escitalopram or
verapamil x escitalopram effect on the expression of four of the twelve genes
analysed (Table 6.2).
The only target for which a significant escitalopram x verapamil interaction was
detected was the serotonin transporter (SERT). Treatment with verapamil or
escitalopram individually resulted in a trend towards increased SERT mRNA
expression, but this trend was reversed when both verapamil and escitalopram
were administered together, resulting in a significant reduction in SERT mRNA
levels compared to mice treated with escitalopram only (Figure 6.2A).
Escitalopram treatment had an effect on the expression of early growth response
protein 1 (EGR1) mRNA, resulting in increased expression of this gene. Post-hoc
analysis revealed that this increase was only statistically significant in mice treated
with both verapamil and escitalopram. However, there was no significant
interaction between the two treatments (Table 6.2; Figure 6.2B).
Verapamil treatment affected the expression of mRNA for p11 and nerve growth
factor IB (NGFI-B), increasing p11 expression to a similar extent with or without
escitalopram treatment (Figure 6.2C). NGFI-B mRNA expression was also increased
by verapamil treatment. Similar to EGR1, post-hoc analysis revealed that this
increase was only statistically significant in mice treated with both verapamil and
escitalopram, but there was no significant interaction between the two treatments
(Table 6.2; Figure 6.2D).

Chapter 6: Chronic verapamil and escitalopram
233
Table 6.2: Two-way ANOVA of the effects of verapamil, escitalopram and verapamil x escitalopram interaction on mRNA expression in the hippocampus (n= 7-10).
Target Total n Verapamil effect Escitalopram effect
Verapamil x escitalopram interaction
GR 32 F(1, 28) = 0.15, p = 0.904
F(1, 28) = 4.132, p = 0.052
F(1, 28) = 2.337, p = 0.138
MR 31 F(1, 27) = 1.530, p = 0.227
F(1, 27) = 0.004, p = 0.952
F(1, 27) = 0.059, p = 0.810
FKBP5 34 F(1, 30) = 0.810, p = 0.375
F(1, 30) = 0.669, p = 0.420
F(1, 30) = 1.385, p = 0.249
EGR1 34 F(1, 30) = 3.795, p = 0.061
F(1, 30) = 5.854, p = 0.022
F(1, 30) = 0.011, p = 0.917
NGFI-B 31 F(1, 27) = 5.336, p = 0.029
F(1, 27) = 1.838, p = 0.186
F(1, 27) = 0.389, p = 0.538
SERT 33 F(1, 29) = 0.408, p = 0.528
F(1, 29) = 0.009, p = 0.925
F(1, 29) = 5.385, p = 0.028
TPH2 33 F(1, 29) = 0.284, p = 0.598
F(1, 29) = 1.258, p = 0.271
F(1, 29) = 3.342, p = 0.078
5-HT1A 33 F(1, 29) = 0.008, p = 0.930
F(1, 29) = 1.091, p = 0.305
F(1, 29) = 0.414, p = 0.525
TREK-1 33 F(1, 29) = 1.568, p = 0.221
F(1, 29) = 0.091, p = 0.765
F(1, 29) = 2.216, p = 0.147
BDNF 34 F(1, 30) = 0.000, p = 0.990
F(1, 30) = 0.918, p = 0.346
F(1, 30) = 0.062, p = 0.805
CREB 32 F(1, 28) = 2.163, p = 0.153
F(1, 28) = 0.008, p = 0.930
F(1, 28) = 0.477, p = 0.496
p11 34 F(1, 30) = 10.182, p = 0.003
F(1, 30) = 0.076, p = 0.785
F(1, 30) = 0.127, p = 0.724
Bold font denotes statistically significant effect

Chapter 6: Chronic verapamil and escitalopram
234
Figure 6.2: Relative expression of genes for which significant effects were observed. A. A significant interaction between verapamil and escitalopram was observed for SERT expression. SERT mRNA levels were significantly lower in mice treated with both verapamil and escitalopram than those treated with escitalopram only. B. Escitaloram treatment was found to exert a significant effect on EGR1 mRNA expression. The increase in EGR1 mRNA levels, compared to the control group, was only statistically significant in mice treated with both verapamil and escitalopram. However, there was no significant interaction between the two treatments. C. Verapamil exerted a significant effect on p11 expression, resulting in a significant increase in mice treated with verapamil only compared to control mice, and a trend towards increased expression in mice treated with both verapamil and escitalopram (p = 0.054). D. Verapamil also exerted a significant effect on NGFI-B expression. A statistically significant elevation in NGFI-B mRNA was only observed in mice treated with both verapamil and escitalopram, but there was no interaction between the two treatments (n = 7-10 per group). * p < 0.05; ** p < 0.01 compared to control group # p < 0.05 between the indicated groups

Chapter 6: Chronic verapamil and escitalopram
235
6.4. Discussion
Recent evidence from preclinical studies has highlighted an important role for the
efflux transporter P-gp at the BBB in limiting the brain distribution of several
antidepressants (O'Brien et al., 2012b). Here, we demonstrate, for what is to our
knowledge the first time, that chronic treatment with a P-gp inhibitor and a P-gp
substrate antidepressant results in increased brain levels of the antidepressant
drug. We recently demonstrated that acute pre-treatment with the P-gp inhibitor
verapamil augmented the brain concentrations and functional activity of the SSRI
escitalopram in mice. However, prior to the present study, it remained unclear if
such findings would translate to chronic treatment paradigms. Considering that
antidepressant drugs are administered chronically in clinical practice, this is an
important consideration, especially given that the antidepressant venlafaxine has
been reported to induce P-gp in vitro and in vivo (Ehret et al., 2007; de Klerk et al.,
2010). Thus, the present results indicate that P-gp inhibition may represent a
promising strategy to augment the brain delivery of certain antidepressants during
chronic treatment.
Verapamil, the P-gp inhibitor used in the present study, is a clinically used calcium
channel blocker, indicated for the treatment of cardiovascular conditions such as
angina, supraventricular tachycardia and essential hypertension. At higher doses,
which it is thought may be required to inhibit P-gp due to its lack of specificity and
relatively low potency, verapamil can elicit toxicity, characterized by symptoms
such as hypotension and bradycardia (DeWitt and Waksman, 2004). In the present
study, in which verapamil was found to inhibit P-gp, no overt signs of toxicity were
detected during daily observations or in terms of alterations in body weight.
Furthermore, the plasma concentrations of verapamil measured in the present
study (390 ng/ml) are within the clinical therapeutic range (50 - 500 ng/ml)
(Regenthal et al., 1999). Notwithstanding the potential for verapamil to inhibit P-gp,
it is likely that its other pharmacological actions, including cardiovascular effects
and inhibition of cytochrome P450 enzymes, would preclude its widespread use as
a P-gp inhibitor in clinical practice. Several more specific second and third
generation P-gp inhibitors have been developed which may be more appropriate

Chapter 6: Chronic verapamil and escitalopram
236
for this purpose (Colabufo et al., 2010). Nonetheless, verapamil represents a
valuable pharmacological tool to investigate the effects of P-gp inhibition on drug
distribution in preclinical studies.
Despite observing a greater than 2-fold increase in escitalopram concentrations in
cortical tissue in mice treated with the P-gp inhibitor verapamil, no enhancement of
behavioural or gene expression responses to chronic escitalopram treatment was
detected. Indeed, chronic treatment with escitalopram elicited no robust effect on
the behavioural or molecular parameters investigated in the present study. This is
perhaps not too surprising, given that we chose a relatively low dose (0.1 mg/kg) of
escitalopram so as to be able to unmask any augmentation effects of verapamil.
Nonetheless, in previous acute studies, we had observed a behavioural effect in the
TST at this dose of escitalopram, but only when mice were pre-treated with
verapamil (O'Brien et al., 2013b, Chapter 4). No such effect was evident here after
chronic administration of both drugs. However, the results from the TST are
inconclusive: when compared to our previous acute experiments (cf. O'Brien et al.,
2013b, Chapter 4), the baseline immobility in the control group was reduced by
35%. This may have resulted in a floor effect, thereby potentially obscuring any
putative behavioural impact of the increased brain concentrations of escitalopram
due to P-gp inhibition. Although there have been a limited number of reports of the
TST being responsive to chronic antidepressant administration, it is predominantly
used to assess behavioural responses to acute antidepressant treatment (Cryan et
al., 2005a). Interestingly, studies which have yielded positive results in the TST
following chronic antidepressant administration have generally involved quite high
doses of the antidepressant, for example 20 mg/kg of fluoxetine (Ukai et al., 1998).
Hence, increasing the dose of escitalopram may represent a viable strategy to
overcome the floor effect seen here. Future investigations of the effect of P-gp
inhibition on antidepressant-like activity should make use of other paradigms,
which are responsive to chronic antidepressant treatment, such as the social defeat
stress or learned helplessness models (O'Leary and Cryan, 2013).

Chapter 6: Chronic verapamil and escitalopram
237
Similar to our behavioural studies, gene expression analysis did not reveal an
augmentation of molecular responses to escitalopram administration in verapamil
pre-treated mice. However, reports of alterations in mRNA expression in response
to antidepressant treatment are often inconsistent, and may not be universal
among different antidepressants, as evidenced by the variable findings in relation
to BDNF expression (Tardito et al., 2006; Groves, 2007). Thus, genes which have
been reported to be altered by treatment with other antidepressants may not be
influenced by escitalopram administration. To our knowledge, p11, BDNF and CREB
are the only gene targets which have been shown to be affected by chronic
escitalopram treatment (Jacobsen and Mork, 2004; Alboni et al., 2010; Melas et al.,
2012). However, the expression of these genes was not altered by escitalopram
treatment in the present study, further underlining the inconsistency of the effects
of antidepressant treatment on mRNA expression. Moreover, our finding that
chronic escitalopram treatment exerted a significant effect on mRNA levels of the
transcription factor EGR1 is the first time that this has been reported, to our
knowledge. Interestingly, the combination of verapamil and escitalopram
treatment, but neither in isolation, resulted in a statistically significant increase in
EGR1 mRNA expression relative to control mice. Similar findings were observed in
relation to another transcription factor, NGFI-B. While there was not a significant
interaction between escitalopram and verapamil treatment for either of these
genes, indicating that this could merely reflect an additive effect of the two
treatments, these targets warrant further investigation in future studies.
It is also worth noting that antidepressant-induced changes in gene expression can
be dependent on the brain region analysed and the antidepressant dose used
(Tardito et al., 2006). In relation to the dose, the drug administration regimen used
in the present study yielded plasma concentrations of escitalopram (23 ng/ml)
within the therapeutic range (15 – 80 ng/ml) (Baumann et al., 2004), albeit at the
lower end of that range. However, most studies which have reported significant
alterations in mRNA expression following antidepressant treatment have involved
the administration of much higher doses of the antidepressant (10 mg/kg
escitalopram daily, for example (Jacobsen and Mork, 2004; Alboni et al., 2010)).

Chapter 6: Chronic verapamil and escitalopram
238
Thus, the doses of escitalopram used in the present study may have been
insufficient to reproduce previously reported changes in mRNA expression.
Furthermore, it is possible that there may have been functionally relevant
alterations in protein expression, activation or cellular localization in response to
antidepressant treatment, without changes in mRNA levels. Future studies should
investigate these possibilities.
Even though our analysis did not reveal any augmentation of escitalopram’s effects
on mRNA expression by verapamil administration, a statistically significant
interaction between the two treatments was observed in terms of serotonin
transporter (SERT) mRNA levels. Interestingly, this effect constituted an attenuation
of a trend towards increased SERT mRNA levels following verapamil or escitalopram
on their own. It is important to note that, while studies have shown that SERT
mRNA expression can be altered in response to antidepressant treatment, these
findings have been somewhat inconsistent. SERT mRNA levels have been variously
reported to be increased, decreased or not affected by chronic antidepressant
treatment (Lesch et al., 1993; Lopez et al., 1994; Benmansour et al., 1999;
Abumaria et al., 2007), indicating that the effect of antidepressant drugs on SERT
expression is complex and variable.
Due to the inconclusive nature of our findings in relation to the effect of chronic P-
gp inhibition on behavioural and molecular responses to antidepressant treatment,
further studies are required to investigate this question. Such future studies should
ideally utilise more specific inhibitors of P-gp, thereby limiting the contribution of P-
gp independent factors to alterations in gene expression, and helping to specifically
elucidate antidepressant-related changes. For example, two-way ANOVA analysis
revealed that verapamil itself exerted a significant effect on the expression of
mRNA for NGFI-B and p11, thus making it difficult to identify any potential influence
of P-gp inhibition on putative escitalopram effects in relation to these targets. In
addition, future studies should use different dosing regimens of escitalopram and
investigate other parameters, such as protein expression, rather than focusing on
mRNA expression exclusively.

Chapter 6: Chronic verapamil and escitalopram
239
In conclusion, the present study demonstrates that inhibition of P-gp results in
elevated brain levels of an antidepressant drug in a chronic drug administration
paradigm. This finding indicates that P-gp inhibition may represent a viable strategy
to enhance the brain distribution of P-gp substrate antidepressants after repeated
dosing. In addition, these data reveal that chronic escitalopram administration can
influence mRNA expression of the transcription factor EGR1. Further studies are
required to fully elucidate the functional consequences, if any, of increasing the
brain levels of an antidepressant drug by P-gp inhibition on a prolonged basis.

240
Chapter 7:
General Discussion

Chapter 7: General Discussion
241
7.1. Overview and Summary
In this thesis, we have demonstrated that the drug efflux pump P-glycoprotein (P-
gp) restricts the blood-brain barrier (BBB) transport of the antidepressants
imipramine and escitalopram in rodents. Inhibition of P-gp, by either verapamil or
cyclosporin A (CsA), resulted in a significant increase in brain concentrations of both
of these antidepressants following acute administration. Further studies revealed
that the acute effect of P-gp inhibition on the brain distribution of escitalopram is
also relevant to chronic treatment scenarios. Moreover, we have shown that both
imipramine and escitalopram are transported substrates of human P-gp, using an in
vitro bidirectional transport approach, indicating that our findings in rodents may
also apply to humans. In contrast, we found that the antidepressants amitriptyline,
duloxetine, fluoxetine and mirtazapine are not transported substrates of human P-
gp in vitro, demonstrating that it is necessary to assess the P-gp substrate status of
antidepressant drugs on a case-by-case basis. Furthermore, we investigated
functional consequences of increasing brain levels of antidepressants by
modulating P-gp function, demonstrating that P-gp inhibition by verapamil
augmented the antidepressant-like activity of escitalopram, as measured in the tail
suspension test (TST) in mice, and that CsA exacerbated behavioural responses to
escitalopram in a mouse model of serotonin syndrome, indicating that adjunctive P-
gp inhibition may potentially increase the risk of serious adverse reactions to
antidepressant treatment.
It should also be noted that, unlike verapamil, CsA pre-treatment did not augment
the effect of escitalopram in the TST, despite similar increases in brain
concentrations of escitalopram. Thus, further studies are needed to fully
characterise the functional relevance of P-gp inhibition on the effects of
antidepressant treatment.
Nonetheless, the studies outlined in this thesis advance our understanding of the
role of P-gp in the pharmacokinetics and pharmacodynamics of antidepressant
drugs, and support the concept that modulation of P-gp could represent a

Chapter 7: General Discussion
242
beneficial therapeutic approach to augment antidepressant treatment, especially in
cases of treatment resistant depression (TRD).
7.2. The need for more effective strategies to improve response
to antidepressant treatment
With the possible exception of agomelatine, currently available antidepressant
medications act primarily by modulating monoaminergic function in the brain
(Section 1.4.2). While these antidepressant drugs fail to achieve an adequate
response in up to 60% of patients, and require prolonged treatment to elicit a
clinical effect in those who do respond, they remain the best therapeutic option
available at present (Hollon et al., 2002; Fava, 2003). Much effort has been directed
at attempts to unravel the neurobiological mechanisms of depression beyond the
monoamine hypothesis, in the hope that a greater understanding of the
pathophysiology the disorder may reveal novel therapeutic targets, resulting in
more rapid and more efficacious antidepressant treatments (Krishnan and Nestler,
2008). Although this research has led to the identification of numerous systems, in
addition to the monoaminergic system, which contribute to the aetiology of
depression, a ‘universal theory of depression’ has not been elucidated. Moreover,
this work has not resulted in the successful development of more efficacious
antidepressant drugs (Krishnan and Nestler, 2008). Indeed, such is the lack of
success in the development of novel antidepressant treatments that it is widely
acknowledged that those in use in the present day are no more effective in
relieving the devastating symptomatology of depression than imipramine, which
was serendipitously discovered over 50 years ago. However, recent findings in
relation to glutamatergic involvement in depression offer much promise, and the
results of clinical trials focused on drugs targeting this mechanism are awaited with
interest (Burgdorf et al., 2013).
In the absence of more effective drugs targeting novel mechanisms, clinicians
endeavour to maximise the therapeutic benefit attainable with currently available
antidepressant drugs (Connolly and Thase, 2011). Several pharmacological options
are available in cases of treatment failure, including dose optimisation, switching to
another antidepressant or augmentation of antidepressant treatment with another

Chapter 7: General Discussion
243
agent, in addition to other, non-pharmacological, interventions, such as
electroconvulsive therapy (Connolly and Thase, 2011). The recent STAR*D study
found that applying these (pharmacological) options in a stepwise fashion,
according to a defined algorithm, resulted in remission in approximately 70% of
patients, but that it required repeated trials of sufficiently sustained, vigorously
dosed antidepressant therapy to achieve this response (Gaynes et al., 2008).
Furthermore, the authors concluded that “should the first treatment fail, either
switching treatment or augmenting the current treatment” are reasonable options
(Gaynes et al., 2008). However, the STAR*D study was not placebo controlled, and
it is important to note that the evidence base supporting the efficacy of currently
used augmentation strategies is far from convincing, especially in the context of the
more modern and most commonly used SSRI antidepressant drugs (Connolly and
Thase, 2011). Moreover, the mechanisms of action of these augmentation agents
are poorly defined. Thus, there remains scope to develop new strategies to increase
the efficacy of currently available antidepressants, in addition to a clear need for
more efficacious drugs which exploit novel mechanisms for the treatment of
depression.
In this context, targeted inhibition of P-gp efflux represents a promising alternative
to currently accepted augmentation strategies. The research outlined in this thesis
builds on previous studies which initially revealed the key role played by P-gp in
limiting the BBB transport of several antidepressants. Prior to the research
conducted in this thesis, with the exception of three studies (Ejsing and Linnet,
2005; Ejsing et al., 2006; Clarke et al., 2009), the existing literature demonstrating
that P-gp limited brain levels of antidepressant drugs had focused exclusively on
investigations involving P-gp knockout mice.
7.3. Limitations of studies in P-gp knockout mice
While P-gp knockout mice without doubt represent an invaluable investigational
tool in determining the role of P-gp in drug distribution, there are several
limitations associated with studies involving their use.

Chapter 7: General Discussion
244
Firstly, studies in P-gp knockout mice do not offer information regarding the
capacity to target P-gp as a strategy to increase brain concentrations of its
transported substrates. Indeed, a previous study has reported a failure to
reproduce observations in P-gp knockout mice by pharmacological inhibition of P-
gp (Ejsing and Linnet, 2005). Similarly, this limitation extends to studies involving
the effect of P-gp on antidepressant distribution into the brain following chronic
treatment. Given that the expression and activity of ABC transporters can be
modulated by administration of certain xenobiotics, including the P-gp substrate
antidepressant venlafaxine (Ehret et al., 2007; de Klerk et al., 2010), it is plausible
that chronic treatment with a P-gp inhibitor and an antidepressant could result in
an upregulation of P-gp activity. Considering that P-gp knockout mice do not
express P-gp at the BBB, the effect of chronic drug treatment on the expression and
function of P-gp, and by extension the BBB transport of P-gp substrate drugs,
cannot be investigated in P-gp knockout mice. Moreover, P-gp knockout mice are
developmentally different to their wild-type counterparts; there is evidence to
suggest that the expression and function of other ABC efflux transporters, such as
breast cancer resistance protein (BCRP), is upregulated in the absence of P-gp
(Cisternino et al., 2004). Given the extensive overlap in substrate specificity
between the different transporters in the ABC superfamily (Sharom, 2008), this is a
potentially crucial confounding factor.
The apparent discrepancy in findings between studies utilising single knockout
abcb1a(-/-) mice (i.e. those lacking the abcb1a homologue only) and double
knockout abcb1ab(-/-) mice is another important consideration in relation to P-gp
knockout mice. For reasons which remain unclear, discrepant findings about the P-
gp substrate status of several glucocorticoids, as well as the antidepressants
fluoxetine and amitriptyline, have been reported in studies using the two strains,
thereby leading to uncertainty regarding the role of P-gp in their brain distribution
(Uhr et al., 2000; Doran et al., 2005; Uhr et al., 2007; Mason et al., 2012). Given
that abcb1a is thought to be the predominant isoform of P-gp at the BBB in
rodents, it is difficult to rationalise these findings.

Chapter 7: General Discussion
245
Another limitation of many of the previously existing studies regarding the role of
P-gp in the brain distribution of antidepressants is the focus on brain
concentrations at a particular, individual timepoint after drug administration. As
demonstrated in studies by Uhr and colleagues in relation to amitriptyline, the time
of sampling can influence the results obtained (Uhr et al., 2007). Thus, potentially
significant differences between P-gp knockout and wild-type mice may not have
been detected in some studies due to the sampling time.
Finally, P-gp deficient mice have been reported to behave abnormally in relation to
their wild-type comparators in commonly used animal models of antidepressant
activity, such as the forced swim test (FST) and the tail suspension test (TST)
(Schoenfelder et al., 2012). Thus, it may not be possible to assess the impact of P-gp
knockout on responses to antidepressant treatment using these commonly used
and well-validated models.
Due to these limitations, there remained a need for further studies in wild-type
animals to further investigate the potential for pharmacological manipulation of P-
gp to modulate antidepressant pharmacokinetics and pharmacodynamics.
7.4. An adaptable, integrated intracerebral microdialysis
approach to assess drug transport across the BBB in vivo
To allow us to address some of the issues highlighted in the previous section, we
developed an integrated intracerebral microdialysis technique to facilitate the
assessment drug transport across the BBB in vivo in the conscious, freely moving
rat. This approach involved catheterization of the jugular vein and carotid artery,
and implantation of a microdialysis probe into the brain. While technically
challenging, this technique offered several advantages over more simplistic
methods of assessing BBB transport.
The advantages of the intracerebral microdialysis have already been outlined in
Section 1.2.5.4, and are summarised in Table 7.1. Jugular vein catheterization
facilitated intravenous drug administration without a need to handle or restrain the
animal, thereby minimising pharmacokinetic variability by eliminating the drug
absorption step associated with other routes of administration (such as

Chapter 7: General Discussion
246
intraperitoneal, subcutaneous or oral), while also avoiding stress associated with
handling or restraint. Catheterization of the carotid artery in this model facilitated
repeated blood sampling from the animal while simultaneously monitoring
fluctuations in free drug concentrations in the extracellular space in the brain.
Again, using the catheterization approach, it was possible to do this without a need
to handle or restrain the animal. The simultaneous and repeated sampling from the
carotid artery and microdialysis probe allowed us to measure drug concentrations
in the blood and the brain with a high level of temporal resolution. Thus, it was
uniquely possible to determine the effect of P-gp inhibition on the BBB transport of
antidepressant drugs over time by adopting this approach.
Table 7.1: Advantages and limitations of intracerebral microdialysis technique (de Lange et al., 2000; Anderzhanova and Wotjak, 2013)
Advantages Facilitates the monitoring of changes in the extracellular concentration of various
compounds of interest in conscious freely animals
Only free, unbound, physiologically and pharmacologically active concentrations of the
compound are monitored
Amenable to studies investigating neurotransmission as well as drug pharmacokinetics
Minimal disruption of tissue homeostasis
Efficient spatial and temporal resolution
Samples do not require purification or work-up prior to analysis
Limitations
Physiological stress associated with the invasive surgical procedure required
Physical damage caused by implantation of the microdialysis probe
Requirement for highly sensitive analytical assays to facilitate determination of
compounds in small volume, low concentration samples
Challenges in achieving quantitative analysis of actual brain ECF concentrations
Potential changes in probe recovery due to manipulations which dramatically change the
extracellular concentrations of the analyte of interest
Unsuitable for highly lipophilic compounds
Temporal resolution is restricted to several minutes (e.g. 20 min), thereby unsuitable for
the measurement of rapid changes in analyte concentration
Using this technique, we demonstrated that P-gp inhibition results in increased
brain levels of the antidepressants imipramine and escitalopram. Furthermore, we
were able to investigate the effect of pre-treatment with the P-gp inhibitor CsA on

Chapter 7: General Discussion
247
increases in extracellular serotonin in response to escitalopram treatment, thereby
offering unique insight into the pharmacodynamic effects of this drug combination.
The possibility to administer a drug as a continuous intravenous infusion, due to the
presence of the indwelling jugular vein catheter, allowed us to achieve and
maintain steady state concentrations of escitalopram in plasma and brain tissue.
This proved to be a particularly useful strategy when investigating the influence of
P-gp inhibition on drug transport across the BBB, as demonstrated in Chapter 4,
where a striking increase in brain levels of escitalopram were observed immediately
after administration of the P-gp inhibitor CsA (O'Brien et al., 2013b). Furthermore,
this approach enabled us to cease the experiment at a point when the elevation in
brain levels was maximal, thereby facilitating confirmation of microdialysis findings
by measuring escitalopram concentrations in brain tissue harvested at termination
of the experiment. This was not possible in our earlier studies involving a one-off,
bolus administration of imipramine; brain levels of imipramine, as measured by
microdialysis, were no longer different between the groups at the end of the
experiment. Thus, it is advisable that future studies investigating the effect of drug
efflux transporters on BBB transport should avail of the steady state approach.
Indeed, recent work in our lab has adapted this strategy to investigate the effect of
OAT3 inhibition on the BBB transport of bumetanide, with promising results to date
(Donovan, O’Brien et al., unpublished data).
One of the major challenges in successfully implementing the intracerebral
microdialysis technique is the requirement to develop a high sensitivity analytical
method to facilitate detection of the analyte of interest. For this purpose, we were
able to successfully adapt methods described in the literature for the
antidepressant drugs investigated in the present study. In addition, it was possible
to modify our microdialysis technique to measure extracellular serotonin
concentrations, both at basal levels and in response to escitalopram treatment,
thereby facilitating investigation of the effect pre-treatment with the P-gp inhibitor
CsA on escitalopram-induced increases in extracellular serotonin. The analytical
challenge presented by microdialysis studies highlights another advantage of
conducting drug transport experiments at steady state with continuous intravenous

Chapter 7: General Discussion
248
drug infusion. When using this approach, drug concentrations can be maintained at
higher, and therefore more readily detectable, levels compared to bolus
administration studies. After bolus administration, drug concentrations rapidly
decline to low levels from an initial peak, thereby potentially presenting an
insurmountable analytical challenge. Thus, by using the steady state approach, our
integrated intracerebral microdialysis technique could be applied to drugs for which
highly sensitive analytical assays do not exist. The numerous applications to which
this integrated intracerebral microdialysis model has already been successfully
employed highlight its flexibility and utility, and indicate that it may be possible to
extend its use to address other research questions.
7.5. The importance of in vitro studies to identify drugs which
are transported substrates of human P-gp
Despite the abundance of preclinical evidence demonstrating that P-gp limits the
brain distribution of antidepressants in rodents, the existing data from in vitro
studies investigating interactions between antidepressants and human P-gp were
inconclusive (O'Brien et al., 2012b; Chapter 1). While several studies reported
significant interactions between certain antidepressants and human P-gp using the
ATPase assay, the relevance of these findings to drug transport is unclear. In
contrast, the in vitro bidirectional transport approach represents the ‘gold
standard’ approach for the identification of transported substrates of P-gp
(Balimane et al., 2006).
However, bidirectional transport studies investigating if antidepressant drugs are
transported substrates of human P-gp have reported inconsistent, but generally
negative, findings. Confident interpretation of the results from these studies is
difficult, however, mostly due to methodological limitations of the two studies
which have provided most of the data in this regard (Mahar Doan et al., 2002; Feng
et al., 2008). For example, one of these studies, which investigated the effects of
human P-gp on the permeability of 39 compounds in the MDCKII-MDR1 cell line,
found that none of the seven antidepressants included in the study were
transported substrates of P-gp (Feng et al., 2008). Presumably to facilitate high
throughput screening of the large number of compounds included in the study, the

Chapter 7: General Discussion
249
effect of P-gp on drug transport was only determined at a single, 5-hour time-point.
While this approach was sufficient to identify very high affinity substrates of P-gp,
such as ritonavir, it may have lacked the sensitivity to detect less avid substrates.
Indeed, the transport ratio for verapamil, a well-established P-gp substrate, in
addition to being an inhibitor of P-gp, was marginally above the threshold for
identification of a transported P-gp substrate in this study (Feng et al., 2008).
Another study reported that 10 of 11 antidepressants investigated were not
transported substrates of P-gp (Mahar Doan et al., 2002). However, the donor
concentration used in this work was twice the recommended upper limit of 5 µM
for these types of studies and samples were only taken at single timepoint one hour
after commencing the experiment (see Balimane et al., 2006, for a discussion of
methodological considerations). Similarly, two of the three in vitro bidirectional
transport studies which have reportedly identified antidepressant drugs as
transported substrates of P-gp were carried out in the Caco-2 cell line, without
conducting additional experiments to confirm that P-gp was the transporter
responsible for the net efflux effect observed (Faassen et al., 2003; El Ela et al.,
2004). Thus, there was a lack of definitive and reliable data pertaining to the
transport of antidepressants by human P-gp. This was a major limitation when
attempting to evaluate the relevance of findings from rodent studies to humans in
receipt of antidepressant treatment, considering reports of species differences in P-
gp specificity and activity (Yamazaki et al., 2001; Katoh et al., 2006; Baltes et al.,
2007; Syvanen et al., 2009). It was in this context that we established and utilised
an in vitro bidirectional transport model to assess if various antidepressants are
transported substrates of P-gp.
In the in vitro model employed in our work (Chapters 3 and 4), drug transport was
measured at several time points throughout the experiments, rather than taking a
single measurement at the end, thus enabling us to determine the rate of transport
more accurately (Youdim et al., 2003). Moreover, cellular retention of the
compound, an often overlooked factor when calculating permeability values based
on experimental observations, was accounted for in our studies (Youdim et al.,
2003). Using this approach, we determined that P-gp substantially limited the

Chapter 7: General Discussion
250
ability of escitalopram to traverse the cell monolayer, while it also restricted
imipramine permeability, albeit to a lesser extent. Moreover, we found that P-gp
exerted no effect on the permeability of amitriptyline, duloxetine, fluoxetine or
mirtazapine. Thus, the in vitro model was sensitive enough to discriminate between
antidepressants which were subjected to P-gp mediated efflux and those which
were not. The data from these studies suggest that P-gp may play a role in the brain
distribution of escitalopram and imipramine in humans, but is unlikely to affect the
BBB transport of amitriptyline, duloxetine, fluoxetine or mirtazapine. This
information in regard to amitriptyline and fluoxetine is particularly interesting, as
there had been ambiguity about the role of P-gp in their brain distribution based on
somewhat inconsistent findings from studies involving P-gp knockout mice (Uhr et
al., 2000; Doran et al., 2005; Uhr et al., 2007).
Knowing which antidepressants are transported substrates of P-gp would be
essential in rationally designing any potential future clinical studies with the aim of
evaluating P-gp inhibition as an antidepressant augmentation strategy. This
knowledge will help to avoid potential flaws in study design similar to those which
may have contributed to the failure of large scale clinical trials investigating P-gp
inhibitors as adjunctive agents in oncology (as outlined in Section 1.3.5). Similarly,
information regarding the transport of antidepressants by human P-gp is important
when planning or critically evaluating pharmacogenetic studies investigating
potential links between SNPs in ABCB1 and antidepressant response.
7.6. Determining the functional relevance of increasing brain
levels of antidepressant drugs by P-gp inhibition:
behavioural studies
While several studies had reported that the brain pharmacokinetics of certain
antidepressants were enhanced by P-gp inhibition or P-gp knockout, no published
study had investigated the functional effect of increased brain distribution of
antidepressants in a relevant animal model of antidepressant activity. Indeed, it had
been proposed that a 4-fold increase in brain levels of a drug in P-gp knockout mice
relative to wild-type controls was required in order to consider P-gp efflux to be
functionally relevant (Feng et al., 2008); the greatest increase reported for an

Chapter 7: General Discussion
251
antidepressant to date is a 3.6-fold increase (O'Brien et al., 2012b). Thus, it was
unclear whether the differences in brain pharmacokinetics of antidepressant drugs
due to P-gp inhibition or P-gp knockout would result in a meaningful difference in
the pharmacodynamic effects of the antidepressant.
One previous study had reported altered behaviour in the open field in P-gp
knockout mice, compared to wild-type controls, when treated with the P-gp
substrate antidepressant venlafaxine (Karlsson et al., 2011). While this finding was
certainly interesting, as it revealed a differential response to antidepressant
treatment between the two strains, its relevance to the antidepressant effects of
venlafaxine were unclear. Thus, there remained a major impetus to carry out
further experiments to elucidate the impact of a reduction in P-gp function, either
due to pharmacological intervention or genetic ablation, on the pharmacodynamic
activity of P-gp substrate antidepressants. The related, but subtly different, forced
swim test (FST) and tail suspension test (TST) are two of the most widely used and
well validated rodent models for assessing antidepressant-like activity (Cryan and
Holmes, 2005), and would therefore represent ideal paradigms in which to address
this issue. However, it may not be possible to conduct such experiments in the P-gp
knockout mice, as they have been reported to display aberrant behaviour in these
tests, with significantly lower immobility in the FST and significantly greater
immobility in the TST, relative to their wild-type counterparts (Schoenfelder et al.,
2012). Therefore, P-gp knockout mice may not respond normally to antidepressant
drugs in these tests; indeed, this seems to be the case (Schmitt et al., 2009).
In light of the aberrant responses of P-gp knockout mice in these commonly used
animal models of antidepressant activity, it was necessary to conduct
pharmacodynamic studies involving P-gp inhibition in wild-type animals to assess
the functional relevance of increased brain levels of antidepressants as a result of
reduced P-gp function. Our experiment demonstrating that pre-treatment with
verapamil augmented the antidepressant-like activity of escitalopram in the TST
was the first such study (Chapter 4). However, subsequent investigations using an
alternative P-gp inhibitor, CsA, yielded conflicting results (Chapter 5). CsA itself was
found to exert an effect on the serotonergic system, as demonstrated by its

Chapter 7: General Discussion
252
attenuating effect on escitalopram-induced increased in extracellular serotonin and
its effect on serotonin turnover when administered in combination with
escitalopram. In addition, it significantly reduced locomotor activity in the open
field, which may explain why it did not augment the effect of escitalopram in the
TST. Thus, it is difficult to draw any firm conclusions from pharmacodynamic studies
involving CsA. Further experiments, involving more specific P-gp inhibitors, are
required to definitively elucidate the impact of P-gp inhibition on behavioural
responses to antidepressant drugs which are transported substrates of P-gp.
We also investigated the impact of P-gp inhibition on an escitalopram-induced
mouse model of serotonin syndrome, finding that CsA pre-treatment significantly
exacerbated the manifestation of behaviours associated with this model (Chapter
5). This finding highlights the potential for increased risk of side-effects when
increasing brain levels of antidepressants by P-gp inhibition. Further studies are
required to confirm the mechanism underlying this interaction between CsA and
escitalopram, given that CsA was found to modulate escitalopram-induced changes
in the serotonergic system as outlined above.
7.7. Do findings from acute experiments in relation to the
impact of P-gp inhibition on antidepressant transport
across the BBB translate to chronic studies?
One of the main unresolved questions regarding studies demonstrating that P-gp
limited the BBB transport of certain antidepressants, and that inhibition of P-gp
resulted in increased brain levels of these drugs, was whether these findings would
translate to chronic drug administration scenarios which are more analogous to the
clinical use of antidepressants. This is a key consideration when contemplating P-gp
inhibition as a potential adjunctive strategy for treatment with P-gp substrate
antidepressants, given that repeated exposure to xenobiotics, including the
antidepressant venlafaxine (Ehret et al., 2007; de Klerk et al., 2010), can result in
increased P-gp expression and function (Miller, 2010).
A number of studies had gone some way to addressing this issue by conducting
longer term studies in P-gp knockout compared to wild-type mice. However, these

Chapter 7: General Discussion
253
studies could be more aptly described as ‘subchronic’ rather than chronic per se, as
they involved drug administration for a maximum of 11 days. Moreover, studies in
P-gp knockout mice do not yield information that indicates whether long term
administration of a P-gp inhibitor in conjunction with a P-gp substrate
antidepressant will result in increased brain levels of the antidepressant. Thus, we
conducted a chronic experiment in which the P-gp inhibitor verapamil and the P-gp
substrate antidepressant escitalopram were administered daily for 22 days (Chapter
6). This study revealed that brain levels of a P-gp substrate antidepressant were
indeed increased by P-gp inhibition in a chronic paradigm. This finding indicates
that long term treatment with a P-gp inhibitor may represent a viable strategy to
achieve enhanced brain delivery of P-gp substrate antidepressants in clinical
practice.
In addition, the behavioural and neurochemical effects of antidepressant treatment
have been reported to differ between acute and chronic drug administration
paradigms (Cryan et al., 2005b; Gaska et al., 2012). Therefore, as a secondary goal
of our chronic study, we investigated potential behavioural and molecular
consequences of chronically increased brain levels of escitalopram by P-gp
inhibition. These experiments did not detect any augmentation of escitalopram’s
effects by P-gp inhibition. However, there are several potential explanations for this
lack of effect, as outlined in Section 6.4, not least the low dose (0.1 mg/kg) of
escitalopram administered in the study. Studies which have reported significant
effects of chronic antidepressant administration on the mRNA expression of the
targets investigated in Chapter 6 have involved much higher doses than that used in
our experiment. The rationale underlying the choice of dose for our chronic study
was based on our findings in acute studies, whereby this dose of escitalopram did
not elicit a significant antidepressant-like effect when administered on its own, but
did when administered in combination with the P-gp inhibitor verapamil. Thus, it
seemed rational to investigate the effect of P-gp inhibition on the
pharmacodynamic activity of this dose following chronic administration, as using a
higher dose of escitalopram would have risked encountering a ceiling effect. Future
studies should explore the question of the pharmacodynamic effect of chronic P-gp

Chapter 7: General Discussion
254
inhibitor and antidepressant treatment using a different dosing regimen of
escitalopram.
7.8. Limitations of the work outlined in this thesis
No experimental approach is without its limitations, and it is necessary to be
cognisant of this fact when interpreting our results. The in vivo and in vitro
techniques used in the work described in this thesis have several limitations, as
outlined in the following sections.
7.8.1. Limitations of in vivo studies
7.8.1.1. Intracerebral microdialysis
There are several advantages associated with the intracerebral microdialysis
technique (see Table 7.1), including the ability to continuously monitor fluctuations
in extracellular concentrations of unbound, pharmacologically and physiologically
active compounds in specific brain regions, thus offering a unique level of spatial
and temporal resolution. However, there are also several important limitations
associated with this approach (Table 7.1). For example, stereotaxic implantation of
the microdialysis probe causes unavoidable damage to the surrounding tissue,
which may in turn affect the integrity of the BBB. The impact of this damage on
studies investigating BBB drug transport can be minimised by conducting
experiments during the optimal post-surgical period, between 1 and 2 days after
probe implantation; after recovery from early tissue reactions and before the start
of long term reactions (de Lange et al., 2000). Importantly, in our BBB transport
studies, we were able to detect changes in the brain levels of our target compounds
as a result of P-gp inhibition, thereby demonstrating that the BBB was exerting a
functional effect on drug transport; had the BBB been substantially compromised
by the insertion of the microdialysis probe, it is likely that such differences would
not have been evident.
Another important limitation associated with our microdialysis studies is that we
did not perform quantitative analyses, meaning that we did not determine actual
concentrations of the analytes of interest in brain extracellular fluid. Rather, we
compared relative changes in analyte concentrations between different treatment

Chapter 7: General Discussion
255
groups. As a result, it was not possible to definitively calculate the actual magnitude
of increases in brain concentrations of the antidepressant due to P-gp inhibition.
This is a particular concern considering that inhibition of P-gp could alter probe
recovery (de Lange et al., 2000). However, both predictions, based on theoretical
modelling (Bungay et al., 1990), and experimental evidence (de Lange et al., 1998;
Xie et al., 1999) indicate that inhibition of P-gp would result in a reduction in probe
recovery of P-gp substrate compounds. Therefore, it is likely that our findings may
underestimate the effect of P-gp inhibition on brain levels of antidepressants.
7.8.1.2. Non-selective nature of P-gp inhibitors used
Perhaps the most important limitation of the present work is the non-selective
nature of the P-gp inhibitors used, verapamil and CsA. Each of these compounds
has an extensive range of pharmacological actions in addition to their inhibition of
P-gp. Verapamil is primarily known as a calcium channel blocker, while CsA is a
calcineurin inhibitor. Both are clinically used; verapamil for cardiovascular
indications, and CsA as an immunosuppressant. The rich pharmacology of these
compounds makes isolation of P-gp mediated effects somewhat challenging,
especially when investigating pharmacodynamic effects.
The integrated approach adopted in microdialysis-based pharmacokinetic studies
allowed us to confirm that increases in brain concentrations following
administration of these P-gp inhibitors were not merely a reflection of elevations in
circulating blood levels, thereby confirming increased BBB transport. Furthermore,
the converging effect of both verapamil and CsA, in enhancing the brain
concentrations of imipramine and escitalopram, strongly indicates that this
enhancement was mediated via P-gp inhibition, an effect common to both drugs.
Moreover, the involvement of P-gp was confirmed by in vitro studies, which offered
the advantage of elucidating the mechanism at play, in addition to demonstrating
that these antidepressants are substrates of human P-gp (as discussed in Section
7.5).
While it was possible to overcome potential problems associated with the non-
selective nature of the P-gp inhibitors in pharmacokinetic studies, it is more difficult
Chapter 7: General Discussion
256
to discriminate between P-gp-dependent and P-gp-independent effects in relation
to pharmacodynamic studies. We found that verapamil augmented the
antidepressant-like activity of escitalopram in the TST, resulting in a reduction in
immobility. Moreover, this reduction in immobility was statistically correlated with
brain levels of escitalopram, thereby indicating that this effect was likely as a result
of increased brain concentrations of escitalopram following P-gp inhibition, as
opposed to, for example, verapamil’s ability to block calcium channels (Cohen et al.,
1997; Busquet et al., 2010). In contrast, inhibition of P-gp by CsA did not augment
the antidepressant-like activity of escitalopram in the TST. The effects of CsA on the
serotonergic system, as demonstrated by microdialysis studies, and its effect on
serotonin turnover in prefrontal cortex brain tissue, in addition to its effects on
locomotor activity, indicate that the pharmacodynamic effects of CsA may be acting
to suppress any potential enhancement of escitalopram activity due to increased
brain levels. Similarly, it is not possible to definitively attribute the exacerbating
effects of CsA in an escitalopram-induced mouse model of serotonin syndrome to
P-gp dependent or independent mechanisms. Further studies, using more specific
P-gp inhibitors (Colabufo et al., 2010), are required to conclusively determine the
effect of P-gp inhibition on the pharmacodynamic activity of P-gp substrate
antidepressants.
7.8.1.3. Caution extrapolating findings in rodents to humans
As with any in vivo preclinical studies, it is important to avoid over-interpretation of
our findings in rodents when evaluating their potential relevance to humans.
Therefore, the pharmacokinetic differences between rodents and humans need to
be highlighted and taken into consideration.
Studies have shown that the capacity of P-gp at the BBB differs between species,
requiring different doses of a P-gp inhibitor to elicit the same effect in terms of
increased brain distribution of P-gp substrates (Cutler et al., 2006; Syvanen et al.,
2009). Thus, it may not be possible to replicate our findings in rodents in human
subjects. Indeed, a recent paper, published on behalf of the International
Transporter Consortium, has questioned whether clinical modulation of efflux
transport at the BBB is likely for these reasons (Kalvass et al., 2013).

Chapter 7: General Discussion
257
Another important consideration, especially relevant to our chronic study, is the
difference in drug clearance between rodents and humans. Typically, the half life of
a drug is much shorter in rodents than in humans. Owing to their long half lives,
most antidepressants accumulate until steady state levels are achieved following
chronic once daily administration in humans. In contrast, steady state levels may
not be achieved with once, or even more frequent, daily dosing in mice (Frazer and
Benmansour, 2002). Thus, it is necessary to be cautious when drawing conclusions
from chronic studies involving daily injections in mice. This could be especially
relevant when investigating pharmacodynamic effects, as it may be necessary for
antidepressant levels to remain consistently above a certain concentration in order
to elicit their long term effects (Frazer and Benmansour, 2002). This problem could
be overcome with future studies involving continuous drug infusion over a
prolonged period of time, for example by using an osmotic minipump.
Similarly, animal models of antidepressant activity, such as the TST used in the
present work, have their limitations. The pharmacodynamic findings in these
studies do not necessarily mean that similar effects will be observed in patients, as
evidenced by the fact that many compounds which have shown antidepressant-like
effects in these models have failed to gain clinical approval (O'Leary and Cryan,
2013). Thus, it is necessary to be cautious when interpreting results from our
behavioural studies.
7.8.2. Limitations of in vitro studies
To ensure accurate identification of antidepressants which are subjected to efflux
by P-gp, every effort was made in our in vitro work to adopt a rational and
consistent methodological approach, based on published guidelines and best
practice (Polli et al., 2001; Youdim et al., 2003; Balimane et al., 2006; Zhang et al.,
2006). However, it remains a possibility that aspects of our approach may have
resulted in misleading results. It is necessary to consider such potential sources of
error, as discussed in the following sections.

Chapter 7: General Discussion
258
7.8.2.1. Non-BBB characteristics of cells used for in vitro studies
Due to limitations of BBB-derived systems, as outlined in Section 1.2.5.2, we chose
to use cells from a non-cerebral origin for our in vitro work. This is not ideal, given
that the properties of the endothelium/epithelium are known to influence P-gp
activity at the BBB (Romsicki and Sharom, 1999; Hellinger et al., 2012). However,
the available data indicate that the MDCKII-MDR1 model we employed is at least as
effective, if not more so, at identifying transported P-gp substrates at the BBB than
alternative, BBB-derived, in vitro approaches (Hellinger et al., 2012). Nonetheless, it
is important to bear in mind that our in vitro system is not a model of the BBB per
se, and therefore does not reflect the complexity of uptake, efflux and metabolic
processes ongoing at the BBB in vivo. Rather, our model represents a tool for the
identification of P-gp substrates in general, and this caveat needs to be borne in
mind when considering the relevance of in vitro findings to BBB transport in vivo.
Our approach, whereby rodent studies to assess the role of P-gp in the BBB
transport of imipramine and escitalopram in vivo were combined with in vitro
studies involving human P-gp, helps to offset this limitation.
7.8.2.2. Concentration-dependence of in vitro studies
The donor concentration used in in vitro studies is known to influence the results
obtained (Balimane et al., 2006). Using too high a donor concentration may result in
saturation of the efflux transporter and a resultant overwhelming of the efflux
effect. Conversely, it has been reported that the antiepileptic drug phenobarbital
was detected as a P-gp substrate when higher, but not lower, donor concentrations
were used (Zhang et al., 2010). Thus, it is possible that the antidepressants which
we did not find to be affected by P-gp efflux may have been identified as P-gp
substrates had we used a different donor concentration. As a result, further studies
are required before these antidepressant drugs can be definitively categorised as
non-P-gp substrates.
When attempting to conduct traditional bidirectional transport studies at low
donor concentrations, the small amount of the compound of interest that has
accumulated in the receiver chamber, in particular at earlier time-points, can
present a substantial analytical challenge. The concentration-equilibrium-transport-
Chapter 7: General Discussion
259
assay (CETA) approach may represent a useful means to circumvent this problem in
future studies (Luna-Tortos et al., 2008; Zhang et al., 2011). The CETA approach
involves simultaneously adding equal concentrations of the compound of interest
to both the apical and basolateral chambers. If the compound is a transported P-gp
substrate, it will preferentially accumulate in the apical chamber, due to the
influence of P-gp efflux at the apical membrane. Thus, due to the addition of the
compound to each chamber, the same level of sensitivity in the analytical technique
is not required as would be the case for traditional bidirectional transport studies
involving the same initial concentration.
7.9. Is P-gp inhibition a potentially viable option to augment
antidepressant treatment clinically?
Our work has shown that P-gp inhibition results in increased brain levels of certain
antidepressants, and can lead to an augmentation of their antidepressant-like
activity, in rodents. This has raised the possibility that adjunctive therapy with a P-
gp inhibitor could represent a potential strategy to augment antidepressant
treatment in treatment-resistant depression. However, despite recent advances,
several outstanding questions remain to be answered before this strategy can be
considered a viable clinical option. Some of these questions will be outlined in the
following sections.
7.9.1. Which antidepressants are transported substrates of P-gp?
To rationally choose which antidepressant drugs may be amenable to augmentation
with a P-gp inhibitor, it is necessary to know which antidepressants are transported
P-gp substrates and which are not. In a recent review paper (Zhang et al., 2012), a
set of criteria for defining the P-gp substrate status of compounds was proposed in
relation to antiepileptic drugs (Table 7.2).

Chapter 7: General Discussion
260
Table 7.2: Definitions of substrate status classifications (Zhang et al., 2012)
Substrate status Definition
Definite P-gp substrate Evidence from both in vivo (animal model or human data) and in
vitro bidirectional transport studies demonstrating transport by
P-gp
Probable P-gp
substrate
Drug is a transported substrate of P-gp in vitro but no (or
inconclusive) in vivo data is available, or vice versa
Possible P-gp substrate Inconsistent results from in vitro and in vivo studies
Unlikely to be a P-gp
substrate
Drug is not transported by P-gp in vitro, but no (or inconclusive)
in vivo data is available, or vice versa
Not a P-gp substrate Both in vivo and in vitro studies have demonstrated that the
drug is not transported by P-gp
By adapting these criteria and applying them to antidepressant drugs, it is evident
that the P-gp substrate status of most antidepressant drugs remains unclear (Table
7.3). Due to a paucity of data from studies which have investigated if
antidepressant drugs are P-gp substrates in humans, we have included
pharmacogenetic associations showing alterations in antidepressant
pharmacokinetics or treatment response as a surrogate indicator of interactions
with human P-gp. Furthermore, we have subdivided animal studies into those using
P-gp knockout mice and those involving P-gp inhibition in wild-type animals.
Based on the research outlined in this thesis, in conjunction with recent work
carried out by others (Karlsson et al., 2013), escitalopram is the only antidepressant
which can be classified as a ‘definite’ P-gp substrate. In all likelihood, several other
antidepressants, including the commonly prescribed citalopram, paroxetine and
venlafaxine, are also P-gp substrates, but further studies are required in order to
state this with confidence. The lack of clarity in this regard is due, in large part, to
deficiencies in relation to in vitro studies of antidepressant transport by P-gp. Most
of the currently available data from in vitro experiments come from only two
studies, and there are certain limitations associated with the methodologies
employed in these studies (as outlined in Section 7.5). Interestingly, based on the

Chapter 7: General Discussion
261
available data, it seems unlikely that amitriptyline is a transported substrate of P-
gp, despite its inclusion as one of four ‘P-gp substrate antidepressants’ in the
landmark pharmacogenetic study demonstrating associations between SNPs in
ABCB1 and treatment response to antidepressants (Uhr et al., 2008). Thus, further
research is required in order to definitively determine the P-gp substrate status of
commonly used antidepressant drugs before the use of P-gp inhibitors as adjunctive
agents can be advocated.

262
Table 7.3: Antidepressants as P-gp substrates in research models (adapted from studies summarised in Chapter 1 and the research outlined in this thesis)
AD Substrate
status In vitro1
Animals
Humans
Pharmacogenetic associations2
P-gp knockout
P-gp inhibition
Pharmacokinetic Response/side effects
Escitalopram Definite Y Y Y - - Y
Fluvoxamine Probable ? Y - - Y - Imipramine Probable ? - Y - - -
Protriptyline Probable Y - - - - -
Citalopram Possible N Y - - Y ?
Desipramine Possible N - Y - - -
Doxepin Possible N Y3 - - - -
Nortriptyline Possible N Y Y - - ?
Paroxetine Possible N Y - Y - ?
Trimipramine Possible N Y - - - -
Venlafaxine Possible N Y - - - Y
Amitriptyline Unlikely N ? - - - ?
Clomipramine Unlikely N - - - - -
Duloxetine Unlikely N - - - - N
Fluoxetine Unlikely N ? - - - N
Trazodone Unlikely N - - - - -

263
AD Substrate
status In vitro1
Animals
Humans
Pharmacogenetic associations2
P-gp knockout
P-gp inhibition
Pharmacokinetic Response/side effects
Mirtazapine Not N N - - - N
Sertraline Not N N - - - -
Agomelatine Unknown - - - - - -
Dosulepin Unknown - - - - - -
Lofepramine Unknown - - - - - -
Y = yes; N = no; - = not reported; ? = inconclusive evidence 1 Most of the in vitro data comes from only two studies which reported almost universally negative data. Due to methodological limitations of these studies, further investigations are needed 2 Surrogate indicator of interactions with P-gp in humans 3 The increase in P-gp knockout mice relative to WT controls was marginal (10%), but statistically significant

Chapter 7: General Discussion
264
7.9.2. Would adjunctive treatment with a P-gp inhibitor result in
increased brain levels of a P-gp substrate antidepressant
in patients?
Due to documented species differences in the ability of P-gp inhibitors to enhance
brain distribution of P-gp substrates (Cutler et al., 2006; Syvanen et al., 2009),
human studies are needed to demonstrate that P-gp inhibition would result in
enhanced brain distribution of antidepressants which are proven to be P-gp
substrates. Given that it is generally not possible to directly measure brain levels of
a drug in human brain tissue (with the exception being in rare brain biopsy cases),
imaging approaches may represent the best approach to assess the impact of P-gp
inhibition on the brain distribution of an antidepressant. Ideally, such studies would
involve direct measurement of a radiolabelled antidepressant by PET. However,
logistical reasons may preclude the generation of such radiolabelled compounds.
Measuring serotonin transporter (SERT) occupancy by means of imaging, using
selective ligands such as 123I-ADAM, could represent an alternative approach to
address this question. Interestingly, this technique has been shown to be
sufficiently sensitive to detect a 2-fold difference in the dose of escitalopram
treatment, meaning that it may be suitable for this purpose (Klein et al., 2006).
Furthermore, the effect of chronic treatment with a P-gp inhibitor and P-gp
substrate antidepressant would need to be investigated in man, due to potential
species differences as outlined in Section 7.8.1.3.
7.9.3. How significant is the contribution of P-gp efflux to
antidepressant resistance?
The causes of treatment resistant depression (TRD) are, in all probability,
multifactorial. As such, it is not likely that P-gp inhibition will represent an
appropriate augmentation strategy for all refractory depressed patients. However,
P-gp mediated restriction of brain levels of antidepressants may contribute to the
aetiology of TRD in a subset of patients, especially considering the robust
association between P-gp genotype and response to treatment with P-gp substrate
antidepressants reported by Uhr and colleagues (Uhr et al., 2008). However, given
that the functional effects of SNPs in the ABCB1 gene are unknown, the exact

Chapter 7: General Discussion
265
mechanism underlying this pharmacogenetic association is unclear. Future imaging
studies may serve to elucidate the functional effect of ABCB1 genotype, thereby
helping to inform decisions regarding which patients are likely to benefit from
adjunctive P-gp inhibition. Moreover, imaging studies could help to determine if P-
gp activity is elevated in patients who fail to respond to antidepressant treatment.
Such studies could serve to experimentally evaluate the contribution of P-gp efflux
to treatment failure, as current evidence is inconclusive.
7.9.4. Clinical promise and limitations of increasing brain
distribution of P-gp substrate antidepressants: Towards an
antidepressant augmentation strategy?
We have demonstrated that P-gp inhibition by verapamil enhances the
antidepressant-like activity of escitalopram in the tail suspension test, thereby
raising the possibility that P-gp inhibition may represent a potential strategy to
augment treatment with P-gp substrate antidepressant. However, further
preclinical studies are required to more thoroughly investigate the effect of P-gp
inhibition on antidepressant-like activity in different animal models and using more
specific P-gp inhibitors. Such studies will facilitate informed prediction of expected
effects in patients. However, should preclinical investigations yield positive results,
it will remain necessary to conduct clinical studies to confirm whether findings from
animal models will translate to humans. At present, despite one promising result
from our preclinical studies (O'Brien et al., 2013b; Chapter 4), there is insufficient
data available to conclusively state whether increasing the brain distribution of a P-
gp substrate antidepressant by P-gp inhibition would be expected to result in an
augmentation of its efficacy as an antidepressant.
Despite the normal viability of P-gp knockout mice (Schinkel et al., 1997) and the
tolerability of certain P-gp inhibitors in humans (Kreisl et al., 2010), there are likely
to be myriad problems associated with long term clinical use of P-gp inhibitors. P-gp
fulfils an important function in several organs in the body, not only at the BBB
(Marzolini et al., 2004). Thus, inhibition of P-gp activity could have undesirable
effects on the distribution and metabolism of various endogenous and exogenous
P-gp substrates. This would be a particular problem in patients taking other

Chapter 7: General Discussion
266
medications which are P-gp substrates, in addition to the antidepressant and P-gp
inhibitor. Moreover, although increasing brain levels of an antidepressant drug by
P-gp inhibition may facilitate dose reduction while maintaining therapeutic effect,
thereby minimising peripheral side-effects, this could prove to be problematic. For
example, inceasing brain levels of the antidepressant may lead to an increased risk
of centrally-mediated side effects of antidepressant treatment, such as nausea,
vomiting and appetite dysregulation, as outlined in Section 1.4.3. Indeed, our
research revealed that co-administration of the P-gp inhibitor CsA exacerbated the
manifestation of an escitalopram-induced mouse model of serotonin syndrome,
thereby highlighting the potential for serious adverse interactions between a P-gp
inhibitor and an SSRI (Chapter 5). However, additional research is required to
determine if this effect was due to P-gp inhibition or an alternative effect of CsA.
Regardless, there would be genuine cause for concern about the potential for
adverse reactions in patients treated chronically with a P-gp inhibitor. Further
studies are needed to evaluate the risk:benefit ratio associated with any putative
augmentation of antidepressant treatment by P-gp inhibition.
Furthermore, while the P-gp inhibitors used in our research, verapamil and CsA,
have the advantage of being clinically approved and widely available, they lack the
requisite potency and specificity to represent viable agents for achieving P-gp
inhibition in clinical use (Kalvass et al., 2013). More selective second or third
generation P-gp inhibitors, such as the CsA analogue valspodar or tariquidar (which
have been used in clinical trials), may represent better alternatives. However, the
high cost of more selective P-gp inhibitors such as these may preclude their
widespread use in clinical practice. Furthermore, it is unclear whether
pharmaceutical companies would be interested in supporting the large scale clinical
trials that would be needed in order to investigate the benefit, or lack thereof, of
adjunctive P-gp inhibitor treatment in depression, given the previous failures of
similar studies in the field of oncology (Szakacs et al., 2006).

Chapter 7: General Discussion
267
7.10. Overall conclusions and future perspectives
In this thesis, we have conducted research which has furthered our understanding
of the role played by P-gp in the brain distribution and antidepressant-like activity
of antidepressant drugs. To build on this work, further studies are now needed to
address unanswered questions regarding the role of P-gp in the pharmacokinetics
and pharmacodynamics of antidepressant drugs. For the majority of
antidepressants, the available data are inadequate to allow definitive classification
as transported substrates of P-gp or not. Further preclinical studies, with a
particular focus on in vitro approaches involving human P-gp, are required to
provide more conclusive information in this regard. Furthermore, additional studies
assessing the impact of P-gp inhibition on the effects of antidepressants in animal
models of depression are needed to elucidate the pharmacodynamic effect of
increasing brain concentrations of P-gp substrate antidepressants. Moreover,
clinical studies are required to investigate potential associations between TRD and
P-gp efflux of antidepressants. Taken together, the results from such studies will
facilitate an informed evaluation of the potential of P-gp inhibition as a novel
augmentation strategy in the treatment of depression. Given the potential
difficulties associated with therapeutic use of P-gp inhibitors in clinical practice,
tailoring the choice or dose of antidepressant based on information relating to P-gp
function may represent a more feasible option. Indeed, a pilot clinical study has
recently reported that antidepressant treatment can be optimized by the clinical
application of ABCB1 genotyping (Breitenstein et al., 2013). Further investigations
of the benefits of this approach will be of interest.
In conclusion, we have demonstrated that the antidepressants imipramine and
escitalopram are transported substrates of human P-gp in vitro and that acute
inhibition of P-gp increases the brain distribution of these antidepressants in
rodents. In addition, a further study revealed that findings from acute in vivo P-gp
inhibition experiments also apply after chronic administration for escitalopram. In
contrast, the antidepressants amitriptyline, duloxetine, fluoxetine and mirtazapine
were not found to be transported substrates of human P-gp in vitro. Moreover, we
have shown, for the first time, that inhibition of P-gp can result in an augmentation

Chapter 7: General Discussion
268
of the behavioural effects of an antidepressant. Taken together these findings
indicate that P-gp inhibition may represent a potential strategy to augment
treatment with certain antidepressants, such as escitalopram. The promise of this
approach now requires clinical validation.

269
References
Abbott NJ (2013). Blood-brain barrier structure and function and the challenges for CNS drug delivery. J Inherit Metab Dis 36: 437-449. Abbott NJ, Patabendige AA, Dolman DE, Yusof SR, Begley DJ (2010). Structure and function of the blood-brain barrier. Neurobiol Dis 37: 13-25. Abbott NJ, Ronnback L, Hansson E (2006). Astrocyte-endothelial interactions at the blood-brain barrier. Nat Rev Neurosci 7: 41-53. Abumaria N, Rygula R, Hiemke C, Fuchs E, Havemann-Reinecke U, Ruther E, Flugge G (2007). Effect of chronic citalopram on serotonin-related and stress-regulated genes in the dorsal raphe nucleus of the rat. Eur Neuropsychopharmacol 17: 417-429. Akamine Y, Miura M, Yasui-Furukori N, Kojima M, Uno T (2012). Carbamazepine differentially affects the pharmacokinetics of fexofenadine enantiomers. Brit J Clin Pharmaco 73: 478-481. Alboni S, Benatti C, Capone G, Corsini D, Caggia F, Tascedda F, Mendlewicz J, Brunello N (2010). Time-dependent effects of escitalopram on brain derived neurotrophic factor (BDNF) and neuroplasticity related targets in the central nervous system of rats. Eur J Pharmacol 643: 180-187. Aller SG, Yu J, Ward A, Weng Y, Chittaboina S, Zhuo RP, Harrell PM, Trinh YT, Zhang QH, Urbatsch IL, Chang G (2009). Structure of P-Glycoprotein Reveals a Molecular Basis for Poly-Specific Drug Binding. Science 323: 1718-1722. Ambudkar SV, Kimchi-Sarfaty C, Sauna ZE, Gottesman MM (2003). P-glycoprotein: from genomics to mechanism. Oncogene 22: 7468-7485. American Psychiatric Association (2013). Diagnostic and statistical manual of mental disorders 5th edn. American Psychiatric Publishing: Arlington, VA. Anderzhanova E, Wotjak CT (2013). Brain microdialysis and its applications in experimental neurochemistry. Cell Tissue Res: [Epub ahead of print]. Armulik A, Genove G, Mae M, Nisancioglu MH, Wallgard E, Niaudet C, He L, Norlin J, Lindblom P, Strittmatter K, Johansson BR, Betsholtz C (2010). Pericytes regulate the blood-brain barrier. Nature 468: 557-561. Aronica E, Gorter JA, Jansen GH, van Veelen CW, van Rijen PC, Leenstra S, Ramkema M, Scheffer GL, Scheper RJ, Troost D (2003). Expression and cellular distribution of multidrug transporter proteins in two major causes of medically intractable epilepsy: focal cortical dysplasia and glioneuronal tumors. Neuroscience 118: 417-429. Aronica E, Gorter JA, Ramkema M, Redeker S, Ozbas-Gerceker F, van Vliet EA, Scheffer GL, Scheper RJ, van der Valk P, Baayen JC, Troost D (2004). Expression and cellular distribution of multidrug resistance-related proteins in the hippocampus of patients with mesial temporal lobe epilepsy. Epilepsia 45: 441-451.

References
270
Atkinson HC, Waddell BJ (1997). Circadian variation in basal plasma corticosterone and adrenocorticotropin in the rat: sexual dimorphism and changes across the estrous cycle. Endocrinology 138: 3842-3848. Auguet M, Delaflotte S, Clostre F, Defeudis FV (1986). Verapamil as an Apparent Competitive Antagonist of the Serotonin Receptor of Rabbit Isolated Aorta. Gen Pharmacol 17: 133-135. Avdeef A (2011). How well can in vitro brain microcapillary endothelial cell models predict rodent in vivo blood-brain barrier permeability? Eur J Pharm Sci 43: 109-124. Backman JT, Olkkola KT, Aranko K, Himberg JJ, Neuvonen PJ (1994). Dose of Midazolam Should Be Reduced during Diltiazem and Verapamil Treatments. Brit J Clin Pharmacol 37: 221-225. Balimane PV, Han YH, Chong S (2006). Current industrial practices of assessing permeability and P-glycoprotein interaction. AAPS J 8: E1-13. Ballabh P, Braun A, Nedergaard M (2004). The blood-brain barrier: an overview: Structure, regulation, and clinical implications. Neurobiol Dis 16: 1-13. Baltes S, Gastens AM, Fedrowitz M, Potschka H, Kaever V, Loscher W (2007). Differences in the transport of the antiepileptic drugs phenytoin, levetiracetam and carbamazepine by human and mouse P-glycoprotein. Neuropharmacology 52: 333-346. Bart J, Willemsen AT, Groen HJ, van der Graaf WT, Wegman TD, Vaalburg W, de Vries EG, Hendrikse NH (2003). Quantitative assessment of P-glycoprotein function in the rat blood-brain barrier by distribution volume of [11C]verapamil measured with PET. Neuroimage 20: 1775-1782. Bauer B, Hartz AMS, Fricker G, Miller DS (2004). Pregnane X receptor up-regulation of P-glycoprotein expression and transport function at the blood-brain barrier. Mol Pharmacol 66: 413-419. Bauer B, Hartz AMS, Lucking JR, Yang XD, Pollack GM, Miller DS (2008). Coordinated nuclear receptor regulation of the efflux transporter, Mrp2, and the phase-II metabolizing enzyme, GST pi, at the blood-brain barrier. J Cerebr Blood F Met 28: 1222-1234. Bauer B, Hartz AMS, Miller DS (2007). Tumor necrosis factor alpha and endothelin-1 increase P-glycoprotein expression and transport activity at the blood-brain barrier. Mol Pharmacol 71: 667-675. Bauer B, Yang X, Hartz AM, Olson ER, Zhao R, Kalvass JC, Pollack GM, Miller DS (2006). In vivo activation of human pregnane X receptor tightens the blood-brain barrier to methadone through P-glycoprotein up-regulation. Mol Pharmacol 70: 1212-1219. Baumann P, Hiemke C, Ulrich S, Eckermann G, Gaertner I, Gerlach M, Kuss HJ, Laux G, Muller-Oerlinghausen B, Rao ML, Riederer P, Zernig G (2004). The AGNP-TDM expert group consensus guidelines: therapeutic drug monitoring in psychiatry. Pharmacopsychiatry 37: 243-265.

References
271
Baumert C, Hilgeroth A (2009). Recent advances in the development of P-gp inhibitors. Anticancer Agents Med Chem 9: 415-436. Begley DJ (2004). ABC transporters and the blood-brain barrier. Curr Pharm Design 10: 1295-1312. Bendayan R, Ronaldson PT, Gingras D, Bendayan M (2006). In situ localization of P-glycoprotein (ABCB1) in human and rat brain. J Histochem Cytochem 54: 1159-1167. Benet LZ (2009). The Drug Transporter-Metabolism Alliance: Uncovering and Defining the Interplay. Mol Pharmaceut 6: 1631-1643. Benmansour S, Cecchi M, Morilak DA, Gerhardt GA, Javors MA, Gould GG, Frazer A (1999). Effects of chronic antidepressant treatments on serotonin transporter function, density, and mRNA level. The Journal of neuroscience : the official journal of the Society for Neuroscience 19: 10494-10501. Berman RM, Cappiello A, Anand A, Oren DA, Heninger GR, Charney DS, Krystal JH (2000). Antidepressant effects of ketamine in depressed patients. Biol Psychiatry 47: 351-354. Berton O, Hahn CG, Thase ME (2012). Are we getting closer to valid translational models for major depression? Science 338: 75-79. Berton O, Nestler EJ (2006). New approaches to antidepressant drug discovery: beyond monoamines. Nat Rev Neurosci 7: 137-151. Bickel U (2005). How to measure drug transport across the blood-brain barrier. NeuroRx 2: 15-26. Bjartmar L, Johansson IM, Marcusson J, Ross SB, Seckl JR, Olsson T (2000). Selective effects on NGFI-A, MR, GR and NGFI-B hippocampal mRNA expression after chronic treatment with different subclasses of antidepressants in the rat. Psychopharmacology (Berl) 151: 7-12. Blom JM, Tascedda F, Carra S, Ferraguti C, Barden N, Brunello N (2002). Altered regulation of CREB by chronic antidepressant administration in the brain of transgenic mice with impaired glucocorticoid receptor function. Neuropsychopharmacol 26: 605-614. Bolo NR, Hode Y, Nedelec JF, Laine E, Wagner G, Macher JP (2000). Brain pharmacokinetics and tissue distribution in vivo of fluvoxamine and fluoxetine by fluorine magnetic resonance spectroscopy. Neuropsychopharmacol 23: 428-438. Bouw MR, Hammarlund-Udenaes M (1998). Methodological aspects of the use of a calibrator in in vivo microdialysis-further development of the retrodialysis method. Pharm Res 15: 1673-1679. Boyer EW, Shannon M (2005). The serotonin syndrome. The New England journal of medicine 352: 1112-1120. Brady LS, Whitfield HJ, Jr., Fox RJ, Gold PW, Herkenham M (1991). Long-term antidepressant administration alters corticotropin-releasing hormone, tyrosine

References
272
hydroxylase, and mineralocorticoid receptor gene expression in rat brain. Therapeutic implications. J Clin Invest 87: 831-837. Breitenstein B, Scheuer S, Pfister H, Uhr M, Lucae S, Holsboer F, Ising M, Bruckl TM (2013). The clinical application of ABCB1 genotyping in antidepressant treatment: a pilot study. CNS spectrums: 1-11. Brightman MW, Reese TS (1969). Junctions between Intimately Apposed Cell Membranes in Vertebrate Brain. J Cell Biol 40: 648-677. Broccatelli F, Larregieu CA, Cruciani G, Oprea TI, Benet LZ (2012). Improving the prediction of the brain disposition for orally administered drugs using BDDCS. Adv Drug Deliv Rev 64: 95-109. Browne CA, Clarke G, Dinan TG, Cryan JF (2011). Differential stress-induced alterations in tryptophan hydroxylase activity and serotonin turnover in two inbred mouse strains. Neuropharmacology 60: 683-691. Browne CA, Clarke G, Hanke J, Dinan TG, Schwegler H, Yilmazer-Hanke DM, Cryan JF (2013). Alterations in prefrontal cortical serotonin and antidepressant-like behavior in a novel C3H/HeJxDBA/2J recombinant inbred mouse strain. Behav Brain Res 236: 283-288. Bundgaard C, Jensen CJ, Garmer M (2012). Species comparison of in vivo P-glycoprotein-mediated brain efflux using mdr1a-deficient rats and mice. Drug Metab Dispos 40: 461-466. Bundgaard C, Jorgensen M, Mork A (2007). An integrated microdialysis rat model for multiple pharmacokinetic/pharmacodynamic investigations of serotonergic agents. J Pharmacol Toxicol Methods 55: 214-223. Bungay PM, Morrison PF, Dedrick RL (1990). Steady-state theory for quantitative microdialysis of solutes and water in vivo and in vitro. Life Sci 46: 105-119. Burgdorf J, Zhang XL, Nicholson KL, Balster RL, Leander JD, Stanton PK, Gross AL, Kroes RA, Moskal JR (2013). GLYX-13, a NMDA receptor glycine-site functional partial agonist, induces antidepressant-like effects without ketamine-like side effects. Neuropsychopharmacol 38: 729-742. Burnet PW, Michelson D, Smith MA, Gold PW, Sternberg EM (1994). The effect of chronic imipramine administration on the densities of 5-HT1A and 5-HT2 receptors and the abundances of 5-HT receptor and transporter mRNA in the cortex, hippocampus and dorsal raphe of three strains of rat. Brain Res 638: 311-324. Busquet P, Nguyen NK, Schmid E, Tanimoto N, Seeliger MW, Ben-Yosef T, Mizuno F, Akopian A, Striessnig J, Singewald N (2010). CaV1.3 L-type Ca2+ channels modulate depression-like behaviour in mice independent of deaf phenotype. Int J Neuropsychopharmacol 13: 499-513. Campbell M, Humphries MM, Kiang AS, Nguyen AT, Gobbo OL, Tam LC, Suzuki M, Hanrahan F, Ozaki E, Farrar GJ, Kenna PF, Humphries P (2011). Systemic low-molecular weight drug delivery to pre-selected neuronal regions. EMBO Mol Med 3: 235-245.

References
273
Carman AJ, Mills JH, Krenz A, Kim D-G, Bynoe MS (2011). Adenosine Receptor Signaling Modulates Permeability of the Blood–Brain Barrier. The Journal of Neuroscience 31: 13272-13280. Carroll BJ (1982a). Clinical-Applications of the Dexamethasone Suppression Test for Endogenous-Depression. Pharmacopsychiatria 15: 19-24. Carroll BJ (1982b). The Dexamethasone Suppression Test for Melancholia. Brit J Psychiat 140: 292-304. Carroll BJ, Cassidy F, Naftolowitz D, Tatham NE, Wilson WH, Iranmanesh A, Liu PY, Veldhuis JD (2007). Pathophysiology of hypercortisolism in depression. Acta Psychiat Scand 115: 90-103. Cascorbi I (2006). Role of pharmacogenetics of ATP-binding cassette transporters in the pharmacokinetics of drugs. Pharmacol Therapeut 112: 457-473. Cascorbi I, Gerloff T, Johne A, Meisel C, Hoffmeyer S, Schwab M, Schaeffeler E, Eichelbaum M, Brinkmann U, Roots I (2001). Frequency of single nucleotide polymorphisms in the P-glycoprotein drug transporter MDR1 gene in white subjects. Clin Pharmacol Ther 69: 169-174. Cecchelli R, Dehouck B, Descamps L, Fenart L, Buee-Scherrer VV, Duhem C, Lundquist S, Rentfel M, Torpier G, Dehouck MP (1999). In vitro model for evaluating drug transport across the blood-brain barrier. Adv Drug Deliv Rev 36: 165-178. Centers for Disease Control and Prevention (2013). Web-based Injury Statistics Query and Reporting System (WISQARS). Web address: www.cdc.gov/ncipc/wisqars. Accessed 26 September 2013. Cisternino S, Mercier C, Bourasset F, Roux F, Scherrmann JM (2004). Expression, up-regulation, and transport activity of the multidrug-resistance protein ABCG2 at the mouse blood-brain barrier. Cancer Res 64: 3296-3301. Clarke G, O'Mahony SM, Cryan JF, Dinan TG (2009). Verapamil in treatment resistant depression: a role for the P-glycoprotein transporter? Hum Psychopharmacol 24: 217-223. Clinckers R, Smolders I, Meurs A, Ebinger G, Michotte Y (2005). Quantitative in vivo microdialysis study on the influence of multidrug transporters on the blood-brain barrier passage of oxcarbazepine: concomitant use of hippocampal monoamines as pharmacodynamic markers for the anticonvulsant activity. J Pharmacol Exp Ther 314: 725-731. Cohen C, Perrault G, Sanger DJ (1997). Assessment of the antidepressant-like effects of L-type voltage-dependent channel modulators. Behav Pharmacol 8: 629-638. Colabufo NA, Berardi F, Cantore M, Contino M, Inglese C, Niso M, Perrone R (2010). Perspectives of P-Glycoprotein Modulating Agents in Oncology and Neurodegenerative Diseases: Pharmaceutical, Biological, and Diagnostic Potentials. J Med Chem 53: 1883-1897.

References
274
Cole SPC, Loe DW, Deeley RG (2000). Verapamil stimulates glutathione transport by the 190-kDa multidrug resistance protein 1 (MRP1). J Pharmacol Exp Ther 293: 530-538. Connolly KR, Thase ME (2011). If at first you don't succeed: a review of the evidence for antidepressant augmentation, combination and switching strategies. Drugs 71: 43-64. Connor TJ, Kelliher P, Shen Y, Harkin A, Kelly JP, Leonard BE (2000). Effect of subchronic antidepressant treatments on behavioral, neurochemical, and endocrine changes in the forced-swim test. Pharmacology, biochemistry, and behavior 65: 591-597. Cordoncardo C, O'Brien JP, Casals D, Rittmangrauer L, Biedler JL, Melamed MR, Bertino JR (1989). Multidrug-Resistance Gene (P-Glycoprotein) Is Expressed by Endothelial-Cells at Blood-Brain Barrier Sites. P Natl Acad Sci USA 86: 695-698. Cotter D, Mackay D, Landau S, Kerwin R, Everall I (2001). Reduced glial cell density and neuronal size in the anterior cingulate cortex in major depressive disorder. Arch Gen Psychiatry 58: 545-553. Cremers TI, de Vries MG, Huinink KD, van Loon JP, v d Hart M, Ebert B, Westerink BH, De Lange EC (2009). Quantitative microdialysis using modified ultraslow microdialysis: direct rapid and reliable determination of free brain concentrations with the MetaQuant technique. Journal of neuroscience methods 178: 249-254. Cryan JF, Holmes A (2005). The ascent of mouse: advances in modelling human depression and anxiety. Nat Rev Drug Discov 4: 775-790. Cryan JF, Leonard BE (eds) (2010). Depression: From Psychopathology to Pharmacotherapy. Karger: Basel. Cryan JF, Mombereau C (2004). In search of a depressed mouse: utility of models for studying depression-related behavior in genetically modified mice. Mol Psychiatry 9: 326-357. Cryan JF, Mombereau C, Vassout A (2005a). The tail suspension test as a model for assessing antidepressant activity: review of pharmacological and genetic studies in mice. Neurosci Biobehav Rev 29: 571-625. Cryan JF, O'Leary OF (2010). Neuroscience. A glutamate pathway to faster-acting antidepressants? Science 329: 913-914. Cryan JF, Page ME, Lucki I (2005b). Differential behavioral effects of the antidepressants reboxetine, fluoxetine, and moclobemide in a modified forced swim test following chronic treatment. Psychopharmacology (Berl) 182: 335-344. Cutler L, Howes C, Deeks NJ, Buck TL, Jeffrey P (2006). Development of a P-glycoprotein knockout model in rodents to define species differences in its functional effect at the blood-brain barrier. J Pharm Sci 95: 1944-1953. Dano K (1973). Active outward transport of daunomycin in resistant Ehrlich ascites tumor cells. Biochim Biophys Acta 323: 466-483.

References
275
Dantzer R, O'Connor JC, Freund GG, Johnson RW, Kelley KW (2008). From inflammation to sickness and depression: when the immune system subjugates the brain. Nat Rev Neurosci 9: 46-56. Darvesh AS, Carroll RT, Geldenhuys WJ, Gudelsky GA, Klein J, Meshul CK, Van der Schyf CJ (2011). In vivo brain microdialysis: advances in neuropsychopharmacology and drug discovery. Expert opinion on drug discovery 6: 109-127. Dauchy S, Dutheil F, Weaver RJ, Chassoux F, Daumas-Duport C, Couraud PO, Scherrmann JM, De Waziers I, Decleves X (2008). ABC transporters, cytochromes P450 and their main transcription factors: expression at the human blood-brain barrier. J Neurochem 107: 1518-1528. de Klerk OL, Bosker FJ, Willemsen AT, Van Waarde A, Visser AK, de Jager T, Dagyte G, den Boer JA, Dierckx RA, Meerlo P (2010). Chronic stress and antidepressant treatment have opposite effects on P-glycoprotein at the blood-brain barrier: an experimental PET study in rats. J Psychopharmacol 24: 1237-1242. de Klerk OL, Nolte IM, Bet PM, Bosker FJ, Snieder H, den Boer JA, Bruggeman R, Hoogendijk WJ, Penninx BW (2013). ABCB1 gene variants influence tolerance to selective serotonin reuptake inhibitors in a large sample of Dutch cases with major depressive disorder. Pharmacogenomics J 13: 349-353. de Klerk OL, Willemsen ATM, Roosink M, Bartels AL, Hendrikse NH, Bosker FJ, den Boer JA (2009). Locally increased P-glycoprotein function in major depression: a PET study with [C-11]verapamil as a probe for P-glycoprotein function in the blood-brain barrier. Int J Neuropsychoph 12: 895-904. de Lagerie SB, Comets E, Gautrand C, Fernandez C, Auchere D, Singlas E, Mentre F, Gimenez F (2004). Cerebral uptake of mefloquine enantiomers with and without the P-gp inhibitor elacridar (GF1210918) in mice. Brit J Pharmacol 141: 1214-1222. de Lange EC, de Bock G, Schinkel AH, de Boer AG, Breimer DD (1998). BBB transport and P-glycoprotein functionality using MDR1A (-/-) and wild-type mice. Total brain versus microdialysis concentration profiles of rhodamine-123. Pharm Res 15: 1657-1665. de Lange ECM, de Boer AG, Breimer DD (2000). Methodological issues in microdialysis sampling for pharmacokinetic studies. Adv Drug Deliver Rev 45: 125-148. De Luca V, Mundo E, Trakalo J, Wong GWH, Kennedy JL (2003). Investigation of polymorphism in the MDR1 gene and antidepressant-induced mania. Pharmacogenomics J 3: 297-299. de Vries NA, Zhao J, Kroon E, Buckle T, Beijnen JH, van Tellingen O (2007). P-glycoprotein and breast cancer resistance protein: two dominant transporters working together in limiting the brain penetration of topotecan. Clin Cancer Res 13: 6440-6449. Desai PV, Sawada GA, Watson IA, Raub TJ (2013). Integration of in silico and in vitro tools for scaffold optimization during drug discovery: predicting P-glycoprotein efflux. Mol Pharm 10: 1249-1261.

References
276
Devault A, Gros P (1990). Two members of the mouse mdr gene family confer multidrug resistance with overlapping but distinct drug specificities. Mol Cell Biol 10: 1652-1663. DeWitt CR, Waksman JC (2004). Pharmacology, pathophysiology and management of calcium channel blocker and beta-blocker toxicity. Toxicological reviews 23: 223-238. Di Chiara G, Tanda G, Carboni E (1996). Estimation of in-vivo neurotransmitter release by brain microdialysis: the issue of validity. Behav Pharmacol 7: 640-657. Diaz SL, Maroteaux L (2011). Implication of 5-HT(2B) receptors in the serotonin syndrome. Neuropharmacology 61: 495-502. Dinan TG (2009). Inflammatory markers in depression. Curr Opin Psychiatr 22: 32-36. Dombrowski SM, Desai SY, Marroni M, Cucullo L, Goodrich K, Bingaman W, Mayberg MR, Bengez L, Janigro D (2001). Overexpression of multiple drug resistance genes in endothelial cells from patients with refractory epilepsy. Epilepsia 42: 1501-1506. Doran A, Obach RS, Smith BJ, Hosea NA, Becker S, Callegari E, Chen CP, Chen X, Choo E, Cianfrogna J, Cox LM, Gibbs JP, Gibbs MA, Hatch H, Hop CECA, Kasman IN, LaPerle J, Liu JH, Liu XR, Logman M, Maclin D, Nedza FM, Nelson F, Olson E, Rahematpura S, Raunig D, Rogers S, Schmidt K, Spracklin DK, Szewc M, Troutman M, Tseng E, Tu MH, Van Deusen JW, Venkatakrishnan K, Walens G, Wang EQ, Wong D, Yasgar AS, Zhang CH (2005). The impact of P-glycoprotein on the disposition of drugs targeted for indications of the central nervous system: Evaluation using the MDR1A/1B knockout mouse model. Drug Metab Dispos 33: 165-174. Duman RS, Monteggia LM (2006). A neurotrophic model for stress-related mood disorders. Biol Psychiatry 59: 1116-1127. Dunn AJ, Swiergiel AH, de Beaurepaire R (2005). Cytokines as mediators of depression: what can we learn from animal studies? Neurosci Biobehav Rev 29: 891-909. Dureja H, Madan AK (2007). Validation of topochemical models for the prediction of permeability through the blood-brain barrier. Acta Pharm 57: 451-467. Dutheil F, Dauchy S, Diry M, Sazdovitch V, Cloarec O, Mellottée L, Bièche I, Ingelman-Sundberg M, Flinois J-P, de Waziers I, Beaune P, Declèves X, Duyckaerts C, Loriot M-A (2009). Xenobiotic-Metabolizing Enzymes and Transporters in the Normal Human Brain: Regional and Cellular Mapping as a Basis for Putative Roles in Cerebral Function. Drug Metab Dispos 37: 1528-1538. Ebinger M, Uhr M (2006). ABC drug transporter at the blood-brain barrier - Effects on drug metabolism and drug response. Eur Arch Psy Clin N 256: 294-298. Eckford PDW, Sharom FJ (2009). ABC Efflux Pump-Based Resistance to Chemotherapy Drugs. Chem Rev 109: 2989-3011. Ehret MJ, Levin GA, Narasimhan M, Rathinavelu A (2007). Venlafaxine induces P-glycoprotein in human Caco-2 cells. Hum Psychopharm Clin 22: 49-53.

References
277
Ejsing TB, Hasselstrom J, Linnet K (2006). The influence of P-glycoprotein on cerebral and hepatic concentrations of nortriptyline and its metabolites. Drug Metabol Drug Interact 21: 139-162. Ejsing TB, Linnet K (2005). Influence of P-glycoprotein inhibition on the distribution of the tricyclic antidepressant nortriptyline over the blood-brain barrier. Hum Psychopharmacol 20: 149-153. El Ela AA, Hartter S, Schmitt U, Hiemke C, Spahn-Langguth H, Langguth P (2004). Identification of P-glycoprotein substrates and inhibitors among psychoactive compounds - implications for pharmaccokinetics of selected substrates. J Pharm Pharmacol 56: 967-975. Evrard PA, Ragusi C, Boschi G, Verbeeck RK, Scherrmann JM (1998). Simultaneous microdialysis in brain and blood of the mouse: extracellular and intracellular brain colchicine disposition. Brain Res 786: 122-127. Eyal S, Hsiao P, Unadkat JD (2009). Drug interactions at the blood-brain barrier: Fact or fantasy? Pharmacol Therapeut 123: 80-104. Faassen F, Vogel G, Spanings H, Vromans H (2003). Caco-2 permeability, P-glycoprotein transport ratios and brain penetration of heterocyclic drugs. Int J Pharm 263: 113-122. Fava M (2003). Diagnosis and definition of treatment-resistant depression. Biol Psychiatry 53: 649-659. Feldmann M, Asselin MC, Liu J, Wang S, McMahon A, Anton-Rodriguez J, Walker M, Symms M, Brown G, Hinz R, Matthews J, Bauer M, Langer O, Thom M, Jones T, Vollmar C, Duncan JS, Sisodiya SM, Koepp MJ (2013). P-glycoprotein expression and function in patients with temporal lobe epilepsy: a case-control study. Lancet Neurol 12: 777-785. Fellner S, Bauer B, Miller DS, Schaffrik M, Fankhanel M, Spruss T, Bernhardt G, Graeff C, Farber L, Gschaidmeier H, Buschauer A, Fricker G (2002). Transport of paclitaxel (Taxol) across the blood-brain barrier in vitro and in vivo. J Clin Invest 110: 1309-1318. Feng B, Mills JB, Davidson RE, Mireles RJ, Janiszewski JS, Troutman MD, de Morais SM (2008). In vitro P-glycoprotein assays to predict the in vivo interactions of P-glycoprotein with drugs in the central nervous system. Drug Metab Dispos 36: 268-275. Fick A (1855). On Liquid Diffusion Philos Mag J Sci 10: 31-39. Fleishaker JC, Sisson TA, Carel BJ, Azie NE (2000). Pharmacokinetic interaction between verapamil and almotriptan in healthy volunteers. Clin Pharmacol Ther 67: 498-503. Frahnert C, Rao ML, Grasmader K (2003). Analysis of eighteen antidepressants, four atypical antipsychotics and active metabolites in serum by liquid chromatography: a simple tool for therapeutic drug monitoring. J Chromatogr B Analyt Technol Biomed Life Sci 794: 35-47. Frazer A, Benmansour S (2002). Delayed pharmacological effects of antidepressants. Mol Psychiatry 7 Suppl 1: S23-28.

References
278
Friedl W, Propping P (1984). 3H-imipramine binding in human platelets: a study in normal twins. Psychiatry Res 11: 279-285. Fukui N, Suzuki Y, Sawamura K, Sugai T, Watanabe J, Inoue Y, Someya T (2007). Dose-dependent effects of the 3435 C > T genotype of ABCB1 gene on the steady-state plasma concentration of fluvoxamine in psychiatric patients. Ther Drug Monit 29: 185-189. Garberg P, Ball M, Borg N, Cecchelli R, Fenart L, Hurst RD, Lindmark T, Mabondzo A, Nilsson JE, Raub TJ, Stanimirovic D, Terasaki T, Oberg JO, Osterberg T (2005). In vitro models for the blood-brain barrier. Toxicol In Vitro 19: 299-334. Gaska M, Kusmider M, Solich J, Faron-Gorecka A, Krawczyk MJ, Kulakowski K, Dziedzicka-Wasylewska M (2012). Analysis of region-specific changes in gene expression upon treatment with citalopram and desipramine reveals temporal dynamics in response to antidepressant drugs at the transcriptome level. Psychopharmacology (Berl) 223: 281-297. Gaynes BN, Rush AJ, Trivedi MH, Wisniewski SR, Spencer D, Fava M (2008). The STAR*D study: treating depression in the real world. Cleveland Clinic journal of medicine 75: 57-66. Gex-Fabry M, Eap CB, Oneda B, Gervasoni N, Aubry JM, Bondolfi G, Bertschy G (2008). CYP2D6 and ABCB1 genetic variability: Influence on paroxetine plasma level and therapeutic response. Ther Drug Monit 30: 474-482. Ghersi-Egea JF, Leninger-Muller B, Suleman G, Siest G, Minn A (1994). Localization of Drug-Metabolizing Enzyme-Activities to Blood-Brain Interfaces and Circumventricular Organs. J Neurochem 62: 1089-1096. Gillman PK (2005). Monoamine oxidase inhibitors, opioid analgesics and serotonin toxicity. British journal of anaesthesia 95: 434-441. Gold PW, Chrousos GP (2002). Organization of the stress system and its dysregulation in melancholic and atypical depression: high vs low CRH/NE states. Mol Psychiatry 7: 254-275. Goodwin JT, Clark DE (2005). In silico predictions of blood-brain barrier penetration: considerations to "keep in mind". J Pharmacol Exp Ther 315: 477-483. Gosselin RD, O'Connor RM, Tramullas M, Julio-Pieper M, Dinan TG, Cryan JF (2010). Riluzole normalizes early-life stress-induced visceral hypersensitivity in rats: role of spinal glutamate reuptake mechanisms. Gastroenterology 138: 2418-2425. Gottesman MM, Fojo T, Bates SE (2002). Multidrug resistance in cancer: role of ATP-dependent transporters. Nat Rev Cancer 2: 48-58. Gourley SL, Wu FJ, Kiraly DD, Ploski JE, Kedves AT, Duman RS, Taylor JR (2008). Regionally specific regulation of ERK MAP kinase in a model of antidepressant-sensitive chronic depression. Biol Psychiatry 63: 353-359. Grauer MT, Uhr M (2004). P-glycoprotein reduces the ability of amitriptyline metabolites to cross the blood brain barrier in mice after a 10-day administration of amitriptyline. J Psychopharmacol 18: 66-74.

References
279
Greig NH, Daly EM, Sweeney DJ, Rapoport SI (1990). Pharmacokinetics of chlorambucil-tertiary butyl ester, a lipophilic chlorambucil derivative that achieves and maintains high concentrations in brain. Cancer Chemother Pharmacol 25: 320-325. Groenendaal D, Freijer J, de Mik D, Bouw MR, Danhof M, de Lange EC (2007). Population pharmacokinetic modelling of non-linear brain distribution of morphine: influence of active saturable influx and P-glycoprotein mediated efflux. Br J Pharmacol 151: 701-712. Groves JO (2007). Is it time to reassess the BDNF hypothesis of depression? Mol Psychiatry 12: 1079-1088. Guidotti G, Calabrese F, Anacker C, Racagni G, Pariante CM, Riva MA (2013). Glucocorticoid receptor and FKBP5 expression is altered following exposure to chronic stress: modulation by antidepressant treatment. Neuropsychopharmacol 38: 616-627. Haberzettl R, Bert B, Fink H, Fox MA (2013). Animal models of the serotonin syndrome: A systematic review. Behav Brain Res 256C: 328-345. Halbreich U, Asnis GM, Shindledecker R, Zumoff B, Nathan RS (1985). Cortisol Secretion in Endogenous-Depression .1. Basal Plasma-Levels. Arch Gen Psychiat 42: 904-908. Hammarlund-Udenaes M (2010). Active-site concentrations of chemicals - are they a better predictor of effect than plasma/organ/tissue concentrations? Basic Clin Pharmacol Toxicol 106: 215-220. Hartz AM, Miller DS, Bauer B (2010). Restoring blood-brain barrier P-glycoprotein reduces brain amyloid-beta in a mouse model of Alzheimer's disease. Mol Pharmacol 77: 715-723. Hawkins BT, Davis TP (2005). The blood-brain barrier/neurovascular unit in health and disease. Pharmacol Rev 57: 173-185. Hayashi Y, Nomura M, Yamagishi SI, Harada SI, Yamashita J, Yamamoto H (1997). Induction of various blood-brain barrier properties in non-neural endothelial cells by close apposition to co-cultured astrocytes. Glia 19: 13-26. Heiser A (2007). Rat Jugular Vein and Carotid Artery Catheterization for Acute Survival Studies: A Practical Guide. 1st edn. Springer: New York. Hellinger E, Veszelka S, Toth AE, Walter F, Kittel A, Bakk ML, Tihanyi K, Hada V, Nakagawa S, Duy TD, Niwa M, Deli MA, Vastag M (2012). Comparison of brain capillary endothelial cell-based and epithelial (MDCK-MDR1, Caco-2, and VB-Caco-2) cell-based surrogate blood-brain barrier penetration models. Eur J Pharm Biopharm 82: 340-351. Hermann DJ, Krol TF, Dukes GE, Hussey EK, Danis M, Han YH, Powell JR, Hak LJ (1992). Comparison of verapamil, diltiazem, and labetalol on the bioavailability and metabolism of imipramine. J Clin Pharmacol 32: 176-183. Hermann DM, Bassetti CL (2007). Implications of ATP-binding cassette transporters for brain pharmacotherapies. Trends Pharmacol Sci 28: 128-134.

References
280
Herr AS, Tsolakidou AF, Yassouridis A, Holsboer F, Rein T (2003). Antidepressants differentially influence the transcriptional activity of the glucocorticoid receptor in vitro. Neuroendocrinology 78: 12-22. Heurteaux C, Lucas G, Guy N, El Yacoubi M, Thummler S, Peng XD, Noble F, Blondeau N, Widmann C, Borsotto M, Gobbi G, Vaugeois JM, Debonnel G, Lazdunski M (2006). Deletion of the background potassium channel TREK-1 results in a depression-resistant phenotype. Nat Neurosci 9: 1134-1141. Heydendael W, Jacobson L (2009). Glucocorticoid status affects antidepressant regulation of locus coeruleus tyrosine hydroxylase and dorsal raphe tryptophan hydroxylase gene expression. Brain Res 1288: 69-78. Hoffmeyer S, Burk O, von Richter O, Arnold HP, Brockmoller J, Johne A, Cascorbi I, Gerloff T, Roots I, Eichelbaum M, Brinkmann U (2000). Functional polymorphisms of the human multidrug-resistance gene: Multiple sequence variations and correlation of one allele with P-glycoprotein expression and activity in vivo. P Natl Acad Sci USA 97: 3473-3478. Hollon SD, Thase ME, Markowitz JC (2002). Treatment and Prevention of Depression. Psychological Science in the Public Interest 3: 39-77. Holsboer F (2000). The corticosteroid receptor hypothesis of depression. Neuropsychopharmacol 23: 477-501. Holthoewer D, Hiemke C, Schmitt U (2010). Induction of Drug Transporters Alters Disposition of Risperidone - A Study in Mice. Pharmaceutics 2: 258-274. Holtzheimer PE, Mayberg HS (2011). Stuck in a rut: rethinking depression and its treatment. Trends Neurosci 34: 1-9. Hoshaw BA, Malberg JE, Lucki I (2005). Central administration of IGF-I and BDNF leads to long-lasting antidepressant-like effects. Brain Res 1037: 204-208. Hsiao P, Bui T, Ho RJ, Unadkat JD (2008). In vitro-to-in vivo prediction of P-glycoprotein-based drug interactions at the human and rodent blood-brain barrier. Drug Metab Dispos 36: 481-484. Huang C, Yoshimoto M, Miki K, Johns EJ (2006). The contribution of brain angiotensin II to the baroreflex regulation of renal sympathetic nerve activity in conscious normotensive and hypertensive rats. J Physiol 574: 597-604. Hynynen K (2008). Ultrasound for drug and gene delivery to the brain. Adv Drug Deliv Rev 60: 1209-1217. Ibrahim S, Peggins J, Knapton A, Licht T, Aszalos A (2000). Influence of antipsychotic, antiemetic, and Ca(2+) channel blocker drugs on the cellular accumulation of the anticancer drug daunorubicin: P-glycoprotein modulation. J Pharmacol Exp Ther 295: 1276-1283.

References
281
Ieiri I (2012). Functional significance of genetic polymorphisms in P-glycoprotein (MDR1, ABCB1) and breast cancer resistance protein (BCRP, ABCG2). Drug Metab Pharmacokinet 27: 85-105. Ito S, Ieiri I, Tanabe M, Suzuki A, Higuchi S, Otsubo K (2001). Polymorphism of the ABC transporter genes, MDR1, MRP1 and MRP2/cMOAT, in healthy Japanese subjects. Pharmacogenetics 11: 175-184. Jacobsen JP, Mork A (2004). The effect of escitalopram, desipramine, electroconvulsive seizures and lithium on brain-derived neurotrophic factor mRNA and protein expression in the rat brain and the correlation to 5-HT and 5-HIAA levels. Brain Res 1024: 183-192. Jaffrezou JP, Chen G, Duran GE, Muller C, Bordier C, Laurent G, Sikic BI, Levade T (1995). Inhibition of Lysosomal Acid Sphingomyelinase by Agents Which Reverse Multidrug-Resistance. Bba-Mol Cell Res 1266: 1-8. Janzer RC, Raff MC (1987). Astrocytes induce blood-brain barrier properties in endothelial cells. Nature 325: 253-257. Johansson IM, Bjartmar L, Marcusson J, Ross SB, Seckl JR, Olsson T (1998). Chronic amitriptyline treatment induces hippocampal NGFI-A, glucocorticoid receptor and mineralocorticoid receptor mRNA expression in rats. Brain research. Molecular brain research 62: 92-95. Johne A, Kopke K, Gerloff T, Mai I, Rietbrock S, Meisel C, Hoffmeyer S, Kerb R, Fromm MF, Brinkmann U, Eichelbaum M, Brockmoller J, Cascorbi I, Roots I (2002). Modulation of steady-state kinetics of digoxin by haplotypes of the P-glycoprotein MDR1 gene. Clin Pharmacol Ther 72: 584-594. Joint Formulary Committee (2013). British National Formulary. 65 edn. BMJ Publishing Group Ltd and Royal Pharmaceutical Society: London. Juliano RL, Ling V (1976). Surface Glycoprotein Modulating Drug Permeability in Chinese-Hamster Ovary Cell Mutants. Biochim Biophys Acta 455: 152-162. Julio-Pieper M, Dinan TG (2010). The Hypothalamic-Pituitary-Adrenal Axis in Depression. In: Cryan JF, Leonard BE (eds). Depression: From Psychopathology to Pharmacotherapy. Karger Press: Basel. pp 20-31. Kalvass JC, Pollack GM (2007). Kinetic considerations for the quantitative assessment of efflux activity and inhibition: Implications for understanding and predicting the effects of efflux inhibition. Pharmaceut Res 24: 265-276. Kalvass JC, Polli JW, Bourdet DL, Feng B, Huang SM, Liu X, Smith QR, Zhang LK, Zamek-Gliszczynski MJ (2013). Why clinical modulation of efflux transport at the human blood-brain barrier is unlikely: the ITC evidence-based position. Clin Pharmacol Ther 94: 80-94. Kane J, Honigfeld G, Singer J, Meltzer H (1988). Clozapine for the treatment-resistant schizophrenic. A double-blind comparison with chlorpromazine. Arch Gen Psychiatry 45: 789-796.

References
282
Kannan P, John C, Zoghbi SS, Halldin C, Gottesman MM, Innis RB, Hall MD (2009). Imaging the Function of P-Glycoprotein With Radiotracers: Pharmacokinetics and In Vivo Applications. Clin Pharmacol Ther 86: 368-377. Kantola T, Kivisto KT, Neuvonen PJ (1998). Erythromycin and verapamil considerably increase serum simvastatin and simvastatin acid concentrations. Clin Pharmacol Ther 64: 177-182. Karege F, Vaudan G, Schwald M, Perroud N, La Harpe R (2005). Neurotrophin levels in postmortem brains of suicide victims and the effects of antemortem diagnosis and psychotropic drugs. Brain research. Molecular brain research 136: 29-37. Karlsson L, Carlsson B, Hiemke C, Ahlner J, Bengtsson F, Schmitt U, Kugelberg FC (2013). Altered brain concentrations of citalopram and escitalopram in P-glycoprotein deficient mice after acute and chronic treatment. Eur Neuropsychopharmacol: [Epub ahead of print]. Karlsson L, Hiemke C, Carlsson B, Josefsson M, Ahlner J, Bengtsson F, Schmitt U, Kugelberg FC (2011). Effects on enantiomeric drug disposition and open-field behavior after chronic treatment with venlafaxine in the P-glycoprotein knockout mice model. Psychopharmacology (Berl) 215: 367-377. Karlsson L, Schmitt U, Josefsson M, Carlsson B, Ahlner J, Bengtsson F, Kugelberg FC, Hiemke C (2010). Blood-brain barrier penetration of the enantiomers of venlafaxine and its metabolites in mice lacking P-glycoprotein. Eur Neuropsychopharmacol 20: 632-640. Karssen AM, Meijer OC, van der Sandt ICJ, De Boer AG, De Lange ECM, De Kloet ER (2002). The role of the efflux transporter P-glycoprotein in brain penetration of prednisolone. J Endocrinol 175: 251-260. Karssen AM, Meijer OC, van der Sandt ICJ, Lucassen PJ, de Lange ECM, de Boer AG, de Kloet ER (2001). Multidrug Resistance P-Glycoprotein Hampers the Access of Cortisol But Not of Corticosterone to Mouse and Human Brain. Endocrinology 142: 2686-2694. Kato M, Fukuda T, Serretti A, Wakeno M, Okugawa G, Ikenaga Y, Hosoi Y, Takekita Y, Mandelli L, Azuma J, Kinoshita T (2008). ABCB1 (MDR1) gene polymorphisms are associated with the clinical response to paroxetine in patients with major depressive disorder. Prog Neuro-Psychoph 32: 398-404. Katoh M, Suzuyama N, Takeuchi T, Yoshitomi S, Asahi S, Yokoi T (2006). Kinetic analyses for species differences in P-glycoprotein-mediated drug transport. J Pharm Sci 95: 2673-2683. Kemper EM, Boogerd W, Thuis I, Beijnen JH, van Tellingen O (2004). Modulation of the blood-brain barrier in oncology: therapeutic opportunities for the treatment of brain tumours? Cancer treatment reviews 30: 415-423. Kennedy SH, Andersen HF, Lam RW (2006). Efficacy of escitalopram in the treatment of major depressive disorder compared with conventional selective serotonin reuptake inhibitors and venlafaxine XR: a meta-analysis. J Psychiatry Neurosci 31: 122-131. Kim RB, Leake BF, Choo EF, Dresser GK, Kubba SV, Schwarz UI, Taylor A, Xie HG, McKinsey J, Zhou S, Lan LB, Schuetz JD, Schuetz EG, Wilkinson GR (2001). Identification of functionally

References
283
variant MDR1 alleles among European Americans and African Americans. Clin Pharmacol Ther 70: 189-199. Kimchi-Sarfaty C, Oh JM, Kim IW, Sauna ZE, Calcagno AM, Ambudkar SV, Gottesman MM (2007). A "silent" polymorphism in the MDR1 gene changes substrate specificity. Science 315: 525-528. Kirschbaum KM, Henken S, Hiemke C, Schmitt U (2008). Pharmacodynamic consequences of P-glycoprotein-dependent pharmacokinetics of risperidone and haloperidol in mice. Behav Brain Res 188: 298-303. Klein N, Sacher J, Geiss-Granadia T, Attarbaschi T, Mossaheb N, Lanzenberger R, Potzi C, Holik A, Spindelegger C, Asenbaum S, Dudczak R, Tauscher J, Kasper S (2006). In vivo imaging of serotonin transporter occupancy by means of SPECT and [123I]ADAM in healthy subjects administered different doses of escitalopram or citalopram. Psychopharmacology (Berl) 188: 263-272. Kliewer SA, Goodwin B, Willson TM (2002). The nuclear pregnane X receptor: a key regulator of xenobiotic metabolism. Endocrine reviews 23: 687-702. Kohle C, Bock KW (2009). Coordinate regulation of human drug-metabolizing enzymes, and conjugate transporters by the Ah receptor, pregnane X receptor and constitutive androstane receptor. Biochemical pharmacology 77: 689-699. Kovarik JM, Beyer D, Bizot MN, Jiang Q, Allison MJ, Schmouder RL (2005). Pharmacokinetic interaction between verapamil and everolimus in healthy subjects. Brit J Clin Pharmacol 60: 434-437. Kreilgaard M, Smith DG, Brennum LT, Sanchez C (2008). Prediction of clinical response based on pharmacokinetic/pharmacodynamic models of 5-hydroxytryptamine reuptake inhibitors in mice. Br J Pharmacol 155: 276-284. Kreisl WC, Liow JS, Kimura N, Seneca N, Zoghbi SS, Morse CL, Herscovitch P, Pike VW, Innis RB (2010). P-glycoprotein function at the blood-brain barrier in humans can be quantified with the substrate radiotracer 11C-N-desmethyl-loperamide. Journal of nuclear medicine : official publication, Society of Nuclear Medicine 51: 559-566. Kreuter J, Ramge P, Petrov V, Hamm S, Gelperina SE, Engelhardt B, Alyautdin R, von Briesen H, Begley DJ (2003). Direct evidence that polysorbate-80-coated poly(butylcyanoacrylate) nanoparticles deliver drugs to the CNS via specific mechanisms requiring prior binding of drug to the nanoparticles. Pharm Res 20: 409-416. Krishnan V, Nestler EJ (2008). The molecular neurobiology of depression. Nature 455: 894-902. Kuhnke D, Jedlitschky G, Grube M, Krohn M, Jucker M, Mosyagin I, Cascorbi I, Walker LC, Kroemer HK, Warzok RW, Vogelgesang S (2007). MDR1-P-Glycoprotein (ABCB1) Mediates Transport of Alzheimer's amyloid-beta peptides--implications for the mechanisms of Abeta clearance at the blood-brain barrier. Brain Pathol 17: 347-353.

References
284
Kunzel HE, Binder EB, Nickel T, Ising M, Fuchs B, Majer M, Pfennig A, Ernst G, Kern N, Schmid DA, Uhr M, Holsboer F, Modell S (2003). Pharmacological and nonpharmacological factors influencing hypothalamic-pituitary-adrenocortical axis reactivity in acutely depressed psychiatric in-patients, measured by the Dex-CRH test. Neuropsychopharmacol 28: 2169-2178. Kupfer DJ, Frank E, Phillips ML (2012). Major depressive disorder: new clinical, neurobiological, and treatment perspectives. Lancet 379: 1045-1055. Kurata Y, Ieiri I, Kimura M, Morita T, Irie S, Urae A, Ohdo S, Ohtani H, Sawada Y, Higuchi S, Otsubo K (2002). Role of human MDR1 gene polymorphism in bioavailability and interaction of digoxin, a substrate of P-glycoprotein. Clin Pharmacol Ther 72: 209-219. Kuteykin-Teplyakov K, Luna-Tortos C, Ambroziak K, Loscher W (2010). Differences in the expression of endogenous efflux transporters in MDR1-transfected versus wildtype cell lines affect P-glycoprotein mediated drug transport. Brit J Pharmacol 160: 1453-1463. Kwan P, Brodie MJ (2000). Early identification of refractory epilepsy. The New England journal of medicine 342: 314-319. Kwan P, Sills GJ, Butler E, Gant TW, Brodie MJ (2003). Differential expression of multidrug resistance genes in naive rat brain. Neurosci Lett 339: 33-36. Laika B, Leucht S, Steimer W (2006). ABCB1 (P-Glycoprotein/MDR1) Gene G2677T/A Sequence Variation (Polymorphism): Lack of Association with Side Effects and Therapeutic Response in Depressed Inpatients Treated with Amitriptyline. Clin Chem 52: 893-895. Lang PO, Hasso Y, Hilleret H, Vogt-Ferrier N (2008). [Serotonin syndrome as a result of escitalopram and cyclosporin combination in an 84-year-old woman]. Rev Med Interne 29: 583-586. Langford D, Grigorian A, Hurford R, Adame A, Ellis RJ, Hansen L, Masliah E (2004). Altered P-glycoprotein expression in AIDS patients with HIV encephalitis. Journal of neuropathology and experimental neurology 63: 1038-1047. Laterra J, Keep R, Betz LA, Goldstein GW (1999a). Blood-Brain Barrier. In: Siegel GJ, Agranoff BW, Albers RW, Fisher SK, Uhler MD (eds). Basic Neurochemistry: Molecular, Cellular and Medical Aspects. Lippincott-Raven Press: Philadelphia. pp. Laterra J, Keep R, Betz LA, Goldstein GW (1999b). Blood-Cerebrospinal Fluid Barrier. In: Siegel GJ, Agranoff BW, Albers RW, Fisher SK, Uhler MD (eds). Basic Neurochemistry: Molecular, Cellular and Medical Aspects. Lippincott-Raven Press: Philadelphia. pp. Lee SH, Lee MS, Lee JH, Kim SW, Kang RH, Choi MJ, Park SJ, Kim SJ, Lee JM, Cole SPC, Lee MG (2010). MRP1 Polymorphisms Associated With Citalopram Response in Patients With Major Depression. J Clin Psychopharm 30: 116-125. Leith CP, Kopecky KJ, Chen IM, Eijdems L, Slovak ML, McConnell TS, Head DR, Weick J, Grever MR, Appelbaum FR, Willman CL (1999). Frequency and clinical significance of the expression of the multidrug resistance proteins MDR1/P-glycoprotein, MRP1, and LRP in acute myeloid leukemia: a Southwest Oncology Group Study. Blood 94: 1086-1099.

References
285
Lemoine A, Gautier JC, Azoulay D, Kiffel L, Belloc C, Guengerich FP, Maurel P, Beaune P, Leroux JP (1993). Major pathway of imipramine metabolism is catalyzed by cytochromes P-450 1A2 and P-450 3A4 in human liver. Mol Pharmacol 43: 827-832. Leonard BE (2010). The concept of depression as a dysfunction of the immune system. Current immunology reviews 6: 205-212. Leonard BE, Myint A (2009). The psychoneuroimmunology of depression. Hum Psychopharmacol 24: 165-175. Lesch KP, Aulakh CS, Wolozin BL, Tolliver TJ, Hill JL, Murphy DL (1993). Regional brain expression of serotonin transporter mRNA and its regulation by reuptake inhibiting antidepressants. Brain research. Molecular brain research 17: 31-35. Levin VA (1980). Relationship of octanol/water partition coefficient and molecular weight to rat brain capillary permeability. J Med Chem 23: 682-684. Li N, Lee B, Liu RJ, Banasr M, Dwyer JM, Iwata M, Li XY, Aghajanian G, Duman RS (2010). mTOR-dependent synapse formation underlies the rapid antidepressant effects of NMDA antagonists. Science 329: 959-964. Lin JH (2007). Transporter-mediated drug interactions: clinical implications and in vitro assessment. Expert Opin Drug Met 3: 81-92. Lin KM, Chiu YF, Tsai IJ, Chen CH, Shen WW, Liu SC, Lu SC, Liu CY, Hsiao MC, Tang HS, Liu SI, Chang LH, Wu CS, Tsou HH, Tsai MH, Chen CY, Wang SM, Kuo HW, Hsu YT, Liu YL (2011). ABCB1 gene polymorphisms are associated with the severity of major depressive disorder and its response to escitalopram treatment. Pharmacogenet Genomics 21: 163-170. Liow JS, Lu S, McCarron JA, Hong J, Musachio JL, Pike VW, Innis RB, Zoghbi SS (2007). Effect of a P-glycoprotein inhibitor, Cyclosporin A, on the disposition in rodent brain and blood of the 5-HT1A receptor radioligand, [11C](R)-(-)-RWAY. Synapse 61: 96-105. Liptrott NJ, Penny M, Bray PG, Sathish J, Khoo SH, Back DJ, Owen A (2009). The impact of cytokines on the expression of drug transporters, cytochrome P450 enzymes and chemokine receptors in human PBMC. Brit J Pharmacol 156: 497-508. List AF, Kopecky KJ, Willman CL, Head DR, Persons DL, Slovak ML, Dorr R, Karanes C, Hynes HE, Doroshow JH, Shurafa M, Appelbaum FR (2001). Benefit of cyclosporine modulation of drug resistance in patients with poor-risk acute myeloid leukemia: a Southwest Oncology Group study. Blood 98: 3212-3220. Litman T, Druley TE, Stein WD, Bates SE (2001). From MDR to MXR: new understanding of multidrug resistance systems, their properties and clinical significance. Cell Mol Life Sci 58: 931-959. Livak KJ, Schmittgen TD (2001). Analysis of relative gene expression data using real-time quantitative PCR and the 2(-Delta Delta C(T)) Method. Methods 25: 402-408.

References
286
Loftis JM, Hauser P (2004). The phenomenology and treatment of interferon-induced depression. J Affect Disord 82: 175-190. Lonnroth P, Jansson PA, Smith U (1987). A microdialysis method allowing characterization of intercellular water space in humans. Am J Physiol 253: E228-231. Lopez JF, Chalmers DT, Vazquez DM, Watson SJ, Akil H (1994). Serotonin transporter mRNA in rat brain is regulated by classical antidepressants. Biol Psychiatry 35: 287-290. Loscher W, Potschka H (2005a). Blood-brain barrier active efflux transporters: ATP-binding cassette gene family. NeuroRx 2: 86-98. Loscher W, Potschka H (2005b). Drug resistance in brain diseases and the role of drug efflux transporters. Nat Rev Neurosci 6: 591-602. Luna-Tortos C, Fedrowitz M, Loscher W (2008). Several major antiepileptic drugs are substrates for human P-glycoprotein. Neuropharmacology 55: 1364-1375. Mackay FJ, Dunn NR, Mann RD (1999). Antidepressants and the serotonin syndrome in general practice. The British journal of general practice : the journal of the Royal College of General Practitioners 49: 871-874. Maes M, Meltzer HY, Bosmans E, Bergmans R, Vandoolaeghe E, Ranjan R, Desnyder R (1995). Increased plasma concentrations of interleukin-6, soluble interleukin-6, soluble interleukin-2 and transferrin receptor in major depression. J Affect Disord 34: 301-309. Mahar Doan KM, Humphreys JE, Webster LO, Wring SA, Shampine LJ, Serabjit-Singh CJ, Adkison KK, Polli JW (2002). Passive permeability and P-glycoprotein-mediated efflux differentiate central nervous system (CNS) and non-CNS marketed drugs. J Pharmacol Exp Ther 303: 1029-1037. Maines LW, Antonetti DA, Wolpert EB, Smith CD (2005). Evaluation of the role of P-glycoprotein in the uptake of paroxetine, clozapine, phenytoin and carbamazapine by bovine retinal endothelial cells. Neuropharmacology 49: 610-617. Marchi N, Angelov L, Masaryk T, Fazio V, Granata T, Hernandez N, Hallene K, Diglaw T, Franic L, Najm I, Janigro D (2007). Seizure-Promoting Effect of Blood–Brain Barrier Disruption. Epilepsia 48: 732-742. Martinez-Turrillas R, Del Rio J, Frechilla D (2005). Sequential changes in BDNF mRNA expression and synaptic levels of AMPA receptor subunits in rat hippocampus after chronic antidepressant treatment. Neuropharmacology 49: 1178-1188. Marzolini C, Paus E, Buclin T, Kim RB (2004). Polymorphisms in human MDR1 (P-glycoprotein): recent advances and clinical relevance. Clin Pharmacol Ther 75: 13-33. Mason BL, Pariante CM, Jamel S, Thomas SA (2010). Central nervous system (CNS) delivery of glucocorticoids is fine-tuned by saturable transporters at the blood-CNS barriers and nonbarrier regions. Endocrinology 151: 5294-5305.

References
287
Mason BL, Pariante CM, Thomas SA (2012). Changes in the brain accumulation of glucocorticoids in abcb1a-deficient CF-1 mice. J Neuroendocrinol 24: 1440-1446. Mason BL, Pariante CM, Thomas SA (2008). A revised role for P-glycoprotein in the brain distribution of dexamethasone, cortisol, and corticosterone in wild-type and ABCB1A/B-deficient mice. Endocrinology 149: 5244-5253. Mason BL, Thomas SA, Lightman SL, Pariante CM (2011). Desipramine treatment has minimal effects on the brain accumulation of glucocorticoids in P-gp-deficient and wild-type mice. Psychoneuroendocrinology 36: 1351-1360. McEwen BS (2007). Physiology and neurobiology of stress and adaptation: central role of the brain. Physiological reviews 87: 873-904. McKinney WT, Jr., Bunney WE, Jr. (1969). Animal model of depression. I. Review of evidence: implications for research. Arch Gen Psychiatry 21: 240-248. Medicines and Healthcare products Regulatory Agency (2011). Citalopram and escitalopram: QT interval prolongation—new maximum daily dose restrictions (including in elderly patients), contraindications, and warnings. Web address: http://www.mhra.gov.uk/Safetyinformation/DrugSafetyUpdate/CON137769. Accessed 11 February 2013. Meijer OC, de Lange ECM, Breimer DD, de Boer AG, Workel JO, de Kloet ER (1998). Penetration of dexamethasone into brain glucocorticoid targets is enhanced in mdr1A P-glycoprotein knockout mice. Endocrinology 139: 1789-1793. Melas PA, Rogdaki M, Lennartsson A, Bjork K, Qi H, Witasp A, Werme M, Wegener G, Mathe AA, Svenningsson P, Lavebratt C (2012). Antidepressant treatment is associated with epigenetic alterations in the promoter of P11 in a genetic model of depression. Int J Neuropsychopharmacol 15: 669-679. Mensch J, Oyarzabal J, Mackie C, Augustijns P (2009). In vivo, in vitro and in silico methods for small molecule transfer across the BBB. J Pharm Sci 98: 4429-4468. Merry S, Hamilton TG, Flanigan P, Freshney RI, Kaye SB (1991). Circumvention of pleiotropic drug resistance in subcutaneous tumours in vivo with verapamil and clomipramine. Eur J Cancer 27: 31-34. Mesiwala AH, Farrell L, Wenzel HJ, Silbergeld DL, Crum LA, Winn HR, Mourad PD (2002). High-intensity focused ultrasound selectively disrupts the blood-brain barrier in vivo. Ultrasound Med Biol 28: 389-400. Mihaljevic Peles A, Bozina N, Sagud M, Rojnic Kuzman M, Lovric M (2008). MDR1 gene polymorphism: therapeutic response to paroxetine among patients with major depression. Progress in Neuro-Psychopharmacology and Biological Psychiatry 32: 1439-1444. Miller DS (2010). Regulation of P-glycoprotein and other ABC drug transporters at the blood-brain barrier. Trends Pharmacol Sci 31: 246-254.

References
288
Miura H, Kitagami T, Ozaki N (2007). Suppressive effect of paroxetine, a selective serotonin uptake inhibitor, on tetrahydrobiopterin levels and dopamine as well as serotonin turnover in the mesoprefrontal system of mice. Synapse 61: 698-706. Miura H, Qiao H, Kitagami T, Ohta T, Ozaki N (2005). Fluvoxamine, a selective serotonin reuptake inhibitor, suppresses tetrahydrobiopterin levels and dopamine as well as serotonin turnover in the mesoprefrontal system of mice. Psychopharmacology (Berl) 177: 307-314. Mombereau C, Kaupmann K, Froestl W, Sansig G, van der Putten H, Cryan JF (2004). Genetic and pharmacological evidence of a role for GABA(B) receptors in the modulation of anxiety- and antidepressant-like behavior. Neuropsychopharmacol 29: 1050-1062. Morinobu S, Strausbaugh H, Terwilliger R, Duman RS (1997). Regulation of c-Fos and NGF1-A by antidepressant treatments. Synapse 25: 313-320. Muller MB, Keck ME, Binder EB, Kresse AE, Hagemeyer TP, Landgraf R, Holsboer F, Uhr M (2003). ABCB1 (MDR1)-Type P-Glycoproteins at the Blood-Brain Barrier Modulate the Activity of the Hypothalamic-Pituitary-Adrenocortical System: Implications for Affective Disorder. Neuropsychopharmacol 28: 1991-1999. Narang VS, Fraga C, Kumar N, Shen J, Throm S, Stewart CF, Waters CM (2008). Dexamethasone increases expression and activity of multidrug resistance transporters at the rat blood-brain barrier. Am J Physiol-Cell Ph 295: C440-C450. Nelson JC, Papakostas GI (2009). Atypical antipsychotic augmentation in major depressive disorder: a meta-analysis of placebo-controlled randomized trials. Am J Psychiatry 166: 980-991. Neuwelt E, Abbott N, Abrey L, Banks WA, Blakley B, Davis T, Engelhardt B, Grammas P, Nedergaard M, Nutt J, Pardridge W, Rosenberg GA, Smith Q, Drewes LR (2008). Strategies to advance translational research into brain barriers. Lancet Neurol 7: 84-96. Neuwelt EA, Bauer B, Fahlke C, Fricker G, Iadecola C, Janigro D, Leybaert L, Molnár Z, O'Donnell ME, Povlishock JT, Saunders NR, Sharp F, Stanimirovic D, Watts RJ, Drewes LR (2011). Engaging neuroscience to advance translational research in brain barrier biology. Nat Rev Neurosci 12: 169-182. Neuwelt EA, Frenkel EP, Diehl JT, Maravilla KR, Vu LH, Clark WK, Rapoport SI, Barnett PA, Hill SA, Lewis SE, Ehle AL, Beyer CW, Jr., Moore RJ (1979). Osmotic blood-brain barrier disruption: a new means of increasing chemotherapeutic agent delivery. Trans Am Neurol Assoc 104: 256-260. Neuwelt EA, Frenkel EP, Rapoport S, Barnett P (1980). Effect of osmotic blood-brain barrier disruption on methotrexate pharmacokinetics in the dog. Neurosurgery 7: 36-43. Newey CR, Khawam E, Coffman K (2011). Two cases of serotonin syndrome with venlafaxine and calcineurin inhibitors. Psychosomatics 52: 286-290.

References
289
Nibuya M, Morinobu S, Duman RS (1995). Regulation of BDNF and trkB mRNA in rat brain by chronic electroconvulsive seizure and antidepressant drug treatments. The Journal of neuroscience : the official journal of the Society for Neuroscience 15: 7539-7547. Nibuya M, Nestler EJ, Duman RS (1996). Chronic antidepressant administration increases the expression of cAMP response element binding protein (CREB) in rat hippocampus. The Journal of neuroscience : the official journal of the Society for Neuroscience 16: 2365-2372. Nicolazzo JA, Charman SA, Charman WN (2006). Methods to assess drug permeability across the blood-brain barrier. J Pharm Pharmacol 58: 281-293. Nies AT (2007). The role of membrane transporters in drug delivery to brain tumors. Cancer Letters 254: 11-29. Nikisch G, Eap CB, Baumann P (2008). Citalopram enantiomers in plasma and cerebrospinal fluid of ABCB1 genotyped depressive patients and clinical response: A pilot study. Pharmacol Res 58: 344-347. Normann C, Horn M, Hummel B, Grunze H, Walden R (2004). Paroxetine in major depression: Correlating plasma concentrations and clinical response. Pharmacopsychiatry 37: 123-126. O'Brien FE, Clarke G, Dinan TG, Cryan JF, Griffin BT (2013a). Human P-glycoprotein differentially affects antidepressant drug transport: relevance to blood-brain barrier permeability. Int J Neuropsychopharmacol 16: 2259-2272. O'Brien FE, Clarke G, Fitzgerald P, Dinan TG, Griffin BT, Cryan JF (2012a). Inhibition of P-glycoprotein enhances transport of imipramine across the blood-brain barrier: microdialysis studies in conscious freely moving rats. Br J Pharmacol 166: 1333-1343. O'Brien FE, Dinan TG, Griffin BT, Cryan JF (2012b). Interactions between antidepressants and P-glycoprotein at the blood-brain barrier: clinical significance of in vitro and in vivo findings. Br J Pharmacol 165: 289-312. O'Brien FE, O'Connor RM, Clarke G, Dinan TG, Griffin BT, Cryan JF (2013b). P-glycoprotein Inhibition Increases the Brain Distribution and Antidepressant-Like Activity of Escitalopram in Rodents. Neuropsychopharmacol 38: 2209-2219. O'Connor RM, Cryan JF (2013). The effects of mGlu7 receptor modulation in behavioural models sensitive to antidepressant action in two mouse strains. Behav Pharmacol 24: 105-113. O'Leary OF, Bechtholt AJ, Crowley JJ, Hill TE, Page ME, Lucki I (2007). Depletion of serotonin and catecholamines block the acute behavioral response to different classes of antidepressant drugs in the mouse tail suspension test. Psychopharmacology (Berl) 192: 357-371. O'Leary OF, Cryan JF (2013). Towards translational rodent models of depression. Cell Tissue Res 354: 141-153.

References
290
O'Leary OF, Zandy S, Dinan TG, Cryan JF (2013). Lithium augmentation of the effects of desipramine in a mouse model of treatment-resistant depression: a role for hippocampal cell proliferation. Neuroscience 228: 36-46. Oldendorf WH (1974). Lipid solubility and drug penetration of the blood brain barrier. Proc Soc Exp Biol Med 147: 813-815. Oldendorf WH (1970). Measurement of brain uptake of radiolabeled substances using a tritiated water internal standard. Brain Res 24: 372-376. Olson RJ, Justice JB, Jr. (1993). Quantitative microdialysis under transient conditions. Anal Chem 65: 1017-1022. Page ME, Bao L, Andre P, Pelta-Heller J, Sluzas E, Gonzalez-Alegre P, Bogush A, Khan LE, Iacovitti L, Rice ME, Ehrlich ME (2010). Cell-autonomous alteration of dopaminergic transmission by wild type and mutant (DeltaE) TorsinA in transgenic mice. Neurobiol Dis 39: 318-326. Page ME, Lucki I (2002). Effects of acute and chronic reboxetine treatment on stress-induced monoamine efflux in the rat frontal cortex. Neuropsychopharmacol 27: 237-247. Papakostas GI, Shelton RC (2008). Use of atypical antipsychotics for treatment-resistant major depressive disorder. Current psychiatry reports 10: 481-486. Pardridge WM (2010). Biopharmaceutical drug targeting to the brain. J Drug Target 18: 157-167. Pardridge WM (2007a). Blood-brain barrier delivery. Drug Discov Today 12: 54-61. Pardridge WM (2005). The blood-brain barrier: bottleneck in brain drug development. NeuroRx 2: 3-14. Pardridge WM (2007b). Drug targeting to the brain. Pharm Res 24: 1733-1744. Pardridge WM (2006). Molecular trojan horses for blood-brain barrier drug delivery. Discov Med 6: 139-143. Pardridge WM (1995). Transport of small molecules through the blood-brain barrier: biology and methodology. Adv Drug Deliver Rev 15: 5-36. Pariante CM (2008). The role of multi-drug resistance p-glycoprotein in glucocorticoid function: Studies in animals and relevance in humans. Eur J Pharmacol 583: 263-271. Pariante CM, Hye A, Williamson R, Makoff A, Lovestone S, Kerwin RW (2003a). The antidepressant clomipramine regulates cortisol intracellular concentrations and glucocorticoid receptor expression in fibroblasts and rat primary neurones. Neuropsychopharmacol 28: 1553-1561. Pariante CM, Kim RB, Makoff A, Kerwin RW (2003b). Antidepressant fluoxetine enhances glucocorticoid receptor function in vitro by modulating membrane steroid transporters. Brit J Pharmacol 139: 1111-1118.

References
291
Pariante CM, Lightman SL (2008). The HPA axis in major depression: classical theories and new developments. Trends Neurosci 31: 464-468. Pariante CM, Makoff A, Lovestone S, Feroli S, Heyden A, Miller AH, Kerwin RW (2001). Antidepressants enhance glucocorticoid receptor function in vitro by modulating the membrane steroid transporters. Brit J Pharmacol 134: 1335-1343. Pariante CM, Pearce BD, Pisell TL, Owens MJ, Miller AH (1997). Steroid-independent translocation of the glucocorticoid receptor by the antidepressant desipramine. Mol Pharmacol 52: 571-581. Pariante CM, Thomas SA, Lovestone S, Makoff A, Kerwin RW (2004). Do antidepressants regulate how cortisol affects the brain? Psychoneuroendocrinology 29: 423-447. Parker KJ, Schatzberg AF, Lyons DM (2003). Neuroendocrine aspects of hypercortisolism in major depression. Hormones and behavior 43: 60-66. Pascussi JM, Gerbal-Chaloin S, Duret C, Daujat-Chavanieu M, Vilarem MJ, Maurel P (2008). The tangle of nuclear receptors that controls xenobiotic metabolism and transport: crosstalk and consequences. Annu Rev Pharmacol Toxicol 48: 1-32. Pastan I, Gottesman MM, Ueda K, Lovelace E, Rutherford AV, Willingham MC (1988). A retrovirus carrying an MDR1 cDNA confers multidrug resistance and polarized expression of P-glycoprotein in MDCK cells. Proc Natl Acad Sci U S A 85: 4486-4490. Pauwels EKJ, Erba P, Mariani G, Gomes CMF (2007). Multidrug resistance in cancer: Its mechanism and its modulation. Drug News Perspect 20: 371-377. Paxinos G, Watson C (1998). The Rat Brain in Stereotaxic Coordinates. 4th edn. Academic Press: San Diego. Peiffer A, Veilleux S, Barden N (1991). Antidepressant and other centrally acting drugs regulate glucocorticoid receptor messenger RNA levels in rat brain. Psychoneuroendocrinology 16: 505-515. Perlis RH, Fijal B, Dharia S, Heinloth AN, Houston JP (2010). Failure to Replicate Genetic Associations with Antidepressant Treatment Response in Duloxetine-Treated Patients. Biol Psychiat 67: 1110-1113. Perry PJ, Pfohl BM, Holstad SG (1987). The relationship between antidepressant response and tricyclic antidepressant plasma concentrations. A retrospective analysis of the literature using logistic regression analysis. Clin Pharmacokinet 13: 381-392. Perry PJ, Zeilmann C, Arndt S (1994). Tricyclic antidepressant concentrations in plasma: an estimate of their sensitivity and specificity as a predictor of response. J Clin Psychopharmacol 14: 230-240. Peters EJ, Reus V, Hamilton SP (2009). The ABCB1 transporter gene and antidepressant response. F1000 Biol Rep 1.

References
292
Peters EJ, Slager SL, Kraft JB, Jenkins GD, Reinalda MS, McGrath PJ, Hamilton SP (2008). Pharmacokinetic genes do not influence response or tolerance to citalopram in the STAR*D sample. Plos One 3: e1872. Philip NS, Carpenter LL, Tyrka AR, Price LH (2010). Pharmacologic approaches to treatment resistant depression: a re-examination for the modern era. Expert Opin Pharmaco 11: 709-722. Plock N, Kloft C (2005). Microdialysis--theoretical background and recent implementation in applied life-sciences. Eur J Pharm Sci 25: 1-24. Polasek TM, Elliot DJ, Lewis BC, Miners JO (2004). Mechanism-Based Inactivation of Human Cytochrome P4502C8 by Drugs in Vitro. J Pharmacol Exp Ther 311: 996-1007. Poller B, Gutmann H, Krahenbuhl S, Weksler B, Romero I, Couraud PO, Tuffin G, Drewe J, Huwyler J (2008). The human brain endothelial cell line hCMEC/D3 as a human blood-brain barrier model for drug transport studies. J Neurochem 107: 1358-1368. Polli JW, Olson KL, Chism JP, John-Williams LS, Yeager RL, Woodard SM, Otto V, Castellino S, Demby VE (2009). An unexpected synergist role of P-glycoprotein and breast cancer resistance protein on the central nervous system penetration of the tyrosine kinase inhibitor lapatinib (N-{3-chloro-4-[(3-fluorobenzyl)oxy]phenyl}-6-[5-({[2-(methylsulfonyl)ethyl]amino }methyl)-2-furyl]-4-quinazolinamine; GW572016). Drug Metab Dispos 37: 439-442. Polli JW, Wring SA, Humphreys JE, Huang L, Morgan JB, Webster LO, Serabjit-Singh CS (2001). Rational Use of in Vitro P-glycoprotein Assays in Drug Discovery. J Pharmacol Exp Ther 299: 620-628. Porsolt RD, Bertin A, Jalfre M (1977a). Behavioral despair in mice: a primary screening test for antidepressants. Archives internationales de pharmacodynamie et de therapie 229: 327-336. Porsolt RD, Le Pichon M, Jalfre M (1977b). Depression: a new animal model sensitive to antidepressant treatments. Nature 266: 730-732. Potschka H (2012). Role of CNS efflux drug transporters in antiepileptic drug delivery: overcoming CNS efflux drug transport. Adv Drug Deliv Rev 64: 943-952. Qadir M, O'Loughlin KL, Fricke SM, Williamson NA, Greco WR, Minderman H, Baer MR (2005). Cyclosporin A is a broad-spectrum multidrug resistance modulator. Clin Cancer Res 11: 2320-2326. Raison CL, Capuron L, Miller AH (2006). Cytokines sing the blues: inflammation and the pathogenesis of depression. Trends in immunology 27: 24-31. Rao RN, Kumar KN, Ramakrishna S (2011). Enantiomeric separation of mirtazapine and its metabolite in rat plasma by reverse polar ionic liquid chromatography using fluorescence and polarimetric detectors connected in series. J Chromatogr B Analyt Technol Biomed Life Sci 879: 1911-1916.

References
293
Raub TJ (2006). P-glycoprotein recognition of substrates and circumvention through rational drug design. Mol Pharm 3: 3-25. Ravindranath V (1998). Metabolism of xenobiotics in the central nervous system: implications and challenges. Biochem Pharmacol 56: 547-551. Reese TS, Karnovsky MJ (1967). Fine structural localization of a blood-brain barrier to exogenous peroxidase. J Cell Biol 34: 207-217. Regenthal R, Krueger M, Koeppel C, Preiss R (1999). Drug levels: therapeutic and toxic serum/plasma concentrations of common drugs. Journal of clinical monitoring and computing 15: 529-544. Reichel A, Begley DJ, Abbott NJ (2003). An overview of in vitro techniques for blood-brain barrier studies. Methods Mol Med 89: 307-324. Roberts DJ, Goralski KB (2008). A critical overview of the influence of inflammation and infection on P-glycoprotein expression and activity in the brain. Expert Opin Drug Metab Toxicol 4: 1245-1264. Roberts RL, Joyce PR, Mulder RT, Begg EJ, Kennedy MA (2002). A common P-glycoprotein polymorphism is associated with nortriptyline-induced postural hypotension in patients treated for major depression. Pharmacogenomics J 2: 191-196. Rochat B, Baumann P, Audus KL (1999). Transport mechanisms for the antidepressant citalopram in brain microvessel endothelium. Brain Res 831: 229-236. Romsicki Y, Sharom FJ (1999). The membrane lipid environment modulates drug interactions with the P-glycoprotein multidrug transporter. Biochemistry 38: 6887-6896. Ruike Z, Junhua C, Wenxing P (2010). In vitro and in vivo evaluation of the effects of duloxetine on P-gp function. Hum Psychopharmacol 25: 553-559. Rush AJ (2013). Ketamine for Treatment-Resistant Depression: Ready or Not for Clinical Use? Am J Psychiatry 170: 1079-1081. Rush AJ, Fava M, Wisniewski SR, Lavori PW, Trivedi MH, Sackeim HA, Thase ME, Nierenberg AA, Quitkin FM, Kashner TM, Kupfer DJ, Rosenbaum JF, Alpert J, Stewart JW, McGrath PJ, Biggs MM, Shores-Wilson K, Lebowitz BD, Ritz L, Niederehe G (2004). Sequenced treatment alternatives to relieve depression (STAR*D): rationale and design. Controlled clinical trials 25: 119-142. Rush AJ, Trivedi MH, Wisniewski SR, Nierenberg AA, Stewart JW, Warden D, Niederehe G, Thase ME, Lavori PW, Lebowitz BD, McGrath PJ, Rosenbaum JF, Sackeim HA, Kupfer DJ, Luther J, Fava M (2006). Acute and longer-term outcomes in depressed outpatients requiring one or several treatment steps: A STAR*D report. Am J Psychiat 163: 1905-1917. Sahay A, Hen R (2007). Adult hippocampal neurogenesis in depression. Nat Neurosci 10: 1110-1115.
References
294
Saija A, Princi P, De Pasquale R, Costa G (1989). Modifications of the permeability of the blood-brain barrier and local cerebral metabolism in pentobarbital- and ketamine-anaesthetized rats. Neuropharmacology 28: 997-1002. Sakaeda T, Nakamura T, Horinouchi M, Kakumoto M, Ohmoto N, Sakai T, Morita Y, Tamura T, Aoyama N, Hirai M, Kasuga M, Okumura K (2001). MDR1 genotype-related pharmacokinetics of digoxin after single oral administration in healthy Japanese subjects. Pharm Res 18: 1400-1404. Sakugawa T, Miura M, Hokama N, Suzuki T, Tateishi T, Uno T (2009). Enantioselective disposition of fexofenadine with the P-glycoprotein inhibitor verapamil. Brit J Clin Pharmaco 67: 535-540. Sakurai A, Onishi Y, Hirano H, Seigneuret M, Obanayama K, Kim G, Liew EL, Sakaeda T, Yoshiura K, Niikawa N, Sakurai M, Ishikawa T (2007). Quantitative structure--activity relationship analysis and molecular dynamics simulation to functionally validate nonsynonymous polymorphisms of human ABC transporter ABCB1 (P-glycoprotein/MDR1). Biochemistry 46: 7678-7693. Salama NN, Yang ZP, Bui T, Ho RJY (2006). MDR1 haplotypes significantly minimize intracellular uptake and transcellular P-gp substrate transport in recombinant LLC-PK1 cells. J Pharm Sci-Us 95: 2293-2308. Salvatore MF, Ai Y, Fischer B, Zhang AM, Grondin RC, Zhang Z, Gerhardt GA, Gash DM (2006). Point source concentration of GDNF may explain failure of phase II clinical trial. Experimental Neurology 202: 497-505. Sanchez C, Bergqvist PB, Brennum LT, Gupta S, Hogg S, Larsen A, Wiborg O (2003). Escitalopram, the S-(+)-enantiomer of citalopram, is a selective serotonin reuptake inhibitor with potent effects in animal models predictive of antidepressant and anxiolytic activities. Psychopharmacology (Berl) 167: 353-362. Sarginson JE, Lazzeroni LC, Ryan HS, Ershoff BD, Schatzberg AF, Murphy GM (2010). ABCB1 ( MDR1) polymorphisms and antidepressant response in geriatric depression. Pharmacogenet Genom 20: 467-475. Sarkadi B, Price EM, Boucher RC, Germann UA, Scarborough GA (1992). Expression of the human multidrug resistance cDNA in insect cells generates a high activity drug-stimulated membrane ATPase. J Biol Chem 267: 4854-4858. Sato Y, Shibanoki S, Sugahara M, Ishikawa K (1994). Measurement and pharmacokinetic analysis of imipramine and its metabolite by brain microdialysis. Br J Pharmacol 112: 625-629. Sato Y, Takayanagi Y, Onaka T, Kobayashi E (2007). Impact of cyclosporine upon emotional and social behavior in mice. Transplantation 83: 1365-1370. Sawchuk RJ, Elmquist WF (2000). Microdialysis in the study of drug transporters in the CNS. Adv Drug Deliv Rev 45: 295-307.

References
295
Schiepers OJG, Wichers MC, Maes M (2005). Cytokines and major depression. Prog Neuro-Psychoph 29: 201-217. Schinkel AH (1999). P-Glycoprotein, a gatekeeper in the blood-brain barrier. Adv Drug Deliv Rev 36: 179-194. Schinkel AH, Mayer U, Wagenaar E, Mol CAAM, vanDeemter L, Smit JJM, vanderValk MA, Voordouw AC, Spits H, vanTellingen O, Zijlmans JMJM, Fibbe WE, Borst P (1997). Normal viability and altered pharmacokinetics in mice lacking mdr1-type (drug-transporting) P-glycoproteins. P Natl Acad Sci USA 94: 4028-4033. Schinkel AH, Smit JJM, Vantellingen O, Beijnen JH, Wagenaar E, Vandeemter L, Mol CAAM, Vandervalk MA, Robanusmaandag EC, Teriele HPJ, Berns AJM, Borst P (1994). Disruption of the Mouse Mdr1a P-Glycoprotein Gene Leads to a Deficiency in the Blood-Brain-Barrier and to Increased Sensitivity to Drugs. Cell 77: 491-502. Schinkel AH, Wagenaar E, Mol CA, van Deemter L (1996). P-glycoprotein in the blood-brain barrier of mice influences the brain penetration and pharmacological activity of many drugs. J Clin Invest 97: 2517-2524. Schinkel AH, Wagenaar E, van Deemter L, Mol CA, Borst P (1995). Absence of the mdr1a P-Glycoprotein in mice affects tissue distribution and pharmacokinetics of dexamethasone, digoxin, and cyclosporin A. J Clin Invest 96: 1698-1705. Schmitt U, Schoenfelder Y, Karlsson L, Kugelberg FC, Bengtsson F, Hiemke C (2009). Forced swim-test-related antidepressant effects depend on P-glycoprotein expression in the Blood-Brain-Barrier. Pharmacopsychiatry 42: 241-241. Schoenfelder Y, Hiemke C, Schmitt U (2012). Behavioural consequences of p-glycoprotein deficiency in mice, with special focus on stress-related mechanisms. J Neuroendocrinol 24: 809-817. Schwab D, Fischer H, Tabatabaei A, Poli S, Huwyler J (2003). Comparison of in vitro P-glycoprotein screening assays: Recommendations for their use in drug discovery. J Med Chem 46: 1716-1725. Seckl JR, Fink G (1992). Antidepressants increase glucocorticoid and mineralocorticoid receptor mRNA expression in rat hippocampus in vivo. Neuroendocrinology 55: 621-626. Shaffer BC, Gillet JP, Patel C, Baer MR, Bates SE, Gottesman MM (2012). Drug resistance: still a daunting challenge to the successful treatment of AML. Drug resistance updates : reviews and commentaries in antimicrobial and anticancer chemotherapy 15: 62-69. Shapiro AB, Ling V (1997). Extraction of Hoechst 33342 from the cytoplasmic leaflet of the plasma membrane by P-glycoprotein. Eur J Biochem 250: 122-129. Sharom FJ (2008). ABC multidrug transporters: structure, function and role in chemoresistance. Pharmacogenomics 9: 105-127. Sheline YI (2003). Neuroimaging studies of mood disorder effects on the brain. Biol Psychiatry 54: 338-352.
References
296
Shirayama Y, Chen AC, Nakagawa S, Russell DS, Duman RS (2002). Brain-derived neurotrophic factor produces antidepressant effects in behavioral models of depression. The Journal of neuroscience : the official journal of the Society for Neuroscience 22: 3251-3261. Shishkina GT, Kalinina TS, Dygalo NN (2007). Up-regulation of tryptophan hydroxylase-2 mRNA in the rat brain by chronic fluoxetine treatment correlates with its antidepressant effect. Neuroscience 150: 404-412. Shuto H, Kataoka Y, Kanaya A, Matsunaga K, Sueyasu M, Oishi R (1998). Enhancement of serotonergic neural activity contributes to cyclosporine-induced tremors in mice. Eur J Pharmacol 341: 33-37. Siddiqui A, Kerb R, Weale ME, Brinkmann U, Smith A, Goldstein DB, Wood NW, Sisodiya SM (2003). Association of multidrug resistance in epilepsy with a polymorphism in the drug-transporter gene ABCB1. New Engl J Med 348: 1442-1448. Sillaber I, Panhuysen M, Henniger MS, Ohl F, Kuhne C, Putz B, Pohl T, Deussing JM, Paez-Pereda M, Holsboer F (2008). Profiling of behavioral changes and hippocampal gene expression in mice chronically treated with the SSRI paroxetine. Psychopharmacology (Berl) 200: 557-572. Singh AB, Bousman CA, Ng CH, Byron K, Berk M (2012). ABCB1 polymorphism predicts escitalopram dose needed for remission in major depression. Transl Psychiatry 2: e198. Siuciak JA, Lewis DR, Wiegand SJ, Lindsay RM (1997). Antidepressant-like effect of brain-derived neurotrophic factor (BDNF). Pharmacology, biochemistry, and behavior 56: 131-137. Slattery DA, Hudson AL, Nutt DJ (2004). Invited review: the evolution of antidepressant mechanisms. Fundamental & clinical pharmacology 18: 1-21. Song C, Leonard BE (2005). The olfactory bulbectomised rat as a model of depression. Neurosci Biobehav Rev 29: 627-647. Souery D, Papakostas GI, Trivedi MH (2006). Treatment-resistant depression. The Journal of clinical psychiatry 67 Suppl 6: 16-22. Speth C, Dierich MP, Sopper S (2005). HIV-infection of the central nervous system: the tightrope walk of innate immunity. Molecular immunology 42: 213-228. Spina E, Gitto C, Avenoso A, Campo GM, Caputi AP, Perucca E (1997). Relationship between plasma desipramine levels, CYP2D6 phenotype and clinical response to desipramine: a prospective study. Eur J Clin Pharmacol 51: 395-398. Spudich A, Kilic E, Xing HY, Kilic U, Rentsch KM, Wunderli-Allenspach H, Bassetti CL, Hermann DM (2006). Inhibition of multidrug resistance transporter-1 facilitates neuroprotective therapies after focal cerebral ischemia. Nat Neurosci 9: 487-488.

References
297
Stahl SM (2013). Stahl's Essential Psychopharmacology: Neuroscientific Basis and Practical Application. 4th edn. Cambridge University Press: New York. Stein U, Walther W, Wunderlich V (1994). Point Mutations in the Mdr1 Promoter of Human Osteosarcomas Are Associated with in-Vitro Responsiveness to Multidrug-Resistance Relevant Drugs. Eur J Cancer 30A: 1541-1545. Stenfors C, Ross SB (2002). Evidence for involvement of 5-hydroxytryptamine(1B) autoreceptors in the enhancement of serotonin turnover in the mouse brain following repeated treatment with fluoxetine. Life Sci 71: 2867-2880. Stormer E, von Moltke LL, Perloff MD, Greenblatt DJ (2001). P-glycoprotein interactions of nefazodone and trazodone in cell culture. J Clin Pharmacol 41: 708-714. Summers MA, Moore JL, McAuley JW (2004). Use of verapamil as a potential P-glycoprotein inhibitor in a patient with refractory epilepsy. The Annals of pharmacotherapy 38: 1631-1634. Svenningsson P, Chergui K, Rachleff I, Flajolet M, Zhang X, El Yacoubi M, Vaugeois JM, Nomikos GG, Greengard P (2006). Alterations in 5-HT1B receptor function by p11 in depression-like states. Science 311: 77-80. Syvanen S, Blomquist G, Sprycha M, Hoglund AU, Roman M, Eriksson O, Hammarlund-Udenaes M, Langstrom B, Bergstrom M (2006). Duration and degree of cyclosporin induced P-glycoprotein inhibition in the rat blood-brain barrier can be studied with PET. Neuroimage 32: 1134-1141. Syvanen S, Lindhe O, Palner M, Kornum BR, Rahman O, Langstrom B, Knudsen GM, Hammarlund-Udenaes M (2009). Species differences in blood-brain barrier transport of three positron emission tomography radioligands with emphasis on P-glycoprotein transport. Drug Metab Dispos 37: 635-643. Szabo D, Szabo G, Jr., Ocsovszki I, Aszalos A, Molnar J (1999). Anti-psychotic drugs reverse multidrug resistance of tumor cell lines and human AML cells ex-vivo. Cancer Lett 139: 115-119. Szakacs G, Paterson JK, Ludwig JA, Booth-Genthe C, Gottesman MM (2006). Targeting multidrug resistance in cancer. Nat Rev Drug Discov 5: 219-234. Taipalensuu J, Tornblom H, Lindberg G, Einarsson C, Sjoqvist F, Melhus H, Garberg P, Sjostrom B, Lundgren B, Artursson P (2001). Correlation of gene expression of ten drug efflux proteins of the ATP-binding cassette transporter family in normal human jejunum and in human intestinal epithelial Caco-2 cell monolayers. J Pharmacol Exp Ther 299: 164-170. Tang F, Horie K, Borchardt RT (2002). Are MDCK cells transfected with the human MDR1 gene a good model of the human intestinal mucosa? Pharm Res 19: 765-772. Tardito D, Perez J, Tiraboschi E, Musazzi L, Racagni G, Popoli M (2006). Signaling pathways regulating gene expression, neuroplasticity, and neurotrophic mechanisms in the action of antidepressants: a critical overview. Pharmacol Rev 58: 115-134.

References
298
Taub ME, Podila L, Ely D, Almeida I (2005). Functional assessment of multiple P-glycoprotein (P-gp) probe substrates: influence of cell line and modulator concentration on P-gp activity. Drug Metab Dispos 33: 1679-1687. Tetrault S, Chever O, Sik A, Amzica F (2008). Opening of the blood-brain barrier during isoflurane anaesthesia. Eur J Neurosci 28: 1330-1341. Thal SC, Luh C, Schaible EV, Timaru-Kast R, Hedrich J, Luhmann HJ, Engelhard K, Zehendner CM (2012). Volatile anesthetics influence blood-brain barrier integrity by modulation of tight junction protein expression in traumatic brain injury. Plos One 7: e50752. Thanacoody R (2012). Serotonin syndrome. Medicine 40: 63-64. Thase ME (2004). Therapeutic alternatives for difficult-to-treat depression: a narrative review of the state of the evidence. CNS spectrums 9: 808-816, 818-821. Thiebaut F, Tsuruo T, Hamada H, Gottesman MM, Pastan I, Willingham MC (1989). Immunohistochemical Localization in Normal-Tissues of Different Epitopes in the Multidrug Transport Protein P170 - Evidence for Localization in Brain Capillaries and Crossreactivity of One Antibody with a Muscle Protein. J Histochem Cytochem 37: 159-164. Thiel CM, Muller CP, Huston JP, Schwarting RK (1999). High versus low reactivity to a novel environment: behavioural, pharmacological and neurochemical assessments. Neuroscience 93: 243-251. Thome J, Sakai N, Shin K, Steffen C, Zhang YJ, Impey S, Storm D, Duman RS (2000). cAMP response element-mediated gene transcription is upregulated by chronic antidepressant treatment. The Journal of neuroscience : the official journal of the Society for Neuroscience 20: 4030-4036. Thrivikraman KV, Huot RL, Plotsky PM (2002). Jugular vein catheterization for repeated blood sampling in the unrestrained conscious rat. Brain Res Brain Res Protoc 10: 84-94. Tishler DM, Weinberg KI, Hinton DR, Barbaro N, Annett GM, Raffel C (1995). MDR1 gene expression in brain of patients with medically intractable epilepsy. Epilepsia 36: 1-6. Triguero D, Buciak J, Pardridge WM (1990). Capillary depletion method for quantification of blood-brain barrier transport of circulating peptides and plasma proteins. J Neurochem 54: 1882-1888. Trivedi MH, Rush AJ, Wisniewski SR, Nierenberg AA, Warden D, Ritz L, Norquist G, Howland RH, Lebowitz B, McGrath PJ, Shores-Wilson K, Biggs MM, Balasubramani GK, Fava M, STAR*D Study Team (2006). Evaluation of Outcomes With Citalopram for Depression Using Measurement-Based Care in STAR*D: Implications for Clinical Practice. Am J Psychiatry 163: 28-40. Tsai TH, Chen CF (1997). Measurement and pharmacokinetic analysis of buspirone by means of brain microdialysis coupled to high-performance liquid chromatography with electrochemical detection. J Chromatogr A 762: 269-273.

References
299
Tsai TH, Liu SC, Tsai PL, Ho LK, Shum AY, Chen CF (2002). The effects of the cyclosporin A, a P-glycoprotein inhibitor, on the pharmacokinetics of baicalein in the rat: a microdialysis study. Br J Pharmacol 137: 1314-1320. Ueda K, Okamura N, Hirai M, Tanigawara Y, Saeki T, Kioka N, Komano T, Hori R (1992). Human P-glycoprotein transports cortisol, aldosterone, and dexamethasone, but not progesterone. J Biol Chem 267: 24248-24252. Uhr M, Grauer MT (2003). abcblab P-glycoprotein is involved in the uptake of citalopram and trimipramine into the brain of mice. J Psychiat Res 37: 179-185. Uhr M, Grauer MT, Holsboer F (2003). Differential enhancement of antidepressant penetration into the brain in mice with abcb1ab (mdr1ab) P-glycoprotein gene disruption. Biol Psychiat 54: 840-846. Uhr M, Grauer MT, Yassouridis A, Ebinger M (2007). Blood-brain barrier penetration and pharmacokinetics of amitriptyline and its metabolites in p-glycoprotein (abcb1ab) knock-out mice and controls. J Psychiatr Res 41: 179-188. Uhr M, Holsboer F, Muller MB (2002). Penetration of endogenous steroid hormones corticosterone, cortisol, aldosterone and progesterone into the brain is enhanced in mice deficient for both mdr1a and mdr1b P-glycoproteins. J Neuroendocrinol 14: 753-759. Uhr M, Namendorf C, Grauer MT, Rosenhagen M, Ebinger M (2004). P-glycoprotein is a factor in the uptake of dextromethorphan, but not of melperone, into the mouse brain: evidence for an overlap in substrate specificity between P-gp and CYP2D6. J Psychopharmacol 18: 509-515. Uhr M, Steckler T, Yassouridis A, Holsboer F (2000). Penetration of amitriptyline, but not of fluoxetine, into brain is enhanced in mice with blood-brain barrier deficiency due to Mdr1a P-glycoprotein gene disruption. Neuropsychopharmacol 22: 380-387. Uhr M, Tontsch A, Namendorf C, Ripke S, Lucae S, Ising M, Dose T, Ebinger M, Rosenhagen M, Kohli M, Kloiber S, Salyakina D, Bettecken T, Specht M, Putz B, Binder EB, Muller-Myhsok B, Holsboer F (2008). Polymorphisms in the drug transporter gene ABCB1 predict antidepressant treatment response in depression. Neuron 57: 203-209. Ukai M, Maeda H, Nanya Y, Kameyama T, Matsuno K (1998). Beneficial effects of acute and repeated administrations of sigma receptor agonists on behavioral despair in mice exposed to tail suspension. Pharmacology, biochemistry, and behavior 61: 247-252. Unceta N, Goicolea MA, Barrio RJ (2011). Analytical procedures for the determination of the selective serotonin reuptake inhibitor antidepressant citalopram and its metabolites. Biomed Chromatogr 25: 238-257. Ungerstedt U, Hallstrom A (1987). In vivo microdialysis--a new approach to the analysis of neurotransmitters in the brain. Life Sci 41: 861-864. Ungerstedt U, Pycock C (1974). Functional correlates of dopamine neurotransmission. Bulletin der Schweizerischen Akademie der Medizinischen Wissenschaften 30: 44-55.

References
300
Urquhart BL, Kim RB (2009). Blood-brain barrier transporters and response to CNS-active drugs. Eur J Clin Pharmacol 65: 1063-1070. Van Sant SP, Buckley PF (2011). Pharmacotherapy for treatment-refractory schizophrenia. Expert Opin Pharmacother 12: 411-434. van Vliet EA, van Schaik R, Edelbroek PM, Redeker S, Aronica E, Wadman WJ, Marchi N, Vezzani A, Gorter JA (2006). Inhibition of the multidrug transporter P-glycoprotein improves seizure control in phenytoin-treated chronic epileptic rats. Epilepsia 47: 672-680. Vankalken CK, Broxterman HJ, Pinedo HM, Feller N, Dekker H, Lankelma J, Giaccone G (1993). Cortisol Is Transported by the Multidrug Resistance Gene-Product P-Glycoprotein. Brit J Cancer 67: 284-289. Varga A, Nugel H, Baehr R, Marx U, Hever A, Nacsa J, Ocsovszky I, Molnar J (1996). Reversal of multidrug resistance by amitriptyline in vitro. Anticancer Res 16: 209-211. Vogelgesang S, Cascorbi I, Schroeder E, Pahnke J, Kroemer HK, Siegmund W, Kunert-Keil C, Walker LC, Warzok RW (2002). Deposition of Alzheimer's beta-amyloid is inversely correlated with P-glycoprotein expression in the brains of elderly non-demented humans. Pharmacogenetics 12: 535-541. Vogelgesang S, Warzok RW, Cascorbi I, Kunert-Keil C, Schroeder E, Kroemer HK, Siegmund W, Walker LC, Pahnke J (2004). The role of P-glycoprotein in cerebral amyloid angiopathy; implications for the early pathogenesis of Alzheimer's disease. Current Alzheimer research 1: 121-125. von Richter O, Glavinas H, Krajcsi P, Liehner S, Siewert B, Zech K (2009). A novel screening strategy to identify ABCB1 substrates and inhibitors. N-S Arch Pharmacol 379: 11-26. Wacher VJ, Wu CY, Benet LZ (1995). Overlapping Substrate Specificities and Tissue Distribution of Cytochrome-P450 3a and P-Glycoprotein - Implications for Drug-Delivery and Activity in Cancer-Chemotherapy. Mol Carcinogen 13: 129-134. Wagner CC, Bauer M, Karch R, Feurstein T, Kopp S, Chiba P, Kletter K, Loscher W, Muller M, Zeitlinger M, Langer O (2009). A pilot study to assess the efficacy of tariquidar to inhibit P-glycoprotein at the human blood-brain barrier with (R)-11C-verapamil and PET. Journal of nuclear medicine : official publication, Society of Nuclear Medicine 50: 1954-1961. Wang JS, DeVane CL, Gibson BB, Donovan JL, Markowitz JL, Zhu HJ (2006a). Population pharmacokinetic analysis of drug-drug interactions among risperidone, bupropion, and sertraline in CF1 mice. Psychopharmacology 183: 490-499. Wang JS, DeVane CL, Zhu HJ, Marokowitz J, Donovan J (2006b). Evaluation of antipsychotic drugs as inhibitors of multidrug resistance transporter P-glycoprotein. Acta Pharmacol Sin 27: 76-76. Wang JS, Ruan Y, Taylor RM, Donovan JL, Markowitz JS, De Vane CL (2004a). The brain entry of risperidone and 9-hydroxyrisperidone is greatly limited by P-glycoprotein. Int J Neuropsychoph 7: 415-419.

References
301
Wang JS, Ruan Y, Taylor RM, Donovan JL, Markowitz JS, DeVane CL (2004b). Brain penetration of methadone (R)- and (S)-enantiomers is greatly increased by P-glycoprotein deficiency in the blood-brain barrier of Abcb1a gene knockout mice. Psychopharmacology (Berl) 173: 132-138. Wang JS, Taylor R, Ruan Y, Donovan JL, Markowitz JS, De Vane CL (2004c). Olanzapine penetration into brain is greater in transgenic Abcb 1 a P-glycoprotein-deficient mice than FVB1 (wild-type) animals. Neuropsychopharmacol 29: 551-557. Wang JS, Zhu HJ, Donovan JL, Yuan HJ, Markowitz JS, Geesey ME, DeVane CL (2009). Aripiprazole brain concentration is altered in P-glycoprotein deficient mice. Schizophr Res 110: 90-94. Wang JS, Zhu HJ, Gibson BB, Markowitz JS, Donovan JL, DeVane CL (2008). Sertraline and its metabolite desmethylsertraline, but not bupropion or its three major metabolites, have high affinity for P-glycoprotein. Biol Pharm Bull 31: 231-234. Wang X, Sykes DB, Miller DS (2010). Constitutive androstane receptor-mediated up-regulation of ATP-driven xenobiotic efflux transporters at the blood-brain barrier. Mol Pharmacol 78: 376-383. Wang YH, Jones DR, Hall SD (2004d). Prediction of cytochrome P450 3A inhibition by verapamil enantiomers and their metabolites. Drug Metab Dispos 32: 259-266. Weber CC, Eckert GP, Muller WE (2006). Effects of antidepressants on the brain/plasma distribution of corticosterone. Neuropsychopharmacol 31: 2443-2448. Weber CC, Kressmann S, Ott M, Fricker G, Müller WE (2005). Inhibition of P-Glycoprotein Function by Several Antidepressants may not Contribute to Clinical Efficacy. Pharmacopsychiatry 38: 293-300. Weiss J, Dormann G, Martin-Facklam M, Kerpen CJ, Ketabi-Kiyanvash N, Haefeli WE (2003). Inhibition of P-glycoprotein by newer antidepressants. J Pharmacol Exp Ther 305: 197-204. Weksler BB, Subileau EA, Perriere N, Charneau P, Holloway K, Leveque M, Tricoire-Leignel H, Nicotra A, Bourdoulous S, Turowski P, Male DK, Roux F, Greenwood J, Romero IA, Couraud PO (2005). Blood-brain barrier-specific properties of a human adult brain endothelial cell line. Faseb J 19: 1872-1874. Willson TM, Kliewer SA (2002). PXR, CAR and drug metabolism. Nat Rev Drug Discov 1: 259-266. Wohlfart S, Gelperina S, Kreuter J (2011a). Transport of drugs across the blood-brain barrier by nanoparticles. J Control Release. Wohlfart S, Khalansky AS, Gelperina S, Begley D, Kreuter J (2011b). Kinetics of transport of doxorubicin bound to nanoparticles across the blood-brain barrier. J Control Release 154: 103-107. Wolburg H, Lippoldt A (2002). Tight junctions of the blood-brain barrier: development, composition and regulation. Vascul Pharmacol 38: 323-337.
References
302
Wolburg H, Noell S, Mack A, Wolburg-Buchholz K, Fallier-Becker P (2009). Brain endothelial cells and the glio-vascular complex. Cell Tissue Res 335: 75-96. Wong EH, Chan NN, Sze KH, Or KH (2002). Serotonin syndrome in a renal transplant patient. J R Soc Med 95: 304-305. Wong ML, Licinio J (2001). Research and treatment approaches to depression. Nat Rev Neurosci 2: 343-351. World Health Organisation (2012). Depression (Fact Sheet No 369). Web address: www.who.int/mediacentre/factsheets/fs369/en/index.html. Accessed 17 September 2013. Xie R, Hammarlund-Udenaes M, de Boer AG, de Lange EC (1999). The role of P-glycoprotein in blood-brain barrier transport of morphine: transcortical microdialysis studies in mdr1a (-/-) and mdr1a (+/+) mice. Br J Pharmacol 128: 563-568. Yamazaki M, Neway WE, Ohe T, Chen IW, Rowe JF, Hochman JH, Chiba M, Lin JH (2001). In vitro substrate identification studies for P-glycoprotein-mediated transport: Species difference and predictability of in vivo results. J Pharmacol Exp Ther 296: 723-735. Yasui-Furukori N, Saito M, Niioka T, Inoue Y, Sato Y, Kaneko S (2007). Effect of itraconazole on pharmacokinetics of paroxetine: The role of gut transporters. Ther Drug Monit 29: 45-48. Yau JLW, Noble J, Thomas S, Kerwin R, Morgan PE, Lightman S, Seckl JR, Pariante CM (2007). The Antidepressant Desipramine Requires the ABCB1 (Mdr1)-Type p-Glycoprotein to Upregulate the Glucocorticoid Receptor in Mice. Neuropsychopharmacol 32: 2520-2529. Youdim KA, Avdeef A, Abbott NJ (2003). In vitro trans-monolayer permeability calculations: often forgotten assumptions. Drug Discov Today 8: 997-1003. Yu CH, Kastin AJ, Tu H, Waters S, Pan WH (2007). TNF activates P-glycoprotein in cerebral microvascular endothelial cells. Cell Physiol Biochem 20: 853-858. Yu JJ, Zhang Y, Wang Y, Wen ZY, Liu XH, Qin J, Yang JL (2013). Inhibition of calcineurin in the prefrontal cortex induced depressive-like behavior through mTOR signaling pathway. Psychopharmacology (Berl) 225: 361-372. Zarate CA, Jr., Singh JB, Carlson PJ, Brutsche NE, Ameli R, Luckenbaugh DA, Charney DS, Manji HK (2006). A randomized trial of an N-methyl-D-aspartate antagonist in treatment-resistant major depression. Arch Gen Psychiatry 63: 856-864. Zhang C, Kwan P, Zuo Z, Baum L (2010). In vitro concentration dependent transport of phenytoin and phenobarbital, but not ethosuximide, by human P-glycoprotein. Life Sci 86: 899-905. Zhang C, Zuo Z, Kwan P, Baum L (2011). In vitro transport profile of carbamazepine, oxcarbazepine, eslicarbazepine acetate, and their active metabolites by human P-glycoprotein. Epilepsia 52: 1894-1904.

References
303
Zhang CB, Kwan P, Zuo Z, Baum L (2012). The transport of antiepileptic drugs by P-glycoprotein. Adv Drug Deliver Rev 64: 930-942. Zhang L, Strong JM, Qiu W, Lesko LJ, Huang SM (2006). Scientific perspectives on drug transporters and their role in drug interactions. Mol Pharmaceut 3: 62-69. Zhou SF (2008). Structure, function and regulation of P-glycoprotein and its clinical relevance in drug disposition. Xenobiotica 38: 802-832. Zhu HJ, Wang JS, Markowitz JS, Donovan JL, Gibson BB, DeVane CL (2007). Risperidone and paliperidone inhibit P-glycoprotein activity in vitro. Neuropsychopharmacol 32: 757-764. Zhu WL, Shi HS, Wang SJ, Wu P, Ding ZB, Lu L (2011). Hippocampal CA3 calcineurin activity participates in depressive-like behavior in rats. J Neurochem 117: 1075-1086. Zlokovic BV (2008). The blood-brain barrier in health and chronic neurodegenerative disorders. Neuron 57: 178-201. Zomkowski AD, Engel D, Gabilan NH, Rodrigues AL (2010). Involvement of NMDA receptors and L-arginine-nitric oxide-cyclic guanosine monophosphate pathway in the antidepressant-like effects of escitalopram in the forced swimming test. Eur Neuropsychopharmacol 20: 793-801.

304
Appendix A: Abbreviations
5-HIAA: 5-hydroxyindoleacetic acid
5-HT: serotonin
5-HTP: 5-hydroxytryptophan
A→B: apical-to-basolateral permeability
ABC: adenosine triphosphate binding-cassette
ACTH: adrenocorticotropic hormone
AF6: afadin
ATP: adenosine triphosphate
AUC: area under the concentration-time curve
B→A: basolateral-to-apical permeability
BBB: blood-brain barrier BCEC: brain capillary endothelial cell
BCEC: brain capillary endothelial cell
BCRP: breast cancer resistance protein
BCSFB: blood-cerebrospinal fluid barrier
C0: initial concentration following bolus intravenous administration (Chapter 2) or
initial donor concentration used in in vitro studies (Chapters 3 and 4)
Caco-2: human colorectal adenocarcinoma cells
Calcein AM: calcein acetoxymethyl ester
CAR: coxsackie- and adenovirus receptor
Cl: drug clearance from plasma
CNS: central nervous system
cTR: corrected (B→A)/(A→B) transport ratio
CRF: corticotrophin-releasing factor
CsA: cyclosporin A
CYP: cytochrome P450
DBS: deep brain stimulation
ECF: extracellular fluid
ECT: electroconvulsive therapy

Appendix A: Abbreviations
305
ESAM: endothelial selective adhesion molecules
FST: forced swim test
HPA axis: hypothalamic-pituitary-adrenal axis
HPLC: high performance liquid chromatography
HPLC-ECD: HPLC with electrochemical detection
IC50: half maximal inhibitory concentration
ICV: intracerebroventricular
JAM: junctional adhesion molecules
JACOP: junction associated coiled-coil protein
kel: elimination rate constant
Km: Michaelis constant
KO:WT B/P ratio: brain/plasma drug concentration ratios between P-gp knockout
and wild-type mice
MAOI: monoamine oxidase inhibitor
MDCK: Madine-Darby canine kidney cells
MDCK-MDR1: ABCB1-transfected MDCK cells which overexpress human P-gp
MDCK-WT: wild-type Madine-Darby canine kidney cells
MDR1: multidrug resistance 1 gene
MRP: multidrug resistance-associated proteins
MUPP1: multi-PDZ-protein 1
NaSSA: noradrenergic and specific serotonergic antidepressant
NBD: nucleotide binding domain
NSCLC: non-small cell lung cancer
OB: olfactory bulbectomy
OPA: orthophosphoric acid
Papp: apparent permeability coefficient (cm.s-1)
PECAM: platelet-endothelial cell adhesion molecule
PFC: prefrontal cortex
P-gp: P-glycoprotein
PK: pharmacokinetic
SBP: substrate-binding pocket
SNP: single nucleotide polymorphism

Appendix A: Abbreviations
306
SNRI: serotonin–noradrenaline reuptake inhibitor
SSRI: selective serotonin reuptake inhibitor
STAR*D: Sequenced Treatment Alternatives to Relieve Depression study
t1/2: half-life of drug in plasma
TCA: tricyclic antidepressant
TEER: trans-epithelial electrical resistance
TR: (B→A)/(A→B) transport ratio
TRD: treatment resistant depression
TST: tail suspension test
Vd: volume of distribution
VE-cadherin: vascular endothelial cadherin
VNS: vagus nerve stimulation
ZO: zona occludens proteins

307
Appendix B: Publications and presentations
B.1. Peer-reviewed publications
O'Brien FE, O'Connor RM, Clarke G, Donovan MD, Dinan TG, Griffin BT and Cryan JF. The P-glycoprotein Inhibitor Cyclosporin A Differentially Influences Behavioural and Neurochemical Responses to the Antidepressant Escitalopram. Behavioural Brain Research doi: 10.1016/j.bbr.2013.11.027. [Epub ahead of print]
O’Leary OF, O’Brien FE, O’Connor RM and Cryan JF (under review). Drugs, Genes and the Blues: Pharmacogenetics of the Antidepressant Response from Mouse to Man. Pharmacology Biochemistry and Behavior doi: 10.1016/j.pbb.2013.10.015. [Epub ahead of print]
O'Brien FE, Clarke G, Dinan TG, Cryan JF and Griffin BT (2013). Human P-glycoprotein Differentially Affects Antidepressant Drug Transport: Relevance to Blood-Brain Barrier Permeability. The International Journal of Neuropsychopharmacology 16(10):2259-2272
O'Brien FE, O'Connor RM, Clarke G, Dinan TG, Griffin BT and Cryan JF (2013). P-glycoprotein Inhibition Increases the Brain Distribution and Antidepressant-Like Activity of Escitalopram in Rodents. Neuropsychopharmacology 38(11):2209-19
Browne CA, O'Brien FE, Connor TJ, Dinan TG and Cryan JF (2012). Differential lipopolysaccharide-induced immune alterations in the hippocampus of two mouse strains: effects of stress. Neuroscience 225:237-48
O'Brien FE, Clarke G, Fitzgerald P, Dinan TG, Griffin BT and Cryan JF (2012). Inhibition of P-glycoprotein Enhances Transport of the Antidepressant Imipramine across the Blood-Brain Barrier: Microdialysis Studies in the Conscious Freely Moving Rat. British Journal of Pharmacology 166(4):1333-43
O'Brien FE, Dinan TG, Griffin BT and Cryan JF (2012). Interactions between antidepressants and P-glycoprotein at the blood-brain barrier: Clinical significance of in vitro and in vivo findings. British Journal of Pharmacology 165(2):289-312
B.2. Manuscripts in preparation:
O'Brien FE, Moloney G, Scott KA, O'Connor RM, Clarke G, Dinan TG, Griffin BT and Cryan JF (in preparation). P-glycoprotein Inhibition Increases the Brain Distribution of the Antidepressant Escitalopram in the Mouse: Effects of Chronic Administration. To be submitted to Pharmacology Reports & Perspectives.

Appendix B: Publications and Presentations
308
B.3. Conference presentations
F.E. O’Brien, R.M. O’Connor, G. Clarke, M.D. Donovan, T.G. Dinan, B.T. Griffin, J.F. Cryan (2013). An investigation of pharmacokinetic and pharmacodynamic interactions between the P-glycoprotein inhibitor Cyclosporin A and the antidepressant escitalopram. Neuroscience Ireland, 12-13 September 2013, Cork, Ireland.
FE O’Brien, O’Connor RM, Clarke G, Dinan TG, Griffin BT, Cryan JF (2013). Effect of P-glycoprotein inhibition on the brain distribution and antidepressant-like activity of escitalopram in rodents (oral). Royal Academy of Medicine in Ireland Section of Biomedical Sciences Annual Meeting, 20 June 2013, Cork, Ireland.
FE O’Brien, Clarke G, Dinan TG, Griffin BT, Cryan JF (2013). P-glycoprotein restricts blood-brain barrier transport of the antidepressant escitalopram: converging evidence from in vitro and in vivo studies (poster). Beating the Blood-Brain and other Blood Barriers Conference, 6-8 February 2013, Lisbon, Portugal.
FE O’Brien, Clarke G, Dinan TG, Griffin BT, Cryan JF (2012). The Influence of P-glycoprotein on the Blood-Brain Barrier Transport of the Antidepressant Escitalopram: Converging Evidence from In vivo and In vitro Studies (oral). British Pharmacological Society Winter Meeting, 18-20 December 2012, London, UK.
FE O’Brien, Clarke G, Dinan TG, Cryan JF, Griffin BT (2012). P-glycoprotein limits antidepressant transport across the blood-brain barrier: converging evidence from in vitro and in vivo studies (poster). American Association of Pharmaceutical Scientists Annual Meeting and Exposition, 14-17 October 2012, Chicago, IL, USA.
FE O’Brien, Clarke G, Dinan TG, Griffin BT, Cryan JF (2012). P-glycoprotein restricts blood-brain barrier transport of the antidepressant escitalopram: converging evidence from in vitro and in vivo studies (oral). Neuroscience Ireland, 5-6 September 2012, Dublin, Ireland.
FE O’Brien, Clarke G, Dinan TG, Griffin BT, Cryan JF (2012). Antidepressants as P-glycoprotein substrates in vitro: investigations in the MDCKII-MDR1 cell line (poster). European Graduate School of Neuroscience Workshop on Drugs and the Brain, 15-20 April 2012, Braga, Portugal.
FE O’Brien, Clarke G, Fitzgerald P, Dinan TG, Griffin BT, Cryan JF (2012). P-glycoprotein inhibition enhances the transport of the antidepressant imipramine across the blood-brain barrier (poster). European College of Neuropsychopharmacology Workshop on Neuropsychopharmacology for Young Scientists in Europe, 15-18 March 2012, Nice, France.
FE O’Brien, Clarke G, Fitzgerald P, Dinan TG, Griffin BT, Cryan JF (2012). Inhibition of P-glycoprotein Enhances Transport of the Antidepressant Imipramine across the Blood-Brain Barrier: Microdialysis Studies in the Conscious Freely Moving Rat (oral). All-Ireland Joint Schools of Pharmacy Research Conference, 3 April 2012, Cork, Ireland.

Appendix B: Publications and Presentations
309
FE O’Brien, Clarke G, Fitzgerald P, Dinan TG, Griffin BT, Cryan JF (2011). The Influence of P-gp Inhibition on Imipramine Transport across the Blood-Brain Barrier: Microdialysis Studies in the Conscious Freely Moving Rat (poster). British Pharmacological Society Winter Meeting, 13-15 December 2011, London, UK.
FE O’Brien, Clarke G, Fitzgerald P, O’Driscoll CM, Dinan TG, Cryan JF, Griffin BT (2011). Evaluation of the influence of P-glycoprotein inhibition on plasma and brain pharmacokinetics of the antidepressant imipramine: microdialysis studies in the conscious freely moving rat (poster). American Association of Pharmaceutical Scientists Annual Meeting and Exposition, 23-27 October 2011. Washington DC, USA.
FE O’Brien, Clarke G, Fitzgerald P, Dinan TG, Griffin BT, Cryan JF (2011). Evaluation of the influence of P-glycoprotein inhibition on plasma and brain pharmacokinetics of the antidepressant imipramine: microdialysis studies in the conscious freely moving rat (poster). Neuroscience Ireland, 1-2 September 2011, Kildare, Ireland.
FE O’Brien, Clarke G, Fitzgerald P, Griffin BT, Cryan JF (2011). An integrated microdialysis model for the analysis of blood-brain barrier drug transport in the conscious freely moving rat (poster). All-Ireland Joint Schools of Pharmacy Research Conference, 18-19 April 2011, Dublin, Ireland.

310
Appendix C:
Establishment of surgical and analytical
techniques

Appendix C: Establishment of techniques
311
C.1. Introduction
In order to evaluate the BBB transport of a compound using microdialysis, it was
necessary to develop an integrated technique which enables the simultaneous
determination of drug levels in the brain and the blood (Bundgaard et al., 2007).
This integrated technique involves concomitant intracerebral microdialysis and
peripheral catheterizations. To facilitate intravenous drug administration (thereby
avoiding variability in drug absorption) and serial blood sampling (to determine
plasma drug pharmacokinetics), in-dwelling catheters are surgically inserted into
the jugular vein and carotid artery respectively, while a microdialysis probe is
inserted into the brain to monitor fluctuations in drug concentrations in the brain
extracellular fluid (ECF).
It was decided that achieving proficiency at each of these intricate surgical
procedures individually was necessary before attempting to combine them in the
same animal. To this end, imipramine, a tricyclic antidepressant drug, was selected
as the model drug during method development. Imipramine was chosen as it has
previously been sampled using the microdialysis technique (Sato et al., 1994), and
the ability of antidepressants such as imipramine to cross the BBB has come under
scrutiny of late (O'Brien et al., 2012b). It was therefore also necessary to develop a
highly sensitive analytical assay to facilitate detection of the very low levels of
imipramine that were anticipated to be recovered in the microdialysis samples. In
addition, imipramine has an active metabolite, desipramine, which we aimed to
detect and quantify using the same analytical technique.
The present study had several goals. Firstly, it was aimed to develop and optimise a
highly sensitive analytical assay which would enable detection and quantification of
imipramine down to the nanograms per millilitre concentration range. High
performance liquid chromatography with electrochemical detection (HPLC-ECD)
was chosen as an appropriate analytical technique for this purpose based on
previous reports in the literature (Sato et al., 1994). It was necessary to determine
the optimal electrochemical detector settings for the determination of
concentrations of imipramine, desipramine and the internal standard trimipramine.

Appendix C: Establishment of techniques
312
Using these optimised settings, calibration curves for these drugs at low and high
concentration ranges, as would be expected in microdialysis and plasma samples
respectively, were generated to determine if a linear relationship exists between
analyte concentration and detector response. Secondly, once the HPLC method had
been established, it was aimed to validate the success of peripheral catheterization
surgeries by administering imipramine intravenously followed by serial blood
sampling. Using this method, we aimed to generate imipramine and desipramine
plasma pharmacokinetic profiles in dual-catheterized rats following intravenous
administration and determine an optimal intravenous dose for use in further
studies. In order to do this, it was necessary to optimise a plasma extraction
technique and to validate that imipramine, desipramine and trimipramine could be
reliably and efficiently extracted from plasma samples, and that these compounds
in the extracted plasma samples could be determined using the HPLC-ECD system.
Initial catheterization surgeries were carried out on a non-recovery basis. Therefore
the plasma pharmacokinetics of imipramine were initially determined in
anaesthetized animals. Once greater surgical proficiency was achieved, imipramine
plasma pharmacokinetics were determined in conscious freely moving animals
which had recovered post-operatively. Thirdly, we measured plasma corticosterone
concentrations over time in one conscious freely moving catheterized animal
following post-operative recovery to ascertain that it was possible to monitor
diurnal variations in plasma corticosterone levels using our technique and to
determine if plasma corticosterone levels were elevated above expected normal
values on the day following surgery. Finally, we aimed to validate the success of our
microdialysis technique by detecting fluctuations in imipramine levels in
microdialysis samples in the conscious, freely moving rat following intraperitoneal
imipramine administration in animals which had received microdialysis surgery
only.

Appendix C: Establishment of techniques
313
C.2. Methods
C.2.1. Drugs and chemicals
High performance liquid chromatography (HPLC) grade acetonitrile, potassium
dihydrogen phosphate and orthophosphoric acid (OPA) were obtained from Fisher
Scientific (Ireland). Heparin sodium solution (Wockhardt UK Ltd, UK) was purchased
from Uniphar Group (Ireland). Imipramine, desipramine, trimipramine and
verapamil were obtained from Sigma-Aldrich as were all other chemicals unless
otherwise stated.
C.2.2. HPLC method development
C.2.2.1. HPLC equipment
The HPLC with electrochemical detection (HPLC-ECD) system consisted of a
Shimadzu LC-20AD XR Prominence Pump, CBM-20A communication bus module,
SIL-20AC XR Prominence Autosampler, CTO-20A Prominence Column oven (all
supplied by Mason Technology, Cork, Ireland). System components were used in
conjunction with Shimadzu LC solutions software (Mason Technology). The detector
used was ESA Coulochem III with the 5041 Amperometric Cell (Supplied by ESA
Analytical, Ltd., Brook Farm, Dorton, Aylesbury, Buckinghamshire, HP18 9NH
England). All samples were injected onto a reversed phase Luna 3 µm C18(2) 150 x
2 mm column (Phenomenex), which was protected by Krudkatcher Ultra in-line
filters (Phenomenex).
C.2.2.2. HPLC optimisation and validation
Standard solutions of imipramine, desipramine, verapamil and trimipramine were
injected onto the HPLC system at different voltages to determine the optimal
voltage. Response (as measured by peak height) was plotted against applied
voltage to facilitate identification of the optimal voltage. Calibration curves were
generated to investigate if a linear relationship exists between analyte
concentration and peak height across the concentration ranges to be investigated.
C.2.2.3. HPLC conditions
The HPLC-ECD method was adapted from previously described methods (Sato et al.,
1994; Frahnert et al., 2003). Briefly, the mobile phase which was used on the HPLC

Appendix C: Establishment of techniques
314
system consisted of a mixture of 25mM potassium dihydrogen phosphate (25 mM,
pH 7 with 4N NaOH) and HPLC grade acetonitrile (56:44). Mobile phase was filtered
through Millipore 0.22 µm Durapore filters (Millipore, Ireland) and vacuum
degassed prior to use. Compounds were eluted isocratically over a 30 min runtime
at a flow rate of 0.4 ml.min-1 after a 20 µl injection. The column was maintained at a
temperature of 30oC and samples/standards were kept at 8oC in the cooled
autoinjector prior to analysis. The glassy carbon working electrode combined with a
platinum reference electrode (ESA) was operated at a potential of 600mV and a
range of 50nA.
C.2.2.4. Analyte identification and quantification
Imipramine, desipramine and trimipramine (internal standard) were identified by
their characteristic retention times as determined by standard injections which
were run at regular intervals during sample analysis. For the extracted plasma
samples, analyte:internal standard peak height ratios were measured and
compared with standard injections, and results were expressed as nanograms of
analyte per ml of plasma. As no extraction procedure was necessary for
microdialysis samples, analyte peak height ratios were compared directly with
standard injections and expressed as nanograms of analyte per ml of dialysate
C.2.3. In vivo experiments
Male and female Sprague Dawley rats (Harlan Laboratories, UK) were used for
these preliminary in vivo experiments. Animals were group-housed 4-6 animals per
cage and maintained on a 12 hour light/dark cycle (lights on at 08:00 h) with food
and water ad libitum. Room temperature was controlled at 22 ± 1°C. All procedures
were carried out in accordance with EU directive 89/609/EEC and approved by the
Animal Experimentation & Ethics Committee of University College Cork.
C.2.3.1. Development of surgical procedures
Animals were anaesthetized prior to surgery with a ketamine/xylazine mixture
(90/10 mg.kg-1 i.p.), with maintenance of anaesthesia achieved by repeating 20-25%
of the induction dose at 30-40 minute intervals, as required. Analgesia was
provided by pre-operative administration of carprofen (3 mg.kg-1 s.c.). Throughout
Appendix C: Establishment of techniques
315
surgical procedures, the body temperature of each rat was maintained using a
heating pad.
C.2.3.2. Catheterization surgeries
Two indwelling catheters were surgically implanted in each rat using standard
surgical techniques: one in the carotid artery for collection of serial blood samples
and one in the external right jugular vein to facilitate intravenous drug
administration (Thrivikraman et al., 2002; Huang et al., 2006; Heiser, 2007). All
catheters were pyrogen-free polyethylene tubing (Instech Laboratories, Plymouth
Meeting, PA). The arterial and venous catheters consisted of BPE-T25 tubing
(0.018"ID x 0.036"OD) and BPE-T50 tubing (0.023"ID x 0.038"OD), respectively. The
catheters were subcutaneously tunnelled to the back of the neck of the rat, where
they were exteriorized and connected to three-way Discofix® stopcocks (B. Braun).
To prevent clotting the catheters were filled with a heparinised saline solution (20
IU.ml-1).
C.2.3.3. Blood sampling experiments
After successful catheterization surgeries, rats were administered imipramine
either intravenously or by oral administration. Initial experiments were carried out
on anaesthetized animals, while later experiments were carried out on conscious
freely moving animals. In one case where the intravenous line was not patent,
imipramine was administered by i.p. injection rather than by i.v. injection. Following
imipramine administration, blood samples were taken at regular intervals up to 300
minutes post-imipramine administration. Blood samples (~ 250 µl) were
immediately centrifuged at 5000 rpm for 5 minutes, plasma taken and stored at -
20oC or -80oC until extraction for analysis by HPLC with electrochemical detection.
At the conclusion of the experiment, rats were euthanized by administration of
intravenous sodium pentobarbitone (euthatal).
C.2.3.4. Plasma extraction
Imipramine and its active metabolite desipramine were extracted from plasma
using a liquid-liquid extraction technique as described previously (Clarke et al.,
2009), with some modifications. Briefly, 98 µl of plasma was spiked with 2 µl of the

Appendix C: Establishment of techniques
316
internal standard, trimipramine, to yield a final concentration of 20 ng.ml-1
trimipramine. To this trimipramine-spiked plasma, 1 ml of sodium hydroxide (2 M)
and 3 ml of water were added. Extraction was carried out in 7.5 ml of 1.5% isoamyl
alcohol in n-heptane by vortexing for 30 seconds, followed by agitation on a
mechanical shaker for 15 min and then centrifugation at 5000 RPM for 15 min at
20°C. The upper solvent layer was transferred to a tube containing 200 µl of 25 mM
OPA, vortexed for 30 seconds, then agitated on a mechanical shaker for 15 min
followed by centrifugation at 5000 rpm for 15 min at room temperature. Twenty
microlitres of the lower aqueous phase was injected onto the HPLC system for
analysis. This reliability and efficiency of this extraction technique was validated
before use by extracting blank plasma samples spiked with known concentrations
(100 ng.ml-1) of imipramine and desipramine.
C.2.3.5. Determination of diurnal variations in plasma corticosterone
concentrations
Serial blood samples (~200 µl) were taken at two-hourly intervals from one drug-
naive rat on the day following successful catheterizations. Blood samples were
immediately centrifuged at 5000 rpm for 5 minutes at 4°C, plasma taken and stored
at -20oC until assayed. Plasma corticosterone concentrations were determined
using a commercially available enzyme-linked immunosorbent assay (ELISA) kit
(Enzo Life Sciences, USA) according to the manufacturer's instructions.
C.2.3.6. Development and validation of microdialysis technique
C.2.3.7. Dialysis probe construction and calibration
Vertical concentric microdialysis probes were constructed as described elsewhere
(Page and Lucki, 2002). Briefly, a piece of fused silica (ID 75 ± 3 µm, OD 150 ± 6 µm;
CM Scientific Ltd, UK) was inserted through PE10 tubing (Instech Laboratories,
Plymouth Meeting, PA). A Spectra/Por® Micro-dialysis Hollow Fiber regenerated
cellulose semipermeable membrane with a 13 kD molecular weight cut-off
(Spectrum Laboratories, Inc.) was placed over the fused silica and into the PE10
tubing, and fixed in place using epoxy adhesive. The open end of the
semipermeable membrane was sealed with a 0.5 mm epoxy plug, and the active

Appendix C: Establishment of techniques
317
area of the fibre, where diffusion takes place across the membrane, was limited to
3 mm in length by coating regions outside this range with epoxy adhesive. In vitro
recovery experiments were carried out to demonstrate that imipramine and
desipramine could be recovered using the microdialysis probes. These in vitro
recovery experiments involved immersing each probe in a well of aCSF containing a
known concentration (100 ng.ml-1) of imipramine and desipramine. The
concentration of imipramine and desipramine present in the dialysis samples was
expressed as a percentage of the known concentration in the well and this
percentage is termed the recovery rate.
C.2.3.8. Microdialysis surgery
Rats were placed in a stereotaxic frame (Model 900 Small Animal Stereotaxic
Instrument, David Kopf Instruments, Bilaney Consultants, St Julians, Sevenoaks, UK)
with the skull flat. A small burr hole was made in the skull, centred 2.7 mm anterior
and 0.7 mm lateral to bregma. The microdialysis probe was slowly lowered 5 mm
from dura into the prefrontal cortex (PFC) (Paxinos and Watson, 1998) and secured
with skull screws and dental acrylic. The inlet of the probe was connected to a fluid
swivel (Instech Laboratories, Plymouth Meeting, PA) and the rats were single-
housed in cylindrical plexiglass containers (Instech Laboratories, Plymouth Meeting,
PA) filled with bedding and food pellets. Artificial cerebrospinal fluid (aCSF: 147 mM
NaCl, 1.7 mM CaCl2, 0.9 mM MgCl2, and 4mM KCl) was continuously perfused
through each microdialysis probe at a rate of 1.5 μl.min-1 by a microlitre ‘Pico Plus’
syringe pump (Harvard Apparatus, Fircroft Way, Edenbridge, Kent UK).
C.2.3.9. Microdialysis sampling experiments
After successful microdialysis surgeries, rats were allowed to recover overnight
prior to microdialysis sampling experiments on the following day during the optimal
post-surgical period (de Lange et al., 2000). Microdialysis samples were taken
before imipramine administration (blanks) and at 20 minute intervals following the
administration of imipramine (30 mg.kg-1 i.p.) for 300 minutes. Imipramine and
desipramine concentrations in the microdialysis samples were determined by HPLC
analysis on the same day as they were collected without any extraction procedure.

Appendix C: Establishment of techniques
318
C.3. Results
C.3.1. Optimal potential for ECD detector
The response (peak height) increased with increasing voltage applied across the
electrode at all applied voltages tested for trimipramine and verapamil, while the
response increased to a maximum at 700 mV for imipramine before decreasing at a
higher voltage (Figure C.1). The response for desipramine reached a plateau at an
applied voltage of 600 mV and declined at higher applied voltages. As the
background noise increases with increasing applied voltage, it was decided that 600
mV was the optimal voltage at which to analyse our samples.
Figure C.1: Determination of optimal potential for ECD detection of analytes
0
50
100
150
200
250
300
500 550 600 650 700 750 800
Pe
ak h
eig
ht
(x 1
03)
Applied voltage (mV)
Desipramine
Imipramine
Verapamil
Trimipramine
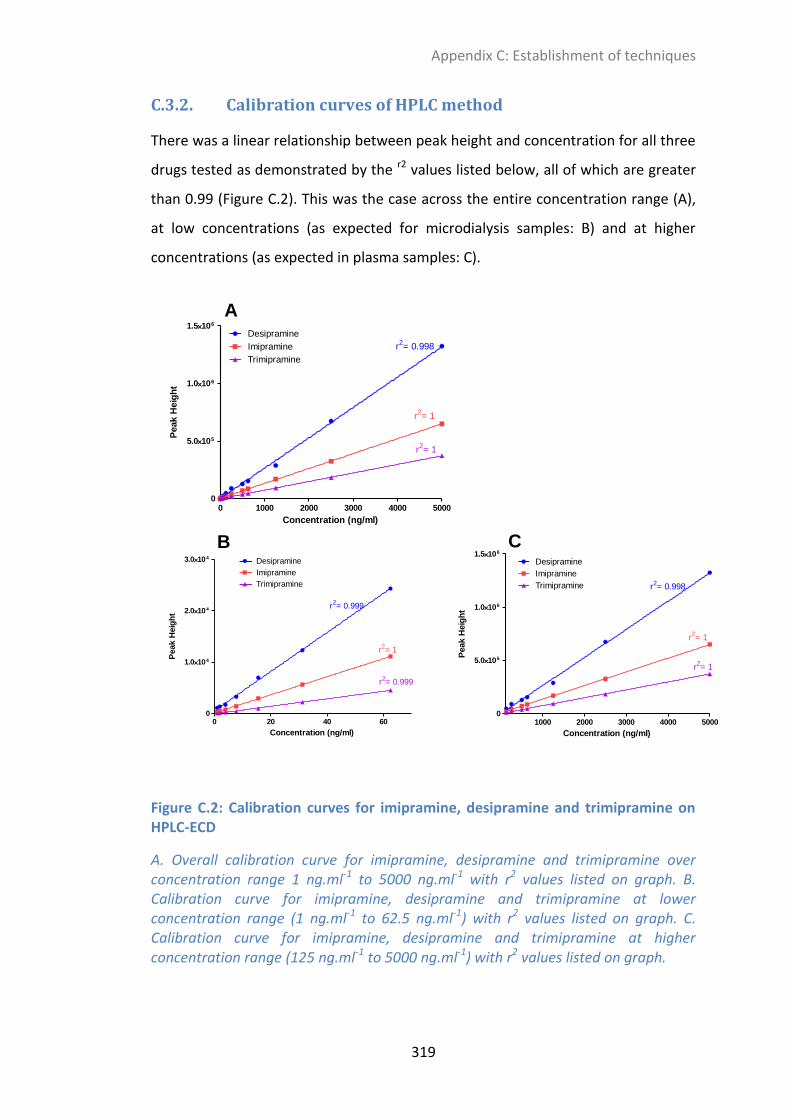
Appendix C: Establishment of techniques
319
C.3.2. Calibration curves of HPLC method
There was a linear relationship between peak height and concentration for all three
drugs tested as demonstrated by the r2 values listed below, all of which are greater
than 0.99 (Figure C.2). This was the case across the entire concentration range (A),
at low concentrations (as expected for microdialysis samples: B) and at higher
concentrations (as expected in plasma samples: C).
0 1000 2000 3000 4000 50000
5.0105
1.0106
1.5106
Desipramine
Imipramine
Trimipramine
r2= 0.998
r2= 1
r2= 1
Concentration (ng/ml)
Peak H
eig
ht
0 20 40 600
1.0104
2.0104
3.0104Desipramine
Imipramine
Trimipramine
r2= 0.999
r2= 1
r2= 0.999
Concentration (ng/ml)
Peak H
eig
ht
1000 2000 3000 4000 50000
5.0105
1.0106
1.5106
Desipramine
Imipramine
Trimipramine r2= 0.998
r2= 1
r2= 1
Concentration (ng/ml)
Peak H
eig
ht
A
B C
Figure C.2: Calibration curves for imipramine, desipramine and trimipramine on HPLC-ECD
A. Overall calibration curve for imipramine, desipramine and trimipramine over concentration range 1 ng.ml-1 to 5000 ng.ml-1 with r2 values listed on graph. B. Calibration curve for imipramine, desipramine and trimipramine at lower concentration range (1 ng.ml-1 to 62.5 ng.ml-1) with r2 values listed on graph. C. Calibration curve for imipramine, desipramine and trimipramine at higher concentration range (125 ng.ml-1 to 5000 ng.ml-1) with r2 values listed on graph.

Appendix C: Establishment of techniques
320
C.3.3. Plasma extraction efficiency
The extraction efficiency of our liquid-liquid extraction technique was determined
by spiking blank plasma with a known concentration of imipramine, desipramine
and trimipramine (100 ng.ml-1). The concentration of these drugs in our extracted
samples was expressed as a percentage of the initial concentration and termed
‘extraction efficiency’. As illustrated in Figure C.3, the extraction efficiency for all
three compounds was > 80% and the extraction procedure was reliable and
reproducible.
Des
ipra
min
e
Imip
ram
ine
Trimip
ram
ine
0
20
40
60
80
100
% E
xtr
acti
on
Eff
icie
ncy
Figure C.3: Plasma extraction efficiency
Percentage of the spiked concentration of desipramine, imipramine and the internal standard trimipramine obtained in extracted samples (n = 4 extractions)

Appendix C: Establishment of techniques
321
C.3.4. Imipramine and desipramine plasma profiles in anaesthetized rats
C.3.4.1. Following intravenous imipramine (15 mg.kg-1) administration
Imipramine (15 mg.kg-1 i.v.) was administered to an anaesthetized rat immediately
after successful completion of dual catheterization surgery. Anaesthesia was
maintained for 90 minutes post-imipramine administration, and blood samples
were taken at regular intervals. The concentration of imipramine and desipramine
were determined at each time-point and are presented in the plasma profiles
shown in Figure C.4.
Figure C.4: Imipramine and desipramine plasma profiles in an anaesthetized animal after the intravenous administration of imipramine 15 mg.kg-1 (n = 1)
0 60 1200
2000
4000
6000
8000Imipramine 15 mg/kg i.v. (anaes)
Time (min)
Pla
sm
a im
ipra
min
e c
on
cen
trati
on
(n
g/m
l)
0 60 1200
10
20
30
40
50
Desipramine
Time (min)
Pla
sm
a d
esip
ram
ine c
on
cen
trati
on
(n
g/m
l)
A
B
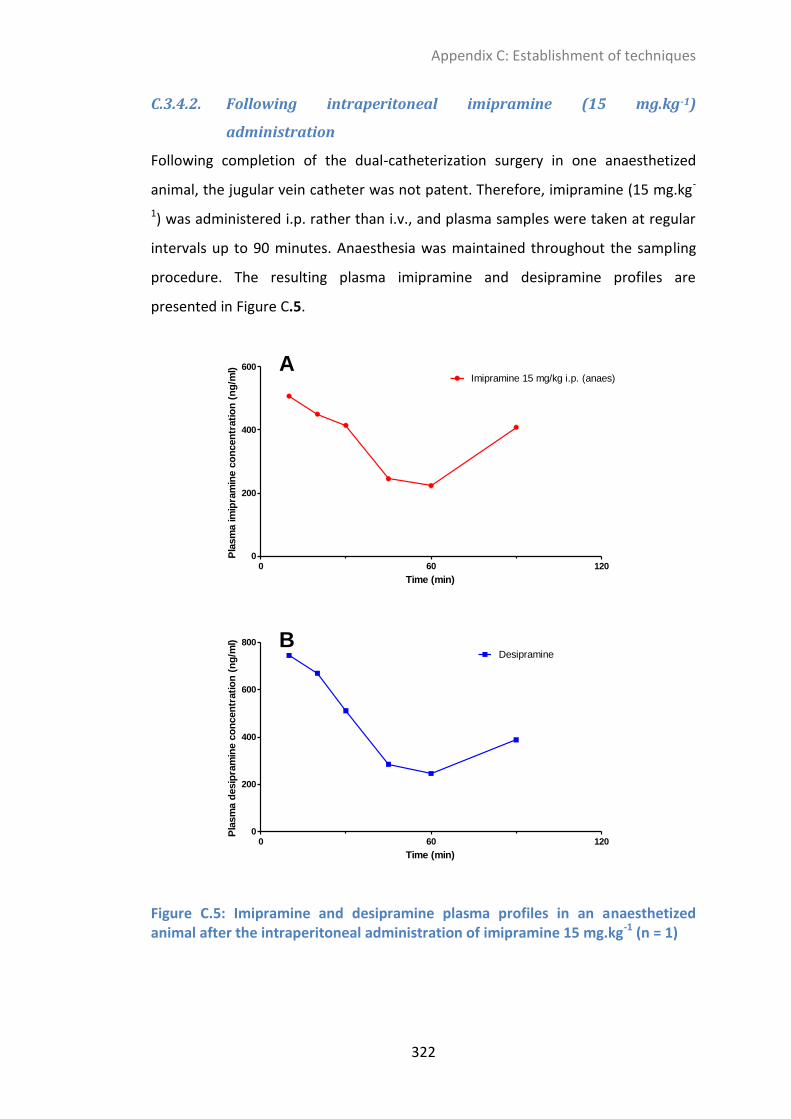
Appendix C: Establishment of techniques
322
C.3.4.2. Following intraperitoneal imipramine (15 mg.kg-1)
administration
Following completion of the dual-catheterization surgery in one anaesthetized
animal, the jugular vein catheter was not patent. Therefore, imipramine (15 mg.kg-
1) was administered i.p. rather than i.v., and plasma samples were taken at regular
intervals up to 90 minutes. Anaesthesia was maintained throughout the sampling
procedure. The resulting plasma imipramine and desipramine profiles are
presented in Figure C.5.
Figure C.5: Imipramine and desipramine plasma profiles in an anaesthetized animal after the intraperitoneal administration of imipramine 15 mg.kg-1 (n = 1)
0 60 1200
200
400
600
Imipramine 15 mg/kg i.p. (anaes)
Time (min)
Pla
sm
a im
ipra
min
e c
on
cen
trati
on
(n
g/m
l)
0 60 1200
200
400
600
800
Desipramine
Time (min)
Pla
sm
a d
esip
ram
ine c
on
cen
trati
on
(n
g/m
l)
A
B

Appendix C: Establishment of techniques
323
C.3.5. Imipramine and desipramine plasma profiles in conscious freely moving rats
C.3.5.1. Following intravenous imipramine (1 mg.kg-1) administration
Following successful dual-catheterization surgery, one animal was allowed to
recover overnight prior to imipramine (1 mg.kg-1 i.v.) administration while conscious
and freely moving. This dose was tolerated without any adverse reaction, and
plasma samples were taken at regular intervals up to 300 minutes post-imipramine
administration. The resulting imipramine plasma profile is illustrated in Figure C.6.
For technical reasons, desipramine concentrations could not be determined in
these plasma samples.
0 60 120 180 240 300 3600
200
400
600
800
1000 Imipramine 1 mg/kg i.v.
Time (min)
Pla
sm
a im
ipra
min
e c
on
cen
trati
on
(n
g/m
l)
Figure C.6: Imipramine plasma profile in a conscious freely moving animal following the intravenous administration of imipramine 1 mg.kg-1 (desipramine levels could not be determined for technical reasons) (n = 1)

Appendix C: Establishment of techniques
324
C.3.5.2. Following intravenous imipramine (5 mg.kg-1) administration
Following successful dual-catheterization surgery, imipramine (5 mg.kg-1 i.v.) was
administered to six conscious freely moving animals. This dose was tolerated
without any adverse reactions, and plasma samples were taken at regular intervals
up to 300 minutes post-imipramine administration. The resulting mean imipramine
and desipramine plasma profiles are illustrated in Figure C.7.
Figure C.7: Imipramine and desipramine plasma profiles in conscious freely moving animals after the intravenous administration of imipramine 5 mg.kg-1 (n = 6)
0 60 120 180 240 300 3600
500
1000
1500
2000Imipramine 5 mg/kg i.v.
Time (min)
Pla
sm
a im
ipra
min
e c
on
cen
trati
on
(n
g/m
l)
0 60 120 180 240 300 3600
10
20
30
Desipramine
Time (min)
Pla
sm
a d
esip
ram
ine c
on
cen
trati
on
(n
g/m
l)
A
B

Appendix C: Establishment of techniques
325
C.3.5.3. Following oral imipramine (30 mg.kg-1) administration
Following successful dual-catheterization surgery, imipramine (30 mg.kg-1) was
administered orally to three conscious freely moving animals. Plasma samples were
taken at regular intervals up to 300 minutes post-imipramine administration. The
resulting mean imipramine and desipramine plasma profiles are illustrated in Figure
C.8.
Figure C.8: Imipramine and desipramine plasma profiles in conscious freely moving animals after the oral administration of imipramine 30 mg.kg-1 (n = 6)
0 60 120 180 240 300 3600
500
1000
1500
2000
2500
Imipramine 30 mg/kg p.o.
Time (min)
Pla
sm
a im
ipra
min
e c
on
cen
trati
on
(n
g/m
l)
0 60 120 180 240 300 3600
50
100
150
200
250 Desipramine
Time (min)
Pla
sm
a d
esip
ram
ine c
on
cen
trati
on
(n
g/m
l)
A
B

Appendix C: Establishment of techniques
326
C.3.6. Diurnal variation in plasma corticosterone levels in a conscious freely moving rat one day after catheterization surgery
Following overnight recovery after successful dual catheterization surgery, plasma
samples were taken from one female rat every two hours between 8 am and 10 pm
and plasma corticosterone levels were determined in each plasma sample. The
resulting plot illustrating the diurnal variation in plasma corticosterone
concentrations throughout the day is shown in Figure C.9. The overall mean plasma
corticosterone concentration was 145.8 ng.ml-1.
Figure C.9: Diurnal variation in plasma corticosterone levels as measured by serial blood sampling from an indwelling arterial catheter (n=1)
8 10 12 14 16 18 20 22 240
100
200
300
400
LIGHTS ON LIGHTS OFF
Time of day
Pla
sm
a C
OR
T (
ng
/ml)

Appendix C: Establishment of techniques
327
C.3.7. Microdialysis probe recovery – in vitro experiments
The mean in vitro probe recovery by gain for desipramine (DMI), imipramine (IMI),
verapamil (VERAP) and trimipramine (TRIM) are illustrated in Figure C.10 (n = 6
probes).
Figure C.10: In vitro probe recovery by gain from a 100 ng.ml-1 solution (n = 6 probes)
DM
IIM
I
VER
AP
TRIM
0
5
10
15P
rob
e r
eco
very
(%
)

Appendix C: Establishment of techniques
328
C.3.8. Imipramine and desipramine dialysate profiles in conscious freely moving rats after intraperitoneal imipramine (30 mg.kg-1) administration
Imipramine (30 mg.kg-1 i.p.) was administered to 3 rats on the day following
successful microdialysis surgery and the resulting concentration of imipramine and
desipramine in the microdialysis samples at different time intervals post-
imipramine administration was measured using HPLC-ECD. The imipramine and
desipramine levels in all samples were quantifiable, and the resulting profiles are
shown in Figure C.11.
Figure C.11: Dialysate imipramine and desipramine concentration-time profiles following intraperitoneal imipramine administration (30 mg.kg-1) (n=3)
0 60 120 180 240 3000
5
10
15
20
25Imipramine
Time (mins)
Dia
lysate
co
ncen
trati
on
(n
g/m
l)
0 60 120 180 240 3000
1
2
3
4
5Desipramine
Time (mins)
Dia
lysate
co
ncen
trati
on
(n
g/m
l)
A
B

Appendix C: Establishment of techniques
329
C.4. Discussion
The present data demonstrate the success of our analytical and surgical techniques.
We successfully developed a highly sensitive analytical technique which facilitated
the determination of imipramine, desipramine and the internal standard
trimipramine concentrations in the ng.ml-1 range. Furthermore, we successfully
developed a surgical catheterization technique which facilitated the intravenous
administration of imipramine via the jugular vein and serial blood sampling via the
carotid artery. Using this catheterization technique, it was possible to repeatedly
remove small volumes of blood (plasma) from a conscious freely moving animal
after intravenous imipramine administration. We successfully developed a
reproducible and efficient liquid-liquid extraction technique to extract imipramine
and desipramine from plasma samples for HPLC analysis, with > 80 % extraction
efficiency on average and very little variation between different extractions (Figure
C.3). Therefore, using this optimised extraction procedure it was possible to
determine plasma concentrations of imipramine and desipramine over time
following intravenous imipramine administration, thereby generating
pharmacokinetic profiles for imipramine and desipramine in both anaesthetized
and conscious freely moving animals following imipramine delivery via various
routes of administration.
Initial experiments were carried out on a non-recovery basis. Therefore, a plasma
pharmacokinetic profile for imipramine and desipramine was firstly determined in
an anaesthetized animal for 90 minutes post-intravenous imipramine
administration (Figure C.4). In a subsequent experiment the intravenous catheter
was not patent, meaning it was not possible to administer imipramine
intravenously, but it was possible to sample blood via the intra-arterial catheter.
Therefore, imipramine was administered intraperitoneally to the anaesthetized rat
and blood samples were taken for 90 minutes following imipramine administration
(Figure C.5). Once an adequate level of surgical proficiency was attained, rats were
allowed to recover overnight prior to drug administration and blood sampling. A
pilot experiment to help determine an acceptable dose was carried out in one
animal which received an i.v. dose of imipramine 1 mg.kg-1 (Figure C.6). This dose

Appendix C: Establishment of techniques
330
was well-tolerated, and subsequent experiments used a higher imipramine dose of
5 mg.kg-1 which was also well-tolerated. This 5 mg.kg-1 i.v. dose was repeated in 6
animals, resulting in a typical intravenous drug concentration versus time plot for
imipramine with low levels of variation at each time-point (Figure C.7).
Furthermore, it was also possible to quantify desipramine levels in these plasma
samples, thus yielding a plasma profile for desipramine in the conscious freely
moving animal following imipramine administration. The concentration of
desipramine in plasma gradually increased over time before declining, as was
expected considering desipramine is a metabolite of imipramine.
Further experiments were carried out in dual-catheterized animals which involved
the oral administration of imipramine. The aim here was to demonstrate that the
plasma profile of imipramine would be different following administration via the
oral route compared to the intravenous route. This was the case as illustrated in
Figure C.8. The high levels of variability observed at each time point reflect the
variable nature of drug absorption from the gut (particularly in non-fasted animals,
as was the case here), and supports our decision to administer imipramine
intravenously, thereby reducing the variability in plasma levels.
In addition to the determination of imipramine and desipramine plasma profiles
after imipramine administration, we also determined plasma corticosterone levels
in one dual-catheterized animal at various time-points on the day after
catheterization surgery. The aim here was two-fold: firstly to demonstrate that we
could detect the diurnal variation in plasma corticosterone levels using our
catheterization technique and secondly to determine if the plasma corticosterone
levels detected would be elevated relative to expected values. Corticosterone is the
main stress hormone in rats, and circulating plasma corticosterone concentrations
reflect the stress levels of the animal. As expected, we observed a diurnal variation
in plasma corticosterone levels over the course of the day, with trough values
observed in the morning shortly after turning the lights on and peak values in the
evening shortly after turning the lights off (Figure C.9). This pattern is broadly in line
with reports in the literature (Atkinson and Waddell, 1997). Furthermore, the mean
plasma corticosterone concentration measured across the day (145.8 ng.ml-1) was

Appendix C: Establishment of techniques
331
within the expected range for an unstressed female rat (Atkinson and Waddell,
1997), thus indicating that the rat was not suffering from an increased level of
stress on the day following catheterization surgery.
The present study also aimed to establish the intracerebral microdialysis technique.
To this end, in vitro experiments were firstly undertaken which demonstrated that
imipramine, desipramine, verapamil and trimipramine could be reliably and
reproducibly recovered in our ‘home-made’ probes from wells containing a
standard 100 ng.ml-1 solution of these drugs (Figure C.10). The next step involved
carrying out in vivo experiments to determine if imipramine and desipramine could
be recovered from the brains of rats which had undergone microdialysis surgery.
On the day after microdialysis surgery, imipramine (30 mg.kg-1 i.p.) was
administered to these animals and microdialysis samples were collected over time.
It was possible to detect both imipramine and desipramine in all of these samples,
thus yielding an intracerebral concentration versus time profile for these drugs
following i.p. administration (Figure C.11). This demonstrates the success of our
intracerebral microdialysis technique.
In conclusion, the present results demonstrate that it is possible to individually use
our catheterization or microdialysis procedures, in combination with our HPLC-ECD
analytical technique, to monitor fluctuations in imipramine and desipramine
concentrations in plasma or the brain over time. The next step involves combining
the two surgical procedures to monitor alterations in imipramine transport across
the BBB in response to interventions such as P-gp inhibition.

332
Appendix D: Microdialysis probe construction
D.1. Background information
Microdialysis is a sampling technique used to collect small molecular weight
substances from the extracellular fluid of the brain/spinal cord. Substances diffuse
across a semi-permeable membrane down their concentration gradient. All
microdialysis probes are composed of a length of tubular dialysis semipermeable
membrane through which a solution, usually devoid of the analyte of interest
(usually artificial cerebrospinal fluid), is constantly perfused. A variety of
membranes are available which differ in pore size and the material used. Once the
probe is inserted into the brain/spinal cord region of interest and perfusion begins,
substances in the extracellular fluid diffuse through the membrane into the probe
along their concentration gradient. The perfusate is infused slowly and continuously
through the length of the dialysis probe into the outflow tubing where it can be
collected for subsequent analyte quantification.
D.2. Materials
Polyethylene tubing (PE-10, PE-50)
Fused silica
Semipermeable membrane (choose specific molecular weight cutoff)
Scissors
Forceps
Needles (orange)
Epoxy adhesive glue-Epoxy Part A and Hardener Part B
Ruler
Microscope
A4 sheet (for mixing glue)

Appendix D: Microdialysis probe construction
333
D.3. Step-by-step guide
D.3.1. Probe building
1. Cut PE-10 (16 inches and 10 inches), PE-50 (2 inches) and Silica (19 inches)
and hang on upturned sticky tape. If old probes available, can reuse PE-10
for covering silica, and PE-50 if long enough.
2. Put PE-50 over 16 inch PE-10 (may need to use blue 23G needle to loosen
PE-50). Glue in place.
3. Make hole in one side of PE-10 at the end which does not have PE-50
attached (~4cm from top) using orange needle. Hold needle in right hand
and have long side of PE-10 on right so that hole made forms lip which glue
cannot get into.
4. Know where the hole was made. Holding the PE-10 up with the hole facing
up and slightly curved, feed silica in through short end of PE-10 and pull
through hole. Leave a small bit of silica showing at the top of the PE-10.
5. Cut membranes (about 12-15mm so that long enough to tuck in). Always
hold membrane with forceps, never with fingers. To place membrane onto
silica place membrane on microscope stage. Hold the membrane near top
using forceps without applying pressure, and push silica into the membrane.
Tuck a good amount of membrane under PE-10 so that glue won’t block it.
Glue membrane in place. Measure membrane from end of glue spot to top
of membrane under microscope. Want 6mm of membrane for prefrontal
cortex, or 4.5mm for hippocampus, or otherwise as according to the
literature, and chop off any excess using blade.
6. Place wet glue in membrane tip and allow capillary action to work so that
~0.75mm of the membrane is filled with glue on inside only.
7. Need to block of some of the membrane from the connection with PE-10 so
that only a certain amount will contribute to the ‘dialysing tip’. Active site
for PFC=3mm, Hippocampus=2mm. Block off any remaining membrane
using a very thin, smooth layer of glue. Mark the spot for blocking the
membrane using fused silica.

Appendix D: Microdialysis probe construction
334
8. Once top glue spot dry, push silica as close as possible to glue spot without
touching (~0.2mm). Glue silica in place. Be very careful that the glue is not
too runny at this stage as it may block the probe.
9. Attach 10 inch PE-10 over silica and glue in place.
D.3.2. Make aCSF (quantities for 500ml):
NaCl 147mM 4.29534g
KCl 4mM 0.1491g
MgCl2.6H2O 0.9mM 0.091485g
CaCl2 1.7mM 0.094335g
Put 250ml HPLC grade water into 500ml glass bottle. Add salts. Make up to 500ml
with HPLC grade water. Aliquot out by filtering using 0.2mcM filter attached to
syringe. aCSF can be stored for a few weeks.
D.3.3. Activate membrane of the probe
Put ethanol in syringe (Terumo brand). Put blue needle into PE-50, attach syringe
and push ethanol through finished probe to activate the membrane. Wait to see
ethanol coming out the end of the silica-no blockages. Run aCSF through probe
using a syringe and attach to pump running at 1.5µL/min with membrane immersed
in medicine cup of aCSF (an activated membrane will shrink unless immersed in
liquid).
D.3.4. Setting up syringes in pump.
Add filtered aCSF to 5ml syringe and mount on pump. End of barrel and end of
insert should fit into gaps. Tighten side bars, then front, then back. Push out some
aCSF and then click into place. Turn on, press run (1.5µL/min), make sure flow
switch going the right way. Attach probes that are ready to it and immerse
membrane in aCSF. Attach probe to orange frame and glue silica end below it.

335
Appendix E: Microdialysis surgery protocol
E.1. Background information
Microdialysis is a sensitive technique used to sample extracellular fluid for levels of
drugs, drug metabolites, neurotransmitters, amino acids etc. It is renowned as a
sensitive, versatile technique which has applications in elucidating
neuropharmacology of drugs and diseases, as well as giving pharmacokinetic
information on drug levels in the brain. While it was developed over 30 years ago in
the 1970s and 1980s in Sweden, it has gained popularity as a useful and powerful
sampling technique in recent times. This technique is known to hold many
advantages over other available brain sampling techniques, including:
Continuous sample collection from live, awake, freely-moving animals pre-
and post- drug administration/other manipulation
Measurement of free (unbound) drug concentrations = active form of drug
Measurement of drug/neurotransmitter levels in a specific area of the brain-
ability to measure levels in discrete regions
Collection of clean samples, that do not require extra purification prior to
analysis
Potential application in wide range of species, from small rodents (mice,
rats) to non-human primates
E.2. Materials
Stereotaxic frame
Scalpel
Clips
Cotton buds
Adrenaline 0.1%
Blue needle
Probe (calibrated)
Screws
Forceps
Screwdriver
Drill
Marker

Appendix E: Microdialysis surgery protocol
336
Dental cement (powder and solvent)
Petri dish
Spatula
Spring
Needle and thread
Microdialysis cage
Allen keys
Bedding, Chow, Water bottle
Tape
E.3. Step-by-step guide
1. Set up rat on stereotaxic frame.
2. Make one incision from eyes to ears using scalpel.
3. Use 4 clips to pull back skin from four corners.
4. Use cotton buds to move away layer above skull.
5. Dip cotton buds in adrenaline and dab over skull to constrict vessels and stop
bleeding.
6. This should allow time for bregma to appear.
7. Mark bregma with marker.
8. Take AP( anterior posterior) and ML (medial-lateral) co-ordinates.
9. Calculate co-ordinates of where you want to go to-hippocampus, PFC etc. based
on co-ordinates in literature/rat brain atlas.
10. Move needle on stereotaxic frame to that point.
11. Mark skull with needle.
12. Use marker to mark spot also if required.
13. Mark two other spots to the back of the area for screws which lend support
(this makes a triangle type area).
14. Drill all three holes (drill speed 4, only until drill pops back up). Make sure the
microdialysis probe hole for entry is completely free of membrane by putting a
needle in past skull to pop any remaining membrane.
15. Place screws in back two holes, holding with forceps and screwing with
screwdriver (may require downward pressure).
16. Insert probe, making sure it enters center of the hole and is pointed straight
downward.

Appendix E: Microdialysis surgery protocol
337
17. As it is being lowered in, stop just when it is in past the level of the skull, and
take DV (dorsal ventral) co-ordinates. Calculate how far into the brain the probe
should be placed and lower it in.
18. Mix some cement and solvent in a petri dish and start to cement the probe in
place, using the screws for support. This will require many layers of glue.
19. Place spring over probe and cement in place also.
20. Start stitching up wound on nape of neck (from cannulations) while waiting for
cement to dry. Once cement is dry, stitch up head.
E.4. Post-surgery
Place rat onto bedding in special cage. Attach spring using allen key to loosen
holding arm. Make sure spring is loose enough that rat can move around. Using
tape tie down silica. Attach PE-50 to syringe pump outlet.

338
Appendix F: Jugular Vein Catheterisation
F.1. Methodological notes
1. Making taps for JV and CA catheterisation. Clamp needle near base by
holding with needle holder and cut using scalpel.
Blue needle for JV
Orange needle for CA
2. Shave back of neck and top of chest (right hand side if rat lying with chest up
and head towards you, legs away from you. Pull taught while shaving and
shave with blade ‘scooping’.
3. Give subcutaneous injection of Carprofen (100 µl Rimadyl in 5 ml saline).
Pinch skin on back and inject ~0.8ml in bottom part of V.
4. Swab shaved areas with alcohol to sterilize and wipe away excess hair.
5. Make incision to right of centre along line of beating vein. Make incision
using scissors. Holding skin with forceps (one arm inside and one out), pull
subcutaneous tissue away from skin using another forceps. Make pouch
below incision, pull away to right and small bit on left.
6. Butterfly using needle holder, to separate subcutaneous tissue more.
7. Make incision at back of neck using scissors. Pull subcutaneous tissue away
from skin and tunnel to left using needle holder (pushing out against skin so
as not to damage anything).
8. Pull JV catheter through using needle-holder, blue marked end (2.5 cm from
tip of catheter) pointed toward vein side.
9. Insert catheter through 2 syringe barrels (to protect from chewing when rat
regains consciousness). Attach 3-way tap with blue needle (with valve
closed) to line and flush with 0.35ml-0.4ml saline.
10. Pull apart subcutaneous tissue with small forceps and be careful once near
vein. Isolate vein carefully from sides by pulling away fat/subcutaneous
tissue. When isolated, put forceps with arms facing up under JV so that JV
rests in dip of forceps. Thread double piece of thread through, and cut into
two pieces.

Appendix F:Jugular vein catheterization
339
11. Tie of top piece of string tightly to slow blood flow. Leave arms long and
clamp out of the way using needle holder.
12. Tie one very loose knot at the other end and attach clamp to it.
13. Make nick in side of vein using spring scissors, use tweezers to open up nick
just enough to put catheter in. Hold catheter using forceps just above blue
mark. Push into vein as far as blue mark and quickly tie the knot at bottom
very tightl. Cut excess suture string away from knot.
14. Tie top piece of string around catheter and cut excess suture string away
from knot. Check to see that line is patent by pushing in small bit of saline
and drawing out and pushing back in small extra bit.
15. Sew up SC tissue top (leave arms of knot long to loop around catheter) and
bottom (don’t cut arms of knot). Make loop out of catheter and place into
pouch. Loop bottom piece of string around catheter 3 or 4 times and tie
knots them to secure in place. Check line is still patent and fill line with
heparinised saline (0.4-0.45ml). Do the same on top. Sew up skin (mattress
stitching works well).

340
Appendix G: Carotid Artery Catheterisation
G.1. Methodological notes
1. When catheterising both jugular vein and carotid artery, make incision at
midline. Do jugular vein as per Appendix E. Try to ensure loop is pushed to
the right so that carotid artery and jugular vein catheters are separated.
2. Pull jugular vein, barrels and taps over to the left-hand side so that carotid
artery line can be threaded through barrels.
3. Start pulling apart subcutaneous tissue just to the left of midline. Do not go
too near head.
4. Work through subcutaneous tissue until muscles with upside down ‘V’ in
middle is visible. Holding muscle on left with small forceps, tease apart from
V using other small forceps. Reach carotid artery and vagus nerve
(together). Tease apart tissue to isolate carotid artery and vagus. Scoop up
using small forceps.
5. Separate vagus from carotid. Using forceps make hole between carotid and
vagus. Push against carotid rather than vagus. Insert small forceps into hole,
and keeping pressure against carotid, separate carotid and vagus. Once
carotid is free, clamp as close to the base as possible. Insert thread
underneath and tie off at top. Throw loose knot in thread at bottom. Use
needle holder on top thread to create tension on the vessel and drop over
left hand side of head for correct angle.
6. Using spring scissors, cut carotid top and side. Use straight forceps to open
and insert CA tubing. Have catheter so that dip is angled into vein. Push in as
far as clamp. Tighten thread over artery and catheter. Remove clamp and
insert catheter to blue line. Tie thread. Stitch up subcutaneous, make loop
etc as described in relation to jugular vein.
7. Always check patency of catheters once in. Make sure to fill with saline
before inserting into rat and heparinised saline after.