UC San Francisco Electronic Theses and Dissertations - eScholarship
465
UCSF UC San Francisco Electronic Theses and Dissertations Title Mechanisms Regulating the Expression and Function of MXR Permalink https://escholarship.org/uc/item/8dr5j9nq Author Eclov, Rachel Publication Date 2013 Peer reviewed|Thesis/dissertation eScholarship.org Powered by the California Digital Library University of California
-
Upload
khangminh22 -
Category
Documents
-
view
0 -
download
0
Transcript of UC San Francisco Electronic Theses and Dissertations - eScholarship

UCSFUC San Francisco Electronic Theses and Dissertations
TitleMechanisms Regulating the Expression and Function of MXR
Permalinkhttps://escholarship.org/uc/item/8dr5j9nq
AuthorEclov, Rachel
Publication Date2013 Peer reviewed|Thesis/dissertation
eScholarship.org Powered by the California Digital LibraryUniversity of California

Mechanisms Regulating the Expression and Function of MXR
by
Rachel J, Eelov
DISSERTATION
Submitted in partial satisfaction of the requirements for the degree of
DOCTOR OF PHILOSOPHY
in
Pharmaceutical Sciences and Pharmaeogenomics
in the

ii
© 2013 Rachel Jean Eclov

iii
This thesis is dedicated to my husband Neville,
with whom I share the times of struggle and success.

iv
Acknowledgements
This thesis is the compilation of many hours spent in the lab researching or on the
computer searching the literature and writing. However much effort I put in, it would
never have been completed without physical, mental and emotional contributions from
many people. Although below I acknowledge many of those who have helped me, there
are also many unnamed individuals who shared with me their insight, protocols, cells,
reagents and techniques. To both those named and unnamed, you have my thanks and
gratitude for easing my passage and bringing me through this journey.
The foremost person that has my utmost gratitude is my advisor, Dr. Deanna
Kroetz. It has been an honor to have a mentor with compassion, who is both a great
scientist and scholar, and capable of recalling every piece of knowledge or literature she’s
ever read. Even though the last few months have been frantic and stressful, she has my
heartfelt thanks for her continued diligence in combing through my thesis time and time
again. Deanna has also contributed to my development as a scientist and I appreciate how
she has always challenged me to think critically about the literature and experimental
setups so I learned how to address research questions from different angles and with the
correct forethought. I am also appreciative of Deanna’s open mind to different research
avenues, such as epigenetics, and allowing me to try out new techniques in the lab.
Finally, because I have always had a knack for pronouncing words incorrectly, I
especially appreciate Deanna’s willingness to reiterate to me the correct pronunciation,
especially with words like canalicular.
I would also like to thank the members of my thesis and oral committees, who
gave me valuable advice and suggestions on the direction of my thesis. Dr. Nadav Ahituv,

v
who before he was the chair of my orals committee, opened my eyes to the world of
epigenetics and transporter gene regulation. I am also grateful for his willingness to
collaborate with me on the in vivo portions of my research. Dr. John Witte, for your ever
upbeat attitude, enthusiasm for my results and realistic research suggestions. Members of
my orals committee: Dr. Kathy Giacomini, who was gracious enough to find time in her
busy schedule to enlighten me on different aspects of transporters and write me numerous
letters of recommendations through the years, and Dr. Pui-Yan Kwok who knows
everything on genetic analysis.
The other Pharmaceutical Science and Pharmacogenomic (PSPG) faculty
members including my academic advisor Dr. Steve Hamilton, who took the time to make
sure I was academically and emotionally on track. The PSPG administrator Debbie
Acoba for her diligence and willingness to complete paperwork, and making sure that the
years of my graduate studies were full of department funded outings. Additionally, I
would like to thank the multitude of staff at the University of California San Francisco,
especially those at the Cell Culture Facility and Cell Imaging Facility, who made my life
run smoother. Also, a very special and heartfelt thanks to our purchasing analyst Hubert
Sylvester, without whose patience and prompt actions I would never have received any of
my reagents.
From the beginning of my time in the Kroetz lab, I had guidance and endless day-
to-day help from three wonderful individuals, for whom I have a great deal of
appreciation and gratitude. Dr. Yingmei Lui, whose knowledge on immunocytochemistry
was a great asset in a coworker. To Dr. Hisa Fukushima, who never said no; her
infectious smile and generosity were the reasons I was never afraid of joining the Kroetz

vi
lab. Last, but never least, Dr. Svetlana Markova, who assisted me on many projects,
taught me a multitude of skills and always had the time and ability to answer to any
question. Sveta also became a close friend of mine and I’ll be forever grateful for being
able to share my years in the Kroetz lab with her.
The atmosphere in which I spent my graduate career was both educational and
entertaining, and there are numerous people who have my thanks for making it that way.
First, thank you to all the current and past members of the Kroetz lab, particularly Dr.
Mike Baldwin, Dr. Leslie Chinn, Mike Martin and Janine Micheli for their technical help,
valuable suggestions and willingness to eat anything I baked without regard to fat or
calories. Second, a special thank you to Aparna Chhibber, who promptly fielded my
computer programming questions and assisted with many SNP correlations. Also, thank
you to the endless flow of Swedish pharmacy students and international postdoctoral
fellows in the Kroetz lab, who in addition to showing me novel techniques, all stole into
my heart and I cannot wait to travel the world and visit them. I would also like to thank
all the past and present members of Giacomini lab, who I have always thought of as our
sister lab, for being great friends and scientists, and their always willingness to share
reagents, equipment and space. Specifically, I would like to thank Dr. Sook Wah Yee; if I
am ever half as good a scientist as her, I will be satisfied.
There are many people who collaborated with me, and without their assistance I
would not have the wonderful collection of data described in the following pages. Thank
you to (a very soon to be doctor) Mee Jean Kim and Dr. Robin Smith for your time and
effort collecting the in vivo enhancer data for me. Thank you to Shripa Patel from the
PAN facility at Stanford University for never giving up on my DNA methylation

vii
sequencing project. Also, my many mentees, especially Xiaomin Liang. I am grateful that
they allowed me to practice my teaching and assisted me during their brief time in the
Kroetz lab.
My time at UCSF was a section of my life that, while it was happening, I thought
could never possibly end, and now that it has, I look back and realize the years flew by in
the blink of an eye. This is due to those in San Francisco that shared life outside of lab
with me. Among these individuals are my fellow PSPG students; your intelligence and
work ethic always gave me a benchmark to strive toward. Also, the many people who
allowed me to relax by playing soccer with them, especially the members of Wakiza, Das
Foot and iSoccer; I will miss each and every one of them. A special thanks to Dr. Marcia
Campbell Scott, for listening and understanding about my endless lab stories, and her
husband “Uncle Andrew” for giving my husband an outlet for all things soccer so I didn’t
have to be it (and also for your casserole).
My graduate work was built upon other years of my life that was sculpted by
many special people. I would like to thank my parents Barb and Chris LaFond, who did
an excellent job teaching me that only hard work and perseverance will allow me to
succeed. I also appreciate their assumptions that I would complete anything I set out to
do, which gave me the confidence to actually do it. To my beautiful "sister" Jessica
Paulson, I appreciate being able to share the good and bad aspects of writing a thesis with
her and the never ending Disney related materials with which she has supplied me. Her
encouragement and support means the world to me. To my siblings Lynda, Lisa and
Chris, for their provision of reading materials and attempts to understand my research. To

viii
my family-in-law, Theresa and Jon Eclov, who understand the effort it takes to get an
advanced degree and always provide a stimulating conversation.
Finally I thank my intelligent husband, Neville Eclov; there are not words that will
adequately express my gratitude for his support and love. In addition to spending many
weekends in lab with me in order to keep me sane, he has always believed in my
capacities as a scientist. Also, I must express my appreciation to him as a sounding board
for my scientific thoughts and for his time spent diligently editing my thesis; without his
efforts my thesis would never have been completed. Finally, I need to thank him for not
giving up on me, or letting me give up, even though I have sat in my pajamas over the
past several months and taken every frustration out on him.
I would also like to acknowledge my financial support. These studies were funded
by the NIH grant GM61390, American Foundation for Pharmaceutical Education
Predoctoral fellowship, NIGMS Predoctoral Training Grant 2 T32 GM07175 and are part
of the Pharmacogenetics of Membrane Transporters project in the Pharmacogenetics
Research Network.

ix
Abstract
ABCG2 encodes for a multidrug efflux transporter called the mitoxantrone
resistance protein (MXR, BCRP) that mediates the efflux of substrates out of the cell and
is important in detoxification. The present study was focused on the expression and
function of MXR amino acid variants, activity of the ABCG2 promoter and promoter
variants, characterization of ABCG2 locus cis-regulatory elements and variant enhancers,
and examination of DNA methylation around ABCG2. MXR expression, localization and
activity were characterized using whole cells and inside-out vesicles. The Q141K variant
had reduced expression. MXR I206L had increased efflux of pheophorbide A and both
V12M and D620N had increased ATPase activity. The activity of ABCG2 regulatory
elements was tested in in vitro and in vivo luciferase assays. Two promoter SNPs
(rs76656413 and rs59370292) had decreased in vivo liver enhancer activity. Six regions
with in vivo liver enhancer activity and several enhancer SNPs (rs9999111, rs12508471,
rs72873421, rs149713212 and rs2725263) with altered activity in vivo were identified.
Association of these SNPs with ABCG2, PPM1K or PDK2 expression in different tissues
was detected. In vitro assays were used to identify nuclear receptor response elements.
The ABCG2 promoter responded to multiple nuclear receptor ligands, and the promoter
SNP rs66664036 had a significantly increased response to 17β-estradiol. Nine rifampin,
six 17β-estradiol and three dexamethasone responsive regions were identified. Enhancer
SNP rs12508471 had decreased response to 17β-estradiol and increased response to
dexamethasone, while rs573519157 had an increased and rs190754327 had a decreased
response to 17β-estradiol. Finally, methylation of CpG islands in the ABCG2 locus was
correlated with the expression of ABCG2 in human liver and kidney tissues. There was

x
no correlation of whole CpG island methylation with ABCG2 expression. However, a
CpG site within CpG4 correlated with ABCG2 expression in the kidney, and part or all of
select CpG islands had significantly lower methylation in liver than in kidney. The
genetic and epigenetic regulation of the ABCG2 gene locus described in this dissertation
may contribute to clinical variation in ABCG2 expression.

xi
TABLE OF CONTENTS
TITLE PAGE .............................................................................................................i
DEDICATION ...........................................................................................................iii
ACKNOWLEDGEMENTS .......................................................................................iv
ABSTRACT ...............................................................................................................ix
TABLE OF CONTENTS ...........................................................................................xi
LIST OF TABLES .....................................................................................................xvii
LIST OF FIGURES ...................................................................................................xviii
LIST OF EQUATIONS .............................................................................................xx
Chapter 1: Function and Regulation of the Mitoxantrone Resistance Protein
1.1 OVERVIEW ........................................................................................................1
1.2 INTRODUCTION ...............................................................................................2
1.3 THE MITOXANTRONE RESISTANCE PROTEIN .........................................4
1.3.1 Tissue Distribution .........................................................................................4 1.3.2 Localization....................................................................................................5 1.3.3 Structure .........................................................................................................6 1.3.4 Oligomerization .............................................................................................7
1.4 THERAPEUTIC SUBSTRATES OF MXR ........................................................8
1.4.1 Anthracenes and Topoisomerase Inhibitors ..................................................8 1.4.2 Antimetabolites ..............................................................................................9 1.4.3 Anthracyclines................................................................................................10 1.4.4 Camptothecin Analogues ...............................................................................11 1.4.5 Kinase Inhibitors ............................................................................................12 1.4.6 Statins .............................................................................................................13 1.4.7 Antiretrovirals ................................................................................................14 1.4.8 Antibiotics ......................................................................................................14 1.4.9 Other Therapeutic Drugs ...............................................................................15
1.5 NATURAL SUBSTRATES OF MXR ................................................................17
1.5.1 Porphyrins......................................................................................................17 1.5.2 Carcinogens ...................................................................................................18 1.5.3 Flavonoids......................................................................................................19 1.5.4 Hormones .......................................................................................................20 1.5.5 Dyes and Fluorescent Compounds ................................................................21 1.5.6 Other Natural ................................................................................................21
1.6 MXR INHIBITORS .............................................................................................23
1.6.1 Prototypical MXR Inhibitors..........................................................................24 1.6.2 Hormones .......................................................................................................25

xii
1.6.3 Tyrosine Kinase Inhibitors .............................................................................26 1.6.4 Natural Inhibitors ..........................................................................................27
1.7 PHYSIOLOGICAL FUNCTION OF MXR ........................................................29
1.7.1 Distribution of Dietary Compounds...............................................................29 1.7.2 Tissue Defense ...............................................................................................30 1.7.3 Phototoxicity ..................................................................................................30
1.8 MXR VARIANTS ...............................................................................................31
1.8.1 V12M ..............................................................................................................32 1.8.2 Q141K ............................................................................................................32 1.8.3 R482 Mutations ..............................................................................................34
1.9 ABCG2 MRNA ...................................................................................................36 1.9.1 mRNA Variability ...........................................................................................36 1.9.2 Splice Variants ...............................................................................................38
1.10 ABCG2 AND ITS REGULATION ...................................................................38
1.10.1 Promoter ......................................................................................................39 1.10.2 Methylation ..................................................................................................40
1.11 NUCLEAR RECEPTORS .................................................................................41
1.11.1 Estrogen Receptor ........................................................................................43 1.11.2 Glucocorticoid Receptor ..............................................................................44 1.11.3 Retinoid X Receptor .....................................................................................46 1.11.4 Pregnane X Receptor ...................................................................................46 1.11.5 Farnesoid and Liver X Receptors ................................................................47 1.11.6 Aryl Hydrocarbon Receptor .........................................................................48 1.11.7 COUP-TFII ..................................................................................................48
1.12 SUMMARY .......................................................................................................49
1.13 FOCUS OF THESIS ..........................................................................................50
1.13.1 Rational ........................................................................................................50 1.13.2 Hypotheses ...................................................................................................50 1.13.3 Specific Aims ................................................................................................51
1.14 REFERENCES ..................................................................................................52
Chapter 2: Functional Characterization of MXR Variants
2.1 ABSTRACT .........................................................................................................96
2.2 INTRODUCTION ...............................................................................................97
2.3 MATERIALS AND METHODS .........................................................................100
2.3.1 Chemicals and Materials ...............................................................................100 2.3.2 Genetic Analysis of ABCG2 Coding Region ..................................................102 2.3.3 Cloning of MXR and Site Directed Mutagenesis for MXR Variant Plasmids ....103 2.3.4 Cell Culture ....................................................................................................105

xiii
2.3.5 Transient Transfection of MCF-7 Cells .........................................................105 2.3.6 Creation of Stable HEK293 Flp-in Cells .......................................................106 2.3.7 Protein and mRNA Extraction from Cells .....................................................107 2.3.8 MXR Immunoblots .........................................................................................108 2.3.9 Flow Cytometry ..............................................................................................109 2.3.10 Immunocytochemistry ..................................................................................111 2.3.11 qRT-PCR ......................................................................................................111 2.3.12 Vesicle Isolation ...........................................................................................112 2.3.13 Vanadate Sensitive ATPase Assay ...............................................................113 2.3.14 H+/ATPase Assay .........................................................................................114 2.3.15 Vesicle Uptake Assay ...................................................................................115 2.3.16 Statistics .......................................................................................................116
2.4 RESULTS ............................................................................................................117
2.4.1 Nonsynonymous Variants of MXR in the SOPHIE Cohort ............................117 2.4.2 Expression and Function of MXR Variants in Transiently Transfected MCF-7s.................................................................................................................................120 2.4.3 Generation of Stably Transfected MXR Variant Cell Lines...........................126 2.4.4 Expression and Localization of MXR Variants ..............................................126 2.4.5 Transport Activity of MXR Vesicles ...............................................................136 2.4.6 Substrate Uptake by MXR Vesicles ................................................................141
2.5 DISCUSSION ......................................................................................................143
2.6 CONCLUSION ....................................................................................................149
2.7 REFERENCES ....................................................................................................150
Chapter 3: Functional Characterization of the ABCG2 Promoter and its Genetic Variants
3.1 ABSTRACT .........................................................................................................164
3.2 INTRODUCTION ...............................................................................................165
3.3 MATERIALS AND METHODS .........................................................................170
3.3.1 Chemicals and Materials ...............................................................................170 3.3.2 ABCG2 Promoter Plasmid Construction .......................................................172 3.3.3 Genetic Analysis of ABCG2 Promoter Region ..............................................174 3.3.4 Site-Directed Mutagenesis .............................................................................175 3.3.5 Deletion Mutagenesis PCR Amplification .....................................................177 3.3.6 Cell Culture ....................................................................................................178 3.3.7 Transient Transfection ...................................................................................178 3.3.8 Luciferase Reporter Assay .............................................................................179 3.3.9 Hydrodynamic Tail Vein Assay ......................................................................180 3.3.10 Predictions of Transcription Factor Binding Site Changes ........................181 3.3.11 Statistical Analysis .......................................................................................182
3.4 RESULTS ............................................................................................................182
3.4.1 Genetic Polymorphisms of the ABCG2 Promoter .........................................182
xiv
3.4.2 Basal Activity of the ABCG2 Promoter In Vitro ............................................184 3.4.3 Effect of SNPs on Basal ABCG2 Promoter Activity In Vitro .........................186 3.4.4 Effect of SNPs on Basal ABCG2 Promoter Activity In Vivo ..........................189 3.4.5 Effect of SNPs on Predicted Binding of TFs in the ABCG2 Promoter ..........191
3.5 DISCUSSION ......................................................................................................194
3.6 CONCLUSIONS..................................................................................................198
3.7 REFERENCES ....................................................................................................199
Chapter 4: Identification and Characterization of ABCG2 Regulatory Regions
4.1 ABSTRACT .........................................................................................................208
4.2 INTRODUCTION ...............................................................................................209
4.3 MATERIALS AND METHODS .........................................................................213
4.3.1 Chemicals and Materials ...............................................................................213 4.3.2 In Silico Analysis of the ABCG2 Locus to Identify Putative Regulatory Elements ...............................................................................................................................215
4.3.3 Ranking of Putative Regulatory Elements .....................................................216 4.3.4 Primer Design ................................................................................................217 4.3.5 Cloning of Putative Regulatory Elements ......................................................220 4.3.6 Cell Culture ....................................................................................................222 4.3.7 Transient Transfections .................................................................................222 4.3.8 Luciferase Assay ............................................................................................224 4.3.9 Hydrodynamic Tail Vein Injection .................................................................224 4.3.10 Data Mining and Retrieval from ENCODE .................................................225 4.3.11 Statistical Analysis .......................................................................................226
4.4 RESULTS ............................................................................................................227
4.4.1 Identification of High Priority Putative Enhancer Elements .........................227 4.4.2 System Controls .............................................................................................233 4.4.3 In Vitro Enhancers .........................................................................................235 4.4.4 In Vitro Suppressors ......................................................................................242 4.4.5 In Vivo Enhancers ..........................................................................................244 4.4.6 Predicted Functional Elements of the In Vivo Enhancers .............................246
4.5 DISCUSSION ......................................................................................................256
4.6 CONCLUSIONS..................................................................................................265
4.7 REFERENCES ....................................................................................................266
Chapter 5: Effect of SNPS on ABCG2 Locus Enhancer Regions
5.1 ABSTRACT .........................................................................................................277
5.2 INTRODUCTION ...............................................................................................278
5.3 MATERIALS AND METHODS .........................................................................281

xv
5.3.1 Chemicals and Materials ...............................................................................281 5.3.2 Genetic Analysis of Enhancer Regions ..........................................................282 5.3.3 Primer Design ................................................................................................283 5.3.4 Variant Enhancer Plasmid Construction .......................................................289 5.3.5 Deletion Mutagenesis PCR Amplification .....................................................290 5.3.6 Cell Culture ....................................................................................................290 5.3.7 Transient Transfection ...................................................................................291 5.3.8 Luciferase Reporter Assay .............................................................................291 5.3.9 Hydrodynamic Tail Vein Assay ......................................................................292 5.3.10 Predictions of Transcription Factor Binding Site Changes ........................293 5.3.11 Liver and Kidney Tissues .............................................................................294 5.3.12 ABCG2 mRNA Expression and Genotype in PMT Liver and Kidney Tissues.................................................................................................................................295 5.3.13 Association of SNPs with Gene Expression .................................................296 5.3.14 Statistical Analysis .......................................................................................297
5.4 RESULTS ............................................................................................................297
5.4.1 Genetic Variation in the ABCG2 Locus Enhancer Regions ..........................297 5.4.2 Effect of SNPs on ECR44 In Vitro Activity ....................................................305 5.4.3 Effect of SNPs on ECR400 In Vitro Activity ..................................................307 5.4.4 Effect of SNPs on ECR423 In Vitro Activity ..................................................309 5.4.5 Effect of SNPs on CR6 In Vitro Activity .........................................................311 5.4.6 Effect of SNPs on ECR31 In Vitro Activity ....................................................313 5.4.7 Effect of SNPs on ECR33 In Vitro Activity ....................................................315 5.4.8 Effect of SNPs on Enhancer Activity In Vivo .................................................317 5.4.9 Associations of SNPs with mRNA Expression Levels ....................................319 5.4.10 Predicted Alterations in TFBS by SNPs.......................................................326
5.5 DISCUSSION ......................................................................................................331
5.6 CONCLUSIONS..................................................................................................338
5.7 REFERENCES ....................................................................................................339
Chapter 6: Characterization of Inducible Regulatory Elements of the ABCG2
Locus
6.1 ABSTRACT .........................................................................................................347
6.2 INTRODUCTION ...............................................................................................347
6.3 MATERIALS AND METHODS .........................................................................352
6.3.1 Chemicals and Materials ...............................................................................352 6.3.2 Computational Predictions of Nuclear Response Elements ..........................353 6.3.3 Cell Culture ....................................................................................................357 6.3.4 Transient Transfections .................................................................................357 6.3.5 Rifampin Induction.........................................................................................359 6.3.6 17β-estradiol Exposure ..................................................................................359 6.3.7 Aryl Hydrocarbon Receptor Induction ..........................................................360

xvi
6.3.8 Dexamethasone Induction ..............................................................................361 6.3.9 Luciferase Assay ............................................................................................361 6.3.10 Statistical Analysis .......................................................................................362
6.4 RESULTS ............................................................................................................363
6.4.1 Predicted Nuclear Response Elements ..........................................................363 6.4.2 System Controls .............................................................................................363 6.4.3 Rifampin Induction.........................................................................................366 6.4.4 Estrogen Receptor Mediated Induction .........................................................367 6.4.5 Glucocorticoid Receptor Mediated Induction ...............................................373 6.4.6 Aryl Hydrocarbon Receptor Mediated Induction ..........................................375 6.4.7 Accuracy of NRE and HRE Predictions .........................................................376
6.5 DISCUSSION ......................................................................................................378
6.6 CONCLUSIONS..................................................................................................383
6.7 REFERENCES ....................................................................................................385
Chapter 7: DNA Methylation in the ABCG2 Gene Locus
7.1 ABSTRACT .........................................................................................................396
7.2 INTRODUCTION ...............................................................................................396
7.3 MATERIALS AND METHODS .........................................................................403
7.3.1 Chemicals and Materials ...............................................................................403 7.3.2 In Silico CpG Island Prediction .....................................................................403 7.3.3 Liver and Kidney Tissues ...............................................................................404 7.3.4 ABCG2 mRNA Expression in PMT Liver and Kidney Tissues ......................405 7.3.5 Pyrosequencing Primer Design .....................................................................406 7.3.6 Pyrosequencing ..............................................................................................408 7.3.7 Statistical Analysis .........................................................................................409
7.4 RESULTS ............................................................................................................410
7.4.1 ABCG2 Expression in PMT Liver and Kidney Tissues ..................................410 7.4.2 CpG Island Prediction ...................................................................................412 7.4.3 Methylation of CpG4......................................................................................414 7.4.4 Methylation of CpG6......................................................................................420
7.5 DISCUSSION ......................................................................................................425
7.6 CONCLUSION ....................................................................................................427
7.7 REFERENCES ....................................................................................................428
Chapter 8: Summary and Conclusion
8.1 SUMMARY .........................................................................................................435
8.2 REFERENCES ....................................................................................................440

xvii
LIST OF TABLES Table 1.1. Therapeutic Substrates of MXR ................................................................16 Table 1.2. Natural Substrates of MXR .......................................................................23 Table 1.3. MXR Inhibitors .........................................................................................28 Table 1.4. Nonsynonymous Variants of MXR ............................................................35 Table 2.1. Cloning and SDM Primers for MXR Variants ..........................................104 Table 2.2. Sequencing Primers for MXR pcDNA5/FRT ............................................105 Table 2.3. MXR Nonsynonymous Variants from the SOPHIE Cohort ......................119 Table 3.1. ABCG2 Site-Directed Mutagenesis Primers .............................................176 Table 3.2. ABCG2 Promoter SNPs ............................................................................183 Table 3.3. ABCG2 Promoter Variants In Vitro and In Vivo Activity ........................191 Table 4.1. TRANSFAC TFBS Matrices Used in Cister Plot Analysis .......................216 Table 4.2. High Priority Transcription Factors ........................................................217 Table 4.3. Cloning Primers for Putative Enhancer Regions .....................................218 Table 4.4. Sequencing Primers for Putative Regulatory Elements ............................220 Table 4.5. High Priority Putative Enhancer Regions ................................................231 Table 5.1. ECR44 Site-Directed Mutagenesis Primers .............................................284 Table 5.2. ECR400 Site-Directed Mutagenesis Primers ...........................................284 Table 5.3. ECR423 Site-Directed Mutagenesis Primers ...........................................285 Table 5.4. CR6 Site-Directed Mutagenesis Primers ..................................................286 Table 5.5. ECR31 Site-Directed Mutagenesis Primers .............................................287 Table 5.6. ECR33 Site-Directed Mutagenesis Primers .............................................288 Table 5.7. SNPs in the ECR44 Enhancer ...................................................................299 Table 5.8. SNPs in the ECR400 Enhancer .................................................................299 Table 5.9. SNPs in the ECR423 Enhancer .................................................................300 Table 5.10. SNPs in the CR6 Enhancer .....................................................................301 Table 5.11. SNPs in the ECR31 Enhancer .................................................................302 Table 5.12. SNPs in the ECR33 Enhancer .................................................................303 Table 6.1. Nuclear Response Elements in ECRs ........................................................356 Table 6.2. Response of ABCG2 Locus Regulatory Regions to Xenobiotic Treatment ..377 Table 7.1. Pyrosequencing Primers for CpG Island 4...............................................407 Table 7.2. Pyrosequencing Primers for CpG Island 6...............................................408 Table 7.3. Characteristics of the CpG Islands in the ABCG2 Locus .........................413

xviii
LIST OF FIGURES Figure 1.1 Structure of the MXR protein. ..................................................................7
Figure 1.2 Expression profile of ABCG2 mRNA in human tissues ..........................37
Figure 1.3. Orientation of the ABCG2 locus and MXR protein.................................39
Figure 2.1. Expression levels of MXR in transiently transfected MCF-7 cells .........121
Figure 2.2. Efflux of mitoxantrone, pheophorbide A and doxorubicin in MXR and pcDNA5/FRT transfected MCF-7 cells .....................................................................122
Figure 2.3. Inhibition of MXR mediated mitoxantrone efflux in transiently transfected MCF-7 cells ...............................................................................................................123
Figure 2.4. Inhibition of MXR mediated pheophorbide A efflux in transiently transfected MCF-7 cells .............................................................................................124
Figure 2.5. Box and whisker plot of MXR inhibitable efflux ....................................125
Figure 2.6. Expression of ABCG2 mRNA in stably transfected cell lines ................127
Figure 2.7. Expression levels of MXR in stably transfected HEK293 Flp-in cells ...128
Figure 2.8. Cell surface expression of MXR in stable cell lines ................................129
Figure 2.9. Expression levels of MXR in vesicles. ....................................................131
Figure 2.10. Localization of MXR variants in stably transfected HEK293 Flp-in cells at 10X magnification .....................................................................................................133
Figure 2.11. Localization of MXR variants in stably transfected HEK293 Flp-in cells at 40X magnification .....................................................................................................135
Figure 2.12. Localization of MXR in HEK293 Flp-in cells stably transfected with empty pcDNA5/FRT vector .......................................................................................135
Figure 2.13. Vesicle dual H+-ATPase activity assay controls ...................................137
Figure 2.14. Dual H+-ATPase activity of MXR expressing vesicles .........................139
Figure 2.15. Vanadate sensitive ATPase activity of MXR vesicles ..........................140
Figure 2.16. Time dependent uptake of fluorescent drugs into inside-out vesicles ...142
Figure 3.1. Schematic of ABCG2 promoter region ....................................................170
Figure 3.2. Schematic of mutagenesis protocol for large deletion or insertion polymorphisms ...........................................................................................................177
Figure 3.3. Basal ABCG2 promoter activity in vitro .................................................185
Figure 3.4. Effect of promoter variants in vitro .........................................................187
Figure 3.5. Effect of promoter variants in vivo ..........................................................190
Figure 3.6. Predicted TFBS for rs76656413 ..............................................................192
Figure 3.7. Predicted TFBS for rs59370292 ..............................................................193

xix
Figure 4.1. Pipeline to identify and characterize ABCG2 regulatory elements .........213
Figure 4.2. Snapshot from ABCG2 locus illustrating representative results from bioinformatic analyses ...............................................................................................230
Figure 4.3. Genomic representation of 30 high priority putative ABCG2 enhancer regions ........................................................................................................................232
Figure 4.4. System controls for the in vitro and in vivo luciferase enhancer assay ...234
Figure 4.5. Activity of putative enhancer elements in HEK293T cells .....................238
Figure 4.6. Activity of putative enhancer elements in HepG2 cells ..........................239
Figure 4.7. Activity of putative enhancer elements in HCT116 cells ........................240
Figure 4.8. Activity of putative enhancer elements in MCF-7 cells ..........................241
Figure 4.9. Activity of putative suppressor elements in vitro ....................................243
Figure 4.10. Schematic of the in vivo hydrodynamic tail vein injection assay ..........245
Figure 4.11. In vivo liver enhancer activity in mice ..................................................246
Figure 4.12. ENCODE data in ECR400 ....................................................................249
Figure 4.13. ENCODE data in CR6 ...........................................................................250
Figure 4.14. ENCODE data in ECR31 ......................................................................251
Figure 4.15. ENCODE data in ECR33 ......................................................................252
Figure 4.16. ENCODE data in ECR44 ......................................................................254
Figure 4.17. ENCODE data in ECR423 ....................................................................255
Figure 5.1. Linkage disequilibrium plots of SNPs in ABCG2 locus enhancers .........304
Figure 5.2. Effect of ECR44 genetic variants in vitro ...............................................306
Figure 5.3. Effect of ECR400 genetic variants in vitro .............................................308
Figure 5.4. Effect of ECR423 genetic variants in vitro .............................................310
Figure 5.5. Effect of CR6 genetic variants in vitro ....................................................312
Figure 5.6. Effect of ECR31 genetic variants in vitro ...............................................314
Figure 5.7. Effect of ECR33 genetic variants in vitro ...............................................316
Figure 5.8. In vivo liver enhancer activity of ABCG2 locus region variants .............318
Figure 5.9. Association of rs9999111 with ABCG2 expression ................................322
Figure 5.10. Association of rs12500008 with gene expression .................................323
Figure 5.11. Association of rs2725263 with PPM1K and PKD2 expression ............324
Figure 5.12. Association of rs2725264 with PKD2 liver expression ........................325
Figure 5.13. Predicted TFBS changes for ECR44 rs9999111 ...................................327

xx
Figure 5.14. Predicted TFBS changes for ECR400 rs72873421 ...............................328
Figure 5.15. Predicted TFBS changes for ECR400 rs12508471 ...............................329
Figure 5.16. Predicted TFBS changes for ECR423 rs149713212 .............................330
Figure 5.17. Predicted TFBS changes for ECR31 rs2725263 ...................................331
Figure 6.1. System controls for in vitro nuclear response element assays ................365
Figure 6.2. Effect of rifampin treatment on enhancer activity ...................................367
Figure 6.3. Effect of 17β-estradiol treatment on promoter and enhancer activity .....369
Figure 6.4. Effect of 17β-estradiol treatment on reference and variant promoter activity....................................................................................................................................370
Figure 6.5. Effect of 17β-estradiol treatment on reference and variant CR6 enhancer activity........................................................................................................................371
Figure 6.6. Effect of 17β-estradiol treatment on reference and variant ECR400 enhancer activity........................................................................................................................372
Figure 6.7. Effect of 24 hour dexamethasone treatment on selected reference and variant enhancers’ and suppressors’ activities ...........................................................374
Figure 6.8. Effect of 24 hour benzo[a]pyrene treatment on selected enhancers and promoter activities .....................................................................................................375
Figure 7.1. Schematic of CpG islands in the ABCG2 locus.......................................401
Figure 7.2. Bisulfite conversion of cytosine to uracil ................................................402
Figure 7.3. Expression profile of ABCG2 mRNA in human tissues .........................411
Figure 7.4. Representative program traces obtained by pyrosequencing ..................415
Figure 7.5. Box and whisker plots for range of CpG4 methylation per CpG site .....416
Figure 7.6. Box and whisker plots for range of CpG4 methylation per tissue ..........417
Figure 7.7. Scatter plot of methylation analyses for sections of CpG4 .....................418
Figure 7.8. Correlation of CpG4 island CpG site 77 methylation with ABCG2 expression in kidney ..................................................................................................419
Figure 7.9. Box and whisker plots for range of CpG6 methylation per CpG site .....421
Figure 7.10. Box and whisker plots for range of CpG6 methylation per tissue ........422
Figure 7.11. Scatter plot of methylation analyses for CpG6 ......................................423
Figure 7.12. Correlation of CpG6 island methylation with ABCG2 expression in kidney and liver .....................................................................................................................424
LIST OF EQUATIONS
Equation 2.1. Inhibitable Efflux .................................................................................117

1
Chapter 1 : Function and Regulation of the Mitoxantrone Resistance Protein
1.1 Overview
The mitoxantrone resistance protein (MXR; BCRP; ABCG2), referred to here as
MXR, is an efflux transporter expressed apically in several tissues with a broad range of
both exogenous and endogenous substrates. The transport activity, tissue distribution and
specific cellular localization of MXR suggest that it plays a pivotal role in endogenous
substrate disposition as well as the protection and detoxification of the body from
xenobiotics. Overexpression of MXR is associated with drug resistance to a variety of
anticancer drugs, and its expression has been linked with decreased disease-free survival
in several different cancers. An individual’s susceptibility to certain drug-induced side
effects has also been linked to MXR expression or nonsynonymous single nucleotide
polymorphisms (SNPs) in the MXR gene ABCG2. Initial reports on common ABCG2
SNPs suggest that amino acid altering SNPs have significant effects on substrate
selectivity, transport function, expression and localization. However, these SNP-
associated changes in MXR function do not account for all of the variation in MXR
expression or the pharmacokinetic and pharmacodynamic properties of MXR substrates.
The details of ABCG2 regulation are not well known, but the evidence is accumulating
for regulation by methylation, transcription factors and nuclear receptors. Here, we
discuss the current literature on the different mechanisms which alter MXR expression
and function.
2
1.2 Introduction
Both drug metabolizing enzymes and transporters contribute to drug distribution,
elimination, response and toxicity. The ATP-binding cassette (ABC) transporters
comprise a superfamily of membrane transporter proteins that utilize the energy from
ATP hydrolysis to translocate substrates, against their concentration gradient, across both
extra- and intracellular membranes1. These membrane bound proteins are responsible for
the biological distribution of both endogenous and exogenous compounds. The ABC
transporters represent one of the largest families of transporters, with seven highly
diverse families (ABCA to ABCG)1. The importance of these membrane transporters in
drug disposition is evident from the recently published guidelines on drug transporters2.
The efficacy of cancer therapy is often limited by the development of drug
resistance by cancer cells. One method of resistance is attributed to efflux membrane
transporters, which become upregulated and efflux chemotherapeutics from the cancer
cell, thus conferring cancer cell resistance by reducing the internal concentration of the
drug. One of the main efflux transporters indicated in multidrug resistance during
chemotherapy is the mitoxantrone resistance protein (MXR)3. MXR is a high capacity
transporter that recognizes a wide variety of substrates, including chemotherapeutics
ranging from anthracenes to kinase inhibitors4. Since the expression of MXR can lead to
drug resistance, MXR is a prognostic factor in both hematopoietic and solid cancers, as
well as an indicator for possible drug toxicity3.
There are multiple nonsynonymous variants of MXR, many of which are rare;
MXR is a highly polymorphic transporter with over 80 single nucleotide polymorphisms
(SNPs) in its gene, ABCG25–11. The transport functions of the common nonsynonymous
3
variants and many unnatural variants of MXR have been investigated12. Due to
difficulties in monitoring the transport efficacy of an efflux transporter, these reports are
often limited to one variant against several substrates or one substrate for several variants.
However, since MXR has multiple binding regions for substrate interactions, several
nonsynonymous variants have been shown to possess altered substrate specificity and
activity13. This indicates that each variant should be screened against whole panels of
MXR substrates to determine if there are any differences in its transport capabilities.
There are many assays being utilized for the characterization of MXR variants, and these
tools must continue to be optimized and utilized so that future generations of therapeutics
may be screened14.
Although nonsynonymous variants of MXR have been shown to alter MXR
function, and possibly substrate specificity, their frequency does not account for all the
reported variability in MXR expression, as individuals with reference MXR still have
variability in expression15. Therefore, in order to effectively evade multidrug resistance,
we must understand the mechanisms that regulate the expression of the gene that codes
for MXR, ABCG2. Recent research has highlighted the role of the ABCG2 promoter and
its hypomethylation in the regulation of MXR expression16. However, there is growing
evidence for additional regulation of ABCG2, including that of alternate promoters,
enhancers and nuclear receptor (NR) response elements16.
By understanding both drug-drug interactions and underlying DNA differences
that alter the expression or function of a drug response protein, we could predict drug
toxicity and efficacy, bringing us closer to personalized medicine17,18. Here, we describe
the current literature regarding MXR and ABCG2 regulation, including the MXR protein

4
itself, MXR substrates and inhibitors, the nonsynonymous variants of MXR, and
regulation of ABCG2 via DNA methylation and its promoter, enhancers and NRs.
1.3 The Mitoxantrone Resistance Protein
The mitoxantrone resistance protein (MXR) is a 75 kDa membrane transporter
first isolated from a mitoxantrone resistant human colon carcinoma cell line19,20. It was
independently isolated from a doxorubicin resistant human breast cancer cell line (MCF-
7 AdVp) and named the breast cancer resistance protein (BCRP)21. Shortly thereafter, the
protein was isolated from placental tissue and named the ABC transporter of the placenta
(ABCP)22. MXR transport is unidirectional, and since it localizes to the plasma
membrane, it transports substrates from the cytoplasm out of the cell. Since its discovery,
MXR has been shown to transport numerous endogenous and exogenous substrates, thus
becoming a major player in clinical studies of the pharmacokinetics of its substrates.
1.3.1 Tissue Distribution
MXR is expressed in many tissues and protects the body from natural dietary
toxins and carcinogens. Expression of MXR has been reported in the intestinal and colon
epithelium21,23–25, where it effluxes substrates out of the epithelium cell and back into the
lumen, limiting the absorption of MXR substrates. It is also highly expressed in the bile
canalicular membrane of hepatocytes21,23–25, where it transports substrates and many of
their conjugates into the bile, increasing their elimination from the body. MXR is
expressed at lower levels in the renal cortex tubules21,24,25, where it mediates the excretion
of substrates into the urine. MXR is expressed in the ducts and lobules of the breast23,

5
where it effluxes nutrients, toxins, carcinogens or drugs from the circulation into milk. It
is expressed in the placental syncytiotrophoblasts21–28, where it works to protect the fetus
from endogenous hormones and toxins by moving substrates in the fetal circulation to the
maternal circulation26. MXR is also present in the endothelium of veins and capillaries,
most importantly at the blood-brain barrier where it keeps its substrates from penetrating
into the brain23,25,29. Finally, MXR is expressed in the side population of hematopoietic
stem cells; it has been proposed that its role there is the protection of the progenitor
cells30–32.
1.3.2 Localization
MXR is a plasma membrane protein and is generally not expressed on other
intracellular membranes33. This allows MXR to efflux its substrates out of the cell. There
have been reports of MXR having altered cellular localization in times of nutrient
deprivation, such as low folate, when it then relocates to vesicle membranes under the
assumption it helps to sequester nutrients in these vesicles34. MXR has apical localization
in the epithelium of the small intestine and colon and the liver bile canaliculi, indicating a
role of MXR in systemic exposure through the regulation of digestive uptake, thus
secreting substances into the bile for their elimination and preventing substrates from
entering circulation from the gut23. MXR is also localized to the apical side of most breast
ducts and lobules, where it moves substrates into the milk23. Finally, MXR has mainly
apical localization in placental syncytiotrophoblasts23, with one report of some
cytoplasmic staining in these cells24, where it moves substrates into the maternal
circulation.

6
1.3.3 Structure
MXR and related ABCG subfamily members are half-transporters consisting of
one nucleotide binding domain (NBD) and a membrane spanning domain (MSD) that
consists of six transmembrane (TM) α-helices35,36. Compared to other ABC transporters,
the orientation of the MXR NBD and MSD is reversed. The NBD is at the amino-
terminal end of the protein, including an intracellular stretch that has the ATP binding
site (Walker A and B motifs) and the C signature motif of ABC transporter, before the
MSD and finally the acid terminal end of the protein (see Figure 1.1)37. The NBD
stretches from residues 1-396, and the MSD from residues 397-65537. There is a N-
glycosylation site at Asp590 in the extracellular loop connecting TM5 with TM638, and
the Cys603 amino acid, also in this loop, is responsible for disulfide bond formation
between MXR oligomers39. The Arg363 and T402-G410 residues are relevant for correct
biogenesis, folding and membrane insertion of the MXR protein40,41. Additionally, the
R482 amino acid is critical in substrate interaction42.

7
Figure 1.1 Structure of the MXR transporter. A schematic representation of MXR
membrane organization with nonsynonymous variant locations indicated. Figure was
obtained from Polgar and Bates43 with additional variants added.
1.3.4 Oligomerization
The MXR protein is unique among the multidrug resistant transporters because it
is a half transporter and needs to form oligomers in order to create a functional unit. The
MXR protein migrates on a gel as a monomer at ~70-75 kDa under reducing conditions
and as a dimer at 140-180 kDa (depending on glycosylation and other modifications)
under non-reducing conditions44,45. However, in human cells the minimal stable
functional unit of MXR is a homotetramer, and it has potential to have higher forms of
oligomerization, including as a homo-dodecamer44. Cys603 is responsible for disulfide

8
bond formation between MXR oligomers39. However, the formation of intra-molecular
disulfide bonds between MXR proteins is not necessary for activity and transport
function3. The formation of higher order oligomers of MXR would provide multiple
binding sites and flexibility in the protein’s recognition of substrates. Multiple homology
modeling and structural analysis help to elucidate the structure of MXR in vivo37;
however, additional structural data are needed to confirm the current two dimensional
structure predictions and make a three dimensional map of the functional transporter.
1.4 Therapeutic Substrates of MXR
The MXR protein is extremely flexible in its substrate recognition. Ongoing
functional characterization of the transporter adds to the list of MXR substrates, which
includes a broad spectrum of synthetic and endogenous compounds3,37. The substrate
specificity of MXR overlaps with that of other multidrug transporters, and it has been
suggested that the dual role of these transporters assists in synergistic protection of the
body and its organs1,46. MXR was first discovered in cellular resistance to
chemotherapeutic agents; since then many classes of chemotherapeutics have been tested
in cytotoxicity assays and identified as MXR substrates. Additionally, a number of other
non-chemotherapeutic compounds such as statins, antiretrovirals and antibiotics have
been shown to be transported by MXR (see Table 1.1).
1.4.1 Anthracenes and Topoisomerase Inhibitors
The ability of many anticancer agents to elicit their cytotoxic effects depends on
intracellular access of the drug. The overexpression of efflux transporters, such as MXR,

9
leads to reduced intracellular accumulation of anticancer agents and drug resistance.
Mitoxantrone is an anthracenedione anticancer agent47 used in combination therapies to
treat prostate and breast cancers and multiple sclerosis48–50. Resistance to mitoxantrone is
a hallmark of MXR overexpressing cell lines19,20,33,51–57. Mitoxantrone stimulates MXR
ATPase activity58, but direct kinetics for this compound have not been reported. The
anthracene derivative bisantrene also shows reduced accumulation in MXR expressing
cell lines20. Additionally, cells resistant to mitoxantrone exhibit cross-resistance to other
topoisomerase inhibitors including etoposide51,57,59, GV19677160, indolocarbazole61,
becatecarin62, NB-506 and J-10708863.
1.4.2 Antimetabolites
Many antimetabolites, which are chemotherapeutic agents that interfere with
rapidly dividing cells, are also MXR substrates. The most well-characterized
antimetabolite substrate of MXR is methotrexate (MTX). Methorexate is an antifolate
that competitively inhibits the dihydrofolate reductase enzyme, making it an effective
agent to treat many types of cancers and rheumatoid arthritis64. The ability for MXR to
transport MTX was first identified in cell lines that overexpressed MXR and had
resistance to MTX57,65. MTX is a high capacity, low affinity substrate of MXR with
reported Km values of 0.68 – 1.3 mM55,64,66. MXR also transports MTX diglutamates and
triglutamates, but it cannot transport MTX with more than three glutamates55,64,66.
Another metabolite of MTX, 7-hydroxy-methotrexate is also transported by MXR55.
Although MXR can transport MTX and folic acid55, it cannot transport the
reduced folate leucovorin66. Interestingly, most lipophilic antifolates are much better

10
substrates of the mutant G482 MXR67, but MTX transport is specific to reference R482
MXR68. Other antifolates such as GW1843, tomudex, pyrimethamine and trimethrexate
are also substrates of MXR67,69. Other antimetabolites can be transported by MXR,
including pyrimidine analogs like 5-fluorouracil57 and multiple purine analogs such as
clofarabine, fludarabine, 6-mercaptopurine and 6-mercaptopurine riboside70.
Additionally, nucleotide and nucleoside analogs are MXR substrates, specifically
CdAMP and cladribine70. Considering the wide breadth of antimetabolites that are MXR
substrates, emerging antimetabolite therapies should be screened through MXR substrate
assays.
1.4.3 Anthracyclines
The MCF-7 AdVp cell line overexpresses MXR and accumulates the
anthracycline daunorubicin (daunomycin) to a lesser extent than the parental cell line20.
Additionally, both daunorubicin and doxorubicin were shown to stimulate MXR ATPase
activity58. However, these cells harbor a R482G/T variant MXR protein, and reference
MXR is not capable of transporting daunorubicin71,72. The MCF-7 AdVp cells are also
cross-resistant to doxorubicin51, epirubicin56,71 and pirarubicin57. The transport of many
anthracyclines is attributed to the R482G/T mutation in MXR, including idarubicin71. The
R482G/T MXR variant is not found in humans, but these data provide information
regarding the determinants of MXR substrate specificity.
11
1.4.4 Camptothecin Analogues
Camptothecin is an anticancer agent that works through inhibition of DNA
topoisomerase I and its derivative irinotecan, a cytotoxic camptothecin whose active
metabolite is SN-38, a commonly used anti-cancer agent for treatment of colorectal, lung
and gastric tumors73. Although camptothecin itself is not transported by MXR74, many of
its derivatives, including irinotecan (CPT-11)75–77, the irinotecan active metabolite SN-38
(7-ethyl-10-hydroxycamptothecin)54,56,74–78, SN-38 glucuronide76,78, topotecan20,33,52–
54,56,74,75,79, 9-aminocamptothecin52,56,74,75,80, homocamptothecin77 and diflomotecan77,81,
are MXR substrates. Thus, overexpression of MXR causes cancer cell line resistance to
SN-38 and irinotecan82,83. The structural comparison of camptothecin analogues
transported by MXR has given insight into key features of MXR substrates. Since
irinotecan analogues with a hydroxyl group at position 10 or 11 of their A ring are good
substrates for MXR, hydrogen bond formation is considered to be involved in substrate
recognition and/or transport84. Additionally, negative potential at position 10 or 11 of the
A ring85 and a polar group at position 9 or 1080 are both important for substrate
recognition by MXR. Continued elucidation of the structural features of MXR substrates
will inform the development of anticancer agents with lower potential for drug resistance.
Although camptothecin derivatives are effective anticancer agents, they are often
accompanied by side effects; these side effects have been linked to several efflux drug
transporters including MXR73. In MXR knockout mice, topotecan plasma levels are
increased and milk accumulation is decreased relative to reference86. Elacridar
(GF120918), a non-selective inhibitor of ABC transporters, increases plasma topotecan
levels and increases fetal topotecan exposure, demonstrating the potential for clinically

12
significant drug-drug interactions involving MXR79. In human studies, decreased
function ABCG2 alleles have been associated with irinotecan induced neutropenia87,88,
oral bioavailability of topotecan89 and diflomotecan81, and extensive plasma
accumulation of SN-38 and its glucuronide90. The development of campthothecin
derivatives that are not MXR substrates would be expected to improve the benefit-risk
ratio for these agents.
1.4.5 Kinase Inhibitors
Many new anticancer agents have been developed to target specific mitogenic
pathways within cancer cells. Many of these mitogenic pathways are regulated by
kinases, and inhibition of these kinases is an effective anticancer therapy. Tyrosine kinase
inhibitors (TKIs) were first developed for treatment of hematopoietic malignancies, and
efflux of these compounds can lead to drug resistance91. MXR expression is high in many
hematopoietic cancers92,93, making TKIs that are not substrates of MXR a useful strategy
for future development.
The first TKI, imatinib mesylate, is transported in MXR overexpressing cell
lines94,95, and individuals develop “pharmacokinetic resistance” to imatinib through the
overexpression of MXR96. Many other TKIs, including lapatinib, dasatinib, gefitinib,
vandetanib and erlotinib are also substrates of MXR97–102. Most TKIs were initially
thought to be inhibitors of MXR, but it is now clear that agents such as nilotinib,
dasatinib and CI1033 are high-affinity substrates of MXR that at high concentrations
inhibit the transporter103,104. Most TKIs, like erlotinib, stimulate the ATPase activity of
MXR, supporting the claim that they are MXR substrates105. Abcg2-/- mice have

13
increased bioavailability of erlotinib99 and increased sorafenib penetration into the
brain106, illustrating the importance of MXR in TKI pharmacokinetics. MXR also plays a
role in the transport of the cylin-dependent kinase/Aurora kinase inhibitor JNJ-
7706621107. MXR should therefore be evaluated in the development of all kinase
inhibitors.
1.4.6 Statins
Statins target HMG-CoA reductase and are used in the treatment of coronary heart
disease108. Statins are widely used and generally well-tolerated; however, serious
complications such as myopathy may occur108. The ABCG family is associated with the
transport of cholesterol steroids36, and MXR transports a number of statins, including
rosuvastatin109 and pitavastatin110 (see Table 1.1). Patients with reduced function variants
of MXR had higher exposure to rosuvastatin111, fluvastatin, pravastatin and
simvastatin112, higher liver levels and a greater therapeutic response108. Noncoding SNPs
in the ABCG2 locus are associated with greater response to rosuvastatin113. Although
individuals with these variants might exhibit improved drug response, they also have the
potential for drug toxicities. The use of statins as a gout treatment has also been proposed
because they are able to alter ABCG2 expression114. Thus, identification of statins that
are substrates of MXR, of MXR variants with lower transport of these compounds and of
the pathways involved in the statin regulation of MXR is important for assessing the
benefit-risk ratio in patients.

14
1.4.7 Antiretrovirals
The development of antiretroviral therapy (ART) has led to significant declines in
human immunodeficiency virus (HIV) associated morbidity and mortality115. Although
combination therapy is now a hallmark of ART, there are numerous drug resistance and
metabolic complications that are associated with HIV treatment115. Overexpression of
MXR in vitro leads to increased resistance to the nucleoside reverse transcriptase
inhibitor (NRTI) zidovudine (AZT) as a result of decreased cellular accumulation of AZT
and its metabolites116,117. Similarly, lamivudine has reduced activity in MXR
overexpressing cells116. Antiretroviral drugs are competitive inhibitors of MXR, and
multiple antiretrovirals (in order of IC50 rank: lopinavir, nelfinavir, delavirdine, efavirenz,
saquinavir, atazanavir, amprenavir and abacavir) increased pheophorbide A accumulation
in a MXR expressing cell line118. Identification of ART agents that can inhibit MXR in
combination treatment settings could provide avenues to circumvent resistance.
1.4.8 Antibiotics
The ability of MXR to transport antibiotics, especially into milk, is of particular
interest not only in humans, but in cows as well. MXR can transport a number of
antibiotics including ciprofloxacin, ofloxacin, norfloxacin, erythromycin, tetracycline,
rifampicin and enrofloxacin119–121. MXR alters the pharmacokinetics, hepatobiliary
excretion and milk secretion of nitrofurantoin122. It also mediates the biliary excretion of
ciprofloxacin, grepafloxacin, ofloxacin and ulifloxacin, and the tubular secretion of
ciprofloxacin and grepafloxacin123. Identification of antibiotic substrates of MXR is
necessary to limit infant exposure and reduce antibiotic accumulation in cow’s milk.

15
1.4.9 Other Therapeutic Drugs
Sulfasalazine, a prodrug for 5-aminosalicylic acid, is an anti-inflammatory
medication used for rheumatoid arthritis and inflammatory bowel disease124,125.
Sulfasalazine is a high affinity (Km = 0.7 μM) substrate of MXR126,127 and is used
clinically as a marker of MXR activity128–130. MXR transports other immunomodulators
including the anti-inflammatory diclofenac131, the antirheumatic drug leflunomide and its
metabolite A771726 (teriflunomide)132.
MXR also transports numerous other therapeutic compounds that treat everything
from parasites to sclerosis (see Table 1.1). MXR transports drugs that work in the gastric
tract such as the proton pump inhibitor pantroprazole, which can also inhibit MXR133,
and the antiulcerative agent cimetidine134. Since MXR is expressed in the apical side of
the intestinal epithelium, its efflux of these compounds back into the lumen might aid in
their therapeutic action or work to reduce plasma levels of the drug. For example, Abcg2-
/- mice have increased plasma concentrations and decreased milk accumulation of
cimetidine86. MXR also transports several antidiabetic agents such as glyburide135,136,
and is responsible for the biliary excretion of troglitazone sulfate, the major metabolite of
the antidiabetic agent troglitazone137. MXR also mediates the transfer of glyburide across
the human placenta from fetus to maternal circulation138. Finally, the expression of MXR
at the blood brain barrier can impact any of its antipsychotic substrates that need to enter
the CNS, such as the depression medicine befloxatone139. Prazosin, a drug used to treat
anxiety, post-traumatic stress disorder and panic disorder, has reduced accumulation in
cells overexpressing MXR20. Expression of MXR may influence the pharmacological or
toxicological actions of its many substrates.

16
Table 1.1. Therapeutic Substrates of MXR Statins Quinoline Alkaloids Antimetabolites nitrofurantoin140 irinotecan75–77,82,83 methotrexate55,57,64–66 pitavastatin110,141 SN-3854,56,74–78,82,83 MTX diglutamate55,64,66 pravastatin112,142 SN-38-glucuronide76,78 MTX triglutamate64,66 lamivudine143 topotecan20,33,52–54,56,74,75,79,86 7-hydroxy-MTX55 fluvastatin112 9-aminocamptothecin52,56,74,75,80 GW184369 simvastatin112 homocaptothecin77 trimethrexate67 rosuvastatin109,111 diflomotecan77,81 tomudex69 NX21175 pyrimethamine67 Kinase Inhibitors DX-8951f 52,144 5-fluorouracil57 gefitinib97,98,101 gimatecan145 CdAMP70 erlotinib97,99,105 belotecan146 cladribine70 imatinib94–96 clofarabine70 lapatinib100 Others fludarabine70 nilotinib103 prazosin20 6-mercaptopurine (6MP)70 dasatinib102,103 Iodoarylazidoprazosin147 6MP riboside70 vandetanib101 mycophenolic acid glucuronide148 sorafenib106 azidopine147 Immunomodulators tandutinib149 nitrendipine147 diclofenac131 CP-724,714150 nicardipine147 leflunomide132 symadex151 nifedipine147 teriflunomide132 *CI1033104 cimetidine86,134 albendazol sulfozide152 JNJ-7706621107 *pantroprazole133 sulfasalazine126–130 glyburide135,136,138 Antibiotics troglitazone sulfate137 Topoisomerase Inhibitors ciprofloxacin119,123 TH-337153 mitoxantrone19,20,33,51–58 ofloxacin119,123 *dipyridamole154 bisantrene20 norfloxacin119 ME3327155 aza-antrapyrazole53,156 erythromycin120 PM-5155 etoposide51,57,59 tetracycline120 *oxfendazole152 teniposide59 rifampicin120 moxidectin157 indolocarbazole61 enrofloxacin121 zoledronic acid158 NB-50663 nitrofurantoin122 riluzole159 J-10708863 grepafloxacin123 olmesartan medoxomil160 GV19677160 ulifloxacin123 befloxatone139 *becatecarin62 4-methylumbelliferone (4Mu) sulfate161 Anthracyclines# 4Mu glucuronide161 Antiretrovirals doxorubicin51,58 E3040 sulfate161 zidovudine (ZVD)116,117 epirubicin56,71 2,4-dinitrophenyl-S-glutathione161 ZDV metabolites116,117 pirarubicin57 albendazol sulfoxide152 lamivudine116,143 ortataxel162 ganciclovir163 bicalutamide164 *NSC73306165 *Also inhibits MXR at higher concentrations #Substrates of the R482G/T variant MXR

17
1.5 Natural Substrates of MXR
The tissue distribution and localization of the MXR transporter supports an
important role in detoxification and protection. This role was illuminated in MXR
knockout mice, which develop phototoxicity due to accumulation of the porphyrin class
of dietary toxins166. Since then it has been shown that MXR is responsible for the
protection of the body from other dietary toxins such as carcinogens167. Additionally,
MXR is responsible for the distribution of many natural compounds, including
flavonoids, folic acid, steroids, and bile acids (see Table 1.2). Identification of the natural
substrates of MXR adds to the knowledge of its function in the body and could help in
identifying structurally similar therapeutic substrates of MXR.
1.5.1 Porphyrins
Porphyrins are naturally occurring aromatic compounds that bind and form
complexes with metals. The most common porphyrin is heme, which gives blood cells
their red color and their ability to transport iron. The buildup of porphyrins, either in cells
or in vivo, leads to phototoxicity. Abcg2-/- mice experience phototoxicity due to the
accumulation of porphyrins166, which led to their establishment as MXR substrates10,168.
Pheophorbide A, a natural dietary toxin, accumulates in MXR knockout mice to cause
phototoxicity166 and is a specific MXR substrate and good in vitro probe for MXR
function169. Levels of protoporphyrin IX (a derivative of heme) are also increased in the
erthyrocytes of Abcg2-/- mice166, and protoporphyrin IX was later determined to be a
substrate of MXR170. MXR mediates the transport of other porphyrins, including

18
hematoporphyrin10,171 and 3-(1'-hexyloxyethyl)-3-devinyl pyropeophorbide-A (HPPH)172,
and is important for the biliary excretion of porphyrins173.
Transport of porphyrins by MXR is consistent with phototoxicity caused by some
MXR inhibitors and substrates174. The MXR specific inhibitor fumetrimorgin C (FTC)
blocks phytoporphyrin (phylloerythrin) transported in MXR expressing cell lines173.
Additionally, the reduced accumulation of pyropheophorbide A methyl ester, chlorine e6
and protoporphyrin IX (generated by treating with 5-aminolevulinic acid) in a MXR
overexpressing cell line was reversible by FTC treatment175. The continued
characterization of porphyrin substrates of MXR could give new insight into the
mechanisms that lead to clinical phototoxicity and its prevention.
1.5.2 Carcinogens
One of the most common food carcinogens is 2-amino-1-methyl-6-
phenylimidazo[4,5-b]pyridine (PhIP). MXR transports PhIP134, along with other
carcinogens including Benzo[a]pyrene-3-sulfate and Benzo[a]pyrene-3-glucuronide176.
The ability of MXR to protect against carcinogen exposure is evident from reports that
Abcg2-/- mice have higher plasma levels of PhIP due to impaired hepatobiliary and
intestinal excretion of PhIP167 and have decreased PhIP transport into milk86. MXR
reduces systemic exposure to the heterocyclic amines 2-amino-3-methylimidazo[4,5-
f]quinoline (IQ) and 3-amino-1,4-dimethyl-5H-pyrido[4,3-b]indole (Trp-P-1) and the
potent human hepatocarcinogen aflatoxin B1177. The ability of MXR to reduce systemic
exposure to carcinogens is associated with cancer susceptibility. For example, prostate
cancer patients with reduced function alleles of MXR had a significantly shorter survival

19
time178. Reduced function MXR variants were also associated with increased risk of
diffuse large B-cell lymphoma179. Mechanisms that reduce MXR expression could result
in cancer prevention.
1.5.3 Flavonoids
Fruits, vegetables and beverages are all important sources of flavonoids180–182.
Flavonoids are polyphenolic compounds that are characterized as flavonols, flavones,
flavanones, flavanols, isoflavones, chalcones, or anthocyanidins. These compounds are
all widely distributed throughout the plant kingdom; the two most common flavonols
(which are the most common flavonoids) are quercetin and kaempferol181,183. Quercetin
and kaempferol are major constituents of Ginkgo biloba extract, and both are MXR
substrates184. Lumen absorption of quercetin and the quercetin glucuronides is limited by
MXR efflux185. Additionally, plasma concentrations of quercetin and isorhamnetin
(methylated metabolite of quercetin) increase in MXR knockout mice185.
Many flavonoids have biological activity, such as riboflavin (vitamin B2) which is
secreted into milk by MXR186. MXR transports many of the flavonoids (see Table 1.2),
including hesperetin and its metabolites and flavopiridol187–189. Flavopiridol is a cyclin-
dependent kinase inhibitor being developed as an acute myeloid leukemia (AML)
treatment. MXR overexpressing cells are resistant to flavopiridol189 and ABCG2 mRNA
levels correlate with flavopiridol cytotoxicity in AML blast cell samples93. The
importance of MXR in flavopiridol activity requires careful study.
Some flavonoids have weak estrogenic activities and are called phytoestrogens.
Some phytoestrogens, including genistein, naringenin, acacetin and kaempferol,

20
potentiate the cytotoxicity of SN-38 and mitoxantrone and increase cellular accumulation
of topotecan190. Studies in Abcg2 -/- mice have shown increases in AUC of
genistein191,192, plasma levels of diadzein192 and the accumulation of inulin in the brain
and testis192. Thus, MXR is important in limiting the oral availability and distribution of
phytoestrogens into the brain, testis, epididymis and fetus192. Alterations in MXR
expression or function could impact the bioavailability and tissue exposure to
phytoestrogens.
1.5.4 Hormones
In addition to many phytoestrogens, MXR transports many other hormones
including estrone 3-sulfate (E1S), dehydroepiandrosterone sulfate (DHEAS) and the
estrogen metabolites 17β-estradiol sulfate and 17β-estradiol-17β-D-glucuronide
(E217βG)161,193. Data on whether MXR can transport estrogen are conflicting, as there are
reports of MXR transport of 17β-estradiol120 and non-transport of free estrogen and 17β-
estradiol193. MXR transport of estrogen conjugates is well supported; the Km for E1S
ranges from 3.6-16.6 μM161,194 and the Km for E217βG is 44.2 μM66. MXR is implicated
in the bioavailability of estrogens and is responsible for the biliary excretion of the 3-O-
sulfate conjugate of 17α-ethinylestradiol, a component of oral contraceptives195. The
expression of MXR could affect many hormonal processes, especially in tissues where
both hormones and MXR are prevalent, such as the placenta, breast and testes.

21
1.5.5 Dyes and Fluorescent Compounds
There are many different dyes and fluorescent compounds utilized in the
laboratory setting, including Hoechst 33342 dye and D-luciferin (substrate of the firefly
luciferase), that are substrates of MXR196,197. Many of the dyes that are transported by
MXR are used in flow cytometry assays. For example, the expression of MXR in
hematopoietic pluripotent progenitor cells is a major contributor to the efflux of Hoechst
33342198,199. Two other cell imaging agents, rhodamine 123 and Bodipy-prazosin, are
actively transported from cells by MXR58,71, have reduced accumulation in MXR
overexpressing cell lines20 and their efflux is inhibitable by the MXR specific inhibitor
FTC200. These dyes have also been utilized in vivo; for example, MXR transports Bodipy-
prazosin away from the mouse fetus136. The newly developed fluorescent bile salt
analogues cholyl-L-lysyl-fluorescein and cholylglycylamido fluorescein are being
developed as in vivo tools to monitor liver transporter function201,202.
1.5.6 Other Natural Substrates
MXR is located on the apical membrane of the bile canalicular membrane and
transports bile acids such as cholate and deoxycholate120,202. Additionally, MXR is
expressed in the kidney and mediates urate secretion at the brush border membrane of
renal proximal tubule cells203. MXR also transports uric acid, and ABCG2
polymorphisms and gene expression levels have been repeatedly associated with gout204–
206. Determining mechanisms that regulate the expression and function of MXR could
lead to new pathways to identify individuals at risk for gout.

22
There are many other dietary nutrients that are transported by MXR, including
folic acid and vitamin K55,66,207. Resveratrol, the natural phenol found in the skin of red
grapes and other fruits and that is associated with increased life span, is transported by
MXR55. Glutathione (GSH), the major endogenous thiol antioxidant with a critical role in
the preservation of cellular redox balance as well as the detoxification of exogenous and
endogenous compounds, is also transported by MXR208. Finally, MXR transports
phenethyl isothiocyanates; isothiocyanates are non-nutrient constituents abundant in
cruciferous vegetables that inhibit carcinogenesis209.
MXR is also important for the transport of cellular components. The potent
sphingolipid mediator sphingosine 1-phosphate (S1P) is transported by MXR210.
Additionally, the phospholipid phosphatidylserine, usually kept on the inner-leaflet of the
cell membrane, is also transported by MXR211. The most interesting cellular compound
that MXR transports is amyloid β212, a component of amyloid plaques indicated in the
causation of Alzheimer’s disease212. Therefore, the expression and function of MXR at
the blood-brain barrier could be playing a role in the accumulation of amyloid β, and
therapies designed to increase MXR expression or function could be beneficial in
Alzheimer patients.

23
Table 1.2. Natural Substrates of MXR Porphyrins Carcinogens pheophorbide A166,168,169 PhIP86,134,167 protoporphyrin IX166,168,170,175 benzo[a]pyrene-3-sulfate176 phytoporphyrin173 benzo[a]pyrene-3-glucuronide176 pyropheophorbide A methyl ester175 IQ177 chlorine e6175 Trp-P-1177 hematoporphyrin10,171 aflatoxin B1
177 HPPH172 zinc mesoporphyrin168 Flavonoids heme168 genistein190–192 hemin168 naringenin190 zinc protoporphyrin IX168 acacetin190 copper protoporphyrin IX168 kaempferol184,190 flavopiridol189 Steroids/Hormones riboflavin186 estrone 3-sulfate161,193,194 quercetin185 DHEAS161 quercetin glucuronides185 E(2)17β glucuronide66,161 isorhamnetin185 17β-estradiol sulfate193 hesperetin188 oestradiol120 hesperetin 7-O-glucuronide187 3-O-sulfate 17α-ethinylestradiol195 inulin192 daidzein192 Bile Acids glycoCA202 Dyes tauroCA202 rhodamine 12320,58 taurolithocholic acid-3-sulfate202 bodipy-prazosin58,71,136,200 cholic acid/cholate120,202 hoechst 3334258,71,198,199 deoxycholate120 eFluxxID® Green213 eFluxxID® Gold213 Dietary Compounds D-luciferin196,197 uric acid/urate203,204 cholyl-L-lysyl-fluorescein201 folic acid55 cholylglycylamido fluorescein202 vitamin K207 bodipy-dihydropyridine147 plumbagin207 resveratrol55 Others phenethyl isothiocyanates209 sphingosine 1-phosphate210 glutathione208 phospholipid phosphatidylserine211 amyloid β212
1.6 MXR Inhibitors
There are currently many natural products and synthetic inhibitors of MXR (see
Table 1.3), and many libraries of compounds are being screened for their ability to inhibit

24
MXR function196,214. Identification of dietary compounds and therapeutics that inhibit
MXR could aid in the understanding of drug-drug interactions and the prevention of drug
toxicity. MXR inhibitors are identified through assays utilizing a well characterized
substrate of MXR and screening for whether target compounds can alter transport. This
has led to the discovery of multiple competitive and noncompetitive inhibitors (see Table
1.3). Competitive inhibitors act as substrates with high affinity for a MXR substrate
binding sites, preventing binding and active transport of other substrates. Non-
competitive inhibitors can act in various ways, for example by blocking the ATPase
activity that is necessary for transport of xenobiotics across the plasma membrane.
Typical examples of noncompetitive inhibitors of MXR are cyclosporine A and sodium
orthovanadate58,215.
1.6.1 Prototypical MXR Inhibitors
One of the most common specific and potent inhibitors of MXR, fumitremorgin C
(FTC), is an indolyl diketopiperazine isolated from Aspergillus fumigatus and is not
transported by MXR53,200,216,217. FTC inhibits the ATPase activity of MXR218 and reverses
mitoxantrone, doxorubicin and topotecan resistance53,216. Depending on the MXR
substrate, FTC has IC50 values in the range of 0.5-10 μM53,58,216,219. Although FTC is a
potent MXR inhibitor, it is not being developed for clinical use because it causes severe
in vivo neurotoxicity, including tremors and convulsions. There are many FTC analogs
that have also been targeted as specific MXR inhibitors, although many also have severe
cytotoxicity220. The most promising FTC analogs for use in the clinic are Ko134 and
Ko143, which are both potent and specific MXR inhibitors without cytotoxicity98,221.

25
Two more common inhibitors of MXR are the benzimidazoles pantoprazole and
omeprazole, which inhibit MTX transport with IC50 values around 13 μM and 36 μM,
respectively133. Pantoprazole, a proton pump inhibitor, is a common treatment for acid
reflux, acts through competitive inhibition and is also transported by MXR133. Co-
treatment with pantoprazole reduces imatinib clearance and increases imatinib
penetration into mouse brain94. Development of an effective and safe MXR inhibitor
would be beneficial particularly for the treatment of brain tumors.
MXR also has overlap in its inhibitor profile with P-glycoprotein (P-gp), another
common ABC transporter. The P-gp inhibitor tariquidar inhibits MXR-mediated
pheophorbide A transport169. Another P-gp inhibitor elacridar (GF120918) reverses
MXR-dependent cellular resistance to topotecan and other camptothecin derivatives75,222,
to etoposide59 and to mitoxatrone and MTX65,221,222. Elacridar also works in vivo and
during co-treatment increases topotecan plasma and fetal concentrations in mice79,
reduces imatinib clearance and increases imatinib penetration into mouse brain94.
Possibly due to its dual inhibition of both MXR and P-gp, elacridar increases the oral
bioavailability of topotecan by 50% in patients223. Since elacridar can be used in vivo to
inhibit ABC transporters, it is a promising clinical combination therapeutic for reversal of
drug resistance or improvement of chemotherapeutic bioavailability.
1.6.2 Hormones
Many sulfate and glucoronide conjugates of estrogen derivates and other
hormones are transported by MXR, but their parent compounds are not193. However, free
estrogens like estrone and 17β-estradiol increase the cellular accumulation of topotecan,

26
mitoxantrone and SN-38 in MXR overexpressing cell lines134,224. Estrogen antagonists
and agonist screens found that diethylstilbestrol, estrone, tamoxifen, toremifene, TAG-11
and TAG-139 all reverse MXR-mediated SN-38 and topotecan resistance225. Therefore,
estrogen levels in tissues could play a role in target site concentrations of MXR
substrates.
Glucocorticoids regulate growth, metabolic, developmental and immune
functions, and glucocorticoid derivatives are widely prescribed to treat immune
disorders226. The natural glucocorticoid corticosterone and the glucocorticoid drugs
beclomethasone, 6α-methylprednisolone, dexamethasone and triamcinolone inhibit, but
are not transported by, MXR134. The impact of glucocorticoid treatment on MXR
substrates in vivo requires further study.
1.6.3 Tyrosine Kinase Inhibitors
Tyrosine kinase inhibitors (TKIs) are anticancer agents given as single or
combination therapies for many cancers and are particularly important in the treatment of
hematopoietic malignancies101. Initially, both imatinib and gefitinib were reported to
reverse MXR-mediated topotecan and SN-38 resistance, without being transported by
MXR227–229. They have both since been shown to be transported by MXR, functioning as
competitive inhibitors of the transporter97,230,231. Erlotinib reverses MXR-mediated drug
resistance105, but it also stimulates MXR ATPase activity and is a substrate97. Recent data
suggests that nilotinib, imatinib, dasatinib, lapatinib and sunitinib all function as MXR
substrates at low concentrations231–234 but inhibit MXR at higher concentrations103.

27
1.6.4 Natural Inhibitors
The interaction of naturally occurring compounds with drugs is of clinical
significance and may explain individual variability in drug pharmacokinetics. Extracts of
isoflavonoids from food sources inhibit MXR-mediated transport235. Flavones are the
most potent MXR inhibitors236, but multiple flavonoids, including phytoestrogens, also
inhibit transporter function190,235,237–241. The glucoside derivatives of flavonoids have
significantly reduced MXR inhibitory capabilities235,237. Some of the most potent
flavonoid inhibitors of MXR include coumestrol235, chrysin237, biochanin A237,
quercetin241, retusin and ayanin240. Although administration of chrysin did not affect
topotecan pharmacokinetics in rats or mice242, in vivo experiments should focus on
flavonoids given in combination as found in food, since MXR inhibition may be
additive243.
Many chalcones, which are phenols and structurally related to flavonoids (they
are flavonoid precursors), and indolylphenylpropenones are MXR inhibitors244. Curcumin
is a phenol linked with beneficial effects in many diseases, particularly at low doses
where it reduces amyloid β accumulation in Alzheimer models245. The major forms of
curcuminoids in turmeric powder, curcumin, demethoxycurcumin and
bisdemethoxycurcumin, are all noncompetative inhibitors of MXR246. Additionally,
tetrahydrocurcumin, a major curcumin metabolite, also inhibits MXR247. Further studies
investigating the complex interaction of amyloid β, curcumin and MXR would be
beneficial to the study of Alzheimers.

28
Table 1.3. MXR Inhibitors Kinase Inhibitors Natural Compounds Others *imatinib94,227,229–232 coumestrol235 cyclosporine A58,215 *gefitinib97,98,196,228,229 genistein121,190,191,235,237,243 orthovanadate58 EKI-785229 daidzein235,237,238 fumitremorginC53,58,200,216–219 sunitinib234,248 biochanin A235,237,239,243 Ko13498,221 *nilotinib103,231,232 glycitein235 Ko14398,221,249 *dasatinib103,231 prunetin235 digoxin134 *erlotinib97,105 chrysin237,242,243 elacridar59,65,75,221,222 *lapatinib100,233 7,8-benzoflavone242 novobiocin54,250 *CI1033104 apigenin237,243 glafenine196 bisindolylmaleimides IV251 fisetin237 tracazolate196 indolocarbazole251 hesperetin237,238,243 calcimycin196 bisindolylmaleimides V251 kaempferol190,237,243 doxazosin mesylate196 arcyriaflavin A251 naringenin190,237,243 tariquidar169 K252c251 phloretin237 tryprostatin A211 UCN-01169 quercetin237,238,241 biricodar252 purvalanol A171 silybin237 *Dipyridamole154 WHI-P180171 silymarin237,238,243 nicardipine154,253 LY294002254 resveratrol238 nitrendipine154,253 kaempferide239 nimodipine154 Estrogens 5,7-dimethoxyflavone239 niguldipine253 estrone224,225 8-methylflavone239 PZ-39255,256 17β-estradiol134,224 acacetin190 ortataxel257 diethylstilbestrol225 chalcones244 tRA96023257 tamoxifen225 indolylphenylpropenones244 XR9577258 toremifene225 curcumin246 WK-X-34258,259 TAG-11225 demethoxycurcumin246 WK-X-50258 TAG-139225 bisdemethoxycurcumin246 WK-X-84258 tetrahydrocurcumin247 albendazole sulfoxide121 Glucocorticoids caffeine260 corticosterone134 naringenin-7-glucoside190 Antiretrovirals beclomethasone134 6-prenylchrysin236 lopinavir118 6α-methylprednisolone134 tectochrysin236 nelfinavir118,261 dexamethasone134 delavirdine118 triamcinolone134 Antipsychotics efavirenz118 clozapine249 saquinavir118,261 Analog Screens paliperidone249 atazanavir118 dihydropyridines253 chlorpromazine249 amprenavir118 pyridines (Im)253 quetiapine249 abacavir118 chromanones262 olanzapine249 ritonavir261 taxanes263 haloperidol249 reserpine32 risperidone249 *indicates also substrate of MXR
29
1.7 Physiological Function of MXR
Separate from its role in cancer resistance and pharmacokinetics, MXR has an
important function in the body. The tissue distribution and substrate and inhibitor profiles
of MXR indicate its importance for the distribution of nutrients, especially into the milk,
and the defense of tissues from carcinogens and phototoxic compounds. Although
therapeutic MXR inhibitors are being developed or are already in clinical use, the
disruption of the physiological function of MXR must be considered in developing such
strategies.
1.7.1 Distribution of Dietary Compounds
MXR regulates the absorption of dietary compounds, and its cellular localization
is altered in times of nutrient deprivation. During times of low folate, MXR localizes to
the membrane of intracellular vesicles where it assists in sequestering nutrients34.
Additionally, MXR is expressed in the ducts and tubules of the breast, where it
contributes to the secretion of nutrients, particularly riboflavin (vitamin B2), into milk186.
The expression of MXR in the lumen serves to reduce overall systemic exposure
to various compounds. The distribution of phytoestrogens are altered in Abcg2 -/- mice,
which have increased AUC of genistein191,192, plasma levels of diadzein192, brain and
testis accumulation of inulin192, and plasma concentrations of quercetin and isorhamnetin
(methylated metabolite of quercetin)185. Although phytoestrogens are not strictly
nutrients, they are considered beneficial due to their estrogenic and anti-estrogenic
effects264.

30
1.7.2 Tissue Defense
MXR plays an important role in protecting the brain, fetus, prostate and eye46. In
Abcg2 -/- mice, there is increased exposure to the dietary carcinogen PhIP167 and
hepatocarcinogen aflatoxin B1177. Additionally, MXR reduces the systemic exposure to
the heterocyclic amines IQ and Trp-P-1177. MXR also plays a role in the placental barrier
and the protection of the fetus from glyburide, Bodipy-prazosin and bile acids136,202. The
inhibition of MXR in mice via elacridar treatment increased fetal topotecan exposure79.
Reduced MXR function limits the accumulation of PhIP, topotecan and cimetidine into
mouse milk86 and simultaneously increases systemic and fetal exposure to harmful
compounds. As a result of both the natural protective role of MXR against carcinogens265
and its ability to efflux chemotherapeutics out of cancer cells266, MXR expression is
associated with decreased progression-free and disease-free survival in a variety of
cancers267–275.
1.7.3 Phototoxicity
MXR knockout mice develop phototoxic skin lesions due to the accumulation of
chlorophyll-derivative porphyrins from natural dietary sources that are MXR
substrates166, particularly pheophorbide A10,168,169. Phototoxicity has been reported in
healthy individuals with chlorophyll rich diets276, and it is also a well known side effect
of several therapeutic agents that are MXR substrates277–280 and inhibitors281. Low
functioning nonsynonymous alleles of MXR have reduced porphyrin transport282, and
this could contribute to human phototoxicity in individuals treated with a number of
MXR substrates such as statins277 and imatinib278. MXR transports many photosensitizers

31
with structures similar to that of pheophorbide A and increases photodynamic resistance
to pheophorbide A, pyropheophorbide A methyl ester, chlorine e6 and 5-aminolevulinic
acid in photodynamic therapy (PDT)175. PDT is an anticancer treatment in which a tumor-
selective photosensitizer is administered and light is activated to cause cell death through
the generation of reactive oxygen species175. MXR needs to be studied as a possible
mechanism for the development of cellular resistance to this therapy.
The accumulation of porphyrins is also relevant to cytotoxicity that occurs during
hypoxia. Normally, MXR protects tissues during hypoxia by effluxing heme and
porphyrin compounds out of the cell283. This is most relevant to stem cells as it reduces
erythropoietic protophyria by effluxing protoporphyrin IX170. Additionally, the major
endogenous thiol antioxidant glutathione (GSH), which has an extensive role in the
preservation of cellular redox balance, is transported by MXR208. Therefore, the
expression and function of MXR in individual cells can be relevant for their survival
upon exposure to hypoxia.
1.8 MXR Variants
Nonsynonymous variants of ABCG2 and other ABC membrane transporters have
been implicated in the in vivo drug disposition, therapeutic efficacy and adverse drug
reactions of their substrates35,284–286. There are several common and many rare
nonsynonymous variants of ABCG2 (see Figure 1.1 and Table 1.4)5–11. The minor allele
frequencies (MAFs) of ABCG2 variants are population-specific5–11. The effects of
transporter variants on different substrates are not always the same; in fact, 14% of
variants in membrane transporters exhibited substrate specific defects in transport287. The

32
transport function of the common nonsynonymous variants and many unnatural variants
of ABCG2 have been investigated12. The functional studies and phenotype association of
ABCG2 nonsynonymous variants8,285,288 indicate that some variants of MXR have
substrate-dependent alterations in transport abilities.
1.8.1 V12M
The V12M variant is located in the NH2-terminal intracellular region of the MXR
transporter (see Figure 1.1). The V12M polymorphism is most common in Asian and
Caucasian populations with MAFs ranging from 2-45%5–11. Although there have been a
few reports of altered V12M localization289 and lower V12M protein expression in cells10
and Hispanic livers15, the majority of reports indicate no effect of this variant on mRNA
or protein6,9,282,290–292. There is evidence for substrate-dependent effects of the V12M
variant as it causes lower porphyrin10 and higher methotrexate293 transport. The V12M
variant also has protective effects (higher IC50) against pheophorbide A6 and SN-38282.
However, the V12M variant was similar to reference MXR in its mitoxantrone stimulated
ATPase activity294, as well as sensitivity to mitoxantrone282,292. Patients homozygous for
the V12M variant had worse survival in diffuse large B-cell lymphoma179 and response to
imatinib mesylate treatment295.
1.8.2 Q141K
The Q141K variant lies between the Walker A motif and the ABC signature
region (see Figure 1.1). The Q141K variant is very common, with MAFs in Asian and
Caucasian populations ranging from 6-36%5–11. Reports on alteration in MXR function

33
are contradictory. Some reports show that Q141K exhibits lower SN-38294, porphyrin10,
urate203 and glyburide135 transport, and lower IC50s for imatinib296, topotecan89, Symadex
(C-1311)151, SN-38 and mitoxantrone9,282,292. Other reports show that Q141K has similar
mitoxantrone stimulated ATPase activity294, pheophorbide A IC506 and MTX ATP-
dependent transport293 compared to reference. The Q141K transporter has lower protein
expression, but mRNA levels are unaffected6,9,10,27,290–292,297,298. However, intestinal
mRNA and protein levels are not affected by the Q141K130,268. Alterations in Q141K
protein levels have been linked to an increase in proteasomal degradation299,300. Thus,
studies that normalized for MXR expression (as opposed to total protein) saw no changes
in Q141K function291, indicating that the Q141K protein functions properly, but has
reduced expression due to higher protein degradation.
MXR Q141K is associated with altered pharmacokinetics and multiple adverse
events. The Q141K variant transporter alters the pharmacokinetic parameters of SN-38
and its glucuronide88,90, gefitinib97, sulfasalazine130,301, topotecan89, diflomotecan81,
mycophenolic acid glucuronide148, fluvastatin, pravastatin and simvastatin112, and
rosuvastatin111 but has no effect on the pharmacokinetic properties of imatinib296,
nitrofurantoin140, irinotecan90, pitavastatin141, pravastatin142 or lamivudine143. MXR
Q141K is also associated with chemotherapy-induced diarrhea302,303, acute lymphoblastic
leukemia complications304 and neutropenia in cancer patients treated with irinotecan87,88.
Due to the reduction in urate transport by the Q141K variant, it is estimated that this SNP
is responsible for 10% of gout cases in Caucasians203. Finally, lower expression of
Q141K could have ramification in the protection of the body from carcinogens. This is
consistent with reports of MXR Q141K association with increased risk and worse

34
survival in patients with diffuse large B-cell lymphoma179. The Q141K variant transporter
is also associated with poorer survival in patients who were younger at diagnosis or had
bulky tumors179. The MXR V12M/Q141K haplotype was associated with the worst
overall survival in diffuse large B-cell lymphoma179. Collectively, these data suggest that
both V12M and Q141K MXR transporters can have significant effects on
pharmacokinetics and pharmacodynamics.
1.8.3 R482 Mutations
The MXR R482T variant was identified from a doxorubicin resistant cell line, but
has not been found in human samples. This mutation is located in the intracellular
domain near the third transmembrane helix, a region important in other ABC transporters
for the recognition of substrates, and drastically changes the substrate antagonist-specific
profile of MXR71. Both the MXR R482T and R482G mutants cannot transport MTX65,
but are 100 to 1000-fold more resistant to the antifolates GW1843 and Tomudex69 and
lipophilic antifolates67. Additionally, the 482G and 482T variants, but not reference
MXR, transport rhodamine 123, daunorubicin and LysoTracker Green71. Due to the
position of R482 near transmembrane 3 and its ability to alter the MXR substrate profile,
it has been proposed that this residue is important for the interaction of MXR with
charged substrates (like MTX and rhodamine 123) but not with neutral unconjugated
sterols, bile acids or antibiotics120. Continued research on these mutations could inform
our understanding of acquired drug resistance.

35
Table 1.4 Nonsynonymous Variants of MXR
SNP ID Position1 Δnt2 ΔAA3 MAF4 (%) Sources
rs2231137 34 G>A Val12Met 0.0-45 5,8,10,11,27,143,268,289,292,
305–310 - 38 C>T Ser13Leu 0.3 307 - 151 G>T Gly51Cys 0.1 11 - - - Lys86Met - 218
rs2231139 376 C>T Gln126Stop 0.0-3 8,10,11,143,307,308,311
rs2231142 421 C>A Gln141Lys 0.0-41 5,8,10,11,27,90,143,268,289,29
2, 305–311 - 458 C>T Thr153Met 3.3 10,11 - 479 G>A Arg160Gln 0.3-0.5 8,10,307
rs1061017 496 C>G Gln166Gly 0.3 11 rs12721643 626 A>C Ile206Leu 0.6-20 8,10,11,268,305 rs1061018 623 T>C Phe208Ser 0.3 10,11 rs3116448 742 T>C Ser248Pro 0.5 10,11 rs34678167 805 C>T Pro269Ser 0.2-0.8 143,305,309
- 1060 G>A Gly354Arg 0.3 307 - 1291 T>C Phe431Leu 0.3-0.8 8,10,11,307,311 - 1322 G>A Ser441Asn 0.5 8,10,311 - - - Arg482Ala - 218
rs192169063 1465 T>C Phe489Leu 0.5-0.8 8,10,307,311 - 1515 C>- Phe506Stop 0.3 307
rs35965584 1624 A>G Thr542Ala 1.9 305,312 - 1711 T>A Phe571Leu 0.5 10 - 1723 C>T Arg575Stop 0.3 8,10,307
rs34264773 1768 A>T Asn590Tyr 0.0-1.1 8,10,11 rs34783571 1858 G>A Asp620Asn 0.5-1.1 8,10,11,305,306,313
- 34/421 G>A/C>A Val12Met/ Gln141Lys 0.6-1.5 305,309,311
1Position in cDNA 2Change in nucleotide, variants without indicated change are not natural 3Change in amino acid 4Minor allele frequency in percent from all reported populations, individual population MAFs are reported elsewhere5–11

36
1.9 ABCG2 mRNA
The expression of ABCG2 mRNA is an important determinant of MXR expression
and function and is altered by many types of stimuli, ranging from hypoxia to xenobiotic
exposure314–320. This regulatory control of MXR expression gives cells the ability to adapt
to excessive or reduced levels of endogenous substrates which are essential for their
survival. Characterizing the variability in ABCG2 throughout the body is important in
understanding how expression impacts both systemic and target site drug exposure.
1.9.1 mRNA variability
Reports on the expression of ABCG2 in different normal tissues show wide
variability in ABCG2 expression levels. As much as a 500-fold change in mRNA
expression has been noted across human liver samples, without detectable copy number
variations15. In human intestine, ABCG2 levels vary 1.8- to 78-fold130,268. In a cohort of
human liver and kidney samples collected as part of the Pharmacogenetics of Membrane
Transporters project, large variation in ABCG2 mRNA was detected (see Figure
1.2). Additionally, overexpression of ABCG2 is seen in cancers92,268–275, with
reports of ABCG2 mRNA levels varying 1000-fold in the blast cells of leukemic
patients92 and 200-fold in AML blast cell samples93. Higher expression of ABCG2
mRNA has been linked to decreased disease-free survival of patients with several types
of cancers268–275. This variability of ABCG2 expression is not accounted for by the
Q141K variant with reduced protein stability or other non-synonymous variants of
ABCG215, and additional mechanisms must contribute to variation in expression321.

37
Figure 1.2 Expression profile of ABCG2 mRNA in human tissues. ABCG2 mRNA
expression in 60 human (A) kidney and (B) liver tissues, determined by qRT-PCR and
displayed as 2ΔCt relative expression. The mRNA expression of ABCG2 was normalized
to the geometric mean of GAPDH, β-2 microglobin, and β-actin, then quantile
normalized as described in Chapter 5 Materials and Methods. Each sample is represented
by a column along the x-axis.

38
1.9.2 Splice variants
In addition to variation in expression, there are eleven ABCG2 mRNA splice
variants reported in the National Center for Biotechnology Information (NCBI) website
(http://www.ncbi.nlm.nih.gov/IEB/Research/Acembly/av.cgi?db=human&l=ABCG2). Of
these, the major splice variants are prominent in different tissues. Several tissue-specific
isoforms of ABCG2 occur due to the creation of splice variants of the 5’-UTR from use of
alternate promoters322–324. The most common of the exon 1 splice variants is called
E1a15,325, and it is generated by the use of any one of three adjacent promoters and is
commonly detected in drug-resistant cell lines323. E1b is associated with lower ABCG2
mRNA in livers15, and its murine equivalent is expressed in the intestine324. E1c, which
has an intron 1 that is approximately 90 kb longer than the other exon 1 splice variants, is
detected in human leukemia322 and during murine erythroid differentiation326.
1.10 ABCG2 and its regulation
MXR is transcribed by ABCG2 located on the anti-strand of chromosome 4q22
between PKD2 and PPM1K21. ABCG2 spans over 66 kb and includes 15 introns and 16
exons22. The translational start site is located in exon 2, the Walker A domain in exon 3
and the Walker B and ABC signature domains in exon 622 (see Figure 1.3). ABCG2 is
highly conserved; it is known as the white protein in Drosophila and has been found in
all sequenced vertebrates16. Due to the wide variability in ABCG2 expression,
mechanisms that are important in the regulation of ABCG2 are of increasing importance.

39
Figure 1.3. Orientation of the ABCG2 locus and MXR protein. Diagram depicts the
orientation and location of the ABCG2 gene on chromosome 4, followed by an enlarged
version of the ABCG2 gene with the introns (horizontal line) and exons (vertical lines)
noted. Finally, the organization of the MXR protein is depicted; boxes are the location of
important physical features, and lines connect these features with the exons that code for
them. Abbreviations are as follows: M, Morgans; TMD, transmembrane domain; ABC,
ATP-binding cassette. Figure adapted from Bailey- Dell325 with all components to scale.
1.10.1 Promoter
The basal ABCG2 promoter is a TATA-less sequence that instead includes a
CCAAT box and numerous Sp1, AP-1 and AP-2 sites 312 bp upstream of the
transcriptional start site325. An alternate promoter for ABCG2 is used to generate one of
the 5’ UTR mRNA variants322. The basal -628/+362 ABCG2 promoter segment had
suppressed activity in MCF-7 cells, whereas the -312/+362 promoter segment was highly
active325.
The proximal promoter of ABCG2 also has a functional aryl hydrocarbon receptor
(AhR) response element between -194 to -190327,328 that overlaps with its functional

40
progesterone receptor (PR)317 and estrogen receptor (ER)329 response elements. There is
an NF-κB response element at -23, which works in concert with estrogen to increase
ABCG2 expression315. Additionally, there is a hypoxia inducible factor (HIF)-1α
response element between -116 and -112330 and an antioxidant response element at -431
to -420331. Recently, an interferon-γ activated sequence at -448/-422 was shown to
increase the ABCG2 promoter activity upon stimulation of the JAK2/STAT5 pathway by
prolactin332. This overlaps with the antioxidant response element stimulated by Nrf2 in
stem cells331. The cMyc-Max protein also binds to the unmethylated proximal promoter
of ABCG2 to activate ABCG2 transcription in human leukemic hematopoietic progenitor
cells333,334.
Although the ABCG2 proximal promoter has many transcription factor (TF)
response elements, SNPs within the ABCG2 promoter have not yet been associated with
its mRNA levels. There has been a report of an adjacent promoter haplotype -15622C/T
and 1143C/T conferring lower MXR expression, and thus it was associated with higher
erlotinib PK parameters335. Further studies of this polymorphism and other promoter
polymorphisms are required to understand their contribution to the variation in ABCG2
mRNA.
1.10.2 Methylation
DNA methylation occurs by the addition of a methyl group to the 5’ position of
cytosine (C) when it is directly linked with a guanine (G). DNA methylation occurs in the
human genome at these "CpG" sites (the ‘p’ refers to the phosphate group linking the two
nucleotides)336. CpG sites cluster in specific regions of the genome at a frequency higher

41
than what would randomly be expected throughout the genome, and these regions are
termed CpG islands (CGIs)337,338. Promoters are often associated with a high frequency
of CpG sites339,340, and when these multiple CpG sites over a gene’s promoter are
methylated, it causes gene suppression337. Additionally, methylation of CpG sites has
been shown to affect the binding of TFs, especially over gene promoters341,342.
The ABCG2 basal promoter is on the edge of a large CGI that covers most of the
ABCG2 proximal promoter and the core of which is just upstream of the transcriptional
start site325. Normally, minimal to absent methylation of the ABCG2 promoter CGI has
been reported in human liver tissues343 and in renal cell lines344. Treatment with the
demethylating agent 5-aza-2’-deoxycytidine or other xenobiotics in cell lines induces
ABCG2 expression, whereas the hypermethylated ABCG2 promoter is associated with
gene silencing344–348. The degree of ABCG2 promoter methylation correlates to ABCG2
mRNA levels in cancer cell lines344–347 and hypomethylation of the ABCG2 promoter
contributes to drug-resistance in cell lines and patients344–349. Additionally, demethylation
of the ABCG2 promoter has also been correlated with metastasis and stage of cancer, but
not with the development of cancer itself350. Methylation of the ABCG2 promoter may
determine the allele-specific expression profile in certain tissues, specifically in
placenta27. Further research on the impact of ABCG2 promoter methylation in normal and
malignant tissues is warranted.
1.11 Nuclear Receptors
Recent research has highlighted that SNPs in non-coding genomic regions can
affect gene transcription and expression levels of metabolizing enzymes and membrane

42
transporters, and thus drug disposition321,351. Additional variation in enzyme and
transporter expression can be mediated by ligand-activated TFs from the nuclear receptor
(NR) family; these TFs stimulate drug detoxification pathways to temporarily alter gene
expression in response to changes in the cell environment352,353.
NRs are ligand-dependent TFs, and theirligands include a variety of fatty acids,
vitamins and steroids354 that bind to consensus sequences in the genome and promote the
transcription or transrepression of target genes355. NRs exist as homo- and heterodimers
with each partner recognizing specific DNA sequences, called response elements356.
These response elements exist as direct, indirect or inverted half-sites separated by
variable length nucleotide spacers357.
NRs have been classified depending upon their binding partner and the type of
response element to which they bind356. Class I NRs include the steroid hormones and
bind to inverted repeats358, and Class II NRs are heterodimeric partners of RXR and bind
to direct repeats359. The other two classes of NRs are orphan receptors binding to direct
repeats and NRs acting as monomers to bind to a single half-site356,357. NRs can also be
categorized based upon their mechanism of action, which includes their ligand binding
while the NR is located in the cytosol (Type I) or nucleus (Type II)360. The large number
of heterodimer combinations between different NRs and their diversity of isoform
expression depending on cell type and development could generate significant diversity
in gene regulation361.
The expression of ABCG2 is altered by many types of stimuli, including
hypoxia314, inflammation315, xenobiotics316, hormones317,318 and nutrients319,320. There is
much evidence supporting the regulation of ABCG2 by NR pathways, including those for

43
the ER, PR, AhR, HIF, pregnane X receptor (PXR), constitutive androstane receptor
(CAR), glucocorticoid receptor (GR), retinoid-related orphan receptor (ROR),
peroxisome proliferator-activated receptor (PPAR) and NF-E2 related factor-2 (Nrf2)314–
320,328–331,362. The understanding of the pathways and xenobiotics that regulate ABCG2
expression could have application clinically. For example, it has been proposed to utilize
statins as a treatment of gout because statins are able to alter ABCG2 expression114. Since
~13% of current drugs target NRs363, it is imperative we understand the NR
transcriptional regulation of drug enzymes and transporters, especially ABCG2.
1.11.1 Estrogen Receptor
The ER is a class I and type I NR and is usually activated by 17β-estradiol (E2),
but can be activated or suppressed by several other types of estrogens357. The ER has two
forms, ERα and ERβ, that have specific tissue expression and regulate overlapping but
different cellular pathways357. The ER is important in many cellular processes, including
growth, differentiation, inflammation and function of the sexual organs364. The ER also
plays a major role in many cancers, including breast, ovarian, colorectal, prostate, and
endometrial364. The ER binds to estrogen responsive elements (ERE) almost exclusively
in cis-regulatory regions; it has only been found to bind to 4% of the proximal promoters
for estrogen responsive genes365. Additionally, ER works in concert with many other TFs
and co-factors to activate its target genes. The presence of the general TFs AP-1, Sp1 and
CREB1, substantially increase the modulation of activity with estrogen treatment364,366–
369. Additionally, GATA3 is integral to the ERα receptor pathway in several tissues,
including kidney and breast370. Other transcriptional co-factors, like p300, AP-2γ and

44
FoxA1, directly interact with ER and work as long-range tethering sites for the ERα-
mediated transcription368,371. ER dimerizes with many other NRs, including the hepatic
nuclear factor (HNF)-4, thyroid receptor (TR), retinoic acid receptor (RAR), retinoid X
receptor (RXR), and the vitamin D receptor (VDR)361. The type of response that ERs
elicit upon ligand binding depends on the expression of the two ER forms, which ER
ligand has bound, other cofactors that are present and chromosome conformation364.
Stimulation of ER both induces318,372,373 and downregulates224,374,375 ABCG2
expression. The ability of ER to either increase or decrease ABCG2 expression depends
on both the tissue and presence of other NR224,318,372–375. Additionally, ER often shares
response elements with the progesterone receptor (PR), such as the ER/PR element found
in the ABCG2 proximal promoter317. The ER and PR have a normal role in the
upregulation of ABCG2 during pregnancy to augment protection of the fetus26,79,329.
Understanding the ER regulation pathway for ABCG2 is vital because of the role both of
these proteins play in the placenta and mammary tissues26,28.
1.11.2 Glucocorticoid Receptor
The GR is another type I, class I NR that is expressed in almost every tissue and is
activated by glucocorticoids376. After being released from its repressors by one of its
ligands, GR works to trans-repress target genes by binding to other TFs in the nucleus
such as AP-1 or NF-κB and inhibiting them from activating transcription of the target
gene377. Glucocorticoids have a broad endogenous role in the body, including regulation
of growth, metabolic, immune and stress related pathways, and are critical for the
function of the central nervous, digestive, hematopoietic, renal, and reproductive

45
systems226,376,378,379. Due to the powerful anti-inflammatory and immunosuppressive
action of glucocorticoids, they are widely utilized for treatment of acute and chronic
inflammatory diseases, autoimmune diseases, organ transplant rejection, and
malignancies of the lymphoid system378,380.
The majority of glucocorticoid response elements (GREs) are >10 kb from the
transcriptional start site of glucocorticoid responsive genes, with only 9% of GREs in the
proximal promoter381. The ~1000 bp surrounding a GRE is evolutionarily conserved and
the level of conservation for a predicted GRE is correlated to the extent of GR occupancy
at that element382. Many other TFs are associated with GREs, including AP-1, ETS,
C/EBP or HNF4381. AP-2 also interacts with GR383, and is implicated along with PPAR
and the liver X receptor (LXR) in cell response to inflammation379,384.
The GR ligand dexamethasone increases the expression of both PXR and RXR385,
which in turn increases the expression of genes by increasing activity of NR/RXR
dimers386,387. Due to dexamethasone’s ability to induce PXR expression, dexamethasone
is capable of acting via direct GR-dependent mechanisms at either low concentrations or
short exposure and via a PXR-dependent mechanism at high concentration or long
exposure386,388,389. Dexamethasone decreases ABCG2 expression both in vivo390 and in
vitro391. Both GR and PXR regulatory elements of ABCG2 must be identified and
characterized in order to understand the pathways that dexamethasone utilizes to regulate
ABCG2.

46
1.11.3 Retinoid X Receptor
The RXR proteins RXRα/β are essential dimerization partners of many steroid
hormone receptors and other NRs, including PXR, LXR, CAR, PPAR and the farnesoid
X receptor (FXR). However, a biological role and ligand for RXR has not been
identified359. RXRα interacts with HNF4α, and both RXRα and HNF4α interact with
ERα361. In addition to the importance of RXRα and ERα in the placenta, HNF4α and
RXRα are important liver specific nuclear factors359,392. Thus, the pathways of RXR/NR
regulation and their target tissues overlap with that of the MXR protein and give support
for the possible regulation of ABCG2 by RXR/NR dimers.
The function of RXR/NR dimers can be repressed by the interaction of the
octamer 1 (Oct-1, POU2F1) TF393. In addition to RXR, Oct-1 interacts with GR, AR and
PR393–395. Additionally, RXR dimerized with PPAR, CAR or LXR binds to GR or ER
response elements, inhibiting the ER or GR response396–399. The restrictive expression
patterns for RXRα/β and the activation or repression of gene expression being dependent
on interaction with other co-factors could explain how this NR affects expression of
genes in selected tissues359.
1.11.4 Pregnane X Receptor
PXR is a NR critical in the regulation of hepatic genes and drug metabolizing
enzymes and transporters400. PXR is a Type I, Class II NR that is activated by a variety of
ligands including steroids, bile acids and antibiotics401. The most common PXR ligand is
rifampin402. Upon binding of its ligand, PXR dissociates from its regulatory proteins in
the cytoplasm, translocates to the nucleus and alters gene expression through
47
heterodimerizing with RXR. PXR is predominantly expressed in liver, small intestine and
colon, as well as other tissues, cancer cell lines and tumor samples401.
The expression of PXR mRNA is correlated with the expression of ABCG2
mRNA403,404, and rifampin induces ABCG2 expression316,405. PXR is also activated by
other ligands, including statins and the bile acid lithocholic acid406. Since ABCG2 is
integral in statin response108 and the development of gout204, PXR is a candidate for
linking ABCG2 expression with disease or drug response. The ability of rifampin to
induce ABCG2 expression and the correlation of PXR with ABCG2 indicate that PXR
can regulate ABCG2316,403–405. Additionally, the identification of PXR response elements
and a better understanding of the PXR induction pathway for ABCG2 could identify new
therapeutic targets.
1.11.5 Farnesoid and Liver X Receptors
LXR and FXR both dimerize with RXR and are Type II and Class II NRs highly
expressed in the intestine and liver407. These NRs bind DNA in a complex with
corepressors and become active once the ligand displaces the corepressors and recruits
coactivators407. FXR is a known regulator of bile acid408, lipid homeostasis409 and drug
metabolizing and transport genes352, especially those involved in statin response410–412.
Lower expressing variants of FXR in combination with reduced function of ABCG2 have
recently been linked to statin response413. LXR binds to cholesterol metabolites, regulates
cholesterol turnover and hepatic glucose metabolism and represses a set of inflammatory
genes in immune cells399. Additionally, LXR is implicated along with PPAR in cell
response to inflammation379,384. Unlike the other ABCG genes407, there has been no FXR

48
or LXR response elements identified for ABCG2. The identification of these elements
would aid in the understanding of the effects of FXR and LXR dynamics on ABCG2
regulation during homeostasis and drug targeting of bile acid, cholesterol and lipid
pathways.
1.11.6 Aryl Hydrocarbon Receptor
The aryl hydrocarbon receptor (AhR) is a Class I, Type II NR that translocates to
the nucleus upon ligand binding and dimerizes with the aryl hydrocarbon receptor nuclear
translocator (ARNT)414 or ER415. Additionally, AhR dimerizes with several other NR414
and has recently been shown to recognize nontraditional AhRE motifs416,417. Many
carcinogens are known ligands of AhR and through AhR induce multiple metabolizing
enzymes and drug transporters418. Exposure to carcinogens causes DNA damage that
leads to DNA mutations419, and exposure to exogenous carcinogens are a factor in the
development, severity and aggressiveness of cancer. ABCG2 expression is increased with
carcinogen exposure176,420,421. The expression of ABCG2 and activity of its promoter are
both altered by exposure to AhR ligands327,328,422. This induction of ABCG2 expression
through the AhR pathway would allow the body to protect itself, and its vital organs,
from exposure to these carcinogens.
1.11.7 COUP-TFII
Chicken ovalbumin upstream promoter-transcription factor II (COUP-TFII), is a
member of the steroid NR family and is important in glucose, cholesterol and xenobiotic
metabolism pathways423. COUP-TFII binds to the same direct repeat segments as VDR,

49
TR, RAR, RXR, PPAR and HNF4423. Therefore, COUP-TFII exerts negative regulatory
function on these NRs by competing for their common response element, forming
inactive heterodimers or tethering the corepressor silencing mediator for retinoid and
thyroid hormone receptor (SMRT), and tightening the chromatin structure423–425. In
contrast, the binding of GR stimulates COUP-TFII induced transactivation by attracting
cofactors, while COUP-TFII binding will repress the GR-governed transcriptional
activity424. The restrictive expression patterns for COUP-TF426 and its dynamic
interactions with many other NRs could explain how it affects expression of genes in
selected tissues.
1.12 Summary
The MXR protein is expressed apically in numerous tissues, especially those
relevant for drug absorption and excretion, and has a number of natural and synthetic
substrates and inhibitors. The MXR transporter has several amino acid variants
implicated in altered drug response and cancer risk. Finally, the wide variability in
mRNA expression of ABCG2 can be attributed to the activity of the basal ABCG2
promoter, DNA methylation and regulation by NRs. Much has been done to understand
the role MXR plays in protection from toxins, drug pharmacokinetics,
pharmacodynamics, and toxicity, cancer risk and severity, and distribution of nutrients
and natural compounds. However, little is known about the function and substrate
profiles of amino acid variants of MXR and the mechanisms that regulate ABCG2. These
mechanisms need to be fully elucidated to aid in the translation of MXR
pharmacogenomics into clinical application.

50
1.13 Focus of Thesis
1.13.1 Rationale
There is interindividual variability in the therapeutic response, pharmacokinetic
and pharmacodynamic profiles of MXR substrates, as well as in the expression of MXR
among healthy individuals and in cancerous tissues. It was been demonstrated that
ABCG2 responds to different stimuli and is thus altered through exposure to different
compounds. Additionally, ABCG2 is polymorphic and many of its nonsynonymous
variants have not been characterized; of those that have, there are conflicting reports on
substrate-dependent effects, activity and localization. Therefore, in addition to continued
characterization of ABCG2 nonsynonymous variants, the mechanisms and cis-regulatory
elements involved in regulation of ABCG2 and the corresponding effects of SNPs within
these elements must be examined.
1.13.2 Hypotheses
First, I hypothesize that some MXR variants exhibit altered substrate profiles,
expression and localization compared to the reference transporter. Second, I hypothesize
that SNPs within the ABCG2 proximal promoter and cis-regulatory elements of the
ABCG2 locus affect the ability of these elements to regulate transcription. Third, I
hypothesize that the activity of some cis-regulatory elements in the ABCG2 locus can be
attributed to regulation by nuclear receptors. Finally, I hypothesize that DNA methylation
patterns in the ABCG2 locus are tissue-specific and regulate the transcription of ABCG2.

51
1.13.3 Specific aims
1. Characterize nonsynonymous variants of ABCG2. Cell based assays were used to
examine in vitro expression and localization, and flow cytometry and inside-out
membrane vesicles were used to examine ATPase, indirect and direct transport
activity of MXR variant transporters (Chapter 2).
2. Examine the effects of SNPs on ABCG2 promoter activity through in silico
transcription factor binding predictions, in vitro luciferase assays and an in vivo
hydrodynamic tail vein assay (Chapter 3).
3. Identify cis-regulatory elements in the ABCG2 gene locus through in silico
predictions, in vitro luciferase assays and an in vivo hydrodynamic tail vein assay
(Chapter 4). Similar methods were used to examine the effects of SNPs within
these elements on their activity, and enhancer variants were associated with gene
expression (Chapter 5).
4. Examine the response to nuclear receptor ligands of in silico predicted cis-
regulatory elements in the ABCG2 locus, the ABCG2 promoter and their SNPs
through in vitro luciferase assays (Chapter 6).
5. Examine epigenetic DNA modifications in the ABCG2 locus in human liver and
kidney tissues and their association with ABCG2 expression (Chapter 7).
Collectively, these studies will enhance our understanding of how genetic and epigenetic
changes influence MXR function and expression. The results from this research will
drive future clinical investigations examining how interindividual variation in MXR
expression and function contributes to differences in drug response.

52
1.14 References
(1) Schinkel, A. H.; Jonker, J. W. Mammalian drug efflux transporters of the ATP binding cassette (ABC) family: an overview. Advanced drug delivery reviews 2003, 55, 3–29.
(2) Giacomini, K. M.; Huang, S.-M.; Tweedie, D. J.; Benet, L. Z.; Brouwer, K. L. R.; Chu, X.; Dahlin, A.; Evers, R.; Fischer, V.; Hillgren, K. M.; Hoffmaster, K. a; Ishikawa, T.; Keppler, D.; Kim, R. B.; Lee, C. a; Niemi, M.; Polli, J. W.; Sugiyama, Y.; Swaan, P. W.; Ware, J. a; Wright, S. H.; Yee, S. W.; Zamek-Gliszczynski, M. J.; Zhang, L. Membrane transporters in drug development. Nature reviews. Drug discovery 2010, 9, 215–36.
(3) Mo, W.; Zhang, J.-T. Human ABCG2: structure, function, and its role in multidrug resistance. International journal of biochemistry and molecular biology 2012, 3, 1–27.
(4) Mao, Q.; Unadkat, J. D. Role of the breast cancer resistance protein (ABCG2) in drug transport. The AAPS journal 2005, 7, E118–33.
(5) Kim, K.; Joo, H.-J.; Park, J.-Y. ABCG2 polymorphisms, 34G>A and 421C>A in a Korean population: analysis and a comprehensive comparison with other populations. Journal of clinical pharmacy and therapeutics 2010, 35, 705–12.
(6) Tamura, A.; Onishi, Y.; An, R.; Koshiba, S.; Wakabayashi, K.; Hoshijima, K.; Priebe, W.; Yoshida, T.; Kometani, S.; Matsubara, T.; Mikuriya, K.; Ishikawa, T. In vitro evaluation of photosensitivity risk related to genetic polymorphisms of human ABC transporter ABCG2 and inhibition by drugs. Drug metabolism and pharmacokinetics 2007, 22, 428–40.
(7) Wakabayashi, K.; Tamura, A.; Saito, H.; Onishi, Y.; Ishikawa, T. Human ABC transporter ABCG2 in xenobiotic protection and redox biology. Drug metabolism reviews 2006, 38, 371–91.
(8) Ishikawa, T.; Tamura, A.; Saito, H.; Wakabayashi, K.; Nakagawa, H. Pharmacogenomics of the human ABC transporter ABCG2: from functional evaluation to drug molecular design. Die Naturwissenschaften 2005, 92, 451–63.
(9) Yanase, K.; Tsukahara, S.; Mitsuhashi, J.; Sugimoto, Y. Functional SNPs of the breast cancer resistance protein-therapeutic effects and inhibitor development. Cancer letters 2006, 234, 73–80.
(10) Tamura, A.; Watanabe, M.; Saito, H.; Nakagawa, H.; Kamachi, T.; Okura, I.; Ishikawa, T. Functional validation of the genetic polymorphisms of human ATP-binding cassette (ABC) transporter ABCG2: identification of alleles that are defective in porphyrin transport. Molecular pharmacology 2006, 70, 287–96.

53
(11) Yoshioka, S.; Katayama, K.; Okawa, C.; Takahashi, S.; Tsukahara, S.; Mitsuhashi, J.; Sugimoto, Y. The identification of two germ-line mutations in the human breast cancer resistance protein gene that result in the expression of a low/non-functional protein. Pharmaceutical research 2007, 24, 1108–17.
(12) Gradhand, U.; Kim, R. B. Pharmacogenomics of MRP transporters (ABCC1-5) and BCRP (ABCG2). Drug metabolism reviews 2008, 40, 317–54.
(13) Giri, N.; Agarwal, S.; Shaik, N.; Pan, G.; Chen, Y.; Elmquist, W. F. Substrate-Dependent Breast Cancer Resistance Protein ( Bcrp1 / Abcg2 ) -Mediated Interactions : Consideration of Multiple Binding Sites in in Vitro Assay Design. Pharmacology 2009, 37, 560–570.
(14) Hegedus, C.; Szakács, G.; Homolya, L.; Orbán, T. I.; Telbisz, A.; Jani, M.; Sarkadi, B. Ins and outs of the ABCG2 multidrug transporter: an update on in vitro functional assays. Advanced drug delivery reviews 2009, 61, 47–56.
(15) Poonkuzhali, B.; Lamba, J.; Strom, S.; Sparreboom, A.; Thummel, K.; Watkins, P.; Schuetz, E. Association of breast cancer resistance protein/ABCG2 phenotypes and novel promoter and intron 1 single nucleotide polymorphisms. Drug metabolism and disposition: the biological fate of chemicals 2008, 36, 780–95.
(16) Robey, R. W.; To, K. K. K.; Polgar, O.; Dohse, M.; Fetsch, P.; Dean, M.; Bates, S. E. ABCG2: a perspective. Advanced drug delivery reviews 2009, 61, 3–13.
(17) Evans, W. E.; Relling, M. V Moving towards individualized medicine with pharmacogenomics. Nature 2004, 429, 464–8.
(18) Daly, A. K. Pharmacogenetics and human genetic polymorphisms. The Biochemical journal 2010, 429, 435–49.
(19) Miyake, K.; Mickley, L.; Litman, T.; Zhan, Z.; Robey, R.; Cristensen, B.; Brangi, M.; Greenberger, L.; Dean, M.; Fojo, T.; Bates, S. E. Molecular cloning of cDNAs which are highly overexpressed in mitoxantrone-resistant cells: demonstration of homology to ABC transport genes. Cancer research 1999, 59, 8–13.
(20) Litman, T.; Brangi, M.; Hudson, E.; Fetsch, P.; Abati, A.; Ross, D. D.; Miyake, K.; Resau, J. H.; Bates, S. E. The multidrug-resistant phenotype associated with overexpression of the new ABC half-transporter, MXR (ABCG2). Journal of cell science 2000, 113 ( Pt 1, 2011–21.
(21) Doyle, L. a; Yang, W.; Abruzzo, L. V; Krogmann, T.; Gao, Y.; Rishi, a K.; Ross, D. D. A multidrug resistance transporter from human MCF-7 breast cancer cells. Proceedings of the National Academy of Sciences of the United States of America 1998, 95, 15665–70.

54
(22) Allikmets, R.; Schriml, L. M.; Hutchinson, A.; Romano-Spica, V.; Dean, M. A human placenta-specific ATP-binding cassette gene (ABCP) on chromosome 4q22 that is involved in multidrug resistance. Cancer research 1998, 58, 5337–9.
(23) Maliepaard, M.; Scheffer, G. L.; Faneyte, I. F.; Gastelen, A. Van; Pijnenborg, A. C. L. M. Subcellular Localization and Distribution of the Breast Cancer Resistance Protein Transporter in Normal Human Tissues Subcellular Localization and Distribution of the Breast Cancer Resistance Protein Transporter in Normal Human Tissues 1. 2001, 3458–3464.
(24) Fetsch, P. a; Abati, A.; Litman, T.; Morisaki, K.; Honjo, Y.; Mittal, K.; Bates, S. E. Localization of the ABCG2 mitoxantrone resistance-associated protein in normal tissues. Cancer letters 2006, 235, 84–92.
(25) Doyle, L. A.; Ross, D. D. Multidrug resistance mediated by the breast cancer resistance protein BCRP (ABCG2). Oncogene 2003, 22, 7340–58.
(26) Mao, Q. BCRP/ABCG2 in the placenta: expression, function and regulation. Pharmaceutical research 2008, 25, 1244–55.
(27) Kobayashi, D.; Ieiri, I.; Hirota, T.; Takane, H. Functional assessment of ABCG2 (BCRP) gene polymorphisms to protein expression in human placenta. Drug metabolism and 2005, 33, 94–101.
(28) Yeboah, D.; Sun, M.; Kingdom, J.; Baczyk, D.; Lye, S. J.; Matthews, S. G.; Gibb, W. Expression of breast cancer resistance protein ( BCRP / ABCG2 ) in human placenta throughout gestation and at term before and after labor. 2006, 1258, 1251–1258.
(29) Cooray, H. C.; Blackmore, C. G.; Maskell, L.; Barrand, M. a Localisation of breast cancer resistance protein in microvessel endothelium of human brain. Neuroreport 2002, 13, 2059–63.
(30) Abbott, B. L. ABCG2 (BCRP): a cytoprotectant in normal and malignant stem cells. Clinical advances in hematology & oncology : H&O 2006, 4, 63–72.
(31) Hirschmann-Jax, C.; Foster, a E.; Wulf, G. G.; Nuchtern, J. G.; Jax, T. W.; Gobel, U.; Goodell, M. a; Brenner, M. K. A distinct “side population” of cells with high drug efflux capacity in human tumor cells. Proceedings of the National Academy of Sciences of the United States of America 2004, 101, 14228–33.
(32) Zhou, S.; Schuetz, J. D.; Bunting, K. D.; Colapietro, a M.; Sampath, J.; Morris, J. J.; Lagutina, I.; Grosveld, G. C.; Osawa, M.; Nakauchi, H.; Sorrentino, B. P. The ABC transporter Bcrp1/ABCG2 is expressed in a wide variety of stem cells and is a molecular determinant of the side-population phenotype. Nature medicine 2001, 7, 1028–34.
55
(33) Rocchi, E.; Khodjakov, a; Volk, E. L.; Yang, C. H.; Litman, T.; Bates, S. E.; Schneider, E. The product of the ABC half-transporter gene ABCG2 (BCRP/MXR/ABCP) is expressed in the plasma membrane. Biochemical and biophysical research communications 2000, 271, 42–6.
(34) Lemos, C.; Kathmann, I.; Giovannetti, E.; Beliën, J. a M.; Scheffer, G. L.; Calhau, C.; Jansen, G.; Peters, G. J. Cellular folate status modulates the expression of BCRP and MRP multidrug transporters in cancer cell lines from different origins. Molecular cancer therapeutics 2009, 8, 655–64.
(35) Choudhuri, S.; Klaassen, C. D. Structure, function, expression, genomic organization, and single nucleotide polymorphisms of human ABCB1 (MDR1), ABCC (MRP), and ABCG2 (BCRP) efflux transporters. International journal of toxicology 2006, 25, 231–59.
(36) Kusuhara, H.; Sugiyama, Y. ATP-binding cassette, subfamily G (ABCG family). Pflügers Archiv : European journal of physiology 2007, 453, 735–44.
(37) Ni, Z.; Bikadi, Z.; Rosenberg, M. F.; Mao, Q. Structure and function of the human breast cancer resistance protein (BCRP/ABCG2). Current drug metabolism 2010, 11, 603.
(38) Mohrmann, K.; Van Eijndhoven, M. a J.; Schinkel, A. H.; Schellens, J. H. M. Absence of N-linked glycosylation does not affect plasma membrane localization of breast cancer resistance protein (BCRP/ABCG2). Cancer chemotherapy and pharmacology 2005, 56, 344–50.
(39) Shigeta, J.; Katayama, K.; Mitsuhashi, J.; Noguchi, K.; Sugimoto, Y. BCRP/ABCG2 confers anticancer drug resistance without covalent dimerization. Cancer science 2010, 101, 1813–21.
(40) Polgar, O.; Ierano, C.; Tamaki, A.; Stanley, B.; Ward, Y.; Xia, D.; Tarasova, N.; Robey, R. W.; Bates, S. E. Mutational analysis of threonine 402 adjacent to the GXXXG dimerization motif in transmembrane segment 1 of ABCG2. Biochemistry 2010, 49, 2235–45.
(41) Polgar, O.; Ediriwickrema, L. S.; Robey, R. W.; Sharma, A.; Hegde, R. S.; Li, Y.; Xia, D.; Ward, Y.; Dean, M.; Ozvegy-Laczka, C.; Sarkadi, B.; Bates, S. E. Arginine 383 is a crucial residue in ABCG2 biogenesis. Biochimica et biophysica acta 2009, 1788, 1434–43.
(42) Ozvegy-Laczka, C.; Köblös, G.; Sarkadi, B.; Váradi, A. Single amino acid (482) variants of the ABCG2 multidrug transporter: major differences in transport capacity and substrate recognition. Biochimica et biophysica acta 2005, 1668, 53–63.

56
(43) Polgar, O.; Bates, S. E. ABC transporters in the balance: is there a role in multidrug resistance? Biochemical Society transactions 2005, 33, 241–5.
(44) Xu, J.; Liu, Y.; Yang, Y.; Bates, S.; Zhang, J. Characterization of oligomeric human half-ABC transporter ATP-binding cassette G2. The Journal of biological chemistry 2004, 279, 19781–9.
(45) Bhatia, A.; Schäfer, H.-J.; Hrycyna, C. a Oligomerization of the human ABC transporter ABCG2: evaluation of the native protein and chimeric dimers. Biochemistry 2005, 44, 10893–904.
(46) Leslie, E. M.; Deeley, R. G.; Cole, S. P. C. Multidrug resistance proteins: role of P-glycoprotein, MRP1, MRP2, and BCRP (ABCG2) in tissue defense. Toxicology and applied pharmacology 2005, 204, 216–37.
(47) Posner, L. E.; Dukart, G.; Goldberg, J.; Bernstein, T.; Cartwright, K. Mitoxantrone: an overview of safety and toxicity. Investigational new drugs 1985, 3, 123–32.
(48) Scott, L. J.; Figgitt, D. P. Mitoxantrone: a review of its use in multiple sclerosis. CNS drugs 2004, 18, 379–96.
(49) Carles, J.; Castellano, D.; Climent, M. Á.; Maroto, P.; Medina, R.; Alcaraz, A. Castration-resistant metastatic prostate cancer: current status and treatment possibilities. Clinical & translational oncology : official publication of the Federation of Spanish Oncology Societies and of the National Cancer Institute of Mexico 2012, 14, 169–76.
(50) Atiba, J. O.; Green, S. J.; Hynes, H. E.; Osborne, C. K.; Miller, T. P.; Davidner, M. Phase II evaluation of mitoxantrone plus cis-platinum in patients with advanced breast cancer. A Southwest Oncology Group study. Investigational new drugs 1994, 12, 129–32.
(51) Nakagawa, M.; Schneider, E.; Dixon, K. H.; Horton, J.; Kelley, K.; Morrow, C.; Cowan, K. H. Reduced intracellular drug accumulation in the absence of P-glycoprotein (mdr1) overexpression in mitoxantrone-resistant human MCF-7 breast cancer cells. Cancer research 1992, 52, 6175–81.
(52) Ishii, M.; Iwahana, M.; Mitsui, I.; Minami, M.; Imagawa, S. Growth inhibitory effect of a new camptothecin analog , DX-8951f , on various drug-resistant sublines including BCRP-mediated camptothecin derivative- resistant variants derived from the human lung cancer cell line PC-6. 2000, 353–362.
(53) Rabindran, S. K.; Ross, D. D.; Doyle, L. A.; Yang, W.; Greenberger, L. M. Fumitremorgin C reverses multidrug resistance in cells transfected with the breast cancer resistance protein. Cancer research 2000, 60, 47–50.

57
(54) Shiozawa, K.; Oka, M.; Soda, H.; Yoshikawa, M.; Ikegami, Y.; Tsurutani, J.; Nakatomi, K.; Nakamura, Y.; Doi, S.; Kitazaki, T.; Mizuta, Y.; Murase, K.; Yoshida, H.; Ross, D. D.; Kohno, S. Reversal of breast cancer resistance protein (BCRP/ABCG2)-mediated drug resistance by novobiocin, a coumermycin antibiotic. International journal of cancer. Journal international du cancer 2004, 108, 146–51.
(55) Breedveld, P.; Pluim, D.; Cipriani, G.; Dahlhaus, F.; Van Eijndhoven, M. A. J.; De Wolf, C. J. F.; Kuil, A.; Beijnen, J. H.; Scheffer, G. L.; Jansen, G.; Borst, P.; Schellens, J. H. M. The effect of low pH on breast cancer resistance protein (ABCG2)-mediated transport of methotrexate, 7-hydroxymethotrexate, methotrexate diglutamate, folic acid, mitoxantrone, topotecan, and resveratrol in in vitro drug transport models. Molecular pharmacology 2007, 71, 240–9.
(56) Brangi, M.; Litman, T.; Ciotti, M.; Nishiyama, K.; Kohlhagen, G.; Takimoto, C.; Robey, R.; Pommier, Y.; Fojo, T.; Bates, S. E. Camptothecin resistance: role of the ATP-binding cassette (ABC), mitoxantrone-resistance half-transporter (MXR), and potential for glucuronidation in MXR-expressing cells. Cancer research 1999, 59, 5938–46.
(57) Yuan, J.; Lv, H.; Peng, B.; Wang, C.; Yu, Y.; He, Z. Role of BCRP as a biomarker for predicting resistance to 5-fluorouracil in breast cancer. Cancer chemotherapy and pharmacology 2009, 63, 1103–10.
(58) Ozvegy, C.; Litman, T.; Szakács, G.; Nagy, Z.; Bates, S.; Váradi, a; Sarkadi, B. Functional characterization of the human multidrug transporter, ABCG2, expressed in insect cells. Biochemical and biophysical research communications 2001, 285, 111–7.
(59) Allen, J. D.; Van Dort, S. C.; Buitelaar, M.; Van Tellingen, O.; Schinkel, A. H. Mouse breast cancer resistance protein (Bcrp1/Abcg2) mediates etoposide resistance and transport, but etoposide oral availability is limited primarily by P-glycoprotein. Cancer research 2003, 63, 1339–44.
(60) Polli, J. W.; Baughman, T. M.; Humphreys, J. E.; Jordan, K. H.; Mote, A. L.; Webster, L. O.; Barnaby, R. J.; Vitulli, G.; Bertolotti, L.; Read, K. D.; Serabjit-Singh, C. J. The systemic exposure of an N-methyl-D-aspartate receptor antagonist is limited in mice by the P-glycoprotein and breast cancer resistance protein efflux transporters. Drug metabolism and disposition: the biological fate of chemicals 2004, 32, 722–6.
(61) Nakagawa, R.; Hara, Y.; Arakawa, H.; Nishimura, S.; Komatani, H. ABCG2 confers resistance to indolocarbazole compounds by ATP-dependent transport. Biochemical and biophysical research communications 2002, 299, 669–75.
58
(62) Robey, R. W.; Obrzut, T.; Shukla, S.; Polgar, O.; Macalou, S.; Bahr, J. C.; Di Pietro, A.; Ambudkar, S. V; Bates, S. E. Becatecarin (rebeccamycin analog, NSC 655649) is a transport substrate and induces expression of the ATP-binding cassette transporter, ABCG2, in lung carcinoma cells. Cancer chemotherapy and pharmacology 2009, 64, 575–83.
(63) Komatani, H.; Kotani, H.; Hara, Y.; Nakagawa, R.; Matsumoto, M.; Arakawa, H.; Nishimura, S. Identification of breast cancer resistant protein/mitoxantrone resistance/placenta-specific, ATP-binding cassette transporter as a transporter of NB-506 and J-107088, topoisomerase I inhibitors with an indolocarbazole structure. Cancer research 2001, 61, 2827–32.
(64) Volk, E. L.; Schneider, E. Wild-type breast cancer resistance protein (BCRP/ABCG2) is a methotrexate polyglutamate transporter. Cancer research 2003, 63, 5538–43.
(65) Volk, E. L.; Farley, K. M.; Wu, Y.; Li, F.; Robey, R. W.; Schneider, E. Overexpression of wild-type breast cancer resistance protein mediates methotrexate resistance. Cancer research 2002, 62, 5035–40.
(66) Chen, Z.; Robey, R. W.; Belinsky, M. G.; Shchaveleva, I.; Ren, X.; Sugimoto, Y.; Ross, D. D.; Bates, S. E.; Kruh, G. D. Transport of methotrexate, methotrexate polyglutamates, and 17beta-estradiol 17-(beta-D-glucuronide) by ABCG2: effects of acquired mutations at R482 on methotrexate transport. Cancer research 2003, 63, 4048–54.
(67) Bram, E.; Ifergan, I.; Shafran, A.; Berman, B.; Jansen, G.; Assaraf, Y. G. Mutant Gly482 and Thr482 ABCG2 mediate high-level resistance to lipophilic antifolates. Cancer chemotherapy and pharmacology 2006, 58, 826–34.
(68) Mitomo, H.; Kato, R.; Ito, A.; Kasamatsu, S.; Ikegami, Y.; Kii, I.; Kudo, A.; Kobatake, E.; Sumino, Y.; Ishikawa, T. A functional study on polymorphism of the ATP-binding cassette transporter ABCG2: critical role of arginine-482 in methotrexate transport. The Biochemical journal 2003, 373, 767–74.
(69) Shafran, A.; Ifergan, I.; Bram, E.; Jansen, G.; Kathmann, I.; Peters, G. J.; Robey, R. W.; Bates, S. E.; Assaraf, Y. G. ABCG2 harboring the Gly482 mutation confers high-level resistance to various hydrophilic antifolates. Cancer research 2005, 65, 8414–22.
(70) De Wolf, C.; Jansen, R.; Yamaguchi, H.; De Haas, M.; Van de Wetering, K.; Wijnholds, J.; Beijnen, J.; Borst, P. Contribution of the drug transporter ABCG2 (breast cancer resistance protein) to resistance against anticancer nucleosides. Molecular cancer therapeutics 2008, 7, 3092–102.

59
(71) Robey, R. W.; Honjo, Y.; Morisaki, K.; Nadjem, T. a; Runge, S.; Risbood, M.; Poruchynsky, M. S.; Bates, S. E. Mutations at amino-acid 482 in the ABCG2 gene affect substrate and antagonist specificity. British journal of cancer 2003, 89, 1971–8.
(72) Honjo, Y.; Hrycyna, C. A.; Yan, Q. W.; Medina-Pérez, W. Y.; Robey, R. W.; Van de Laar, A.; Litman, T.; Dean, M.; Bates, S. E. Acquired mutations in the MXR/BCRP/ABCP gene alter substrate specificity in MXR/BCRP/ABCP-overexpressing cells. Cancer research 2001, 61, 6635–9.
(73) De Jong, F. a; De Jonge, M. J. a; Verweij, J.; Mathijssen, R. H. J. Role of pharmacogenetics in irinotecan therapy. Cancer letters 2006, 234, 90–106.
(74) Maliepaard, M.; Van Gastelen, M. A.; De Jong, L. A.; Pluim, D.; Van Waardenburg, R. C.; Ruevekamp-Helmers, M. C.; Floot, B. G.; Schellens, J. H. Overexpression of the BCRP/MXR/ABCP gene in a topotecan-selected ovarian tumor cell line. Cancer research 1999, 59, 4559–63.
(75) Maliepaard, M.; Van Gastelen, M. A.; Tohgo, A.; Hausheer, F. H.; Van Waardenburg, R. C.; De Jong, L. A.; Pluim, D.; Beijnen, J. H.; Schellens, J. H. Circumvention of breast cancer resistance protein (BCRP)-mediated resistance to camptothecins in vitro using non-substrate drugs or the BCRP inhibitor GF120918. Clinical cancer research : an official journal of the American Association for Cancer Research 2001, 7, 935–41.
(76) Nakatomi, K.; Yoshikawa, M.; Oka, M.; Ikegami, Y.; Hayasaka, S.; Sano, K.; Shiozawa, K.; Kawabata, S.; Soda, H.; Ishikawa, T.; Tanabe, S.; Kohno, S. Transport of 7-ethyl-10-hydroxycamptothecin (SN-38) by breast cancer resistance protein ABCG2 in human lung cancer cells. Biochemical and biophysical research communications 2001, 288, 827–32.
(77) Bates, S. E.; Medina-Pérez, W. Y.; Kohlhagen, G.; Antony, S.; Nadjem, T.; Robey, R. W.; Pommier, Y. ABCG2 mediates differential resistance to SN-38 (7-ethyl-10-hydroxycamptothecin) and homocamptothecins. The Journal of pharmacology and experimental therapeutics 2004, 310, 836–42.
(78) Kawabata, S.; Oka, M.; Shiozawa, K.; Tsukamoto, K.; Nakatomi, K.; Soda, H.; Fukuda, M.; Ikegami, Y.; Sugahara, K.; Yamada, Y.; Kamihira, S.; Doyle, L. a; Ross, D. D.; Kohno, S. Breast cancer resistance protein directly confers SN-38 resistance of lung cancer cells. Biochemical and biophysical research communications 2001, 280, 1216–23.
(79) Jonker, J. W.; Smit, J. W.; Brinkhuis, R. F.; Maliepaard, M.; Beijnen, J. H.; Schellens, J. H.; Schinkel, A. H. Role of breast cancer resistance protein in the bioavailability and fetal penetration of topotecan. Journal of the National Cancer Institute 2000, 92, 1651–6.

60
(80) Rajendra, R.; Gounder, M. K.; Saleem, A.; Schellens, J. H. M.; Ross, D. D.; Bates, S. E.; Sinko, P.; Rubin, E. H. Differential Effects of the Breast Cancer Resistance Protein on the Cellular Accumulation and Cytotoxicity of 9-Aminocamptothecin and 9-Nitrocamptothecin Differential Effects of the Breast Cancer Resistance Protein on the Cellular Accumulation and Cytotox. Cancer 2003, 3228–3233.
(81) Sparreboom, A.; Gelderblom, H.; Marsh, S.; Ahluwalia, R.; Obach, R.; Principe, P.; Twelves, C.; Verweij, J.; McLeod, H. L. Diflomotecan pharmacokinetics in relation to ABCG2 421C>A genotype. Clinical pharmacology and therapeutics 2004, 76, 38–44.
(82) Bessho, Y.; Oguri, T.; Achiwa, H.; Muramatsu, H.; Maeda, H.; Niimi, T.; Sato, S.; Ueda, R. Role of ABCG2 as a biomarker for predicting resistance to CPT-11/SN-38 in lung cancer. Cancer science 2006, 97, 192–8.
(83) Takahata, T.; Ookawa, K.; Suto, K.; Tanaka, M.; Yano, H.; Nakashima, O.; Kojiro, M.; Tamura, Y.; Tateishi, T.; Sakata, Y.; Fukuda, S. Chemosensitivity determinants of irinotecan hydrochloride in hepatocellular carcinoma cell lines. Basic & clinical pharmacology & toxicology 2008, 102, 399–407.
(84) Ishikawa, T.; Ikegami, Y.; Sano, K.; Nakagawa, H.; Sawada, S. Transport mechanism-based drug molecular design: novel camptothecin analogues to circumvent ABCG2-associated drug resistance of human tumor cells. Current pharmaceutical design 2006, 12, 313–25.
(85) Nakagawa, H.; Saito, H.; Ikegami, Y.; Aida-Hyugaji, S.; Sawada, S.; Ishikawa, T. Molecular modeling of new camptothecin analogues to circumvent ABCG2-mediated drug resistance in cancer. Cancer letters 2006, 234, 81–9.
(86) Jonker, J. W.; Merino, G.; Musters, S.; Van Herwaarden, A. E.; Bolscher, E.; Wagenaar, E.; Mesman, E.; Dale, T. C.; Schinkel, A. H. The breast cancer resistance protein BCRP (ABCG2) concentrates drugs and carcinogenic xenotoxins into milk. Nature medicine 2005, 11, 127–9.
(87) Sai, K.; Saito, Y.; Maekawa, K.; Kim, S.-R.; Kaniwa, N.; Nishimaki-Mogami, T.; Sawada, J.; Shirao, K.; Hamaguchi, T.; Yamamoto, N.; Kunitoh, H.; Ohe, Y.; Yamada, Y.; Tamura, T.; Yoshida, T.; Matsumura, Y.; Ohtsu, A.; Saijo, N.; Minami, H. Additive effects of drug transporter genetic polymorphisms on irinotecan pharmacokinetics/pharmacodynamics in Japanese cancer patients. Cancer chemotherapy and pharmacology 2010, 66, 95–105.
(88) Jada, S. R.; Lim, R.; Wong, C. I.; Shu, X.; Lee, S. C.; Zhou, Q.; Goh, B. C.; Chowbay, B. Role of UGT1A1*6, UGT1A1*28 and ABCG2 c.421C>A polymorphisms in irinotecan-induced neutropenia in Asian cancer patients. Cancer science 2007, 98, 1461–7.

61
(89) Sparreboom, A.; Loos, W. J.; Burger, H.; Sissung, T. M.; Verweij, J.; Figg, W. D.; Nooter, K.; Gelderblom, H. Effect of ABCG2 genotype on the oral bioavailability of topotecan. Cancer biology & therapy 2005, 4, 650–8.
(90) De Jong, F. a; Marsh, S.; Mathijssen, R. H. J.; King, C.; Verweij, J.; Sparreboom, A.; McLeod, H. L. ABCG2 pharmacogenetics: ethnic differences in allele frequency and assessment of influence on irinotecan disposition. Clinical cancer research : an official journal of the American Association for Cancer Research 2004, 10, 5889–94.
(91) Lemos, C.; Jansen, G.; Peters, G. J. Drug transporters: recent advances concerning BCRP and tyrosine kinase inhibitors. British journal of cancer 2008, 98, 857–62.
(92) Ross, D. D.; Karp, J. E.; Chen, T. T.; Doyle, L. A. Expression of breast cancer resistance protein in blast cells from patients with acute leukemia. Blood 2000, 96, 365–8.
(93) Nakanishi, T.; Karp, J. E.; Tan, M.; Doyle, L. A.; Peters, T.; Yang, W.; Wei, D.; Ross, D. D. Quantitative analysis of breast cancer resistance protein and cellular resistance to flavopiridol in acute leukemia patients. Clinical cancer research : an official journal of the American Association for Cancer Research 2003, 9, 3320–8.
(94) Breedveld, P.; Pluim, D.; Cipriani, G.; Wielinga, P.; Van Tellingen, O.; Schinkel, A. H.; Schellens, J. H. M. The effect of Bcrp1 (Abcg2) on the in vivo pharmacokinetics and brain penetration of imatinib mesylate (Gleevec): implications for the use of breast cancer resistance protein and P-glycoprotein inhibitors to enable the brain penetration of imatinib in pat. Cancer research 2005, 65, 2577–82.
(95) Burger, H.; Van Tol, H.; Boersma, A. W. M.; Brok, M.; Wiemer, E. a C.; Stoter, G.; Nooter, K. Imatinib mesylate (STI571) is a substrate for the breast cancer resistance protein (BCRP)/ABCG2 drug pump. Blood 2004, 104, 2940–2.
(96) Burger, H.; Nooter, K. Pharmacokinetic resistance to imatinib mesylate: role of the ABC drug pumps ABCG2 (BCRP) and ABCB1 (MDR1) in the oral bioavailability of imatinib. Cell cycle (Georgetown, Tex.) 2004, 3, 1502–5.
(97) Li, J.; Cusatis, G.; Brahmer, J.; Sparreboom, A.; Robey, R. W.; Bates, S. E.; Hidalgo, M.; Baker, S. D. Association of variant ABCG2 and the pharmacokinetics of epidermal growth factor receptor tyrosine kinase inhibitors in cancer patients. Cancer biology & therapy 2007, 6, 432–8.
(98) Elkind, N. B.; Szentpétery, Z.; Apáti, A.; Ozvegy-Laczka, C.; Várady, G.; Ujhelly, O.; Szabó, K.; Homolya, L.; Váradi, A.; Buday, L.; Kéri, G.; Német, K.; Sarkadi, B. Multidrug transporter ABCG2 prevents tumor cell death induced by the

62
epidermal growth factor receptor inhibitor Iressa (ZD1839, Gefitinib). Cancer research 2005, 65, 1770–7.
(99) Marchetti, S.; De Vries, N. a; Buckle, T.; Bolijn, M. J.; Van Eijndhoven, M. a J.; Beijnen, J. H.; Mazzanti, R.; Van Tellingen, O.; Schellens, J. H. M. Effect of the ATP-binding cassette drug transporters ABCB1, ABCG2, and ABCC2 on erlotinib hydrochloride (Tarceva) disposition in in vitro and in vivo pharmacokinetic studies employing Bcrp1-/-/Mdr1a/1b-/- (triple-knockout) and wild-type mice. Molecular cancer therapeutics 2008, 7, 2280–7.
(100) Polli, J. W.; Humphreys, J. E.; Harmon, K. A.; Castellino, S.; O’Mara, M. J.; Olson, K. L.; John-Williams, L. S.; Koch, K. M.; Serabjit-Singh, C. J. The role of efflux and uptake transporters in [N-{3-chloro-4-[(3-fluorobenzyl)oxy]phenyl}-6-[5-({[2-(methylsulfonyl)ethyl]amino}methyl)-2-furyl]-4-quinazolinamine (GW572016, lapatinib) disposition and drug interactions. Drug metabolism and disposition: the biological fate of chemicals 2008, 36, 695–701.
(101) Azzariti, A.; Porcelli, L.; Simone, G. M.; Quatrale, A. E.; Colabufo, N. a; Berardi, F.; Perrone, R.; Zucchetti, M.; D’Incalci, M.; Xu, J. M.; Paradiso, A. Tyrosine kinase inhibitors and multidrug resistance proteins: interactions and biological consequences. Cancer chemotherapy and pharmacology 2010, 65, 335–46.
(102) Hiwase, D. K.; Saunders, V.; Hewett, D.; Frede, A.; Zrim, S.; Dang, P.; Eadie, L.; To, L. B.; Melo, J.; Kumar, S.; Hughes, T. P.; White, D. L. Dasatinib cellular uptake and efflux in chronic myeloid leukemia cells: therapeutic implications. Clinical cancer research : an official journal of the American Association for Cancer Research 2008, 14, 3881–8.
(103) Hegedus, C.; Ozvegy-Laczka, C.; Apáti, a; Magócsi, M.; Német, K.; Orfi, L.; Kéri, G.; Katona, M.; Takáts, Z.; Váradi, a; Szakács, G.; Sarkadi, B. Interaction of nilotinib, dasatinib and bosutinib with ABCB1 and ABCG2: implications for altered anti-cancer effects and pharmacological properties. British journal of pharmacology 2009, 158, 1153–64.
(104) Erlichman, C.; Boerner, S. A.; Hallgren, C. G.; Spieker, R.; Wang, X. Y.; James, C. D.; Scheffer, G. L.; Maliepaard, M.; Ross, D. D.; Bible, K. C.; Kaufmann, S. H. The HER tyrosine kinase inhibitor CI1033 enhances cytotoxicity of 7-ethyl-10-hydroxycamptothecin and topotecan by inhibiting breast cancer resistance protein-mediated drug efflux. Cancer research 2001, 61, 739–48.
(105) Shi, Z.; Peng, X.-X.; Kim, I.-W.; Shukla, S.; Si, Q.-S.; Robey, R. W.; Bates, S. E.; Shen, T.; Ashby, C. R.; Fu, L.-W.; Ambudkar, S. V; Chen, Z.-S. Erlotinib (Tarceva, OSI-774) antagonizes ATP-binding cassette subfamily B member 1 and ATP-binding cassette subfamily G member 2-mediated drug resistance. Cancer research 2007, 67, 11012–20.

63
(106) Agarwal, S.; Sane, R.; Ohlfest, J. R.; Elmquist, W. F. The role of the breast cancer resistance protein (ABCG2) in the distribution of sorafenib to the brain. The Journal of pharmacology and experimental therapeutics 2011, 336, 223–33.
(107) Seamon, J. a; Rugg, C. a; Emanuel, S.; Calcagno, A. M.; Ambudkar, S. V; Middleton, S. a; Butler, J.; Borowski, V.; Greenberger, L. M. Role of the ABCG2 drug transporter in the resistance and oral bioavailability of a potent cyclin-dependent kinase/Aurora kinase inhibitor. Molecular cancer therapeutics 2006, 5, 2459–67.
(108) Generaux, G. T.; Bonomo, F. M.; Johnson, M.; Doan, K. M. M. Impact of SLCO1B1 (OATP1B1) and ABCG2 (BCRP) genetic polymorphisms and inhibition on LDL-C lowering and myopathy of statins. Xenobiotica; the fate of foreign compounds in biological systems 2011, 41, 639–51.
(109) Huang, L.; Wang, Y.; Grimm, S. ATP-dependent transport of rosuvastatin in membrane vesicles expressing breast cancer resistance protein. Drug metabolism and disposition: the biological fate of chemicals 2006, 34, 738–42.
(110) Hirano, M.; Maeda, K.; Matsushima, S.; Nozaki, Y.; Kusuhara, H.; Sugiyama, Y. Involvement of BCRP (ABCG2) in the biliary excretion of pitavastatin. Molecular pharmacology 2005, 68, 800–7.
(111) Zhang, W.; Yu, B.-N.; He, Y.-J.; Fan, L.; Li, Q.; Liu, Z.-Q.; Wang, A.; Liu, Y.-L.; Tan, Z.-R.; Fen-Jiang; Huang, Y.-F.; Zhou, H.-H. Role of BCRP 421C>A polymorphism on rosuvastatin pharmacokinetics in healthy Chinese males. Clinica chimica acta; international journal of clinical chemistry 2006, 373, 99–103.
(112) Keskitalo, J. E. J.; Pasanen, M. K. M.; Neuvonen, P. J.; Niemi, M. Different effects of the ABCG2 c. 421C> A SNP on the pharmacokinetics of fluvastatin, pravastatin and simvastatin. Pharmacogenomics 2009, 10, 1617–1624.
(113) Chasman, D. I.; Giulianini, F.; MacFadyen, J.; Barratt, B. J.; Nyberg, F.; Ridker, P. M. Genetic determinants of statin-induced low-density lipoprotein cholesterol reduction: the Justification for the Use of Statins in Prevention: an Intervention Trial Evaluating Rosuvastatin (JUPITER) trial. Circulation. Cardiovascular genetics 2012, 5, 257–64.
(114) Rodrigues, A. C.; Curi, R.; Genvigir, F. D. V.; Hirata, M. H.; Hirata, R. D. C. The expression of efflux and uptake transporters are regulated by statins in Caco-2 and HepG2 cells. Acta pharmacologica Sinica 2009, 30, 956–64.
(115) Temesgen, Z.; Warnke, D.; Kasten, M. J. Current status of antiretroviral therapy. Expert opinion on pharmacotherapy 2006, 7, 1541–54.

64
(116) Wang, X.; Furukawa, T.; Nitanda, T.; Okamoto, M.; Sugimoto, Y.; Akiyama, S.-I.; Baba, M. Breast cancer resistance protein (BCRP/ABCG2) induces cellular resistance to HIV-1 nucleoside reverse transcriptase inhibitors. Molecular pharmacology 2003, 63, 65–72.
(117) Wang, X.; Nitanda, T.; Shi, M.; Okamoto, M.; Furukawa, T.; Sugimoto, Y.; Akiyama, S.; Baba, M. Induction of cellular resistance to nucleoside reverse transcriptase inhibitors by the wild-type breast cancer resistance protein. Biochemical pharmacology 2004, 68, 1363–70.
(118) Weiss, J.; Rose, J.; Storch, C. H.; Ketabi-Kiyanvash, N.; Sauer, A.; Haefeli, W. E.; Efferth, T. Modulation of human BCRP (ABCG2) activity by anti-HIV drugs. The Journal of antimicrobial chemotherapy 2007, 59, 238–45.
(119) Merino, G.; Álvarez, A. I.; Pulido, M. M. M. M. M.; Molina, A. J. A. J.; Schinkel, A. H. A. H. A. H.; Prieto, J. G. J. G.; Alvarez, A. I. Breast cancer resistance protein (BCRP/ABCG2) transports fluoroquinolone antibiotics and affects their oral availability, pharmacokinetics, and milk secretion. Drug metabolism and disposition 2006, 34, 690–695.
(120) Janvilisri, T.; Shahi, S.; Venter, H.; Balakrishnan, L.; Van Veen, H. W. Arginine-482 is not essential for transport of antibiotics, primary bile acids and unconjugated sterols by the human breast cancer resistance protein (ABCG2). The Biochemical journal 2005, 385, 419–26.
(121) Pulido, M. M.; Molina, A. J.; Merino, G.; Mendoza, G.; Prieto, J. G.; Alvarez, A. I. Interaction of enrofloxacin with breast cancer resistance protein (BCRP/ABCG2): influence of flavonoids and role in milk secretion in sheep. Journal of veterinary pharmacology and therapeutics 2006, 29, 279–87.
(122) Merino, G.; Jonker, J. W.; Wagenaar, E.; Van Herwaarden, A. E.; Schinkel, A. H. The breast cancer resistance protein (BCRP/ABCG2) affects pharmacokinetics, hepatobiliary excretion, and milk secretion of the antibiotic nitrofurantoin. Molecular pharmacology 2005, 67, 1758–64.
(123) Ando, T.; Kusuhara, H.; Merino, G.; Alvarez, A. I.; Schinkel, A. H.; Sugiyama, Y. Involvement of breast cancer resistance protein (ABCG2) in the biliary excretion mechanism of fluoroquinolones. Drug metabolism and disposition: the biological fate of chemicals 2007, 35, 1873–9.
(124) Cantini, F.; Niccoli, L.; Nannini, C.; Kaloudi, O.; Bertoni, M.; Cassarà, E. Psoriatic arthritis: a systematic review. International journal of rheumatic diseases 2010, 13, 300–17.
(125) Ford, A. C.; Achkar, J.-P.; Khan, K. J.; Kane, S. V; Talley, N. J.; Marshall, J. K.; Moayyedi, P. Efficacy of 5-aminosalicylates in ulcerative colitis: systematic
65
review and meta-analysis. The American journal of gastroenterology 2011, 106, 601–16.
(126) Jani, M.; Szabó, P.; Kis, E.; Molnár, E.; Glavinas, H.; Krajcsi, P.; Ani, M. J.; Zabó, P. S.; Is, E. K.; Olnár, É. M.; Lavinas, H. G.; Rajcsi, P. K. Kinetic characterization of sulfasalazine transport by human ATP-binding cassette G2. Biological & pharmaceutical bulletin 2009, 32, 497–9.
(127) Van der Heijden, J.; De Jong, M. C.; Dijkmans, B. A. C.; Lems, W. F.; Oerlemans, R.; Kathmann, I.; Scheffer, G. L.; Scheper, R. J.; Assaraf, Y. G.; Jansen, G. Acquired resistance of human T cells to sulfasalazine: stability of the resistant phenotype and sensitivity to non-related DMARDs. Annals of the rheumatic diseases 2004, 63, 131–7.
(128) Adkison, K. K.; Vaidya, S. S.; Lee, D. Y.; Koo, S. H.; Li, L.; Mehta, A. A.; Gross, A. S.; Polli, J. W.; Humphreys, J. E.; Lou, Y.; Lee, E. J. D. Oral sulfasalazine as a clinical BCRP probe substrate: pharmacokinetic effects of genetic variation (C421A) and pantoprazole coadministration. Journal of pharmaceutical sciences 2010, 99, 1046–62.
(129) Kusuhara, H.; Furuie, H.; Inano, A.; Sunagawa, A.; Yamada, S.; Wu, C.; Fukizawa, S.; Morimoto, N.; Ieiri, I.; Morishita, M.; Sumita, K.; Mayahara, H.; Fujita, T.; Maeda, K.; Sugiyama, Y. Pharmacokinetic interaction study of sulphasalazine in healthy subjects and the impact of curcumin as an in vivo inhibitor of BCRP. British journal of pharmacology 2012, 166, 1793–1803.
(130) Urquhart, B. L.; Ware, J. a; Tirona, R. G.; Ho, R. H.; Leake, B. F.; Schwarz, U. I.; Zaher, H.; Palandra, J.; Gregor, J. C.; Dresser, G. K.; Kim, R. B. Breast cancer resistance protein (ABCG2) and drug disposition: intestinal expression, polymorphisms and sulfasalazine as an in vivo probe. Pharmacogenetics and genomics 2008, 18, 439–48.
(131) Lagas, J. S.; Van der Kruijssen, C. M. M.; Van de Wetering, K.; Beijnen, J. H.; Schinkel, A. H. Transport of diclofenac by breast cancer resistance protein (ABCG2) and stimulation of multidrug resistance protein 2 (ABCC2)-mediated drug transport by diclofenac and benzbromarone. Drug metabolism and disposition: the biological fate of chemicals 2009, 37, 129–36.
(132) Kis, E.; Nagy, T.; Jani, M.; Molnár, E.; Jánossy, J.; Ujhellyi, O.; Német, K.; Herédi-Szabó, K.; Krajcsi, P. Leflunomide and its metabolite A771726 are high affinity substrates of BCRP: implications for drug resistance. Annals of the rheumatic diseases 2009, 68, 1201–7.
(133) Breedveld, P.; Zelcer, N.; Pluim, D.; Sönmezer, O.; Tibben, M. M.; Beijnen, J. H.; Schinkel, A. H.; Van Tellingen, O.; Borst, P.; Schellens, J. H. M. Mechanism of the pharmacokinetic interaction between methotrexate and benzimidazoles:
66
potential role for breast cancer resistance protein in clinical drug-drug interactions. Cancer research 2004, 64, 5804–11.
(134) Pavek, P.; Merino, G.; Wagenaar, E.; Bolscher, E.; Novotna, M.; Jonker, J. W.; Schinkel, A. H. Human breast cancer resistance protein: interactions with steroid drugs, hormones, the dietary carcinogen 2-amino-1-methyl-6-phenylimidazo(4,5-b)pyridine, and transport of cimetidine. The Journal of pharmacology and experimental therapeutics 2005, 312, 144–52.
(135) Pollex, E. K.; Anger, G.; Hutson, J.; Koren, G.; Piquette-Miller, M. Breast cancer resistance protein (BCRP)-mediated glyburide transport: effect of the C421A/Q141K BCRP single-nucleotide polymorphism. Drug metabolism and disposition: the biological fate of chemicals 2010, 38, 740–4.
(136) Cygalova, L. H.; Hofman, J.; Ceckova, M.; Staud, F. Transplacental pharmacokinetics of glyburide, rhodamine 123, and BODIPY FL prazosin: effect of drug efflux transporters and lipid solubility. The Journal of pharmacology and experimental therapeutics 2009, 331, 1118–25.
(137) Enokizono, J.; Kusuhara, H.; Sugiyama, Y. Involvement of breast cancer resistance protein (BCRP/ABCG2) in the biliary excretion and intestinal efflux of troglitazone sulfate, the major metabolite of troglitazone with a cholestatic effect. Drug metabolism and disposition: the biological fate of chemicals 2007, 35, 209–14.
(138) Gedeon, C.; Anger, G.; Piquette-Miller, M.; Koren, G. Breast cancer resistance protein: mediating the trans-placental transfer of glyburide across the human placenta. Placenta 2008, 29, 39–43.
(139) Tournier, N.; Valette, H.; Peyronneau, M.-A.; Saba, W.; Goutal, S.; Kuhnast, B.; Dollé, F.; Scherrmann, J.-M.; Cisternino, S.; Bottlaender, M. Transport of selected PET radiotracers by human P-glycoprotein (ABCB1) and breast cancer resistance protein (ABCG2): an in vitro screening. Journal of nuclear medicine : official publication, Society of Nuclear Medicine 2011, 52, 415–23.
(140) Adkison, K. K.; Vaidya, S. S.; Lee, D. Y.; Koo, S. H.; Li, L.; Mehta, A. a; Gross, A. S.; Polli, J. W.; Lou, Y.; Lee, E. J. D. The ABCG2 C421A polymorphism does not affect oral nitrofurantoin pharmacokinetics in healthy Chinese male subjects. British journal of clinical pharmacology 2008, 66, 233–9.
(141) Ieiri, I.; Suwannakul, S.; Maeda, K.; Uchimaru, H.; Hashimoto, K.; Kimura, M.; Fujino, H.; Hirano, M.; Kusuhara, H.; Irie, S.; Higuchi, S.; Sugiyama, Y. SLCO1B1 (OATP1B1, an Uptake Transporter) and ABCG2 (BCRP, an Efflux Transporter) Variant Alleles and Pharmacokinetics of Pitavastatin in Healthy Volunteers. Clinical Pharmacology & Therapeutics 2007, 82, 541–547.

67
(142) Ho, R. H.; Choi, L.; Lee, W.; Mayo, G.; Schwarz, U. I.; Tirona, R. G.; Bailey, D. G.; Michael Stein, C.; Kim, R. B. Effect of drug transporter genotypes on pravastatin disposition in European- and African-American participants. Pharmacogenetics and genomics 2007, 17, 647–56.
(143) Kim, H.-S.; Sunwoo, Y. E.; Ryu, J. Y.; Kang, H.-J.; Jung, H.-E.; Song, I.-S.; Kim, E.-Y.; Shim, J.-C.; Shon, J.-H.; Shin, J.-G. The effect of ABCG2 V12M, Q141K and Q126X, known functional variants in vitro, on the disposition of lamivudine. British journal of clinical pharmacology 2007, 64, 645–54.
(144) Van Hattum, a H.; Hoogsteen, I. J.; Schlüper, H. M. M.; Maliepaard, M.; Scheffer, G. L.; Scheper, R. J.; Kohlhagen, G.; Pommier, Y.; Pinedo, H. M.; Boven, E. Induction of breast cancer resistance protein by the camptothecin derivative DX-8951f is associated with minor reduction of antitumour activity. British journal of cancer 2002, 87, 665–72.
(145) Marchetti, S.; Oostendorp, R. L.; Pluim, D.; Van Eijndhoven, M.; Van Tellingen, O.; Schinkel, A. H.; Versace, R.; Beijnen, J. H.; Mazzanti, R.; Schellens, J. H. In vitro transport of gimatecan (7-t-butoxyiminomethylcamptothecin) by breast cancer resistance protein, P-glycoprotein, and multidrug resistance protein 2. Molecular cancer therapeutics 2007, 6, 3307–13.
(146) Li, H.; Jin, H.-E.; Kim, W.; Han, Y.-H.; Kim, D.-D.; Chung, S.-J.; Shim, C.-K. Involvement of P-glycoprotein, multidrug resistance protein 2 and breast cancer resistance protein in the transport of belotecan and topotecan in Caco-2 and MDCKII cells. Pharmaceutical research 2008, 25, 2601–12.
(147) Shukla, S.; Robey, R. W.; Bates, S. E.; Ambudkar, S. V The calcium channel blockers, 1,4-dihydropyridines, are substrates of the multidrug resistance-linked ABC drug transporter, ABCG2. Biochemistry 2006, 45, 8940–51.
(148) Miura, M.; Kagaya, H.; Satoh, S.; Inoue, K.; Saito, M.; Habuchi, T.; Suzuki, T. Influence of drug transporters and UGT polymorphisms on pharmacokinetics of phenolic glucuronide metabolite of mycophenolic acid in Japanese renal transplant recipients. Therapeutic drug monitoring 2008, 30, 559–64.
(149) Yang, J. J.; Milton, M. N.; Yu, S.; Liao, M.; Liu, N.; Wu, J.-T.; Gan, L.; Balani, S. K.; Lee, F. W.; Prakash, S.; Xia, C. Q. P-glycoprotein and breast cancer resistance protein affect disposition of tandutinib, a tyrosine kinase inhibitor. Drug metabolism letters 2010, 4, 201–12.
(150) Feng, B.; Xu, J. J.; Bi, Y.-A.; Mireles, R.; Davidson, R.; Duignan, D. B.; Campbell, S.; Kostrubsky, V. E.; Dunn, M. C.; Smith, A. R.; Wang, H. F. Role of hepatic transporters in the disposition and hepatotoxicity of a HER2 tyrosine kinase inhibitor CP-724,714. Toxicological sciences : an official journal of the Society of Toxicology 2009, 108, 492–500.

68
(151) Bram, E. E.; Adar, Y.; Mesika, N.; Sabisz, M.; Skladanowski, A.; Assaraf, Y. G. Structural Determinants of Imidazoacridinones Facilitating Antitumor Activity Are Crucial for Substrate Recognition by ABCG2. 2009, 75, 1149–1159.
(152) Merino, G.; Jonker, J. W.; Wagenaar, E.; Pulido, M. M.; Molina, A. J.; Alvarez, A. I.; Schinkel, A. H. Transport of anthelmintic benzimidazole drugs by breast cancer resistance protein (BCRP/ABCG2). Drug metabolism and disposition: the biological fate of chemicals 2005, 33, 614–8.
(153) Meng, F.; Cai, X.; Duan, J.; Matteucci, M. G.; Hart, C. P. A novel class of tubulin inhibitors that exhibit potent antiproliferation and in vitro vessel-disrupting activity. Cancer chemotherapy and pharmacology 2008, 61, 953–63.
(154) Zhang, Y.; Gupta, A.; Wang, H.; Zhou, L.; Vethanayagam, R. R.; Unadkat, J. D.; Mao, Q. BCRP transports dipyridamole and is inhibited by calcium channel blockers. Pharmaceutical research 2005, 22, 2023–34.
(155) Kondo, C.; Onuki, R.; Kusuhara, H.; Suzuki, H.; Suzuki, M.; Okudaira, N.; Kojima, M.; Ishiwata, K.; Jonker, J. W.; Sugiyama, Y. Lack of improvement of oral absorption of ME3277 by prodrug formation is ascribed to the intestinal efflux mediated by breast cancer resistant protein (BCRP/ABCG2). Pharmaceutical research 2005, 22, 613–8.
(156) Hazlehurst, L. A.; Foley, N. E.; Gleason-guzman, M. C.; Line, M. C.; Hacker, M. P.; Cress, A. E.; Greenberger, L. W.; Jong, M. C. De; Dalton, W. S. Multiple Mechanisms Confer Drug Resistance to Mitoxantrone in the Human 8226 Myeloma Cell Line Multiple Mechanisms Confer Drug Resistance to Mitoxantrone in the Human 8226. 1999, 1021–1028.
(157) Perez, M.; Blazquez, A. G.; Real, R.; Mendoza, G.; Prieto, J. G.; Merino, G.; Alvarez, A. I. In vitro and in vivo interaction of moxidectin with BCRP/ABCG2. Chemico-biological interactions 2009, 180, 106–12.
(158) Kars, M. D.; Işeri, O. D.; Ural, A. U.; Gündüz, U. In vitro evaluation of zoledronic acid resistance developed in MCF-7 cells. Anticancer research 2007, 27, 4031–7.
(159) Milane, A.; Vautier, S.; Chacun, H.; Meininger, V.; Bensimon, G.; Farinotti, R.; Fernandez, C. Interactions between riluzole and ABCG2/BCRP transporter. Neuroscience letters 2009, 452, 12–6.
(160) Yamada, A.; Maeda, K.; Kamiyama, E.; Sugiyama, D.; Kondo, T.; Shiroyanagi, Y.; Nakazawa, H.; Okano, T.; Adachi, M.; Schuetz, J. D.; Adachi, Y.; Hu, Z.; Kusuhara, H.; Sugiyama, Y. Multiple human isoforms of drug transporters contribute to the hepatic and renal transport of olmesartan, a selective antagonist of the angiotensin II AT1-receptor. Drug metabolism and disposition: the biological fate of chemicals 2007, 35, 2166–76.

69
(161) Suzuki, M.; Suzuki, H.; Sugimoto, Y.; Sugiyama, Y. ABCG2 transports sulfated conjugates of steroids and xenobiotics. The Journal of biological chemistry 2003, 278, 22644–9.
(162) Brooks, T. A.; Minderman, H.; O’Loughlin, K. L.; Pera, P.; Ojima, I.; Baer, M. R.; Bernacki, R. J.; Brooks, T. Taxane-based reversal agents modulate drug resistance mediated by P-glycoprotein, multidrug resistance protein, and breast cancer resistance protein. Molecular cancer therapeutics 2003, 2, 1195–205.
(163) Hu, W.; Liu, W. Side populations of glioblastoma cells are less sensitive to HSV-TK/GCV suicide gene therapy system than the non-side population. In vitro cellular & developmental biology. Animal 2010, 46, 497–501.
(164) Colabufo, N. A.; Pagliarulo, V.; Berardi, F.; Contino, M.; Inglese, C.; Niso, M.; Ancona, P.; Albo, G.; Pagliarulo, A.; Perrone, R. Bicalutamide failure in prostate cancer treatment: involvement of Multi Drug Resistance proteins. European journal of pharmacology 2008, 601, 38–42.
(165) Wu, C.-P.; Shukla, S.; Calcagno, A. M.; Hall, M. D.; Gottesman, M. M.; Ambudkar, S. V Evidence for dual mode of action of a thiosemicarbazone, NSC73306: a potent substrate of the multidrug resistance linked ABCG2 transporter. Molecular cancer therapeutics 2007, 6, 3287–96.
(166) Jonker, J. W.; Buitelaar, M.; Wagenaar, E.; Van Der Valk, M. a; Scheffer, G. L.; Scheper, R. J.; Plosch, T.; Kuipers, F.; Elferink, R. P. J. O.; Rosing, H.; Beijnen, J. H.; Schinkel, A. H. The breast cancer resistance protein protects against a major chlorophyll-derived dietary phototoxin and protoporphyria. Proceedings of the National Academy of Sciences of the United States of America 2002, 99, 15649–54.
(167) Van Herwaarden, A. E.; Jonker, J. W.; Wagenaar, E.; Brinkhuis, R. F.; Schellens, J. H. M.; Beijnen, J. H.; Schinkel, A. H. The breast cancer resistance protein (Bcrp1/Abcg2) restricts exposure to the dietary carcinogen 2-amino-1-methyl-6-phenylimidazo[4,5-b]pyridine. Cancer research 2003, 63, 6447–52.
(168) Desuzinges-Mandon, E.; Arnaud, O.; Martinez, L.; Huché, F.; Di Pietro, A.; Falson, P. ABCG2 transports and transfers heme to albumin through its large extracellular loop. The Journal of biological chemistry 2010, 285, 33123–33.
(169) Robey, R. W.; Steadman, K.; Polgar, O.; Morisaki, K.; Blayney, M.; Mistry, P.; Bates, S. E. Pheophorbide a is a specific probe for ABCG2 function and inhibition. Cancer research 2004, 64, 1242–6.
(170) Zhou, S.; Zong, Y.; Ney, P. a; Nair, G.; Stewart, C. F.; Sorrentino, B. P. Increased expression of the Abcg2 transporter during erythroid maturation plays a role in decreasing cellular protoporphyrin IX levels. Blood 2005, 105, 2571–6.
70
(171) An, R.; Hagiya, Y.; Tamura, A.; Li, S.; Saito, H.; Tokushima, D.; Ishikawa, T. Cellular phototoxicity evoked through the inhibition of human ABC transporter ABCG2 by cyclin-dependent kinase inhibitors in vitro. Pharmaceutical research 2009, 26, 449–58.
(172) Zheng, X.; Morgan, J.; Pandey, S. K.; Chen, Y.; Tracy, E.; Baumann, H.; Missert, J. R.; Batt, C.; Jackson, J.; Bellnier, D. a; Henderson, B. W.; Pandey, R. K. Conjugation of 2-(1’-hexyloxyethyl)-2-devinylpyropheophorbide-a (HPPH) to carbohydrates changes its subcellular distribution and enhances photodynamic activity in vivo. Journal of medicinal chemistry 2009, 52, 4306–18.
(173) Robey, R. W.; Fetsch, P. a; Polgar, O.; Dean, M.; Bates, S. E. The livestock photosensitizer, phytoporphyrin (phylloerythrin), is a substrate of the ATP-binding cassette transporter ABCG2. Research in veterinary science 2006, 81, 345–9.
(174) Lankerani, L.; Baron, E. D. Photosensitivity to exogenous agents. Journal of cutaneous medicine and surgery 2005, 8, 424–31.
(175) Robey, R. W.; Steadman, K.; Polgar, O.; Bates, S. E. ABCG2-mediated transport of photosensitizers: potential impact on photodynamic therapy. Cancer biology & therapy 2005, 4, 187–94.
(176) Ebert, B.; Seidel, A.; Lampen, A. Identification of BCRP as transporter of benzo[a]pyrene conjugates metabolically formed in Caco-2 cells and its induction by Ah-receptor agonists. Carcinogenesis 2005, 26, 1754–63.
(177) Van Herwaarden, A. E.; Wagenaar, E.; Karnekamp, B.; Merino, G.; Jonker, J. W.; Schinkel, A. H. Breast cancer resistance protein (Bcrp1/Abcg2) reduces systemic exposure of the dietary carcinogens aflatoxin B1, IQ and Trp-P-1 but also mediates their secretion into breast milk. Carcinogenesis 2006, 27, 123–30.
(178) Gardner, E. R.; Ahlers, C. M.; Shukla, S.; Sissung, T. M.; Ockers, S. B.; Price, D. K.; Hamada, A.; Robey, R. W.; Steinberg, S. M.; Ambudkar, S. V; Dahut, W. L.; Figg, W. D. Association of the ABCG2 C421A polymorphism with prostate cancer risk and survival. BJU international 2008, 102, 1694–9.
(179) Hu, L.-L.; Wang, X.-X.; Chen, X.; Chang, J.; Li, C.; Zhang, Y.; Yang, J.; Jiang, W.; Zhuang, S.-M. BCRP gene polymorphisms are associated with susceptibility and survival of diffuse large B-cell lymphoma. Carcinogenesis 2007, 28, 1740–4.
(180) Scalbert, A.; Williamson, G. Dietary intake and bioavailability of polyphenols. The Journal of nutrition 2000, 130, 2073S–85S.
(181) Manach, C.; Scalbert, A.; Morand, C.; Rémésy, C.; Jiménez, L. Polyphenols: food sources and bioavailability. The American journal of clinical nutrition 2004, 79, 727–47.

71
(182) Somerset, S. M.; Johannot, L. Dietary flavonoid sources in Australian adults. Nutrition and cancer 2008, 60, 442–9.
(183) De Vries, J. H.; Janssen, P. L.; Hollman, P. C.; Van Staveren, W. A.; Katan, M. B. Consumption of quercetin and kaempferol in free-living subjects eating a variety of diets. Cancer letters 1997, 114, 141–4.
(184) An, G.; Gallegos, J.; Morris, M. E. The Bioflavonoid Kaempferol Is an Abcg2 Substrate and Inhibits Abcg2-Mediated Quercetin Efflux ABSTRACT : 2011, 39, 426–432.
(185) Sesink, A. L. A.; Arts, I. C. W.; De Boer, V. C. J.; Breedveld, P.; Schellens, J. H. M.; Hollman, P. C. H.; Russel, F. G. M. Breast cancer resistance protein (Bcrp1/Abcg2) limits net intestinal uptake of quercetin in rats by facilitating apical efflux of glucuronides. Molecular pharmacology 2005, 67, 1999–2006.
(186) Van Herwaarden, A. E.; Wagenaar, E.; Merino, G.; Jonker, J. W.; Rosing, H.; Beijnen, J. H.; Schinkel, A. H. Multidrug transporter ABCG2/breast cancer resistance protein secretes riboflavin (vitamin B2) into milk. Molecular and cellular biology 2007, 27, 1247–53.
(187) Brand, W.; Oosterhuis, B.; Krajcsi, P.; Barron, D.; Dionisi, F.; Van Bladeren, P. J.; Rietjens, I. M. C. M.; Williamson, G. Interaction of hesperetin glucuronide conjugates with human BCRP, MRP2 and MRP3 as detected in membrane vesicles of overexpressing baculovirus-infected Sf9 cells. Biopharmaceutics & drug disposition 2011, 32, 530–5.
(188) Brand, W.; Van der Wel, P. A. I.; Rein, M. J.; Barron, D.; Williamson, G.; Van Bladeren, P. J.; Rietjens, I. M. C. M. Metabolism and transport of the citrus flavonoid hesperetin in Caco-2 cell monolayers. Drug metabolism and disposition: the biological fate of chemicals 2008, 36, 1794–802.
(189) Robey, R. W.; Medina-Pérez, W. Y.; Nishiyama, K.; Lahusen, T.; Miyake, K.; Litman, T.; Senderowicz, A. M.; Ross, D. D.; Bates, S. E. Overexpression of the ATP-binding cassette half-transporter, ABCG2 (Mxr/BCrp/ABCP1), in flavopiridol-resistant human breast cancer cells. Clinical cancer research : an official journal of the American Association for Cancer Research 2001, 7, 145–52.
(190) Imai, Y.; Tsukahara, S.; Asada, S.; Sugimoto, Y. Phytoestrogens/flavonoids reverse breast cancer resistance protein/ABCG2-mediated multidrug resistance. Cancer research 2004, 64, 4346–52.
(191) Yang, Z.; Zhu, W.; Gao, S.; Yin, T.; Jiang, W.; Hu, M. Breast cancer resistance protein (ABCG2) determines distribution of genistein phase II metabolites: reevaluation of the roles of ABCG2 in the disposition of genistein. Drug metabolism and disposition: the biological fate of chemicals 2012, 40, 1883–93.

72
(192) Enokizono, J.; Kusuhara, H.; Sugiyama, Y. Effect of breast cancer resistance protein (Bcrp/Abcg2) on the disposition of phytoestrogens. Molecular pharmacology 2007, 72, 967–75.
(193) Imai, Y.; Asada, S.; Tsukahara, S.; Ishikawa, E.; Tsuruo, T.; Sugimoto, Y. Breast cancer resistance protein exports sulfated estrogens but not free estrogens. Molecular pharmacology 2003, 64, 610–8.
(194) Mao, Q.; Conseil, G.; Gupta, A.; Cole, S. P. C.; Unadkat, J. D. Functional expression of the human breast cancer resistance protein in Pichia pastoris. Biochemical and biophysical research communications 2004, 320, 730–7.
(195) Han, Y.; Busler, D.; Hong, Y.; Tian, Y.; Chen, C.; Rodrigues, A. D. Transporter studies with the 3-O-sulfate conjugate of 17alpha-ethinylestradiol: assessment of human liver drug transporters. Drug metabolism and disposition: the biological fate of chemicals 2010, 38, 1072–82.
(196) Zhang, Y.; Byun, Y.; Ren, Y. R.; Liu, J. O.; Laterra, J.; Pomper, M. G. Identification of inhibitors of ABCG2 by a bioluminescence imaging-based high-throughput assay. Cancer research 2009, 69, 5867–75.
(197) Zhang, Y.; Bressler, J. P.; Neal, J.; Lal, B.; Bhang, H.-E. C.; Laterra, J.; Pomper, M. G. ABCG2/BCRP expression modulates D-Luciferin based bioluminescence imaging. Cancer research 2007, 67, 9389–97.
(198) Scharenberg, C. W.; Harkey, M. A.; Torok-Storb, B. The ABCG2 transporter is an efficient Hoechst 33342 efflux pump and is preferentially expressed by immature human hematopoietic progenitors. Blood 2002, 99, 507–12.
(199) Kim, M.; Turnquist, H.; Jackson, J.; Sgagias, M.; Yan, Y.; Gong, M.; Dean, M.; Sharp, J. G.; Cowan, K. The multidrug resistance transporter ABCG2 (breast cancer resistance protein 1) effluxes Hoechst 33342 and is overexpressed in hematopoietic stem cells. Clinical cancer research : an official journal of the American Association for Cancer Research 2002, 8, 22–8.
(200) Robey, R. W.; Honjo, Y.; Van de Laar, A.; Miyake, K.; Regis, J. T.; Litman, T.; Bates, S. E. A functional assay for detection of the mitoxantrone resistance protein, MXR (ABCG2). Biochimica et biophysica acta 2001, 1512, 171–82.
(201) De Waart, D. R.; Häusler, S.; Vlaming, M. L. H.; Kunne, C.; Hänggi, E.; Gruss, H.; Oude Elferink, R. P. J.; Stieger, B. Hepatic transport mechanisms of cholyl-L-lysyl-fluorescein. The Journal of pharmacology and experimental therapeutics 2010, 334, 78–86.
(202) Blazquez, A. G.; Briz, O.; Romero, M. R.; Rosales, R.; Monte, M. J.; Vaquero, J.; Macias, R. I. R.; Cassio, D.; Marin, J. J. G. Characterization of the role of ABCG2

73
as a bile acid transporter in liver and placenta. Molecular pharmacology 2012, 81, 273–83.
(203) Woodward, O. M.; Köttgen, A.; Coresh, J.; Boerwinkle, E.; Guggino, W. B.; Köttgen, M. Identification of a urate transporter, ABCG2, with a common functional polymorphism causing gout. Proceedings of the National Academy of Sciences of the United States of America 2009, 106, 10338–42.
(204) Reginato, A. M.; Mount, D. B.; Yang, I.; Choi, H. K. The genetics of hyperuricaemia and gout. Nature reviews. Rheumatology 2012, 8, 610–21.
(205) Tan, Y.-C.; Blumenfeld, J.; Rennert, H. Autosomal dominant polycystic kidney disease: genetics, mutations and microRNAs. Biochimica et biophysica acta 2011, 1812, 1202–12.
(206) Peters, D. J.; Spruit, L.; Saris, J. J.; Ravine, D.; Sandkuijl, L. A.; Fossdal, R.; Boersma, J.; Van Eijk, R.; Nørby, S.; Constantinou-Deltas, C. D. Chromosome 4 localization of a second gene for autosomal dominant polycystic kidney disease. Nature genetics 1993, 5, 359–62.
(207) Shukla, S.; Wu, C.-P.; Nandigama, K.; Ambudkar, S. V The naphthoquinones, vitamin K3 and its structural analogue plumbagin, are substrates of the multidrug resistance linked ATP binding cassette drug transporter ABCG2. Molecular cancer therapeutics 2007, 6, 3279–86.
(208) Brechbuhl, H. M.; Min, E.; Kariya, C.; Frederick, B.; Raben, D.; Day, B. J. Select cyclopentenone prostaglandins trigger glutathione efflux and the role of ABCG2 transport. Free radical biology & medicine 2009, 47, 722–30.
(209) Ji, Y.; Morris, M. E. Membrane transport of dietary phenethyl isothiocyanate by ABCG2 (breast cancer resistance protein). Molecular pharmaceutics 2005, 2, 414–9.
(210) Takabe, K.; Kim, R. H.; Allegood, J. C.; Mitra, P.; Ramachandran, S.; Nagahashi, M.; Harikumar, K. B.; Hait, N. C.; Milstien, S.; Spiegel, S. Estradiol induces export of sphingosine 1-phosphate from breast cancer cells via ABCC1 and ABCG2. The Journal of biological chemistry 2010, 285, 10477–86.
(211) Woehlecke, H.; Pohl, A.; Alder-Baerens, N.; Lage, H.; Herrmann, A. Enhanced exposure of phosphatidylserine in human gastric carcinoma cells overexpressing the half-size ABC transporter BCRP (ABCG2). The Biochemical journal 2003, 376, 489–95.
(212) Tai, L. M.; Loughlin, a J.; Male, D. K.; Romero, I. a P-glycoprotein and breast cancer resistance protein restrict apical-to-basolateral permeability of human brain endothelium to amyloid-beta. Journal of cerebral blood flow and metabolism :

74
official journal of the International Society of Cerebral Blood Flow and Metabolism 2009, 29, 1079–83.
(213) Lebedeva, I. V; Pande, P.; Patton, W. F. Sensitive and specific fluorescent probes for functional analysis of the three major types of mammalian ABC transporters. PloS one 2011, 6, e22429.
(214) Henrich, C. J.; Robey, R. W.; Bokesch, H. R.; Bates, S. E.; Shukla, S.; Ambudkar, S. V; Dean, M.; McMahon, J. B. New inhibitors of ABCG2 identified by high-throughput screening. Molecular cancer therapeutics 2007, 6, 3271–8.
(215) Qadir, M.; O’Loughlin, K. L.; Fricke, S. M.; Williamson, N. a; Greco, W. R.; Minderman, H.; Baer, M. R. Cyclosporin A is a broad-spectrum multidrug resistance modulator. Clinical cancer research : an official journal of the American Association for Cancer Research 2005, 11, 2320–6.
(216) Rabindran, S. K.; He, H.; Singh, M.; Brown, E.; Collins, K. I.; Annable, T.; Greenberger, L. M. Reversal of a novel multidrug resistance mechanism in human colon carcinoma cells by fumitremorgin C. Cancer research 1998, 58, 5850–8.
(217) Minderman, H.; Suvannasankha, A.; O’Loughlin, K. L.; Scheffer, G. L.; Scheper, R. J.; Robey, R. W.; Baer, M. R. Flow cytometric analysis of breast cancer resistance protein expression and function. Cytometry 2002, 48, 59–65.
(218) Ozvegy, C.; Váradi, A.; Sarkadi, B. Characterization of drug transport, ATP hydrolysis, and nucleotide trapping by the human ABCG2 multidrug transporter. Modulation of substrate specificity by a point mutation. The Journal of biological chemistry 2002, 277, 47980–90.
(219) Noguchi, K.; Kawahara, H.; Kaji, A.; Katayama, K.; Mitsuhashi, J.; Sugimoto, Y. Substrate-dependent bidirectional modulation of P-glycoprotein-mediated drug resistance by erlotinib. Cancer science 2009, 100, 1701–7.
(220) Van Loevezijn, a; Allen, J. D.; Schinkel, a H.; Koomen, G. J. Inhibition of BCRP-mediated drug efflux by fumitremorgin-type indolyl diketopiperazines. Bioorganic & medicinal chemistry letters 2001, 11, 29–32.
(221) Allen, J. D.; Van Loevezijn, A.; Lakhai, J. M.; Van der Valk, M.; Van Tellingen, O.; Reid, G.; Schellens, J. H. M.; Koomen, G.-J.; Schinkel, A. H. Potent and specific inhibition of the breast cancer resistance protein multidrug transporter in vitro and in mouse intestine by a novel analogue of fumitremorgin C. Molecular cancer therapeutics 2002, 1, 417–25.
(222) De Bruin, M.; Miyake, K.; Litman, T.; Robey, R.; Bates, S. E. Reversal of resistance by GF120918 in cell lines expressing the ABC half-transporter, MXR. Cancer letters 1999, 146, 117–26.

75
(223) Kruijtzer, C. M. F. Increased Oral Bioavailability of Topotecan in Combination With the Breast Cancer Resistance Protein and P-Glycoprotein Inhibitor GF120918. Journal of Clinical Oncology 2002, 20, 2943–2950.
(224) Imai, Y.; Tsukahara, S.; Ishikawa, E.; Tsuruo, T.; Sugimoto, Y. Estrone and 17beta-estradiol reverse breast cancer resistance protein-mediated multidrug resistance. Japanese journal of cancer research : Gann 2002, 93, 231–5.
(225) Sugimoto, Y.; Tsukahara, S.; Imai, Y.; Ueda, K.; Tsuruo, T. Reversal of breast cancer resistance protein-mediated drug resistance by estrogen antagonists and agonists. Molecular cancer therapeutics 2003, 2, 105–12.
(226) Charmandari, E.; Kino, T.; Chrousos, G. P. Glucocorticoids and their actions: an introduction. Annals of the New York Academy of Sciences 2004, 1024, 1–8.
(227) Houghton, P. J.; Germain, G. S.; Harwood, F. C.; Schuetz, J. D.; Stewart, C. F.; Buchdunger, E.; Traxler, P. Imatinib mesylate is a potent inhibitor of the ABCG2 (BCRP) transporter and reverses resistance to topotecan and SN-38 in vitro. Cancer research 2004, 64, 2333–7.
(228) Nakamura, Y.; Oka, M.; Soda, H.; Shiozawa, K.; Yoshikawa, M.; Itoh, A.; Ikegami, Y.; Tsurutani, J.; Nakatomi, K.; Kitazaki, T.; Doi, S.; Yoshida, H.; Kohno, S. Gefitinib (“Iressa”, ZD1839), an epidermal growth factor receptor tyrosine kinase inhibitor, reverses breast cancer resistance protein/ABCG2-mediated drug resistance. Cancer research 2005, 65, 1541–6.
(229) Ozvegy-Laczka, C.; Hegedus, T.; Várady, G.; Ujhelly, O.; Schuetz, J. D.; Váradi, A.; Kéri, G.; Orfi, L.; Német, K.; Sarkadi, B. High-affinity interaction of tyrosine kinase inhibitors with the ABCG2 multidrug transporter. Molecular pharmacology 2004, 65, 1485–95.
(230) Nakanishi, T.; Shiozawa, K.; Hassel, B. a; Ross, D. D. Complex interaction of BCRP/ABCG2 and imatinib in BCR-ABL-expressing cells: BCRP-mediated resistance to imatinib is attenuated by imatinib-induced reduction of BCRP expression. Blood 2006, 108, 678–84.
(231) Dohse, M.; Scharenberg, C.; Shukla, S.; Robey, R. W.; Volkmann, T.; Deeken, J. F.; Brendel, C.; Ambudkar, S. V; Neubauer, A.; Bates, S. E. Comparison of ATP-binding cassette transporter interactions with the tyrosine kinase inhibitors imatinib, nilotinib, and dasatinib. Drug metabolism and disposition: the biological fate of chemicals 2010, 38, 1371–80.
(232) Brendel, C.; Scharenberg, C.; Dohse, M.; Robey, R. W.; Bates, S. E.; Shukla, S.; Ambudkar, S. V; Wang, Y.; Wennemuth, G.; Burchert, a; Boudriot, U.; Neubauer, a Imatinib mesylate and nilotinib (AMN107) exhibit high-affinity interaction with

76
ABCG2 on primitive hematopoietic stem cells. Leukemia : official journal of the Leukemia Society of America, Leukemia Research Fund, U.K 2007, 21, 1267–75.
(233) Dai, C.; Tiwari, A. K.; Wu, C.-P.; Su, X.-D.; Wang, S.-R.; Liu, D.; Ashby, C. R.; Huang, Y.; Robey, R. W.; Liang, Y.; Chen, L.; Shi, C.-J.; Ambudkar, S. V; Chen, Z.-S.; Fu, L. Lapatinib (Tykerb, GW572016) reverses multidrug resistance in cancer cells by inhibiting the activity of ATP-binding cassette subfamily B member 1 and G member 2. Cancer research 2008, 68, 7905–14.
(234) Dai, C.; Liang, Y.; Wang, Y.; Tiwari, A. K.; Yan, Y.; Wang, F.; Chen, Z.; Tong, X.; Fu, L. Sensitization of ABCG2-overexpressing cells to conventional chemotherapeutic agent by sunitinib was associated with inhibiting the function of ABCG2. Cancer letters 2009, 279, 74–83.
(235) Tamaki, H.; Satoh, H.; Hori, S.; Ohtani, H.; Sawada, Y. Inhibitory effects of herbal extracts on breast cancer resistance protein (BCRP) and structure-inhibitory potency relationship of isoflavonoids. Drug metabolism and pharmacokinetics 2010, 25, 170–9.
(236) Ahmed-Belkacem, A.; Pozza, A.; Muñoz-Martínez, F.; Bates, S. E.; Castanys, S.; Gamarro, F.; Di Pietro, A.; Pérez-Victoria, J. M. Flavonoid structure-activity studies identify 6-prenylchrysin and tectochrysin as potent and specific inhibitors of breast cancer resistance protein ABCG2. Cancer research 2005, 65, 4852–60.
(237) Zhang, S.; Yang, X.; Morris, M. E. Flavonoids are inhibitors of breast cancer resistance protein (ABCG2)-mediated transport. Molecular pharmacology 2004, 65, 1208–16.
(238) Cooray, H. C.; Janvilisri, T.; Van Veen, H. W.; Hladky, S. B.; Barrand, M. a Interaction of the breast cancer resistance protein with plant polyphenols. Biochemical and biophysical research communications 2004, 317, 269–75.
(239) An, G.; Morris, M. E. Effects of single and multiple flavonoids on BCRP-mediated accumulation, cytotoxicity and transport of mitoxantrone in vitro. Pharmaceutical research 2010, 27, 1296–308.
(240) Pick, A.; Müller, H.; Mayer, R.; Haenisch, B.; Pajeva, I. K.; Weigt, M.; Bönisch, H.; Müller, C. E.; Wiese, M. Structure-activity relationships of flavonoids as inhibitors of breast cancer resistance protein (BCRP). Bioorganic & medicinal chemistry 2011, 19, 2090–102.
(241) Yoshikawa, M.; Ikegami, Y.; Sano, K.; Yoshida, H.; Mitomo, H.; Sawada, S.; Ishikawa, T. Transport of SN-38 by the wild type of human ABC transporter ABCG2 and its inhibition by quercetin, a natural flavonoid. Journal of experimental therapeutics & oncology 2004, 4, 25–35.

77
(242) Zhang, S.; Wang, X.; Sagawa, K.; Morris, M. E. Flavonoids chrysin and benzoflavone, potent breast cancer resistance protein inhibitors, have no significant effect on topotecan pharmacokinetics in rats or mdr1a/1b (-/-) mice. Drug metabolism and disposition: the biological fate of chemicals 2005, 33, 341–8.
(243) Zhang, S.; Yang, X.; Morris, M. E. Combined effects of multiple flavonoids on breast cancer resistance protein (ABCG2)-mediated transport. Pharmaceutical research 2004, 21, 1263–73.
(244) Valdameri, G.; Gauthier, C.; Terreux, R.; Kachadourian, R.; Day, B. J.; Winnischofer, S. M. B.; Rocha, M. E. M.; Frachet, V.; Ronot, X.; Di Pietro, A.; Boumendjel, A. Investigation of chalcones as selective inhibitors of the breast cancer resistance protein: critical role of methoxylation in both inhibition potency and cytotoxicity. Journal of medicinal chemistry 2012, 55, 3193–200.
(245) Lim, G. P.; Chu, T.; Yang, F.; Beech, W.; Frautschy, S. a; Cole, G. M. The curry spice curcumin reduces oxidative damage and amyloid pathology in an Alzheimer transgenic mouse. The Journal of neuroscience : the official journal of the Society for Neuroscience 2001, 21, 8370–7.
(246) Chearwae, W.; Shukla, S.; Limtrakul, P.; Ambudkar, S. V Modulation of the function of the multidrug resistance-linked ATP-binding cassette transporter ABCG2 by the cancer chemopreventive agent curcumin. Molecular cancer therapeutics 2006, 5, 1995–2006.
(247) Limtrakul, P.; Chearwae, W.; Shukla, S.; Phisalphong, C.; Ambudkar, S. V Modulation of function of three ABC drug transporters, P-glycoprotein (ABCB1), mitoxantrone resistance protein (ABCG2) and multidrug resistance protein 1 (ABCC1) by tetrahydrocurcumin, a major metabolite of curcumin. Molecular and cellular biochemistry 2007, 296, 85–95.
(248) Kawahara, H.; Noguchi, K.; Katayama, K.; Mitsuhashi, J.; Sugimoto, Y. Pharmacological interaction with sunitinib is abolished by a germ-line mutation (1291T>C) of BCRP/ABCG2 gene. Cancer science 2010, 101, 1493–500.
(249) Wang, J.-S.; Zhu, H.-J.; Markowitz, J. S.; Donovan, J. L.; Yuan, H.-J.; Devane, C. L. Antipsychotic drugs inhibit the function of breast cancer resistance protein. Basic & clinical pharmacology & toxicology 2008, 103, 336–41.
(250) Yang, C.-H.; Chen, Y.-C.; Kuo, M.-L. Novobiocin sensitizes BCRP/MXR/ABCP overexpressing topotecan-resistant human breast carcinoma cells to topotecan and mitoxantrone. Anticancer research 23, 2519–23.
(251) Robey, R. W.; Shukla, S.; Steadman, K.; Obrzut, T.; Finley, E. M.; Ambudkar, S. V; Bates, S. E. Inhibition of ABCG2-mediated transport by protein kinase

78
inhibitors with a bisindolylmaleimide or indolocarbazole structure. Molecular cancer therapeutics 2007, 6, 1877–85.
(252) Minderman, H.; O’Loughlin, K. L.; Pendyala, L.; Baer, M. R. VX-710 (biricodar) increases drug retention and enhances chemosensitivity in resistant cells overexpressing P-glycoprotein, multidrug resistance protein, and breast cancer resistance protein. Clinical cancer research : an official journal of the American Association for Cancer Research 2004, 10, 1826–34.
(253) Zhou, X.; Yang, X.; Wang, Q.; Coburn, R. A.; Morris, M. E. Effects of dihydropyridines and pyridines on multidrug resistance mediated by breast cancer resistance protein: in vitro and in vivo studies. Drug metabolism and disposition: the biological fate of chemicals 2005, 33, 1220–8.
(254) Imai, Y.; Yoshimori, M.; Fukuda, K.; Yamagishi, H.; Ueda, Y. The PI3K/Akt inhibitor LY294002 reverses BCRP-mediated drug resistance without affecting BCRP translocation. Oncology reports 2012, 27, 1703–9.
(255) Peng, H.; Dong, Z.; Qi, J.; Yang, Y.; Liu, Y.; Li, Z.; Xu, J.; Zhang, J.-T. A novel two mode-acting inhibitor of ABCG2-mediated multidrug transport and resistance in cancer chemotherapy. PloS one 2009, 4, e5676.
(256) Peng, H.; Qi, J.; Dong, Z.; Zhang, J.-T. Dynamic vs static ABCG2 inhibitors to sensitize drug resistant cancer cells. PloS one 2010, 5, e15276.
(257) Minderman, H.; Brooks, T. a; O’Loughlin, K. L.; Ojima, I.; Bernacki, R. J.; Baer, M. R. Broad-spectrum modulation of ATP-binding cassette transport proteins by the taxane derivatives ortataxel (IDN-5109, BAY 59-8862) and tRA96023. Cancer chemotherapy and pharmacology 2004, 53, 363–9.
(258) Jekerle, V.; Klinkhammer, W.; Reilly, R. M.; Piquette-Miller, M.; Wiese, M. Novel tetrahydroisoquinolin-ethyl-phenylamine based multidrug resistance inhibitors with broad-spectrum modulating properties. Cancer chemotherapy and pharmacology 2007, 59, 61–9.
(259) Jekerle, V.; Klinkhammer, W.; Scollard, D. a; Breitbach, K.; Reilly, R. M.; Piquette-Miller, M.; Wiese, M. In vitro and in vivo evaluation of WK-X-34, a novel inhibitor of P-glycoprotein and BCRP, using radio imaging techniques. International journal of cancer. Journal international du cancer 2006, 119, 414–22.
(260) Ding, R.; Shi, J.; Pabon, K.; Scotto, K. W. Xanthines down-regulate the drug transporter ABCG2 and reverse multidrug resistance. Molecular pharmacology 2012, 81, 328–37.

79
(261) Gupta, A.; Zhang, Y.; Unadkat, J. D.; Mao, Q. HIV protease inhibitors are inhibitors but not substrates of the human breast cancer resistance protein (BCRP/ABCG2). The Journal of pharmacology and experimental therapeutics 2004, 310, 334–41.
(262) Boumendjel, A.; Nicolle, E.; Moraux, T.; Gerby, B.; Blanc, M.; Ronot, X.; Boutonnat, J. Piperazinobenzopyranones and phenalkylaminobenzopyranones: potent inhibitors of breast cancer resistance protein (ABCG2). Journal of medicinal chemistry 2005, 48, 7275–81.
(263) Brooks, T. A.; Minderman, H.; O’Loughlin, K. L.; Pera, P.; Ojima, I.; Baer, M. R.; Bernacki, R. J.; Brooks, T. Taxane-based reversal agents modulate drug resistance mediated by P-glycoprotein, multidrug resistance protein, and breast cancer resistance protein. Molecular cancer therapeutics 2003, 2, 1195–205.
(264) Zhao, E.; Mu, Q. Phytoestrogen biological actions on Mammalian reproductive system and cancer growth. Scientia pharmaceutica 2011, 79, 1–20.
(265) Jonker, J. W.; Merino, G.; Musters, S.; Van Herwaarden, A. E.; Bolscher, E.; Wagenaar, E.; Mesman, E.; Dale, T. C.; Schinkel, A. H. The breast cancer resistance protein BCRP (ABCG2) concentrates drugs and carcinogenic xenotoxins into milk. Nature medicine 2005, 11, 127–9.
(266) Noguchi, K.; Katayama, K.; Mitsuhashi, J.; Sugimoto, Y. Functions of the breast cancer resistance protein (BCRP/ABCG2) in chemotherapy. Advanced drug delivery reviews 2009, 61, 26–33.
(267) Kim, Y. H.; Ishii, G.; Goto, K.; Ota, S.; Kubota, K.; Murata, Y.; Mishima, M.; Saijo, N.; Nishiwaki, Y.; Ochiai, A. Expression of breast cancer resistance protein is associated with a poor clinical outcome in patients with small-cell lung cancer. Lung cancer (Amsterdam, Netherlands) 2009, 65, 105–11.
(268) Zamber, C. P.; Lamba, J. K.; Yasuda, K.; Farnum, J.; Thummel, K.; Schuetz, J. D.; Schuetz, E. G. Natural allelic variants of breast cancer resistance protein (BCRP) and their relationship to BCRP expression in human intestine. Pharmacogenetics 2003, 13, 19–28.
(269) Suvannasankha, a; Minderman, H.; O’Loughlin, K. L.; Nakanishi, T.; Greco, W. R.; Ross, D. D.; Baer, M. R. Breast cancer resistance protein (BCRP/MXR/ABCG2) in acute myeloid leukemia: discordance between expression and function. Leukemia : official journal of the Leukemia Society of America, Leukemia Research Fund, U.K 2004, 18, 1252–7.
(270) Suvannasankha, A.; Minderman, H.; O’Loughlin, K. L.; Nakanishi, T.; Ford, L. a; Greco, W. R.; Wetzler, M.; Ross, D. D.; Baer, M. R. Breast cancer resistance protein (BCRP/MXR/ABCG2) in adult acute lymphoblastic leukaemia: frequent

80
expression and possible correlation with shorter disease-free survival. British journal of haematology 2004, 127, 392–8.
(271) Benderra, Z.; Faussat, A.-M.; Sayada, L.; Perrot, J.-Y.; Chaoui, D.; Marie, J.-P.; Legrand, O. Breast cancer resistance protein and P-glycoprotein in 149 adult acute myeloid leukemias. Clinical cancer research : an official journal of the American Association for Cancer Research 2004, 10, 7896–902.
(272) Tsunoda, S.; Okumura, T.; Ito, T.; Kondo, K.; Ortiz, C.; Tanaka, E.; Watanabe, G.; Itami, A.; Sakai, Y.; Shimada, Y. ABCG2 expression is an independent unfavorable prognostic factor in esophageal squamous cell carcinoma. Oncology 2006, 71, 251–8.
(273) Usuda, J.; Tsunoda, Y.; Ichinose, S.; Ishizumi, T.; Ohtani, K.; Maehara, S.; Ono, S.; Tsutsui, H.; Ohira, T.; Okunaka, T.; Furukawa, K.; Sugimoto, Y.; Kato, H.; Ikeda, N. Breast cancer resistant protein (BCRP) is a molecular determinant of the outcome of photodynamic therapy (PDT) for centrally located early lung cancer. Lung cancer (Amsterdam, Netherlands) 2010, 67, 198–204.
(274) Uggla, B.; Ståhl, E.; Wågsäter, D.; Paul, C.; Karlsson, M. G.; Sirsjö, A.; Tidefelt, U. BCRP mRNA expression v. clinical outcome in 40 adult AML patients. Leukemia research 2005, 29, 141–6.
(275) Yoh, K. Breast Cancer Resistance Protein Impacts Clinical Outcome in Platinum-Based Chemotherapy for Advanced Non-Small Cell Lung Cancer. Clinical Cancer Research 2004, 10, 1691–1697.
(276) Jitsukawa, K.; Suizu, R.; Hidano, A. Chlorella photosensitization. New phytophotodermatosis. International journal of dermatology 1984, 23, 263–8.
(277) Wan, P.; Moat, S.; Anstey, A. Pellagra: a review with emphasis on photosensitivity. The British journal of dermatology 2011, 164, 1188–200.
(278) Ho, A. Y. L.; Deacon, A.; Osborne, G.; Mufti, G. J. Precipitation of porphyria cutanea tarda by imatinib mesylate? British journal of haematology 2003, 121, 375.
(279) Brazzelli, V.; Prestinari, F.; Barbagallo, T.; Rona, C.; Orlandi, E.; Passamonti, F.; Locatelli, F.; Zecca, M.; Villani, S.; Borroni, G. A long-term time course of colorimetric assessment of the effects of imatinib mesylate on skin pigmentation: a study of five patients. Journal of the European Academy of Dermatology and Venereology : JEADV 2007, 21, 384–7.
(280) Brazzelli, V.; Muzio, F.; Manna, G.; Moggio, E.; Vassallo, C.; Orlandi, E.; Fiandrino, G.; Lucioni, M.; Borroni, G. Photoinduced dermatitis and oral lichenoid

81
reaction in a chronic myeloid leukemia patient treated with imatinib mesylate. Photodermatology, photoimmunology & photomedicine 2012, 28, 2–5.
(281) Boumendjel, a; Macalou, S.; Valdameri, G.; Pozza, a; Gauthier, C.; Arnaud, O.; Nicolle, E.; Magnard, S.; Falson, P.; Terreux, R.; Carrupt, P.; Payen, L.; Di Pietro, a Targeting the multidrug ABCG2 transporter with flavonoidic inhibitors: in vitro optimization and in vivo validation. Current medicinal chemistry 2011, 18, 3387–401.
(282) Tamura, A.; Wakabayashi, K.; Onishi, Y.; Takeda, M.; Ikegami, Y.; Sawada, S.; Tsuji, M.; Matsuda, Y.; Ishikawa, T. Re-evaluation and functional classification of non-synonymous single nucleotide polymorphisms of the human ATP-binding cassette transporter ABCG2. Cancer Science 2007, 98, 231–239.
(283) Krishnamurthy, P.; Schuetz, J. D. The ABC transporter Abcg2/Bcrp: role in hypoxia mediated survival. Biometals : an international journal on the role of metal ions in biology, biochemistry, and medicine 2005, 18, 349–58.
(284) IEIRI, I. Functional Significance of Genetic Polymorphisms in P-glycoprotein (MDR1, ABCB1) and Breast Cancer Resistance Protein (BCRP, ABCG2). Drug metabolism and pharmacokinetics 2011.
(285) Cascorbi, I. Role of pharmacogenetics of ATP-binding cassette transporters in the pharmacokinetics of drugs. Pharmacology & therapeutics 2006, 112, 457–73.
(286) Sarkadi, B.; Homolya, L.; Szakács, G.; Váradi, A. Human multidrug resistance ABCB and ABCG transporters: participation in a chemoimmunity defense system. Physiological reviews 2006, 86, 1179–236.
(287) Urban, T. J.; Sebro, R.; Hurowitz, E. H.; Leabman, M. K.; Badagnani, I.; Lagpacan, L. L.; Risch, N.; Giacomini, K. M. Functional genomics of membrane transporters in human populations. Genome research 2006, 16, 223–30.
(288) Meyer, H. E.; Kroemer, H. K. Drug Transporters: In Vitro and In Vivo Evidence for the Importance of Breast Cancer Resistance Protein Transporters (BCRP/MXR/ABCP/ABCG2); Fromm, M. F.; Kim, R. B., Eds.; Springer Berlin Heidelberg: Berlin, Heidelberg, 2011; Vol. 201.
(289) Mizuarai, S.; Aozasa, N.; Kotani, H. Single nucleotide polymorphisms result in impaired membrane localization and reduced atpase activity in multidrug transporter ABCG2. International journal of cancer. Journal international du cancer 2004, 109, 238–46.
(290) Tamura, A.; Wakabayashi, K.; Onishi, Y.; Nakagawa, H.; Tsuji, M.; Matsuda, Y.; Ishikawa, T. Genetic polymorphisms of human ABC transporter ABCG2: development of the standard method for functional validation of SNPs by using the

82
Flp recombinase system. Journal of experimental therapeutics & oncology 2006, 6, 1–11.
(291) Kondo, C.; Suzuki, H.; Itoda, M.; Ozawa, S.; Sawada, J.; Kobayashi, D.; Ieiri, I.; Mine, K.; Ohtsubo, K.; Sugiyama, Y. Functional analysis of SNPs variants of BCRP/ABCG2. Pharmaceutical research 2004, 21, 1895–903.
(292) Ingelheim, B.; Imai, Y.; Nakane, M.; Kage, K.; Tsukahara, S.; Ishikawa, E.; Tsuruo, T.; Miki, Y.; Sugimoto, Y. C421A polymorphism in the human breast cancer resistance protein gene is associated with low expression of Q141K protein and low-level drug resistance. Molecular cancer therapeutics 2002, 1, 611–6.
(293) Ishikawa, T.; Sakurai, A.; Kanamori, Y.; Nagakura, M.; Hirano, H.; Takarada, Y.; Yamada, K.; Fukushima, K.; Kitajima, M. High-speed screening of human ATP-binding cassette transporter function and genetic polymorphisms: new strategies in pharmacogenomics. Methods in enzymology 2005, 400, 485–510.
(294) Morisaki, K.; Robey, R. W.; Ozvegy-Laczka, C.; Honjo, Y.; Polgar, O.; Steadman, K.; Sarkadi, B.; Bates, S. E. Single nucleotide polymorphisms modify the transporter activity of ABCG2. Cancer chemotherapy and pharmacology 2005, 56, 161–72.
(295) Kim, D. H. D.; Sriharsha, L.; Xu, W.; Kamel-Reid, S.; Liu, X.; Siminovitch, K.; Messner, H. a.; Lipton, J. H. Clinical relevance of a pharmacogenetic approach using multiple candidate genes to predict response and resistance to imatinib therapy in chronic myeloid leukemia. Clinical cancer research : an official journal of the American Association for Cancer Research 2009, 15, 4750–8.
(296) Gardner, E. R.; Burger, H.; Van Schaik, R. H.; Van Oosterom, A. T.; De Bruijn, E. a; Guetens, G.; Prenen, H.; De Jong, F. a; Baker, S. D.; Bates, S. E.; Figg, W. D.; Verweij, J.; Sparreboom, A.; Nooter, K. Association of enzyme and transporter genotypes with the pharmacokinetics of imatinib. Clinical pharmacology and therapeutics 2006, 80, 192–201.
(297) Sugimoto, Y.; Tsukahara, S.; Ishikawa, E.; Mitsuhashi, J. Breast cancer resistance protein: molecular target for anticancer drug resistance and pharmacokinetics/pharmacodynamics. Cancer science 2005, 96, 457–65.
(298) Kasza, I.; Várady, G.; Andrikovics, H.; Koszarska, M.; Tordai, A.; Scheffer, G. L.; Németh, A.; Szakács, G.; Sarkadi, B. Expression Levels of the ABCG2 Multidrug Transporter in Human Erythrocytes Correspond to Pharmacologically Relevant Genetic Variations. PloS one 2012, 7, e48423.
(299) Furukawa, T.; Wakabayashi, K.; Tamura, A.; Nakagawa, H.; Morishima, Y.; Osawa, Y.; Ishikawa, T. Major SNP (Q141K) variant of human ABC transporter

83
ABCG2 undergoes lysosomal and proteasomal degradations. Pharmaceutical research 2009, 26, 469–79.
(300) Wakabayashi-Nakao, K.; Tamura, A.; Furukawa, T.; Nakagawa, H.; Ishikawa, T. Quality control of human ABCG2 protein in the endoplasmic reticulum: ubiquitination and proteasomal degradation. Advanced drug delivery reviews 2009, 61, 66–72.
(301) Yamasaki, Y.; Ieiri, I.; Kusuhara, H.; Sasaki, T.; Kimura, M.; Tabuchi, H.; Ando, Y.; Irie, S.; Ware, J.; Nakai, Y.; Higuchi, S.; Sugiyama, Y. Pharmacogenetic characterization of sulfasalazine disposition based on NAT2 and ABCG2 (BCRP) gene polymorphisms in humans. Clinical pharmacology and therapeutics 2008, 84, 95–103.
(302) Kim, I.-S.; Kim, H.-G.; Kim, D. C.; Eom, H.-S.; Kong, S.-Y.; Shin, H.-J.; Hwang, S.-H.; Lee, E.-Y.; Lee, G.-W. ABCG2 Q141K polymorphism is associated with chemotherapy-induced diarrhea in patients with diffuse large B-cell lymphoma who received frontline rituximab plus cyclophosphamide/doxorubicin/vincristine/prednisone chemotherapy. Cancer science 2008, 99, 2496–501.
(303) Cusatis, G.; Gregorc, V.; Li, J.; Spreafico, A.; Ingersoll, R. G.; Verweij, J.; Ludovini, V.; Villa, E.; Hidalgo, M.; Sparreboom, A.; Baker, S. D. Pharmacogenetics of ABCG2 and adverse reactions to gefitinib. Journal of the National Cancer Institute 2006, 98, 1739–42.
(304) Erdilyi, D. J.; Kámory, E.; Csókay, B.; Andrikovics, H.; Tordai, a; Kiss, C.; Filni-Semsei, a; Janszky, I.; Zalka, a; Fekete, G.; Falus, a; Kovács, G. T.; Szalai, C. Synergistic interaction of ABCB1 and ABCG2 polymorphisms predicts the prevalence of toxic encephalopathy during anticancer chemotherapy. The pharmacogenomics journal 2008, 8, 321–7.
(305) Nguyen, T. D.; Gow, J. M.; Chinn, L. W.; Kelly, L.; Jeong, H.; Huang, C. C.; Stryke, D.; Kawamoto, M.; Johns, S. J.; Carlson, E.; Taylor, T.; Ferrin, T. E.; Sali, A.; Giacomini, K. M.; Kroetz, D. L. PharmGKB submission update: IV. PMT submissions of genetic variations in ATP-Binding cassette transporters to the PharmGKB network. Pharmacological reviews 2006, 58, 1–2.
(306) Honjo, Y.; Morisaki, K.; Huff, L.; Robey, R. W.; Hung, J.; Dean, M.; Bates, S. E. Single-nucleotide polymorphism (SNP) analysis in the ABC half-transporter ABCG2 (MXR/BCRP/ABCP1). Cancer biology & … 2002, 2, 696–702.
(307) Aekawa, K. M.; Toda, M. I.; Ai, K. S.; Aito, Y. S.; Aniwa, N. K.; Hirao, K. S.; Amaguchi, T. H.; Unitoh, H. K.; Amamoto, N. Y.; Amura, T. T.; Inami, H. M.; Ubota, K. K.; Htsu, A. O.; Maekawa, K.; Itoda, M.; Sai, K.; Saito, Y. Genetic

84
variation and haplotype structure of the ABC transporter gene ABCG2 in a Japanese population. Drug metabolism and 2006, 21, 109–121.
(308) Imai, Y.; Nakane, M.; Kage, K.; Tsukahara, S.; Ishikawa, E.; Tsuruo, T.; Miki, Y.; Sugimoto, Y. C421A polymorphism in the human breast cancer resistance protein gene is associated with low expression of Q141K protein and low-level drug resistance. Molecular cancer therapeutics 2002, 1, 611–6.
(309) Lee, S. S.; Jeong, H.; Yi, J.; Jung, H.; Jang, J.; Kim, E.; Lee, S.; Shin, J.; Al, L. E. E. E. T. Identification and Functional Assessment of BCRP Polymorphisms in a Korean Population. Pharmacology 2007, 35, 623–632.
(310) Bäckström, G.; Taipalensuu, J.; Melhus, H.; Brändström, H.; Svensson, A.-C.; Artursson, P.; Kindmark, A. Genetic variation in the ATP-binding cassette transporter gene ABCG2 (BCRP) in a Swedish population. European journal of pharmaceutical sciences : official journal of the European Federation for Pharmaceutical Sciences 2003, 18, 359–64.
(311) ITODA, M.; SAITO, Y.; SHIRAO, K. Eight novel single nucleotide polymorphisms in ABCG2/BCRP in Japanese cancer patients administered irinotacan. Drug metabolism and … 2003, 18, 212–217.
(312) Ishikawa, T.; Nakagawa, H.; Hagiya, Y.; Nonoguchi, N.; Miyatake, S.-I.; Kuroiwa, T. Key Role of Human ABC Transporter ABCG2 in Photodynamic Therapy and Photodynamic Diagnosis. Advances in pharmacological sciences 2010, 2010, 587306.
(313) Bosch, T. M.; Kjellberg, L. M.; Bouwers, A.; Koeleman, B. P. C.; Schellens, J. H. M.; Beijnen, J. H.; Smits, P. H. M.; Meijerman, I. Detection of single nucleotide polymorphisms in the ABCG2 gene in a Dutch population. American journal of pharmacogenomics : genomics-related research in drug development and clinical practice 2005, 5, 123–31.
(314) Cheng, G. M. Y.; To, K. K. W. Adverse Cell Culture Conditions Mimicking the Tumor Microenvironment Upregulate ABCG2 to Mediate Multidrug Resistance and a More Malignant Phenotype. ISRN oncology 2012, 2012, 746025.
(315) Pradhan, M.; Bembinster, L. a; Baumgarten, S. C.; Frasor, J. Proinflammatory cytokines enhance estrogen-dependent expression of the multidrug transporter gene ABCG2 through estrogen receptor and NF{kappa}B cooperativity at adjacent response elements. The Journal of biological chemistry 2010, 285, 31100–6.
(316) Jigorel, E.; Vee, M. Le; Boursier-neyret, C.; Parmentier, Y.; Fardel, O. Differential Regulation of Sinusoidal and Canalicular Hepatic Drug Transporter Expression by Xenobiotics Activating Drug-Sensing Receptors in Primary Human Hepatocytes ABSTRACT : 2006, 34, 1756–1763.

85
(317) Wang, H.; Lee, E.; Zhou, L.; Leung, P. C. K.; Ross, D. D.; Unadkat, J. D.; Mao, Q. Progesterone receptor (PR) isoforms PRA and PRB differentially regulate expression of the breast cancer resistance protein in human placental choriocarcinoma BeWo cells. Molecular pharmacology 2008, 73, 845–54.
(318) Zhang, Y.; Zhou, G.; Wang, H.; Zhang, X.; Wei, F.; Cai, Y.; Yin, D. Transcriptional upregulation of breast cancer resistance protein by 17beta-estradiol in ERalpha-positive MCF-7 breast cancer cells. Oncology 2006, 71, 446–55.
(319) Lemos, C.; Kathmann, I.; Giovannetti, E.; Dekker, H.; Scheffer, G. L.; Calhau, C.; Jansen, G.; Peters, G. J. Folate deprivation induces BCRP (ABCG2) expression and mitoxantrone resistance in Caco-2 cells. International journal of cancer. Journal international du cancer 2008, 123, 1712–20.
(320) Lemos, C.; Kathmann, I.; Giovannetti, E.; Calhau, C.; Jansen, G.; Peters, G. J. Impact of cellular folate status and epidermal growth factor receptor expression on BCRP/ABCG2-mediated resistance to gefitinib and erlotinib. British journal of cancer 2009, 100, 1120–7.
(321) Smith, R. P.; Lam, E. T.; Markova, S.; Yee, S. W.; Ahituv, N. Pharmacogene regulatory elements: from discovery to applications. Genome medicine 2012, 4, 45.
(322) Campbell, P. K.; Zong, Y.; Yang, S.; Zhou, S.; Rubnitz, J. E.; Sorrentino, B. P. Identification of a novel, tissue-specific ABCG2 promoter expressed in pediatric acute megakaryoblastic leukemia. Leukemia research 2011, 35, 1321–9.
(323) Nakanishi, T.; Bailey-Dell, K. J.; Hassel, B. a; Shiozawa, K.; Sullivan, D. M.; Turner, J.; Ross, D. D. Novel 5’ untranslated region variants of BCRP mRNA are differentially expressed in drug-selected cancer cells and in normal human tissues: implications for drug resistance, tissue-specific expression, and alternative promoter usage. Cancer research 2006, 66, 5007–11.
(324) Natarajan, K.; Xie, Y.; Nakanishi, T.; Beck, W. T.; Bauer, K. S.; Ross, D. D. Identification and characterization of the major alternative promoter regulating Bcrp1/Abcg2 expression in the mouse intestine. Biochimica et biophysica acta 2011, 1809, 295–305.
(325) Bailey-Dell, K. J.; Hassel, B.; Doyle, L. a; Ross, D. D. Promoter characterization and genomic organization of the human breast cancer resistance protein (ATP-binding cassette transporter G2) gene. Biochimica et biophysica acta 2001, 1520, 234–41.
(326) Zong, Y.; Zhou, S.; Fatima, S.; Sorrentino, B. P. Expression of mouse Abcg2 mRNA during hematopoiesis is regulated by alternative use of multiple leader exons and promoters. The Journal of biological chemistry 2006, 281, 29625–32.

86
(327) To, K. K. W.; Robey, R.; Zhan, Z.; Bangiolo, L.; Bates, S. E. Upregulation of ABCG2 by romidepsin via the aryl hydrocarbon receptor pathway. Molecular cancer research : MCR 2011, 9, 516–27.
(328) Tan, K. P.; Wang, B.; Yang, M.; Boutros, P. C.; Macaulay, J.; Xu, H.; Chuang, A. I.; Kosuge, K.; Yamamoto, M.; Takahashi, S.; Wu, A. M. L.; Ross, D. D.; Harper, P. A.; Ito, S. Aryl Hydrocarbon Receptor Is a Transcriptional Activator of the Human Breast Cancer Resistance Protein ( BCRP / ABCG2 ) □. 2010.
(329) Ee, P. L. R. Identification of a Novel Estrogen Response Element in the Breast Cancer Resistance Protein (ABCG2) Gene. Cancer Research 2004, 64, 1247–1251.
(330) Krishnamurthy, P.; Ross, D. D.; Nakanishi, T.; Bailey-Dell, K.; Zhou, S.; Mercer, K. E.; Sarkadi, B.; Sorrentino, B. P.; Schuetz, J. D. The stem cell marker Bcrp/ABCG2 enhances hypoxic cell survival through interactions with heme. The Journal of biological chemistry 2004, 279, 24218–25.
(331) Singh, A.; Wu, H.; Zhang, P.; Happel, C. Expression of ABCG2 (BCRP) is regulated by Nrf2 in cancer cells that confers side population and chemoresistance phenotype. Molecular cancer … 2010, 9, 2365–2376.
(332) Wu, A. M. L.; Dalvi, P.; Lu, X.; Yang, M.; Riddick, D. S.; Matthews, J.; Clevenger, C. V; Ross, D. D.; Harper, P. a; Ito, S. Induction of Multidrug Resistance Transporter ABCG2 by Prolactin in Human Breast Cancer Cells.; 2012.
(333) Herkert, B.; Eilers, M. Transcriptional repression: the dark side of myc. Genes & cancer 2010, 1, 580–6.
(334) Porro, A.; Iraci, N.; Soverini, S.; Diolaiti, D.; Gherardi, S.; Terragna, C.; Durante, S.; Valli, E.; Kalebic, T.; Bernardoni, R.; Perrod, C.; Haber, M.; Norris, M. D.; Baccarani, M.; Martinelli, G.; Perini, G. c-MYC Oncoprotein Dictates Transcriptional Profiles of ATP-Binding Cassette Transporter Genes in Chronic Myelogenous Leukemia CD34+ Hematopoietic Progenitor Cells. Molecular cancer research : MCR 2011, 9, 1054–66.
(335) Rudin, C. M.; Liu, W.; Desai, A.; Karrison, T.; Jiang, X.; Janisch, L.; Das, S.; Ramirez, J.; Poonkuzhali, B.; Schuetz, E.; Fackenthal, D. L.; Chen, P.; Armstrong, D. K.; Brahmer, J. R.; Fleming, G. F.; Vokes, E. E.; Carducci, M. A.; Ratain, M. J. Pharmacogenomic and pharmacokinetic determinants of erlotinib toxicity. Journal of clinical oncology : official journal of the American Society of Clinical Oncology 2008, 26, 1119–27.

87
(336) Ehrlich, M.; Gama-Sosa, M. Amount and distribution of 5-methylcytosine in human DNA from different types of tissues or cells. Nucleic acids … 1982, 10, 11–14.
(337) Takai, D.; Jones, P. a Comprehensive analysis of CpG islands in human chromosomes 21 and 22. Proceedings of the National Academy of Sciences of the United States of America 2002, 99, 3740–5.
(338) Bird, A. CpG-rich islands and the function of DNA methylation. Nature 1986.
(339) Cooper, S. J.; Trinklein, N. D.; Anton, E. D.; Nguyen, L.; Myers, R. M. Comprehensive analysis of transcriptional promoter structure and function in 1% of the human genome. Genome research 2006, 16, 1–10.
(340) Larsen, F.; Gundersen, G.; Lopez, R.; Prydz, H. CpG islands as gene markers in the human genome. Genomics 1992, 13, 1095–107.
(341) Reik, W.; Murrell, A. Silence across the border. 2000, 405, 408–409.
(342) Wolffe, a P. Transcriptional control: imprinting insulation. Current biology : CB 2000, 10, R463–5.
(343) Ding, S.; Gong, B.-D.; Yu, J.; Gu, J.; Zhang, H.-Y.; Shang, Z.-B.; Fei, Q.; Wang, P.; Zhu, J.-D. Methylation profile of the promoter CpG islands of 14 “drug-resistance” genes in hepatocellular carcinoma. World journal of gastroenterology : WJG 2004, 10, 3433–40.
(344) To, K. K. W.; Zhan, Z.; Bates, S. E. Aberrant promoter methylation of the ABCG2 gene in renal carcinoma. Molecular and cellular biology 2006, 26, 8572–85.
(345) Nakano, H.; Nakamura, Y.; Soda, H.; Kamikatahira, M.; Uchida, K.; Takasu, M.; Kitazaki, T.; Yamaguchi, H.; Nakatomi, K.; Yanagihara, K.; Kohno, S.; Tsukamoto, K. Methylation status of breast cancer resistance protein detected by methylation-specific polymerase chain reaction analysis is correlated inversely with its expression in drug-resistant lung cancer cells. Cancer 2008, 112, 1122–30.
(346) Turner, J. G.; Gump, J. L.; Zhang, C.; Cook, J. M.; Marchion, D.; Hazlehurst, L.; Munster, P.; Schell, M. J.; Dalton, W. S.; Sullivan, D. M. ABCG2 expression, function, and promoter methylation in human multiple myeloma. Blood 2006, 108, 3881–9.
(347) Bram, E.; Stark, M.; Raz, S.; Assaraf, Y. Chemotherapeutic drug-induced ABCG2 promoter demethylation as a novel mechanism of acquired multidrug resistance. Neoplasia (New York, NY) 2009, 11, 1359–1370.

88
(348) Chen, M.; Xue, X.; Wang, F.; An, Y.; Tang, D.; Xu, Y.; Wang, H.; Yuan, Z.; Gao, W.; Wei, J.; Zhang, J.; Miao, Y. Expression and promoter methylation analysis of ATP-binding cassette genes in pancreatic cancer. Oncology reports 2012, 27, 265–9.
(349) Bram, E.; Stark, M.; Raz, S. Chemotherapeutic drug-induced ABCG2 promoter demethylation as a novel mechanism of acquired multidrug resistance. Neoplasia (New York, NY) 2009, 11, 1359–1370.
(350) Hiraki, M.; Kitajima, Y.; Sato, S.; Mitsuno, M.; Koga, Y.; Nakamura, J.; Hashiguchi, K.; Noshiro, H.; Miyazaki, K. Aberrant gene methylation in the lymph nodes provides a possible marker for diagnosing micrometastasis in gastric cancer. Annals of surgical oncology 2010, 17, 1177–86.
(351) Georgitsi, M.; Zukic, B.; Pavlovic, S.; Patrinos, G. P. Transcriptional regulation and pharmacogenomics. Pharmacogenomics 2011, 12, 655–73.
(352) Tirona, R. Molecular mechanisms of drug transporter regulation. Drug Transporters 2011, 201.
(353) Urquhart, B.; Tirona, R.; Kim, R. Nuclear receptors and the regulation of drug-metabolizing enzymes and drug transporters: implications for interindividual variability in response to drugs. The Journal of Clinical … 2007.
(354) Germain, P.; Staels, B.; Dacquet, C.; Spedding, M.; Laudet, V. Overview of Nomenclature of Nuclear Receptors. 2006, 58, 685–704.
(355) Schupp, M.; Lazar, M. a Endogenous ligands for nuclear receptors: digging deeper. The Journal of biological chemistry 2010, 285, 40409–15.
(356) Mangelsdorf, D. J.; Thummel, C.; Beato, M.; Herrlich, P.; Schütz, G.; Umesono, K.; Blumberg, B.; Kastner, P.; Mark, M.; Chambon, P.; Evans, R. M. The nuclear receptor superfamily: the second decade. Cell 1995, 83, 835–9.
(357) Olefsky, J. M. Nuclear receptor minireview series. The Journal of biological chemistry 2001, 276, 36863–4.
(358) Klinge, C. M.; Bodenner, D. L.; Desai, D.; Niles, R. M.; Traish, a M. Binding of type II nuclear receptors and estrogen receptor to full and half-site estrogen response elements in vitro. Nucleic acids research 1997, 25, 1903–12.
(359) Germain, P.; Chambon, P.; Eichele, G.; Evans, R. M.; Lazar, M. A.; Leid, M.; De Lera, A. R.; Lotan, R.; Mangelsdorf, D. J.; Gronemeyer, H. International Union of Pharmacology. LXIII. Retinoid X receptors. Pharmacological reviews 2006, 58, 760–72.

89
(360) Novac, N.; Heinzel, T. Nuclear receptors: overview and classification. Current drug targets. Inflammation and allergy 2004, 3, 335–46.
(361) Lee, S. K.; Choi, H. S.; Song, M. R.; Lee, M. O.; Lee, J. W. Estrogen receptor, a common interaction partner for a subset of nuclear receptors. Molecular endocrinology (Baltimore, Md.) 1998, 12, 1184–92.
(362) Szatmari, I.; Vámosi, G.; Brazda, P.; Balint, B. L.; Benko, S.; Széles, L.; Jeney, V.; Ozvegy-Laczka, C.; Szántó, A.; Barta, E.; Balla, J.; Sarkadi, B.; Nagy, L. Peroxisome proliferator-activated receptor gamma-regulated ABCG2 expression confers cytoprotection to human dendritic cells. The Journal of biological chemistry 2006, 281, 23812–23.
(363) Overington, J. P.; Al-Lazikani, B.; Hopkins, A. L. How many drug targets are there? Nature reviews. Drug discovery 2006, 5, 993–6.
(364) Zhao, C.; Gao, H.; Liu, Y.; Papoutsi, Z.; Jaffrey, S.; Gustafsson, J.-A.; Dahlman-Wright, K. Genome-wide mapping of estrogen receptor-beta-binding regions reveals extensive cross-talk with transcription factor activator protein-1. Cancer research 2010, 70, 5174–83.
(365) Carroll, J. S.; Meyer, C. a; Song, J.; Li, W.; Geistlinger, T. R.; Eeckhoute, J.; Brodsky, A. S.; Keeton, E. K.; Fertuck, K. C.; Hall, G. F.; Wang, Q.; Bekiranov, S.; Sementchenko, V.; Fox, E. a; Silver, P. a; Gingeras, T. R.; Liu, X. S.; Brown, M. Genome-wide analysis of estrogen receptor binding sites. Nature genetics 2006, 38, 1289–97.
(366) Safe, S. Transcriptional activation of genes by 17 beta-estradiol through estrogen receptor-Sp1 interactions. Vitamins and hormones 2001, 62, 231–52.
(367) Schultz, J. R.; Petz, L. N.; Nardulli, A. M. Cell- and ligand-specific regulation of promoters containing activator protein-1 and Sp1 sites by estrogen receptors alpha and beta. The Journal of biological chemistry 2005, 280, 347–54.
(368) Dutertre, M.; Smith, C. L. Ligand-independent interactions of p160/steroid receptor coactivators and CREB-binding protein (CBP) with estrogen receptor-alpha: regulation by phosphorylation sites in the A/B region depends on other receptor domains. Molecular endocrinology (Baltimore, Md.) 2003, 17, 1296–314.
(369) Acevedo, M. L.; Kraus, W. L. Mediator and p300 / CBP-Steroid Receptor Coactivator Complexes Have Distinct Roles , but Function Synergistically , during Estrogen Receptor α -Dependent Transcription with Chromatin Templates Mediator and p300 / CBP-Steroid Receptor Coactivator Complexes. 2003.
(370) Wilson, B. J. Does GATA3 act in tissue-specifi c pathways ? A meta-analysis-based approach. 2008, 1–6.

90
(371) Tan, S. K.; Lin, Z. H.; Chang, C. W.; Varang, V.; Chng, K. R.; Pan, Y. F.; Yong, E. L.; Sung, W. K.; Sung, W. K.; Cheung, E. AP-2γ regulates oestrogen receptor-mediated long-range chromatin interaction and gene transcription. The EMBO journal 2011, 30, 2569–81.
(372) Ee, P. L. R.; He, X.; Ross, D. D.; Beck, W. T. Modulation of breast cancer resistance protein ( BCRP / ABCG2 ) gene expression using RNA interference Modulation of breast cancer resistance protein ( BCRP / ABCG2 ) gene expression using RNA interference. 2005, 1577–1584.
(373) Yasuda, S.; Kobayashi, M.; Itagaki, S.; Hirano, T.; Iseki, K. Response of the ABCG2 promoter in T47D cells and BeWo cells to sex hormone treatment. Molecular biology reports 2009, 36, 1889–96.
(374) Wang, H.; Zhou, L.; Gupta, A.; Vethanayagam, R. R.; Zhang, Y.; Unadkat, J. D.; Mao, Q. Regulation of BCRP/ABCG2 expression by progesterone and 17beta-estradiol in human placental BeWo cells. American journal of physiology. Endocrinology and metabolism 2006, 290, E798–807.
(375) Imai, Y.; Ishikawa, E.; Asada, S.; Sugimoto, Y. Estrogen-mediated post transcriptional down-regulation of breast cancer resistance protein/ABCG2. Cancer research 2005, 65, 596–604.
(376) Lu, N. Z.; Wardell, S. E.; Burnstein, K. L.; Defranco, D.; Fuller, P. J.; Giguere, V.; Hochberg, R. B.; McKay, L.; Renoir, J.; Weigel, N. L.; Wilson, E. M.; McDonnell, D. P.; Cidlowski, J. A. International Union of Pharmacology. LXV. The pharmacology and classification of the nuclear receptor superfamily: glucocorticoid, mineralocorticoid, progesterone, and androgen receptors. Pharmacological reviews 2006, 58, 782–97.
(377) Ray, a; Prefontaine, K. E. Physical association and functional antagonism between the p65 subunit of transcription factor NF-kappa B and the glucocorticoid receptor. Proceedings of the National Academy of Sciences of the United States of America 1994, 91, 752–6.
(378) Oakley, R. H.; Cidlowski, J. a Cellular processing of the glucocorticoid receptor gene and protein: new mechanisms for generating tissue-specific actions of glucocorticoids. The Journal of biological chemistry 2011, 286, 3177–84.
(379) Glass, C. K.; Saijo, K. Nuclear receptor transrepression pathways that regulate inflammation in macrophages and T cells. Nature reviews. Immunology 2010, 10, 365–76.
(380) Rhen, T.; Cidlowski, J. a Antiinflammatory action of glucocorticoids--new mechanisms for old drugs. The New England journal of medicine 2005, 353, 1711–23.

91
(381) So, A. Y.-L.; Chaivorapol, C.; Bolton, E. C.; Li, H.; Yamamoto, K. R. Determinants of cell- and gene-specific transcriptional regulation by the glucocorticoid receptor. PLoS genetics 2007, 3, e94.
(382) So, A. Y.-L.; Cooper, S. B.; Feldman, B. J.; Manuchehri, M.; Yamamoto, K. R. Conservation analysis predicts in vivo occupancy of glucocorticoid receptor-binding sequences at glucocorticoid-induced genes. Proceedings of the National Academy of Sciences of the United States of America 2008, 105, 5745–9.
(383) Wong, D. L.; Siddall, B. J.; Ebert, S. N.; Bell, R. A.; Her, S. Phenylethanolamine N-methyltransferase gene expression: synergistic activation by Egr-1, AP-2 and the glucocorticoid receptor. Brain research. Molecular brain research 1998, 61, 154–61.
(384) Huang, W.; Glass, C. K. Nuclear receptors and inflammation control: molecular mechanisms and pathophysiological relevance. Arteriosclerosis, thrombosis, and vascular biology 2010, 30, 1542–9.
(385) Pascussi, J. M.; Drocourt, L.; Fabre, J. M.; Maurel, P.; Vilarem, M. J. Dexamethasone induces pregnane X receptor and retinoid X receptor-alpha expression in human hepatocytes: synergistic increase of CYP3A4 induction by pregnane X receptor activators. Molecular pharmacology 2000, 58, 361–72.
(386) Pascussi, J. M.; Drocourt, L.; Gerbal-Chaloin, S.; Fabre, J. M.; Maurel, P.; Vilarem, M. J. Dual effect of dexamethasone on CYP3A4 gene expression in human hepatocytes. Sequential role of glucocorticoid receptor and pregnane X receptor. European journal of biochemistry / FEBS 2001, 268, 6346–58.
(387) Yamaguchi, S.; Murata, Y.; Nagaya, T.; Hayashi, Y.; Ohmori, S.; Nimura, Y.; Seo, H. Glucocorticoids increase retinoid-X receptor alpha (RXRalpha) expression and enhance thyroid hormone action in primary cultured rat hepatocytes. Journal of molecular endocrinology 1999, 22, 81–90.
(388) Bhadhprasit, W.; Sakuma, T.; Hatakeyama, N.; Fuwa, M.; Kitajima, K.; Nemoto, N. Involvement of Glucocorticoid Receptor and Pregnane X Receptor in the Regulation of Mouse CYP3A44 Female-Predominant Expression by Glucocorticoid Hormone ABSTRACT : 2007, 35, 1880–1885.
(389) Honorat, M.; Mesnier, A.; Di Pietro, A.; Lin, V.; Cohen, P.; Dumontet, C.; Payen, L. Dexamethasone down-regulates ABCG2 expression levels in breast cancer cells. Biochemical and biophysical research communications 2008, 375, 308–14.
(390) Petropoulos, S.; Gibb, W.; Matthews, S. G. Glucocorticoid regulation of placental breast cancer resistance protein (Bcrp1) in the mouse. Reproductive sciences (Thousand Oaks, Calif.) 2011, 18, 631–9.

92
(391) Elahian, F.; Kalalinia, F.; Behravan, J. Dexamethasone downregulates BCRP mRNA and protein expression in breast cancer cell lines. Oncology research 2009, 18, 9–15.
(392) Schrem, H.; Klempnauer, J.; Borlak, J. Liver-enriched transcription factors in liver function and development. Part I: the hepatocyte nuclear factor network and liver-specific gene expression. Pharmacological reviews 2002, 54, 129–58.
(393) Kakizawa, T.; Miyamoto, T.; Ichikawa, K.; Kaneko, A.; Suzuki, S.; Hara, M.; Nagasawa, T.; Takeda, T.; Mori, J. i; Kumagai, M.; Hashizume, K. Functional interaction between Oct-1 and retinoid X receptor. The Journal of biological chemistry 1999, 274, 19103–8.
(394) Préfontaine, G. G.; Walther, R.; Giffin, W.; Lemieux, M. E.; Pope, L.; Haché, R. J. Selective binding of steroid hormone receptors to octamer transcription factors determines transcriptional synergism at the mouse mammary tumor virus promoter. The Journal of biological chemistry 1999, 274, 26713–9.
(395) Préfontaine, G. G.; Lemieux, M. E.; Giffin, W.; Schild-poulter, C.; Pope, L.; Lacasse, E.; Haché, R. J. G. Recruitment of Octamer Transcription Factors to DNA by Glucocorticoid Receptor Recruitment of Octamer Transcription Factors to DNA by Glucocorticoid Receptor. 1998.
(396) Nuñez, S. B.; Medin, J. a; Braissant, O.; Kemp, L.; Wahli, W.; Ozato, K.; Segars, J. H. Retinoid X receptor and peroxisome proliferator-activated receptor activate an estrogen responsive gene independent of the estrogen receptor. Molecular and cellular endocrinology 1997, 127, 27–40.
(397) Keller, H.; Givel, F.; Perroud, M.; Wahli, W. Signaling cross-talk between peroxisome proliferator-activated receptor/retinoid X receptor and estrogen receptor through estrogen response elements. Molecular endocrinology (Baltimore, Md.) 1995, 9, 794–804.
(398) Min, G.; Kim, H.; Bae, Y.; Petz, L.; Kemper, J. K. Inhibitory cross-talk between estrogen receptor (ER) and constitutively activated androstane receptor (CAR). CAR inhibits ER-mediated signaling pathway by squelching p160 coactivators. The Journal of biological chemistry 2002, 277, 34626–33.
(399) Nader, N.; Ng, S. S. M.; Wang, Y.; Abel, B. S.; Chrousos, G. P.; Kino, T. Liver x receptors regulate the transcriptional activity of the glucocorticoid receptor: implications for the carbohydrate metabolism. PloS one 2012, 7, e26751.
(400) Konno, Y.; Negishi, M.; Kodama, S. The roles of nuclear receptors CAR and PXR in hepatic energy metabolism. Drug metabolism and pharmacokinetics 2008, 23, 8–13.

93
(401) Chen, Y.; Nie, D. Pregnane X receptor and its potential role in drug resistance in cancer treatment. Recent patents on anti-cancer drug discovery 2009, 4, 19–27.
(402) Lehmann, J. M.; McKee, D. D.; Watson, M. a; Willson, T. M.; Moore, J. T.; Kliewer, S. a The human orphan nuclear receptor PXR is activated by compounds that regulate CYP3A4 gene expression and cause drug interactions. The Journal of clinical investigation 1998, 102, 1016–23.
(403) Albermann, N.; Schmitz-Winnenthal, F. H.; Z’graggen, K.; Volk, C.; Hoffmann, M. M.; Haefeli, W. E.; Weiss, J. Expression of the drug transporters MDR1/ABCB1, MRP1/ABCC1, MRP2/ABCC2, BCRP/ABCG2, and PXR in peripheral blood mononuclear cells and their relationship with the expression in intestine and liver. Biochemical pharmacology 2005, 70, 949–58.
(404) Gahir, S. S.; Piquette-miller, M. Gestational and Pregnane X Receptor-Mediated Regulation of Placental ATP-Binding Cassette Drug Transporters in Mice □. 2011, 465–471.
(405) Lemmen, J.; Tozakidis, I. E. P.; Galla, H.-J. Pregnane X receptor upregulates ABC-transporter Abcg2 and Abcb1 at the blood-brain barrier. Brain research 2012, 1–13.
(406) Kliewer, S. a.; Goodwin, B.; Willson, T. M. The nuclear pregnane X receptor: a key regulator of xenobiotic metabolism. Endocrine reviews 2002, 23, 687–702.
(407) Kalaany, N. Y.; Mangelsdorf, D. J. LXRS and FXR: the yin and yang of cholesterol and fat metabolism. Annual review of physiology 2006, 68, 159–91.
(408) Makishima, M. Identification of a Nuclear Receptor for Bile Acids. Science 1999, 284, 1362–1365.
(409) Parks, D. J. Bile Acids: Natural Ligands for an Orphan Nuclear Receptor. Science 1999, 284, 1365–1368.
(410) Kast, H. R.; Goodwin, B.; Tarr, P. T.; Jones, S. A.; Anisfeld, A. M.; Stoltz, C. M.; Tontonoz, P.; Kliewer, S.; Willson, T. M.; Edwards, P. A. Regulation of multidrug resistance-associated protein 2 (ABCC2) by the nuclear receptors pregnane X receptor, farnesoid X-activated receptor, and constitutive androstane receptor. The Journal of biological chemistry 2002, 277, 2908–15.
(411) Meyer Zu Schwabedissen, H. E.; Böttcher, K.; Chaudhry, A.; Kroemer, H. K.; Schuetz, E. G.; Kim, R. B. Liver X receptor α and farnesoid X receptor are major transcriptional regulators of OATP1B1. Hepatology (Baltimore, Md.) 2010, 52, 1797–807.

94
(412) Ohtsuka, H.; Abe, T.; Onogawa, T.; Kondo, N.; Sato, T.; Oshio, H.; Mizutamari, H.; Mikkaichi, T.; Oikawa, M.; Rikiyama, T.; Katayose, Y.; Unno, M. Farnesoid X receptor, hepatocyte nuclear factors 1alpha and 3beta are essential for transcriptional activation of the liver-specific organic anion transporter-2 gene. Journal of gastroenterology 2006, 41, 369–77.
(413) Hu, M.; Lui, S. S. H.; Tam, L.-S.; Li, E. K.; Tomlinson, B. The farnesoid X receptor -1G>T polymorphism influences the lipid response to rosuvastatin. Journal of lipid research 2012, 53, 1384–9.
(414) Hankinson, O. Role of coactivators in transcriptional activation by the aryl hydrocarbon receptor. Archives of biochemistry and biophysics 2005, 433, 379–86.
(415) Ahmed, S.; Valen, E.; Sandelin, A.; Matthews, J. Dioxin increases the interaction between aryl hydrocarbon receptor and estrogen receptor alpha at human promoters. Toxicological sciences : an official journal of the Society of Toxicology 2009, 111, 254–66.
(416) Patel, R. D.; Murray, I. a; Flaveny, C. a; Kusnadi, A.; Perdew, G. H. Ah receptor represses acute-phase response gene expression without binding to its cognate response element. Laboratory investigation; a journal of technical methods and pathology 2009, 89, 695–707.
(417) Advance, T. High-resolution genome-wide mapping of AHR and ARNT binding sites by ChIP-Seq High-resolution genome-wide mapping of AHR and ARNT binding sites by ChIP-Seq Raymond Lo * and Jason Matthews * * Department of Pharmacology and Toxicology , University of Toron. 2012.
(418) Nguyen, L. P.; Bradfield, C. a The search for endogenous activators of the aryl hydrocarbon receptor. Chemical research in toxicology 2008, 21, 102–16.
(419) Pfeifer, G. P.; Denissenko, M. F.; Olivier, M.; Tretyakova, N.; Hecht, S. S.; Hainaut, P. Tobacco smoke carcinogens, DNA damage and p53 mutations in smoking-associated cancers. Oncogene 2002, 21, 7435–51.
(420) Ebert, B.; Seidel, A.; Lampen, A. Phytochemicals induce breast cancer resistance protein in Caco-2 cells and enhance the transport of benzo[a]pyrene-3-sulfate. Toxicological sciences : an official journal of the Society of Toxicology 2007, 96, 227–36.
(421) Advance, T. The fungicide prochloraz and environmental pollutant dioxin induce the ABCG2 transporter in bovine mammary epithelial cells by the arylhydrocarbon receptor signalling pathway. 2012.
(422) Tompkins, L. M.; Li, H.; Li, L.; Lynch, C.; Xie, Y.; Nakanishi, T.; Ross, D. D.; Wang, H. A novel xenobiotic responsive element regulated by aryl hydrocarbon

95
receptor is involved in the induction of BCRP/ABCG2 in LS174T cells. Biochemical pharmacology 2010, 80, 1754–61.
(423) Qiu, Y.; Krishnan, V.; Pereira, F. A.; Tsai, S. Y.; Tsai, M. J. Chicken ovalbumin upstream promoter-transcription factors and their regulation. The Journal of steroid biochemistry and molecular biology 1996, 56, 81–5.
(424) De Martino, M. U.; Alesci, S.; Chrousos, G. P.; Kino, T. Interaction of the glucocorticoid receptor and the chicken ovalbumin upstream promoter-transcription factor II (COUP-TFII): implications for the actions of glucocorticoids on glucose, lipoprotein, and xenobiotic metabolism. Annals of the New York Academy of Sciences 2004, 1024, 72–85.
(425) Shibata, H.; Nawaz, Z.; Tsai, S. Y.; O’Malley, B. W.; Tsai, M. J. Gene silencing by chicken ovalbumin upstream promoter-transcription factor I (COUP-TFI) is mediated by transcriptional corepressors, nuclear receptor-corepressor (N-CoR) and silencing mediator for retinoic acid receptor and thyroid hormone receptor (SMRT). Molecular endocrinology (Baltimore, Md.) 1997, 11, 714–24.
(426) Park, J.-I.; Tsai, S. Y.; Tsai, M.-J. Molecular mechanism of chicken ovalbumin upstream promoter-transcription factor (COUP-TF) actions. The Keio journal of medicine 2003, 52, 174–81.

96
Chapter 2 : Functional Characterization of MXR Variants
2.1. Abstract
The mitoxantrone resistance protein (MXR, BCRP, ABCG2) is an efflux membrane
transporter with nonsynonymous variants that may alter the pharmacokinetic and
pharmacodynamic properties of MXR substrates. In the present study, the expression and
function of the MXR nonsynonymous variants V12M, Q141K, I206L, P269S, T542A,
D620N and V12M/Q141K are characterized. Transient and stable expression of MXR
variants in MCF-7 and HEK293 Flp-in cells, respectively, was used to investigate MXR
function. Inhibitable efflux of MXR substrates was measured using flow cytometry and
the localization and expression of the variant proteins was determined using Western
blots and immunohistochemistry. Inside-out vesicles from the stable cell lines were used
to test the ATPase and uptake activity of the MXR proteins. The V12M variant exhibits
reduced protein expression but higher ATPase activity than the MXR reference protein.
The Q141K variant also exhibited lower whole cell and membrane protein expression,
consistent with published data. The first characterization of the T542A variant and
V12M/Q141K transporters indicated no alteration in expression or function. The I206L
had increased inhibitable efflux of the pheophorbide A compound and D620N had higher
vanadate-sensitive ATPase activity. There was no alteration in localization of the MXR
variants. In conclusion, MXR nonsynonymous variants have substrate-dependent
alterations in function that may contribute to the interindividual variability in the
pharmacokinetics and pharmacodynamics of MXR substrates.

97
2.2. Introduction
The mitoxantrone resistance protein (MXR, BCRP, ABCG2) is a member of the
ATP-binding cassette (ABC) transporter family1. MXR and other ABCG subfamily
members are half-transporters consisting of one nucleotide binding domain (NBD) and
six transmembrane domains2,3. The functional MXR efflux transporter is found as both a
homodimer and a tetramer 4,5. MXR, located on the apical plasma membrane, transports a
wide variety of compounds including nutrients, natural dietary toxins, cytotoxic agents
and fluorescent drugs6,78. It is expressed in many tissues, including the intestine9–12,
liver9–12, breast10, placenta9–16 and blood-brain barrier10,12,17, thus playing an important
role in the detoxification and protection of the body8,18,19. Not only has wide variability of
ABCG2 expression been reported in normal tissues20–22, but overexpression of ABCG2 is
seen in some tumors22–30 and has been associated with disease-free survival 22,24–30.
Overexpression of MXR also confers resistance to a variety of anticancer agents,
including mitoxantrone, camptothecins (irinotecan, topotecan, SN-38) and
anthracyclines31–33.
Nonsynonymous variants of MXR and other ABC membrane transporters have
been implicated in in vivo drug disposition, therapeutic efficacy and adverse drug
reactions of their substrates2,69–71. The effects of transporter variants on different
substrates are not always similar; in fact, 14% of variants in membrane transporters
exhibited substrate specific defects in transport72. MXR has increased flexibility
compared to other transporters and multiple substrate binding domains that have different
inhibitor and substrate interactions73. MXR mutations occurring at the 482 amino acid are
only found in drug-resistant cells lines. However the mutations exhibit extensive

98
substrate and antagonist specific activity74. The functional studies and phenotype
association of other MXR nonsynonymous variants7,70,75 indicate that some variants of
MXR have substrate-dependent alterations in transport abilities. Thus, it is necessary to
systematically characterize the substrate-dependent effects of ABCG2 genetic variants.
MXR was initially identified in a cell line resistant to mitoxantrone34,35, an
anthracenedione derivative anticancer agent36. It is used in combination therapies to treat
prostate and breast cancers and multiple sclerosis37–39. Mitoxantrone is often used in
growth inhibition assays to measure the activity of the MXR protein40, however its
kinetic parameters for MXR (Km and Vmax) have never been reported. In fact, many MXR
substrates are still lacking kinetic analysis. With the development of ABCG2 Flp-in stable
cell lines41 and isolation techniques for inside-out vesicles42, kinetic assays are now
possible.
MXR knockout mice (Abcg2-/-) experience phototoxicity due to the accumulation
of porphyrins43, especially pheoporbide A, which are established MXR substrates44,45.
Normally, MXR protects tissues during hypoxia by effluxing heme and porphyrin
compounds out of the cell46. Phototoxicity is also a well known side effect of several
anticancer kinase inhibitors47–50, which are also MXR inhibitors51, and it occurs in
healthy individuals with chlorophyll rich diets52. Pheophorbide A is not a substrate of P-
gp or MRP1 and has been targeted as a potential MXR specific probe53. However,
nonsynonymous alleles of MXR have reduced porphyrin transport54 which may
contribute to cellular resistance to photodynamic therapy55 and cause clinical
phototoxicity.

99
Sulfasalazine is another specific substrate of MXR56. Sulfasalazine, of which 5-
aminosalicylic acid is the active metabolite, is an anti-inflammatory medication used for
rheumatoid arthritis and inflammatory bowel disease57,58. It has been used as a successful
clinical marker of MXR activity and MXR inhibition59,60. It has also been used as a
successful in vivo probe for MXR low-functioning alleles in healthy patients21.
Understanding the contribution of MXR variants to sulfasalazine exposure and efficacy
could lead to further use of this drug as an MXR probe substrate or help in facilitating
optimal drug therapy for the widely occurring systemic inflammatory diseases.
Irinotecan, a cytotoxic camptothecin whose active metabolite is SN-38, is a
commonly used anti-cancer agent for treatment of colorectal, lung and gastric tumors61.
Both irinotecan and its active metabolite SN-38 are transported by MXR62,63.
Overexpression of MXR can cause resistance to SN-38 and irinotecan in vitro64,65. The
Q141K MXR variant has been associated with SN-38 pharmacokinetics66, reduced in
vitro transport67 and severity of irinotecan-induced neutropenia66. There is also a report of
one homozygous Q141K individual with extensive SN-38 accumulation68. Further
clarification of the effect of Q141K on SN-38 transport and the investigation of other
MXR variants could enhance our understanding of irinotecan pharmacogenomics.
Current research on MXR nonsynonymous variants focuses on variants with high,
or frequent, minor allele frequencies (MAFs). However, decreased function variants of
other membrane transporters have significantly lower allele frequencies and are more
likely to alter evolutionarily conserved amino acid residues72. Aside from two variants,
V12M and Q141K, most of the reported MXR variants have low MAFs. Therefore, it is
important to determine if MXR variants, regardless of their MAFs, have altered function.

100
In this study, the effect of nonsynonymous variants identified in the SOPHIE
cohort was investigated for their effect on the expression and function of MXR. The
SOPHIE cohort is a group of ethnically diverse group of individuals who have donated
DNA and are willing to be a part of future clinical pharmacogenomic studies76.
Transiently and stably transfected cell lines were used to look at mRNA and protein
expression, protein localization, and cellular efflux. Inside-out vesicles from the stably
transfected cells were used to examine MXR vanadate-sensitive ATPase activity after
stimulation with different MXR substrates. Preliminary studies were performed in inside-
out vesicles to examine the kinetic parameters of mitoxantrone, SN38, pheophorbide A
and sulfasalazine transport by MXR variants.
2.3. Materials and Methods
2.3.1. Chemicals and Materials
Mitoxantrone, sulfasalazine, doxorubicin hydrochloride, verapamil, pantoprazole
sodium hydrate, protease inhibitor cocktail, CelLyticTM MT Lysis Buffer, Tween 20,
sodium orthovanadate, fumitremorgin C (FTC), ouabain, sodium azide, estrone-3-sulfate,
bis-tris propane (BTP), KCl, acridine orange, NADH, phosphol(enol)pyruvic acid (PEP),
lactic dehydrogenase (LD) and pyruvate kinase (PK), creatine phosphate, creatine kinase,
EGTA, MgCl2, ATP magnesium salt, NaOH, sodium dodecyl sulfate (SDS), Triton X-
100, Nunc LabTek II 2-well glass chamber slides and Potter-Elvenjem homogenizers
were all purchased from Sigma Aldrich (St. Louis, MO). The 2X TaqMan Universal PCR
Master Mix and Taqman probes ABCG2 hs01053796_m1, GAPDH Hs99999905_m1
and GusB Hs99999908_m1 were purchased from Applied Biosystems (Carlsbad, CA).

101
Vesicles made from mock transfected (BD CT) and MXR overexpressing (BD BCRP)
Sf9 cells and 488-Alexa goat anti-mouse secondary antibody were purchased from BD
Biosciences (San Jose, CA). Non-fat dried milk and 0.45 μm nitrocellulose membranes
were both purchased from Bio-Rad (Hercules, CA). Pierce BCA assay kits and 1.1 mL
polypropylene flow cytometer tubes were purchased from Thermo Scientific (Rockford
IL). RNase Easy Mini Kits, QIAquick PCR Purification Kits and QIAprep Miniprep Kits
were all purchased from Qiagen (Valencia, CA). The human embryonic kidney
(HEK293) Flp-in cell line, high-glucose Dulbecco’s modified Eagle’s medium (DMEM),
Opti-Minimal Essential Medium (Opti-MEM), dithiothreitol (DTT), BioRad
Kaleidoscope Protein Ladder, NuPage 4X Sample buffer, β-mercapthanone, NuPage 20X
running buffer, NuPage 20X transfer buffer, NOVEX-NuPAGE 4-12% Bis-Tris SDS-
PAGE gels, GAPDH antibody (mouse anti-human), pOG44 vector, pcDNA5/FRT vector,
DH5α competent cells, ProLong Gold Antifade plus DAPI mounting reagent,
SuperScript® III First-Strand Synthesis System and Lipofectamine 2000 were all
purchased from Invitrogen (Carlsbad, CA). The 100 mm LB Amp-100 agar plates, LB
Broth supplemented with 100 μg/mL ampicilin and 10X MOPS buffer were purchased
from Teknova (Hollister, CA). DMSO, 1X phosphate buffered saline (PBS), 0.05%
trypsin, hygromycin, Tris-HCl, EDTA, HEPES and 100X penicillin and streptomycin
were all purchased from the UCSF Cell Culture Facility (San Francisco, CA). Methanol
and acetone were both purchased from Fisher Scientific (Pittsburgh, PA). High-Fidelity
Phusion Buffer, Phusion High-Fidelity DNA Polymerase, bovine serum albumin (BSA),
DpnI, and DpnI digestion buffer were all purchased from New England Biolabs (Ipswich,
MA). All other materials including the human breast adenocarcinoma (MCF-7) cell line

102
(American Type Culture Collection, Manassas, VA), 10% fetal bovine serum (FBS,
Axenia BioLogix, Dixon, CA), Improved Minimum Essential Medium (IMEM) without
phenol red (Mediatech Inc, Manassas, VA), anti-human ABCG2 antibody 5D3 PE
conjugated (eBioscience, San Diego, CA), mouse anti-human ABCG2 antibody BXP-21
(Santa Cruz, Paso Robles, CA), goat anti-mouse secondary antibody 800CW IRDye
(LiCore, Lincoln NE), PD Multitrap G-25 Sephadex columns (GE Healthcare
Biosciences, Pittsburgh, PA), 0.45 μM mixed cellulose ester (MCE) filter plates
(Millipore, Billerica, MA), HYPERflasks (Corning, Corning, NY), PiColorLock ATPase
Assay kits (Innova Biosciences, Cambridge, United Kingdom) and dNTPs (Denville,
Metuchen, NJ) were all purchased from the indicated manufacturers. The human breast
adenocarcinoma doxorubicin and verapamil resistant cell line (MCF-7 AdVp) was a
generous gift from Susan Bates (National Cancer Institute, Bethesda, MD).
2.3.2. Genetic Analysis of ABCG2 Coding Region
SNPs in the ABCG2 coding regions were retrieved for all available ethnic
populations from publicly available databases, including 1000 Genomes (phase 1 release
02/14/2012)77, dbSNP build 135, and HapMap release 2878 and were combined with
those from the SOPHIE cohort reported in the Pharmacogenetics of Membrane
Transporter Database (http://pharmacogenetics.ucsf.edu/, UCSF, San Francisco, CA)76.
Additional non-synonymous variants of MXR were extracted from previously published
sequencing studies79–82. Details regarding the sequencing of SOPHIE samples for ABCG2
coding SNPs have already been published83. Genotypes from 1000 Genomes (phase 1
release 05/21/2011) were used for calculating haplotypes. Haplotypes were determined

103
by downloading each region’s genotype and information files from the 1000 Genomes
browser for all available ethnic groups combined. Genotype and information files were
then loaded into Haploview version 4.284 and linkage disequilibrium analysis was
performed using all available SNPs. The potential effect of non-synonymous variants on
MXR function were predicted using the Grantham scale85, SIFT86 and PolyPhen87
prediction programs. Evolutionary conservation was determined by alignment of
orthologous amino acid sequences from six species (chimp, dog, cow, mouse, rat and
zebrafish) to that of the human sequence using the UCSC genome browser
(http://genome.ucsc.edu/).
2.3.3. Cloning of MXR and Site Directed Mutagenesis for MXR Variant Plasmids
MXR was previously cloned in the Kroetz lab from human placental cDNA into
the pcDNA5/FRT vector using the primers in Table 2.1. Variants where then introduced
into the reference MXR pcDNA5/FRT plasmid. Site-directed mutagenesis (SDM)
primers for each of the MXR nonsynonymous SNPs (Table 2.1) were designed using the
PrimerX© program and synthesized by Integrated DNA Technologies (San Diego, CA).
PCR reaction components for all primers are as follows: 1X High-Fidelity Phusion
Buffer, 1 unit Phusion High-Fidelity DNA Polymerase, 200 nM dNTPs, 1 μM each
primer and 100 ng reference MXR pcDNA5/FRT vector, all in a final volume of 50 μL.
PCR reaction conditions for all primers are as follows: an initial cycle for 30 sec at 98°C,
followed by 16 cycles of 10 sec at 98°C, melting temperature (varies per primer pair) for
30 sec and 3.5 min at 72°C, then a final extension for 10 min at 72°C. The SDM PCR
reactions were then digested for at least 20 min at 37°C with 1 unit DpnI. The reactions

104
were purified using the QIAquick PCR purification kit per the manufacturer’s protocol,
and 5 μL of the purified SDM reaction was transformed into 35 μL DH5α competent
cells. After growing for 24 hr on 100 mm LB Amp-100 agar plates, single colonies were
expanded overnight at 37°C with shaking in LB broth supplemented with 100 μg/mL
ampicillin. DNA was isolated from the bacteria using the QIAprep Miniprep Kit per the
manufacturer’s protocol, and the plasmid was sequenced with the RVPrimer3 and other
primers listed in Table 2.2 to confirm the presence of the SNP at the correct location. The
DNA concentration was checked using a NanoDrop Spectrophotometer (Thermo
Scientific) and stored at -20°C.
Table 2.1. Cloning and SDM Primers for MXR Variants Variant Primer Sequence1 Tm2 (°C)
WT CCTGAGCTCGTCCCCTGGATGTC 53
GAGAACTGTAAGGGACAGGTATG
V12M GTCGAAGTTTTTATCCCAATGTCACAAGG 61
CCTTGTGACATTGGGATAAAAACTTCGAC
Q141K CGGTGAGAGCAAAACTTAAAGTTCTCAGCAGC 64.7
GCTGCTGAGAACTTTAAGTTTTGCTCTCACCG
I206L CACTGATCCTTCCCTCTTGTTCTTGGATGAG 64.4
CTCATCCAAGAACAAGAGGGAAGGATCAGTG
P269S TCCTGAGCAGACCCGTGGAACATAA 64.6
TTATGTTCCACGGGTCTGCTCAGGA
T542A GCAACACTTCTCATGGCCATCTGTTTTGTG 64.7
CACAAAACAGATGGCCATGAGAAGTGTTGC
D620N AAAGCAGGGCATCAATCTCTCACCCTG 64.4 CAGGGTGAGAGATTGATGCCCTGCTTT
1Forward and reverse primers per SNP 2Melting temperature used for annealing step of PCR Abbreviations: PCR, polymerase chain reaction; Tm, Temperature

105
Table 2.2. Sequencing Primers for MXR pcDNA5/FRT Primer Sequence F3:294 GGAACGCACCGTGCACATGC 1003F TAAAGTGGCAGACTCCAAGGTT 1749F GATTCTACTGGAATCCAGAACAGAGC 2218R TCGTGGAATGCTGAAGTACTGAAGCC R2:2569 CAGTGTGATGGCAAGGGAACAG Abbreviations: F, Forward; R, Reverse
2.3.4. Cell Culture
HEK293 Flp-in cells were grown in high-glucose DMEM supplemented with
10% FBS, 100 units/mL penicillin and 0.1 mg/mL streptomycin. The MCF-7 cell line
was grown in IMEM without phenol red, supplemented with 10% FBS, 100 units/mL
penicillin and 0.1mg/mL streptomycin. The MCF-7 ADVP cell line was grown in IMEM
without phenol red, supplemented with 10% FBS, 100 units/mL penicillin, 0.1mg/mL
streptomycin, 3 μg/ml doxorubicin and 5 μg/ml verapamil. All cell lines were grown in a
5% CO2 incubator at 37°C. To maintain cells, they were split upon reaching confluency
by treatment with 0.05% Trypsin-EDTA, washing with 1X PBS and suspension in fresh
media at a 1:5 to 1:20 dilution.
2.3.5. Transient Transfection of MCF-7 Cells
For transient transfections, we utilized the parent cell line of the MCF-7 Ad/Vp
cell line from which MXR was cloned, the MCF-7 cell line9. MCF-7 cells have low
background expression of MXR (data not shown) and have been utilized through the
literature in MXR transport assays9,88. MCF-7 cells were split with 0.05% Trypsin-
EDTA, seeded at ~2 x 10⁶ cells in a T-25 plate and transfected once they reached 95%
confluency in fresh IMEM with 10% FBS, but without antibiotics and phenol red. Cells

106
were then transfected with Lipofectamine 2000 following guidelines suggested in the
manufacturer’s protocol. In short, 25 μL of Lipofectamine 2000 was diluted with 600 μL
Opti-MEM and incubated for 5 min, then gently mixed with a 625 μL solution of 10 μg
pcDNA5/FRT constructs diluted with Opti-MEM. The DNA-Lipofectamine mixture was
allowed to incubate at room temperature for 30 min before being placed onto cells with 4
mL of antibiotic-free media. All cell lines were incubated with their transfection agents
for 18-24 hr before use in the efflux assays.
2.3.6. Creation of Stable HEK293 Flp-in Cells
The stable HEK293 Flp-in cell lines were created by transfection of HEK293 Flp-
in cells followed by selection with hygromycin. The HEK293 Flp-in cell line are
commercially available cells that have an engineered single Flp-in site to ensure one
cDNA clone of ABCG2 is inserted at a controlled location; similar Flp-in cells have been
used in other MXR experiments41. Also, the HEK293 Flp-in parent cell is the HEK293T
cells, which have low to undetectable expression of MXR (data not shown). HEK293
Flp-in cells were split with 0.05% Trypsin-EDTA, seeded at ~5 x 10⁵ cells per well of a
6-well plate and transfected once they reached 80% confluency in fresh DMEM with
10% FBS, but without antibiotics. Cells were then transfected with Lipofectamine 2000
following guidelines suggested in the manufacturer’s protocol. In short, 10 μL of
Lipofectamine 2000 was diluted to 250 μL with Opti-MEM and incubated for 5 min, then
gently mixed with a 250 μL solution of 0.4 μg ABCG2-pcDNA5/FRT plasmid plus 3.6
μg pOG44 DNA diluted with Opti-MEM. The DNA-Lipofectamine mixture was allowed
to incubate at room temperature for 30 min before being placed onto cells with 1.5 mL of
107
antibiotic-free media. All cell lines were incubated with their transfection agents for 6-8
hr, and then the transfection media was removed and fresh DMEM with 10% FBS and
antibiotics added. After 24 hr, the media was again changed to DMEM media
supplemented with 75 μg/mL hygromycin. Media was refreshed again after 48 hr with
DMEM plus 75 μg/mL hygromycin and the cells were continually selected for 1 to 2
weeks in the hygromycin media, until colonies were visible. Per each variant, ~10
colonies were selected and expanded in DMEM plus 75 μg/mL hygromycin until
confluent in a T-25 plate. Cells were then split with 0.05% trypsin and aliquots were
taken for membrane expression analysis using flow cytometry, with additional aliquots
for protein and mRNA extraction. Colonies of HEK293 Flp-in cells stably expressing
variant MXR proteins with MXR expression levels similar to that of WT were selected
for further studies. Colonies from cells transfected with empty pcDNA5/FRT vector that
had the lowest level of MXR expression were also selected for further studies.
2.3.7. Protein and mRNA Extraction from Cells
To obtain whole cell lystates, transiently transfected MCF-7 cells and stably
transfected HEK293 Flp-in cells were grown to confluency, then rinsed with 1X PBS and
trypsinized with 0.05% trypsin until detached. Cells were then centrifuged at 500g, and
the pellet was rinsed with 1X PBS. Up to 5 x 10⁶ cells were resuspended in 500 μL of
CelLytic MT lysis buffer plus 1:1000 protease inhibitor cocktail following the
manufacturer’s protocol. Cells were incubated at 4°C for 15 min and then centrifuged at
14,000g for 10 min at 4°C. Protein concentration of the supernant was determined using a

108
Pierce BCA assay kit following the manufacturer’s protocol. Lysates were kept at -80°C
until analyzed for protein expression.
To obtain mRNA from transiently and stably transfected cells, after trypsinizing
and washing cells as above, mRNA was extracted from 5 x 10⁶ cells using the RNase
Easy Mini Kit following the manufacturer’s protocol. The RNA concentration was
determined using spectrophotometry and kept at -20°C until assayed for mRNA
expression levels.
2.3.8. MXR Immunoblots
Whole cell lysates and membrane fractions (as vesicles) from transient or stably
transfected cells (MCF-7 or HEK293 Flp-in, respectively) and whole cell lysates from
drug-resistant MCF-7 ADVP cells were characterized by Western blotting. Either 10 μg
whole cell lysate or 5 μg of membrane fractions mixed with 1X NuPage LDS sample
buffer and 5% v/v β-mercapthanone were loaded per lane of a 4-12% Bis-Tris SDS-
PAGE gel. Samples were separated alongside a BioRad kaleidoscope protein ladder at
120 V for 2 hr, or until the dye front reached the end of the gel, with 1X NuPAGE MOPS
SDS running buffer in the XCell SureLockTM electrophoresis cell (Invitrogen). Samples
were then transferred to a 0.45 μm nitrocellulose membrane using 1X NuPAGE transfer
buffer in the Xcell II Blot Module (Invitrogen) at 32 V for 1.5 hr. Membranes were
washed three times with 1X PBS for 5 min and then blocked for 1 hr at room temperature
with 2% nonfat dried milk in 1X PBS. Membranes were incubated with BXP-21 mouse
anti-human primary MXR antibody (1:500) in 2% nonfat dried milk plus 0.1% Tween
(PBS-T) overnight at 4°C with rocking, then primary GAPDH goat anti-human antibody

109
at 1:20,000 was added for 1 hr. Membranes were washed three times with 1X PBS-T for
5 min and then incubated with IRDye 800CW goat anti-mouse secondary antibody at
1:10,000 for 1 hr at room temperature. Membranes were rinsed three times with 1X PBS-
T for 5 min and a final time with 1X PBS before imaging both 800 and 700 nm channels
on an Odyssey® Classic infrared scanner (LiCore). Densitometric analysis was
performed using ImageJ89. Expression of MXR was normalized to that of GAPDH and
variant MXR expression was compared to the reference MXR plasmid.
2.3.9. Flow Cytometry
Membrane expression of MXR was determined in either transiently transfected
MCF-7 cells or stably transfected HEK293 Flp-in cells via flow cytometry. At least 48 hr
prior to an experiment, media was changed to IMEM with 10% FBS and 1X Pen-Strep
but without phenol red. When cells reached confluency, they were washed with 1X PBS
and then treated with 0.05% trypsin until detached, centrifuged at 500g for 5 min and
washed with 1X PBS. Cells were then resuspended at 1 x 10⁵ cells per tube, centrifuged
at 500g and the pellet washed with 200 μL of 1X PBS. Cells were resuspended in 500 μL
of 1:250 5D3-PE conjugated primary MXR antibody and incubated for 1 hr at room
temperature in the dark. Cells were centrifuged at 500g for 5 min and the pellet washed
twice with 500 μL 1X PBS. The pellet was resuspended in 300 μL 10% FBS in 1X PBS
(10% FBS-PBS) and internal fluorescence of the cell measured on a FACSCalibur flow
cytometer (BD Biosciences, San Jose, CA) channel 2 (FL2-H) after gating for live cells
based on forward (FSC) and side (SSC) scatter. For each sample, 5,000-10,000 events

110
were captured and recorded as histograms with counts on the y-axis and log fluorescence
on the x-axis.
The capability of transiently transfected MCF-7 cells to efflux mitoxantrone,
doxorubicin and pheophorbide A was measured by flow cytometry. Cells were grown to
confluency in IMEM with 10% FBS and 1X PBS but without phenol red and then
trypsinized with 0.05% trypsin until detached. Cells were centrifuged at 500g for 5 min,
the pellet washed with 1X PBS and 5 x 10⁵ cells transferred to a 1.1 mL polypropylene
tube. Cells were centrifuged again at 500g for 5 min and the pellet resuspended in 250 μL
of 100 μM pantoprazole in phenol-free IMEM media, or inhibitor-free phenol-free IMEM
media for 30 min at 37°C. An aliquot (250 μL) of 2X drug solution in phenol-free IMEM,
with or without 100 μM pantoprazole, was added to the cells and incubated for 30 min at
37°C. Final drug concentrations were 10 μM mitoxantrone, 10 μM doxorubicin and 1 μM
pheophorbide A. Cells were centrifuged at 500g for 5 min at room temperature and
resuspended in 500 μL phenol-free IMEM and incubated for 30 min at 37°C. Cells were
then centrifuged at 500g for 5 min at 4°C and the pellet washed twice with 500 μL ice
cold 1X PBS. Samples were resuspended in ice cold 10% FBS-PBS and kept on ice until
analysis on a FACSCalibur flow cytometer channels 3 and 4 (FL3-H, FL4-H) after gating
for live cells based on forward (FSC) and side (SSC) scatter. For each sample, 5,000-
10,000 events were captured and recorded as histograms with counts on the y-axis and
log fluorescence on the x-axis. Each experiment was replicated two to seven times.

111
2.3.10. Immunocytochemistry
Localization of MXR proteins in stably transfected HEK293 Flp-in cell lines was
determined using fluorescent antibodies and a laser-scanning confocal microscope. Stably
transfected cells were plated at 1 x 10⁵ per well on 2-well glass chamber slides and grown
until 80% confluent in IMEM with 10% FBS, 1X Pen-Strep and no phenol red. Media
was then aspirated off the cells, the cells were washed twice with 2 mL 1X PBS per well,
fixed with ice cold 300 μL 1:1 v/v methanol and acetone at -20°C for 10 min and gently
washed twice with 1X PBS. Nonspecific binding sites were blocked with 300 μL 1X PBS
plus 1.5 mg/mL BSA per well for 1 hr at room temperature. Cells were then incubated
with BXP-21 primary MXR antibody at 1:25 v/v in blocking buffer overnight at 4°C.
Each well was washed twice with 1 mL 1X PBS and then incubated with the
fluorescence-conjugated secondary antibody Alexa 488 goat anti-mouse at 1:100 v/v in
blocking buffer for 1 hr at room temperature in the dark. Wells were gently washed twice
with 1 mL 1X PBS, the chamber slides and gasket removed and the well allowed to dry.
Cells were covered with ProLong Gold Antifade plus DAPI mounting reagent, fitted with
a cover slide and dried for 4 hr at room temperature and 24 hr at 4°C. Slides were stored
at -20°C until imaged using a Retiga CCD-cooled camera and associated QCapture Pro
software (QImaging Surrey, BC Canada) filtered for green (MXR) and blue (DAPI)
fluorescence with 10 to 25 sec exposures at both 10X and 40X magnification.
2.3.11. qRT-PCR
ABCG2 mRNA levels were quantified in HEK293 Flp-in stable cell lines using
reverse-transcription polymerase chain reaction (RT-PCR). RNA (3 μg) extracted from

112
stably transfected HEK293 Flp-in colonies were reverse transcribed by the SuperScript®
III First-Strand Synthesis System in a 10 μL reaction containing 0.1 U SuperScript III
(SSIII) reverse transcriptase, 1X SSIII reaction buffer, 500 μM dNTPs, 1X random
hexamers, 20 U RNase OUT and 5 mM MgCl2, with the residual volume filled with
RNase-free water. Samples were incubated at the following conditions: 5 min at 65°C, 5
min at 25ºC, 50 min at 50ºC and 10 min at 85ºC. Gene expression was then quantified in
a reaction containing 1X TaqMan Universal Master Mix, 1X gene expression assay, and
1 μL cDNA in a 10 μL volume. The reaction was then analyzed in the 7900HT Fast Real-
Time PCR System under the following conditions: 95°C for 2 min, then 35 cycles
between 95°C for 15 sec and 60°C for 1 min. Gene expression of ABCG2 and an internal
control, either GAPDH or GusB, were analyzed in each sample. Expression of ABCG2
was normalized to either the expression of GAPDH or GusB and expressed as ΔΔCt for
each sample. The expression of each ABCG2 variant was compared to the expression of
reference ABCG2.
2.3.12. Vesicle Isolation
Membrane fractions of HEK293 Flp-in stably transfected cells were isolated and
formed as previously described42 with modifications. First, cells were grown to
confluency in a HYPERflask (yields ~2 x 10⁸ cells), trypsinized with 0.05% trypsin until
cells detached, centrifuged at 500g for 5 min and the pellet washed twice with 1X PBS.
All further steps were done with ice cold buffers, on ice or at 4°C. Cells were then lysed
with 10 mL hypotonic lysis buffer (consisting of 0.5 mM Tris-HEPES and 0.1 mM
EGTA at pH 7.5) using 10 strokes of a Potter-Elvenjem homogenizer. The lysate was

113
centrifuged at 2000g for 10 min and the supernatant saved while the pellet was
homogenized again in another aliquot of 10 mL hypotonic lysis buffer. After centrifuging
the re-homogenized cells at 2000g, the supernatants were combined, homogenized by 10
strokes of a Potter-Elvenjem homogenizer and then centrifuged at 100,000g for 30 min.
The resulting pellets were suspended in 7.2 mL of 250 mM sucrose/10 mM Tris-HEPES
and homogenized by 10 strokes of a Potter-Elvenjem homogenizer. Homogenate was
layered in 1.2 mL aliquots over 1.2 mL of 40% w/v sucrose and centrifuged at 100,000g
for 30 min. The middle cloudy layer was extracted (~2.25 mL), brought to a final volume
of 9 mL with 250 mM sucrose/10 mM Tris-HEPES and centrifuged at 100,000g for 30
min. The resulting pellet was resuspended in 100 μL 250 mM sucrose/10 mM Tris-
HEPES, protein was quantified using a BSA assay and samples were frozen at -80°C in
10-20 μL aliquots. Before use, vesicles were slowly thawed, incubated with 0.05%
Brij58, a detergent previously identified to support the formation of sealed inside-out
vesicles90,91, and formed by passing through a 23 gauge needle at least 10 times.
2.3.13. Vanadate Sensitive ATPase Assay
Membrane vesicles isolated from HEK293 Flp-in stable cell lines were assayed
for their ATPase activity. Uptake buffer for the ATPase assay was 250 mM sucrose/10
mM Tris-HCl with 2.5 mM MgCl2, 0.5 mM ATP, 2 mM ouabain and 3 mM sodium
azide. Vanadate sensitive ATPase activity was determined by calculating the difference
between the activities of the vesicles obtained in the presence and absence of 2 mM
sodium orthovanadate. Vesicles were stimulated with 5 μM of sulfasalazine,
mitoxantrone, SN-38, pheophorbide A or estrone-3-sulfate. A 90 μL aliquot of uptake

114
buffer with drugs was warmed to 37°C, and then formed vesicles were added to the
uptake buffer. The reaction was incubated for 30 min at 37°C, and the release of
inorganic phosphate was immediately determined using the colorimetric PiColorLock
ATPase Assay kit following the manufacturer’s protocol. Absorbance of the samples
were determined at 635 nm and compared to a standard curve to quantify liberated
inorganic phosphate. The sulfasalazine experiment was repeated twice with triplicate
wells per condition; whereas the other three drugs were only tested in one experiment
with at least triplicates per condition. Results were analyzed as described below with BD
CT empty vesicles used as the negative control.
2.3.14. H+/ATPase Assay
Vesicles were tested for their ability to simultaneously generate a proton gradient
and for ATPase activity to determine the extent of inside-out and intact vesicles. The dual
H+-ATPase assay was based on a previously published protocol92 , with slight alterations,
which allows for the monitoring of acridine orange and NADH absorbance
simultaneously. The quenching of acridine orange occurs inside the vesicle once protons
are pumped into the vesicles, thus creating an acidic environment and altering the
absorbance of acridine orange at 495 nm93. The ATPase activity is monitored by coupling
inorganic phosphate cleavage with the oxidation of NADH, which can be monitored by a
decrease in absorbance at 340 nm92. Vesicles were obtained either from HEK293 Flp-in
cells as described above or purchased from commercially available sources which were
made from mock transfected (BD CT) and overexpressing MXR (BD BCRP) cells. The
reaction buffer consisted of 10 mM MOP-BTP at pH 6.5 plus 140 mM KCl, 2 mM ATP,

115
1 mM EDTA, 1 mM DTT, 50 μM acridine orange, 1 mg/mL BSA, 0.05% Brij58, 250
μM NADH, 1 mM PEP, 25 μg/mL LD and 50 μg/mL PK. First, 10 μg of membranes
were diluted to 100 μL by 10 mM MOP-BTP with 0.05% Brij58, and then vesicles were
formed by passing through a 23 gauge needle 10 times. Vesicles were incubated with
equal volume 2X reaction buffer for 10 min. The reaction was initiated by the addition of
4 mM MgCl2, and the absorbance at wavelengths 495 and 340 nm was read every 30 sec
for 60 min. The proton gradient was abolished by permeablizing the membrane with
0.015 % w/v Triton X-100.
2.3.15. Vesicle Uptake Assay
The ability of inside-out vesicles to uptake MXR substrates was determined by
adapting and optimizing previously published vesicle uptake protocols42,45,56,62,81,94,95.
Vesicle uptake buffer consisted of 250 mM sucrose, 10 mM Tris-HCl, 1 mM ATP, 5 mM
MgCl2 and an ATP-regenerating system (5 mM creatine phosphate, 0.5 μg creatine
kinase). Reaction stop buffer consisted of ice cold 250 mM sucrose, 10 mM Tris-HCl and
10 mM EDTA. Uptake reactions were performed using cold 0-100 μM SN-38 and 10 μM
mitoxantrone with 1 μg vesicles in uptake buffer at 37°C for 0-5 min. Reactions were
quenched with ice cold stop buffer, vacuum filtered through an MCE filter plate and
washed with 1 mL cold stop buffer. Vesicles were dissolved in 10% DMSO plus 1%
acetic acid for mitoxantrone and 0.1N NaOH plus 0.1% SDS for SN-38. Mitoxantrone
absorbance was read at 670 nm, and SN-38 fluorescence emission was measured at 545
nm after excitation at 414 nm. Uptake reactions for sulfasalazine and pheophorbide A
were performed using 50 μM sulfasalazine and 10 μM pheophorbide A with 1 μg vesicles

116
in uptake buffer at 37°C for 0 - 5 min. Sephadex G-25 columns were prepared with stop
buffer per the manufacturer’s instructions. Reactions were quenched with 150 μL ice cold
stop buffer and vesicles isolated by spinning through a G-25 sephadex column at 700g for
2 min. The elute was made basic by the addition of 50 μL of 10 N NaOH and the
absorbance at 460 nm (sulfasalazine) or 410 nm (pheophorbide A) was measured. The
uptake of substrates was normalized for μg of protein and time for each reaction.
2.3.16. Statistics
The expression of MXR protein or ABCG2 mRNA in MXR transiently or stably
transfected cell lines and vesicles was considered different between reference and
pcDNA5/FRT if P < 0.05 when tested with a Student’s t-test. The expression of MXR
protein or ABCG2 mRNA in MXR transiently or stably transfected cell lines and vesicles
was considered different between reference and variant MXR constructs, if P < 0.05
when tested with an ANOVA followed with a post-hoc Bonferroni t-test. Differences in
populations separated by flow cytometry were detected by testing the cumulative
distribution function (CDF) plots, which exhibit the distribution of fluorescence through
the two populations. CDFs were tested for differences between the distribution of MXR
variants and MXR reference proteins using a generalized Chi-squared test to provide a
value for T(x). Degrees of freedom were determined by the general formula “k-c”, where
k is bins and c is parameters plus 1. For all flow data there were 100 bins used for the
distribution of the data and parameters were the 14 gates used on both samples (7 each:
FSC, SSC, FL1-FL4H and Count). Therefore degrees of freedom (DFs) were calculated
by 100 bins – 14 parameters +1 = 85 DFs and critical T(x) values >108 for 85 DFs were

117
considered significant at the P < 0.05 level, the actual P values noted on the cell
histograms. For efflux assays, the “Inhibitable Efflux” (IE) is defined as the difference in
median fluorescence with pantoprazole (FLinhibitor) minus mean fluorescence without
pantoprazole (FLo), divided by mean fluorescence without pantoprazole67 (Equation 2.1).
Significance between MXR WT and variants was determined by an ANOVA followed by
a post-hoc Bonferroni t-test with P <0.05 considered significant.
𝐼𝐸 = 𝐹𝐿𝑖𝑛ℎ𝑖𝑏𝑖𝑡𝑜𝑟−𝐹𝐿𝑜𝐹𝐿𝑜
Equation 2.1
For ATPase assays, the vanadate-sensitive ATPase activity was determined by
taking the difference in ATPase activity without and with sodium orthovanadate
treatment. The velocity of ATP hydrolysis was then calculated by dividing the μmole of
liberated inorganic phosphate by mg of vesicles and reaction time. Vanadate-sensitive
ATPase velocity was tested for differences between MXR reference and EV using a
Student’s t-test and MXR reference was tested for differences from MXR variants using
an ANOVA followed by a post-hoc Bonferroni’s multiple comparison t-test with P <
0.05 considered significant. Statistics were determined using the Graphpad Prism 5 (La
Jolla, CA) software.
2.4. Results
2.4.1. Nonsynonymous Variants of MXR in the SOPHIE Cohort
Sequencing of the SOPHIE cohort identified six nonsynonymous variants in
ABCG2; none of the variant amino acids fall within the key ABC domains, but five of six

118
are evolutionarily conserved (Table 2.3). These variants include the widely described
V12M and Q141K variants, both with >25% MAF in one population and MAF >5% in
almost all populations. The valine at position 12 is the only non-conserved amino acid;
most species have a methionine at this position (data not shown). All three methods used
to estimate the extent of disruption by the amino acid change predicted that these two
SNPs would have low to medium disruption of the protein function. The V12M and
Q141K polymorphisms were in low linkage disequilibrium (r2=0.16), thus the haplotype
V12M/Q141K occurred at a frequency of 0.6% in the Caucasian and African American
populations of the SOPHIE cohort.
All other nonsynonymous variants in ABCG2 had MAF <2% in the SOPHIE
cohorts and were generally only present in one or two populations. The I206L and
D620N variants have MAF of ~2% in African American and Caucasian populations,
respectively. The D620N SNP was predicted to have little effect on protein function by
both Grantham and SIFT score, but PolyPhen predicted it was potentially damaging
(Table 2.3). The sequencing of the SOPHIE cohort also resulted in the first report of the
T542A variant, which has since been confirmed95. The P269S SNP had <1% MAF in the
Asian population, and was predicted to be the most detrimental to protein function by all
three prediction methods (Table 2.3). Variants from the MXR sequencing have been
deposited in dbSNP and are available on the Pharmacogenomics of Membrane
Transporter (PMT)76 and PharmGKB96 websites. Expression plasmids for all six
nonsynonymous variants present in the SOPHIE cohort, and the V12M/Q141K
haplotype, were generated and the resulting proteins tested for alterations in expression
and activity.

119
Tab
le 2
.3. M
XR
Non
syno
nym
ous V
aria
nts f
rom
the
SOPH
IE C
ohor
t
Po
lyPh
en
Pred
ictio
n4
Ben
ign
Ben
ign
Ben
ign
PD
Ben
ign
PD
-
Abb
revi
atio
ns: S
NP,
Sin
gle
Nuc
leot
ide
Poly
mor
phis
m; A
A, A
min
o A
cid;
MA
F, M
inor
Alle
le F
requ
ency
; PD
, Pos
sibl
y D
amag
ing
1 MA
F fo
r Afr
ican
Am
eric
an (A
A),
Cau
casi
an (C
A),
Asi
an (A
S), M
exic
an (M
E) a
nd P
acifi
c Is
land
er (P
A) p
opul
atio
ns o
btai
ned
from
the
Phar
mac
ogen
omic
s Mem
bran
e Tr
ansp
orte
rs (P
MT)
dat
abas
e
2 MA
F fr
om th
e 10
00 G
enom
es d
atab
ase
and/
or re
porte
d in
oth
er p
opul
atio
ns79
–82
3 Det
erm
ined
from
sequ
ence
alig
nmen
t with
chi
mp
(ch)
, dog
(d),
cow
(co)
, mou
se (m
), ra
t (r)
and
zeb
rafis
h (z
) 4 C
alcu
late
d as
des
crib
ed in
Mat
eria
ls a
nd M
etho
ds
SIFT
Pred
ictio
n4
Tole
rate
d
Tole
rate
d
Tole
rate
d
Del
eter
ious
Tole
rate
d
Tole
rate
d
-
Gra
ntha
m
Val
ue4
21
53
5 74
58
23
-
Am
ino
Aci
d
Con
serv
atio
n3
ch
ch, d
, co,
m, r
ch, d
, co,
m, r
ch, d
, co,
m, r
, z
ch, d
, co,
m, r
, z
ch, c
o, r
-
MA
F1 (%)
Oth
er2
0 - 2
7
1 - 4
1
0.6-
20
0.8
1.9
0.6-
1.1
1.5
PA
0.0
16.7
0.0
0.0
0.0
0.0
0.0
ME
14.9
26.0
0.0
0.0
0.0
0.0
0.0
AS
27.2
40.8
0.0
0.8
0.8
0.0
0.0
CA
6.6
8.1
1.5
0.0
0.0
0.0
0.6
AA
7.7
1.3
0.0
0.0
0.0
1.9
0.6
ΔAm
ino
Aci
d
Val
12M
et
Gln
141L
ys
Ile20
6Leu
Pro2
69Se
r
Thr5
42A
la
Asp
620A
sn
Val
12M
et/
Gln
141L
ys
SNP
ID
rs22
3113
7
rs22
3114
2
rs12
7216
43
rs34
6781
67
rs35
9655
84
rs34
7835
71
-

120
2.4.2. Expression and Function of MXR Variants in Transiently Transfected MCF-7s
To test if MXR variant transporters have altered function, expression plasmids
were transiently transfected into MCF-7 cells, the cells were loaded with substrate and
then allowed to efflux. The remaining internal drug concentration was measured using
flow cytometry and intracellular drug concentration was inversely correlated with MXR
function. The V12M/Q141K haplotype was not tested in the transient transfection
studies. MXR reference (WT) and most of the MXR variant transporters were transiently
expressed in MCF-7 cells, although the expression was only moderately greater than the
background expression in the cells (Figure 2.1). Despite this low level of overexpression,
cells transfected with MXR reference had a significant decrease in internal drug
fluorescence for mitoxantrone and pheophorbide A compared to cells transfected with the
pcDNA5/FRT vector (Figure 2.2). As expected, reference MXR did not transport
doxorubicin (Figure 2.2). Although the PE-conjugated external epitope MXR antibody
5D3 is available, attempts to utilize it for isolation of MXR positive cells were
unsuccessful because of crosstalk of the PE fluorophore with the drug fluorescence and
more importantly, because the 5D3 antibody is an inhibitor of MXR transport97,98.
Due to the potential differences in internal drug concentrations of the transfected
cells after being loaded with substrate, we utilized the MXR inhibitor pantoprazole, as
described in Materials and Methods, to determine IE for each variant. Mitoxantrone
transport in MCF-7 cells transiently expressing MXR reference or variants was
inhibitable by pantoprazole (Figure 2.3). In contrast, pheophorbide A transport was less
sensitive to pantoprazole and the Q141K and T542A variants were almost completely
resistant to inhibition with pantoprazole (Figure 2.4). Using IE as a specific measure of

121
MXR transport, there was no difference between mitoxantrone transport by the reference
and variant MXR transporters (Figure 2.5A). For pheophorbide A IE, the I206L variant
had higher transport activity than the reference protein (Figure 2.5B), but there were no
differences in transport of pheophorbide A for any other variant.
Figure 2.1. Expression levels of MXR in transiently transfected MCF-7 cells.
Expression of MXR determined by (A) immunoblot and then represented in (B) as
GAPDH normalized expression with MXR reference (WT) set to 1. Whole cell lysates
were prepared from cells transiently transfected with reference or variant MXR, 10 μg

122
was loaded per lane. MCF-7 AdVp cells (10 μg) and MXR vesicles (+Control) were also
used as a positive control (4 µg). The homodimer of MXR is indicated at 144-150 kD and
GAPDH is indicated at ~35 kD. Relative expression levels of MXR and GAPDH in each
sample were determined by densitometric analysis as described in Materials and
Methods. A representative immunoblot was selected from two separate experiments,
whose densitometric analyses are both represented in the graph.
Figure 2.2. Efflux of mitoxantrone, pheophorbide A and doxorubicin in MXR and
pcDNA5/FRT transfected MCF-7 cells. MCF-7 cells were transiently transfected with
reference MXR (dotted shaded line) or pcDNA5/FRT (black line) vectors. Efflux assays
were then performed with (A) 10 μM mitoxantrone, (B) 1 μM pheophorbide A or (C) 10
μM doxorubicin as described under Materials and Methods. Histograms show the
distribution of fluorescence (FL) from transfected cells in channels 3 or 4 (FL3-H, FL4-
H) and in the lower left corner are the CDF plots which show the distribution of
fluorescence throughout the two populations. CDFs were tested for differences between
the distribution of pcDNA and MXR reference transfected cells using a generalized Chi-
squared T(x) test. T(x) values over the critical value of 108 significant at P < 0.05, were
observed for mitoxantrone and pheophorbide A.
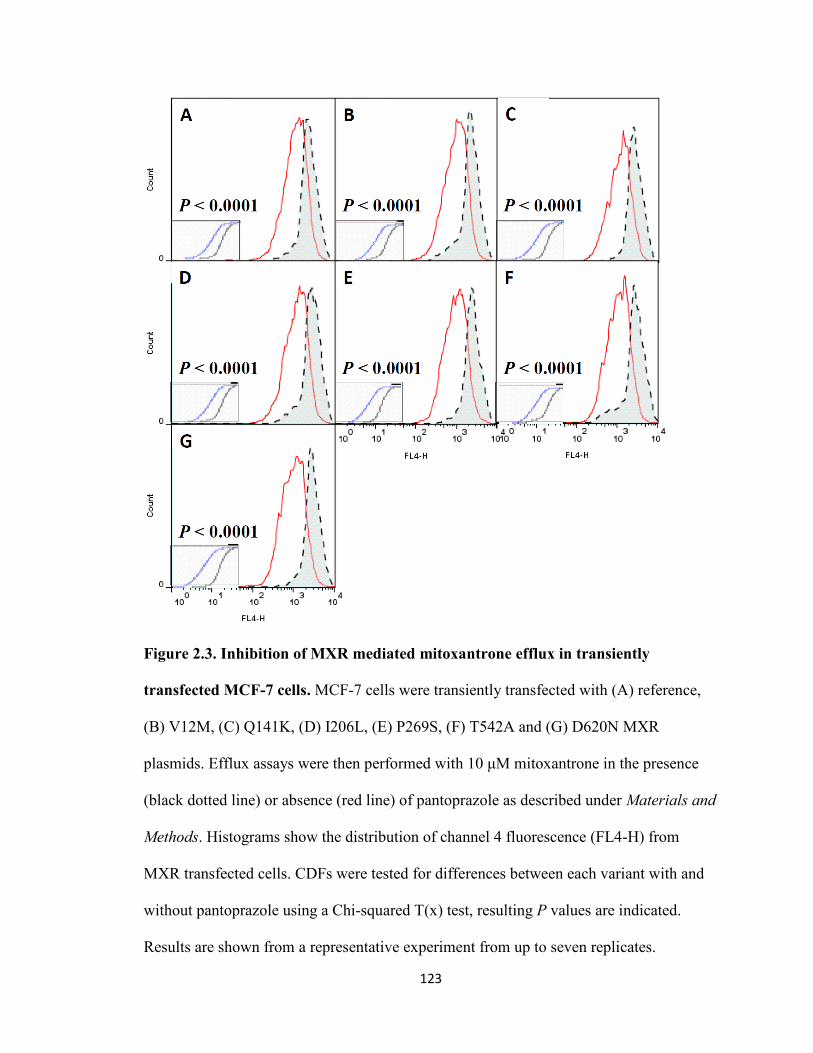
123
Figure 2.3. Inhibition of MXR mediated mitoxantrone efflux in transiently
transfected MCF-7 cells. MCF-7 cells were transiently transfected with (A) reference,
(B) V12M, (C) Q141K, (D) I206L, (E) P269S, (F) T542A and (G) D620N MXR
plasmids. Efflux assays were then performed with 10 μM mitoxantrone in the presence
(black dotted line) or absence (red line) of pantoprazole as described under Materials and
Methods. Histograms show the distribution of channel 4 fluorescence (FL4-H) from
MXR transfected cells. CDFs were tested for differences between each variant with and
without pantoprazole using a Chi-squared T(x) test, resulting P values are indicated.
Results are shown from a representative experiment from up to seven replicates.
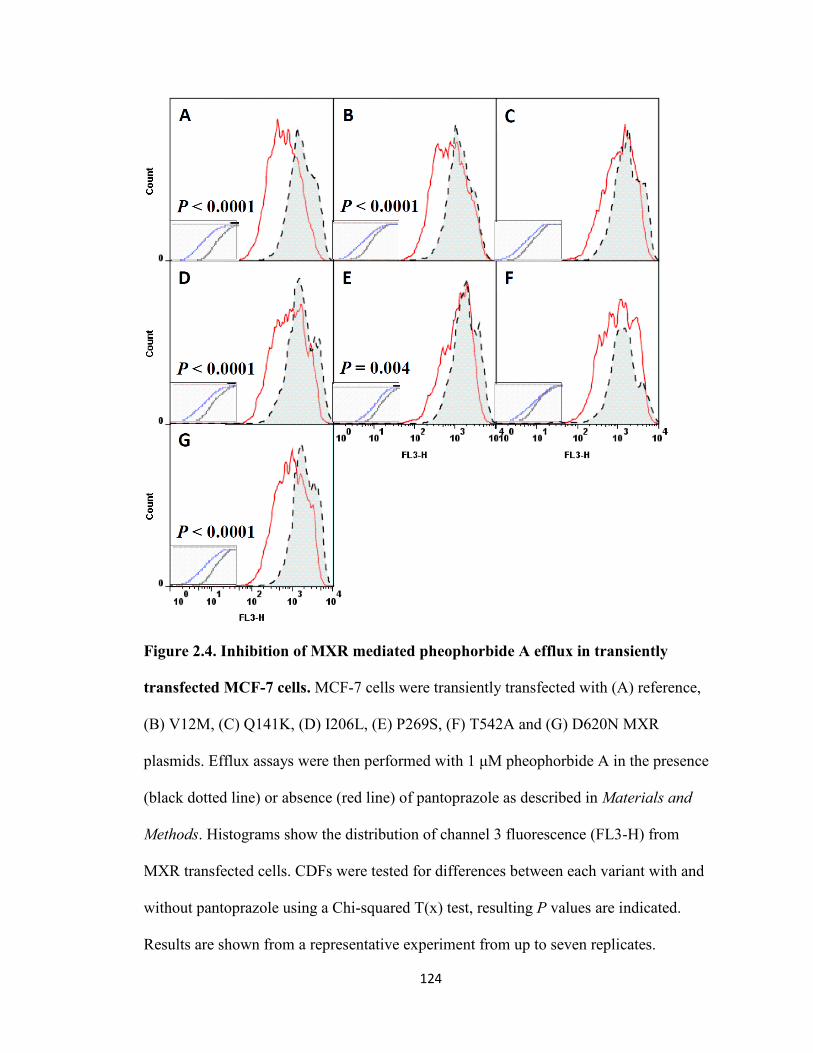
124
Figure 2.4. Inhibition of MXR mediated pheophorbide A efflux in transiently
transfected MCF-7 cells. MCF-7 cells were transiently transfected with (A) reference,
(B) V12M, (C) Q141K, (D) I206L, (E) P269S, (F) T542A and (G) D620N MXR
plasmids. Efflux assays were then performed with 1 μM pheophorbide A in the presence
(black dotted line) or absence (red line) of pantoprazole as described in Materials and
Methods. Histograms show the distribution of channel 3 fluorescence (FL3-H) from
MXR transfected cells. CDFs were tested for differences between each variant with and
without pantoprazole using a Chi-squared T(x) test, resulting P values are indicated.
Results are shown from a representative experiment from up to seven replicates.

125
Figure 2.5. Box and whisker plot of MXR inhibitable efflux. Inhibitable efflux of (A)
mitoxantrone and (B) pheophorbide A in MCF-7 cells transiently transfected with MXR
reference (WT) and variant plasmids. After transfection, cells were loaded with drug and
allowed to efflux in the presence or absence of pantoprazole. Inhibitable efflux (IE), as
defined in Materials and Methods, is normalized to WT for MXR variants within each
experiment. Whisker plots show the data from seven replicate experiments (except for
T542A which was only tested twice and P269S which was tested four times). WT and
variant MXR proteins were tested with an ANOVA followed with a post-hoc Bonferroni
t-test, * P < 0.05.

126
2.4.3. Generation of Stably Transfected MXR Variant Cell Lines
The HEK293 Flp-in system was utilized to generate stably transfected cell lines
for all MXR variants listed in Table 2.3. The MXR WT sequence was previously cloned
in the Kroetz lab into the pcDNA5/FRT (pcDNA) vector, and from that, all MXR
variants were generated by SDM. These plasmids were all successfully transfected into
HEK293 Flp-in cells, and at least 12 colonies expressing each variant MXR protein were
isolated. Colonies for each of the variant MXR proteins, and empty vector transfected
HEK293 Flp-in cells, were screened for their expression of MXR mRNA, MXR whole
cell protein and MXR membrane protein. The pcDNA transfected cells with the lowest
expression of MXR were selected, while MXR variant protein colonies with MXR
expression levels most similar to MXR WT were selected.
2.4.4. Expression and Localization of MXR Variants
ABCG2 mRNA levels in pcDNA transfected cells were <5% of MXR WT cells.
The expression of ABCG2 mRNA in MXR variant colonies was similar to WT (Figure
2.6). Consistent with the high ABCG2 mRNA levels in the stable cell lines, whole cell
MXR expression was 5-fold higher in the reference MXR cells compared to the empty
vector transfected cells; MXR protein in the variant cell lines were similar to WT except
for Q141K which had a 50% decrease (Figure 2.7). As expected, the MXR cell-surface
expression in empty vector transfected cells was significantly lower than that of the MXR
WT cell lines (Figure 2.8). The MXR variants had reduced membrane expression
compared to MXR WT as determined via flow cytometry (Figure 2.8). This was
consistent with a 40% reduction in MXR expression in the Q141K and D620N membrane

127
vesicles isolated from the HEK293 Flp-in cells (Figure 2.9). Immunocytochemistry
showed that MXR WT protein stained to the plasma membrane of the HEK293 Flp-in
cells (Figure 2.10 and Figure 2.11) and was virtually nonexistent in the pcDNA
transfected cells (Figure 2.12). None of the MXR variant proteins exhibited any altered
localization within the cell (Figure 2.10 and Figure 2.11).
Figure 2.6. Expression of ABCG2 mRNA in stably transfected cell lines. Quantitative
RT-PCR analysis of ABCG2 mRNA in stably transfected MXR variant and reference
HEK293 Flp-in cells was performed and ABCG2 mRNA expression levels were
expressed as ∆∆Ct compared to GAPDH and normalized to reference. Shown are the
mRNA expression values of 2-6 clones for each plasmid stably transfected into HEK293
Flp-in cells. The difference in ABCG2 expression between pcDNA and MXR reference
colonies was tested with a Student’s t-test, ** P < 0.001. Expression of ABCG2 in MXR
variant cells were considered different from reference if P < 0.05 when tested with an
ANOVA followed with a post-hoc Bonferroni t-test.

128
Figure 2.7. Expression levels of MXR in stably transfected HEK293 Flp-in cells.
Expression of MXR was determined by (A) immunoblot and (B) quantified by
densitometry, normalized by GAPDH and expressed relative to WT as described in
Materials and Methods. An aliquot (10 μg) of whole cell lysate from the indicated cell
lines was loaded into each lane. The monomer of MXR (75 kD) and GAPDH (~35kD)
are noted. A representative immunoblot is shown from upto four replicate experiments.
The difference in ABCG2 expression between pcDNA and MXR reference cells was
tested with a Student’s t-test, *** P < 0.0001. The difference in ABCG2 expression
between variant and reference MXR cells was tested with an ANOVA followed with a
post-hoc Bonferroni t-test, * P < 0.05.

129
Figure 2.8. Cell surface expression of MXR in stable cell lines. HEK293 Flp-in cells
stably transfected with reference (WT) MXR (red line in all the graphs), or with (A)

130
pcDNA empty vector, (B) V12M, (C) Q141K, (D) I206L, (E) P269S, (F) T542A, (G)
D620N and H) V12M/Q141K MXR plasmids shown as the black shaded lines. MXR
staining was performed using 5D3-PE conjugated antibody as described in Materials and
Methods and histograms show the distribution of fluorescence (FL) in channel 2 (FL2-H).
Cumulative distribution function plots (CDFs) were tested for differences between each
variant and WT MXR using a generalized Chi-squared T(x) test. Critical T(x) values >
108 were considered significant. All Χ2 values are >108 and P < 0.0001 compared to
WT. Results are shown for a representative experiment from three replicates.

131
Figure 2.9. Expression levels of MXR in vesicles. Expression of MXR was determined
by (A) immunoblot and (B) quantified using densitometric analysis, normalized by
GAPDH and expressed relative to WT, as described in Materials and Methods. An
aliquot of membrane vesicles (5 μg) either purchased (BD CT and BD BCRP) or
prepared from the HEK293 Flp-in stable cell lines was loaded onto the gel. MXR dimer
(144-150 kD) and GAPDH (~35 kD) are indicated. The immunoblot is representative of
two separate experiments, whose values are combined in the graph. The difference in
ABCG2 expression between pcDNA and MXR reference vesicles was tested with a
Student’s t-test, *** P < 0.0001, and between variant and reference MXR cells with an
ANOVA followed with a post-hoc Bonferroni t-test, * P < 0.05 and ** P < 0.001.

132

133
Figure 2.10. Localization of MXR variants in stably transfected HEK293 Flp-in cells
at 10X magnification. Stably transfected HEK293 Flp-in cells were stained for MXR
(green) expression using the BXP-21 MXR antibody followed by 488-Alexa conjugated
anti-mouse secondary antibody and DAPI as described in Materials and Methods. Shown
are representative images at 10X magnification selected from three replicate experiments.
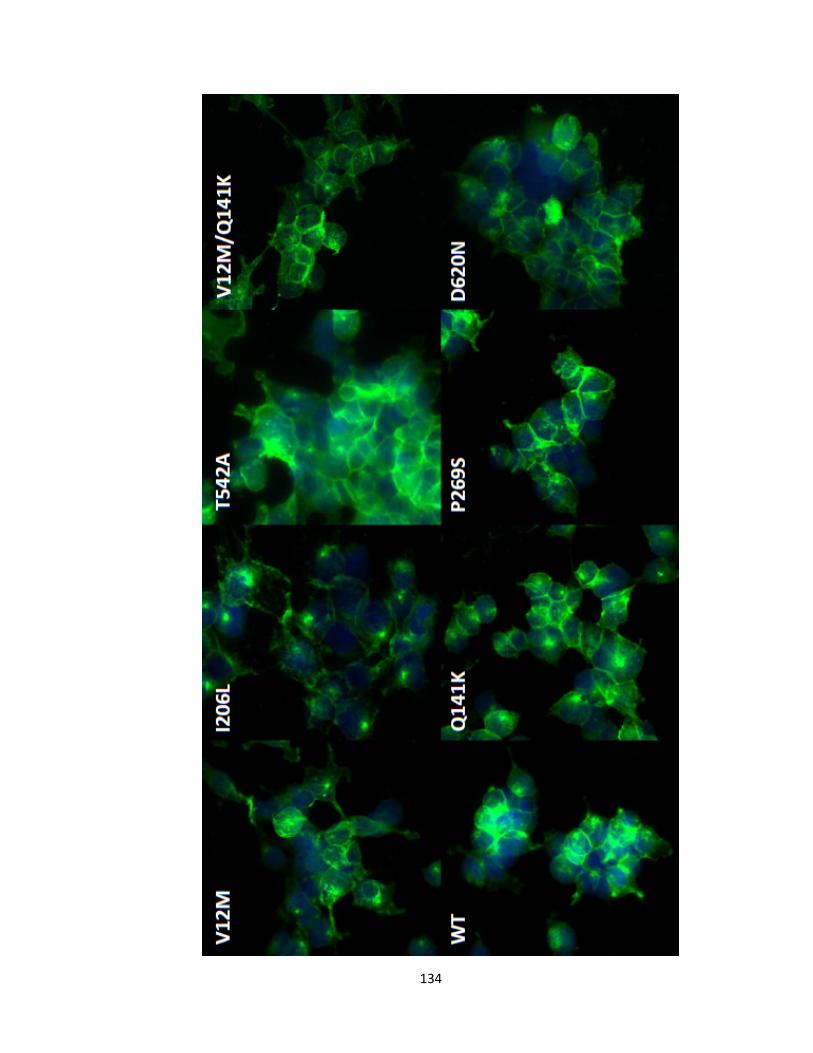
134
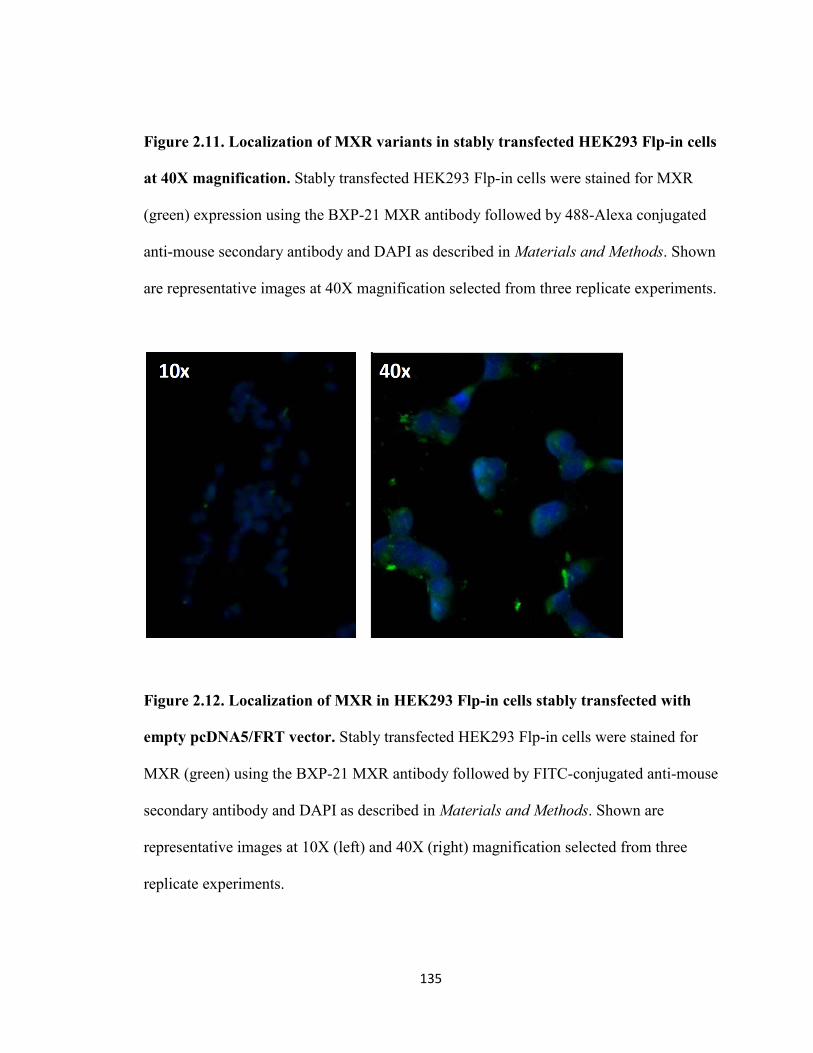
135
Figure 2.11. Localization of MXR variants in stably transfected HEK293 Flp-in cells
at 40X magnification. Stably transfected HEK293 Flp-in cells were stained for MXR
(green) expression using the BXP-21 MXR antibody followed by 488-Alexa conjugated
anti-mouse secondary antibody and DAPI as described in Materials and Methods. Shown
are representative images at 40X magnification selected from three replicate experiments.
Figure 2.12. Localization of MXR in HEK293 Flp-in cells stably transfected with
empty pcDNA5/FRT vector. Stably transfected HEK293 Flp-in cells were stained for
MXR (green) using the BXP-21 MXR antibody followed by FITC-conjugated anti-mouse
secondary antibody and DAPI as described in Materials and Methods. Shown are
representative images at 10X (left) and 40X (right) magnification selected from three
replicate experiments.

136
2.4.5. Transport Activity of MXR Vesicles
To ensure that vesicles were forming inside-out and with intact (not leaky)
membranes, we utilized a previously published protocol91 to simultaneously measure the
development of a proton (H+) pump gradient and ATPase activity. We initiated the
reaction by addition of MgCl2 and tested that the H+ gradient could be abolished with the
addition of Triton X-100 (Figure 2.13), which permeablizes the membrane90. All MXR
variants, EV and commercially purchased vesicles exhibited dual H+- ATPase activity
(Figure 2.14). We saw no differences in activity between commercially purchased
vesicles and the HEK293 Flp-in vesicle preps (data not shown). Also, all MXR and EV
vesicles were above the signal of reactions without vesicles and MXR vesicles generally
had higher ATPase activities, but similar H+ gradients to EV vesicles (data not shown and
Figure 2.14). We also observed that the reaction was only initiated upon the addition of
MgCl2 (Figure 2.13 and zero point in Figure 2.14) and that addition of Brij58 increased
both H+ and ATPase activity of the vesicles (data not shown).
A colorimetric ATPase assay99 was used to measure changes in ATPase activity
in the presence and absence of MXR substrates. Sodium orthovanadate did not inhibit all
ATPase activity in the vesicle reactions (data not shown), indicating slight contamination
by non-plasma membrane ATPases. Therefore, we also included sodium azide to inhibit
mitochondrial membrane ATPase activity100 and ouabain to inhibit sodium-potassium
ATPase channels. MXR WT vesicle ATPase activity was ~3-fold higher than EV
vesicles upon exposure to sulfasalazine, mitoxantrone, SN-38 and pheophorbide A
(Figure 2.15). There was no difference in ATPase activity between MXR WT and EV
with estrone-3-sulfate treatment (data not shown). The V12M variant vesicles had
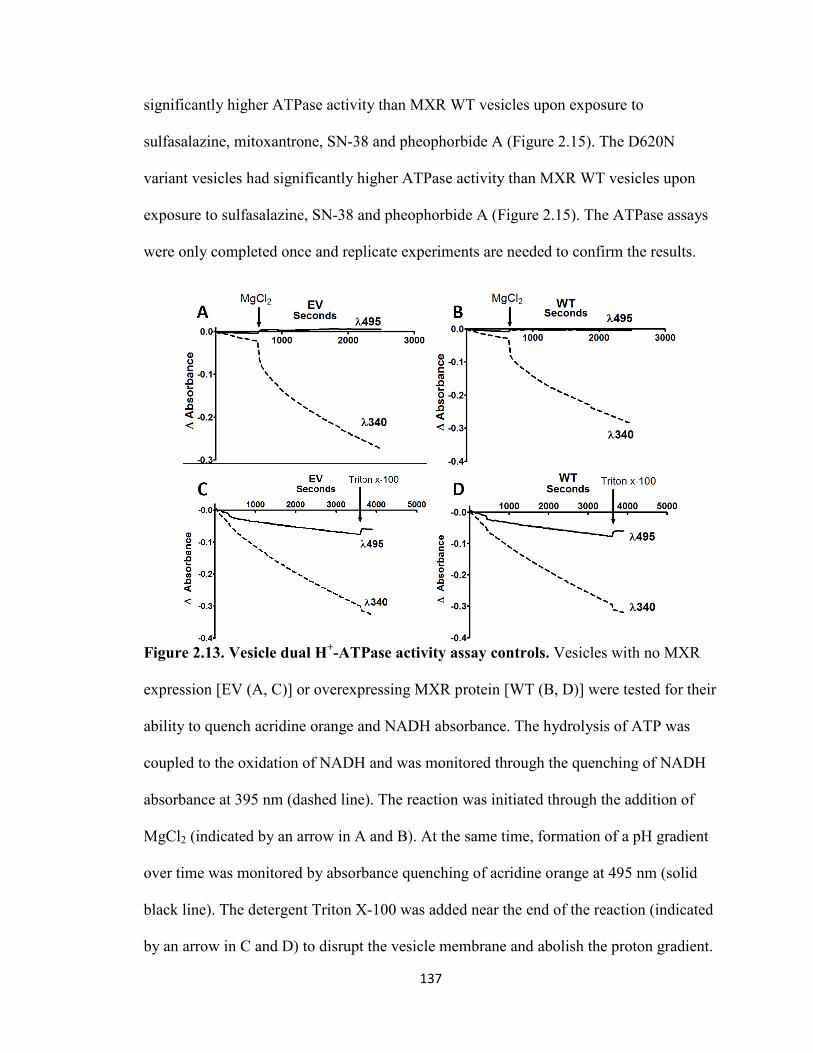
137
significantly higher ATPase activity than MXR WT vesicles upon exposure to
sulfasalazine, mitoxantrone, SN-38 and pheophorbide A (Figure 2.15). The D620N
variant vesicles had significantly higher ATPase activity than MXR WT vesicles upon
exposure to sulfasalazine, SN-38 and pheophorbide A (Figure 2.15). The ATPase assays
were only completed once and replicate experiments are needed to confirm the results.
Figure 2.13. Vesicle dual H+-ATPase activity assay controls. Vesicles with no MXR
expression [EV (A, C)] or overexpressing MXR protein [WT (B, D)] were tested for their
ability to quench acridine orange and NADH absorbance. The hydrolysis of ATP was
coupled to the oxidation of NADH and was monitored through the quenching of NADH
absorbance at 395 nm (dashed line). The reaction was initiated through the addition of
MgCl2 (indicated by an arrow in A and B). At the same time, formation of a pH gradient
over time was monitored by absorbance quenching of acridine orange at 495 nm (solid
black line). The detergent Triton X-100 was added near the end of the reaction (indicated
by an arrow in C and D) to disrupt the vesicle membrane and abolish the proton gradient.

138

139
Figure 2.14. Dual H+-ATPase activity of MXR expressing vesicles. Vesicles with no
MXR expression (EV, red lines all graphs) or overexpressing MXR protein variants
(black lines), A) WT, B) V12M, C) Q141K, D) I206L, E) P269S, F) T542A, G) D620N
and H) V12M/Q141K, were tested for their H+-ATPase activity as described in Materials
and Methods. Formation of a pH gradient over time was monitored by absorbance
quenching of acridine orange at 495 nm (dashed lines). At the same time, the hydrolysis
of ATP was coupled to the oxidation of NADH and was monitored through the
quenching of NADH absorbance at 395 nm (solid lines).

140
Figure 2.15. Vanadate sensitive ATPase activity of MXR vesicles. Vanadate-sensitive
ATPase activity of vesicles after stimulation with (A) 5 μM sulfasalazine, (B) 5 μM
mitoxantrone, (C) 5 μM SN-38 and (D) 5 μM pheophorbide A. Vesicles were made from
141
HEK293 Flp-in cell membranes stably expressing EV, MXR reference (WT) or MXR
variant proteins. The ATPase activities of the vesicles were determined using a
colorimetric assay to detect vanadate-sensitive liberation of inorganic phosphate as
described in Materials and Methods. Vanadate-sensitive ATPase activity is expressed as
μmole of liberated inorganic phosphate (Pi) divided by mg of vesicle protein and reaction
time. Results are from one experiment with triplicate wells per condition with EV data
from BD CT vesicles. Vanadate-sensitive ATPase activity for EV was tested for
differences from reference MXR using a Student’s t-test and variant MXR proteins were
tested for differences from reference MXR using an ANOVA followed by a post-hoc
Bonferroni t-test, * P < 0.05, ** P < 0.01, *** P < 0.001.
2.4.6. Substrate Uptake by MXR Vesicles
Inside-out vesicles were used for direct uptake assays. Since the majority of MXR
tested substrates were fluorescent, MXR transport was measured through fluorescence
detection of the drug inside vesicles. Uptake of mitoxantrone, SN-38 and sulfasalazine
was linear before 1 min (Figure 2.16). There were no differences in the linear range of
uptake between MXR WT and the MXR variant vesicles (data not shown). We were
unable to isolate the linear range of uptake for pheophorbide A (data not shown). The
difference between WT and EV vesicles in uptake of mitoxantrone, SN-38 and
sulfasalazine was 2- to 4- fold after 30 sec (Figure 2.16). Although the initial tests and
optimization of MXR vesicles had promising results, further kinetic assays were
inconsistent. Our attempts to calculate kinetics for MXR WT and variant vesicles with
fluorescent substrates were unsuccessful due to a loss of specific transport in the MXR

142
expressing cells (data not shown) and studies are ongoing to optimize reaction conditions
and detection methods.
Figure 2.16. Time dependent uptake of fluorescent drugs into inside-out vesicles.
Uptake of (A) mitoxantrone, (B) SN-38 and (C) sulfasalazine into EV (●) and MXR WT
() inside-out vesicles was measured as described in Materials and Methods. Vesicles (1
μg) were treated with 10 μM mitoxantrone, 10 μM SN-38 or 50 μM sulfasalazine for 30
sec, 1 min or 5 min, and the reaction was quenched and vesicles separated from uptake
buffer using MCE filter plates (mitoxantrone and SN-38) or sephadex columns
(sulfasalazine). The amount of substrate from lysed vesicles was quantified via
fluorescence at 414 nm following excitation at 545 nm for SN-38, absorbance at 460 nm
for sulfasalazine and absorbance at 670 nm for mitoxantrone.

143
2.5. Discussion
The sequencing of the SOPHIE cohort identified six non-synonymous variants
and one haplotype of the MXR transporter. In this study, these protein variants were
functionally characterized by expressing the MXR variant transporters using the HEK293
Flp-in system. The HEK293 Flp-in system has been well validated as a system to identify
MXR variants that might have altered protein expression, degradation and
function41,45,54,101–104. The overexpression of MXR variants in HEK293 Flp-in cells
indicated that none of the SNPs cause a complete loss in MXR expression or alter the
localization of the protein. Although there were slight fluctuations in the MXR
expression levels in the vesicles isolated from the HEK293 Flp-in stable cells, MXR
expression for all vesicle preps, except pcDNA, was very high.
Inside-out and intact membrane vesicles from these overexpressing cell lines were
used to functionally characterize the MXR variants. The MXR vanadate-sensitive
ATPase activity of the vesicles was stimulated 2-fold with mitoxantrone, sulfasalazine,
SN-38 and pheophorbide A. Although there is generally over a 4-fold stimulation in
ATPase activity that occurs with P-glycoprotein (P-gp), 2-fold simulation of MXR
activity is consistent with what has been seen with other MXR substrates82,105–109.
Further conclusions regarding the function of the MXR variant transporters relative to the
reference require additional experiments.
The MAF of MXR variants have been well summarized in reviews and are
population-specific7,45,79,103,104,110,111. The two most common SNPs were the V12M and
the Q141K variants and the MAF found in the Caucasian, Asian and African American
SOPHIE samples was similar to reported values15,22,68,80,110,112–116. Both the V12M and

144
Q141K variants are most common in Asians (15-45%15,22,80,110,112 and 15-
36%15,22,68,80,110,112,113, respectively), followed by Caucasians (2-12%22,114–116 and 6-
14%22,68,114–116, respectively), and African Americans (0% and 0-5%22,68, respectively).
The I206L, P269S and D620N variants are much less common in most
populations22,80,114,117. The PMT project was the first to report the T542A SNP, which has
since been noted in another population95. The V12M and Q141K SNPs occur together at
a low frequency (<1% in Caucasians and African Americans), consistent with other
reports that show these SNPs to be in linkage disequilibrium80 and therefore not part of a
common haplotype113.
Due to its high MAF in different ethnic populations, the V12M variant is well
studied. The V12M variant is located in the NH2-terminal intracellular region of the
MXR protein. The observed decreased expression of MXR V12M compared to WT is
consistent with another report of low V12M protein levels in cell lines45. However, there
have been many reports noting that V12M mRNA and/or protein expression levels were
the same as MXR WT in either human tissues or cell lines41,54,81,103,111,112. A single report
in Hispanic livers noted an association of the V12M variant with lower mRNA levels of
ABCG220. Altered localization of the V12M protein was not observed in the current
study using non-polarized cells but has been reported in a polarized cell system116.
There is evidence for substrate-dependent effects of the V12M variant as it has
been reported to cause lower porphyrin45 and higher methotrexate42 transport. In vesicle
assays, the V12M MXR exhibited significantly higher ATPase activity compared to WT
MXR when stimulated with sulfasalazine, mitoxantrone, SN-38 and pheophorbide A.
These results are consistent with reports that V12M has protective effects against

145
pheophorbide A103 and SN-38 cytotoxicity54. Alterations of V12M transport are of note
because V12M has been clinically associated with a poor response to imatinib mesylate
treatment118. Further studies are needed to determine if V12M can impact the
pharmacokinetics or dynamics of porphyrins, irinotecan and its active metabolite SN-38.
The Q141K variant is the most common MXR variant and has been associated
with chemotherapy-induced diarrhea119, acute lymphoblastic leukemia complications120
and neutropenia in cancer patients treated with irinotecan121. It lies between the Walker A
motif and the ABC signature region. Not all of the data regarding MXR Q141K function
has been in agreement. In the current study using HEK293 Flp-in stable cells, MXR
Q141K had similar levels of mRNA to WT but reduced whole cell and membrane protein
expression. This reduction in Q141K expression is in agreement with other reports of
normal mRNA but low protein expression levels of Q141K41,45,81,103,111,112,122,123 and has
been linked to an increase in the proteosomal degradation of the Q141K variant 101,102.
Although the Q141K variant has not been linked to alterations in human intestine mRNA
levels22, it could still have an impact on protein expression. Analysis of intestinal biopsy
samples showed equal protein and mRNA expression between Q141K and WT21, but the
variant did have lower protein expression in human erythrocytes123 and placental
samples15.
Without normalizing for Q141K expression, the ATPase assays showed no
difference in mitoxantrone stimulated ATPase activity, consistent with that of Morisaki et
al67. Additionally, the Q141K variant exhibits low porphyrin transport45 and low IC50s in
topotecan, SN-38 and mitoxantrone cytotoxicity assays54,111,112. However, there is no
change in pheophorbide A IC50 for the MXR Q141K variant103 and it has similar MTX

146
ATP-dependent transport compared to WT42. Additionally, the Q141K variant alters the
pharmacokinetic parameters of SN-38 and its glucuronide68, sulfasalazine21,
diflomotecan124, fluvastatin, pravastatin and simvastatin125, and rosuvastatin126. The
Q141K variant has no effect on the pharmacokinetic properties of nitrofurantoin127,
pitavastatin128, pravastatin129 or lamivudine130. Clearly, further research is needed to
clarify the substrate-dependent effects of MXR Q141K and their clinical implications.
The other MXR nonsynonymous SNPs are much less frequent and have been
considerably less studied. The I206L variant is located right before the Walker B motif
and has been reported to have either no change in expression20 or reduced expression131
compared to MXR WT. In the current study, stable HEK293 Flp-in cells showed no
differences in I206L mRNA or protein expression. The I206L transiently transfected cells
also had a 1.4-fold higher pheophorbide A IE, consistent with previous reports that this
variant has a 2.4-fold higher IE131 and a lower porphyrin transport45. Although the I206L
variant is functional, in the presence of inhibitors it might play a role in increased
exposure to porphyrins. MXR has previously been implicated in pheophorbide A
elimination43; phototoxicity is present in humans after injection of foods rich in
pheophorbide A52 and patients taking MXR inhibitors or substrates have evidence for
photosensitivity47–50. Thus, it would be of interest to elucidate the link between MXR
variants and phototoxicity and whether they play a clinical role in the presentation of
phototoxicity.
P269S is another low frequency MXR SNP that has been relatively unstudied. It
is located right before the first transmembrane domain. There was no difference in P269S
mRNA or protein expression compared to the reference transporter, consistent with

147
Kondo et al81. ATPase activity of P269S vesicles was not altered relative to the reference
transporter in the presence of sulfasalazine, SN-38, mitoxantrone or pheophorbide A.
Others have reported that the P269S variant exhibits a 35-40% decrease in vesicular
uptake of estrone-3-sulfate and methotrexate compared to WT80. The PMT project was
the first to identify the T542A MXR variant, and its function has thus not been previously
evaluated. The T542A variant is very near or in the 5th transmembrane domain. The
T542A variant had higher membrane expression, evident both via flow cytometry and
immunohistochemistry. However, there were no significant changes in T542A MXR
function compared to the MXR WT protein. The effect of the V12M/Q141K haplotype
on MXR function has also not been previously studied. Although we noted some
decrease in protein expression, it did not translate into any alteration in protein function.
Stable cell lines expressing the D620N variant, which is in extracellular loop 3 of
the transporter, had similar mRNA levels, but decreased membrane and whole cell MXR
expression. Decreased79, increased131 and no change45 in protein expression have all been
reported for the D620N variant. Both the current study and previous reports showed no
effect of the D620N amino acid change on mitoxantrone stimulated ATPase activity67.
In contrast, ATPase activity was increased for this variant in the presence of
sulfasalazine, SN-38 and pheophorbide A. More research is necessary to elucidate
whether this variant alters function.
Although vesicles have been successfully used in previous research to
characterize MXR substrates, the system was difficult to optimize. Rapid counter-flux of
the drugs was observed after 1 minute, a phenomenon attributed to the expression of
uptake transporters132. This is consistent with mitoxantrone transport by many

148
transporters71. The use of Sf9 cells to generate vesicles expressing human MXR proteins
could be used to circumvent this problem. However, the cholesterol composition of both
Sf9 and HEK293 membranes affects the activity of MXR106. Cholesterol was not added
to our system, but it could be a useful tool in the future to increase the difference between
the EV and WT ATPase activity or substrate transport. The current vesicle assay could
also benefit by further optimization focusing on pH, temperature and sucrose molarity,
since all have been shown to affect the transport of MXR substrates into vesicles56.
Although the sucrose concentration was at the published optimal concentration, the pH
was higher56, and therefore modulating the pH could be another avenue to improve the
vesicle assays. MXR is a high capacity transporter, and it would be of interest to
determine if reducing the temperature of the reaction could prolong the linear range of
MXR transport. Finally, there were difficulties obtaining no transport in conditions in
which only AMP was present (data not shown). However, there is evidence that ATP
hydrolysis is not necessary for the conformational changes that occur in the MXR protein
upon drug binding108, and instead ATP hydrolysis is relevant for resetting the MXR
conformation after transport of substrates133. It is possible that in the AMP reactions, drug
that binds to the MXR transporter and not drug that was effectively transported into the
vesicle was being measured. Thus, further optimization of the vesicle reaction’s
cholesterol content, pH and temperature, and identification of a different negative control
than AMP could be beneficial.

149
2.6. Conclusion
Preliminary evidence was presented for altered substrate-dependent function of
V12M, I206L and D620N variants of MXR. The Q141K variant exhibited lower protein
expression, however, the Q141K MXR protein itself is functional. Additionally, the
HEK293 Flp-in stable cell lines and inside-out vesicle assay have potential for being a
useful tool to determine the expression and function of different MXR variants and
substrates. However, further optimization of the substrate uptake assays are needed
before final conclusions can be made on kinetic parameters.

150
2.7. References
(1) Dean, M.; Hamon, Y.; Chimini, G. The human ATP-binding cassette (ABC) transporter superfamily. Journal of lipid research 2001, 42, 1007–17.
(2) Choudhuri, S.; Klaassen, C. D. Structure, function, expression, genomic organization, and single nucleotide polymorphisms of human ABCB1 (MDR1), ABCC (MRP), and ABCG2 (BCRP) efflux transporters. International journal of toxicology 2006, 25, 231–59.
(3) Kusuhara, H.; Sugiyama, Y. ATP-binding cassette, subfamily G (ABCG family). Pflügers Archiv : European journal of physiology 2007, 453, 735–44.
(4) Xu, J.; Liu, Y.; Yang, Y.; Bates, S.; Zhang, J. Characterization of oligomeric human half-ABC transporter ATP-binding cassette G2. The Journal of biological chemistry 2004, 279, 19781–9.
(5) Bhatia, A.; Schäfer, H.-J.; Hrycyna, C. a Oligomerization of the human ABC transporter ABCG2: evaluation of the native protein and chimeric dimers. Biochemistry 2005, 44, 10893–904.
(6) Velamakanni, S.; Wei, S. L.; Janvilisri, T.; Van Veen, H. W. ABCG transporters: structure, substrate specificities and physiological roles : a brief overview. Journal of bioenergetics and biomembranes 2007, 39, 465–71.
(7) Ishikawa, T.; Tamura, A.; Saito, H.; Wakabayashi, K.; Nakagawa, H. Pharmacogenomics of the human ABC transporter ABCG2: from functional evaluation to drug molecular design. Die Naturwissenschaften 2005, 92, 451–63.
(8) Robey, R. W.; To, K. K. K.; Polgar, O.; Dohse, M.; Fetsch, P.; Dean, M.; Bates, S. E. ABCG2: a perspective. Advanced drug delivery reviews 2009, 61, 3–13.
(9) Doyle, L. a; Yang, W.; Abruzzo, L. V; Krogmann, T.; Gao, Y.; Rishi, a K.; Ross, D. D. A multidrug resistance transporter from human MCF-7 breast cancer cells. Proceedings of the National Academy of Sciences of the United States of America 1998, 95, 15665–70.
(10) Maliepaard, M.; Scheffer, G. L.; Faneyte, I. F.; Gastelen, A. Van; Pijnenborg, A. C. L. M. Subcellular Localization and Distribution of the Breast Cancer Resistance Protein Transporter in Normal Human Tissues Subcellular Localization and Distribution of the Breast Cancer Resistance Protein Transporter in Normal Human Tissues 1. 2001, 3458–3464.

151
(11) Fetsch, P. a; Abati, A.; Litman, T.; Morisaki, K.; Honjo, Y.; Mittal, K.; Bates, S. E. Localization of the ABCG2 mitoxantrone resistance-associated protein in normal tissues. Cancer letters 2006, 235, 84–92.
(12) Doyle, L. A.; Ross, D. D. Multidrug resistance mediated by the breast cancer resistance protein BCRP (ABCG2). Oncogene 2003, 22, 7340–58.
(13) Allikmets, R.; Schriml, L. M.; Hutchinson, A.; Romano-Spica, V.; Dean, M. A human placenta-specific ATP-binding cassette gene (ABCP) on chromosome 4q22 that is involved in multidrug resistance. Cancer research 1998, 58, 5337–9.
(14) Mao, Q. BCRP/ABCG2 in the placenta: expression, function and regulation. Pharmaceutical research 2008, 25, 1244–55.
(15) Kobayashi, D.; Ieiri, I.; Hirota, T.; Takane, H. Functional assessment of ABCG2 (BCRP) gene polymorphisms to protein expression in human placenta. Drug metabolism and 2005, 33, 94–101.
(16) Yeboah, D.; Sun, M.; Kingdom, J.; Baczyk, D.; Lye, S. J.; Matthews, S. G.; Gibb, W. Expression of breast cancer resistance protein ( BCRP / ABCG2 ) in human placenta throughout gestation and at term before and after labor. 2006, 1258, 1251–1258.
(17) Cooray, H. C.; Blackmore, C. G.; Maskell, L.; Barrand, M. a Localisation of breast cancer resistance protein in microvessel endothelium of human brain. Neuroreport 2002, 13, 2059–63.
(18) Jonker, J. W.; Merino, G.; Musters, S.; Van Herwaarden, A. E.; Bolscher, E.; Wagenaar, E.; Mesman, E.; Dale, T. C.; Schinkel, A. H. The breast cancer resistance protein BCRP (ABCG2) concentrates drugs and carcinogenic xenotoxins into milk. Nature medicine 2005, 11, 127–9.
(19) Noguchi, K.; Katayama, K.; Mitsuhashi, J.; Sugimoto, Y. Functions of the breast cancer resistance protein (BCRP/ABCG2) in chemotherapy. Advanced drug delivery reviews 2009, 61, 26–33.
(20) Poonkuzhali, B.; Lamba, J.; Strom, S. Association of breast cancer resistance protein/ABCG2 phenotypes and novel promoter and intron 1 single nucleotide polymorphisms. Drug Metabolism and … 2008, 36, 780–795.
(21) Urquhart, B. L.; Ware, J. a; Tirona, R. G.; Ho, R. H.; Leake, B. F.; Schwarz, U. I.; Zaher, H.; Palandra, J.; Gregor, J. C.; Dresser, G. K.; Kim, R. B. Breast cancer resistance protein (ABCG2) and drug disposition: intestinal expression, polymorphisms and sulfasalazine as an in vivo probe. Pharmacogenetics and genomics 2008, 18, 439–48.

152
(22) Zamber, C. P.; Lamba, J. K.; Yasuda, K.; Farnum, J.; Thummel, K.; Schuetz, J. D.; Schuetz, E. G. Natural allelic variants of breast cancer resistance protein (BCRP) and their relationship to BCRP expression in human intestine. Pharmacogenetics 2003, 13, 19–28.
(23) Ross, D. D.; Karp, J. E.; Chen, T. T.; Doyle, L. A. Expression of breast cancer resistance protein in blast cells from patients with acute leukemia. Blood 2000, 96, 365–8.
(24) Suvannasankha, a; Minderman, H.; O’Loughlin, K. L.; Nakanishi, T.; Greco, W. R.; Ross, D. D.; Baer, M. R. Breast cancer resistance protein (BCRP/MXR/ABCG2) in acute myeloid leukemia: discordance between expression and function. Leukemia : official journal of the Leukemia Society of America, Leukemia Research Fund, U.K 2004, 18, 1252–7.
(25) Suvannasankha, A.; Minderman, H.; O’Loughlin, K. L.; Nakanishi, T.; Ford, L. a; Greco, W. R.; Wetzler, M.; Ross, D. D.; Baer, M. R. Breast cancer resistance protein (BCRP/MXR/ABCG2) in adult acute lymphoblastic leukaemia: frequent expression and possible correlation with shorter disease-free survival. British journal of haematology 2004, 127, 392–8.
(26) Benderra, Z.; Faussat, A.-M.; Sayada, L.; Perrot, J.-Y.; Chaoui, D.; Marie, J.-P.; Legrand, O. Breast cancer resistance protein and P-glycoprotein in 149 adult acute myeloid leukemias. Clinical cancer research : an official journal of the American Association for Cancer Research 2004, 10, 7896–902.
(27) Tsunoda, S.; Okumura, T.; Ito, T.; Kondo, K.; Ortiz, C.; Tanaka, E.; Watanabe, G.; Itami, A.; Sakai, Y.; Shimada, Y. ABCG2 expression is an independent unfavorable prognostic factor in esophageal squamous cell carcinoma. Oncology 2006, 71, 251–8.
(28) Usuda, J.; Tsunoda, Y.; Ichinose, S.; Ishizumi, T.; Ohtani, K.; Maehara, S.; Ono, S.; Tsutsui, H.; Ohira, T.; Okunaka, T.; Furukawa, K.; Sugimoto, Y.; Kato, H.; Ikeda, N. Breast cancer resistant protein (BCRP) is a molecular determinant of the outcome of photodynamic therapy (PDT) for centrally located early lung cancer. Lung cancer (Amsterdam, Netherlands) 2010, 67, 198–204.
(29) Uggla, B.; Ståhl, E.; Wågsäter, D.; Paul, C.; Karlsson, M. G.; Sirsjö, A.; Tidefelt, U. BCRP mRNA expression v. clinical outcome in 40 adult AML patients. Leukemia research 2005, 29, 141–6.
(30) Yoh, K. Breast Cancer Resistance Protein Impacts Clinical Outcome in Platinum-Based Chemotherapy for Advanced Non-Small Cell Lung Cancer. Clinical Cancer Research 2004, 10, 1691–1697.

153
(31) Bates, S. E.; Robey, R.; Miyake, K.; Rao, K.; Ross, D. D.; Litman, T. The role of half-transporters in multidrug resistance. Journal of bioenergetics and biomembranes 2001, 33, 503–11.
(32) Mao, Q.; Unadkat, J. D. Role of the breast cancer resistance protein (ABCG2) in drug transport. The AAPS journal 2005, 7, E118–33.
(33) Mo, W.; Zhang, J.-T. Human ABCG2: structure, function, and its role in multidrug resistance. International journal of biochemistry and molecular biology 2012, 3, 1–27.
(34) Miyake, K.; Mickley, L.; Litman, T.; Zhan, Z.; Robey, R.; Cristensen, B.; Brangi, M.; Greenberger, L.; Dean, M.; Fojo, T.; Bates, S. E. Molecular cloning of cDNAs which are highly overexpressed in mitoxantrone-resistant cells: demonstration of homology to ABC transport genes. Cancer research 1999, 59, 8–13.
(35) Litman, T.; Brangi, M.; Hudson, E.; Fetsch, P.; Abati, A.; Ross, D. D.; Miyake, K.; Resau, J. H.; Bates, S. E. The multidrug-resistant phenotype associated with overexpression of the new ABC half-transporter, MXR (ABCG2). Journal of cell science 2000, 113 ( Pt 1, 2011–21.
(36) Posner, L. E.; Dukart, G.; Goldberg, J.; Bernstein, T.; Cartwright, K. Mitoxantrone: an overview of safety and toxicity. Investigational new drugs 1985, 3, 123–32.
(37) Scott, L. J.; Figgitt, D. P. Mitoxantrone: a review of its use in multiple sclerosis. CNS drugs 2004, 18, 379–96.
(38) Carles, J.; Castellano, D.; Climent, M. Á.; Maroto, P.; Medina, R.; Alcaraz, A. Castration-resistant metastatic prostate cancer: current status and treatment possibilities. Clinical & translational oncology : official publication of the Federation of Spanish Oncology Societies and of the National Cancer Institute of Mexico 2012, 14, 169–76.
(39) Atiba, J. O.; Green, S. J.; Hynes, H. E.; Osborne, C. K.; Miller, T. P.; Davidner, M. Phase II evaluation of mitoxantrone plus cis-platinum in patients with advanced breast cancer. A Southwest Oncology Group study. Investigational new drugs 1994, 12, 129–32.
(40) An, G.; Morris, M. E. Effects of single and multiple flavonoids on BCRP-mediated accumulation, cytotoxicity and transport of mitoxantrone in vitro. Pharmaceutical research 2010, 27, 1296–308.
(41) Tamura, A.; Wakabayashi, K.; Onishi, Y.; Nakagawa, H.; Tsuji, M.; Matsuda, Y.; Ishikawa, T. Genetic polymorphisms of human ABC transporter ABCG2: development of the standard method for functional validation of SNPs by using the

154
Flp recombinase system. Journal of experimental therapeutics & oncology 2006, 6, 1–11.
(42) Ishikawa, T.; Sakurai, A.; Kanamori, Y.; Nagakura, M.; Hirano, H.; Takarada, Y.; Yamada, K.; Fukushima, K.; Kitajima, M. High-speed screening of human ATP-binding cassette transporter function and genetic polymorphisms: new strategies in pharmacogenomics. Methods in enzymology 2005, 400, 485–510.
(43) Jonker, J. W.; Buitelaar, M.; Wagenaar, E.; Van Der Valk, M. a; Scheffer, G. L.; Scheper, R. J.; Plosch, T.; Kuipers, F.; Elferink, R. P. J. O.; Rosing, H.; Beijnen, J. H.; Schinkel, A. H. The breast cancer resistance protein protects against a major chlorophyll-derived dietary phototoxin and protoporphyria. Proceedings of the National Academy of Sciences of the United States of America 2002, 99, 15649–54.
(44) Desuzinges-Mandon, E.; Arnaud, O.; Martinez, L.; Huché, F.; Di Pietro, A.; Falson, P. ABCG2 transports and transfers heme to albumin through its large extracellular loop. The Journal of biological chemistry 2010, 285, 33123–33.
(45) Tamura, A.; Watanabe, M.; Saito, H.; Nakagawa, H.; Kamachi, T.; Okura, I.; Ishikawa, T. Functional validation of the genetic polymorphisms of human ATP-binding cassette (ABC) transporter ABCG2: identification of alleles that are defective in porphyrin transport. Molecular pharmacology 2006, 70, 287–96.
(46) Krishnamurthy, P.; Schuetz, J. D. The ABC transporter Abcg2/Bcrp: role in hypoxia mediated survival. Biometals : an international journal on the role of metal ions in biology, biochemistry, and medicine 2005, 18, 349–58.
(47) Wan, P.; Moat, S.; Anstey, A. Pellagra: a review with emphasis on photosensitivity. The British journal of dermatology 2011, 164, 1188–200.
(48) Ho, A. Y. L.; Deacon, A.; Osborne, G.; Mufti, G. J. Precipitation of porphyria cutanea tarda by imatinib mesylate? British journal of haematology 2003, 121, 375.
(49) Brazzelli, V.; Prestinari, F.; Barbagallo, T.; Rona, C.; Orlandi, E.; Passamonti, F.; Locatelli, F.; Zecca, M.; Villani, S.; Borroni, G. A long-term time course of colorimetric assessment of the effects of imatinib mesylate on skin pigmentation: a study of five patients. Journal of the European Academy of Dermatology and Venereology : JEADV 2007, 21, 384–7.
(50) Brazzelli, V.; Muzio, F.; Manna, G.; Moggio, E.; Vassallo, C.; Orlandi, E.; Fiandrino, G.; Lucioni, M.; Borroni, G. Photoinduced dermatitis and oral lichenoid reaction in a chronic myeloid leukemia patient treated with imatinib mesylate. Photodermatology, photoimmunology & photomedicine 2012, 28, 2–5.

155
(51) Boumendjel, a; Macalou, S.; Valdameri, G.; Pozza, a; Gauthier, C.; Arnaud, O.; Nicolle, E.; Magnard, S.; Falson, P.; Terreux, R.; Carrupt, P.; Payen, L.; Di Pietro, a Targeting the multidrug ABCG2 transporter with flavonoidic inhibitors: in vitro optimization and in vivo validation. Current medicinal chemistry 2011, 18, 3387–401.
(52) Jitsukawa, K.; Suizu, R.; Hidano, A. Chlorella photosensitization. New phytophotodermatosis. International journal of dermatology 1984, 23, 263–8.
(53) Robey, R. W.; Steadman, K.; Polgar, O.; Morisaki, K.; Blayney, M.; Mistry, P.; Bates, S. E. Pheophorbide a is a specific probe for ABCG2 function and inhibition. Cancer research 2004, 64, 1242–6.
(54) Tamura, A.; Wakabayashi, K.; Onishi, Y.; Takeda, M.; Ikegami, Y.; Sawada, S.; Tsuji, M.; Matsuda, Y.; Ishikawa, T. Re-evaluation and functional classification of non-synonymous single nucleotide polymorphisms of the human ATP-binding cassette transporter ABCG2. Cancer Science 2007, 98, 231–239.
(55) Robey, R. W.; Steadman, K.; Polgar, O.; Bates, S. E. ABCG2-mediated transport of photosensitizers: potential impact on photodynamic therapy. Cancer biology & therapy 2005, 4, 187–94.
(56) Jani, M.; Szabó, P.; Kis, E.; Molnár, E.; Glavinas, H.; Krajcsi, P.; Ani, M. J.; Zabó, P. S.; Is, E. K.; Olnár, É. M.; Lavinas, H. G.; Rajcsi, P. K. Kinetic characterization of sulfasalazine transport by human ATP-binding cassette G2. Biological & pharmaceutical bulletin 2009, 32, 497–9.
(57) Cantini, F.; Niccoli, L.; Nannini, C.; Kaloudi, O.; Bertoni, M.; Cassarà, E. Psoriatic arthritis: a systematic review. International journal of rheumatic diseases 2010, 13, 300–17.
(58) Ford, A. C.; Achkar, J.-P.; Khan, K. J.; Kane, S. V; Talley, N. J.; Marshall, J. K.; Moayyedi, P. Efficacy of 5-aminosalicylates in ulcerative colitis: systematic review and meta-analysis. The American journal of gastroenterology 2011, 106, 601–16.
(59) Adkison, K. K.; Vaidya, S. S.; Lee, D. Y.; Koo, S. H.; Li, L.; Mehta, A. A.; Gross, A. S.; Polli, J. W.; Humphreys, J. E.; Lou, Y.; Lee, E. J. D. Oral sulfasalazine as a clinical BCRP probe substrate: pharmacokinetic effects of genetic variation (C421A) and pantoprazole coadministration. Journal of pharmaceutical sciences 2010, 99, 1046–62.
(60) Kusuhara, H.; Furuie, H.; Inano, A.; Sunagawa, A.; Yamada, S.; Wu, C.; Fukizawa, S.; Morimoto, N.; Ieiri, I.; Morishita, M.; Sumita, K.; Mayahara, H.; Fujita, T.; Maeda, K.; Sugiyama, Y. Pharmacokinetic interaction study of

156
sulphasalazine in healthy subjects and the impact of curcumin as an in vivo inhibitor of BCRP. British journal of pharmacology 2012, 166, 1793–1803.
(61) De Jong, F. a; De Jonge, M. J. a; Verweij, J.; Mathijssen, R. H. J. Role of pharmacogenetics in irinotecan therapy. Cancer letters 2006, 234, 90–106.
(62) Nakatomi, K.; Yoshikawa, M.; Oka, M.; Ikegami, Y.; Hayasaka, S.; Sano, K.; Shiozawa, K.; Kawabata, S.; Soda, H.; Ishikawa, T.; Tanabe, S.; Kohno, S. Transport of 7-ethyl-10-hydroxycamptothecin (SN-38) by breast cancer resistance protein ABCG2 in human lung cancer cells. Biochemical and biophysical research communications 2001, 288, 827–32.
(63) Bates, S. E.; Medina-Pérez, W. Y.; Kohlhagen, G.; Antony, S.; Nadjem, T.; Robey, R. W.; Pommier, Y. ABCG2 mediates differential resistance to SN-38 (7-ethyl-10-hydroxycamptothecin) and homocamptothecins. The Journal of pharmacology and experimental therapeutics 2004, 310, 836–42.
(64) Bessho, Y.; Oguri, T.; Achiwa, H.; Muramatsu, H.; Maeda, H.; Niimi, T.; Sato, S.; Ueda, R. Role of ABCG2 as a biomarker for predicting resistance to CPT-11/SN-38 in lung cancer. Cancer science 2006, 97, 192–8.
(65) Takahata, T.; Ookawa, K.; Suto, K.; Tanaka, M.; Yano, H.; Nakashima, O.; Kojiro, M.; Tamura, Y.; Tateishi, T.; Sakata, Y.; Fukuda, S. Chemosensitivity determinants of irinotecan hydrochloride in hepatocellular carcinoma cell lines. Basic & clinical pharmacology & toxicology 2008, 102, 399–407.
(66) Jada, S. R.; Lim, R.; Wong, C. I.; Shu, X.; Lee, S. C.; Zhou, Q.; Goh, B. C.; Chowbay, B. Role of UGT1A1*6, UGT1A1*28 and ABCG2 c.421C>A polymorphisms in irinotecan-induced neutropenia in Asian cancer patients. Cancer science 2007, 98, 1461–7.
(67) Morisaki, K.; Robey, R. W.; Ozvegy-Laczka, C.; Honjo, Y.; Polgar, O.; Steadman, K.; Sarkadi, B.; Bates, S. E. Single nucleotide polymorphisms modify the transporter activity of ABCG2. Cancer chemotherapy and pharmacology 2005, 56, 161–72.
(68) De Jong, F. a; Marsh, S.; Mathijssen, R. H. J.; King, C.; Verweij, J.; Sparreboom, A.; McLeod, H. L. ABCG2 pharmacogenetics: ethnic differences in allele frequency and assessment of influence on irinotecan disposition. Clinical cancer research : an official journal of the American Association for Cancer Research 2004, 10, 5889–94.
(69) IEIRI, I. Functional Significance of Genetic Polymorphisms in P-glycoprotein (MDR1, ABCB1) and Breast Cancer Resistance Protein (BCRP, ABCG2). Drug metabolism and pharmacokinetics 2011.

157
(70) Cascorbi, I. Role of pharmacogenetics of ATP-binding cassette transporters in the pharmacokinetics of drugs. Pharmacology & therapeutics 2006, 112, 457–73.
(71) Sarkadi, B.; Homolya, L.; Szakács, G.; Váradi, A. Human multidrug resistance ABCB and ABCG transporters: participation in a chemoimmunity defense system. Physiological reviews 2006, 86, 1179–236.
(72) Urban, T. J.; Sebro, R.; Hurowitz, E. H.; Leabman, M. K.; Badagnani, I.; Lagpacan, L. L.; Risch, N.; Giacomini, K. M. Functional genomics of membrane transporters in human populations. Genome research 2006, 16, 223–30.
(73) Giri, N.; Agarwal, S.; Shaik, N.; Pan, G.; Chen, Y.; Elmquist, W. F. Substrate-Dependent Breast Cancer Resistance Protein ( Bcrp1 / Abcg2 ) -Mediated Interactions : Consideration of Multiple Binding Sites in in Vitro Assay Design. Pharmacology 2009, 37, 560–570.
(74) Robey, R. W.; Honjo, Y.; Morisaki, K.; Nadjem, T. a; Runge, S.; Risbood, M.; Poruchynsky, M. S.; Bates, S. E. Mutations at amino-acid 482 in the ABCG2 gene affect substrate and antagonist specificity. British journal of cancer 2003, 89, 1971–8.
(75) Meyer, H. E.; Kroemer, H. K. Drug Transporters: In Vitro and In Vivo Evidence for the Importance of Breast Cancer Resistance Protein Transporters (BCRP/MXR/ABCP/ABCG2); Fromm, M. F.; Kim, R. B., Eds.; Springer Berlin Heidelberg: Berlin, Heidelberg, 2011; Vol. 201.
(76) Kroetz, D. L.; Yee, S. W.; Giacomini, K. M. The pharmacogenomics of membrane transporters project: research at the interface of genomics and transporter pharmacology. Clinical pharmacology and therapeutics 2010, 87, 109–16.
(77) Africa, W. A map of human genome variation from population-scale sequencing. Nature 2010, 467, 1061–73.
(78) Frazer, K. a; et. al. A second generation human haplotype map of over 3.1 million SNPs. Nature 2007, 449, 851–61.
(79) Yoshioka, S.; Katayama, K.; Okawa, C.; Takahashi, S.; Tsukahara, S.; Mitsuhashi, J.; Sugimoto, Y. The identification of two germ-line mutations in the human breast cancer resistance protein gene that result in the expression of a low/non-functional protein. Pharmaceutical research 2007, 24, 1108–17.
(80) Lee, S. S.; Jeong, H.; Yi, J.; Jung, H.; Jang, J.; Kim, E.; Lee, S.; Shin, J.; Al, L. E. E. E. T. Identification and Functional Assessment of BCRP Polymorphisms in a Korean Population. Pharmacology 2007, 35, 623–632.
158
(81) Kondo, C.; Suzuki, H.; Itoda, M.; Ozawa, S.; Sawada, J.; Kobayashi, D.; Ieiri, I.; Mine, K.; Ohtsubo, K.; Sugiyama, Y. Functional analysis of SNPs variants of BCRP/ABCG2. Pharmaceutical research 2004, 21, 1895–903.
(82) Ozvegy, C.; Váradi, A.; Sarkadi, B. Characterization of drug transport, ATP hydrolysis, and nucleotide trapping by the human ABCG2 multidrug transporter. Modulation of substrate specificity by a point mutation. The Journal of biological chemistry 2002, 277, 47980–90.
(83) Hesselson, S. E.; Matsson, P.; Shima, J. E.; Fukushima, H.; Yee, S. W.; Kobayashi, Y.; Gow, J. M.; Ha, C.; Ma, B.; Poon, A.; Johns, S. J.; Stryke, D.; Castro, R. a; Tahara, H.; Choi, J. H.; Chen, L.; Picard, N.; Sjödin, E.; Roelofs, M. J. E.; Ferrin, T. E.; Myers, R.; Kroetz, D. L.; Kwok, P.-Y.; Giacomini, K. M. Genetic variation in the proximal promoter of ABC and SLC superfamilies: liver and kidney specific expression and promoter activity predict variation. PloS one 2009, 4, e6942.
(84) Barrett, J. C.; Fry, B.; Maller, J.; Daly, M. J. Haploview: analysis and visualization of LD and haplotype maps. Bioinformatics (Oxford, England) 2005, 21, 263–5.
(85) Grantham, R. Amino acid difference formula to help explain protein evolution. Science (New York, NY) 1974, 185, 862–864.
(86) Kumar, P.; Henikoff, S.; Ng, P. C. Predicting the effects of coding non-synonymous variants on protein function using the SIFT algorithm. Nature protocols 2009, 4, 1073–81.
(87) Adzhubei, I. a; Schmidt, S.; Peshkin, L.; Ramensky, V. E.; Gerasimova, A.; Bork, P.; Kondrashov, A. S.; Sunyaev, S. R. A method and server for predicting damaging missense mutations. Nature methods 2010, 7, 248–9.
(88) Schneider, C. A.; Rasband, W. S.; Eliceiri, K. W. NIH Image to ImageJ: 25 years of image analysis. Nature methods 2012, 9, 671–5.
(89) Palmgren, M. G.; Askerlund, P.; Fredrikson, K.; Widell, S.; Sommarin, M.; Larsson, C. Sealed inside-out and right-side-out plasma membrane vesicles : optimal conditions for formation and separation. Plant physiology 1990, 92, 871–80.
(90) Palmgren, M. G.; Sommarin, M.; Ulvskov, P.; Larsson, C. Effect of detergents on the H(+)-ATPase activity of inside-out and right-side-out plant plasma membrane vesicles. Biochimica et Biophysica Acta 1990, 1021, 133–140.
(91) Palmgren, M. G. An H-ATPase Assay: Proton Pumping and ATPase Activity Determined Simultaneously in the Same Sample. Plant physiology 1990, 94, 882–6.

159
(92) Palmgren, M. G. Acridine orange as a probe for measuring pH gradients across membranes: mechanism and limitations. Analytical biochemistry 1991, 192, 316–21.
(93) Imai, Y.; Asada, S.; Tsukahara, S.; Ishikawa, E.; Tsuruo, T.; Sugimoto, Y. Breast cancer resistance protein exports sulfated estrogens but not free estrogens. Molecular pharmacology 2003, 64, 610–8.
(94) Chen, Z.; Robey, R. W.; Belinsky, M. G.; Shchaveleva, I.; Ren, X.; Sugimoto, Y.; Ross, D. D.; Bates, S. E.; Kruh, G. D. Transport of methotrexate, methotrexate polyglutamates, and 17beta-estradiol 17-(beta-D-glucuronide) by ABCG2: effects of acquired mutations at R482 on methotrexate transport. Cancer research 2003, 63, 4048–54.
(95) Ishikawa, T.; Nakagawa, H.; Hagiya, Y.; Nonoguchi, N.; Miyatake, S.-I.; Kuroiwa, T. Key Role of Human ABC Transporter ABCG2 in Photodynamic Therapy and Photodynamic Diagnosis. Advances in pharmacological sciences 2010, 2010, 587306.
(96) Nguyen, T. D.; Gow, J. M.; Chinn, L. W.; Kelly, L.; Jeong, H.; Huang, C. C.; Stryke, D.; Kawamoto, M.; Johns, S. J.; Carlson, E.; Taylor, T.; Ferrin, T. E.; Sali, A.; Giacomini, K. M.; Kroetz, D. L. PharmGKB submission update: IV. PMT submissions of genetic variations in ATP-Binding cassette transporters to the PharmGKB network. Pharmacological reviews 2006, 58, 1–2.
(97) Zhou, S.; Schuetz, J. D.; Bunting, K. D.; Colapietro, a M.; Sampath, J.; Morris, J. J.; Lagutina, I.; Grosveld, G. C.; Osawa, M.; Nakauchi, H.; Sorrentino, B. P. The ABC transporter Bcrp1/ABCG2 is expressed in a wide variety of stem cells and is a molecular determinant of the side-population phenotype. Nature medicine 2001, 7, 1028–34.
(98) Ozvegy-Laczka, C.; Katalin, N.; Sarkadi, B.; Német, K.; Váradi, A. ABCG2 -- a transporter for all seasons. FEBS letters 2004, 567, 116–20.
(99) Kova, R.; Va, E.; Richter, O. Von; Koomen, G. ABCG2 ( Breast Cancer Resistance Protein / Mitoxantrone Resistance-Associated Protein ) ATPase Assay : A Useful Tool to Detect Drug-Transporter Interactions ABSTRACT : 2007, 35, 1533–1542.
(100) Noumi, T.; Maeda, M.; Futai, M. Mode of inhibition of sodium azide on H+-ATPase of Escherichia coli. FEBS letters 1987, 213, 381–384.
(101) Furukawa, T.; Wakabayashi, K.; Tamura, A.; Nakagawa, H.; Morishima, Y.; Osawa, Y.; Ishikawa, T. Major SNP (Q141K) variant of human ABC transporter ABCG2 undergoes lysosomal and proteasomal degradations. Pharmaceutical research 2009, 26, 469–79.

160
(102) Wakabayashi-Nakao, K.; Tamura, A.; Furukawa, T.; Nakagawa, H.; Ishikawa, T. Quality control of human ABCG2 protein in the endoplasmic reticulum: ubiquitination and proteasomal degradation. Advanced drug delivery reviews 2009, 61, 66–72.
(103) Tamura, A.; Onishi, Y.; An, R.; Koshiba, S.; Wakabayashi, K.; Hoshijima, K.; Priebe, W.; Yoshida, T.; Kometani, S.; Matsubara, T.; Mikuriya, K.; Ishikawa, T. In vitro evaluation of photosensitivity risk related to genetic polymorphisms of human ABC transporter ABCG2 and inhibition by drugs. Drug metabolism and pharmacokinetics 2007, 22, 428–40.
(104) Wakabayashi, K.; Tamura, A.; Saito, H.; Onishi, Y.; Ishikawa, T. Human ABC transporter ABCG2 in xenobiotic protection and redox biology. Drug metabolism reviews 2006, 38, 371–91.
(105) Ni, Z.; Bikadi, Z.; Rosenberg, M. F.; Mao, Q. Structure and function of the human breast cancer resistance protein (BCRP/ABCG2). Current drug metabolism 2010, 11, 603.
(106) Pál, A.; Méhn, D.; Molnár, E.; Gedey, S.; Mészáros, P.; Nagy, T.; Glavinas, H.; Janáky, T.; Von Richter, O.; Báthori, G.; Szente, L.; Krajcsi, P. Cholesterol potentiates ABCG2 activity in a heterologous expression system: improved in vitro model to study function of human ABCG2. The Journal of pharmacology and experimental therapeutics 2007, 321, 1085–94.
(107) Ozvegy, C.; Litman, T.; Szakács, G.; Nagy, Z.; Bates, S.; Váradi, a; Sarkadi, B. Functional characterization of the human multidrug transporter, ABCG2, expressed in insect cells. Biochemical and biophysical research communications 2001, 285, 111–7.
(108) Rosenberg, M. F.; Bikadi, Z.; Chan, J.; Liu, X.; Ni, Z.; Cai, X.; Ford, R. C.; Mao, Q. The human breast cancer resistance protein (BCRP/ABCG2) shows conformational changes with mitoxantrone. Structure (London, England : 1993) 2010, 18, 482–93.
(109) Glavinas, H.; Kis, E.; Pál, A.; Kovács, R.; Jani, M.; Vági, E.; Molnár, E.; Bánsághi, S.; Kele, Z.; Janáky, T.; Báthori, G.; Von Richter, O.; Koomen, G.-J.; Krajcsi, P. ABCG2 (breast cancer resistance protein/mitoxantrone resistance-associated protein) ATPase assay: a useful tool to detect drug-transporter interactions. Drug metabolism and disposition: the biological fate of chemicals 2007, 35, 1533–42.
(110) Kim, K.; Joo, H.-J.; Park, J.-Y. ABCG2 polymorphisms, 34G>A and 421C>A in a Korean population: analysis and a comprehensive comparison with other populations. Journal of clinical pharmacy and therapeutics 2010, 35, 705–12.

161
(111) Yanase, K.; Tsukahara, S.; Mitsuhashi, J.; Sugimoto, Y. Functional SNPs of the breast cancer resistance protein-therapeutic effects and inhibitor development. Cancer letters 2006, 234, 73–80.
(112) Ingelheim, B.; Imai, Y.; Nakane, M.; Kage, K.; Tsukahara, S.; Ishikawa, E.; Tsuruo, T.; Miki, Y.; Sugimoto, Y. C421A polymorphism in the human breast cancer resistance protein gene is associated with low expression of Q141K protein and low-level drug resistance. Molecular cancer therapeutics 2002, 1, 611–6.
(113) ITODA, M.; SAITO, Y.; SHIRAO, K. Eight novel single nucleotide polymorphisms in ABCG2/BCRP in Japanese cancer patients administered irinotacan. Drug metabolism and … 2003, 18, 212–217.
(114) Honjo, Y.; Morisaki, K.; Huff, L.; Robey, R. W.; Hung, J.; Dean, M.; Bates, S. E. Single-nucleotide polymorphism (SNP) analysis in the ABC half-transporter ABCG2 (MXR/BCRP/ABCP1). Cancer biology & … 2002, 2, 696–702.
(115) Bäckström, G.; Taipalensuu, J.; Melhus, H.; Brändström, H.; Svensson, A.-C.; Artursson, P.; Kindmark, A. Genetic variation in the ATP-binding cassette transporter gene ABCG2 (BCRP) in a Swedish population. European journal of pharmaceutical sciences : official journal of the European Federation for Pharmaceutical Sciences 2003, 18, 359–64.
(116) Mizuarai, S.; Aozasa, N.; Kotani, H. Single nucleotide polymorphisms result in impaired membrane localization and reduced atpase activity in multidrug transporter ABCG2. International journal of cancer. Journal international du cancer 2004, 109, 238–46.
(117) Bosch, T. M.; Kjellberg, L. M.; Bouwers, A.; Koeleman, B. P. C.; Schellens, J. H. M.; Beijnen, J. H.; Smits, P. H. M.; Meijerman, I. Detection of single nucleotide polymorphisms in the ABCG2 gene in a Dutch population. American journal of pharmacogenomics : genomics-related research in drug development and clinical practice 2005, 5, 123–31.
(118) Kim, D. H. D.; Sriharsha, L.; Xu, W.; Kamel-Reid, S.; Liu, X.; Siminovitch, K.; Messner, H. a.; Lipton, J. H. Clinical relevance of a pharmacogenetic approach using multiple candidate genes to predict response and resistance to imatinib therapy in chronic myeloid leukemia. Clinical cancer research : an official journal of the American Association for Cancer Research 2009, 15, 4750–8.
(119) Kim, I.-S.; Kim, H.-G.; Kim, D. C.; Eom, H.-S.; Kong, S.-Y.; Shin, H.-J.; Hwang, S.-H.; Lee, E.-Y.; Lee, G.-W. ABCG2 Q141K polymorphism is associated with chemotherapy-induced diarrhea in patients with diffuse large B-cell lymphoma who received frontline rituximab plus cyclophosphamide/doxorubicin/vincristine/prednisone chemotherapy. Cancer science 2008, 99, 2496–501.

162
(120) Erdilyi, D. J.; Kámory, E.; Csókay, B.; Andrikovics, H.; Tordai, a; Kiss, C.; Filni-Semsei, a; Janszky, I.; Zalka, a; Fekete, G.; Falus, a; Kovács, G. T.; Szalai, C. Synergistic interaction of ABCB1 and ABCG2 polymorphisms predicts the prevalence of toxic encephalopathy during anticancer chemotherapy. The pharmacogenomics journal 2008, 8, 321–7.
(121) Sai, K.; Saito, Y.; Maekawa, K.; Kim, S.-R.; Kaniwa, N.; Nishimaki-Mogami, T.; Sawada, J.; Shirao, K.; Hamaguchi, T.; Yamamoto, N.; Kunitoh, H.; Ohe, Y.; Yamada, Y.; Tamura, T.; Yoshida, T.; Matsumura, Y.; Ohtsu, A.; Saijo, N.; Minami, H. Additive effects of drug transporter genetic polymorphisms on irinotecan pharmacokinetics/pharmacodynamics in Japanese cancer patients. Cancer chemotherapy and pharmacology 2010, 66, 95–105.
(122) Sugimoto, Y.; Tsukahara, S.; Ishikawa, E.; Mitsuhashi, J. Breast cancer resistance protein: molecular target for anticancer drug resistance and pharmacokinetics/pharmacodynamics. Cancer science 2005, 96, 457–65.
(123) Kasza, I.; Várady, G.; Andrikovics, H.; Koszarska, M.; Tordai, A.; Scheffer, G. L.; Németh, A.; Szakács, G.; Sarkadi, B. Expression Levels of the ABCG2 Multidrug Transporter in Human Erythrocytes Correspond to Pharmacologically Relevant Genetic Variations. PloS one 2012, 7, e48423.
(124) Sparreboom, A.; Gelderblom, H.; Marsh, S.; Ahluwalia, R.; Obach, R.; Principe, P.; Twelves, C.; Verweij, J.; McLeod, H. L. Diflomotecan pharmacokinetics in relation to ABCG2 421C>A genotype. Clinical pharmacology and therapeutics 2004, 76, 38–44.
(125) Keskitalo, J. E. J.; Pasanen, M. K. M.; Neuvonen, P. J.; Niemi, M. Different effects of the ABCG2 c. 421C> A SNP on the pharmacokinetics of fluvastatin, pravastatin and simvastatin. Pharmacogenomics 2009, 10, 1617–1624.
(126) Zhang, W.; Yu, B.-N.; He, Y.-J.; Fan, L.; Li, Q.; Liu, Z.-Q.; Wang, A.; Liu, Y.-L.; Tan, Z.-R.; Fen-Jiang; Huang, Y.-F.; Zhou, H.-H. Role of BCRP 421C>A polymorphism on rosuvastatin pharmacokinetics in healthy Chinese males. Clinica chimica acta; international journal of clinical chemistry 2006, 373, 99–103.
(127) Adkison, K. K.; Vaidya, S. S.; Lee, D. Y.; Koo, S. H.; Li, L.; Mehta, A. a; Gross, A. S.; Polli, J. W.; Lou, Y.; Lee, E. J. D. The ABCG2 C421A polymorphism does not affect oral nitrofurantoin pharmacokinetics in healthy Chinese male subjects. British journal of clinical pharmacology 2008, 66, 233–9.
(128) Ieiri, I.; Suwannakul, S.; Maeda, K.; Uchimaru, H.; Hashimoto, K.; Kimura, M.; Fujino, H.; Hirano, M.; Kusuhara, H.; Irie, S.; Higuchi, S.; Sugiyama, Y. SLCO1B1 (OATP1B1, an Uptake Transporter) and ABCG2 (BCRP, an Efflux Transporter) Variant Alleles and Pharmacokinetics of Pitavastatin in Healthy Volunteers. Clinical Pharmacology & Therapeutics 2007, 82, 541–547.
163
(129) Ho, R. H.; Choi, L.; Lee, W.; Mayo, G.; Schwarz, U. I.; Tirona, R. G.; Bailey, D. G.; Michael Stein, C.; Kim, R. B. Effect of drug transporter genotypes on pravastatin disposition in European- and African-American participants. Pharmacogenetics and genomics 2007, 17, 647–56.
(130) Kim, H.-S.; Sunwoo, Y. E.; Ryu, J. Y.; Kang, H.-J.; Jung, H.-E.; Song, I.-S.; Kim, E.-Y.; Shim, J.-C.; Shon, J.-H.; Shin, J.-G. The effect of ABCG2 V12M, Q141K and Q126X, known functional variants in vitro, on the disposition of lamivudine. British journal of clinical pharmacology 2007, 64, 645–54.
(131) Vethanayagam, R. R.; Wang, H.; Gupta, A.; Zhang, Y.; Lewis, F.; Unadkat, J. D.; Mao, Q. Functional analysis of the human variants of breast cancer resistance protein: I206L, N590Y, and D620N. Drug metabolism and disposition: the biological fate of chemicals 2005, 33, 697–705.
(132) Xie, H. Activity assay of membrane transport proteins. Acta Biochimica et Biophysica Sinica 2008, 40, 269–277.
(133) McDevitt, C. a; Crowley, E.; Hobbs, G.; Starr, K. J.; Kerr, I. D.; Callaghan, R. Is ATP binding responsible for initiating drug translocation by the multidrug transporter ABCG2? The FEBS journal 2008, 275, 4354–62.

164
Chapter 3: Functional Characterization of the ABCG2 Promoter and its Genetic
Variants
3.1. Abstract
ABCG2 encodes the mitoxantrone resistance protein (MXR, BCRP), a membrane
transporter responsible for the efflux of its substrates out of the cell and important in
detoxification of the body. In the present study, we examine the basal activity of the
ABCG2 promoter in HepG2 (liver), HEK293T (kidney), HCT116 (intestine) and MCF-7
(breast) cell lines. We then proceed to test the effect of variants on the ABCG2 promoter
activity in vitro and on in silico predictions for transcription factor binding. Reference
and variant ABCG2 promoter sequences, cloned into a promoter assay vector, were tested
for their ability to increase luciferase activity when transiently transfected into these four
cell lines. We found that the ABCG2 promoter was strongest in the HepG2 and HCT116
cell lines. We also identified four SNPs in the basal ABCG2 promoter (rs76656413,
rs66664036, rs139256004 and rs59370292) that decreased the activity of the ABCG2
promoter by 50% in at least three of the four cell lines. Three of these SNPs (rs76656413
and rs59370292) significantly decreased in vivo liver promoter activity, from 50-80%.
The in silico transcription factor binding analysis found alterations in binding
probabilities of several transcription factors for each of these SNPs that could explain
their ability to alter ABCG2 promoter activity in vitro. In conclusion, genetic variants in
the ABCG2 promoter could be a contributing factor to the variability of ABCG2
expression in the liver and intestine.
165
3.2. Introduction
The mitoxantrone resistance protein (MXR, BCRP) is an efflux membrane
transporter and part of the ATP-binding cassette (ABC) transporter family. It transports a
variety of dietary toxins, endogenous nutrients and pharmaceutical compounds1. MXR is
expressed in the side population of hematological stem cells2–4, endothelium of veins and
capillaries (including in the brain)5–7, intestinal and colon epithelium5,7–9, placental
syncytiotrophoblasts5,7–13, ducts and lobules of the breast5, the bile canalicular membrane
of hepatocytes5,7–9 and to a lesser extent the renal cortex tubules7–9. ABCG2 is essential
for detoxification processes, transport of nutrients into milk and protection of vital organs
and tissues like the brain, fetus, prostate and eye14.
Inter-individual expression of ABCG2 mRNA has been shown to be highly variable.
One analysis of human livers has shown as much as a 500-fold difference in mRNA
expression across samples, without detectable copy number variations15. ABCG2 mRNA
levels varied 1000-fold in the blast cells of leukemic patients16 and 1.8- to 78-fold in
human intestine17,18. Our own liver and kidney expression data show large variation in
human liver and kidney ABCG2 mRNA (Chapter 1 Figure 1.2). High ABCG2
expression has been linked to decreased disease-free survival in several different
cancers18–25. Variability in ABCG2 expression might also influence drug response and
toxicity. Understanding the mechanisms that regulate the expression of ABCG2 can help
to predict cancer outcomes, drug response and toxicity.
MXR is transcribed by ABCG2 located on the anti-strand of chromosome 4q22
between PKD2 and PPM1K. ABCG2 spans over 66 kb with the translational start site in
exon 2, the Walker A domain in exon 3 and the Walker B and ABC signature domains in

166
exon 610. There are several tissue-specific isoforms of ABCG2 that occur due to the
creation of splice variants of the 5’-UTR of ABCG2 from use of alternate promoters26–28.
Examples of exon 1 splice variants are E1a15,29 (the most common, generated by three
adjacent promoters and detected in drug-resistance cell lines27), E1b (associated with
lower ABCG2 mRNA in livers15 and with a murine equivalent expressed in the
intestine28) and E1c (contains an intron 1 that is approximately 90 kb longer than the
others and detected in human leukemia26 and murine erythroid differentiation30). Due to
this evidence of tissue specific use of promoters, the relevance of the basal ABCG2
promoter in different tissues and how the variants of its promoter effect the expression of
ABCG2 needs to be investigated.
Promoters regulate the basal expression of genes and are generally located within 2.5
kb of the transcriptional start site (TSS), with the core promoter usually ~50 bp in length
and adjacent to the TSS of the gene31,32. The core promoter is responsible for binding of
transcriptional machinery, such as RNA polymerase II, and is the minimal amount of
promoter required to drive transcription of the gene33. The region adjacent to the core
promoter, generally within 250 bp, is called the proximal promoter. The proximal
promoter is typically comprised of binding sites for other transcription factors (TFs)
which are important for the tethering of regulatory elements (such as enhancers) which
interact with the general transcriptional machinery34. Promoters work in concert with
other regulatory regions, including insulators, suppressors and enhancers, to modulate the
level of gene expression. Promoters are often associated with a high frequency of
cytosine followed by guanine (CpG) sites32. Clusters of CpG sites, at a frequency higher
than what would randomly be expected through the genome, are called CpG islands35.

167
Methylation occurs at the 5’-position on the cytosine of CpG sites, and methylation of
multiple CpG sites over a gene promoter is associated with gene suppression35.
The basal ABCG2 promoter is a TATA-less promoter and was previously identified
as the 312 bp upstream of the TSS29. The basal promoter includes a CCAAT box and
numerous SP1, AP1 and AP2 sites (black boxes in Figure 3.1)29. The proximal promoter
of ABCG2 has a functional aryl hydrocarbon receptor response element between -194 to -
19036,37 (purple box Figure 3.1) that overlaps with its functional progesterone38 (turquoise
box Figure 3.1) and estrogen39 response elements (pink box Figure 3.1). There is also an
NF-κB response element at -23, which works in concert with estrogen to increase
ABCG2 expression40 (orange bar in Figure 3.1). Additionally, there is a hypoxia
inducible factor (HIF)-1α response element (HRE) between -116 and -11241 (red bar in
Figure 3.1) and an antioxidant response element (ARE) at -431 to -42042 (blue bar in
Figure 3.1). The basal promoter is on the edge of a large CpG island that covers most of
the ABCG2 proximal promoter (green bar in Figure 3.1). Hypomethylation of the ABCG2
CpG island is a factor in the increased expression levels of ABCG2 during development
of drug resistance in both cell lines and human tumor cells43–46.
Genetic polymorphisms in the proximal promoter of transporter genes have been
linked to variation in gene expression47–50. Additionally, genetic variations in promoters
for other pharmacogenes have been linked to adverse drug reactions51–55. The general
function of the basal ABCG2 promoter has been previously identified29; however no
further research has been done looking at genetic variation in the ABCG2 promoter and
its effect on the basal activity of the promoter.

168
In the present study, the basal activity of the major ABCG2 promoter (-499 to +21 bp
relative to the TSS) was investigated in transiently transfected kidney (HEK293T), liver
(HepG2), intestine (HCT116) and breast (MCF-7) cell lines. The activity of twelve
variant ABCG2 promoter constructs was characterized in these same cell lines to identify
SNPs that alter ABCG2 promoter activity. Furthermore, SNPs that caused significant in
vitro decreases in ABCG2 promoter activity were tested in the mouse hydrodynamic tail
vein assay for their effect on in vivo promoter activity. The functional significance of
these SNPs was investigated by predicting changes in TFBS using in silico TFBS
modeling. In some cases, preliminary support for the binding of these TFBS to the
ABCG2 promoter was obtained from the public chromatin immunoprecipitation with
parallel sequencing (ChIP-seq) database ENCODE.

169

170
Figure 3.1. Schematic of the ABCG2 promoter region. From top to bottom: the
genomic coordinates (chr4:89079997-89080517; hg19) followed by black boxes
indicating where basal transcription factors have been reported to bind29. The
transcriptional start site is indicated by a black box labeled TSS. The colored boxes
indicate where nuclear response elements for aryl hydrocarbon36 (purple), antioxidant42
(blue), estrogen39 (pink), hypoxia41 (red), NF-κB40 (orange) and progesterone38
(turquoise) receptors have been reported to bind. Below this is ChIP-seq data from
ENCODE with each TF on its own line followed by a bar, with the length indicating the
breadth of the peak and the shading indicating its strength. Each bar is followed by letters
to indicate the cell line the signal was found in: K, K562; H, HeLa-S3; L, HepG2; a,
A549; p, PAC-1; m, MCF-7. This is followed by a green bar depicting a CpG island
covering almost the entire basal promoter. Below the CpG island are seven additional
peaks from ENCODE ChIP-seq data. The first five grey bars are for USF-1, with peaks
17185 and 18491 in H1-hESC cells, peak 17246 in K562 cells, peak 28669 in HepG2
cells and peak 9358 in ECC1 cells. The last two peaks are for cMyc in K562 and HepG2
cells. Finally, the location and rs number for single nucleotide polymorphisms (SNP)
reported in dbSNP 135 are indicated.
3.3. Materials and Methods
3.3.1. Chemicals and Materials
The vectors pGL4.11b [luc2P], pGL4.74 [hRluc/TK], pGL4.13 [luc2/SV40], the
Dual-Luciferase® Reporter Assay System and HB101 competent cells were all purchased
from Promega (Madison, WI). The human embryonic kidney (HEK293T/17), human
171
colorectal carcinoma (HCT116), human hepatocellular carcinoma (HepG2) and human
breast adenocarcinoma (MCF-7) cell lines were all purchased from the American Type
Culture Collection (ATCC, Manassas, VA). The One Shot INV110 dcm-/dam- competent
cells, high-glucose Dulbecco’s modified Eagle’s medium (DMEM), Opti-Minimal
Essential Medium (Opti-MEM) and Lipofectamine 2000 were all purchased from
Invitrogen (Carlsbad, CA). The 100 mm LB Amp-100 agar plates and LB Broth
supplemented with 100 μg/mL ampicilin were purchased from Teknova (Hollister, CA).
DMSO, phosphate buffered saline (PBS), 0.05% trypsin and 100X penicillin and
streptomycin were all purchased from the UCSF Cell Culture Facility (San Francisco,
CA). The GeneJet PCR Purification Kits, GeneJET Gel Purification Kits and GeneJet
Plasmid Miniprep Kits were all purchased from Fermentas (Glen Burnie, MD). High-
Fidelity Phusion Buffer, Phusion High-Fidelity DNA Polymerase, bovine serum albumin
(BSA), Buffer 2, NheI, HindIII, T4 Ligase, Ligase buffer, DpnI, DpnI digestion buffer,
antarctic phosphatase and 10 mM ATP were all purchased from New England Biolabs
(Ipswich, MA). Endotoxin-Free Maxiprep Kits and placental genomic DNA were
purchased from Sigma Aldrich (St. Louis, MO). All other materials including10% fetal
bovine serum (FBS) (Axenia BioLogix, Dixon, CA), GenElute HP Improved Minimum
Essential Medium (IMEM) without phenol red (Mediatech Inc, Manassas, VA),
PolyJet™ DNA In Vitro Transfection Reagent (SignaGen Laboratories, Rockville, MD),
PfuTurbo DNA Polymerase (Agilent Technologies, Santa Clara, CA) and dNTPs
(Denville, Metuchen, NJ) were all purchased from the indicated manufacturers.
172
3.3.2. ABCG2 Promoter Plasmid Construction
A 524 bp region of the ABCG2 promoter (chr4:89079995-89080518, hg19) was
targeted for PCR amplification using the forward primer
5’-TCAGGCTAGCAAGCATCCACTTTCTCAGA-3’ and reverse primer
5’-TTATAAGCTTCAGGCAGCGCTGACACGAA-3’. This region was selected as it
includes the proximal promoter (-312 bp upstream of the TSS)29, adjacent TF response
elements including the antioxidant response element (ARE) at -431 to -42042 and the
CpG island that extends to ~500 bp upstream of the TSS29. The core of the primers were
designed using the Primer3 program56 and the sequences for restriction sites NheI and
HindIII were added to the forward and reverse primers, respectively (underlined in above
sequences). Primers were synthesized by Integrated DNA Technologies (San Diego, CA).
The UCSC genome browser’s in silico PCR program was used to confirm predicted
specific amplification of the target region with the selected primer set. The region was
amplified from human placenta genomic DNA using 1 unit PfuTurbo DNA polymerase,
1X PfuTurbo buffer, 200 μM dNTPs, 150 ng genomic DNA, 400 nM of each primer, and
1 μL DMSO in a final reaction volume of 50 μL. PCR conditions were 95°C for 2 min,
followed by 35 cycles of 30 sec at 95°C, 30 sec at 60°C and 1 min at 68°C, then a final
extension of 10 min at 72°C. The PCR reaction was imaged on a 1% agarose gel and the
specific band at 542 bp was gel purified using the GeneJet Gel Purification Kit following
the manufacturer’s protocol. For cloning, the pGL4.11b [luc2P] vector was grown in One
Shot INV110 dcm-/dam- competent cells so methylation would not interfere with enzyme
digestion. The pGL4.11b vector is a promoterless firefly luciferase vector designed to
accept a putative promoter sequence before the luciferase gene. The purified promoter

173
region and the pGL4.11b vector were enzyme digested in a reaction of 1X Buffer 2, 1
unit NheI, 1 unit HindIII and 0.5 μL BSA at 37°C for 1 hr. Vectors were
dephosphorylated using 4 units of antarctic phosphatase at 37°C for 2 hr. The reaction
was purified using the GeneJet PCR Purification Kit following the manufacturer’s
protocol and the concentration of the cleaned DNA was checked using spectrophotometry
(NanoDrop Spectrophotometer, Thermo Scientific).
The amplified ABCG2 promoter region was ligated into the pGL4.11b vector
through a 96:32 fmol insert to vector reaction comprised of the insert and vector plus 1
unit Ligase T4, 1X Ligase Buffer, and 65 nM ATP in a final reaction volume of 20 μL.
The ligation was allowed to sit overnight at room temperature before purification using
the GeneJet PCR Purification kit. A portion of the purified ligation reaction (5 μL) was
transformed into 35 μL HB101 competent cells following the manufacturer’s protocol.
The transformed bacteria was plated onto 100 mm LB Amp-100 plates and grown at
37°C for 24 hr. Selected colonies were grown in 2-5 mL LB Broth with 100 μg/mL
ampicillin at 37°C with shaking for up to 24 hr. DNA was isolated from the bacteria
using a GeneJet Plasmid Miniprep Kit and sequenced with the RVPrimer3 to verify the
presence and orientation of the ABCG2 promoter in the pGL4.11b vector. Colonies
having the promoter in both the forward (positive strand sequence) and reverse (reverse
strand sequence) orientation were isolated. Other vectors used in the transfection assays
include the pGL4.74 [hRluc/TK] vector, which has a Renilla luciferase reporter gene, a
highly active HSV-TK promoter, and is co-transfected into each cell so that the
transfection efficiency can be controlled by the expression of Renilla, and the pGL4.13
[luc2/SV40] vector, which has a luciferase reporter gene and a highly active SV40

174
promoter and is used as a positive control. DNA for the selected promoter plasmids,
empty pGL4.11b [luc2P], pGL4.74 [hRluc/TK] and pGL4.13 [luc2/SV40] vectors were
isolated from transformed bacteria grown in 150 mL LB Broth with 100 μg/mL
ampicillin overnight at 37°C with shaking, using the GenElute HP Endotoxin-Free
Maxiprep Kit following the manufacturer’s protocol. The forward promoter (+) plasmid
was only used for basal promoter activity assays in HEK293T and HepG2 cell lines and
is labeled as the (+) promoter. In all other assays and for site-directed mutagenesis, the
reverse (-) promoter plasmid was used and is termed the ‘reference’ promoter vector.
3.3.3. Genetic Analysis of ABCG2 Promoter Region
SNPs in the ABCG2 promoter region were retrieved for all available ethnic
populations from publicly available databases, including 1000 Genomes (phase 1 release
02/14/2012)57, dbSNP build 135, and HapMap release 2858 and were combined with
those from the SOPHIE cohort reported in the Pharmacogenetics of Membrane
Transporter Database (UCSF, San Francisco, CA). The SOPHIE cohort is a group of 247
ethnically diverse individuals who have donated DNA and are willing to be a part of
future clinical pharmacogenomic studies59. The ABCG2 promoter region from -674 to
+85 bp was sequenced for variants in the SOPHIE cohort. Details regarding the
sequencing of SOPHIE samples for ABCG2 promoter SNPs has already been published48.
Genotypes from 1000 Genomes (phase 1 release 05/21/2011) were used for calculating
haplotypes. Haplotypes were determined by downloading each region’s genotype and
information files from the 1000 Genomes browser for all available ethnic groups

175
combined. Genotype and information files were then loaded into Haploview version 4.260
and haplotypes were determined using all available SNPs.
3.3.4. Site-Directed Mutagenesis
Site-directed mutagenesis (SDM) primers for each of the ABCG2 promoter SNPs
(Table 3.1) were designed using the PrimerX© program and then synthesized by
Integrated DNA Technologies (San Diego, CA). PCR reaction components for all
primers are as follows: 1X High-Fidelity Phusion Buffer, 1 unit Phusion High-Fidelity
DNA Polymerase, 200 nM dNTPs, 1 μM each primer and 100 ng ABCG2 reference
promoter plasmid, all in a final volume of 50 μL. PCR reaction conditions for all primers
except rs139256004 are as follows: An initial cycle for 30 sec at 98°C, followed by 20
cycles of 10 sec at 98°C, melting temperature (varies per primer pair) for 30 sec and 3
min at 72°C, then a final extension for 10 min at 72°C. The SDM PCR reactions were
then digested for at least 20 min at 37°C with 1 unit DpnI enzyme in 1X DpnI digestion
buffer. The reactions were then purified using the GeneJet PCR purification kit per the
manufacturer’s protocol, and 5 μL of the purified SDM reaction was transformed into 35
μL HB101 competent cells. After growing for 24 hr on 100 mm LB Amp-100 agar plates,
colonies were selected for expansion overnight at 37°C with shaking in LB broth
supplemented with 100 μg/mL ampicillin . DNA was then isolated from the bacteria
using the GeneJet Miniprep Kit and the vector was sequenced with the RVPrimer3
primer to confirm the presence of the SNP. Large bacterial preps of the correctly
mutagenized vectors were grown in 150 mL LB broth supplemented with 100 μg/mL
ampicillin overnight at 37°C with shaking and DNA isolated with the GenElute HP

176
Endotoxin-Free Maxiprep Kit per the manufacturer’s protocol. All DNA used for the in
vitro and in vivo luciferase assays were endotoxin-free to avoid the cytotoxic effects of
toxins released from the bacteria during lysis, which also allowed for more reproducible
results.
Table 3.1 ABCG2 Site-Directed Mutagenesis Primers SNP ID Δnt1 Primer Sequence2 Tm3
rs61181041 G>A GAACCCCGAC[T]TGGGGAAAC 58.4 GTTTCCCCA[A]GTCGGGGTTC
rs61535534 C>G CTTTCAGCCG[C]GTCGCAGGG 64 CCCTGCGAC[G]CGGCTGAAAG
rs76656413 C>T GCGGCAGGACA[T]GTGTGCGCTTTC 65.2 GAAAGCGCACAC[A]TGTCCTGCCGC
rs66664036 ->G GGAGGCGGG[G]AGTGTTTGG 61.2 CCAAACACT[C]CCCGCCTCC
rs139256004 GTTA>- TCGTA[-]ATCACTCTGGTTCATTCCGTTC 58.4 GTGAT[-]TACGAGAATCACCAGGCGC 59.9
rs2231134 C>G GACGAGGTACT[C]ATCAGCCCAATG 59.2 CATTGGGCTGAT[G]AGTACCTCGTC
rs45604438 G>A GTGCTTCGG[T]GCTCCGGCC 64.4 GGCCGGAGC[A]CCGAAGCAC
rs36068118 ->C CAGCGTCCCC[C]GGTGCTTCG 65.9 CGAAGCACC[G]GGGGACGCTG
rs58132660 C>T CTTGTGACTG[A]GCAACCTGTG 56.1 CACAGGTTGC[T]CAGTCACAAG
rs142365584 G>C GTGCGAGCAG[G]GCTTGTGAC 61.6 GTCACAAGC[C]CTGCTCGCAC
rs59370292 G>A CTTTCTCAGAAT[T]CCATTCACCAG 53.8 CTGGTGAATGG[A]ATTCTGAGAAAG
rs59172759 A>T CTTTCTCAGAA[A]CCCATTCACCAG 55.9 CTGGTGAATGGG[T]TTCTGAGAAAG 1Change in reference to variant nucleotide of the anti-strand 2Forward and reverse primers per SNP with mutagenized nucleotide in brackets 3Melting temperature used for annealing step of SDM PCR

177
3.3.5. Deletion Mutagenesis PCR Amplification
The deletion SNP rs139256004 was introduced into the ABCG2 promoter using a
special protocol illustrated in Figure 3.2 and previously reported to work for both deletion
and insertion mutatgenesis61. Primers were designed to overlap on their 5’- end so that
the deletion is missing from both primers (see Figure 3.2B) and to ensure that the melting
temperature of the non-overlapping section of the primers was greater than that of the
overlapping section of the primers by 5-10°C. PCR reaction components were the same
as described above with PCR conditions as follows: an initial cycle of 5 min at 95°C,
then 12 cycles of 95°C for 1 min, 45°C for 1 min and 72°C for 9 min, with a final cycle
of 1 min at 36°C and 30 min at 72°C. Promoter SNP rs57327643 was also attempted via
this protocol, but no colonies were successfully isolated.
Figure 3.2. Schematic of mutagenesis protocol for large deletion or insertion
polymorphisms. The PCR amplification protocol (A) and primer design to create the
large deletion (B) or insertion (C) polymorphisms is illustrated. Solid circles represent the

178
parent plasmid and dashed circles represent the amplified plasmid. Arrows indicate
primers and triangles represent the polymorphism. Figure is reproduced from Liu et. al.61.
3.3.6. Cell Culture
HEK293T/17, HCT116 and HepG2 were grown in high-glucose DMEM
supplemented with 10% FBS, 100 units/mL of penicillin and 0.1 mg/mL of streptomycin.
The MCF-7 cell line was grown in IMEM without phenol red, supplemented with 10%
FBS, 100 units/mL of penicillin and 0.1 mg/mL of streptomycin. All cell lines were
grown in a 5% CO2 incubator at 37°C. To maintain cells, they were split upon reaching
confluency by treatment with 0.05% Trypsin-EDTA, washing with 1X PBS and
suspension in fresh media at a 1:5 to 1:20 dilution.
3.3.7. Transient Transfection
The HEK293T/17 (kidney), HepG2 (liver), HCT116 (intestine) and MCF-7
(breast) cell lines were chosen to represent their primary tissue source. For transient
transfections of the HEK293T/17, HepG2 and HCT116 cell lines, cells were seeded at
approximately 1.8 x 10⁴ cells per well of a 96-well plate in fresh DMEM with 10% FBS,
but without antibiotics, and grown for at least 24 hr to 80% confluency. Cells were then
transfected with Lipofectamine 2000 following guidelines suggested in the
manufacturer’s protocol. In short, 0.5 μL of Lipofectamine 2000 was incubated in 25 μL
Opti-MEM for 5 min and then gently mixed with a 25 μL solution of 0.08 μg of the
pGL4.11b [luc2P] plasmids (plus 0.02 μg pGL4.74 [hRluc/TK]) diluted with Opti-MEM.
The DNA-Lipofectamine mixture was allowed to incubate at room temperature for 30

179
min before being placed onto cells with 50 μL of antibiotic-free media. MCF-7 cells were
split with 0.05% Trypsin-EDTA and seeded at ~2.5 x 10⁴ cells per well and transfected
only once they reached 95% confluency with the PolyJet™ DNA In Vitro Transfection
Reagent; transfection efficiency was optimized by following the manufacturer’s
guidelines. Briefly, media on the cells were replaced with 100 μL fresh IMEM
(supplemented with FBS and antibiotics as above) 30 min before transfection. A mix of
75 ng ABCG2 plasmid and 25 ng of pGL4.74 [hRluc/TK], to control for transfection
efficiency, was diluted to 5 μL with IMEM supplemented with 10% FBS (no antibiotics).
A 0.4 μL aliquot of PolyJet was diluted to 5 μL with IMEM supplemented with 10% FBS
(no antibiotics) and then immediately added to the DNA mix with gentle mixing. The
PolyJet/DNA mix was allowed to incubate at room temperature for 15 min before being
added to the cells. All cell lines were incubated with their transfection agents for 18-24 hr
before assaying.
3.3.8. Luciferase Reporter Assay
The day after transfection, each well was washed with 100 μL 1X PBS before
being lysed with 50 μL of 1X passive lysis buffer for 1 hr with shaking. Then 20 μL of
HEK293T/17 or 30 μL of HepG2, HCT116 and MCF-7 lysates were measured for firefly
and Renilla luciferase activity using 70 μL each of the Luciferase Assay Reagent II and
Stop & Glo® reagents from the Dual-Luciferase® Reporter Assay System in a GloMax 96
microplate Dual Injector Luminometer. The firefly activity was normalized to the Renilla
activity per well to control for transfection efficiency. Each experiment also included the
empty pGL4.11b vector as the negative control and the pGL4.13 [luc2/SV40] vector as

180
the positive control. The promoter activity for each plasmid was calculated as the ratio of
the normalized firefly activity to that of the empty vector.
3.3.9. Hydrodynamic Tail Vein Assay
Positive in vitro variant enhancer elements were screened for their effect on in
vivo liver enhancer activity through the hydrodynamic tail vein injection62 adapted for
enhancer element screening63 (see Chapter 4, Figure 4.10). Each variant enhancer, along
with their reference enhancer plasmid, was injected into the tail vein of 4-5 mice using
the TransIT EE In Vivo Gene Delivery System following the manufacturer’s protocol.
Briefly, 10 μg of pGL4.23 [luc2/minP] vector with or without enhancer element, or the
ApoE64 positive control liver enhancer, along with 2 μg of pGL4.74 [hRluc/TK] were
injected into the tail vein of CD1 mice (Charles River Laboratory). After 24 hr, mice
were euthanized and livers from the mice were harvested. Each liver was homogenized in
3 mL of 1X Promega Passive Lysis Buffer and then centrifuged at 4°C for 30 min at
14,000 rpm. The supernatant was then diluted 1:20 with additional lysis buffer and
measured for firefly and Renilla luciferase activity using the Dual-luciferase® reporter
assay system according to the manufacturer’s protocol in a Synergy 2 (BioTek
Instruments, Winooski, VT) microplate reader. Each mouse liver lysate was read in
replicate 3-6 times, with each sample’s firefly activity normalized to the Renilla activity
and then averaged across the replicates. Average normalized luciferase activity is
expressed as the mean of 4-5 mice. Enhancer or ApoE normalized luciferase activity was
then compared to the empty pGL4.23 vector activity and expressed as fold activation

181
relative to pGL4.23. All mouse work was done following a protocol approved by the
UCSF Institutional Animal Care and Use Committee.
3.3.10. Predictions of Transcription Factor Binding Site Changes
Two separate computation tools were used to predict differences in the binding
probability of TFs between reference and variant promoter sequences. First, the Consite65
program, which directly compares the transcription factor binding sites (TFBS) shared
between two aligned genomic sequences. For this analysis, promoter reference and
variant sequences were extracted from UCSC genome browser (hg19) and imputed as
orthologous pairs of genomic sequences. The regions were scanned for vertebrate TFs
provided by the program, with a minimum specificity of 10 bits. With no conservation
cut off, the TF score threshold was set to 70% and TFs with greater than 20% change in
binding probability were extracted. The second computation tool was the TRANSFAC
Match program66. Individually, the genomic sequence of the reference and variant
promoters were scanned for the probability of TF binding using the TRANSFAC release
2012.2 matrix table of all non-redundant vertebrate TFs. Parameters were set to select
only high quality matrices and to minimize false positives. The probabilities for TF
binding of enhancer and reference promoters were compiled and those that altered TF
binding were extracted. Consite and TRANSFAC also provided alignments of the
consensus TF matrix sequence with that of the reference and variant promoter sequences.
We compared any alterations in TFBS with that of ChIP-seq validated TF binding sites
through the RegulomeDB67 database.

182
3.3.11. Statistical Analysis
Promoter activity was expressed relative to the empty vector (as described above).
Results for each transfection, with 3-16 wells per plasmid in each transfection, were
combined for each cell line and analyzed by an ANOVA followed by a Bonferroni’s
multiple comparison t-test. A representative experiment (n=6-16 wells per plasmid) is
shown for each cell line. Basal forward and reverse promoter activity in the HEK293T
and HepG2 cell lines was considered to be statistically significant from the empty
pGL4.11b vector if the ANOVA analysis followed by a Bonferroni’s multiple
comparison t-test had a P < 0.05. Basal promoter activity in the HCT116 and MCF-7 cell
lines was considered to be statistically significant from the empty pGL4.11b vector when
P < 0.05 using a Student’s t-test. Variant promoter plasmids tested in vitro or in vivo
were compared to the reference ABCG2 promoter by an ANOVA analysis followed by a
Bonferroni’s multiple comparison t-test. Variant ABCG2 promoter sequences identified
for in vivo testing were significantly different (P < 0.05) from the reference promoter in
three of four cell lines. In the in vivo experiments, the reference sequence and ApoE
controls were tested for difference from the empty vector sequence using an unpaired
Students’s t-test. All statistics were run using the GraphPad Prism 5 program.
3.4. Results
3.4.1. Genetic Polymorphisms of the ABCG2 Promoter
A total of 13 SNPs were obtained for the ABCG2 promoter region from publicly
available databases and from the SOPHIE cohort, and are displayed in Table 3.2. Of the
13 SNPs, rs57327643, rs66664036, rs2231134, rs45604438 and rs59172759 had MAF

183
above 4% in at least one of the ethnic populations (Table 3.2). The ABCG2 promoter
SNPs included two single nucleotide insertions, rs66664036 and rs36068118. There were
also two multiple base pair deletions, rs57327643 and rs139256004. Attempts to
construct the rs57327643 variant promoter plasmid were unsuccessful and this SNP was
not evaluated in the functional assays. Variant promoter plasmids for all other SNPs in
Table 3.2 were successfully made and tested for their luciferase activity relative to
reference in four cell lines. There was no notable linkage disequilibrium between SNPs in
the ABCG2 promoter (data not shown).
Table 3.2 ABCG2 Promoter SNPs
SNP ID Position1 Δnt MAF (%)2 AA CA AS ME
rs61181041 -84 G>A 0.00 0.00 0.80 0.00 rs61535534 -151 C>G 0.00 0.00 0.00 0.80 rs76656413 -169 C>T 0.00 0.00 1.00 0.00 rs57327643 -266 AGTGTTT>- 3.80 4.20 0.00 4.70 rs66664036 -267 ->G nr 6.00 nr nr rs139256004 -267 GTTA>- nr nr nr nr rs2231134 -307 C>G 2.50 6.50 0.00 6.00 rs45604438 -340 G>A 7.50 0.00 0.00 1.70 rs36068118 -390 ->C nr nr nr nr rs58132660 -400 C>T 0.00 0.00 0.00 0.90 rs142365584 -424 G>C 0.00 0.00 0.00 0.30 rs59370292 -435 G>A 0.00 0.00 0.80 0.00 rs59172759 -483 A>T 4.20 0.00 0.00 0.00
1SNP position is noted relative to the transcriptional start site 2Minor allele frequency (MAF) for African American (AA), Caucasian (CA), Asian (AS) and Mexican (ME) populations
Abbreviations: nr, not reported

184
3.4.2. Basal Activity of the ABCG2 Promoter In Vitro
The baseline activity of the reverse and forward strand ABCG2 promoter sequence
(chr4:89079947-89080567, hg19), cloned into the firefly luciferase reporter vector
pGL4.11b, was investigated in transiently transfected HEK293T and HepG2 cell lines,
while the reverse strand promoter plasmids were screened in the HCT116 and MCF-7
cell lines (Figure 3.3). This region includes the basal promoter of ABCG2 (previously
reported) and the structural elements displayed in Figure 3.1. The promoter drives
expression of the firefly luciferase gene, and firefly luciferase activity is used as a marker
of promoter activity. In both HEK293T and HepG2 cell lines, the forward and reverse
orientation promoter plasmids exhibited an increased promoter activity (P < 0.05) when
compared to pGL4.11b empty vector (Figure 3.3). The reverse ABCG2 promoter activity
was strongest in the HEK293T and HCT116 cell lines, with average activation of 15- and
14-fold, respectively; in the HepG2 and MCF-7 cell lines promoter activity was weaker,
with average activation of 4- and 1.5- fold, respectively (Figure 3.3). The forward
ABCG2 promoter sequence exhibited the same promoter activity as the reverse ABCG2
promoter sequence in the HepG2 and HEK293T cell lines (Figure 3.3).

185
Figure 3.3. Basal ABCG2 promoter activity in vitro. Luciferase activity of the forward
(checkered) and reverse (solid grey) reference promoter was measured in transiently
transfected liver (HepG2) and kidney (HEK293T) cell lines, while the reverse reference
promoter was also measured in the intestine (HCT116) and breast (MCF-7) cell lines.
Promoter activity is expressed as the ratio of the normalized firefly to Renilla luciferase
activity relative to the empty vector (pGL4.11b) activity. Data is expressed as the mean
± SEM from a representative experiment (n=16 wells per construct). Differences between
reference and empty vector, and forward and reverse promoter constructs, were tested by
an ANOVA followed by a post-hoc Bonferroni’s multiple comparison test (HEK293T
and HepG2 cells) or a Student’s t-test (HCT116 and MCF-7 cells) for difference between
reference and empty vector; *** P < 0.0001.

186
3.4.3. Effect of SNPs on Basal ABCG2 Promoter Activity In Vitro
The effect of twelve SNPs on the basal ABCG2 promoter activity was investigated
by transient transfections of HEK293T, HepG2, HCT116 and MCF-7 cell lines with the
reference and variant ABCG2 promoter plasmids. Two SNPs had significantly decreased
promoter activity in HepG2 cells (Figure 3.4A); rs76656413 and rs66664036 had a 50%
decrease in promoter activity relative to the reference promoter. Five SNPs had
significantly decreased promoter activity in HEK293T cells (Figure 3.4B). Three of them
(rs61181041, rs139258004 and rs2231134) had a 25% decrease in activity relative to
reference, while the other two (rs59370292 and rs76656413) had over a 50% decrease in
promoter activity relative to the reference promoter. In HCT116 cells, six SNPs had
decreased activity relative to the reference promoter including a 25% decrease with SNPs
rs61181041, rs66664036 and rs142365584, a 50% decrease with rs76656413 and
rs139256004, and over a 75% decrease with rs59370292 (Figure 3.4C). Finally in the
MCF-7 cells, four SNPs (rs76656413, rs66664036, rs139256004 and rs59370292) have a
50% decrease relative to reference promoter (Figure 3.4D). Both the rs66664036 and
rs139256004 SNPs had 25-50% decreased promoter activity relative to reference in three
of the four cell lines (Figure 3.4). The rs76656413 SNP had over a 50% decreased
promoter activity in all four of the cell lines (Figure 3.4). The rs59370292 SNP was the
most detrimental SNP in both HepG2 (Figure 3.4A) and HCT116 (Figure 3.4C) cell lines
with an almost 75% decreased promoter activity; it also had a 50% decrease in promoter
activity in MCF-7 (Figure 3.4D) cells. Due to their decreased promoter activity in at least
three of four cell lines, rs66664036, rs139256004, rs76656413 and rs59370292 were
chosen for follow up in the in vivo hydrodynamic tail vein injection assay.
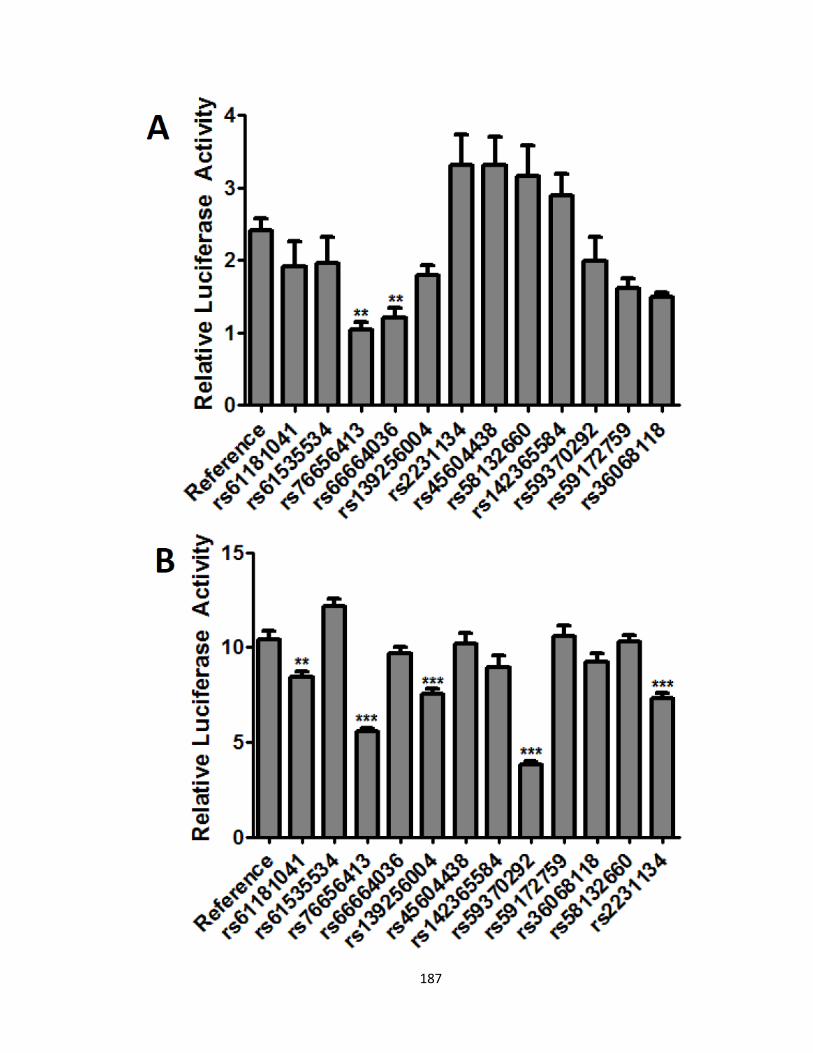
187

188

189
Figure 3.4. Effect of promoter variants in vitro. Luciferase assay of ABCG2 reference
and variant promoter sequences was measured in transiently transfected A) liver
(HepG2), B) kidney (HEK293T), C) intestine (HCT116) and D) breast (MCF-7) cell
lines. Promoter activity is expressed as the ratio of the normalized firefly to Renilla
luciferase activity relative to the empty vector (pGL4.11b) activity. Data is expressed as
the mean ± SEM from a representative experiment (N = 6-12 wells per construct).
Differences between reference and variant promoter constructs were tested by an
ANOVA followed by a post-hoc Bonferroni’s Multiple Comparison t-test; *** P <
0.0001, ** P < 0.001, * P < 0.05.
3.4.4. Effect of SNPs on Basal ABCG2 Promoter Activity In Vivo
Four SNPs were screened for their effect on in vivo liver enhancers using the
hydrodynamic tail vein injection assay. In this assay, we used the ApoE liver enhancer
positive control, which had more than 200-fold activation over empty vector (pGL4.11b).
The ABCG2 promoter construct exhibited a strong 35-fold activation over empty
pGL4.11b. Two of the four promoter SNPs screened showed a significant decrease in
promoter activity in vivo (Figure 3.5). The rs59370292 SNP had the largest decrease in
activity, with over 80% decrease in promoter activity, while the rs76656413 resulted in a
70% decrease in promoter activity in vivo. After multiple comparison adjustment,
rs66664036 showed a trend toward significance (p=0.078) and reduced promoter activity
by 50%. The in vivo and in vitro fold activities, relative to empty vector, for the five
ABCG2 promoter variants tested in vivo are shown in Table 3.3.

190
Promoter
(-)
rs766
5641
3
rs666
6403
6
rs139
2560
04
rs593
7029
2ApoE
0
10
20
30
40
50200
225
250
****
**
***R
elat
ive
Luci
fera
se A
ctiv
ity
Figure 3.5. Effect of promoter variants in vivo. The luciferase activity in mouse liver
homogenates was measured 24 hr after plasmid injection. Promoter activity is expressed
as the ratio of firefly to Renilla luciferase activity normalized to the empty vector
(pGL4.11b) activity. SNPs are displayed respective to their genomic orientation. Data is
expressed as the mean ± SEM for 4-5 mice. Differences between reference promoter or
ApoE and empty vector were tested by an unpaired Student’s t-test, and reference and
variant promoter sequences were compared using a one-way ANOVA followed by a
Bonferroni’s multiple comparison t-test; ** P < 0.001.

191
Table 3.3. ABCG2 Promoter Variants In Vitro and In Vivo Activity
Genotype Relative Fold Activation
HEK293T HepG2 HCT116 MCF-7 In Vivo Reference 10.40 2.42 16.74 1.60 35.36
rs76656413 5.59 *** 1.04 ** 13.14 *** 0.71 ** 9.99 ** rs66664036 9.70 ns 1.21 ** 9.31 *** 0.71 ** 17.60 ns rs139256004 7.52 *** 1.80 ns 17.88 *** 0.80 * 37.79 ns rs59370292 3.81 *** 1.99 ns 5.28 *** 0.75 ** 6.37 ** * P <0.05; ** P < 0.001; *** P < 0.0001; ns, not significant
3.4.5. Effect of SNPs on Predicted Binding of TFs in the ABCG2 Promoter
To investigate the mechanism for decreased ABCG2 promoter activity associated
with some of the SNPs, TFBS predictions were made on both reference and promoter
sequences using ConSite and TRANSFAC Match programs. Predicted probability score
changes from ConSite are shown in Figure 3.6 and Figure 3.7 sections A and B, while
any TRANSFAC predicted losses and gains in TF binding sites are shown in sections C
and D of the figures. rs76656413 caused a 41% gain in the binding probability score for
p53 and binding probability score losses for Myc-Max (33%), USF (37%), n-Myc (37%)
and Max (98%) (Figure 3.6A and B). The predicted loss of Myc-Max binding was
corroborated by TRANSFAC (Figure 3.6C), which predicted no probable binding of
Myc-Max (>0.7) to the variant sequence. rs59370292 had predicted gains in TF binding
probability scores for p65 (20%), Pax-4 (24%), Chop-cEBP (47%) and c-REL (50%), as
well as decreases in the binding probability scores for RREB-1 (34%) and RXR-VDR
(38%) (Figure 3.7 A and B). The RegulomeDB67 database also predicted that rs59370292
is likely to affect TF binding and provides evidence for the binding of GATA1, STAT1
and STAT5A to this region (data not shown).

192
Figure 3.6. Predicted TFBS for rs76656413. The TFBS predicted by (A, B) Consite
aligned with reference and SNP sequences that are lost (above alignment) or gained
(below alignment) and the corresponding binding probability scores (B) for the reference
(blue) and SNP (red) sequences. The absolute change in binding probability scores for
each TF, between reference and variant sequences, are indicated as a Δ value. TFBS
changes as determined by (C) TRANSFAC, showing sequence alignments of TFBS that
are lost.

193
Figure 3.7. Predicted TFBS for rs59370292. The TFBS predicted by (A, B) Consite
aligned with reference and SNP sequences that are lost (above alignment) or gained
(below alignment) and the corresponding binding probability scores (B) for the reference
(blue) and SNP (red) sequences. The absolute change in binding probability scores for
each TF, between reference and variant sequences, are indicated as a Δ value.

194
3.5. Discussion
The results of this study indicate that the ABCG2 promoter is highly active in the
intestinal HCT116 and liver HepG2 cell lines, has medium activity in the kidney
HEK293T cell line and low but detectable activity in the breast MCF-7 cell line. It also
had a strong in vivo liver activity. These results correlate with the high expression of
ABCG2 in intestine and liver and more moderate expression of ABCG2 in kidney5. In
contrast, the low promoter activity in the MCF-7 cells is not consistent with the high
expression of ABCG2 in breast tissue5. Previously, luciferase assays on the -628/+362
ABCG2 promoter segment indicated suppressed activity in MCF-7 cells, whereas the
-312/+362 promoter segment was highly active. It is possible that a suppressor element
within the -499 to -312 segment reduces the activity of our ABCG2 promoter construct in
MCF-7 cells29. Recently, an interferon-gamma activated sequence (GAS) at -448/-422
was shown to increase the ABCG2 promoter activity upon stimulation of the
JAK2/STAT5 pathway by prolactin68. This overlaps with the antioxidant response
element stimulated by Nrf2 in stem cells42. STAT5 is well documented for its importance
in regulating expression of genes essential for mammary development and lactogenesis69.
Naturally occurring dominant-negative isoforms of STAT5 have also been shown to
suppress the transcriptional activity of the estrogen receptor (ER) in MCF-7 cells70.
Although the MCF-7 cell line does express the ER, previous research has shown
discordant results in the ability of the ABCG2 promoter to be upregulated in cell lines
with ER expression when treated with 17β-estradiol71,72. Therefore, it is possible that
without stimulation of the STAT5 pathways, there is a suppressive factor bound between
-499 and -312 of the ABCG2 promoter in MCF-7 cells that inhibits promoter activity.

195
This indicates a fragile and complex network of TFs that bind to the ABCG2 promoter
and regulate its expression specific to each cell line and tissue.
Similar to promoter SNPs in other pharmacogenes47–50, several of the ABCG2
promoter SNPs affect the activity of the ABCG2 promoter in vitro and in vivo through the
predicted alteration of TF binding. Although four SNPs in the ABCG2 promoter altered
promoter activity in vitro, all except rs66664036 have reported low minor allele
frequencies. This is in concordance with a large analysis of ABC and SLC gene promoter
variation that found the proximal promoters of these gene families had low nucleotide
diversity48. Therefore, when present, these SNPs could have effects on the expression
levels of ABCG2, but due to their low frequency may not contribute significantly to the
wide variability in ABCG2 expression. Also, due to the low frequency of these SNPs, we
were unable to correlate them with the expression of ABCG2 in tissue samples (data not
shown). Further research is needed to successfully associate these SNPs with the
expression of ABCG2 and the function of the MXR transporter.
Of the four SNPs identified in the in vitro screen, two were confirmed to have a
significantly decreased in vivo activity, while one more SNP’s drop in activity showed a
trend toward significance. There was no cell line whose pattern of SNPs’ activity was
comparable to, or could be used to predict, in vivo activity. Therefore, a combination of
cell lines is necessary for future screens in order to identify SNPs that would also be
positive in vivo. This is consistent with the use of multiple cell lines in other transporter
promoter SNP assays49. Overall, the in vitro activity of ABCG2 promoter SNPs in four
cell lines was an adequate predictor of the SNPs’ activity in vivo.
196
The ABCG2 promoter SNP rs76656413 has strong evidence for altering the
transcriptional activity of the ABCG2 promoter. It was able to attenuate the relative
luciferase activity of the ABCG2 promoter by 50% in all four cells lines and decreased
ABCG2 liver promoter activity by 70% in vivo. It was also predicted to have large losses
in USF-1, n-Myc, Max and Myc-Max binding, as predicted by multiple TFBS analysis
programs. The USF and Myc-Max TFs are all reported to bind to the same canonical E-
box sequence73. The rs76656413 lies in the middle of several reported ChIP-seq peaks for
USF-1 and c-Myc. Additionally, c-Myc has been reported to direct the transcriptional
regulation of ABC genes, particularly the unmethylated ABCG2 promoter, in human
leukemic hematopoietic progenitor cells74. Furthermore, the expression of ABCG2 was
altered by the overexpression of c-Myc in human breast epithelial cells75. Since the USF-
1 and c-Myc transcription factors bind to the ABCG2 promoter in several cell types, it is
possible that the rs76656413 SNP is able to disrupt this binding and alter the
transcriptional activity of the ABCG2 promoter.
The ABCG2 promoter SNP rs66664036 significantly decreased the relative
luciferase activity of the ABCG2 promoter in three of the four cell lines tested by 35 to
50% and trended towards significant with altering the liver in vivo activity by 50%. It was
predicted to reduce binding of the AP-1 TF to the ABCG2 promoter (data not shown).
There are both AP-1 and AP-2 predicted sites in the ABCG2 promoter, and ChIP-seq
evidence from ENCODE for the binding of the AP-2γ TF over the rs66664036 SNP. AP-
1 is a TF shown to regulate both basal and inducible transcription of target genes76,77.
Previously it was shown that ER works in concert with AP-1 and Sp1 to activate its target
genes78, and promoters with Sp1 and AP-1 sites had substantially more modulation of

197
activity with estrogen treatment79. Additionally, AP-1 physically interacts with ERβ to
modulate the transcription of genes upon treatment with estrogen80. We have done further
experiments on the reference and variant promoter plasmids to show that rs66664036
increased response to 17β-estradiol treatment compared to the reference promoter (see
Chapter 6, Figure 6.4). It is possible that the rs6666403 SNP alters the basal
transcriptional activity of the ABCG2 promoter through reduced binding of the AP-1 TF,
but does not alter the inducible activity of the ABCG2 promoter by 17β-estradiol. Further
experiments are necessary to test this hypothesis.
The ABCG2 promoter SNP rs59370292 has the lowest reported minor allele
frequencies of the four SNPs that alter in vitro ABCG2 promoter activity. The
rs59370292 SNP is just upstream of the antioxidant response element in the ABCG2
promoter. It altered the relative luciferase activity of the ABCG2 promoter in three of four
cell lines and had the largest effect of any ABCG2 promoter SNP in vivo, decreasing the
promoter activity by 80%. The top TF predicted to have reduced binding due to
rs139256004 is the vitamin D receptor (VDR). We could not find evidence for binding of
this TFs to the ABCG2 promoter in ChIP-seq databases or for the regulation of ABCG2
by VDR. However, the genomic binding locations of VDR are not yet in the publicly
available ChIP-seq databases. Although VDR has not been directly linked to ABCG2,
VDR is important in regulating bile acid transporters, and its ligands include bile acid
derivatives and steroids81,82. Since ABCG2 encodes a bile acid transporter83 and has been
shown to be important for the pharmacokinetics and pharmacodynamics of statins84,
VDR could be the link for statin regulation of ABCG2 expression. However, further

198
studies are needed to determine if VDR binding to the proximal promoter of ABCG2 is
involved in ABCG2 transcription.
3.6. Conclusions
The basal promoter of ABCG2 from -499 to +21 has strong activity in HepG2,
HCT116 and HEK293T cell lines; it has low activity in the MCF-7 cell line. The
rs76656413 and rs59370292 SNPs within the basal promoter of ABCG2 affect its
function both in vitro and in vivo. Additionally, these SNPs are predicted to alter TFBS
relevant to the transcriptional regulation of ABCG2. Taken together, these SNPs could
account for some of the reported variability of ABCG2 expression in liver and intestine.

199
3.7. References
(1) Ni, Z.; Bikadi, Z.; Rosenberg, M. F.; Mao, Q. Structure and function of the human breast cancer resistance protein (BCRP/ABCG2). Current drug metabolism 2010, 11, 603.
(2) Abbott, B. L. ABCG2 (BCRP): a cytoprotectant in normal and malignant stem cells. Clinical advances in hematology & oncology : H&O 2006, 4, 63–72.
(3) Hirschmann-Jax, C.; Foster, a E.; Wulf, G. G.; Nuchtern, J. G.; Jax, T. W.; Gobel, U.; Goodell, M. a; Brenner, M. K. A distinct “side population” of cells with high drug efflux capacity in human tumor cells. Proceedings of the National Academy of Sciences of the United States of America 2004, 101, 14228–33.
(4) Zhou, S.; Schuetz, J. D.; Bunting, K. D.; Colapietro, a M.; Sampath, J.; Morris, J. J.; Lagutina, I.; Grosveld, G. C.; Osawa, M.; Nakauchi, H.; Sorrentino, B. P. The ABC transporter Bcrp1/ABCG2 is expressed in a wide variety of stem cells and is a molecular determinant of the side-population phenotype. Nature medicine 2001, 7, 1028–34.
(5) Maliepaard, M.; Scheffer, G. L.; Faneyte, I. F.; Gastelen, A. Van; Pijnenborg, A. C. L. M. Subcellular Localization and Distribution of the Breast Cancer Resistance Protein Transporter in Normal Human Tissues Subcellular Localization and Distribution of the Breast Cancer Resistance Protein Transporter in Normal Human Tissues 1. 2001, 3458–3464.
(6) Cooray, H. C.; Blackmore, C. G.; Maskell, L.; Barrand, M. a Localisation of breast cancer resistance protein in microvessel endothelium of human brain. Neuroreport 2002, 13, 2059–63.
(7) Doyle, L. A.; Ross, D. D. Multidrug resistance mediated by the breast cancer resistance protein BCRP (ABCG2). Oncogene 2003, 22, 7340–58.
(8) Doyle, L. a; Yang, W.; Abruzzo, L. V; Krogmann, T.; Gao, Y.; Rishi, a K.; Ross, D. D. A multidrug resistance transporter from human MCF-7 breast cancer cells. Proceedings of the National Academy of Sciences of the United States of America 1998, 95, 15665–70.
(9) Fetsch, P. a; Abati, A.; Litman, T.; Morisaki, K.; Honjo, Y.; Mittal, K.; Bates, S. E. Localization of the ABCG2 mitoxantrone resistance-associated protein in normal tissues. Cancer letters 2006, 235, 84–92.
(10) Allikmets, R.; Schriml, L. M.; Hutchinson, A.; Romano-Spica, V.; Dean, M. A human placenta-specific ATP-binding cassette gene (ABCP) on chromosome 4q22 that is involved in multidrug resistance. Cancer research 1998, 58, 5337–9.

200
(11) Mao, Q. BCRP/ABCG2 in the placenta: expression, function and regulation. Pharmaceutical research 2008, 25, 1244–55.
(12) Kobayashi, D.; Ieiri, I.; Hirota, T.; Takane, H. Functional assessment of ABCG2 (BCRP) gene polymorphisms to protein expression in human placenta. Drug metabolism and 2005, 33, 94–101.
(13) Yeboah, D.; Sun, M.; Kingdom, J.; Baczyk, D.; Lye, S. J.; Matthews, S. G.; Gibb, W. Expression of breast cancer resistance protein ( BCRP / ABCG2 ) in human placenta throughout gestation and at term before and after labor. 2006, 1258, 1251–1258.
(14) Leslie, E. M.; Deeley, R. G.; Cole, S. P. C. Multidrug resistance proteins: role of P-glycoprotein, MRP1, MRP2, and BCRP (ABCG2) in tissue defense. Toxicology and applied pharmacology 2005, 204, 216–37.
(15) Poonkuzhali, B.; Lamba, J.; Strom, S. Association of breast cancer resistance protein/ABCG2 phenotypes and novel promoter and intron 1 single nucleotide polymorphisms. Drug Metabolism and … 2008, 36, 780–795.
(16) Ross, D. D.; Karp, J. E.; Chen, T. T.; Doyle, L. A. Expression of breast cancer resistance protein in blast cells from patients with acute leukemia. Blood 2000, 96, 365–8.
(17) Urquhart, B. L.; Ware, J. a; Tirona, R. G.; Ho, R. H.; Leake, B. F.; Schwarz, U. I.; Zaher, H.; Palandra, J.; Gregor, J. C.; Dresser, G. K.; Kim, R. B. Breast cancer resistance protein (ABCG2) and drug disposition: intestinal expression, polymorphisms and sulfasalazine as an in vivo probe. Pharmacogenetics and genomics 2008, 18, 439–48.
(18) Zamber, C. P.; Lamba, J. K.; Yasuda, K.; Farnum, J.; Thummel, K.; Schuetz, J. D.; Schuetz, E. G. Natural allelic variants of breast cancer resistance protein (BCRP) and their relationship to BCRP expression in human intestine. Pharmacogenetics 2003, 13, 19–28.
(19) Suvannasankha, a; Minderman, H.; O’Loughlin, K. L.; Nakanishi, T.; Greco, W. R.; Ross, D. D.; Baer, M. R. Breast cancer resistance protein (BCRP/MXR/ABCG2) in acute myeloid leukemia: discordance between expression and function. Leukemia : official journal of the Leukemia Society of America, Leukemia Research Fund, U.K 2004, 18, 1252–7.
(20) Suvannasankha, A.; Minderman, H.; O’Loughlin, K. L.; Nakanishi, T.; Ford, L. a; Greco, W. R.; Wetzler, M.; Ross, D. D.; Baer, M. R. Breast cancer resistance protein (BCRP/MXR/ABCG2) in adult acute lymphoblastic leukaemia: frequent expression and possible correlation with shorter disease-free survival. British journal of haematology 2004, 127, 392–8.

201
(21) Benderra, Z.; Faussat, A.-M.; Sayada, L.; Perrot, J.-Y.; Chaoui, D.; Marie, J.-P.; Legrand, O. Breast cancer resistance protein and P-glycoprotein in 149 adult acute myeloid leukemias. Clinical cancer research : an official journal of the American Association for Cancer Research 2004, 10, 7896–902.
(22) Tsunoda, S.; Okumura, T.; Ito, T.; Kondo, K.; Ortiz, C.; Tanaka, E.; Watanabe, G.; Itami, A.; Sakai, Y.; Shimada, Y. ABCG2 expression is an independent unfavorable prognostic factor in esophageal squamous cell carcinoma. Oncology 2006, 71, 251–8.
(23) Usuda, J.; Tsunoda, Y.; Ichinose, S.; Ishizumi, T.; Ohtani, K.; Maehara, S.; Ono, S.; Tsutsui, H.; Ohira, T.; Okunaka, T.; Furukawa, K.; Sugimoto, Y.; Kato, H.; Ikeda, N. Breast cancer resistant protein (BCRP) is a molecular determinant of the outcome of photodynamic therapy (PDT) for centrally located early lung cancer. Lung cancer (Amsterdam, Netherlands) 2010, 67, 198–204.
(24) Uggla, B.; Ståhl, E.; Wågsäter, D.; Paul, C.; Karlsson, M. G.; Sirsjö, A.; Tidefelt, U. BCRP mRNA expression v. clinical outcome in 40 adult AML patients. Leukemia research 2005, 29, 141–6.
(25) Yoh, K. Breast Cancer Resistance Protein Impacts Clinical Outcome in Platinum-Based Chemotherapy for Advanced Non-Small Cell Lung Cancer. Clinical Cancer Research 2004, 10, 1691–1697.
(26) Campbell, P. K.; Zong, Y.; Yang, S.; Zhou, S.; Rubnitz, J. E.; Sorrentino, B. P. Identification of a novel, tissue-specific ABCG2 promoter expressed in pediatric acute megakaryoblastic leukemia. Leukemia research 2011, 35, 1321–9.
(27) Nakanishi, T.; Bailey-Dell, K. J.; Hassel, B. a; Shiozawa, K.; Sullivan, D. M.; Turner, J.; Ross, D. D. Novel 5’ untranslated region variants of BCRP mRNA are differentially expressed in drug-selected cancer cells and in normal human tissues: implications for drug resistance, tissue-specific expression, and alternative promoter usage. Cancer research 2006, 66, 5007–11.
(28) Natarajan, K.; Xie, Y.; Nakanishi, T.; Beck, W. T.; Bauer, K. S.; Ross, D. D. Identification and characterization of the major alternative promoter regulating Bcrp1/Abcg2 expression in the mouse intestine. Biochimica et biophysica acta 2011, 1809, 295–305.
(29) Bailey-Dell, K. J.; Hassel, B.; Doyle, L. a; Ross, D. D. Promoter characterization and genomic organization of the human breast cancer resistance protein (ATP-binding cassette transporter G2) gene. Biochimica et biophysica acta 2001, 1520, 234–41.

202
(30) Zong, Y.; Zhou, S.; Fatima, S.; Sorrentino, B. P. Expression of mouse Abcg2 mRNA during hematopoiesis is regulated by alternative use of multiple leader exons and promoters. The Journal of biological chemistry 2006, 281, 29625–32.
(31) Kim, T. H.; Barrera, L. O.; Zheng, M.; Qu, C.; Singer, M. a; Richmond, T. a; Wu, Y.; Green, R. D.; Ren, B. A high-resolution map of active promoters in the human genome. Nature 2005, 436, 876–80.
(32) Cooper, S. J.; Trinklein, N. D.; Anton, E. D.; Nguyen, L.; Myers, R. M. Comprehensive analysis of transcriptional promoter structure and function in 1% of the human genome. Genome research 2006, 16, 1–10.
(33) Smale, S. T.; Kadonaga, J. T. The RNA polymerase II core promoter. Annual review of biochemistry 2003, 72, 449–79.
(34) Calhoun, V. C.; Stathopoulos, A.; Levine, M. Promoter-proximal tethering elements regulate enhancer-promoter specificity in the Drosophila Antennapedia complex. Proceedings of the National Academy of Sciences of the United States of America 2002, 99, 9243–7.
(35) Takai, D.; Jones, P. a Comprehensive analysis of CpG islands in human chromosomes 21 and 22. Proceedings of the National Academy of Sciences of the United States of America 2002, 99, 3740–5.
(36) To, K. K. W.; Robey, R.; Zhan, Z.; Bangiolo, L.; Bates, S. E. Upregulation of ABCG2 by romidepsin via the aryl hydrocarbon receptor pathway. Molecular cancer research : MCR 2011, 9, 516–27.
(37) Tan, K. P.; Wang, B.; Yang, M.; Boutros, P. C.; Macaulay, J.; Xu, H.; Chuang, A. I.; Kosuge, K.; Yamamoto, M.; Takahashi, S.; Wu, A. M. L.; Ross, D. D.; Harper, P. A.; Ito, S. Aryl Hydrocarbon Receptor Is a Transcriptional Activator of the Human Breast Cancer Resistance Protein ( BCRP / ABCG2 ) □. 2010.
(38) Wang, H.; Lee, E.; Zhou, L.; Leung, P. C. K.; Ross, D. D.; Unadkat, J. D.; Mao, Q. Progesterone receptor (PR) isoforms PRA and PRB differentially regulate expression of the breast cancer resistance protein in human placental choriocarcinoma BeWo cells. Molecular pharmacology 2008, 73, 845–54.
(39) Ee, P. L. R. Identification of a Novel Estrogen Response Element in the Breast Cancer Resistance Protein (ABCG2) Gene. Cancer Research 2004, 64, 1247–1251.
(40) Pradhan, M.; Bembinster, L. a; Baumgarten, S. C.; Frasor, J. Proinflammatory cytokines enhance estrogen-dependent expression of the multidrug transporter gene ABCG2 through estrogen receptor and NF{kappa}B cooperativity at adjacent response elements. The Journal of biological chemistry 2010, 285, 31100–6.

203
(41) Krishnamurthy, P.; Ross, D. D.; Nakanishi, T.; Bailey-Dell, K.; Zhou, S.; Mercer, K. E.; Sarkadi, B.; Sorrentino, B. P.; Schuetz, J. D. The stem cell marker Bcrp/ABCG2 enhances hypoxic cell survival through interactions with heme. The Journal of biological chemistry 2004, 279, 24218–25.
(42) Singh, A.; Wu, H.; Zhang, P.; Happel, C. Expression of ABCG2 (BCRP) is regulated by Nrf2 in cancer cells that confers side population and chemoresistance phenotype. Molecular cancer … 2010, 9, 2365–2376.
(43) Turner, J. G.; Gump, J. L.; Zhang, C.; Cook, J. M.; Marchion, D.; Hazlehurst, L.; Munster, P.; Schell, M. J.; Dalton, W. S.; Sullivan, D. M. ABCG2 expression, function, and promoter methylation in human multiple myeloma. Blood 2006, 108, 3881–9.
(44) To, K. K. W.; Zhan, Z.; Bates, S. E. Aberrant promoter methylation of the ABCG2 gene in renal carcinoma. Molecular and cellular biology 2006, 26, 8572–85.
(45) Bram, E.; Stark, M.; Raz, S. Chemotherapeutic drug-induced ABCG2 promoter demethylation as a novel mechanism of acquired multidrug resistance. Neoplasia (New York, NY) 2009, 11, 1359–1370.
(46) Nakano, H.; Nakamura, Y.; Soda, H.; Kamikatahira, M.; Uchida, K.; Takasu, M.; Kitazaki, T.; Yamaguchi, H.; Nakatomi, K.; Yanagihara, K.; Kohno, S.; Tsukamoto, K. Methylation status of breast cancer resistance protein detected by methylation-specific polymerase chain reaction analysis is correlated inversely with its expression in drug-resistant lung cancer cells. Cancer 2008, 112, 1122–30.
(47) Ha Choi, J.; Wah Yee, S.; Kim, M. J.; Nguyen, L.; Ho Lee, J.; Kang, J.-O.; Hesselson, S.; Castro, R. a; Stryke, D.; Johns, S. J.; Kwok, P.-Y.; Ferrin, T. E.; Goo Lee, M.; Black, B. L.; Ahituv, N.; Giacomini, K. M. Identification and characterization of novel polymorphisms in the basal promoter of the human transporter, MATE1. Pharmacogenetics and genomics 2009, 19, 770–80.
(48) Hesselson, S. E.; Matsson, P.; Shima, J. E.; Fukushima, H.; Yee, S. W.; Kobayashi, Y.; Gow, J. M.; Ha, C.; Ma, B.; Poon, A.; Johns, S. J.; Stryke, D.; Castro, R. a; Tahara, H.; Choi, J. H.; Chen, L.; Picard, N.; Sjödin, E.; Roelofs, M. J. E.; Ferrin, T. E.; Myers, R.; Kroetz, D. L.; Kwok, P.-Y.; Giacomini, K. M. Genetic variation in the proximal promoter of ABC and SLC superfamilies: liver and kidney specific expression and promoter activity predict variation. PloS one 2009, 4, e6942.
(49) Yee, S. W.; Shima, J. E.; Hesselson, S.; Nguyen, L.; De Val, S.; Lafond, R. J.; Kawamoto, M.; Johns, S. J.; Stryke, D.; Kwok, P.; Ferrin, T. E.; Black, B. L.; Gurwitz, D.; Ahituv, N.; Giacomini, K. M. Identification and characterization of proximal promoter polymorphisms in the human concentrative nucleoside

204
transporter 2 (SLC28A2). The Journal of pharmacology and experimental therapeutics 2009, 328, 699–707.
(50) Li, L.; Koo, S. H.; Hong, I. H. K.; Lee, E. J. D. Identification of functional promoter haplotypes of human concentrative nucleoside transporter 2, hCNT2 (SLC28A2). Drug metabolism and pharmacokinetics 2009, 24, 161–6.
(51) Wang, D.; Chen, H.; Momary, K. M.; Cavallari, L. H.; Johnson, J. a; Sadée, W. Regulatory polymorphism in vitamin K epoxide reductase complex subunit 1 (VKORC1) affects gene expression and warfarin dose requirement. Blood 2008, 112, 1013–21.
(52) Kenna, G. a; Zywiak, W. H.; McGeary, J. E.; Leggio, L.; McGeary, C.; Wang, S.; Grenga, A.; Swift, R. M. A within-group design of nontreatment seeking 5-HTTLPR genotyped alcohol-dependent subjects receiving ondansetron and sertraline. Alcoholism, clinical and experimental research 2009, 33, 315–23.
(53) McLeod, H. L.; Sargent, D. J.; Marsh, S.; Green, E. M.; King, C. R.; Fuchs, C. S.; Ramanathan, R. K.; Williamson, S. K.; Findlay, B. P.; Thibodeau, S. N.; Grothey, A.; Morton, R. F.; Goldberg, R. M. Pharmacogenetic predictors of adverse events and response to chemotherapy in metastatic colorectal cancer: results from North American Gastrointestinal Intergroup Trial N9741. Journal of clinical oncology : official journal of the American Society of Clinical Oncology 2010, 28, 3227–33.
(54) Toffoli, G.; Cecchin, E.; Gasparini, G.; D’Andrea, M.; Azzarello, G.; Basso, U.; Mini, E.; Pessa, S.; De Mattia, E.; Lo Re, G.; Buonadonna, A.; Nobili, S.; De Paoli, P.; Innocenti, F. Genotype-driven phase I study of irinotecan administered in combination with fluorouracil/leucovorin in patients with metastatic colorectal cancer. Journal of clinical oncology : official journal of the American Society of Clinical Oncology 2010, 28, 866–71.
(55) Innocenti, F.; Undevia, S. D.; Iyer, L.; Chen, P. X.; Das, S.; Kocherginsky, M.; Karrison, T.; Janisch, L.; Ramírez, J.; Rudin, C. M.; Vokes, E. E.; Ratain, M. J. Genetic variants in the UDP-glucuronosyltransferase 1A1 gene predict the risk of severe neutropenia of irinotecan. Journal of clinical oncology : official journal of the American Society of Clinical Oncology 2004, 22, 1382–8.
(56) Rozen, S.; Skaletsky, H. Primer3 on the WWW for general users and for biologist programmers. Methods in molecular biology (Clifton, N.J.) 2000, 132, 365–86.
(57) Africa, W. A map of human genome variation from population-scale sequencing. Nature 2010, 467, 1061–73.
(58) Frazer, K. a; et. al. A second generation human haplotype map of over 3.1 million SNPs. Nature 2007, 449, 851–61.

205
(59) Kroetz, D. L.; Yee, S. W.; Giacomini, K. M. The pharmacogenomics of membrane transporters project: research at the interface of genomics and transporter pharmacology. Clinical pharmacology and therapeutics 2010, 87, 109–16.
(60) Barrett, J. C.; Fry, B.; Maller, J.; Daly, M. J. Haploview: analysis and visualization of LD and haplotype maps. Bioinformatics (Oxford, England) 2005, 21, 263–5.
(61) Liu, H.; Naismith, J. H. An efficient one-step site-directed deletion, insertion, single and multiple-site plasmid mutagenesis protocol. BMC biotechnology 2008, 8, 91.
(62) Liu, F.; Song, Y.; Liu, D. Hydrodynamics-based transfection in animals by systemic administration of plasmid DNA. Gene therapy 1999, 6, 1258–66.
(63) Kim, M. J.; Ahituv, N. The Hydrodynamic Tail Vein Assay as a Tool for the Study of Liver Promoters and Enhancers. In Pharmacogenomics: Methods and Protocols; Innocenti, F.; van Schaik, R. H. N., Eds.; 2012.
(64) Simonet, W. S.; Bucay, N.; Lauer, S. J.; Taylor, J. M. A far-downstream hepatocyte-specific control region directs expression of the linked human apolipoprotein E and C-I genes in transgenic mice. The Journal of biological chemistry 1993, 268, 8221–9.
(65) Sandelin, A.; Wasserman, W. W.; Lenhard, B. ConSite: web-based prediction of regulatory elements using cross-species comparison. Nucleic acids research 2004, 32, W249–52.
(66) Wingender, E.; Chen, X.; Hehl, R.; Karas, H.; Liebich, I.; Matys, V.; Meinhardt, T.; Prüss, M.; Reuter, I.; Schacherer, F. TRANSFAC: an integrated system for gene expression regulation. Nucleic acids research 2000, 28, 316–9.
(67) Boyle, A. P.; Hong, E. L.; Hariharan, M.; Cheng, Y.; Schaub, M. a; Kasowski, M.; Karczewski, K. J.; Park, J.; Hitz, B. C.; Weng, S.; Cherry, J. M.; Snyder, M. Annotation of functional variation in personal genomes using RegulomeDB. Genome research 2012, 22, 1790–7.
(68) Wu, A. M. L.; Dalvi, P.; Lu, X.; Yang, M.; Riddick, D. S.; Matthews, J.; Clevenger, C. V; Ross, D. D.; Harper, P. a; Ito, S. Induction of Multidrug Resistance Transporter ABCG2 by Prolactin in Human Breast Cancer Cells.; 2012.
(69) Watson, C. J. Stat transcription factors in mammary gland development and tumorigenesis. Journal of mammary gland biology and neoplasia 2001, 6, 115–27.

206
(70) Yamashita, H.; Iwase, H.; Toyama, T.; Fujii, Y. Naturally occurring dominant-negative Stat5 suppresses transcriptional activity of estrogen receptors and induces apoptosis in T47D breast cancer cells. Oncogene 2003, 22, 1638–52.
(71) Imai, Y.; Ishikawa, E.; Asada, S.; Sugimoto, Y. Estrogen-mediated post transcriptional down-regulation of breast cancer resistance protein/ABCG2. Cancer research 2005, 65, 596–604.
(72) Yasuda, S.; Kobayashi, M.; Itagaki, S.; Hirano, T.; Iseki, K. Response of the ABCG2 promoter in T47D cells and BeWo cells to sex hormone treatment. Molecular biology reports 2009, 36, 1889–96.
(73) Boyd, K. E.; Farnham, P. J. Coexamination of Site-Specific Transcription Factor Binding and Promoter Activity in Living Cells Coexamination of Site-Specific Transcription Factor Binding and Promoter Activity in Living Cells. Society 1999, 19.
(74) Porro, A.; Iraci, N.; Soverini, S.; Diolaiti, D.; Gherardi, S.; Terragna, C.; Durante, S.; Valli, E.; Kalebic, T.; Bernardoni, R.; Perrod, C.; Haber, M.; Norris, M. D.; Baccarani, M.; Martinelli, G.; Perini, G. c-MYC Oncoprotein Dictates Transcriptional Profiles of ATP-Binding Cassette Transporter Genes in Chronic Myelogenous Leukemia CD34+ Hematopoietic Progenitor Cells. Molecular cancer research : MCR 2011, 9, 1054–66.
(75) Kang, K. W.; Im, Y. Bin; Go, W.-J.; Han, H.-K. C-myc amplification altered the gene expression of ABC- and SLC-transporters in human breast epithelial cells. Molecular pharmaceutics 6, 627–33.
(76) Hess, J.; Angel, P.; Schorpp-Kistner, M. AP-1 subunits: quarrel and harmony among siblings. Journal of cell science 2004, 117, 5965–73.
(77) Angel, P.; Karin, M. The role of Jun, Fos and the AP-1 complex in cell-proliferation and transformation. Biochimica et biophysica acta 1991, 1072, 129–57.
(78) Safe, S. Transcriptional activation of genes by 17 beta-estradiol through estrogen receptor-Sp1 interactions. Vitamins and hormones 2001, 62, 231–52.
(79) Schultz, J. R.; Petz, L. N.; Nardulli, A. M. Cell- and ligand-specific regulation of promoters containing activator protein-1 and Sp1 sites by estrogen receptors alpha and beta. The Journal of biological chemistry 2005, 280, 347–54.
(80) Zhao, C.; Gao, H.; Liu, Y.; Papoutsi, Z.; Jaffrey, S.; Gustafsson, J.-A.; Dahlman-Wright, K. Genome-wide mapping of estrogen receptor-beta-binding regions reveals extensive cross-talk with transcription factor activator protein-1. Cancer research 2010, 70, 5174–83.

207
(81) Halilbasic, E.; Claudel, T.; Trauner, M. Bile acid transporters and regulatory nuclear receptors in the liver and beyond. Journal of hepatology 2012, 58, 155–168.
(82) Germain, P.; Staels, B.; Dacquet, C.; Spedding, M.; Laudet, V. Overview of Nomenclature of Nuclear Receptors. 2006, 58, 685–704.
(83) Blazquez, A. G.; Briz, O.; Romero, M. R.; Rosales, R.; Monte, M. J.; Vaquero, J.; Macias, R. I. R.; Cassio, D.; Marin, J. J. G. Characterization of the role of ABCG2 as a bile acid transporter in liver and placenta. Molecular pharmacology 2012, 81, 273–83.
(84) Generaux, G. T.; Bonomo, F. M.; Johnson, M.; Doan, K. M. M. Impact of SLCO1B1 (OATP1B1) and ABCG2 (BCRP) genetic polymorphisms and inhibition on LDL-C lowering and myopathy of statins. Xenobiotica; the fate of foreign compounds in biological systems 2011, 41, 639–51.

208
Chapter 4 : Identification and Characterization of ABCG2 Regulatory Regions
4.1. Abstract
ABCG2 encodes the mitoxantrone resistance protein (MXR, BCRP), a membrane
transporter responsible for the efflux of substrates out of the cell and body. In this study
we computationally analyzed a ~300 kb stretch of DNA surrounding ABCG2
(chr4:88911376-89220011, hg19) and identified 30 regions with potential cis-regulatory
capabilities based on high evolutionary conservation, determined by comparative
genomics (ECR and Vista browsers), and the presence of specialized transcription factor
binding sites (TFBS), identified with computational methods (rVista, TRANSFAC, and
Cister). These regions were cloned from human DNA and inserted into the enhancer
assay vector pGL4.23 and suppressor assay vector pGL3-promoter. Plasmids were
transiently transfected into HepG2, HEK293T, HCT116 and MCF-7 cell lines, and
luciferase activity was measured as a surrogate for the transcriptional activity of the
genomic region. Nine positive in vitro enhancers were selected for in vivo validation in
the mouse tail vein injection luciferase assay. The in vivo tail vein assay confirmed six of
the nine regions to have liver enhancer activity. The in vitro suppressor assays identified
seven regions capable of decreasing gene expression in at least one cell line. Our study
provides evidence that there are genomic regions surrounding ABCG2 capable of altering
gene expression. The results from this research will drive future clinical investigations
examining how interindividual variation in MXR expression and function contributes to
differences in drug response. The effect of genetic variants within these regulatory
regions on enhancer activity and ABCG2 expression were also studied and will be
discussed in Chapter 5.

209
4.2. Introduction
The mitoxantrone resistance protein (MXR; BCRP; ABCG2) is an efflux
membrane transporter expressed apically in several tissues1–12 with a broad range of both
exogenous and endogenous substrates. The transport activity, tissue distribution and
cellular localization of MXR suggest that it plays a pivotal role in endogenous substrate
disposition as well as protection from and detoxification of xenobiotics13,14.
Overexpression of MXR is associated with drug resistance to a variety of anticancer
drugs and has been linked with decreased disease-free survival in several cancers15–22. An
individual’s susceptibility to certain drug-induced side effects has also been linked to
MXR expression, and both coding and non-coding single nucleotide polymorphisms
(SNPs) in the ABCG2 gene encoding MXR23–25.
Interindividual variation in drug absorption, distribution, metabolism and
excretion (ADME) has been correlated with genetic variation in genes encoding drug-
metabolizing enzymes and transporters26. New research has highlighted that single
nucleotide polymorphisms (SNPs) in non-coding genomic regions can also effect ADME
gene transcription and expression levels, and thus drug disposition27,28. Additional
variation in ADME gene expression can be brought on by ligand-activated transcription
factors (TFs) from the nuclear receptor (NR) family; these TFs temporally alter gene
expression in response to changes in the cell environment29. In addition, complex tissue-
specific pathways of TFs have been shown to regulate expression for selected tissues30,31.
The expression of ABCG2 has wide tissue-specific variability among individuals.
There are reports of significant ABCG2 variation in intestine15,32, liver33,and blast cells34,

210
and we have shown wide variation in ABCG2 mRNA in a local bank of human livers and
kidneys (Chapter 1 Figure 1.2). In addition, the expression of ABCG2 is altered by many
types of stimuli, including hypoxia35, inflammation36, xenobiotics37, hormones38,39 and
nutrients40,41. ABCG2 expression is tissue-specific4 and modulated by NR ligands37.
Several nuclear response elements (NRE) have been mapped to the proximal promoter of
ABCG236,38,42–44. However, it is speculated that in order to regulate the expression of a
gene, multiple response elements for a NR must interact together, causing looping of the
DNA between them, to stabilize the transcriptional machinery and increase gene
expression45. For tissue-specific genes like ABCG2 that have a CpG island in their
promoter, methylation of the CpG island can block the access of NRs to their recognition
sequence, thus cis-elements are necessary to respond to NR signals46. In addition, there
have been no reported SNPs in these NREs mapped in the proximal promoter, indicating
that even if they regulate expression of ABCG2, these NREs do not contribute to basal
ABCG2 variation. Therefore, we hypothesized that there are cis-regulatory elements in
the ABCG2 gene locus that are responsible for the expression of ABCG2. The aim of this
study was to identify and characterize those regulatory regions both in vitro and in vivo.
NRs are a large family of TFs, including the glucocorticoid receptor (GR),
estrogen receptor (ER), progesterone receptor (PR), aryl hydrocarbon receptor (AhR),
androgen receptor (AR), pregnane X receptor (PXR), retinoid X receptor (RXR),
farnesoid X receptor (FXR), hepatocyte nuclear factor 4α (HNF4α) and vitamin D
receptor (VDR). NRs are ligand-induced in response to environmental stimuli and their
ligands include a variety of fatty acids, vitamins and steroids47. NRs prefer to binding to
cis-elements as opposed to the proximal promoter of their genes48–51. In addition NR

211
response elements have been shown to be composite elements, consisting of binding sites
for other TFs48,50–53. Therefore, the identification of TF clustering through a gene locus
would be a good approach for the identification of regulatory elements.
There are several factors that influence whether predicted regulatory elements are
likely functional. Among them is the evolutionary conservation of the region, excluding
the coding regions and promoter regions of genes. This is due to well established
evidence for the conservation of regulatory elements through different species54,55,
especially for developmental enhancers56,57 and tissue-specific enhancers31,58. Recently it
has been shown that the ~1000 bp surrounding a GRE is evolutionarily conserved and the
level of conservation for a predicted GRE is correlated to the extent of GR occupancy at
that element59. Therefore, consideration of conservation of non-coding regions can aid in
identifying putative functional elements. However, it is important to note that due to
recent selection in primates, conservation is not necessary for some enhancer regions60.
The existence of large public databases including genome sequencing,
comparative genomics, TF profiling, and gene expression studies has made the
identification of cis-regulatory elements and the characterization of the effect of genetic
variation within them possible30,31,60. A previous screen looking for tissue-specific
enhancers of genes successfully used gene expression, TFBS and conservation to identify
tissue-specific enhancers, showing the power of combining complementary genomic data
sets31. To identify cis-regulatory elements in the ABCG2 gene locus, a layered in silico
analysis was developed that incorporated predicted TFBS and evolutionary conservation,
in combination with the clustering of multiple TFs.
212
In this study, a computational analysis of the ABCG2 gene locus for TFBS
clustering and evolutionary conservation was performed to identify putative regulatory
regions of ABCG2 (Figure 4.1). Putative regulatory regions were ranked based on the
prevalence of TFs linked to ABCG2 expression or tissue-specific expression in liver or
kidney, degree of evolutionary conservation and presence of preliminary ChIP-seq data
supporting binding of TFs to the genomic region. High priority regulatory regions were
cloned into the pGL4.23 [luc2/minP] enhancer assay vector and assayed for their activity
in transiently transfected kidney (HEK293T), liver (HepG2), intestine (HCT116) and
breast (MCF-7) cell lines. The pGL4.23 vector is a firefly luciferase vector with a
multiple cloning site designed to accept a putative enhancer element upstream of a
minimal promoter and the luciferase gene, once cloned and transfected into cells, the
luciferase activity can be measured as a surrogate for enhancer function. The cell lines
were each chosen to represent their primary tissue source. Positive in vitro enhancer
elements were tested for their in vivo liver enhancer activity through the hydrodynamic
tail vein assay in mice. Elements with suppressor activity were cloned into the pGL3-
promoter [luc+/SV40] luciferase expression vector and assayed for their ability to
suppress luciferase activity in transiently transfected kidney (HEK293T), liver (HepG2),
intestine (HCT116) and breast (MCF-7) cell lines. The pGL3-promoter vector is a firefly
luciferase vector with a multiple cloning site designed to accept a putative suppressor
element upstream of the strong SV40 promoter and the luciferase gene. ChIP-seq
databases were mined for evidence to support the activity of the positive in vivo enhancer
activity. The identified in vivo enhancers and in vitro suppressors provide elements of the
ABCG2 gene locus that could be responsible for the tissue-specific expression of ABCG2.

213
Further research assessing the effect of SNPs in these regions on enhancer activity is
addressed in Chapter 5.
Figure 4.1. Pipeline to identify and characterize ABCG2 regulatory elements.
Experimental design begins with bioinformatic analyses to identify putative enhancer
elements (Step 1). Putative enhancers are first tested in vitro using luciferase assays for
enhancer activity followed by confirmation of enhancer activity in vivo (Step 2). Further
functional characterization of SNP effects on enhancer activity are performed in Step 3
and will be addressed in Chapter 5.
4.3. Materials and Methods
4.3.1. Chemicals and Materials
The vectors pGL4.23 [luc2/minP], pGL4.74 [hRluc/TK], pGL4.13 [luc2/SV40],
pGL3-promoter [luc+/SV40], the Dual-Luciferase® Reporter Assay System and HB101

214
competent cells were all purchased from Promega (Madison, WI). The human embryonic
kidney (HEK293T/17), human colorectal carcinoma (HCT116), human hepatocellular
carcinoma (HepG2) and human breast adenocarcinoma (MCF-7) cell lines were all
purchased from the American Type Culture Collection (ATCC, Manassas, VA). One
Shot INV110 dcm-/dam- competent cells, high-glucose Dulbecco’s modified Eagle’s
medium (DMEM), Opti-Minimal Essential Medium (Opti-MEM) and Lipofectamine
2000 were all purchased from Invitrogen (Carlsbad, CA). TE buffer, 100 mm LB Amp-
100 agar plates and LB Broth 100 μg/mL ampicilin were purchased from Teknova
(Hollister, CA). DMSO, phosphate buffered saline (PBS), 0.05% trypsin, and 100X
penicillin and streptomycin were all purchased from the UCSF cell culture facility (San
Francisco, CA). The GeneJet PCR Purification Kits, GeneJET Gel Purification Kits and
GeneJet Plasmid Miniprep Kits were all purchased from Fermentas (Glen Burnie, MD).
Bovine serum albumin (BSA), Buffer 2, Buffer 3, XhoI, Acc65I, NheI, HindIII, T4
Ligase, Ligase buffer, DpnI, DpnI digestion buffer, antarctic phosphatase and 10 mM
ATP were all purchased from New England Biolabs (Ipswich, MA). Other materials
including 10% fetal bovine serum (FBS) (Axenia BioLogix, Dixon, CA), GenElute HP
Endotoxin-Free Maxiprep Kits (Sigma Aldrich), Improved Minimum Essential Medium
(IMEM) without phenol red (Mediatech Inc, Manassas, VA), PolyJet™ DNA In Vitro
Transfection Reagent (SignaGen Laboratories, Rockville, MD), TransIT EE In Vivo Gene
Delivery System (Mirus Bio, Madison, WI), CD1 mice (Charles Rivers Laboratories,
Wilminton, MA), placental genomic DNA (Sigma Aldrich, St. Louis, MO), PfuTurbo
DNA Polymerase (Agilent Technologies, Santa Clara, CA) and dNTPs (Denville,
Metuchen, NJ) were all purchased from the indicated manufacturers.

215
4.3.2. In Silico Analysis of the ABCG2 Locus to Identify Putative Regulatory Elements
A list of putative regulatory regions in the ABCG2 gene locus was generated by
combining data from several computational programs which looked for high evolutionary
conservation to mouse and increased clustering of cis-elements. The analyzed ABCG2
gene locus was defined as a ~300,000 bp region, stretched from one gene upstream
(PPM1K) and downstream (PKD2) of ABCG2 (chr4:89130400-89439035, hg18;
chr4:88911376-89220011, hg19). Using both the Evolutionary Conserved Regions (ECR)
browser61 and Vista browser62, the ABCG2 gene locus was scanned for regions larger
than 100 bp and with greater than 70% conservation to mouse. Regions from this analysis
were numbered ECR1-85 for ECR browser, ECR86-98 for Vista browser, and those with
>400 bp of conservation were named ECR400s. Conservation alignments from the ECR
browser were submitted to rVista63, which analyzes them for conserved TFBS using all
vertebrate TF matrices from TRANSFAC professional. Next, the genomic region was
examined for regions with increased clustering of predicted transcription factor binding
sites (TFBS), regardless of conservation, using the Cister program64. Matrices used for
cis-elements included those preprogrammed into the Cister program (TATA, Sp1, CRE,
ERE, Nf-1, E2F, Mef-2, Myf, CCAAT, AP-1, Ets, Myc, GATA, LSF, SRF, Tef) and
several additional matrices obtained from TRANSFAC65 and listed in Table 4.1. The
ABCG2 gene locus was split into fourths and analyzed in the Cister program with the
default settings: width of window was set to 100 bp, average distance between motifs
within a cluster was set to 35 bp, average number of motifs in cluster (b) was set to 6,
average distance between clusters (g) was set to 30,000, half-width of sliding window (w)
was set to 1000 bp, motif probability threshold was set to 0.1, and pseudocount was set to

216
1. Regions obtained from this analysis were named cister regions (CR) 1-23. Overlapping
regions from the conservation and Cister plot analyses were combined into one putative
enhancer region keeping the name of the longer region. Regions consisting of repeat or
coding elements were eliminated from further analysis.
Table 4.1. TRANSFAC TFBS Matrices Used in Cister Plot Analysis Accession Number1
Transcription Factor
Accession Number1
Transcription Factor
M00054 NF-κB M00206 HNF-1 M00109 C/EBPβ M00208 NF-κB M00117 C/EBPβ M00235 AhR:Arnt M00131 HNF-3β M00236 Arnt M00132 HNF-1 M00237 AhR:Arnt M00134 HNF-4 M00242 PPARα:RXRα M00139 AhR M00269 XFD-3 M00155 ARP-1 M00289 HFH-3 M00156 RORα1 M00411 HNF-4α M00157 RORα2 M00512 PPARγ M00158 COUP-TF, HNF-4 M00515 PPARγ M00191 ER M00526 GCNF M00192 GR M00528 PPAR M00194 NF-κB
1Accession number in the TRANSFAC database 4.3.3. Ranking of Putative Regulatory Elements
To select high priority putative regulatory elements for in vitro testing, putative
enhancer regions were ranked based on several criteria. First, regions were scored based
on their percent identity to mouse and the number of predicted TFBS per length of
region. Then regions were scored for total number of TFBS with extra weight given to
TFBS associated with ABCG2, liver and kidney gene expression (see Table 4.2). Finally,
putative enhancer regions were overlaid with ChIP-seq data peaks from the
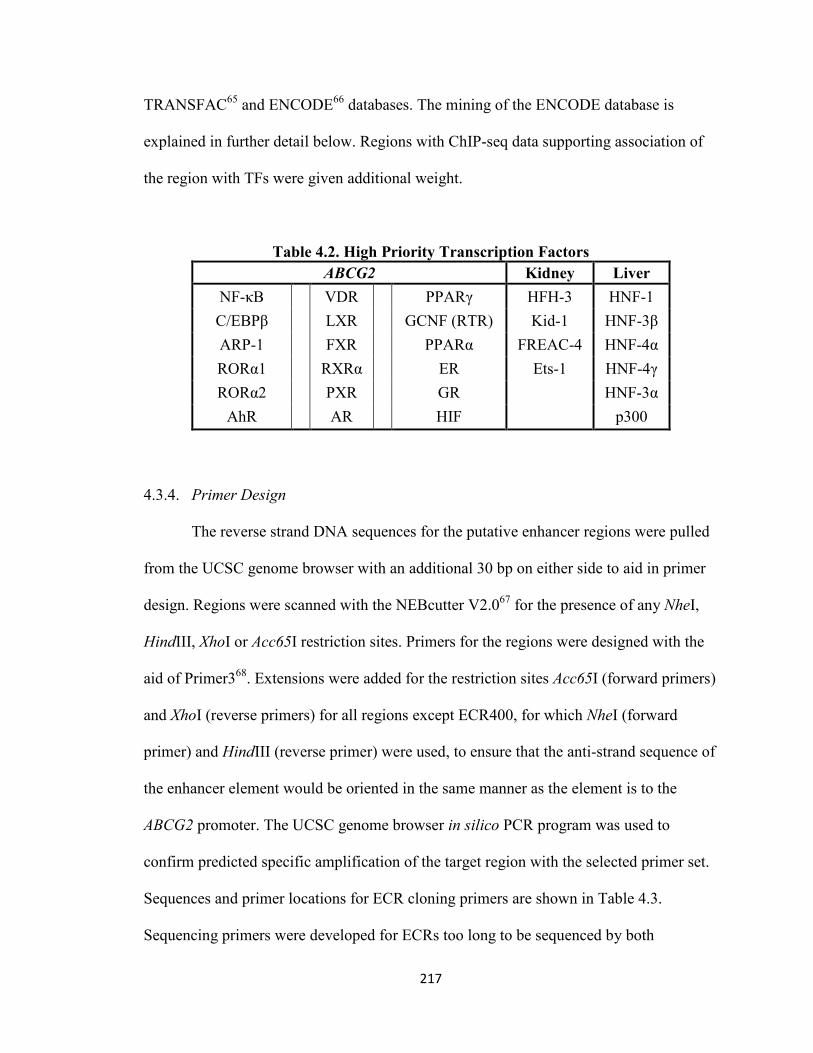
217
TRANSFAC65 and ENCODE66 databases. The mining of the ENCODE database is
explained in further detail below. Regions with ChIP-seq data supporting association of
the region with TFs were given additional weight.
Table 4.2. High Priority Transcription Factors ABCG2 Kidney Liver
NF-κB VDR PPARγ HFH-3 HNF-1 C/EBPβ LXR GCNF (RTR) Kid-1 HNF-3β ARP-1 FXR PPARα FREAC-4 HNF-4α RORα1 RXRα ER Ets-1 HNF-4γ RORα2 PXR GR HNF-3α
AhR AR HIF p300
4.3.4. Primer Design
The reverse strand DNA sequences for the putative enhancer regions were pulled
from the UCSC genome browser with an additional 30 bp on either side to aid in primer
design. Regions were scanned with the NEBcutter V2.067 for the presence of any NheI,
HindIII, XhoI or Acc65I restriction sites. Primers for the regions were designed with the
aid of Primer368. Extensions were added for the restriction sites Acc65I (forward primers)
and XhoI (reverse primers) for all regions except ECR400, for which NheI (forward
primer) and HindIII (reverse primer) were used, to ensure that the anti-strand sequence of
the enhancer element would be oriented in the same manner as the element is to the
ABCG2 promoter. The UCSC genome browser in silico PCR program was used to
confirm predicted specific amplification of the target region with the selected primer set.
Sequences and primer locations for ECR cloning primers are shown in Table 4.3.
Sequencing primers were developed for ECRs too long to be sequenced by both
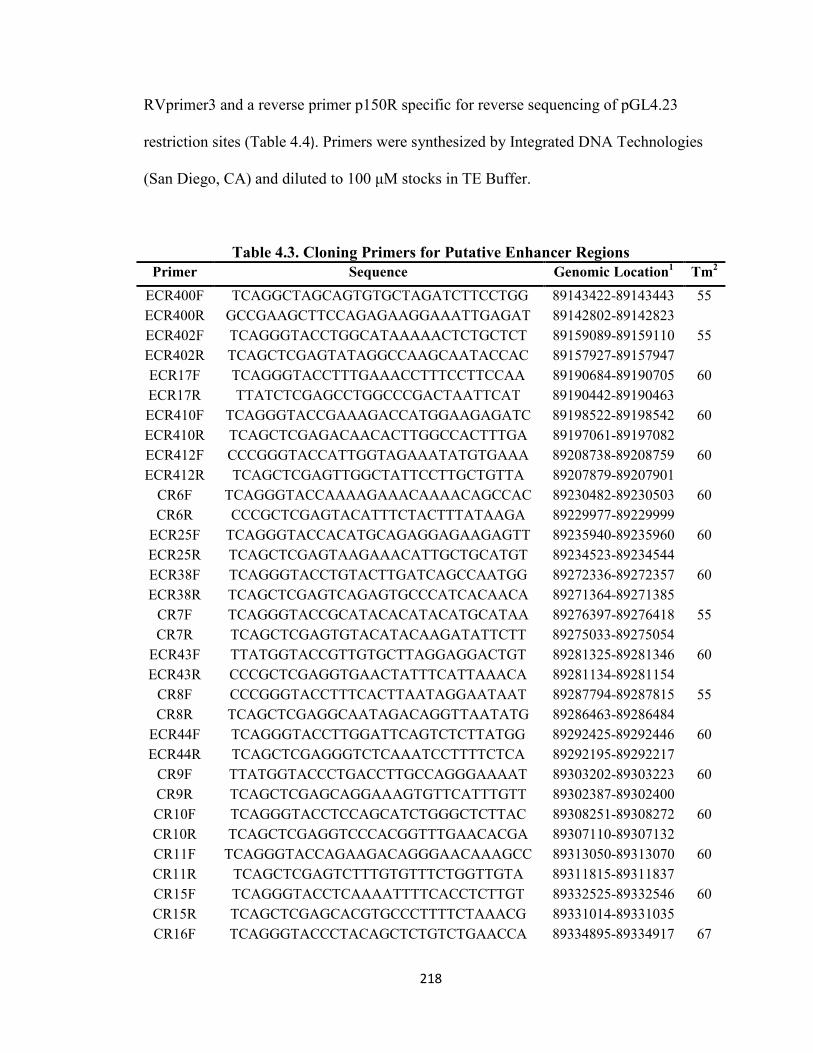
218
RVprimer3 and a reverse primer p150R specific for reverse sequencing of pGL4.23
restriction sites (Table 4.4). Primers were synthesized by Integrated DNA Technologies
(San Diego, CA) and diluted to 100 μM stocks in TE Buffer.
Table 4.3. Cloning Primers for Putative Enhancer Regions Primer Sequence Genomic Location1 Tm2
ECR400F TCAGGCTAGCAGTGTGCTAGATCTTCCTGG 89143422-89143443 55 ECR400R GCCGAAGCTTCCAGAGAAGGAAATTGAGAT 89142802-89142823 ECR402F TCAGGGTACCTGGCATAAAAACTCTGCTCT 89159089-89159110 55 ECR402R TCAGCTCGAGTATAGGCCAAGCAATACCAC 89157927-89157947 ECR17F TCAGGGTACCTTTGAAACCTTTCCTTCCAA 89190684-89190705 60 ECR17R TTATCTCGAGCCTGGCCCGACTAATTCAT 89190442-89190463 ECR410F TCAGGGTACCGAAAGACCATGGAAGAGATC 89198522-89198542 60 ECR410R TCAGCTCGAGACAACACTTGGCCACTTTGA 89197061-89197082 ECR412F CCCGGGTACCATTGGTAGAAATATGTGAAA 89208738-89208759 60 ECR412R TCAGCTCGAGTTGGCTATTCCTTGCTGTTA 89207879-89207901
CR6F TCAGGGTACCAAAAGAAACAAAACAGCCAC 89230482-89230503 60 CR6R CCCGCTCGAGTACATTTCTACTTTATAAGA 89229977-89229999
ECR25F TCAGGGTACCACATGCAGAGGAGAAGAGTT 89235940-89235960 60 ECR25R TCAGCTCGAGTAAGAAACATTGCTGCATGT 89234523-89234544 ECR38F TCAGGGTACCTGTACTTGATCAGCCAATGG 89272336-89272357 60 ECR38R TCAGCTCGAGTCAGAGTGCCCATCACAACA 89271364-89271385
CR7F TCAGGGTACCGCATACACATACATGCATAA 89276397-89276418 55 CR7R TCAGCTCGAGTGTACATACAAGATATTCTT 89275033-89275054
ECR43F TTATGGTACCGTTGTGCTTAGGAGGACTGT 89281325-89281346 60 ECR43R CCCGCTCGAGGTGAACTATTTCATTAAACA 89281134-89281154
CR8F CCCGGGTACCTTTCACTTAATAGGAATAAT 89287794-89287815 55 CR8R TCAGCTCGAGGCAATAGACAGGTTAATATG 89286463-89286484
ECR44F TCAGGGTACCTTGGATTCAGTCTCTTATGG 89292425-89292446 60 ECR44R TCAGCTCGAGGGTCTCAAATCCTTTTCTCA 89292195-89292217
CR9F TTATGGTACCCTGACCTTGCCAGGGAAAAT 89303202-89303223 60 CR9R TCAGCTCGAGCAGGAAAGTGTTCATTTGTT 89302387-89302400 CR10F TCAGGGTACCTCCAGCATCTGGGCTCTTAC 89308251-89308272 60 CR10R TCAGCTCGAGGTCCCACGGTTTGAACACGA 89307110-89307132 CR11F TCAGGGTACCAGAAGACAGGGAACAAAGCC 89313050-89313070 60 CR11R TCAGCTCGAGTCTTTGTGTTTCTGGTTGTA 89311815-89311837 CR15F TCAGGGTACCTCAAAATTTTCACCTCTTGT 89332525-89332546 60 CR15R TCAGCTCGAGCACGTGCCCTTTTCTAAACG 89331014-89331035 CR16F TCAGGGTACCCTACAGCTCTGTCTGAACCA 89334895-89334917 67

219
Primer Sequence Genomic Location1 Tm2 CR16R TCAGCTCGAGGAAGGCTGCCATGAATGTAG 89333859-89333880 ECR48F TCAGGGTACCAGGAGGTAAAACGTGGGCCC 89336908-89336930 55 ECR48R TCAGCTCGAGCTGTCAAGTGCATCTCCTGT 89336705-89336727 ECR420F TCAGGGTACCTAGCAGATTTTCAACAGGCA 89346301-89346322 60 ECR420R TCAGCTCGAGCTGTCAAAAGATTTGCCATT 89345102-89345123 ECR52F TCAGGGTACCACTTCATGGAGAAGGTGGGC 89346901-89346880 60 ECR52R TCAGCTCGAGCAATGCCTTAACTGTGTGCT 89346636-89346657 ECR55F TCAGGGTACCTTTCTGGTAGTTCTGACCTC 89364013-89364035 60 ECR55R TCAGCTCGAGCAGCGAACACACACCACTAC 89363840-89363862 CR19F TCAGGGTACCATAAAATAACGTGTTACATC 89383418-89383439 60 CR19R TCAGCTCGAGCTATAGAGGTGGTAAGACTT 89382285-89382307
ECR423F TCAGGGTACCTCCATGGGCTCAAGTAGACC 89409470-89409482 55 ECR423R TCAGCTCGAGACAATGGTGTGATATGTAGA 89408527-89408548 ECR425F TCAGGGTACCAGTGAATGTGTATATGCGTG 89411732-89411754 55 ECR425R TCAGCTCGAGAAGGTTGTAATACAAAGAGG 89409846-89409868 ECR426F TCAGGGTACCTGTTGGGAACTCCAATTAAT 89417136-89417157 55 ECR426R TCAGCTCGAGGATGAACCAAATACAGATCA 89416468-89416490 ECR428F TCAGGGTACCTTGGCCATTCTTTGGAAACA 89419430-89419409 60 ECR428R TCAGCTCGAGATTTTGGTTAATGCTTTCCC 89418093-89418115 ECR429F TCAGGGTACCTTCTTCCCAGATTCCAGCTT 89431770-89431792 55 ECR429R TCAGCTCGAGCTGTGGGAAATGGTGCATAA 89430870-89430892 ECR33F TCAGGGTACCAGCCCATTTCTTGTTTTT 89248403-89248422 56.5 ECR33R TCAGCTCGAGGGGAAGAGTTTCAATTAGAG 89247469-89247490 ECR31F TTATGGTACCAGTCACAGTGGACCCTTAAA 89245696-89245716 60 ECR31R TTATCTCGAGACTGCACTACTGCACACCAG 89244915-89244935 ECR54F TTATGGTACCAAGGTAGTCAGAGGCCAGA 89352633-89352652 60 ECR54R TTATCTCGAGCCAGAGGGGAAAGTCTTTC 89352026-89352045
1Genomic location of the primers on chromosome 4 build hg18 2Melting temperature used in cloning polymerase chain reaction for the primer pair Abbreviations: F, Forward; R, Reverse

220
Table 4.4. Sequencing Primers for Putative Regulatory Elements Primer Sequence Genomic Location1
ECR402 Seq1 CACCAGCACTGAGAGTGGAGCAT chr4:89158678-89158701 ECR423 Seq1 TTGAACTGGTTGTAGCCAGTGTTGG chr4:89408981-89409006
CR10 Seq1 AAGGCAGAAGGGACAGTTGGGTT chr4:89307834-89307857 CR8 Seq1 TTGACAGGGTTACGCTGTTGCTTAG chr4:89287234-89287259
ECR25 Seq1 CAAACAAGAACGAAAGATTGTCACTG chr4:89235274-89235299 ECR428 Seq1 GAACCAGGTGAGAAGGAGAGTGCTG chr4:89418805-89418830 ECR429 Seq1 GCTTGACAACCAGTGACAAACAGGC chr4:89431362-89431387
CR7 Seq1 GCCTAGTGGGGGATTCAGAACACA chr4:89274236-89274260 ECR38 Seq1 AGGCAGGGAGAATCTGGAATATGGC chr4:89271905-89271930 ECR425 Seq1 GGTTCCCACATCTCTTTGTCCCA chr4:89411209-89411231
CR15 Seq1 CCACATCATCTCGCCAACACCTG chr4:89331631-89331653 pGL4.23 SEQ
p150R GGCATCTTCCATGGTGGCTTTACC na 1Genomic location in build hg19 Abbreviations: na, not applicable
4.3.5. Cloning of Putative Regulatory Elements
The region of interest was amplified from human placenta genomic DNA using 1
unit PfuTurbo DNA polymerase, 1X PfuTurbo buffer, 200 μM dNTPs, 150 ng genomic
DNA, 400 nM each primer (Table 4.3) and when needed,1 μL DMSO in a final reaction
volume of 50 μL. PCR conditions were 95°C for 2 min, followed by 35 cycles of 30 sec
at 95°C, 30 sec at melting temperature (see Table 4.3) and 2.5 min at 72°C, and then a
final extension of 10 min at 72°C. The PCR reaction was imaged on a 1% agarose gel,
and the specific band at the correct size was gel purified using the GeneJet Gel
Purification Kit following the manufacturer’s protocol. For cloning, the pGL4.23
[luc2/minP] and pGL3-promoter [luc+/SV40] were grown in One Shot INV110 dcm-
/dam- competent cells so methylation would not interfere with enzyme digestion. The
purified putative enhancer regions, 500 ng of pGL4.23 [luc2/minP] and 500 ng of pGL3-
promoter [luc+/SV40] vector were digested in separate reactions of 1X Buffer 3, 1 unit

221
Acc65I, 1 unit XhoI and 0.5 μL BSA at 37°C for 1 hr. For ECR400, the purified enhancer
region, 500 ng of pGL4.23, and 500 ng of pGL3-promoter vector were digested in
separate reactions of 1X Buffer 2, 1 unit NheI, 1 unit HindIII, and 0.5 μL BSA, at 37°C
for 1 hr. Vectors were dephosphorylated after enzyme digestion using 4 units of antarctic
phosphatase at 37°C for 2 hr. The reaction was purified using the GeneJet PCR
Purification Kit following the manufacturer’s protocol, and the concentration of the
cleaned DNA measured using a NanoDrop spectrophotometer (Thermo Scientific).
The amplified ABCG2 putative enhancer region was ligated into the pGL4.23
vector through a 96:32 fmol insert to vector reaction comprised of the insert and vector
plus 1 unit Ligase T4, 1X Ligase Buffer, 65 nM ATP and a final reaction volume of 20
μL. The ligation was allowed to sit overnight at room temperature before purification
using the GeneJet PCR Purification Kit. A portion of the purified ligation reaction (5 μL)
was transformed into 35 μL HB101 competent cells following the manufacturer’s
protocol. The transformed bacteria was plated onto 100mm LB Amp plates and grown at
37°C for 24 hr. Selected colonies were grown in 2-5 mL LB Broth with 100 μg/mL
ampicillin at 37°C with shaking for up to 24 hr. DNA was isolated from the bacteria
using a GeneJet Plasmid Miniprep Kit and sequenced with the RVPrimer3 and p150R
primers (Table 4.4) to confirm the presence and orientation of the putative enhancer
element in the pGL4.23 vector. If needed, additional sequencing primers (see Table 4.4)
were used to verify the correct sequence of the putative enhancer. Other vectors used in
the transfection assays include the pGL4.74 [hRluc/TK] vector, which has a Renilla
luciferase reporter gene, a highly active HSV-TK promoter and is co-transfected into
each cell so that the transfection efficiency can be controlled by the expression of Renilla,

222
and the pGL4.13 [luc2/SV40] vector, which has a luciferase reporter gene and a highly
active SV40 promoter. DNA for the selected enhancer plasmids, empty pGL4.23,
APOE69 (liver specific enhancer in pGL4.23 kindly provided by Dr. Nadav Ahituv,
University of California San Francisco), pGL4.13, and pGL4.74 vectors were isolated
from transformed bacteria grown overnight at 37°C with shaking in 150 mL LB Broth
with 100 μg/mL ampicillin, using the GenElute HP Endotoxin-Free Maxiprep Kit
following the manufacturer’s protocol. For follow-up studies on negative regulatory
regions, putative suppressor regions were re-amplified from the pGL4.23 vectors and
cloned, using the same restriction sites, into the pGL3-promoter vector. Constructs were
sequenced to verify their identity and orientation in the pGL3-promoter vector.
4.3.6. Cell Culture
HEK293T/17, HCT116 and HepG2 cell lines were grown in high-glucose DMEM
supplemented with 10% FBS, 100 units/mL of penicillin and 0.1 mg/mL of streptomycin.
The MCF-7 cell line was grown in IMEM without phenol red, supplemented with 10%
FBS, 100 units/mL of penicillin and 0.1 mg/mL of streptomycin. All cell lines were
grown in a 5% CO2 incubator at 37°C. To maintain cells, they were split upon reaching
confluency by treatment with 0.05% Trypsin-EDTA, washing with 1X PBS and
suspending in fresh media at a 1:5 to 1:20 dilution.
4.3.7. Transient Transfections
For transient transfections of the HEK293T/17, HepG2 and HCT116 cell lines,
cells were seeded at approximately 1.8 x 10⁴ cells per well of a 96-well plate in fresh

223
DMEM with 10% FBS, but without antibiotics, and grown for at least 24 hr to 80%
confluency. Cells were then transfected with Lipofectamine 2000 following guidelines
suggested in the manufacturer’s protocol. In short, 0.5 μL of Lipofectamine 2000 was
incubated in 25 μL Opti-Minimal Essential Medium (Opti-MEM) for 5 min and then
gently mixed with a 25 μL solution of 0.08 μg construct (pGL4.23 [luc2/minP],
Enhancer-pGL4.23 [luc2/minP], pGL3 promoter [luc+/SV40], Supressor-pGL3 promoter
[luc+/SV40], APOE-pGL4.23 or pGL4.13 [luc2/SV40]) plus 0.02 μg pGL4.74
[hRluc/TK] diluted with Opti-MEM. The DNA-Lipofectamine mixture was allowed to
incubate at room temperature for 30 min before being placed onto cells with fresh 50 μL
of antibiotic-free media. MCF-7 cells were split with 0.05% Trypsin-EDTA and seeded at
~2.5 x 10⁴ cells per well and transfected once they reached 95% confluency with the
PolyJet™ DNA In Vitro Transfection Reagent; transfection efficiency was optimized by
following the manufacturer’s guidelines. Briefly, media on the cells were replaced with
100 μL fresh IMEM (supplemented with FBS and antibiotics as above) 30 min before
transfection. A mix of 75 ng ABCG2 plasmid and 25 ng of pGL4.74 [hRluc/TK], to
control for transfection efficiency, was diluted to 5 μL with IMEM supplemented with
10% FBS (no antibiotics). A 0.4 μL aliquot of PolyJet was diluted to 5 μL with IMEM
supplemented with 10% FBS (no antibiotics) and then immediately added to the DNA
mix with gentle mixing. The PolyJet/DNA mix was allowed to incubate at room
temperature for 15 min before being added to the cells. All cell lines were incubated with
their transfection reagents for 18-24 hr before assaying.

224
4.3.8. Luciferase Assay
The day after transfection, each well was washed with 100 μL 1X PBS before
being lysed with 50 μL of 1X passive lysis buffer for 1 hr with shaking. Then 20 μL of
HEK293T/17 or 30 μL of HepG2, HCT116 and MCF-7 lysates were measured for firefly
and Renilla luciferase activity using 70 μL each of the Luciferase Assay Reagent II and
Stop & Glo® reagents from the Dual-Luciferase® Reporter Assay System in a GloMax 96
microplate Dual Injector Luminometer. The firefly activity was normalized to the Renilla
activity per well to control for transfection efficiency. Each experiment also included the
empty pGL4.23 or pGL3-promoter vector as the negative control and the APOE-pGL4.23
or pGL4.13 vector as the positive control. The enhancer activity for each plasmid was
calculated as the ratio of its normalized firefly activity to that of the empty vector.
4.3.9. Hydrodynamic Tail Vein Injection
Positive in vitro enhancer elements were screened for in vivo liver enhancer
activity through the hydrodynamic tail vein injection70 adapted for enhancer element
screening71 (see Figure 4.10). Each construct was injected into the tail vein of 4-5 mice
using the TransIT EE In Vivo Gene Delivery System following the manufacturer’s
protocol. Briefly, 10 μg of pGL4.23 vector with or without enhancer element, or the
ApoE69 positive control liver enhancer, along with 2 μg of pGL4.74 were injected into the
tail vein of CD1 mice. After 24 hr, mice were euthanized and their livers were harvested.
Each liver was homogenized in 3 mL of 1X passive lysis buffer and then centrifuged at
4°C for 30 min at 14,000 rpm. The supernatant was diluted 1:20 with lysis buffer and
measured for firefly and Renilla luciferase activity using the Dual-luciferase® reporter

225
assay system according to the manufacturer’s protocol in a Synergy 2 (BioTek
Instruments, Winooski, VT) microplate reader. Each sample lysate was read in replicate
3-6 times, with firefly activity normalized to the Renilla activity and then averaged across
the replicates. The enhancer or ApoE normalized firefly activity was expressed as fold
activation relative to pGL4.23. All mouse work was done following a protocol approved
by the UCSF Institutional Animal Care and Use Committee.
4.3.10. Data Mining and Retrieval from ENCODE
The Encyclopedia of DNA Elements (ENCODE) consortium is constantly adding
to the available data from a variety of assays and methods to identify functional
regulatory elements in the genome66. Through the UCSC genome browser portal to the
ENCODE data, information on the occupancy density of histone modifications for an
enhancer region of the genome was extracted. Histone modifications associated with
active regulatory elements (H3K27ac)72 and general regulatory elements (H3K4me1)72,73
were the focus of his analysis. Sensitivity of the DNA region to the DNaseI nuclease was
also analyzed. DNaseI hypersensitivity sites are an indication of open chromatin around
active genes74, and they are also present when TFs bind and displace histones46,75,76. The
last, and by far most extensive, ENCODE dataset that was mined was mapping of TFs
bound to the genome through the ChIP-seq approach77. In addition to utilizing the TF
ChIP-seq clustering from ENCODE to identify priority putative enhancer elements,
additional ChIP-seq peaks for each of the positive in vivo enhancers were analyzed in
order to get an idea of which TFs are binding to the enhancer element. There are five
separate experiments of ENCODE ChIP-seq data available through the UCSC genome

226
browser, each named for the centers that did them: HAIB, SYDH, UChicago, UTA and
UW. The strongest genome-wide peaks that are replicated are combined in the Txn
Factor track77; the density of TFBS from this track was used in our initial weighting of
putative enhancer elements. For further analysis of the positive in vivo enhancers, the
density of TF signals in each of the ChIP-seq experiments for all available cell lines and
TFs was analyzed. TFs that had strong signal density, in both replicates, for multiple cell
lines and reported interesting findings in Figure 4.12-Figure 4.17 were of most interest.
ENCODE data was accessed through the full or preview UCSC genome browser portal
(http://genome.ucsc.edu/ENCODE). Data from this analysis is displayed as shaded
density bars indicating both strength of signal for TF and histone association with the
DNA region and degree of sensitivity of the DNA to DNaseI.
4.3.11. Statistical Analysis
Putative enhancer elements were considered to have statistically significant
enhancer activity over the empty pGL4.23 vector activity if the ANOVA analysis,
followed by a Bonferroni’s multiple comparison t-test, had a P < 0.05 in each experiment
(with 3-6 wells per plasmid) replication. Positive in vitro enhancer elements were chosen
for follow-up in vivo testing when they had significant enhancer activity over the
reference enhancer in two of the four cell lines. For analysis of in vivo results, normalized
enhancer activity from 4 to 5 mice per plasmid was compared to the empty pGL4.23
vector using an ANOVA analysis followed by a Student’s t-test. Constructs were
considered positive in vivo if they had a P < 0.05. Constructs were chosen for in vitro
suppressor follow-up in the pGL3-promoter vector if they exhibited luciferase activity

227
75% reduced from empty vector in one cell line and at least 50% reduced in an additional
cell line. Results for suppressor luciferase assays were expressed as normalized reporter
activity compared to the empty pGL3-promoter vector. Results from each transfection,
with 5 to 10 wells per plasmid, were analyzed with an ANOVA followed by a
Bonferroni’s multiple comparison t-test to compare suppressor constructs to the empty
pGL3-promoter vector with significance determined if P < 0.05. All statistics were run
using the GraphPad Prism 5 software program.
4.4. Results
4.4.1. Identification of High Priority Putative Enhancer Elements
A multistep pipeline was developed to identify and then characterize putative
regulatory elements of ABCG2 (Figure 4.1). A list of over 100 putative enhancer
elements was generated by the in silico analysis of the ABCG2 gene locus (Step 1 of
Figure 4.1). Different characteristics for these elements were compiled through the in
silico analysis; Figure 4.2 is a snapshot of such features, including evolutionary
conservation, predicted TF binding and ChIP-seq data with selected regions highlighted
by red boxes. Regions were ranked and a list of high priority elements were selected
based on evolutionary conservation (Figure 4.2A, Figure 4.2C and Figure 4.2D), the
clustering of predicted cis-elements from Cister plot64 (Figure 4.2E) and ChIP-seq data
available from ENCODE66 (Figure 4.2B) and TRANSFAC65 databases. A list of 30 high
priority elements was generated (Table 4.5 and Figure 4.3), and these regions were
cloned into pGL4.23 [luc2/minP] for in vitro screening. None of the high priority
elements fulfilled the criteria of being ‘core’ ECRs, core ECRs have been previously

228
defined as > 350 bp and > 77% conservation and are associated with developmental
enhancers78. There were five regions that appeared in both the evolutionary conservation
and Cister plot analyses, all of which were ranked in the top thirty. Three regions,
ECR31, ECR33 and ECR52 had preliminary ChIP-seq data from ENCODE and were
also ranked in the top thirty. The high priority putative enhancer elements were evenly
distributed across the ABCG2 gene locus and their relative sizes and locations are
depicted in Figure 4.3.

229

230
Figure 4.2. Snapshot from ABCG2 locus illustrating representative results from
bioinformatic analyses. Red boxes indicate high priority putative ECR regions that
were chosen for further study based on conservation as determined by the Vista Browser
(A), UCSC genome browser mammal base wise conservation (C) or ECR browser
conservation to fish, possum, mouse, canine and monkey (D). Regions were also chosen
based on clusters of TF elements with a probability of binding >0.7 as determined by
Cister plot (E) and overlap of these regions with ENCODE DNaseI, ChIP-seq and
conserved TFBS data (B).

231
Table 4.5. High Priority Putative Enhancer Regions Rank Region Genomic position1 hg18 Genomic position1 hg19 Length
1 ECR425 89409846-89411754 89190822-89192730 1909 2 CR8 89286463-89287815 89067439-89068791 1353 3 ECR423 89408527-89409482 89189503-89190458 956 4 CR9 89302387-89303223 89083363-89084199 837 5 ECR402 89157927-89159110 88938903-88940086 1184 6 CR19 89382285-89383439 89163261-89164415 1155 7 ECR410 89197061-89198542 88978037-88979518 1482 8 ECR400 89142824-89143421 88923800-88924397 598 9 CR10 89307110-89308272 89088086-89089248 1163 10 ECR420 89345102-89346322 89126078-89127298 1221 11 CR7 89275033-89276418 89056009-89057394 1386 12 ECR412 89207879-89208759 88988855-88989735 881 13 ECR25 89234523-89235960 89015499-89016936 1438 14 ECR48 89336705-89336930 89117681-89117906 226 15 ECR429 89430870-89431792 89211846-89212768 923 16 CR15 89331014-89332546 89111990-89113522 1533 17 ECR426 89416468-89417157 89197444-89198133 690 18 ECR17 89190442-89190705 88971418-88971681 264 19 CR16 89333859-89334917 89114835-89115893 1059 20 ECR428 89418093-89419430 89199069-89200406 1338 21 ECR401 89147687-89148807 88928663-88929783 1121 22 ECR38 89271364-89272357 89052340-89053333 994 23 ECR44 89292195-89292446 89073171-89073422 251 24 ECR52 89346636-89346901 89127612-89127877 266 25 CR6 89229977-89230503 89010953-89011479 527 26 ECR55 89363840-89364013 89144816-89144989 174 27 ECR43 89281134-89281346 89062110-89062322 213 28 ECR31 89244906-89245725 89025882-89026701 819 29 ECR54 89352017-89352661 89132993-89133637 644 30 ECR33 89247461-89248430 89028437-89029406 969
1Genomic location on Chromosome 4 Abbreviations: ECR, Evolutionarily Conserved Region; CR, Cister Region

232
Figu
re 4
.3. G
enom
ic r
epre
sent
atio
n of
30
high
pri
ority
put
ativ
e A
BC
G2
enha
ncer
reg
ions
. The
gen
ome
sequ
ence
runs
3’ to
5’ f
rom
left
to ri
ght.
ABC
G2
is o
n th
e an
ti-st
rand
flan
ked
by P
KD
2 an
d PP
MIK
(als
o on
the
anti-
stra
nd).
Puta
tive
enha
ncer
regi
ons a
re d
enot
ed b
y a
red
box
indi
catin
g th
eir s
ize
and
loca
tion.

233
4.4.2. System Controls
For the second step of the enhancer discovery pipeline (Figure 4.1 Step 2), high
priority putative enhancer regions were cloned into pGL4.23 [luc2/minP]. The pGL4.23
vector is a luciferase expression vector with only a minimal promoter before the
luciferase gene. Thus the luciferase gene is only transcribed when an enhancer element is
placed upstream, and the activity of the luciferase gene can be used as a marker of
enhancer activity. The putative enhancer constructs were transiently transfected into four
cell lines to test for their in vitro enhancer activity; top in vitro enhancers were then
injected into the tail vein of mice for quantification of their in vivo enhancer activity.
Putative enhancer elements displaying suppressor characteristics in pGL4.23 were cloned
into the pGL3-promoter vector to be tested for suppressor activity. For all in vitro and in
vivo luciferase experiments an empty vector (either pGL4.23 or pGL3-promoter) was also
transfected as a baseline marker for luciferase activity. The normalized luciferase activity
for the empty vector was set at 1.0 in all experiments (see white bars in Figure 4.4). The
experimental set up for screening the in vitro enhancers was validated using two different
controls. The first is the pGL4.13 [luc2/SV40] vector which has the SV40 early enhancer
driving the expression of the luciferase gene. This construct was an excessively strong
enhancer in all four cell lines ranging from ~100- to ~4000-fold activation relative to
pGL4.23 (checkered bars in Figure 4.4). The second positive control for the in vitro
assay, which was also the positive control for the in vivo tail vein luciferase assay, was a
pGL4.23 construct with the ApoE liver specific enhancer69. This construct exhibited
selected enhancer activity depending upon the cell line. The ApoE enhancer had strong
activity in HepG2 and MCF-7 cells, no enhancer activity in HEK293T and HCT116 cells

234
and strong enhancer activity in vivo (grey bars Figure 4.4). These results indicate that the
in vitro and in vivo luciferase assay systems are capable of finding global enhancers as
well as identifying possible liver-specific tissue enhancers.
Figure 4.4. System controls for the in vitro and in vivo luciferase enhancer assay.
Luciferase activity of the empty vector pGL4.23 (white), global positive control vector
pGL4.13 (checkered) and liver-specific positive control ApoE (grey) was measured in
transiently transfected kidney (HEK293T), liver (HepG2), intestine (HCT116) and breast
(MCF-7) cell lines. The activity of the empty pGL4.23 (white) and ApoE (grey) controls
were also determined in vivo and their luciferase activity is represented by the last two
bars on the right. Enhancer activity is expressed as the ratio of the firefly to Renilla
luciferase activity normalized to the empty vector activity. Data is expressed as the mean
± SEM of one representative experiment (N=3-6 wells per plasmid).

235
4.4.3. In Vitro Enhancers
The thirty high priority putative enhancer elements (listed in Table 4.2) were
transiently transfected into HEK293T (Figure 4.5), HepG2 (Figure 4.6), HCT116 (Figure
4.7) and MCF-7 (Figure 4.8) cell lines and their luciferase activity quantified relative to
empty vector. The HEK293T cells had both the highest number of positive enhancer
elements and the highest activity of putative enhancer elements, with regions such as
CR6, ECR31 and ECR44 showing 32-, 16- and 6-fold activation relative to empty vector
(Figure 4.5). There were five more regions with significant enhancer activity in
HEK293T cells: ECR400, ECR38, ECR52, ECR423 and ECR429. HepG2 cells had six
enhancer regions, of which CR6 had the highest activity with >12-fold activation over
empty vector. The other five enhancers, ECR402, ECR33, ECR44, ECR52 and ECR423,
ranged from 2-4 fold activation (Figure 4.6). In HCT116 cells, only five enhancer
elements were active, the least of any of the tested cells lines (Figure 4.7). The enhancer
activity of CR6 in HCT116 cells was >14-fold, and ECR400, ECR31, ECR33 and
ECR44, ranged from 1.8- to 3- fold activation. Six putative enhancer regions showed
positive activity in MCF-7 cells, although relative enhancer activity was lower than in the
other cell lines (Figure 4.8). ECR400, CR6, ECR31, ECR44, ECR52 and CR19 had
enhancer activities ranging from 1.8- to 3.5-fold activation in MCF-7 cells (Figure 4.8).
Collective data across all of the cell lines was taken into consideration for
selection of enhancer regions for in vivo follow-up. For simplification, enhancers were
binned according to their ‘strong’ (4-fold and above activation), moderate (2- to 4-fold
activation) and weak (1.5- to 2-fold activation) enhancer activities. The strong and most
reproducible enhancer element was CR6. It was a strong enhancer element in all four cell

236
lines, with up to 32-fold increase relative to empty vector. The next most reproducible
enhancer element was ECR44; it had strong enhancer activity in HEK293T cells and
moderate enhancer activity in the other three cell lines. ECR31 had over a 16-fold
activation in HEK293T cells, was a moderate enhancer in HCT116 cells and a weak
enhancer in MCF-7s. Two more regions had enhancer activity in three of the four cells
lines: ECR52 was a moderate enhancer in both HEK293T and HepG2 cells and a weak
enhancer in MCF-7 cells, while ECR400 had moderate activity in MCF-7 cells and weak
activity in both HEK293T and HCT116 cell lines. Two regions had enhancer activity in
two of the four cell lines: ECR33 was a moderate enhancer in HepG2 cells and a weak
enhancer in HCT116 cells, whereas ECR423 had moderate enhancer activity in both
HEK293T and HCT116 cell lines. Finally, three regions had enhancer activity in only
one of the four cells lines: CR19 was a moderate enhancer in MCF-7 cells, ECR429 was
a weak enhancer in HEK293T cells and ECR402 was a weak enhancer in HepG2 cells.
All elements that had significant enhancer activity in at least one cell line, except for
ECR402, were followed up in vivo. The ECR402 was not included in the in vivo follow-
up because its enhancer activity in the HepG2 cells was barely significant (P = 0.05) and
not over 1.5-fold. The other two regions that were significant in only one cell line both
had activities over 1.8-fold above empty vector.
The pGL4.23 vector has very little basal luciferase activity. However, it can still
be useful to obtain a sense of which regions might have suppressive qualities. Regions
that had at least 50% reduction in activity for all cell lines (relative to empty pGL4.23),
along with one region with suppressive activity in two cell lines, were cloned into the
pGL3-promoter [luc+/SV40] vector. The pGL3-promoter vector has a much higher basal

237
transcription of luciferase and is thus a better system to screen regions for suppressor
activity. Of the thirty regions analyzed in the enhancer screen, seven (ECR410, ECR17,
CR7, CR11, CR15, ECR43 and ECR425) had a 50% decrease in luciferase activity in all
four cell lines. All of these, except ECR43, CR11 and CR15, were followed up for
suppressor activity in the pGL3-promoter. Three enhancer regions (ECR25, CR16 and
ECR428) showed a 75% decrease in three cell lines and 50% in the fourth. All three of
these regions were chosen for suppressor follow-up. The final construct chosen for
suppressor follow-up was ECR429, which was only suppressive in HepG2 and HCT116
cells. It was chosen for follow-up over other suppressor regions because it had significant
enhancer activity in HEK293T and slight activity in MCF-7 cells (although it did not
reach significance), suggesting the possibility of finding elements with tissue specific
enhancer or suppressor activity.
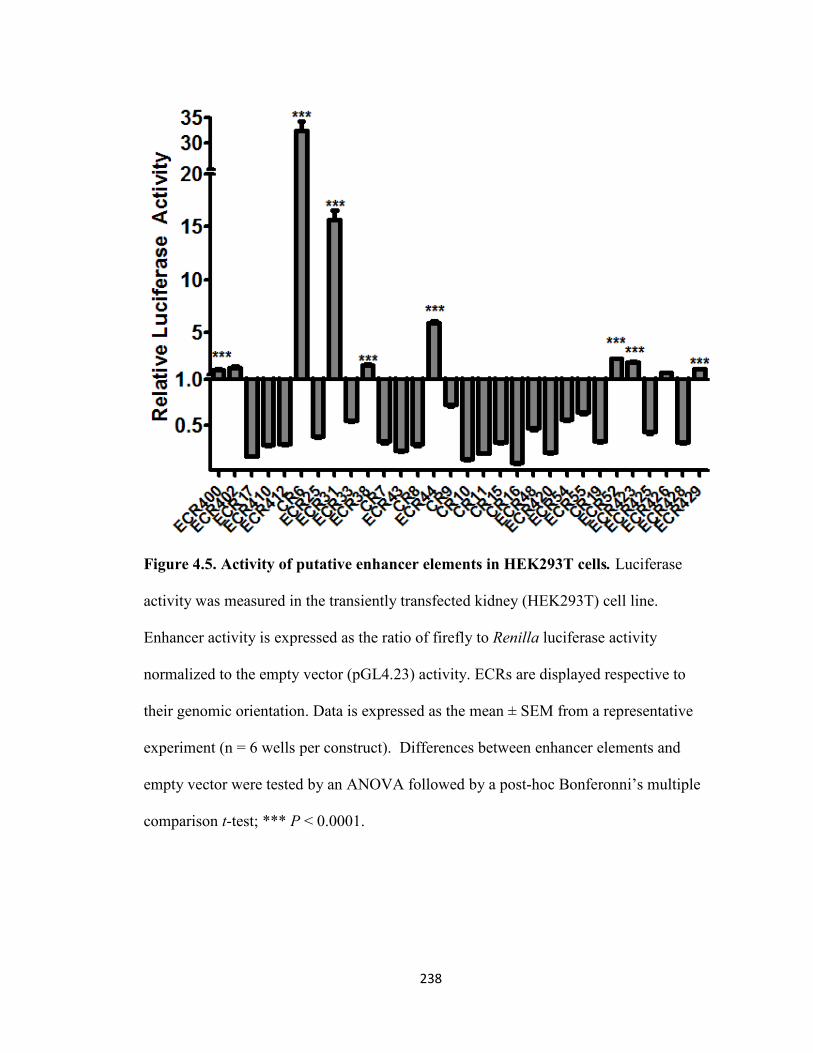
238
Figure 4.5. Activity of putative enhancer elements in HEK293T cells. Luciferase
activity was measured in the transiently transfected kidney (HEK293T) cell line.
Enhancer activity is expressed as the ratio of firefly to Renilla luciferase activity
normalized to the empty vector (pGL4.23) activity. ECRs are displayed respective to
their genomic orientation. Data is expressed as the mean ± SEM from a representative
experiment (n = 6 wells per construct). Differences between enhancer elements and
empty vector were tested by an ANOVA followed by a post-hoc Bonferonni’s multiple
comparison t-test; *** P < 0.0001.

239
Figure 4.6. Activity of putative enhancer elements in HepG2 cells. Luciferase activity
was measured in the transiently transfected liver (HepG2) cell line. Enhancer activity is
expressed as the ratio of firefly to Renilla luciferase activity normalized to the empty
vector activity (pGL4.23). ECRs are displayed respective to their genomic orientation.
Data is expressed as the mean ± SEM from a representative experiment (n = 3 wells per
construct). Differences between enhancer elements and empty vector were tested by an
ANOVA followed by a post-hoc Bonferonni’s multiple comparison t-test; *** P <
0.0001, ** P < 0.001, * P < 0.05.

240
Figure 4.7. Activity of putative enhancer elements in HCT116 cells. Luciferase
activity was measured in the transiently transfected intestine (HCT116) cell line.
Enhancer activity is expressed as the ratio of firefly to Renilla luciferase activity
normalized to the empty vector activity (pGL4.23). ECRs are displayed respective to
their genomic orientation. Data is expressed as the mean ± SEM from a representative
experiment (n = 6 wells per construct). Differences between enhancer elements and
empty vector were tested by an ANOVA followed by a post-hoc Bonferonni’s multiple
comparison t-test; *** P < 0.0001, ** P < 0.001, * P < 0.05.
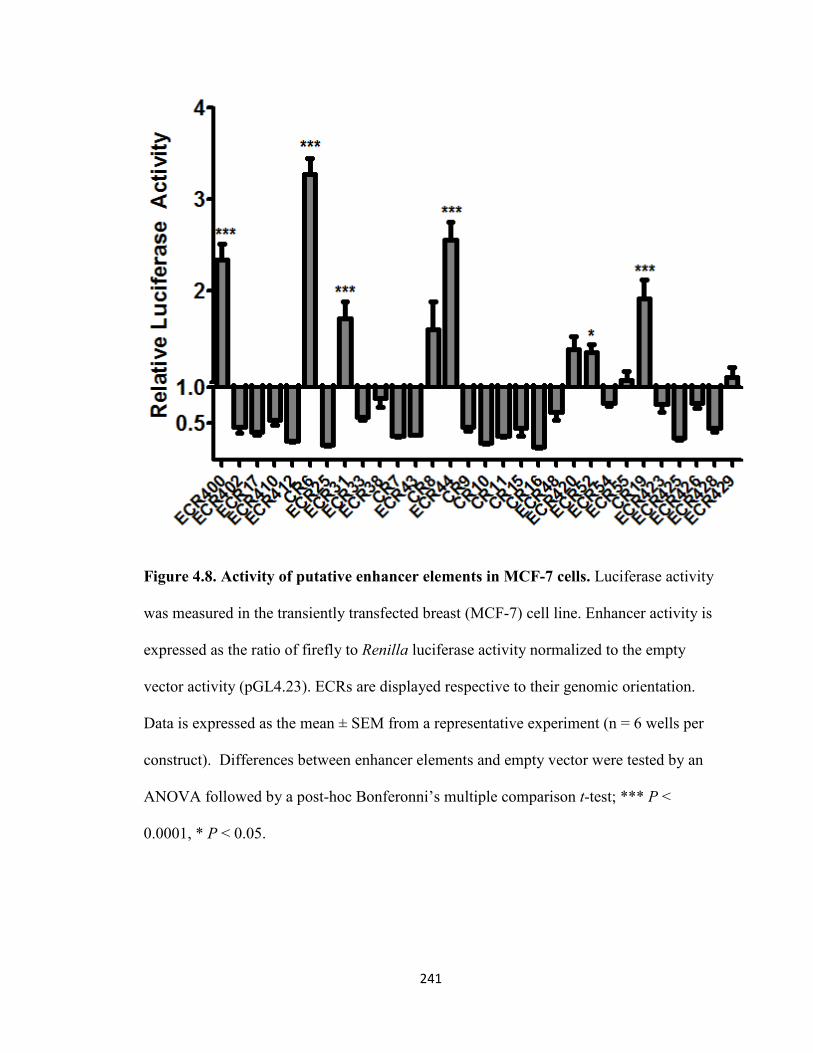
241
Figure 4.8. Activity of putative enhancer elements in MCF-7 cells. Luciferase activity
was measured in the transiently transfected breast (MCF-7) cell line. Enhancer activity is
expressed as the ratio of firefly to Renilla luciferase activity normalized to the empty
vector activity (pGL4.23). ECRs are displayed respective to their genomic orientation.
Data is expressed as the mean ± SEM from a representative experiment (n = 6 wells per
construct). Differences between enhancer elements and empty vector were tested by an
ANOVA followed by a post-hoc Bonferonni’s multiple comparison t-test; *** P <
0.0001, * P < 0.05.

242
4.4.4. In Vitro Suppressors
Suppressor activity of ten regions was determined by cloning them into the pGL3-
promoter vector, transiently transfecting them into four cell lines and measuring the
resulting luciferase activity relative to empty vector. The strongest and most consistent
suppressor was ECR25 (Figure 4.9). It had >75% decrease in luciferase activity in both
HepG2 (Figure 4.9A) and HCT116 (Figure 4.9C), and a 50% decrease in HEK293T
(Figure 4.9B) and MCF-7 (Figure 4.9D) cells. ECR25 was the only significant suppressor
in the HEK293T cell line (Figure 4.9B). Three elements: ECR428, CR7 and ECR429 had
significantly decreased luciferase activity in the HepG2 (Figure 4.9A) and HCT116
(Figure 4.9C) cell lines. ECR412 luciferase activity was significantly decreased in both
the HCT116 (Figure 4.9C) and MCF-7 (Figure 4.9D) cell lines. ECR412 and ECR25
were the only two suppressors in the MCF-7 (Figure 4.9D) cell line. The last two
elements with suppressor activity, CR10 and ECR425, were only significant in the
HCT116 (Figure 4.9C) cell line. ECR429 had 2-fold increase in activity in both HEK293
and MCF-7 cells, the same cells it was an enhancer in with the pGL4.23 screen, and 50%
decreased activity in the HEK293T and HCT116 cell lines.
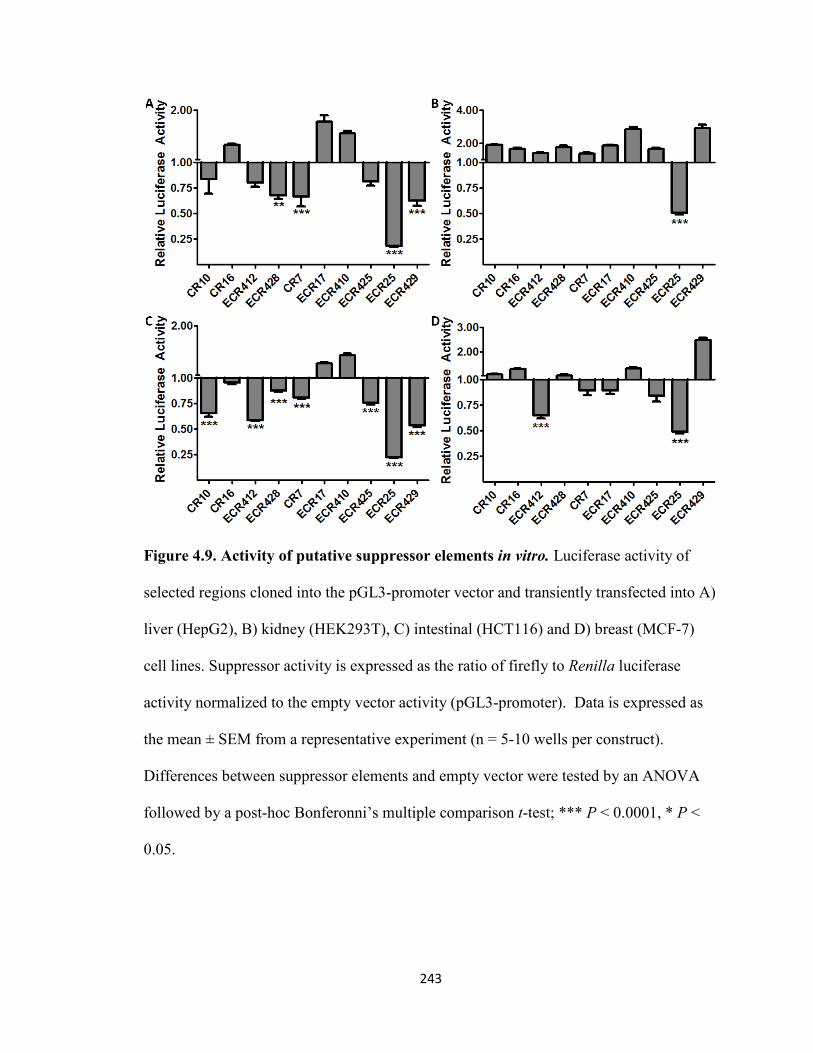
243
Figure 4.9. Activity of putative suppressor elements in vitro. Luciferase activity of
selected regions cloned into the pGL3-promoter vector and transiently transfected into A)
liver (HepG2), B) kidney (HEK293T), C) intestinal (HCT116) and D) breast (MCF-7)
cell lines. Suppressor activity is expressed as the ratio of firefly to Renilla luciferase
activity normalized to the empty vector activity (pGL3-promoter). Data is expressed as
the mean ± SEM from a representative experiment (n = 5-10 wells per construct).
Differences between suppressor elements and empty vector were tested by an ANOVA
followed by a post-hoc Bonferonni’s multiple comparison t-test; *** P < 0.0001, * P <
0.05.

244
4.4.5. In Vivo Enhancers
Nine of the in vitro enhancers were selected for in vivo validation using the
hydrodynamic tail vein injection technique (Figure 4.10). In this technique, naked DNA
is injected quickly into the tail vein of the mouse, which due to overload of the heart,
causes hepatocytes to take up the DNA70,79. At some point after injection, the liver of the
mice is extracted and the hepatic lysate luciferase activity is measured. The positive
control for this assay was the ApoE liver-specific enhancer in the pGL4.23 vector,
previously shown to be a strong enhancer in vivo69 and an effective control for the
hydrodynamic tail vein injection80. This enhancer gave consistently strong enhancer
activity, with over 40-fold activation, confirming that the tail vein injection assay was
working (Figure 4.11). Of the nine enhancer elements tested in vivo, six of them had
significant enhancer activity (Figure 4.11), giving a 67% rate of successful in vivo
activity when picking enhancers based on in vitro enhancer activity in four separate cell
lines. The CR6 construct had the lowest significant enhancer activity in vivo, barely
reaching 1.8-fold activation. The next four strongest enhancers, ECR31, ECR33, ECR44
and ECR423, all had enhancer activity ranging from 5- to 12- fold relative activation. The
strongest enhancer was the ECR400 region; it had consistent activation over 120-fold
relative to empty vector, which is almost three times that of the positive ApoE control.
The strong in vivo enhancer capabilities of these regions lead to the question of whether
SNPs within these regions alter their enhancer capabilities.

245
Figure 4.10. Schematic of the in vivo hydrodynamic tail vein injection assay. DNA
sequences with in vitro enhancer activity are injected into the tail vein of a mouse with a
large volume of water (10% of mouse weight) over a short time (5-8 seconds). Relative
luciferase activity is measured in liver homogenates 24 hr post injection, image is
reproduced from Kim, et al. 201180.
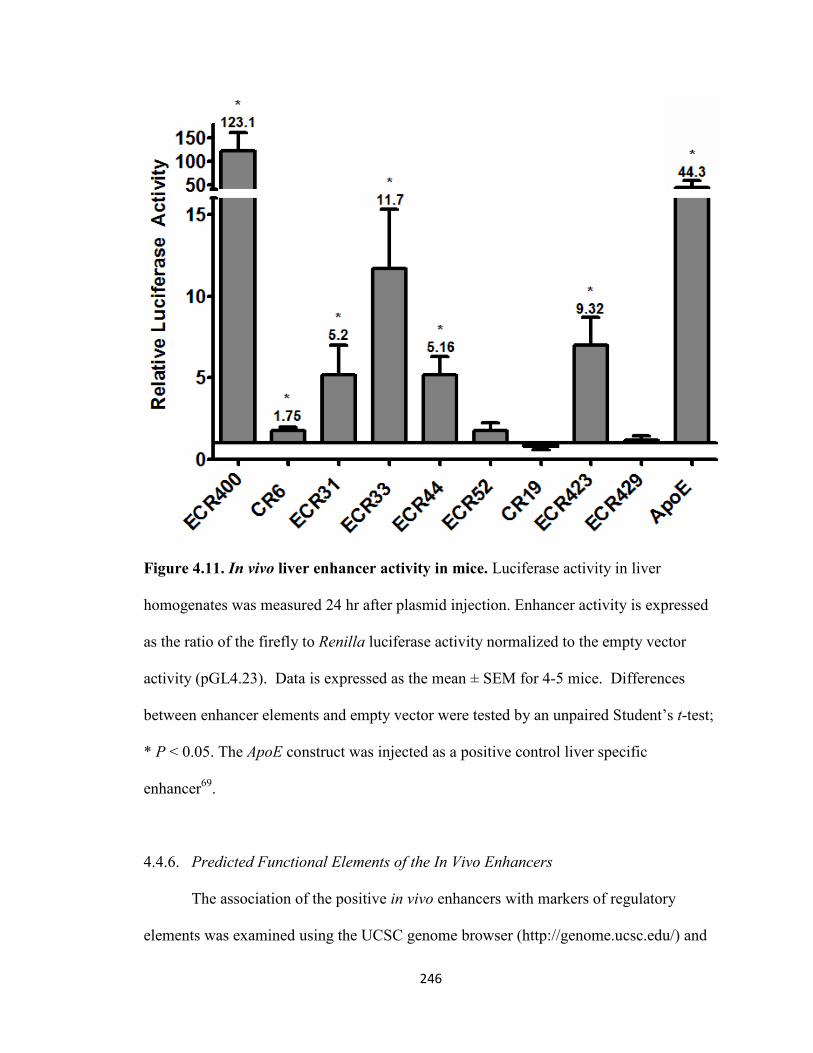
246
Figure 4.11. In vivo liver enhancer activity in mice. Luciferase activity in liver
homogenates was measured 24 hr after plasmid injection. Enhancer activity is expressed
as the ratio of the firefly to Renilla luciferase activity normalized to the empty vector
activity (pGL4.23). Data is expressed as the mean ± SEM for 4-5 mice. Differences
between enhancer elements and empty vector were tested by an unpaired Student’s t-test;
* P < 0.05. The ApoE construct was injected as a positive control liver specific
enhancer69.
4.4.6. Predicted Functional Elements of the In Vivo Enhancers
The association of the positive in vivo enhancers with markers of regulatory
elements was examined using the UCSC genome browser (http://genome.ucsc.edu/) and
247
ENCODE66 database. The ECR400 enhancer was highly sensitive to DNaseI in multiple
cell lines and in CD34- maturating myeloid cells, but not in CD34+ hematopoietic stem
cells (Figure 4.12). There are three conserved TFBS in ECR400: Oct1, MIF1 and RFX
(Figure 4.12). The only TF that had consistent signal peaks in the ENCODE ChIP-seq
data for ECR400 was CTCF; it was present in several cell lines including the MCF-7 and
HepG2 cell lines (Figure 4.12). In contrast, the CR6 enhancer had no hypersensitivity to
DNaseI, but it did have several dense ChIP-seq peaks, particularly in the center of the
region (Figure 4.13). The ChIP-seq signal peaks in the CR6 enhancer region include
CEBPB, CREB1, E2F6, Max, USF1, TEAD4, PML, SRF, FOSL2, NFIC, p300, CTCF
and Egr-1 (Figure 4.13).
The two enhancers with the most functional markers were ECR31 (Figure 4.14)
and ECR33 (Figure 4.15). The ECR31 enhancer region was associated with both
H3K27ac and H3K4me1 histone markers; it was also very sensitive to DNaseI in over
100 cell lines (Figure 4.14). Additionally, there were many dense ChIP-seq peaks in the
ECR31 region (Figure 4.14). TFs that mapped to ECR31 include GATA-2 and -3, AP-2γ,
AP-2α, p300, c-Fos, JunD, c-Jun, CEBPB, PRDM1 and FOXA1 (Figure 4.14). Several of
these TFs, including AP-2γ, AP-2α, JunD, c-Jun and CEBPB were in the HepG2 cell line.
The ECR33 enhancer also had extensive transcriptional marker associations including
strong H3K4me1 markers, heavy DNaseI sensitivity clusters and many TF ChIP-seq
peaks (Figure 4.15). TFs bound to the ECR33 region are p300, Pol2, FOXA1, TBP,
ELF1, FOSL2, HEY1, TCF4, FOXA2, HNF4α, GR, HDAC2, CEBPB, RXRα, c-Jun,
JunD, MafF and MafK. Interestingly, GR was bound to the ECR33 region in A549 cells
when they were treated with increasing concentrations of dexamethasone. Also, CEBPB

248
was bound to ECR33 in both untreated HepG2 and after forskolin treatment. Additional
ChIP-seq signal peaks occurred for GATA3 and Max in MCF-7 and HCT116 cell lines
(Figure 4.15).
The last two enhancer regions ECR44 and ECR423 had considerably fewer
markers of functional transcription as compared to ECR31 and ECR33. The ECR44
enhancer region, located in intron 1 of ABCG2, had both histone and TFs markers
associated with it (Figure 4.16). Moderate peaks for H3K27ac and weak peaks for
H3K4me1 markers were located over the ECR44 enhancer (Figure 4.16). TFs with dense
signal peaks in the ECR44 region included CREB1, CEBPB, GATA3, Max, NRF2, p300,
TAF1, ATF3 and JunD. Several of these TFs, such as Max and CEBPB were in the
MCF-7 and HCT116 cell lines (Figure 4.16). The ECR423 enhancer region, located over
an exon of PPM1K, was also associated with H3K27ac and H3K4me1 markers, but it
was not sensitive to DNaseI (Figure 4.17). Additionally it had ChIP-seq signal peaks for
TFs including CREB1, CEBPB, Max, NRF2, p300, FOSL2 and SRF (Figure 4.17).

249
Figure 4.12. ENCODE data in ECR400. From top to bottom: the genomic coordinates
(chr4:88923800-88924397; hg19) followed by a black bar indicating the area covered by
the ECR400 enhancer. This is followed by a density bar indicating the accessibility of the
DNA to DNaseI from all cell types (black shaded bar) and then in CD34+/- cells (blue
bar). Next are the locations of three conserved TFBs as determined by rVista. Following
this is the DNA occupancy of the CTCF TF as determined by ChIP-seq. Each cell line is
on its own line followed by a bar, with the length indicating the breadth of the peak and
the shading density indicating its strength. Finally, black lines indicate locations with
associated rs numbers for the SNPs reported in dbSNP 137. Schematic was made using
the UCSC genome preview browser.

250
Figure 4.13. ENCODE data in CR6. From top to bottom: the genomic coordinates
(chr4:89010953-89011479; hg19) followed by a black bar to indicating the area covered
by the CR6 enhancer. Following this is the DNA occupancy of several transcription TFs
as determined by ChIP-seq. Representative cell lines for each TF are grouped together,
with the length indicating the breadth of the peak and the shading density indicating its
strength. Cell lines include GM12878 (GM78), ECC1, HCT116 (HCT), H1-hESC
(hESC), SK-N-SH (SKSH), and MCF-7. Finally, black lines indicate locations with
associated rs numbers for the SNPs reported in dbSNP 137, blue SNPs indicate those in
the 3’UTR of ABCG2. Schematic was made using the UCSC genome preview browser.

251
Figure 4.14. ENCODE data in ECR31. From top to bottom: the genomic coordinates
(chr4:89025882-89026701; hg19), blue hatched lines indicating intron 10 of ABCG2 and
then black boxes indicating the area covered by the ECR31 enhancer. These are followed
by density bars indicating the DNA occupancy of H3K27ac and H3K4me1, and the
accessibility of the DNA to DNaseI in all cell types. Next is ChIP-seq data from the
combined TxN ChIP-seq ENCODE data, with each TF on its own line followed by a bar,
with the length indicating the breadth of the peak and the shading indicating its strength.
Each bar is followed by letters to indicate the cell line the signal was found in: H, HeLa-
S3; U, HUVEC; s, SH-SY5Y; t, T-47D; u, U2OS. Finally, black lines indicate locations
with associated rs numbers for the SNPs reported in dbSNP 137. Schematic was made
using the UCSC genome preview browser.

252
Figure 4.15. ENCODE data in ECR33. From top to bottom: genomic coordinates
(chr4:89028437-89029406; hg19), blue hatched lines indicating intron 9 and then black
boxes indicating the area covered by the ECR33 enhancer. Next are density bars
indicating the DNA occupancy of H3K4me1 and the accessibility of the DNA to DNaseI
in all cell types. Following this is ChIP-seq data from the combined TxN ChIP-seq
ENCODE data, with each TF on its own line followed by a bar, with the length indicating
the breadth of the peak and the shading indicating its strength. Each bar is followed by

253
letters to indicate the cell line the signal was found in: L, HepG2, s, SH-SY5Y; a, A549;
u, U2OS. Multiple repeats of a letter behind a TF bar indicate the peak came up in the
cell line when treated with a drug. For GR it is from the A549 cell line when treated with
(in order) 5 nM, 50 nM, 500 pM and 100 nM dexamethasone. For CEBPB it is from the
HepG2 cell line untreated and after forskolin treatment. Next are ENCODE ChIP-seq
peaks. Representative cell lines for each TF are grouped together, with each cell line on
its own line followed by a bar, with the length indicating the breadth of the peak and the
shading density indicating its strength. TFs are GATA3 and Max in the cell lines MCF-7,
HCT116 (HCT) and SK-N-SH (SKSH). Finally, black lines indicate locations with
associated rs numbers for the SNPs reported in dbSNP 137. Schematic was made using
the UCSC genome preview browser.

254
Figure 4.16. ENCODE data in ECR44. From top to bottom: the genomic coordinates
(chr4: 89073171-89073422; hg19) followed by black boxes indicating the area covered
by the ECR44 enhancer. Following this are blue hatched lines indicating intron 1 of
ABCG2. Two density bars indicate the DNA occupancy of H3K27ac and H3K4me1.
Following this is the DNA occupancy of several TFs as determined by ChIP-seq.
Representative cell lines for each TF are grouped together, with each cell line on its own
line followed by a bar, with the length indicating the breadth of the peak and the shading
density indicating its strength. Cell lines include K562, A549, T47D, ECC1, HCT116
(HCT), SK-N-SH (SKSH), and MCF-7. Finally, black lines indicate locations with
associated rs numbers for the SNPs reported in dbSNP 137. Schematic was made using
the UCSC genome preview browser.

255
Figure 4.17. ENCODE data in ECR423. From top to bottom: the genomic coordinates
(chr4:89189503-89190458; hg19), followed by black boxes indicating the area covered
by the ECR423 enhancer. Following this are blue hatched lines indicating intron 1 and
exons of PPM1K. Two density bars indicate the DNA occupancy of H3K27ac and
H3K4me1. Following this is the DNA occupancy of several TFs as determined by ChIP-
seq. Representative cell lines for each TF are grouped together, with each cell line on its
own line followed by a bar, with the length indicating the breadth of the peak and the
shading density indicating its strength. Cell lines include HepG2 (HepG) and MCF-7.
Finally, black lines indicate locations with associated rs numbers for the SNPs reported in
dbSNP 137: non-coding SNPs are in black, non-synonymous SNPs are in red and
synonymous SNPs are in green. Schematic was made using the UCSC genome preview
browser.

256
4.5. Discussion
Alteration of ABCG2 gene expression has been shown after many types of
stimulus including hypoxia35, inflammation36, xenobiotics37, hormones38,39 and
nutrients40,41. Additionally ABCG2 is only expressed in select tissues, such as liver,
intestine and breast4. Variability of ABCG2 expression has not been accounted for by
non-synonymous variants of ABCG233, and thus additional mechanisms are indicated as a
cause of variation in expression28. There is much evidence for cis-elements in the
regulation of tissue-specific genes81, and it is becoming rapidly apparent that many TFs
prefer to bind at cis-elements rather than proximal promoters to confer gene
induction48,50. Thus, the several response elements for NRs and other TFs that have been
mapped to the ABCG2 proximal promoter might contribute less to the variability of
ABCG2 expression and indeed no SNPs have been reported within these response
elements33. Aside from elements in the proximal promoter, very little has been done to
identify either nuclear response elements or tissue-specific suppressors and enhancers of
ABCG2 within its gene locus. The possibility of finding a tissue-specific cis-regulatory
element of ABCG2 could have implications on ABCG2 variation within those tissues. In
the present study regulatory elements in the ABCG2 gene locus were identified and
characterized through in silico, in vitro and in vivo methods.
Our in silico scheme, considering DNA conservation, TFBS conservation, TF
clustering and ChIP-seq, was able to identify over 110 putative enhancer elements and
thirty high priority regions were selected for in vitro screening. Of the thirty high priority
putative regulatory elements screened in vitro, eleven had in vitro enhancer activity in at
least one cell line. Additionally, ten of the high priority regulatory elements were

257
screened for suppressor activity and seven of the ten elements had suppressor activity in
at least one cell line, with the ECR429 region having cell-dependent suppressor and
enhancer activity. Therefore, based on in silico predictions we were able to identify
seventeen regions with in vitro regulatory activity, a 57% success rate. The in vitro assays
allowed us to have stringent criteria for selecting enhancer elements for in vivo follow up.
We screened nine regions in the in vivo hydrodynamic tail vein assay and identified six
regions with positive in vivo enhancer activity, a 67% success rate. Of the thirty regions
that entered the in vitro characterization steps, six of them were positive in vivo liver
enhancers, an overall 20% success rate. Our in vivo success rate was two-fold higher than
in a previous liver membrane transporter enhancer screen which utilized conservation and
liver-specific TFBS as criteria to screen regions for in vivo liver enhancer activity80,
indicating that an additional layer of in vitro cell-based screening or the addition of ChIP-
seq data could improve the selection process for in vivo enhancers. We also observed that
none of the positive in vivo enhancer elements were greater than 1000 bp, which is less
than that seen for developmental enhancers57 but consistent with other in vivo liver
enhancer regions80. Only two of the suppressor regions, ECR25 (1438 bp) and ECR425
(1909 bp) were over 1000 bp long. The current understanding is that regulatory elements
can range from 100 to several kb, but are on average 500 bp55.
The strength of our enhancers both in vitro and in vivo was quite high. Our in vivo
liver enhancer activity ranged from ECR400 at >120-fold activation, three times that of
the positive ApoE control, to 1.7- fold in the CR6 enhancer; the remaining enhancers
showed 5- to 12- fold relative activation. This degree of activation is in the range of the
strong enhancer elements previously discovered in screens for regulatory elements of
258
membrane transporters80,82. Additionally, these elements have strong enough enhancer
activity that alterations in activity due to SNPs could be detected. Characterization of
SNP effects on these in vivo liver enhancer elements is reported in Chapter 5.
At the beginning of our screen, only a few of the ENCODE ChIP-seq experiments
had been completed and the data publicly available. However, there are now many
experiments on the ChIP-seq database, including cells before and after treatment with NR
ligands that would be an excellent source for future regulatory element searches66. It is
worth noting that not all of the regions with ChIP-seq data were enhancers. ECR54 for
example has many ChIP-seq peaks, especially strong and reproducible signals for CTCF
(data not shown), but ECR54 showed neither enhancer nor suppressor activity in most of
the cell lines. This could be because CTCF can act as a general TF, but it is most well
known for its ability to act as an insulator and modulator of chromatin structure76,83.
Additionally, our highest in vivo enhancer ECR400 was fairly devoid of ChIP-seq data.
Clearly we cannot just rely on ChIP-seq data to find regulatory elements, as there are
many TFs that have either not been characterized or do not have reliable antibodies for
use in ChIP-seq experiments.
In order to investigate possible mechanisms driving the activity of our positive in
vivo enhancers, we mined the ENCODE database for ChIP-seq signals of TF binding and
DNaseI hypersensitivity; additional data from our original in silico screen, such as
conserved TFBS was also considered for these regions. Our strongest in vivo enhancer
was ECR400, but it was a relatively weak in vitro enhancer and had no activity in HepG2
cells. ECR400 has a conserved binding site for Octamer 1 (Oct1, POU2F1), a TF which
has been shown to interact with NRs RXRα84, GR, AR and PR85,86 and general TFs like

259
Sp187,88. ECR400 has only weak ChIP-seq peaks for CTCF in several cell lines but strong
DNaseI sensitivity. CTCF has also been reported to act on its own as both a suppressive
and activating TF83, however CTCF is most strongly linked to decreased gene
expression89, therefore it is likely that additional TFs not picked up in the ENCODE
ChIP-seq experiments are driving the activity of ECR400. For example, our TRANSFAC
analysis of ECR400 predicted binding sites for CAR, LXR, PXR, VDR and AhR (data
shown in Chapter 6: Table 6.1). Additional studies to characterize the TFs responsible for
this strong activity of the in vivo liver enhancer ECR400 are discussed in Chapter 6. It is
also important to note with ECR400 that it is ~4000 bp upstream of the PKD2 promoter
and could alternatively be regulating the expression of PKD2 or be working as a loci
enhancer element to regulate both the expression of PKD2 and ABCG2.
In contrast to ECR400, CR6 was the strongest in vitro enhancer in all the cell
lines, but it had relatively weak enhancer activity in vivo, hardly reaching significance
with a 1.7-fold activation. CR6 is located just downstream of the 3’ end of ABCG2, an
ideal location for looping around and regulating the transcription of ABCG2. Some of the
strongest ChIP-seq signals in CR6 were for Max, FOSL2, CTCF and CREB1. FOSL2 is a
member of the c-Fos TF family and a TF that can dimerize with other AP-1 proteins at
AP-1 sites90. AP-1 and CREB1 have both been shown to interact with hormone receptors,
like ER, during their response to ligands91–93. Additionally, we explore and discuss a
PXR-dependent activation of CR6 activity in Chapter 6. If CR6 is relevant to the
hormonal alteration of ABCG2 expression, the absence of hormone receptor ligand could
account for the lack of in vivo activity of CR6. As our cells were cultured in phenol red
containing media, it is important to note that this media on cells in vitro has been reported

260
to work as a NR ligand94. This could also be the case for CR19, which had no in vivo
activity, but has ChIP-seq peaks for multiple ER binding sites and is induced by estrogen
(see Chapter 6).
Another possible TF relevant for CR6 activity could be Max. Max is a dimer
partner to the Myc proteins, and Myc-Max dimers usually activate genes through
enhancer elements95. Additionally, cMyc-Max have been shown to bind to the proximal
promoter of ABCG2, only when it is unmethylated, to activate ABCG2 transcription95,96.
Since Myc is a well known oncogene and increases in ABCG2 expression cause drug
resistance in tumor cells, finding regulatory elements that link Myc with ABCG2
expression could provide additional mechanisms for the acquisition of drug resistance by
tumor cells and possible targets to reverse this resistance.
Due to the dynamics of tissue-specific expression of TFs, cis-regulatory elements
could have either suppressor or enhancer activity depending on the balance of TFs
present in the cell. ECR429 is located just upstream of the PPM1K promoter, a location
that could work to regulate either PPM1K or ABCG2. ECR429 was chosen for suppressor
follow-up due to its 50% reduction in activity in both HepG2 and HCT116; suppressive
activity of ECR429 was confirmed in the HEK293T and HCT116 cell lines. ECR429 was
also chosen for in vivo enhancer follow up but did not show any in vivo enhancer activity.
We searched for mechanisms that could explain both suppressor and enhancer properties
of ECR429 in vitro. The ECR429 region has DNaseI sensitivity and a ChIP-seq peak for
the Egr-1 TF (data not shown). The Egr-1 is both a suppressive and activating TF97; it has
been shown to cooperate with p30098, AP-2 and GR99 in activating genes, and could be
responsible for the cell-specific activity of the region. Interestingly, ECR429 activity was

261
decreased upon estrogen treatment and increased with 48 hr dexamethasone treatment
(see Chapter 6). This indicates the possibility that the binding of Egr-1 in ECR429 could
be facilitating the binding of NRs, such as GR, while competing with others, such as ER,
to elicit the activity of ECR429. ECR429 is located upstream of ABCG2 by ~ 120,000 kb
and upstream of PPM1K by ~2,000 bp. Both ER and GR response elements have been
shown to prefer binding to elements far away from the proximal promoter48,49. The only
known ERE for ABCG2 is in the proximal promoter, therefore the location of ECR429
could facilitate the ability of ECR429 to regulate ABCG2 through both ER and GR.
PPM1K has been shown to be a ERα response gene100 and ECR429 could be a possible
ERE for PPM1K too. Further discussion on the hormone regulation of the ECR429
region will be made in Chapter 6.
Three of the in vivo liver enhancers (3 out of 9, 33%) were within intronic regions
of ABCG2, which is consistent with the finding that 40% of enhancers are in intronic
regions81. The ABCG2 intron 10 enhancer ECR31 exhibited activity of 16- fold in
HEK293T and over 2- fold in HCT116 and MCF-7 cells, which were confirmed by in
vivo liver enhancer activity of 5-fold. There were many strong ChIP-seq peaks in the
ECR31 enhancer including sites for GATA-2, AP-2γ, AP-2α, p300, GATA3, c-Fos,
JunD, c-Jun, CEBPB, FoxAl and KAP1. JunD, c-Jun and c-Fos are all members of the
AP-1 TF complex90. JunD is a central player in lymphoid cells90, c-Jun, which can
dimerize with c-Fos, is essential for hepatic development90,101 and c-Fos is a well known
oncogene implemented in osteogenesis102,103. Additionally, c-Fos and c-Jun were found
bound to ECR31 in human umbilical vein endothelial cells (HUVEC, represented by H in
Figure 4.14). ABCG2 is highly expressed in the side population of hematopoietic stem

262
cells, placental syncytiotrophoblasts and hepatocytes4; it would be interesting to see if
ECR31 assists in this tissue-specific expression of ABCG2. AP-2γ and FoxA1 have been
shown to work as long-range tethering sites for the ERα-mediated transcription53. The
evidence for these TFs binding to ECR31, along with that of p300, could mean that
ECR31 is also relevant to NR regulation of ABCG2 expression. Additional studies are
needed to confirm that these TFs are driving ECR31 activity in vivo.
The second ABCG2 intronic enhancer was ECR33. The ABCG2 intron 9 enhancer
ECR33 was active in HepG2 and HCT116 cells, as well as in vivo. There are many strong
ChIP-seq signals for TFs bound to the ECR33 region. Among them is the HNF4γ nuclear
receptor, which often confers tissue specific expression and is expressed in kidney and
intestine, but not liver104. Since ECR33 was active in the human colon carcinoma cell line
(HCT116), ECR33 could be playing a role in the tissue-specific expression of ABCG2 in
the intestines. Other TFs bound to ECR33 are RXRα and HNF4α. In addition to RXRα’s
importance in the placenta, both TFs are important liver specific nuclear factors105,106.
RXRα and HNF4α have also been shown to interact with each other and with ERα107.
While CAR and PXR crosstalk with FoxA2 to regulate hepatic genes108, the presence of
GR, FoxA1, Sp1, RXRα and a strong p300 ChIP-seq signal indicate a likely role of
ECR33 in hormone response and possibly the expression of ABCG2 in the intestines,
liver and placenta. Interestingly, the GR ChIP-seq peak was seen in A549 cells treated
with increasing concentrations of dexamethasone. Our own assays show ECR33 responds
to both rifampin and estrogen treatment (see Chapter 6). The presence of all these NRs
supports the theory that these TFs work as parts of a functional composite NR response
complex46,48. ECR33 is in intron 9, only 2,000 bp downstream of ECR31; the enhancer’s

263
adjacent locations could allow for them to work together in recruiting additional TFs
necessary to moderate ABCG2 expression in a tissue-specific manner.
The last indentified ABCG2 intronic enhancer, ECR44, is in intron 1. Another
study that utilized conservation and TFBS clustering in order to identify high priority
regions of ABCG2 intron 1 for sequencing, also identified a section of intron 1 that
includes the ECR44 genomic region33. Although this study didn’t test the cis-element
activity of the region, it is promising that our in silico screen was able to identify this
region as having potential cis-regulatory activity. ECR44 had enhancer activity in all four
cell lines and in the liver in vivo. ChIP-seq data shows a signal for binding of TFs
including Max, p300, TAF1 and NR2F2 to ECR44. The NR2F2 TF, also known as
COUP-TFII, is a member of the steroid receptor family and is important in glucose,
cholesterol and xenobiotic metabolism pathways109. The ABCG family has been heavily
associated with the transport of cholesterol steroids110, and ABCG2 itself has been linked
with reducing the efficacy of statin drugs111. COUP-TFII binds to the same direct repeat
segments as VDR, thyroid hormone receptor (TR), retinoic acid receptor (RAR), RXR,
PPAR and HNF-4; therefore its exerts negative regulatory function on these NR by
competing for their common response element109. GR binding stimulates COUP-TFII
induced transactivation by attracting cofactors, while COUP-TFII represses the GR-
governed transcriptional activity by tethering repressors112. With the presence of p300 at
ECR44, this element could be working through NR2F2 to regulate ABCG2 expression in
response to steroids such as cholesterol.
In addition to intronic enhancers, we identified the ECR423 enhancer which
encompasses exon 4 of PPM1K. This is not the first example of a coding exon working
264
as an enhancer to regulate the tissue-specific expression of a neighboring gene113.
However, these examples have been infrequent, probably since in silico pipelines to
identify conserved enhancer elements eliminate coding regions under the assumption that
they are conserved due to being necessary for the protein, not due to cis-regulatory
activity. Since exon 4 of PPM1K is relatively short, we decided not to exclude this region
for our analysis because it also held numerous conserved and non-conserved predicted
TFBS (data not shown) and it is a region with overlapping cis-element clusters and
evolutionary conservation. Unfortunately, there has been very little TF binding
information available from ChIP-seq databases for the ECR423 region. As one of the
strongest in vivo liver enhancers in our screen, additional follow-up assays are warranted
to identify which TFs are driving the activity of ECR423.
The entire pipeline to indentify cis-regulatory elements in the ABCG2 gene locus
yielded many in vivo liver enhancers with strong support of their activity by ChIP-seq
data. It is important to note that although we screened 30 regions in the ABCG2 gene
locus, there is a possibility that we missed other important regulatory regions. Since the
enhancer assay is set up as a putative cis-element cloned into a reporter vector, it is not
able to assess possible long-range dynamics, like enhancer-enhancer interactions.
Additionally, many nuclear response elements work in coordination with other TFs, like
p300, in order to remodel chromatin, and the chromatin context is extremely important in
the TF activity46,114. Without the complex chromatin context that a vector is unable to
provide, in addition to the possibility of not having necessary TFs present in the cells,
some of these regions could still be in vivo cis-regulatory elements. Furthermore, there
are limitations of the hydrodynamic tail vein assay that include possible incompatibilities

265
of mouse TFs with that of human TFBS. Also, we only used livers that were harvested
from mice injected with the enhancer plasmids, so we were not able to address other
tissue-specific enhancers. Some of the in vitro enhancers could possibly be enhancers for
other tissues where ABCG2 is expressed such as in the breast, placenta and intestine. A
developmental screen would be needed to confirm other tissue enhancer activity for these
regions. Although there is the possibility of examining kidney-enhancers through a renal
vein injection115, such an experiment was unsuccessful in our hands due to the difficulty
of injecting mouse renal veins.
4.6. Conclusions
Through detailed in silico, in vitro and in vivo cis-regulatory assays, we identified
multiple regions in the ABCG2 gene locus that function as enhancers and suppressors.
These regions have evidence for TF binding that could link them with tissue-specific or
nuclear receptor responsive expression of ABCG2. Through computational genetics, in
vitro and in vivo assays, regulatory regions can be successfully identified and
characterized. With increasing evidence for the effects of cis-regulatory regions on drug
disposition and efficacy28, identification of these elements can help elucidate how genetic
variants in non-coding regions of the genome cause clinical variation in ADME gene
expression, pharmacokinetics and pharmacodynamics of drug response or disease
progression.
266
4.7. References
(1) Abbott, B. L. ABCG2 (BCRP): a cytoprotectant in normal and malignant stem cells. Clinical advances in hematology & oncology : H&O 2006, 4, 63–72.
(2) Hirschmann-Jax, C.; Foster, a E.; Wulf, G. G.; Nuchtern, J. G.; Jax, T. W.; Gobel, U.; Goodell, M. a; Brenner, M. K. A distinct “side population” of cells with high drug efflux capacity in human tumor cells. Proceedings of the National Academy of Sciences of the United States of America 2004, 101, 14228–33.
(3) Zhou, S.; Schuetz, J. D.; Bunting, K. D.; Colapietro, a M.; Sampath, J.; Morris, J. J.; Lagutina, I.; Grosveld, G. C.; Osawa, M.; Nakauchi, H.; Sorrentino, B. P. The ABC transporter Bcrp1/ABCG2 is expressed in a wide variety of stem cells and is a molecular determinant of the side-population phenotype. Nature medicine 2001, 7, 1028–34.
(4) Maliepaard, M.; Scheffer, G. L.; Faneyte, I. F.; Gastelen, A. Van; Pijnenborg, A. C. L. M. Subcellular Localization and Distribution of the Breast Cancer Resistance Protein Transporter in Normal Human Tissues Subcellular Localization and Distribution of the Breast Cancer Resistance Protein Transporter in Normal Human Tissues 1. 2001, 3458–3464.
(5) Cooray, H. C.; Blackmore, C. G.; Maskell, L.; Barrand, M. a Localisation of breast cancer resistance protein in microvessel endothelium of human brain. Neuroreport 2002, 13, 2059–63.
(6) Doyle, L. A.; Ross, D. D. Multidrug resistance mediated by the breast cancer resistance protein BCRP (ABCG2). Oncogene 2003, 22, 7340–58.
(7) Doyle, L. a; Yang, W.; Abruzzo, L. V; Krogmann, T.; Gao, Y.; Rishi, a K.; Ross, D. D. A multidrug resistance transporter from human MCF-7 breast cancer cells. Proceedings of the National Academy of Sciences of the United States of America 1998, 95, 15665–70.
(8) Allikmets, R.; Schriml, L. M.; Hutchinson, A.; Romano-Spica, V.; Dean, M. A human placenta-specific ATP-binding cassette gene (ABCP) on chromosome 4q22 that is involved in multidrug resistance. Cancer research 1998, 58, 5337–9.
(9) Mao, Q. BCRP/ABCG2 in the placenta: expression, function and regulation. Pharmaceutical research 2008, 25, 1244–55.
(10) Kobayashi, D.; Ieiri, I.; Hirota, T.; Takane, H. Functional assessment of ABCG2 (BCRP) gene polymorphisms to protein expression in human placenta. Drug metabolism and 2005, 33, 94–101.

267
(11) Yeboah, D.; Sun, M.; Kingdom, J.; Baczyk, D.; Lye, S. J.; Matthews, S. G.; Gibb, W. Expression of breast cancer resistance protein ( BCRP / ABCG2 ) in human placenta throughout gestation and at term before and after labor. 2006, 1258, 1251–1258.
(12) Fetsch, P. a; Abati, A.; Litman, T.; Morisaki, K.; Honjo, Y.; Mittal, K.; Bates, S. E. Localization of the ABCG2 mitoxantrone resistance-associated protein in normal tissues. Cancer letters 2006, 235, 84–92.
(13) Jonker, J. W.; Merino, G.; Musters, S.; Van Herwaarden, A. E.; Bolscher, E.; Wagenaar, E.; Mesman, E.; Dale, T. C.; Schinkel, A. H. The breast cancer resistance protein BCRP (ABCG2) concentrates drugs and carcinogenic xenotoxins into milk. Nature medicine 2005, 11, 127–9.
(14) Noguchi, K.; Katayama, K.; Mitsuhashi, J.; Sugimoto, Y. Functions of the breast cancer resistance protein (BCRP/ABCG2) in chemotherapy. Advanced drug delivery reviews 2009, 61, 26–33.
(15) Zamber, C. P.; Lamba, J. K.; Yasuda, K.; Farnum, J.; Thummel, K.; Schuetz, J. D.; Schuetz, E. G. Natural allelic variants of breast cancer resistance protein (BCRP) and their relationship to BCRP expression in human intestine. Pharmacogenetics 2003, 13, 19–28.
(16) Suvannasankha, a; Minderman, H.; O’Loughlin, K. L.; Nakanishi, T.; Greco, W. R.; Ross, D. D.; Baer, M. R. Breast cancer resistance protein (BCRP/MXR/ABCG2) in acute myeloid leukemia: discordance between expression and function. Leukemia : official journal of the Leukemia Society of America, Leukemia Research Fund, U.K 2004, 18, 1252–7.
(17) Suvannasankha, A.; Minderman, H.; O’Loughlin, K. L.; Nakanishi, T.; Ford, L. a; Greco, W. R.; Wetzler, M.; Ross, D. D.; Baer, M. R. Breast cancer resistance protein (BCRP/MXR/ABCG2) in adult acute lymphoblastic leukaemia: frequent expression and possible correlation with shorter disease-free survival. British journal of haematology 2004, 127, 392–8.
(18) Benderra, Z.; Faussat, A.-M.; Sayada, L.; Perrot, J.-Y.; Chaoui, D.; Marie, J.-P.; Legrand, O. Breast cancer resistance protein and P-glycoprotein in 149 adult acute myeloid leukemias. Clinical cancer research : an official journal of the American Association for Cancer Research 2004, 10, 7896–902.
(19) Tsunoda, S.; Okumura, T.; Ito, T.; Kondo, K.; Ortiz, C.; Tanaka, E.; Watanabe, G.; Itami, A.; Sakai, Y.; Shimada, Y. ABCG2 expression is an independent unfavorable prognostic factor in esophageal squamous cell carcinoma. Oncology 2006, 71, 251–8.
268
(20) Usuda, J.; Tsunoda, Y.; Ichinose, S.; Ishizumi, T.; Ohtani, K.; Maehara, S.; Ono, S.; Tsutsui, H.; Ohira, T.; Okunaka, T.; Furukawa, K.; Sugimoto, Y.; Kato, H.; Ikeda, N. Breast cancer resistant protein (BCRP) is a molecular determinant of the outcome of photodynamic therapy (PDT) for centrally located early lung cancer. Lung cancer (Amsterdam, Netherlands) 2010, 67, 198–204.
(21) Uggla, B.; Ståhl, E.; Wågsäter, D.; Paul, C.; Karlsson, M. G.; Sirsjö, A.; Tidefelt, U. BCRP mRNA expression v. clinical outcome in 40 adult AML patients. Leukemia research 2005, 29, 141–6.
(22) Yoh, K. Breast Cancer Resistance Protein Impacts Clinical Outcome in Platinum-Based Chemotherapy for Advanced Non-Small Cell Lung Cancer. Clinical Cancer Research 2004, 10, 1691–1697.
(23) Mo, W.; Zhang, J.-T. Human ABCG2: structure, function, and its role in multidrug resistance. International journal of biochemistry and molecular biology 2012, 3, 1–27.
(24) Cusatis, G.; Gregorc, V.; Li, J.; Spreafico, A.; Ingersoll, R. G.; Verweij, J.; Ludovini, V.; Villa, E.; Hidalgo, M.; Sparreboom, A.; Baker, S. D. Pharmacogenetics of ABCG2 and adverse reactions to gefitinib. Journal of the National Cancer Institute 2006, 98, 1739–42.
(25) Sai, K.; Saito, Y.; Maekawa, K.; Kim, S.-R.; Kaniwa, N.; Nishimaki-Mogami, T.; Sawada, J.; Shirao, K.; Hamaguchi, T.; Yamamoto, N.; Kunitoh, H.; Ohe, Y.; Yamada, Y.; Tamura, T.; Yoshida, T.; Matsumura, Y.; Ohtsu, A.; Saijo, N.; Minami, H. Additive effects of drug transporter genetic polymorphisms on irinotecan pharmacokinetics/pharmacodynamics in Japanese cancer patients. Cancer chemotherapy and pharmacology 2010, 66, 95–105.
(26) Daly, A. K. Pharmacogenetics and human genetic polymorphisms. The Biochemical journal 2010, 429, 435–49.
(27) Georgitsi, M.; Zukic, B.; Pavlovic, S.; Patrinos, G. P. Transcriptional regulation and pharmacogenomics. Pharmacogenomics 2011, 12, 655–73.
(28) Smith, R. P.; Lam, E. T.; Markova, S.; Yee, S. W.; Ahituv, N. Pharmacogene regulatory elements: from discovery to applications. Genome medicine 2012, 4, 45.
(29) Urquhart, B.; Tirona, R.; Kim, R. Nuclear receptors and the regulation of drug-metabolizing enzymes and drug transporters: implications for interindividual variability in response to drugs. The Journal of Clinical … 2007.
(30) Ong, C.-T.; Corces, V. G. Enhancer function: new insights into the regulation of tissue-specific gene expression. Nature reviews. Genetics 2011, 12, 283–93.

269
(31) Pennacchio, L. a; Loots, G. G.; Nobrega, M. a; Ovcharenko, I. Predicting tissue-specific enhancers in the human genome. Genome research 2007, 17, 201–11.
(32) Urquhart, B. L.; Ware, J. a; Tirona, R. G.; Ho, R. H.; Leake, B. F.; Schwarz, U. I.; Zaher, H.; Palandra, J.; Gregor, J. C.; Dresser, G. K.; Kim, R. B. Breast cancer resistance protein (ABCG2) and drug disposition: intestinal expression, polymorphisms and sulfasalazine as an in vivo probe. Pharmacogenetics and genomics 2008, 18, 439–48.
(33) Poonkuzhali, B.; Lamba, J.; Strom, S. Association of breast cancer resistance protein/ABCG2 phenotypes and novel promoter and intron 1 single nucleotide polymorphisms. Drug Metabolism and … 2008, 36, 780–795.
(34) Ross, D. D.; Karp, J. E.; Chen, T. T.; Doyle, L. A. Expression of breast cancer resistance protein in blast cells from patients with acute leukemia. Blood 2000, 96, 365–8.
(35) Cheng, G. M. Y.; To, K. K. W. Adverse Cell Culture Conditions Mimicking the Tumor Microenvironment Upregulate ABCG2 to Mediate Multidrug Resistance and a More Malignant Phenotype. ISRN oncology 2012, 2012, 746025.
(36) Pradhan, M.; Bembinster, L. a; Baumgarten, S. C.; Frasor, J. Proinflammatory cytokines enhance estrogen-dependent expression of the multidrug transporter gene ABCG2 through estrogen receptor and NF{kappa}B cooperativity at adjacent response elements. The Journal of biological chemistry 2010, 285, 31100–6.
(37) Jigorel, E.; Vee, M. Le; Boursier-neyret, C.; Parmentier, Y.; Fardel, O. Differential Regulation of Sinusoidal and Canalicular Hepatic Drug Transporter Expression by Xenobiotics Activating Drug-Sensing Receptors in Primary Human Hepatocytes ABSTRACT : 2006, 34, 1756–1763.
(38) Wang, H.; Lee, E.; Zhou, L.; Leung, P. C. K.; Ross, D. D.; Unadkat, J. D.; Mao, Q. Progesterone receptor (PR) isoforms PRA and PRB differentially regulate expression of the breast cancer resistance protein in human placental choriocarcinoma BeWo cells. Molecular pharmacology 2008, 73, 845–54.
(39) Zhang, Y.; Zhou, G.; Wang, H.; Zhang, X.; Wei, F.; Cai, Y.; Yin, D. Transcriptional upregulation of breast cancer resistance protein by 17beta-estradiol in ERalpha-positive MCF-7 breast cancer cells. Oncology 2006, 71, 446–55.
(40) Lemos, C.; Kathmann, I.; Giovannetti, E.; Dekker, H.; Scheffer, G. L.; Calhau, C.; Jansen, G.; Peters, G. J. Folate deprivation induces BCRP (ABCG2) expression and mitoxantrone resistance in Caco-2 cells. International journal of cancer. Journal international du cancer 2008, 123, 1712–20.

270
(41) Lemos, C.; Kathmann, I.; Giovannetti, E.; Calhau, C.; Jansen, G.; Peters, G. J. Impact of cellular folate status and epidermal growth factor receptor expression on BCRP/ABCG2-mediated resistance to gefitinib and erlotinib. British journal of cancer 2009, 100, 1120–7.
(42) Tan, K. P.; Wang, B.; Yang, M.; Boutros, P. C.; Macaulay, J.; Xu, H.; Chuang, A. I.; Kosuge, K.; Yamamoto, M.; Takahashi, S.; Wu, A. M. L.; Ross, D. D.; Harper, P. A.; Ito, S. Aryl Hydrocarbon Receptor Is a Transcriptional Activator of the Human Breast Cancer Resistance Protein ( BCRP / ABCG2 ) □. 2010.
(43) Singh, A.; Wu, H.; Zhang, P.; Happel, C. Expression of ABCG2 (BCRP) is regulated by Nrf2 in cancer cells that confers side population and chemoresistance phenotype. Molecular cancer … 2010, 9, 2365–2376.
(44) Ee, P. L. R. Identification of a Novel Estrogen Response Element in the Breast Cancer Resistance Protein (ABCG2) Gene. Cancer Research 2004, 64, 1247–1251.
(45) Pike, J. W.; Meyer, M. B.; Watanuki, M.; Kim, S.; Zella, L. a; Fretz, J. a; Yamazaki, M.; Shevde, N. K. Perspectives on mechanisms of gene regulation by 1,25-dihydroxyvitamin D3 and its receptor. The Journal of steroid biochemistry and molecular biology 2007, 103, 389–95.
(46) Wiench, M.; Miranda, T. B.; Hager, G. L. Control of nuclear receptor function by local chromatin structure. The FEBS journal 2011, 278, 2211–30.
(47) Germain, P.; Staels, B.; Dacquet, C.; Spedding, M.; Laudet, V. Overview of Nomenclature of Nuclear Receptors. 2006, 58, 685–704.
(48) So, A. Y.-L.; Chaivorapol, C.; Bolton, E. C.; Li, H.; Yamamoto, K. R. Determinants of cell- and gene-specific transcriptional regulation by the glucocorticoid receptor. PLoS genetics 2007, 3, e94.
(49) Carroll, J. S.; Meyer, C. a; Song, J.; Li, W.; Geistlinger, T. R.; Eeckhoute, J.; Brodsky, A. S.; Keeton, E. K.; Fertuck, K. C.; Hall, G. F.; Wang, Q.; Bekiranov, S.; Sementchenko, V.; Fox, E. a; Silver, P. a; Gingeras, T. R.; Liu, X. S.; Brown, M. Genome-wide analysis of estrogen receptor binding sites. Nature genetics 2006, 38, 1289–97.
(50) Bolton, E. C.; So, A. Y.; Chaivorapol, C.; Haqq, C. M.; Li, H.; Yamamoto, K. R. Cell- and gene-specific regulation of primary target genes by the androgen receptor. Genes & development 2007, 21, 2005–17.
(51) Weltmeier, F.; Borlak, J. A high resolution genome-wide scan of HNF4α recognition sites infers a regulatory gene network in colon cancer. PloS one 2011, 6, e21667.
271
(52) Wang, Q.; Li, W.; Liu, X. S.; Carroll, J. S.; Jänne, O. a; Keeton, E. K.; Chinnaiyan, A. M.; Pienta, K. J.; Brown, M. A hierarchical network of transcription factors governs androgen receptor-dependent prostate cancer growth. Molecular cell 2007, 27, 380–92.
(53) Tan, S. K.; Lin, Z. H.; Chang, C. W.; Varang, V.; Chng, K. R.; Pan, Y. F.; Yong, E. L.; Sung, W. K.; Sung, W. K.; Cheung, E. AP-2γ regulates oestrogen receptor-mediated long-range chromatin interaction and gene transcription. The EMBO journal 2011, 30, 2569–81.
(54) Ahituv, N.; Rubin, E. M.; Nobrega, M. a Exploiting human--fish genome comparisons for deciphering gene regulation. Human molecular genetics 2004, 13 Spec No, R261–6.
(55) Loots, G. G. Genomic identification of regulatory elements by evolutionary sequence comparison and functional analysis. Advances in genetics 2008, 61, 269–93.
(56) Woolfe, A.; Goodson, M.; Goode, D. K.; Snell, P.; McEwen, G. K.; Vavouri, T.; Smith, S. F.; North, P.; Callaway, H.; Kelly, K.; Walter, K.; Abnizova, I.; Gilks, W.; Edwards, Y. J. K.; Cooke, J. E.; Elgar, G. Highly conserved non-coding sequences are associated with vertebrate development. PLoS biology 2005, 3, e7.
(57) Pennacchio, L. a; Ahituv, N.; Moses, A. M.; Prabhakar, S.; Nobrega, M. a; Shoukry, M.; Minovitsky, S.; Dubchak, I.; Holt, A.; Lewis, K. D.; Plajzer-Frick, I.; Akiyama, J.; De Val, S.; Afzal, V.; Black, B. L.; Couronne, O.; Eisen, M. B.; Visel, A.; Rubin, E. M. In vivo enhancer analysis of human conserved non-coding sequences. Nature 2006, 444, 499–502.
(58) Savic, D.; Bell, G. I.; Nobrega, M. a An in vivo cis-regulatory screen at the type 2 diabetes associated TCF7L2 locus identifies multiple tissue-specific enhancers. PloS one 2012, 7, e36501.
(59) So, A. Y.-L.; Cooper, S. B.; Feldman, B. J.; Manuchehri, M.; Yamamoto, K. R. Conservation analysis predicts in vivo occupancy of glucocorticoid receptor-binding sequences at glucocorticoid-induced genes. Proceedings of the National Academy of Sciences of the United States of America 2008, 105, 5745–9.
(60) King, D. C.; Taylor, J.; Zhang, Y.; Cheng, Y.; Lawson, H. a; Martin, J.; Chiaromonte, F.; Miller, W.; Hardison, R. C. Finding cis-regulatory elements using comparative genomics: some lessons from ENCODE data. Genome research 2007, 17, 775–86.
(61) Ovcharenko, I.; Nobrega, M. a; Loots, G. G.; Stubbs, L. ECR Browser: a tool for visualizing and accessing data from comparisons of multiple vertebrate genomes. Nucleic acids research 2004, 32, W280–6.

272
(62) Frazer, K. a; Pachter, L.; Poliakov, A.; Rubin, E. M.; Dubchak, I. VISTA: computational tools for comparative genomics. Nucleic acids research 2004, 32, W273–9.
(63) Loots, G. G.; Ovcharenko, I. rVISTA 2.0: evolutionary analysis of transcription factor binding sites. Nucleic acids research 2004, 32, W217–21.
(64) Frith, M.; Hansen, U.; Weng, Z. Detection of cis-element clusters in higher eukaryotic DNA. Bioinformatics 2001, 17, 878–889.
(65) Wingender, E.; Chen, X.; Hehl, R.; Karas, H.; Liebich, I.; Matys, V.; Meinhardt, T.; Prüss, M.; Reuter, I.; Schacherer, F. TRANSFAC: an integrated system for gene expression regulation. Nucleic acids research 2000, 28, 316–9.
(66) Encode, T.; Consortium, P. A user’s guide to the encyclopedia of DNA elements (ENCODE). PLoS biology 2011, 9, e1001046.
(67) Vincze, T. NEBcutter: a program to cleave DNA with restriction enzymes. Nucleic Acids Research 2003, 31, 3688–3691.
(68) Rozen, S.; Skaletsky, H. Primer3 on the WWW for general users and for biologist programmers. Methods in molecular biology (Clifton, N.J.) 2000, 132, 365–86.
(69) Simonet, W. S.; Bucay, N.; Lauer, S. J.; Taylor, J. M. A far-downstream hepatocyte-specific control region directs expression of the linked human apolipoprotein E and C-I genes in transgenic mice. The Journal of biological chemistry 1993, 268, 8221–9.
(70) Liu, F.; Song, Y.; Liu, D. Hydrodynamics-based transfection in animals by systemic administration of plasmid DNA. Gene therapy 1999, 6, 1258–66.
(71) Kim, M. J.; Ahituv, N. The Hydrodynamic Tail Vein Assay as a Tool for the Study of Liver Promoters and Enhancers. In Pharmacogenomics: Methods and Protocols; Innocenti, F.; van Schaik, R. H. N., Eds.; 2012.
(72) Wang, Z.; Zang, C.; Rosenfeld, J. a; Schones, D. E.; Barski, A.; Cuddapah, S.; Cui, K.; Roh, T.-Y.; Peng, W.; Zhang, M. Q.; Zhao, K. Combinatorial patterns of histone acetylations and methylations in the human genome. Nature genetics 2008, 40, 897–903.
(73) Benevolenskaya, E. V Histone H3K4 demethylases are essential in development and differentiation. Biochemistry and cell biology = Biochimie et biologie cellulaire 2007, 85, 435–43.
(74) Weintraub, H.; Groudine, M. Chromosomal subunits in active genes have an altered conformation. Science (New York, N.Y.) 1976, 193, 848–56.
273
(75) Stalder, J.; Larsen, A.; Engel, J. D.; Dolan, M.; Groudine, M.; Weintraub, H. Tissue-specific DNA cleavages in the globin chromatin domain introduced by DNAase I. Cell 1980, 20, 451–60.
(76) Cockerill, P. N. Structure and function of active chromatin and DNase I hypersensitive sites. The FEBS journal 2011, 278, 2182–210.
(77) Landt, S. G.; Snyder, M.; et. al. ChIP-seq guidelines and practices of the ENCODE and modENCODE consortia. 2012, 1813–1831.
(78) Ovcharenko, I.; Stubbs, L.; Loots, G. G. Interpreting mammalian evolution using Fugu genome comparisons. Genomics 2004, 84, 890–5.
(79) Zhang, G.; Gao, X.; Song, Y. K.; Vollmer, R.; Stolz, D. B.; Gasiorowski, J. Z.; Dean, D. a; Liu, D. Hydroporation as the mechanism of hydrodynamic delivery. Gene therapy 2004, 11, 675–82.
(80) Kim, M. J.; Skewes-Cox, P.; Fukushima, H.; Hesselson, S.; Yee, S. W.; Ramsey, L. B.; Nguyen, L.; Eshragh, J. L.; Castro, R. A.; Wen, C. C.; Stryke, D.; Johns, S. J.; Ferrin, T. E.; Kwok, P.; Relling, M. V; Giacomini, K. M.; Kroetz, D. L.; Ahituv, N. Functional characterization of liver enhancers that regulate drug-associated transporters. Clinical pharmacology and therapeutics 2011, 89, 571–8.
(81) Heintzman, N. D.; Hon, G. C.; Hawkins, R. D.; Kheradpour, P.; Stark, A.; Harp, L. F.; Ye, Z.; Lee, L. K.; Stuart, R. K.; Ching, C. W.; Ching, K. a; Antosiewicz-Bourget, J. E.; Liu, H.; Zhang, X.; Green, R. D.; Lobanenkov, V. V; Stewart, R.; Thomson, J. a; Crawford, G. E.; Kellis, M.; Ren, B. Histone modifications at human enhancers reflect global cell-type-specific gene expression. Nature 2009, 459, 108–12.
(82) Matsson, P.; Yee, S. W.; Markova, S.; Morrissey, K.; Jenkins, G.; Xuan, J.; Jorgenson, E.; Kroetz, D. L.; Giacomini, K. M. Discovery of regulatory elements in human ATP-binding cassette transporters through expression quantitative trait mapping. The pharmacogenomics journal 2011, 1–13.
(83) Phillips, J. E.; Corces, V. G. CTCF: master weaver of the genome. Cell 2009, 137, 1194–211.
(84) Kakizawa, T.; Miyamoto, T.; Ichikawa, K.; Kaneko, A.; Suzuki, S.; Hara, M.; Nagasawa, T.; Takeda, T.; Mori, J. i; Kumagai, M.; Hashizume, K. Functional interaction between Oct-1 and retinoid X receptor. The Journal of biological chemistry 1999, 274, 19103–8.
(85) Préfontaine, G. G.; Walther, R.; Giffin, W.; Lemieux, M. E.; Pope, L.; Haché, R. J. Selective binding of steroid hormone receptors to octamer transcription factors

274
determines transcriptional synergism at the mouse mammary tumor virus promoter. The Journal of biological chemistry 1999, 274, 26713–9.
(86) Préfontaine, G. G.; Lemieux, M. E.; Giffin, W.; Schild-poulter, C.; Pope, L.; Lacasse, E.; Haché, R. J. G. Recruitment of Octamer Transcription Factors to DNA by Glucocorticoid Receptor Recruitment of Octamer Transcription Factors to DNA by Glucocorticoid Receptor. 1998.
(87) Ström, A. C.; Forsberg, M.; Lillhager, P.; Westin, G. The transcription factors Sp1 and Oct-1 interact physically to regulate human U2 snRNA gene expression. Nucleic acids research 1996, 24, 1981–6.
(88) Gunther, M.; Laithier, M.; Brison, O. A set of proteins interacting with transcription factor Sp1 identified in a two-hybrid screening. Molecular and cellular biochemistry 2000, 210, 131–42.
(89) Ernst, J.; Kheradpour, P.; Mikkelsen, T. S.; Shoresh, N.; Ward, L. D.; Epstein, C. B.; Zhang, X.; Wang, L.; Issner, R.; Coyne, M.; Ku, M.; Durham, T.; Kellis, M.; Bernstein, B. E. Mapping and analysis of chromatin state dynamics in nine human cell types. Nature 2011, 473, 43–9.
(90) Hess, J.; Angel, P.; Schorpp-Kistner, M. AP-1 subunits: quarrel and harmony among siblings. Journal of cell science 2004, 117, 5965–73.
(91) Dutertre, M.; Smith, C. L. Ligand-independent interactions of p160/steroid receptor coactivators and CREB-binding protein (CBP) with estrogen receptor-alpha: regulation by phosphorylation sites in the A/B region depends on other receptor domains. Molecular endocrinology (Baltimore, Md.) 2003, 17, 1296–314.
(92) Acevedo, M. L.; Kraus, W. L. Mediator and p300 / CBP-Steroid Receptor Coactivator Complexes Have Distinct Roles , but Function Synergistically , during Estrogen Receptor α -Dependent Transcription with Chromatin Templates Mediator and p300 / CBP-Steroid Receptor Coactivator Complexes. 2003.
(93) Zhao, C.; Gao, H.; Liu, Y.; Papoutsi, Z.; Jaffrey, S.; Gustafsson, J.-A.; Dahlman-Wright, K. Genome-wide mapping of estrogen receptor-beta-binding regions reveals extensive cross-talk with transcription factor activator protein-1. Cancer research 2010, 70, 5174–83.
(94) Berthois, Y.; Katzenellenbogen, J. A.; Katzenellenbogen, B. S. Phenol red in tissue culture media is a weak estrogen: implications concerning the study of estrogen-responsive cells in culture. Proceedings of the National Academy of Sciences of the United States of America 1986, 83, 2496–500.
(95) Herkert, B.; Eilers, M. Transcriptional repression: the dark side of myc. Genes & cancer 2010, 1, 580–6.

275
(96) Porro, A.; Iraci, N.; Soverini, S.; Diolaiti, D.; Gherardi, S.; Terragna, C.; Durante, S.; Valli, E.; Kalebic, T.; Bernardoni, R.; Perrod, C.; Haber, M.; Norris, M. D.; Baccarani, M.; Martinelli, G.; Perini, G. c-MYC Oncoprotein Dictates Transcriptional Profiles of ATP-Binding Cassette Transporter Genes in Chronic Myelogenous Leukemia CD34+ Hematopoietic Progenitor Cells. Molecular cancer research : MCR 2011, 9, 1054–66.
(97) Khachigian, L. M. Early growth response-1 in cardiovascular pathobiology. Circulation research 2006, 98, 186–91.
(98) Mouillet, J.-F.; Sonnenberg-Hirche, C.; Yan, X.; Sadovsky, Y. p300 regulates the synergy of steroidogenic factor-1 and early growth response-1 in activating luteinizing hormone-beta subunit gene. The Journal of biological chemistry 2004, 279, 7832–9.
(99) Wong, D. L.; Siddall, B. J.; Ebert, S. N.; Bell, R. A.; Her, S. Phenylethanolamine N-methyltransferase gene expression: synergistic activation by Egr-1, AP-2 and the glucocorticoid receptor. Brain research. Molecular brain research 1998, 61, 154–61.
(100) Lin, Z.; Reierstad, S.; Huang, C.-C.; Bulun, S. E. Novel estrogen receptor-alpha binding sites and estradiol target genes identified by chromatin immunoprecipitation cloning in breast cancer. Cancer research 2007, 67, 5017–24.
(101) Eferl, R.; Sibilia, M.; Hilberg, F.; Fuchsbichler, A.; Kufferath, I.; Guertl, B.; Zenz, R.; Wagner, E. F.; Zatloukal, K. Functions of c-Jun in liver and heart development. The Journal of cell biology 1999, 145, 1049–61.
(102) Wagner, E. F. Functions of AP1 (Fos/Jun) in bone development. Annals of the rheumatic diseases 2002, 61 Suppl 2, ii40–2.
(103) Durchdewald, M.; Angel, P.; Hess, J. The transcription factor Fos: a Janus-type regulator in health and disease. Histology and histopathology 2009, 24, 1451–61.
(104) Drewes, T.; Senkel, S.; Holewa, B.; Ryffel, G. U. Human hepatocyte nuclear factor 4 isoforms are encoded by distinct and differentially expressed genes. Molecular and cellular biology 1996, 16, 925–31.
(105) Schrem, H.; Klempnauer, J.; Borlak, J. Liver-enriched transcription factors in liver function and development. Part I: the hepatocyte nuclear factor network and liver-specific gene expression. Pharmacological reviews 2002, 54, 129–58.
(106) Germain, P.; Chambon, P.; Eichele, G.; Evans, R. M.; Lazar, M. A.; Leid, M.; De Lera, A. R.; Lotan, R.; Mangelsdorf, D. J.; Gronemeyer, H. International Union of

276
Pharmacology. LXIII. Retinoid X receptors. Pharmacological reviews 2006, 58, 760–72.
(107) Lee, S. K.; Choi, H. S.; Song, M. R.; Lee, M. O.; Lee, J. W. Estrogen receptor, a common interaction partner for a subset of nuclear receptors. Molecular endocrinology (Baltimore, Md.) 1998, 12, 1184–92.
(108) Konno, Y.; Negishi, M.; Kodama, S. The roles of nuclear receptors CAR and PXR in hepatic energy metabolism. Drug metabolism and pharmacokinetics 2008, 23, 8–13.
(109) Qiu, Y.; Krishnan, V.; Pereira, F. A.; Tsai, S. Y.; Tsai, M. J. Chicken ovalbumin upstream promoter-transcription factors and their regulation. The Journal of steroid biochemistry and molecular biology 1996, 56, 81–5.
(110) Kusuhara, H.; Sugiyama, Y. ATP-binding cassette, subfamily G (ABCG family). Pflügers Archiv : European journal of physiology 2007, 453, 735–44.
(111) Generaux, G. T.; Bonomo, F. M.; Johnson, M.; Doan, K. M. M. Impact of SLCO1B1 (OATP1B1) and ABCG2 (BCRP) genetic polymorphisms and inhibition on LDL-C lowering and myopathy of statins. Xenobiotica; the fate of foreign compounds in biological systems 2011, 41, 639–51.
(112) De Martino, M. U.; Alesci, S.; Chrousos, G. P.; Kino, T. Interaction of the glucocorticoid receptor and the chicken ovalbumin upstream promoter-transcription factor II (COUP-TFII): implications for the actions of glucocorticoids on glucose, lipoprotein, and xenobiotic metabolism. Annals of the New York Academy of Sciences 2004, 1024, 72–85.
(113) Birnbaum, R. Y.; Clowney, E. J.; Agamy, O.; Kim, M. J.; Zhao, J.; Yamanaka, T.; Pappalardo, Z.; Clarke, S. L.; Wenger, A. M.; Nguyen, L.; Gurrieri, F.; Everman, D. B.; Schwartz, C. E.; Birk, O. S.; Bejerano, G.; Lomvardas, S.; Ahituv, N. Coding exons function as tissue-specific enhancers of nearby genes. Genome research 2012, 22, 1059–68.
(114) Biddie, S. C.; John, S.; Hager, G. L. Genome-wide mechanisms of nuclear receptor action. Trends in endocrinology and metabolism: TEM 2010, 21, 3–9.
(115) Kameda, S.; Maruyama, H.; Higuchi, N.; Iino, N.; Nakamura, G.; Miyazaki, J.; Gejyo, F. Kidney-targeted naked DNA transfer by retrograde injection into the renal vein in mice. Biochemical and Biophysical Research Communications 2004, 314, 390–395.

277
Chapter 5 : Effect of SNPs on ABCG2 Locus Enhancer Regions
5.1. Abstract
ABCG2 encodes the mitoxantrone resistance protein (MXR, BCRP), a membrane
transporter responsible for the efflux of its substrates out of the cell and important in
detoxification. In the present study, the effect of genetic variation on the in vitro enhancer
activity of six previously identified liver enhancers in the ABCG2 locus was examined.
The effect of variants on enhancer activity in vivo and on in silico predictions for
transcription factor binding was also characterized. Reference and variant ABCG2 gene
locus liver enhancers, cloned into the pGL4.23 expression vector, were tested for their
ability to alter luciferase activity when transiently transfected into HepG2 and HEK293T
cell lines. Multiple SNPs were found that both increased and decreased enhancer activity
in vitro. Three SNPs (rs9999111, rs12508471 and rs149713212) decreased the activity of
the enhancers by at least 50% and four SNPs (rs72873421, rs183322988, rs190738974
and rs2725263) increased the activity of the enhancers by over 2-fold in both cell lines.
Four of these SNPs (rs9999111, rs12508471, rs72873421 and rs149713212) significantly
decreased and rs2725263 significantly increased enhancer activity in vivo. The in silico
transcription factor binding analysis found alterations in binding probabilities of
prominent transcription factors for each of these SNPs that could explain their ability to
alter enhancer activity in vivo. Additionally, associations of these SNPs with ABCG2,
PPM1K or PDK2 expression in liver, kidney, breast, lymphocytes, T-cells and skin cells
were detected. In conclusion, genetic variants in ABCG2 gene locus liver enhancers could
be a contributing factor to the variability of ABCG2, PKD2 and PPM1K expression in a
tissue-specific manner.

278
5.2. Introduction
The mitoxantrone resistance protein (MXR, BCRP), encoded by the ABCG2 gene,
is a member of the ABC membrane transporter family and is responsible for transport of
its substrates across the intestinal epithelial cells back into the intestinal lumen, from the
hepatocyte into the bile, into milk, away from the placenta and brain, and into the lumen
of the renal proximal tubule1. With MXR playing important roles in the disposition of
xenobiotics and endogenous ligands throughout the body, it’s not surprising that reduced
expression and function of MXR is associated with a variety of drug side effects, lower
efficacy of treatments and increased susceptibility to cancer2–10. Although reduced
function variants of MXR occur11–17, all the variability in ABCG2 expression and MXR
substrate pharmacokinetics cannot be accounted for by these nonsynonymous variants.
For example, even in individuals without these variants there is a wide range of ABCG2
expression18.
There are many phenotypes associated with decreased, absent or drug-inhibited
MXR. MXR knockout mice (Abcg2-/-) experience phototoxicity due to the accumulation
of porphyrins19, which are established MXR substrates20. Normally, MXR protects
tissues during hypoxia by effluxing heme and porphyrin compounds out of the cell21.
Reduced porphyrin transport by MXR could thus be an explanation for human
phototoxicity in individuals treated with a number of MXR substrates such as statins22
and imatinib23. MXR also transports uric acid, and polymorphisms of ABCG2 have been
repeatedly associated with gout24. Statins are proposed as a treatment for gout since they
are able to alter ABCG2 expression25. Polymorphisms in ABCG2 have also been linked to
increased risk of diarrhea in patients taking gefitinib, another MXR substrate26. Altered
279
ABCG2 expression has been associated with decreased disease-free survival3–10 as a
result of the natural protective role of MXR against carcinogens27 and its ability to efflux
chemotherapeutics out of the cancer cell28. Based on the important function of MXR in
protection from toxins and intracellular access to drugs, identifying regulatory regions of
ABCG2 and functional SNPs within those regions may inform about the mechanisms of
regulation of ABCG2 expression.
MXR is one of many transporters and enzymes important in drug absorption,
distribution, metabolism and excretion (ADME). Recently, the transcriptional regulation
of ADME genes has been linked to cis-regulatory elements, and alterations in their
expression due to variants in those regulatory elements are becoming more evident29,30.
Additionally, expression quantitative trait loci (eQTL) studies of human genes have
implicated proximal regulatory variation as a prevalent cause of population variation in
gene expression by associating a genetic variation with the expression of a gene of
interest31,32. Cis-regulatory elements include enhancers, suppressors, promoters,
insulators and locus control regions that work to regulate the transcriptional activity of
the basal transcription machinery. These genomic regions provide binding sites for
transcription factors (TFs), which can be ubiquitous or tissue-specific, that work through
complex interactions with histones, other TFs and/or RNA polymerase to alter gene
transcription. In our previous research, we characterized the ABCG2 promoter (see
Chapter 3) and utilized comparative genomics along with in vitro and in vivo assays to
identify nine liver enhancers in the ABCG2 gene locus (see Chapter 4).
The ABCG2 gene locus is shared with the polycystic kidney disease 2 (PKD2)
and protein phosphatase 1K (PPM1K) genes. PKD2 encodes the polycystin-2 protein, an

280
integral membrane protein implemented in cell-cell interactions, renal tubular
development and calcium homeostasis in the kidney33. Germline mutations in PKD2, and
the resulting reduction in polycystin-2 protein, cause autosomal dominant polycystic
kidney disease (ADPKD)34. Additionally, somatic mutations in PKD2 occur in ADPKD
patients with germline PKD1 mutations causing more severe disease33. Although they
have not been identified, other genetic modifying effects causing wide variability in
PKD1 and PKD2 expression have been linked to the ADPKD phenotype and disease
progression35.
The other member of the ABCG2 gene locus is the PPM1K gene. PPM1K encodes
the protein phosphatase 2Cm (PP2Cm) enzyme important in branched-chain amino acid
homeostasis and regulation of the mitochondria permeability transition pore36. PP2Cm is
highly expressed in the brain, heart, liver and kidney and is also transcriptionally
regulated in response to nutrient status37. Any cis-regulatory elements found in the
ABCG2 gene locus could also be important for the regulation of PKD2 and PPM1K.
Therefore, it is important to also test the association of enhancer SNPs with the
expression of these two genes.
In this study, we test the hypothesis that SNPs in previously identified (see
Chapter 4) regulatory regions of the ABCG2 locus explain the variation in ABCG2,
PKD2 or PPM1K expression. Variants in the liver enhancer regions reported in publicly
available databases were studied in the pGL4.23 [luc2/minP] vector. The pGL4.23 vector
is a firefly luciferase vector with a multiple cloning site designed to accept a putative
enhancer element upstream of a minimal promoter and the luciferase gene, once cloned
and transfected into cells, the luciferase activity can be measured as a surrogate for

281
enhancer function. Enhancer activity of the variant plasmids was measured in vitro in
kidney (HEK293T) and liver (HepG2) cells, each chosen to represent their primary tissue
source, and variants with altered function were tested in vivo using a hydrodynamic tail
vein assay. SNPs that significantly altered in vivo liver enhancer activity were then tested
for association with ABCG2, PKD2 and PPM1K expression in human liver, kidney,
breast, lymphocyte, T-cell and fibroblasts. The ability of functional SNPs to alter TFBS
was predicted using in silico methods. The findings from these studies provide insight
into how non-coding genetic variants may lead to altered exposure, and thus toxicity, to
MXR substrates.
5.3. Materials and Methods
5.3.1. Chemicals and Materials
The vectors pGL4.23 [luc2/minP], pGL4.74 [hRluc/TK], pGL4.13 [luc2/SV40],
the Dual-Luciferase® Reporter Assay System and HB101 competent cells were all
purchased from Promega (Madison, WI). The human embryonic kidney (HEK293T/17)
and human hepatocellular carcinoma (HepG2) cells were purchased from the American
Type Culture Collection (ATCC, Manassas, VA). High-glucose Dulbecco’s modified
Eagle’s medium (DMEM), Opti-Minimal Essential Medium (Opti-MEM), Lipofectamine
2000 and Trizol were all purchased from Invitrogen (Carlsbad, CA). Both 100 mm LB
Amp-100 agar plates and LB Broth 100 μg/mL ampicilin were purchased from Teknova
(Hollister, CA). RNase- DNase- water, 1X phosphate buffered saline (PBS), 0.05%
trypsin and 100X penicillin and streptomycin were all purchased from the University of
California San Francisco (UCSF) cell culture facility (San Francisco, CA). The GeneJet

282
PCR Purification Kits and GeneJet Plasmid Miniprep Kits are from Fermentas (Glen
Burnie, MD). High-Fidelity Phusion Buffer, Phusion High-Fidelity DNA Polymerase,
DpnI and DpnI digestion buffer were all purchased from New England Biolabs (Ipswich,
MA). AllPrep DNA/RNA Mini Kits, QIAquick PCR Purification Kits, and Qiagen
RNeasy MinElute Cleanup Kits were from Qiagen (Valencia, CA). Other materials
including 10% fetal bovine serum (FBS) (Axenia BioLogix, Dixon, CA), GenElute HP
Endotoxin-Free Maxiprep Kit (Sigma Aldrich), TransIT EE In Vivo Gene Delivery
System (Mirus Bio, Madison, WI), CD1 mice (Charles Rivers Laboratories, Wilminton,
MA), High Capacity cDNA Reverse Transcription Kits (Applied Biosystems, Foster
City, CA), 10 U/mL Exonuclease I enzyme (GE Healthcare, Piscataway, New Jersey) and
dNTPs (Denville, Metuchen, NJ) were purchased from the indicated manufacturers. The
APOE-pGL4.2338 construct was a gift from Nadav Ahituv (University of California San
Francisco, San Francisco, CA).
5.3.2. Genetic Analysis of Enhancer Regions
SNPs in each of the ABCG2 in vivo enhancer regions were retrieved for all
available ethnic populations from publicly available databases, including 1000 Genomes
20120214 phase 1 release39, dbSNP build 135 and HapMap release 2840. Genotypes from
1000 Genomes 20100804 phase 1 release were used for calculating haplotypes.
Haplotypes were determined by downloading each region’s genotype and information
files from the 1000 Genomes browser for Caucasians (CEU), Nigerians (YRI), combined
Chinese and Japanese (CHB+JBT) and all available ethnic groups combined (ALL).
Genotype and information files were then loaded into Haploview version 4.241 and

283
linkage analysis was performed on each region. Haplotype frequencies are reported as the
frequency of one haplotype compared to all other haplotypes. SNP and haplotype
frequencies for each enhancer region are displayed in Table 5.7 - Table 5.12. All SNPs
were tested in vitro regardless of minor allele frequency. SNPs in linkage disequilibrium
(LD) with rs12508471, rs72873421, rs149713212, rs9999111 and rs2725263 (r2
threshold ≥ 0.8) were extracted from 1000 Genomes pilot 1 genotype data using the
Broad Institute SNP annotation and proxy search (SNAP) version 2.242 for each
population (CEU, YRI and CHB+JBT) separately.
5.3.3. Primer Design
DNA sequences ±25 bp for each SNP were pulled from the UCSC genome
browser. The site-directed mutagenesis (SDM) primers for each SNP in a positive in vivo
ABCG2 locus enhancer were designed using the PrimerX© program and synthesized by
Integrated DNA Technologies (San Diego, CA). Each primer was diluted to 100 μM in
TE buffer and each primer set (forward and reverse) was combined in a 10 μM solution
in RNAse and DNase free water for use in SDM PCR. Primers for the deletion SNP
rs36105707 were designed according to the large deletion/insertion protocol described in
Chapter 3. In short, the primers were designed to overlap on their 5’-end so that the
deletion is missing from both primers (see Figure 3.2B) and to ensure that the melting
temperature of the non-overlapping section of the primers is larger than that of the
overlapping section of the primers by 5-10°C.
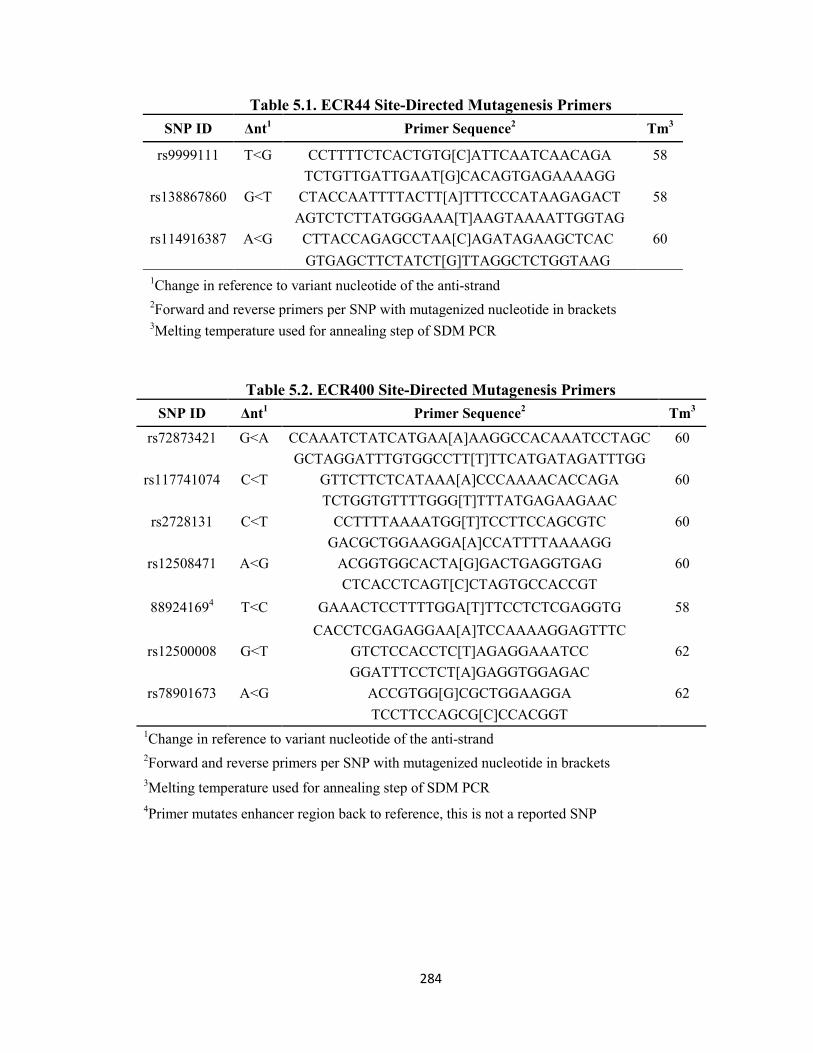
284
Table 5.1. ECR44 Site-Directed Mutagenesis Primers SNP ID Δnt1 Primer Sequence2 Tm3
rs9999111 T<G CCTTTTCTCACTGTG[C]ATTCAATCAACAGA 58
TCTGTTGATTGAAT[G]CACAGTGAGAAAAGG
rs138867860 G<T CTACCAATTTTACTT[A]TTTCCCATAAGAGACT 58
AGTCTCTTATGGGAAA[T]AAGTAAAATTGGTAG
rs114916387 A<G CTTACCAGAGCCTAA[C]AGATAGAAGCTCAC 60
GTGAGCTTCTATCT[G]TTAGGCTCTGGTAAG
1Change in reference to variant nucleotide of the anti-strand 2Forward and reverse primers per SNP with mutagenized nucleotide in brackets 3Melting temperature used for annealing step of SDM PCR
Table 5.2. ECR400 Site-Directed Mutagenesis Primers SNP ID Δnt1 Primer Sequence2 Tm3
rs72873421 G<A CCAAATCTATCATGAA[A]AAGGCCACAAATCCTAGC 60
GCTAGGATTTGTGGCCTT[T]TTCATGATAGATTTGG rs117741074 C<T GTTCTTCTCATAAA[A]CCCAAAACACCAGA 60
TCTGGTGTTTTGGG[T]TTTATGAGAAGAAC rs2728131 C<T CCTTTTAAAATGG[T]TCCTTCCAGCGTC 60
GACGCTGGAAGGA[A]CCATTTTAAAAGG rs12508471 A<G ACGGTGGCACTA[G]GACTGAGGTGAG 60
CTCACCTCAGT[C]CTAGTGCCACCGT 889241694 T<C GAAACTCCTTTTGGA[T]TTCCTCTCGAGGTG 58
CACCTCGAGAGGAA[A]TCCAAAAGGAGTTTC rs12500008 G<T GTCTCCACCTC[T]AGAGGAAATCC 62
GGATTTCCTCT[A]GAGGTGGAGAC rs78901673 A<G ACCGTGG[G]CGCTGGAAGGA 62
TCCTTCCAGCG[C]CCACGGT 1Change in reference to variant nucleotide of the anti-strand 2Forward and reverse primers per SNP with mutagenized nucleotide in brackets 3Melting temperature used for annealing step of SDM PCR 4Primer mutates enhancer region back to reference, this is not a reported SNP

285
Table 5.3. ECR423 Site-Directed Mutagenesis Primers SNP ID Δnt1 Primer Sequence2 Tm3 rs137884075 C<T GGAGGGCAGATCA[T]GAGGTCAGGAGATC 60
GATCTCCTGACCTC[A]TGATCTGCCCTCC
rs142621223 G<A GAGGGCAGATCAC[A]AGGTCAGGAGATC 60
GATCTCCTGACCT[T]GTGATCTGCCCTC
rs139553964 G<A GGTCAGGAGATC[A]AGACCATCCTGG 58
CCAGGATGGTCT[T]GATCTCCTGACC
rs149713212 G<A CACGGTGAAACCCC[A]TCTCTACTAAAAAAC 58
GTTTTTTAGTAGAGA[T]GGGGTTTCACCGTG
rs144565932 G<A CAAAAAATTAGCCGAGC[A]TGTTGGCAGGC 60
GCCTGCCAACA[T]GCTCGGCTAATTTTTTG
rs62309980 C<T GGCGCCTGTAGT[T]CCAGCTACTCAG 60
CTGAGTAGCTGG[A]ACTACAGGCGCC
rs76888829 T<C GCATCACTATCTACAAA[C]GGCCTCTATTCATATC 60
GATATGAATAGAGGCC[G]TTTGTAGATAGTGATGC
rs9998634 C<A GGATATCTGGTGTCCA[T]ACTGAAAGTATTAAA 60
TTTAATACTTTCAGT[A]TGGACACCAGATATCC
rs77538297 C<T CACAAAATAGCC[T]GGCTGTCCCCAAC 60
GTTGGGGACAGCC[A]GGCTATTTTGTG
rs35696062 G<- CATCTCGCAATA[-]GGCTACTGTTGCAGTAG 60 CTACTGCAACAGTAGCC[-]TATTGCGAGATG 1Change in reference to variant nucleotide of the anti-strand 2Forward and reverse primers per SNP with mutagenized nucleotide in brackets 3Melting temperature used for annealing step of SDM PCR

286
Table 5.4. CR6 Site-Directed Mutagenesis Primers SNP ID Δnt1 Primer Sequence2 Tm3
rs45510401 A<G AAAGAATACATAAAATAGGAT[G]TAATTAAATTCTCATTTAT 60
ATAAATGAGAATTTAATTA[C]ATCCTATTTTATGTATTCTTT rs5735191574 -<A CAAAAAAAAAAAA[A]TTAGCCGGGCGTG 60
CACGCCCGGCTAA[T]TTTTTTTTTTTTG rs5883021 A<- CAAAAAAAAAAAAAAAAAAAA
[-]GTCCTTAATTTTAAAATGG 60
CCATTTTAAAATTAAGGAC[-]TTTTTTTTTTTTTTTTTTTTG rs186188962 C<T CCACCCGCTT[T]GGCCTCCCA 65.4
TGGGAGGCC[A]AAGCGGGTGG rs144180103 T<- GCTAATTTTTTTTTTTT[-]GTATTTTTAGTAGAGAC 58
GTCTCTACTAAAAATAC[-]AAAAAAAAAAAATTAGCC rs190754327 G<C GTAATGGCTGG[C]ACTACAGGCTCC 64.9
GGAGCCTGTAGT[G]CCAGCCATTAC rs2725268 A<G AAAGAATACATAAAATAGGAT[G]TAATTAAATTCTCATTTAT 56
ATAAATGAGAATTTAATTA[C]ATCCTATTTTATGTATTCTTT rs183322988 A<G ATTAACTTTTTAAATAA[G]TGAGAATTTAATTATATCCT 58
AGGATATAATTAAATTCTCA[C]TTATTTAAAAAGTTAAT 1Change in reference to variant nucleotide of the anti-strand 2Forward and reverse primers per SNP with mutagenized nucleotide in brackets 3Melting temperature used for annealing step of SDM PCR 4Primer mutates enhancer region back to reference

287
Table 5.5. ECR31 Site-Directed Mutagenesis Primers SNP ID Δnt1 Primer Sequence2 Tm3
rs139101431 T<C CTGAAGAAACACCTAAGGTTCTTC[T]TTATTTCTC 59.2
GAGAAATAA[A]GAAGAACCTTAGGTGTTTCTTCAG rs144062279 G<A CAAAGTTCCAGTTG[A]AGACCAGGTTACTCC 65
GGAGTAACCTGGTC[T]TCAACTGGAACTTTG rs27252644 C<T GTTACTCCATGTCCT[C]TCCAAATGCTTCCTG 60
CAGGAAGCATTTGGA[G]AGGACATGGAGTAAC rs4148156 G<A GTCTGGAAATAATCT[A]GATACCTCAGCCC 59.6
GGGCTGAGGTATC[T]AGATTATTTCCAGAC rs145932752 A<G CTTATTCTTTAAAAAATA[G]TCAGCCTTTCCAGACATC 59.2
GATGTCTGGAAAGGCTGA[C]TATTTTTTAAAGAATAAG rs6831395 G<A ATAATCAGCCTTTCCA[A]ACATCAAAATAGGCTGC 62.1
GCAGCCTATTTTGATGT[T]TGGAAAGGCTGATTAT rs27252634 A<C CTTTCCAGACATCAA[A]ATAGGCTGCACATAAG 60
CTTATGTGCAGCCTAT[T]TTGATGTCTGGAAAG rs192562676 C<T GATACTACCATCTA[T]CCCCTCTAAATCAC 55
GTGATTTAGAGGGG[A]TAGATGGTAGTATC rs182159263 C<G CTACCATCTACCC[G]CTCTAAATCACTGG 62.1
CCAGTGATTTAGAG[C]GGGTAGATGGTAG rs187527722 A<G GACAGCAAGC[G]CTACGGAGCAC 65
GTGCTCCGTAG[C]GCTTGCTGTC rs192781547 A<G GCTTATGTTCAGA[G]CACAATACAGTCG 65
CGACTGTATTGTG[C]TCTGAACATAAGC rs184709106 C<T CAGAACACAATACAGT[T]GATAAAAAGTCCCCTC 59.6
GAGGGGACTTTTTATC[A]ACTGTATTGTGTTCTG 1Change in reference to variant nucleotide of the anti-strand 2Forward and reverse primers per SNP with mutagenized nucleotide in brackets 3Melting temperature used for annealing step of SDM PCR 4Primer mutates enhancer region back to reference

288
Table 5.6. ECR33 Site-Directed Mutagenesis Primers SNP ID Δnt1 Primer Sequence2 Tm3
rs2231148 T<A CAATTAGAGATAAAAACTTA[A] ACACACCATTTATTAGTATA 57
TATACTAATAAATGGTGTGT[T]TAAGTTTTTATCTCTAATTG rs190738974 A<G AACTTATACACACCATTT[G]TTAGTATAATATATGGT 57
ACCATATATTATACTAA[C]AAATGGTGTGTATAAGTT rs117761897 C<T CATTAAGATAAACACT[T]AATGGCTTGGCCAACG 62.7
CGTTGGCCAAGCCATT[A]AGTGTTTATCTTAATG rs41282399 A<C GATAAACACTCA[C]TGGCTTGGCCAAC 61
GTTGGCCAAGCCA[G]TGAGTGTTTATC rs113647079 C<G CCCTGGGAGAAAATAAAA[G]AGCATACATTATTTAGAC 61
GTCTAAATAATGTATGCT[C]TTTTATTTTCTCCCAGGG rs2054576 A<G CAATGCAAGTATGT[G]GCAAAGCAAAGTC 61
GACTTTGCTTTGC[C]ACATACTTGCATTG rs151266026 T<C AAAAATTTTAAAGCACACA[C]
TAAAAAAATTCTAACAATGG 61
CCATTGTTAGAATTTTTTTA[G]TGTGTGCTTTAAAATTTTT rs183315559 G<A GTGAGGAAATAG[A]GGTGAGATGGAGC 61
GCTCCATCTCACC[T]CTATTTCCTCAC rs189214307 C<T CACTACCCATCTC[T]TGTCACTGCTTC 61
GAAGCAGTGACA[A]GAGATGGGTAGTG rs361057074,5 -< TTAAA ATAACGTAACCC[TTAAA]TTAACCCTTTGCTTATTGAA 62
TTTAAGGGTTACGTTATGATAT[AATTT]
ATCTGAGAAAATCC rs141635727 A<G ACGTTATGATATAATTT[G]TCTGAGAAAATCCTATTT 57
AAATAGGATTTTCTCAGA[C]AAATTATATCATAACGT rs190767980 C<T AGAAAATCCTATTTATATTTA[T]
TCGTGAGTTAAATATTAAAA 57
TTTTAATATTTAACTCACGA[A] TAAATATAAATAGGATTTTCT
rs147070185 G<A AAATCCTATTTATATTTACTCA[T] GAGTTAAATATTAAAAAAC 57
GTTTTTTAATATTTAACTC[A]
TGAGTAAATATAAATAGGATTT rs26226284 C<A CTGGACAAACAC[C]AATCTTGTTTCTAGG 56
CCTAGAAACAAGATT[G]GTGTTTGTCCAG 1Change in reference to variant nucleotide of the anti-strand 2Forward and reverse primers per SNP with mutagenized nucleotide in brackets 3Melting temperature used for annealing step of SDM PCR 4Primer mutates enhancer region back to reference 5This primer is used with special PCR conditions

289
5.3.4. Variant Enhancer Plasmid Construction
Reference enhancer plasmids, in the pGL4.23 [luc2/minP] vector, were
constructed as described in Chapter 4. SDM on the reference plasmids were performed to
create each of the variant enhancer constructs using the primers listed in Table 5.1 - Table
5.6. PCR reaction components for all SNP primer sets were as follows: 1X High-Fidelity
Phusion Buffer, 1 unit Phusion High-Fidelity DNA Polymerase, 200 nM dNTPs, 1 μM
each primer and 100 ng ABCG2 reference enhancer vector, all in a final volume of 50 μL.
PCR reaction conditions for all primers except for rs36105707 were as follows: An initial
cycle for 30 sec at 98°C, followed by 20 cycles of 10 sec at 98°C, melting temperature
(varies per primer pair) for 30 sec and 3 min at 72°C, then a final extension for 10 min at
72°C. The SDM PCR reactions were then digested for at least 20 min at 37°C with 1 unit
DpnI in 1X DpnI digestion buffer. The reactions were then purified using the GeneJet
PCR purification kit per the manufacturer’s protocol, and 5 μL of the purified SDM
reaction was transformed into 35 μL HB101 competent cells per the manufacturer’s
protocol. After growing for 24 hr on 100 mm LB Amp-100 agar plates, colonies were
selected for expansion in LB broth supplemented with 100 μg/mL ampicillin overnight at
37°C with shaking. DNA was then isolated from the bacteria using the GeneJet Miniprep
Kit and the vector was sequenced with the RVPrimer3, p150R or region-specific primer
(see Table 4.4) to confirm the presence of the SNP. Large bacterial preparations of the
correctly mutagenized plasmids were grown in 150 mL LB broth supplemented with 100
μg/mL ampicillin overnight at 37°C with shaking and DNA was isolated with the
GenElute HP Endotoxin-Free Maxiprep Kit per the manufacturer’s protocol. In order to
make the ECR400 rs7287321/rs12508471/rs12500008 haplotype, the SNPs for

290
rs7287321 and rs12508471 were introduced into the rs12500008 construct. The ECR33
rs412823991/rs2622628 haplotype was made by mutating the rs412823991 SNP into the
rs2622628 construct. The ECR31 rs2725264/rs2725263 haplotype was the genotype of
the originally cloned ECR31 region and was mutated back to reference. All DNA used
for the in vitro and in vivo luciferase assays were endotoxin-free to avoid the cytotoxic
effects of toxins released from the bacteria during lysis; this also allowed for more
reproducible results.
5.3.5. Deletion Mutagenesis PCR Amplification
The protocol for large insertion/deletion amplification is explained in detail in
Chapter 3. The deletion SNP rs36105707 was mutated back to reference in the ECR33
plasmid using a special protocol illustrated in Figure 3.2 and previously reported to work
for both deletion and insertion mutatgenesis43. Primers were designed as described
above. PCR reaction components were the same as described above. PCR conditions
were as follows: an initial cycle of 5 min at 95°C, then 12 cycles of 95°C for 1 min,
46.5°C for 1 min and 72°C for 9 min, with a final cycle of 1 min at 36°C and 30 min at
72°C.
5.3.6. Cell Culture
HEK293T/17 and HepG2 cell lines were grown in high-glucose DMEM
supplemented with 10% FBS, 100 units/mL of penicillin and 0.1 mg/mL of streptomycin.
Both cell lines were grown in 5% CO2 at 37°C. To maintain cells, they were split upon

291
reaching confluency by treatment with 0.05% Trypsin-EDTA, washing with 1X PBS and
suspension in fresh media at a 1:5 to 1:20 dilution.
5.3.7. Transient Transfection
For transient transfections of the HEK293T/17 and HepG2 cell lines, cells were
seeded at approximately 1.8 x 10⁴ cells per well of a 96-well plate in fresh DMEM with
10% FBS without antibiotics and grown for at least 24 hrs to 80% confluency. Cells were
then transfected with Lipofectamine 2000 following guidelines suggested in the
manufacturer’s protocol. In short, 0.5 μL of Lipofectamine 2000 was incubated in 25 μL
Opti-MEM for 5 min and then gently mixed with a 25 μL solution of 0.08 μg plasmid
(pGL4.23 [luc2/minP], reference or variant enhancer-pGL4.23 [luc2/minP], APOE-
pGL4.23 or pGL4.13 [luc2/SV40]) plus 0.02 μg pGL4.74 [hRluc/TK] diluted with Opti-
MEM. The DNA-Lipofectamine mixture was allowed to incubate at room temperature
for 30 min before being placed onto cells with 50 μL of antibiotic-free media. Cells were
incubated with their transfection reagents for 18-24 hr before analysis.
5.3.8. Luciferase Reporter Assay
The day after transfection, each well was washed with 100 μL 1X PBS before
being lysed with 50 μL of 1X passive lysis buffer for 1 hr with shaking. Then 20 μL of
HEK293T/17 or 30 μL of HepG2 lysates were measured for firefly and Renilla luciferase
activity using 70 μL each of the Luciferase Assay Reagent II and Stop & Glo® reagents
from the Dual-Luciferase® Reporter Assay System in a GloMax 96 microplate Dual
Injector Luminometer. The firefly activity was normalized to the Renilla activity per well
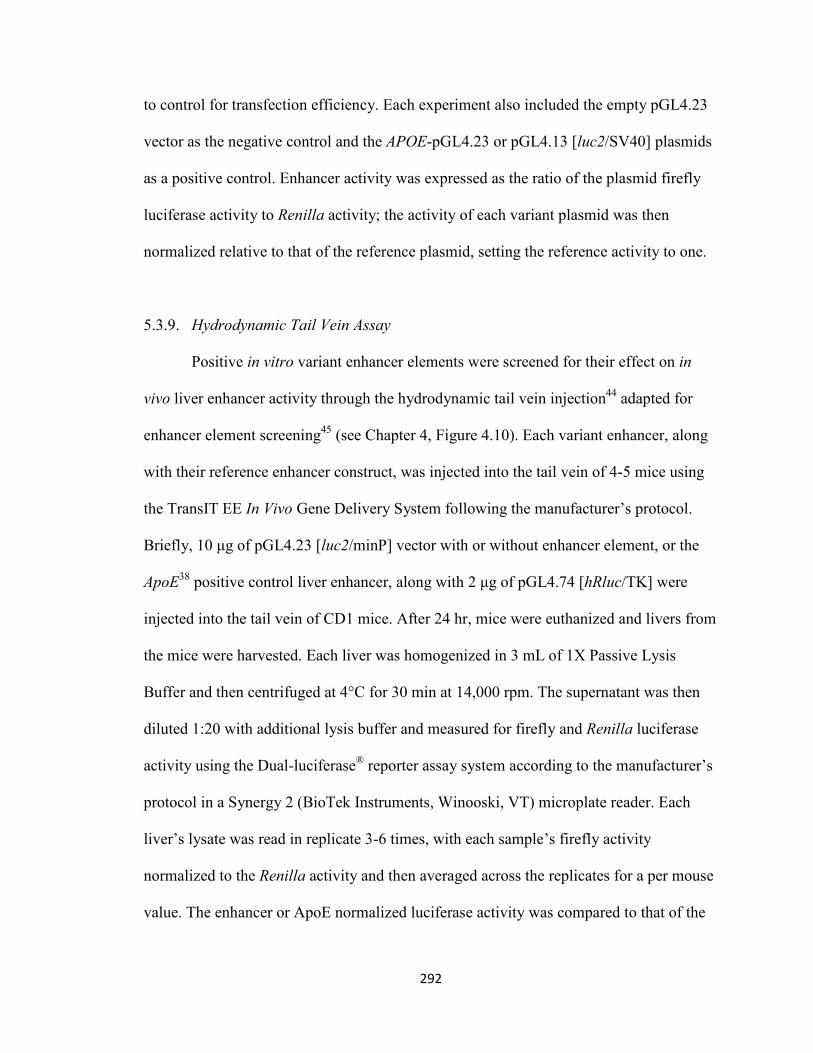
292
to control for transfection efficiency. Each experiment also included the empty pGL4.23
vector as the negative control and the APOE-pGL4.23 or pGL4.13 [luc2/SV40] plasmids
as a positive control. Enhancer activity was expressed as the ratio of the plasmid firefly
luciferase activity to Renilla activity; the activity of each variant plasmid was then
normalized relative to that of the reference plasmid, setting the reference activity to one.
5.3.9. Hydrodynamic Tail Vein Assay
Positive in vitro variant enhancer elements were screened for their effect on in
vivo liver enhancer activity through the hydrodynamic tail vein injection44 adapted for
enhancer element screening45 (see Chapter 4, Figure 4.10). Each variant enhancer, along
with their reference enhancer construct, was injected into the tail vein of 4-5 mice using
the TransIT EE In Vivo Gene Delivery System following the manufacturer’s protocol.
Briefly, 10 μg of pGL4.23 [luc2/minP] vector with or without enhancer element, or the
ApoE38 positive control liver enhancer, along with 2 μg of pGL4.74 [hRluc/TK] were
injected into the tail vein of CD1 mice. After 24 hr, mice were euthanized and livers from
the mice were harvested. Each liver was homogenized in 3 mL of 1X Passive Lysis
Buffer and then centrifuged at 4°C for 30 min at 14,000 rpm. The supernatant was then
diluted 1:20 with additional lysis buffer and measured for firefly and Renilla luciferase
activity using the Dual-luciferase® reporter assay system according to the manufacturer’s
protocol in a Synergy 2 (BioTek Instruments, Winooski, VT) microplate reader. Each
liver’s lysate was read in replicate 3-6 times, with each sample’s firefly activity
normalized to the Renilla activity and then averaged across the replicates for a per mouse
value. The enhancer or ApoE normalized luciferase activity was compared to that of the

293
empty pGL4.23 vector. All mouse work was done following a protocol approved by the
UCSF institutional Animal Care and Use Committee.
5.3.10. Predictions of Transcription Factor Binding Site Changes
Two separate computational tools were used to predict differences in the binding
probability of TFs between reference and variant enhancer sequences. First, Consite46was
used to directly compare the transcription factor binding sites (TFBS) shared between
two aligned genomic sequences. For this analysis, enhancer reference and variant
sequences were extracted from UCSC genome browser (hg19) and imputed as
orthologous pairs of genomic sequences. The regions were scanned for vertebrate TFs
provided by the program, with a minimum specificity of 10 bits. With no conservation
cut off, the TF score threshold was set to 70%, and TFs with greater than 20% change in
binding probability were extracted. The second computational tool was the
TRANSFAC’s Match program47. Individually, the genomic sequence of the reference and
variant enhancers were scanned for the probability of TF binding using the TRANSFAC
release 2012.2 matrix table of all non-redundant vertebrate TFs with high quality
matrices. TRANSFAC determines TF matrices to be high quality if they produce a
minimal amount of false positives when used to scan a control sequence of DNA.
Additionally, default settings were used to minimize false positives, which are calculated
by TRANSFAC by setting a minFP value for each matrix equal to the lowest value which
yields no hits when scanning a control region. The probabilities for TF binding to
reference and variant enhancer sequences of TF’s with a matrix score >0.70 were
compiled, and TFs which had a gain or loss of binding were identified. Consite and

294
TRANSFAC also provided alignments of the consensus TF matrix sequence with that of
the reference and variant enhancer sequences.
5.3.11. Liver and Kidney Tissues
Kidney (n=60) and liver (n=60) samples were procured by the Pharmacogenomics
of Membrane Transporters (PMT) research group at the University of California San
Francisco (San Francisco, CA)48. These tissues were purchased from Asterand (Detroit,
MI), Capital Biosciences (Rockville, MD) and SRI International (Menlo Park, CA). The
Asterand samples included both postmortem tissues and surgical resections from donors;
the Capital Biosciences specimens included surgical resections from normal tissue
surrounding cancer tissues and SRI International included postmortem tissues. All
samples were stored frozen at -80°C until processing for DNA and RNA. Information on
the age, sex, and ethnicity of the patient was available for all samples.
DNA was extracted from the tissues using a Qiagen AllPrep DNA/RNA Mini Kit
following the manufacturer’s protocol, with additional DNA clean-up using the
QIAquick PCR Purification Kit. RNA was extracted from the tissues following the
protocol for Trizol reagent, followed by RNA clean-up with the Qiagen RNeasy
MinElute Cleanup Kit following the manufacturer’s protocol. Good-quality RNA
(260/280 >1.7 and 260/230 >1.8, RNA Integrity number 3-8) was isolated from 58
kidney samples and 60 liver samples, and these were used to correlate SNP genotype
with total ABCG2 mRNA expression. RNA (2 μg) was reverse transcribed to cDNA
using the High Capacity cDNA Reverse Transcription Kit and the following incubation
conditions: 10 min at 22ºC, 2 hr at 37ºC, 5 min at 4ºC, 10 min at 75ºC and 5 min at 4ºC.

295
Exonuclease I enzyme (10 U/mL) was added to each sample and the following incubation
conditions were used to remove excess primers: 1 hr at 37ºC, 5 min at 4ºC and then 10
min at 85ºC to inactivate the exonuclease enzyme. Samples were then stored at -20ºC
until assayed for gene expression or genotype.
5.3.12. ABCG2 mRNA Expression and Genotype in PMT Liver and Kidney Tissues
Gene expression for ABCG2 (along with other transporters) was evaluated in 60
kidney and 60 liver samples from surgical resection or postmortem collections in
Caucasian males and females using the Biotrove Open Array™ qPCR platform (Life
Technologies, Carlsbad, CA) according to the manufacturer’s protocol. ABCG2 mRNA
expression was normalized to a geometric mean of the expression of GAPDH, β-2
microglobin, and β-actin and expressed as 2-ΔΔCt per gene for each sample. All ∆Ct values
for a given tissue type were quantile normalized across samples using the open source R
preprocessCore package49,50. Expression data was quality controlled using principal
component analysis to identify outliers. Of these samples, 58 kidney samples and 34 liver
samples were successfully genotyped on the Affymetrix Axiom (Santa Clara, CA)
genotyping platform using the Axiom® Genome-Wide CEU 1 Array Plate (Affymetrix,
Santa Clara, CA). The samples were tested for quality control (QC) using sex-check,
identity by descent and call rate tests, of which six kidney samples failed and were
excluded from further analysis. After initial QC, 52 kidney samples and 34 liver samples
were included in subsequent analyses.

296
5.3.13. Association of SNPs with Gene Expression
Associations between variants and ABCG2 expression levels in the PMT liver
and kidney tissues were identified by imputing genotypes using 1000 Genomes data and
then testing for correlation between gene expression and genotype using a linear
regression adjusted for gender. Additional liver genotype and expression data provided
by Schadt et al.51 was also analyzed for correlation between genotype and gene
expression. Additionally, gene expression and genotyping data from The Cancer Genome
Atlas (TCGA) breast tissue52 was analyzed in a similar manner. All data were analyzed
using liner regression between SNPs with in vivo effects on enhancer activity and the
expression of ABCG2, PPM1K and PKD2 using the Affymetrix Genotyping Console
(Affymetrix, Santa Clara, CA).
Recently, a database for integrated analysis and visualization of SNP-gene
associations in eQTL studies has become available53. This database includes data from
several sequence and gene expression profiling studies: the MuTHER study54,55 with data
from female twins in adipose, skin and lymphoblastoid cell lines (LCLs), the Stranger
study56–59 with data from HapMap LCLs, and the GenCord study60 with data from human
umbilical fibroblasts, LCLs and T-cells. The expression of ABCG2, PPM1K and PKD2
was correlated to the ABCG2 locus SNPs that altered enhancer activity in vivo, or when
the SNP was not genotyped, with SNPs in LD (r2>0.08, as determined above) with these
SNPs. Using the GeneVar 3.2.0 eQTL analysis program, Spearman rank correlation
coefficients (rho) for 10,000 permutations per SNP between reference, heterozygous and
variant alleles were calculated.

297
5.3.14. Statistical Analysis
Enhancer activity was expressed relative to the reference sequence as described
above. Normalized enhancer activities were determined per transfection, with a minimum
of three and maximum of eight wells per plasmid. All polymorphic enhancer constructs
were compared to the reference enhancer construct by an ANOVA analysis followed by a
Bonferroni’s multiple comparison t-test; P < 0.05 was considered significant.
Polymorphic enhancer constructs identified for in vivo testing had either a 2-fold increase
or 50% decrease in activity and a P < 0.0001 in both cell lines. Results from the
hydrodynamic tail vein injection were analyzed using an unpaired Student’s t-test
between the reference and variant enhancer. All statistics were run using the GraphPad
Prism 5 program.
5.4. Results
5.4.1. Genetic Variation in the ABCG2 Locus Enhancer Regions
A total of 54 SNPs and 5 haplotypes were obtained from publicly available
databases throughout all six enhancer regions with in vivo activity. ECR44 had three
SNPs (Table 5.7), none of which are in linkage disequilibrium (LD) with each other, and
only the rs9999111 SNP had a minor allele frequency (MAF) ≥ 5%. There are six SNPs
in the ECR400 region (Table 5.8), as well as a seventh novel SNP found in the cloned
region (rs88924169 in Table 5.2). In addition, ECR400 has one major haplotype (referred
to as ECR400*1 throughout results), which is a combination of the SNPs rs72873421,
rs12500008 and rs12508471. These three SNPs have MAFs ranging from 8.4-38% and
are in almost perfect linkage disequilibrium (r2=0.96-0.98) with each other (Figure 5.1A).

298
There are ten SNPs in ECR423 (Table 5.9), but only rs76888829 has a MAF above 2%.
There are eight SNPs in CR6 (Table 5.10), the most frequent of which is rs2725268,
which has a MAF ranging from 8-47%. There are 13 SNPs in ECR 31 (Table 5.11) along
with three haplotypes. The most common ECR31 haplotype (referred to as ECR31*1
throughout results) is a combination of the two most frequent SNPs rs2725263 and
rs2725264. These two SNPs have MAFs ranging from 8-87% depending on the ethnic
population, and the ECR31*1 haplotype has a frequency of approximately 31% with an r2
= 0.46 between the two SNPs (Figure 5.1B). There are 14 SNPs and two haplotypes in
ECR33 (Table 5.12). The two haplotypes of ECR33 (*1, rs41282399/ rs2622628) and
(*2, rs2231148/ rs117761897) are comprised of the four most common SNPs in ECR33.
ECR33*1 has a frequency of 3.6% and an r2 = 0.13 between the two SNPs (Figure 5.1C).
ECR33*2 has a frequency of 2.9% and an r2 = 0.07 (Figure 5.1C) between the two SNPs.
The minor allele frequencies for each of the SNPs and haplotypes that were reported are
displayed in Tables 5.7-5.12, and the LD plots for selected SNPs are in Figure 5.1.

299
Table 5.7. SNPs in the ECR44 Enhancer
SNP ID Δnt1 Conserved1 MAF2 % Location3 AA EUR AS
rs9999111 A>C Yes 4.7 7.3 0.0 chr4:89073197 rs138867860 C>A No 0.0 0.0 0.0 chr4:89073397 rs114916387 T>C Yes 2.0 0.0 0.5 chr4:89073289 1Nucleotide change and conservation of the reference allele to the variant allele as obtained from the UCSC genome browser
2Minor allele frequency (MAF) for African American (AA), European (EUR), and Asian (AS) populations as obtained from databases described in methods
3Genomic location obtained from UCSC genome browser's hg19 build
Table 5.8. SNPs in the ECR400 Enhancer
Variant ID1 Δnt2 Conserved2 MAF3 % Location4
AA EUR AS rs72873421 G/A Yes 21.1 8.4 38.1 chr4:88923906 rs117741074 G/A Yes 0.0 0.0 1.7 chr4:88924002 rs12500008 C/A Yes 21.1 8.4 38.3 chr4:88924176 rs2728131 C/T Yes 1.2 8.4 2.8 chr4:88924344 rs12508471 A/G Yes 21.1 8.4 38.3 chr4:88924371 rs78901673 A/G Yes nr nr nr chr4:88924356 *15 - - 16.8 16.8 16.8 - 1Variant ID as either the rs number or haplotype ID 2Nucleotide change and conservation of the reference allele to the variant allele as obtained from the UCSC genome browser
3Frequency of minor allele (MAF) or haplotype (as a percent of all haplotypes) for African American (AA), European (EUR) and Asian (AS) populations
4Genomic location obtained from UCSC genome browser's hg19 build 5rs72873421/rs12500008/rs12508471 (*1) Abbreviations: nr, not reported

300
Table 5.9. SNPs in the ECR423 Enhancer
SNP ID Δnt1 Conserved1 MAF2 % Location3 AA EUR AS
rs137884075 C/T No 0.0 0.0 0.2 chr4:89189556 rs142621223 G/A No 0.0 0.0 0.3 chr4:89189557 rs139553964 G/A No 0.0 0.0 1.2 chr4:89189571 rs149713212 G/A No 1.6 0.0 0.2 chr4:89189602 rs144565932 G/A No 0.0 0.0 1.2 chr4:89189634 rs62309980 C/T Yes 0.0 0.1 0.0 chr4:89189655 rs76888829 T/C Yes 4.3 1.3 1.2 chr4:89190325 rs9998634 G/C Yes 0.4 0.0 0.0 chr4:89190395 rs77538297 C/T Yes 0.2 0.0 0.0 chr4:89189971 rs35696062 G/- Yes nr nr nr chr4:89190022 1Nucleotide change and conservation of the reference allele to the variant allele as obtained from the UCSC genome browser
2Minor allele frequency (MAF) for African American (AA), European (EUR) and Asian (AS) populations as obtained from databases described in methods
3Genomic location obtained from UCSC genome browser's hg19 build Abbreviations: nr, not reported

301
Table 5.10. SNPs in the CR6 Enhancer
SNP ID Δnt1 Conserved1 MAF2 % Location3
AA EUR AS rs45510401 A>G No 4.5 0.0 0.0 chr4:89011422 rs2725268 A>G Yes 7.5 47.4 24.0 chr4:89010983 rs57351915 A>- Yes nr nr nr chr4:89011141 rs58830217 ->A No nr nr nr chr4:89011309 rs186188962 G>A No 0.0 0.5 0.0 chr4:89011051 rs144180103 A>- No nr nr nr chr4:89011129 rs190754327 C>G Yes nr nr nr chr4:89011173 rs183322988 T>C No 0.0 0.3 0.3 chr4:89011437
1Nucleotide change and conservation of the reference allele to the variant allele as obtained from the UCSC genome browser 2Minor allele frequency (MAF) for African American (AA), European (EUR) and Asian (AS) populations as obtained from databases described in methods
3Genomic location obtained from UCSC genome browser's hg19 build Abbreviations: nr, not reported
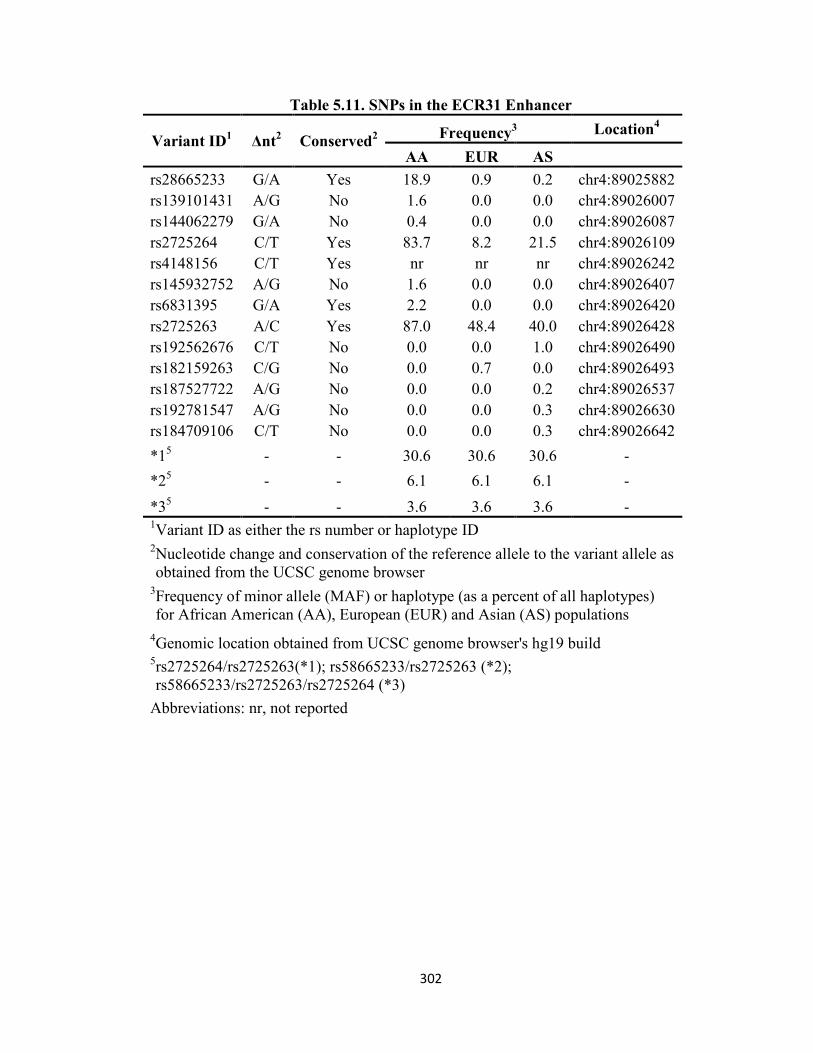
302
Table 5.11. SNPs in the ECR31 Enhancer
Variant ID1 Δnt2 Conserved2 Frequency3 Location4
AA EUR AS rs28665233 G/A Yes 18.9 0.9 0.2 chr4:89025882 rs139101431 A/G No 1.6 0.0 0.0 chr4:89026007 rs144062279 G/A No 0.4 0.0 0.0 chr4:89026087 rs2725264 C/T Yes 83.7 8.2 21.5 chr4:89026109 rs4148156 C/T Yes nr nr nr chr4:89026242 rs145932752 A/G No 1.6 0.0 0.0 chr4:89026407 rs6831395 G/A Yes 2.2 0.0 0.0 chr4:89026420 rs2725263 A/C Yes 87.0 48.4 40.0 chr4:89026428 rs192562676 C/T No 0.0 0.0 1.0 chr4:89026490 rs182159263 C/G No 0.0 0.7 0.0 chr4:89026493 rs187527722 A/G No 0.0 0.0 0.2 chr4:89026537 rs192781547 A/G No 0.0 0.0 0.3 chr4:89026630 rs184709106 C/T No 0.0 0.0 0.3 chr4:89026642 *15 - - 30.6 30.6 30.6 - *25 - - 6.1 6.1 6.1 - *35 - - 3.6 3.6 3.6 - 1Variant ID as either the rs number or haplotype ID 2Nucleotide change and conservation of the reference allele to the variant allele as obtained from the UCSC genome browser
3Frequency of minor allele (MAF) or haplotype (as a percent of all haplotypes) for African American (AA), European (EUR) and Asian (AS) populations
4Genomic location obtained from UCSC genome browser's hg19 build 5rs2725264/rs2725263(*1); rs58665233/rs2725263 (*2); rs58665233/rs2725263/rs2725264 (*3)
Abbreviations: nr, not reported

303
Table 5.12. SNPs in the ECR33 Enhancer
Variant ID1 Δnt2 Conserved2 Frequency3 Location4
AA EUR AS rs34485575 A>- Yes nr nr nr chr4:89028439 rs2231148 T>A Yes 4.3 40.2 18.5 chr4:89028478 rs190738974 A>G No 0.0 0.0 0.2 chr4:89028490 rs117761897 C>T Yes 0.0 0.0 0.2 chr4:89028542 rs41282399 A>C Yes 4.1 1.7 3.3 chr4:89028544 rs113647079 C>G Yes nr nr nr chr4:89028578 rs2054576 A>G Yes 1.2 7.9 25.0 chr4:89028775 rs151266026 T>C No 0.0 0.0 0.7 chr4:89028935 rs183315559 G>A No 0.0 0.0 0.3 chr4:89028979 rs189214307 C>T No 0.0 0.0 0.3 chr4:89029111 rs2622628 A>C Yes 45.5 4.4 20.8 chr4:89029252 rs36105707 ->TTAAT Yes nr nr nr chr4:89029304 rs141635727 A>G No 0.4 0.0 0.0 chr4:89029335 rs190767980 C>T No 0.0 0.0 0.0 chr4:89029361 rs147070185 G>A No 0.0 0.0 0.2 chr4:89029364 *15 - - 3.6 3.6 3.6 - *25 - - 2.9 2.9 2.9 - 1Variant ID as either the rs number or haplotype ID 2Nucleotide change and conservation of the reference allele to the variant allele as obtained from the UCSC genome browser
3Frequency of minor allele (MAF) or haplotype (as a percent of all haplotypes) for African American (AA), European (EUR) and Asian (AS) populations
4Genomic location obtained from UCSC genome browser's hg19 build 5rs412823991/rs2622628 (*1); rs2231148/rs117761897 (*2)
Abbreviations: nr, not reported

304
Figure 5.1. Linkage disequilibrium plots of SNPs in ABCG2 locus enhancers. Plots
show the degree of linkage disequilibrium (LD) of SNPs within ECR400 (A), ECR31 (B)
and ECR33 (C). The top lane shows the rs numbers for the different SNPs within the
region that were reported in any of the 1000 Genomes populations. The r2 values between
each SNP are in the box connecting the two SNPs, i.e., 98 implies r2 = 0.98. Linkage
disequilibrium is depicted by the shade of grey, with black being highly linked and white
no linkage. LD plots were generated using Haploview v4.2 and incorporated genotype
data from all available ethnic groups in the 1000 Genome database.

305
5.4.2. Effect of SNPs on ECR44 In Vitro Activity
All three SNPs in the ECR44 region (Table 5.7) were successfully mutated into
the ECR44 enhancer plasmid and tested for their luciferase activity relative to reference
ECR44 in HepG2 (Figure 5.2A) and HEK293T (Figure 5.2B) cell lines. rs138867860
caused a 1.3- to 1.5-fold increase in luciferase activity in both cell lines. The
rs114916387 SNP had no effect in HepG2 cells, but it was increased by almost 1.5-fold
above reference in HEK293T cells. The rs9999111 SNP was chosen for in vivo follow up
because it displayed over an 80% reduction in activity compared to reference in HepG2
and HEK293T cells, respectively (Figure 5.2).

306
Figure 5.2. Effect of ECR44 genetic variants in vitro. The luciferase activity of ECR44
reference and variant enhancer regions was measured in transiently transfected a) liver
(HepG2) and b) kidney (HEK293T/17) cell lines. Enhancer activity is expressed as the
ratio of firefly to Renilla luciferase activity normalized to the reference enhancer activity
(reference is set to 1). SNPs are displayed respective to their genomic orientation. Data is
expressed as the mean ± SEM from a representative experiment with 4-5 wells per
construct. Differences between reference and variant enhancers were tested by an
ANOVA followed by a post-hoc Bonferroni’s multiple comparison t-test; *** P < 0.0001.

307
5.4.3. Effect of SNPs on ECR400 In Vitro Activity
Seven SNPs in the ECR400 enhancer and the ECR400*1 haplotype (Table 5.8)
were successfully mutated into the ECR400 enhancer plasmid and tested for their
luciferase activity relative to reference in HepG2 (Figure 5.3A) and HEK293T (Figure
5.3B) cell lines. Three SNPs caused an increased activity in both cell lines: rs72873421,
rs117741074 and rs78901673. rs72873421 caused the highest increase (>2-fold) in
enhancer activity relative to the reference sequence. The fifth SNP, significant in both
cell lines, was rs12508471, which had almost a complete loss of activity in HepG2
(Figure 5.3A) and HEK293T (Figure 5.3B) cells. The
rs72873421/rs12500008/rs12508471 (ECR400*1) haplotype did not have a significant
effect in HepG2 cells, but resulted in a 75% reduction of enhancer activity in the
HEK293T cell line. Of the four SNPs that significantly altered the ECR400 enhancer
activity in both cell lines, two of them, rs72873421 and rs12508471, were chosen for in
vivo validation.

308
Figure 5.3. Effect of ECR400 genetic variants in vitro. The luciferase activity of
ECR400 reference and variant enhancer regions was measured in transiently transfected
A) liver (HepG2) and B) kidney (HEK293T/17) cells. Enhancer activity is expressed as
the ratio of the firefly to Renilla luciferase activity normalized to the reference plasmid
(reference is set to 1). SNPs are displayed respective to their genomic orientation. The

309
rs72873421/rs12500008/rs12508471 haplotype is labeled *1. Data is expressed as the
mean ± SEM from a representative experiment with 4-6 wells per construct. Differences
between reference and variant enhancers were tested by an ANOVA followed by a post-
hoc Bonferroni’s multiple comparison t-test; ** P < 0.001, *** P < 0.0001.
5.4.4. Effect of SNPs on ECR423 In Vitro Activity
All nine SNPs in the ECR423 enhancer (Table 5.9) were successfully introduced
into the ECR423 enhancer plasmid and screened for their luciferase activity in HepG2
(Figure 5.4A) and HEK293T (Figure 5.4B) cell lines. Seven of the nine SNPs caused
relatively small but significant increases in enhancer activity relative to the reference
sequence in both cell lines. Three of these SNPs rs62309980, rs777538297 and
rs35696062 had 1.5- to 2-fold increases in activity in both cell lines. The only SNP that
led to a decrease in enhancer activity was rs149713212. It was associated with an ~90%
reduction in enhancer activity in HepG2 (Figure 5.4A) and HEK293T (Figure 5.4B) cell
lines. The ability of the rs149713212 SNP to decrease the enhancer activity of the
ECR423 enhancer led to its selection for in vivo validation.

310
Figure 5.4. Effect of ECR423 genetic variants in vitro. The luciferase activity of
ECR423 reference and variant enhancer regions was measured in transiently transfected
A) liver (HepG2) and B) kidney (HEK293T/17) cell lines. Enhancer activity is expressed
as the ratio of firefly to Renilla luciferase activity normalized to the reference vector
activity (reference is set to 1). SNPs are displayed respective to their genomic orientation.

311
Data is expressed as the mean ± SEM from a representative experiment with 3-5 wells
per construct. Differences between reference and variant enhancers were tested by an
ANOVA followed by a post-hoc Bonferroni’s multiple comparison t-test; ** P < 0.001,
*** P < 0.0001.
5.4.5. Effect of SNPs on CR6 In Vitro Activity
All eight SNPs in the CR6 enhancer (Table 5.10) were successfully introduced
into the CR6 enhancer plasmid and screened for enhancer activity in HepG2 (Figure
5.5A) and HEK293T (Figure 5.5B) cell lines. Four of the SNPs, rs573519157,
rs5883021, rs45510401 and rs190754327, caused small but significant decreases in
relative enhancer activity in both cell lines. The most detrimental was rs573519157,
which led to a 25-50% reduction in relative luciferase activity in both cell lines. The only
SNP to cause a significant increase in enhancer activity was rs183322988, which
increased relative enhancer activity by 1.5-fold in both cell lines. Since CR6 was only a
weak in vivo enhancer (Figure 4.11) only rs183322988 SNP, which enhanced activity,
was chosen for in vivo validation.

312
Figure 5.5. Effect of CR6 genetic variants in vitro. The luciferase activity of CR6
reference and variant enhancer regions was measured in transiently transfected A) liver
(HepG2) and B) kidney (HEK293T/17) cell lines. Enhancer activity is expressed as the
ratio of firefly to Renilla luciferase activity normalized to the reference vector activity
(reference is set to 1). SNPs are displayed respective to their genomic orientation. Data is

313
expressed as the mean ± SEM of a representative experiment with 4-6 wells per
construct. Differences between reference and variant enhancers were tested by an
ANOVA followed by a post-hoc Bonferroni’s multiple comparison t-test; * P < 0.05, **
P < 0.001, *** P < 0.0001.
5.4.6. Effect of SNPs on ECR31 In Vitro Activity
All thirteen SNPs in the ECR31 enhancer and the ECR31*1 haplotype (Table
5.11) were successfully introduced into the ECR31 enhancer construct and screened for
enhancer activity in HepG2 (Figure 5.6A) and HEK293T (Figure 5.6B) cell lines. Only
rs2725263 and rs2725264 had a significant effect on enhancer activity in HepG2 cells
(Figure 5.6A); they both caused over a 1.3-fold increase in relative luciferase activity.
These SNPs had similar increases in enhancer function in HEK293T cells. Interestingly,
the ECR31*1 haplotype, a combination of both rs2725263 and rs2725264, did not affect
enhancer activity. Three other SNPs, rs139101431, rs144062279 and rs184709106, also
had modest increases in enhancer activity in the HEK293T cell line (Figure 5.6B). Only
rs2725263 was chosen for in vivo follow-up because it had a more consistent increase in
enhancer function than the rs2725264 SNP.

314
Figure 5.6. Effect of ECR31 genetic variants in vitro. The luciferase activity of ECR31
reference and variant enhancer regions was measured in transiently transfected A) liver
(HepG2) and B) kidney (HEK293T/17) cell lines. Enhancer activity is expressed as the
ratio of firefly to Renilla luciferase activity normalized to the reference vector activity
(reference is set to 1). SNPs are displayed respective to their genomic orientation. The

315
rs2725263/rs2725264 haplotype is labeled *1. Data is expressed as the mean ± SEM of a
representative experiment with 4-6 wells per construct. Differences between reference
and variant enhancers were tested by an ANOVA followed by a post-hoc Bonferroni’s
multiple comparison t-test; * P < 0.05, ** P < 0.001, *** P < 0.0001.
5.4.7. Effect of SNPs on ECR33 In Vitro Activity
All fourteen SNPs in the ECR33 enhancer and the ECR33*1 haplotype (Table
5.12) were successfully introduced into the ECR31 enhancer construct and screened for
enhancer activity in HepG2 (Figure 5.7A) and HEK293T (Figure 5.7B) cell lines. Three
SNPs caused significantly increased enhancer activity in both cell lines. rs41282399 had
only a slight 1.3- to 1.5-fold increase in function. The other two SNPs, rs190738974 and
rs36105707, both had 1.5- to 2-fold increase in enhancer activity which was replicated in
the HEK293T cell line. Four additional SNPs, rs2231148, rs117761897, rs151266026
and rs2622628, had decreased enhancer activity in the HEK293T cells, ranging from 25%
to 50% reduction. The increased activity of SNP rs41282399 was balanced by the
decreased activity of the rs2622628 in the ECR33*1 haplotype in HepG2 cells, but not in
the HEK293T cells, where ECR33*1 still had significantly increased activity relative to
reference. The only SNP that was chosen for in vivo follow-up was the rs190738974; it
was chosen over the rs36105707 SNP based on predicted changes in TFBS (Table 5.12).

316
Figure 5.7. Effect of ECR33 genetic variants in vitro. The luciferase activity of ECR33
reference and variant enhancer regions was measured in transiently transfected A) liver
(HepG2) and B) kidney (HEK293T/17) cell lines. Enhancer activity is expressed as the
ratio of firefly to Renilla luciferase activity normalized to the reference vector activity
(reference is set to 1). SNPs are displayed respective to their genomic orientation. The

317
rs412823991/rs2622628 haplotype is labeled *1. Data is expressed as the mean ± SEM of
a representative experiment with 4-6 wells per construct. Differences between reference
and variant enhancers were tested by an ANOVA followed by a post-hoc Bonferroni’s
multiple comparison t-test; * P < 0.05, ** P < 0.001, *** P < 0.0001.
5.4.8. Effect of SNPs on Enhancer Activity In Vivo
Seven SNPs were screened for their effect on in vivo liver enhancers using the
hydrodynamic tail vein injection assay. Four of the seven SNPs resulted in decreased
enhancer activity compared to their respective reference enhancer (Figure 5.8). SNP
rs9999111 decreased ECR44 enhancer activity by 70% (Figure 5.8, P < 0.05), consistent
with in vitro results (Figure 5.2). SNP rs72873421 decreased the enhancer activity of
ECR400 by ~50% in vivo but a high level of enhancer activity was still associated with
this region (Figure 5.8, P < 0.05); in vitro this SNP increased the activity of ECR400 in
both HepG2 and HEK293T (Figure 5.3) cell lines. The ECR400 SNP rs12508471
resulted in an almost complete loss of enhancer activity (Figure 5.8, P < 0.0001),
consistent with the complete loss of ECR400 enhancer activity in HepG2 and HEK293T
cells transfected with this variant enhancer sequence (Figure 5.3). The ECR423 SNP
rs149713212 also led to a complete loss of enhancer activity in vivo (Figure 5.8, P <
0.001) consistent with its effect in vitro (Figure 5.4). The only SNP to increase enhancer
activity in vivo was the ECR31 SNP rs2725263 (Figure 5.8). This SNP increased the
ECR31 in vivo enhancer activity by 1.5- fold (Figure 5.8, P < 0.05), which was consistent
with its effect in vitro (Figure 5.6). The CR6 SNP rs183322988 and ECR33 SNP
rs190738974 had no effect on enhancer activity in vivo.

318
Figure 5.8. In vivo liver enhancer activity of ABCG2 locus variants. The luciferase
activity in mouse liver homogenates was measured 24 hr after plasmid injection.
Enhancer activity is expressed as the ratio of firefly to Renilla luciferase activity
normalized to the empty vector activity. SNPs are displayed respective to their genomic
orientation. Data is expressed as the mean ± SEM for 4-5 mice. Differences between
reference and variant enhancer elements were tested by an unpaired Student’s t-test; * P
< 0.05, *** P < 0.0001.

319
5.4.9. Associations of SNPs with mRNA Expression Levels
SNPs that showed an effect on in vivo liver enhancer activity were tested for their
association with expression levels of ABCG2, PKD2 and PPM1K in human liver, kidney,
breast, LCLs, T-cell, adipose and skin cells. Genotype and expression data were collected
both from tissues analyzed by the PMT group and from previously published literature
(Schadt51, TCGA52, MuTHER54, GenCord60 and Stranger56). Since many of the ECRs are
in low-coverage areas for sequencing, they are not included in genotyping platforms.
Therefore, when possible we utilized linkage disequilibrium from 1000 Genomes to
impute genotypes for missing SNPs.
The ECR44 SNP rs9999111 was tested for association with ABCG2 expression in
the PMT liver and kidney tissues and, after correction for sex, was associated with
decreased expression of ABCG2 in kidney tissues (P = 0.05; β=1.814, Figure 5.9B) but
had no association with ABCG2 expression in the liver samples. ABCG2 expression was
also not correlated with rs9999111 in the Schadt51 liver tissues (data not shown).
However, rs9999111 was significantly associated with lower ABCG2 expression in
LCLs and T-cells from the GenCord60 tissues (Figure 5.9 C and D). Due to the low
frequency of rs9999111, very few samples were homozygous for this SNP. Additionally,
there were only 52 kidney PMT tissues; therefore follow-up in a cohort with more kidney
tissues could help clarify the association of this SNP with ABCG2 expression in kidney.
The three SNPs from ECR400, rs12500008, rs12508471 and rs72873421, are in
almost perfect LD (r2=0.96-0.98, Figure 5.1) and occur together as the ECR400*1
haplotype (Table 5.8). The ECR400*1 haplotype was associated with lower ABCG2
expression in LCLs of Chinese (CHB, rho = 0.251, P = 0.025; Figure 5.10A) and trended

320
toward significance with ABCG2 expression in the Kenyan population (LWK, rho =
0.181, P = 0.1; Figure 5.10A). ECR400*1 was also associated with lower PPM1K
expression in adipose (rho=0.2, P=0.015; Figure 5.10B) and skin (rho=0.32, P=0.005;
Figure 5.10C). ECR400*1 was also associated with lower PPM1K expression in LCLs
using two probes for the PPM1K mRNA (rho=0.22, P=0.06 and rho=0.22, P=0.47;
Figure 5.10D). All ECR400*1 associations with PPM1K and ABCG2 had similar effect
sizes (rho ~ 0.25).
There where two SNPs in ECR31 tested for correlation with gene expression in
tissues, both the rs2725263 and rs2725264. These two SNPs have a modest linkage
disequilibrium of r2 = 0.46 (Figure 5.1), occur together in the ECR31*1 haplotype and
both have high minor allele frequencies (Table 5.11). The rs2725263 SNP trended toward
significance when associated with PPM1K expression in TCGA52 breast tissues (P =
0.07, β = -0.22; Figure 5.11A) and PKD2 in the Schadt51 liver tissues (P = 0.066, β = -
0.07; Figure 5.11B). Additionally, the rs2725264 SNP trended toward significance when
associated with PKD2 in the Schadt livers (P = 0.057, β = -0.05; Figure 5.12). Neither
SNP was associated with ABCG2 expression in any of the tissue sets (data not shown).

321

322
Figure 5.9. Association of rs9999111 with ABCG2 expression. Association of the
ECR44 SNP rs9999111 with ABCG2 mRNA expression in (A) human livers and (B)
kidneys from PMT, and in (C) lymphocytes and (D) T-Cells from GenCord60. Analysis
on PMT livers and kidneys were done using a linear regression on imputed genotypes
versus ABCG2 expression (ΔCT) after correcting for sex. Lymphocyte and T-Cell
analysis was done using the GeneVar53 program as described in the Materials and
Methods section with a linear regression and are displayed as ABCG2 expression (ΔCT)
versus rs9999111 genotype with rho (correlation coefficient), P value (P) and empirical P
value (Pemp) indicated.

323
Figure 5.10. Association of rs12500008 with gene expression. Association of the
ECR400 SNP rs12500008 with ABCG2 mRNA expression in (A) HapMap LCLs of Han
Chinese (CHB) and Kenyan (LWK) from the Stranger study57; and with PPM1K in (B)
adipose, (C) skin and (D) LCLs (two probes) from the MuTHER study54. Analysis was
done using the GeneVar53 program as described in Materials and Methods with a linear
regression and are displayed as gene expression versus rs12500008 genotype with rho
(correlation coefficient), P value (P) and empirical P value (Pemp) indicated.

324
Figure 5.11. Association of rs2725263 with PPM1K and PKD2 expression. Trend for
the association of ECR31 rs2725263 with mRNA expression of (A) PPM1K in human
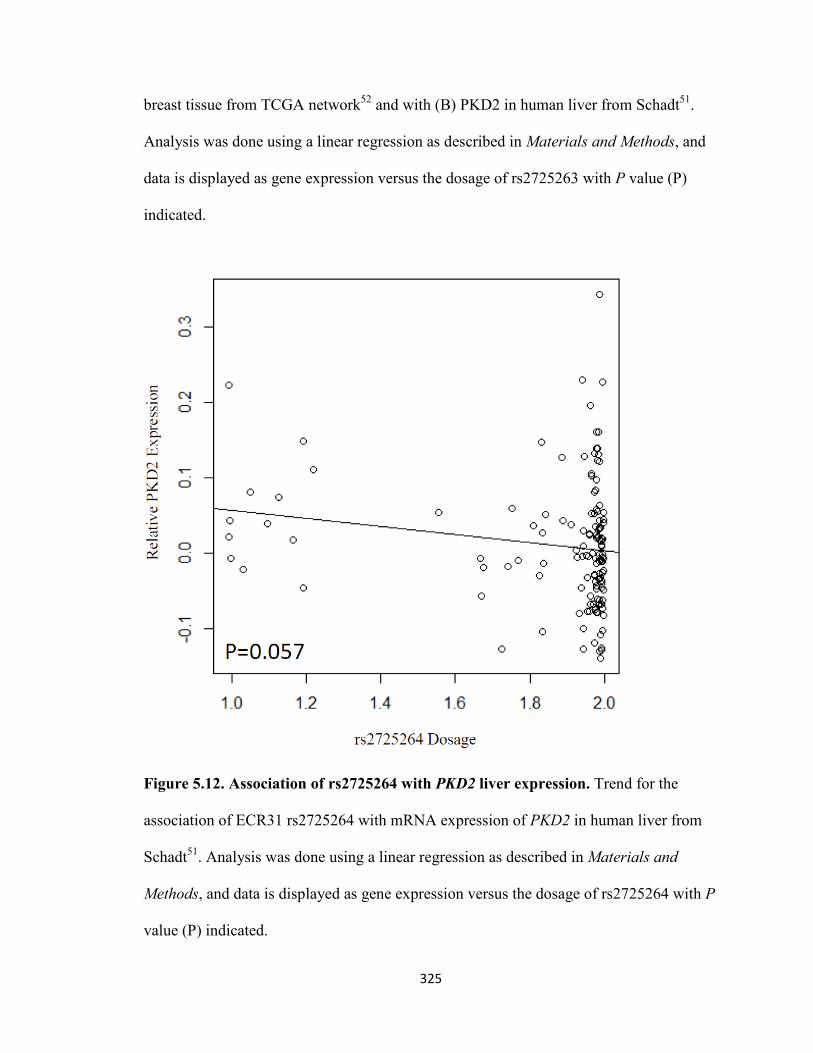
325
breast tissue from TCGA network52 and with (B) PKD2 in human liver from Schadt51.
Analysis was done using a linear regression as described in Materials and Methods, and
data is displayed as gene expression versus the dosage of rs2725263 with P value (P)
indicated.
Figure 5.12. Association of rs2725264 with PKD2 liver expression. Trend for the
association of ECR31 rs2725264 with mRNA expression of PKD2 in human liver from
Schadt51. Analysis was done using a linear regression as described in Materials and
Methods, and data is displayed as gene expression versus the dosage of rs2725264 with P
value (P) indicated.

326
5.4.10. Predicted Alterations in TFBS by SNPs
Functional effects of SNPs on enhancer activity were assessed using TFBS
predictions on both the reference and enhancer sequences using ConSite and
TRANSFAC Match programs (Figure 5.13Figure 5.17). The ECR44 rs9999111 SNP,
which decreased in vivo (Figure 5.8) and in vitro (Figure 5.2) activity of the ECR44
enhancer, had predicted losses in TFBS for HFH-2, Gfi, HNF-3β and RXR-VDR (Figure
5.13).
The ECR400 SNP rs12508471 was the most detrimental SNP, decreasing
ECR400 enhancer activity both in vitro (Figure 5.3) and in vivo (Figure 5.8). There were
no predicted changes in TFBS between the rs12508471 and ECR400 reference sequence
using ConSite. However, the TRANSFAC MATCH program predicted gains for the
rs12508471 sequence in PPAR (direct repeat 1), GR, SREBP, p300, VDR and PXR, none
of which were predicted to bind to the reference ECR400 with a greater than 0.6 core
matrix match score (Figure 5.15). The ECR400 rs72873421 SNP, which had a loss of
function in vivo (Figure 5.8), had predicted gains for PPARγ-RXRα, COUP-TF and HLF
binding probabilities (Figure 5.14). It also had predicted losses for SPI-1, SPI-B and
CREB binding (Figure 5.14).
The ECR423 SNP rs149713212 was the second most detrimental SNP, decreasing
ECR423 activity both in vitro (Figure 5.4) and in vivo (Figure 5.8). For rs149713212,
ConSite predicted gains in TF binding probability for GATA-1, 2&3, RREB-1 and
PPARγ-RXRα (Figure 5.16). The ECR31 SNP rs2725263 increased ECR31 activity both
in vitro (Figure 5.6) and in vivo (Figure 5.8). TFBS predictions show gains in binding for
hepatic TFs HNF-3β, HFH-1 and HFH-2, as well as for the general TFs AP2α, CREB

327
and GATA-3 (Figure 5.17). Although many other SNPs in the high priority ECRs were
predicted to result in TFBS changes (data not shown), none of those SNPs were screened
for their effect on in vivo enhancer activity due to their low impact on in vitro enhancer
activity.
Figure 5.13. Predicted TFBS changes for ECR44 rs9999111. (A) Sequence alignments
for reference and variant ECR44 as determined by ConSite indicate TFBS that are lost
(above alignment) or gained (below alignment) and (B) the binding probabilities for
reference (blue) and SNP (red) sequences. The absolute change in binding probabilities
for each TF, between reference and variant sequences, are indicated.

328
Figure 5.14. Predicted TFBS changes for ECR400 rs72873421. (A) Sequence
alignments for reference and variant ECR400 as determined by ConSite indicate TFBS
that are lost (above alignment) or gained (below alignment) and (B) the binding
probabilities for reference (blue) and SNP (red) sequences. The absolute change in
binding probabilities, between reference and variant sequences, for each TF are indicated.

329
Figure 5.15. Predicted TFBS changes for ECR400 rs12508471. (A) Sequence
alignments of reference and variant ECR400 as determined by TRANSFAC indicate
TFBS that are gained above alignment and (B) the binding probabilities for variant
sequence (blue). None of these TFs had predicted binding for the reference sequence.
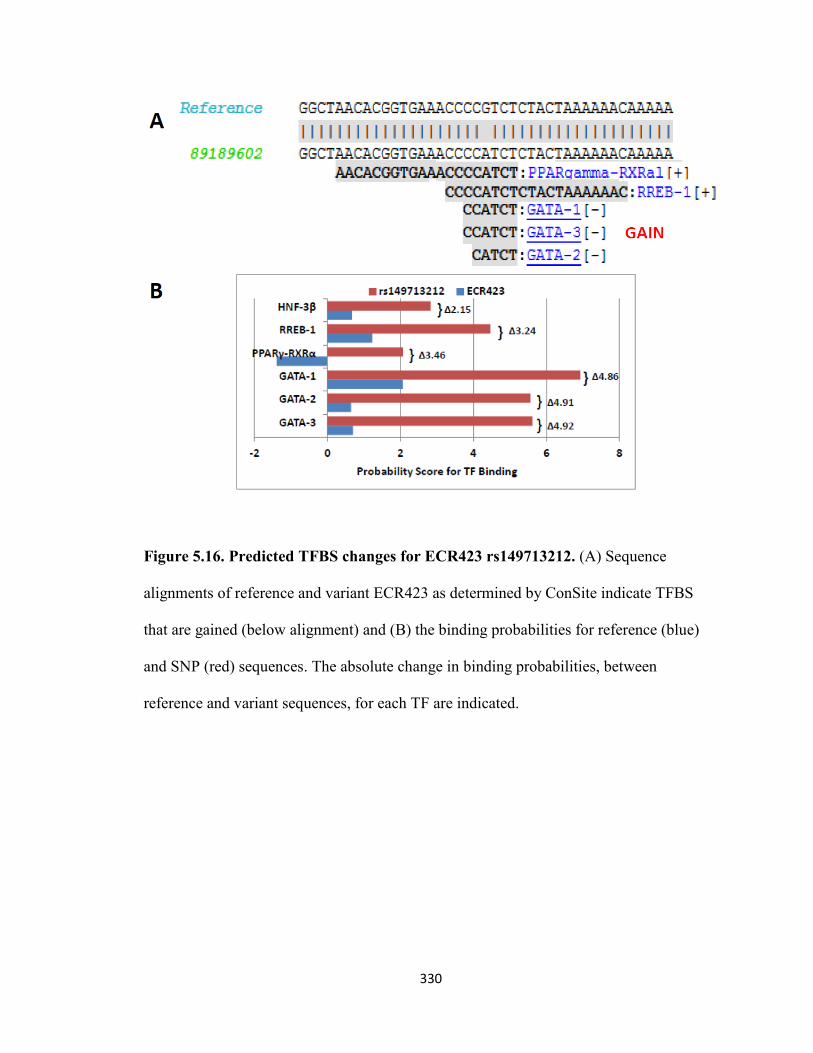
330
Figure 5.16. Predicted TFBS changes for ECR423 rs149713212. (A) Sequence
alignments of reference and variant ECR423 as determined by ConSite indicate TFBS
that are gained (below alignment) and (B) the binding probabilities for reference (blue)
and SNP (red) sequences. The absolute change in binding probabilities, between
reference and variant sequences, for each TF are indicated.

331
Figure 5.17. Predicted TFBS changes for ECR31 rs2725263. (A) Sequence alignments
of reference and variant ECR31 as determined by ConSite indicate TFBS that are gained
(below alignment) and (B) the binding probabilities for reference (blue) and SNP (red)
sequences. The absolute change in binding probabilities, between reference and variant
sequences, for each TF are indicated.
5.5. Discussion
Although non-coding SNPs in the ABCG2 gene locus have been correlated with
drug response61 and disease progression62, relatively few have been correlated with gene

332
expression18,61 and none have confirmed mechanisms of action. Recent studies on other
ADME genes have identified SNPs in cis-regulatory regions that are responsible for
altering the expression of the gene and contributing to adverse drug effects29,63,64.
Following a previous cis-regulatory screen (see Chapter 4) which identified six in
vivo liver enhancers in the ABCG2 gene locus, the in vitro and in vivo effect of SNPs on
enhancer activity was evaluated. There were 54 SNPs throughout the six enhancer
regions. After screening these SNPs for their effect on enhancer activity in vitro, the SNP
in each region with the largest in vitro effect was chosen for in vivo follow-up; in the case
of ECR400, two SNPs were chosen. Of the seven SNPs tested in vivo, five significantly
altered in vivo liver enhancer activity, a 71% success rate, and two of these SNPs
(rs9999111 and rs12508471) were correlated with decreased gene expression in human
tissues. Our ability to identify functional enhancer SNPs in our pipeline is comparable to
other studies that searched first for SNPs associated with transporter expression and then
characterized cis-element activity65 and is slightly higher than the identification of SNPs
in transporter enhancer regions around drug-associated transporters63. Of the SNPs
chosen for in vivo follow-up, four were expected to increase enhancer activity, of which
only one significantly did. However, three of the SNPs decreased enhancer activity both
in vitro and in vivo, suggesting that SNPs decreasing enhancer activity might have a more
consistent effect in vivo.
With the high success rate of the chosen SNPs to alter enhancer activity in vivo,
additional SNPs identified in the in vitro screen could also benefit from in vivo follow-up.
Specifically, it would be interesting to follow-up with the CR6 SNPs rs573519157 and
rs190754327 to see their effect in vivo since they each had a 25% to 50% decrease in

333
activity in both cell lines. Additionally, the ECR33 SNP rs2622628 elicited an over 50%
reduction in enhancer activity in HEK293T cells, and this SNP had a trend for association
with decreased PPM1K and ABCG2 expression in human livers (data not shown). It
would also be interesting to test the positive in vivo SNPs for correlation to gene
expression in both kidney and liver samples. Association of SNPs with liver expression
was first evaluated in the 195 liver samples from Schadt51 and then replication was tested
in 34 liver samples that were available from the PMT cohort. Unfortunately, only 52
kidney samples were available for the primary analysis with no replication cohort. Many
of the enhancer regions are in low sequence coverage areas. Follow-up sequencing on
these enhancer regions could allow for gene expression correlation with the few SNPs
that we were not able to correlate with gene expression in the selected tissues due to their
low MAF and low genotype coverage.
The rs9999111 SNP, which has a MAF of 5%, was chosen for in vivo follow-up
because it displayed an 80% reduction in activity compared to reference in HepG2 and
HEK293T cells, respectively. ECR44 SNP rs9999111, which is located in intron 1 of
ABCG2, significantly decreased the activity of the ECR44 enhancer sequence in vivo by
~70%. The rs9999111 SNP was also associated with decreased ABCG2 expression in
human kidney (after adjusting for sex), LCLs and T-cells. The beta coefficient of
rs9999111 in the kidney (1.8) and the correlation coefficient for rs9999111 in the other
tissues (0.18-0.26) indicate this SNP contributes modestly to the variation in ABCG2
expression. Additionally, the minor allele, rs9999111 is consistently associated with
lower ABCG2 expression across these tissues. However, rs9999111 was not associated
with liver expression of ABCG2 and previously was not found to influence liver or

334
intestinal expression of ABCG218. These data suggest that rs9999111 could regulate
ABCG2 in a tissue-specific manner and possibly play a role in the response of ABCG2
expression to hormones. rs9999111 is predicted to cause a decrease in binding for HFH-
2, Gfi, HNF-3β, RXR-VDR and NF-κB. The zinc-finger transcriptional repressor (Gfi-1)
plays an essential role in hematopoietic development, of interest in lymphoid and T-
cells66. Binding sites for Gfi-1 are enriched around genes specific for liver and whole
blood67. It has been linked to repressed genes in LCLs and K562, but not HepG2 cells68.
However, the dynamic for Gfi-1 to repress genes depends heavily on the expression of its
co-repression TFs and the state of cell differentiation69. Working against the Gfi-1
suppression would be the NF-κB TF, which is an activator for lymphoblastoid
enhancers68. Current literature suggests Gfi-1 works as a transcriptional repressor to
stimulate T-cells, hematopoietic stem cells and liver regeneration, whereas NF-κB works
to activate genes in these cell lines. In addition, HNF-3β regulates gene expression in
selected tissues including hepatocytes and intestinal epithelium70. With the association of
rs9999111 with ABCG2 expression in T-cells, predicted changes in Gfi, NF-κB and
HNF-3β binding and the relevance of these TFs in hematopoietic cells, the ability of this
SNP to alter the binding of these putative TFs needs to be directly tested. Additionally,
more knowledge on the dynamic interaction of Gfi-1 and NF-κB or HNF-3β in each
tissue could elucidate how the rs9999111 SNP may reduce ABCG2 expression.
ECR400*1 is a common haplotype with a frequency of 20% and is made up of
rs12508471, rs72873421 and rs12500008. rs12508471 completely eliminated ECR400
enhancer activity in vitro and in vivo. In contrast, rs72873421 showed increased activity
in vitro, which could limit the decrease in activity by rs12508471 when these SNPs occur

335
together in the ECR400*1 haplotype. However, ECR400*1 showed a 75% decrease in
enhancer activity in the HEK293T cells. Both rs12508471 and rs72873421 had decreased
activity in vivo. The ECR400*1 construct was not tested in vivo and requires further
testing. ECR400*1 was associated with decreased expression of ABCG2 in LCLs (rho=
0.18-0.26) and with PPM1K in several tissues (rho=0.22-31), indicating that this
haplotype may modestly influence the variability in ABCG2 and PPM1K expression in
multiple tissues. ECR400 is situated just upstream of the PKD2 promoter, but it did not
correlate with PKD2 expression in any of the tissue sets (data not shown). The ABCG2
gene is on the anti-strand and PKD2 downstream of the ABCG2 promoter running on the
positive strand. This puts the ABCG2 and PKD2 promoters back-to-back, which would
facilitate an enhancer regulating both promoters. Enhancers that regulate the expression
of linked genes are locus control regions and play a role in the regulation of multiple
genes in a tissue-specific manner71. This enhancer region may regulate both ABCG2 and
PKD2 expression and the ECR400*1 haplotype could contribute to altered expression of
these genes.
TFBS predictions were analyzed to understand the molecular basis for the
detrimental effect of rs12508471 on ECR400 enhancer activity. rs12508471 was
predicted to cause gains in several TFBS, many of which are NRs, including PPAR,
PXR, CREB, GR, p300, SREBP, VDR and multiple COUP-TF sites. NRs need their
ligands to be active, but in the absence of ligands, other TFs often bind to their DNA
consensus sequence, recruit histone binding proteins and work to repress transcriptional
function72. For example, COUP-TF suppresses the GR transcriptional activity by
tethering co-repressors and tightening the chromatin structure73. Additionally, COUP-TF

336
has been shown to repress the transcriptional activity of several other NRs including
RAR, TR, VDR and PPAR by competing for DNA binding, forming inactive
heterodimers or tethering the co-repressor silencing mediator for retinoid and thyroid
hormone receptor (SMRT)74,75. The ECR400 SNP rs72873421 is predicted to gain a
COUP-TF site and lose sites for the general TF SP1. This brings up an interesting
possibility that the rs12508471 and rs72873421 SNPs create multiple new COUP-TF
binding sites which suppress the activity of any NR binding to that region of ECR44.
Further experiments are needed to directly test alteration in binding for these variant
enhancer sequences to the COUP-TF protein. Additionally, follow-up is warranted on
SNPs that correlate with ABCG2 expression (such as rs9999111 and ECR400*1) in
cohorts of patients with drug treatment to see the effect of these SNPs on
pharmacokinetics and pharmacodynamics of MXR substrates.
The ECR423 SNP rs149713212 also caused an extreme loss in enhancer activity
both in vitro and in vivo. Due to the low MAF of rs149713212(0.2-2%) we were unable
to correlated this SNP to gene expression. However, rs149713212 is predicted to cause a
gain in binding of GATA proteins 1, 2, and 3. GATA1 and GATA2 work together or
independently to promote or suppress transcription in differentiation-dependent
settings76. For example, GATA1 will replace GATA2 to suppress genes during the
development of erythrocytes76. Coupled with the changes in GATA1 and GATA2
expression patterns during erythropoieses77, it will be of interest to investigate whether
this SNP is associated with gene suppression in hematopoietic stem cells or differentiated
cells where ABCG2 is normally expressed.

337
The only SNP to exhibit increased in vivo liver enhancer activity was rs2725263
in the ECR31 enhancer region. rs2725263 is common, with MAFs ranging from 40% in
Asians to 84% in African Americans. The rs2725263 SNP was associated with decreased
PPM1K expression in the TCGA breast tissues52, but with increased PKD2 expression in
liver51. The rs2725263 genotype accounted for 22% of variation in PKD2 liver
expression, while it accounted for only 7% of PPM1K breast expression. This SNP is
predicted to increase binding of APα and GATA3, two TFs already shown to bind to
ECR31 over the rs2725263 SNP by ChIP-seq. GATA3 is a TF linked to tissue-specific
gene expression in kidney and breast and is associated with the development of these
tissues76,78. Also, GATA3 is integral to the ERα receptor pathway in several tissues
including kidney and breast78. Although the ECR31 enhancer lies in the middle of
ABCG2 intron 10, SNPs in it are correlated to expression of neighboring genes,
indicating this enhancer might play a more relevant role in their expression.
The other common ECR31 SNP, rs2725264, was present with a MAF ranging
from 8.2% in Europeans to 84% in African Americans. This SNP was not screened in
vivo, but caused a 1.25- to 1.5-fold increase in relative luciferase activity in vitro. It is
possible that this SNP and the rs2725264 ECR31 SNP, which showed a trend for
association with decreased PKD2 expression, could also be relevant for the regulation of
PKD2 through the GATA and ER pathways. This is important because it has been noted
that the severity of polycystic kidney disease is associated with hormonal factors in both
male and female disease progression, and specifically with estrogen exposure in
females35. In Chapter 6, data is presented showing that ECR31 activity changes upon NR
ligand treatment, however further research would be necessary to test if the rs2725263

338
and rs2725264 SNPs respond differently than reference ECR31 to hormone exposure.
Additionally, direct experiments are needed to test if GATA-3 and ERα have altered
binding to the sequence containing rs2725263.
Although we are able to show some correlation between ABCG2 locus enhancer
SNPs and gene expression, further association studies in larger cohorts and in additional
tissues are needed to validate these findings. Electrophoretic mobility shift assays are
needed to confirm the predicted alterations by these SNPs in the proposed TF binding to
the enhancer.
5.6. Conclusions
Liver enhancers identified in the ABCG2 gene locus have many genetic
polymorphisms that alter their activity in vitro. Several of these SNPs, including
rs9999111, rs125084721, rs72873421, rs2725263 and rs149713212 alter enhancer
activity in vivo. The rs9999111 SNP and ECR400*1 haplotype were correlated with
ABCG2 and PPM1K expression in a tissue-specific manner. Predicted alterations in
TFBS provide testable hypotheses for the mechanism by which these SNPs alter enhancer
activity. Taken together, these SNPs could account for some of the reported variability in
ABCG2 and PPM1K expression in various tissues and may influence the correlation
between these genes and disease risk for cancers, ADPKD or gout. Finally, these novel
regulatory SNPs may influence the pharmacokinetics and pharmacodynamics of ABCG2
substrates.

339
5.7. References
(1) Robey, R. W.; To, K. K. K.; Polgar, O.; Dohse, M.; Fetsch, P.; Dean, M.; Bates, S. E. ABCG2: a perspective. Advanced drug delivery reviews 2009, 61, 3–13.
(2) Mo, W.; Zhang, J.-T. Human ABCG2: structure, function, and its role in multidrug resistance. International journal of biochemistry and molecular biology 2012, 3, 1–27.
(3) Zamber, C. P.; Lamba, J. K.; Yasuda, K.; Farnum, J.; Thummel, K.; Schuetz, J. D.; Schuetz, E. G. Natural allelic variants of breast cancer resistance protein (BCRP) and their relationship to BCRP expression in human intestine. Pharmacogenetics 2003, 13, 19–28.
(4) Suvannasankha, a; Minderman, H.; O’Loughlin, K. L.; Nakanishi, T.; Greco, W. R.; Ross, D. D.; Baer, M. R. Breast cancer resistance protein (BCRP/MXR/ABCG2) in acute myeloid leukemia: discordance between expression and function. Leukemia : official journal of the Leukemia Society of America, Leukemia Research Fund, U.K 2004, 18, 1252–7.
(5) Suvannasankha, A.; Minderman, H.; O’Loughlin, K. L.; Nakanishi, T.; Ford, L. a; Greco, W. R.; Wetzler, M.; Ross, D. D.; Baer, M. R. Breast cancer resistance protein (BCRP/MXR/ABCG2) in adult acute lymphoblastic leukaemia: frequent expression and possible correlation with shorter disease-free survival. British journal of haematology 2004, 127, 392–8.
(6) Benderra, Z.; Faussat, A.-M.; Sayada, L.; Perrot, J.-Y.; Chaoui, D.; Marie, J.-P.; Legrand, O. Breast cancer resistance protein and P-glycoprotein in 149 adult acute myeloid leukemias. Clinical cancer research : an official journal of the American Association for Cancer Research 2004, 10, 7896–902.
(7) Tsunoda, S.; Okumura, T.; Ito, T.; Kondo, K.; Ortiz, C.; Tanaka, E.; Watanabe, G.; Itami, A.; Sakai, Y.; Shimada, Y. ABCG2 expression is an independent unfavorable prognostic factor in esophageal squamous cell carcinoma. Oncology 2006, 71, 251–8.
(8) Usuda, J.; Tsunoda, Y.; Ichinose, S.; Ishizumi, T.; Ohtani, K.; Maehara, S.; Ono, S.; Tsutsui, H.; Ohira, T.; Okunaka, T.; Furukawa, K.; Sugimoto, Y.; Kato, H.; Ikeda, N. Breast cancer resistant protein (BCRP) is a molecular determinant of the outcome of photodynamic therapy (PDT) for centrally located early lung cancer. Lung cancer (Amsterdam, Netherlands) 2010, 67, 198–204.
(9) Uggla, B.; Ståhl, E.; Wågsäter, D.; Paul, C.; Karlsson, M. G.; Sirsjö, A.; Tidefelt, U. BCRP mRNA expression v. clinical outcome in 40 adult AML patients. Leukemia research 2005, 29, 141–6.

340
(10) Yoh, K. Breast Cancer Resistance Protein Impacts Clinical Outcome in Platinum-Based Chemotherapy for Advanced Non-Small Cell Lung Cancer. Clinical Cancer Research 2004, 10, 1691–1697.
(11) Kim, K.; Joo, H.-J.; Park, J.-Y. ABCG2 polymorphisms, 34G>A and 421C>A in a Korean population: analysis and a comprehensive comparison with other populations. Journal of clinical pharmacy and therapeutics 2010, 35, 705–12.
(12) Tamura, A.; Onishi, Y.; An, R.; Koshiba, S.; Wakabayashi, K.; Hoshijima, K.; Priebe, W.; Yoshida, T.; Kometani, S.; Matsubara, T.; Mikuriya, K.; Ishikawa, T. In vitro evaluation of photosensitivity risk related to genetic polymorphisms of human ABC transporter ABCG2 and inhibition by drugs. Drug metabolism and pharmacokinetics 2007, 22, 428–40.
(13) Wakabayashi, K.; Tamura, A.; Saito, H.; Onishi, Y.; Ishikawa, T. Human ABC transporter ABCG2 in xenobiotic protection and redox biology. Drug metabolism reviews 2006, 38, 371–91.
(14) Ishikawa, T.; Tamura, A.; Saito, H.; Wakabayashi, K.; Nakagawa, H. Pharmacogenomics of the human ABC transporter ABCG2: from functional evaluation to drug molecular design. Die Naturwissenschaften 2005, 92, 451–63.
(15) Yanase, K.; Tsukahara, S.; Mitsuhashi, J.; Sugimoto, Y. Functional SNPs of the breast cancer resistance protein-therapeutic effects and inhibitor development. Cancer letters 2006, 234, 73–80.
(16) Tamura, A.; Watanabe, M.; Saito, H.; Nakagawa, H.; Kamachi, T.; Okura, I.; Ishikawa, T. Functional validation of the genetic polymorphisms of human ATP-binding cassette (ABC) transporter ABCG2: identification of alleles that are defective in porphyrin transport. Molecular pharmacology 2006, 70, 287–96.
(17) Yoshioka, S.; Katayama, K.; Okawa, C.; Takahashi, S.; Tsukahara, S.; Mitsuhashi, J.; Sugimoto, Y. The identification of two germ-line mutations in the human breast cancer resistance protein gene that result in the expression of a low/non-functional protein. Pharmaceutical research 2007, 24, 1108–17.
(18) Poonkuzhali, B.; Lamba, J.; Strom, S. Association of breast cancer resistance protein/ABCG2 phenotypes and novel promoter and intron 1 single nucleotide polymorphisms. Drug Metabolism and … 2008, 36, 780–795.
(19) Jonker, J. W.; Buitelaar, M.; Wagenaar, E.; Van Der Valk, M. a; Scheffer, G. L.; Scheper, R. J.; Plosch, T.; Kuipers, F.; Elferink, R. P. J. O.; Rosing, H.; Beijnen, J. H.; Schinkel, A. H. The breast cancer resistance protein protects against a major chlorophyll-derived dietary phototoxin and protoporphyria. Proceedings of the National Academy of Sciences of the United States of America 2002, 99, 15649–54.

341
(20) Desuzinges-Mandon, E.; Arnaud, O.; Martinez, L.; Huché, F.; Di Pietro, A.; Falson, P. ABCG2 transports and transfers heme to albumin through its large extracellular loop. The Journal of biological chemistry 2010, 285, 33123–33.
(21) Krishnamurthy, P.; Schuetz, J. D. The ABC transporter Abcg2/Bcrp: role in hypoxia mediated survival. Biometals : an international journal on the role of metal ions in biology, biochemistry, and medicine 2005, 18, 349–58.
(22) Wan, P.; Moat, S.; Anstey, A. Pellagra: a review with emphasis on photosensitivity. The British journal of dermatology 2011, 164, 1188–200.
(23) Ho, A. Y. L.; Deacon, A.; Osborne, G.; Mufti, G. J. Precipitation of porphyria cutanea tarda by imatinib mesylate? British journal of haematology 2003, 121, 375.
(24) Reginato, A. M.; Mount, D. B.; Yang, I.; Choi, H. K. The genetics of hyperuricaemia and gout. Nature reviews. Rheumatology 2012, 8, 610–21.
(25) Rodrigues, A. C.; Curi, R.; Genvigir, F. D. V.; Hirata, M. H.; Hirata, R. D. C. The expression of efflux and uptake transporters are regulated by statins in Caco-2 and HepG2 cells. Acta pharmacologica Sinica 2009, 30, 956–64.
(26) Cusatis, G.; Gregorc, V.; Li, J.; Spreafico, A.; Ingersoll, R. G.; Verweij, J.; Ludovini, V.; Villa, E.; Hidalgo, M.; Sparreboom, A.; Baker, S. D. Pharmacogenetics of ABCG2 and adverse reactions to gefitinib. Journal of the National Cancer Institute 2006, 98, 1739–42.
(27) Jonker, J. W.; Merino, G.; Musters, S.; Van Herwaarden, A. E.; Bolscher, E.; Wagenaar, E.; Mesman, E.; Dale, T. C.; Schinkel, A. H. The breast cancer resistance protein BCRP (ABCG2) concentrates drugs and carcinogenic xenotoxins into milk. Nature medicine 2005, 11, 127–9.
(28) Noguchi, K.; Katayama, K.; Mitsuhashi, J.; Sugimoto, Y. Functions of the breast cancer resistance protein (BCRP/ABCG2) in chemotherapy. Advanced drug delivery reviews 2009, 61, 26–33.
(29) Georgitsi, M.; Zukic, B.; Pavlovic, S.; Patrinos, G. P. Transcriptional regulation and pharmacogenomics. Pharmacogenomics 2011, 12, 655–73.
(30) Smith, R. P.; Lam, E. T.; Markova, S.; Yee, S. W.; Ahituv, N. Pharmacogene regulatory elements: from discovery to applications. Genome medicine 2012, 4, 45.
(31) Ge, B.; Pokholok, D. K.; Kwan, T.; Grundberg, E.; Morcos, L.; Verlaan, D. J.; Le, J.; Koka, V.; Lam, K. C. L.; Gagné, V.; Dias, J.; Hoberman, R.; Montpetit, A.; Joly, M.-M.; Harvey, E. J.; Sinnett, D.; Beaulieu, P.; Hamon, R.; Graziani, A.; Dewar, K.; Harmsen, E.; Majewski, J.; Göring, H. H. H.; Naumova, A. K.;

342
Blanchette, M.; Gunderson, K. L.; Pastinen, T. Global patterns of cis variation in human cells revealed by high-density allelic expression analysis. Nature genetics 2009, 41, 1216–22.
(32) Pastinen, T. Genome-wide allele-specific analysis: insights into regulatory variation. Nature reviews. Genetics 2010, 11, 533–8.
(33) Tan, Y.-C.; Blumenfeld, J.; Rennert, H. Autosomal dominant polycystic kidney disease: genetics, mutations and microRNAs. Biochimica et biophysica acta 2011, 1812, 1202–12.
(34) Peters, D. J.; Spruit, L.; Saris, J. J.; Ravine, D.; Sandkuijl, L. A.; Fossdal, R.; Boersma, J.; Van Eijk, R.; Nørby, S.; Constantinou-Deltas, C. D. Chromosome 4 localization of a second gene for autosomal dominant polycystic kidney disease. Nature genetics 1993, 5, 359–62.
(35) Rossetti, S.; Harris, P. C. Genotype-phenotype correlations in autosomal dominant and autosomal recessive polycystic kidney disease. Journal of the American Society of Nephrology : JASN 2007, 18, 1374–80.
(36) Lu, G.; Ren, S.; Korge, P.; Choi, J.; Dong, Y.; Weiss, J.; Koehler, C.; Chen, J.; Wang, Y. A novel mitochondrial matrix serine/threonine protein phosphatase regulates the mitochondria permeability transition pore and is essential for cellular survival and development. Genes & development 2007, 21, 784–96.
(37) Zhou, M.; Lu, G.; Gao, C.; Wang, Y.; Sun, H. Tissue-specific and nutrient regulation of the branched-chain α-keto acid dehydrogenase phosphatase, protein phosphatase 2Cm (PP2Cm). The Journal of biological chemistry 2012, 287, 23397–406.
(38) Simonet, W. S.; Bucay, N.; Lauer, S. J.; Taylor, J. M. A far-downstream hepatocyte-specific control region directs expression of the linked human apolipoprotein E and C-I genes in transgenic mice. The Journal of biological chemistry 1993, 268, 8221–9.
(39) Africa, W. A map of human genome variation from population-scale sequencing. Nature 2010, 467, 1061–73.
(40) Frazer, K. a; et. al. A second generation human haplotype map of over 3.1 million SNPs. Nature 2007, 449, 851–61.
(41) Barrett, J. C.; Fry, B.; Maller, J.; Daly, M. J. Haploview: analysis and visualization of LD and haplotype maps. Bioinformatics (Oxford, England) 2005, 21, 263–5.

343
(42) Johnson, A. D.; Handsaker, R. E.; Pulit, S. L.; Nizzari, M. M.; O’Donnell, C. J.; De Bakker, P. I. W. SNAP: a web-based tool for identification and annotation of proxy SNPs using HapMap. Bioinformatics (Oxford, England) 2008, 24, 2938–9.
(43) Liu, H.; Naismith, J. H. An efficient one-step site-directed deletion, insertion, single and multiple-site plasmid mutagenesis protocol. BMC biotechnology 2008, 8, 91.
(44) Liu, F.; Song, Y.; Liu, D. Hydrodynamics-based transfection in animals by systemic administration of plasmid DNA. Gene therapy 1999, 6, 1258–66.
(45) Kim, M. J.; Ahituv, N. The Hydrodynamic Tail Vein Assay as a Tool for the Study of Liver Promoters and Enhancers. In Pharmacogenomics: Methods and Protocols; Innocenti, F.; van Schaik, R. H. N., Eds.; 2012.
(46) Sandelin, A.; Wasserman, W. W.; Lenhard, B. ConSite: web-based prediction of regulatory elements using cross-species comparison. Nucleic acids research 2004, 32, W249–52.
(47) Wingender, E.; Chen, X.; Hehl, R.; Karas, H.; Liebich, I.; Matys, V.; Meinhardt, T.; Prüss, M.; Reuter, I.; Schacherer, F. TRANSFAC: an integrated system for gene expression regulation. Nucleic acids research 2000, 28, 316–9.
(48) Kroetz, D. L.; Yee, S. W.; Giacomini, K. M. The pharmacogenomics of membrane transporters project: research at the interface of genomics and transporter pharmacology. Clinical pharmacology and therapeutics 2010, 87, 109–16.
(49) Bolstad, B. M.; Irizarry, R. A.; Astrand, M.; Speed, T. P. A comparison of normalization methods for high density oligonucleotide array data based on variance and bias. Bioinformatics (Oxford, England) 2003, 19, 185–93.
(50) Boes, T.; Neuhäuser, M. Normalization for Affymetrix GeneChips. Methods of information in medicine 2005, 44, 414–7.
(51) Schadt, E. E.; Molony, C.; Chudin, E.; Hao, K.; Yang, X.; Lum, P. Y.; Kasarskis, A.; Zhang, B.; Wang, S.; Suver, C.; Zhu, J.; Millstein, J.; Sieberts, S.; Lamb, J.; GuhaThakurta, D.; Derry, J.; Storey, J. D.; Avila-Campillo, I.; Kruger, M. J.; Johnson, J. M.; Rohl, C. a; Van Nas, A.; Mehrabian, M.; Drake, T. a; Lusis, A. J.; Smith, R. C.; Guengerich, F. P.; Strom, S. C.; Schuetz, E.; Rushmore, T. H.; Ulrich, R. Mapping the genetic architecture of gene expression in human liver. PLoS biology 2008, 6, e107.
(52) The Cancer Genome Atlas Network Comprehensive molecular portraits of human breast tumours. Nature 2012, 490, 61–70.

344
(53) Yang, T.-P.; Beazley, C.; Montgomery, S. B.; Dimas, A. S.; Gutierrez-Arcelus, M.; Stranger, B. E.; Deloukas, P.; Dermitzakis, E. T. Genevar: a database and Java application for the analysis and visualization of SNP-gene associations in eQTL studies. Bioinformatics (Oxford, England) 2010, 26, 2474–6.
(54) Nica, A. C.; Parts, L.; Glass, D.; Nisbet, J.; Barrett, A.; Sekowska, M.; Travers, M.; Potter, S.; Grundberg, E.; Small, K.; Hedman, A. K.; Bataille, V.; Tzenova Bell, J.; Surdulescu, G.; Dimas, A. S.; Ingle, C.; Nestle, F. O.; Di Meglio, P.; Min, J. L.; Wilk, A.; Hammond, C. J.; Hassanali, N.; Yang, T.-P.; Montgomery, S. B.; O’Rahilly, S.; Lindgren, C. M.; Zondervan, K. T.; Soranzo, N.; Barroso, I.; Durbin, R.; Ahmadi, K.; Deloukas, P.; McCarthy, M. I.; Dermitzakis, E. T.; Spector, T. D. The architecture of gene regulatory variation across multiple human tissues: the MuTHER study. PLoS genetics 2011, 7, e1002003.
(55) Grundberg, E.; Small, K. S.; Hedman, Å. K.; Nica, A. C.; Buil, A.; Keildson, S.; Bell, J. T.; Yang, T.; Meduri, E.; Barrett, A.; Nisbett, J.; Sekowska, M.; Wilk, A.; Shin, S.; Glass, D.; Travers, M.; Min, J. L.; Ring, S.; Ho, K.; Thorleifsson, G.; Kong, A.; Thorsteindottir, U.; Ainali, C.; Dimas, A. S.; Hassanali, N.; Ingle, C.; Knowles, D.; Krestyaninova, M.; Lowe, C. E.; Meglio, P. Di; Montgomery, S. B.; Parts, L.; Potter, S.; Surdulescu, G.; Tsaprouni, L.; Tsoka, S.; Bataille, V.; Durbin, R.; Nestle, F. O.; Rahilly, S. O.; Soranzo, N.; Lindgren, C. M.; Zondervan, K. T.; Ahmadi, K. R.; Schadt, E. E.; Stefansson, K.; Smith, G. D.; Mccarthy, M. I.; Deloukas, P.; Dermitzakis, E. T.; Spector, T. D.; Multiple, T.; Human, T. Articles Mapping cis- and trans-regulatory effects across multiple tissues in twins. 2012, 44.
(56) Stranger, B. E.; Nica, A. C.; Forrest, M. S.; Dimas, A.; Bird, C. P.; Beazley, C.; Ingle, C. E.; Dunning, M.; Flicek, P.; Koller, D.; Montgomery, S.; Tavaré, S.; Deloukas, P.; Dermitzakis, E. T. Population genomics of human gene expression. Nature genetics 2007, 39, 1217–24.
(57) Stranger, B. E.; Forrest, M. S.; Clark, A. G.; Minichiello, M. J.; Deutsch, S.; Lyle, R.; Hunt, S.; Kahl, B.; Antonarakis, S. E.; Tavaré, S.; Deloukas, P.; Dermitzakis, E. T. Genome-wide associations of gene expression variation in humans. PLoS genetics 2005, 1, e78.
(58) Stranger, B. E.; Forrest, M. S.; Dunning, M.; Ingle, C. E.; Beazley, C.; Thorne, N.; Redon, R.; Bird, C. P.; De Grassi, A.; Lee, C.; Tyler-Smith, C.; Carter, N.; Scherer, S. W.; Tavaré, S.; Deloukas, P.; Hurles, M. E.; Dermitzakis, E. T. Relative impact of nucleotide and copy number variation on gene expression phenotypes. Science (New York, N.Y.) 2007, 315, 848–53.
(59) Stranger, B. E.; Montgomery, S. B.; Dimas, A. S.; Parts, L.; Stegle, O.; Ingle, C. E.; Sekowska, M.; Smith, G. D.; Evans, D.; Gutierrez-Arcelus, M.; Price, A.; Raj, T.; Nisbett, J.; Nica, A. C.; Beazley, C.; Durbin, R.; Deloukas, P.; Dermitzakis, E.

345
T. Patterns of cis regulatory variation in diverse human populations. PLoS genetics 2012, 8, e1002639.
(60) Dimas, A.; Deutsch, S.; Stranger, B. Common regulatory variation impacts gene expression in a cell type–dependent manner. Science 2009, 325, 1246–1250.
(61) Rudin, C. M.; Liu, W.; Desai, A.; Karrison, T.; Jiang, X.; Janisch, L.; Das, S.; Ramirez, J.; Poonkuzhali, B.; Schuetz, E.; Fackenthal, D. L.; Chen, P.; Armstrong, D. K.; Brahmer, J. R.; Fleming, G. F.; Vokes, E. E.; Carducci, M. A.; Ratain, M. J. Pharmacogenomic and pharmacokinetic determinants of erlotinib toxicity. Journal of clinical oncology : official journal of the American Society of Clinical Oncology 2008, 26, 1119–27.
(62) Campa, D.; Butterbach, K.; Slager, S. L.; Skibola, C. F.; De Sanjosé, S.; Benavente, Y.; Becker, N.; Foretova, L.; Maynadie, M.; Cocco, P.; Staines, A.; Kaaks, R.; Boffetta, P.; Brennan, P.; Conde, L.; Bracci, P. M.; Caporaso, N. E.; Strom, S. S.; Camp, N. J.; Cerhan, J. R.; Consortium, G.; Canzian, F.; Nieters, A. A comprehensive study of polymorphisms in the ABCB1, ABCC2, ABCG2, NR1I2 genes and lymphoma risk. International journal of cancer. Journal international du cancer 2012, 131, 803–12.
(63) Kim, M. J.; Skewes-Cox, P.; Fukushima, H.; Hesselson, S.; Yee, S. W.; Ramsey, L. B.; Nguyen, L.; Eshragh, J. L.; Castro, R. A.; Wen, C. C.; Stryke, D.; Johns, S. J.; Ferrin, T. E.; Kwok, P.; Relling, M. V; Giacomini, K. M.; Kroetz, D. L.; Ahituv, N. Functional characterization of liver enhancers that regulate drug-associated transporters. Clinical pharmacology and therapeutics 2011, 89, 571–8.
(64) McLeod, H. L.; Sargent, D. J.; Marsh, S.; Green, E. M.; King, C. R.; Fuchs, C. S.; Ramanathan, R. K.; Williamson, S. K.; Findlay, B. P.; Thibodeau, S. N.; Grothey, A.; Morton, R. F.; Goldberg, R. M. Pharmacogenetic predictors of adverse events and response to chemotherapy in metastatic colorectal cancer: results from North American Gastrointestinal Intergroup Trial N9741. Journal of clinical oncology : official journal of the American Society of Clinical Oncology 2010, 28, 3227–33.
(65) Matsson, P.; Yee, S. W.; Markova, S.; Morrissey, K.; Jenkins, G.; Xuan, J.; Jorgenson, E.; Kroetz, D. L.; Giacomini, K. M. Discovery of regulatory elements in human ATP-binding cassette transporters through expression quantitative trait mapping. The pharmacogenomics journal 2011, 1–13.
(66) Hock, H.; Orkin, S. H. Zinc-finger transcription factor Gfi-1: versatile regulator of lymphocytes, neutrophils and hematopoietic stem cells. Current opinion in hematology 2006, 13, 1–6.
(67) Girgis, H. Z.; Ovcharenko, I. Predicting tissue specific cis-regulatory modules in the human genome using pairs of co-occurring motifs. BMC bioinformatics 2012, 13, 25.

346
(68) Ernst, J.; Kheradpour, P.; Mikkelsen, T. S.; Shoresh, N.; Ward, L. D.; Epstein, C. B.; Zhang, X.; Wang, L.; Issner, R.; Coyne, M.; Ku, M.; Durham, T.; Kellis, M.; Bernstein, B. E. Mapping and analysis of chromatin state dynamics in nine human cell types. Nature 2011, 473, 43–9.
(69) Saleque, S.; Kim, J.; Rooke, H. M.; Orkin, S. H. Epigenetic regulation of hematopoietic differentiation by Gfi-1 and Gfi-1b is mediated by the cofactors CoREST and LSD1. Molecular cell 2007, 27, 562–72.
(70) Schrem, H.; Klempnauer, J.; Borlak, J. Liver-enriched transcription factors in liver function and development. Part I: the hepatocyte nuclear factor network and liver-specific gene expression. Pharmacological reviews 2002, 54, 129–58.
(71) Li, Q.; Peterson, K. R.; Fang, X.; Stamatoyannopoulos, G. Locus control regions. Blood 2002, 100, 3077–86.
(72) Wiench, M.; Miranda, T. B.; Hager, G. L. Control of nuclear receptor function by local chromatin structure. The FEBS journal 2011, 278, 2211–30.
(73) De Martino, M. U.; Alesci, S.; Chrousos, G. P.; Kino, T. Interaction of the glucocorticoid receptor and the chicken ovalbumin upstream promoter-transcription factor II (COUP-TFII): implications for the actions of glucocorticoids on glucose, lipoprotein, and xenobiotic metabolism. Annals of the New York Academy of Sciences 2004, 1024, 72–85.
(74) Shibata, H.; Nawaz, Z.; Tsai, S. Y.; O’Malley, B. W.; Tsai, M. J. Gene silencing by chicken ovalbumin upstream promoter-transcription factor I (COUP-TFI) is mediated by transcriptional corepressors, nuclear receptor-corepressor (N-CoR) and silencing mediator for retinoic acid receptor and thyroid hormone receptor (SMRT). Molecular endocrinology (Baltimore, Md.) 1997, 11, 714–24.
(75) Qiu, Y.; Krishnan, V.; Pereira, F. A.; Tsai, S. Y.; Tsai, M. J. Chicken ovalbumin upstream promoter-transcription factors and their regulation. The Journal of steroid biochemistry and molecular biology 1996, 56, 81–5.
(76) Bresnick, E. H.; Katsumura, K. R.; Lee, H.-Y.; Johnson, K. D.; Perkins, A. S. Master regulatory GATA transcription factors: mechanistic principles and emerging links to hematologic malignancies. Nucleic acids research 2012, 40, 5819–31.
(77) Bresnick, E. H.; Lee, H.-Y.; Fujiwara, T.; Johnson, K. D.; Keles, S. GATA switches as developmental drivers. The Journal of biological chemistry 2010, 285, 31087–93.
(78) Wilson, B. J. Does GATA3 act in tissue-specific pathways ? A meta-analysis-based approach. 2008, 1–6.

347
Chapter 6 : Characterization of Inducible Regulatory Elements of the ABCG2 Locus
6.1. Abstract
The mitoxantrone resistance protein (MXR, BCRP) is one of many drug
transporters, and its gene ABCG2 is regulated by nuclear receptors (NR). NRs are ligand-
dependent transcription factors that upon activation by their ligand, bind to specific
sequences in DNA and work to activate or repress target genes. In the present study, we
examine the effect of NR ligands on the activity of putative regulatory regions from the
ABCG2 locus. Reference and variant ABCG2 enhancers, suppressors and promoter were
cloned into luciferase reporter vectors, transiently transfected into MCF-7 and HepG2
cell lines and then treated with rifampin, 17β-estradiol (E2), dexamethasone and
benzo[a]pyrene (B[a]P). The ABCG2 promoter responded to E2, dexamethasone and
B[a]P, and the promoter SNP rs66664036 had a significantly altered response to E2
compared to the reference promoter. Nine rifampin, six E2 and three dexamethasone
responsive regulatory regions were identified. The ECR400 SNP rs12508471 has a
significantly altered response to E2 compared to reference ECR400. Finally, the CR6
SNPs rs573519157 and rs190754327 both responded differently to E2 than reference
CR6. These results describe novel hormone response elements within the ABCG2 gene
locus and SNPs within these regions that could explain clinical variation in ABCG2
expression.
6.2. Introduction
Drug metabolism and transporter genes are regulated by nuclear receptors (NR)
which stimulate drug detoxification pathways in the body1,2. NRs are ligand-dependent

348
transcription factors (TFs) that bind to consensus sequences in the genome and promote
the transcription or transrepression of target genes3. NRs exist as homo- and heterodimers
with each partner recognizing specific DNA sequences, called response elements4. These
response elements exist as direct, indirect or inverted half-sites separated by variable
length nucleotide spacers5. NRs have been classified depending upon their binding
partner and the type of response element to which they bind4. Class I NRs include the
steroid hormones and bind to inverted repeats6, and Class II NRs are heterodimeric
partners of RXR and bind to direct repeats7. The other two classes of NRs are orphan
receptors binding to direct repeats and NRs acting as monomers to bind to a single half-
site4,5. NRs can also be categorized based upon their mechanism of action, which
includes their ligand binding while the NR is located in the cytosol (Type I) or nucleus
(Type II)8. The large number of heterodimer combinations between different NRs and
their diversity of isoform expression depending on cell type and development could
generate significant diversity in gene regulation9. The study of NRs has been rapidly
developing, and there are many good reviews in the literature3–5,7,8,10–13. Additionally,
~13% of current drugs target NRs14; therefore it is imperative we understand the
transcriptional regulation of drug enzymes and transporters by NR ligands.
NRs are a large family of TFs that include the glucocorticoid receptor (GR),
estrogen receptor (ER), progesterone receptor (PR), aryl hydrocarbon receptor (AhR),
androgen receptor (AR), pregnane X receptor (PXR), retinoid X receptor (RXR),
farnesoid X receptor (FXR), hepatocyte nuclear factor 4α (HNF4α) and vitamin D
receptor (VDR). NRs are ligand-induced in response to environmental stimuli and their
ligands include a variety of fatty acids, vitamins and steroids15. Through ChIP-seq

349
experiments many NRs were shown to prefer binding to cis-elements as opposed to the
proximal promoter of their genes. Over 63% of glucocorticoid response elements (GRE)
are >10 kb from the transcriptional start site (TSS) of glucocorticoid responsive genes,
split evenly between up- and downstream of the TSS, with only 9% of GREs in the
proximal promoter16. Similarly, only 4% of estrogen responsive elements (ERE) are in
the proximal promoter of estrogen responsive genes17 and ~33% of androgen responsive
elements (ARE) are within 10 kb of androgen responsive genes18. Similarly, more that
90% of HNF4α sites map to distal promoter elements19. In addition to preferring distal
locations from the proximal promoter, the ERE, ARE, GREs and HNF4α response
elements (HRE) are composite elements, consisting of binding sites for other TFs. AP-1,
ETS, C/EBP and HNF4 bind to GREs16, Oct1, GATA2, AP-1, RAR, ZNF4α, HNF4α and
EGR18,20 to AREs, and ERα, AP-1, GATA, HNF1α, AP-2γ and FoxA1 with HNF1α
sites19,21. Therefore, when searching for NR response elements, it is necessary to take into
consideration the binding of other NRs, especially the multiple NR dimer partner RXR.
The efflux transporter ABCG2 is not excepted from NR regulation and there is
evidence supporting its regulation by the ER, PR, PXR, constitutive androstane receptor
(CAR), AhR, GR, hypoxia inducible factor (HIF), retinoid-related orphan receptor
(ROR), peroxisome proliferator-activated receptor (PPAR) and NF-E2 related factor-2
(Nrf2)22–31. In addition, the expression of ABCG2 is altered by many types of stimuli,
including hypoxia32, inflammation29 and nutrient status33,34. Several nuclear response
elements (NRE) have been mapped to the proximal promoter of ABCG222,27–31. Due to
the necessity of dynamic regulation of gene transcription, NRs prefer to bind to cis-

350
regulatory elements as opposed to proximal promoter elements12. Therefore, it is likely
that there are NREs in the ABCG2 locus.
One NR prominent in the regulation of drug metabolizing enzyme and transporter
genes is PXR. PXR expression correlates with the expression of ABCG235,36, and the
PXR ligand rifampin37 induces ABCG2 expression24,38. However, no PXR or retinoid X
receptor (RXR), a binding partner of PXR, response element has been mapped to the
ABCG2 locus. PXR is activated by other ligands, including statins and the bile acid
lithocholic acid39. ABCG2 is integral in statin response40 and the development of gout41,
so the identification of PXR response elements and a better understanding of the PXR
induction pathway for ABCG2 could identify new therapeutic targets.
Hormones and their receptors are common pathways to regulate drug
metabolizing enzymes and transporters. For example, the ER both induces23,42,43 and
downregulates44–46 ABCG2 expression. Also, ER often shares response elements with the
PR, such as the ER/PR element found in the ABCG2 proximal promoter22. ER also
interacts with HNF3α (FOXA1) and genomic variants in the ERE where it binds are a
major risk factor for breast cancer47. Understanding the ER regulation pathway for
ABCG2 is vital because of the role both of these hormones play in the placenta and
mammary tissues48,49. For example, the ER and PR have a normal role in the upregulation
of ABCG2 during pregnancy to augment protection of the fetus31,49,50. In contrast,
upregulation of ABCG2 in ER and PR positive breast cancer cells is associated with
decreased response to chemotherapy51. ABCG2 overexpression in breast cancer cells
leads to drug resistance as MXR effluxes chemotherapeutics from the cancer cell.
Although there is a well characterized ER/PR response element in the ABCG2

351
promoter22, in vivo only 4% of active ERE are within 1 kb of the proximal promoter and
almost all ER binding events occur in non-annotated cis-regulatory elements17. Therefore,
identification of ER and PR cis-regulatory elements of ABCG2 could help untangle how
drug resistance develops and how ABCG2 is regulated in placenta and breast.
Glucocorticoids, which are ligands for the GR, have a broad endogenous role in
the body, including regulation of growth, metabolic, immune and stress related
pathways52–54. Due to the powerful anti-inflammatory and immunosuppressive action of
glucocorticoids, they are widely utilized for treatment of acute and chronic inflammatory
diseases, autoimmune diseases, organ transplant rejection, and malignancies of the
lymphoid system53,55. The GR ligand dexamethasone decreases ABCG2 expression both
in vivo56 and in vitro57. Additionally, dexamethasone also increases the expression of both
PXR and RXR58. Due to dexamethasone’s ability to induce PXR expression, it has been
proposed that dexamethasone acts via direct GR-dependent mechanisms at either low
concentrations or short (up to 24 hr) treatment and via a PXR-dependent mechanism at
high or long (48 hr) treatment59–61. Most NRs are known for activating gene expression;
after being released from its repressors by its ligand, GR works to trans-repress target
genes by binding to other TFs in the nucleus such as AP-1 or NF-κB and inhibiting them
from activating transcription of the target gene62. Identification of GR response elements
(GRE) for ABCG2 could help unravel the GR response pathway and its effect on ABCG2
expression in inflammatory diseases as well as after glucocorticoid treatment.
Many carcinogens are known ligands of AhR and through AhR induce many
metabolizing enzymes and drug transporters63. This allows the body to protect its vital
organs from exposure to these carcinogens. Exposure to carcinogens causes DNA

352
damage that leads to DNA mutations64, and exposure to exogenous carcinogens are a
factor in the development, severity and aggressiveness of cancer. MXR not only
transports carcinogens65, but ABCG2 expression is increased with carcinogen exposure65–
67. The expression of ABCG2 to has been linked to severity and disease-free survival in
cancer68–75 and low functioning alleles of ABCG2 with the occurrence of cancer76.
Identification of AhR response elements (AhRE) for ABCG2 would allow for better
understanding of the AhR pathway regulation of ABCG2 and for identification of variants
that have altered response to carcinogen exposure, thus leading to increasing carcinogen
exposure and cancer severity.
Due to the multitude of NR ligands and environmental stimuli that regulate
ABCG2, we hypothesized that some of the putative cis-regulatory elements of the ABCG2
locus are NRE. In this study, liver (HepG2) or breast (MCF-7) cells expressing variant
and reference ABCG2 promoter plasmids (see Chapter 3) and previously identified
reference and variant high priority regulatory regions in the ABCG2 gene locus (see
Chapter 4) were treated with ligands for PXR, ER, GR and AhR. The identification of
putative NREs in the ABCG2 gene locus adds to the previously identified cis-regulatory
elements of ABCG2 (see Chapter 4 and references22,27–31) and provides novel links
between genetic variants and ABCG2 expression.
6.3. Materials and Methods
6.3.1. Chemicals and Materials
The vectors pGL4.23 [luc2/minP], pGL3-promoter [luc+/SV40], pGL4.11b
[luc2P], pGL4.74 [hRluc/TK], pGL4.13 [luc2/SV40], the Dual-Luciferase® Reporter
353
Assay System and HB101 competent cells were all purchased from Promega (Madison,
WI). The human hepatocellular carcinoma (HepG2) and human breast adenocarcinoma
(MCF-7) cell lines were both purchased from the American Type Culture Collection
(ATCC, Manassas, VA). High-glucose Dulbecco’s modified Eagle’s medium (DMEM),
Opti-Minimal Essential Medium (Opti-MEM) and Lipofectamine 2000 were all
purchased from Invitrogen (Carlsbad, CA). DMSO, 1X phosphate buffered saline (PBS),
0.05% trypsin and 100X penicillin and streptomycin were all purchased from the UCSF
Cell Culture Facility (San Francisco, CA). Rifampin, 17β-estradiol, benzo[a]pyrene,
dexamethasone and 10% charcoal stripped fetal bovine serum (FBS) were all purchased
from Sigma Aldrich (St. Louis, MO). Improved Minimum Essential Medium (IMEM)
without phenol red (Mediatech Inc, Manassas, VA), 10% FBS (Axenia BioLogix, Dixon,
CA), and PolyJet™ DNA In Vitro Transfection Reagent (SignaGen Laboratories,
Rockville, MD) were all purchased from the indicated manufacturers. The CYP3A4
Xrem77 in the pGL4.23 [luc2/minP] vector and hPXR-pcDNA3.1 were a gift from Kathy
Giacomini (University of California San Francisco, San Francisco, CA).
6.3.2. Computational Predictions of Nuclear Response Elements
Three web-based computational tools and two chromatin immunoprecipitation
(ChIP) coupled with deep sequencing (ChIP-seq) databases were used to either predict or
provide evidence for the binding of NRs to putative enhancer elements. For the prediction
analysis, either the entire ABCG2 locus, which we defined as the ~300,000 bp region,
stretching from one gene up- (PPM1K) and downstream (PKD2) of ABCG2
(chr4:89130400-89439035 hg18; chr4:88911376-89220011 hg19), or selected putative

354
enhancer sequences were extracted from UCSC genome browser (hg19). These
sequences were then compared with NR consensus sequences using Cister, rVista and
TRANSFAC MATCH programs to detect which putative cis-regulatory elements have
high probability of NR binding. The prediction analyses with Cister and rVista, were
originally done during the initial in silico screen for putative enhancer elements (see
Chapter 4) on the entire ABCG2 gene locus. First the entire ABCG2 locus was scanned
using the rVista78 program, which analyzes sequences for conserved TFBS, using all
vertebrate TF matrices from TRANSFAC professional. NREs were isolated from the list
of all predicted TFBS, and regions with NREs predicted by rVista are indicated in Table
6.1. Next, the ABCG2 locus was examined for regions with increased clustering of
predicted transcription factor binding sites (TFBS), regardless of conservation, using the
Cister program79. Matrices used for cis-elements included those preprogrammed into the
Cister program (see Chapter 4 Material and Methods for full list) and several additional
matrices obtained from TRANSFAC80 and listed in Table 4.1. The ABCG2 gene locus
was split into fourths and analyzed in the Cister program with the default settings
described in Chapter 4 Materials and Methods. Enhancer regions with NREs (such as
ERE) predicted by Cister are indicated in Table 6.1. The third computational tool was the
TRANSFAC Match program80. For this tool, the genomic sequence for each putative
enhancer element was individually scanned for the probability of TF binding using the
TRANSFAC release 2012.2 matrix table of all non-redundant vertebrate TFs. Parameters
were set to select only high quality matrices and to minimize false positives. The
probabilities for TF binding in putative enhancer elements were compiled and those
elements with predicted NREs were extracted. To provide evidence for the actual binding

355
of NRs to putative enhancer regions, overlap of NR ChIP-seq peaks with putative
enhancer elements were pulled from the TRANSFAC80 ChIP-seq database. Additionally,
all putative enhancer elements were visualized using the UCSC genome browser, and NR
peaks occurring in the ENCODE81 TF ChIP-seq (Txn ChIP) track were noted in Table
6.1. Many of the putative enhancer elements with in silico evidence-based predictions for
NR binding are compiled under the respective NR in Table 6.1; the NR predictions shown
were those utilized to select putative enhancer elements for testing in in vitro induction
assays.

356
Table 6.1. Nuclear Response Elements in ECRs ER HNF3α/β6 RXR7 PXR GR AhR
ECR4204 ECR442 CR92 ECR172 ECR312 ECR4202,4 CR153 ECR4021,2 ECR522 ECR4252 ECR522 ECR4291
ECR4104 ECR4232 ECR4262 CR62 ECR4261,2 CR104 CR104 ECR4262 CR62 ECR4202 ECR4102,4 CR152,4 CR114 CR94 ECR4002 CR102 CR104 CR162,4 CR164 ECR432 ECR382 CR112 ECR382 ECR4102,4 CR192,4 CR72 CR72 ECR4282 CR72 ECR4002 CR82 ECR252 ECR4292 ECR4002 ECR4282
ECR4252 CR102 ECR4282 CR82 CR152 CR192 ECR4022 CR162 ECR252 ECR4122,4 ECR312 CR82 ECR252 ECR4022 ECR335 ECR4102 ECR4122 ECR4232 CR102 ECR4252 CR112 CR152 CR162 ECR332,5 ECR312 ECR552
1rVista predicted 2TRANSFAC predicted 3TRANSFAC ChIP-seq evidence 4Cister predicted 5ENCODE evidence 6Either HNF3α (FOXA1) or HNF3β; 7Due to the flexibility of RXR as a binding partner, these predictions are from matrices that target different combinations of direct repeats

357
6.3.3. Cell Culture
The HepG2 cell line was obtained from the ATCC and grown in high-glucose
DMEM supplemented with 10% FBS, 100 units/mL of penicillin and 0.1 mg/mL of
streptomycin. The MCF-7 cell line was also obtained from ATCC and cells were grown
in IMEM, without phenol red, supplemented with 10% charcoal stripped FBS, 100
units/mL of penicillin and 0.1 mg/mL of streptomycin. All cell lines were grown in a 5%
CO2 incubator at 37°C. To maintain cells, they were split upon reaching confluency by
treatment with 0.05% Trypsin-EDTA, washed with 1X PBS and suspended in fresh
media at a 1:5 to 1:20 dilution.
6.3.4. Transient Transfections
ABCG2 promoter reference and variant plasmids were made as described in the
Materials and Methods of Chapter 3, enhancer and suppressor constructs as described in
Chapter 4, and variant enhancer constructs as described in Chapter 5. The pGL4.23
vector is a firefly luciferase vector with a multiple cloning site designed to accept a
putative enhancer element upstream of a minimal promoter and the luciferase gene. The
pGL3-promoter vector is a firefly luciferase vector with a multiple cloning site designed
to accept a putative suppressor element upstream of the strong SV40 promoter and the
luciferase gene. The pGL4.11b vector is a promoterless firefly luciferase vector designed
to accept a putative promoter sequence before the luciferase gene. Once the target
sequence is cloned into one of these vectors and transfected into cells, the luciferase
activity can be measured as a surrogate for the regulatory region function. The cell lines
were each chosen to represent their primary tissue source. Plasmids for hPXR and Xrem

358
were a gift from Kathy Giacomini and are described below. For transient transfections of
the HepG2 cell lines, cells were split with 0.05% Trypsin-EDTA and seeded at
approximately 1.8 x 10⁴ cells per well of a 96-well plate in fresh DMEM with 10% FBS
without antibiotics and grown for at least 24 hr to 80% confluency. Cells were then
transfected with Lipofectamine 2000 following guidelines suggested in the
manufacturer’s protocol. In short, 0.5 μL of Lipofectamine 2000 was incubated in 25 μL
Opti-MEM for 5 min and then gently mixed with a 25 μL solution of 100 ng ABCG2
plasmid, 50 ng of hPXR plasmid and 10 ng pGL4.74 [hRluc/TK] (Promega, Madison,
WI) diluted with Opti-MEM. The DNA-Lipofectamine mixture was allowed to incubate
at room temperature for 30 min before being placed onto cells with 50 μL of antibiotic-
free media. MCF-7 cells were split with 0.05% Trypsin-EDTA and seeded at ~2.5 x 10⁴
cells per well and transfected with the PolyJet™ DNA In Vitro Transfection Reagent
once they reached 80-90% confluency; transfection efficiency was optimized by
following the manufacturer’s guidelines. Briefly, media on the cells was replaced with
100 μL fresh IMEM (supplemented with FBS and antibiotics as above) 30 min before
transfection. A mix of 75 ng ABCG2 plasmid and 25 ng of pGL4.74 [hRluc/TK], to
control for transfection efficiency, was diluted to 5 μL with IMEM supplemented with
10% FBS (no antibiotics). A 0.4 μL aliquot of PolyJet was diluted to 5 μL with IMEM
supplemented with 10% FBS (no antibiotics) and then immediately added to the DNA
with gentle mixing. The PolyJet/DNA mix was incubated at room temperature for 15 min
before being added to the cells. All cell lines were incubated with their transfection
reagents for 6-24 hr before drug media was added for induction assays.

359
6.3.5. Rifampin Induction
The protocol for induction of the ABCG2 constructs with rifampin was adapted
from previously published rifampin induction protocols77,82. The positive control plasmid
for induction was a xenobiotic response element (Xrem) that induces CYP3A4
expression upon rifampin treatment77. Additionally, we co-transfected with a human PXR
plasmid to ensure the expression of PXR. Plasmids used in the rifampin induction assays
included empty pGL4.23 [luc2/minP], enhancer-pGL4.23, hPXR-pcDNA3.1 and Xrem-
pGL4.23. Since almost all putative cis-regulatory elements had either a PXR or RXR
predicted binding site, we screened them all in the rifampin induction assay. HepG2 cells
were transiently transfected as above and 18 hr after transfection each well in a 96-well
plate was given new media. Each plasmid was treated with either 200 μL of DMEM with
25 μM rifampin dissolved in DMSO or with 200 μL of DMEM with 0.1% DMSO. Cells
were incubated for 24 hr with drug media before being assayed for luciferase activity.
6.3.6. 17β-estradiol Exposure
Treatment of the ABCG2 constructs with E2 was adapted from previously
published ER induction protocols31,44. The positive control plasmid for induction was the
ABCG2 promoter construct, which includes an ERE at -180 that responds to E2
treatment29,31,43. MCF-7 cells were used for the E2 induction assay because they express
the ER and estrogen treatment modulates ABCG2 expression45,83. Plasmids used in the E2
induction assays included pGL4.23 [luc2/minP], enhancer-pGL4.23, variant enhancer-
pGL4.23, pGL3 promoter [luc+/SV40], ABCG2 promoter-pGL4.11b [luc+/minP],
variant ABCG2 promoter-pGL4.11b and pGL4.11b [luc2+/minP]. Since a significant

360
faction of putative cis-regulatory elements have predicted HNF3α or ER binding sites and
ER also binds to nontraditional recognition sequences84, we hypothesized that there are
both novel and traditional ERE in our putative cis-regulatory elements. Since ER is such
an important regulator of ABCG2, all high priority putative cis-regulatory elements were
screened in the E2 induction assays, whether or not they were predicted to have ER
response elements (Table 6.1). MCF-7 cells were transiently transfected as above, and 6
hr after transfection, media was changed to 200 μL of IMEM (without phenol red) with
100 nM E2 (dissolved in DMSO) or with 200 μL of IMEM with 0.2% DMSO for each
well of the 96-well plate. Cells were incubated for 48 hr with drug media before being
assayed for luciferase activity.
6.3.7. Aryl Hydrocarbon Receptor Induction
Induction of the ABCG2 plasmids with B[a]P was adapted from a previously
published AhR induction protocol85. The positive control plasmid for induction was the
ABCG2 promoter construct, which includes AhR response elements at -55 and -189 that
are important in response of the ABCG2 promoter to aryl hydrocarbon treatment30,85,86.
MCF-7 cells were used for the AhR induction assay because they express the AhR and
their ABCG2 expression responds to aryl hydrocarbon treatment66. Plasmids used in the
AhR induction assays included pGL4.23 [luc2/minP], enhancer-pGL4.23 [luc2/minP],
ABCG2 promoter-pGL4.11b [luc+/minP] and pGL4.11b [luc2+/minP]. Only enhancer
elements predicted to have AhR response elements were screened in the B[a]P induction
assays (Table 6.1). MCF-7 cells were transiently transfected as above, and 18 hr after
transfection, media was changed to 200 μL of IMEM (without phenol red) with 500 nM

361
or 10 μM B[a]P dissolved in DMSO or with 200 μL of IMEM with 0.2% DMSO. Cells
were incubated for 24 hr with drug media before being assayed for luciferase activity.
6.3.8. Dexamethasone Induction
Induction of the ABCG2 plasmids with dexamethasone (DEX) was adapted from
previously published GR induction protocols60,61. MCF-7 cells were used for the DEX
induction assay because they express GR87 and their expression of ABCG2 responds to
glucocorticoid treatment60. Plasmids used in the DEX induction assays included pGL4.23
[luc2/minP], enhancer-pGL4.23, variant enhancer-pGL4.23, pGL3 promoter
[luc+/SV40], supressor-pGL3 promoter [luc+/SV40], ABCG2 promoter-pGL4.11b
[luc2+/minP], variant ABCG2 promoter-pGL4.11b and pGL4.11b [luc2+/minP]. Only
putative enhancer elements predicted to have GR response elements were screened in the
dexamethasone induction assays. MCF-7 cells were transiently transfected as above, and
18 hr after transfection, media was changed to 200 μL of IMEM (without phenol red)
with 500 nM DEX (dissolved in DMSO) or with 200 μL of IMEM with 0.2% DMSO.
Cells were incubated for 24 with drug media before being assayed for luciferase activity.
6.3.9. Luciferase Assay
After cells were treated with drug or DMSO, each well was washed with 100 μL
1X PBS and lysed with 50 μL of 1X passive lysis buffer for 1 hr with shaking. HepG2 or
MCF-7 lysates (30 μL) were measured for firefly and Renilla luciferase activity using 70
μL each of the Luciferase Assay Reagent II and Stop & Glo® reagents from the Dual-
Luciferase® Reporter Assay System in a GloMax 96 microplate Dual Injector

362
Luminometer. The firefly activity was normalized to the Renilla activity per well to
control for transfection efficiency. Each experiment also included the empty pGL4.23,
pGL4.11b or pGL3-promoter vector as the negative control and the Xrem-pGL4.23 or
ABCG2 promoter plasmid as the positive control. Luciferase activity for each plasmid
was expressed as the ratio of the normalized firefly to Renilla activity to that of either the
DMSO treatment or the empty vector treated with or without drug.
6.3.10. Statistical Analysis
Luciferase activity was first normalized to Renilla activity and then by the activity
of the drug-treated empty vector (EV). For presentation in figures, the difference from
EV with NR ligand treatment was divided by the activity with DMSO treatment to yield a
relative fold activity (RFA). Putative enhancer elements treated with drug were
considered to have statistically significant activity compared to the DMSO treated vector
if the unpaired Student’s t-test had a P < 0.05 in each experimental replication. For
statistical analysis of variant versus reference regulatory regions, the RFA for the variant
regulatory region was tested against the RFA of the reference regulatory region using
either an unpaired Student’s t-test (when analyzing only one variant) or an ANOVA
followed by a post-hoc Bonferroni’s multiple comparison t-test (when comparing
multiple variants) with statistical significance set at P < 0.05. All statistics were run using
the GraphPad Prism 5 program.

363
6.4. Results
6.4.1. Predicted Nuclear Response Elements
Utilizing several web-based TF prediction programs and publically available
ChIP-seq databases, putative enhancer elements were analyzed for the occurrence of
various NREs (Table 6.1). The NRE for RXR, from matrices that include different direct
repeat configurations, was present in 24 of the 30 putative enhancer elements, making it
the most abundant putative NRE. All but one RXR response elements were predicted
using the TRANSFAC MATCH program80; only ECR33 had additional evidence from
the ENCODE ChIP-seq database81 for the binding of RXR (Table 6.1). The glucocorticoid
response element (GRE) was predicted in 13 of 30 putative enhancer elements with the
GREs in ECR426, ECR410 and ECR412 being predicted by more than one program.
Additionally, the ECR426 predicted GRE was conserved through mouse. The next most
abundant NRE, in 12 of the 30 putative enhancer elements, was for HNF-3α (FOXA1, a
binding partner of ER) or HNF-3β. ERE were predicted in 9 of the 30 putative cis-
regulatory regions and AhR response elements in only 7 of 30 putative cis-regulatory
regions. Besides RXR binding in ECR33, the only other ChIP-seq evidence for NR
binding was for p300, a co-activator for many NRs, in both ECR31 and ECR33 and ER
in CR15 (Table 6.1).
6.4.2. System Controls
To test the validity of our induction assays, MCF-7 cells transiently transfected
with the ABCG2 promoter plasmid were treated for 18 to 48 hr with ligands for different
nuclear receptors (Figure 6.1A). Initial conditions for the induction assays were based on
364
previous literature for E231,44, DEX60,61 and B[a]P85. Treatment with 100 nM E2 caused
increased ABCG2 promoter activity within 18 hours and increased activity was
maintained for 48 hours (Figure 6.1A). Treatment with 500 nM DEX caused increased
ABCG2 promoter activity at 24 hours and decreased promoter activity after 48 hours
(Figure 6.1A). Any cell toxicity from the DEX, or other NR ligands, is accounted for by
the Renilla activity. However, we did not notice excessive cell toxicity at any of the NR
ligand doses used. Due to the ability of DEX to act via a GR mediated mechanism at 24
hr and a PXR mechanism at 48 hr60,61, regulatory regions were tested at 24 hr post DEX
treatment. Treatment with 500 nM or 10 μM B[a]P caused 2-fold induction of the
ABCG2 promoter at 18 hr and this increased to 4-fold induction only with the lower dose
(Figure 6.1A). There was no induction by B[a]P at 48 hr (Figure 6.1A). Based on these
results and a previous study85 cells were treated for 24 hr with 10 μM B[a]P. To test the
validity of the rifampin induction assay, HepG2 cells were treated with 10 μM and 25 μM
of rifampin for 24 hr after transient transfection with the XREM element. These
conditions were based on the literature77,82, and the positive control, Xrem, was a known
rifampin-inducible element upstream of CYP3A477. Treatment with 10 μM rifampin
caused an 8-fold induction of the XREM enhancer activity after 24 hr, while treatment
with 25 μM rifampin caused an 18-fold induction of the XREM enhancer activity (Figure
6.1B). Therefore, cells expressing putative regulatory regions were treated with 25 μM
rifampin for 24 hr.

365
Figure 6.1. System controls for in vitro nuclear response element assays. Breast
(MCF-7) cells (A) were transiently transfected with the ABCG2 promoter plasmid (in
pGL4.11b) and then treated with 17β-estradiol (E2, 100 nM), dexamethasone (Dex, 500
nM), benzo[a]pyrene (B[a]P, 500 nM or 10 μM) or 0.2% DMSO. Liver (HepG2) cells
(B) were transiently transfected with the Xrem plasmid (in pGL4.23) and then treated
with rifampin (10 μM or 25 μM) or 0.1% DMSO. Cells were treated with drug for 18
(white bars), 24 (grey bars) or 48 (checkered bars) hr before luciferase activity was

366
measured. Normalized firefly to Renilla luciferase activity post ligand treatment is shown
for each plasmid relative to its activity when treated with DMSO (DMSO treatment is set
to ‘1’). Normalized luciferase values less than one are due to attenuation of luciferase
activity with ligand treatment. Data is expressed as the mean ± SEM from a
representative experiment (n = 4-9). Differences between XREM activity in the absence
and presence of rifampin were tested by an unpaired Student’s t-test. *** P < 0.0001.
6.4.3. Rifampin Induction
The ability of putative enhancer elements to respond to a PXR ligand was tested
in transiently transfected HepG2 cells after 24 hr of rifampin treatment. After DMSO and
rifampin treatment, cell lysates were tested for differences in normalized enhancer
activity. Relative luciferase activity for each plasmid is expressed as the enhancer activity
with ligand treatment to that measured after DMSO treatment (Figure 6.2). Of the 30
screened enhancer elements, nine of them had significant rifampin-inducible activity
(Figure 6.2). Most of the regions (CR8, CR9, CR10, ECR38, ECR400, ECR410 and
ECR412) responded weakly to rifampin treatment (Figure 6.2). ECR25 and ECR33
responded moderately (~3-fold induction) to rifampin treatment, and the ECR33
enhancer had the highest induction (Figure 6.2). This screen identified several regulatory
elements that respond to the PXR ligand rifampin and could be potential nuclear response
elements for the ABCG2 gene.

367
Figure 6.2. Effect of rifampin treatment on enhancer activity. Luciferase activity of
putative enhancer regions was measured in transiently transfected liver (HepG2) cells 24
hr after treatment with 0.1% DMSO or 25μM rifampin. Enhancer activity is expressed as
the ratio of firefly to Renilla luciferase activity in the presence of rifampin to the same
ratio after DMSO treatment. Data is expressed as the mean ± SEM from a representative
experiment (n = 6 wells per construct and treatment). Differences between the enhancer
activity in the absence and presence of rifampin were tested by an unpaired Student’s t-
test. *** P < 0.0001, ** P < 0.001, * P < 0.05.
6.4.4. Estrogen Receptor Mediated Induction
Many different regulatory sequences were tested for their response to E2 treatment
after 48 hours. First, the response of 30 putative enhancer constructs and the ABCG2

368
promoter construct to E2 were tested (Figure 6.3). There were six enhancer elements,
ECR400, CR6, ECR33, CR7, CR8 and CR9, with significantly decreased activity (25 to
50%) upon E2 treatment (Figure 6.3). Most of these regions were moderate to strong
enhancers with DMSO treatment and their activity was reduced or abolished with E2
treatment. The only putative enhancer region with induced activity after E2 treatment was
CR19, which exhibited a moderate induction upon E2 treatment (Figure 6.3). The ABCG2
promoter construct activity was also weakly induced by E2 treatment (Figure 6.3 and
Figure 6.4).
After confirmation that the ABCG2 promoter was inducible with E2 treatment
(Figure 6.3 and Figure 6.4), the nine variant ABCG2 promoter plasmids (described in
Chapter 3) were tested for changes in E2 induction. Four of nine ABCG2 promoter
variants responded to E2 treatment, and rs66664036 increased induction compared to the
reference sequence (Figure 6.4).
Since CR6 enhancer activity was significantly decreased upon treatment with E2
(Figure 6.3), the effect of E2 on the seven variant CR6 enhancer regions described in
Chapter 5 was evaluated. Three SNPs were associated with reduced enhancer activity in
response to E2, and the suppression with rs573519157 was greater than that for the
reference sequence (Figure 6.5). rs190754327 was associated with loss of E2 induction
(Figure 6.5).
Since the ECR400 enhancer activity was significantly decreased upon treatment
with E2 (Figure 6.3) the effect of genetic variation in ECR400 on the response to E2 was
evaluated. With one exception, the ECR400 SNPs did not affect the ability of the

369
ECR400 enhancer to respond to E2 (Figure 6.6). rs12508471 caused a loss of E2-induced
suppression of ECR400 enhancer activity (Figure 6.6).
Figure 6.3. Effect of 17β-estradiol treatment on promoter and enhancer activity. The
luciferase activity of ABCG2 promoter (in pGL4.11b) and putative enhancer regions (in
pGL4.23) was measured in transiently transfected breast (MCF-7) cells 48 hr after
treatment with 0.2% DMSO or 100 nM 17β-estradiol (E2). Enhancer activity is expressed
as the ratio of firefly to Renilla luciferase activity in the presence of E2 to the same ratio
after DMSO treatment. Relative luciferase activity less than one is due to reduction of the
enhancer activity with E2 treatment. Data is expressed as the mean ± SEM from a
representative experiment (n = 6-8 wells per construct and treatment). Differences
between enhancer activity in the absence and presence of E2 were tested by an unpaired
Student’s t-test. *** P < 0.0001, ** P < 0.001, * P < 0.05.

370
Figure 6.4. Effect of 17β-estradiol treatment on reference and variant promoter
activity. The luciferase activity of reference and variant promoter plasmids (in
pGL4.11b) was measured in transiently transfected breast (MCF-7) cells 48 hr after
treatment with 0.2% DMSO or 100 nM 17β-estradiol (E2). Enhancer activity is expressed
as the ratio of firefly to Renilla luciferase activity in the presence of E2 to the same ratio
after DMSO treatment. Data is expressed as the mean ± SEM from a representative
experiment (n = 6-8 wells per plasmid and treatment). Differences between promoter
activity in the absence and presence of E2 were tested by an unpaired Student’s t-test; * P
< 0.05. Differences in promoter activity between variants and the reference were
compared by an ANOVA followed by a Bonferroni multiple comparison t-test; # P <0.05.

371
Figure 6.5. Effect of 17β-estradiol treatment on reference and variant CR6 enhancer
activity. The luciferase activity of reference and variant CR6 enhancer plasmids (in
pGL4.23) was measured in transiently transfected breast (MCF-7) cells 48 hr after
treatment with 0.2% DMSO or 100 nM 17β-estradiol (E2). Enhancer activity is expressed
as the ratio of firefly to Renilla luciferase activity in the presence of E2 to the same ratio
after DMSO treatment. Relative luciferase activity less than one indicates reduction of
enhancer activity with E2 treatment. Data is expressed as the mean ± SEM from a
representative experiment (n = 6-8 wells per construct and treatment). Differences
between the enhancer activity in the absence and presence of E2 were tested by an
unpaired Student’s t-test; * P < 0.05, ** P < 0.001. Differences between variant and
reference CR6 enhancer RFA were compared by an ANOVA followed by a Bonferroni
multiple comparison t-test; # P < 0.05.

372
Figure 6.6. Effect of 17β-estradiol treatment on reference and variant ECR400
enhancer activity. The luciferase activity of reference and variant ECR400 enhancer
constructs (in pGL4.23) was measured in transiently transfected breast (MCF-7) cells 48
hr after treatment with 0.2% DMSO or 100 nM 17β-estradiol (E2). Enhancer activity is
expressed as the ratio of firefly to Renilla luciferase activity in the presence of E2 to the
same ratio after DMSO treatment. Relative luciferase activities less than one indicate
reduction of enhancer activity with E2 treatment. Data is expressed as the mean ± SEM
from a representative experiment (n = 6-8 wells per construct and treatment). Differences
between enhancer activity in the absence and presence of E2 were tested by an unpaired
Student’s t-test; * P <0.05, ** P < 0.001. Differences between the response of reference
and variant ECR400 enhancers to E2 were compared by an ANOVA followed by a
Bonferroni multiple comparison t-test; # P <0.05.

373
6.4.5. Glucocorticoid Receptor Mediated Induction
Selected putative enhancer constructs were tested for their response to
dexamethasone (DEX) treatment. First, putative enhancer constructs, and when available
their suppressor constructs, with predicted GREs (Table 6.1) were transiently transfected
into MCF-7 cells and then treated with DEX or DMSO for 24 hours and their relative
luciferase activity measured. Three regions had significantly decreased luciferase activity
relative to DMSO treatment respectively. ECR25 (in pGL4.23) had a 60% decrease in
RFA with DEX treatment (Figure 6.8). However, the ECR25 (pGL3-promoter)
suppressor construct did not have altered RFA with DEX treatment (Figure 6.8).
ECR410, which had GREs predicted by both Cister and TRANSFAC (Table 6.1), had a
50% to 75% decrease in RFA after DEX treatment when this region was tested in either
the in pGL4.23 or pGL3-promoter vectors (Figure 6.8). The last construct with a
significant decrease in relative luciferase activity was ECR400 rs12508471 plasmid.
Although ECR400 is not predicted to have a GRE (Table 6.1), the rs12508471 SNP was
predicted to gain a GR site (see Chapter 5, Figure 5.15), which was why this SNP was
screened. The ECR400 enhancer was not significantly decreased with DEX treatment,
dropping a little over 25% (Figure 6.8). In contrast, the rs12508471 SNP had over an
80% decreased RFA with DEX treatment (Figure 6.8).

374
Figure 6.7. Effect of 24 hour dexamethasone treatment on selected reference and
variant enhancers’ and suppressors’ activities. The luciferase activity of reference and
variant enhancer constructs (in pGL4.23) and suppressor constructs (in pGL3-promoter)
was measured in transiently transfected breast (MCF-7) cells 24 hours after treatment
with 0.2% DMSO or 500nM dexamethasone (DEX). Enhancer activity is expressed as
the ratio of firefly to Renilla luciferase activity in the presence of DEX to the same ratio
after DMSO treatment. Relative fold activation values less than one are due to reduction
of the enhancer’s activity with DEX treatment. Data is expressed as the mean ± SEM
from a representative experiment (n=6-8 wells per construct and treatment). Differences
between reference enhancer activity in the absence and presence of DEX were tested by
an unpaired Student’s t-test * P < 0.05, ** P <0.001, *** P <0.0001. Differences between
the RFA of reference and variant enhancers were compared by a Student’s t-test, # P <
0.05.

375
6.4.6. Aryl Hydrocarbon Receptor Mediated Induction
Putative enhancer constructs that were predicted by more than one program to
have aryl hydrocarbon (AhR) response elements (Table 6.1) and the ABCG2 promoter
construct, were transiently transfected into MCF-7 cells and then treated with B[a]P for
24 hr and their relative luciferase activity measured (Figure 6.8). Only the ABCG2
promoter showed increased activity when treated with B[a]P and the induction was
modest (Figure 6.8).
Figure 6.8. Effect of 24 hour benzo[a]pyrene treatment on selected enhancer and
promoter activities. The luciferase activity of enhancer regions (in pGL4.23) and the
ABCG2 promoter (in pGL4.11b) was measured in transiently transfected breast (MCF-7)
cells 24 hr after treatment with 0.2% DMSO or 10 μM benzo[a]pyrene (B[a]P). Enhancer
activity is expressed as the ratio of firefly to Renilla luciferase activity in the presence of
B[a]P to the same ratio after DMSO treatment. Relative luciferase activities less than one

376
indicate reduction in enhancer activity with B[a]P treatment. Data is expressed as the
mean ± SEM from a representative experiment (n = 8 wells per construct and treatment).
Differences between reference enhancer activity in the absence and presence of B[a]P
were tested by a Student’s t-test; * P < 0.05.
6.4.7. Accuracy of NRE and HRE Predictions
There were 12 of the 30 high priority enhancer regions that responded to at least
one nuclear receptor (NR) ligand (listed in Table 6.2), six regions responded to at least
two different NR ligands and ECR400 (or its variant) responded to all the NR ligands
tested (Table 6.2).
All regions were challenged with rifampin and 17β-estradiol (E2), in an attempt to
see if prediction of NRRE were sufficient to determine in vitro activity. Of the nine
elements that responded to rifampin, only two had predicted PXR response elements
(22%) and of the eight regions with predicted PXR response elements only two
responded to rifampin (25%). Of the 22 regions not predicted to harbor a PXR response
element, six responded to rifampin treatment (27%). For E2 response, of the nine regions
with predicted ERE, only three responded to E2 treatment (33%), and CR15, which had
ChIP-seq support for ER binding (Table 6.1), did not respond to E2 treatment (Figure 6.3).
Of the 21 regions without predicted ER response elements, six (29%) responded to E2
treatment. These results suggest that in silico prediction or preliminary ChIP-seq data of
NR binding was not indicative of response to ligand treatment (summarized in Table 6.2).
Additionally, excluding regions without predicted NR binding could allow for false
negatives.

377
Only selected regions with predicted GR and AhR (Table 6.1) were challenged
with dexamethasone and B[a]P. Of the three regions that responded to dexamethasone
treatment, one (33%) had predicted GR binding. Of the three elements with predicted GR
binding only one (33%) responded to dexamethasone. None of the regions with predicted
AhR binding responded to B[a]P treatment.
Table 6.2. Response of ABCG2 Locus Regulatory Regions to Xenobiotic Treatment
Region Treatment Predicted NRE
Rifampin Estrogen Dex B[a]P ECR33 ↑ ↓ RXR, GR CR16 ↔ ↔ ↔ ER, RXR, AhR CR6 ↔ ↓ RXR, PXR ECR400 ↑ ↓ ↓ RXR, PXR, AhR CR8 ↑ ↓ ER, RXR, GR CR9 ↑ ↓ RXR CR10 ↑ ↔ ER, RXR, PXR, AhR ECR25 ↑ ↔ ↓ RXR, ER ECR38 ↑ ↔ RXR, GR ECR410 ↑ ↔ ↓1 ↔ ER, RXR, GR, AhR ECR412 ↑ ↔ ↔ RXR, GR CR7 ↔ ↓ ↔ RXR, GR CR19 ↔ ↑ ER, RXR ECR429 ↔ RXR, AhR ECR425 ↔ ↔ ER, RXR, PXR CR11 ↔ ↔ ER, RXR, PXR ECR17 ↔ ↔ PXR ECR31 ↔ ↔ ↔ RXR, GR ECR52 ↔ ↔ RXR ECR402 ↔ ↔ RXR, GR ECR426 ↔ ↔ GR ECR420 ↔ ↔ ↔ ER, PXR, AhR Promoter ↑ ↑ ↑ ER ↑Increase, ↓Decrease, ↔No Response, Not Tested
1 Significant in both pGL4.23 and pGL3-suppressor vectors Abbreviations: Dex, Dexamethasone; hr, hour; B[a]P, Benzo[a]pyrene; NRE, Nuclear Response Elements; ER, Estrogen Receptor; RXR, Retinoic Acid Receptor; PXR, Pregnane X Receptor; GR, Glucocorticoid Receptor; AhR, Aryl Hydrocarbon Receptor

378
6.5. Discussion
The evidence that ABCG2 is regulated by NR pathways22–25,27,29–31,33,34 and that
multiple NREs work together to modulate expression of a gene88 suggest that there are
multiple hormone and xenobiotic response elements in the ABCG2 gene locus. Therefore,
the previous screen for regulatory elements of ABCG2 (see Chapter 4) was extended with
in vitro induction assays for PXR, ER, GR and AhR to identify if any of these putative
regulatory elements are cis- hormone or xenobiotic response elements.
Rifampin induction of XREM (8- to 16- fold) was lower than the 45- fold
induction reported in the literature77, and reflects to some degree differences in the
experimental conditions. The ABCG2 promoter was inducible ~6-fold with E2 treatment,
similar to previous reports31. The 2- to 4- fold induction of the ABCG2 promoter with an
AhR ligand was also consistent with earlier studies85,86.
The use of in silico TFBS prediction programs was moderately successful in
identifying regions that would respond to ER, AhR, PXR and GR ligand challenge.
Regions screened in both the GR and AhR induction assays were selected based on
predicted binding of GR or AhR. However, the regions that were selected to be tested had
response rates of 33% for GR and 0% with AhR. Predictive programs for TF binding are
fairly inconsistent, but can only be as good as the TF matrices currently available. For
example, only 60% of AhR bound DNA from ChIP-seq studies contained a core AhRE
(5’-GCGTG-3’)89. This is due to the variability in published cistrome data; for example,
replication attempts to identify ER binding sites using ChIP-seq and ChIP-ChIP have
success rates between 10-76%90. Continued development of TF binding consensus

379
sequence libraries and ChIP-seq databases, such as that from ENCODE, are likely to
increase our ability to predict NRE.
In addition to variability in TF consensus sequences, binding of NRs to DNA
found in ChIP-seq screens do not guarantee the region is a regulatory element. For
example, 66%91 - 91%18 of androgen receptor response elements based on ChIP-seq
data responded to androgens. Since both PXR and ER are important NRs in the
regulation of ABCG2, all high priority regulatory elements in the ABCG2 locus were
challenged with representative ligands. Of the regions with a predicted NRE, 25-30%
responded to the respective ligand; 29-77% of regions without a predicted NRE were
modulated by the NR ligands. Inconsistent prediction of ERE by ER ChIP-seq has been
previously reported90. The CR15 enhancer region had ChIP-seq data from ENCODE81
supporting the binding of ER, however, CR15 did not respond to E2. The CR19 region
was significantly induced by E2 treatment, consistent with ChIP-seq data that identified
two peaks for binding of ER, and the ERα tethering protein FOXA121, to CR19. ChIP-seq
data suggests that NRE are often composite elements, consisting of binding sites for NR
co-activators as well as other NRs and TFs12. There is a wide variation in NR dimer
partners for ER, including HNF-4, TR, RAR, RXR, and VDR9. The use of additional
TFBS to identify composition sites, as well as the continual addition to ChIP-seq
databases, would improve our current prediction methods for the identification of NRE.
The ER is perhaps the most well defined NR system, as it is integral in many
biological responses and has many clinical applications5. Additionally, E2 is a key
regulator of growth and development and it functions in a wide array of target tissues92.
In the current study, the activity of the ABCG2 promoter was induced with E2 treatment,
380
consistent with previous studies31. Additionally, the promoter SNP rs66664036 had
significantly greater response to E2 than the reference promoter. The rs6664036 SNP
does not lie in the promoter’s documented ERE and therefore does not effect ER binding.
Interestingly, this same SNP reduced in vivo promoter activity 50% (see Chapter 3), a
response that might be negated in the presence of E2.
Although this ERE in the ABCG2 promoter responds to E2 treatment, the ER, like
many other hormone receptors, prefers to bind to cis-regulatory regions versus proximal
promoters17, especially for genes with tissue-specific expression. Due to significant
evidence supporting the ability of ER ligands to either increase or decrease ABCG2
expression depending on the tissue and presence of other NR23,42–46, regulatory regions
within the ABCG2 gene locus were tested for response to E2 treatment. CR6, a region just
downstream of ABCG2 with strong in vitro enhancer activity and weak in vivo activity,
had decreased activity upon E2 treatment. Additionally, regulation of ABCG2 expression
by CR6 could be confounded by the CR6 SNP rs190754327 which eliminated the
response to E2 or the E2-sensitive CR6 SNP rs573519157. Both of these SNPs resulted in
reduced enhancer activity in HepG2 and HEK293T cells but further studies would be
needed to test their activity in vivo. Thus the decreased in vivo activity of CR6 could be
dependent on the availability of E2 in a given tissue.
The expression of ABCG2 and activity of its promoter are both altered by
exposure to AhR ligands30,85,86. In addition to crosstalk between ER and AhR93, AhR
dimerizes with several other NRs94 and has recently been shown to recognize
nontraditional AhRE motifs89,95. Although only elements with predicted AhR binding
sites were screened, future studies should test the induction of other putative regulatory

381
regions regardless of predicted AhR binding, especially those we have shown to respond
to E2. The ABCG2 promoter was the only region that responded to AhR; it was also
induced by E2 treatment. Interestingly, ECR420 and ECR410 also had predicted
response elements for both ER and AhR but these regions did not respond to either E2 or
B[a]P. AhR and ER reportedly can dimerize93; whether this is important for the function
of the ABCG2 promoter requires further study. The response of the ABCG2 promoter to
both ER and AhR supports the hypothesis that there is an overlap in the genomic regions
that bind both ER and AhR93.
A goal of these experiments was to identify PXR response elements in the
ABCG2 locus since none have been reported despite strong evidence of ABCG2
regulation by PXR24,35,36,38. PXR is a well known regulator of multiple hepatic drug
transporters and metabolizing enzymes, and it is activated by many structurally diverse
xenobiotic and endogenous ligands96. The most promising PXR response element in the
ABCG2 locus is the ECR33 enhancer region. ChIP-seq data from ENCODE supports the
binding of two PXR interaction partners7, p300 and RXR, to ECR33. ECR33 activity was
also suppressed by treatment with E2. ChIP-seq data also suggests that many other NRs
bind to ECR33, including HNF4α, HNF4γ and GR, and the ER co-activator FOXA1
(HNF3α)21. RXRα and HNF4α have also been shown to interact with each other and with
ERα9. Therefore, ER could be tethered to the ECR33 element through interactions with
FOXA1, RXRα and HNF4α. The binding of so many NRs to the ECR33 region and the
ability of multiple NR ligands to regulate ECR33 enhancer activity suggests that ECR33
is a composite response element. Knowledge of ABCG2 PXR response elements, such as
ECR33, could also aid in the identification of underlying protective or causative genetic

382
variants for altered statin response or gout, such as the rs2622628 ECR33 variant that
reduces function or the rs190738974 ECR 33 variant that increases function.
As in the enhancer and suppressor screens, the most interesting inducible region
was ECR400. ECR400 responded to multiple ligands, increasing with rifampin treatment
and decreasing with E2. The ECR400 has a conserved binding site for the Oct-1 TF, an
important coactivator of many NRs including GR, PR, AR, RXR and ER17,97–99. Although
there is no ChIP-seq data available from ENCODE or TRANSFAC indicating binding of
any NRs to ECR400, the response of ECR400 to multiple NR ligands suggests that it is
an important hormone and xenobiotic response element. Further studies are needed to
confirm the binding of these NRs and Oct-1 to ECR400.
The ECR400 element has SNPs within it that completely abolish its activity both
in vitro and in vivo (see Chapter 5). The ECR400 SNP rs12508471 had reduced activity
in vivo and was modestly associated with reduced expression of ABCG2 and PPM1K in
different tissues (see Chapter 5). rs12508471 had predicted gains for several NRs
including PPAR, PXR, LXR, GR, p300 and VDR. Therefore, the rs12508471 enhancer
plasmid was challenged in the induction assays to see if it had a different response to NR
ligands than the reference ECR400 sequence. rs12508471 was associated with a reduced
response to E2 and increased response to dexamethasone treatment. ER and PXR both
dimerize with RXR, and RXR dimers with PPAR, CAR or LXR have been shown to bind
to GR or ER response elements and inhibit ER or GR response100–103. The gain in
predicted binding for RXR could explain the alteration in rs12508471 response to E2 and
dexamethasone. Additionally, rs12508471 was predicted to induce binding of chicken
ovalbumin upstream promoter-transcription factor (COUP-TF), which has been shown to

383
repress the transcriptional activity of several NRs by forming inactive heterodimers that
compete for DNA binding, tether co-repressors and tighten the chromatin structure104–106.
The restrictive expression patterns for RXRα/β7 and COUP-TF107 could explain how this
SNP affects expression of genes in selected tissues. Future studies are needed to confirm
this change in binding of rs12508471 to RXR or COUP-TF.
The reporter gene assays used in the current studies do not provide local
chromatin structure that is integral in the regulation of expression by nuclear
receptors12,88,108. It will be interesting to see if chromosome confirmation capture assays
are able to detect the interaction of the ABCG2 promoter with these cis-regulatory
elements. Additionally, only a few NR ligands and environmental stimuli were
investigated. Many of the putative regulatory elements had predicted binding for PPAR,
LXR, ROR and several HNF isoforms. Other cell-based assays for induction by RXR109,
PPAR110, HIFα111, LXR112, HNF4113 and ROR114 could identify additional nuclear
response elements important for the regulation of ABCG2.
6.6. Conclusions
Through the use of NR ligand induction assays, multiple regions in the ABCG2
gene locus, including the ABCG2 promoter, were identified as NREs. Additionally, some
SNPs within these regions were shown to have altered response to NR ligands compared
to the reference regulatory regions. In addition to the previously identified enhancer and
suppressor regions surrounding ABCG2 and their SNPs, (see Chapter 4 and 5), these
regions could explain the reported NR regulation of ABCG2. The SNPs within these
regions could also explain clinical variability in ABCG2 gene expression, drug

384
pharmacokinetics and pharmacodynamics and disease risk for cancer, ADPKD or gout.
Additionally, the discovery of NRE in the ABCG2 locus extends our understanding of the
architecture and regulation of ABCG2.
385
6.7. References
(1) Tirona, R. Molecular mechanisms of drug transporter regulation. Drug Transporters 2011, 201.
(2) Urquhart, B.; Tirona, R.; Kim, R. Nuclear receptors and the regulation of drug-metabolizing enzymes and drug transporters: implications for interindividual variability in response to drugs. The Journal of Clinical … 2007.
(3) Schupp, M.; Lazar, M. a Endogenous ligands for nuclear receptors: digging deeper. The Journal of biological chemistry 2010, 285, 40409–15.
(4) Mangelsdorf, D. J.; Thummel, C.; Beato, M.; Herrlich, P.; Schütz, G.; Umesono, K.; Blumberg, B.; Kastner, P.; Mark, M.; Chambon, P.; Evans, R. M. The nuclear receptor superfamily: the second decade. Cell 1995, 83, 835–9.
(5) Olefsky, J. M. Nuclear receptor minireview series. The Journal of biological chemistry 2001, 276, 36863–4.
(6) Klinge, C. M.; Bodenner, D. L.; Desai, D.; Niles, R. M.; Traish, a M. Binding of type II nuclear receptors and estrogen receptor to full and half-site estrogen response elements in vitro. Nucleic acids research 1997, 25, 1903–12.
(7) Germain, P.; Chambon, P.; Eichele, G.; Evans, R. M.; Lazar, M. A.; Leid, M.; De Lera, A. R.; Lotan, R.; Mangelsdorf, D. J.; Gronemeyer, H. International Union of Pharmacology. LXIII. Retinoid X receptors. Pharmacological reviews 2006, 58, 760–72.
(8) Novac, N.; Heinzel, T. Nuclear receptors: overview and classification. Current drug targets. Inflammation and allergy 2004, 3, 335–46.
(9) Lee, S. K.; Choi, H. S.; Song, M. R.; Lee, M. O.; Lee, J. W. Estrogen receptor, a common interaction partner for a subset of nuclear receptors. Molecular endocrinology (Baltimore, Md.) 1998, 12, 1184–92.
(10) Whitfield, G. K.; Jurutka, P. W.; Haussler, C. a; Haussler, M. R. Steroid hormone receptors: evolution, ligands, and molecular basis of biologic function. Journal of cellular biochemistry 1999, Suppl 32-3, 110–22.
(11) Prologue, M. Thematic Minireview Series on Nuclear Receptors in Biology and. 2010, 285, 38741–38742.
(12) Biddie, S. C.; John, S.; Hager, G. L. Genome-wide mechanisms of nuclear receptor action. Trends in endocrinology and metabolism: TEM 2010, 21, 3–9.

386
(13) Michalik, L.; Auwerx, J.; Berger, J. P.; Chatterjee, V. K.; Glass, C. K.; Gonzalez, F. J.; Grimaldi, P. A.; Kadowaki, T.; Lazar, M. A.; Rahilly, S. O.; Palmer, C. N. A.; Plutzky, J.; Reddy, J. K.; Spiegelman, B. M.; Staels, B. International Union of Pharmacology . LXI . Peroxisome Proliferator-Activated Receptors. 2006, 58, 726–741.
(14) Overington, J. P.; Al-Lazikani, B.; Hopkins, A. L. How many drug targets are there? Nature reviews. Drug discovery 2006, 5, 993–6.
(15) Germain, P.; Staels, B.; Dacquet, C.; Spedding, M.; Laudet, V. Overview of Nomenclature of Nuclear Receptors. 2006, 58, 685–704.
(16) So, A. Y.-L.; Chaivorapol, C.; Bolton, E. C.; Li, H.; Yamamoto, K. R. Determinants of cell- and gene-specific transcriptional regulation by the glucocorticoid receptor. PLoS genetics 2007, 3, e94.
(17) Carroll, J. S.; Meyer, C. a; Song, J.; Li, W.; Geistlinger, T. R.; Eeckhoute, J.; Brodsky, A. S.; Keeton, E. K.; Fertuck, K. C.; Hall, G. F.; Wang, Q.; Bekiranov, S.; Sementchenko, V.; Fox, E. a; Silver, P. a; Gingeras, T. R.; Liu, X. S.; Brown, M. Genome-wide analysis of estrogen receptor binding sites. Nature genetics 2006, 38, 1289–97.
(18) Bolton, E. C.; So, A. Y.; Chaivorapol, C.; Haqq, C. M.; Li, H.; Yamamoto, K. R. Cell- and gene-specific regulation of primary target genes by the androgen receptor. Genes & development 2007, 21, 2005–17.
(19) Weltmeier, F.; Borlak, J. A high resolution genome-wide scan of HNF4α recognition sites infers a regulatory gene network in colon cancer. PloS one 2011, 6, e21667.
(20) Wang, Q.; Li, W.; Liu, X. S.; Carroll, J. S.; Jänne, O. a; Keeton, E. K.; Chinnaiyan, A. M.; Pienta, K. J.; Brown, M. A hierarchical network of transcription factors governs androgen receptor-dependent prostate cancer growth. Molecular cell 2007, 27, 380–92.
(21) Tan, S. K.; Lin, Z. H.; Chang, C. W.; Varang, V.; Chng, K. R.; Pan, Y. F.; Yong, E. L.; Sung, W. K.; Sung, W. K.; Cheung, E. AP-2γ regulates oestrogen receptor-mediated long-range chromatin interaction and gene transcription. The EMBO journal 2011, 30, 2569–81.
(22) Wang, H.; Lee, E.; Zhou, L.; Leung, P. C. K.; Ross, D. D.; Unadkat, J. D.; Mao, Q. Progesterone receptor (PR) isoforms PRA and PRB differentially regulate expression of the breast cancer resistance protein in human placental choriocarcinoma BeWo cells. Molecular pharmacology 2008, 73, 845–54.

387
(23) Zhang, Y.; Zhou, G.; Wang, H.; Zhang, X.; Wei, F.; Cai, Y.; Yin, D. Transcriptional upregulation of breast cancer resistance protein by 17beta-estradiol in ERalpha-positive MCF-7 breast cancer cells. Oncology 2006, 71, 446–55.
(24) Jigorel, E.; Vee, M. Le; Boursier-neyret, C.; Parmentier, Y.; Fardel, O. Differential Regulation of Sinusoidal and Canalicular Hepatic Drug Transporter Expression by Xenobiotics Activating Drug-Sensing Receptors in Primary Human Hepatocytes ABSTRACT : 2006, 34, 1756–1763.
(25) Cheng, G. M. Y.; To, K. K. W. Adverse Cell Culture Conditions Mimicking the Tumor Microenvironment Upregulate ABCG2 to Mediate Multidrug Resistance and a More Malignant Phenotype. ISRN oncology 2012, 2012, 746025.
(26) Szatmari, I.; Vámosi, G.; Brazda, P.; Balint, B. L.; Benko, S.; Széles, L.; Jeney, V.; Ozvegy-Laczka, C.; Szántó, A.; Barta, E.; Balla, J.; Sarkadi, B.; Nagy, L. Peroxisome proliferator-activated receptor gamma-regulated ABCG2 expression confers cytoprotection to human dendritic cells. The Journal of biological chemistry 2006, 281, 23812–23.
(27) Singh, A.; Wu, H.; Zhang, P.; Happel, C. Expression of ABCG2 (BCRP) is regulated by Nrf2 in cancer cells that confers side population and chemoresistance phenotype. Molecular cancer … 2010, 9, 2365–2376.
(28) Krishnamurthy, P.; Ross, D. D.; Nakanishi, T.; Bailey-Dell, K.; Zhou, S.; Mercer, K. E.; Sarkadi, B.; Sorrentino, B. P.; Schuetz, J. D. The stem cell marker Bcrp/ABCG2 enhances hypoxic cell survival through interactions with heme. The Journal of biological chemistry 2004, 279, 24218–25.
(29) Pradhan, M.; Bembinster, L. a; Baumgarten, S. C.; Frasor, J. Proinflammatory cytokines enhance estrogen-dependent expression of the multidrug transporter gene ABCG2 through estrogen receptor and NF{kappa}B cooperativity at adjacent response elements. The Journal of biological chemistry 2010, 285, 31100–6.
(30) Tan, K. P.; Wang, B.; Yang, M.; Boutros, P. C.; Macaulay, J.; Xu, H.; Chuang, A. I.; Kosuge, K.; Yamamoto, M.; Takahashi, S.; Wu, A. M. L.; Ross, D. D.; Harper, P. A.; Ito, S. Aryl Hydrocarbon Receptor Is a Transcriptional Activator of the Human Breast Cancer Resistance Protein ( BCRP / ABCG2 ) □. 2010.
(31) Ee, P. L. R. Identification of a Novel Estrogen Response Element in the Breast Cancer Resistance Protein (ABCG2) Gene. Cancer Research 2004, 64, 1247–1251.
(32) Krishnamurthy, P.; Schuetz, J. D. The ABC transporter Abcg2/Bcrp: role in hypoxia mediated survival. Biometals : an international journal on the role of metal ions in biology, biochemistry, and medicine 2005, 18, 349–58.

388
(33) Lemos, C.; Kathmann, I.; Giovannetti, E.; Dekker, H.; Scheffer, G. L.; Calhau, C.; Jansen, G.; Peters, G. J. Folate deprivation induces BCRP (ABCG2) expression and mitoxantrone resistance in Caco-2 cells. International journal of cancer. Journal international du cancer 2008, 123, 1712–20.
(34) Lemos, C.; Kathmann, I.; Giovannetti, E.; Calhau, C.; Jansen, G.; Peters, G. J. Impact of cellular folate status and epidermal growth factor receptor expression on BCRP/ABCG2-mediated resistance to gefitinib and erlotinib. British journal of cancer 2009, 100, 1120–7.
(35) Albermann, N.; Schmitz-Winnenthal, F. H.; Z’graggen, K.; Volk, C.; Hoffmann, M. M.; Haefeli, W. E.; Weiss, J. Expression of the drug transporters MDR1/ABCB1, MRP1/ABCC1, MRP2/ABCC2, BCRP/ABCG2, and PXR in peripheral blood mononuclear cells and their relationship with the expression in intestine and liver. Biochemical pharmacology 2005, 70, 949–58.
(36) Gahir, S. S.; Piquette-miller, M. Gestational and Pregnane X Receptor-Mediated Regulation of Placental ATP-Binding Cassette Drug Transporters in Mice □. 2011, 465–471.
(37) Lehmann, J. M.; McKee, D. D.; Watson, M. a; Willson, T. M.; Moore, J. T.; Kliewer, S. a The human orphan nuclear receptor PXR is activated by compounds that regulate CYP3A4 gene expression and cause drug interactions. The Journal of clinical investigation 1998, 102, 1016–23.
(38) Lemmen, J.; Tozakidis, I. E. P.; Galla, H.-J. Pregnane X receptor upregulates ABC-transporter Abcg2 and Abcb1 at the blood-brain barrier. Brain research 2012, 1–13.
(39) Kliewer, S. a.; Goodwin, B.; Willson, T. M. The nuclear pregnane X receptor: a key regulator of xenobiotic metabolism. Endocrine reviews 2002, 23, 687–702.
(40) Generaux, G. T.; Bonomo, F. M.; Johnson, M.; Doan, K. M. M. Impact of SLCO1B1 (OATP1B1) and ABCG2 (BCRP) genetic polymorphisms and inhibition on LDL-C lowering and myopathy of statins. Xenobiotica; the fate of foreign compounds in biological systems 2011, 41, 639–51.
(41) Reginato, A. M.; Mount, D. B.; Yang, I.; Choi, H. K. The genetics of hyperuricaemia and gout. Nature reviews. Rheumatology 2012, 8, 610–21.
(42) Ee, P. L. R.; He, X.; Ross, D. D.; Beck, W. T. Modulation of breast cancer resistance protein ( BCRP / ABCG2 ) gene expression using RNA interference Modulation of breast cancer resistance protein ( BCRP / ABCG2 ) gene expression using RNA interference. 2005, 1577–1584.

389
(43) Yasuda, S.; Kobayashi, M.; Itagaki, S.; Hirano, T.; Iseki, K. Response of the ABCG2 promoter in T47D cells and BeWo cells to sex hormone treatment. Molecular biology reports 2009, 36, 1889–96.
(44) Wang, H.; Zhou, L.; Gupta, A.; Vethanayagam, R. R.; Zhang, Y.; Unadkat, J. D.; Mao, Q. Regulation of BCRP/ABCG2 expression by progesterone and 17beta-estradiol in human placental BeWo cells. American journal of physiology. Endocrinology and metabolism 2006, 290, E798–807.
(45) Imai, Y.; Ishikawa, E.; Asada, S.; Sugimoto, Y. Estrogen-mediated post transcriptional down-regulation of breast cancer resistance protein/ABCG2. Cancer research 2005, 65, 596–604.
(46) Imai, Y.; Tsukahara, S.; Ishikawa, E.; Tsuruo, T.; Sugimoto, Y. Estrone and 17beta-estradiol reverse breast cancer resistance protein-mediated multidrug resistance. Japanese journal of cancer research : Gann 2002, 93, 231–5.
(47) Meyer, K. B.; Carroll, J. S. FOXA1 and breast cancer risk. Nature genetics 2012, 44, 1176–7.
(48) Yeboah, D.; Sun, M.; Kingdom, J.; Baczyk, D.; Lye, S. J.; Matthews, S. G.; Gibb, W. Expression of breast cancer resistance protein ( BCRP / ABCG2 ) in human placenta throughout gestation and at term before and after labor. 2006, 1258, 1251–1258.
(49) Mao, Q. BCRP/ABCG2 in the placenta: expression, function and regulation. Pharmaceutical research 2008, 25, 1244–55.
(50) Jonker, J. W.; Smit, J. W.; Brinkhuis, R. F.; Maliepaard, M.; Beijnen, J. H.; Schellens, J. H.; Schinkel, A. H. Role of breast cancer resistance protein in the bioavailability and fetal penetration of topotecan. Journal of the National Cancer Institute 2000, 92, 1651–6.
(51) Wang, H.; Zhou, L.; Gupta, A.; Vethanayagam, R. R.; Zhang, Y.; Unadkat, J. D.; Mao, Q.; Robert, R. Regulation of BCRP/ABCG2 expression by progesterone and 17beta-estradiol in human placental BeWo cells. American journal of physiology. Endocrinology and metabolism 2006, 290, E798–807.
(52) Charmandari, E.; Kino, T.; Chrousos, G. P. Glucocorticoids and their actions: an introduction. Annals of the New York Academy of Sciences 2004, 1024, 1–8.
(53) Oakley, R. H.; Cidlowski, J. a Cellular processing of the glucocorticoid receptor gene and protein: new mechanisms for generating tissue-specific actions of glucocorticoids. The Journal of biological chemistry 2011, 286, 3177–84.

390
(54) Glass, C. K.; Saijo, K. Nuclear receptor transrepression pathways that regulate inflammation in macrophages and T cells. Nature reviews. Immunology 2010, 10, 365–76.
(55) Rhen, T.; Cidlowski, J. a Antiinflammatory action of glucocorticoids--new mechanisms for old drugs. The New England journal of medicine 2005, 353, 1711–23.
(56) Petropoulos, S.; Gibb, W.; Matthews, S. G. Glucocorticoid regulation of placental breast cancer resistance protein (Bcrp1) in the mouse. Reproductive sciences (Thousand Oaks, Calif.) 2011, 18, 631–9.
(57) Elahian, F.; Kalalinia, F.; Behravan, J. Dexamethasone downregulates BCRP mRNA and protein expression in breast cancer cell lines. Oncology research 2009, 18, 9–15.
(58) Pascussi, J. M.; Drocourt, L.; Fabre, J. M.; Maurel, P.; Vilarem, M. J. Dexamethasone induces pregnane X receptor and retinoid X receptor-alpha expression in human hepatocytes: synergistic increase of CYP3A4 induction by pregnane X receptor activators. Molecular pharmacology 2000, 58, 361–72.
(59) Bhadhprasit, W.; Sakuma, T.; Hatakeyama, N.; Fuwa, M.; Kitajima, K.; Nemoto, N. Involvement of Glucocorticoid Receptor and Pregnane X Receptor in the Regulation of Mouse CYP3A44 Female-Predominant Expression by Glucocorticoid Hormone ABSTRACT : 2007, 35, 1880–1885.
(60) Honorat, M.; Mesnier, A.; Di Pietro, A.; Lin, V.; Cohen, P.; Dumontet, C.; Payen, L. Dexamethasone down-regulates ABCG2 expression levels in breast cancer cells. Biochemical and biophysical research communications 2008, 375, 308–14.
(61) Pascussi, J. M.; Drocourt, L.; Gerbal-Chaloin, S.; Fabre, J. M.; Maurel, P.; Vilarem, M. J. Dual effect of dexamethasone on CYP3A4 gene expression in human hepatocytes. Sequential role of glucocorticoid receptor and pregnane X receptor. European journal of biochemistry / FEBS 2001, 268, 6346–58.
(62) Ray, a; Prefontaine, K. E. Physical association and functional antagonism between the p65 subunit of transcription factor NF-kappa B and the glucocorticoid receptor. Proceedings of the National Academy of Sciences of the United States of America 1994, 91, 752–6.
(63) Nguyen, L. P.; Bradfield, C. a The search for endogenous activators of the aryl hydrocarbon receptor. Chemical research in toxicology 2008, 21, 102–16.
(64) Pfeifer, G. P.; Denissenko, M. F.; Olivier, M.; Tretyakova, N.; Hecht, S. S.; Hainaut, P. Tobacco smoke carcinogens, DNA damage and p53 mutations in smoking-associated cancers. Oncogene 2002, 21, 7435–51.

391
(65) Ebert, B.; Seidel, A.; Lampen, A. Identification of BCRP as transporter of benzo[a]pyrene conjugates metabolically formed in Caco-2 cells and its induction by Ah-receptor agonists. Carcinogenesis 2005, 26, 1754–63.
(66) Ebert, B.; Seidel, A.; Lampen, A. Phytochemicals induce breast cancer resistance protein in Caco-2 cells and enhance the transport of benzo[a]pyrene-3-sulfate. Toxicological sciences : an official journal of the Society of Toxicology 2007, 96, 227–36.
(67) Advance, T. The fungicide prochloraz and environmental pollutant dioxin induce the ABCG2 transporter in bovine mammary epithelial cells by the arylhydrocarbon receptor signalling pathway. 2012.
(68) Zamber, C. P.; Lamba, J. K.; Yasuda, K.; Farnum, J.; Thummel, K.; Schuetz, J. D.; Schuetz, E. G. Natural allelic variants of breast cancer resistance protein (BCRP) and their relationship to BCRP expression in human intestine. Pharmacogenetics 2003, 13, 19–28.
(69) Suvannasankha, a; Minderman, H.; O’Loughlin, K. L.; Nakanishi, T.; Greco, W. R.; Ross, D. D.; Baer, M. R. Breast cancer resistance protein (BCRP/MXR/ABCG2) in acute myeloid leukemia: discordance between expression and function. Leukemia : official journal of the Leukemia Society of America, Leukemia Research Fund, U.K 2004, 18, 1252–7.
(70) Suvannasankha, A.; Minderman, H.; O’Loughlin, K. L.; Nakanishi, T.; Ford, L. a; Greco, W. R.; Wetzler, M.; Ross, D. D.; Baer, M. R. Breast cancer resistance protein (BCRP/MXR/ABCG2) in adult acute lymphoblastic leukaemia: frequent expression and possible correlation with shorter disease-free survival. British journal of haematology 2004, 127, 392–8.
(71) Benderra, Z.; Faussat, A.-M.; Sayada, L.; Perrot, J.-Y.; Chaoui, D.; Marie, J.-P.; Legrand, O. Breast cancer resistance protein and P-glycoprotein in 149 adult acute myeloid leukemias. Clinical cancer research : an official journal of the American Association for Cancer Research 2004, 10, 7896–902.
(72) Tsunoda, S.; Okumura, T.; Ito, T.; Kondo, K.; Ortiz, C.; Tanaka, E.; Watanabe, G.; Itami, A.; Sakai, Y.; Shimada, Y. ABCG2 expression is an independent unfavorable prognostic factor in esophageal squamous cell carcinoma. Oncology 2006, 71, 251–8.
(73) Usuda, J.; Tsunoda, Y.; Ichinose, S.; Ishizumi, T.; Ohtani, K.; Maehara, S.; Ono, S.; Tsutsui, H.; Ohira, T.; Okunaka, T.; Furukawa, K.; Sugimoto, Y.; Kato, H.; Ikeda, N. Breast cancer resistant protein (BCRP) is a molecular determinant of the outcome of photodynamic therapy (PDT) for centrally located early lung cancer. Lung cancer (Amsterdam, Netherlands) 2010, 67, 198–204.

392
(74) Uggla, B.; Ståhl, E.; Wågsäter, D.; Paul, C.; Karlsson, M. G.; Sirsjö, A.; Tidefelt, U. BCRP mRNA expression v. clinical outcome in 40 adult AML patients. Leukemia research 2005, 29, 141–6.
(75) Yoh, K. Breast Cancer Resistance Protein Impacts Clinical Outcome in Platinum-Based Chemotherapy for Advanced Non-Small Cell Lung Cancer. Clinical Cancer Research 2004, 10, 1691–1697.
(76) Korenaga, Y.; Naito, K.; Okayama, N.; Hirata, H.; Suehiro, Y.; Hamanaka, Y.; Matsuyama, H.; Hinoda, Y. Association of the BCRP C421A polymorphism with nonpapillary renal cell carcinoma. International journal of cancer. Journal international du cancer 2005, 117, 431–4.
(77) Goodwin, B.; Hodgson, E.; Liddle, C. The orphan human pregnane X receptor mediates the transcriptional activation of CYP3A4 by rifampicin through a distal enhancer module. Molecular pharmacology 1999, 56, 1329–39.
(78) Loots, G. G.; Ovcharenko, I. rVISTA 2.0: evolutionary analysis of transcription factor binding sites. Nucleic acids research 2004, 32, W217–21.
(79) Frith, M.; Hansen, U.; Weng, Z. Detection of cis-element clusters in higher eukaryotic DNA. Bioinformatics 2001, 17, 878–889.
(80) Wingender, E.; Chen, X.; Hehl, R.; Karas, H.; Liebich, I.; Matys, V.; Meinhardt, T.; Prüss, M.; Reuter, I.; Schacherer, F. TRANSFAC: an integrated system for gene expression regulation. Nucleic acids research 2000, 28, 316–9.
(81) Encode, T.; Consortium, P. A user’s guide to the encyclopedia of DNA elements (ENCODE). PLoS biology 2011, 9, e1001046.
(82) Chen, Y.; Ferguson, S. S.; Negishi, M.; Goldstein, J. A.; Carolina, N. Induction of Human CYP2C9 by Rifampicin , Hyperforin , and Phenobarbital Is Mediated by the Pregnane X Receptor. 2004, 308, 495–501.
(83) Kamalakaran, S.; Radhakrishnan, S. K.; Beck, W. T. Identification of estrogen-responsive genes using a genome-wide analysis of promoter elements for transcription factor binding sites. The Journal of biological chemistry 2005, 280, 21491–7.
(84) Lin, Z.; Reierstad, S.; Huang, C.-C.; Bulun, S. E. Novel estrogen receptor-alpha binding sites and estradiol target genes identified by chromatin immunoprecipitation cloning in breast cancer. Cancer research 2007, 67, 5017–24.

393
(85) To, K. K. W.; Robey, R.; Zhan, Z.; Bangiolo, L.; Bates, S. E. Upregulation of ABCG2 by romidepsin via the aryl hydrocarbon receptor pathway. Molecular cancer research : MCR 2011, 9, 516–27.
(86) Tompkins, L. M.; Li, H.; Li, L.; Lynch, C.; Xie, Y.; Nakanishi, T.; Ross, D. D.; Wang, H. A novel xenobiotic responsive element regulated by aryl hydrocarbon receptor is involved in the induction of BCRP/ABCG2 in LS174T cells. Biochemical pharmacology 2010, 80, 1754–61.
(87) Rossini, G. P.; Malaguti, C. Nanomolar concentrations of untransformed glucocorticoid receptor in nuclei of intact cells. The Journal of steroid biochemistry and molecular biology 1994, 51, 291–8.
(88) Pike, J. W.; Meyer, M. B.; Watanuki, M.; Kim, S.; Zella, L. a; Fretz, J. a; Yamazaki, M.; Shevde, N. K. Perspectives on mechanisms of gene regulation by 1,25-dihydroxyvitamin D3 and its receptor. The Journal of steroid biochemistry and molecular biology 2007, 103, 389–95.
(89) Advance, T. High-resolution genome-wide mapping of AHR and ARNT binding sites by ChIP-Seq High-resolution genome-wide mapping of AHR and ARNT binding sites by ChIP-Seq Raymond Lo * and Jason Matthews * * Department of Pharmacology and Toxicology , University of Toron. 2012.
(90) Zhao, C.; Gao, H.; Liu, Y.; Papoutsi, Z.; Jaffrey, S.; Gustafsson, J.-A.; Dahlman-Wright, K. Genome-wide mapping of estrogen receptor-beta-binding regions reveals extensive cross-talk with transcription factor activator protein-1. Cancer research 2010, 70, 5174–83.
(91) Jia, L.; Berman, B. P.; Jariwala, U.; Yan, X.; Cogan, J. P.; Walters, A.; Chen, T.; Buchanan, G.; Frenkel, B.; Coetzee, G. a Genomic androgen receptor-occupied regions with different functions, defined by histone acetylation, coregulators and transcriptional capacity. PloS one 2008, 3, e3645.
(92) Hall, J. M.; Couse, J. F.; Korach, K. S. The multifaceted mechanisms of estradiol and estrogen receptor signaling. The Journal of biological chemistry 2001, 276, 36869–72.
(93) Ahmed, S.; Valen, E.; Sandelin, A.; Matthews, J. Dioxin increases the interaction between aryl hydrocarbon receptor and estrogen receptor alpha at human promoters. Toxicological sciences : an official journal of the Society of Toxicology 2009, 111, 254–66.
(94) Hankinson, O. Role of coactivators in transcriptional activation by the aryl hydrocarbon receptor. Archives of biochemistry and biophysics 2005, 433, 379–86.

394
(95) Patel, R. D.; Murray, I. a; Flaveny, C. a; Kusnadi, A.; Perdew, G. H. Ah receptor represses acute-phase response gene expression without binding to its cognate response element. Laboratory investigation; a journal of technical methods and pathology 2009, 89, 695–707.
(96) Chen, Y.; Nie, D. Pregnane X receptor and its potential role in drug resistance in cancer treatment. Recent patents on anti-cancer drug discovery 2009, 4, 19–27.
(97) Préfontaine, G. G.; Walther, R.; Giffin, W.; Lemieux, M. E.; Pope, L.; Haché, R. J. Selective binding of steroid hormone receptors to octamer transcription factors determines transcriptional synergism at the mouse mammary tumor virus promoter. The Journal of biological chemistry 1999, 274, 26713–9.
(98) Kakizawa, T.; Miyamoto, T.; Ichikawa, K.; Kaneko, A.; Suzuki, S.; Hara, M.; Nagasawa, T.; Takeda, T.; Mori, J. i; Kumagai, M.; Hashizume, K. Functional interaction between Oct-1 and retinoid X receptor. The Journal of biological chemistry 1999, 274, 19103–8.
(99) Gonzalez, M. I.; Robins, D. M. Oct-1 preferentially interacts with androgen receptor in a DNA-dependent manner that facilitates recruitment of SRC-1. The Journal of biological chemistry 2001, 276, 6420–8.
(100) Nuñez, S. B.; Medin, J. a; Braissant, O.; Kemp, L.; Wahli, W.; Ozato, K.; Segars, J. H. Retinoid X receptor and peroxisome proliferator-activated receptor activate an estrogen responsive gene independent of the estrogen receptor. Molecular and cellular endocrinology 1997, 127, 27–40.
(101) Keller, H.; Givel, F.; Perroud, M.; Wahli, W. Signaling cross-talk between peroxisome proliferator-activated receptor/retinoid X receptor and estrogen receptor through estrogen response elements. Molecular endocrinology (Baltimore, Md.) 1995, 9, 794–804.
(102) Min, G.; Kim, H.; Bae, Y.; Petz, L.; Kemper, J. K. Inhibitory cross-talk between estrogen receptor (ER) and constitutively activated androstane receptor (CAR). CAR inhibits ER-mediated signaling pathway by squelching p160 coactivators. The Journal of biological chemistry 2002, 277, 34626–33.
(103) Nader, N.; Ng, S. S. M.; Wang, Y.; Abel, B. S.; Chrousos, G. P.; Kino, T. Liver x receptors regulate the transcriptional activity of the glucocorticoid receptor: implications for the carbohydrate metabolism. PloS one 2012, 7, e26751.
(104) De Martino, M. U.; Alesci, S.; Chrousos, G. P.; Kino, T. Interaction of the glucocorticoid receptor and the chicken ovalbumin upstream promoter-transcription factor II (COUP-TFII): implications for the actions of glucocorticoids on glucose, lipoprotein, and xenobiotic metabolism. Annals of the New York Academy of Sciences 2004, 1024, 72–85.

395
(105) Shibata, H.; Nawaz, Z.; Tsai, S. Y.; O’Malley, B. W.; Tsai, M. J. Gene silencing by chicken ovalbumin upstream promoter-transcription factor I (COUP-TFI) is mediated by transcriptional corepressors, nuclear receptor-corepressor (N-CoR) and silencing mediator for retinoic acid receptor and thyroid hormone receptor (SMRT). Molecular endocrinology (Baltimore, Md.) 1997, 11, 714–24.
(106) Qiu, Y.; Krishnan, V.; Pereira, F. A.; Tsai, S. Y.; Tsai, M. J. Chicken ovalbumin upstream promoter-transcription factors and their regulation. The Journal of steroid biochemistry and molecular biology 1996, 56, 81–5.
(107) Park, J.-I.; Tsai, S. Y.; Tsai, M.-J. Molecular mechanism of chicken ovalbumin upstream promoter-transcription factor (COUP-TF) actions. The Keio journal of medicine 2003, 52, 174–81.
(108) Wiench, M.; Miranda, T. B.; Hager, G. L. Control of nuclear receptor function by local chromatin structure. The FEBS journal 2011, 278, 2211–30.
(109) Zou, a; Elgort, M. G.; Allegretto, E. a Retinoid X receptor (RXR) ligands activate the human 25-hydroxyvitamin D3-24-hydroxylase promoter via RXR heterodimer binding to two vitamin D-responsive elements and elicit additive effects with 1,25-dihydroxyvitamin D3. The Journal of biological chemistry 1997, 272, 19027–34.
(110) Mochizuki, K.; Suruga, K.; Fukami, H.; Kiso, Y.; Takase, S.; Goda, T. Selectivity of fatty acid ligands for PPARalpha which correlates both with binding to cis-element and DNA binding-independent transactivity in Caco-2 cells. Life sciences 2006, 80, 140–5.
(111) Xia, M.; Huang, R.; Sun, Y.; Semenza, G. L.; Aldred, S. F.; Witt, K. L.; Inglese, J.; Tice, R. R.; Austin, C. P. Identification of chemical compounds that induce HIF-1alpha activity. Toxicological sciences : an official journal of the Society of Toxicology 2009, 112, 153–63.
(112) Berrodin, T. J.; Shen, Q.; Quinet, E. M.; Yudt, M. R.; Freedman, L. P. Identification of 5 ␣ , 6 ␣ -Epoxycholesterol as a Novel Modulator of Liver X Receptor Activity. 2010, 78, 1046–1058.
(113) Lucas, B.; Grigo, K.; Erdmann, S.; Lausen, J.; Klein-Hitpass, L.; Ryffel, G. U. HNF4alpha reduces proliferation of kidney cells and affects genes deregulated in renal cell carcinoma. Oncogene 2005, 24, 6418–31.
(114) Wilkinson, J.; Hallis, T.; Hermanson, S.; Bi, K. Development and validation of a cell-based assay for the nuclear receptor retinoid-related orphan receptor gamma. Assay and drug development technologies 2011, 9, 125–35.

396
Chapter 7 : DNA Methylation in the ABCG2 Gene Locus
7.1. Abstract
ABCG2 encodes for a multidrug efflux transporter called the mitoxantrone
resistance protein (MXR, BCRP). MXR is an important player in the natural
detoxification and protection pathways of the body and is responsible for the efflux of
substrates from the cell. The methylation of cytosine paired with guanine (CpG) sites in
the ABCG2 promoter has been correlated with ABCG2 expression. In this study, eleven
clusters of CpG sites, called CpG islands (CGIs), were predicted in the ABCG2 gene
locus. Sodium bisulfite treatment and pyrosequencing was used to quantify percent
methylation of CpG sites in two CGIs, CpG4 and CpG6. Finally, methylation of these
sites was correlated with the expression of ABCG2 in human liver and kidney tissues.
CpG4, the CGI over the ABCG2 promoter, has little methylation through its center, but
variable methylation on its sides; methylation of a specific CpG site within CpG4 (#77) is
correlated with ABCG2 expression in the kidney. Methylation of the edges of CpG4 is
significantly lower in liver than in kidney and methylation of the entire CpG6 is
significantly higher in kidney than in liver. There was no correlation of methylation of
the entire CpG4 or CpG6 with ABCG2 expression. These findings add to knowledge of
ABCG2 CGI methylation in liver and kidney, and identify regions of interest for future
studies on the development of drug resistance.
7.2. Introduction
The mitoxantrone resistance protein (MXR, BCRP) is an efflux membrane
transporter, a member of the ATP-binding cassette (ABC) transporter family and is

397
encoded by ABCG2. MXR is expressed in many tissues including the liver1–4 and
kidney2–4 and plays a role in protecting these vital organs from natural dietary toxins and
in elimination of xenobiotics from the body. Not only has wide variability of ABCG2
expression been reported in normal tissues5–7, but overexpression of ABCG2 is seen in
cancers7–15 and is associated with disease-free survival of patients with these cancers7,9–15.
The majority of studies investigating mechanisms regulating the expression of ABCG2
have focused on identifying binding sites for transcription factors (TFs) in the ABCG2
promoter region16–23. However, methylation of CpG sites affects the binding of TFs,
especially over gene promoters24,25. Therefore, further research looking at the effect of
ABCG2 promoter methylation on ABCG2 expression is warranted.
Methylation refers to the addition of a methyl group to the 5’ position of cytosine
(C) when it is directly linked with a guanine (G). DNA methylation occurs in the human
genome at these "CpG" sites (the ‘p’ refers to the phosphate group linking the two
nucleotides). Methylated cytosine accounts for ~1% of total DNA bases and affects 70-
80% of all CpG dinucleotides in the genome26. CpG sites were first noted because they
occur in the genome at a much lower rate than is expected by the random combination of
four bases27. It was also noted that these CpG sites cluster into specific regions of the
genome and were termed ‘CpG islands’ (CGIs)27. Gardiner-Gardner and Frommer
originally described CGIs as having a length greater than 200 bp, a G and C content
greater than 50% and a CpG observed to expected ratio (O/E) greater than 0.628.
Promoters are often associated with a high frequency of CpG sites29,30, and when multiple
CpG sites over a gene promoter are methylated gene suppression occurs31. CGIs are

398
particularly associated with the promoters for tissue-specific and housekeeping genes28,
and their methylation is important for maintaining gene silence31.
The natural role of CpG methylation is important for the process of imprinting
and the regulation of tissue-specific genes (see Bird 200232 for review). Global alterations
in the epigenetic landscape, such as hypomethylation or hypermethylation of CGIs, are a
hallmark of cancer33–35. Hypomethylation at CGIs for drug efflux transporters causes
aberrant expression of the transporter gene and allows for cancer to acquire drug
resistance36. Thus, epigenetic mechanisms have become a new target for pharmaceutical
agents37–40.
The ABCG2 promoter has a CGI, the core of which is just upstream of the
transcriptional start site (TSS) (Figure 7.1)16. Minimal to absent methylation of the
ABCG2 promoter CGI has been reported in human liver tissues41 and in renal cell lines42.
The degree of ABCG2 promoter methylation correlates to ABCG2 mRNA levels in
cancer cell lines42–45 and hypomethylation of the ABCG2 promoter contributes to drug-
resistance in cell lines and patients42–47. Demethylation of the ABCG2 promoter has also
been correlated with metastasis and stage of cancer, but not with the development of
cancer itself48. Treatment with the demethylating agent 5-aza-2’-deoxycytidine in cell
lines induces ABCG2 expression while the hypermethylated ABCG2 promoter is
associated with gene silencing42–44. The degree of ABCG2 promoter methylation in sheep
was inversely correlated with xenobiotic resistance, and specific methylated CpG sites in
the ABCG2 promoter correlated to ABCG2 expression 49. Methylation of the ABCG2
promoter is implicated in allele-specific expression in certain tissues (shown for ABCG2

399
in placenta50). Characterization of epigenetic expression profiles in liver, intestine and
kidney would be of interest.
The methylation of CpG sites over a promoter works to repress gene expression
through two mechanisms. The first is limiting binding for activating TFs24,25, and the
second is the recruitment of methyl binding domain (MBDs) proteins that in turn recruit
histones and condense chromatin51. Recent genome wide studies correlating gene
expression with DNA methylation patterns in cancer and normal tissues have identified
methylated CpG sites of atypical distances from the gene TSS52, trans- and cis-
association of CGI methylation with expression53 and methylation quantitative trait loci
(mQTL) for SNP-CpG methylation-expression associations54–56. These studies support
the hypothesis that ‘orphan CGIs’, CGIs that are not over the TSS of genes, have
functional significance57. The most likely explanation for how orphan CGIs affect gene
expression is through disruption of cis-regulatory regions58.
The methylation status of cytosines cannot be determined by traditional
sequencing methods. CpG methylation is evaluated by treatment of single stranded DNA
with sodium bisulfite and subsequent sequencing59. Sodium bisulfite converts
unmethylated cytosines to uracil (Figure 7.2), whereby 5-methylcytosine (5-MeC) is
nonreactive. Treated DNA is then amplified in a methylation specific PCR (MSP), in
which converted cytosines amplify as thymine and 5-MeC residues amplify as cytosine.
DNA is then sequenced before and after bisulfite treatment, with primers designed to
target the expected sequence after bisulfite treatment, to determine which CpG sites are
methylated. This technique, called bisulfite sequencing, was the original method for
determining the sequence of CGIs and required the sequencing of multiple DNA samples

400
to obtain quantitative methylation data for the CpG site. Bisulfite treatment has now been
coupled with new sequencing methods, such as pyrosequencing, to overcome many of the
challenges of MSP60. Pyrosequencing is a robust, high-throughput technique that
quantifies percent methylation of CpG sites by coupling nucleotide incorporation to a
luciferase reaction61.
In this study, the hypothesis that methylation of CGIs in the ABCG2 gene locus
associates with the expression of ABCG2 was tested. CGIs in the ABCG2 gene locus
were predicted using in silico modeling programs based on the accepted definition of a
CGI28. Pyrosequencing was used to determine the methylation percentage of CpG sites
within two of the computed CGIs in the ABCG2 gene locus for human liver and kidney
tissues. Finally, the degree of methylation for individual CpG sites and entire CGIs was
correlated to the expression of ABCG2 in these tissues. Results from this study can direct
further research to identify key CpG sites important for ABCG2 regulation and the
development of drug-resistance.

401
Figu
re 7
.1. S
chem
atic
of C
pG is
land
s in
the
ABC
G2
gene
locu
s. Fr
om to
p to
bot
tom
: sca
le fo
r the
regi
on fo
llow
ed b
y th
e
geno
mic
coo
rdin
ates
(chr
4:89
0799
97-8
9080
517;
hg1
9). D
epic
ted
by re
d bo
xes a
nd n
umbe
ring
are
the
loca
tion
and
rela
tive
size
of C
pG is
land
s pre
dict
ed b
y th
e C
pGPr
oD, C
pGPl
ot a
nd C
pG Is
land
Sea
rche
r ana
lysi
s as d
escr
ibed
in M
ater
ials
and
Met
hods
. Ref
eren
ce g
enes
from
the
UC
SC G
enom
e B
row
ser a
re in
blu
e w
ith a
rrow
s ind
icat
ing
dire
ctio
n of
tran
scrip
tion.
CpG
isla
nds o
ver 3
00 b
p as
pre
dict
ed b
y EN
CO
DE
are
show
n in
gre
en.

402
Figure 7.2. Bisulfite conversion of cytosine to uracil. (A) Chemical reaction that occurs
when DNA is treated with bisulfite. The bisulfite attacks the aromatic ring leading to
sulfonation at the 6’ position (Step 1). The ring then goes through a hydrolytic
deamination process (Step 2) and finally alkali desulphonation (Step 3) to yield uracil.
When there is a methyl group in the 5’ position of cytosine (B) this reaction cannot occur.

403
7.3. Materials and Methods
7.3.1. Chemicals and Materials
Qiagen AllPrep DNA/RNA Mini Kit, QIAquick PCR Purification Kit, Qiagen
RNeasy MinElute Cleanup Kit, Epitect Bisulfite Kits, Qiagen Pyromark PCR Kits,
Strepavidin beads, PyroMark Vacuum System and Qiagen Pyro Gold reagents were all
purchased from Qiagen (Valencia, CA). Trizol (Invitrogen, Carlsbad, CA), High
Capacity cDNA Reverse Transcription Kit (Applied Biosystems, Foster City, CA) and
Exonuclease I (GE Healthcare, Piscataway, NJ) were all purchased from their respective
manufacturers.
7.3.2. In Silico CpG Island Prediction
CpG island predictions were done using three in silico prediction programs
(CpGProD62, CpGPlot by Emboss63 and CpG Island Searcher64) which all utilize baseline
criteria for CpG islands described by Gardiner-Gardner and Frommer28 and the
traditional algorithms for predicted CpG islands65. The analyzed ABCG2 gene locus was
defined as a ~300,000 bp region from one gene upstream (PPM1K) and downstream
(PKD2) of ABCG2 (chr4:89130400-89439035, hg18; chr4:88911376-89220011, hg19).
Both forward and reverse DNA sequences for the gene locus were obtained from the
UCSC Genome browser and utilized in the above prediction programs. For the CpGProD
program62, criteria of GC content ≥ 50%, CpG O/E ≥ 0.6 and a length greater than 300 bp
were used for predictions. This program suggests using a length > 500 bp and it also
weights for CpG islands over the transcriptional start site (TSS) of genes62. Similar
parameters were used for predictions with the CpGPlot program by EMBOSS63, with the

404
exception of a required length of 200 bp. The CpG Searcher program uses the algorithm
previously described by Takai and Jones31 and criteria of GC ≥ 55%, O/E ≥ 0.6 and
length ≥ 300 bp were used for predictions with this algorithm. No programs that are
based on the recently developed algorithms focused on clustering of CpG sites without
taking into account baseline DNA content66 were utilized for these predictions. To help
eliminate false positive CpG islands that occur over Alu repeats, a required minimum
number of seven CpG sites in 200 bp, described in Table 7.3 as CpG/bp > 0.035, was
implemented.
7.3.3. Liver and Kidney Tissues
Kidney (n=29) and liver (n=29) samples were procured by the Pharmacogenomics
of Membrane Transporters (PMT) research group at the University of California San
Francisco (San Francisco, CA)67. These tissues were purchased from Asterand (Detroit,
MI), Capital Biosciences (Rockville, MD) and SRI International (Menlo Park, CA). The
Asterand samples included both postmortem tissues and surgical resections from donors,
the Capital Biosciences samples included surgical resections from normal tissue
surrounding cancer tissues and SRI International samples were postmortem tissues. All
samples were stored frozen at -80°C until processing for DNA and RNA. Information on
the age, sex, and ethnicity of the patient was available for all samples.
DNA was extracted from the tissues using the Qiagen AllPrep DNA/RNA Mini
Kit following the manufacturer’s protocol, with additional DNA clean-up using the
QIAquick PCR Purification Kit. RNA was extracted from the tissues following the
protocol for Trizol reagent, followed by RNA clean-up with the Qiagen RNeasy

405
MinElute Cleanup Kit following the manufacturer’s protocol. Good-quality RNA
(260/280 >1.7 and 260/230 >1.8, RNA Integrity number 3-8) was isolated from 29
kidney samples and 29 liver samples, and all were used to correlate CpG island
methylation with total ABCG2 mRNA expression. Two micrograms of RNA were
reverse transcribed to cDNA using the High Capacity cDNA Reverse Transcription Kit
and the following incubation conditions: 10 min at 22ºC, 2 hr at 37ºC, 5 min at 4ºC, 10
min at 75 ºC and 5 min at 4ºC. Exonuclease I (10U/mL) was added to each sample and
the following incubation conditions were used to remove excess primers: 1 hr at 37ºC, 5
min at 4ºC and then 10 min at 85ºC to inactivate the exonuclease enzyme. Samples were
then stored at -20ºC until assayed for gene expression or pyrosequenced.
7.3.4. ABCG2 mRNA Expression in PMT Liver and Kidney Tissues
ABCG2 expression was evaluated in 29 kidney and 29 liver samples from
surgical resection or postmortem collections in Caucasian males and females using the
Biotrove Open Array™ qPCR platform (Life Technologies, Carlsbad, CA) according to
the manufacturer’s protocol. ABCG2 mRNA expression was normalized to a geometric
mean of the expression of GAPDH, β-2 microglobin, and β-actin and expressed as 2-ΔΔCt
per gene for each sample. All ∆Ct values for a given tissue type were quantile normalized
across samples using the open source R preprocessCore package68,69 Expression data was
quality controlled using principal component analysis to identify outliers. All samples
(N=29 for each tissue) passed initial QC and were pyrosequenced.

406
7.3.5. Pyrosequencing Primer Design
Primers for PCR and pyrosequencing reactions were designed using the PyroMark
Assay Design 2.0 software (Qiagen, Valencia, CA). First, CpG4 and CpG6 were split into
four and two regions of up to 300 bp, respectively, for PCR reactions. Sequences for each
region where extracted from the UCSC Genome Browser and input into the design
software. Primers were selected based on melting temperature, percent GC and
uniqueness. Multiple sequencing primers were designed per region to cover all CpG sites.
All reverse PCR primers were biotin labeled; all primers were synthesized by Integrated
DNA Technologies (San Diego, CA).

407
Table 7.1. Pyrosequencing Primers for CpG Island 4 Primer1 Sequence Location2
CpG4 PCR1 F1 TTTTAGAGAAATTGGTTTTATA 89079507-89079528 CpG4 PCR1 R1* AACTACCTACTATACCCACTCA 89079824-89079845 CpG4 SEQ1 S1 AATTAAAGGTTTAGGATT 89079562-89079570 CpG4 SEQ1 S2 AATAAGATTATTAAGTATGTGTA 89079686-89079708 CpG4 SEQ1 S3 TTTTAATTTTAGTGGGAG 89079764-89079781 CpG4 PCR2 F1 GAATTTTTTGAGTGGGTATAGT 89079816-89079837 CpG4 PCR2 R1* AACCACTACCTTCAACTCTAAC 89080048-89080069 CpG4 SEQ2 S1 TTTTGAGTGGGTATAGTA 89079821-89079838 CpG4 SEQ2 S2 AATTTTTTTTTTTAATTATAT 89079858-89079878 CpG4 SEQ2 S3 GGTGGTAGTTTGGGGAGA 89079958-89079975 CpG4 PCR3 F1 GTTGTGGATAGTTAGAGTTGAA 89080038-89080059 CpG4 PCR3 R1* CAATAAACCCCTAATAATTCTC 89080323-89080344 CpG4 SEQ3 S1 GAGTTGAAAGTAGTGGTT 89080052-89080069 CpG4 SEQ3 S2 GTTTAGGGTTTTTTTAGG 89080080-89080097 CpG4 SEQ3 S3 GTTAGTAGGATTGGTATTAT 89080201-89080220 CpG4 PCR4 F1 GTTGAGTAGTTAGTAGGATTGGTAT 89080193-89080217 CpG4 PCR4 R1* AACCACCCATTTAACTTACTCT 89080461-89080482 CpG4 SEQ4 S1 GTAGGGATAAGTTAAATATT 89080259-89080278 CpG4 SEQ4 S2 TGATTTAGTTGGGTTTGG 89080364-89080381 1 Primer names indicate CpG island, PCR reaction order per island or overall sequencing reaction number, and a numbered F, R, or S for direction or order of primer in region 2 Genomic location on chromosome 4 from UCSC genome browser build 19
Asterisks indicate biotin labeled primers Abbreviations: SEQ, overall sequence reaction; F, forward; R, reverse; S, sequence primer order per region

408
Table 7.2. Pyrosequencing Primers for CpG Island 6 Primer1 Sequence Location2
CpG6 PCR1 F1 AGAGGAATTTGTTGTTAGTATATT 89120804-89120827 CpG6 PCR1 R1* CCCCACTAATCTTTTTTATATT 89120992-89121013 CpG6 SEQ1 S1 AAAAGTTATTTTATTTTATTTA 89120849-89120870 CpG6 SEQ1 S2 GTTTTAGTATTTTGGGAG 89120898-89120915 CpG6 PCR2 F1 GATTATTTTGGAGAATATAGTGAAA 89120951-89120975 CpG6 PCR2 R1* AAATTCCTAAACTCAAATAATCTAC 89121251-89121275 CpG6 PCR2 S1 AAAAATATAAAAAAGATTAGT 89120989-89121009 CpG6 SEQ2 S2 GTAGAGTTTGTAGTGAGTAAG 89121085-89121105 1 Primer names indicate CpG island, PCR reaction order per island or overall sequencing reaction number, and a numbered F, R, or S for direction or order of primer in region 2 Genomic location on chromosome 4 from UCSC genome browser build 19 Asterisks indicate biotin labeled primers Abbreviations: SEQ, overall sequence reaction; F, forward; R, reverse; S, sequence primer order per region
7.3.6. Pyrosequencing
All bisulfite reactions of DNA and pyrosequencing were done at the Stanford
University Protein and Nucleic Acid (PAN) Facility (Stanford, CA). DNA from each
tissue was treated with sodium bisulfite using the Qiagen Epitech Bisulfite Kit following
the manufacturer’s protocol. Regions were amplified using the Qiagen Pyromark PCR kit
following the manufacturer’s protocol, with the following adjustments per each PCR
reaction: 10-20 ng of sodium bisulfite treated DNA, 0.2 μM final primer concentration,
25 mM MgCl2 and an annealing temperature of 54°C. PCR reactions were purified on
Strepavidin beads using the Qiagen PyroMark vacuum system following the
manufacturer’s protocol. Pyrosequencing reactions were run on the Qiagen PyroMark
Q24 instrument (Qiagen, Valencia, CA) using Qiagen Pyro Gold reagents following the
manufacturer’s protocol. Pyrosequencing results were analyzed versus the standard

409
reference sequence, which was obtained from the UCSC Genome browser, and visualized
using the PyroMark Q24 software (Qiagen, Valencia, CA).
7.3.7. Statistical Analysis
Results for pyrosequencing reactions were obtained as percent methylation per
CpG site. CpG methylation percentages were averaged both per site for all tissues and per
CpG island in each tissue. In the case of CpG4, percent methylations for sections of the
island were averaged per tissue. Average percent methylation for sections of the CpG4
island or the entire CpG6 island were compared between liver and kidney tissues using an
ANOVA followed by a post-hoc Bonferroni’s multiple comparison test or a Student’s t-
test, respectively. Regions were considered to have statistically significant differences in
methylation with a P < 0.05. If the range of percent methylation at a given site was 10%
or greater, linear regression was used to evaluate the relationship between ABCG2
expression and methylation. Methylation of whole CpG islands was analyzed in a similar
manner. Results were reported for individual CpG sites only if the linear regression had
an R2 > 0.8, a P < 0.05 and a non-zero slope. Expression of ABCG2 mRNA was analyzed
as 2-ΔΔCt values (as described above), and differences in ABCG2 mean expression were
examined using a Student’s t-test on the 29 samples of each tissue. All statistics were run
using the GraphPad Prism 5 program.

410
7.4. Results
7.4.1. ABCG2 Expression in PMT Liver and Kidney Tissues
The expression of ABCG2 mRNA in 29 liver and kidney tissues were examined
using qRT-PCR. A range of ABCG2 expression was observed in kidney (Figure 7.3).
Although there were a few liver samples with high expression of ABCG2, the average
expression of ABCG2 in kidney was three times that of liver (0.003 versus 0.001, p =
0.38, data not shown). The lack of statistical difference between the mean of these two
tissue sets is likely limited by sample size; analysis of 60 samples for each tissue yields
similar mean values of ABCG2 expression but the difference between liver and kidney is
significantly different (P = 0.004, data not shown).

411
Figu
re 7
.3. E
xpre
ssio
n pr
ofile
of A
BC
G2
mR
NA
in h
uman
tiss
ues.
AB
CG
2 m
RN
A e
xpre
ssio
n in
29
hum
an (A
) kid
ney
and
(B) l
iver
tiss
ues,
dete
rmin
ed b
y qR
T-PC
R a
nd d
ispl
ayed
as 2
-ΔΔC
t . The
mR
NA
exp
ress
ion
of A
BC
G2
was
nor
mal
ized
to th
e ge
omet
ric m
ean
of th
ree
hous
ekee
ping
gen
es a
nd th
en q
uant
ile n
orm
aliz
ed a
s des
crib
ed in
Mat
eria
ls a
nd M
etho
ds.

412
7.4.2. CpG Island Prediction
Using the three predictive programs CpGProD, CpGPlot and CpG Island Searcher
with criteria described in Materials and Methods, 12 predicted CpG islands in the
ABCG2 gene locus were identified (Figure 7.1 and Table 7.3). These CpG Islands ranged
in length from 250 bp to 2000 bp, in GC content from 55-70%, in O/E ratio from 0.71-
0.95 and in the number of CpG sites from 14-170. As expected, the three largest CpG
islands were over the TSS of genes, CpG1 over the PKD2 TSS, CpG4 over the ABCG2
TSS and CpG11 over the PPM1K TSS. The reverse sequence of the ABCG2 gene locus
yielded slightly more predicted CpG islands than the forward sequence. Since PKD2 runs
on the forward strand and PPM1K and ABCG2 run on the anti-strand, we did not exclude
any CpG islands based on their strand orientation.
The three programs predicted similar regions of comparable length. Seven regions
were predicted by all three programs: CpG isles 1, 3-6, 9 and 11 (data not shown). The
remaining five regions were predicted by both CpGProD and CpGPlot. The Takai/Jones
algorithm31 used in CpGProD was designed to eliminate Alu repeats by increasing the
minimum length of CpG islands to 500 bp since Alu repeats are usually ~300 bp in
length70. Using a high minimum length requirement suppresses short regions which have
been suggested to be active66. Therefore, a minimum CpG site of 7 per 200 bp versus the
high minimum length to eliminate Alu repeats was implemented.
Two CpG islands in the ABCG2 gene locus were analayzed in both liver and
kidney tissues (n = 29 per tissue). The CpG1 and CpG11 islands were eliminated from
pyrosequencing analysis due to their orientation over the TSS of neighboring genes,
which suggests they are relevant for regulating the expression of those genes (Figure 7.1).

413
For similar reasons, we choose CpG4 for analysis because it is situated over the TSS of
ABCG2 and there is evidence supporting alteration in methylation correlates with
ABCG2 expression42–45. CpG islands 3-9 are either intra-ABCG2 or upstream relative to
its TSS (Figure 7.1). Since all of these regions have reliable CpG island criteria (Table
7.3), we selected CpG6 for analysis with pyrosequencing since it was the only region that
had preliminary data by ENCODE showing alteration in methylation (data not shown).
Table 7.3. Characteristics of the CpG Islands in the ABCG2 Locus Isle ID %GC1 Obs/Exp2 Length #CpG3 CpG/bp4 Genomic Location5
CpG Isle 1 69.6 0.945 1490 170 0.114 88928338-88929827 CpG Isle 2 55.6 0.735 253 14 0.055 88978629-88978881 CpG Isle 3 55.2 0.973 330 22 0.067 89037746-89038075 CpG Isle 4 63 0.834 1040 85 0.082 89079580-89080619 CpG Isle 5 55 0.714 525 28 0.053 89107719-89108243 CpG Isle 6 55 0.841 318 18 0.057 89120882-89121199 CpG Isle 9 55 0.755 318 18 0.057 89169456-89169773 CpG Isle 11 59.3 0.823 1955 139 0.071 89204336-89206290 1 Percentage G and C content of region 2 Number of CpG sites divided by number of C and G base pairs 3 Total number of CpG sites in region 4 Number of CpG sites per basepair (bp) 5 Genomic location on chromosome 4 from the UCSC genome browser's hg19 build

414
7.4.3. Methylation of CpG4
Methylation percentages for each CpG site in CpG4 were obtained in seven
kidney and liver tissues. Quality of bisulfite conversion and pyrosequencing were
checked through analysis of the pyrograms (Figure 7.4) provided by the PyroMark Q24
software. All bisulfite conversions were >90%, and any failed sequencing runs were
rerun. Percent methylation for individual CpG sites in both kidney and liver tissues were
under 30% (Figure 7.5), and methylation for the entire CpG4 island was under 40% in
both tissues (Figure 7.6). The most variability in methylation between samples, for both
tissues, occurred on the edges of the CpG4 island, specifically CpG sites 1-13 and 68-87
(Figure 7.5). For both CpG sites 1-13 and 68-87, kidney tissues had a higher percent
methylation than liver tissues (Figure 7.7). There was no difference between kidney and
liver for the average percent methylation of CpG sites 14-67 in CpG4. Additionally, the
individual CpG site percent methylation for CpG sites 1-13 and 68-87 was correlated
with the expression of ABCG2 mRNA in kidney and liver. The percent methylation of
CpG site 77 of CpG4 was correlated to ABCG2 mRNA in the kidney (Figure 7.8).

415
Figu
re 7
.4. R
epre
sent
ativ
e pr
ogra
m tr
aces
obt
aine
d by
pyr
oseq
uenc
ing.
Pyr
ogra
ms f
rom
the
sequ
enci
ng o
f a
sect
ion
of C
pG is
land
s (A
) CpG
4 an
d (B
) CpG
6. R
ed c
olum
ns in
dica
te m
ethy
late
d C
pG si
tes w
ith th
e de
nsity
of t
he
met
hyla
tion
pres
ente
d at
the
top
of th
e tra
ce a
s an
aver
age
perc
ent f
or th
e C
pG si
te a
naly
zed.
Hig
hlig
hted
yel
low
nucl
eotid
es in
dica
te q
ualit
y co
ntro
l fla
gs fo
r fai
led
conv
ersi
on o
f cyt
osin
e to
ura
cil b
y th
e bi
sulfi
te tr
eatm
ent.
Hei
ght
of e
ach
peak
is a
rbitr
ary
and
used
by
Pyro
Mar
k w
ithin
eac
h sa
mpl
e ru
n to
cal
cula
te p
erce
nt o
f met
hyla
tion.
Nuc
leot
ide
sequ
ence
is li
sted
alo
ng th
e bo
ttom
bel
ow p
eak
trace
s.

416
Figu
re 7
.5. B
ox a
nd w
hisk
er p
lots
for
rang
e of
CpG
4 m
ethy
latio
n pe
r C
pG si
te. T
he m
ethy
latio
n pe
rcen
t of 8
7 C
pG si
tes i
n th
e
CpG
4 is
land
for s
even
(A) k
idne
y an
d (B
) liv
er ti
ssue
s. Pe
r eac
h C
pG si
te th
e bo
x in
dica
tes t
he 2
5th a
nd 7
5th p
erce
ntile
, the
line
in
the
box
the
med
ian
and
the
whi
sker
s ran
ge fr
om m
inim
um to
max
imum
per
cent
met
hyla
tion.

417
Figure 7.6. Box and whisker plots for range of CpG4 methylation per tissue. The
mean methylation percent of all CpG sites in the CpG4 island are combined for each of
the seven kidney and liver tissues. Per each tissue, the box indicates the 25th and 75th
percentile, the line in the box the median and the whiskers range from minimum to
maximum percent methylation.

418
Figure 7.7. Scatter plot of methylation analyses for sections of CpG4. The scatter plot
shows the methylation percent of CpG sites in sections of the CpG4 island for ()
Kidney and () Liver tissues. The CpG sites contained in each section of the CpG4
island are listed along the x-axis. Per each section of CpG4, the line represents the mean
percent methylation of each sample’s CpG sites. Analysis between the two tissues were
done per each section of CpG4 using an ANOVA followed by a post-hoc Bonferroni’s
multiple comparison test; *** P < 0.0001.

419
Figure 7.8. Correlation of CpG4 island CpG site 77 methylation with ABCG2
expression in kidney. Percent methylation at CpG site 77 in CpG4 for each of the seven
kidney tissues were plotted versus their ABCG2 mRNA expression. ABCG2 mRNA
expression is displayed as 2-ΔΔCt as described in Materials and Methods. Linear regression
was used to determine correlation of methylation with ABCG2 expression; R2 = 0.9, P =
0.001.

420
7.4.4. Methylation of CpG6
Methylation percentages for each CpG site in the CpG6 island were obtained in
29 kidney and liver tissues. Quality of bisulfite conversion and pyrosequencing were
checked through analysis of the pyrograms (Figure 7.4) provided by the PyroMark Q24
software. All bisulfite conversions were >90%, and any failed sequencing runs were
rerun. Percent methylation for individual CpG sites in both kidney and liver tissues had a
wide range, but averaged between 50-80% for kidney tissues (Figure 7.9A) and 65-100%
for liver tissues (Figure 7.9B). Overall methylation for the entire CpG6 island per tissue
sample ranged from 50-90% for kidney tissues (Figure 7.10A) and 85-95% for liver
tissues (Figure 7.10B). Since the entire CpG6 island exhibited variability in percent
methylation, the average percent methylation for the whole CpG6 island was tested for
differences between kidney and liver. Liver had an average percent methylation of 90%,
which was significantly higher than the 75% average percent methylation of kidney
(Figure 7.11). The average percent methylation for the entire CpG6 island did not
correlate with ABCG2 mRNA in either kidney or liver tissues (Figure 7.12). Association
between the percent methylation of individual CpG sites in the CpG6 island and ABCG2
mRNA levels was not evident (data not shown).

421
Figure 7.9. Box and whisker plots for range of CpG6 methylation per CpG site. The
percent methylation of 20 CpG sites in the CpG6 island for 29 (A) kidney and (B) liver
tissues. For each CpG site, the box indicates the 25th and 75th percentile, the line in the
box is the median, and the whiskers range from minimum to maximum percent
methylation.
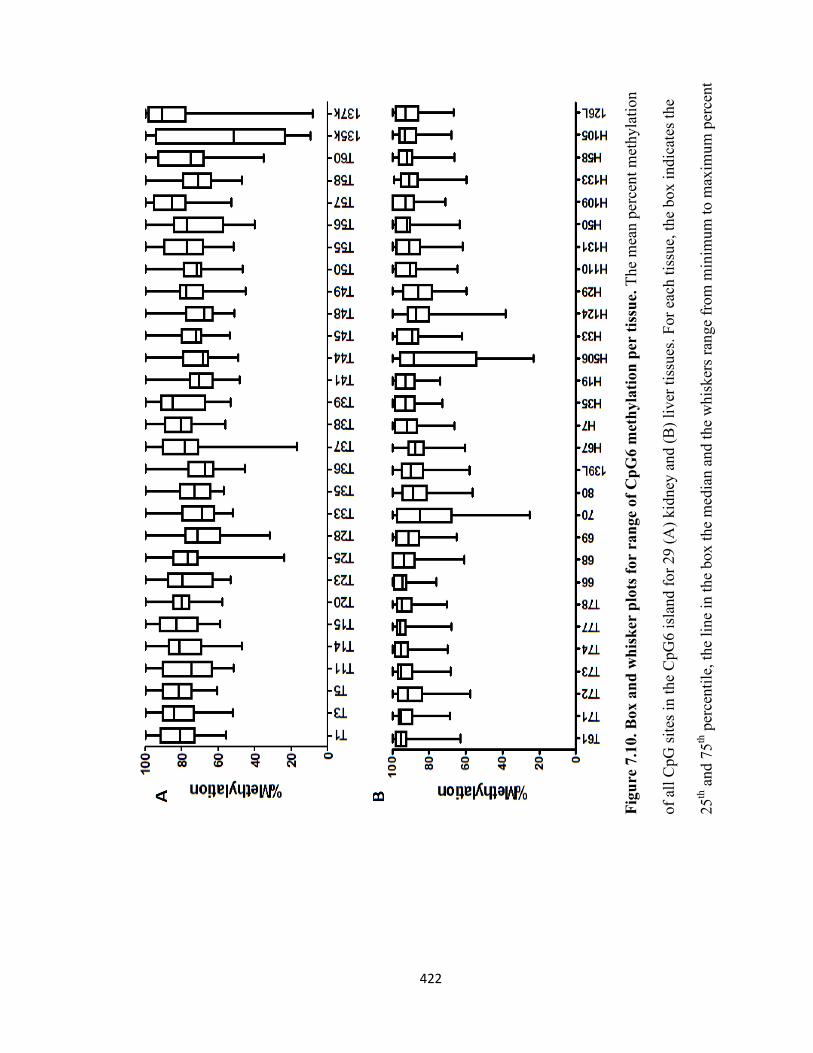
422
Figu
re 7
.10.
Box
and
whi
sker
plo
ts fo
r ra
nge
of C
pG6
met
hyla
tion
per
tissu
e. T
he m
ean
perc
ent m
ethy
latio
n
of a
ll C
pG si
tes i
n th
e C
pG6
isla
nd fo
r 29
(A) k
idne
y an
d (B
) liv
er ti
ssue
s. Fo
r eac
h tis
sue,
the
box
indi
cate
s the
25th
and
75th
per
cent
ile, t
he li
ne in
the
box
the
med
ian
and
the
whi
sker
s ran
ge fr
om m
inim
um to
max
imum
per
cent

423
Figure 7.11. Scatter plot of methylation analyses for CpG6. The scatter plot shows the
percent methylation of CpG sites in the CpG6 island for () kidney and () liver tissues.
Percent methylation of all 20 CpG sites in CpG6 was averaged per tissue to obtain a
single value. For each tissue set, the line represents the mean percent methylation of
CpG6. Analysis between the two tissues was done using a Student’s t-test; ** P < 0.001.

424
Figure 7.12. Correlation of CpG6 island methylation with ABCG2 expression in
kidney and liver. Percent methylation of CpG6 for each of the 29 () kidney and ()
liver tissues were plotted versus their ABCG2 mRNA expression. Percent methylation of
all 20 CpG sites in CpG6 was averaged per tissue to obtain a single value. ABCG2
mRNA expression is displayed as 2-ΔΔCt, as described in Materials and Methods. Linear
regression was used to determine correlation of CpG6 methylation with ABCG2
expression in either tissue.

425
7.5. Discussion
The data presented above suggests that the ABCG2 promoter CpG island, CpG4,
has low methylation in liver and kidney. These data are consistent with the absence of
methylation for the ABCG2 promoter CpG island in liver41 and renal cell lines42. Limited
methylation and the rank order of methylation between liver and kidney is also consistent
with the high expression of ABCG2 in liver and more moderate expression of ABCG2 in
kidney1. However, the average percent methylation of CpG4 was not correlated with
expression of ABCG2. Larger studies are needed to confirm these results.
Previous research correlating the expression of ABCG2 to promoter methylation
has been qualitative rather than quantitative in nature. The only report that has shown
correlation between ABCG2 mRNA levels and percent methylation of the ABCG2
promoter used data from before and after mass depletion of promoter methylation by
treating cells with the demethylation agent 5-aza-2’deoxycitidine44. Other qualitative
reports of alteration in ABCG2 expression due to ABCG2 promoter methylation have also
been before and after treatment with 5-aza-2’deoxycitidine or with other xenobiotics42–46.
The current results demonstrate that in normal kidney and liver tissues the ABCG2
promoter CpG4 island is not highly methylated and extent of methylation is not a marker
for ABCG2 expression.
The use of the pyrosequencing technique allowed the estimation of percent
methylation at multiple CpG sites within two CpG islands of the ABCG2 gene locus.
Methylation of one CpG site, CpG site 77 in the CpG4 island, was correlated with
ABCG2 expression in the kidney. Alteration in methylation status of CpG sites on the
edges, or shores, of CpG islands often relate the strongest to gene expression71 and it has

426
been proposed that alterations in methylation status of CpG shores are more relevant to
the modulation of gene expression71. Consistent with this proposal, CpG4 island CpG site
77 is located in a shore. This insight could continue to direct other studies looking at
ABCG2 promoter methylation in drug resistance.
The smaller CpG6 island, located upstream of the ABCG2 promoter, showed
different extents of methylation in kidney and liver tissues. Traditionally, CpG islands are
categorized as being over 200 bp in length28, with CpG islands over the transcriptional
start sites of genes being greater than 500 bp62. However, shorter CpG islands (>200 bp)
are also functional and can exhibit tissue-specific alterations in methylation and
evolutionary conservation66. Although there is no correlation between the average percent
methylation of CpG6 and ABCG2 expression, there is a significant difference in the
average methylation of CpG6 between kidney and liver tissues. This is consistent with
reports that functional short CpG islands exhibit tissue-specific alterations in
methylation66, and suggesting that this island may have some other yet unknown
function. CpG6 is also upstream of the alternate promoter for ABCG272, and further
studies would be needed to see if the methylation of CpG correlates to expression of
individual ABCG2 isoforms or the expression of ABCG2 in other tissues. Additional
studies would also be needed to investigate correlation between CpG6 methylation and
PPM1K expression, the other gene near CpG6.

427
7.6. Conclusion
The CpG4 and CpG6 islands in the ABCG2 gene locus both exhibit tissue-specific
patterns in CpG site methylation in kidney and liver tissues. However, the average
percent methylation of either island was not correlated to ABCG2 expression.
Interestingly, CpG4 had little variability in the methylation of CpG sites located in the
center of the island, but its shores exhibited high variability in methylation. The percent
methylation of one CpG site in CpG4, site 77, correlated to ABCG2 expression in the
kidney. The identification of CpG islands with tissue-specific methylation patterns within
the ABCG2 gene locus, as well as the CpG site 77 that correlates to ABCG2 expression,
can help guide further studies investigating the development of drug-resistance in cancer.

428
7.7. References
(1) Maliepaard, M.; Scheffer, G. L.; Faneyte, I. F.; Gastelen, A. Van; Pijnenborg, A. C. L. M. Subcellular Localization and Distribution of the Breast Cancer Resistance Protein Transporter in Normal Human Tissues Subcellular Localization and Distribution of the Breast Cancer Resistance Protein Transporter in Normal Human Tissues 1. 2001, 3458–3464.
(2) Doyle, L. a; Yang, W.; Abruzzo, L. V; Krogmann, T.; Gao, Y.; Rishi, a K.; Ross, D. D. A multidrug resistance transporter from human MCF-7 breast cancer cells. Proceedings of the National Academy of Sciences of the United States of America 1998, 95, 15665–70.
(3) Fetsch, P. a; Abati, A.; Litman, T.; Morisaki, K.; Honjo, Y.; Mittal, K.; Bates, S. E. Localization of the ABCG2 mitoxantrone resistance-associated protein in normal tissues. Cancer letters 2006, 235, 84–92.
(4) Doyle, L. A.; Ross, D. D. Multidrug resistance mediated by the breast cancer resistance protein BCRP (ABCG2). Oncogene 2003, 22, 7340–58.
(5) Poonkuzhali, B.; Lamba, J.; Strom, S. Association of breast cancer resistance protein/ABCG2 phenotypes and novel promoter and intron 1 single nucleotide polymorphisms. Drug Metabolism and … 2008, 36, 780–795.
(6) Urquhart, B. L.; Ware, J. a; Tirona, R. G.; Ho, R. H.; Leake, B. F.; Schwarz, U. I.; Zaher, H.; Palandra, J.; Gregor, J. C.; Dresser, G. K.; Kim, R. B. Breast cancer resistance protein (ABCG2) and drug disposition: intestinal expression, polymorphisms and sulfasalazine as an in vivo probe. Pharmacogenetics and genomics 2008, 18, 439–48.
(7) Zamber, C. P.; Lamba, J. K.; Yasuda, K.; Farnum, J.; Thummel, K.; Schuetz, J. D.; Schuetz, E. G. Natural allelic variants of breast cancer resistance protein (BCRP) and their relationship to BCRP expression in human intestine. Pharmacogenetics 2003, 13, 19–28.
(8) Ross, D. D.; Karp, J. E.; Chen, T. T.; Doyle, L. A. Expression of breast cancer resistance protein in blast cells from patients with acute leukemia. Blood 2000, 96, 365–8.
(9) Suvannasankha, a; Minderman, H.; O’Loughlin, K. L.; Nakanishi, T.; Greco, W. R.; Ross, D. D.; Baer, M. R. Breast cancer resistance protein (BCRP/MXR/ABCG2) in acute myeloid leukemia: discordance between expression and function. Leukemia : official journal of the Leukemia Society of America, Leukemia Research Fund, U.K 2004, 18, 1252–7.

429
(10) Suvannasankha, A.; Minderman, H.; O’Loughlin, K. L.; Nakanishi, T.; Ford, L. a; Greco, W. R.; Wetzler, M.; Ross, D. D.; Baer, M. R. Breast cancer resistance protein (BCRP/MXR/ABCG2) in adult acute lymphoblastic leukaemia: frequent expression and possible correlation with shorter disease-free survival. British journal of haematology 2004, 127, 392–8.
(11) Benderra, Z.; Faussat, A.-M.; Sayada, L.; Perrot, J.-Y.; Chaoui, D.; Marie, J.-P.; Legrand, O. Breast cancer resistance protein and P-glycoprotein in 149 adult acute myeloid leukemias. Clinical cancer research : an official journal of the American Association for Cancer Research 2004, 10, 7896–902.
(12) Tsunoda, S.; Okumura, T.; Ito, T.; Kondo, K.; Ortiz, C.; Tanaka, E.; Watanabe, G.; Itami, A.; Sakai, Y.; Shimada, Y. ABCG2 expression is an independent unfavorable prognostic factor in esophageal squamous cell carcinoma. Oncology 2006, 71, 251–8.
(13) Usuda, J.; Tsunoda, Y.; Ichinose, S.; Ishizumi, T.; Ohtani, K.; Maehara, S.; Ono, S.; Tsutsui, H.; Ohira, T.; Okunaka, T.; Furukawa, K.; Sugimoto, Y.; Kato, H.; Ikeda, N. Breast cancer resistant protein (BCRP) is a molecular determinant of the outcome of photodynamic therapy (PDT) for centrally located early lung cancer. Lung cancer (Amsterdam, Netherlands) 2010, 67, 198–204.
(14) Uggla, B.; Ståhl, E.; Wågsäter, D.; Paul, C.; Karlsson, M. G.; Sirsjö, A.; Tidefelt, U. BCRP mRNA expression v. clinical outcome in 40 adult AML patients. Leukemia research 2005, 29, 141–6.
(15) Yoh, K. Breast Cancer Resistance Protein Impacts Clinical Outcome in Platinum-Based Chemotherapy for Advanced Non-Small Cell Lung Cancer. Clinical Cancer Research 2004, 10, 1691–1697.
(16) Bailey-Dell, K. J.; Hassel, B.; Doyle, L. a; Ross, D. D. Promoter characterization and genomic organization of the human breast cancer resistance protein (ATP-binding cassette transporter G2) gene. Biochimica et biophysica acta 2001, 1520, 234–41.
(17) To, K. K. W.; Robey, R.; Zhan, Z.; Bangiolo, L.; Bates, S. E. Upregulation of ABCG2 by romidepsin via the aryl hydrocarbon receptor pathway. Molecular cancer research : MCR 2011, 9, 516–27.
(18) Tan, K. P.; Wang, B.; Yang, M.; Boutros, P. C.; Macaulay, J.; Xu, H.; Chuang, A. I.; Kosuge, K.; Yamamoto, M.; Takahashi, S.; Wu, A. M. L.; Ross, D. D.; Harper, P. A.; Ito, S. Aryl Hydrocarbon Receptor Is a Transcriptional Activator of the Human Breast Cancer Resistance Protein ( BCRP / ABCG2 ) □. 2010.
(19) Wang, H.; Lee, E.; Zhou, L.; Leung, P. C. K.; Ross, D. D.; Unadkat, J. D.; Mao, Q. Progesterone receptor (PR) isoforms PRA and PRB differentially regulate
430
expression of the breast cancer resistance protein in human placental choriocarcinoma BeWo cells. Molecular pharmacology 2008, 73, 845–54.
(20) Ee, P. L. R. Identification of a Novel Estrogen Response Element in the Breast Cancer Resistance Protein (ABCG2) Gene. Cancer Research 2004, 64, 1247–1251.
(21) Pradhan, M.; Bembinster, L. a; Baumgarten, S. C.; Frasor, J. Proinflammatory cytokines enhance estrogen-dependent expression of the multidrug transporter gene ABCG2 through estrogen receptor and NF{kappa}B cooperativity at adjacent response elements. The Journal of biological chemistry 2010, 285, 31100–6.
(22) Krishnamurthy, P.; Ross, D. D.; Nakanishi, T.; Bailey-Dell, K.; Zhou, S.; Mercer, K. E.; Sarkadi, B.; Sorrentino, B. P.; Schuetz, J. D. The stem cell marker Bcrp/ABCG2 enhances hypoxic cell survival through interactions with heme. The Journal of biological chemistry 2004, 279, 24218–25.
(23) Singh, A.; Wu, H.; Zhang, P.; Happel, C. Expression of ABCG2 (BCRP) is regulated by Nrf2 in cancer cells that confers side population and chemoresistance phenotype. Molecular cancer … 2010, 9, 2365–2376.
(24) Reik, W.; Murrell, A. Silence across the border. 2000, 405, 408–409.
(25) Wolffe, a P. Transcriptional control: imprinting insulation. Current biology : CB 2000, 10, R463–5.
(26) Ehrlich, M.; Gama-Sosa, M. Amount and distribution of 5-methylcytosine in human DNA from different types of tissues or cells. Nucleic acids … 1982, 10, 11–14.
(27) Bird, A. CpG-rich islands and the function of DNA methylation. Nature 1986.
(28) Gardiner-Garden, M.; Frommer, M. CpG islands in vertebrate genomes. Journal of molecular biology 1987, 196, 261–82.
(29) Cooper, S. J.; Trinklein, N. D.; Anton, E. D.; Nguyen, L.; Myers, R. M. Comprehensive analysis of transcriptional promoter structure and function in 1% of the human genome. Genome research 2006, 16, 1–10.
(30) Larsen, F.; Gundersen, G.; Lopez, R.; Prydz, H. CpG islands as gene markers in the human genome. Genomics 1992, 13, 1095–107.
(31) Takai, D.; Jones, P. a Comprehensive analysis of CpG islands in human chromosomes 21 and 22. Proceedings of the National Academy of Sciences of the United States of America 2002, 99, 3740–5.

431
(32) Bird, A. DNA methylation patterns and epigenetic memory. Genes & development 2002, 16, 6–21.
(33) Sharma, S.; Kelly, T. K.; Jones, P. a Epigenetics in cancer. Carcinogenesis 2010, 31, 27–36.
(34) GRØNBÆK, K.; HOTHER, C.; JONES, P. Epigenetic changes in cancer. Apmis 2007, 3, 9.
(35) Barros, S. P.; Offenbacher, S. Epigenetics: connecting environment and genotype to phenotype and disease. Journal of dental research 2009, 88, 400–8.
(36) Baker, E. K.; El-Osta, A. The rise of DNA methylation and the importance of chromatin on multidrug resistance in cancer. Experimental Cell Research 2003, 290, 177–194.
(37) Peedicayil, J. Epigenetic therapy--a new development in pharmacology. The Indian journal of medical research 2006, 123, 17–24.
(38) Baer-Dubowska, W.; Majchrzak-Celińska, A.; Cichocki, M. Pharmocoepigenetics: a new approach to predicting individual drug responses and targeting new drugs. Pharmacological reports : PR 2011, 63, 293–304.
(39) Szyf, M. Epigenetics, DNA methylation, and chromatin modifying drugs. Annual review of pharmacology and toxicology 2009, 49, 243–63.
(40) Piekarz, R. L.; Bates, S. E. Epigenetic modifiers: basic understanding and clinical development. Clinical cancer research : an official journal of the American Association for Cancer Research 2009, 15, 3918–26.
(41) Ding, S.; Gong, B.-D.; Yu, J.; Gu, J.; Zhang, H.-Y.; Shang, Z.-B.; Fei, Q.; Wang, P.; Zhu, J.-D. Methylation profile of the promoter CpG islands of 14 “drug-resistance” genes in hepatocellular carcinoma. World journal of gastroenterology : WJG 2004, 10, 3433–40.
(42) To, K. K. W.; Zhan, Z.; Bates, S. E. Aberrant promoter methylation of the ABCG2 gene in renal carcinoma. Molecular and cellular biology 2006, 26, 8572–85.
(43) Nakano, H.; Nakamura, Y.; Soda, H.; Kamikatahira, M.; Uchida, K.; Takasu, M.; Kitazaki, T.; Yamaguchi, H.; Nakatomi, K.; Yanagihara, K.; Kohno, S.; Tsukamoto, K. Methylation status of breast cancer resistance protein detected by methylation-specific polymerase chain reaction analysis is correlated inversely with its expression in drug-resistant lung cancer cells. Cancer 2008, 112, 1122–30.
(44) Turner, J. G.; Gump, J. L.; Zhang, C.; Cook, J. M.; Marchion, D.; Hazlehurst, L.; Munster, P.; Schell, M. J.; Dalton, W. S.; Sullivan, D. M. ABCG2 expression,
432
function, and promoter methylation in human multiple myeloma. Blood 2006, 108, 3881–9.
(45) Bram, E.; Stark, M.; Raz, S.; Assaraf, Y. Chemotherapeutic drug-induced ABCG2 promoter demethylation as a novel mechanism of acquired multidrug resistance. Neoplasia (New York, NY) 2009, 11, 1359–1370.
(46) Chen, M.; Xue, X.; Wang, F.; An, Y.; Tang, D.; Xu, Y.; Wang, H.; Yuan, Z.; Gao, W.; Wei, J.; Zhang, J.; Miao, Y. Expression and promoter methylation analysis of ATP-binding cassette genes in pancreatic cancer. Oncology reports 2012, 27, 265–9.
(47) Bram, E.; Stark, M.; Raz, S. Chemotherapeutic drug-induced ABCG2 promoter demethylation as a novel mechanism of acquired multidrug resistance. Neoplasia (New York, NY) 2009, 11, 1359–1370.
(48) Hiraki, M.; Kitajima, Y.; Sato, S.; Mitsuno, M.; Koga, Y.; Nakamura, J.; Hashiguchi, K.; Noshiro, H.; Miyazaki, K. Aberrant gene methylation in the lymph nodes provides a possible marker for diagnosing micrometastasis in gastric cancer. Annals of surgical oncology 2010, 17, 1177–86.
(49) Babu, K.; Zhang, J.; Moloney, S.; Pleasants, T.; McLean, C. a; Phua, S. H.; Sheppard, A. M. Epigenetic regulation of ABCG2 gene is associated with susceptibility to xenobiotic exposure. Journal of proteomics 2012, 75, 3410–8.
(50) Kobayashi, D.; Ieiri, I.; Hirota, T.; Takane, H. Functional assessment of ABCG2 (BCRP) gene polymorphisms to protein expression in human placenta. Drug metabolism and 2005, 33, 94–101.
(51) Bird, a P.; Wolffe, a P. Methylation-induced repression--belts, braces, and chromatin. Cell 1999, 99, 451–4.
(52) Zouridis, H.; Deng, N.; Ivanova, T.; Zhu, Y.; Wong, B.; Huang, D.; Wu, Y. H.; Wu, Y.; Tan, I. B.; Liem, N.; Gopalakrishnan, V.; Luo, Q.; Wu, J.; Lee, M.; Yong, W. P.; Goh, L. K.; Teh, B. T.; Rozen, S.; Tan, P. Methylation subtypes and large-scale epigenetic alterations in gastric cancer. Science translational medicine 2012, 4, 156ra140.
(53) Van Eijk, K. R.; De Jong, S.; Boks, M. P.; Langeveld, T.; Colas, F.; Veldink, J. H.; De Kovel, C. G.; Janson, E.; Strengman, E.; Langfelder, P.; Kahn, R. S.; Van den Berg, L. H.; Horvath, S.; Ophoff, R. a Genetic analysis of DNA methylation and gene expression levels in whole blood of healthy human subjects. BMC Genomics 2012, 13, 636.
(54) Gibbs, J. R.; Van der Brug, M. P.; Hernandez, D. G.; Traynor, B. J.; Nalls, M. a; Lai, S.-L.; Arepalli, S.; Dillman, A.; Rafferty, I. P.; Troncoso, J.; Johnson, R.;

433
Zielke, H. R.; Ferrucci, L.; Longo, D. L.; Cookson, M. R.; Singleton, A. B. Abundant quantitative trait loci exist for DNA methylation and gene expression in human brain. PLoS genetics 2010, 6, e1000952.
(55) Zhang, D.; Cheng, L.; Badner, J. a; Chen, C.; Chen, Q.; Luo, W.; Craig, D. W.; Redman, M.; Gershon, E. S.; Liu, C. Genetic control of individual differences in gene-specific methylation in human brain. American journal of human genetics 2010, 86, 411–9.
(56) Bell, J. T.; Pai, A. a; Pickrell, J. K.; Gaffney, D. J.; Pique-Regi, R.; Degner, J. F.; Gilad, Y.; Pritchard, J. K. DNA methylation patterns associate with genetic and gene expression variation in HapMap cell lines. Genome biology 2011, 12, R10.
(57) Deaton, A. M.; Bird, A. CpG islands and the regulation of transcription. Genes & development 2011, 25, 1010–22.
(58) Jones, P. a Functions of DNA methylation: islands, start sites, gene bodies and beyond. Nature reviews. Genetics 2012, 13, 484–92.
(59) Clark, S. J.; Harrison, J.; Paul, C. L.; Frommer, M. High sensitivity mapping of methylated cytosines. Nucleic acids research 1994, 22, 2990–7.
(60) Umer, M.; Herceg, Z. Deciphering the Epigenetic Code: An Overview of DNA methylation Analysis Methods. Antioxidants & redox signaling 2012, 00.
(61) Uhlmann, K.; Brinckmann, A.; Toliat, M. R.; Ritter, H.; Nürnberg, P. Evaluation of a potential epigenetic biomarker by quantitative methyl-single nucleotide polymorphism analysis. Electrophoresis 2002, 23, 4072–9.
(62) Mouchiroud, D. CpGProD : identifying CpG islands associated with transcription start sites in large genomic. 2002, 18, 631–633.
(63) Rice, P. The European Molecular Biology Open Software Suite EMBOSS : The European Molecular Biology Open Software Suite. 2000, 16, 2–3.
(64) Takai, D.; Jones, P. A. The CpG island searcher: a new WWW resource. In silico biology 2003, 3, 235–40.
(65) Zhao, Z.; Han, L. CpG islands: algorithms and applications in methylation studies. Biochemical and biophysical research communications 2009, 382, 643–5.
(66) Hackenberg, M.; Barturen, G.; Carpena, P.; Luque-Escamilla, P. L.; Previti, C.; Oliver, J. L. Prediction of CpG-island function: CpG clustering vs. sliding-window methods. BMC genomics 2010, 11, 327.

434
(67) Kroetz, D. L.; Yee, S. W.; Giacomini, K. M. The pharmacogenomics of membrane transporters project: research at the interface of genomics and transporter pharmacology. Clinical pharmacology and therapeutics 2010, 87, 109–16.
(68) Bolstad, B. M.; Irizarry, R. A.; Astrand, M.; Speed, T. P. A comparison of normalization methods for high density oligonucleotide array data based on variance and bias. Bioinformatics (Oxford, England) 2003, 19, 185–93.
(69) Boes, T.; Neuhäuser, M. Normalization for Affymetrix GeneChips. Methods of information in medicine 2005, 44, 414–7.
(70) Häsler, J.; Strub, K. Alu elements as regulators of gene expression. Nucleic acids research 2006, 34, 5491–7.
(71) Irizarry, R. a; Ladd-Acosta, C.; Wen, B.; Wu, Z.; Montano, C.; Onyango, P.; Cui, H.; Gabo, K.; Rongione, M.; Webster, M.; Ji, H.; Potash, J. B.; Sabunciyan, S.; Feinberg, A. P. The human colon cancer methylome shows similar hypo- and hypermethylation at conserved tissue-specific CpG island shores. Nature genetics 2009, 41, 178–86.
(72) Campbell, P. K.; Zong, Y.; Yang, S.; Zhou, S.; Rubnitz, J. E.; Sorrentino, B. P. Identification of a novel, tissue-specific ABCG2 promoter expressed in pediatric acute megakaryoblastic leukemia. Leukemia research 2011, 35, 1321–9.

435
Chapter 8 : Summary and Conclusions
8.1. Summary
The disposition of xenobiotics is dependent upon expression and function of
enzymes and transporters. Uptake and efflux transporters are designed to protect the cell
and organism from environmental toxins as well as transport dietary nutrients across
barriers, such as into the milk1,2. The focus of this thesis was the efflux half-transporter
mitoxantrone resistance protein (MXR), which has apical expression in select tissues and
a broad spectrum of synthetic and natural substrates3,4. MXR has emerged as an essential
transporter in xenobiotic pharmacokinetics, anticancer drug resistance and protection
against xenobioitics3,4. Amino acid variants and variability in expression contribute to
altered substrate profiles, chemotherapeutic resistance and cancer risk (Chapter 1)3,5.
Expression of ABCG2 in various normal6–8 and tumorigenic9,10 tissues shows
wide variability. Considering the importance of MXR in the transport of endogenous
compounds and xenobioitics, a clear understanding of MXR function and ABCG2
regulation is warranted. Identification of ABCG2 regulatory elements and the effect of
genetic variation in these regulatory regions will inform our understanding of the
regulation of ABCG2 expression and MXR function. The work presented in this thesis
illustrates that there are many mechanisms involved in the regulation and function of the
MXR transporter. In addition to function, expression and localization of MXR variants,
this research examines variants within the ABCG2 promoter, cis-regulatory enhancers,
suppressors and DNA methylation of the ABCG2 locus in order to better understand the
components of MXR function and ABCG2 regulation.

436
The identification of MXR substrates and function of MXR amino acid variants
have been extensively reported11–17 (Chapter 1). The identification of novel
nonsynonymous ABCG2 variants in the SOPHIE cohort, as well as discordant functional
studies of MXR variants, prompted the hypothesis that MXR variants can have altered
expression and/or function. In Chapter 2 of this thesis, expression and localization studies
of MXR variants in vitro are described. Specific MXR substrates were used to
characterize the activity of amino acid variants both in whole cells and in vesicle based
assays.
The optimization and use of vesicle assays for specific MXR substrates could be a
useful tool in the identification of both other MXR substrates and altered substrate
profiles for different MXR variants. Although the results from the MXR variant assays
support many conclusions drawn in the literature, such as the reduced expression of
Q141K, further studies are needed to confirm the impact of MXR variants in vitro and in
vivo. This is especially important for understanding the defense of tissues from
carcinogens and dietary toxins like pheophorbide A, the patient response and toxicity to
chemotherapeutics like SN-38 (active metabolite of irinotecan) and the clinical use of
MXR specific probes like sulfasalazine.
The majority of research on ABCG2 regulation is focused on response elements in
the proximal promoter of ABCG218. Despite the identification of several response
elements in the ABCG2 proximal promoter, nothing has been done to characterize the
effect of SNPs on the promoter's activity. This led to the hypothesis that variants within
the ABCG2 promoter were capable of altering its activity in vitro and in vivo. In Chapter
3, the results from in vitro and in vivo luciferase assays characterizing the activity of

437
ABCG2 promoter variants are presented. In silico predictions of transcription factor
binding sites were used to predict the mechanism by which SNPs alter promoter activity.
The predicted alteration in transcription factor binding by these SNPs must be confirmed.
Although several ABCG2 promoter SNPs were found to alter activity in vivo, the
frequencies of these SNPs are low, and large population studies are needed to address
their contribution to the expression of MXR.
The expression of MXR is altered by cellular exposure to xenobiotics or
environmental stimuli18–25. Recent discoveries have shown that variation in
pharmacogene regulatory elements have clinical impact26. This led to the hypothesis that
there are regions of the ABCG2 locus that act as cis-regulatory elements, and variations
within these elements affect their activity. In silico prediction programs and in vitro and
in vivo assays were used to identify the first cis-regulatory elements in the ABCG2 locus
(Chapter 4) and to show the effect of genetic variants in these regions on enhancer
activity (Chapter 5). Some variants in cis-regulatory regions were associated with
expression of one or more genes in the ABCG2 locus, including ABCG2 itself. Some of
the putative cis-regulatory regions were identified as nuclear receptor response elements,
and genetic variations within these elements altered the response to nuclear receptor
ligands (Chapter 6). This screen involving in silico, in vitro and in vivo steps could be
applied to the identification of genomic regulatory regions for other transporters or
enzymes. As promising as these results are, the predicted transcription factors responsible
for the activity of cis-regulatory elements and the effect of genetic variations on their
binding in vitro must be confirmed.

438
The occurrence of hypo- and hypermethylation along the promoter of genes is a
mechanism for the development of chemotherapeutic resistance27. Current research has
highlighted the role of the ABCG2 promoter and its hypomethylation in the regulation of
MXR expression18. Aberrant methylation of the ABCG2 promoter correlates with
ABCG2 expression and drug resistance in clinical tumor samples28–33. However, most
studies on the methylation of the ABCG2 promoter focus on complete gain or loss of
methylation, versus methylation dynamics, and it has yet to be discovered which sections
or sites within CpG islands are most relevant for the DNA methylation regulation of
MXR. In this thesis, patterns of DNA methylation of CpG islands within the ABCG2
locus were examined in healthy kidney and liver tissues. Bisulfite treatment coupled with
pyrosequencing techniques were used to obtain quantitative methylation values for each
target CpG site. Sections of the CpG islands with different methylation between kidney
and liver samples and correlation of ABCG2 expression with the methylation of a key
CpG site were characterized. Further studies are needed to expand these results to more
tissues and examine similar DNA methylation in other types of tissues. Additionally, to
understand the dynamics of DNA methylation, these sites should be examined after
cellular stimuli and exposure to xenobiotics.
This dissertation describes novel data regarding mechanisms involved in the
function and expression of MXR. Genetic variants within the ABCG2 locus attributed to
one of these mechanisms may be instrumental in understanding interindividual variation
in MXR expression as well as drug response and toxicity. Although new avenues to
explain the variation in MXR function have been identified, translation of this knowledge
into clinical application requires significant effort. Further research on these mechanisms

439
is imperative and would allow for the clinical implementation of ABCG2
pharmacogenetic information for the prediction, prevention or avoidance of altered drug
response and adverse drug effects.

440
8.2. References
(1) Schinkel, A. H.; Jonker, J. W. Mammalian drug efflux transporters of the ATP binding cassette (ABC) family: an overview. Advanced drug delivery reviews 2003, 55, 3–29.
(2) Daly, A. K. Pharmacogenetics and human genetic polymorphisms. The Biochemical journal 2010, 429, 435–49.
(3) Mo, W.; Zhang, J.-T. Human ABCG2: structure, function, and its role in multidrug resistance. International journal of biochemistry and molecular biology 2012, 3, 1–27.
(4) Mao, Q.; Unadkat, J. D. Role of the breast cancer resistance protein (ABCG2) in drug transport. The AAPS journal 2005, 7, E118–33.
(5) Gradhand, U.; Kim, R. B. Pharmacogenomics of MRP transporters (ABCC1-5) and BCRP (ABCG2). Drug metabolism reviews 2008, 40, 317–54.
(6) Poonkuzhali, B.; Lamba, J.; Strom, S. Association of breast cancer resistance protein/ABCG2 phenotypes and novel promoter and intron 1 single nucleotide polymorphisms. Drug Metabolism and … 2008, 36, 780–795.
(7) Urquhart, B. L.; Ware, J. a; Tirona, R. G.; Ho, R. H.; Leake, B. F.; Schwarz, U. I.; Zaher, H.; Palandra, J.; Gregor, J. C.; Dresser, G. K.; Kim, R. B. Breast cancer resistance protein (ABCG2) and drug disposition: intestinal expression, polymorphisms and sulfasalazine as an in vivo probe. Pharmacogenetics and genomics 2008, 18, 439–48.
(8) Zamber, C. P.; Lamba, J. K.; Yasuda, K.; Farnum, J.; Thummel, K.; Schuetz, J. D.; Schuetz, E. G. Natural allelic variants of breast cancer resistance protein (BCRP) and their relationship to BCRP expression in human intestine. Pharmacogenetics 2003, 13, 19–28.
(9) Ross, D. D.; Karp, J. E.; Chen, T. T.; Doyle, L. A. Expression of breast cancer resistance protein in blast cells from patients with acute leukemia. Blood 2000, 96, 365–8.
(10) Nakanishi, T.; Karp, J. E.; Tan, M.; Doyle, L. A.; Peters, T.; Yang, W.; Wei, D.; Ross, D. D. Quantitative analysis of breast cancer resistance protein and cellular resistance to flavopiridol in acute leukemia patients. Clinical cancer research : an official journal of the American Association for Cancer Research 2003, 9, 3320–8.

441
(11) Kim, K.; Joo, H.-J.; Park, J.-Y. ABCG2 polymorphisms, 34G>A and 421C>A in a Korean population: analysis and a comprehensive comparison with other populations. Journal of clinical pharmacy and therapeutics 2010, 35, 705–12.
(12) Tamura, A.; Onishi, Y.; An, R.; Koshiba, S.; Wakabayashi, K.; Hoshijima, K.; Priebe, W.; Yoshida, T.; Kometani, S.; Matsubara, T.; Mikuriya, K.; Ishikawa, T. In vitro evaluation of photosensitivity risk related to genetic polymorphisms of human ABC transporter ABCG2 and inhibition by drugs. Drug metabolism and pharmacokinetics 2007, 22, 428–40.
(13) Wakabayashi, K.; Tamura, A.; Saito, H.; Onishi, Y.; Ishikawa, T. Human ABC transporter ABCG2 in xenobiotic protection and redox biology. Drug metabolism reviews 2006, 38, 371–91.
(14) Ishikawa, T.; Tamura, A.; Saito, H.; Wakabayashi, K.; Nakagawa, H. Pharmacogenomics of the human ABC transporter ABCG2: from functional evaluation to drug molecular design. Die Naturwissenschaften 2005, 92, 451–63.
(15) Yanase, K.; Tsukahara, S.; Mitsuhashi, J.; Sugimoto, Y. Functional SNPs of the breast cancer resistance protein-therapeutic effects and inhibitor development. Cancer letters 2006, 234, 73–80.
(16) Tamura, A.; Watanabe, M.; Saito, H.; Nakagawa, H.; Kamachi, T.; Okura, I.; Ishikawa, T. Functional validation of the genetic polymorphisms of human ATP-binding cassette (ABC) transporter ABCG2: identification of alleles that are defective in porphyrin transport. Molecular pharmacology 2006, 70, 287–96.
(17) Yoshioka, S.; Katayama, K.; Okawa, C.; Takahashi, S.; Tsukahara, S.; Mitsuhashi, J.; Sugimoto, Y. The identification of two germ-line mutations in the human breast cancer resistance protein gene that result in the expression of a low/non-functional protein. Pharmaceutical research 2007, 24, 1108–17.
(18) Robey, R. W.; To, K. K. K.; Polgar, O.; Dohse, M.; Fetsch, P.; Dean, M.; Bates, S. E. ABCG2: a perspective. Advanced drug delivery reviews 2009, 61, 3–13.
(19) Cheng, G. M. Y.; To, K. K. W. Adverse Cell Culture Conditions Mimicking the Tumor Microenvironment Upregulate ABCG2 to Mediate Multidrug Resistance and a More Malignant Phenotype. ISRN oncology 2012, 2012, 746025.
(20) Pradhan, M.; Bembinster, L. a; Baumgarten, S. C.; Frasor, J. Proinflammatory cytokines enhance estrogen-dependent expression of the multidrug transporter gene ABCG2 through estrogen receptor and NF{kappa}B cooperativity at adjacent response elements. The Journal of biological chemistry 2010, 285, 31100–6.
(21) Jigorel, E.; Vee, M. Le; Boursier-neyret, C.; Parmentier, Y.; Fardel, O. Differential Regulation of Sinusoidal and Canalicular Hepatic Drug Transporter Expression by

442
Xenobiotics Activating Drug-Sensing Receptors in Primary Human Hepatocytes ABSTRACT : 2006, 34, 1756–1763.
(22) Wang, H.; Lee, E.; Zhou, L.; Leung, P. C. K.; Ross, D. D.; Unadkat, J. D.; Mao, Q. Progesterone receptor (PR) isoforms PRA and PRB differentially regulate expression of the breast cancer resistance protein in human placental choriocarcinoma BeWo cells. Molecular pharmacology 2008, 73, 845–54.
(23) Zhang, Y.; Zhou, G.; Wang, H.; Zhang, X.; Wei, F.; Cai, Y.; Yin, D. Transcriptional upregulation of breast cancer resistance protein by 17beta-estradiol in ERalpha-positive MCF-7 breast cancer cells. Oncology 2006, 71, 446–55.
(24) Lemos, C.; Kathmann, I.; Giovannetti, E.; Dekker, H.; Scheffer, G. L.; Calhau, C.; Jansen, G.; Peters, G. J. Folate deprivation induces BCRP (ABCG2) expression and mitoxantrone resistance in Caco-2 cells. International journal of cancer. Journal international du cancer 2008, 123, 1712–20.
(25) Lemos, C.; Kathmann, I.; Giovannetti, E.; Calhau, C.; Jansen, G.; Peters, G. J. Impact of cellular folate status and epidermal growth factor receptor expression on BCRP/ABCG2-mediated resistance to gefitinib and erlotinib. British journal of cancer 2009, 100, 1120–7.
(26) Smith, R. P.; Lam, E. T.; Markova, S.; Yee, S. W.; Ahituv, N. Pharmacogene regulatory elements: from discovery to applications. Genome medicine 2012, 4, 45.
(27) Baer-Dubowska, W.; Majchrzak-Celińska, A.; Cichocki, M. Pharmocoepigenetics: a new approach to predicting individual drug responses and targeting new drugs. Pharmacological reports : PR 2011, 63, 293–304.
(28) Turner, J. G.; Gump, J. L.; Zhang, C.; Cook, J. M.; Marchion, D.; Hazlehurst, L.; Munster, P.; Schell, M. J.; Dalton, W. S.; Sullivan, D. M. ABCG2 expression, function, and promoter methylation in human multiple myeloma. Blood 2006, 108, 3881–9.
(29) Bram, E.; Stark, M.; Raz, S.; Assaraf, Y. Chemotherapeutic drug-induced ABCG2 promoter demethylation as a novel mechanism of acquired multidrug resistance. Neoplasia (New York, NY) 2009, 11, 1359–1370.
(30) Chen, M.; Xue, X.; Wang, F.; An, Y.; Tang, D.; Xu, Y.; Wang, H.; Yuan, Z.; Gao, W.; Wei, J.; Zhang, J.; Miao, Y. Expression and promoter methylation analysis of ATP-binding cassette genes in pancreatic cancer. Oncology reports 2012, 27, 265–9.
(31) To, K. K. W.; Zhan, Z.; Bates, S. E. Aberrant promoter methylation of the ABCG2 gene in renal carcinoma. Molecular and cellular biology 2006, 26, 8572–85.

443
(32) Bram, E.; Stark, M.; Raz, S. Chemotherapeutic drug-induced ABCG2 promoter demethylation as a novel mechanism of acquired multidrug resistance. Neoplasia (New York, NY) 2009, 11, 1359–1370.
(33) Nakano, H.; Nakamura, Y.; Soda, H.; Kamikatahira, M.; Uchida, K.; Takasu, M.; Kitazaki, T.; Yamaguchi, H.; Nakatomi, K.; Yanagihara, K.; Kohno, S.; Tsukamoto, K. Methylation status of breast cancer resistance protein detected by methylation-specific polymerase chain reaction analysis is correlated inversely with its expression in drug-resistant lung cancer cells. Cancer 2008, 112, 1122–30.